Developmental and generational trends in alcohol, cannabis and tobacco use — A ten year cohort...
18
Drug and Alcohol Dependence, 10 (1982) 303 - 320 303 DEVELOPMENTAL AND GENERATIONAL TRENDS IN ALCOHOL, CANNABIS AND TOBACCO USE .- A TEN YEAR COHORT ANALYSIS MICHAEL S. GOODSTADT, GODWIN C. CHAN and MARGARET A. SHEPPARD Education Research Section, Addiction Research Foundation, 33 Russell Street, Toronto, Ontario M5S 2s: (Canada) (Received September 3, 1982) Summary Six surveys of drug use (including alcohol) among Ontario (Canada) students (grades 7 - 13) were conducted between 1968 - 1979. Cohort anal- yses identified significant increases in the prevalence and incidence of alcohol and cannabis use for all cohorts with, however, some moderation of cannabis use in recent years within the oldest cohort. Recent tobacco use has shown a reduction in the earlier strong trends towards increased use. Developmen- tal influences on drug use were stronger than generational influences. Impli- cations for preventive intervention are discussed. Introduction Changes and trends in patterns of drug use have been of growing con- cern among policy-makers, researchers and the general public. In contrast to earlier single cross-sectional surveys of students’ drug use (e.g. [l] ), a few recent studies have recognized the importance of data obtained over an extended time frame, employing repeated cross-sectional surveys or longitu- dinal studies [ 21. Few studies have, however, made adequate use of available comparisons in analyzing and interpreting trends. Of special value in this context is the use of cohort analysis in assigning significance to developmen- tal, generational and historical influences [ 31. The present report summarizes and interprets trends in alcohol, cannabis and tobacco use in the southern- central area of Ontario (Canada) for 1968 - 1979. Materials and methods Sampling designs Sampling 1968 - 1974 At intervals of two years between 1968 and 1974, grade 7, 9,ll and 13 students (approximately 12, 14, 16 and 18 years of age respectively) in 0376-8716/82/0000-0000/$02.75 @ Elsevier Sequoia /Printed in The Netherlands
Transcript of Developmental and generational trends in alcohol, cannabis and tobacco use — A ten year cohort...

Drug and Alcohol Dependence, 10 (1982) 303 - 320 303
DEVELOPMENTAL AND GENERATIONAL TRENDS IN ALCOHOL, CANNABIS AND TOBACCO USE .- A TEN YEAR COHORT ANALYSIS
MICHAEL S. GOODSTADT, GODWIN C. CHAN and MARGARET A. SHEPPARD
Education Research Section, Addiction Research Foundation, 33 Russell Street, Toronto, Ontario M5S 2s: (Canada)
(Received September 3, 1982)
Summary
Six surveys of drug use (including alcohol) among Ontario (Canada) students (grades 7 - 13) were conducted between 1968 - 1979. Cohort anal- yses identified significant increases in the prevalence and incidence of alcohol and cannabis use for all cohorts with, however, some moderation of cannabis use in recent years within the oldest cohort. Recent tobacco use has shown a reduction in the earlier strong trends towards increased use. Developmen- tal influences on drug use were stronger than generational influences. Impli- cations for preventive intervention are discussed.
Introduction
Changes and trends in patterns of drug use have been of growing con- cern among policy-makers, researchers and the general public. In contrast to earlier single cross-sectional surveys of students’ drug use (e.g. [l] ), a few recent studies have recognized the importance of data obtained over an extended time frame, employing repeated cross-sectional surveys or longitu- dinal studies [ 21. Few studies have, however, made adequate use of available comparisons in analyzing and interpreting trends. Of special value in this context is the use of cohort analysis in assigning significance to developmen- tal, generational and historical influences [ 31. The present report summarizes and interprets trends in alcohol, cannabis and tobacco use in the southern- central area of Ontario (Canada) for 1968 - 1979.
Materials and methods
Sampling designs Sampling 1968 - 1974 At intervals of two years between 1968 and 1974, grade 7, 9,ll and
13 students (approximately 12, 14, 16 and 18 years of age respectively) in
0376-8716/82/0000-0000/$02.75 @ Elsevier Sequoia /Printed in The Netherlands

304
the Metropolitan Toronto region of Ontario were surveyed concerning their drug use. A two-stage (self-weighting) cluster sampling design was established for the 1968 survey, when all school jurisdictions in the region were included in the sampling frame, with sampling units being high school attendance areas (i.e. a high school and all ‘feeder’ junior-high and elementary schools). Approximately one-fifth of high school districts (i.e. 23 of the 112 districts among 7 boards) were randomly selected for participation; a random selec- tion was made of grade 7, 9,ll and 13 classes from each district. All students in selected classes were asked to participate in the study.
In 1970 and 1972, the same classes (but not necessarily the same stu- dents) were resurveyed. Two of the 1968 schools withdrew from the survey in 1970; one of these was replaced in the 1972 survey. In 1974, the sample size was randomly reduced by approximately 50%. Two schools from earlier waves withdrew from the 1974 survey and two schools were excluded due to issues involving parental permission.
Sampling 1977 - 1979 The 1977 sampling was extended to include all seven Ontario educa-
tional regions. The number of school boards (the first sampling unit) ran- domly selected from a region was proportionate to the region’s contribution to the Ontario student enrollment. Sampling of high schools (grade 9, 11 and 13) from selected boards was weighted according to school size. Grade 7 samples were obtained by surveying all ‘feeder’ schools associated with se- lected high schools. Selection of students at each sampled school was made in consultation with the principal. In the majority of cases, class units were selected with special attention paid to their representativeness; in the remain- ing cases, individual students were randomly selected from the appropriate grade. Twenty of the 24 boards (or their alternatives) agreed to participate in 1977; of the 118 selected schools, 19 did not participate due to: with- drawal of board approval (2 schools); winter weather conditions (10 schools); and principals’ refusal (7 schools, whereupon five previously randomly se- lected alternative schools were substituted). Parental permission requirements again played a role in student participation. Similar sampling procedures were followed in 1979, with participation from the same 20 boards as in 1977. Of the 94 schools selected in 1979 for participation, 10 schools were not in- cluded in the study due to: weather conditions (2 schools); and refusals by principals (8 schools, replaced by 3 previously selected alternates).
Table 1 summarizes sample sizes for the six surveys.
Administration procedures Questionnaires were administered within classrooms (without teachers
being present) by contract interviewers and additional research staff. Machine- readable response sheets were employed in 1970 and later surveys, except for grade 7 students in 1977 and 1979 who recorded their answers directly in questionnaire booklets. Students were requested not to sign their answer sheets.

305
TABLE 1
Samples sizes in 1968 - 1979 student drug use surveys (Metropolitan Toronto, Ontario, Canada)
Grade Survey year
1968 1970 1972 1974 1977 1979 ___
7 1816 1868 1890 1025 540 472
9 1752 1875 1875 916 807 551
11 1733 1725 1661 840 456 362
13 1146 1422 1198 698 300 328
Total 6447 6890 6624 3479 2103 1713
Completion
Kate (%)* 67 72** 69 69 70*** 78
*Completion rate by students potentially available on day of testing - does not include
rates as affected by board refusals, etc.
**Estimate includes completion rates by grade 6 sub-sample. ***Estimate for entire Province including grade 5 sub-sample.
Questionnaire response variables Surveys enquired about a range of drug related issues. Of interest to the
present analysis, however, are: (1) demographic characteristics, and (2) fre- quency of use of alcohol, cannabis and tobacco. Questions varied slightly between pairs of surveys, as a function of experience by researchers in their field. Table 2 provides details of the relevant questions for each survey year.
Validity and reliability The validity and reliability of self-reported drug use present almost
insurmountable problems for researchers. It is known, however, that the aggre- gates of such measures err on the side of under-reporting rather than over- reporting [4, 51 and that estimates of frequency of alcohol use are more reliable than estimates of quantity of alcohol use. The present measures of drug use should, therefore, be taken as relative rather than definitive.
At the time of the 1979 survey, a sample of 151 students was resurveyed after an interval of 2 months. Test-retest reliability was high for classification as users of alcohol (86% consistency), cannabis (84%) and tobacco (86%).
Data analysis Weighting procedures The cluster-sampling procedures incorporated a self-weighting feature.
Repeated measures Multiple responses from indivi.duals raise two issues, methodological
and substantive. The methodological problems of response covariance and multiple tests of significance are mitigated by the consistency of the major

TA
BL
E
2
Dru
g u
se
surv
ey
qu
esti
ons:
Fr
equ
ency
of
al
coh
ol,
can
nab
is
and
to
bac
co
use
Yea
r A
lcoh
ol
Can
nab
is
Tob
acco
1968
h
th
e pa
st
six
mon
ths
(sin
ce
Nov
embe
r)
I
and
h
ave
use
d A
LC
OH
OL
:
1970
A
. N
ot
at a
ll.
B.
Les
s th
an
once
pe
r m
onth
. C
. A
bou
t tw
ice
per
mon
th.
D.
Abo
ut
thre
e ti
mes
pe
r m
onth
. E
. A
bou
t fo
ur
or m
ore
tim
es
per
mon
th.
1972
In
th
e pa
st
six
mon
ths
(sin
ce
Nov
embe
r)
I
and
h
ave
use
d A
LC
OH
OL
(w
ine,
be
er,
wh
isk
ey,
1974
gi
n,
etc.
):
A.
Not
at
all
. B
. L
ess
than
on
ce
per
mon
th.
C.
Abo
ut
twic
e pe
r m
onth
. D
. A
bou
t th
ree
tim
es
per
mon
th.
E.
Abo
ut
fou
r ti
mes
pe
r m
onth
or
on
ce
a w
eek
. F
. 2
to
5 ti
mes
a
wee
k.
G.
Alm
ost
ever
y da
y.
1977
In
th
e la
st
12
mon
ths.
h
ow
ofte
n
hav
e yo
u
use
d A
LC
OH
OL
-l
iqu
or
(ru
m,
wh
isk
ey,
etc.
).
win
e or
bee
r?
A.
1 di
d n
ot
“se
alco
hol
in
th
e la
st
12
mon
ths.
B
. I
only
h
ad
a dr
ink
of
al
coh
ol
at s
peci
al
tim
es
(e.g
. C
hri
stm
as.
wed
din
g).
C.
I h
ave
had
a
sip
of
alco
hol
to
se
e w
hat
it
is
lik
e.
D.
I h
ad
a dr
ink
of
al
coh
ol
once
a
mon
th
or
less
oft
en.
E.
I h
ad
a dr
ink
of
al
coh
ol
abou
t tw
ice
a m
onth
. F
. 1
had
a
drin
k
of
alco
hol
ab
out
thre
e ti
mes
a
mon
th.
G.
I h
ad
a dr
ink
of
al
coh
ol
abou
t on
ce
a w
eek
. H
. I
had
a
drin
k
of
alco
hol
fo
ur
or
five
ti
mes
a
wee
k.
In t
he
past
si
x m
onth
s (s
ince
N
ovem
ber)
I
hav
e u
sed
MA
RIH
UA
NA
:
A.
Not
at
all
.
In t
he
past
si
x m
onth
s (s
ince
N
ovem
ber)
I
hav
e u
sed
TO
BA
CC
O:
A.
Not
at
all
. B
. O
ne
or
two
tim
es.
B.
1 to
5
ciga
rett
es
per
wee
k.
C.
Th
ree
of
fou
r ti
mes
. C
. 6
to
10
ciga
rett
es
per
wee
k.
D.
Fiv
e or
six
ti
mes
. D
. 11
to
20
ci
gare
ttes
pe
r w
eek
. E
. S
even
O
F m
ore
tim
es.
E.
20
ciga
rett
es
or
over
pe
r w
eek
or
re
gula
r
In t
he
past
si
x m
onth
s (s
ince
N
ovem
ber)
I
hav
e u
sed
MA
RIH
UA
NA
:
A.
Not
at
all
. B
. O
ne
or t
wo
tim
es.
C.
Th
ree
or
fou
r ti
mes
. D
. F
ive
or
six
tim
es.
E.
Sev
en
to
ten
ti
mes
. F
. E
leve
n
to
twen
ty
tim
es.
G.
Tw
enty
-on
e to
fi
fty
tim
es.
H.
Mor
e th
an
fift
y ti
mes
.
In t
he
last
12
m
onth
s,
how
of
ten
di
d yo
u
“se
CA
NN
AB
IS
(mar
ihu
ana.
gr
ass.
po
t,
has
his
h,
has
h,
has
h
oil)
?
A.
I do
n
ot
kn
ow
wh
at
can
nab
is
is.
B.
I di
d n
ot
“se
can
nab
is
in t
he
last
12
m
onth
s.
C.
I h
ave
use
d ca
nn
abis
1
or
2 ti
mes
. D
. I
hav
e u
sed
can
nab
is
3 to
5
tim
es.
E.
I h
ave
use
d ca
nn
abis
6
to
9 ti
mes
. F
. I
hav
e u
sed
can
nab
is
10
to
19
tim
es.
G.
I h
ave
use
d ca
nn
abis
20
to
39
ti
mes
. H
. I
hav
e u
sed
can
nab
is
40
or m
ore
tim
es.
use
r.
In t
he
past
si
x m
onth
s (s
ince
N
ovem
ber)
I
hav
e u
sed
TO
BA
CC
O:
A.
Not
at
all
. B
. 1
to
5 ci
gare
ttes
pe
r w
eek
. C
. 6
to
10
ciga
rett
es
per
wee
k.
D.
11
to
20
ciga
rett
es
per
wee
k.
E.
3 to
10
a
day.
F
. 10
to
25
a
day
(% a
pac
kag
e to
1
pack
age)
. G
. M
ore
than
25
ci
gare
ttes
pe
r da
y.
In t
he
last
12
m
onth
s.
how
of
ten
di
d yo
u
use
T
OB
AC
CO
?
A.
I di
d n
ot
“se
toba
cco
in t
he
last
12
m
onth
s.
B.
I tr
ied
a ci
gare
tte
in t
he
last
12
m
onth
s.
C.
I h
ad
less
th
an
1 ci
gare
tte
a da
y.
D.
I h
ad
1 to
2
ciga
rett
es
a da
y.
E.
I h
ad
3 to
5
ciga
rett
es
a da
y.
F.
I h
ad
6 to
10
ci
gare
ttes
a
day.
G
. I
had
11
to
15
ci
gare
ttes
a
day.
H
. I
had
16
to
20
ci
gare
ttes
a
day.
1.
I
had
m
ore
than
20
ci
gare
ttes
a
day.

I.
1 h
ad
a dr
ink
of
al
coh
ol
alm
ost
ever
, da
y -
6 to
7
tim
es
a w
eek
.
1979
In
th
e la
st
12
mon
ths,
h
ow
ofte
n
hav
e yo
u
use
d A
LC
OH
OL
-liq
uor
(r
um
. w
his
key
, et
c.).
w
ine
or b
eer?
A.
B.
C.
D.
E.
F.
G.
I di
d n
ot
drin
k
alco
hol
at
all
in
th
e la
st
12
mon
ths.
I
only
dr
ank
at
spe
cial
ev
ents
(e
.g.
Ch
rist
man
s,
wed
din
g).
I h
ave
had
a
sip
of
alco
hol
to
se
e w
hat
it
is
lik
e.
I dr
ank
al
coh
ol
once
a
mon
th
or l
ess
ofte
n.
I dr
ank
al
coh
ol
abou
t tw
o or
th
ree
tim
es
a m
onth
. I
dran
k
alco
hol
ab
out
once
a
wee
k.
I dr
ank
al
coh
ol
abou
t tw
o O
I th
ree
tim
es
a w
eek
.
In t
he
last
12
m
onth
s,
how
of
ten
di
d yo
u
use
C
AN
NA
BIS
(m
arih
uan
a “g
rass
”.
“Pot
”,
has
his
h,
“has
h”,
h
ash
oi
l)?
A.
I do
n
ot
kn
ow
wh
at
can
nab
is
is.
B.
I di
d n
ot
use
ca
nn
abis
in
th
e la
st
12
mon
ths.
C
. I
use
d ca
nn
abis
1
or
2 ti
mes
. D
. I
use
d ca
nn
abis
3
to
5 ti
mes
. E
. I
use
d ca
nn
abis
6
to
9 ti
mes
. F
. I
use
d ca
nn
abis
10
to
19
ti
mes
. G
. I
use
d ca
nn
abis
20
to
39
ti
mes
. H
. I
use
d ca
nn
abis
40
or
m
ore
tim
es.
In t
he
last
12
m
onth
s,
how
of
ten
di
d YOU
use
TO
BA
CC
O?
A.
I di
d n
ot
use
to
bacc
o in
th
e la
st
12
mon
ths.
B
. I
trie
d on
e ci
gare
tte
in t
he
last
12
m
onth
s.
C.
I h
ad
less
th
an
1 ci
gare
tte
a da
y.
D.
I h
ad
1 to
2
ciga
rett
es
a da
y.
E.
I h
ad
3 to
5
ciga
rett
es
a da
y.
P‘.
I h
ad
6 to
10
ci
gare
ttes
a
day.
G
. I
had
11
to
15
ci
gare
ttes
a
day.
H
. I
had
16
to
20
ci
gare
ttes
a
day.
I.
I
had
m
ore
than
20
ci
gare
ttes
a
day.
H.
I dr
ank
al
coh
ol
abou
t fo
ur
or
five
ti
mes
a
wee
k.
I.
I dr
ank
al
coh
ol
alm
ost
ever
yday
-
6 to
7
tim
es
a w
eek
.

308
findings and the elevated level of significance employed 0, < 0.001). The substantive issues concerning the relationships between reported alcohol, cannabis and tobacco use are to be dealt with in a separate report: it was found, for example, that among grade 9 students, while 51% of alcohol users did not also use either tobacco or cannabis, only 6.8% of tobacco users did not also use one of the other two drugs, and only 1.1% of cannabis users reported no use of either alcohol or tobacco.
Cohort analysis The present analysis, in contrast to previous reports (e.g. [6 - 81 ), will
concentrate on grade-related cohort changes in the years 1968 - 1979. Efforts will be made to avoid two previously identified fallacies [9] : a ‘generational’ fallacy that examines only differences between samples representing different ‘eras’, and a ‘life-course’ fallacy that attributes differences only to the devel- opmental changes that occur within a sample throughout life.
The major challenge faced by cohort analysis is the independent parti- tioning of developmental and generational effects [3, 9 - 121, which are largely, but not exclusively, represented by within- and between-cohort effects respectively. These two cohort effects may have historical and/or societal factors in common; for example, an increase in drug availability may influence both how an individual’s drug use changes over time, and how one generation differs from other generations of drug users. Thus,
Within-cohort factors = Developmental influences + (common) histor- ical influences.
Between-cohort factors = Generational influences + (common) histor- ical influences.
The difference between the two cohort effects, therefore, is equivalent to the difference between developmental and generational influences, indepen- dent of common historical influences. The ratio, the Developmental Influ- ence Index (DII), i.e.,
(Within-cohort - Between-cohort)/( IBetween-cohort I)
provides a measure of the strength of developmental influences relative to the combined influence of generational and common historical factors. When between-cohort effects are greater than within-cohort effects, a complemen- tary formula,
(Between-cohort - Within-cohort)/( IWithin-cohort 1)
represents the greater influence of generational factors. Due to the change in sampling procedure (and questions) between the
1968 - 1974 waves and the 1977 - 1979 waves, analyses will deal with each series separately. The data included in the 1977 - 1979 analyses will refer only to the South-Central Ontario region constituting, predominantly, the previously sampled Metropolitan Toronto region.

309
Results
Alcohol use Tables 3 and 4 summarize the reported prevalence (i.e. proportion of
users) and incidence (i.e. frequency of use among users) of alcohol use. (No data are available for 1968 since, for now unknown reasons, 43 per cent of students did not reply to the relevant questions. Non-responses to other drug-use questions in 1968 was minimal, i.e. less than 1 per cent.) Compari- sons on the diagonals in Tables 3 and 4 reflect within-cohort progression of alcohol use, whereas horizontal comparisons represent between-cohort changes.
Between-cohort differences in baseline prevalence rates Generational differences in prevalence rates are partially reflected in the
between-cohort changes in baseline rates, that is, the rates at which the youngest (i.e. grade 7) students reported using alcohol. These rates increased significantly (t-test, p < 0.001) between 1970, 1972 and 1974 (39.5%, 45.0% and 51.5% respectively). Corresponding rates for 1977 - 1979 did not change (60.3% vs. 57.8%).
TABLE 3
Prevalence of reported drug use (Metropolitan Toronto, Ontario, Canada: Grade 7 - 13 Students)
Drug Grade Self-reported drug use
In prior 6 months In prior 12 months
1968 1970 1972 1974 1977 1979
(%) (%) (S) (%) (%) (%)
Alcohol*
Cannabis* *
Tobacco***
7 39.5 45.0 51.5 60.3 57.8 9 53.9 60.3 71.3 75.7 77.9
11 71.5 84.9 84.5 84.5 85.0 13 82.3 91.8 92.6 92.3 90.2
7 2.6 5.6 4.7 5.2 6.4 9.7 9 10.8 15.9 21.2 23.8 20.1 23.1
11 8.9 28.1 31.6 37.3 35.3 44.6 13 7.5 26.2 31.3 30.5 36.3 41.2
7 24.6 26.0 24.2 23.2 12.9 17.3 9 44.3 35.1 45.1 37.9 30.0 32.0
11 46.6 44.0 46.5 41.3 36.8 48.7 13 39.7 38.0 38.7 34.4 35.7 32.0
*Alcohol use: 1970 - 1974, drank alcohol at least once during the previous 6 months. 1977 - 1979, drank more than “a sip... to see what it is like” in the previous twelve months.
**Cannabis use: 1968 - 1974, used cannabis at least once in previous 6 months. 1977 1979, used cannabis at least once in previous 12 months. ***Tobacco use: 1968 - 1974, used tobacco at least once in previous 6 months. 1977 - 1979, used tobacco at least once in previous 12 months.

TA
BL
E
4
Inci
den
ce
of
rep
orte
d
dru
g u
se
amon
g d
rug
use
rs
(Met
ropo
lita
n
Tor
onto
, O
nta
rio,
C
anad
a:
Gra
de
7 -
13
Stu
den
ts)
Dw
G
rade
P
erce
nta
ge
of
dru
g u
sers
w
ith
in
grad
e su
b-gr
oups
re
port
ing
freq
uen
cies
of
d
rug
use
Fre
quen
cy
of
use
19
68
1970
19
72
1974
F
requ
ency
of
u
se
(S)
(%)
(%)
(S)
1977
19
79
(%)
(%)
Alc
ohol
7 9
11
13
< 1
per
m
onth
7 9 11
13
2 -
3 m
onth
p
er
7 9 11
13
> 1
per
w
eek
Can
nab
is
7 9 11
13
1 -
2 in
las
t 6
mon
ths
7 9 11
13
3 -
6 in
las
t 6
mon
ths
7 9 11
13
>7
in l
ast
6 m
onth
s
50.0
61
.4
59.6
49
.1
27.9
38
.6
31.2
32
.1
47.4
29
.2
27.1
25
.2
33.8
29
.8
32.4
30
.0
12.5
23
.8
24.7
15
.1
54.7
32
.9
25.6
23
.9
26.6
23
.0
22.7
23
.6
22.5
24
.4
24.1
27
.7
37.5
14
.9
15.7
35
.8
17.4
28
.5
43.2
44
.0
26.0
47
.9
50.2
51
.1
43.7
45
.8
43.6
42
.3
55.5
51
.7
50.8
51
.2
40.5
41
.7
47.7
29
.2
30.0
40
.1
21.5
18
.9
25.2
28
.4
29.0
29.2
32
.0
32.5
32.8
34
.0
33.5
34
.3
33.7
31
.9
19.4
20
.0
20.3
19
.6
27.5
25
.9
19.5
36
.8
36.5
25
.6
44.8
49
.2
< 1
per
m
onth
2 -
3 p
er
mon
th
>l
per
w
eek
1 -
5 in
las
t 12
m
onth
s
6 -
19
in l
ast
12
mon
ths
>20
in
las
t 12
m
onth
s
89.1
85
.0
69.0
72
.1
52.0
52
.2
32.1
46
.3
5.3
7.5
13.0
11
.2
19.5
18
.3
27.8
19
.9
5.6
7.5
18.0
16
.7
28.6
29
.4
40.1
33
.8
72.4
68
.9
44.4
44
.1
26.1
28
.6
41.3
51
.9
10.3
22
.2
27.8
31
.5
22.4
21
.7
28.4
21
.5
17.2
8.
9 27
.8
24.4
51.6
49
.7
30.3
26
.7

Tob
acco
7 9
II
13 7 9
11
13 7 9
11
13 7 9
11
13
1 5
per
w
eek
6 -
20
per
w
eek
> 2
0 p
er
wee
k
59.0
56
.6
58.9
63
.0
<1
a da
y 40
.6
36.8
38
.9
43.8
30
.1
30.3
30
.1
27.7
33
.8
30.1
27
.9
26.7
24.4
20
.8
24.4
20
.2
23.5
23
.1
20.2
20
.2
20.5
17
.1
16.5
17
.6
21.1
19
.9
14.9
20
.4
16.6
22
.6
16.7
16
.8
36.0
40
.1
40.8
36
.0
49.4
52
.6
53.4
54
.8
45.1
50
.0
57.2
52
.9
1 -
5 a
day
6-15
aday
216
a da
y
27.5
30
.4
26.1
36
.8
17.3
27
.3
33.6
31
.4
55.1
48
.1
40.3
36
.8
33.3
26
.1
25.2
24
.8
l-1.
6 19
.0
28.6
17
.2
36.3
31
.8
24.3
29
.5
5.8
2.5
5.0
9.2
13.1
14
.8
16.8
14
.3

312
Within-cohort changes in prevalence of alcohol use Within-cohort changes were examined by procedures partially derived
from Glenn [ 111. Predicted prevalence rates for any year were projected from earlier years’ prevalence rates, on the assumption (null-hypothesis) that no within-cohort changes had occurred during the intervening period. The for- mulae used for calculating predicted and observed prevalence rates were:
Predictedprevalence = (lZiniXi)/(Zini)
where
Xi = prevalence for grade (i) for the predictor year.
ni = sample size for grade (i) for the predictor year.
Zini = sum of sample sizes for grades included in computations for predictor year.
Observed prevalence = (Zjmj Yj )/(~jmj )
where
Yj = prevalence for grade (j) for the observed year.
mj = sample size for grade (j) for the observed year.
Cj”j = sum of sample sizes for grades included in computations for observed years.
The null-hypothesis was then tested (Student’s t-test) by comparing these predicted rates with the observed prevalence rates. In the simplest example, it was hypothesized that the 1970 grade 7 prevalence rates (i.e. 39.5%) would remain unchanged when students reached grade 9 in 1972; in fact, this ex- pected prevalence was significantly less (p < 0.001) than the 60.3% observed prevalence for grade 9 students in 1972.
In every comparison (i.e. regardless of predictor and observed years employed), the observed prevalence of reported alcohol use is significantly greater 0, < 0.001) than the predicted prevalence, leading to rejection of the null-hypothesis, and indicating the existence of strong within-cohort effects. (If comparisons between prevalence rates for 1977 and 1979 had referred to between-cohort differences, for example between grades 7 in both years, no significant change in alcohol use would have been apparent, thus emphasiz- ing the value of within- as well as between-cohort analyses.)
Within-cohort trends in alcohol use prevalence show a high degree of consistency between the survey years 1970 - 1974 (see Fig. l), regardless of the differing baselines from which they developed. Thus, the absolute change in prevalence between grades 7 and 9 for the years 1970 - 1972 and 1972- 1974 were 20.8 per cent (60.3% - 39.5%) and 26.3 percent (71.3% - 45.0%); similar absolute differences were found in grades 9 - 11 changes for 1970 - 1972 and 1972 - 1974 (31.0% and 24.2% respectively). The notable excep- tion to this uniformity of change was the small change between grades 11 and 13 in the years 1972 - 1974; data for cohorts involving grade 13 are, however, ‘incomplete’, since approximately 40% of students leave Ontario

313
IOC
90
80
,o B
7c
E
T
‘:
f 60
J G
a
50
40
0 1 1 1 I-- 1970 1972 1974 1977 1979
Used I” 1970-1974, Used I” l977- 1979,
I” previous SIX months an previous twelve months
Fig. 1. Prevalence of alcohol use within cohorts 1970 - 1979.
high schools between grades 11 and 13. In the absence of similar pairs of grades for 1977 - 1979, it is not possible to undertake the same comparisons for these later years.
Within-cohort changes in incidence of alcohol use Log-linear analysis was undertaken of changes in reported incidence
(frequency) of alcohol use among drinkers. This procedure utilized the SAS FUNCAT procedures [ 131 which is an ANOVA-analogue method for exam- ining design and response effects (based on Grizzle et al. [14] ). In the present case, the model possessed one designated ‘dependent’ variable (i.e. reported drug use; see Table 4 for categories of use frequency) and two ‘independent’ variables (i.e. cohort membership and year of survey). Results for each pair of survey years reveal significant 0, < 0.0001) cohort and year effects (and one cohort X year interaction, for 1970 - 1972). Specifically, it was found that: (1) older cohorts reported significantly more heavy alcohol use (i.e. once a week or more frequent use) than younger cohorts; (2) the proportion of light alcohol users (i.e. once a month or less) declined between the two years within each comparison period, while heavy alcohol consumption in- creased, and medium use remained little changed within the same period; and (3) alcohol use in the years 1970 - 1972, but not in later years, varied
314
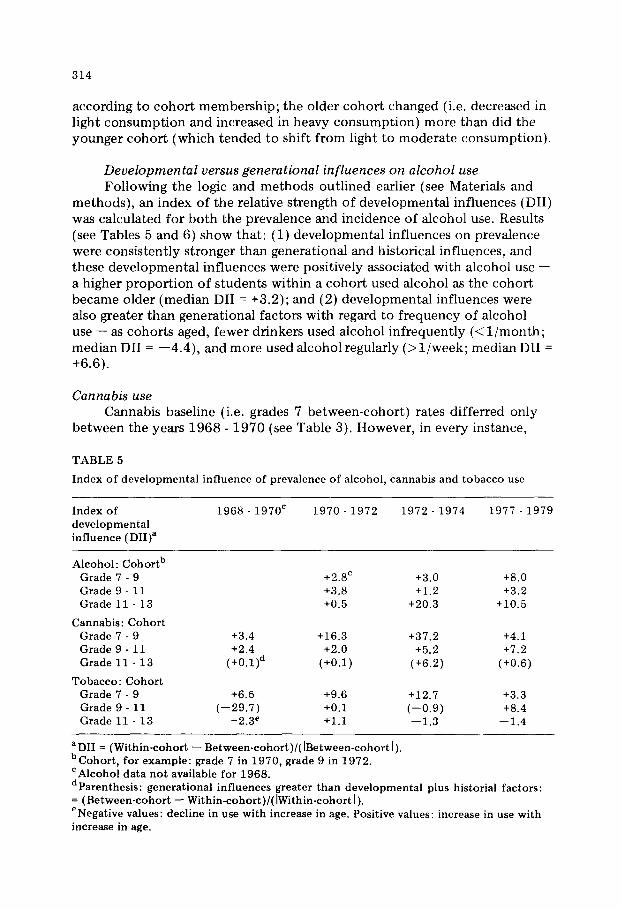
according to cohort membership; the older cohort changed (i.e. decreased in light consumption and increased in heavy consumption) more than did the younger cohort (which tended to shift from light to moderate consumption).
Developmental versus generational influences on alcohol use Following the logic and methods outlined earlier (see Materials and
methods), an index of the relative strength of developmental influences (DII) was calculated for both the prevalence and incidence of alcohol use. Results (see Tables 5 and 6) show that: (1) developmental influences on prevalence were consistently stronger than generational and historical influences, and these developmental influences were positively associated with alcohol use - a higher proportion of students within a cohort used alcohol as the cohort became older (median DII = +3.2); and (2) developmental influences were also greater than generational factors with regard to frequency of alcohol use - as cohorts aged, fewer drinkers used alcohol infrequently (<l/month; median DII = -4.4), and more used alcohol regularly (>l/week; median DII = +6.6).
Cannabis use Cannabis baseline (i.e. grades 7 between-cohort) rates differ-red only
between the years 1968 - 1970 (see Table 3). However, in every instance,
TABLE 5
Index of developmental influence of prevalence of alcohol, cannabis and tobacco use
Index of
developmental
influence ( DII)a
1968 - 1970’ 1970 - 1972 1972 _ 1974 1977 - 1979
Alcohol : Cohortb
Grade 7 - 9 +2.@ +3.0 +8.0
Gradeg-11 +3.8 +1.2 +3.2 Grade 11 - 13 +0.5 +20.3 +10.5
Cannabis: Cohort
Grade 7 - 9 +3.4 +16.3 +37.2 +4.1 Gradeg-11 +2.4 +2.0 +5.2 +7.2 Grade 11 - 13 (+O.l)d (+o.l) (+6.2) (+0.6)
Tobacco: Cohort Grade 7 - 9 +6.5 +9.6 +12.7 +3.3 Grade 9 - 11 (-29.7) +0.1 (-0.9) +8.4 Grade 11 - 13 -2.3e +1.1 -1.3 -1.4
aDII = (Within-cohort - Between-cohort)/( [Between-cohort I). bCohort, for example: grade 7 in 1970, grade 9 in 1972.
‘Alcohol data not available for 1968.
dParenthesis: generational influences greater than developmental plus historial factors: = (Between-cohort - Within-cohort)/( [Within-cohort I).
eNegative values: decline in use with increase in age. Positive values: increase in use with increase in age.

TA
BL
E
6
Ind
ex
of
deve
lopm
ent
infl
uenc
e of
in
cid
ence
of
al
coho
l, ca
nnab
is
and
to
bacc
o us
e*
Ind
ex
of
deve
lopm
enta
l 19
68
- 19
70’
1970
-
1972
19
72
- 19
74
1977
-
1979
in
flue
nces
(D
II)”
Alc
ohol
: C
ohor
tb
Gra
de
7 -
9 G
rad
e 9
- 11
G
rad
e 11
-
13
Can
nabi
s:
Coh
ort
Gra
de
7 -
9 G
rad
eg-1
1 G
rad
e 11
-
13
Tob
acco
: C
ohor
t
Gra
de
7 -
9 G
rad
eg-1
1 G
rad
e 11
-
13
Use
<l/
ma.
Use
> l
/wk.
1 21
6 m
os.
> 7
16
mos
.
-2.0
(-
1.5)
’ (+
7.2)
2 +
1.5
(+o.
o)
(CO
.1)
1 -
5/w
k.
.> 2
0/w
k.
-8.3
+
2.9
-1.7
+
3.0
0.0
(+4.
3)
Use
<l/
ma.
-2.g
d
-1.1
-0
.4
Use
> l
/wk.
+12
.5d
+
1.2
+0.
5
1 -
2/6
mos
. c.
716
mos
.
-20.
6 +
34.4
-0
.6
+0.
5 +
2.5
-2.9
1 -
5/w
k
-8.7
-4
.2
-11.
0
2 20
/wk.
-2.1
-1
8.0 +3.
8
Use
<l/
ma.
-10.
1 -7
.8
+11
.9
1 -
216
mos
.
-1.6
-5
.7
+2.
5
1 -
5/w
k.
-2.7
-
3.5
-0.4
Use
> l
/wk.
+18
.7
+6.
6 +
42.3
.) 71
6 m
os.
+0.
4 +
8.9
-9.8
3 20
/wk.
+19
2.0
+3.
9 (+
3.8)
Use
<l/
ma.
-3.1
-4
.4
-29.
5
1 -
5112
m
os.
-7.1
-5
3.7 +8.
9
1 -
5/d
ays
-1.6
-3
.1
-0.2
Use
>l/w
k.
+4.
8 +
9.8
+5.
5
2201
12
mos
.
+1.
9 +
5.4
-12.
1
> 1
6/d
ays
+2.
0 +
1.3
(+0.
4)
*Ind
icen
ce
(fre
quen
cy)
of
use
amon
g us
ers
only
. aD
II
= (
Wit
hin-
coho
rt
- B
etw
een-
coho
rt)/
( [B
etw
een-
coho
rt
I).
bCoh
ort,
for
exam
ple:
gr
ade
7 in
19
70,
grad
e 9
in
1972
. ‘A
lcoh
ol
dat
a no
t av
aila
ble
for
1968
. dN
egat
ive
valu
e:
decl
ine
in u
se
with
in
crea
se
in a
ge.
Posi
tive
valu
e:
incr
ease
in
us
e w
ith
incr
ease
in
age
. ‘P
aren
thes
es:
gene
rati
onal
in
flue
nces
gr
eate
r th
an
deve
lopm
enta
l pl
us
hist
oric
al
fact
ors:
=
(B
etw
een-
coho
rt
- W
ithi
n-co
hort
)/(/
Wit
hin-
co
hort
1)
.

316
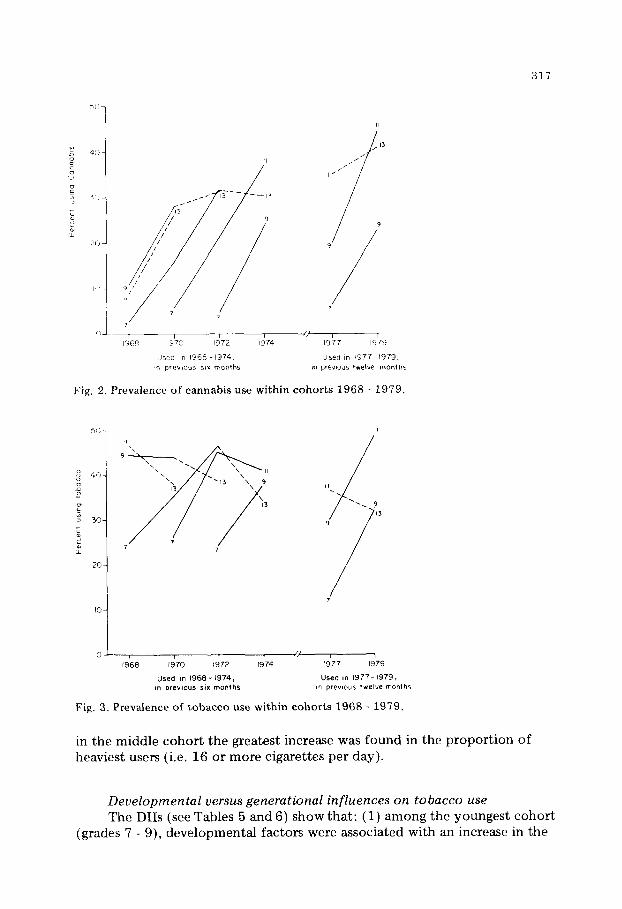
within-cohort observed cannabis prevalence rates were significantly greater than those predicted on the basis of earlier years (t-tests, p < 0.001). It was, again, found that (except for the incomplete cohorts between grades 11 and 13) there was a striking equivalence between the rates of increase in the pre- valence of cannabis use, especially between the years 1968 - 1974 (see Fig. 2). In these years, the range of increase was from a minimum absolute change of 13.3% to a maximum of 19.2% for grades 7 - 9 cohorts, and from 15.7% to 17.3% for grades 9 - 11 cohorts (see Fig. 2).
Log-linear analysis of the frequency of cannabis use reveal consistent and strong (p < 0.0001) cohort X year interactions: between any pair of years the two younger cohorts (grades 7 - 9, 9 - 11) shifted from light or moderate use to heavier use; except for the years 1968 - 1970, the frequency of canna- bis use within the oldest cohort (grades 11 - 13) tended to remain unchanged or, in later years, to decline.
Developmental versus generational influences on cannabis use Indices of developmental influence for both the prevalence and inci-
dence of cannabis use (see Tables 5 and 6) show that: (1) developmental influences on prevalence were positive and consistently stronger than genera- tional factors in the two younger cohorts (grades 7 - 9, and 9 - 11, with a median index of +4.6) - as students became older they tended to use canna- bis; developmental and generational factors were small and approximately equal in the oldest cohort (grades 11 - 13); (2) in the years 1970 - 1979, developmental influences on incidence rates were associated with the two younger cohorts shifting away from light use (median DII = -6.4) and to- wards heavier use (median DII = +3.7); the reverse of this influence was found among the oldest (grades 11 - 13) cohort, which shifted away from heavier use (median DII = -9.8) to light use (median DII = +2.5); changes within 1968 - 1970 were less consistent with respect to the sources of influence.
Tobacco use Baseline prevalence rates (i.e. grade 7) for tobacco use did not differ
significantly from one another between adjacent years. In contrast to the consistency of the within-cohort trends for alcohol and cannabis, tobacco use showed significant differences between predicted and observed prevalence rates only for 1970 - 1972 and 1977 - 1979 (see Fig. 3).
Log-linear analyses demonstrated important shifts in the patterns of tobacco use. There were, firstly, significant cohort X year interactions for the years 1968 - 1974. In each pair of comparison years, smokers in the two younger cohorts shifted from light (i.e. 1 - 5 cigarettes per week) to heaviest use (i.e. 20 or more cigarettes per week); the oldest cohort, in contrast, showed little or no change. Secondly, in 1977 - 1979 there was a redistribu- tion of the proportion of light users (i.e. 1 - 5 cigarettes per day) within all cohorts: among the youngest and oldest cohorts this was reflected in an increase in the proportion of lightest users (i.e. less than one cigarette a day);
317
I? L__ I I F I
I368 I370 1972 1974 Iii77 I973
UsEd Il. 1968-1974, Used ,n 1977-1979, in prevnus 5,x months I” prewous twelve months
Fig. 2. Prevalence of cannabis use within cohorts 1968 - 1979.
OJ- , 1 1
1968 1970 1972 $974 1977 1979
used I” 1966 - 1974, Used I” 1977- 1979, m prevmus SIX months in ~WYIOUS twelve months
Fig. 3. Prevalence of tobacco use within cohorts 1968 - 1979.
in the middle cohort the greatest increase was found in the proportion of heaviest users (i.e. 16 or more cigarettes per day).
Developmental versus generational influences on tobacco use The DITs (see Tables 5 and 6) show that: (1) among the youngest cohort
(grades 7 - 9), developmental factors were associated with an increase in the

318
proportion of smokers (median DII = +8.0) and with a shift away from light use (median DII = -5.5) towards heavy use (median DII = +2.5); (2) preva- lence of tobacco use in the middle cohort (grades 9 - 11) was not consistently affected by either developmental or generational factors, although, among smokers in this cohort, developmental influences were consistently associated with shifts away from light tobacco use (medium DII = -3.3) towards heavy use (median DII = +3.5); and (3) among the oldest cohort (grades 11 - 13), developmental influences were associated with a decrease in the proportion of smokers (median DII = -1.3) but, among smokers in this cohort, genera- tional factors were somewhat more powerful and in the direction of more frequent tobacco use.
Discussion
The findings from the present analyses can be summarized according to substantive and methodological significance. Among the more important substantive conclusions are: (1) there have been significant increases in the prevalence of alcohol use, as measured between the baseline age groups (i.e. grade 7) during the years 1970 - 1974, but not for 1977 - 1979; (2) there have been highly significant and consistent increases within cohorts in the prevalence of alcohol and cannabis use for each pair of survey years, includ- ing 1977 - 1979; (3) significant increases in the prevalence of tobacco use occurred only between 1970 - 1972 and between 1977 - 1979; (4) there have been highly significant increases in the incidence of alcohol use among all cohorts for all time periods; (5) a similar increase in the incidence of cannabis use was found for all cohorts and time periods, except for a move towards lighter use among the oldest cohort in 1977 - 1979; and (6) recent changes in the incidence of tobacco use have been towards even less frequent use, especially among already light* users in the youngest and oldest cohorts.
From the viewpoint of methodology, it has been demonstrated that significant differences occur in the conclusions derived from traditional forms of between-cohort analysis, as compared to within-cohort procedures. While the former analyses [e.g. 6 - 81 have demonstrated many significant changes between cohorts in the prevalence and incidence of drug use, within- cohort analysis in the present paper has identified (a) many changes in drug use which were undetectable by between-cohort procedures, and (b) much larger changes in drug use within cohorts than between cohorts. By employ- ing and comparing both procedures it has been possible to identify the rela- tive weight of developmental versus generational influences on changes in drug use, with the advantage being strongly in favour of developmental effects.
Developmental change is a function of psychological maturation and personal and interpersonal events; generational differences, in the present
*The terminology ‘light’ etc. is not meant to imply any degree of acceptability or approval.

319
instance, would most probably be a function of differences between cohorts in exposure to personal, interpersonal and societal events. Differences be- tween developmental and generational effects represent the change due to within-individual development which, in turn, would justify concluding that changes in drug use (both increases and decreases) are most strongly influ- enced by age-related psychological and social developments of the individual. The precise nature of these changing characteristics is unknown since, in the absence of detailed longitudinal research, current cross-sectional research (for example, concerning personality correlates of drug use) are only sugges- tive of factors that may be active in the developmental process. The impor- tance of within-individual development, however, suggests that from a pre- ventive viewpoint, more attention should be paid to interventions that take account of relevant developmental changes and attempts to bolster positive individual development.
An emphasis on individual development should not, however, lead to the neglect of significant interpersonal and societal events. An example of the latter is the change in legislation governing the legal minimum age for drinking. Ontario law was changed in this regard in July 1971, when it was lowered from 21 to 18 years of age. Data from the present analysis showed that not only did all cohorts show an increase in alcohol consumption be- tween the years 1970 - 1972, but that these changes were positively related to age, with the oldest cohorts (grades 11 - 13) showing a significantly larger increase in consumption that the younger cohorts; these findings and the absence of similar findings in the next time period (1972 - 1974) suggest a strong liberalizing effect of the change in the law. A more recent (1979) change, increasing the legal minimum age to 19 years of age, is not amenable to adequate analysis with the present data, although the smaller increase in heavier alcohol use by the oldest cohort may indicate that some anticipatory effect of the new law (announced six months prior to enactment) may have been operating.
Two further findings are of relevance to preventive interventions. (1) The substantial prevalence of drug use at the earliest grade (i.e. grade 7) studied in the present series of surveys, and the significant increase in both the prevalence and incidence of drug use between grades 7 and 9, both indi- cate the need for energetic prevention programs for these grades, programs which should commence even before grade 7 for the population studied. (2) There were consistent differences in patterns and trends in drug use as the oldest cohort progressed from grade 11 to 13 between surveys. Grade 13 students were frequently more conservative than younger cohorts and usually showed an apparent discontinuity in their cohort-related development of drug use (see Figs. 1 - 3). As already indicated, this cohort was ‘incomplete’ due to a substantial proportion (40%) of Ontario students leaving school between these grades. Other data from the same surveys have consistently shown a very high negative correlation between academic performance and all forms of drug use. Grade 13 students are, moreover, those with better academic records who plan to proceed to further professional or university

320
training; it is understandable, therefore, that the grades 11 - 13 cohort should consistently show more markedly conservative shifts in drug use than younger cohorts. These trends among older cohorts are worthy of further longitudinal examination to determine whether any components could be identified and capitalized upon for use in prevention programs aimed at younger students (see, e.g. [ 151 ).
In conclusion, the present analysis of a ten-year series of surveys has demonstrated the advantages of more detailed analysis of such survey data, and the value of cohort analysis. It has demonstrated the complexity of the changes in patterns of drug use, which are a function of both within- and between-individual factors, and which change as these factors alter with cohort membership. These and other developmental dynamics are worthy of examination through more careful survey design and analysis, especially through the use of truly longitudinal studies.
References
1 S. Einstein and S. Allen, Proceedings of the First International Conference on Student Drug Surveys, Baywood, Farmingdale, NY, 1971.
2 D. B. Kandel (ed.), Longitudinal Research on Drug Use, John Wiley, New York, 1978. 3 M. W. Riley and J. Waring, Age, cohorts, and drug use. In D. B. Kandel (ed.), Longitu-
dinal Research on Drug Use, John Wiley, New York, 1978. 4 R. G. Smart, Recent studies of the validity and reliability of self-reported drug-use,
1970 - 1974. Can. J. Criminol. Correct., 17 (1975) 326 - 333. 5 M. S. Goodstadt and V. Gruson, The randomized response technique: a test on drug
use. J. Am. Statist. Assoc., 70 (1975) 814 - 818. 6 R. G. Smart, D. Fejer and J. White, Drug Use Trends Among Metropolitan Toronto
Students: a Study of Changes from 1968 to 1972, Substudy #512, Addiction Re- search Foundation, Toronto, Ontario, 1972.
7 R. G. Smart and D. Fejer, Changes in Drug Use in Toronto High School Students Between 1972 and 19 74, Substudy #631, Addiction Research Foundation, Toronto, Ontario, 1974.
8 R. G. Smart, M. S. Goodstadt, M. A. Sheppard and C. B. Liban, Alcohol and Drug Use Among Ontario Students in 1979 and Changes from 1977: Preliminary Findings, Substudy #1070, Addiction Research Foundation, Toronto, Ontario, 1979.
9 W. R. Riley, Aging and cohort succession: interpretations and misinterpretations. Pub[. Opin. Q., 37 (1973) 35 - 49.
10 A. F. Brunswick and J. M. Boyle, Patterns of drug involvement: development and secular influences on age at initiation. Youth and Society, 11 (1979) 139 - 162.
11 N. D. Glenn, Cohort Analysis, Sage Publications, Beverly Hills, 1977. 12 K. 0. Mason, W. M. Mason, H. H. Winsborough and W. K. Poole, Some methodological
issues in cohort analysis of archival data. Am. Social. Rev., 38 (1973) 242 - 258. 13 SAS, SAS User’s Guide, SAS Institute Inc., Raleigh NC, 1979.
14 J. E. Grizzle, C. F. Starmer and G. G. Koch, Analysis of categorical data by linear models. Biometrics, 25 (1969) 489 - 504.
15 R. Jessor and S. L. Jessor, Problem Behauiour and Psychosocial Development: a Lon- gitudinal Study of Youth, Academic Press, New York, 1977.