Weak magnetism and non-Fermi liquids near heavy-fermion critical points

EUROPEAN ORGANIZATION FOR NUCLEAR RESEARCH
CERN{EP/99{05
20 January 1999
Measurement and Interpretation of
Fermion-Pair Production
at LEP energies from
130 to 172 GeV
DELPHI Collaboration
Abstract
The data collected with the DELPHI detector at centre-of-mass energies be-tween 130 and 172 GeV, during LEP operation in 1995 and 1996, have been usedto determine the hadronic and leptonic cross-sections and leptonic forward{backward asymmetries. In addition, the cross-section ratios and forward{backward asymmetries for avour-tagged samples of light (uds), c and b quarkshave been measured.The results are interpreted by performing S-matrix �ts to these data and tothe data collected previously at the energies near the Z0 resonance peak (88-93 GeV). The results are also interpreted in terms of contact interactions,which parameterise physics beyond the Standard Model. Further interpretationof the data is made in terms of possible R-parity violating SUSY particlesand of possible Z
0
bosons. No signi�cant deviations from the Standard Modelexpectations are found and limits are given for the various interpretations whichare made of physics beyond the Standard Model.
(Submitted to Eur. Phys. J. C)

ii
P.Abreu21, W.Adam50, T.Adye36, P.Adzic11, Z.Albrecht17 , T.Alderweireld2 , G.D.Alekseev16 , R.Alemany49 ,
T.Allmendinger17 , P.P.Allport22, S.Almehed24 , U.Amaldi9, S.Amato47, E.G.Anassontzis3 , P.Andersson44 ,
A.Andreazza9, S.Andringa21 , P.Antilogus25 , W-D.Apel17, Y.Arnoud9, B.�Asman44, J-E.Augustin25 ,
A.Augustinus9 , P.Baillon9 , P.Bambade19, F.Barao21, R.Barbier25 , D.Y.Bardin16 , G.Barker17, A.Baroncelli38 ,
M.Battaglia15 , M.Baubillier23 , K-H.Becks52, M.Begalli6 , A.Behrmann52 , P.Beilliere8 , Yu.Belokopytov9;53 ,
A.C.Benvenuti5, C.Berat14, M.Berggren25, D.Bertini25 , D.Bertrand2, M.Besancon39 , F.Bianchi45 , M.Bigi45 ,
M.S.Bilenky16 , M-A.Bizouard19 , D.Bloch10 , H.M.Blom30, M.Bonesini27 , W.Bonivento27 , M.Boonekamp39 ,
P.S.L.Booth22, A.W.Borgland4 , G.Borisov19 , C.Bosio41, O.Botner48, E.Boudinov30 , B.Bouquet19 ,
C.Bourdarios19 , T.J.V.Bowcock22, I.Boyko16, I.Bozovic11 , M.Bozzo13, P.Branchini38 , T.Brenke52,
R.A.Brenner48, P.Bruckman18, J-M.Brunet8, L.Bugge32 , T.Buran32, T.Burgsmueller52 , P.Buschmann52 ,
S.Cabrera49, M.Caccia27, M.Calvi27 , T.Camporesi9, V.Canale37, F.Carena9, L.Carroll22 , C.Caso13,
M.V.Castillo Gimenez49 , A.Cattai9, F.R.Cavallo5, V.Chabaud9 , N.Chalanda42, Ph.Charpentier9 ,
L.Chaussard25 , P.Checchia35, G.A.Chelkov16, R.Chierici45 , P.Chliapnikov42 , P.Chochula7, V.Chorowicz25,
J.Chudoba29, K.Cieslik18 , P.Collins9 , R.Contri13, E.Cortina49 , G.Cosme19, F.Cossutti9, J-H.Cowell22,
H.B.Crawley1, D.Crennell36 , S.Crepe14, G.Crosetti13, J.Cuevas Maestro33, S.Czellar15 , M.Davenport9 ,
W.Da Silva23 , A.Deghorain2 , G.Della Ricca46 , P.Delpierre26 , N.Demaria9 , A.De Angelis9 , W.De Boer17,
S.De Brabandere2 , C.De Clercq2 , B.De Lotto46, A.De Min35 , L.De Paula47 , H.Dijkstra9, L.Di Ciaccio37;9 ,
J.Dolbeau8 , K.Doroba51 , M.Dracos10, J.Drees52, M.Dris31, A.Duperrin25 , J-D.Durand9, G.Eigen4, T.Ekelof48,
G.Ekspong44 , M.Ellert48 , M.Elsing9 , J-P.Engel10 , B.Erzen43, M.Espirito Santo21, E.Falk24, G.Fanourakis11 ,
D.Fassouliotis11 , J.Fayot23, M.Feindt17, A.Fenyuk42, P.Ferrari27, A.Ferrer49, E.Ferrer-Ribas19 , S.Fichet23 ,
A.Firestone1, U.Flagmeyer52, H.Foeth9, E.Fokitis31 , F.Fontanelli13 , B.Franek36, A.G.Frodesen4, R.Fruhwirth50 ,
F.Fulda-Quenzer19 , J.Fuster49, A.Galloni22 , D.Gamba45, S.Gamblin19 , M.Gandelman47 , C.Garcia49 , C.Gaspar9,
M.Gaspar47, U.Gasparini35 , Ph.Gavillet9 , E.N.Gazis31, D.Gele10, L.Gerdyukov42 , N.Ghodbane25 , I.Gil49 ,
F.Glege52, R.Gokieli9;51 , B.Golob43 , G.Gomez-Ceballos40 , P.Goncalves21 , I.Gonzalez Caballero40 , G.Gopal36 ,
L.Gorn1;54 , M.Gorski51 , Yu.Gouz42, V.Gracco13, J.Grahl1, E.Graziani38 , C.Green22, H-J.Grimm17, P.Gris39,
G.Grosdidier19 , K.Grzelak51, M.Gunther48 , J.Guy36, F.Hahn9, S.Hahn52 , S.Haider9 , A.Hallgren48 ,
K.Hamacher52, J.Hansen32, F.J.Harris34, V.Hedberg24, S.Heising17 , J.J.Hernandez49, P.Herquet2, H.Herr9,
T.L.Hessing34, J.-M.Heuser52, E.Higon49 , S-O.Holmgren44 , P.J.Holt34, S.Hoorelbeke2 , M.Houlden22 ,
J.Hrubec50, K.Huet2, G.J.Hughes22, K.Hultqvist44 , J.N.Jackson22, R.Jacobsson9, P.Jalocha9, R.Janik7 ,
Ch.Jarlskog24 , G.Jarlskog24, P.Jarry39, B.Jean-Marie19 , E.K.Johansson44, P.Jonsson25, C.Joram9, P.Juillot10 ,
F.Kapusta23, K.Karafasoulis11 , S.Katsanevas25 , E.C.Katsou�s31, R.Keranen17, B.P.Kersevan43,
B.A.Khomenko16, N.N.Khovanski16, A.Kiiskinen15 , B.King22, A.Kinvig22 , N.J.Kjaer30, O.Klapp52 , H.Klein9 ,
P.Kluit30 , P.Kokkinias11 , M.Koratzinos9 , V.Kostioukhine42 , C.Kourkoumelis3 , O.Kouznetsov39 , M.Krammer50,
E.Kriznic43 , Z.Krumstein16 , P.Kubinec7, J.Kurowska51, K.Kurvinen15, J.W.Lamsa1, D.W.Lane1, P.Langefeld52 ,
V.Lapin42, J-P.Laugier39, R.Lauhakangas15 , G.Leder50, F.Ledroit14, V.Lefebure2, L.Leinonen44 , A.Leisos11 ,
R.Leitner29 , J.Lemonne2, G.Lenzen52, V.Lepeltier19 , T.Lesiak18 , M.Lethuillier39 , J.Libby34 , D.Liko9 ,
A.Lipniacka44 , I.Lippi35 , B.Loerstad24, M.Lokajicek29 , J.G.Loken34, J.H.Lopes47, J.M.Lopez40,
R.Lopez-Fernandez14 , D.Loukas11 , P.Lutz39, L.Lyons34, J.MacNaughton50 , J.R.Mahon6, A.Maio21, A.Malek52 ,
T.G.M.Malmgren44, V.Malychev16 , F.Mandl50 , J.Marco40, R.Marco40, B.Marechal47 , M.Margoni35 ,
J-C.Marin9, C.Mariotti9, A.Markou11, C.Martinez-Rivero19 , F.Martinez-Vidal49 , S.Marti i Garcia9, J.Masik12 ,
N.Mastroyiannopoulos11 , F.Matorras40, C.Matteuzzi27, G.Matthiae37, F.Mazzucato35, M.Mazzucato35 ,
M.Mc Cubbin22 , R.Mc Kay1, R.Mc Nulty22 , G.Mc Pherson22 , C.Meroni27 , W.T.Meyer1, E.Migliore45 ,
L.Mirabito25 , W.A.Mitaro�50 , U.Mjoernmark24, T.Moa44, M.Moch17, R.Moeller28 , K.Moenig9 , M.R.Monge13 ,
X.Moreau23, P.Morettini13 , G.Morton34, U.Mueller52 , K.Muenich52 , M.Mulders30 , C.Mulet-Marquis14 ,
R.Muresan24 , W.J.Murray36, B.Muryn14;18 , G.Myatt34, T.Myklebust32 , F.Naraghi14 , F.L.Navarria5, S.Navas49,
K.Nawrocki51, P.Negri27, N.Neufeld9, N.Neumeister50, R.Nicolaidou39 , B.S.Nielsen28 , M.Nikolenko10;16 ,
V.Nomokonov15, A.Normand22, A.Nygren24, V.Obraztsov42, A.G.Olshevski16 , A.Onofre21, R.Orava15,
G.Orazi10, K.Osterberg15, A.Ouraou39, M.Paganoni27 , S.Paiano5 , R.Pain23, R.Paiva21, J.Palacios34 , H.Palka18 ,
Th.D.Papadopoulou31 , K.Papageorgiou11 , L.Pape9, C.Parkes9, F.Parodi13 , U.Parzefall22 , A.Passeri38 ,
O.Passon52, M.Pegoraro35, L.Peralta21, M.Pernicka50 , A.Perrotta5, C.Petridou46 , A.Petrolini13 , H.T.Phillips36 ,
F.Pierre39, M.Pimenta21, E.Piotto27, T.Podobnik43 , M.E.Pol6, G.Polok18 , P.Poropat46, V.Pozdniakov16 ,
P.Privitera37 , N.Pukhaeva16 , A.Pullia27 , D.Radojicic34 , S.Ragazzi27 , H.Rahmani31 , D.Rakoczy50 , P.N.Rato�20,
A.L.Read32, P.Rebecchi9, N.G.Redaelli27 , M.Regler50 , D.Reid30 , R.Reinhardt52 , P.B.Renton34, L.K.Resvanis3 ,
F.Richard19 , J.Ridky12 , G.Rinaudo45 , O.Rohne32 , A.Romero45, P.Ronchese35 , E.I.Rosenberg1, P.Rosinsky7 ,
P.Roudeau19 , T.Rovelli5 , Ch.Royon39 , V.Ruhlmann-Kleider39 , A.Ruiz40, H.Saarikko15 , Y.Sacquin39 ,
A.Sadovsky16 , G.Sajot14, J.Salt49, D.Sampsonidis11 , M.Sannino13 , H.Schneider17 , Ph.Schwemling23 ,
U.Schwickerath17 , M.A.E.Schyns52, F.Scuri46, P.Seager20, Y.Sedykh16, A.M.Segar34, R.Sekulin36 , V.Senko42,
R.C.Shellard6 , A.Sheridan22 , M.Siebel52 , L.Simard39 , F.Simonetto35, A.N.Sisakian16 , G.Smadja25,
N.Smirnov42 , O.Smirnova24 , G.R.Smith36, O.Solovianov42 , A.Sopczak17 , R.Sosnowski51 , T.Spassov21 ,
E.Spiriti38 , P.Sponholz52 , S.Squarcia13 , D.Stampfer50, C.Stanescu38, S.Stanic43 , K.Stevenson34, A.Stocchi19 ,
J.Strauss50, R.Strub10 , B.Stugu4, M.Szczekowski51 , M.Szeptycka51, T.Tabarelli27 , O.Tchikilev42 ,
F.Tegenfeldt48, F.Terranova27, J.Thomas34, J.Timmermans30, N.Tinti5, L.G.Tkatchev16, S.Todorova10 ,
A.Tomaradze2, B.Tome21, A.Tonazzo9, L.Tortora38, G.Transtromer24, D.Treille9 , G.Tristram8,

iii
M.Trochimczuk51 , C.Troncon27, A.Tsirou9, M-L.Turluer39, I.A.Tyapkin16, S.Tzamarias11 , B.Ueberschaer52 ,
O.Ullaland9 , V.Uvarov42, G.Valenti5 , E.Vallazza46 , C.Vander Velde2, G.W.Van Apeldoorn30 , P.Van Dam30,
W.K.Van Doninck2 , J.Van Eldik30 , A.Van Lysebetten2 , I.Van Vulpen30 , N.Vassilopoulos34 , G.Vegni27 ,
L.Ventura35, W.Venus36;9, F.Verbeure2, M.Verlato35, L.S.Vertogradov16, V.Verzi37, D.Vilanova39 ,
N.Vishnevsky42 , L.Vitale46 , E.Vlasov42, A.S.Vodopyanov16 , C.Vollmer17, G.Voulgaris3 , V.Vrba12, H.Wahlen52 ,
C.Walck44, C.Weiser17, D.Wicke52 , J.H.Wickens2, G.R.Wilkinson9 , M.Winter10 , M.Witek18 , G.Wolf9, J.Yi1,
A.Zalewska18 , P.Zalewski51 , D.Zavrtanik43 , E.Zevgolatakos11 , N.I.Zimin16;24 , G.C.Zucchelli44 , G.Zumerle35
1Department of Physics and Astronomy, Iowa State University, Ames IA 50011-3160, USA2Physics Department, Univ. Instelling Antwerpen, Universiteitsplein 1, BE-2610 Wilrijk, Belgiumand IIHE, ULB-VUB, Pleinlaan 2, BE-1050 Brussels, Belgiumand Facult�e des Sciences, Univ. de l'Etat Mons, Av. Maistriau 19, BE-7000 Mons, Belgium3Physics Laboratory, University of Athens, Solonos Str. 104, GR-10680 Athens, Greece4Department of Physics, University of Bergen, All�egaten 55, NO-5007 Bergen, Norway5Dipartimento di Fisica, Universit�a di Bologna and INFN, Via Irnerio 46, IT-40126 Bologna, Italy6Centro Brasileiro de Pesquisas F��sicas, rua Xavier Sigaud 150, BR-22290 Rio de Janeiro, Braziland Depto. de F��sica, Pont. Univ. Cat�olica, C.P. 38071 BR-22453 Rio de Janeiro, Braziland Inst. de F��sica, Univ. Estadual do Rio de Janeiro, rua S~ao Francisco Xavier 524, Rio de Janeiro, Brazil7Comenius University, Faculty of Mathematics and Physics, Mlynska Dolina, SK-84215 Bratislava, Slovakia8Coll�ege de France, Lab. de Physique Corpusculaire, IN2P3-CNRS, FR-75231 Paris Cedex 05, France9CERN, CH-1211 Geneva 23, Switzerland10Institut de Recherches Subatomiques, IN2P3 - CNRS/ULP - BP20, FR-67037 Strasbourg Cedex, France11Institute of Nuclear Physics, N.C.S.R. Demokritos, P.O. Box 60228, GR-15310 Athens, Greece12FZU, Inst. of Phys. of the C.A.S. High Energy Physics Division, Na Slovance 2, CZ-180 40, Praha 8, Czech Republic13Dipartimento di Fisica, Universit�a di Genova and INFN, Via Dodecaneso 33, IT-16146 Genova, Italy14Institut des Sciences Nucl�eaires, IN2P3-CNRS, Universit�e de Grenoble 1, FR-38026 Grenoble Cedex, France15Helsinki Institute of Physics, HIP, P.O. Box 9, FI-00014 Helsinki, Finland16Joint Institute for Nuclear Research, Dubna, Head Post O�ce, P.O. Box 79, RU-101 000 Moscow, Russian Federation17Institut f�ur Experimentelle Kernphysik, Universit�at Karlsruhe, Postfach 6980, DE-76128 Karlsruhe, Germany18Institute of Nuclear Physics and University of Mining and Metalurgy, Ul. Kawiory 26a, PL-30055 Krakow, Poland19Universit�e de Paris-Sud, Lab. de l'Acc�el�erateur Lin�eaire, IN2P3-CNRS, Bat. 200, FR-91405 Orsay Cedex, France20School of Physics and Chemistry, University of Lancaster, Lancaster LA1 4YB, UK21LIP, IST, FCUL - Av. Elias Garcia, 14-1o, PT-1000 Lisboa Codex, Portugal22Department of Physics, University of Liverpool, P.O. Box 147, Liverpool L69 3BX, UK23LPNHE, IN2P3-CNRS, Univ. Paris VI et VII, Tour 33 (RdC), 4 place Jussieu, FR-75252 Paris Cedex 05, France24Department of Physics, University of Lund, S�olvegatan 14, SE-223 63 Lund, Sweden25Universit�e Claude Bernard de Lyon, IPNL, IN2P3-CNRS, FR-69622 Villeurbanne Cedex, France26Univ. d'Aix - Marseille II - CPP, IN2P3-CNRS, FR-13288 Marseille Cedex 09, France27Dipartimento di Fisica, Universit�a di Milano and INFN, Via Celoria 16, IT-20133 Milan, Italy28Niels Bohr Institute, Blegdamsvej 17, DK-2100 Copenhagen �, Denmark29NC, Nuclear Centre of MFF, Charles University, Areal MFF, V Holesovickach 2, CZ-180 00, Praha 8, Czech Republic30NIKHEF, Postbus 41882, NL-1009 DB Amsterdam, The Netherlands31National Technical University, Physics Department, Zografou Campus, GR-15773 Athens, Greece32Physics Department, University of Oslo, Blindern, NO-1000 Oslo 3, Norway33Dpto. Fisica, Univ. Oviedo, Avda. Calvo Sotelo s/n, ES-33007 Oviedo, Spain34Department of Physics, University of Oxford, Keble Road, Oxford OX1 3RH, UK35Dipartimento di Fisica, Universit�a di Padova and INFN, Via Marzolo 8, IT-35131 Padua, Italy36Rutherford Appleton Laboratory, Chilton, Didcot OX11 OQX, UK37Dipartimento di Fisica, Universit�a di Roma II and INFN, Tor Vergata, IT-00173 Rome, Italy38Dipartimento di Fisica, Universit�a di Roma III and INFN, Via della Vasca Navale 84, IT-00146 Rome, Italy39DAPNIA/Service de Physique des Particules, CEA-Saclay, FR-91191 Gif-sur-Yvette Cedex, France40Instituto de Fisica de Cantabria (CSIC-UC), Avda. los Castros s/n, ES-39006 Santander, Spain41Dipartimento di Fisica, Universit�a degli Studi di Roma La Sapienza, Piazzale Aldo Moro 2, IT-00185 Rome, Italy42Inst. for High Energy Physics, Serpukov P.O. Box 35, Protvino, (Moscow Region), Russian Federation43J. Stefan Institute, Jamova 39, SI-1000 Ljubljana, Slovenia and Laboratory for Astroparticle Physics,Nova Gorica Polytechnic, Kostanjeviska 16a, SI-5000 Nova Gorica, Slovenia,and Department of Physics, University of Ljubljana, SI-1000 Ljubljana, Slovenia
44Fysikum, Stockholm University, Box 6730, SE-113 85 Stockholm, Sweden45Dipartimento di Fisica Sperimentale, Universit�a di Torino and INFN, Via P. Giuria 1, IT-10125 Turin, Italy46Dipartimento di Fisica, Universit�a di Trieste and INFN, Via A. Valerio 2, IT-34127 Trieste, Italyand Istituto di Fisica, Universit�a di Udine, IT-33100 Udine, Italy
47Univ. Federal do Rio de Janeiro, C.P. 68528 Cidade Univ., Ilha do Fund~ao BR-21945-970 Rio de Janeiro, Brazil48Department of Radiation Sciences, University of Uppsala, P.O. Box 535, SE-751 21 Uppsala, Sweden49IFIC, Valencia-CSIC, and D.F.A.M.N., U. de Valencia, Avda. Dr. Moliner 50, ES-46100 Burjassot (Valencia), Spain50Institut f�ur Hochenergiephysik, �Osterr. Akad. d. Wissensch., Nikolsdorfergasse 18, AT-1050 Vienna, Austria51Inst. Nuclear Studies and University of Warsaw, Ul. Hoza 69, PL-00681 Warsaw, Poland52Fachbereich Physik, University of Wuppertal, Postfach 100 127, DE-42097 Wuppertal, Germany53On leave of absence from IHEP Serpukhov54Now at University of Florida

1
1 Introduction
At the end of 1995 and in 1996 LEP was run for the �rst time at energies well abovethe Z0 resonance, the LEP-2 regime. A total luminosity of about 26 pb�1 was collected atcentre-of-mass energies ranging from 130 to 172 GeV, allowing the determination of thecross-sections for the inclusive production of quark-antiquark pairs and for lepton pairs ofeach avour in a new kinematic domain. Lepton pairs were also used to extract forward-backward charge asymmetries. In addition, the cross-section ratios and forward-backwardasymmetries for light (uds), c and b quarks have been determined, using avour-taggingtechniques.
A characteristic feature of fermion pair production at these energies is that a largepart of the events undergo Initial State Radiation (ISR), which reduces the e�ectivecentre-of-mass energy,
ps0; in particular down to Z0 energies.
The determination of the luminosity and the selection of the di�erent �nal states weresimilar to those used at LEP-1 [1,2]. However, the selection criteria were adapted tothe fast decrease of the signal cross-sections with increasing collision energy and to theemergence of new backgrounds due to four-fermion production. For each collision energy,the hadronic and leptonic cross-sections and the leptonic forward-backward asymmetrieswere computed for the full range of
ps0, as well as for the subsample of events where
ps0
was close to the collision energy (ps).
A description of the DELPHI apparatus is given in [3] and details on the performanceof the DELPHI detector and algorithms used for reconstruction and simulation can befound in [4]. The speci�c event generators used for the analyses are described in therelevant sections of this paper. The details of the LEP energy measurement, luminositydetermination, the computation of s0 and the analyses of each �nal state, i.e. inclusivee+e�, �+��, �+�� and q�q pairs, are given in section 2. In addition to the inclusivequark-antiquark cross-section data, measurements of the cross-sections for light (u,d,s),charm (c) and bottom (b) quarks, and of their forward-backward asymmetries, have beenmade. The analysis techniques used in extracting these avour-tagged samples are alsodescribed in section 2.
The results on the lepton data and inclusive q�q are given in section 3, together withresults on the cross-sections and asymmetries of avour-tagged hadronic �nal states.The cross-sections and asymmetries measured at high energies were combined with thepublished Z0 data [1,2] in order to check the predictions of the Standard Model (SM). Thedata were analysed in the framework of the S-matrix approach, achieving a substantialimprovement in the precision of the hadronic Z0 interference compared to the accuracyobtained from the Z0 data alone, this is discussed in section 4.
The data are also interpreted in terms of several models which include physics beyondthe SM, the theoretical descriptions of these models are given in section 5 and the resultsof the interpretations are given in section 6. Many of these models predict sizeable e�ectsin e+e� collisions at energies above the Z resonance. For example, several models proposedto explain the anomaly reported by the HERA experiments [5] also predict deviationsfrom the SM for observables at LEP-2 (e.g. [6,7]). The �rst set of models considered hereparameterise new physics, with a characteristic high energy scale, in terms of e�ectivecontact interactions between fermions. Non-conservation of R-parity in Supersymmetricextensions of the Standard Model could lead to e�ects in both the cross-sections andforward-backward asymmetries of e+e� ! ff . The high-energy results presented hereare used to determine limits on many of the possible R-parity violating couplings.

2
Finally, in many extensions to the SM there are additional Z0
bosons. Such bosonswould give rise to deviations from the SM predictions, both for the cross-sections andforward-backward asymmetries, largely through interference e�ects with the SM ampli-tudes. The theoretical framework of these models is discussed in section 5.
The results of the interpretation of the data presented in this paper in terms of con-tact interactions and R-parity violating SUSY e�ects are described in section 6. Thisinterpretation is performed separately for the lepton cross-section and forward-backwardasymmetries and for the avour-tagged q�q cross-section and asymmetry data. The highenergy data, together with data taken at the Z-pole, are also interpreted in terms ofpossible Z
0
bosons.A summary and conclusions are given in section 7. For comparison, the results on the
analyses of the high energy e+e� ! ff data from the other LEP experiments can befound in [8], [9] and [10].
2 Measurements of cross-sections and asymmetries
2.1 LEP energy determination
At energies well above the Z0 resonance the LEP energy cannot be determined directlyby resonant depolarisation. In 1996, resonant depolarisation was achieved at a beamenergy of 50 GeV. The centre-of-mass energies for the data between 130 and 172 GeVare determined by using a model of the LEP energy [11,12]. Information on the magnetic�elds of the dipole magnets, the temperature of the LEP dipole magnets, the RF cavitiesand other quantities which in uence the LEP energy are used in this model. The modelis normalised to the resonant depolarisation data. For higher energies, an extrapolationmust be performed and the uncertainty on the normalisation used in the extrapolation isthe largest source of uncertainty. The estimated uncertainties on the LEP beam energiesare 27 and 30 MeV at beam energies of 80.5 and 86 GeV respectively [11]. For the datataken in 1995, at beam energies between 65 and 70 GeV, the estimated uncertainty onthe beam energy is 25 MeV [12].
2.2 Luminosity measurement
The luminosity was derived from the rate of events due to Bhabha scattering recon-structed in the high precision Small angle TIle Calorimeter (STIC) of the experiment,which consists of two lead scintillator sampling calorimeters. Located at � 220 cm fromthe interaction point, they provide full coverage of the region between 29 and 185 mradwith respect to the beam line. A detailed description of the detector can be found in [13].
The events due to Bhabha scattering were selected by demanding a coincidence of twoshowers, coplanar with the beam direction and with energies larger than 65% of the beamenergy, and by requiring that the reconstructed radial position of the showers were insidethe geometrical acceptance.
Due to a very sharp angular dependence of the Bhabha cross-section at small anglesthe uncertainty on the inner edge of the acceptance represents the major experimentaluncertainty in luminosity determination. In 1995 the inner radius of the acceptance onone side was de�ned by a precisely machined conical tungsten mask projecting to theinteraction point, which absorbs incoming electrons. At the start of 1996, the mask wasremoved to increase the acceptance for four-fermion processes. The selection of Bhabha

3
events was therefore based on the radius of the showers reconstructed in both calorime-ters. In order to reduce the dependence of the visible cross-section on the longitudinalposition of the interaction point the side with tighter cuts on radial position of showerswas alternated at each trigger. The loss in precision after the removal of the mask resultedin an increase of the total experimental systematic uncertainty on the luminosity deter-mination from 0:09% in 1995 to 0:5% in 1996. This value is still small when comparedto the statistical precision of the measured cross-sections for fermion pair production.
The calculation of the visible cross-section was based on the event generatorBHLUMI 4.03 [14], which has a theoretical accuracy of �0:25%.
Experimental and theoretical systematic uncertainties on the luminosity are not in-cluded in the errors on the individual cross-section measurements presented hereafter.They are treated as common to all cross-section measurements in the �tting procedure.
2.3 Determination of s0
Although slightly di�erent for each �nal state, the computations ofps0 were all per-
formed using the constraint of the collision energy, the reconstructed directions of the�nal state fermions and the information of the electromagnetic calorimeters on isolated(ISR) energetic photons. The performance of all
ps0 computation methods and the sys-
tematic errors associated to the separation of the non-radiative part of measurementswere estimated from simulated events.
In the e+e� ! q�q( ) analysis, each event was �rst forced into a 2-jet con�guration byadjusting the value of the parameter djoin in the LUCLUS [15] clusterisation algorithm.
The value ofps0 was derived from the polar angles of the jet directions (�1; �2), assuming
that a single ISR photon was emitted along the beam line. In this topology the reducedcentre-of-mass energy is given by the following expression:
s0 = s� 2E
ps; (1)
where E is the ISR photon energy:
E =j sin(�1 + �2)j
ps
sin �1 + sin �2 + j sin(�1 + �2)j: (2)
When an isolated energetic photon was reconstructed in the electromagnetic calorimetersthe value of
ps0 was computed from the measured photon energy. The fraction of events
where such an isolated photon was observed was close to 25%, in agreement with theprediction of a Monte Carlo simulation.
In the e+e� ! �+��( ) analysis,ps0 was calculated from a kinematic �t procedure,
where four di�erent topologies were investigated for each event: i) no photon radiated,ii) one photon radiated along the beam line, iii) one seen and one unseen photon in anydirection, iv) a single unseen photon in any direction. The seen photon �t was performedif a neutral energy deposit greater than 5 GeV was measured in the electromagneticcalorimeters. A probability was assigned to each of the four hypotheses on the basis of�2 of the kinematic �t. The most probable hypothesis was retained, and
ps0 was set
accordingly, either to the �tted invariant mass of the muons (topology ii), iii) or iv)), ortops (topology i)).
In the e+e� ! �+��( ) analysis,ps0 was calculated from the estimated fermion
directions using formulae 1 and 2. For the e+e� ! e+e�( ) channel the analysis isperformed in terms of the acollinearity of the outgoing electron and positron, which iswell determined experimentally and can be treated theoretically. The acollinearity is

4
correlated to s0 in s-channel processes, so that a cut on acollinearity can be used to selectevents with predominantly low energy initial state radiation.
2.4 e+e�
! e+e�( ) in the central angular region
The analysis was similar to that used for Z0 energies with the values of the cutsimposed on energy and momenta scaled according to the centre-of-mass energy. Thedetails of the event selection can be found in [1,2].
The electron and positron were required to be in the polar angle range 44� < � < 136�
and the non-radiative events were selected by requiring the acollinearity angle betweenthe �nal state e+ and e�, �acol, to be smaller than 20� 1. In this region the statisticswere su�cient to apply the method where the selection e�ciency is derived from the datathemselves, using two independent selections based on the information delivered by di�er-ent sets of subdetectors (one using the barrel electromagnetic calorimeter and the siliconvertex detector, and the other using the main tracking detectors in the barrel region,namely, the Inner Detector, the Time Projection Chamber and the Outer Detector).
Another analysis which estimates e�ciency from simulated events was performed forthe acollinearity region between 20� and 90�. It was checked that this method also givesconsistent results for the region of acollinearity below 20�. The sum of the results ofboth methods was used to produce the cross-section and asymmetry for an acollinearitysmaller than 90�. This cut de�nes the total cross-section and asymmetry measurementsfor the e+e� ! e+e�( ) process in analogy with the low s0 cut for other channels.
The main background was due to e+e� ! �+��( ) events. Its contribution wasestimated from simulation. The other sources of background, as well as the feed-throughfrom radiative events into the non-radiative sample, were found to be negligible.
Systematic errors on the cross-section measurements arise from event selection, back-ground subtraction and acceptance de�nition. The e�ciencies, residual backgrounds,contamination of radiative events in the non-radiative sample and total systematic errorsof the cross-section analyses are given in Table 1 for each collision energy.
The forward-backward asymmetries have been determined with the same samples ofevents. Systematic errors on the asymmetry arise from charge confusion and forward-backward acceptance di�erences. They are negligible compared to the statistical preci-sion.
2.5 Forward e+e�
! e+e�( )
The di�erential e+e� cross-section was measured in the forward region using the For-ward Electromagnetic Calorimeter (FEMC). Events were selected by requiring at leastone electromagnetic cluster with an energy greater than 2/3 of the beam energy in eachof the calorimeters (polar angle range 12� < � < 35� and 145� < � < 168�) and anacollinearity between the two clusters smaller than 10 degrees.
The selection e�ciency was derived from the real data by studying events where onlyone lepton passed the energy requirements. Simulated events were used to take intoaccount correlations between hemispheres.
The most relevant background was due to e+e� ! ( ) events, and amounted to(1:4 � 0:1)%. The e�ciencies, backgrounds and total systematic errors at each energypoint are summarised in table 2.
1The cut at 20� corresponds approximately to selecting events where the invariant mass of the ee pair isps0 > 0:85
ps.

5
e+e� ! e+e�( ); �acol < 20�
Energy (GeV) 130.2 136.2 161.3 172.1
E�ciency, % 97.3 98.6 97.3 97.0
Background, % 0.16 0.15 0.14 0.10
Total systematic error, % �1:9 �1:5 �1:5 �1:2
e+e� ! e+e�( ); �acol < 90�
Energy (GeV) 130.2 136.2 161.3 172.1
E�ciency, % 96.4 97.5 95.6 95.6
Background, % 0.5 0.4 0.2 0.3
Total systematic error, % �1:7 �1:4 �1:4 �1:1
Table 1: E�ciencies, residual backgrounds and total systematic errors of the cross-section measurements
for e+e� ! e+e�( ) channel in the central angular region for di�erent collision energies.
e+e� ! e+e�( ); �acol < 10�
Energy (GeV) 130.2 136.2 161.3 172.1
E�ciency, % 83.0 82.9 82.8 82.8
Background, % 1.4 1.4 1.4 1.4
Total systematic error, % �2:6 �2:6 �2:8 �2:8
Table 2: E�ciencies, residual backgrounds and total systematic errors of the cross-section measurements
for e+e� ! e+e�( ) channel in the forward region for di�erent collision energies.

6
e+e� ! �+��( );ps0=ps > 0:85
Energy (GeV) 130.2 136.2 161.3 172.1
E�ciency, % 93.0 93.0 91.5 92.5
Background, % 3.2 3.2 3.4 2.2
Feed-through from rad.events, % 1.8 1.8 1.5 0.9
Total systematic error, % �3:7 �3:7 �3:5 �3:4
e+e�! �+��( );ps0 > 75 GeV
Energy (GeV) 130.2 136.2 161.3 172.1
E�ciency, % 91.0 91.0 91.0 91.0
Background, % 2.5 2.4 3.9 4.5
Total systematic error, % �3:4 �3:4 �3:4 �3:4
Table 3: E�ciencies, residual backgrounds, feed-through from radiative events into the non-radiative
sample and total systematic errors of the cross-section measurements for e+e� ! �+��( ) channel for
di�erent collision energies.
2.6 e+e�
! �+��( )
The event selection for the process e+e� ! �+��( ) was based on criteria similarto those used at Z0 energies. An event was required to have two identi�ed muons inthe polar angle range 20� � � � 160�, originating from close to the interaction region(to reduce the cosmic ray background), with the momentum of the most energetic muonbeing at least 30 GeV=c. The contamination of the �nal sample by two-photon collisionevents, cosmic rays, �+�� and four-fermion �nal states was further reduced by requiringthe �+�� invariant mass to be greater than 75 GeV=c2. After these selections a smallbackground contamination was left, with the main source from cosmic ray events. Thiswas estimated by extrapolating the number of events which were not su�ciently closeto the interaction region into the region from which signal events were selected. At161 GeV and 172 GeV there was a signi�cant contribution from two-photon interactions.At 172 GeV, above the threshold for W pair production, there was also a signi�cantcontribution from four-fermion �nal states.
The non-radiative events were selected by requiringps0=ps � 0:85. The contamina-
tion from Z0 radiative events was found to decrease with increasingps and was between
1:8% and 0:9%. The decrease was due to the increasing separation between the highenergy and radiative return peaks with
ps. The distributions of
ps0=ps obtained for the
data and simulation are shown in Figure 1.
The selection e�ciency was estimated from simulation and was found to be in agree-ment with the results of another method based on the data themselves. The resultingcross-sections were corrected to the full angular acceptance using correction factors ob-tained from DYMU3 [17] and ZFITTER [18]. The e�ciencies, residual backgrounds,

7
DELPHI
√s,/√s
No.
of e
vent
s/0.
05
e+e-→µ+µ-(γ)√s = 130+136 GeV
Data
Expected signal +Background
Background
√s,/√s
No.
of e
vent
s/0.
05
e+e-→µ+µ-(γ)√s = 161+172 GeV
Data
Expected signal +background
Background
0
5
10
15
20
25
30
35
40
45
50
0.3 0.4 0.5 0.6 0.7 0.8 0.9 1 1.1
0
10
20
30
40
50
60
70
80
0.3 0.4 0.5 0.6 0.7 0.8 0.9 1 1.1
Figure 1: Distribution of the reconstructed reduced energy for the e+e� ! �+��( ) process. The
points are the data and the histogram shows the simulation from KORALZ normalised to ZFITTER.

8
contamination of radiative events in the non-radiative sample and total systematic errorsof the cross-section analyses for di�erent collision energies are given in Table 3.
The forward-backward asymmetry was determined with a counting method: Afb =(Nf�Nb)=(Nf+Nb), where Nf and Nb are the number of events with the �
� produced inthe forward and the backward region, respectively. Measured asymmetries were correctedfor the background and for the contamination of non-radiative events by events with hardISR photons. The correction to the full angular range was performed using DYMU3.
2.7 e+e�
! �+��( )
For the selection of tau pair events, the thrust axis was calculated using the chargedparticle momenta, and the particles in each event were then assigned to the hemispheresformed by the plane perpendicular to the thrust axis and passing through the origin. Theleading charged particle in each hemisphere was required to lie in the polar angle rangej cos �j < 0:94, and the observed charged particle multiplicity was required to be unity inone hemisphere and no more than �ve in the other. The leading charged particles in bothhemispheres had to be consistent with originating from the interaction region and at leastone of them was required to have momentum greater than 0:025 �ps=c. Non-radiativeevents were selected by requiring
ps0=ps > 0:85.
For the rejection of Bhabha events, �-pairs and cosmic ray backgrounds, the acollinear-ity was required to be greater than 0.5�. In addition, a radial momentum was de�ned
as Prad =qx21 + x22, where x1(2) is the momentum of the most energetic charged particle
in hemisphere 1(2) normalised to that expected for a dimuon event, P1(2), which wascalculated from the formula
P1(2) =ps sin �2(1)=(j sin(�1 + �2)j+ sin �1 + sin �2):
The value of Prad was required to be less than 1.1. Similarly, a radial energy, Erad, wasde�ned using the total electromagnetic calorimetric energy deposited in a cone of half-angle 30� around the highest momentum charged particle track in each hemisphere, andits value was required to satisfy Erad < 0:8. Dimuon events have a peak at
p2 in radial
momentumwhile Bhabha events have a peak atp2 for both radial momentum and radial
energy.To reject the remaining two-photon background, it was required that the total visible
energy of the event exceeded 0:15ps, and the transverse momentum of the event be
greater than 0:04ps=c for those events consistent with the reactions e+e� ! e+e�e+e�
and e+e� ! e+e��+��, where both channels were tagged using calorimetric signals.Further rejection of both Bhabha and e+e� ! e+e�e+e� events was obtained by rejectingevents where both leading charged particles had an associated electromagnetic energygreater than 40% of the measured particle momentum.
The background from e+e� ! WW;ZZ events was reduced by demanding that theevent acoplanarity1 , was less than 0.3 radians.
The distribution ofps0=ps is presented in Figure 2. The selection e�ciency and
the background estimation were performed using simulated events. The total and non-radiative cross-sections were determined after correcting for the selection e�ciency andbackground, and for feed-through from radiative events in the case of the non-radiativecross-sections.
1The event acoplanarity is de�ned as j�1 � �2j � �, where �1(2) are the azimuthal angles of the leading tracks inhemispheres 1 (2) in the DELPHI coordinate system, in which the z-axis points along the direction of incoming electrons,the x-axis points towards the centre of LEP and the y-axis points vertically upwards

9
DELPHI
√s,/√s
No.
of e
vent
s/0.
05
0.3
e+e- → τ+τ-(γ)√s = 130+136 GeV
Data
Expected signal +Background
Background
√s,/√s
No.
of e
vent
s/0.
05
0.3
e+e- → τ+τ-(γ)√s = 161+172 GeV
Data
Expected signal +background
Background
0
5
10
15
20
25
30
35
0.3 0.4 0.5 0.6 0.7 0.8 0.9 1 1.1
0
10
20
30
40
50
60
0.3 0.4 0.5 0.6 0.7 0.8 0.9 1 1.1
Figure 2: Distribution of the reconstructed reduced energy for the e+e� ! �+��( ) process. The
points are the data and the histogram shows the simulation from KORALZ normalised to ZFITTER.

10
The e�ciencies, residual backgrounds, contamination of radiative events in the non-radiative sample and total systematic errors of the cross-section analyses for di�erentcollision energies are given in Table 4.
The forward-backward charge asymmetry was determined using the counting methodwhere the thrust axis de�ned the polar angle. The asymmetry was corrected for accep-tance and background and in the case of the high-energy sample for feed-through fromradiative events.
2.8 Inclusive e+e�
! q�q( )
The selection of inclusive hadronic �nal states was based on the charged particle trackschosen with the criteria described in [1,2]. Events were retained if they contained at least7 charged particles and if the energy of charged particles was greater than 15% of the
collision energy. In addition, the quantityqE2F + E2
B, where EF and EB are the totalenergy seen in the Forward and Backward electromagnetic calorimeters, was required tobe less than 90% of the beam energy.
The selection e�ciency was computed from simulated events produced with thePYTHIA 5.7 [15] generator, which was tuned on the data collected by DELPHI aroundthe Z0 [19].
The residual background contamination was estimated with simulated event samples.The TWOGAM generator [20] was used to simulate two-photon collisions, PYTHIA andBABAMC [21] were used for lepton pair production, and PYTHIA was used for four-fermion production. Below 161 GeV, the main background contributions to the totalcross-section measurement came from two-photon interactions and from Z0e+e� events(amounting typically to 5.5 � 1 pb and 1.8 � 0.5 pb, respectively). Above 161 GeV,W-pair production became a substantial background. It dominates at 172 GeV, witha contribution of 10.9 � 0.3 pb to the total cross-section and of 4.9 � 0.2 pb to thenon-radiative cross-section.
The distribution of the reconstructed reduced energy is presented in Figure 3 forthe four collision energies. The total cross-section refers to
ps0=ps > 0:1, whereas the
non-radiative cross-section refers tops0=ps > 0:85. The resolution on the latter cut
value translates into a purity of the non-radiative event sample which increases fromabout 82% at 130 GeV to about 90% at 172 GeV. The systematic uncertainty on theselection e�ciency for non-radiative events, which amounts to �2:5%, was dominated bythe accuracy of the determination of
ps0=ps which also includes the uncertainty in the
ISR.The e�ciencies, residual backgrounds and contamination of radiative events in the
non-radiative sample entering the computation of the cross-sections are given in Table 5for each collision energy, together with the total systematic uncertainties associated toeach measurement.
2.9 Flavour-tagged hadronic �nal states
The hadronic data were analysed to investigate the separate production of bottom,charm and light quarks.
The selection of hadronic events was as described for inclusive hadronic �nal states.In addition, the thrust axis of the event was calculated including neutral particles andits polar angle was required to be between 25� and 155�. The charged and neutralparticles were clustered into jets using the LUCLUSalgorithm with an invariant mass

11
e+e�! �+��( );ps0=ps > 0:85
Energy (GeV) 130.2 136.2 161.3 172.1
E�ciency, % 45.8 48.7 44.2 46.0
Background, % 15 15 16 12
Feed-through from rad.events, % 7 6 4 8
Total systematic error, % �7 �7 �7 �7
e+e�! �+��( );ps0 > 75 GeV
Energy (GeV) 130.2 136.2 161.3 172.1
E�ciency, % 44.1 45.8 41.6 40.8
Background, % 17 16 17 16
Total systematic error, % �7 �7 �7 �7
Table 4: E�ciencies, residual backgrounds, feed-through from radiative events into the non-radiative
sample and total systematic errors of the cross-section measurements for e+e� ! �+��( ) channel for
di�erent collision energies.
e+e�! q�q( );ps0=ps > 0:85
Energy (GeV) 130.2 136.2 161.3 172.1
E�ciency, % 85.7 84.6 87.1 86.9
Background, % 1.4 1.5 5.7 19.7
Feed-through from rad.events, % 18.5 17.4 11.4 10.2
Total systematic error, % �3:0 �3:0 �3:0 �3:0
e+e�! q�q( );ps0=ps > 0:10
Energy (GeV) 130.2 136.2 161.3 172.1
E�ciency, % 91.4 90.3 88.7 85.9
Background, % 2.9 3.6 7.8 18.0
Total systematic error, % �0:9 �1:0 �1:1 �1:3
Table 5: E�ciencies, residual backgrounds, feed-through from radiative events into the non-radiative
sample and total systematic errors of the cross-section measurements for e+e� ! q�q( ) channel for
di�erent collision energies.

12
DELPHI
No.
of e
vent
s/3
GeV
Dataqq
- (γ)
Bkg
√s = 130 GeV
No.
of e
vent
s/3
GeV
Dataqq
- (γ)
Bkg
√s = 136 GeV
No.
of e
vent
s/3
GeV
Dataqq
- (γ)
Bkg
√s = 161 GeV
√s, (GeV)
No.
of e
vent
s/3
GeV
Dataqq
- (γ)
Bkg
√s = 172 GeV
0
50
100
150
0
50
100
150
0
100
200
0
50
100
150
40 60 80 100 120 140 160 180
Figure 3: Distribution of the reconstructed reduced energy for the e+e� ! q�q( ) process at di�erent
collision energies. The points are the data and the histogram shows the simulation.

13
cut of 5 GeV=c2. To remove W+W� events in the 161 and 172 GeV data, only eventswith 3 jets or less were kept. In addition, events with three jets were rejected if oneof the jets contained only one charged particle and at most two neutral particles - toremove semileptonicW decays. The e�ective centre-of-mass energy
ps0 was calculated as
described in section 2.3. To remove events that return radiatively to the Z,ps0=ps > 0:85
was required. A total sample of 426 hadronic events at a centre-of-mass energy of 130and 136 GeV, 288 events at 161 GeV and 232 events at 172 GeV were selected. TheW+W� background in the inclusive hadronic event sample amounts to 0:8% at 161 GeVand 1:7% at 172 GeV. The DYMU3 and PYTHIA [17,15] generators (with DELPHItuning [19]) were used to generate qq( ) and W+W� events for the simulation.
The selected hadronic events were divided into three main classes. The �rst class wasenriched in bottom quarks, the second in charm quarks and the third in light quarks.The avour separation was based on the probability that all the tracks in an event camefrom the primary vertex [22]. For light quark events this is typically large, whereas fora large fraction of events containing a bottom quark this probability is low, due to thelong lifetime of B hadrons. The de�nitions of the classes were chosen to optimise thee�ciency and purity for the di�erent categories. The e�ciencies and purities after thisclassi�cation for the energies of 161-172 GeV with
ps0=ps > 0:85 obtained by simulation
are shown in Table 6.Hadronic events collected to calibrate the detector at Z energies, were used to check the
predicted rates observed for the 3 classes. For the 1995 data 41k events were selected, forthe 1996 data 21k. The fractions of tagged events in data and simulation were comparedand their ratios were found to be 0.942 � 0.010 (1.011 � 0.017) for the b tag, 1.046 �0.010 (1.052 � 0.017) for the c tag, and 1.006 � 0.005 (0.983 � 0.010) for the light quarktag. The numbers in brackets correspond to the Z data taken in 1996, the errors arestatistical only. The tagging rates agree to better than �10% with the values from thesimulation. To obtain predictions for the tagging rates at 130 GeV and above, the ratespredicted by the simulation were corrected using these fractions. It was assumed thatthe fractions of bottom, charm and light quark events at the Z are the same as predictedin the Standard Model. Potential errors arising from the corrections applied to the highenergy data, but calculated at the Z due to di�erences in properties of the events (forexample, the avour composition which could give di�erent biases through the purity)are included in the systematic error.
The observed numbers of events in the avour-tagged samples of hadronic �nal stateswere compared to the expected number of events assuming the Standard Model fractionsfor bottom, charm and light quark events, after applying the correction factors obtainedfrom the Z data. The results for the b, c and uds enriched classes are shown in Table7, together with the systematic and statistical errors coming from the simulation. Thesystematic error had two components. The �rst was due to the statistical uncertaintyon the correction derived from the normalisation of the quark production rates to thehadronic Z data. The second component was an estimate of the uncertainty in thebottom, charm and light quark e�ciencies which was taken from the changes in tagginge�ciencies in simulation which would be needed to obtain the tagging rates in data at theZ. These changes in e�ciency were then applied at the higher energies and the di�erencesin the number of events tagged in the simulation were assigned as the systematic error,taken to cover possible errors due to di�erences between events at the Z and at higherenergies. The error on the expected tagging rate was then evaluated by taking the worstcase scenarios, e.g. where discrepancies for the light quark tag were fully attributed topresence of charm background. The quadratic sum of these two components is quoted as

14
tag e�ciency b content c content uds content
b enriched 0.78 (b) 0.76 0.19 0.05
c enriched 0.35 (c) 0.14 0.43 0.43
uds enriched 0.79 (uds) 0.03 0.21 0.76
Table 6: E�ciencies and purities for the di�erent tags at energies of 161-172 GeV.
the total systematic error. The results for the observed number of events were compatiblewithin approximately one standard deviation with the number of expected events in theStandard Model.
At the Z-pole the forward-backward asymmetries for quarks are around 10% in theStandard Model. At centre-of-mass energies of 161-172 GeV, much larger forward-backward asymmetries of typically 50% and higher are expected. The hemisphere chargeQhemi [23] was used to determine the direction of the quark and that of the anti-quark,
Qhemi =Xi
qip�i===
Xi
p�i== (3)
with � = 0:6, pi== the momentum component along the thrust axis, and i runs over thecharged particles in one hemisphere, de�ned by the thrust axis. The forward-backwardhemisphere charge QFB is de�ned as the di�erence of the charges in the two hemispheres.Events with a jQFBj > 0:2 were selected, and the direction of the thrust axis was signed,assuming the quark (not anti-quark) had positive charge, to give an estimate of the initialquark direction. The angular distribution can be described by:
d�
d cos �t= 1 + cos2 �t + 8=3 AFB cos �t; (4)
where �t is the signed polar angle of the thrust axis and AFB the forward-backward chargeasymmetry. The angular distributions were �tted in the range j cos �tj < 0:8. The chargeasymmetry is positive for charm and up quarks, and negative for bottom, strange anddown quarks. Angular dependent e�ciency e�ects were negligible at the level of precisionof this measurement.
The observed asymmetry AobsFB is smaller than the real asymmetry because the hemi-
sphere charge sometimes gives the wrong sign. This can be expressed by a charge confu-sion factor C, according to the following equation:
AobsFB = CAFB: (5)
Using the simulation, the constant C was determined to be 0.54 for bottom, 0.37 forcharm, 0.55 for strange, 0.62 for up, and 0.52 for down quarks at energies of 161-172GeV. The uncertainty on the charge confusion factors determined in this way was 15%The angular distributions at energies of 161-172 GeV for all events and for bottom, charmand light quark enriched samples are shown together with the �tted curves in Figure 4.The shaded areas give the Standard Model predictions from the simulation.
The results for the di�erent samples at energies of 130-136 and 161-172 GeV for theobserved and expected charge asymmetry are shown in Table 8.
The systematic error listed in the last column comes from two sources: �rstly, fromthe uncertainty on the charge confusion factors C and secondly from the discrepancies

15
ps = 130� 136 GeV
tagobserved
events
expected
events
stat:error
(sim)
syst:error
(sim)
b enriched 68 70.4 �2:7 �0:9c enriched 73 76.1 �2:8 �1:3uds enriched 251 245.5 �3:3 �2:0
ps = 161� 172 GeV
tagobserved
events
expected
events
stat:error
(sim)
syst:error
(sim)
b enriched 85 95.2 �1:3 �2:1c enriched 117 105.3 �1:4 �2:2uds enriched 294 295.5 �1:6 �3:3
Table 7: The observed and expected numbers of events for the di�erent tags at energies of 130-136 and
161-172 GeV withps0=ps > 0:85.
ps = 130� 136 GeV
tag AobsFB Aexp
FB
stat:error
(sim)
syst:error
(sim)
all �0:039 � 0:065 0.001 �0:023 �0:002b enriched �0:199 � 0:153 -0.113 �0:059 �0:020c enriched 0:078 � 0:146 0.048 �0:058 �0:010uds enriched �0:044 � 0:086 0.021 �0:031 �0:010
ps = 161� 172 GeV
tag AobsFB A
expFB
stat:error
(sim)
syst:error
(sim)
all 0:025 � 0:058 0.023 �0:009 �0:002b enriched �0:357 � 0:139 -0.146 �0:023 �0:020c enriched 0:120 � 0:127 0.044 �0:023 �0:010uds enriched 0:072 � 0:076 0.064 �0:013 �0:010
Table 8: The observed and expected forward-backward charge asymmetries for the di�erent tags at
energies of 130-136 and 161-172 GeV withps0=ps > 0:85.

16
0
10
20
30
40
50
-1 -0.5 0 0.5 1
QFB cos θt
Eve
nts
All
0
2
4
6
8
10
12
14
16
18
-1 -0.5 0 0.5 1
QFB cos θt
Eve
nts
B tag
0
2
4
6
8
10
12
14
16
18
-1 -0.5 0 0.5 1
QFB cos θt
Eve
nts
C tag
0
5
10
15
20
25
30
35
-1 -0.5 0 0.5 1
QFB cos θt
Eve
nts
UDS tag
Figure 4: The charge-signed polar angle distributions for all events, b, c and uds enriched events at
energies of 161-172 GeV. The shaded area gives the Standard Model prediction, normalised to the data,
the full curve shows the �t of equation 4 to the data.

17
Energy (GeV) 130.2 136.2 161.3 172.1
Integrated Luminosity (pb�1) 2.87 2.96 10.09 10.12
Number of events: e+e� ! q�q( ) 868 715 1526 1288
e+e� ! e+e�( ) 129 152 276 312
e+e� ! �+��( ) 56 40 72 70
e+e� ! �+��( ) 33 29 58 54
Table 9: Integrated luminosity and statistics used in the analyses of the di�erent �nal states and
collision energies. For the e+e� ! e+e�( ) channel, the values refer to the analysis in the central
angular region with �acol < 90�, whereas for the other channels, the numbers refer to the analyses with
low s0 cut.
between data and simulation observed in the tagging rates at the Z which were propagatedaccording to the method described above.
The results for the observed forward-backward charge asymmetries are in agreementwith the Standard Model expectation.
Possible detector e�ects a�ecting the asymmetry measurement were studied. Severaldistributions were checked using the higher statistics Z data, e.g. by comparing thehemisphere charge in the forward region and the s0 distributions with the simulation.The distributions were consistent with the expectations from the simulation. Further, theobserved forward-backward charge asymmetries at the Z were compared to the StandardModel expectations for avour-tagged events and found to be Aobs
FB � AexpFB = -0.015 �
0.013 (all), -0.003 � 0.036 (b enriched), -0.013 � 0.034 (c enriched) and -0.023 � 0.019(uds enriched); consistent with expectations.
3 Results for cross-sections and asymmetries
3.1 Inclusive e+e�
! q�q( ) and leptonic �nal states
The luminosity and statistics accumulated at each collision energy are summarisedin Table 9 for the inclusive e+e� ! q�q( ) �nal state and leptonic �nal states. Theresults of the cross-section and asymmetry measurements for these di�erent �nal statesare summarised in Table 10. The errors indicated are statistical only. The systematicerrors are those presented in Table 1,3,4,5 and in the section devoted to the luminositymeasurement.
For the e+e� �nal state the photon exchange in the t-channel dominates the measuredcross-section. As a consequence, the s-channel contribution cannot be extracted reliably.These e+e� cross-sections and asymmetries were not included in the S-matrix �ts de-scribed in Section 4. However, as can be seen from Table 10, they are compatible withthe Standard Model predictions calculated with the TOPAZ0 program [24].
Figures 5 and 6 show the measured hadron, muon and tau cross-sections and forward-backward asymmetries from the Z0-peak energies up to 172 GeV. The muon data belowthe Z0, shown in the same �gures, are taken from [25]. The electron cross-section andforward-backward asymmetry including full (s+t) contribution are presented in Figures 7and 8. The curves show the ZFITTER, or TOPAZ0 (in the case of electrons), predictions.

18
Energy (GeV) 130.2 136.2 161.3 172.1
�had(pb)ps0=ps > 0:85 82:1 � 5:2 65:1� 4:7 40:9 � 2:1 30:3 � 1:9
SM 83.1 67.0 34.8 28.9ps0=ps > 0:10 328:4 � 11:4 259:6 � 10:0 158:3 � 4:5 125:5 � 4:2
SM 327.2 270.5 147.0 123.0
���(pb)ps0=ps > 0:85 9:7 � 1:9 6:6� 1:6 3:6 � 0:7 3:6� 0:7
SM 8.1 7.0 4.5 3.8ps0 > 75 GeV 24:3 � 3:2 17:0� 2:6 9:3 � 1:1 8:9� 1:1
SM 19.9 17.0 10.2 8.7
���(pb)ps0=ps > 0:85 10:2 � 3:1 8:8� 3:0 5:1 � 1:2 4:5� 1:1
SM 8.3 7.2 4.6 3.9ps0 > 75 GeV 22:2 � 4:6 17:7� 3:9 11:7 � 1:8 11:2 � 1:8
SM 20.2 17.2 10.3 8.8
A�FB
ps0=ps > 0:85 0:67 � 0:15 0:74� 0:16 0:43 � 0:16 0:94 � 0:14
SM 0.72 0.69 0.62 0.61ps0 > 75 GeV 0:45 � 0:12 0:56� 0:13 0:39 � 0:11 0:55 � 0:10
SM 0.34 0.34 0.33 0.33
A�FB
ps0=ps > 0:85 0:73 � 0:17 0:49� 0:23 0:92 � 0:08 0:13 � 0:20
SM 0.72 0.70 0.62 0.61ps0 > 75 GeV 0:31 � 0:17 0:26� 0:19 0:39 � 0:12 0:19 � 0:14
SM 0.33 0.33 0.32 0.32
�ee(pb) �acol < 20� 42:0 � 4:0 47:1� 4:2 27:1 � 1:8 30:3 � 1:9
SM 48.7 44.6 31.9 28.0
�acol < 90� 48:0 � 4:3 54:1� 4:5 30:7 � 1:9 33:7 � 2:0
SM 56.3 50.8 35.1 30.6
AeFB �acol < 20� 0:81 � 0:06 0:89� 0:04 0:82 � 0:04 0:81 � 0:04
SM 0.81 0.81 0.82 0.82
�acol < 90� 0:75 � 0:06 0:78� 0:05 0:77 � 0:04 0:76 � 0:04
SM 0.72 0.73 0.76 0.77
Table 10: Results of the cross-section and asymmetry measurements for the di�erent �nal states and
collision energies. The errors indicated are statistical only. Systematic errors are given in Tables 1,3,4
and 5 and in the section devoted to the luminosity measurement. The Standard Model predictions of
ZFITTER and for the e+e� channel TOPAZ0 are also indicated. The hadronic, muon and tau results
are corrected for all cuts, apart from the s0 cut. In case of the e+e� ! e+e�( ) channel the numbers are
restricted to the barrel analysis, and are corrected for all cuts except the acollinearity and polar angle
acceptance.

19
DELPHI
√s,>0.10√s
√s,>0.50√s
(x 0.1)
√s,>0.85√s
(x 0.1)
√s,>0.85√s
muons
taus
hadrons
Energy (GeV)
Cro
ss S
ectio
n (n
b)
10-4
10-3
10-2
10-1
1
10
10 2
40 60 80 100 120 140 160 180
qq - √s≈MZ (√s,>0.10√s)qq - √s>MZ (√s,>0.10√s)qq - √s>MZ (√s,>0.85√s)µµ - √s≈MZ (√s,>0.50√s)µµ - √s<MZ (√s,>0.50√s)
µµ - √s>MZ (√s,>0.50√s)µµ - √s>MZ (√s,>0.85√s)ττ - √s≈MZ (√s,>0.50√s)ττ - √s>MZ (√s,>0.50√s)ττ - √s>MZ (√s,>0.85√s)
Figure 5: Cross-sections for e+e� ! q�q( ), �+�� and �+�� processes measured from Z0-resonance
energies up to 172 GeV. The data at the Z resonance are the published results of the Z lineshape
corrected to the acceptanceps0 > 0:10
ps for hadrons and
ps0 > 0:50
ps for leptons. The data for
muons below the Z peak are from the analysis of e+e� ! �+��( ) data at LEP I, also corrected tops0 > 0:50
ps. The curves are the predictions of the ZFITTER program.

20
DELPHI
√s,>0.50√stausmuons
√s,>0.85√s
Energy (GeV)
Asy
mm
etry
-1
-0.8
-0.6
-0.4
-0.2
0
0.2
0.4
0.6
0.8
1
40 60 80 100 120 140 160 180
Energy (GeV)
Asy
mm
etry
0
0.2
0.4
0.6
0.8
1
110 120 130 140 150 160 170 180
µµ - √s≈MZ (√s,>0.50√s)µµ - √s<MZ (√s,>0.50√s)µµ - √s>MZ (√s,>0.50√s)µµ - √s>MZ (√s,>0.85√s)
ττ - √s≈MZ (√s,>0.50√s)ττ - √s>MZ (√s,>0.50√s)ττ - √s>MZ (√s,>0.85√s)
Figure 6: The forward-backward charge asymmetries measured in the reactions e+e� ! �+��( ) and
�+�� at energies from Z0-peak up to 172 GeV. The data at the Z resonance are the published results
of the Z lineshape corrected to the acceptanceps0 > 0:10
ps for hadrons and
ps0 > 0:50
ps for leptons.
The data for muons below the Z peak are from the analysis of e+e� ! �+��( ) data at LEP I, also
corrected tops0 > 0:50
ps. The insert shows the data with the cut
ps0 > 0:85
ps The curves are the
predictions of the ZFITTER program.

21
DELPHI
(s+t)acol<90O
(s+t)acol<20O
(x 0.5)
electrons
Energy (GeV)
Cro
ss S
ectio
n (n
b)
10-2
10-1
1
40 60 80 100 120 140 160 180
Figure 7: The measured cross-sections for e+e� ! e+e�( ) from the Z0-peak energies up to 172 GeV.
The curves are the predictions of the TOPAZ0 program.

22
DELPHI
electrons(s only)
electrons(s+t)acol<90O
electrons(s+t)acol<20O
(x 0.5)
Energy (GeV)
Asy
mm
etry
-1
-0.8
-0.6
-0.4
-0.2
0
0.2
0.4
0.6
0.8
1
40 60 80 100 120 140 160 180
Figure 8: The measured forward-backward charge asymmetries for e+e� ! e+e�( ) from the Z0-peak
energies up to 172 GeV. The curves are the predictions of the TOPAZ0 program.

23
Collision energy Total number Cross-section
(GeV) of events (nb)
130.2 2697 1.125 � 0.022
136.2 2585 1.032 � 0.020
161.3 6055 0.776 � 0.010
172.1 5546 0.695 � 0.009
Table 11: The number of events and the integrated cross-section in the range 12� < � < 35� for the
reaction e+e� ! e+e�( ) as a function of collision energy. The errors given are statistical only.
3.2 Forward e+e�
! e+e�( )
The di�erential cross-sections for forward e+e� ! e+e�( ) measured at collisionenergies of 130 to 172 GeV are shown in Figure 9 compared to the predictions ofALIBABA [26]. The total numbers of events selected and the cross-sections integratedover the full angular coverage are given in Table 11. The systematic error on these mea-surements was estimated to be �2:6%, with a dominant contribution from the knowledgeof the acceptance, the precision of the absolute polar angle calibration being �0:13�. Thedata are in agreement with the theoretical predictions.
3.3 Flavour-tagged events
From the measured event rates and asymmetries for avour-tagged events it is possibleto extract the ratios of cross-sections and asymmetries for bottom, charm, strange, up anddown quarks. The cross-section ratio Rq is de�ned as the ratio of the quark cross-section�q and the total hadronic cross-section �h.
To extract the cross-section for one quark avour, the cross-sections for the other avours were taken from the Standard Model2. The results are given in Table 12. Thecentral values of the derived ratios of quark production cross-sections compared to allhadrons do not add up exactly to unity. This is because of the various correction factors,taken from data and simulation, applied to the observed numbers in the three taggedsamples to obtain the quark production rates. In Figure 10, the extracted values of Rq
for bottom, charm and light uds quarks are shown as a function of the centre-of-massenergy, together with the predictions from ZFITTER.
To extract the forward-backward asymmetry for one quark avour, the cross-sectionsand asymmetries for the other avours were taken from the Standard Model. The ob-served asymmetry Aobs
FB is related to the quark asymmetries AiFB in the following way:
AobsFB =
Xi
qi
jqijCiPiA
iFB;
where i runs over the quarks, C denotes the charge confusion factor, and P the purity, andqi the charge on the quark. This de�nition results in a minus sign to convert the observedcharge asymmetry into the forward-backward quark asymmetry for bottom, strange and
2According to the formula Rq =�q�h
= RSMq (1 +Nobsq �Nexp
Nexp Pq), where q denotes b, c or uds quarks, Rq refers to the
extracted cross-section ratio, RSMq to the Standard Model expectation, Nobsq (N
expq ) to the observed (expected) number
of events for a given q enriched tag (see Table 7) and Pq to the q purity for a q enriched tag. For the 161-172 GeV datathe purities can be found in Table 6.

24
DELPHI
0
0.05
0.1
0.15
0.2
15 20 25 30 35
θ (deg.)
dσ/d
θ (n
b/de
g.)
√s = 130.3 GeV
0
0.05
0.1
0.15
0.2
15 20 25 30 35
θ (deg.)
dσ/d
θ (n
b/de
g.)
√s = 136.3 GeV
0
0.05
0.1
0.15
15 20 25 30 35
θ (deg.)
dσ/d
θ (n
b/de
g.)
√s = 161.3 GeV
0
0.05
0.1
0.15
15 20 25 30 35
θ (deg.)
dσ/d
θ (n
b/de
g.)
√s = 172.1 GeV
Figure 9: Di�erential cross-sections for the process e+e� ! e+e�( ) in the forward region for collision
energies of 161 and 172 GeV. The data are shown by the points and the curves are theoretical predictions
computed using the ALIBABA program.

25
down quarks, which corrects the implicit assumption that the charge of the quark waspositive, which was introduced when signing the thrust axis by the forward-backwardhemisphere-charge. The results of this procedure and the correlations3 are given in Table12. The forward-backward quark asymmetries should by de�nition lie between -1 and 1,the measured quark asymmetry can go outside this range because the charge confusionfactor and the purity are both smaller than 1. The derived up, down and strange quarkasymmetries are fully correlated because they are derived from the charge asymmetrymeasured in the uds enriched sample. The DELPHI data con�rm the expected rise ofthe forward-backward asymmetry for quarks as a function of the centre-of-mass energyabove the Z-pole.
The measurements for avour-tagged cross-section ratios and asymmetries are in agree-ment with the Standard Model.
4 Interpretation of results using S-matrix formalism
In this section the results of the inclusive q�q cross-sections and the leptonic cross-sections and forward-backward asymmetries are discussed in the context of the StandardModel. As can be seen from Table 10 the results are in reasonable agreement with theexpectations of the Standard Model.
The underlying physics can be parameterised in a quasi-model independent way us-ing the S-matrix approach [27,28]. Fits to the measured inclusive hadronic, muon andtau cross-sections and muon and tau forward-backward asymmetries were carried outin this framework using the corresponding branch of the ZFITTER program. The �tsincluded also hadronic, electron, muon and tau data collected by DELPHI near the Z0
resonance [1,2]. The usual de�nitions of the mass (MZ) and width (�Z) of a Breit-Wignerresonance were used, the width being s-dependent.
The S-matrix parameters r and j scale the Z0 exchange and the Z0 interferencecontributions to the total cross-section and forward-backward lepton asymmetries. Thecontribution of the pure exchange was �xed to its value predicted by QED in all �ts.
The results of the �ts are presented in Table 13. The �2 amounted to 227.9 in the caseof the 16-parameter �t (i.e. without assuming lepton universality) and to 237.1 for the8-parameter �t (where lepton universality was assumed). The number of points �ttedwas 217 in both cases. The correlation coe�cients between the free parameters of the8-parameter �t are shown in Table 14.
The data support the hypothesis of lepton universality. Overall, the measurementsare well reproduced by the Standard Model predictions. At 161 GeV, however, themeasured total hadronic cross-section is 3.1 statistical standard deviations larger thanthe theoretical prediction. The di�erence is not concentrated at high values of
ps0=ps
and the cross-section measured at higher collision energy (i.e. 172 GeV) agrees well withthe theory. The di�erence is therefore likely to originate from a uctuation of the eventrate.
Figures 5 and 6 show the measured hadron, muon and tau cross-sections and forward-backward asymmetries from the Z0-peak energies up to 172 GeV. The electron cross-section and forward-backward asymmetry including full (s+t) contribution are presentedin Figures 7 and 8. The curves show the ZFITTER, or TOPAZ0 (in the case of electrons),predictions.
3The correlations �Rq=�Rx, �AqFB
=�AxFB
and �AqFB
=�Rx, are given for the working point where the ratios and asym-
metries are equal to the SM predictions and are only valid for small deviations from these expectations.

26
Rq(ps = 130� 136 GeV)
quark avour Rq RSMq �Rq=�Rb �Rq=�Rc �Rq=�Ruds
bottom 0:174 � 0:028 0.182 1 0.20 0.02
charm 0:199 � 0:073 0.225 0.40 1 0.38
light uds 0:610 � 0:050 0.593 0.13 0.73 1
Rq(ps = 161� 172 GeV)
quark avour Rq RSMq �Rq=�Rb �Rq=�Rc �Rq=�Ruds
bottom 0:142 � 0:024 0.165 1 0.17 0.02charm 0:314 � 0:055 0.250 0.49 1 0.43
light uds 0:581 � 0:047 0.585 0.14 0.64 1
AqFB(ps = 130� 136 GeV)
quark avour AqFB ASM
FB �AqFB=�A
bFB �A
qFB=�A
cFB �A
qFB=�A
s(d)FB �A
qFB=�A
uFB
bottom 0:67 � 0:39 0.475 1 -0.17 0.02 (0.02) -0.03charm 0:90 � 1:17 0.679 -0.48 1 0.46 (0.46) -0.63strange 0:95 � 0:68 0.473 0.12 -0.60 1 (0.95) -1.37up 0:30 � 0:54 0.679 -0.09 0.44 -0.70 (-0.70) 1
down 0:95 � 0:67 0.473 0.13 -0.63 1.05 (1) -1.45
AqFB(ps = 161� 172 GeV)
quark avour AqFB ASM
FB �AqFB=�A
bFB �A
qFB=�A
cFB �A
qFB=�A
s(d)FB �A
qFB=�A
uFB
bottom 1:05 � 0:35 0.545 1 -0.17 0.02 (0.02) -0.03charm 1:14 � 0:81 0.663 -0.48 1 0.43 (0.46) -0.71strange 0:48 � 0:65 0.543 0.13 -0.65 1 (0.95) -1.67
up 0:70 � 0:39 0.663 -0.08 0.39 -0.59 (-0.59) 1down 0:48 � 0:64 0.543 0.14 -0.69 1.06 (1) -1.78
�AqFB=�Rq(
ps = 130� 136 GeV)
quark avour �AqFB=�Rb �A
qFB=�Rc �A
qFB=�Rs(d) �A
qFB=�Ru
bottom 1.0 -0.80 0.02 (0.02) -0.12charm -1.6 2.1 -1.5 (-1.5) 1.6
strange 0.38 -1.4 2.9 (2.9) -3.6up -0.27 1.1 -2.1 (-2.1) 2.6
down 0.41 -1.5 3.1 (3.1) -3.8
�AqFB=�Rq(
ps = 161� 172 GeV)
quark avour �AqFB=�Rb �A
qFB=�Rc �A
qFB=�Rs(d) �A
qFB=�Ru
bottom 1.2 -0.77 0.03 (0.03) -0.12
charm -1.9 1.8 -1.6 (-1.6) 1.6strange 0.52 -1.4 3.7 (3.7) -3.8up -0.31 0.8 -2.2 (-2.2) 2.3
down 0.55 -1.4 3.9 (3.9) -4.1
Table 12: Results for avour tagged samples at energies of 130-136 and 161-172 GeV withps0=ps > 0:85: the derived quark cross-section ratios, Rq , and the observed forward-backward quark
asymmetry,AqFB, together with the Standard Model expectations RSM
q and ASMFB from ZFITTER. The
correlations between the cross-section ratios, Rq, and the correlations between the forward-backward
asymmetries are given, normalised so that the correlation is 1 for quarks of the same avour. Also given
are the correlations between the forward-backward asymmetries and the values of Rq. The correlations
are calculated at the working point where all values agree with the Standard Model.

27
0
0.1
0.2
0.3
0.4
0.5
0.6
0.7
0.8
0.9
1
80 90 100 110 120 130 140 150 160 170 180
√s (GeV)
Rq
DELPHI
Ruds
uds
Rb
b
Rc
c
Figure 10: The measured ratios Rq of cross-sections for bottom, charm and light uds quarks production
compared to the total hadronic cross-section as a function of the centre-of-mass energy, together with
the predictions from ZFITTER. Note that in the extraction of the individual cross-section ratios Rq,
the other cross-section ratios are taken from the Standard Model.

28
Parameter Value SM prediction
MZ[GeV] 91.185�0.006 -
�Z[GeV] 2.487�0.004 2.493
rtothad 2.951�0.010 2.959
rtote 0.1411�0.0009rtot� 0.1426�0.0007rtot� 0.1418�0.0010rtot` 0.1421�0.0006 0.1425
jtothad 0.32�0.29 0.22
jtote -0.039�0.046jtot� 0.050�0.030jtot� 0.014�0.037jtot` 0.022�0.023 0.004
rfbe 0.0033�0.0009rfb� 0.0028�0.0005rfb� 0.0042�0.0007rfb` 0.00324�0.00038 0.00265
jfbe 0.82�0.07jfb� 0.763�0.034jfb� 0.746�0.044jfb` 0.763�0.025 0.799
Table 13: Results of the 16- and 8-parameter �ts to the combined line-shape and high energy data.
Also shown are the Standard Model predictions for the �t parameters evaluated for MZ as given in the
table, MH = 300GeV=c2, mt = 175GeV=c2 and �s(MZ) = 0:118

29
The correlation between the parameters MZ and jtothad is shown in Figure 11. It canbe seen that a signi�cant improvement in the precision on the hadronic interferenceparameter, jtothad, is obtained when the high energy data are included in the �ts.
5 Physics Beyond the Standard Model
Data from e+e� collisions at LEP-2 energies can be used to put severe constraints onphysics beyond the Standard Model. Such measurements could have an impact on theinterpretation of measurements from other experiments, for example [5{7].
Interactions not described by the Standard Model can in uence the di�erential cross-sections for the fermion pair production, e+e� ! ff , leading to deviations from theStandard Model predictions. For example, the existence of a new particle with a mass ofaround 200 GeV=c2, would produce virtual e�ects at lower energies, such that the cross-sections and asymmetries for di�erent quark avours and lepton species at LEP2 would bedi�erent from the SM predictions. The values of the cross-sections and forward-backwardasymmetries for fermion pair production measured by the DELPHI collaboration at
ps =
130 � 172 GeV were used to search for such e�ects in the models discussed below. Theresults of this interpretation of the data are given in section 6.
5.1 Contact interactions
The �rst set of models considered here involve contact interactions between the initialand �nal state fermionic currents. Such models provide a general description of thelow energy behaviour of new physics with a high characteristic energy scale. Followingreference [29] these interactions are parameterised by an e�ective Lagrangian, added tothe Standard Model Lagrangian Leff , of the form:
Leff = g2
(1 + �)�2
Xi;j=L;R
�ijei �eif j �fj; (6)
where g2=4� is taken to be 1 by convention, � = 1(0) for f = e(f 6= e), �ij = �1 or 0,� is the scale of the contact interactions4, ei and fj are are left or right-handed spinors.By assuming di�erent helicity coupling between the initial state and �nal state currentsand either constructive or destructive interference with the Standard Model (accordingto the choice of each �ij) a basic set of 12 di�erent models can be de�ned from thisLagrangian [30]. The di�erential cross-section for scattering the outgoing fermion at anangle � with respect to the incident e� direction is given by [31,32]
d�
d cos �=��2
2sNfc
8>>>>>><>>>>>>:
����Aee
LR
���2 + ���Aee
RL
���2� ( st)2� +����Aef
LR
���2 + ���AefRL
���2� ( ts)2 +����Aef
LL
���2 + ���AefRR
���2� (us)2
9>>>>>>=>>>>>>;; (7)
where s, t and u are the Mandelstam variables and Nfc is the number of colours for
fermion f . The Aij and Aij are helicity amplitudes for the scattering process. Whenthe helicity amplitudes are squared, 3 sets of terms arise: the �rst set contains purelyStandard Model terms; the second set of terms derive from the interference between
4The choice of g2 is somewhat arbitrary; if the coupling constant was taken to be �s much lower limits on � would beobtained.

30
DELPHI
-1.5
-1
-0.5
0
0.5
1
1.5
91.16 91.17 91.18 91.19 91.2 91.21
MZ [GeV]
J had
tot
SM
Figure 11: Probability contour plot in the MZ-jtothad plane. The dotted curve shows the region accepted
at the 68% con�dence level from a �t to data taken at the energies around Z0; the solid curve show the
region accepted at the same con�dence level when the high energy data are also included in the �t.
�Z rtothad rtot` jtothad jtot` rfb` jfb`
MZ -.15 -.11 -.09 -.85 -.54 .17 -.04
�Z .84 .69 .21 .12 .00 .08
rtothad .73 .17 .09 .01 .08
rtot` .13 .14 .03 .12
jtothad .52 -.15 .04
jtot` -.06 .03
rfb` .15
Table 14: Correlation matrix of the 8-parameter �t.

31
ijk limit C.L. (%) Derived from
121 0.10 95 Charged Current Universality
122 0.10 95 Charged Current Universality
123 0.10 95 Charged Current Universality
131 0.16 95 Tau Decay
132 0.16 95 Tau Decay
133 0.006 - Mass of �e limit < 5 eV=c2
231 0.16 95 Tau Decay
232 0.16 95 Tau Decay
233 0.16 95 Tau Decay
Table 15: Existing upper limits on �ijk for assumed sneutrino masses of 200 GeV=c2.
contact interactions and the Standard Model, these terms are proportional to 1=�2; the�nal set of terms are due to contact interactions alone and are proportional to 1=�4. Forthe purpose of �tting contact interaction models to the data, a new parameter � = 1=�2 isde�ned; with � = 0 in the limit that there are no contact interactions. This parameter isallowed to take both positive and negative values in the �ts. It is worth noting that thereis a symmetry between models with �ij = +1 and those with �ij = �1. The predicteddi�erential cross-section in the constructive (+) models is the same as the destructive (-)models for �� = ��+.
5.2 Sneutrino exchange models
The second set of models consider possible s or t channel sneutrino ~�` exchange inR-parity violating supersymmetry [33], which can a�ect the channel e+e� ! l+l�. Thepurely leptonic part of the R-parity violating superpotential has the form
�ijkLiLL
jLE
k
R
where ijk are generation indices, LL represents a left-handed leptonic super�eld doubletand ER corresponds to the right-handed singlet super�eld of charged leptons. The cou-pling �ijk is only non-zero for combinations involving at least two generations and fori<j.
For the channel e+e� ! e+e� there are possible contributions from the s-channelproduction and t-channel exchange of either ~�� (�121 6= 0) or ~�� (�131 6= 0). For thechannels e+e� ! �+�� and e+e� ! �+�� there is no s-channel contribution if only oneof the �ijk is non-zero. For e
+e� ! �+�� there are t-channel contributions from either~�e (�121 6= 0), ~�� (�122 6= 0) or from ~�� (�132 or �231 6= 0). If both �131 6= 0 and �232 6= 0then the s-channel production of ~�� is possible. For e+e� ! �+�� there are t-channelcontributions from either ~�e (�131 6= 0), ~�� (�123 or �232 6= 0) or from ~�� ( �133 6= 0). Ifboth �121 6= 0 and �233 6= 0 then there the s-channel production of ~�� is possible.
In this paper all these possibilities are considered. For a given scenario the s ort-channel sneutrino exchange amplitude contribution is added to the Standard Modelcontribution as appropriate. If there is no sneutrino exchange for a speci�c channel thenthe prediction for that channel is just the SM value.
In the case of s-channel sneutrino graphs, if the sneutrino mass, m�
�, is equal, or close,
to the centre-of-mass energy of the e+e� beams, resonant sneutrino production occurs,

32
ijk limit C.L. (%) Derived from
111 0.001 68 Neutrinoless double beta decay
112 0.028 95 Charged current universality
113 0.028 95 Charged current universality
121 0.034 95 Atomic parity violation
131 0.034 95 Atomic parity violation
122 0.06 - Mass of �e limit < 5 eV=c2
133 0.002 - Mass of �e limit < 5 eV=c2
123 0.30 95 D0 �D0 mixing
132 0.48 95 �(Hadron)=�(Lepton) of Z
Table 16: Existing upper limit on �0ijk for assumed squark masses of 200 GeV=c2.
which can lead to a large change in the cross-section. A lesser change in the cross-sectionwill occur for m�
�<ps due to the process of radiative return. There is some sensitivity
to m�
�just above
ps due to the �nite width of the particle. It is assumed here that the
sneutrino width is 1 GeV.Existing upper limits on �ijk are summarised in table 15; for further details see [34]
and references therein.
5.3 Squark exchange
In supersymmetric extensions to the Standard Model which include R-parity violation,as well as a purely leptonic term in the superpotential there is a further term which linksthe lepton and quark sectors:
�0ijkLiLQ
jLD
k
R;
where LL and QL represent left-handed super�eld doublets of leptons and quarks and DR
corresponds to the right-handed singlet super�eld of down type quarks, as above ijk aregeneration indices.
This term in the superpotential could also generate R-parity violating SUSY termsin the channel e+e� ! qq. At LEP e+e� pairs might annihilate through the t-channelexchange of a squark of mass m and produce a quark-antiquark pair in the �nal state. Ifonly one of the �0ijk is non zero, and only one squark is light, then the production of only
one quark species will be a�ected, for example if �0121 6= 0 and the ~d is light then charmproduction will be a�ected. The same term, with suitable �0ijk 6= 0, could give rise to
the following interactions: (i) e+d ! ~uL, (ii) e+s! ~uL (iii) e+�u! ~dR, which have been
suggested as possible explanations for the anomaly presented in [5].In the analysis presented here, each q�q �nal state was considered separately assuming
that the production of all other channels was �xed by the Standard Model. The pre-dictions used in this paper were based on the formalism of [6], which makes use of theproperty that squark exchange is equivalent to certain models of leptoquark exchange5.The coupling constant is denoted by �0susy for each channel, this can be explicitly con-verted to the appropriate �0ijk as desired. For �nal states with down type quarks, the
5The limits presented here can therefore be treated as limits on leptoquark exchange for models of the form ~S1=2 or S0with coupling constant g = �0susy see equation 5 and table 2 of [6]. Note also that in the large mass limit the e�ectiveLagrangian corresponds to a contact interaction of the form LR with � = �1=2 for up type quarks or LL with � = +1=2for down type quarks.

33
cross-section increases as a function of �0susy ; for up type quarks, the cross-section �rstdecreases and then increases due to the interference, this is shown later in Figure 14,where a squark mass of 200 GeV=c2 is assumed for
ps = 166 GeV. Existing upper limits
on �0ijk are given in table 16, for further details see [34] and references therein.
5.4 Fermion production in presence of a Z0-boson
Many theories which are more general than the Standard Model predict the existenceof additional heavy gauge bosons. The consequences of several of these models wereinvestigated, complemented by a model independent �t to the leptonic data.
5.4.1 Speci�c Z0 Models
The existence of an additional heavy gauge boson Z0
can be parameterised by themass of the boson MZ
0 and by its couplings to fermions. In addition, a possible mixingbetween the Z
0
and the standard Z, represented by a mixing angle �ZZ0 , has to be takeninto account [35,36]. In order to deal with a restricted number of free parameters, it isuseful to consider speci�c Z
0
-models with well de�ned couplings. Popular models are:
� The E6 model [37]. It is based on a symmetry breaking of the E6 GUT. The freeparameter of this model is the mixing of the Z
0
to fermions, �6. Usual choices of �6
are �6 = 0 (�-model), �=2 ( -model) and �6 = �arctanq5=3 (�-model).
� The L-R model [38]. It includes a right-handed SU(2)R extension to the StandardModel gauge group SU(2)L U(1). The free parameter �LR describes the coupling
of the heavy bosons to fermions. �LR varies betweenq2=3 � �LR �
qcot2 �W � 1.
5.4.2 Model independent approach
In a more general approach, the Z0
-boson is directly described in terms of its couplingsa0f and v0f . The amplitude for fermion pair production in e+e� annihilations via a Z
0
exchange has the following expression at the Born level [39]:
M(Z0
) =g22
s�m2Z0
�ue �( 5a0e + v0e)ue �uf
�( 5a0f + v0f)uf
= �4�
s�ue �( 5a
Ne + vNe )ue �uf
�( 5aNf + vNf )uf (8)
with
aNf = a0f
vuut g224�
s
m2Z0 � s ; vNf = v0f
vuut g224�
s
m2Z0 � s
; m2Z0 =M2
Z0 � i�Z0MZ
0 (9)
O� the Z0
resonance, pair production is only sensitive to the normalised couplingsaNf and vNf . As a consequence, the couplings and the mass of the Z
0
boson cannot bemeasured independently. Furthermore, the coupling constant g2 is unknown outside of
any speci�c model. In the following the convention is taken thatg224�
= 1. The normalisedcouplings then become
aNf = a0f
ss
m2Z0� s
; vNf = v0f
ss
m2Z0� s
: (10)

34
6 Fits to physics beyond the Standard Model
6.1 Leptonic channels
The input to the �ts consisted of the cross-sections for scattering of the negativelycharged lepton into the forward and backward hemispheres, de�ned with respect to theincident electron direction (as seen in the laboratory frame) for the non-radiative class ofe+e�, �+�� and �+�� �nal states, at
ps = 130 � 172 GeV.
Theoretical predictions were based on the appropriate Born level expressions convo-luted with QED corrections, the Standard Model contributions being treated within theImproved Born approximation [40], with the following parameters:
mt = 175 � 6 GeV=c2 ; MH = 300+700�240 GeV=c2;
�s = 0:118 � 0:005 ; MZ = 91:187 � 0:007 GeV=c2;
(11)
Which were evaluated from data at the Z resonance, using hadronic �nal states only. Theranges given are the values over which the parameters were varied to estimate the biasfrom uncertainties in the Standard Model inputs. The changes in the �ts, presented below,were found to be negligible. The systematic errors from knowledge of the Standard Modelparameters were therefore neglected. For the �+�� and �+�� �nal states the StandardModel contributions were computed using ZFITTER, with full QED radiative corrections,including the e�ects of box diagrams and initial-�nal state interference. The treatmentof interference between initial state and �nal state radiation was a potential source ofuncertainty in the radiative corrections to the Standard Model and the new physics asthis correction was calculated at lower order than other QED corrections [41]. Includingor excluding the interference led to changes in the corrected forward and backward cross-sections of approximately 2:5%. The resulting uncertainties in the �tted values werenegligible when added in quadrature with the statistical errors. For the e+e� �nal statethe SM computations were made using TOPAZ0.
QED radiative corrections for the new physics contributions to the cross-sections,were calculated using the MIBA package [42]. These corrections were checked againstZFITTER, DYMU3 and TOPAZ0. The radiative corrections for new physics di�er fromthe corrections for the Standard Model. This di�erence arises from initial state radiation.The probability of radiating photons to arrive at a given centre-of-mass energy dependson the energy dependence of the Born level cross-section. Models which contain newphysics have a di�erent s dependence to the Standard Model. For the range of newphysics parameters extracted in this paper the di�erence in radiative corrections arerather negligible (less than 1%) compared to the sizeable statistical errors, but werenevertheless taken into account in the �t.
6.1.1 Contact interaction models
The data were compared to each of the 12 Contact Interaction models mentionedabove6 considering separately the e+e�, �+�� and �+�� �nal states, and all three �nalstates combined, assuming lepton universality in the contact interactions.
The values of � extracted for each model were all compatible with the Standard Modelexpectation � = 0, at the two standard deviation level. The �tted values of � wereconverted into 95% con�dence level lower limits on �, and are shown in Table 17. In the
6For leptonic �nal states, models with only �LR = �1 are equivalent to models with only �RL = �1.

35
cases where � was unphysical, � < 0, the following de�nition was used, � = 1=p1:64�,
where � was the 1 standard deviation parabolic statistical error on �. Otherwise the value
was taken to be, �(�) = 1=q��(+) + 1:64�
(+)+ where �+ is the upper 1 standard deviation
statistical error on �, and the � refer to models with � = �17. Figure 12 shows theexpected variation with
ps of the total cross-section in the LL� models for an energy
scale � = 3 TeV compared to the data for e+e�!�+�� and e+e�!�+�� as an indicationof the constraints the data put on contact interaction models.
6.1.2 Sneutrino exchange
The total cross-section and forward-backward asymmetry values for the channelse+e� ! e+e�, e+e�!�+�� and e+e�!�+��, at each centre-of-mass energy, were againused in the �ts. The theoretical prediction consisted of Improved Born ApproximationStandard Model terms, plus sneutrino exchange, plus interference terms.
All the �ts considered result in values of � which are compatible with zero; so resultsare expressed as 95% con�dence limits. The �rst �ts considered are to those terms whichmodify the e+e� ! e+e� channel. These involve the s and t-channel exchange of a ~��( �121 6= 0) or ~�� ( �131 6= 0). The resulting 95% limits on �, as a function of m�
�, are
given in Figure 13a. It can be seen that the best limits on � are obtained for the casewhere m�
�is close to the actual centre-of-mass energy of the LEP collisions, but that the
radiative return process gives some sensitivity between these points. It can be seen that� greater than approximately 0.08 can be excluded for m�
�in the present LEP 2 range of
energies at the 95% con�dence level.For the case that only one � value is non-zero there are only t-channel sneutrino e�ects
for e+e�!�+�� and e+e�!�+��. The values of � obtained for the e+e�!�+�� channeland for the e+e�!�+�� channel are all consistent with zero, so results are expressed as95% con�dence exclusion limits in Table 18.
For the �ts assuming that �131 = �232 = �, the resulting 95% limits on �, as a functionof m�
�, are given in Figure 13b. A similar exclusion pattern to that obtained from the
e+e� ! e+e� channel is obtained, � greater than approximately 0.1 can be excluded form�
�in the present LEP 2 range of energies at the 95% con�dence level. The exclusion
contour for �121 = �233 = � is shown in �gure 13c, from which it can be seen that againa similar exclusion pattern is obtained.
The sneutrino width is not constrained within R-parity violating supersymmetry. Avalue of 1 GeV has been used [6]. If a value of 2 GeV were used then the sensitivityabove 172 GeV would be marginally improved.
6.2 Flavour-tagged events
Radiative corrections for hadronic �nal states were considered in a manner similar tothe leptonic �nal states and were found to be negligible to the accuracy of the analysispresented here.
6.2.1 Squark exchange
Limits on the coupling constant �0susy were obtained from the data by comparing themeasured cross-section ratios with the expected cross-section ratios as a function of �0susy .For this purpose the measured quark cross-section ratios (�q � �SM)=�SM are extracted,
7The �tted values of � for models with � = �1 are the negative of those with � = +1

36
e+e� ! e+e�
Model �+�+��
�
(TeV�2) �+(TeV) ��(TeV)
LL 0.076+0:084�0:067 2.2 2.8
RR 0.080+0:083�0:070 2.2 2.8
VV 0.020+0:014�0:014 4.8 6.6
AA -0.042+0:040�0:062 3.5 2.6
RL 0.078+0:065�0:054 2.3 3.2
LR 0.078+0:065�0:054 2.3 3.2
e+e�! �+��
Model �+�+��
�
(TeV�2) �+(TeV) ��(TeV)
LL -0.050+0:051�0:055 3.4 2.7
RR -0.056+0:056�0:064 3.2 2.5
VV -0.029+0:022�0:019 5.5 4.1
AA -0.001+0:021�0:025 5.1 4.9
RL -0.132+0:109�0:116 2.3 1.8
LR -0.132+0:109�0:116 2.3 1.8
e+e�! �+��
Model �+�+��
�
(TeV�2) �+(TeV) ��(TeV)
LL -0.016+0:069�0:082 2.8 2.6
RR -0.018+0:076�0:094 2.7 2.4
VV -0.023+0:029�0:029 4.6 3.8
AA 0.019+0:035�0:034 3.6 4.2
RL -0.157+0:141�0:151 2.0 1.6
LR -0.157+0:141�0:151 2.0 1.6
e+e�! l+l�
Model �+�+��
�
(TeV�2) �+(TeV) ��(TeV)
LL -0.007+0:032�0:031 4.4 4.2
RR -0.004+0:034�0:034 4.2 4.1
VV 0.000+0:010�0:009 7.7 7.9
AA -0.006+0:017�0:016 6.1 5.5
RL 0.007+0:030�0:032 4.2 4.4
LR 0.007+0:030�0:032 4.2 4.4
Table 17: Fitted values of � and 95% con�dence limits on the scale, �, of contact interactions in
the models discussed in the text, for e+e� ! e+e�, e+e�!�+��, e+e�!�+�� and e+e� ! l+l�, a
combination of the above assuming lepton universality in the contact interactions. The errors on � are
statistical only.

37
DELPHI
√s (GeV)
(σm
eas. -
σS
M)/
σ SM (
%)
e+e- → l+l- (√s,/√s > 0.85)Λ=3 TeV
LL+
LL-
-60
-40
-20
0
20
40
60
120 130 140 150 160 170 180
Figure 12: The expected deviations from the Standard Model for the LL� models compared to the
weighted average of the deviations found in the combined data for e+e�!�+�� and e+e�!�+��.
Coupling m�
�= 100 GeV=c2 m�
�= 200 GeV=c2
(95% c.l.) (95% c.l.)
� (t-chann. ~�` in e+e� ! �+��) 0.52 0.76
� (t-chann. ~�` in e+e� ! �+��) 0.55 0.79
Table 18: Upper limits on the couplings � in t channel sneutrino exchange in e+e� ! �+�� and
e+e� ! �+��. The couplings involved are given in the text.

38
DELPHI
0
0.1
0.2
100 150 200
0
0.1
0.2
100 150 200
0
0.1
0.2
100 150 200
Figure 13: The 95% exclusion limits for (a) �121 (or �131), as a function of m�
�obtained from the
e+e� ! e+e� channel; (b) �131 = �232 = �, as a function of m�
�obtained from the e+e� ! �+��
channel; (c) �121 = �233 = �, as a function of m�
�obtained from the e+e� ! �+�� channel. The
sneutrino width is taken to be 1 GeV. It can be seen that the limits are better where the sneutrino mass
is equal to the centre of mass energy of the data.

39
where �q denotes the measured quark cross-section and �SM the expected cross-sectionin the Standard Model. The measured quark cross-section is de�ned as �q = Rq�h, whereRq are the measured cross-section ratios given in Table 12, and �h, given in Table 10, is
the average of the measured hadronic cross-sections forps0=ps > 0:85 at centre-of-mass
energies of 130-136 GeV and 161-172 GeV.The results were compared with the model predictions for the cross-section ratio and
asymmetry di�erence, for di�erent values of the coupling constant, �0susy . Upper andlower limits were evaluated from the values of �0susy consistent with the values of themeasured quantities being within �1:64 times the 1 standard deviation uncertainty fromthe measurements and from the Standard Model expectation, taking which ever gave themost conservative limit. Figure 14 shows the predictions and limits for down (up) typequarks in the �nal state taking a squark mass of 200 GeV=c2, at a centre-of-mass energyof 166 GeV. The upper limits on �0susy , derived from all the data analysed in this paperare given in table 19 for each quark avour at 95% con�dence, assuming a squark massof 200 GeV=c2.
6.2.2 Contact Interactions
The cross-sections and asymmetries were predicted for �nal states with up and downtype quarks, assuming contact interactions only couple one avour of quark to electronsat a time.
The parameter � of equation 6 was varied for the LL, LR, RR and RL models takingboth � = �1=2 and � = +1=2 values, giving eight sets of predictions for the cross-sections. From these predictions the cross-section ratios (� � �SM)=�SM were evaluatedand compared to the upper limits on the measured cross-section ratios, as shown in Figure15. The corresponding limits at 95% CL are also given in Table 20. The limits on � arein the range from 1 to 4.4 TeV; the limits for bottom quarks are better than the limitsfor the down or strange quarks since the e�ciency and purity of the bottom quark tagused is highest, leading to a smaller error on the bottom quark production cross-section.
6.3 Z0-bosons
Fits were applied to data collected by DELPHI at LEP 1 [1,2] as well as at LEP 2, i.e.at centre-of-mass energies of 88-94, 130, 136, 161 and 172 GeV. The observables used forthe �ts were the hadronic and leptonic cross-sections and the leptonic forward-backwardasymmetries. Predictions for these observables within the Z
0
models E6 and L-R andwithin a model independent approach were obtained using the program ZEFIT (5.0) [43]together with ZFITTER (5.0). Correlations between the data and errors of the LEPbeam energy were taken into account as described in [1,2].
6.3.1 Model dependent �ts
The program ZEFIT provides predictions for the cross-sections and forward-backwardasymmetries for each model as a function of the masses MZ , MH and Mt, of the strongcoupling constant (�s), the mass of the Z
0
-boson (MZ0 ), its mixing with the Z-boson
(�ZZ0 ), and of the Z0
-model parameters �6 (in case of E6-models) or �LR (in case of theL-R-model). In order to reduce the number of free parameters, the top mass was �xedto Mt = 175 GeV=c2 and the coupling �s to the value 0.123. The mass of the Higgswas set to MH = 300 GeV=c2. Varying the values of these parameters has a negligiblein uence on the �t results. As the standard Z-boson mass would change in the presence
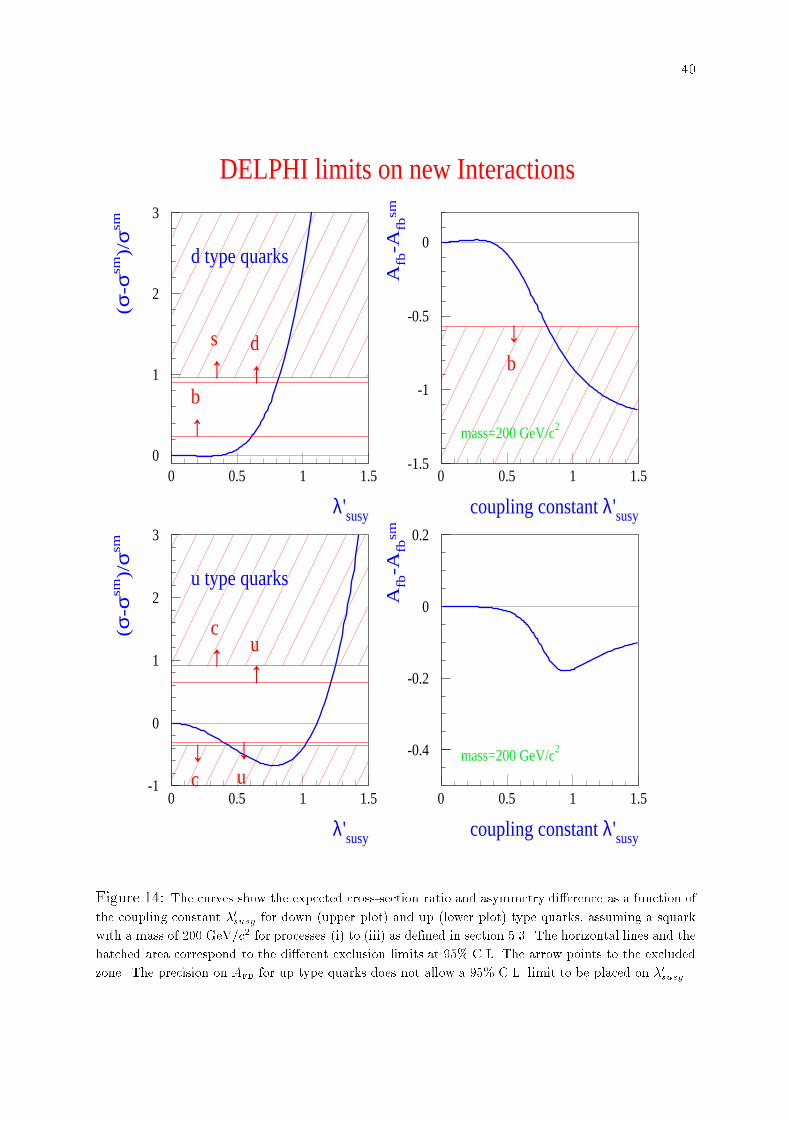
40
DELPHI limits on new Interactions
0
1
2
3
0 0.5 1 1.5
λ'susy
(σ-σ
sm)/
σsm
↑b
↑s
↑d
d type quarks
-1.5
-1
-0.5
0
0 0.5 1 1.5
coupling constant λ'susy
Afb
-Afb
sm
↑
b
mass=200 GeV/c2
-1
0
1
2
3
0 0.5 1 1.5
λ'susy
(σ-σ
sm)/
σsm
↑↑ uc
↑
c
↑
u
u type quarks
-0.4
-0.2
0
0.2
0 0.5 1 1.5
coupling constant λ'susy
Afb
-Afb
sm
mass=200 GeV/c2
Figure 14: The curves show the expected cross-section ratio and asymmetry di�erence as a function of
the coupling constant �0susy for down (upper plot) and up (lower plot) type quarks, assuming a squark
with a mass of 200 GeV=c2 for processes (i) to (iii) as de�ned in section 5.3. The horizontal lines and the
hatched area correspond to the di�erent exclusion limits at 95% C.L. The arrow points to the excluded
zone. The precision on AFB for up type quarks does not allow a 95% C.L. limit to be placed on �0susy

41
Flavour d s b u c
�0susy 0.81 0.82 0.61 0.42 0.43
Table 19: Lower limits at 95% CL on the coupling constant �0susy, in a supersymmetric scenario (see
text) with a squark mass of 200 GeV=c2 for down or strange quarks, bottom quarks, and up and charm
quarks.
Model d or s b u c d or s b u c
�+ (TeV) �+ �+ �+ �� (TeV) �� �� ��
LL 2.4 4.4 1.0 1.0 2.8 3.9 2.4 2.1
LR 1.7 2.5 1.5 1.3 1.5 2.0 1.8 1.6
RR 1.9 3.1 1.2 1.1 1.4 1.7 2.1 1.9
RL 1.4 1.7 1.6 1.5 1.9 3.0 1.6 1.5
Table 20: Lower limits at 95% CL on the energy scale � for di�erent forms of the interaction for down
or strange quarks, bottom, up and charm quarks.

42
DELPHI limits on contact Interactions
-1
0
1
2
3
-1.5 -1 -0.5 0 0.5 1 1.5
ε (TeV-2)
(σ-σ
sm)/
σsm
↑b ↑
s
↑d
↑
b
↑ ↑
s d
d type
-1
0
1
2
3
-1.5 -1 -0.5 0 0.5 1 1.5
ε (TeV-2)
(σ-σ
sm)/
σsm
↑↑ uc
↑
c
↑
u
u type
Figure 15: The curves show the expected cross-section ratio as a function of � (= 1=�2) for down (upper
plot) and up (lower plot) type quarks, assuming a new interaction of the form Eq. 6. The solid curve
corresponds to a LL+ (�), the dotted to a LR+ (�), the dashed to a RR+ (�) and the dotted-dashed
to a RL + (�) interaction. Negative values for � correspond to negative � values. The horizontal lines
and the hatched area correspond to the di�erent exclusion limits at 95% CL. The arrow points to the
excluded zone.

43
of a non-zero mixing between Z and Z0
, MZ was left free to vary together with MZ0 and
�ZZ0 . The E6 inspired models �, and � were considered. In case of the L-R model, �LRwas set to 1:1.
A �2 was formed by comparing the measured observables to their predicted values.The �tted Z-mass was found to be compatible with its standard value. No evidence wasfound for the existence of a Z
0
-boson in any of the models. The 95% con�dence levellimits on MZ0 and �ZZ0 were computed for each model by determining the contours of thedomain in theMZ
0 � �ZZ0 plane where �2 < �2min+5:99. The allowed regions forMZ0 and
�ZZ0 are shown in �gure 16. The lower limit of the Z0
mass varies between 200 GeV=c2
and 280 GeV=c2, depending on the model considered. The limits obtained are given inTable 21.
These results improve substantially the limits from a previous publication of the DEL-PHI collaboration, based on measurements performed on and below the Z peak [44]. Thelimits on the Z
0
mass are weaker than those from direct searches at the TEVATRON [45],where values of the order of 600 GeV=c2 were obtained. A substantial improvement ofthe limits provided by LEP is expected from data taking at energies exceeding 180 GeV.
6.3.2 Model independent �ts
The program ZEFIT was used to predict cross-sections and forward-backward asym-metries as a function of the Z
0
-mass and of the couplings a0f and v0f . In the most general
case, all couplings a0f and v0f should be treated as free parameters. The number of pa-rameters can be reduced if lepton universality is assumed. Bounds on the couplings a0land v0l can then be obtained from �ts to observables describing leptonic �nal states. Mea-surements from an e+e� collider are the most direct input for such an analysis, as noassumptions about the couplings of the Z
0
to quarks have to be made.Fits were performed to the leptonic cross-sections and forward-backward asymmetries.
Several values of the mass of the Z0
were considered (i.e. 300, 500 and 1000 GeV=c2),and the ZZ
0
-mixing was neglected. Figure 17 shows the values of the couplings a0f and v0f
which are compatible with the DELPHI data with a con�dence level of 95%. The limitson the normalised couplings are jaNl0 j < 0:19 and jvNl0 j < 0:44:
7 Summary and conclusions
The data collected with the DELPHI detector at high energies (130-172 GeV) duringLEP operation in 1995 and 1996, have been used to determine the hadronic and leptoniccross-sections and leptonic forward-backward asymmetries. In addition, measurementsof the cross-section ratios and forward-backward asymmetries for avour-tagged samplesof light (uds), c and b quarks have been made.
The results of the hadronic and leptonic cross-sections and leptonic forward-backwardasymmetries, together with data collected previously at the energies near the Z0 resonancepeak (88-93 GeV), have been interpreted by performing �ts using the S-matrix formalism.The precision of the determination of the parameters of this ansatz has been considerablyimproved.
The DELPHI data on e+e� ! ff collected above the Z resonance have been analysedin terms of models beyond the Standard Model. The �rst set included possible contactinteractions between leptons. No evidence was found for such interactions and 95%con�dence lower limits were placed on the energy scale, � in such models, with valuesof the order of a few TeV. In the second set of models, the exchange of a sneutrino in

44
DELPHI
200
300
400
500
600
700
-0.008 0 0.008
ΘZZ,
MZ, /
GeV
200
300
400
500
600
700
-0.008 0 0.008
ΘZZ,
MZ, /
GeV
200
300
400
500
600
700
-0.008 0 0.008
ΘZZ,
MZ, /
GeV
200
300
400
500
600
700
-0.008 0 0.008
ΘZZ,
MZ, /
GeV
Figure 16: The allowed domain in the MZ0 � �ZZ0 plane for the �, , � and L-R models. The contours
show the 95% con�dence level limits.
Model � � L-R
M limitZ0 (GeV=c2) 250 280 200 230
j �limitZZ0
j 0.0033 0.0021 0.0046 0.0031
Table 21: 95% con�dence level lower limits on the Z0
mass and upper limits on the ZZ0
mixing angle
within the �, , � and L-R models.

45
DELPHI
-1.5
-1
-0.5
0
0.5
1
1.5
-1.5 -0.75 0 0.75 1.5
al ,
v l ,
-2-1.5
-1-0.5
00.5
11.5
2
-2 -1 0 1 2
al ,
v l ,
-4-3-2-101234
-4 -2 0 2 4
al ,
v l ,
Figure 17: 95% con�dence level limits on the couplings a0l and v0
l of the Z0
to leptons. The values of
the Z0
mass considered are (a) 300, (b) 500 and (c) 1000 GeV=c2.

46
either the s or t channel, as a manifestation of R-parity violating supersymmetry, wasconsidered. Again, no evidence for such e�ects was found and limits were placed on thecoupling constants between the sneutrino and charged leptons, the values being sensitiveto the model assumed.
The results of the cross-section ratios and forward-backward asymmetries for taggedsamples of di�erent quark avours are in agreement with the expectations of the StandardModel. The data were interpreted in terms of possible new interactions. First, interac-tions with R-Parity violating supersymmetry were considered and exclusion limits werederived. Secondly, more general contact interactions were considered and limits on themass scales in the range from 1.7 to 7.9 TeV were obtained for di�erent quark avours.
Finally, the existence of an additional neutral massive gauge boson, Z0
was investigated.No evidence for a Z
0
was found within the framework of E6 and L-R models. Limits onthe Z
0
-mass and on its mixing angle with the Z were derived, which improve substantiallyformer limits obtained by the DELPHI collaboration. Overall, MZ0 was found to begreater than 200 GeV for all the models considered. A model independent �t was alsoperformed in order to derive limits on the couplings of a possible Z
0
to leptons. The95% con�dence level upper bounds obtained for the normalised couplings of a Z
0
arej aNl0 j < 0:19 and j vNl0 j < 0:44.
Acknowledgements
We would like to thank H. Dreiner , G. Bhattacharyya, H. Spiesberger and P.M. Zerwasfor very helpful discussions on R-Parity violating SUSY e�ects. We would also like tothank Sabine Riemann for providing us with the program ZEFIT and for many helpfuldiscussions concerning its use.
We are greatly indebted to our technical collaborators, to the members of the CERN-SL Division for the excellent performance of the LEP collider, and to the funding agenciesfor their support in building and operating the DELPHI detector.We acknowledge in particular the support of:Austrian Federal Ministry of Science and Tra�cs, GZ 616.364/2-III/2a/98,FNRS{FWO, Belgium,FINEP, CNPq, CAPES, FUJB and FAPERJ, Brazil,Czech Ministry of Industry and Trade, GA CR 202/96/0450 and GA AVCR A1010521,Danish Natural Research Council,Commission of the European Communities (DG XII),Direction des Sciences de la Mati�ere, CEA, France,Bundesministerium f�ur Bildung, Wissenschaft, Forschung und Technologie, Germany,General Secretariat for Research and Technology, Greece,National Science Foundation (NWO) and Foundation for Research on Matter (FOM),The Netherlands,Norwegian Research Council,State Committee for Scienti�c Research, Poland, 2P03B06015, 2P03B03311 andSPUB/P03/178/98,JNICT{Junta Nacional de Investiga�c~ao Cient���ca e Tecnol�ogica, Portugal,Vedecka grantova agentura MS SR, Slovakia, Nr. 95/5195/134,Ministry of Science and Technology of the Republic of Slovenia,CICYT, Spain, AEN96{1661 and AEN96-1681,The Swedish Natural Science Research Council,Particle Physics and Astronomy Research Council, UK,Department of Energy, USA, DE{FG02{94ER40817.

47
References
[1] DELPHI Collaboration, P. Abreu et al. , Nucl. Phys. B417 (1994) 3.[2] DELPHI Collaboration, P. Abreu et al. , Nucl. Phys. B418 (1994) 403.
DELPHI Collaboration, in preparation.[3] DELPHI Collaboration, P. Aarnio et al. , Nucl. Instr. & Meth. A303 (1991) 233.[4] DELPHI Collaboration, P. Abreu et al. , Nucl. Instr. & Meth. A378 (1996) 57.[5] C. Adlo� et al. (H1 Collaboration), Z. Phys. C74 (1997) 191;
J. Breitweg et al. (Zeus Collaboration), Z. Phys. C74 (1997) 207.[6] J. Kalinowski et al. , Z. Phys. C74 (1997) 595.[7] G. Altarelli, Nucl. Instr. & Meth. B506 (1997) 3;
D. Choudhury, Phys Lett. B376 (1996) 201.[8] ALEPH Collaboration, D. Buskulic et al. , Phys. Lett. B378 (1996) 373
ALEPH Collaboration, R. Barate et al. , Phys. Lett. B399 (1997) 329.[9] L3 Collaboration, M. Acciarri et al. , Phys. Lett. B407 (1997) 361.
L3 Collaboration, M. Acciarri et al. , Phys. Lett. B370 (1996) 195.[10] OPAL Collaboration; K. Ackersta� et al. , Euro. Phys. J. C2 (1998) 441.[11] \The LEP Energy Calibration in 1996", LEP Energy Group/97-01.[12] \Energies for LEP 1.5 run", LEP Energy Group/97-01.[13] A. C. Benvenuti et al. , \The DELPHI Small Angle Tile Calorimeter", contribu-
tion to IEEE NSS 1994[14] S. Jadach, O Nicrosini et al. , \Event Generators for Bhabha Scattering", CERN
Yellow Report 96-01, vol 2, p229.[15] T.Sj�ostrand, CERN-TH/92-6488,
T. Sj�ostrand, PYTHIA 5.7 and JETSET 7.4, CERN-TH 7112/93,T. Sj�ostrand and M. Bengtsson, Comput. Phys. Commun. 43(1987)367,T. Sj�ostrand, Comput. Phys. Commun. 39(1986)347.
[16] S. Jadach, B.F.L. Ward, Z. Was, Comp. Phys. Comm. 79 (1994) 503.[17] J.E. Campagne and R. Zitoun, Zeit. Phys. C43 (1989) 469.[18] D. Bardin et al. , \ZFITTER: An Analytical Program for Fermion Pair Production
in e+e� Annihilation", preprint CERN-TH 6443 (1992) and references therein.[19] DELPHI Collaboration, P. Abreu et al. , Zeit. Phys. C73 (1996) 11.[20] S. Nova, A. Olchevski and T. Todorov, DELPHI Note 90-35 PROG/152, unpub-
lished.[21] F.A. Berends, W. Hollik and R. Kleiss, Nucl. Phys. B304 (1988) 712.[22] DELPHI Collaboration, P. Abreu et al. , Zeit. Phys. C70 (1996) 531;
G. Borisov and C. Mariotti, \Performance of b-tagging at LEP2", DAPNIA/SPPReport 97-06, INFN/ISS Report 97-03.G. Borisov and C. Mariotti, NIM A372 (1996) 181.
[23] DELPHI Collaboration, P. Abreu et al. , Phys. Lett. B322 (1994) 459.[24] G. Montagna et al. , Nucl. Phys. B401 (1993) 3, and Comput. Phys. Commun.
76 (1993) 328.[25] DELPHI Collaboration, P. Abreu et al. , Z. Phys. C75 (1997) 581.[26] W. Beenakker et al. , Nucl. Phys. B349 (1991) 323.[27] A. Leike and S. Riemann, Phys. Lett. B273 (1991) 513.[28] S. Riemann, Phys. Lett. B293 (1992) 451.[29] E. Eichten, K. Lane , M. Peskin, Phys. Rev. Lett. 50 (1983) 811.[30] H. Kroha, Phys. Rev. D46 (1992) 58.[31] ALEPH Collaboration, D. Buskulic et al. , Zeit. Phys. C59 (1993) 215.

48
[32] OPAL Collaboration, G. Alexander et al. , Phys. Lett. B 387 (1996) 432.[33] J. Kalinowski et al. , DESY 97-044 [hep-hp/9703436].[34] H. Dreiner, HEP/PH-9707435 (1997) and private communication.[35] A. Leike, S. Riemann and T. Riemann, Munich University preprint LMU-91/6.[36] A. Leike, S. Riemann and T. Riemann, preprint CERN-TH 6545/92.[37] P. Langacker, R.W. Robinett and J.L. Rosner, Phys. Rev. D30 (1984) 1470;
D. London and J.L. Rosner, Phys. Rev. D34 (1986) 1530.[38] J.C. Pati and A. Salam, Phys. Rev. D10 (1974) 275;
R.N. Mohapatra and J.C. Pati, Phys. Rev. D11 (1975) 566.[39] A. Leike, Zeit. Phys. C62 (1994) 265.[40] G. Altarelli et al. (eds), \Z Physics at LEP I", CERN 89-08;
G. Altarelli et al. (eds), \Physics at LEP II", CERN 96-01.[41] DELPHI Collaboration, P. Abreu et al. , Zeit. Phys. C72 (1996) 31;
ALEPH Collaboration, R. Barate et al. , Phys. Lett. B399 (1997) 329.[42] M. Martinez and R. Miquel, Zeit. Phys. C53 (1992) 115.[43] S. Riemann, FORTRAN program ZEFIT, version 5.0.[44] DELPHI Collaboration, Zeit. Phys. C65 (1995) 603.[45] CDF Collaboration, F. Abe at al, Phys. Rev. Lett.79 (1997) 2192.
Copyright © 2022 FDOKUMEN