MDCT findings of extrapancreatic nerve plexus invasion by pancreas head carcinoma: correlation with...
55
*KURAに登録されているコンテンツの著作権は,執筆者,出版社(学協会)などが有します。 *KURAに登録されているコンテンツの利用については,著作権法に規定されている私的使用や引用などの範囲内で行ってください。 *著作権法に規定されている私的使用や引用などの範囲を超える利用を行う場合には,著作権者の許諾を得てください。ただし,著作権者 から著作権等管理事業者(学術著作権協会,日本著作出版権管理システムなど)に権利委託されているコンテンツの利用手続については ,各著作権等管理事業者に確認してください。 Title MDCT findings of extrapancreatic nerve plexus invasion by pancreas head carcinoma: correlation with en bloc pathological specimens and diagnostic accuracy Author(s) Mochizuki, Kentaro; Gabata, Toshifumi; Kozaka, Kazuto; Hattori, Yuki; Zen, Yoh; Kitagawa, Hirohisa; Kayahara, Masato; Ohta, Tetsuo; Matsui, Osamu Citation European Radiology, 20(7): 1757-1767 Issue Date 2010-07 Type Journal Article Text version author URL http://hdl.handle.net/2297/22577 Right http://dspace.lib.kanazawa-u.ac.jp/dspace/
Transcript of MDCT findings of extrapancreatic nerve plexus invasion by pancreas head carcinoma: correlation with...
*KURAに登録されているコンテンツの著作権は,執筆者,出版社(学協会)などが有します。*KURAに登録されているコンテンツの利用については,著作権法に規定されている私的使用や引用などの範囲内で行ってください。*著作権法に規定されている私的使用や引用などの範囲を超える利用を行う場合には,著作権者の許諾を得てください。ただし,著作権者から著作権等管理事業者(学術著作権協会,日本著作出版権管理システムなど)に権利委託されているコンテンツの利用手続については,各著作権等管理事業者に確認してください。
TitleMDCT findings of extrapancreatic nerve plexus invasion by pancreas headcarcinoma: correlation with en bloc pathological specimens and diagnosticaccuracy
Author(s)Mochizuki, Kentaro; Gabata, Toshifumi; Kozaka, Kazuto; Hattori, Yuki;Zen, Yoh; Kitagawa, Hirohisa; Kayahara, Masato; Ohta, Tetsuo; Matsui,Osamu
Citation European Radiology, 20(7): 1757-1767
Issue Date 2010-07
Type Journal Article
Text version author
URL http://hdl.handle.net/2297/22577
Right
http://dspace.lib.kanazawa-u.ac.jp/dspace/

1
MDCT Findings of Extrapancreatic Nerve Plexus Invasion by
Pancreas Head Carcinoma: Correlation with en Bloc Pathological
Specimens and Diagnostic Accuracy
Kentaro Mochizuki, MD1, Toshifumi Gabata, MD1, Kazuto Kozaka,
MD1, Yuki Hattori, MD1, Yoh Zen, MD2, Hirohisa Kitagawa, MD3,
Masato Kayahara, MD3, Tetsuo Ohta, MD3, Osamu Matsui MD1
1Department of Radiology, Kanazawa University Graduate School of
Medical Science, Kanazawa, Japan. 2Division of Pathology, Kanazawa
University Hospital, Kanazawa, Japan. 3Department of
Gastroenterological Surgery, Kanazawa University Graduate School of
Medical Science, Kanazawa, Japan.
Research institution address
Department of Radiology, Kanazawa University Graduate School of
Medical Science, 13-1 Takaramachi, Kanazawa 920-8641, Japan
Tel: +81-76-265-2323
Fax: +81-76-234-4256
Correspondence address:
Kentaro Mochizuki, MD
2
Department of Radiology, Kanazawa University Graduate School of
Medical Science, 13-1 Takaramachi, Kanazawa 920-8641, Japan
Tel: +81-76-265-2323
Fax: +81-76-234-4256
E-mail: [email protected]
Abstract
Objective:
To elucidate the MDCT findings of extrapancreatic nerve plexus (PLX)
invasion by pancreas head carcinoma (PhC) by “point-by-point”
correlation with en bloc pathological specimens and to assess their
diagnostic accuracy.
Methods:
Each pathological section of PhC and adjusted double oblique
multiplanar reconstruction MDCT images were correlated in 554
sections from 37 patients. The diagnostic accuracy of the MDCT
patterns derived was assessed by blind reading.
Results:
PLX invasion with fibrosis showed mass or strand shape (85.6%) or
coarse reticula (13.3%). The CT findings were divided into fine
reticular and linear, coarse reticular, mass and strand and nodular
patterns. PLX invasion was revealed pathologically in 92% of the
3
regions of investigation showing the mass and strand pattern and 63%
the coarse reticular pattern (all continuous with PhC), and they were
highly suggestive of PLX invasion by PhC on MDCT images (p <
0.001). Sensitivity, specificity, accuracy, and positive and negative
predictive values of these MDCT findings in the diagnosis of PLX
invasion were 100% (25/25), 83.3% (10/12), 94.6% (35/37), 92.6%
(25/27) and 100% (10/10), respectively.
Conclusion:
The mass and strand pattern and the coarse reticular pattern continuous
with PhC on MDCT images were highly suggestive of PLX invasion by
PhC.
4
Introduction
Pancreatic carcinoma still has a poor prognosis [1; 2]. Only
surgical resection has the potential to be curative [3]. For pancreas
head carcinoma (PhC), when potentially curative resection is achieved,
the 5-year survival rate is approximately 10-20% [1; 3; 4].
Extrapancreatic nerve plexus (PLX) invasion is one of the most
important prognostic factors in patients with PhC, and therefore,
preoperative imaging diagnosis of PLX invasion in PhC is clinically
important for predicting the prognosis and deciding the surgical
strategy including extended resection with removal of the adjacent
major vessels [5-14].
Recently, the spreading patterns of PLX invasion in PhC have
been investigated in detail pathologically [12; 15]. However, few
reports have focused on the imaging findings of PLX invasion in PhC
[16-19]. Furthermore, these past reports were not sufficiently accurate,
because a point-by-point correlation between the images and
pathological findings was not performed.
In this study, to make point-by-point imaging-pathological
correlation possible, we cut the surgical specimens of PhC resected en
bloc with the surrounding vessels, lymph nodes and connective tissues
including PLX horizontally, and made double oblique multiplanar
reconstruction (MPR) images from multi-detector row computed
5
tomography (MDCT) that were exactly equal to each of the
pathological sections. The purpose of this study was to elucidate the
MDCT findings of PLX invasion by PhC by “point-by-point”
correlation with en bloc pathological specimens and to assess the
diagnostic accuracy of the MDCT findings in the diagnosis of PLX
invasion.
Materials and methods
Our institutional review board approved this retrospective study
and informed consent was obtained from each of the patients.
Study Design
First, we performed “point-by-point” correlation between the
MDCT findings and pathological specimen at the same section to
clarify the MDCT findings of PLX invasion. Then, from this analysis,
the representative MDCT patterns indicating the presence/absence of
PLX invasion were derived. Last, we determined the diagnostic
accuracy of these MDCT patterns in the diagnosis of PLX invasion by
blind assessment by experienced radiologists.
Patients
6
Thirty-seven consecutive patients with invasive ductal
carcinoma of the pancreas head who received preoperative MDCT
examination and en bloc curative surgical resection within one month
during the period from January 2003 to June 2007 at our institution
were focused on in the study. Thirteen female (mean age, 63 years; age
range, 52-74 years) and 24 male (mean age, 62 years; age range, 44-79
years) patients were included. Thirty-three patients had tubular
adenocarcinomas, and four had adenosquamous carcinomas. None of
the patients received preoperative chemotherapy, radiation, or other
neo-adjuvant therapy. En bloc resection of PhC, peripancreatic adipose
tissue including regional PLX, lymph nodes and duodenum was
performed in all patients. Combined resection of the proximal portion
of the portal vein (PV) was performed in 16 patients, and both the
superior mesenteric artery (SMA) and PV in 16 patients. The mean size
and size range of the tumours were 3.1cm and 1.7-4.5cm, respectively.
PLX invasion was revealed in 25 patients pathologically.
Surgical specimens and pathological sections
Resected specimens were immediately fixed in 10% buffered
formaldehyde solution. After the specimens were cut in a transverse
plane of the body approximately parallel to axial CT sections into 5
mm stepwise tissue blocks, they were embedded in paraffin. The 5 µm
7
sections were cut for haematoxylin and eosin (H&E) and Elastica van
Gieson (EVG) staining, and full mount preparations were created. We
obtained a total of 554 pathological sections. The mean number of
created pathological sections per patients was 15.
CT examinations and MPR images
CT examinations were performed using a 16 (29 patients) or 4
(8 patients) –detector row CT (LightSpeed Ultra, LightSpeed Plus; GE
Medical Systems, Milwaukee, WI, USA). Images were acquired
through the pancreas in a craniocaudal direction with 0.562:1
(16-detector), 0.75:1 (4-detector) pitch. Other CT parameters were the
same in both systems, as follows: 300-350 mA; 120 kV; gantry rotation
speed, 0.5 s; a reconstruction section thickness of 1.25 mm and a
reconstruction interval of 1.25 mm. Unenhanced multi-detector row CT
was performed first. For dynamic CT, contrast medium with a
concentration of 300 mg of iodine per millilitre (Omnipaque, Daiichi,
Tokyo, Japan) was administered with a power injector. A total volume
of 100 ml was injected at a rate of 3 ml/s through a 22-gauge plastic
intravenous catheter that was placed in an antecubital vein.
Three-phase (35, 60, 180 seconds after initiation of the injection) CT
acquisition was performed. This is the routine protocol for upper
abdominal CT examination at our institution.
8
After reviewing all pathological sections, double oblique MPR
for both the ventrodorsal and lateral directions were generated with a
slice thickness of 2.5mm and reconstruction intervals of 1.0mm from
the first phase data set using a workstation (Virtual Place Lexus 1.0,
AZE, Tokyo, Japan). Double oblique MPR images were precisely
coordinated equal to the parallel section of the pathological sections
referring to the configuration of the pancreas or tumour and to the
surrounding vessels such as the gastroduodenal artery,
pancreaticoduodenal arteries and PV and its branches, bile duct, and
lymph nodes by two authors (K.M., K.K., both with 9 years’ experience
in abdominal radiology) by consensus. We obtained a total of 554
sectional MPR images exactly equal to the number of pathological
sections.
CT images were reviewed using window level 40 and window
width 350, and using the same monitor in this study.
Correlation between CT and pathological findings
The region of investigation was determined according to the
anatomy of PLX related to PhC invasion described in previous reports
[15; 20; 21] as shown in Fig. 1. It was the medial-posterior fat area of
the pancreas head surrounded by the parenchyma of the pancreas, PV,
common hepatic artery, a median line connecting PV and inferior vena
9
cava, a median line connecting the SMA and aorta, a median line
connecting the celiac artery and aorta, and anterior border line
connecting the aorta and inferior vena cava.
All pathological sections were reviewed by two authors (Z.Y.,
with 10 years’ experience in pathology and K.M.) and all pathological
structures more than 1mm in these regions were recorded. Then the
point-by-point correlation between the pathological and CT findings
was carried out by two radiologists (K.M., K.K.) and one pathologist
(Z.Y.) by consensus with careful comparison of the exactly the same
sections of the MPR images and surgical specimens.
Deriving CT patterns and correlation between each pattern and
pathological findings
According to the above mentioned correlation analysis, the CT
findings in the region of investigation were classified into several
representative patterns with special reference to PLX invasion.
Then, two radiologists (K.M., K.K.) reviewed all sections of
MPR images in all patients and classified the CT findings of each
evaluated area into these patterns by consensus. These patterns and
pathological findings were then correlated to extract the particular CT
patterns reflecting PLX invasion. When the same pattern was observed
continuously in two or more consecutive sections, it was counted as
10
one evaluation area of this particular pattern. As a result, a total of 276
evaluation areas were extracted.
Evaluation of the diagnostic accuracy of MDCT findings
Two independent radiologists (reader A; Y.H., and reader B;
T.G., with 10 and 26 years’ experience in abdominal radiology,
respectively) had been informed of the definitions of each CT pattern
and CT patterns reflecting or not reflecting PLX invasion by using
cases not included in this study. For evaluating the diagnostic accuracy
of the CT patterns in the diagnosis of PLX invasion, the two readers
independently reviewed the routine CT images of all patients and
diagnosed the presence or absence of PLX invasion in each. The
readers were blinded to the patient pathological information.
For analysing interobserver variability, two readers (Y.H., T.G.)
independently reviewed all the MPR images and classified the CT
findings of 276 evaluation areas into derived CT patterns.
Statistical Analysis
The statistical analysis was performed using Statistical software
(SPSS for Windows; SPSS, Chicago, IL, USA). P values less than 0.05
were considered statistically significant.
After taking into account the presence or absence of the
11
continuity of each pattern, for evaluating the correlation between PLX
invasion and each pattern, pattern-by-pattern basis cross-tabulation
tables were prepared and a chi-squared test was carried out.
For evaluating the diagnostic accuracy of the CT patterns in the
diagnosis of PLX invasion by two readers, two patient-by-patient basis
cross-tabulation tables were prepared and the sensitivity, specificity,
accuracy, and positive and negative predictive values were calculated
for each table.
To assess interobserver variability in terms of image
interpretation, k statistics was used to quantify the degree of agreement.
A k value of up to 0.20 was considered to indicate slight agreement; a k
value of 0.21-0.40, fair agreement; a k value of 0.41-0.60, moderate
agreement; a k value of 0.61-0.80, substantial agreement; and a k value
of 0.81 or greater, almost perfect agreement.
Results
Correlation between CT and pathological findings
Among all 554 pathological sections in all 37 patients, we
identified 268 micro-vessels, 14 fibrotic thickenings of adipose tissue
septa, 133 clusters of micro-vessels with fibrotic thickening of adipose
tissue septa, 175 lymph nodes, 90 cases of PLX invasion with fibrosis
12
and 4 cases of inflammatory cell infiltration. All cases of PLX invasion
with fibrosis were continuous with PhC (90/90, 100%).
On MPR images, all of the micro-vessels showed fine lines
(less than 2mm in diameter) (268/268, 100.0%) (Fig. 2). All fibrotic
thickenings of adipose tissue septa also showed fine lines (14/14,
100.0%). Clusters of micro-vessels with fibrotic thickening of adipose
tissue septa showed fine reticula (reticulation that was composed of
fine reticular lines with abundant intermingled fat density) (127/133,
95.5%) (Fig. 3) or coarse reticula (reticulation that was also composed
of reticular lines with less intermingled fat density) (6/133, 4.5%).
Lymph nodes (with or without metastasis) showed fine lines (59/175,
33.7%) or mass or strand shape (over 2mm diameter mass or
strand-shaped soft tissue density continuous with PhC (6/175, 3.4%), or
nodules (over 2mm diameter isolated nodules) (110/175, 62.9%) (Fig.
3). PLX invasion with fibrosis showed mass or strand shape (77/90,
85.6%) (Fig. 4) or coarse reticula (12/90, 13.3%) (Figs. 3, 4) or fine
reticula (1/90, 1.1%). All inflammatory cell infiltrations showed coarse
reticula (4/4, 100%) (Fig. 5).
Deriving CT patterns and correlation between each pattern and
pathological findings
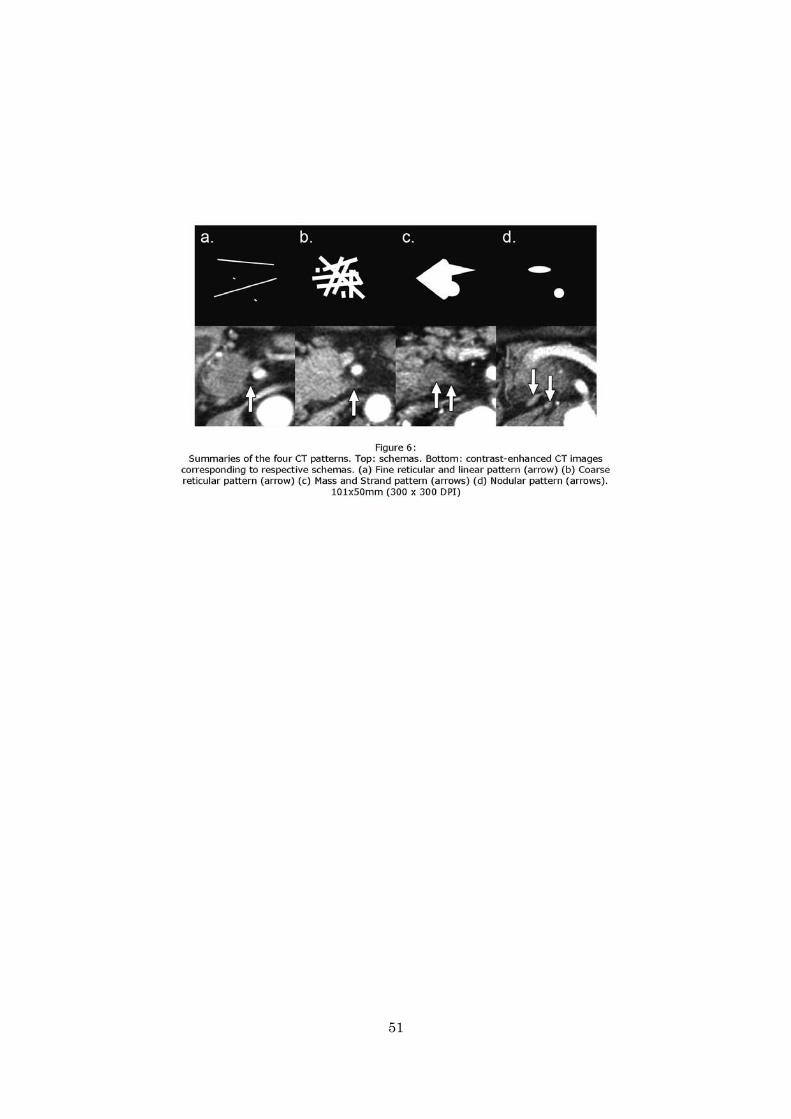
According to this correlation analysis, considering the presence
13
or absence of PLX invasion, the CT findings of the investigated regions
were divided into the following four categories (Fig. 6):
a. Fine reticular and linear pattern: fine lines (less than 2mm
in diameter) and fine reticula (reticulation that was
composed of fine reticular lines with abundant
intermingled fat density).
b. Coarse reticular pattern: coarse reticula (reticulation that
was also composed of reticular lines with less
intermingled fat density).
c. Mass and strand pattern: over 2mm diameter mass or
strand-shaped soft tissue density connecting to the PhC.
d. Nodular pattern: over 2mm diameter isolated nodules.
Table 1 shows the numbers of the areas showing each CT
pattern and the corresponding pathological findings.
Fine reticular and linear pattern: 113 areas showing a fine
reticular and linear pattern were detected on the MPR images in 35
patients. 112 (99%) of them showed micro-vessels, micro-lymph nodes
and fibrosis with PLX (Figs. 2, 3). The remaining one (1%) of them,
which was continuous with PhC, showed PLX invasion by a small
number of cancer cells with fibrosis (Fig. 7).
Coarse reticular pattern: 43 areas showing a coarse reticular
pattern were detected on the MPR images in 20 patients. 16 (37%) of
14
them showed clusters of micro-vessels, micro-lymph nodes, and
fibrosis with PLX, similar to those observed in the fine reticular and
linear pattern. Inflammatory cell infiltration was mixed in two of these
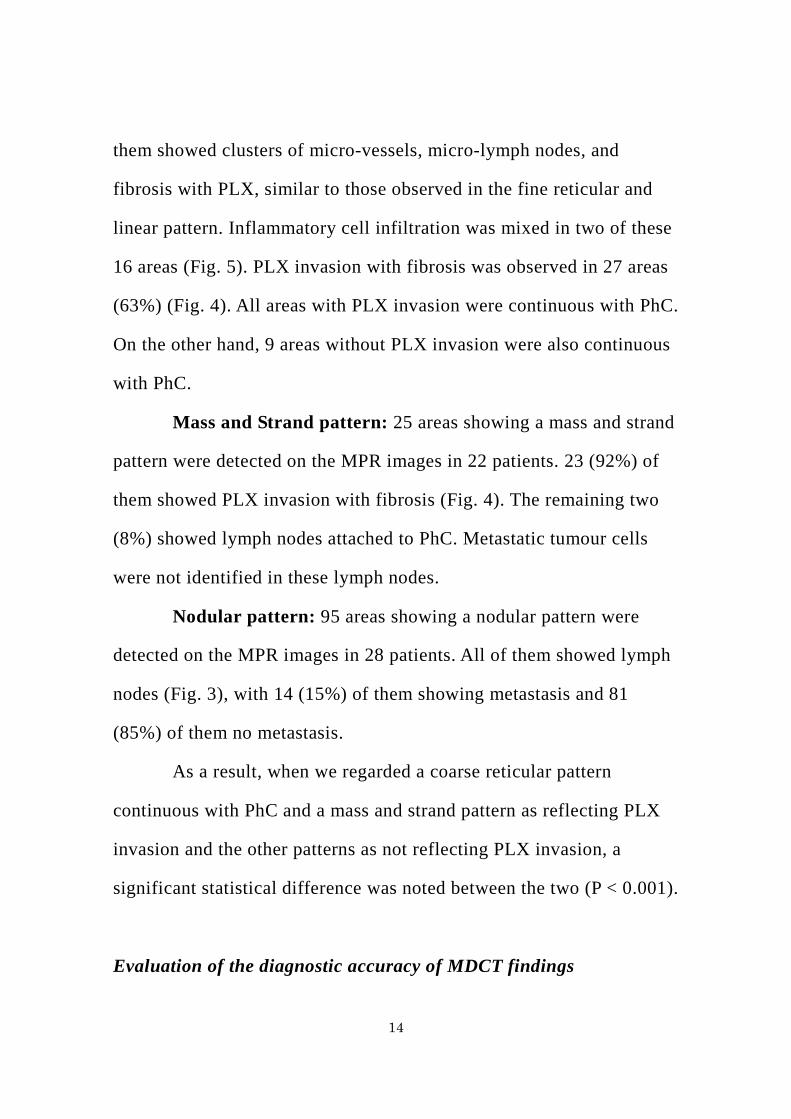
16 areas (Fig. 5). PLX invasion with fibrosis was observed in 27 areas
(63%) (Fig. 4). All areas with PLX invasion were continuous with PhC.
On the other hand, 9 areas without PLX invasion were also continuous
with PhC.
Mass and Strand pattern: 25 areas showing a mass and strand
pattern were detected on the MPR images in 22 patients. 23 (92%) of
them showed PLX invasion with fibrosis (Fig. 4). The remaining two
(8%) showed lymph nodes attached to PhC. Metastatic tumour cells
were not identified in these lymph nodes.
Nodular pattern: 95 areas showing a nodular pattern were
detected on the MPR images in 28 patients. All of them showed lymph
nodes (Fig. 3), with 14 (15%) of them showing metastasis and 81
(85%) of them no metastasis.
As a result, when we regarded a coarse reticular pattern
continuous with PhC and a mass and strand pattern as reflecting PLX
invasion and the other patterns as not reflecting PLX invasion, a
significant statistical difference was noted between the two (P < 0.001).
Evaluation of the diagnostic accuracy of MDCT findings
15
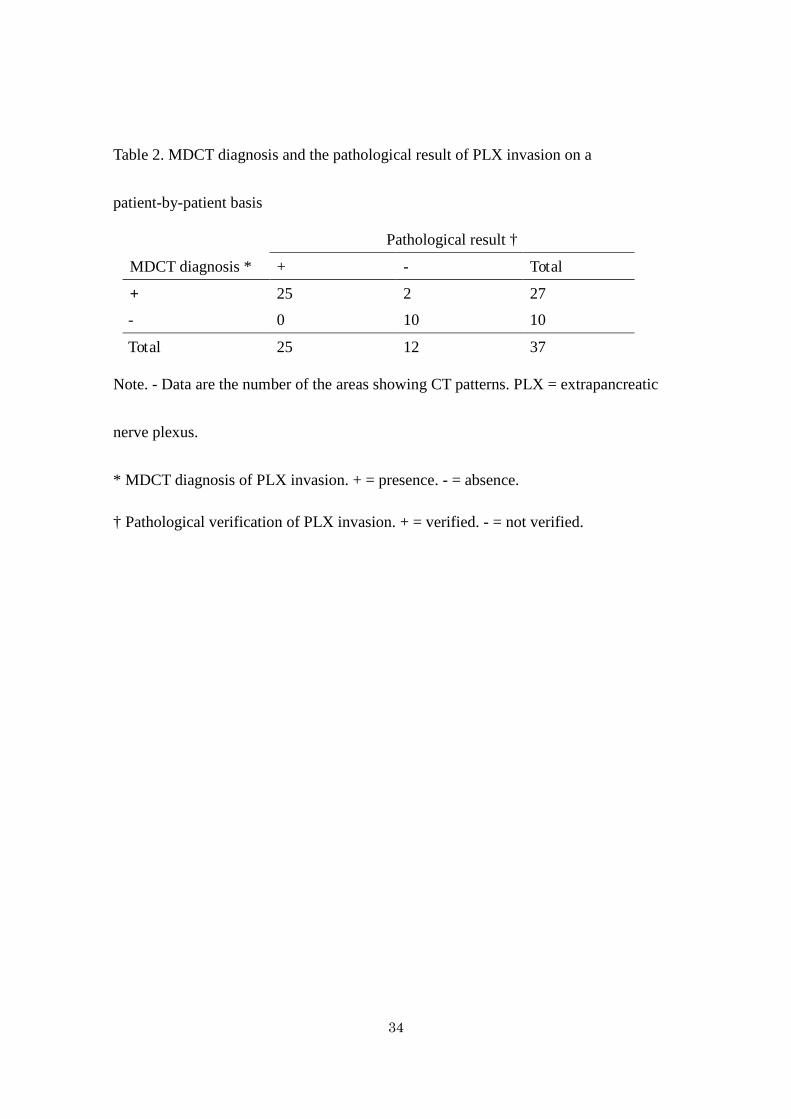
Two patient-by-patient basis cross-tabulation tables about
MDCT diagnosis and the pathological result of PLX invasion were
prepared by two readers (Table 2). These two tables were similar, and
sensitivity, specificity, accuracy, and positive and negative predictive
values were 100% (25/25), 83.3% (10/12), 94.6% (35/37), 92.6%
(25/27) and 100% (10/10), respectively. The k values of independent
image ratings by readers A and B for the CT classification was 0.88,
indicating substantial, almost perfect agreement.
Discussion
Only a few previous reports have focused on the imaging
findings of PLX invasion in PhC [16-19]. This may be due to the
complicated anatomical structures present around the pancreas
including innervation and the difficulty of achieving a “point-by-point”
correlation between the imaging and pathological findings. Therefore,
no description of PLX invasion is provided in the Union Internationale
Contra le Cancer (UICC) classification [22]. However, PhC frequently
invades the PLX [13] and the postoperative survival rate for patients
with PLX invasion is worse compared with that for patients without
PLX invasion [5-12]. Because of this, the Japan Pancreas Society
classification [23] adopted the item of PLX invasion and is now
considered to be a more reliable staging system predicting the outcome
16
compared with that based on the UICC classification [24]. Therefore,
we consider that the preoperative imaging diagnosis of PLX invasion in
PhC is clinically important.
In this study, to make a point-by-point imaging-pathological
correlation possible, we cut the en bloc specimens of PhC horizontally,
and made double oblique MPR images that were exactly equal to each
of the pathological sections. As a result of this correlation analysis, we
derived four different CT patterns from the view point of PLX invasion,
namely, fine reticular and linear, coarse reticular, mass and strand and
nodular patterns. In 92% of the regions investigated showing the mass
and strand pattern and 63% showing the coarse reticular pattern (all
continuous with PhC), PLX invasion was revealed pathologically, and
they were highly suggestive of PLX invasion by PhC on MDCT images
(p < 0.001). In addition, the blind assessment by independent
radiologists confirmed the extremely high diagnostic accuracy of these
MDCT patterns.
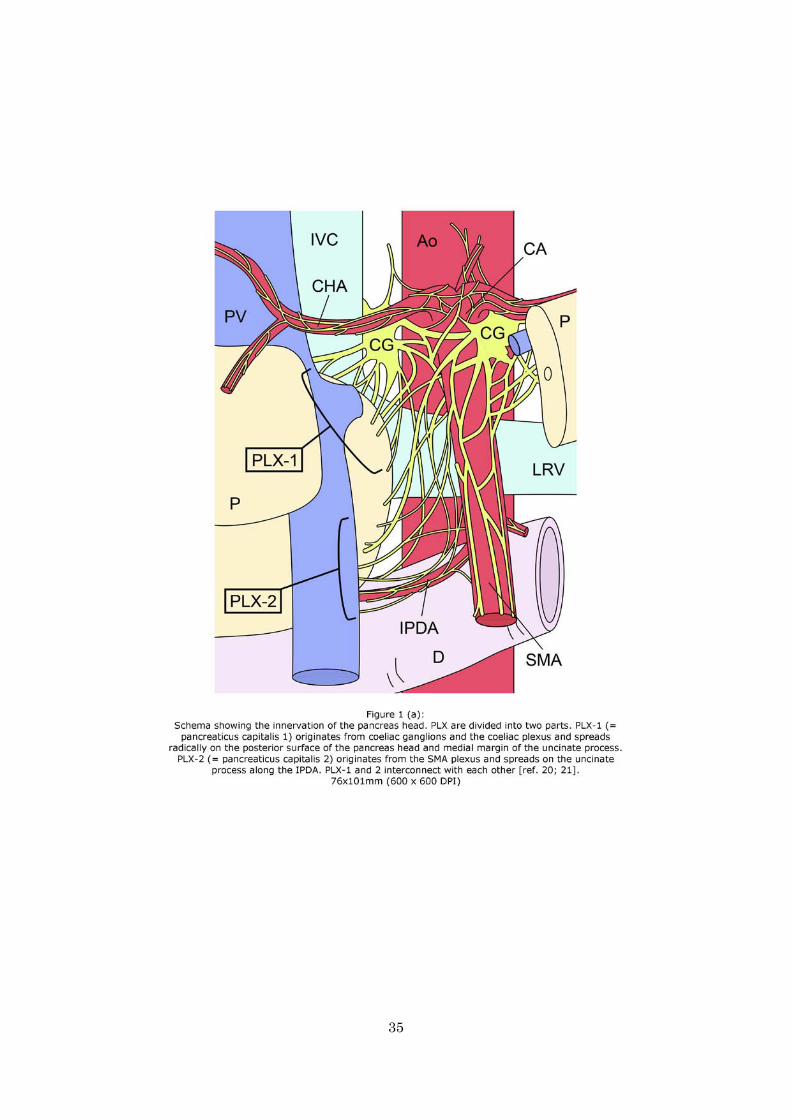
Concerning the innervation of the pancreas, Yoshioka and
Wakabayashi, and Yi et al described that PLX could be divided into
two parts [20; 21], “pancreaticus capitalis 1 and 2” as shown in Fig. 1.
Yi et al also reported that a few nerves were observed with some small
blood vessels and lymphatic vessels diverging complexly with copious
connective tissue between the SMA and uncinate process. Our study
17
confirmed this pancreatic nerve supply pathologically. However, no
data are available that suggest that invasion of different parts of the
nerve plexus carries different prognostic implications. In addition, it
was difficult to differentiate the respective parts of nerve plexuses
exactly on the MDCT images because of the intertwined complexity of
the PLX. Thus, we determined invasion of the PLX without
distinguishing which specific part of the PLX was invaded.
Tian et al and Zhang et al using CT and MRI, respectively,
reported that PLX invasion of “pancreaticus capitalis 2” was
characterised by streaky and strand-like attenuation or signal intensity
structure in fat tissue, and irregular masses adjacent to the tumour [18;
19]. These descriptions correspond approximately to the “mass and
strand pattern” in our results. However, in our study, the MDCT criteria
of the PLX invasion of any part of the PLX (not only the “pancreaticus
capitalis 2”) were not only “mass and strand pattern” but also “coarse
reticular pattern” continuous with PhC on MDCT images. That is to say,
the criteria of the PLX invasion should be further expanded compared
with those previously reported.
Previous reports analysing the imaging findings of PLX
invasion did not refer to those of normal structures between the SMA
and uncinate process at all. Descriptions of these normal structures
were limited to “fat” in previous reports. However, as described above,
18
there are copious connective tissues with small blood vessels and
lymphatic vessels diverging complexly between the SMA and uncinate
process pathologically. To know the imaging findings of these normal
structures is important for the differential diagnosis of PLX invasion.
Based on our results, on MDCT images, there are fine reticular and
linear patterns and nodular patterns, and the areas showing these
patterns correspond to structures complexly intertwined with
micro-vessels, fibrosis, and lymph nodes pathologically. PLX not
invaded by tumour is also included in these structures, but it was
impossible to distinguish the nerve fibres of PLX from other
anatomical structures on MDCT images.
In the areas showing a coarse reticular pattern without PLX
invasion, there was a relatively large amount of fibrosis compared with
that shown in the areas demonstrating a fine reticular pattern. In
addition, two of them showed inflammatory cell infiltration
pathologically. Such fibrosis and inflammatory cell infiltration might
be caused by tumour-induced chronic pancreatitis complicating PhC,
resulting in a major false positive finding for the diagnosis of PLX
invasion.
Megibow et al reported that a “thickened vessels sign”
surrounding the coeliac axis or SMA associated with pancreatic
carcinoma was caused by lymphatic invasion, but without a
19
“point-by-point” comparison with pathological examination [25]. In the
present study, lymphatics were observed pathologically but were likely
not to be visualised separately on MDCT images because of their small
size compared with micro-vessels or fibrosis. In this study, even when
numerous tumour cells were present in this region, PLX invasion was
commonly detected but lymphatic invasion was not. All areas showing
a nodular pattern were lymph nodes pathologically and were unrelated
to PLX invasion.
This study has several limitations. First, it was retrospective in
nature and included a relatively small number of patients. To assess the
clinical usefulness of PLX invasion on the basis of these CT patterns in
individual patients, further prospective study is required. Second, this
study did not cover all PLX around the pancreas head. Third, we did
not evaluate any cases with chronic pancreatitis or other conditions in
the absence of pancreatic cancer. Chronic pancreatitis may also cause a
coarse reticular pattern similar to that of PLX invasion.
In conclusion, in the region of the medial-posterior fat area of
the pancreas head, mass and strand patterns and coarse reticular
patterns continuous with PhC on MDCT images were highly
suggestive of PLX invasion by PhC. These results may help to predict
the prognosis of the disease and to decide the surgical strategy
including extended resection with surrounding major vessels.

20
21
References
1 Matsuno S, Egawa S, Fukuyama S, et al. (2004) Pancreatic
Cancer Registry in Japan: 20 years of experience. Pancreas,
28(3):219-230.
http://ovidsp.tx.ovid.com/spb/ovidweb.cgi?QS2=434f4e1a73d37
e8c01e9bb09ab15b392cdde409bdae0da8d7a43048278daa6de3c9
38745e122f15ea370ee7099ea5f58990821e88c34c5c220f7fd261b
054ce9edb6ee20efc8159053487e23e33c4ea182f66058cfd7c46a8
78f8fbc8e78840770831ba56cc88f52b2fb27252871e2fa2f596fd1f
fc1df57caa3062c2b7a0c224c1a6de28619ab31e1258fc774eaee35f
69ef8f695a3fc8c55f77f906156480753a8c6c6b51b17b5b27c37f6
109c62cef082514785a92fa686d506aa01ffe06869ff19a98f976d7f
aad845108b94a682451e6452cc82b02d948d08ed64d2ec9c6329ce
9b154dba797ec3b9cbf626a93362f14ea64cbf5737. Accessed 23
Oct 2008
2 Jemal A, Siegel R, Ward E, et al. (2008) Cancer statistics, 2008.
CA Cancer J Clin, 58(2):71-96. doi: 10.3322/CA.2007.0010
3 Schnelldorfer T, Ware AL, Sarr MG, et al. (2008) Long-term
survival after pancreatoduodenectomy for pancreatic
adenocarcinoma: is cure possible? Ann Surg 247(3):456-462. doi:
10.1097/SLA.0b013e3181613142
4 Yekebas EF, Bogoevski D, Cataldegirmen G, et al. (2008) En bloc
22
vascular resection for locally advanced pancreatic malignancies
infiltrating major blood vessels: perioperative outcome and
long-term survival in 136 patients. Ann Surg 247(2):300-309.
doi: 10.1097/SLA.0b013e31815aab22
5 Kayahara M, Nagakawa T, Konishi I, Ueno K, Ohta T, Miyazaki
I (1991) Clinicopathological study of pancreatic carcinoma with
particular reference to the invasion of the extrapancreatic neural
plexus. Int J Pancreatol, 10(2):105-111.
6 Nagakawa T, Kayahara M, Ueno K, Ohta T, Konishi I, Miyazaki
I (1992) Clinicopathological study on neural invasion to the
extrapancreatic nerve plexus in pancreatic cancer.
Hepato-gastroenterology, 39(1):51-55.
7 Nagakawa T, Kayahara M, Ueno K, et al. (1992) A
clinicopathologic study on neural invasion in cancer of the
pancreatic head. Cancer, 69(4):930-935. doi:
10.1002/1097-0142(19920215)69:4<930::AID-CNCR282069041
6>3.0.CO;2-R
8 Nagakawa T, Mori K, Nakano T, et al. (1993) Perineural invasion
of carcinoma of the pancreas and biliary tract. Br J Surg
80(5):619-621. doi: 10.1002/bjs.1800800526
9 Kayahara M, Nagakawa T, Ueno K, Ohta T, Tsukioka Y,
Miyazaki I (1995) Surgical strategy for carcinoma of the
23
pancreas head area based on clinicopathologic analysis of nodal
involvement and plexus invasion. Surgery, 117(6):616-623.
10 Nakao A, Harada A, Nonami T, Kaneko T, Takagi H (1996)
Clinical significance of carcinoma invasion of the
extrapancreatic nerve plexus in pancreatic cancer. Pancreas,
12(4):357-361.
http://ovidsp.tx.ovid.com/spb/ovidweb.cgi?WebLinkFrameset=1
&S=AOJHFPEHMCDDNECJNCFLCHJLAJJMAA00&returnUrl
=http%3a%2f%2fovidsp.tx.ovid.com%2fspb%2fovidweb.cgi%3f
Main%2bSearch%2bPage%3d1%26S%3dAOJHFPEHMCDDNE
CJNCFLCHJLAJJMAA00&directlink=http%3a%2f%2fgraphics.
tx.ovid.com%2fovftpdfs%2fFPDDNCJLCHCJMC00%2ffs047%
2fovft%2flive%2fgv031%2f00006676%2f00006676-199605000-
00006.pdf&filename=Clinical+Significance+of+Carcinoma+Inva
sion+of+the+Extrapancreatic+Nerve+Plexus+in+Pancreatic+Can
cer. Accessed 24 Jul 2008
11 Nakao A, Takeda S, Sakai M, et al. (2004) Extended radical
resection versus standard resection for pancreatic cancer: the
rationale for extended radical resection. Pancreas, 28(3):289-292.
http://ovidsp.tx.ovid.com/spb/ovidweb.cgi?QS2=434f4e1a73d37
e8c01e9bb09ab15b39201d3938fc4fac7641a313376699844a0df8
3d70dbae5acf04dc1f708da9a61d665b10e12fc67128294eeb189b3
24
4e7e149e5e3ba3db4b5be0549c35e2e1bef651820d842ec6aa613e
d1210f4cfc47c322563572d3907f80b140c6a4595ffe74cbc12457d
741067426659c902779dffb4885b87c44a3a31d8ce5bc7e14a7c80
3ecf9f589e081094e298481a1e5dcc590cf6259e3061c671de69291
1c277e5c97536dfde8891a9addc12aa37f3563bd07df6569d7ef1bc
ac391210af3c5a55ff8f84aff07a1a529775ee1d4de759f102e38a45
ddb4a1c4aa4e6b5d0cbbc9e4fd22a. Accessed 16 Oct 2008
12 Mitsunaga S, Hasebe T, Kinoshita T, et al. (2007) Detail
histologic analysis of nerve plexus invasion in invasive ductal
carcinoma of the pancreas and its prognostic impact. Am J Surg
Pathol 31(11):1636-1644. doi: 10.1097/PAS.0b013e318065bfe6
13 Noto M, Miwa K, Kitagawa H, et al. (2005) Pancreas head
carcinoma: frequency of invasion to soft tissue adherent to the
superior mesenteric artery. Am J Surg Pathol 29(8):1056-1061.
http://ovidsp.tx.ovid.com/spb/ovidweb.cgi?QS2=434f4e1a73d37
e8c3511ef48f69b7c81718b3f5a9e050c86d9d8590bb5736c913e3
673be9b31519e92f0ec8ad2cf3b2e2e791e4e835c912e6b3ab85a24
ab018c6c8d9f120b7b4aa249a7c65864a291d9c8a6157614fb06ac
d9bbae7e7c779759e876da7065b84514dfbdd22bc4f1d03dfd4cd2
4677b7f4a8697e6f029ed8e4218078f7b8d403caff3f7a682959b89
c2fade0c6d994fa96cd131d862ec27159156aac007984d077d5706
471a7a7dcf846615c4c7fb3a1488406906feb05097c9edaf3a08561
25
3e43bf64f27a78c990169ea5c1be85b1b73cbd27a61eb000913605
a70fe5aea5a12e4b8b3063b9695dbb00715541ca9cbcdf4e.
Accessed 31 Jul 2008
14 Kato K, Yamada S, Sugimoto H, et al. (2009) Prognostic factors
for survival after extended pancreatectomy for pancreatic head
cancer: influence of resection margin status on survival. Pancreas,
38(6):605-612. doi: 10.1097/MPA.0b013e3181a4891d
15 Makino I, Kitagawa H, Ohta T, et al. (2008) Nerve Plexus
Invasion in Pancreatic Cancer: Spread Patters on Histopathologic
and Embryological Analyses. Pancreas, 37(4):358-65. doi:
10.1097/MPA.0b013e31818166e6
16 Miura K (1991) The evaluation of thin slice incremental CE-CT
for diagnosis of extension of pancreatic carcinoma--comparison
of CT and pathological findings Nihon Igaku Hoshasen Gakkai
zasshi, 51(3):245-259. (in Japanese)
17 Demachi H, Hukui N, Miyata S, et al. (1992) CT Findings of
Neural Invasion of Nerve plexus Around the Superior Mesenteric
Artery in patients with Pancreatic Ductal Carcinoma. Jpn J Clin
Radiol, 37:1469-1475. (in Japanese)
18 Tian H, Mori H, Matsumoto S, et al. (2007) Extrapancreatic
neural plexus invasion by carcinomas of the pancreatic head
region: evaluation using thin-section helical CT. Radiat Med
26
25(4):141-147. doi: 10.1007/s11604-006-0115-1
19 Zhang XM, Mitchell DG, Witkiewicz A, Verma S, Bergin D
(2008) Extrapancreatic neural plexus invasion by pancreatic
carcinoma: characteristics on magnetic resonance imaging.
Abdom Imaging. doi: 10.1007/s00261-008-9440-4
20 Yoshioka H, Wakabayashi T (1958) Therapeutic neurotomy on
head of pancreas for relief of pain due to chronic pancreatitis; a
new technical procedure and its results. AMA Arch Surg
76(4):546-554.
21 Yi SQ, Miwa K, Ohta T, et al. (2003) Innervation of the pancreas
from the perspective of perineural invasion of pancreatic cancer.
Pancreas, 27(3):225-229.
http://ovidsp.tx.ovid.com/spb/ovidweb.cgi?QS2=434f4e1a73d37
e8c54ea12160ae198c5304aed6a34a11de0b0441ef677e5dfa0065d
ee75c43bfb4d0d7469c3259437a1427116f4b98b36650686624450
53559e27a0f5ee8d1ebe5163bb39d7b7790ea29c0358d67755dab5
48bec826562abda0570adc3e46208088e1c70788ef931aebf8bb2fd
7305d96698303361772d056318146396f9d35ac6e7e9eb5097afed
8e24cf55fdcf0cdc1fd0647e8fe48c25dca4743d76808573709ca59
2bee9b64fb0a903f0769bc65bb4604d1ff63e34e6e66e59092a2de2
47caaacbece25e3f55728202a46cd7d48b05e06b5fef94366eb3d97
60b660cc1a3e95. Accessed 16 Oct 2008
27
22 Sobin LH, Wittekind C (2002) UICC-TNM classification of
malignant tumours, 6th ed. Wiley-Liss, New York,
23 (2003) Japan Pancreas Society. Classification of pancreatic
carcinoma, 2nd English ed. Kanehara, Tokyo
24 Isaji S, Kawarada Y, Uemoto S (2004) Classification of
pancreatic cancer: comparison of Japanese and UICC
classifications. Pancreas, 28(3):231-234.
http://ovidsp.tx.ovid.com/spb/ovidweb.cgi?QS2=434f4e1a73d37
e8c04d9a87dbb6879060aa0dcfa0542074fe2e8cef0683b49bf51be
13f240c5390e3789ddc7160aa6de105053023cb04e20a13e2d204e
7baafad99dfcecba4986891d594cfe69df79c8ba8869e6c44abdbd3
51136c0a5d59b7f7f54278da5ec51439099e58feed35f63f07e710b
bb45bb918ac79bf92e6a694125ca55ef9e0af2ec38b635cdd2b894d
08dadf66249cbc8537ec4ffba137352e39da7fb0f41f7041d6f431e6
c917b783036d065759bae196c9ec2f09a999259a7f7633f38bd693
14bd56ba570e283ab1a44000e69b77c6f61e650e597ef89dc7f4373
1182bf8e14dae0671e41c0f6f13e. Accessed 28 Jul 2008
25 Megibow AJ, Bosniak MA, Ambos MA, Beranbaum ER (1981)
Thickening of the celiac axis and/or superior mesenteric artery: a
sign of pancreatic carcinoma on computed tomography.
Radiology, 141(2):449-453.
http://radiology.rsna.org/content/141/2/449.full.pdf+html?sid=90

28
fe5875-9bf4-41a1-a524-864e0d5edfd0. Accessed 16 Oct 2008
29
Figure captions
Figure 1
(a) Schema showing the innervation of the pancreas head. PLX are divided into two
parts. PLX-1 (= pancreaticus capitalis 1) originates from coeliac ganglions and the
coeliac plexus and spreads radically on the posterior surface of the pancreas head and
medial margin of the uncinate process. PLX-2 (= pancreaticus capitalis 2) originates
from the SMA plexus and spreads on the uncinate process along the IPDA. PLX-1 and
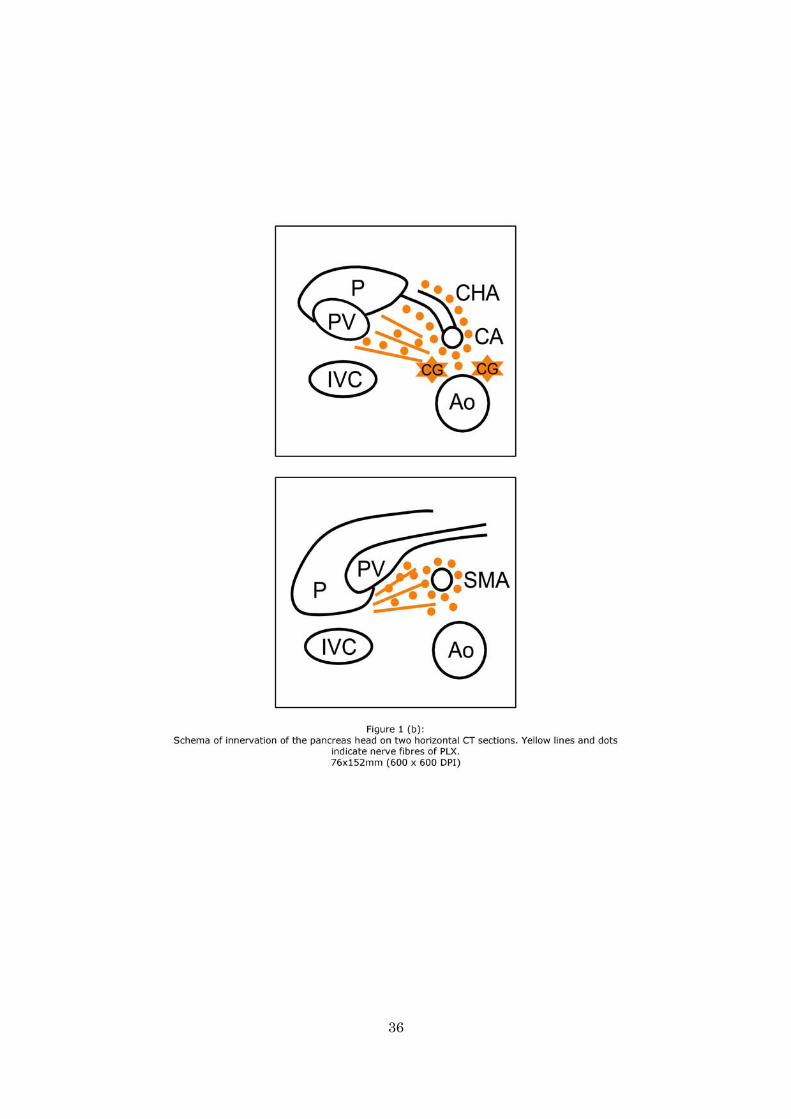
2 interconnect with each other [ref. 20; 21]. (b) Schema of innervation of the pancreas
head on two horizontal CT sections. Yellow lines and dots indicate nerve fibres of
PLX. Ao = aorta. CA = coeliac artery. CG = coeliac ganglion. CHA = common hepatic
artery. DU = duodenum. IPDA = inferior pancreaticoduodenal artery. IVC = inferior
vena cava. LRV = left renal vein. P = pancreas. PLX = extrapancreatic nerve plexus.
PV = portal vein. SMA = superior mesenteric artery.
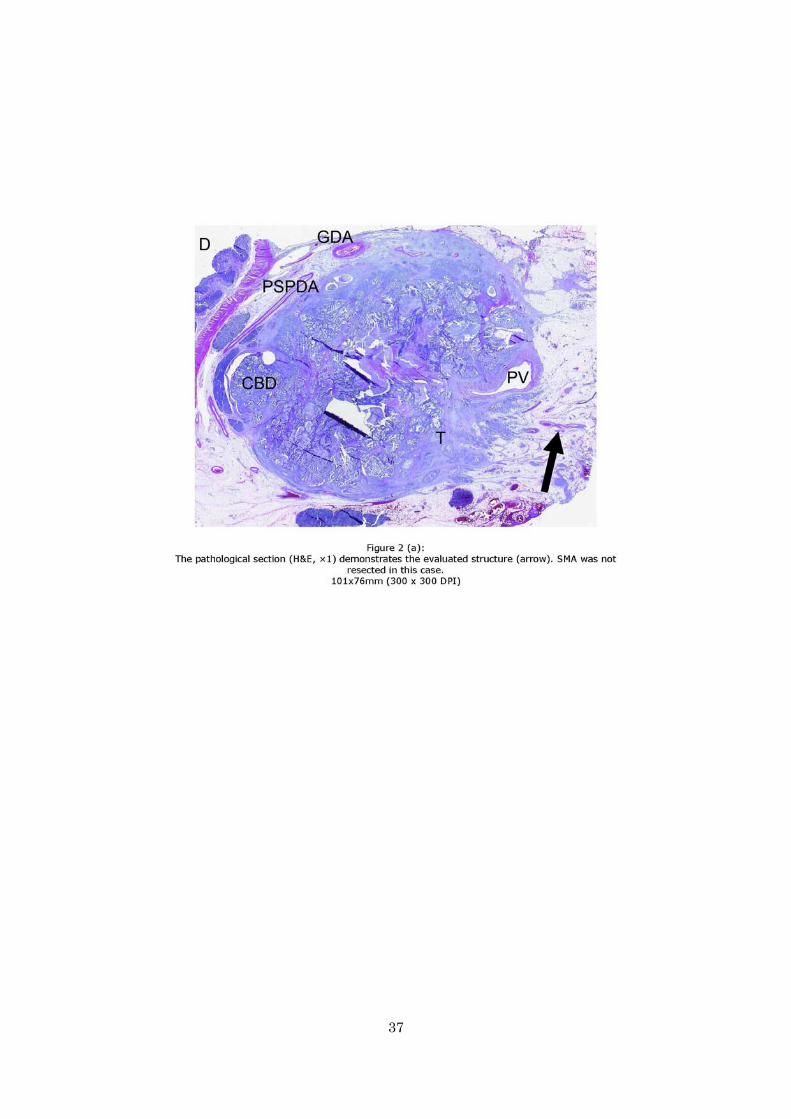
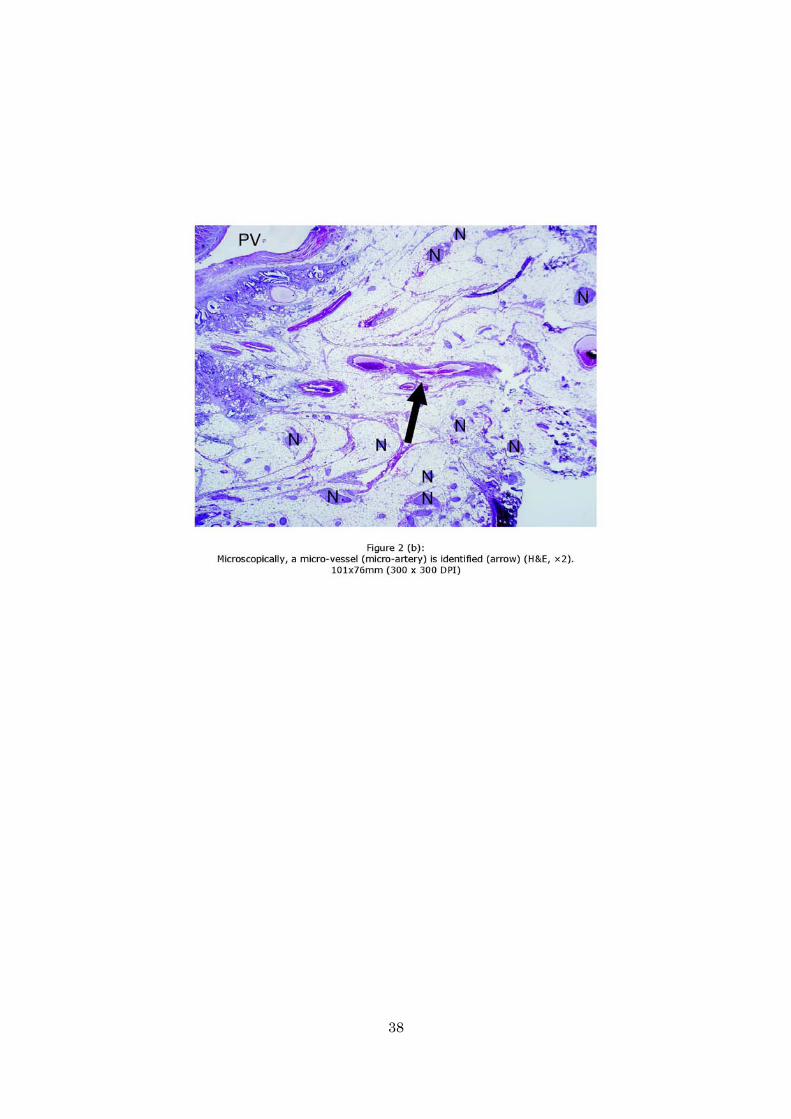
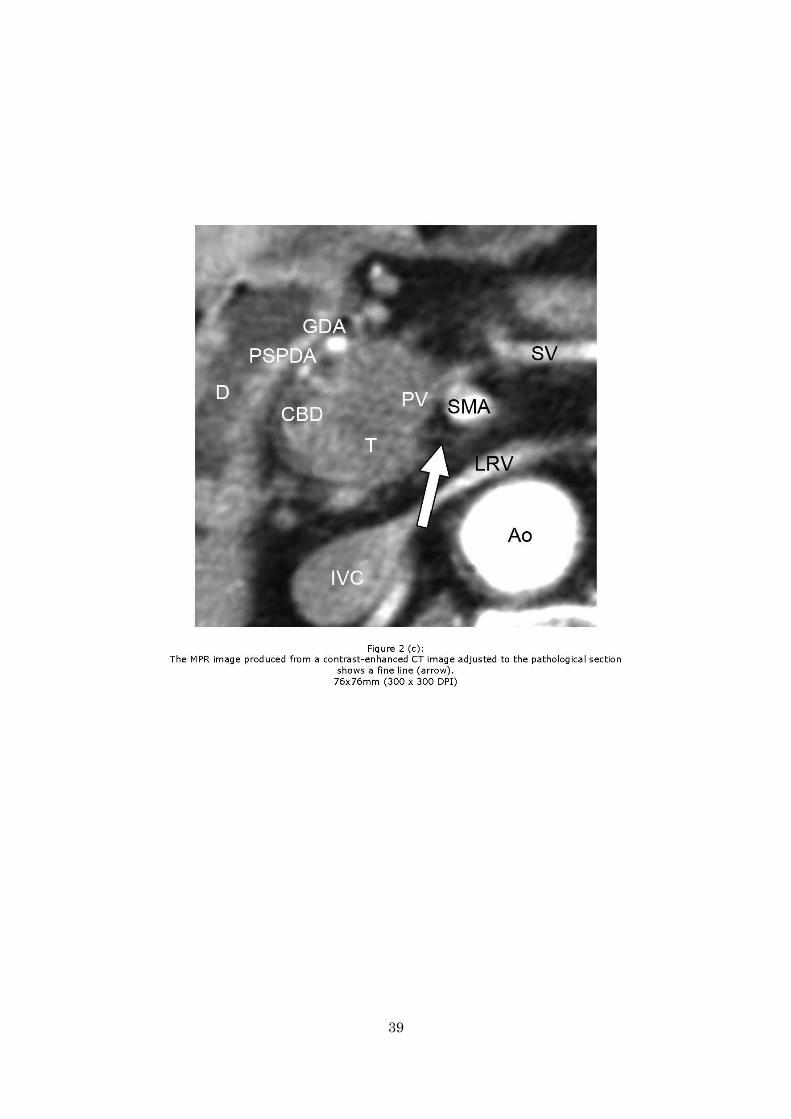
Figure 2
(a) The pathological section (H&E, ×1) demonstrates the evaluated structure (arrow).
SMA was not resected in this case. (b) Microscopically, a micro-vessel (micro-artery)
is identified (arrow) (H&E, ×2). (c) The MPR image produced from a
contrast-enhanced CT image adjusted to the pathological section shows a fine line
(arrow). Ao = Aorta. CBD = common bile duct. D = duodenum. GDA =
gastroduodenal artery. IVC = inferior vena cava. LRV = left renal vein. N = nerve
fibres of PLX. PSPDA = posterior superior pancreaticoduodenal artery. PV = portal
vein. SMA = superior mesenteric artery. SV = splenic vein. T = primary tumour.
30
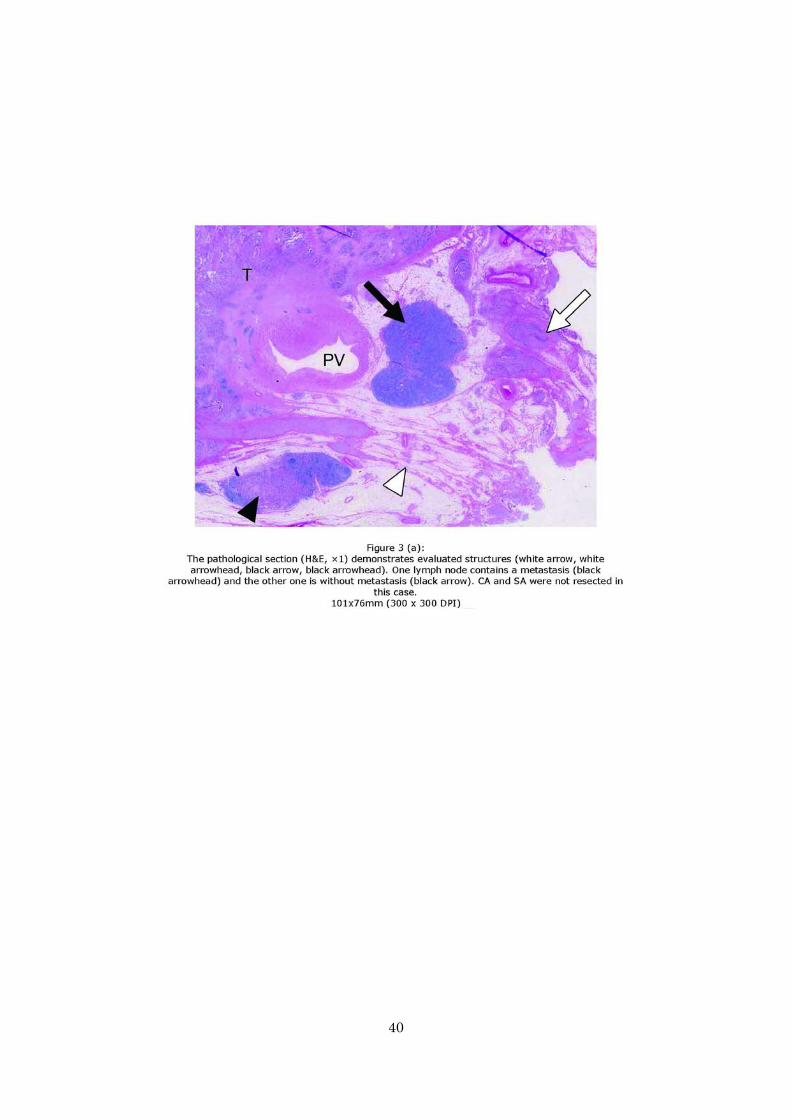
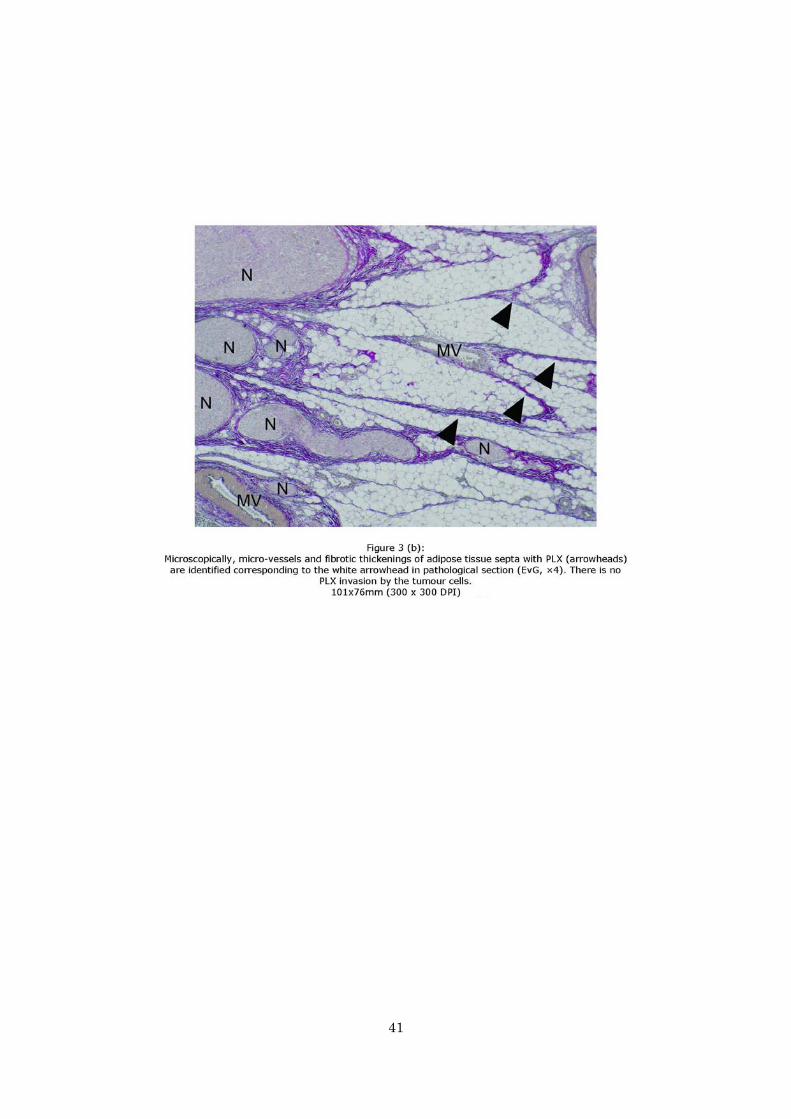
Figure 3
(a) The pathological section (H&E, ×1) demonstrates evaluated structures (white
arrow, white arrowhead, black arrow, black arrowhead). One lymph node contains a
metastasis (black arrowhead) and the other one is without metastasis (black arrow).
CA and SA were not resected in this case. (b) Microscopically, micro-vessels and
fibrotic thickenings of adipose tissue septa with PLX (arrowheads) are identified
corresponding to the white arrowhead in pathological section (EvG, ×4). There is no
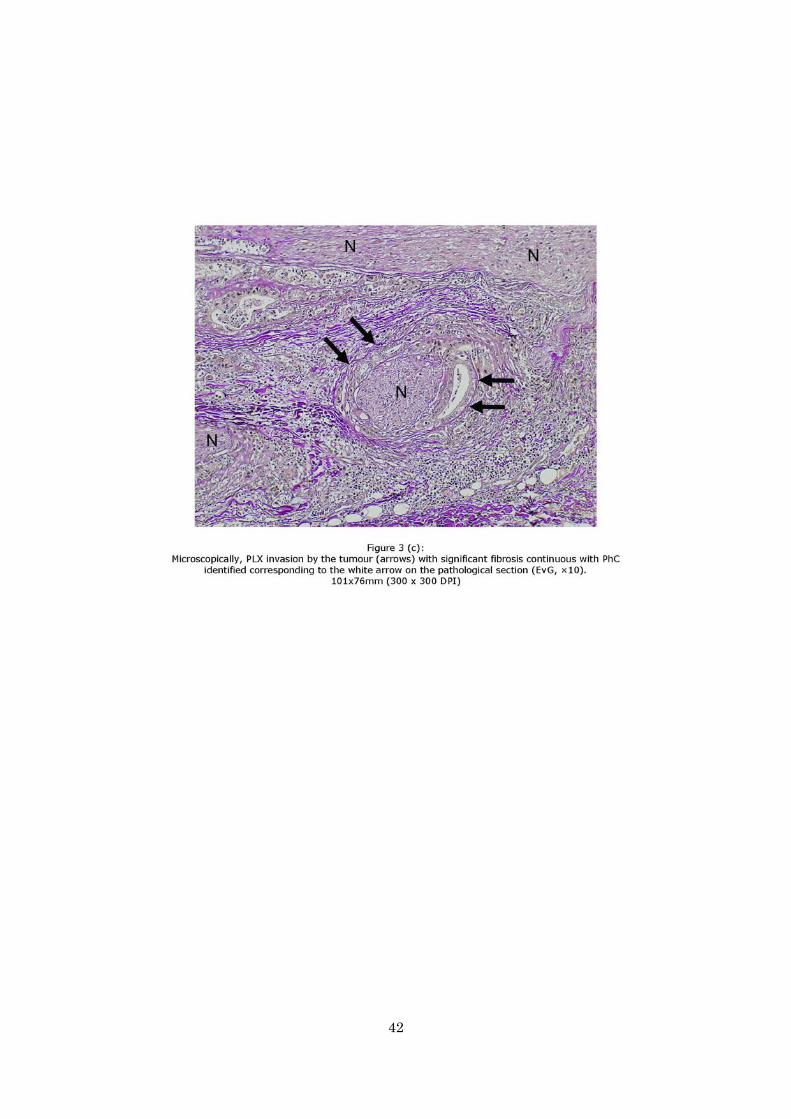
PLX invasion by the tumour cells. (c) Microscopically, PLX invasion by the tumour
(arrows) with significant fibrosis continuous with PhC identified corresponding to the
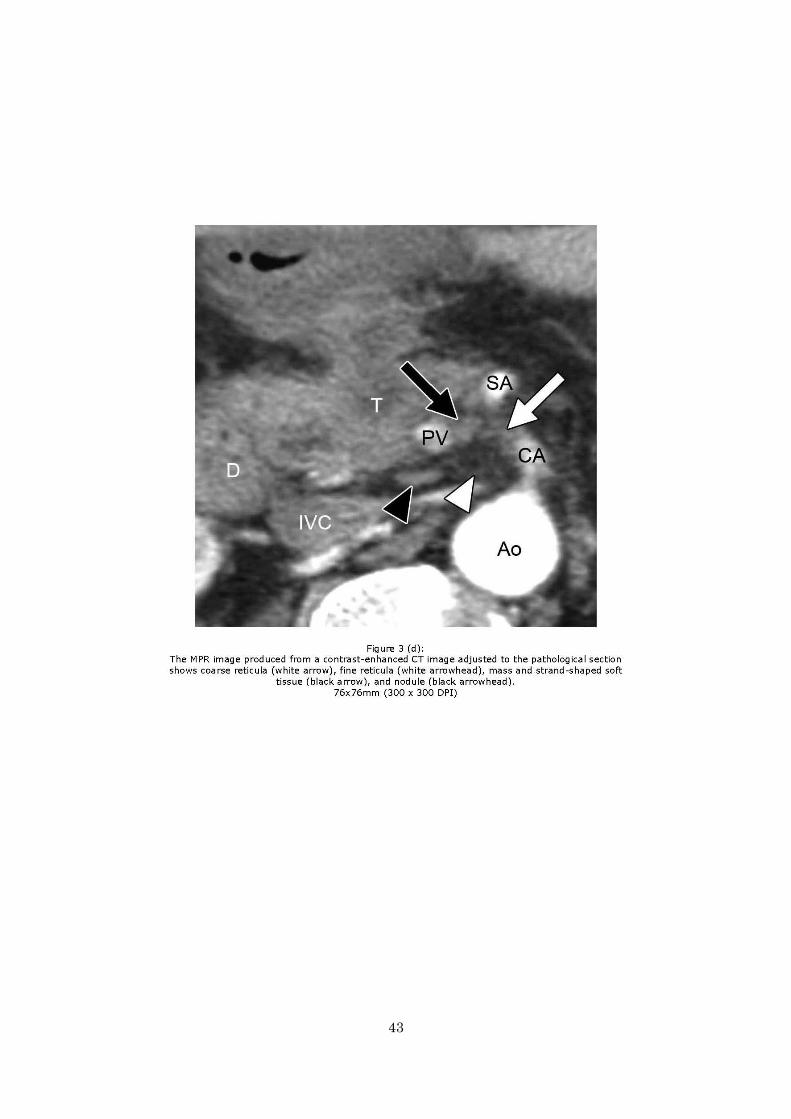
white arrow on the pathological section (EvG, ×10). (d) The MPR image produced
from a contrast-enhanced CT image adjusted to the pathological section shows coarse
reticula (white arrow), fine reticula (white arrowhead), mass and strand-shaped soft
tissue (black arrow), and nodule (black arrowhead). Ao = Aorta. CA = coeliac artery.
D = duodenum. IVC = inferior vena cava. MV = micro-vessels. N = nerve fibres of the
PLX. PV = portal vein. SA = splenic artery. T = primary tumour.
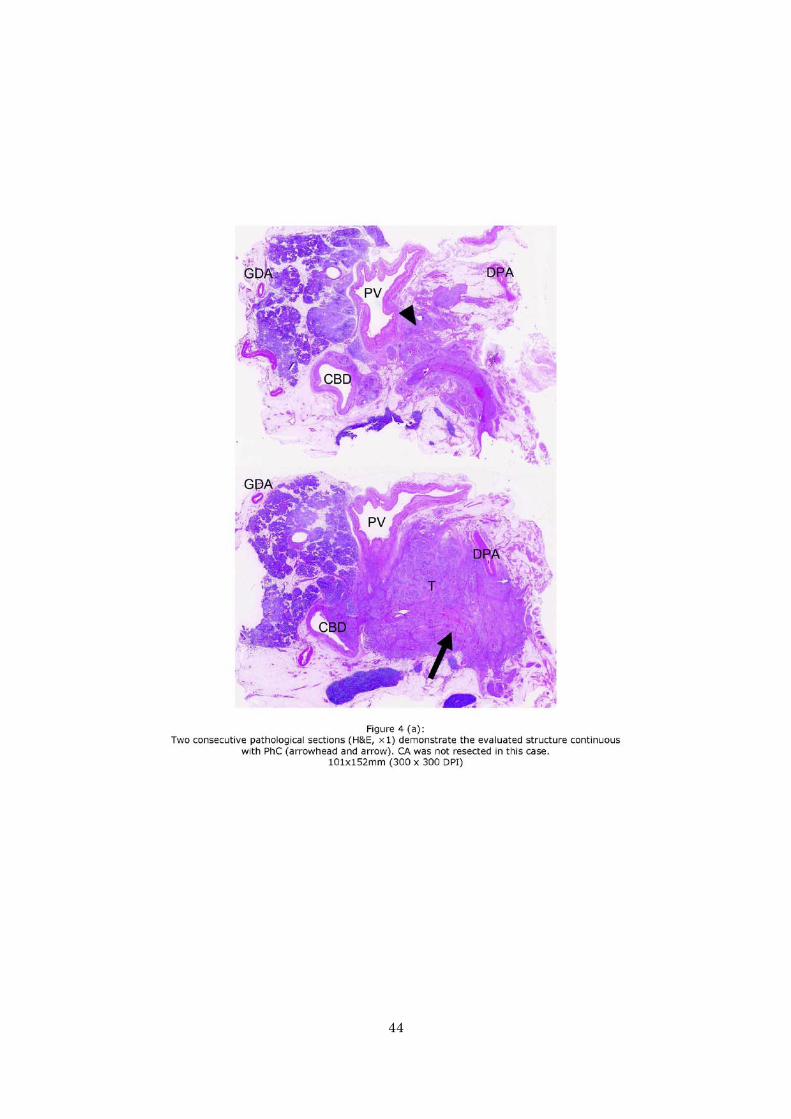
Figure 4
(a) Two consecutive pathological sections (H&E, ×1) demonstrate the evaluated
structure continuous with PhC (arrowhead and arrow). CA was not resected in this
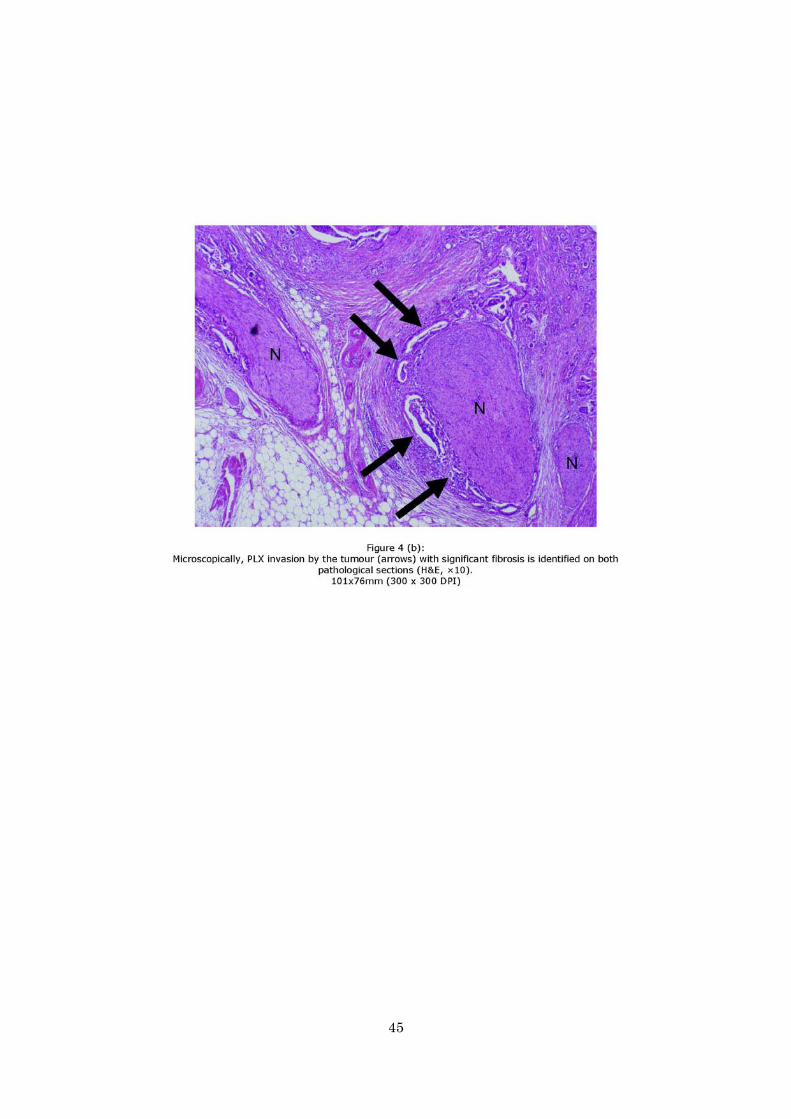
case. (b) Microscopically, PLX invasion by the tumour (arrows) with significant
fibrosis is identified on both pathological sections (H&E, ×10). (c) Two MPR images
produced from a contrast-enhanced CT image adjusted to the pathological sections
show coarse reticula (arrowhead), mass and strand-shaped soft tissue (arrow). Ao =
Aorta. CA = coeliac artery. CBD = common bile duct. D = duodenum. DPA = dorsal
pancreatic artery. GDA = gastroduodenal artery. IVC = inferior vena cava. N = nerve
31
fibres of PLX. PV = portal vein. T = primary tumour.
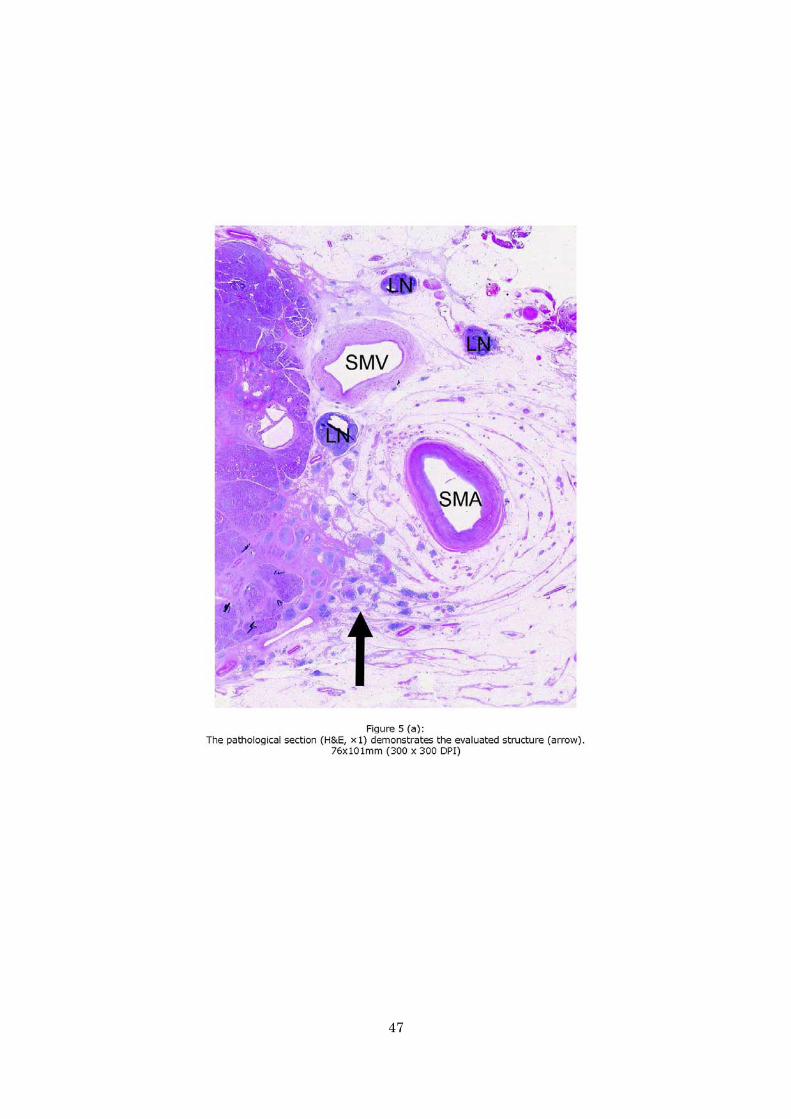
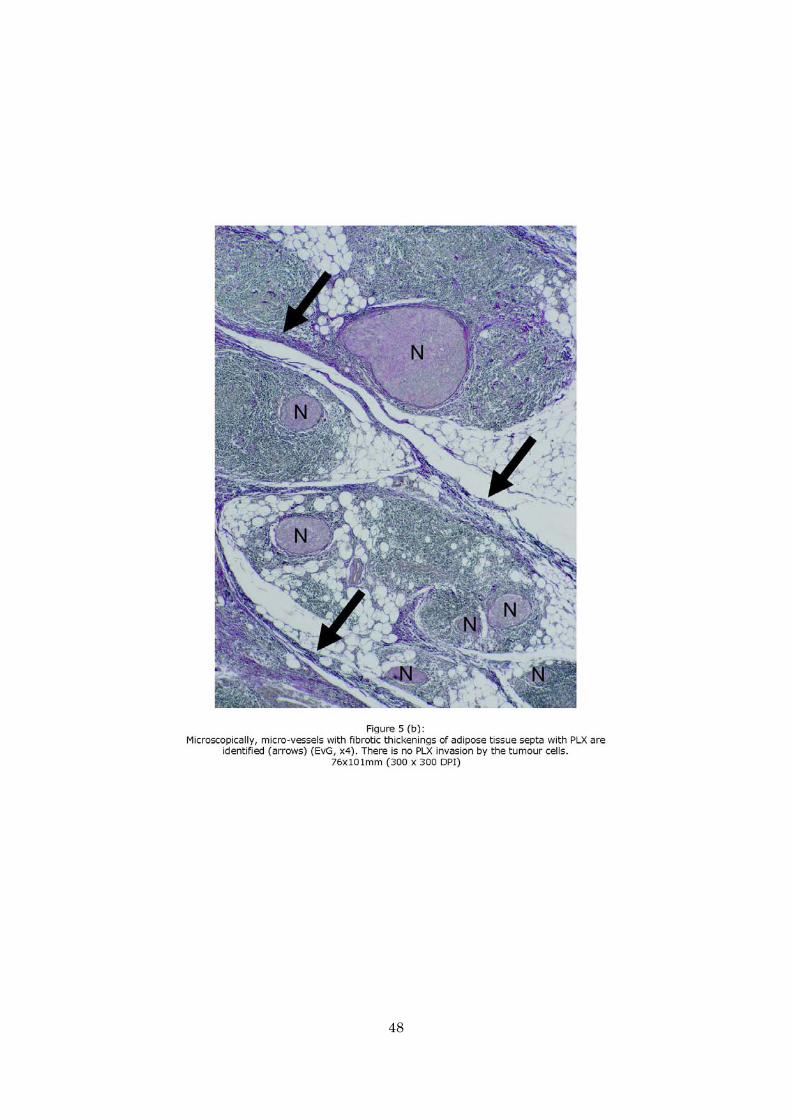
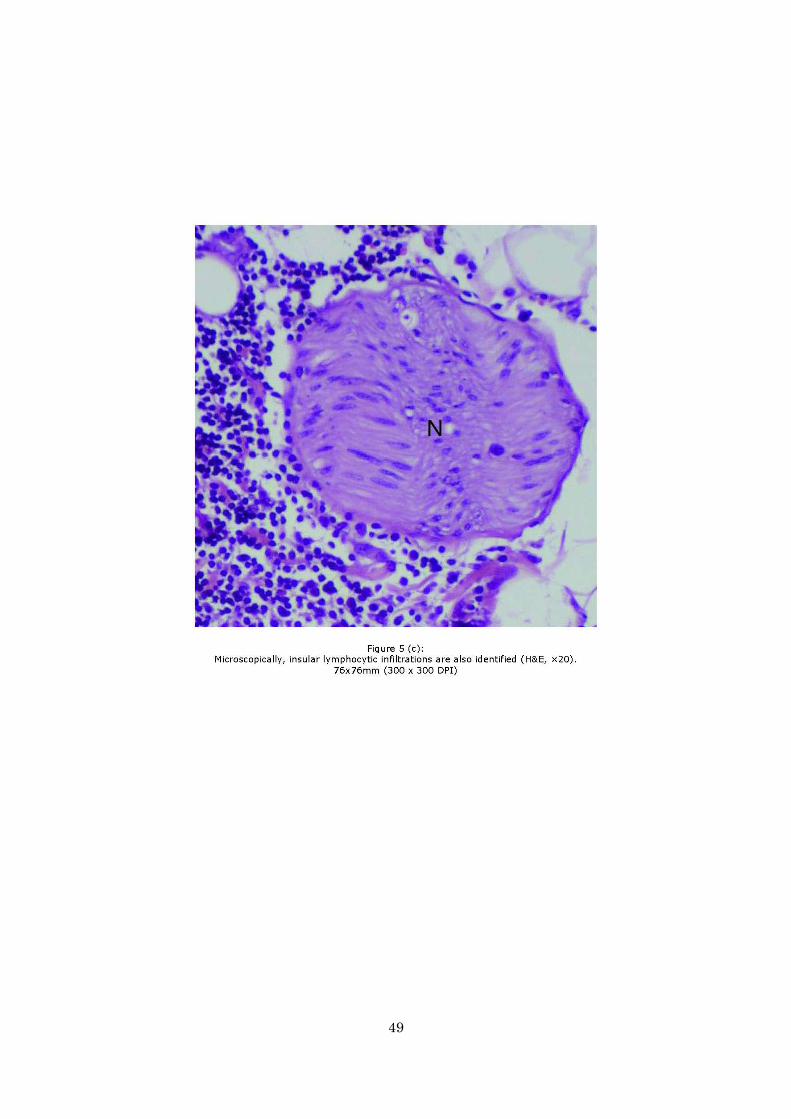
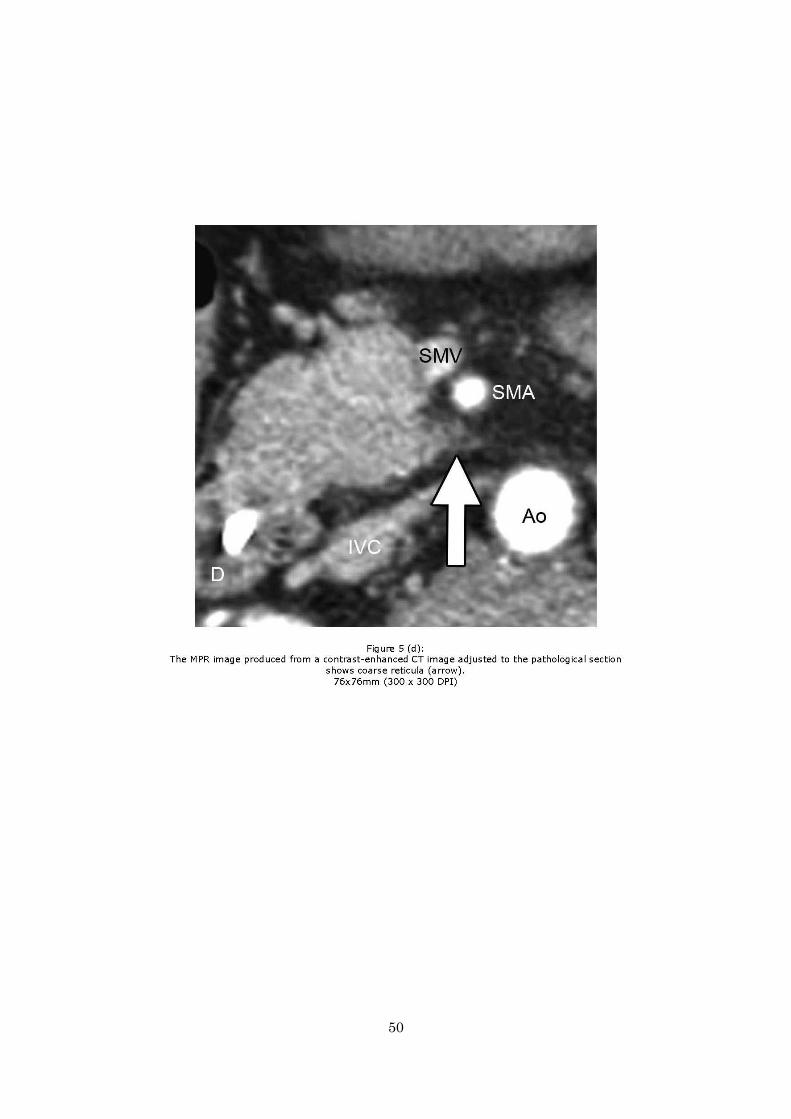
Figure 5
(a) The pathological section (H&E, ×1) demonstrates the evaluated structure (arrow).
(b) Microscopically, micro-vessels with fibrotic thickenings of adipose tissue septa
with PLX are identified (arrows) (EvG, x4). There is no PLX invasion by the tumour
cells. (c) Microscopically, insular lymphocytic infiltrations are also identified (H&E,
×20). (d) The MPR image produced from a contrast-enhanced CT image adjusted to
the pathological section shows coarse reticula (arrow). Ao = Aorta. D = duodenum.
GDA = gastroduodenal artery. IVC = inferior vena cava. LN = lymph nodes. LRV =
left renal vein. N = nerve fibres of the PLX. SMA = superior mesenteric artery. SMV =
superior mesenteric vein. T = primary tumour.
Figure 6
Summaries of the four CT patterns. Top: schemas. Bottom: contrast-enhanced CT
images corresponding to respective schemas. (a) Fine reticular and linear pattern
(arrow) (b) Coarse reticular pattern (arrow) (c) Mass and Strand pattern (arrows) (d)
Nodular pattern (arrows).
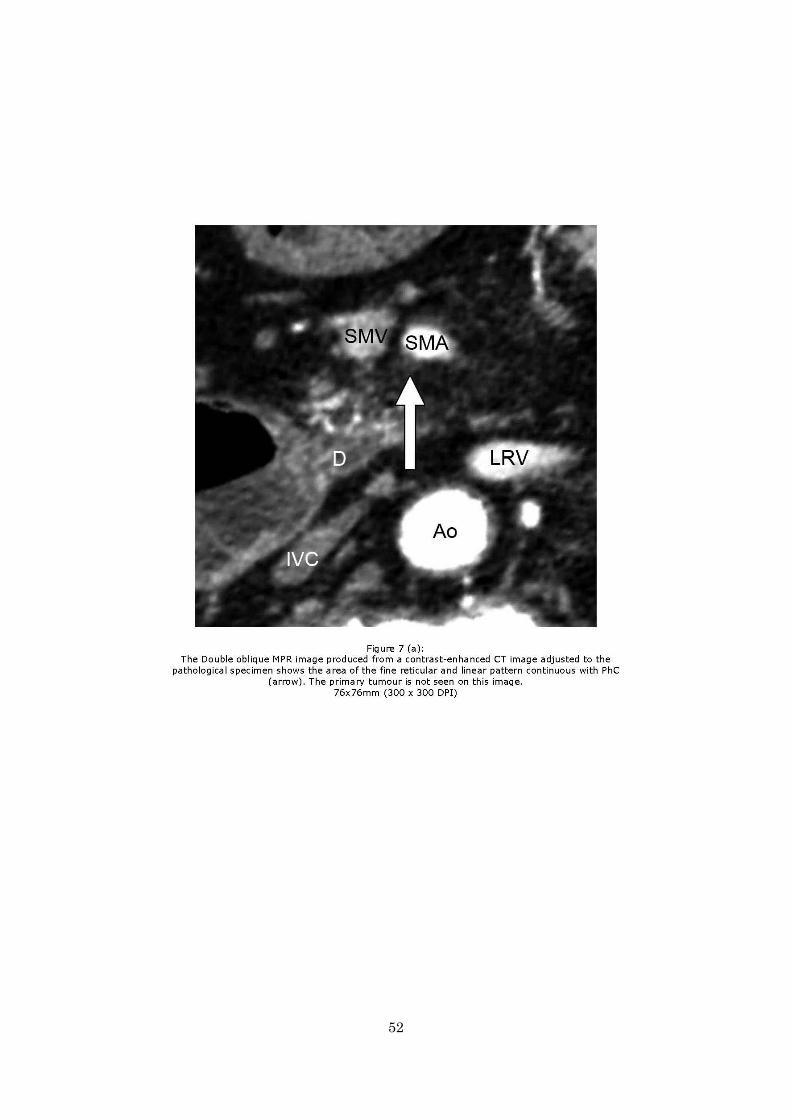
Figure 7
(a) The Double oblique MPR image produced from a contrast-enhanced CT image
adjusted to the pathological specimen shows the area of the fine reticular and linear
pattern continuous with PhC (arrow). The primary tumour is not seen on this image.
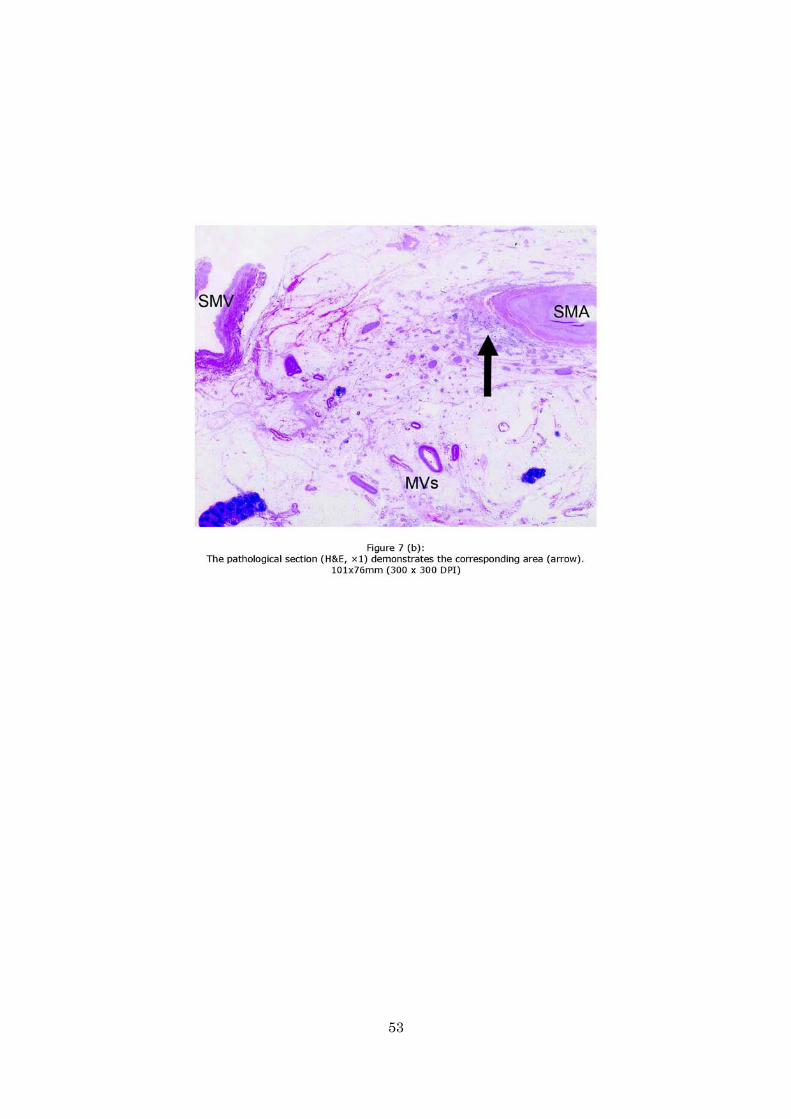
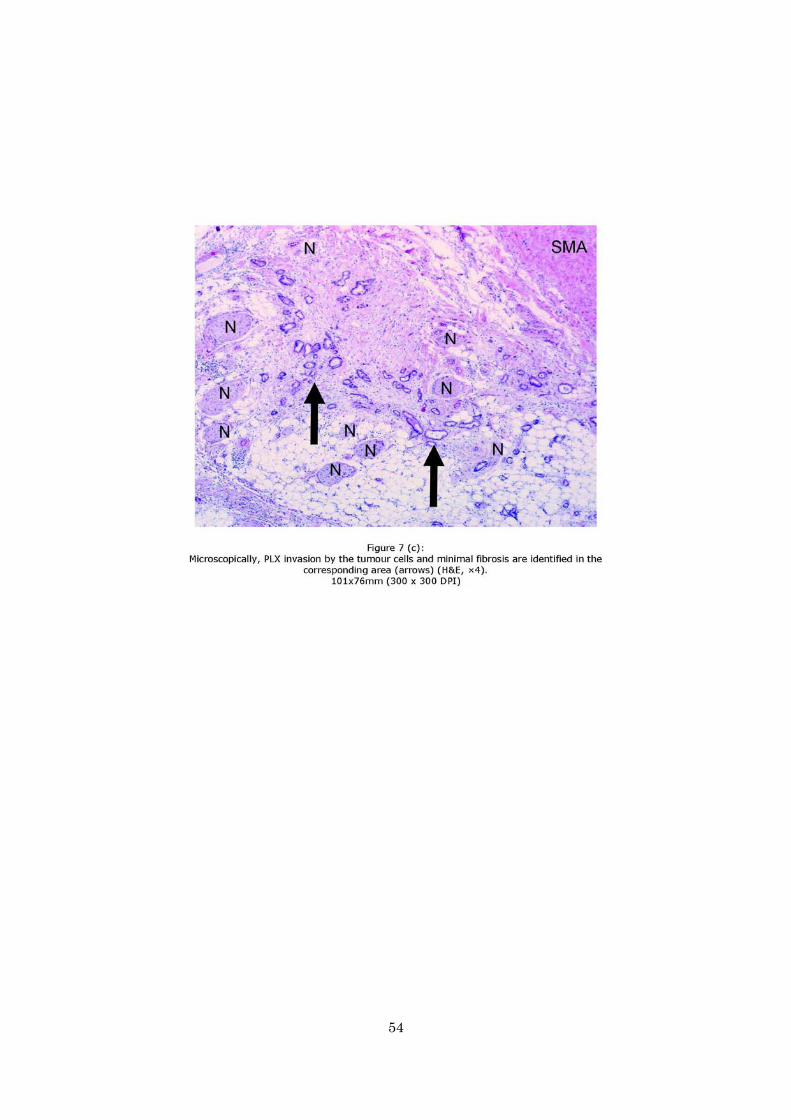
(b) The pathological section (H&E, ×1) demonstrates the corresponding area (arrow).
(c) Microscopically, PLX invasion by the tumour cells and minimal fibrosis are

32
identified in the corresponding area (arrows) (H&E, ×4). Ao = Aorta. D = duodenum.
IVC = inferior vena cava. LRV = left renal vein. MVs = micro-vessels. N = nerve
fibres of the PLX. SMA = superior mesenteric artery. SMV = superior mesenteric vein.

33
Table 1. Correlation between the each of the four CT patterns and pathological findings
CT patterns Pathological findings
Complex of micro-vessels/lymphnodes and fibrosis Lymphnodes PLX invasion Fine reticular and linear (n = 113) 112 (99) 0 1 (1) Coarse reticular (n = 43) 16 (37) * 0 27 (63) † Mass and Strand (n = 25) 0 2 (8) ‡ 23 (92) Nodular (n = 95) 0 95 (100) § 0
Note. - Data represent the number of the areas showing CT patterns, with percentages to the entire number of CT patterns in parentheses. All cases of
PLX invasion were continuous with PhC. PhC = pancreas head carcinoma. PLX = extrapancreatic nerve plexus.
* Seven of them were not continuous and 9 of them were continuous with PhC. Two of them showed inflammatory cell infiltration pathologically.
† All of them were continuous with PhC.
‡ Two of them showed no metastases pathologically.
§ 14 (15%) of them showed metastasis and 81 (85%) of them no metastasis pathologically.
34
Table 2. MDCT diagnosis and the pathological result of PLX invasion on a
patient-by-patient basis
MDCT diagnosis *
Pathological result †
+ - Total
+ 25 2 27
- 0 10 10
Total 25 12 37
Note. - Data are the number of the areas showing CT patterns. PLX = extrapancreatic
nerve plexus.
* MDCT diagnosis of PLX invasion. + = presence. - = absence.
† Pathological verification of PLX invasion. + = verified. - = not verified.
35
36
37
38
39
40
41
42
43
44
45

46
47
48
49
50
51
52
53
54