Maysoon Abdullah Mansor & Dr.Sawsan Rasheed Mohammed:Developing Sustainable Urban Planning...
11
Maysoon Abdullah Mansor et. al. /International Journal of Modern Sciences and Engineering Technology (IJMSET) ISSN 2349-3755; Available at https://www.ijmset.com Volume 2, Issue 3, 2015, pp.46-56 © IJMSET-Advanced Scientific Research Forum (ASRF), All Rights Reserved “IJMSET promotes research nature, Research nature enriches the world’s future” 46 Developing Sustainable Urban Planning Indicators Framework for Iraqi Cities by Using Content Analysis and Delphi Method Abstract This paper is part of a larger study regarding building an integrated framework for sustainable urban planning in Iraqi cities, where the study regions compass 15 urban Iraqi governorates. The study seeks to build an integrated and comprehensive framework of urban sustainability that includes a list of indicators generally matched Iraqi cities, taken as a basis for comparison between the urban areas as well as it contributes to the measurement and evaluation of urban sustainability. Depending on the theoretical review, using SMART approach and interrelation between Delphi method and content analysis, the hierarchy framework was resulting with three levels, level of dimensions(4 dimensions),level of categories (32 categories) and level of indicators (138 indicators ). Keywords: Sustainable Urban Planning, Indicators Framework, Iraqi Cities , content analysis , Delphi method 1. INTRODUCTION: 1.1 Sustainable urban Planning: The goal of sustainable urban development is the creation of an equal balance between the economic, environmental, social, and governance aspects, in order to create more livable and productive cities, towns, and villages ( (Rasoolimanesh , et al 2011).Urban Planning is a traditional tool in striking a balance between above different aspects, and promoting interaction between and among city planners, officials, and the local community (Diamantine &Zanon, 2000). Urban planning plays a key role in sustainable urban development. An appropriate sustainable urban development planning should be a response to the global changes and trends affecting cities, especially in the developing countries. (Rasoolimanesh et al 2011). 1.2 Indicator Frameworks for Sustainability: Frameworks are important to structure work on indicators and on underlying statistics, and to communicate results to information users. They can also be used to promote greater convergence of individual initiatives by providing a coherent framework that countries can easily implement and further adapt to their own needs sustainable development. Across the globe there is now a multitude of theoretical frameworks on which indicator-based sustainability assessment tool development can be grounded. Ideally, frameworks used for measuring sustainable development should(Giovannini& Linster ,2005): 1) Integrate the three dimensions of sustainable development; 2) Have sound conceptual foundations; 3) Capture key information needed to calculate selected indicators; 4) Help to clarify the relationships between different indicators and between indicators and policies 5) Among the key areas for progress is the further examination and development of approaches that help linking and combining environmental, social and economic indicators in existing sustainable development core sets, and those that can help in going beyond the indicators approach. This can be achieved by building both: a common conceptual framework and appropriate coherent statistical frameworks, including accounting tools. Sawsan Rasheed Mohammed 2 Assistant Professor Dept. of Civil Engineering University of Baghdad/College of Engineering Baghdad / Iraq Email: [email protected] Maysoon Abdullah Mansor 1 Assistant Lecturer Dept. of Civil Engineering University of Tikrit/College of Engineering Baghdad / Iraq Email: [email protected]
Transcript of Maysoon Abdullah Mansor & Dr.Sawsan Rasheed Mohammed:Developing Sustainable Urban Planning...
Maysoon Abdullah Mansor et. al. /International Journal of Modern Sciences and Engineering Technology (IJMSET)ISSN 2349-3755; Available at https://www.ijmset.com
Volume 2, Issue 3, 2015, pp.46-56
© IJMSET-Advanced Scientific Research Forum (ASRF), All Rights Reserved“IJMSET promotes research nature, Research nature enriches the world’s future”
46
Developing Sustainable Urban Planning Indicators Framework for IraqiCities by Using Content Analysis and Delphi Method
AbstractThis paper is part of a larger study regarding building an integrated framework for sustainable urbanplanning in Iraqi cities, where the study regions compass 15 urban Iraqi governorates. The study seeks to buildan integrated and comprehensive framework of urban sustainability that includes a list of indicators generallymatched Iraqi cities, taken as a basis for comparison between the urban areas as well as it contributes to themeasurement and evaluation of urban sustainability. Depending on the theoretical review, using SMARTapproach and interrelation between Delphi method and content analysis, the hierarchy framework was resultingwith three levels, level of dimensions(4 dimensions),level of categories (32 categories) and level of indicators(138 indicators ).
Keywords: Sustainable Urban Planning, Indicators Framework, Iraqi Cities , content analysis , Delphi method
1. INTRODUCTION:1.1 Sustainable urban Planning: The goal of sustainable urban development is the creation of anequal balance between the economic, environmental, social, and governance aspects, in order to createmore livable and productive cities, towns, and villages ( (Rasoolimanesh , et al 2011).Urban Planningis a traditional tool in striking a balance between above different aspects, and promoting interactionbetween and among city planners, officials, and the local community (Diamantine &Zanon, 2000).Urban planning plays a key role in sustainable urban development. An appropriate sustainable urbandevelopment planning should be a response to the global changes and trends affecting cities,especially in the developing countries. (Rasoolimanesh et al 2011).
1.2 Indicator Frameworks for Sustainability: Frameworks are important to structure work onindicators and on underlying statistics, and to communicate results to information users. They can alsobe used to promote greater convergence of individual initiatives by providing a coherent frameworkthat countries can easily implement and further adapt to their own needs sustainable development.Across the globe there is now a multitude of theoretical frameworks on which indicator-basedsustainability assessment tool development can be grounded. Ideally, frameworks used for measuringsustainable development should(Giovannini& Linster ,2005):
1) Integrate the three dimensions of sustainable development;2) Have sound conceptual foundations;3) Capture key information needed to calculate selected indicators;4) Help to clarify the relationships between different indicators and between indicators and policies5) Among the key areas for progress is the further examination and development of approaches that
help linking and combining environmental, social and economic indicators in existing sustainabledevelopment core sets, and those that can help in going beyond the indicators approach. This canbe achieved by building both: a common conceptual framework and appropriate coherentstatistical frameworks, including accounting tools.
Sawsan Rasheed Mohammed2
Assistant ProfessorDept. of Civil Engineering
University of Baghdad/College of EngineeringBaghdad / Iraq
Email: [email protected]
Maysoon Abdullah Mansor1
Assistant LecturerDept. of Civil Engineering
University of Tikrit/College of EngineeringBaghdad / Iraq
Email: [email protected]
Maysoon Abdullah Mansor et. al. /International Journal of Modern Sciences and Engineering Technology (IJMSET)ISSN 2349-3755; Available at https://www.ijmset.com
Volume 2, Issue 3, 2015, pp.46-56
© IJMSET-Advanced Scientific Research Forum (ASRF), All Rights Reserved“IJMSET promotes research nature, Research nature enriches the world’s future”
47
1.3The Delphi Method is an iterative process used to collect and distil the judgments of experts usinga series of questionnaires incorporating feedback from previous rounds of questions(Skulmoski et al,2007). The questionnaires are designed to focus on problems, opportunities, solutions, or forecasts.Each sub sequent questionnaire is developed based on the results of the previous questionnaire. Theprocess stops when the research question is answered, when consensus is reached. There is a four keyplanning and execution activities for a Delphi –namely as following below (Loo, 2002):
1)Problem Definition; In this paper the problem was to obtain a consensus about selection suitabledimensions and Indicators for urban planning in Iraqi cities.
2)Panel selection; In this paper, the researchers select experts who involved in urban planning,sustainable urban planning, architecture engineering, project management engineering.
3)Determining the panel size: While there is no sample size advocated for Delphi studies, rules–of–thumb(Martino,1972)suggest that(15-30)carefully selected could be used for heterogeneouspopulation and as few as (5-10) for a homogeneous population .According to (Adler &Ziglio,1996)the literature on this subject suggests that with a homogeneous group of experts good results can beobtained even with small panels of (10-15) individuals. Hasson et al.(2000) recommended that at least15 experts be included in a Delphi study. In this paper, after the researcher has selected the experts ,the questionnaires then distributed to (50) experts in Iraqi cities, the received respondent are (32).
4)Conducting the Delphi rounds.
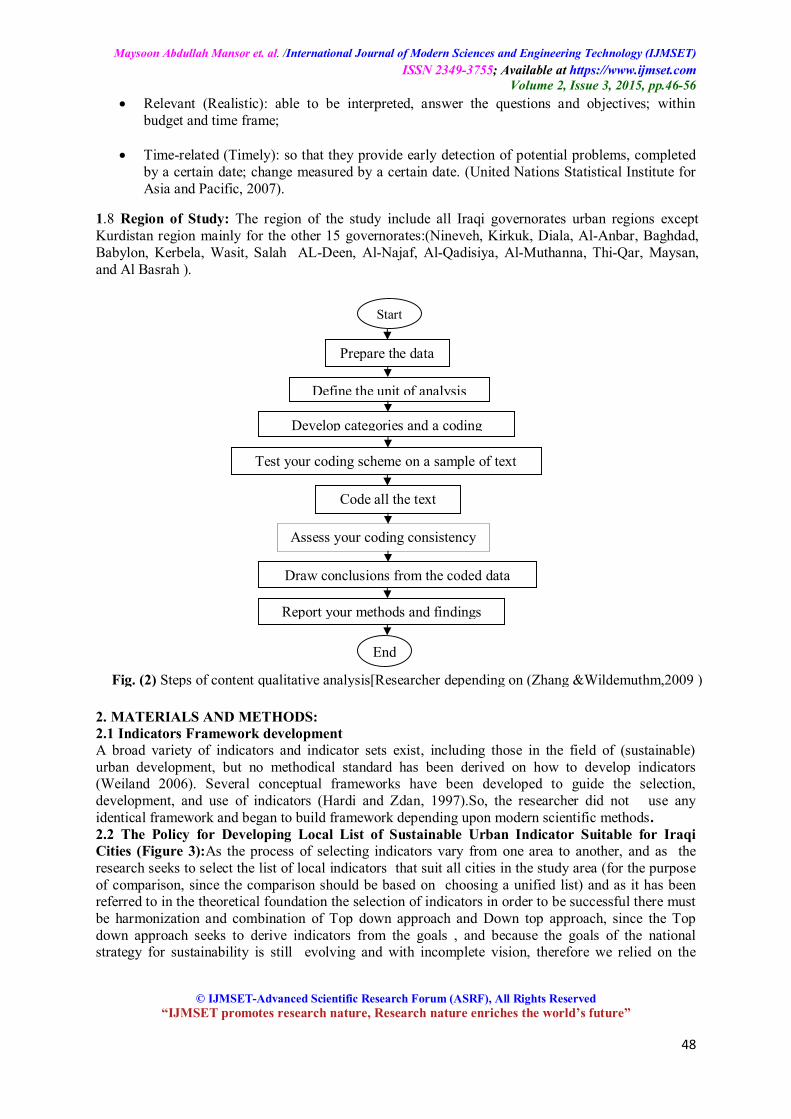
1.4Content Analysis: is a set of procedures for collecting and organizing information in astandardized format that allows analysts to make inferences about the characteristics andmeaning of written and other recorded material(Chelimsky 1989). Hsieh and Shannon (2005)discussed three approaches to qualitative content analysis, based on the degree of involvement ofinductive reasoning: Conventional Qualitative ;Directed Content Analysis; Summative ContentAnalysis. In this research the researcher used .Directed content analysis and some cases usedsummative analysis as will state in the next paragraphs. Steps for qualitative analysis of Content asshown in figure(2).
1.5Weighted Averages: in this paper we compute the average weight for weights of respondent sothe equation depending on(Simpson, 2010) becomes:
…………………………………………………..eq. (1) Where:
WA: the Weighted Averages for weights of respondent; Fi: number of respondents for each weight.
WI: weights Wi for each number; ∑Fi: the sum of all the respondents.
1.6 Relative Index Analysis: was used to rank the indicators according to their priorities (Olomolaiyeet. al 1987). The calculation was carried out using the following eq. (Kometa and Olomolaiye, 1997):
RII= ∑ w / AN………………………………………..……eq. (2) Where:RII: Relative Importance Index; W: weighting given to each indicators and categories by therespondents; A: highest weight (5 in this case) and N = total number of the sample.
1.7 SMART approach: An indicator must be SMART, namely (Byrne et al., 2010):· Specific(simple) : be clear , concise and avoid vague terms so that they are easily interpreted;· Measurable: quantifiable indicators to measure progress including repeatability and statistical
validity;· Achievable (Accessible): someone must be able to complete the objective;
Maysoon Abdullah Mansor et. al. /International Journal of Modern Sciences and Engineering Technology (IJMSET)ISSN 2349-3755; Available at https://www.ijmset.com
Volume 2, Issue 3, 2015, pp.46-56
© IJMSET-Advanced Scientific Research Forum (ASRF), All Rights Reserved“IJMSET promotes research nature, Research nature enriches the world’s future”
48
· Relevant (Realistic): able to be interpreted, answer the questions and objectives; withinbudget and time frame;
· Time-related (Timely): so that they provide early detection of potential problems, completedby a certain date; change measured by a certain date. (United Nations Statistical Institute forAsia and Pacific, 2007).
1.8 Region of Study: The region of the study include all Iraqi governorates urban regions exceptKurdistan region mainly for the other 15 governorates:(Nineveh, Kirkuk, Diala, Al-Anbar, Baghdad,Babylon, Kerbela, Wasit, Salah AL-Deen, Al-Najaf, Al-Qadisiya, Al-Muthanna, Thi-Qar, Maysan,and Al Basrah ).
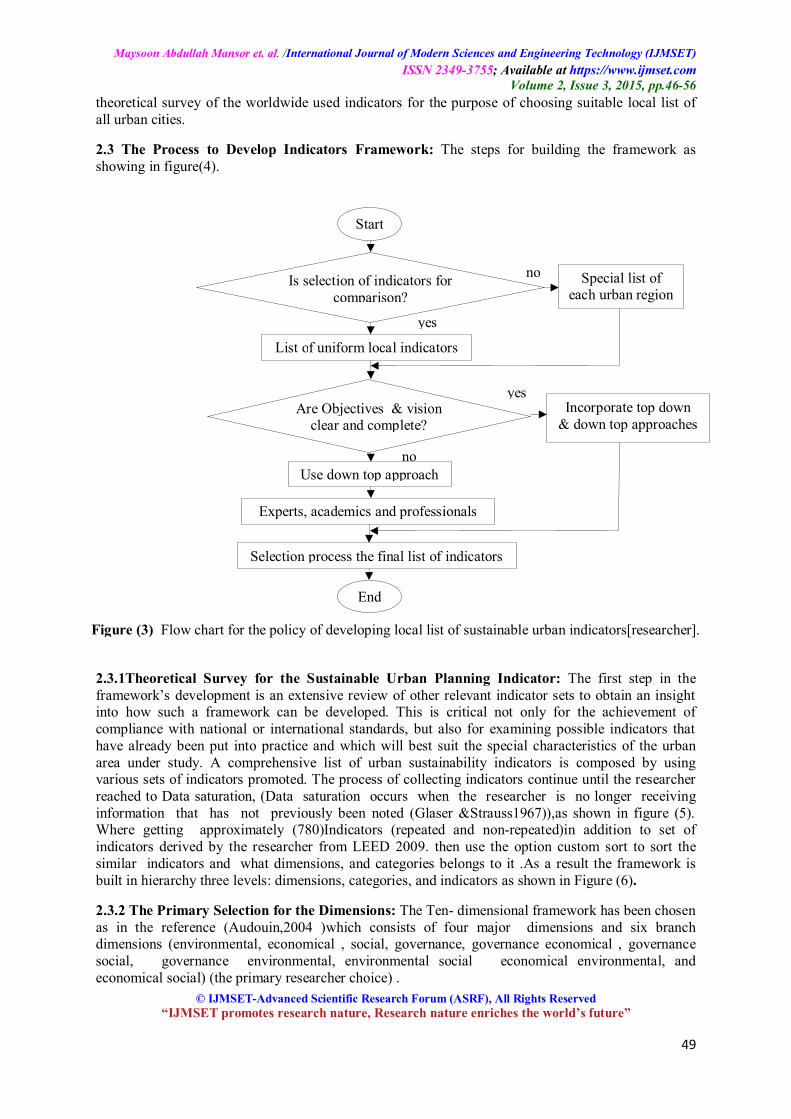
2. MATERIALS AND METHODS:2.1 Indicators Framework developmentA broad variety of indicators and indicator sets exist, including those in the field of (sustainable)urban development, but no methodical standard has been derived on how to develop indicators(Weiland 2006). Several conceptual frameworks have been developed to guide the selection,development, and use of indicators (Hardi and Zdan, 1997).So, the researcher did not use anyidentical framework and began to build framework depending upon modern scientific methods.2.2 The Policy for Developing Local List of Sustainable Urban Indicator Suitable for IraqiCities (Figure 3):As the process of selecting indicators vary from one area to another, and as theresearch seeks to select the list of local indicators that suit all cities in the study area (for the purposeof comparison, since the comparison should be based on choosing a unified list) and as it has beenreferred to in the theoretical foundation the selection of indicators in order to be successful there mustbe harmonization and combination of Top down approach and Down top approach, since the Topdown approach seeks to derive indicators from the goals , and because the goals of the nationalstrategy for sustainability is still evolving and with incomplete vision, therefore we relied on the
Fig. (2) Steps of content qualitative analysis[Researcher depending on (Zhang &Wildemuthm,2009 )
Start
Prepare the data
Define the unit of analysis
Develop categories and a coding
Test your coding scheme on a sample of text
Code all the text
Assess your coding consistency
Draw conclusions from the coded data
Report your methods and findings
End
Maysoon Abdullah Mansor et. al. /International Journal of Modern Sciences and Engineering Technology (IJMSET)ISSN 2349-3755; Available at https://www.ijmset.com
Volume 2, Issue 3, 2015, pp.46-56
© IJMSET-Advanced Scientific Research Forum (ASRF), All Rights Reserved“IJMSET promotes research nature, Research nature enriches the world’s future”
49
theoretical survey of the worldwide used indicators for the purpose of choosing suitable local list ofall urban cities.
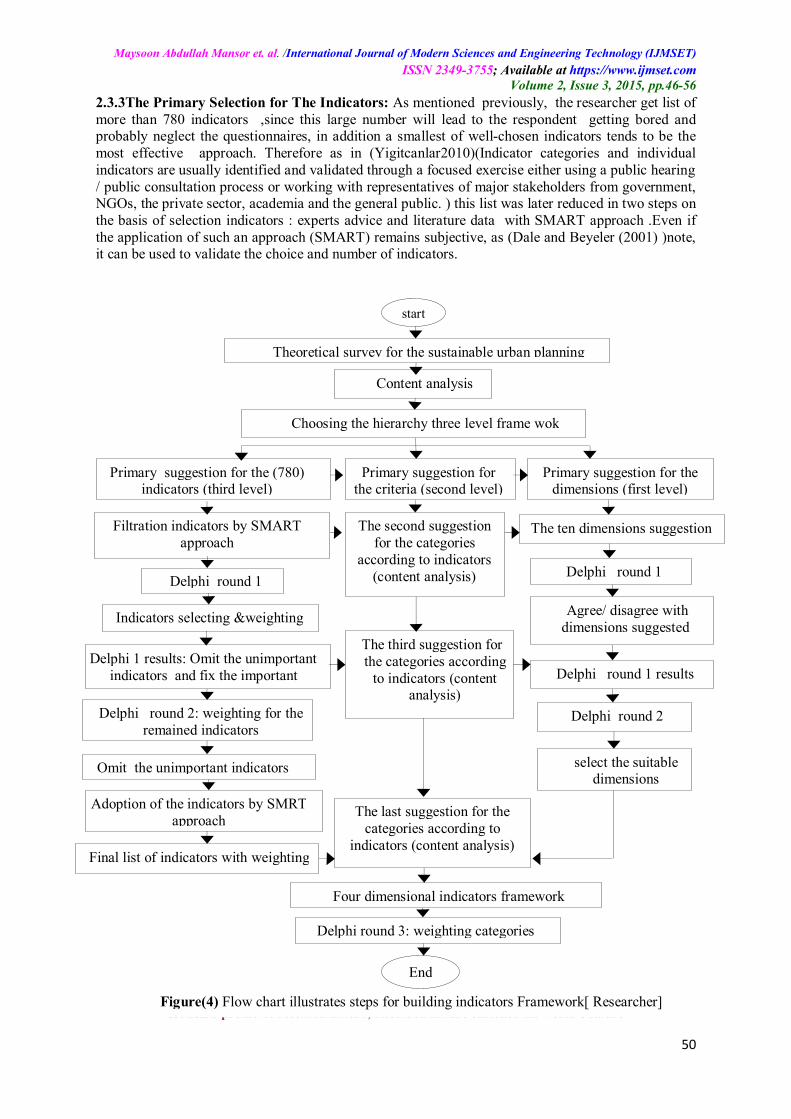
2.3 The Process to Develop Indicators Framework: The steps for building the framework asshowing in figure(4).
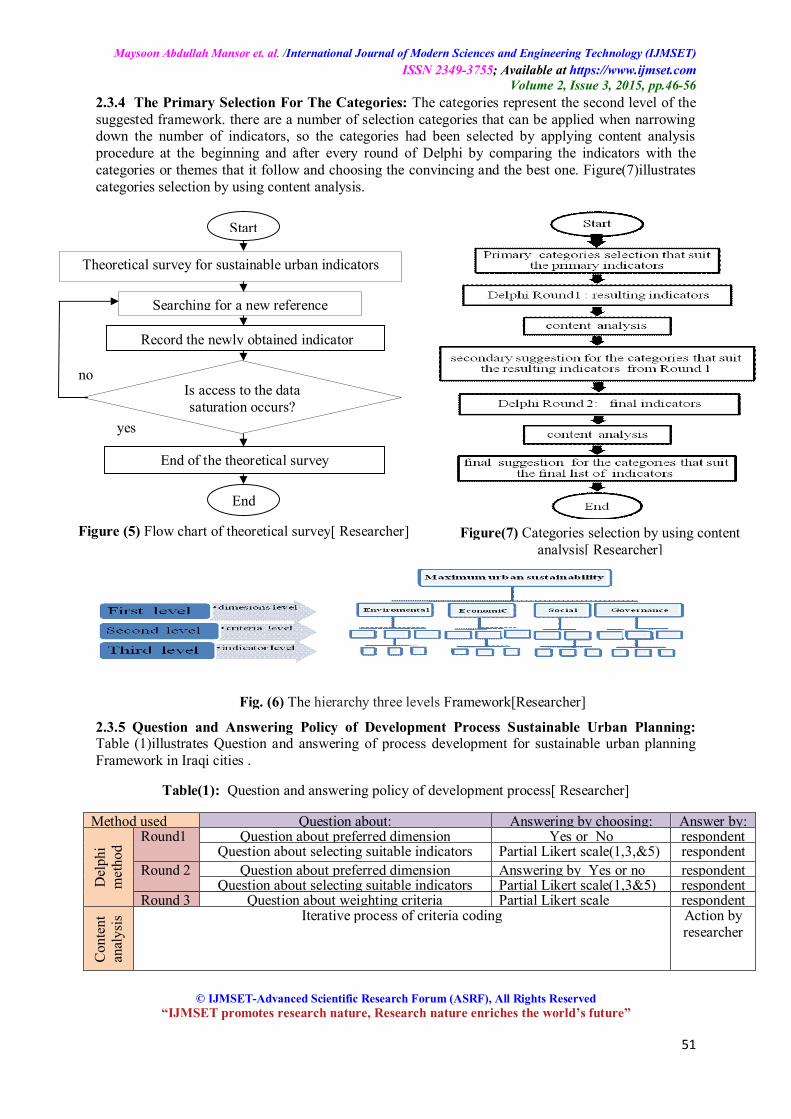
2.3.1Theoretical Survey for the Sustainable Urban Planning Indicator: The first step in theframework’s development is an extensive review of other relevant indicator sets to obtain an insightinto how such a framework can be developed. This is critical not only for the achievement ofcompliance with national or international standards, but also for examining possible indicators thathave already been put into practice and which will best suit the special characteristics of the urbanarea under study. A comprehensive list of urban sustainability indicators is composed by usingvarious sets of indicators promoted. The process of collecting indicators continue until the researcherreached to Data saturation, (Data saturation occurs when the researcher is no longer receivinginformation that has not previously been noted (Glaser &Strauss1967)),as shown in figure (5).Where getting approximately (780)Indicators (repeated and non-repeated)in addition to set ofindicators derived by the researcher from LEED 2009. then use the option custom sort to sort thesimilar indicators and what dimensions, and categories belongs to it .As a result the framework isbuilt in hierarchy three levels: dimensions, categories, and indicators as shown in Figure (6).
2.3.2 The Primary Selection for the Dimensions: The Ten- dimensional framework has been chosenas in the reference (Audouin,2004 )which consists of four major dimensions and six branchdimensions (environmental, economical , social, governance, governance economical , governancesocial, governance environmental, environmental social economical environmental, andeconomical social) (the primary researcher choice) .
no
no
yes
yesIncorporate top down
& down top approaches
Start
Is selection of indicators forcomparison?
Special list ofeach urban region
List of uniform local indicators
Are Objectives & visionclear and complete?
Use down top approach
Experts, academics and professionals
End
Selection process the final list of indicators
Figure (3) Flow chart for the policy of developing local list of sustainable urban indicators[researcher].
Maysoon Abdullah Mansor et. al. /International Journal of Modern Sciences and Engineering Technology (IJMSET)ISSN 2349-3755; Available at https://www.ijmset.com
Volume 2, Issue 3, 2015, pp.46-56
© IJMSET-Advanced Scientific Research Forum (ASRF), All Rights Reserved“IJMSET promotes research nature, Research nature enriches the world’s future”
50
2.3.3The Primary Selection for The Indicators: As mentioned previously, the researcher get list ofmore than 780 indicators ,since this large number will lead to the respondent getting bored andprobably neglect the questionnaires, in addition a smallest of well-chosen indicators tends to be themost effective approach. Therefore as in (Yigitcanlar2010)(Indicator categories and individualindicators are usually identified and validated through a focused exercise either using a public hearing/ public consultation process or working with representatives of major stakeholders from government,NGOs, the private sector, academia and the general public. ) this list was later reduced in two steps onthe basis of selection indicators : experts advice and literature data with SMART approach .Even ifthe application of such an approach (SMART) remains subjective, as (Dale and Beyeler (2001) )note,it can be used to validate the choice and number of indicators.
The ten dimensions suggestion
Theoretical survey for the sustainable urban planning
Content analysis
Choosing the hierarchy three level frame wok
Primary suggestion for the (780)indicators (third level)
Primary suggestion forthe criteria (second level)
Primary suggestion for thedimensions (first level)
Filtration indicators by SMARTapproach
The second suggestionfor the categories
according to indicators(content analysis) Delphi round 1
Indicators selecting &weighting Agree/ disagree withdimensions suggested
Delphi round 1
Delphi 1 results: Omit the unimportantindicators and fix the important
The third suggestion forthe categories according
to indicators (contentanalysis)
Four dimensional indicators framework
Omit the unimportant indicators select the suitabledimensions
The last suggestion for thecategories according to
indicators (content analysis)Final list of indicators with weighting
Adoption of the indicators by SMRTapproach
Delphi round 1 results
Delphi round 3: weighting categories
Delphi round 2Delphi round 2: weighting for theremained indicators
Figure(4) Flow chart illustrates steps for building indicators Framework[ Researcher]
start
End
Maysoon Abdullah Mansor et. al. /International Journal of Modern Sciences and Engineering Technology (IJMSET)ISSN 2349-3755; Available at https://www.ijmset.com
Volume 2, Issue 3, 2015, pp.46-56
© IJMSET-Advanced Scientific Research Forum (ASRF), All Rights Reserved“IJMSET promotes research nature, Research nature enriches the world’s future”
51
2.3.4 The Primary Selection For The Categories: The categories represent the second level of thesuggested framework. there are a number of selection categories that can be applied when narrowingdown the number of indicators, so the categories had been selected by applying content analysisprocedure at the beginning and after every round of Delphi by comparing the indicators with thecategories or themes that it follow and choosing the convincing and the best one. Figure(7)illustratescategories selection by using content analysis.
2.3.5 Question and Answering Policy of Development Process Sustainable Urban Planning:Table (1)illustrates Question and answering of process development for sustainable urban planningFramework in Iraqi cities .
Table(1): Question and answering policy of development process[ Researcher]
Method used Question about: Answering by choosing: Answer by:
Del
phi
met
hod
Round1 Question about preferred dimension Yes or No respondentQuestion about selecting suitable indicators Partial Likert scale(1,3,&5) respondent
Round 2 Question about preferred dimension Answering by Yes or no respondentQuestion about selecting suitable indicators Partial Likert scale(1,3&5) respondent
Round 3 Question about weighting criteria Partial Likert scale respondent
Con
tent
anal
ysis Iterative process of criteria coding Action by
researcher
Fig. (6) The hierarchy three levels Framework[Researcher]
Figure(7) Categories selection by using contentanalysis[ Researcher]
Start
End
Theoretical survey for sustainable urban indicators
Searching for a new reference
Record the newly obtained indicator
End of the theoretical survey
Is access to the datasaturation occurs?
yes
no
Figure (5) Flow chart of theoretical survey[ Researcher]
Maysoon Abdullah Mansor et. al. /International Journal of Modern Sciences and Engineering Technology (IJMSET)ISSN 2349-3755; Available at https://www.ijmset.com
Volume 2, Issue 3, 2015, pp.46-56
© IJMSET-Advanced Scientific Research Forum (ASRF), All Rights Reserved“IJMSET promotes research nature, Research nature enriches the world’s future”
52
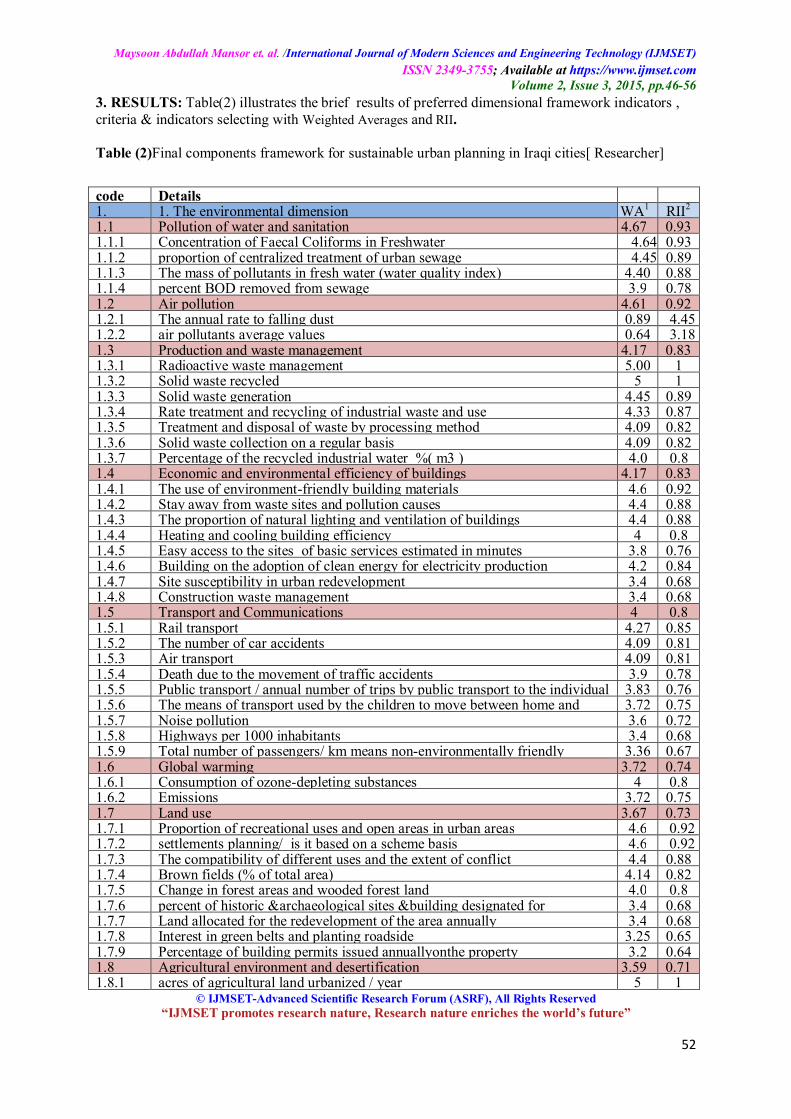
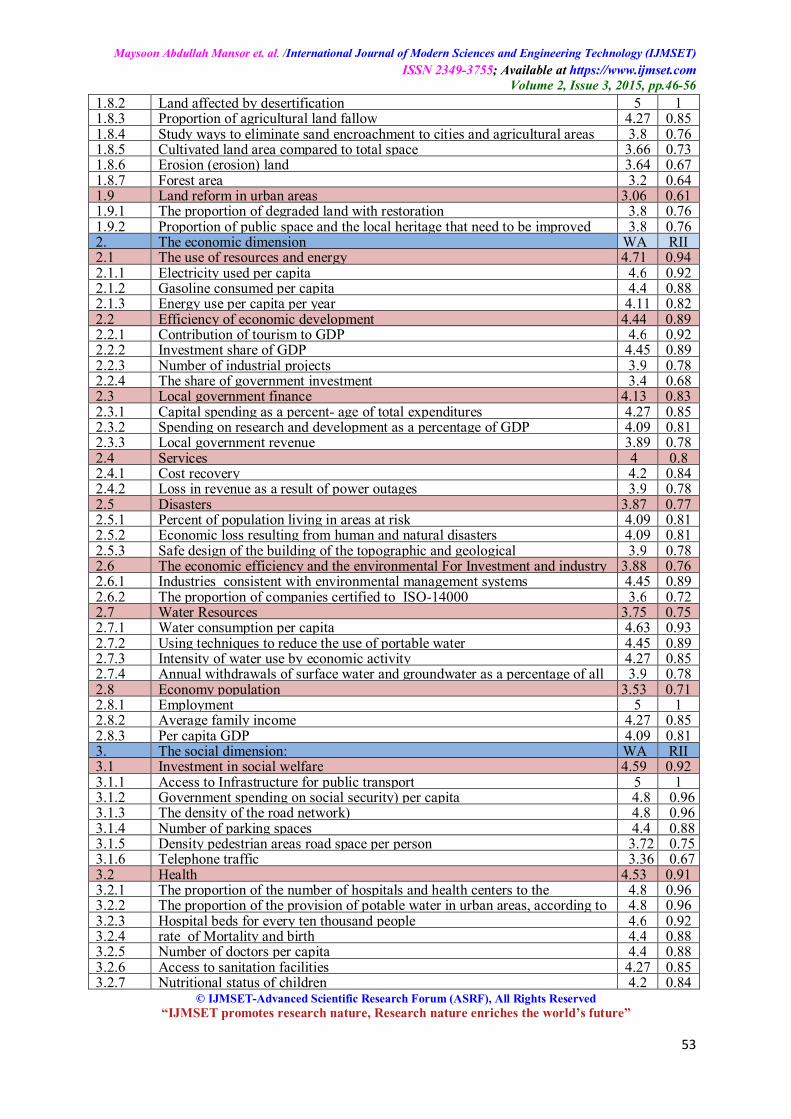
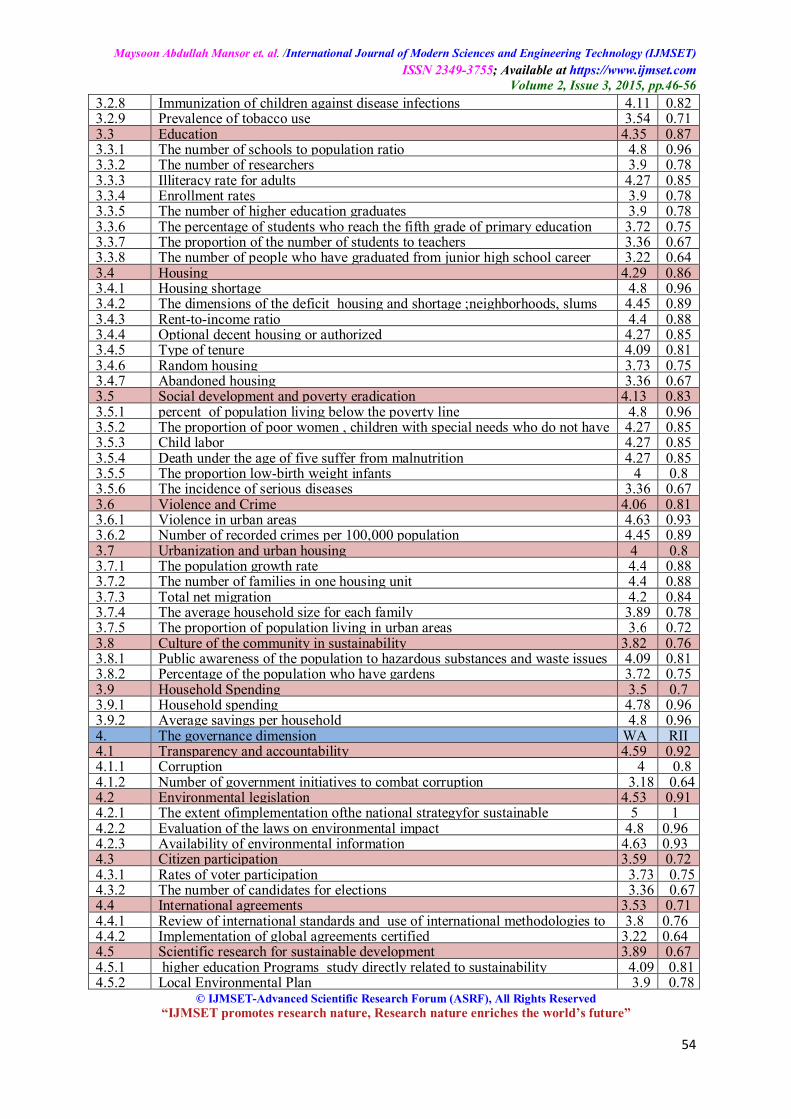
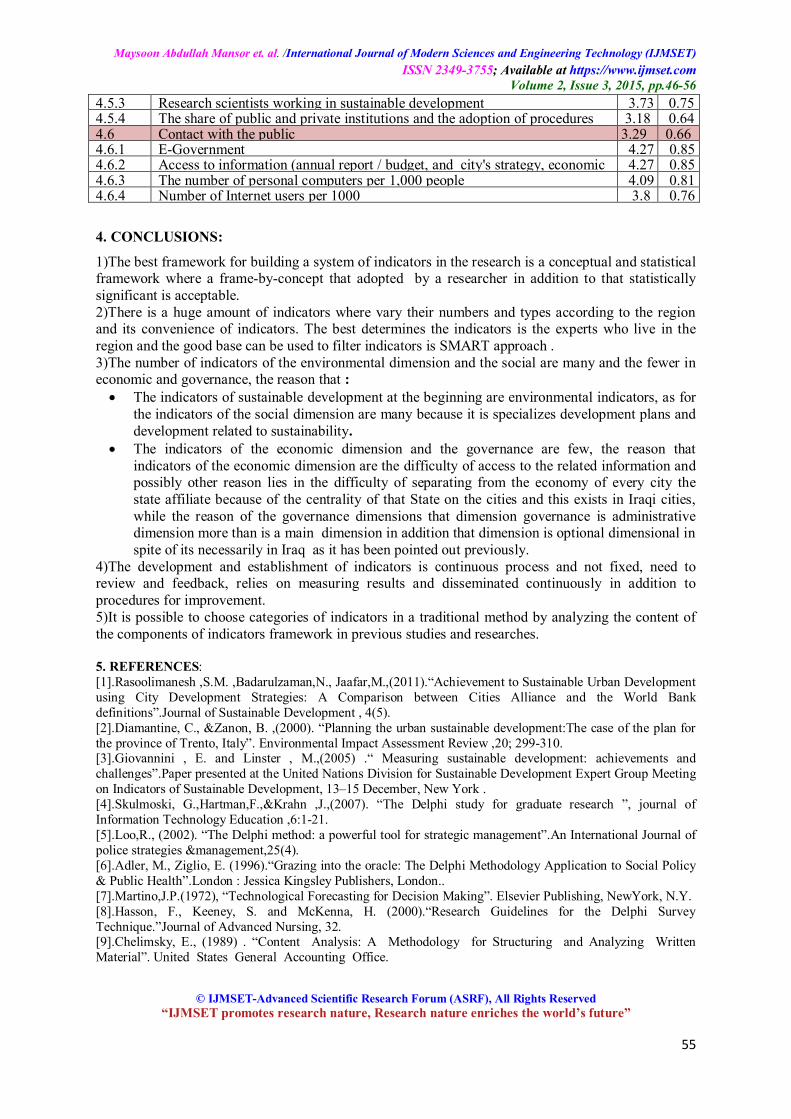
3. RESULTS: Table(2) illustrates the brief results of preferred dimensional framework indicators ,criteria & indicators selecting with Weighted Averages and RII.
Table (2)Final components framework for sustainable urban planning in Iraqi cities[ Researcher]
code Details1. 1. The environmental dimension WA1 RII2
1.1 Pollution of water and sanitation 4.67 0.931.1.1 Concentration of Faecal Coliforms in Freshwater 4.64 0.931.1.2 proportion of centralized treatment of urban sewage 4.45 0.891.1.3 The mass of pollutants in fresh water (water quality index) 4.40 0.881.1.4 percent BOD removed from sewage 3.9 0.781.2 Air pollution 4.61 0.921.2.1 The annual rate to falling dust 0.89 4.451.2.2 air pollutants average values 0.64 3.181.3 Production and waste management 4.17 0.831.3.1 Radioactive waste management 5.00 11.3.2 Solid waste recycled 5 11.3.3 Solid waste generation 4.45 0.891.3.4 Rate treatment and recycling of industrial waste and use 4.33 0.871.3.5 Treatment and disposal of waste by processing method 4.09 0.821.3.6 Solid waste collection on a regular basis 4.09 0.821.3.7 Percentage of the recycled industrial water %( m3 ) 4.0 0.81.4 Economic and environmental efficiency of buildings 4.17 0.831.4.1 The use of environment-friendly building materials 4.6 0.921.4.2 Stay away from waste sites and pollution causes 4.4 0.881.4.3 The proportion of natural lighting and ventilation of buildings 4.4 0.881.4.4 Heating and cooling building efficiency 4 0.81.4.5 Easy access to the sites of basic services estimated in minutes 3.8 0.761.4.6 Building on the adoption of clean energy for electricity production 4.2 0.841.4.7 Site susceptibility in urban redevelopment 3.4 0.681.4.8 Construction waste management 3.4 0.681.5 Transport and Communications 4 0.81.5.1 Rail transport 4.27 0.851.5.2 The number of car accidents 4.09 0.811.5.3 Air transport 4.09 0.811.5.4 Death due to the movement of traffic accidents 3.9 0.781.5.5 Public transport / annual number of trips by public transport to the individual 3.83 0.761.5.6 The means of transport used by the children to move between home and 3.72 0.751.5.7 Noise pollution 3.6 0.721.5.8 Highways per 1000 inhabitants 3.4 0.681.5.9 Total number of passengers/ km means non-environmentally friendly 3.36 0.671.6 Global warming 3.72 0.741.6.1 Consumption of ozone-depleting substances 4 0.81.6.2 Emissions 3.72 0.751.7 Land use 3.67 0.731.7.1 Proportion of recreational uses and open areas in urban areas 4.6 0.921.7.2 settlements planning/ is it based on a scheme basis 4.6 0.921.7.3 The compatibility of different uses and the extent of conflict 4.4 0.881.7.4 Brown fields (% of total area) 4.14 0.821.7.5 Change in forest areas and wooded forest land 4.0 0.81.7.6 percent of historic &archaeological sites &building designated for 3.4 0.681.7.7 Land allocated for the redevelopment of the area annually 3.4 0.681.7.8 Interest in green belts and planting roadside 3.25 0.651.7.9 Percentage of building permits issued annuallyonthe property 3.2 0.641.8 Agricultural environment and desertification 3.59 0.711.8.1 acres of agricultural land urbanized / year 5 1
Maysoon Abdullah Mansor et. al. /International Journal of Modern Sciences and Engineering Technology (IJMSET)ISSN 2349-3755; Available at https://www.ijmset.com
Volume 2, Issue 3, 2015, pp.46-56
© IJMSET-Advanced Scientific Research Forum (ASRF), All Rights Reserved“IJMSET promotes research nature, Research nature enriches the world’s future”
53
1.8.2 Land affected by desertification 5 11.8.3 Proportion of agricultural land fallow 4.27 0.851.8.4 Study ways to eliminate sand encroachment to cities and agricultural areas 3.8 0.761.8.5 Cultivated land area compared to total space 3.66 0.731.8.6 Erosion (erosion) land 3.64 0.671.8.7 Forest area 3.2 0.641.9 Land reform in urban areas 3.06 0.611.9.1 The proportion of degraded land with restoration 3.8 0.761.9.2 Proportion of public space and the local heritage that need to be improved 3.8 0.762. The economic dimension WA RII2.1 The use of resources and energy 4.71 0.942.1.1 Electricity used per capita 4.6 0.922.1.2 Gasoline consumed per capita 4.4 0.882.1.3 Energy use per capita per year 4.11 0.822.2 Efficiency of economic development 4.44 0.892.2.1 Contribution of tourism to GDP 4.6 0.922.2.2 Investment share of GDP 4.45 0.892.2.3 Number of industrial projects 3.9 0.782.2.4 The share of government investment 3.4 0.682.3 Local government finance 4.13 0.832.3.1 Capital spending as a percent- age of total expenditures 4.27 0.852.3.2 Spending on research and development as a percentage of GDP 4.09 0.812.3.3 Local government revenue 3.89 0.782.4 Services 4 0.82.4.1 Cost recovery 4.2 0.842.4.2 Loss in revenue as a result of power outages 3.9 0.782.5 Disasters 3.87 0.772.5.1 Percent of population living in areas at risk 4.09 0.812.5.2 Economic loss resulting from human and natural disasters 4.09 0.812.5.3 Safe design of the building of the topographic and geological 3.9 0.782.6 The economic efficiency and the environmental For Investment and industry 3.88 0.762.6.1 Industries consistent with environmental management systems 4.45 0.892.6.2 The proportion of companies certified to ISO-14000 3.6 0.722.7 Water Resources 3.75 0.752.7.1 Water consumption per capita 4.63 0.932.7.2 Using techniques to reduce the use of portable water 4.45 0.892.7.3 Intensity of water use by economic activity 4.27 0.852.7.4 Annual withdrawals of surface water and groundwater as a percentage of all 3.9 0.782.8 Economy population 3.53 0.712.8.1 Employment 5 12.8.2 Average family income 4.27 0.852.8.3 Per capita GDP 4.09 0.813. The social dimension: WA RII3.1 Investment in social welfare 4.59 0.923.1.1 Access to Infrastructure for public transport 5 13.1.2 Government spending on social security) per capita 4.8 0.963.1.3 The density of the road network) 4.8 0.963.1.4 Number of parking spaces 4.4 0.883.1.5 Density pedestrian areas road space per person 3.72 0.753.1.6 Telephone traffic 3.36 0.673.2 Health 4.53 0.913.2.1 The proportion of the number of hospitals and health centers to the 4.8 0.963.2.2 The proportion of the provision of potable water in urban areas, according to 4.8 0.963.2.3 Hospital beds for every ten thousand people 4.6 0.923.2.4 rate of Mortality and birth 4.4 0.883.2.5 Number of doctors per capita 4.4 0.883.2.6 Access to sanitation facilities 4.27 0.853.2.7 Nutritional status of children 4.2 0.84
Maysoon Abdullah Mansor et. al. /International Journal of Modern Sciences and Engineering Technology (IJMSET)ISSN 2349-3755; Available at https://www.ijmset.com
Volume 2, Issue 3, 2015, pp.46-56
© IJMSET-Advanced Scientific Research Forum (ASRF), All Rights Reserved“IJMSET promotes research nature, Research nature enriches the world’s future”
54
3.2.8 Immunization of children against disease infections 4.11 0.823.2.9 Prevalence of tobacco use 3.54 0.713.3 Education 4.35 0.873.3.1 The number of schools to population ratio 4.8 0.963.3.2 The number of researchers 3.9 0.783.3.3 Illiteracy rate for adults 4.27 0.853.3.4 Enrollment rates 3.9 0.783.3.5 The number of higher education graduates 3.9 0.783.3.6 The percentage of students who reach the fifth grade of primary education 3.72 0.753.3.7 The proportion of the number of students to teachers 3.36 0.673.3.8 The number of people who have graduated from junior high school career 3.22 0.643.4 Housing 4.29 0.863.4.1 Housing shortage 4.8 0.963.4.2 The dimensions of the deficit housing and shortage ;neighborhoods, slums 4.45 0.893.4.3 Rent-to-income ratio 4.4 0.883.4.4 Optional decent housing or authorized 4.27 0.853.4.5 Type of tenure 4.09 0.813.4.6 Random housing 3.73 0.753.4.7 Abandoned housing 3.36 0.673.5 Social development and poverty eradication 4.13 0.833.5.1 percent of population living below the poverty line 4.8 0.963.5.2 The proportion of poor women , children with special needs who do not have 4.27 0.853.5.3 Child labor 4.27 0.853.5.4 Death under the age of five suffer from malnutrition 4.27 0.853.5.5 The proportion low-birth weight infants 4 0.83.5.6 The incidence of serious diseases 3.36 0.673.6 Violence and Crime 4.06 0.813.6.1 Violence in urban areas 4.63 0.933.6.2 Number of recorded crimes per 100,000 population 4.45 0.893.7 Urbanization and urban housing 4 0.83.7.1 The population growth rate 4.4 0.883.7.2 The number of families in one housing unit 4.4 0.883.7.3 Total net migration 4.2 0.843.7.4 The average household size for each family 3.89 0.783.7.5 The proportion of population living in urban areas 3.6 0.723.8 Culture of the community in sustainability 3.82 0.763.8.1 Public awareness of the population to hazardous substances and waste issues 4.09 0.813.8.2 Percentage of the population who have gardens 3.72 0.753.9 Household Spending 3.5 0.73.9.1 Household spending 4.78 0.963.9.2 Average savings per household 4.8 0.964. The governance dimension WA RII4.1 Transparency and accountability 4.59 0.924.1.1 Corruption 4 0.84.1.2 Number of government initiatives to combat corruption 3.18 0.644.2 Environmental legislation 4.53 0.914.2.1 The extent ofimplementation ofthe national strategyfor sustainable 5 14.2.2 Evaluation of the laws on environmental impact 4.8 0.964.2.3 Availability of environmental information 4.63 0.934.3 Citizen participation 3.59 0.724.3.1 Rates of voter participation 3.73 0.754.3.2 The number of candidates for elections 3.36 0.674.4 International agreements 3.53 0.714.4.1 Review of international standards and use of international methodologies to 3.8 0.764.4.2 Implementation of global agreements certified 3.22 0.644.5 Scientific research for sustainable development 3.89 0.674.5.1 higher education Programs study directly related to sustainability 4.09 0.814.5.2 Local Environmental Plan 3.9 0.78
Maysoon Abdullah Mansor et. al. /International Journal of Modern Sciences and Engineering Technology (IJMSET)ISSN 2349-3755; Available at https://www.ijmset.com
Volume 2, Issue 3, 2015, pp.46-56
© IJMSET-Advanced Scientific Research Forum (ASRF), All Rights Reserved“IJMSET promotes research nature, Research nature enriches the world’s future”
55
4. CONCLUSIONS:
1)The best framework for building a system of indicators in the research is a conceptual and statisticalframework where a frame-by-concept that adopted by a researcher in addition to that statisticallysignificant is acceptable.2)There is a huge amount of indicators where vary their numbers and types according to the regionand its convenience of indicators. The best determines the indicators is the experts who live in theregion and the good base can be used to filter indicators is SMART approach .3)The number of indicators of the environmental dimension and the social are many and the fewer ineconomic and governance, the reason that :· The indicators of sustainable development at the beginning are environmental indicators, as for
the indicators of the social dimension are many because it is specializes development plans anddevelopment related to sustainability.
· The indicators of the economic dimension and the governance are few, the reason thatindicators of the economic dimension are the difficulty of access to the related information andpossibly other reason lies in the difficulty of separating from the economy of every city thestate affiliate because of the centrality of that State on the cities and this exists in Iraqi cities,while the reason of the governance dimensions that dimension governance is administrativedimension more than is a main dimension in addition that dimension is optional dimensional inspite of its necessarily in Iraq as it has been pointed out previously.
4)The development and establishment of indicators is continuous process and not fixed, need toreview and feedback, relies on measuring results and disseminated continuously in addition toprocedures for improvement.5)It is possible to choose categories of indicators in a traditional method by analyzing the content ofthe components of indicators framework in previous studies and researches.
5. REFERENCES:[1].Rasoolimanesh ,S.M. ,Badarulzaman,N., Jaafar,M.,(2011).“Achievement to Sustainable Urban Developmentusing City Development Strategies: A Comparison between Cities Alliance and the World Bankdefinitions”.Journal of Sustainable Development , 4(5).[2].Diamantine, C., &Zanon, B. ,(2000). “Planning the urban sustainable development:The case of the plan forthe province of Trento, Italy”. Environmental Impact Assessment Review ,20; 299-310.[3].Giovannini , E. and Linster , M.,(2005) .“ Measuring sustainable development: achievements andchallenges”.Paper presented at the United Nations Division for Sustainable Development Expert Group Meetingon Indicators of Sustainable Development, 13–15 December, New York .[4].Skulmoski, G.,Hartman,F.,&Krahn ,J.,(2007). “The Delphi study for graduate research ”, journal ofInformation Technology Education ,6:1-21.[5].Loo,R., (2002). “The Delphi method: a powerful tool for strategic management”.An International Journal ofpolice strategies &management,25(4).[6].Adler, M., Ziglio, E. (1996).“Grazing into the oracle: The Delphi Methodology Application to Social Policy& Public Health”.London : Jessica Kingsley Publishers, London..[7].Martino,J.P.(1972), “Technological Forecasting for Decision Making”. Elsevier Publishing, NewYork, N.Y.[8].Hasson, F., Keeney, S. and McKenna, H. (2000).“Research Guidelines for the Delphi SurveyTechnique.”Journal of Advanced Nursing, 32.[9].Chelimsky, E., (1989) . “Content Analysis: A Methodology for Structuring and Analyzing WrittenMaterial”. United States General Accounting Office.
4.5.3 Research scientists working in sustainable development 3.73 0.754.5.4 The share of public and private institutions and the adoption of procedures 3.18 0.644.6 Contact with the public 3.29 0.664.6.1 E-Government 4.27 0.854.6.2 Access to information (annual report / budget, and city's strategy, economic 4.27 0.854.6.3 The number of personal computers per 1,000 people 4.09 0.814.6.4 Number of Internet users per 1000 3.8 0.76
Maysoon Abdullah Mansor et. al. /International Journal of Modern Sciences and Engineering Technology (IJMSET)ISSN 2349-3755; Available at https://www.ijmset.com
Volume 2, Issue 3, 2015, pp.46-56
© IJMSET-Advanced Scientific Research Forum (ASRF), All Rights Reserved“IJMSET promotes research nature, Research nature enriches the world’s future”
56
[10].Hsieh, H.-F., & Shannon, S.E. (2005). “Three approaches to qualitative content analysis”. QualitativeHealth Research , 15(9).[11].Simpson,D.G. ,( 2010). “Weighted Averages”. Available at http:// www. pgccphy. net/ref/weightave.pdf.[12].Olomolaiye, P. O. et al., (1987). “ Problems Influencing Craftsmen’s Productivity in Nigeria”. Building andEnvironment,22(4): 317-323.[13].KometaS.T.,andOlomolaiye,P.O.,(1997). “ Evaluation of factors influencing construction client’ decision tobuild”. ASCE Journal of Management in Engineering,13 (2);77-85.[14].Byrne, S., Wallis, A., Graymore, M.,O’Toole, K.,( 2010 ). “ Integrating Regional Sustainability Program:Indicators Guide for Victoria Background Report”. Published by Deakin University, Geelong, Victoria,Australia.Available at www.deakin.edu.au/kmd.[15].United Nations Statistical Institute for Asia and Pacific.(2007). “Building administrative data systems forstatistical purposes-addressing training issues and needs of countries”. Bangkok, Thailand.[16].Weiland,U.(2006).“Sustainability Indicators and Sustainable Development”. In: Wuyi, W.,Krafft, T.,Kraas, F.(eds). Global Change,Urbanizationand Health. China Meteorological Press,Beijing; pp. 241 – 250.[17].Hardi, P. and Zdan, T. (1997). “Assessing sustainable development: principles in practice”.InternationalInstitute for Sustainable Development, Winnipeg[18].Glaser, B. G., & Strauss, A. L. (1967).“Discovery of grounded theory: Strategies for qualitative research”.Chicago: AldinePub. Co..[19].Audouin, Michelle; Muller Elizabeth and; Neal, Marian, (2004).“ City of Cape Town Sustainability Report:Phase 1 Draft Set of Indicators”. Prepared by CSIR Division of Water, Environment and Forestry Technologyfor Environmental Management Department, City of Cape Town.[20].Yigitcanlar, T. and Dur ,F.,(2010).“ Developing a Sustainability Assessment Model: The SustainableInfrastructure, Land-Use, Environment and Transport Model”. Sustainability; 2(1): 321-340.[21].Dale, V.H. &Beyeler, S.C.( 2001). “Challenges in the development and use of ecological indicators”.Ecological Indicators, vol. 1, pp. 3-10.
AUTHOR’S BRIEF BIOGRAPHY
Asst.Prof.Dr.Sawsan Rasheed Mohammed (PhD Construction Project Management):She is an Assistant Professor in the Department of Civil Engineering, College ofEngineering, University of Baghdad (Baghdad, Iraq). A lecturer of under-graduate andpost-graduate courses (MSc and PhD) and a research supervisor for higher studiesstudents in the field of Construction Project Management.
.
Asst. Lecturer Maysoon Abdullah Mansor (MSc Construction ProjectManagement): She is an assistant Lecturer in project management courses in theDepartment of Civil Engineering., College of Engineering, Tikrit University (Salah AL-Deen, Iraq). Currently a PhD student..