MAY 2020 MATHEMATICAL LITERACY PARTICIPANTS' GUIDE
69
1 SSIP APRIL – MAY 2020 MATHEMATICAL LITERACY PARTICIPANTS’ GUIDE
-
Upload
khangminh22 -
Category
Documents
-
view
0 -
download
0
Transcript of MAY 2020 MATHEMATICAL LITERACY PARTICIPANTS' GUIDE

1
SSIP APRIL – MAY 2020
MATHEMATICAL LITERACY
PARTICIPANTS’ GUIDE

2
© COPYRIGHT
This work is protected by the Copyright Act 98 of 1978. No part of this work may be reproduced or
transmitted in any form or by any means, electronic or mechanical, including photocopying, recording
or by any information storage and retrieval system, without permission in writing from Matthew
Goniwe School of Leadership and Governance.
Whilst every effort has been made to ensure that the information published in this work is accurate,
Matthew Goniwe School of Leadership and Governance takes no responsibility for any loss or damage
suffered by any person as a result of the reliance upon the information contained therein.
TABLE OF CONTENTS
NO. PREAMBLE PAGE
A Foreword 2
B Purpose 3
C SSIP Aims/goals 3
D SSIP Objectives 3
E Learning Assumed to be in place 3
F Target Audience 3
G Notional Hours 4
H Course Design and Assessment Strategy 4
I Course outline/Map 4
J Table of Icons 5
K Table of Acronyms and Abbreviations 6
L Term ATP 6
M Course Timetable 6
Module 1: Maps, Plans and Other Representation of the Physical World 8
Unit 1 Scale 9 – 15
Unit 2 Maps and Scale 16 – 31
Unit 3 Elevations and Floor Plan 32 – 43
Module 2: Measurements 44
Unit 1 Conversions, measuring time, timetables and speed 45 - 49
Unit 2 Two-Dimensional Measurement 50 – 58
Unit 3 Three-Dimensional Measurement 59 – 69
A. FOREWORD
This document is the result of the Just in Time Secondary School Intervention Programme (JIT SSIP)
which is an intervention programme for FET teachers in the Gauteng Department Education (GDE) in
collaboration with Matthew Goniwe School of Leadership and Governance (MGSLG).

3
B. PURPOSE
The purpose of this programme is professional development of FET teachers who are currently
teaching in the school FET phase of the education system. The programme is aligned to the strategic
goals of the GDE which focuses on improving the teaching and learning practice in the most
classrooms through capacitation of teachers on Content, Pedagogy, and Assessment and ICT
integration.
C. SSIP AIMS/GOALS
The SSIP programme aims at professional development for Grade 10-12 teachers in the application of
effective teaching and reflective practice to improve learner performance on the identified Grade 12
examinable topics. The overall goal for SSIP is to provide teachers with professional expertise, tools
and skills to spot student learning difficulties and decide on the course of action.
SSIP came about as result of the diagnostic needs that are identified through the end of the year NSC
examination student learning data. In response to this design and development of teaching resources
are developed to train teachers on the learner needs.
The four interconnected outcomes that drive the professional development activities for SSIP are:
• Enhancing Teachers knowledge: deep understanding of subject matter knowledge and students ideas on the content
• Enhancing quality teaching and assessment for learning: effective instructional approaches that teachers may use to ensure improved understanding by most learners.
• Developing ICT integration skills :Use of ICT to improve teaching and learning
• Building professional learning communities: allow teachers to start collaborating and form professional networks in non-formal settings in context of their schools
D. SSIP OBJECTIVES
By the end of the workshop teachers should be able to:
• have mastered and understood all aspects related to Measurement, Maps and Scales within
the FET Mathematical Curriculum
• utilise ICT integration and encourage interactive lessons in teaching and learning
E. LEARNING ASSUMED TO BE IN PLACE
Participants are qualified teachers with a qualification in teaching at NQF 4 or above and teaching Mathematical Literacy.
F. TARGET AUDIENCE
Teachers who were identified through the 2019 NSC results, diagnostics report, and needs analyses of
the teacher in the Integrated Quality Management System (IQMS) who teaching Mathematical
Literacy in target schools. The course is aimed at professional development to improve learner
performance in Mathematics Literacy.

4
G. NOTIONAL HOURS:
The time required to successful completion has been allocated as follows:
Contact face to face session 17, 5 hours
Pre Test 1 hour
Day 2 : Content Practice and Demonstration 10,5 hours
Day 3: Content Practice and Demonstration 5 hours
Post Test 1 hour
H. COURSE DESIGN AND ASSESSMENT STRATEGY
• The envisaged course focuses on four modules with at least two units each viz.
✓ Module 1: Maps Plans and Other Representations of the Physical World
✓ Module 2: Measurement
• Teachers will be subjected to the variety of content knowledge, formative activities to
consolidate the content learnt, Pre-test at the beginning of each workshop session to further
verify content gaps and post-test in the last session.
• Pre-Post Test data will be used to monitor what learning has taken place in the 3 days of the
session and workshop activities will also be used to support participant on subject matter
knowledge
I. COURSE OUTLINE/ MAP
Module 1 : Maps, Plans and Other Representations of the Physical World
Objectives/Outcomes Units
• Work with different types of scales on maps
• Work with scales on maps
• Calculate actual length and distance when map is known
• Calculate map measurements when actual lengths and distances are known using a given scale
• Determine the scale in which a map has been drawn in the form 1: ----- and use the scale to determine other dimensions on the map
• Interpret compass directions in the context of appropriate maps
Unit 1: Scale
Unit 2: Maps and Scale
Unit 3: Floor and Elevation Plans

5
Module 2 : Measurement
Objectives/Outcomes Units
• Calculate/measure metric/imperial units, time, conversion factors/tables, solid to liquid and temperature.
• Calculate/measure the perimeter, area, surface area and volume of objects.
• Calculate/measure the Volume and surface areas of rectangular, triangular prism, cylindrical prism pyramids, cones and spheres.
• Determine/calculate appropriate quantities of materials/components required to complete a task or project.
Unit 1: Conversions, measuring time, timetables and speed
Unit 2: Two-Dimensional Measurement
Unit 3: Three-Dimensional Measurement
J. TABLE OF ICONS TO BE USED IN THIS MANUAL
Discussion
Group ACTIVITY
Individual ACTIVITY
Study Tips
Notes
Ice Breaker
Time
Tools

6
K. TABLE OF ACRONYMS AND ABBREVIATIONS
Acronym Definition
ATP Annual Teaching Plan
CAPS Curriculum and Assessment Policy Statement
ICT Information and Communication Technology
LP Lesson Plan
FG Facilitator’s Guide
NPPPPR National Policy Pertaining to Programme and Promotion requirements
PG Participant’s Guide
FS Fact Sheet
PPT PowerPoint Presentation
TPACK Technological, Pedagogical, Content and Knowledge
TS Training Session
L. TERM ANNUAL TEACHING PLAN
DATE CONTENT CONTEXT
14/04 – 17/04
SCALE
• Scale (ratio, bar)
• Determine actual lengths and distances from a given scale
• Determine a scale for drawings and/or models
• Determine a scale in which to draw diagram or construct a model
• Seating plan (classroom, offices, cinemas, sport stadiums, etc)
• Layout maps (buildings in a school or sports field, stores in a shopping centre)
• Street maps
• National/provincial maps
• Elevation maps
• Strip charts
20/04 – 24/04 MAPS
• Grid reference
• compass directions
• slope on map
28/04 – 30/04 SCALE and PLANS
• Diagrams (assembly instructions in manuals, etc.)
• Plans (symbols and notation, terminology, determine actual dimensions using a given scale, determine a suitable scale to draw
06/05 – 08/05 MEASUREMENT (Calculating)
• Length, distance and time
• Perimeter
• Area
• House plans
• Floor plans
• Painting Tiling (laminating, ceramic, etc.)

7
11/05 – 15/05 MEASUREMENT (Calculating)
• surface area
• Volume
• Rate (speed, costing, etc.)
• Assembling wooden furniture or any appliance
• House floor plan
M. COURSE TIMETABLE
TIME ACTIVITY
15:30 – 16:30 Arrival
16:00 – 17:00 Plenary Session: Opening and Welcome, Issuing of Training Materials and Other Logistics
17:00 – 18:00 TS 1: Pre Test
18:00 – 19:30 Supper
DAY 2
TIME ACTIVITY
06:30 – 08:00 Breakfast
08:00 – 10:30 TS 2: Module 1 – Unit 1
10:30 – 10:45 Tea Break
10:45 – 13:00 TS 3: Module 1 – Unit 2
13:00 – 14:00 Lunch
14:00 – 15:30 TS 4: Module 1 – Unit 3
15:00 – 16:00 TS 5: Module 1 – Unit 4
16:00 – 16:15 Tea Break
16:15 – 18:00 TS 6: Module 2 – Unit 1
18:00 – 19:00 TS 7: Module 2 – Unit 2
19:00 – 20:30 Supper
DAY 3
TIME ACTIVITY
06:30 – 08:00 Breakfast
08:00 – 09:00 TS 8: Module 2 – Unit 2
09:00 – 10:30 TS 9: Module 2 – Unit 3
10:30 – 11:00 Tea Break
11:00 – 12:00 TS 10: Module 2 – Unit 3
12:00 – 13:00 TS 11: Post Test
Closing Session: Closing Remarks
13:00 – 14:00 Lunch

8
MODULE 1: MAPS, PLANS AND OTHER REPS. OF THE PHYSICAL WORLD
INTRODUCTION
In this module participants will look at the concept of
• Number scale and bar scale
• Map scale and calculating distance
• Compass directions and giving directions
OVERVIEW
In this topic, participants will work with maps of possible unfamiliar contexts and complex
structures.
SPECIFIC OBJECTIVES
When participants complete this module, they should be able to:
• Work with different types of scale on the map/plan
• Work with scale on map/plan
• Calculate actual length and distance when map/plan is known
• Calculate map/plan measurement when actual length/distance is known using a given scale
• Determine the scale in which a map/plan has been drawn in the form 1: … and use the scale to determine other dimensions on the map/plan
• Interpret compass directions in the context of appropriate map/plan
GRADE PROGRESSION
GRADE 10 GRADE 11 GRADE 12
Maps and plans of familiar context e.g. school.
Maps and plans of less familiar context e.g. Office space
Maps and plans of possibly unfamiliar contexts or complex structures e.g. RDP houses.
GLOSSARY OF TERMS
Scale Is used to indicate how much an object has either been reduced or enlarged from its actual size. Also applicable to distance between two places.
𝑆𝑐𝑎𝑙𝑒 =𝑀𝑎𝑝 𝑑𝑖𝑠𝑡𝑎𝑛𝑐𝑒
𝐴𝑐𝑡𝑢𝑎𝑙 𝑑𝑖𝑠𝑡𝑎𝑛𝑐𝑒
Number scale A number scale such as 1 : 5 000 means that 1 unit on the map represent 5 000 units in real life
Bar scales Presented as a picture, it means that if you placed a ruler next to this scale, you could determine how many centimeters next to this scale, you could determine how many centimeters represent the specified kilometers.
Distance Length of a line joining any two points.

9
Distance as the Crow flies
Length of a straight line joining any two points.
Actual/Real/True distance
Real distance between any two points.
Map/Plan distance Distance between any two points on a plan or map.
Elevation map Information about the profile of a route as seen from the side.
Highway A major road that links major cities.
National road map Shows major roads linking major cities to each other.
Route map Shows a specific route, for instance for an event, as seen from above.
Determines how many times smaller an object shown on a plan or map is that its actual size
Scale drawing A diagram of a real-life object drawn in proportion.
Street map A map of a small area such as a town or city.
Strip map A map of a section of a travelling route.
CONTENT Participants will study this module through the following units
Unit 1 Scale
Unit 2 Maps and Scale
Unit 3 Floor and Elevation plans
UNIT 1: SCALE
INTRODUCTION In this unit participants will look at the concept of Scale viz. number scale and bar scales including
large scale and small scale.
SPECIFIC OBJECTIVES
At the end of this Unit, participants should be able to:
• Work with number and bar scale
• Discuss the disadvantages and advantages of bar scale and number scale
• Expressing number scale as a bar scale and vice versa
• Determining the scale used to resize the image
• Use the given scale to do calculations
• Calculating the actual length of the drawing or image of the object.

10
LESSON NOTES Scale can be expressed as a set of levels or numbers used in a systematic way to compare or
measure things.
TYPES OF SCALE
• Number scale
➢ Also called a ratio scale.
➢ It is always expressed as a ratio like 1:200
➢ This means 1 unit on the map represents 200 units on the ground. E.g. 1cm measured on
the map will represent 200cm on the ground.
➢ The units should always be in the simplest form.
i.e. if 5: 900 is given, divide both sides by 5 5
5 :
900
5 = 1: 180
Using a number scale:
➢ Multiply the given distance by the real part of the map.
➢ If the distance was not given, use a ruler to measure the distance on the map.
➢ Multiply the scale factor by the distance measured to get the real distance.
➢ E.g. If you measured 800 mm, to get the real distance multiply 800 by 180.
• Bar scale
➢ Also called a graphic scale or a linear scale.
➢ Bar scale is represented in segments
100m 200m
➢ Each piece of the segment represents the given distance
➢ Using a bar scale:
o Measure the size of one segment or the whole bar with a ruler in centimetres
preferably.
o If you measured the whole bar, simplify the scale before doing any calculations.
o Measure the distance on the map in centimetres.
o Calculate how many segments of the bar graph it works out to be; i.e. divide the total
distance measured and divide it by the length of one segment or simplified size of the
bar.
o Multiply the distance by measurement indicated on one bar.

11
➢ Converting from bar scale to number scale
100m 200m
o Measure 1 segment of a bar.
o Write the ratio of a measured segment to the actual length
o Change units to be similar
o Simplify and write the scale in the form 1: …
This triangle may be used when calculating distance or scale factor
Take Note:
• The horizontal line( __ ) represents division
• The vertical line ( ) represents multiplication.
• To calculate the Actual distance, multiply the measured distance by the scale factor.
• To calculate the measured distance, divide the actual distance by the scale factor.
• To calculate the scale factor, divide the actual distance by the measured distance.
Scale
factor
Measured
distance
Actual
distance
e

12
Bar scale versus number scale
Type of scale Advantages Disadvantages
Bar scale • Resizing the map does not affect the bar scale as it changes with the resized map.
• Can be used to determine actual lengths and distances without doing many calculations.
• Quick and relatively easy to use.
• One has to measure the length of one segment and measure the distance on the map before doing calculations.
• Certain instruments are used to measure a bar scale, e.g. a ruler.
Number scale • We only have to measure one distance
• If the distance is given, we only have to multiply the given distance by the real part of the map.
• Calculations are usually fairly simple.
• Any unit e.g. cm or mm can be used when using a ratio scale, which can then be converted to another appropriate unit e.g. km.
• When plans/maps are resized i.e. made bigger or smaller, the ratio scale becomes inaccurate and cannot be used.
• Calculations are required to determine the actual lengths and distances.
Example 1:
Explain the meaning of the following ratio scales:
a) 1 : 500
b) 3000 : 1
Solution
a)
1
un
it
on
th
e m
ap,
rep
res
ents
5
00
un
its
in
real
ity
. b
) 3
000
u
nit
s
on
th
e m
ap,
rep
res
ents
1
un
it i
n
real
ity
Example 2
Lihle recently moved into a new home. She bought a flat screen TV with the dimensions as indicated below. Use the length distance of 947 𝑚𝑚 to determine the scale used on this drawing.

13
Solution: St
ep 1
: U
se a
ru
ler
to
mea
sure
th
e le
ngt
h
dis
tan
ce =
85
𝑚𝑚
St
ep 2
: W
rite
th
e d
ista
nce
s in
rati
o f
orm
85
𝑚𝑚
∶ 9
47
𝑚𝑚
St
ep 3
:
Sim
plif
y th
e ra
tio
i.e.
8
5𝑚
𝑚
85
𝑚𝑚
:94
7𝑚
𝑚
85
𝑚𝑚
Step
4 :
W
rite
th
e sc
ale
in
sim
plif
ied
fo
r i.e
. 1∶
11
.14
11
76
…..
Step
5:
Wri
te t
he
scal
e in
sim
plif
ied
fo
rm i.
e.
1:1
1
Example 3:
Working with a bar scale
Lizzy lives in Polokwane, Limpopo. She wants to go visit a friend in Bloemfontein, Free State. Use the Map and the bar scale below to calculate the straight line distance, in kilometres, from Polokwane to Bloemfontein.

14
Solution St
ep
1:
U
se a
ru
ler
to
accu
rate
ly m
easu
re
the
len
gth
of
the
bar
sc
ale
(eit
her
in c
m o
r
mm
).
1cm
: 10
0km
Ste
p 2
:
Use
a r
ule
r to
m
easu
re t
he
stra
igh
t lin
e d
ista
nce
(as
th
e cr
ow
flie
s) b
etw
een
Po
lokw
ane
and
B
loem
fon
tein
, as
accu
rate
ly a
s p
oss
ible
.
4,8
cm
St
ep
3
Use
th
e n
um
eric
al
rati
o in
ste
p 1
to
calc
ula
te t
he
actu
al
dis
tan
ce.
Act
ual
dis
tan
ce
=4
,8 𝑐
𝑚 ×
10
0 𝑘
𝑚
1𝑐
𝑚
Act
ual
dis
tan
ce
=4
80
𝑘𝑚
Activity 1.1.1. Individual Work (15 Minutes)
Instructions
• Refer to the questions provided
• Task 1: Answer the questions and allocate marks or indicate were marks are allocated. Task 2: Identify the taxonomy levels for each question
• These questions are intended to prompt participants to consolidate the unit and possible ways in which this section can be taught
• Report Back and Discussion
• Resources: Training manual, Note pad, Pen and Calculator. 1. Ms Welcome an educator at Achievers High School, is responsible for preparing the prize
giving certificates for the annual academic awards day. The certificate is rectangular in shape. The certificate has outside dimensions of 𝐿𝑒𝑛𝑔𝑡ℎ = 29,5 𝑐𝑚 and 𝐵𝑟𝑒𝑎𝑑𝑡ℎ = 21 𝑐𝑚.

15
a) Use the Breadth of the certificate to determine the scale used to draw this certificate. b) Explain the meaning of the scale above.
2.
a) Measure the above scale in 𝑐𝑚. b) What does the Bar scale represent? c) The Straight line distance on a map between points A and B is 85 𝑐𝑚.
Use the bar scale above to calculate the actual distance in 𝑘𝑖𝑙𝑜𝑚𝑒𝑡𝑟𝑒𝑠.
Additional Notes:
……………………………………………………………………………………………………………………………………………………………
……………………………………………………………………………………………………………………………………………………………
……………………………………………………………………………………………………………………………………………………………
……………………………………………………………………………………………………………………………………………………………
……………………………………………………………………………………………………………………………………………………………
……………………………………………………………………………………………………………………………………………………………
……………………………………………………………………………………………………………………………………………………………
……………………………………………………………………………………………………………………………………………………………
……………………………………………………………………………………………………………………………………………………………
……………………………………………………………………………………………………………………………………………………………
……………………………………………………………………………………………………………………………………………………………
……………………………………………………………………………………………………………………………………………………………
……………………………………………………………………………………………………………………………………………………………
……………………………………………………………………………………………………………………………………………………………
……………………………………………………………………………………………………………………………………………………………
……………………………………………………………………………………………………………………………………………………………
……………………………………………………………………………………………………………………………………………………………
……………………………………………………………………………………………………………………………………………………………
……………………………………………………………………………………………………………………………………………………………
……………………………………………………………………………………………………………………………………………………………
……………………………………………………………………………………………………………………………………………………………
……………………………………………………………………………………………………………………………………………………………
……………………………………………………………………………………………………………………………………………………………
……………………………………………………………………………………………………………………………………………………………
……………………………………………………………………………………………………………………………………………………………
……………………………………………………………………………………………………………………………………………………………
……………………………………………………………………………………………………………………………………………………………
……………………………………………………………………………………………………………………………………………………………
……………………………………………………………………………………………………………………………………………………………
……………………………………………………………………………………………………………………………….…………………….End

16
UNIT 2: MAPS AND SCALE
INTRODUCTION
In this unit participants will look at the concept of
• Compass directions and giving directions
• Types of maps
• Map scales and calculating distance
LEARNING OUTCOME
At the end of this Unit, participants should be able to:
• Work with different types of maps
• Calculate actual length or distance on the map using bar scale or number scale
• Using given map to find the way to the destination
• Determine the scale in which a map has been drawn in the form 1: …. and use the scale to determine other dimensions on the map.
LESSON NOTES
DEFINITION
• A map is a diagrammatic representation of an area of land or sea showing physical features, cities viz. National/Provincial map, Strip chart, Elevation map, Street map etc.
• A map can be expressed as a plan or a chart.
COMPASS DIRECTIONS AND GIVING DIRECTIONS
• Compass directions are important when describing one’s position.
• Relative position is used to describe a person’s position or direction in relation to a particular landmark.
• The following words can be used to describe relative positions: Left, right, opposite, next to, straight, up, past, between and behind.

17
TYPES OF MAPS
1. Maps of Smaller areas
• Includes seating plans in a cinema, stores in a shopping centre, seating plan in a bus or aeroplane.
• A numbering system and a grid reference is often used to locate places in such maps.
• A grid reference consists of a letter and a number e.g. B6.
Possible Questions: John takes his wife to a concert of her favourite artist. Study the seating plan of the Vereeniging Theatre above and answer the questions that follow: a) How many seats are available in the theatre? b) Determine how many spaces are reserved for wheelchairs in this theatre. c) Give the compass direction of seat H22 from the stage. d) John is seated in the middle block, in the third row from the back. His seat is exactly in the
middle of the row. Name the row and seat number where he is seated.
N

18
Maps of larger areas
• Street maps
• National road and rail maps
• Provincial road maps
• Strip route maps
• Distance maps
• Elevation maps
1. Street Maps
This map usually gives an in-depth view of the city, showing streets, the scale and sometimes with
grid references.

19
2. National road and rail map National roads in South Africa are a class of roads and freeways which connect major cities. They are made up of route numbers beginning ‘N’ from N1 to N18. National roads are indicated by the letter N and a number inside a rectangle.
Example The Ndlovu family lives in Umtata, eastern Cape. They travelled by car to Johannesburg in Gauteng to see a sick relative. 1. In which general direction is Johannesburg from Umtata? 2. Identify the national road that passes through only one province. 3. The family travelled along the N2 to Durban, from Durban they joined the N3 to Harrismith.
When they reached Harrismith they took a wrong turn and found themselves travelling on the N5 towards Bloemfontein. a) Describe a possible route, except the N1 and without turning back to Harrismith that the
family could follow to travel from Bloemfontein to Johannesburg. b) Name the National roads and any relevant towns in the description of the route. c) Use the bar scale to calculate the actual distance from Johannesburg to Umtata in
kilometres.

20
3. Provincial Map Indicates roads and towns that are found within a province. Major provincial roads are indicated by a diamond shape. Minor provincial roads are indicated by a rectangle or the letter R.

21
4. Strip chart/Route map Drawn vertically on a page and shows distances on a national road between cities in South Africa. It is a map that primarily displays roads and transport links rather than natural geographical information. It is a type of navigational map that commonly includes political boundaries and labels, making it also a type of political map.

22
5. Elevation Maps
• Also known as Profile maps, represents the height above the sea level or altitude at different locations.
• Inclines (up-hills), declines (down-hills) and distances may also be shown.
• This type of map is very useful for marathon runners and athletes.
• Steep slope:
o Contour lines are closer to each other
o Soil erosion occurred
o Building on it may be expensive
• Gentle slope:
o Contour lines are apart from each other
o You can build on it as the slope is not steep
o Building infrastructure will be cheaper. (e.g. drawing water), farming
Comrades Marathon Profile Map

23
6. Distance Table
• Provides distances between main towns, cities, countries, etc.
• The table is made up of rows and columns.
Distances in km
Bloem- fontein
Cape Town
Durban East London
Johannes- burg
Mthatha Port Elisabeth
Pretoria
Bloem- Fontein
1004 634 584 398 570 681 455
Cape Town
1004 1753 1079 1402 1314 769 1460
Durban 634 1753 647 557 439 984 636
East London
584 1079 647 982 235 310 1040
Johannes- burg
398 1402 557 982 869 1075 58
Mthatha 570 1314 439 235 869 545 928
Port Elisabeth
681 769 984 310 1075 545 1133
Pretoria 455 1460 636 1040 58 928 1133
George 773 438 1319 645 1171 880 335 1229
Examples Jo-Anne and her friends are going on a vacation. They are planning to tour three different cities in the country. Use the Distance table above to help you answer the following questions: a) Determine the distance from Cape Town to East London. b) Determine the distance from East London to Pretoria. c) Calculate the distance from George to Port Elizabeth via Johannesburg.
Solution:
a)
10
79
𝑘𝑚
b
) 1
04
0 𝑘
𝑚
c)
Step
1 :
Th
e d
ista
nce
fro
m G
eorg
e to
Joh
ann
esb
urg
= 1
17
1 𝑘
𝑚
Step
2: D
ista
nce
fro
m J
oh
ann
esb
urg
to
Po
rt E
lizab
eth
= 1
07
5 𝑘
𝑚
Step
3: T
ota
l dis
tan
ce
= 1
17
1 𝑘
𝑚 +
10
75
𝑘𝑚
=
2 2
46
𝑘𝑚
∴
𝑑𝑖𝑠
𝑡𝑎𝑛
𝑐𝑒 𝑓
𝑟𝑜𝑚
𝐺𝑒𝑜
𝑟𝑔𝑒
𝑡𝑜
𝐽𝑜
ℎ𝑎
𝑛𝑛
𝑒𝑠𝑏
𝑢𝑟𝑔
=2
24
6𝑘
𝑚

24
Activity 1.2.1. Group Discussion (15 Minutes)
Instructions
• Participants should form groups of 4 – 5
• Refer to the questions provided
• Task 1: Answer the questions and allocate marks or indicate where marks are allocated. Task 2: Identify the taxonomy levels for each question
• These questions are intended to prompt participants to consolidate the unit and possible ways in which this section can be taught
• Report Back and Discussion
• Resources: Training manual, Note pad, Pen and Calculator
1.1. The Matric learners of Sunset High School sat for their NSC exams in November 2019.
Below is a seating plan of the matric learners in the school hall. Scale: 1: 300
a) Determine the general direction if travelling from C5 to F8. b) Explain the meaning of the given scale. c) Use the given scale to determine the actual area of the following in 𝑐𝑚2.:
(i) Candidate’s table E7 (ii) Invigilator’s table
1 2 3 4 5 6 7 8 9
A
B
C
D
E
F
G
H
I
Invigilators’ Table

25
1.2. Kruger National Park, in Mpumalanga South Africa, is one of Africa’s largest game reserves. Satara Rest camp is one of many camps in Kruger National Park. (Adapted from KZN, 2019, P2) Below is the travelling time to Satara rest camp from Crocodile Bridge and Gate.
• Important information: Recommended speed 25km/hour for game viewing
Distance from Gates to Camps
Satara Rest Camp
Distance Time
Crocodile bridge and gate 𝟏𝟐𝟕 𝒌𝒎 𝟓 𝒉𝒐𝒖𝒓𝒔 𝟓 𝒎𝒊𝒏𝒖𝒕𝒆𝒔
Use the information provided in the travelling timetable and on the Kruger National Park Map to answer the questions that follow.
a) Give the general direction if travelling from Crocodile Bridge and gate to Satara rest camp. --------------------------------------------------------------------------------------------------------------------------------------
b) A tourist wants to travel from Malelane gate to Phabeni gate. Direct the tourist to Phabeni gate. --------------------------------------------------------------------------------------------------------------------------------------
c) The time taken to travel from Crocodile Bridge and gate to Satara Rest Camp is 5 hours and 5 minutes. Show how this time was calculated. Round off your answer to the nearest minute. --------------------------------------------------------------------------------------------------------------------------------------
d) Convert the bar scale of this map to a number scale in the form 1: …... Show your workings. NB: Round off your number scale to the nearest whole number. --------------------------------------------------------------------------------------------------------------------------------------
e) Use your answer from QUESTION d) above to calculate the straight-line distance from Crocodile Bridge to Satara rest camp. Explain why your answer from QUESTION e) does not match 127 km given above. --------------------------------------------------------------------------------------------------------------------------------------
f) Explain why your answer from QUESTION e) does not match 127 km given above. ------------------------------------------------------------------------------------------------------------------------------------------------------------------------------------------------------------------------------------------------------------------------------------------------------------------------------------------------------------------------------------------------------------------ ------------------------------------------------------------------------------------------------------------------------------------------------------------------------------------------------------------------------------------------------------------------------------------------------------------------------------------------------------------------------------------------------------------------ ------------------------------------------------------------------------------------------------------------------------------------------------------------------------------------------------------------------------------------------------------------------------------------------------------------------------------------------------------------------------------------------------------------------ ------------------------------------------------------------------------------------------------------------------------------------------------------------------------------------------------------------------------------------------------------------------------------------------------------------------------------------------------------------------------------------------------------------------ ------------------------------------------------------------------------------------------------------------------------------------------------------------------------------------------------------------------------------------------------------------------------------------------------------------------------------------------------------------------------------------------------------------------
LAYOUT MAP FOR ENTRANCE KRUGER NATIONAL PARK GATES AND REST CAMPS IS ALSO PROVIDED BELOW:

26

27
Activity 1.2.2. Individual Work (15 minutes)
Instructions
• Refer to the questions provided
• Task 1: Answer the questions and allocate marks or indicate were marks are allocated. Task 2: Identify the taxonomy levels for each question
• These questions are intended to prompt participants to consolidate the unit and possible ways in which this section can be taught
• Report Back and Discussion
• Resources: Training manual, Note pad, Pen and Calculator
The Moodley family lives in Pietermaritzburg. A map of South Africa showing the National roads is given below: Study the map and answer the questions that follow:

28
1. The family travelled from Pietermaritzburg to Johannesburg by car, using the N3.
a) Measure the distance, in centimetres, between these two cities.
b) Hence use the scale given on the map to calculate the actual distance, in kilometres, between these two cities.
2. The car travelled at an average speed of 120km/hr. They departed at 08:15 and planned to
arrive in Johannesburg at 14:10. Determine whether they arrived at the predicted time.
3. The family left Pietermaritzburg with a full tank of petrol. Along the way they stopped at a petrol
station to refuel at a cost of R455,40.
The capacity of the tank is 60 litres and the cost of fuel is R16,35 per litre.
a) Before refuelling, the fuel gauge indicated that the tank was half full.
Verify, showing ALL calculations, whether the fuel gauge was working properly.
b) If the car’s fuel consumption was 9 litres per 100 km, determine how far they were from
Johannesburg when they refuelled.
4. Describe, in detail, the shortest possible route, using national roads, to travel from Port
Shepstone to Upington.
5. Mr Moodley gave the following directions to his friend using his cellphone:
• From George, travel north along the N12.
• When you reach Beaufort West, take the N1 and travel through Bloemfontein to Pretoria.
• Then travel along the N4 in a Westerly direction.
• The next town will be your destination.
What is his friend’s destination?
Additional Notes: --------------------------------------------------------------------------------------------------------------------------------------
--------------------------------------------------------------------------------------------------------------------------------------
--------------------------------------------------------------------------------------------------------------------------------------
--------------------------------------------------------------------------------------------------------------------------------------
--------------------------------------------------------------------------------------------------------------------------------------
--------------------------------------------------------------------------------------------------------------------------------------
--------------------------------------------------------------------------------------------------------------------------------------
--------------------------------------------------------------------------------------------------------------------------------------
--------------------------------------------------------------------------------------------------------------------------------------
--------------------------------------------------------------------------------------------------------------------------------------
--------------------------------------------------------------------------------------------------------------------------------------
--------------------------------------------------------------------------------------------------------------------------------------
--------------------------------------------------------------------------------------------------------------------------------------

29
Activity 1.2.3. Individual Work (10 Minutes)
Instructions
Refer to the context provided
• These questions are intended to advance skills that can be used in the classroom and possible ways in which this section can be taught
• Task 1: Answer the questions and allocate marks or indicate were marks are allocated.
• Task 2: Identify the taxonomy levels for each questions
• Report Back and Discussion
• Resources Training manual and Note pad
1. Siyabonga used the strip map of the route from East London to Harrismith below while planning his trips
around the Free State, Eastern Cape and Lesotho. The strip chart below shows the route that Siyabonga could take for his trip. Use the Information in the strip chart to answer the questions that follow:
a) How many National roads are indicated on the strip chart? b) Give the name of the road connecting Bethlehem and Ficksburg. c) Give the General direction of Maseru from Queenstown. d) Calculate the distance travelled from Bethlehem to Tussen-die-Riviere Game Farm passing Winburg.

30
2. The Big five Marathon is an annual event in South Africa. It can be run as a full 42km marathon or as a half-marathon of 21km. The race has specific cut-off times (Certain compulsory distances to be covered within specific times). Runners who do not meet the cut-off times are forced to withdraw from the race. Below are the cut-off times for the full Marathon.
Full Marathon
Cut-off 1 Cut-off 2 Cut-off 3
Distance from the start 25,5 km 31,5 km Finish line
Time from start 4hours 15min 5hours 15min 7 hours
Adapted from NSC, Nov, P2 2019

31
Use the information above and the map provided to answer the questions that follow:
1. Give the general direction in which a marathon runner is heading when passing the 20km mark.
2. Consider the heights above the sea level for this race.
a) Explain why a runner is correct when he stated that he was running uphill from the start to the 10km
mark.
b) Express in the form: 1: … , the lowest possible height above sea level to the highest height above sea
level.
3. Explain why there are cut-off times for a marathon.
4. For the half marathon, a runner must cover a distance of 16,5 km in a time of 5 hours from the start of
the race to beat the cut-off 2 time for the half-marathon.
A runner of a full marathon compared his speed with the speed of the half-marathon runner and stated
that he had to run 2,7km/h faster in order to beat the cut-off 2 time of the full marathon.
Verify, showing ALL calculations whether he is correct. You may use the formula
𝑫𝒊𝒔𝒕𝒂𝒏𝒄𝒆 = 𝑺𝒑𝒆𝒆𝒅 × 𝒕𝒊𝒎𝒆
Additional Notes:
--------------------------------------------------------------------------------------------------------------------------------------
--------------------------------------------------------------------------------------------------------------------------------------
--------------------------------------------------------------------------------------------------------------------------------------
--------------------------------------------------------------------------------------------------------------------------------------
--------------------------------------------------------------------------------------------------------------------------------------
--------------------------------------------------------------------------------------------------------------------------------------
--------------------------------------------------------------------------------------------------------------------------------------
--------------------------------------------------------------------------------------------------------------------------------------
--------------------------------------------------------------------------------------------------------------------------------------
--------------------------------------------------------------------------------------------------------------------------------------
--------------------------------------------------------------------------------------------------------------------------------------
--------------------------------------------------------------------------------------------------------------------------------------
--------------------------------------------------------------------------------------------------------------------------------------
--------------------------------------------------------------------------------------------------------------------------------------
--------------------------------------------------------------------------------------------------------------------------------------
--------------------------------------------------------------------------------------------------------------------------------------
--------------------------------------------------------------------------------------------------------------------------------------
--------------------------------------------------------------------------------------------------------------------------------------
--------------------------------------------------------------------------------------------------------------------------------------
--------------------------------------------------------------------------------------------------------------------------------------
--------------------------------------------------------------------------------------------------------------------------------------
--------------------------------------------------------------------------------------------------------------------------------------

32
UNIT 3: FLOOR AND ELEVATION PLANS
INTRODUCTION In this unit, Participants will look at the concept of floor plan of a house, elevation plans and
questions regarding scale and plans.
SPECIFIC OBJECTIVES
At the end of this Unit, participants should be able to:
• Work with different types of scales on plans and in the construction of models
• Determine the most appropriate scale in which to draw/construct a plan and/or model, and use this scale to complete the task
• Determine the scale in which a plan has been drawn in the form 1: --- and use the scale to determine other dimensions on the plan
• Analyse the layout of the structure shown on the plan and suggest alternative layout options
• Determine actual lengths of objects shown on plans using measurement and a given scale viz. number or bar scale.
• Determine quantities of materials needed by using the plans and perimeter, area and volume calculations
• Connect the features shown on elevation plans with features and perspectives shown on a floor plan of the same structure
GLOSSARY OF TERMS
2-D models A diagram or picture having length and width only.
2-dimensional plans A plan or design having length and width only, but possibly representing three dimensional objects.
3-D models A dimensional construction of real-life objects.
Elevation plans Show the design and dimensions of the outside of a building from a side view.
Floor plan Shows the design and dimensions of the inside of a building, from a top view.
North elevation plan Shows the side of the building that is in front of you when you are facing the compass direction ‘North’
Scaled elevation plans Show the design and dimensions of the outside of a building from a side view using a specific scale.

33
LESSON NOTES
Floor plans or Layout plan
• It is a line drawing showing rooms as though seen from above without a roof
• Shows a top view of a building floor (room, office, house, etc.). • The floor plan for a house usually shows the layout of different rooms, the position of windows
and doors as well as the position of fittings like cupboards, stoves, toilets, etc.
• Symbols are used in the floor plan or layout plan such as doors, windows, etc.
• The purpose of a plan is to show the layout and design of the 3-dimensional structure
• May include compass direction indicators.
• Floor plans are drawn to scale just like maps
• Plans will show a scale viz. a ratio or a bar scale.
• Working with this scale is exactly the same as working with scales given on maps.
Example 1
The floor plan of a security room at the entrance of Birchwood Hotel is shown below. Window(s) and Door(s) have not yet been shown. Study the plan below and answer the questions that follow.
a) In which direction is the security room facing? b) On which side do the cars stop that enter the hotel? Give the compass direction. c) Write down the outside measurements of the security room in mm by using a ruler. d) Use the scale to determine the actual dimensions of the room in metres.

34
Elevation Plans
LESSON NOTES
Elevation plans
• Elevation plans show the design of the outside of a building
• Elevation is a side-view as viewed from the front, back, left or right.
• These plans will give details such as the height of the walls and the sizes of the windows and doors.
• Elevation plans are generally named for the compass direction that the particular side of a building is facing.
• For example, if the front of a house is facing North, the side that you will be looking at when you are facing the front of the house, will be called the North elevation.
• However, if the direction is not obvious, elevations can be called the front, rear, left or right elevation.
• Elevation plans are usually labelled:
✓ North Elevation, is the side of the house that you are facing when you are facing towards
North
✓ South Elevation
✓ East Elevation, is the side of the house that you are facing when you are facing Eastwards
✓ West Elevation
• Below is an example of an elevation plan showing different views:

35
Example
Use the Elevation and Floor plan below to answer the questions that follow:
a) How many doors and windows does the ground floor of this plan have? b) Refer to the first floor plan and determine the actual length of the plan in metres. c) Determine the Actual Area of the Ground floor plan in 𝑚2 ignore the door openings and
windows.
Additional Notes:
----------------------------------------------------------------------------------------------------------------------------------------------------------------------------------------------------------------------------------------------------------------------------------------------------------------------------------------------------------------------------------------------------------------------------------------------------------------------------------------------------------------------------------------------------------------------------------------------------------------------------------------------------------------------------------------------------------------------------------------------------------------------------------------------------------------------------------------------------------------------------------------------------------------------------------------------------------------------------------------------------------------------------------------------------------------------------------------------------------------------------------------------------------------------------------------------------------------------------------------------------------------------------------------------------------------------------------------------------------------------------------------------

36
Compass directions in house construction
• Compass directions are also used in the construction industry.
• Architects and builders should choose the best position for a building in relation to the sun’s location at different times of the day and during different seasons.

37
Activity 1.3.1 Individual Work (15 Minutes)
Instructions
Refer to the context provided
• These questions are intended to advance skills that can be used in the classroom and possible ways in which this section can be taught
• Task 1: Answer the questions and allocate marks or indicate were marks are allocated.
• Task 2: Identify the taxonomy levels for each questions
• Report Back and Discussion
• Resources Training manual and Note pad
Adapted from IEB 2017, P1
1. The Malema family decides to go on holiday and books a chalet in the game park. The chalet looks like the picture below. If a sketch of the north elevation of the chalet looks like the sketch below, sketch the west elevation.

38
2. The floor plan of the chalet is given below, use it to answer the questions that follow:
a) The total width of the chalet shown on the diagram is 8 m and the total length is 12 metres. Determine the total floor area.
b) Measure and write down (in cm) the length of the chalet excluding the "sundeck" (A to B on the floor plan)
c) The scale of the floor plan is 1 : 64. Determine (in metres) the actual length of bedroom 2 if it measures 59 mm on the floor plan.
d) Determine in which compass direction bedroom 2 is from the living room. e) The width of the sundeck on one side of the chalet is 94,4 cm, which is a third of the width of the
front of the sundeck. Calculate the width (in cm) of the front of the sundeck.

39
Activity 1.3.2. Group Discussion (15 Minutes)
Instructions
• Participants should form groups of 4 – 5
• Refer to the questions provided
• Task 1: Answer the questions and allocate marks or indicate were marks are allocated.
Task 2: Identify the taxonomy levels for each questions
• To choose the best position for a house in relation to the sun’s location at different times of the
day and winter
• Report Back and Discussion
• Resources: Training manual and Note pad
Adapted from NCS P1 March 2018
1. Thabo visited Port Elizabeth to check on the progress made on the house being built for his parents. The floor plan of the house is shown below.

40
a) Give (in mm) the external length of the wall that makes the area of Bedroom 1 larger than Bedroom 2.
b) Determine (in m) the total external length of the western wall of the house. c) Name the room(s) that has more than ONE entrance. d) Identify the room that has the same floor area as the living room. e) Why is it acceptable for the kitchen and the living room to only have door openings (without doors) leading into the passage?
f) Which rooms shown on the plan will be much cooler during winter? Give a reason for your answer.
g) Use the 7 100 𝑚𝑚 length of the plan to determine the scale of the plan. h) Which bathroom fixture is NOT shown on the floor plan? 2. Sapphire High School decides to tile the floor of their school hall using black and grey tiles.
• The hall is L-shaped.
• A rectangular stage is located against one wall of the hall as illustrated in the sketch below.
• The width of the stage is 5 m, and the length is 10 m.
• The stage is not going to be tiled.
• The size of a square tile is 50 cm by 50 cm. The school needs to calculate how many tiles to buy.
a) A scale drawing is to be made of the hall.
Determine the scale (in simplified form) to be used if the length of the north wall of the hall is 60 mm.
b) Calculate the area of the floor (excluding the stage) to be tiled. (Area of a rectangle = length × breadth)

41
Activity 1.3.3. Group Discussion (20 Minutes)
Instruction:
• Participants should form groups of 4-5.
• Refer to the questions provided.
• Answer the questions and allocate marks.
• Identify the taxonomy levels for each question.
• These questions are intended to prompt participants to consolidate the section and possible ways in which the section can be taught.
• Report back and discuss. (Take note – diagrams are not necessarily drawn to scale)
1. The other side of the Game park has different Chalets as compared to the ones chosen by the Malema family. A floor plan of one of those chalets at the resort is indicated below.
a) Explain the meaning of the term floor plan. b) Write down the ratio of the number of rooms to the number of windows found on the plan, in
the form 1: … c) Identify the exterior wall that doesn’t have windows.

42
2. The diagram below is the floor plan of Lesedi’s new home.
• The height of the Inside Walls of all rooms, from the floor to the ceiling is 2 400 mm.
• The dimensions of the windows in each Bedroom are 160cm by 130 cm
• The height of a door opening is 2,14m.
• The following formula may be used : Area = Length × Breadth
Use the floor plan and the information provided above to help you answer the questions that follow:
a) In which general direction does the window in the Bedroom 2 face? b) The area of a door opening is 9% more than the area of a bedroom window.
Calculate the width of a door opening in metres. c) Lesedi wants to paint the inside walls of the two bedrooms. The inside walls of Bedroom 1
have a total area of 28,44m2. Calculate the total inside wall area of Bedroom 2. d) Lesedi estimated that the paint for both Bedrooms will cost less than 𝑅500,00. She
intended using paint that covers 4𝑚2 per litre and which is sold in 5 containers at a price of 𝑅169,99 per container. Verify, showing ALL calculations, whether her estimation was correct.

43
ACTIVITY 1.3.4
Instructions
• Individual activity
• Duration: 10 minutes
• This activity is intended to advance ICT skills that can be used in the classroom
• Task : Download and save a video lesson on the house plan
• Report Back and Discussion
• Resources: Training manual, Laptop and Wi-fi
RECOURCES FOR MODULE 1
1. Mpumalanga 2019 Preliminary Paper 1, Question 4
2. NSC Question Paper, 2018 Paper 2 Question 2
3. IEB Question Paper, 2017 P1
4. Free state 2018 Preliminary Paper 1 Question 1
5. DBE 2018 NSC Paper 2 Question 2
6. Mpumalanga 2018 Preliminary Paper 2 Question 3
7. Western Cape 2018 Preliminary Paper 2 Question 4
8. North West 2018 Preliminary Paper 2 Question 5
MODULE SUMMARY
In this module, participants worked with two types of scales viz. number and bar scale; calculated
the actual length and distance when plan measurements are known and worked with and
interpreted elevation plans or different views of buildings.
REFLECTION
In this module, learners need more practice on questions involving general direction questions and questions on a given set of directions. You should note that when a scale is given, there is every chance that some actual measurement will be done. Therefore, learners should be afforded the opportunity to use their rulers in class to measure classroom items (books, pens, pencils, etc.) on a regular basis. END OF MODULE 1

44
MODULE 2: MEASUREMENTS
INTRODUCTION
In this module you will look at the concept of measurement with specific focus on:
• Conversions within and between the metric and imperial systems; Measuring/calculating
time and timetables; speed, distance and time.
• Area and volumes of rectangles, circles and other circular objects
• Volume and surface areas of rectangular, triangular prism, cylindrical prism pyramids, cones
and spheres
OVERVIEW
In this topic, you will work with complex projects in familiar and unfamiliar contexts
SPECIFIC OBJECTIVES
At the end of this module you will be able to:
• Read, record and perform calculations involving time values and timetables
• Calculate speed, distance and time
• Calculate/measure the perimeter, area, surface area and volume of objects.
• Calculate/measure the Volume and surface areas of rectangular, triangular prism, cylindrical prism pyramids, cones and spheres.
• Determine/calculate appropriate quantities of materials/components required to complete a task or project.
GLOSSARY OF TERMS
Term / concept Definition/ Explanation
Area The amount of two-dimensional (2-D) space occupied by a 2-D shape. Area of a shape is the size of its surface. It is measured in square units.
Two-Dimensional drawings A diagram or picture having length and width only
Two-Dimensional plans A plan or design having length and width only, but possibly representing three dimensional objects
Three Dimensional models A dimensional construction of a real-life object. It is a solid, it has length, breadth/ width and height
Circle A closed curve that is everywhere at the same distance from a fixed point
Circumference Distance around a circle / perimeter of a circle
Conversion A change from one system /unit to another
Conversion factor Values used to convert/ change quantities from one measuring system to another.

45
Cylinder Three dimensional object with congruent parallel circles s bases that are joined by a curved surface
Diameter A straight line passing through the centre of a circle and touching the circle at both ends thus dividing the circle into two equal halves.
CONTENT You will study this module through the following units
Unit 1 Conversions, measuring time, timetables and speed.
Unit 2 Two-Dimensional Measurement
Unit 3 Three-Dimensional Measurement
UNIT 1: Conversions, Measuring Time, Timetables and Speed.
INTRODUCTION In this unit you will look at the concept of Conversions, measuring time, timetables and speed.
LEARNING OUTCOME
At the end of this Unit, you should be able to:
• Convert within and between the metric and imperial systems, solid to liquid measurements and temperature.
• Measure time, calculate time differences, timetables, speed, distance and time
LESSON NOTES
• Metric System
- South Africa use measuring system called the metric system
- However, some European countries use different system called the imperial system
- Metric system works in the multiples of 10’s
- Imperial system doesn’t work in the multiples of 10’s and can be difficult to manipulate
- Some common units used in the metric system:
Table 1: Length, Mass and Volume Units
Length (metres) Mass
(grams)
Volume
(litres)
Km Kg Kl
H H H
D D D
m g l
d d d
cm cg cl
mm mg ml

46
NB: Use the first letters only
Symbol Prefix
k Kilo 1
h Hecto 10 1
d Deca 100 10 1
m or ℓ or
g
Base 1000 100 10 1
da Deci 10 000 1000 100 10 1
c Centi 100 000 10 000 1000 100 10 1
m milli 1000 000 100 000 10 000 1000 100 10
Length
symbol
Length Volume unit Volume Weight unit Weight
km Kilometre kℓ Kilolitre kg Kilogram
hm Hectometre hℓ Hectolitre hg Hectogram
dm Decametre dℓ Decalitre dg Decagram
m Metre ℓ Litre g Gram
dam Decimetre daℓ Decilitre dag Decigram
cm Centimetre cℓ Centilitre cg Centigram
mm Millimetre mℓ Millilitre mg Milligram
Example of pneumonic for conversion:
Keke Hate Doing business during cold months

47
• Imperial System
- Some countries such as USA and Liberia use different system called the imperial system
- Imperial system doesn’t work in the multiples of 10’s and can be difficult to manipulate.
- Working with imperial conversions, the conversions should be given to where it is
required in a question.
- Some units used in the imperial system:
Table 2: Length, Mass and Volume Units
Length Mass Volume
12 in = 1 ft 16 oz = 1 lb 16 floz = 1 pt
3 ft = 1 yard 14 lb = 1 stone 2 pt = 1 quart
1 769 yd = 1 mile 2 240 lb = 1 ton 4 quart = 1 gal
• Temperature
- Temperature conversions between the metric and imperial system
- To convert temperatures form Celsius to Fahrenheit or vice versa, one of the
following formulae will be provided:
Table 3
0Fahreinheit oCelsius
°F = (1,8 × °C) + 32° °C = (°F − 32°) ÷ 1,8
• Solids to Liquids
- Volume can be measured using different units: either unit3 or in litres.
- Conversions are as follows and one of them should be given if it needs to be used:
Table 4
1 ml = 1 cm3 1 l = 1 000 cm3
1 kl = 1 m3
• Measuring Time and working with timetables
- Work with the following:
Table 5
- A minute has 60 seconds. - An hour has 60 minutes. - A day has 24 hours - A week has 7 days - A month we generally say has 4 weeks, but can also be 28, 29, 30 or 31 days. - A year has 12 months or 52 weeks or 365 days
(We don’t normally consider a leap year. - A decade has 10 years. - A century has 100 years.
• Time can be written using a 12 hour clock or a 24 hour clock.

48
Table 6
12 hour clock format 24 hour clock format
8 am 08:00
8 pm 20:00
4:30pm 16:30
2:42 am 02:42
• Working with Speed, Distance and Time
- One of the following formulae should be given when needed and the formula should be rearranged depending on what need to be calculated.
Table 7
49
ACTIVITY 1.1.1
Instructions
• Individual activity
• Duration: 30 minutes
• Refer to the questions provided
• Task 1: Answer the questions and allocate marks or indicate were marks are
allocated.
Task 2: Identify the taxonomy levels for each questions
• These questions are intended to prompt you to consolidate the unit and possible
ways in which this section can be taught
• Report Back and Discussion
• Resources: Table 1 – 7, Training manual, Note pad, Pen and Calculator
1. A dog eats 150g of dog food twice a day. How many kg of dog food does the dog eat in a fortnight?
2. If ¼ of the volume of the coffee in the 1,7litre flask is milk, how many fluid ounces of milk is in the flask? Use 1 floz = 28 ml
3. Hardware sells nails by the kilogram. One inch of nails weigh approximately 18 mg. How long, in mm, is a 1 inch nail, correct to 1 decimal place?
4. The stove you have to bake in is an old one and only has the temperature in
°Fahrenheit. You are making rusks and have to dry them overnight at a temperature of 176°F. Convert this temperature to °Celsius (80oC)
5. A container has the following dimensions: 120 cm × 300 cm × 430 cm. How many litres of liquid can the box hold?
6. The Vaal Dam can store 2536 million m3 of water when full. However, it was
65,4% full on the 30 January 2020. How many litres of water was in the dam?
7. Two friends, Ben and Mike, take part in a 15km fun run. Ben took 1 h 23 min 12 sec and Mike took 1 h 39 min 4 sec. How long did Ben wait at the finish line for Mike?

50
8. Attached is a timetable showing school alarm times
Monday Tuesday Wednesday Thursday Friday
Staff 07:30 07:30 07:30 07:30 07:30
Register 07:40 07:40
1 08:00 07:40 07:40 07:40 08:00
2 08:30 08:50 08:25 08:30 08:30
3 09:20 09:40 09:10 09:20 09:15
4 10:10 10:30 09:50 10:10 10:00
Break 11:00 11:20 10:35 11:00 10:45
5 11:55 11:50 11:00 11:55 11:15
6 12:40 12:40 11:40 12:40 12:00
7 13:25 13:25 12:20 13:25 12:45
14:10 14:10 13:00 14:10 13:30
a) The staff has a meeting every morning. How long do they spend on meetings in a fortnight.
b) How many assemblies are there in a week? c) Why do you think the school finishes so early on a Wednesday? d) What is the average time per lesson on a Wednesday, correct to two decimal
place?
9. Thabiso is riding a bicycle at a speed of 8,5 m/s.
a) Convert 8,5 m/s to km/h
b) How long will it take him to travel 45 km? Give the answer in hours, minutes and seconds.

51
UNIT 2: TWO-DIMENSIONAL MEASUREMENT
INTRODUCTION In this unit participants will look at the concept of Perimeter/Area and Volumes of rectangles, circles and other circular objects
LEARNING OUTCOME
At the end of this Unit, participants should be able to:
• Calculate the perimeter, area, surface area and volume of an object
• Determine/calculate appropriate quantities of materials/components required to complete a task
LESSON NOTES
• 2-D shape/ diagram is a flat figure with 2 dimensions; it does not have the thickness.
• Calculating perimeter
➢ Perimeter is the total length/distance around a shape or around the boundary.
➢ Perimeter of a circle is called the Circumference.
➢ Perimeter is measured in single units e.g. m, cm, mm, etc
➢ Length means measurement between two points in a straight line. E.g. length of a
room.
➢ Circumference is a distance around a circle.
➢ When dealing with semi-circle, remember to divide the formula of circle by 2
➢ Perimeter of a semi-circle is half perimeter of the circumference.
➢ Ensure that all units are the same before calculating perimeter.
➢ The inner part of the shape should be excluded when calculating the perimeter.
➢ If the formula requires diameter, change the radius to diameter by multiplying radius by
2.
➢ Use the value of 𝜋 as ( 𝜋 = 3.142)
• Calculating area
➢ Area is the amount of space occupied by a 2-D (2-Dimensional) figure.
➢ It is measured in square units e.g. 𝑚2, 𝑐𝑚2, etc
➢ Substitute values on the formula and simplify
➢ When dealing with complex figures, always divide it into smaller figures, calculate the
segments and add the answers together.
➢ Polygon: Is a two dimensional figure with many sides

52
Polygon Description Shape
Triangle A polygon with 3 sides
Quadrilateral A polygon with 4 sides
Pentagon A polygon with 5 sides
Hexagon A polygon with 6 sides
Heptagon A polygon with 7 sides
Octagon A polygon with 8 sides
Nonagon A polygon with 9 sides
Decagon A polygon with 10 sides

53
The perimeter and area of the following shapes should be considered:
Shape Perimeter Area
Rectangle
𝑏
𝑙
𝑃 = 𝑙 + 𝑙 + 𝑏 + 𝑏
𝑃 = 2𝑙 + 2𝑏
𝐴 = 𝑙 × 𝑏
Square
𝑠
s
𝑃 = 𝑠 + 𝑠 + 𝑠 + 𝑠
𝑃 = 4𝑠
𝐴 = 𝑠 × 𝑠
Triangle
b
When a rectangle is divided
diagonally into 2 halves, 2
triangles are produced.
𝑃 = 𝑞 + 𝑟 + 𝑠
𝐴 =1
2× 𝑏 ×⊥ ℎ
h q
r
s
2
1

54
Circles
C = 2𝜋𝑟
OR
C = 𝜋 × 𝑑
𝐴 = 𝜋 × 𝑟2
Semi-circle
Diameter
P = 1
2𝜋d
A = 1
2𝜋r2
➢ Diameter is a straight line that divides a circle into two equal parts.
➢ Radius is half of the diameter.
Additional Notes:
----------------------------------------------------------------------------------------------
----------------------------------------------------------------------------------------------
----------------------------------------------------------------------------------------------
----------------------------------------------------------------------------------------------
----------------------------------------------------------------------------------------------
----------------------------------------------------------------------------------------------
----------------------------------------------------------------------------------------------
----------------------------------------------------------------------------------------------
----------------------------------------------------------------------------------------------
----------------------------------------------------------------------------------------------
----------------------------------------------------------------------------------------------
----------------------------------------------------------------------------------------------
Diameter
Radius

55
Example 1: • Mahlodi is a manger at BKN dance studio.
• The North wing and the south wing have equal width of 2800mm and the diameter of the carpet is 2.4m.
• Study the floor plan of her studio and answer the following questions:
a) Name of the shape of the stage b) Show that the perimeter of the stage is 27.9 m c) Determine the perimeter of the dance studio d) Determine the area of the main dance floor that will be covered with a carpet.
Example 2:
Molo is designing traditional beads. She draws the triangles on the material she is using and decorate each peace with beads of different colours as indicated in the diagram above. The length of the material is 2m and the breadth is 1.5 m. The base of each triangle is 70 cm and the perpendicular height of 0.9 m .The opposite sides of a triangle are equal as it is an isosceles triangle. The sides equal to 55 cm. a) Find the perimeter of the material b) Determine the perimeter of the drawn triangles c) Show that surface area of the material to be cut is 2.205 m2
d) Thuli claimed that the piece of material that will not be decorated is 1m2 , verify her claim.

56
Activity 2.1.1 Group Discussion (15 Minutes)
Instructions
• Participants should form groups of 4 – 5
• Refer to the questions provided
• Task 1: Answer the questions and allocate marks for each solution. Task 2: Identify the taxonomy levels for each questions
• Report Back and Discussion
• Resources: Training manual, laptop and Calculator
Pitso has upgraded the area at the back of his house. He has added the picnic area, braai area and kids’ corner where his family can relax during their spare time. Study the sketch of the upgraded area below and answer the following questions:
1. Define perimeter in this context.
2. Hence determine the perimeter of the upgraded area. Round off your final answer to 1 decimal
place. You may use the formula: Area of a circle = π × d
a) The picnic area and Kids corner will be covered with an artificial grass carpet. Determine the
amount of artificial grass needed to cover the two areas.
b) MHM traders are selling the artificial grass carpet for R299 per 2 m × 1.5 m, excluding VAT
Determine the total cost (VAT inclusive) of the artificial carpet needed.
c) Moosa, the manager at MHM is buying 30 m of artificial grass carpet from India at 7160 INR
(Indian Rupee) including shipping. Pitso claims that his profit is more than 50%. Verify his claim.
N.B Use Xe currency converter to find the exchange rate.
3. A portion of the braai area will be occupied by a braai stand as indicated in the diagram.
4. The diameter of the braai stand area is 3.5 m. The remaining portion of the braai area will be
plastered
a) Determine the area that will be occupied by the braai stand.
b) Show that the area to be plastered is 10.02 m2.

57
Activity 2.1.2 Individual Activity (30 Minutes)
Instructions
• Refer to the context provided
• These questions are intended to advance skills that can be used in the classroom and possible ways
in which this section can be taught
• Task 1: Prepare solutions for this activity
• Task 2: Show mark allocation and explanation thereof.
• Solutions and Discussion
• Resources: Training manual, Flip chart, Koki pens
Lesego is upgrading her garden by putting in a flower bed, pond, stepping stones and a new deck. She asked a landscape architect to design the new garden
1. Five stepping stones are placed from the deck to the pond. Determine the area (in cm2) of all the
stepping stones, if the diameter of a stepping stone is 30 cm.
Area = 𝛑 × (radius)2
Use 𝛑 = 3,142
--------------------------------------------------------------------------------------------------------------------------------------
2. Convert the inner diameter of the pond to inches if 1 millimetres equals to 0.039 inches.
--------------------------------------------------------------------------------------------------------------------------------------
3. Pieces of grass are used to cover the lawn area. The length of each piece of grass is 700 mm and the
width is 500 mm.
Calculate the area of one piece of grass in square metres (m2).
--------------------------------------------------------------------------------------------------------------------------------------
4. Lesego has observed that the shade from the house divides the garden diagonally into 2 parts during
mid-day as indicated in the diagram. It covers the East part of the garden. Determine the area of the
garden that will not be covered by the shade.
--------------------------------------------------------------------------------------------------------------------------------------

58
Activity 2.1.3 Group Discussion (30 Minutes)
Instructions
• Participants should form groups of 4 – 5
• Refer to the context provided
• This activity is intended to advance skills that can be used in the classroom and possible ways in
which this section can be taught
• Task 1: Develop a context and three possible questions ( TL 2 – 4) based on the resource provided
• Task 2: Prepare solutions for the questions, indicating mark allocation.
• Report Back and Discussion
• Resources: Training manual, Flip chart, Koki pens
Resource A:
Resource B:

59
UNIT 3: THREE-DIMENSIONAL MEASUREMENT
INTRODUCTION
In this unit participants will look at the concept of Surface Area and Volumes of cubes, prisms, rings
and other complex shapes.
LEARNING OUTCOME
At the end of this Unit, participants should be able to:
• Calculate the surface area and volume of an object
• Determine/calculate appropriate quantities of materials/components required to complete
a task
LESSON NOTES:
• 3-D shape/diagram: A dimensional construction of a real-life object. It is a solid, it has
length, breadth/ width and height.
• Calculating surface area:
➢ Break the complex shape down into its basic shapes such as square, rectangle, triangle or
circle.
➢ Units must always be the same when calculating area.
➢ Use the given formula or choose the suitable formula
➢ Add the areas of all the basic shapes together to get the total area of the complex shape.
➢ To find the net shape , subtract the areas
➢ Area determined by multiplying 2 sides or squaring the radius when working with circle,
the unit is always squared
• Calculating volume:
➢ Volume: Amount of space that an object or substance occupies.
➢ Capacity: The maximum amount that something may contain
➢ Units must always be the same when calculating area.
➢ Use the given formula or choose the suitable formula
➢ The volume is determined by multiplying 3 sides, therefore the units are always cubed

60
Example 1
Puseletso is selling 0.75 litre of pine-gel and she uses two types of containers to package it. As
indicated in the diagram below. The volume of the cylindrical container is 785.5m3, while the volume
of a rectangular container is 812 cm3. Study the diagrams below and answer the questions
that follow:
1. Define volume in the given context.
-----------------------------------------------------------------------------------------------------------------------------
2. Determine the diameter of a cylindrical container in centimetres.
------------------------------------------------------------------------------------------------------------------------------
3. Show that the height of the rectangular container is 14.5 cm.
------------------------------------------------------------------------------------------------------------------------------
4. Which of the two containers do you think will attract more customers? Explain the volume of a
cylinder to litres.
NB: 1 litre = 1 000 cm3
-------------------------------------------------------------------------------------------------------------------------------
--------------------------------------------------------------------------------------------------------------------------------
--------------------------------------------------------------------------------------------------------------------------------
-------------------------------------------------------------------------------------------------------------------------------
--------------------------------------------------------------------------------------------------------------------------------
-------------------------------------------------------------------------------------------------------------------------------
--------------------------------------------------------------------------------------------------------------------------------
-------------------------------------------------------------------------------------------------------------------------------
--------------------------------------------------------------------------------------------------------------------------------
-------------------------------------------------------------------------------------------------------------------------------
--------------------------------------------------------------------------------------------------------------------------------
-------------------------------------------------------------------------------------------------------------------------------
------------------------------------------------------------------------------------------------------------------------------
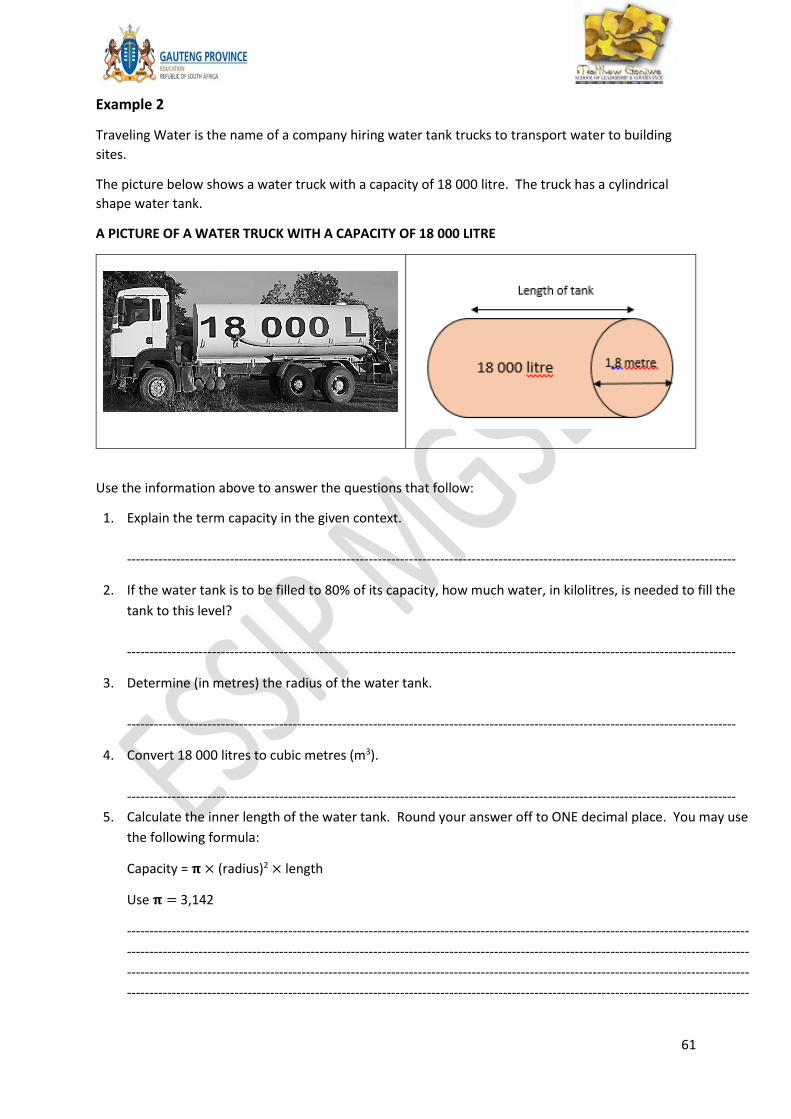
61
Example 2
Traveling Water is the name of a company hiring water tank trucks to transport water to building
sites.
The picture below shows a water truck with a capacity of 18 000 litre. The truck has a cylindrical
shape water tank.
A PICTURE OF A WATER TRUCK WITH A CAPACITY OF 18 000 LITRE
Use the information above to answer the questions that follow:
1. Explain the term capacity in the given context.
----------------------------------------------------------------------------------------------------------------------------------------
2. If the water tank is to be filled to 80% of its capacity, how much water, in kilolitres, is needed to fill the
tank to this level?
----------------------------------------------------------------------------------------------------------------------------------------
3. Determine (in metres) the radius of the water tank.
----------------------------------------------------------------------------------------------------------------------------------------
4. Convert 18 000 litres to cubic metres (m3).
----------------------------------------------------------------------------------------------------------------------------------------
5. Calculate the inner length of the water tank. Round your answer off to ONE decimal place. You may use
the following formula:
Capacity = 𝛑 × (radius)2 × length
Use 𝛑 = 3,142
-------------------------------------------------------------------------------------------------------------------------------------------
-------------------------------------------------------------------------------------------------------------------------------------------
-------------------------------------------------------------------------------------------------------------------------------------------
-------------------------------------------------------------------------------------------------------------------------------------------

62
Example 3
The chocolate below was given to all participants at the competition. Study the diagrams below and answer the questions that follow.
1. Calculate the total area of all the rectangular sides of the chocolate pack.
You may use the following formula:
Area = length × Width
2. Calculate the perimeter of one triangle in mm.
Additional Notes--------------------------------------------------------------------------------------------------------------------------
-------------------------------------------------------------------------------------------------------------------------------------------------
-------------------------------------------------------------------------------------------------------------------------------------------------
-------------------------------------------------------------------------------------------------------------------------------------------------
-------------------------------------------------------------------------------------------------------------------------------------------------
-------------------------------------------------------------------------------------------------------------------------------------------------
-------------------------------------------------------------------------------------------------------------------------------------------------
-------------------------------------------------------------------------------------------------------------------------------------------------
-------------------------------------------------------------------------------------------------------------------------------------------------
-------------------------------------------------------------------------------------------------------------------------------------------------
-------------------------------------------------------------------------------------------------------------------------------------------------
-------------------------------------------------------------------------------------------------------------------------------------------------
-------------------------------------------------------------------------------------------------------------------------------------------------
-------------------------------------------------------------------------------------------------------------------------------------------------
-------------------------------------------------------------------------------------------------------------------------------------------------
-------------------------------------------------------------------------------------------------------------------------------------------------
-------------------------------------------------------------------------------------------------------------------------------------------------
-------------------------------------------------------------------------------------------------------------------------------------------------
-------------------------------------------------------------------------------------------------------------------------------------------------

63
Activity 2.3.1 Group Discussion (30 Minutes)
Instructions
• Refer to the questions provided
• These questions are intended to advance skills that can be used in the classroom and possible ways in
which this section can be taught
• Task 1: Answer all the questions
• Task 2: Allocate marks for each question
• Report Back and Discussion
• Resources: Training manual, Note Pad, Pen and Calculator
PICTURE OF A CONCRETE TROUGH OUTER DIMENSIONS OF A TROUGH
Length : 3 m
Width : 685 mm
Height : 40 cm
Volume of a rectangular prism = length × width × height
Note : A trough is a long , narrow, open container for animals to drink from.
1ℓ = 1000 cm3
Use the information above to answer the following questions:
1. Calculate , in cm3, the volume of concrete used to make this trough if the trough can hold a
maximum of 485 ℓ of water.
--------------------------------------------------------------------------------------------------------------------------------
2. A cow drinks 56 ℓ of water per day. Alfred stated that a full trough has enough water for 6 cows
per day. Verify , with calculations , whether this statement is CORRECT.
--------------------------------------------------------------------------------------------------------------------------------
3. Determine how long , to the nearest minute, it will take to fill a half empty trough if the water flos
in at a rate of 14.5ℓ per minute.
--------------------------------------------------------------------------------------------------------------------------------

64
Activity 2.3.2 Group Discussion (30 Minutes)
Instructions
• Participants should form groups of 4 – 5
• Refer to the questions provided
• These questions are intended to advance skills that can be used in the classroom and possible ways
in which this section can be taught
• Task 1: Answer all the questions
• Task 2: Identify the taxonomy levels for each questions
• Report Back and Discussion
• Resources: Training manual, Note Pad, Pen and Calculator
During winter many children develop coughs.
Cough syrups are sold in bottles packed in rectangular prism-shaped boxes.
Children are given cough syrup using a cylindrical measuring cup.
The diagrams below show the bottle, the box and measuring cup.
Use the inofrmation above to answer the questions that follow:
1. Consider cough syrup box.
(a) Calculate (in cm3) the total surface area of the cough syrup box.
(b) Give a practical reason why a cartoon picture would feature on
the box of cough syrup for children.
2. Calculate ( in cm ) the height of the medicine measuring cup in the diameter is 2.52 cm and the volume
is 10 mℓ.

65
3. Nolo bought his son a chocolate from the supermarket after buying the cough syrup.
The chocolate was wrapped in a cone wrap as shown in the diagram below . Determine the volume of
the cone.
You may use the formula : Volume of a cone = 1
3𝜋 × 𝑟2 × ℎ
Additional Notes:
-------------------------------------------------------------------------------------------------------------------------------------
--------------------------------------------------------------------------------------------------------------------------------------
--------------------------------------------------------------------------------------------------------------------------------------
--------------------------------------------------------------------------------------------------------------------------------------
--------------------------------------------------------------------------------------------------------------------------------------
--------------------------------------------------------------------------------------------------------------------------------------
--------------------------------------------------------------------------------------------------------------------------------------
--------------------------------------------------------------------------------------------------------------------------------------
--------------------------------------------------------------------------------------------------------------------------------------
--------------------------------------------------------------------------------------------------------------------------------------
--------------------------------------------------------------------------------------------------------------------------------------
--------------------------------------------------------------------------------------------------------------------------------------
--------------------------------------------------------------------------------------------------------------------------------------
--------------------------------------------------------------------------------------------------------------------------------------
--------------------------------------------------------------------------------------------------------------------------------------
--------------------------------------------------------------------------------------------------------------------------------------

66
Activity 2.3.3 Group Discussion (30 Minutes)
Instructions
• Participants should form groups of 4 – 5
• Refer to the questions provided
• These questions are intended to advance skills that can be used in the classroom and
possible ways in which this section can be taught
• Task 1: Answer all the questions
• Task 3: Allocate marks for each question
• Report Back and Discussion
• Resources: Training manual, Note Pad, Pen and Calculator
Adapted from WC Prelim 2019 P2
1. Calculate the amount of material that is needed to make the tent. The ground cloth is
attached to the structure of the tent. Use the formula:
Surface area = 2(length × slant height) + ( length breadth ) + ( base × perpendicular height )
Corniël made a tent for camping with his friends while fishing over the weekend as shown
in the diagram below :
• the length is 2,45m
• the breadth 1,75 m
• the slant height 1,737 m and
• the perpendicular height 1,5 m.
1,5 m
2,45m
1,75 m
1,737 m
cm

67
Corniel brought his 3 sons along to teach them to catch fishes. He also brought a cricket ball and a
spherical stress ball to enable them to play while relaxing. His older son clained that the cricket ball
has a greater volume. Verify his claim.
You may use the formula : Volume of a sphere = 4
3 𝜋r3
The dimensions of the balls are indicated in the table below
Diameter = 2.59 inches 1 inch = 2.54 cm
Radius = 2 cm
Activity 2.3.4. Individual Work (20 Minutes)
Instructions
• Refer to the context provided: How to download a video lesson
• These questions are intended to advance ICT skills that can be used in the classroom
• Task : Download a video lesson for calculating volume of a Cone
• Report Back and Discussion
• Resources: Training manual, Laptop and Wi-fi

68
SUMMARY FOR THE UNIT
• In this module, participants were exposed to calculating perimeter, area and volume including
surface area and circumference; calculated rectangles, triangles and circles viz. quarter, semi and
three –quarters using known formulae and calculated rectangular prisms, cylinders and cones
using known formulae.
• Summary of 2D and 3D shapes

69
RECOURCES FOR MODULE 2
1. Free state 2019 Preliminary Paper 1
2. DBE 2019 June and November NSC Paper 2 Question 2
3. Mpumalanga 2019 Preliminary Paper 2
4. Western Cape 2019 Preliminary Paper 2
REFLECTION
You should provide learners with conversion tables or methods like ‘King Henry Died a Miserable
Death Called Measles’ when doing conversions from one unit of measurement to another. Glossary
of terms such as radius and diameter should be reinforced on a regular basis. Teachers should
provide learners with enough exercises on how to substitute correct values into a given formula.
Teachers should encourage learners to write a glossary at the back of their books of the different
terms’ meanings as they complete each topic
END OF MODULE 2