The Challenge of Formative Assessment in Mathematics Education: Children’s Minds, Teachers’ Minds
Upload
khangminh22Category
view
0download
0
Mathematics for Teachers of Young Children
Fall 2009 Edition
Sharon Camner Mathematics Department
Pierce College

Mathematics for Teachers of Young Children
By Sharon Camner
Copyright © 2009 Sharon Camner
This text is licensed under a
Creative Commons
Attribution-Noncommercial-No Derivative Works 3.0 United States license
To view a copy of this license, visit http://creativecommons.org/licenses/by-nc-nd/3.0/us/
You are free:
• to Share — to copy, distribute and transmit the work
Under the following conditions:
• Attribution — You must attribute the work in the manner specified by the author or
licensor (but not in any way that suggests that they endorse you or your use of the work).
• Noncommercial — You may not use this work for commercial purposes.
• No Derivative Works — You may not alter, transform, or build upon this work.
With the understanding that:
• Waiver — Any of the above conditions can be waived if you get permission from the
copyright holder.
• Other Rights — In no way are any of the following rights affected by the license:
o Your fair dealing or fair use rights;
o The author's moral rights;
• Notice — For any reuse or distribution, you must make clear to others the license terms
of this work. The best way to do this is with a link to this web page
http://creativecommons.org/licenses/by-nc-nd/3.0/us/ .
To contact Sharon Camner, the copyright holder of this work, to request permission for a waiver
of any of the conditions of this copyright, please email [email protected] . Requests that
relate to improving access for students to these materials or to improving education of students
will be seriously considered.

iii
Contents Introduction v Acknowledgements v Contact for providing Feedback vi 1. Problem Solving Page 1 – 1 1. Extension: Math Anxiety. Page 1 –15 2. Classifying, Sorting, Patterns, Sequences 2-1 The Foundations of Algebra Page 2 – 1 2-2 Seriation, Classification, and Sets Page 2 – 2 2-3 Patterns and Sequences Page 2 – 14 2-4 Patterns and Function Rules Page 2 – 24 3. Numeration Systems and Counting Page 3 – 1 3-1 Ancient Numeration Systems Page 3 – 2 3-2 Counting and Children Page 3 – 10 4. Operations on Whole Numbers Page 4 – 1 4-1 Addition of Whole Numbers Page 4 – 2 4-2 Subtraction of Whole Numbers Page 4 – 12 4-3 Multiplication of Whole Numbers Page 4 – 22 4-4 Division of Whole Numbers Page 4 – 34 4-5 Exponents, Powers of Ten, and Order of Operations Page 4 – 49 5. Fractions 5-1 Fraction Introduction Page 5 – 1 5-2 Multiplication of Fractions Page 5 – 9 5-3 Equivalent Fractions Page 5 – 20 5-4 Division of Fractions Page 5 – 24 5-5 Addition and Subtraction of Fractions Page 5 – 31 5-6 Comparing Fraction sizes Page 5 – 42 5-7 Operations with Mixed numbers Page 5 – 48 6. Decimals 6-1 Concepts and Representation of Decimals Page 6 – 1 6-2 Addition and Subtraction of Decimals Page 6 – 9 6-3 Multiplication and Division of Decimals Page 6 – 13 6-4 Converting between Decimals and Fractions Page 6 – 22 6-5 Applications of Decimals Page 6 – 32 7. Percents Page 7 – 1 7-1 Concept and Representation of Percents Page 7 – 3 7-2 Converting between Percents, Fractions, and Decimals Page 7 – 15 7-3 Mental Calculations with Percents Page 7 – 26 7-4 Percent Applications Solved with Equations Page 7 – 31

iv
8. Geometry 8-1 Introduction to Geometry Page 8 – 1 8-2 One-Dimensional and Two-Dimensional Geometry Page 8 – 3 (Curves, Polygons, Angles, Triangles, Quadrilaterals) 8-3 Activities in Two-Dimensional Geometry Page 8 – 19 8-4 Geoboards Page 8 – 32 8-5 Coordinate Geometry Page 8 – 39 8-6 Symmetry (Introduction, Reflective Symmetry, Page 8 – 53
Rotational Symmetry, Symmetry in Three-Dimensions) 8-7 Three-Dimensional Geometric Objects Page 8 – 77 9. Measurement 9-1 Introduction to Measurement Page 9 – 1 9-2 Length Page 9 – 6 9-3 Area Page 9 – 32 9-4 Volume, Capacity, and Surface Area Page 9 – 53 9-5 Weight, Temperature, and Time Page 9 – 67 9-6 Circles Page 9 – 78 9-7 Converting Units Page 9 – 88 10. Statistics and Probability 10-1 Introduction to Statistics Page 10 – 1 10-2 Displaying Data in Graphs Page 10 – 2 10-3 Measures of Center and Variability Page 10 – 21 10-4 Probability Page 10 – 30 References Appendix Appendix page - 1 Answers to Exercises Answers page - 1

v
Introduction This book is a mathematics text for those who plan to teach and care for young children. The approach of this book rests on the belief that teachers are always learners too. Teachers of young children can best help the children to learn and love mathematics when the teachers themselves engage in joyful exploration and learning of mathematics. There is not an end point when one can say “Okay, I’ve finished that. Now I know all the math I’ll ever need to know.” Rather, learning mathematics is a lifelong adventure. The primary goal of this book is to facilitate students’ development of a firm conceptual understanding of basic mathematics topics. Students will develop a strong set of mathematics skills that they can apply in their daily lives. Once they recognize that mathematics is accessible and intriguing, students will feel confident about continuing to explore mathematics on their own. This exploration may occur in classrooms with young children and also in further college coursework. This book is not intended to be an educational methods course. Some education applications are mentioned, such as the suggestions in many sections for how the topic might be approached with young children. The standards of the National Council of Teachers of Mathematics are pointed out as they apply to the topics, and occasionally authors of educational pedagogy are quoted. But this is not intended as a book concerning what and how to teach young children mathematics. This is a book for adults to become secure and confident in their own mathematical knowledge and abilities so they can share their learning and appreciation of mathematics with young children. The background required for this book is arithmetic. If the student has also studied algebra, that will come in handy in a few of the sections, but it is not required for success with this text.
Acknowledgements My work on writing this book was part of my sabbatical project approved by Pierce College for academic year 2008-2009. The book would not have been possible without that support. I thank Diane Downie, Pierce College mathematics instructor emeritus, for her numerous comments, suggestions, and re-writing which greatly improved the content of this book. I appreciate the extensive editing and numerous suggestions made by Kayana Hoagland, faculty member at South Puget Sound Community College. And I thank Lisa Camner, my daughter, for her skillful editing of the text.

vi
Please provide me with feedback about this book! Please let me know… • If you notice any sort of error in the book, (including bad grammar, wrong answers to problems, typos, etc.) • If you find some topics confusing, not explained well, etc. • If you think something else should be included in a section – if you have a specific idea or you simply think the topic should be expanded. • If you think some topic is done well, is clear to you, or is enjoyable. • If there is anything else you want to let me know about.
The best way to reach me is by email: [email protected] Or you can leave a voicemail message: 253-964-6754 When you write or call, it would be most helpful if you leave as much detail as possible (what page are you referring to? What exactly was wrong? Or what do you want to have changed?)
Thank you for your input! Sharon Camner

Chapter 1 – Problem Solving
Page 1 - 1
Chapter 1 Problem Solving Solving problems is part of everyday life. Everyone solves problems. For example: What courses should I take next quarter so I make progress towards my degree? What time should I leave campus so I can stop at the drug store and then pick up my son before the child care center closes at 6:00? How expensive a car can I buy so that the loan payments are less than 10% of my income? “Learning to solve problems is the principal reason for studying mathematics.”
- National Council of Supervisors of Mathematics What are “problems”?
“A problem exists when there is a situation you want to resolve but no solution is readily apparent. Problem solving is the process by which the unfamiliar situation is resolved” (Bennett-Nelson 2007: 3). Is “3 + 7” a problem? It is not a problem for you since you immediately know the solution is 10. But it could be a “problem” for a child in kindergarten. To solve this problem the child would first have to understand the notation: she would need to know how to read numerals and know what is meant by the addition sign. To find the solution she might devise a plan to count out 3 blocks and then 7 blocks and then count how many there are when she puts them together. After carrying out that plan she could announce that three plus seven equals ten. Another example of a problem for a young child might be to build a block tower to a certain height so that it doesn’t fall over. In this chapter we will explore examples of problems for adults and children and strategies for finding solutions.
The National Council of Teachers of Mathematics explains why problem solving is important: “By solving mathematical problems, students acquire ways of thinking, habits of persistence and curiosity, and confidence in unfamiliar situations that serve them well outside the mathematics classroom.” (From http://www.nctm.org/uploadedFiles/Math_Standards/12752_exec_pssm.pdf on p. 4, July 2008) Most of the problems our students will encounter in their lives will arise from situations they have not previously encountered. Gaining skills in problem solving will help prepare them for their future. To be effective in solving mathematical problems and other problems, one should: Be Creative Be Organized Be Persistent
The National Council of Teachers of Mathematics (NCTM) is an organization that provides leadership and professional standards in mathematics education (website at www.nctm.org). NCTM published a set of Principles and Standards in 2000. We will refer to these Standards in this course. You can find the “Principles and Standards for School Mathematics” at http://standards.nctm.org . From there the “executive summary” of the Standards can be downloaded in pdf form and printed. In addition, printed versions of the Standards are in many textbooks.

Chapter 1 – Problem Solving
Page 1 - 2
That last quality, being persistent, might be the most important – for both adults and children. As Juanita V. Copley writes in The Young Child and Mathematics (2000: 31), “All young children solve problems; yet even among preschoolers, differences in children’s dispositions toward problem solving may be seen. … Disposition is more than just a positive attitude toward math. An effective problem solver perseveres, focuses his attention, tests hypotheses, takes reasonable risks, remains flexible, tries alternatives, and exhibits self-regulation.”
Problem Solving Steps of George Polya George Polya was a famous twentieth-century mathematician who studied how people solve problems. His book “How to Solve It” (published in 1945 and translated into 18 languages) provides the following four steps as a problem-solving method. 1. Understand the problem. 2. Devise a plan to solve the problem. 3. Carry out the plan. 4. Look back. Polya’s problem-solving steps in more detail: 1. Understand the problem. Before solving a problem you need to understand what is being asked. For a
written problem, this usually requires reading the problem and then reading it again. As you read it the second and third times, write down what you know about the situation. Clearly write out what you are trying to figure out.
2. Devise a plan to solve the problem. Consider approaches you could take to work on the problem. Later we list several
good strategies for solving problems; see if one of them would apply to this problem. Be creative.
3. Carry out the plan. In this step you should be organized, making sure you carefully follow through on
all of the steps of the plan you created. If the plan is not working, you can go back to step 2 and devise a different plan.
4. Look back. “Looking back” may involve any of the following: - Look back to what the original question was and make sure that you answered
that question, all of that question, and not some different question. - Check over your work in carrying out the plan to see that you didn’t make any
small errors. - Use estimating and common sense to check whether the answer you obtained is
reasonable. - If appropriate, record your results. - Look over the entire problem situation to see if you can learn something from it.
Are there any extensions to similar problems that interest you? - Now that you have an answer to the question, do you see another approach to
getting this answer that might have been easier or just different? Example 1 using Polya’s Problem-Solving Steps
The earlier description of a kindergarten child solving the problem “3 + 7” can illustrate the four steps, as follows. 1. Understand the problem: The child must understand the notation – the symbols for
the numbers and the addition sign – before being able to begin solving the problem.

Chapter 1 – Problem Solving
Page 1 - 3
2. Make a plan: The plan the child devises could be to use blocks to find the solution, with the plan to count out the number of blocks for each of the two numbers being added, and then to put the piles together and count the total number of blocks.
3. Carry out the plan: The child would then carry out that plan with the blocks. 4. Look back: The child could look back and realize she should write the answer “10”.
She could also check whether there were any additional problems to solve. She might decide to check her counting by counting again. Upon doing many problems along these lines, the child might notice something that is new to her: that when she wants to find the total number of blocks, she does not need to count all of them again. Rather she could remember that the pile of seven was just counted, and then go to the other pile and count “eight, nine, ten”. This method is sometimes called “counting on.”
Example 2 using Polya’s Problem-Solving Steps
Carla made labels for all the file boxes in the office storage room. The boxes were numbered in order with the first one labeled “1” and the last one labeled “137”. However, the label maker was partially broken; it couldn’t make the digit “4”. So any label that would have a digit “4” in it was skipped (for example, “24” was skipped). How many boxes are in the storage room? 1. Understand the problem: At first it might seem that there were 137 boxes since the
boxes were labeled from 1 to 137. But then we are told that labels with the number “4” in them were not made. Evidently, the numbers from 1 to 137 that have a “4” in them simply weren’t used as labels. We need to find out how many labels were used, which would be the numbers from 1 to 137 that do not have a “4” in them.
2. Make a plan: - We could list all the numbers from 1 to 137, but don’t write any number with a “4” in
it, then count the numbers left. That wouldn’t be too hard, but is there a simpler way? - It would be easier to list all the numbers that DO have a “4”, and then count how
many of them there are. - To make sure we count all the numbers with a “4”, let’s be organized and think of the
places the “4” could be. It is either in the “one’s place” or else in the “ten’s place”. (Note: It could be in the “hundred’s place”, except that the highest number involved here is 137 so we don’t get to having a “4” in the hundred’s place.)
3. Carry out the plan: A “4” is in the one’s place in 4, 14, 24, 34, 44, 54, 64, 74, 84, 94, 104, 114, 124, 134.
There are 14 numbers in that list. A “4” is in the ten’s place in 40, 41, 42, 43, 44, 45, 46, 47, 48, 49 and there are ten
numbers in that list. Notice: There is one number in BOTH of these lists, namely 44, and we don’t want to
count it twice! So the total count of numbers with a “4” in them is 14 (in the first list) plus 10 (in the second list) minus 1 (the “44” that was in both lists). The result is 14 + 10 – 1 = 23.
23 numbers have a “4” in them between 1 and 137. 4. Look back: We didn’t yet answer the question asked. How many boxes are in the storage room?
From the 137 we subtract 23 (the number of labels that couldn’t be made because

Chapter 1 – Problem Solving
Page 1 - 4
they have a “4” in them), resulting in 114. Hence, there are 114 boxes in the storage room.
Problem-Solving Strategies It is helpful to keep in mind various strategies or methods that can be used in solving many kinds of problems. Here is a list of some useful methods, along with examples of their use. Note that not all strategies are needed for each problem. Deciding which strategy to try for a particular problem will become easier with practice. A. Make a Drawing or Diagram
Example: A fence is made by putting a vertical post every eight feet. For a fence that is 40 feet long, how many posts are needed?
Strategy: Sketch a drawing of the fence, starting with the first post, then labeling 8 feet to the second post: | ……. | Continue until you have a total of 40 feet.
8 ft Recall that 8 x 5 = 40.
| …….| …….| …….| …….| …….| ! count the posts: 6 of them 8 ft 8 ft 8 ft 8 ft 8 ft ! check the distance: 8 ft x 5 = 40 feet. Answer: Six posts are needed for this fence. Note that a post is needed at each end.
B. Make a Table or Chart Example: At a carnival game there is a bucket full of pennies, nickels, and dimes, all
mixed together. It costs 5 cents to play. Without looking in the bucket, the player uses a large tweezers to pull out a coin, and he does this three times. What are the various amounts of money the player might end up with?
Strategy: First, understand the problem. The player will pull out three coins. Each coin will be either a penny, a nickel, or a dime. The same type of coin might be obtained once, twice, or three times. We can make an organized list or chart of the possibilities, labeling the columns with the types of coins. Each row represents a possible collection of three coins. The final column gives the value of the coins, in cents, for that combination of three coins.
Total Number
of Coins Number of
Pennies Number of
Nickels Number of
Dimes Total Value
in cents
3 3 0 0 3 3 2 1 0 7 3 2 0 1 12 3 1 2 0 11 3 1 1 1 16 3 1 0 2 21 3 0 3 0 15 3 0 2 1 20 3 0 1 2 25 3 0 0 3 30
In the chart we see the ten different amounts of money that a player could pull from the
jar. Look back: We can now extend this situation by analyzing the game from the point of
view of the player and the carnival.

Chapter 1 – Problem Solving
Page 1 - 5
- Is it a good deal to play this game? Yes: the player pays only 5 cents to play, and 9 of the 10 possible draws earns the player more than 5 cents.
- Will the carnival make money on this game? No, since a player pays only 5 cents to play but is probably going to win more than that. So the carnival loses money.
- What should the carnival charge for playing this game so that they’d make money? This is a more difficult question, involving the concept of expected value from probability. One idea would be to find the average of the numbers in the “total value in cents” column that a player might make, since each of these outcomes is equally likely. The average is (3 + 7 + 12 + 11 + 16 + 21 + 15 + 20 + 25 + 30)/10 = 16. If the carnival charges more than 16 cents to play, then it should make money in the long term. Perhaps they should charge 20 cents, or 25 cents. In that case, sometimes the player would win more money than s/he paid (so the player would want to take the gamble). But usually the player would win less than s/he paid, and so the carnival would come out ahead.
C. Guess, Check, Revise Example: Place the numbers 1, 2, 3, 4, and 5 in the circles below, one number in each
circle, so that the sum of the numbers across the horizontal row equals the sum of the numbers in the vertical column.
Strategy: It is often useful to make a guess at the solution to a problem and then check if
it truly fits all the conditions of the problem. If not, think about how to change the guess so that it would be closer to the solution. Then check that new, revised guess. Continue revising and checking until you have a solution that works. For this problem, one approach is to simply put one number in each circle, and see if the sum of the horizontal and vertical are the same. If not, think about how to revise the guess (for example: when one sum is too large then you need to remove one of those numbers and switch its place with a smaller number). Continue revising your guesses until you find an arrangement of the numbers that gives the same sums. Be persistent.
Look back: Is the answer you found the ONLY way to arrange the numbers? Hint: There are three different numbers that could go in the center circle to give
correct answers. Try to find all the possible solutions. Do you notice a pattern to what type of number can be in the center circle? Can you figure out why this is necessary? (The answer can be found at the back of the book.)
D. Work Backwards
Example: Tommy had a habit of losing pencils, so one morning he brought a lot of pencils with him when he left his apartment. Unfortunately, he dropped half of them before he got on the school bus. Then he gave two pencils to his younger brother. He left one in his classroom. When he got back home he had four pencils left. How many pencils did he have when he left home that morning?

Chapter 1 – Problem Solving
Page 1 - 6
Strategy: In this problem things happened in sequence and we know how things ended up, so maybe we can work backwards. Start at the end of the day and see how many pencils Tommy would have had at each stage.
Carry out the plan: Tommy had 4 pencils when he got home. He left one in his classroom so he must have had 5 pencils in the classroom. He gave two pencils to his brother, so he must have had 5 + 2, which is 7, pencils
then. Before that he had dropped half his pencils. After dropping half of them he had 7 left.
If he dropped half, then he had half remaining. So the 7 pencils he had remaining were half of the pencils. So he must have had 14 pencils earlier (since 7 is half of 14).
Conclusion: Tommy had 14 pencils when he left home. Look back: Let’s go over the problem “forwards” to check if our solution works out. Suppose Tommy started with 14 pencils. He dropped half before the school bus, so he dropped 7 and had 7 left. He gave his brother 2 of the 7, so then he had 5 left. He left one of those 5 in the classroom, so then he had 4 left when he got home. The solution checks out.
E. Use a Formula or Equation Example: Chris wants to paint the workshop ceiling. One can of paint covers 350 square
feet. The workshop is 30 feet long and 22 feet wide. How many cans of paint are needed?
Strategy: Sometimes it is necessary to know and use a fact or formula to solve a problem. The paint covers an area, so we need to find the area of the ceiling. The formula needed is for finding the area of a rectangle. If you know the formula, recall it, and if not then look it up: Area of a rectangle = length x width.
Carry out the plan: The ceiling’s area is 30 ft x 22 ft = 660 square feet. We still need to know how much paint is needed. One can is not enough. Two cans
of paint cover 2 x 350 square feet, which is 700 square feet. So two cans of paint should be enough, but there won’t be much left over.
F. Make a Model
Explanation: To “model” a problem means to solve the problem using objects or diagrams or something that represents what the problem is about.
Example 1: Harvey thinks he can make money through buying and selling rare stamps.
He buys such a stamp from Craigslist.com for $10. Then he sells it to a friend for $15. The friend is leaving town and needs money so Harvey buys the stamp back for $22. Then he sells it on Craigslist.com for $30. After all this dealing, did Harvey come out financially ahead or behind? How much ahead or behind?
Strategy: A good way to deal with this problem would be to take out some money (“play money” would work fine), and go through the transactions described here. One person could be Harvey, and he could start with some money – probably $30 is enough since that is the highest amount in the problem. Another person could be the “banker” and take the money to and from Harvey for the transactions.
Carry out the plan: Get or make some “play money” and model this problem. Result: Harvey comes out ahead. He ends up with $13 more than he started with. (–10 + 15 – 22 + 30 = 13)

Chapter 1 – Problem Solving
Page 1 - 7
Example 2: What is the sum of the numbers 1 + 2 + 3 + 4 + 5 + 6 + 7 + 8 ?
Strategy: You do not need any special way to solve this problem; you could simply add these numbers to get the correct sum. But let’s use a “model” for this problem, because the model will come in handy for other problems that are a lot more difficult.
This is the Staircase Method. For this model, let one square of grid paper (also called graph paper) represent the
number one. Next to it two squares in a column represent the number 2, then three squares in a column represent 3, and so on. To model the sum we would have: one square + two squares + 3 squares + … + 8 squares. To find the sum, we would need to know how many squares all together there are.
! Here is the model of the sum 1 + 2 + 3 + 4 + 5 + 6 + 7 + 8 Rather than counting the squares (which would be a bit tedious), we could determine how many there are in this way: Make another copy of this model, but shade it in so we can tell the
two copies apart. And turn it upside down "
Slide the two models together to make one large rectangle:
We want to know the number of white squares, which is the same as the number of grey squares. The white squares are half of the total number of squares in this large rectangle. To get the total number of squares in the large rectangle, notice that there are 8 columns, and each column is 9 high. So the total number of squares is 8 x 9 = 72. The white squares are half of them. Half of 72 = 72 2 = 36.
Conclusion: the sum of 1 + 2 + 3 + 4 + 5 + 6 + 7 + 8 is 36. Looking back: Extend this problem. Use the same model to find the sum of 1 + 2 + 3 + 4 + 5 + 6 + 7 + 8 + 9 + 10 + 11 + 12.
G. Compare with a Similar or Simpler Problem Explanation: Sometimes a problem might be similar to another problem that you already
know how to solve; then you can use the same method on the new problem.

Chapter 1 – Problem Solving
Page 1 - 8
Sometimes a complicated problem can be broken into simpler parts that can be done separately.
Example: What is 1 + 2 + 3 + 4 + … + 97 + 98 + 99 + 100? That is, what is the sum of the whole numbers from 1 through 100?
Strategy: This problem is similar to the simpler problem to find the sum of the whole numbers from 1 through 8 (1 + 2 + 3 + … + 8) which was already solved. We can see if the same method can be used to solve this problem. To add the numbers 1 through 8, the Staircase model was used involving squares on grid paper. Each number to be added was represented by one column of squares.
For this problem, there would be one square, then a column of two squares, then a column of three squares, and so on until there was a column of 99 squares and then a column of 100 squares. It is not reasonable to actually draw all of these columns, so we simply visualize what the columns would look like and draw a sketch of the situation.
The 100 columns would look like the first figure (you must imagine that all the columns between three and 97 are there). Then a second copy of the figure is made, and turned upside down, and shaded grey. This sketch is not drawn to scale, but simply gives the general idea of what the columns would look like.
100 columns
100 high 100 high
100 columns
Next the two copies are put together to form one large rectangle.
! This rectangle, composed of the two sets of columns, (the white set and the grey set) is 100 columns wide. (You must imagine that all the columns in between size 2 and size 99 are there.) The height is 101 since the side is formed by a column of size 100 plus a column of size 1.
We want to know the total size of the white columns, which is the same as the total size of the grey columns. To get the total size of the large rectangle, we multiply 100 columns times the total height of 101. So the total size of the large rectangle is 100 x 101 = 10,100. The white columns are half of that. Half of 10,100 is 10,100 2 = 5,050.
Conclusion: the sum of 1 + 2 + 3 + … + 98 + 99 + 100 = 5,050.
...
...
...
...

Chapter 1 – Problem Solving
Page 1 - 9
Historical Story and Gauss’s Method
There is a story behind the problem of finding the sum of the whole numbers from 1 to 100. Carl Friedrich Gauss is a well-known mathematician who lived in Hanover, Germany, from 1777 to 1855. The story goes that when he was a young lad in school, the teacher wanted the students to be quiet and busy for awhile so he told them to add the numbers from 1 to 100. A few moments later, young Gauss had the result, no doubt irritating his teacher.
The method that Gauss used is similar to the method we used, though it did not
involve the diagrams. Rather, Gauss reasoned that he could think of the numbers from 1 to 100 added, and then think of the numbers again, this time starting at 100 and going to 1. Those two sums are the same as each other, of course. Next, the two rows of numbers are added together by adding the two numbers lined up above each other. We want: 1 + 2 + 3 + ... + 98 + 99 + 100 It is the same as: 100 + 99 + 98 + … + 3 + 2 + 1 Add the two rows: 101 + 101 + 101 + … +101 + 101 + 101 The two rows added together one-by-one results in the number 101 for each partial sum, and this partial sum of 101 occurs 100 times. So the total sum of that row is 100 x 101 = 10,100. That total sum is the sum of both rows of 1 to 100, and so the sum of one set of numbers from 1 to 100 is half of 10,100 = 10,100 ÷ 2 = 5,050. Notice that this method is similar to the Staircase Method above with the diagrams. The two rows of numbers added together correspond to the large rectangle diagram (each of them equals a total of 100 x 101, and that result is for two sets of the numbers from 1 to 100 and thus must be divided by 2). Some students will definitely prefer the method that shows the diagrams; they might be visual learners. Other students will be comfortable with the symbolic approach. For you as a teacher, it is good to become comfortable with both approaches so that you can work with students who have various learning styles.
H. Work with Other People Explanation: When people work together they can each contribute ideas and pool their
knowledge. Also, each person might have a different approach to the problem. Sometimes it is simply that each person contributes part of the solution, and then together they have the entire solution. Other times when people cooperate and communicate, something “magical” happens – together they move to a new level and accomplish things that none of them could accomplish alone.

Chapter 1 – Problem Solving
Page 1 - 10
Summary of Problem-Solving Strategies
A. Make a drawing or diagram
B. Make a table or chart
C. Guess, check, revise
D. Work backwards
E. Use a formula or equation
F. Make a model
G. Compare with a similar or simpler problem
H. Work with other people
Part of developing problem solving skills is determining which of these strategies will help solve the problem at hand.
NCTM Process and Content Standards The rationale for studying problem solving is given in the NCTM Principles and Standards for School Mathematics: “Problem solving is the cornerstone of school mathematics. … Students who can both develop and carry out a plan to solve a mathematical problem are exhibiting knowledge that is much deeper and more useful than simply carrying out a computation.” (NCTM 2000: 182) We want students to develop problem-solving skills so they can solve the new and different problems they encounter in their lives and their work.
Process Standards The National Council of Teachers of Mathematics (NCTM) lists five “Process Standards.”
(http://standards.nctm.org/document/appendix/process.htm) We have just studied the first one of these (Problem Solving). Juanita V. Copley in The
Young Child and Mathematics discusses all five of the Process Standards in Chapter 3, making the following points.
1. Problem Solving – all young children are problem solvers, but children’s dispositions
(attitudes) towards problem solving may differ. As we saw above, problem solving is the main reason to study math. It is important to recognize that students are not only learning math; they are learning problem-solving and this is useful in all areas of life.
2. Reasoning – there are many opportunities to use reasoning in life, for adults and for children. But young children are still in the process of developing the ability. To promote this development, their teachers and parents should ask them regularly, for example, “How do you know that?” or “What would happen if…?”
3. Communicating – we need to be able to talk about what we are thinking; children need to articulate their thoughts (learn the right words/vocabulary, organize their thinking). Help children by verbalizing what is going on, using correct words but ones that children would understand. Listen attentively to children.
4. Connecting – connect intuitive math ideas with formal ones. For example, the thought “I can have 3 apple slices, I have 2 now, so I need one more” connects to

Chapter 1 – Problem Solving
Page 1 - 11
“2 + ? = 3”. Also connect math to other subjects (artwork shapes, music rhythm, etc.) and to everyday life.
5. Representing – involves making drawings, writings, or symbols of what one is thinking. This is linked to communication. Use many representations with children, such as pictures, graphs, or numerals.
The National Association for the Education of Young Children (NAEYC) encourages
teachers to pay attention to these Process Standards: “While content represents the what of early childhood mathematics education, the processes – problem solving, reasoning, communication, connections, and representation – make it possible for children to acquire content knowledge. These processes develop over time and when supported by well-designed opportunities to learn.” (from http://naeyc.org/about/positions/psmath.asp)
Content Standards The National Council of Teachers of Mathematics (NCTM) lists five “Content Standards” for school mathematics. You can visit http://standards.nctm.org/document/chapter4/index.htm for an overview of the Standards as they apply to Pre-kindergarten through Grade 2. We will list these in later chapters as we encounter the different content areas. The five content standards are:
1. Number and Operations 2. Algebra (including Patterns and Functions) 3. Geometry 4. Measurement 5. Data Analysis and Probability

Chapter 1 – Problem Solving
Page 1 - 12
Chapter 1 - Exercises on Problem Solving For most of these problems you will need to use other paper to do the work and record the answers. 1. For the following problems, use the problem solving strategy that is suggested. (This will give you practice with
these methods in problems where the method works well.)
a) Make a drawing or diagram. Sophia borrowed six small tables for her son’s birthday party in her backyard. Each table can seat one
person on a side. Sophia wants to put the tables into a rectangular shape so that it looks like one large table. What are the different ways she could arrange the six tables – and for each arrangement, how many people can be seated?
(for example, if she had only four tables, she might arrange them this way: and 8 people could be seated.
And there is another way to arrange 4 tables, to seat 10 people.).
b) Make a table or chart. How many different ways can you make 12 cents in change with U.S. money?
c) Guess, check, revise.
Teddy, who loves numbers, says “I really like my two favorite numbers . One of the numbers is exactly 3 larger than the other one. When I multiply them, I get 180. Do you like my favorite numbers too?” What are Teddy’s two favorite numbers? (use a calculator if you wish)
d) Work backwards. Songhi and Trina brought their pebble collections to school. Songhi had 12 more pebbles than Trina. To help them even-out the number, the teacher said that each day Songhi could add 3 pebbles to her collection and Trina could add 5 pebbles to her collection. They have been doing that for awhile and today Songhi has 47 and Trina has 45. How many pebbles did each girl have at the start? Extension: who will have more pebbles tomorrow?
e) Use a formula or equation. Driving along the empty highway, Chris set the car on cruise control and went at 65 miles per hour for the next 3 hours. How far did Chris drive? (Formula you may use: distance = speed • time.)
f) Make a model. To the right is a “domino doughnut” with 8 dots along each side (8 dots along each of the four sides of the “square donut”). Use the four dominoes pictured next to make a “domino donut”
x
x
x x
x
x
x x

Chapter 1 – Problem Solving
Page 1 - 13
with 9 dots along each side. You may want to make a model of the dominoes that you can move around to do this.
For each of the following, solve the problem using whichever method you want and ALSO write which strategy you used. You might want to use more than one strategy on a problem. The Problem Solving Strategies:
• Make a drawing or diagram • Make a table or chart • Guess, check, revise • Work backwards • Use a formula or equation • Make a model • Compare with a similar or simpler problem • Work with other people
2. Aunt Susie left cupcakes cooling on the counter. Her bad dog ate half of them! Then her nephew ate three. At
that point there were eight cupcakes left. Aunt Susie ate one. # How many did she have originally? 3. At the Baby Animals Zoo there are children with their parents in the goat pen petting the young goats. There are
13 heads and 32 feet in that pen. How many people and how many goats are there? (Only people and goats are in the pen.)
4. a) Su Yung had some pencils. She gave three pencils to her friend Juan. Then she gave half the remaining
pencils to Kara. Finally she gave two pencils to Alisdair. That left her with four pencils for herself. How many pencils did she have originally?
b) Create a problem like this. It does not need to be about pencils, but should follow the general idea of this
type of problem. Also, write the solution. 5. Use the “Staircase Method” or “Gauss’ Method” to find the following sums. [Do not simply add the numbers!] a) 1 + 2 + 3 + 4 + 5 + 6 + 7 + 8 + 9 + 10 + … … + 16 + 17 + 18 b) 1 + 2 + 3 + 4 + … + 73 + 74 + 75 c) 28 + 29 + 30 + 31 + 32 + 33 + 34 + 35 + 36 + 37 + 38 + 39 + 40 + 41 + 42

Chapter 1 – Problem Solving
Page 1 - 14
6. a) If you take ten steps forward and two steps back every minute, how long will it be until you reach a point 30 steps ahead of where you started?
b) What will be the total distance you have traveled (how many steps total have you taken)? 7. Some children in the play-yard were riding bicycles and tricycles. If eleven children were riding, and their
vehicles had 29 wheels, how many children were riding bicycles and how many were riding tricycles? 8. How many ways are there to make 27 cents in change with U.S. money? 9. Tanya is putting peanut butter on crackers. Every time after she puts peanut butter on five crackers, she eats
one of them. She ended up with 24 crackers with peanut butter on them that she packed into a storage box. How many peanut-butter-covered-crackers did she eat? How many total crackers did she put peanut butter on?
10. Gerald is putting toasters and can-openers on the shelves at the store. A toaster is twice as wide as a can
opener. One shelf can hold 3 toasters or else 6 can openers, or some combination of the two items. Gerald has 5 toasters and 7 can openers to shelve. How many shelves will that require?
11. Rob is planting some dwarf fruit trees in a row in his yard. The trees must be spaced so each tree has 5 feet
all around the trunk so it has room to grow that far out in each direction. The yard is 40 feet long from one side to the other. How many trees can he plant, keeping them spaced properly? Draw a diagram to show how this can be done.
12. Place the numbers 10, 12, 14, 16, and 18 in the circles here, one number in each circle,
so that the sum of the numbers across the horizontal row equals the sum of the numbers in the vertical column.
13, Julia’s garden is 20 feet long and 14 feet wide. The fertilizer label says that one cup of fertilizer should be
spread over 12 square feet. How many cups of fertilizer are needed to cover the garden? 14. a) Dennis was playing under a chair at the veterinarian’s office as people waited with their dogs. He counted
thirty-eight legs in the room including his own. His Mom counted twelve total dogs and people in the room, including herself. How many dogs were in the room?
b) Create a problem like this. It does not need to be about legs, but should follow the general idea of this type
of problem. Also, write the solution. 15. Chose one of the problem solving strategies listed above. Make up a problem like the ones in this exercise
set that uses the strategy you chose. Name the strategy. Solve your problem. Do problems BEFORE checking answers! Then DO check answers – in the back of the book. Try to figure out all
of them #

Chapter 1 Extension: Lesson on Math Anxiety
Page 1 - 15
Chapter 1 Extension Lesson on Math Anxiety ! Many people, both adults and children, have feelings of “math anxiety”. Here is an explanation of some aspects of math anxiety from the “Platonic Realms” website page “Coping with Math Anxiety” at: http://www.mathacademy.com/pr/minitext/anxiety/
A famous stage actress was once asked if she had ever suffered from stage-fright,
and if so how she had gotten over it. She laughed at the interviewer’s naive assumption
that, since she was an accomplished actress now, she must not feel that kind of anxiety.
She assured him that she had always had stage fright, and that she had never gotten over it.
Instead, she had learned to walk on stage and perform – in spite of it.
Like stage fright, math anxiety can be a disabling condition, causing humiliation,
resentment, and even panic. Consider these testimonials from a questionnaire we have
given to students in the past several years:
When I look at a math problem, my mind goes completely blank. I feel stupid, and I
can’t remember how to do even the simplest things.
I've hated math ever since I was nine years old, when my father grounded me for a
week because I couldn’t learn my multiplication tables.
In math there’s always one right answer, and if you can’t find it you've failed. That
makes me crazy.
Math exams terrify me. My palms get sweaty, I breathe too fast, and often I can't
even make my eyes focus on the paper. It’s worse if I look around, because I’d see
everybody else working, and know that I’m the only one who can’t do it.
I've never been successful in any math class I've ever taken. I never understand
what the teacher is saying, so my mind just wanders.
Some people can do math – not me!
What all of these students are expressing is math anxiety, a feeling of intense frustration or
helplessness about one's ability to do math. What they did not realize is that their feelings
about math are common to all of us to some degree. Even the best mathematicians, like the
actress mentioned above, are prone to anxiety – even about the very thing they do best and
love most. The website goes on to discuss some causes of math anxiety and some tips on how to manage the condition. ! Everybody who does any mathematics will feel better about the experience if they can overcome and manage the feelings of math anxiety that they have. For those who will be teaching mathematics to children, it is vital that they learn ways to cope with math anxiety. And furthermore, it is important for teachers to realize, eventually, that they are capable practitioners of mathematics who can on occasion even take joy in the subject.

Chapter 1 Extension: Lesson on Math Anxiety
Page 1 - 16
Many people first acquired feelings of math anxiety when they were children. Sometimes those bad feelings resulted, at least partly, from the negative views they saw in their teachers. It is time to stop the cycle of teachers who don’t care for math passing along that view to children who then don’t care for math and grow up to be teachers who don’t care for math! ! Before studying the topic of math anxiety, it is useful to do some reflections concerning your own personal history of math experiences. You may recall negative experiences. And hopefully you can recall at least one positive experience. At the end of this section is a page on “Reflections on Your Personal Math Experiences and Attitudes.”
You may want to complete that page and discuss it with others. Perhaps your class will discuss that page or discuss the same topics in another format.
! Goals of the lesson: - to help us be aware of our own math attitudes (such as anxiety, excitement, phobia, feeling challenged, joy) - to help us find our strengths and challenges - to realize how our attitudes toward math affect our ability to learn math - to realize that our own attitudes toward math affect those of our future students. We may need to help children deal with their own math anxieties, phobias, and challenges so that the children become empowered to learn and enjoy math.
! Here are some facts about math anxiety or phobia. a) Some people have a real physiological reaction (sweaty palms, upset stomach,
etc.) – they are not pretending, it is real. b) Math anxiety is common. Some studies report these numbers who experience it: 1/4 of college students and 2/3 of general population c) Is math anxiety inherited, in one’s genes? NO! It is created by life experiences. d) Factors that influence the likelihood of having math anxiety are:
gender (the myth that “girls can’t do math”), ethnicity (language barriers; the belief that some cultures “are more or less
able” to do math), age (the mistaken belief that older people cannot learn math), parental attitudes (Parent saying “I could never do math”), teachers’ attitudes (time-pressure exams, etc.), peers (ridicule by a classmate), actions (avoiding math), society (for example, Talking Barbie saying “Math class is tough”).
e) Having math anxiety can affect one’s ability to learn math. - When the brain is busy with worry, it is more difficult to learn concepts and form
the neural connections needed to remember facts. - Anxiety leads to avoidance behaviors, and then there is no chance to learn. f) Different people have different learning styles (such as visual, aural, verbal, and
kinesthetic). It can be helpful to know your own blend of learning styles and to take advantage of it whenever you can. In addition, of course you must develop more strength in the other styles.

Chapter 1 Extension: Lesson on Math Anxiety
Page 1 - 17
! There are many techniques for reducing and coping with math anxiety. Here are a few examples:
- be aware of one’s own attitudes - learn relaxation techniques (breathing, meditating, visualizing) - take advantage of one’s own blend of learning styles
- change one’s “self talk” to positive statements, however small. Self talk becomes a self-fulfilling expectation. Remember the Little Engine That Could, who chanted “I think I can, I think I can,” to encourage himself as he climbed the steep mountain. And he did. It is a simple, but powerful, chant.
- take advantage of tutors - study in groups - realize that learning takes time, and allow for the time in one’s schedule - prepare well in advance for tests
- realize that making mistakes is an essential part of the learning process; there is nothing wrong with making mistakes and everybody who is learning anything will make mistakes
- aim to truly understand math rather than simply memorizing rules ! Beyond Math Avoidance, into Math Relevance
Many people try to avoid mathematics when at all possible. Someone might have taken as few math courses as possible in high school. Some people will not even try to balance a checkbook or make a home budget. Some rely on others for decisions about what car loan can be afforded or what medical decision to make based on statistical information. A person may have good reasons for avoiding mathematics. Negative experiences in childhood, at home or at school, can lead to math avoidance. Poor math instruction in early life can lead to a lack of success and then to avoidance of math. Someone anxious about mathematics may avoid math. Unfortunately, the other way around also happens: someone who avoids math is likely to have more anxiety about doing math in the future! Now as an adult you have the opportunity to move beyond math avoidance. You can begin by engaging in math in ways that work for you. Challenge yourself to take part in the activities of this course. Take the time to participate fully, using your own blend of styles. And you will succeed.
! Some Resources • The book Conquering Math Anxiety (with CD-ROM) (Paperback), 2nd ed, by Cynthia
Arem. This book is in the Pierce College library, and may be sold in the bookstore. It can be obtained from online sources, and the used books may be a better deal. This author also has information on her website at
http://wc.pima.edu/~carem/MTHANXY.html • The book Studying Math: Pathways to Success, by B. Sidney Smith and Wendy
Hageman Smith. Smith wrote the website referred to at the start of this lesson, at http://www.mathacademy.com/pr/minitext/anxiety/. You might check the school library or online sources for this book.

Chapter 1 Extension: Lesson on Math Anxiety
Page 1 - 18
This page may be part of your class’s work/discussion on Math Anxiety
Topic: Reflections on Your Personal Math Experiences and Attitudes Reflecting and noticing what your experiences and attitudes are is a first step in dealing with
them and adjusting any attitudes that are not serving you well. In addition, this reflection allows you to find the strengths and abilities you have. These you can rely on. !
1. What is your “math history,” your past experiences in math? How do you feel about those experiences? - If you have any negative or bad experiences, feel free to mention them. - Please try to list at least one positive or good experience. This should be at least two paragraphs. You may be inspired to write more. Please use other paper to type or to neatly write your reflections. 2. Give at least two examples of how you use or do something mathematical in your current
life. Think about the wide range of things that can be called “mathematical”. 3. Complete these sentences: a) My ability to do math is ____________________________________________________
b) I am anxious about math when ______________________________________________
c) One thing I like about my math ability is ________________________________________
d) When I make a math mistake I _______________________________________________
e) Doing math makes me feel __________________________________________________
“However difficult your struggles in math may be, I can assure you that mine are
greater.” Albert Einstein, physicist
“A fruit never tasted so sweet as the one you walked furthest to pick.” Author unknown
Quotes are from Math Study Skills by Alan Bass, Pearson Education Inc., 2008, pages 31, 32.

Section 2-1: The Foundations of Algebra
Page 2 - 1
Chapter 2 Classifying, Sorting, Patterns, Sequences
Section 2-1: The Foundations of Algebra One of the NCTM Content Standards is the topic of Algebra. Of course young children do not do algebra in the same way that it is studied by high school students. However, young children are developing a foundation for algebra, a foundation for dealing with abstract concepts. When children sort and classify objects, when they identify and form patterns, they are forming abstract concepts. Patterns lead to generalizations of arithmetic; these generalizations form the essence of algebra.
“Perhaps it is helpful to view algebra as the sum of various activities that young children already do spontaneously, but will need lots of opportunities to try in many situations and with diverse strategies. Basic experiences with algebra involve the following: ! The skills of classifying, sorting, and ordering objects. ! The understanding of patterns in all aspects of their existence – such as color, shape, number, and texture, as well as those involving kinesthetic, tactile, visual, or auditory stimuli…” (Seefeldt and Galper 2008: 82).
Sorting and classifying are essential, basic activities in all of the sciences, including math. For
example, collecting, sorting and classifying data are important activities in the branch of mathematics known as statistics. In biology living organisms are identified and then classified into groups with similar characteristics. In chemistry the elements have been classified and sorted into systems based on their properties. Children are engaging in science activities when they sort a collection of seashells into groups, when they observe and sort various plants in the school yard, and when they place objects in order according to various properties such as hardness or shininess.
Observation of patterns is in important skill in many fields. Scientists search for patterns in
nature and economists look for patterns in society. Artists might create patterns in their designs. Children need to gain skill in working with patterns so that they progress in their learning in many areas, including mathematics.

Section 2-2: Seriation, Classification, and Sets
Page 2 - 2
Section 2-2: Seriation, Classification, and Sets
The word “sort” in English is used to describe several different kinds of skills. When a father asks his child to sort the silverware and put it in the drawer, he wants the child to group the spoons together, the forks together, and the knives together. This is a classification activity; the items are being grouped into sets of similar items.
! The silverware is classified into categories: forks on the left, knives in the next compartment, then large spoons, then small spoons in the compartment on the right.
When the jumble of lids for the round plastic containers in the kitchen fall to the floor, the mother asks her child to please stack the lids in order so that the largest lid is on the bottom of the pile and the smallest is on top. This type of sorting is a seriation activity; the items are put in order according to some characteristic (in this case, the size or diameter of the lids).
! The lids are seriated by some characteristic. In this case they are sorted by size, with the smaller ones fitting inside the larger ones.
Classification is the activity of grouping items into classes according to some system.
Another way to say it is that classification is sorting items into groups where each group has some characteristic in common. The resulting groups can be called categories. For example, a collection of CDs could be classified into groups by putting the jazz music in one pile, the rock music in another pile, and the classical music in a third pile. Each pile is a category.
Seriation is the activity of placing items in order according to some specific attribute, for
example height (from tallest to shortest) or texture (from smoothest to roughest) or age (from oldest to newest). Another way to say it is that seriation involves sorting items into order according to some particular characteristic, such as height or age.
These two tasks of classification and seriation are developmental tasks described by Jean
Piaget (pronounced John Pee-ah-JHAY). Piaget was a Swiss psychologist who researched and wrote extensively in the mid-1900s about how young children understand mathematical concepts. The other two tasks described by Piaget relate to children’s

Section 2-2: Seriation, Classification, and Sets
Page 2 - 3
abilities to form spatial relationships (which will be relevant in the chapters on geometry) and temporal (or time) relationships.
With respect to seriation, “Piaget described three stages of growth in ordering. When given
a group of sticks of various lengths, the child of 3 to 4 years could not order them. The sticks would be placed in random order so that there was no satisfactory pattern. Around the age of 5, the child could order the sticks using trial and error. The sticks were moved from location to location until the task was accomplished. Finally, the child of 6 or older could consider all the sticks before moving them, form a plan of operation, and then choose the sticks in a systematic fashion.” (Smith 2006: 49)
“Object Sorting” activity to explore classification
This activity can be used in a class of young children to explore the concept of sets. Each group of students gets a collection of objects with a variety of characteristics, and finds some way to sort it into groups. The collection of objects could be one of the following: keys, lids, buttons, writing implements, leaves, items found outdoors, socks, books, etc. Almost any set of objects can be sorted in some fashion. As an example, suppose groups of children each had a collection of about twenty buttons to sort into sets (to classify). One group might put the buttons with two holes into one pile, the buttons with four holes into another pile, and the other buttons with a loop on the back into a third set. Another group of students might put the white buttons in one pile, the blue buttons in another, and the red and brown buttons each in their own piles.
During the sorting activity, groups should discuss how they are sorting. It is very
important that the teacher ask a child what his/her ideas were for how to sort the objects. After sorting one way (for example, based on color), then the group may find a different way to sort (for example, based on size). An extension of this activity for older children (grade 1 or 2) would be for each group to display their sorted objects and let others in the class try to determine what criteria they used for sorting.
The book The Button Box by Margarette S. Reid (Puffin Books, 1990) is a lovely picture
book, with realistic pictures, and a story about a boy sorting buttons. This book would be a good accompaniment to a sorting activity in a class.
Attribute Pieces Attribute Pieces are a set of colored geometric shapes (circles, triangles, squares, hexagons, and sometimes rectangles) useful for activities to explore sorting and classifying with young children. Attribute pieces are usually made of plastic or wood and are colored red, blue, and yellow. If you have such a set of attribute pieces, it will be handy to use it in this section. If you do not have a wood or plastic set, then you can use the paper set [at the end of this section] or you can make a set for yourself out of colored cardboard.

Section 2-2: Seriation, Classification, and Sets
Page 2 - 4
What are the attributes of the Attribute Pieces? That is, what are the characteristics of the pieces? What are the types of things you would say to describe a particular piece so that you could tell it apart from the other pieces? You could mention its color, shape, and size. For some sets made of plastic or wood there is one more attribute, thickness, since some pieces are thin and some thick.
Attribute Pieces Activities
What’s in My Pocket?
• One person hides one attribute piece from one set in his/her pocket (or in a bag, or under a paper).
• The other people take turns and ask one question at a time that can be answered yes or no (for example, “Is it a blue piece?”).
• If someone thinks they know what is hidden s/he can ask (for example “Is the blue, small, triangle in your pocket?”).
• Keep going until someone guesses the shape. The shape must be described with EACH of its attributes (shape, color, size, and perhaps thickness).
Suggestion: the people guessing can look over their own set of attribute pieces to help
with their guessing. After the piece is guessed, someone else takes a turn at hiding a different piece.
Guess the Loop Label
• One person chooses one of the “label cards” and keeps it secret from the rest of the group. A copy of the cards is at the end of this section. The cards label something about attribute pieces, such as “blue” or “four-sided” or “not yellow”.
• That same person sets out a loop made of yarn; the loop should be large enough to hold at least half the attribute pieces inside it. Nothing is inside the loop at this point. The label card chosen above will apply to the loop.
• Others in the group take turns choosing an attribute piece and asking the first person whether it goes in the loop or outside of the loop – and then placing the piece in the appropriate place. A piece goes in the loop if it has the characteristic on the label.
• When someone thinks they have figured out the characteristic on the label, they do not say it out loud but rather, they pick up a piece and say they are going to put it in the correct place. The person who knows the secret label says whether they correctly placed the piece.
• Keep going until the characteristic on the label is figured out by all the group members.
Sets ! A set is any collection of objects. An object in a set is called an element of the set. For example, a collection of buttons is a set. Each button is an element of that set. A set can be described in words, such as set E = “the set of even numbers from 0 to 10”. The number “4” is an element of the set E. The number “3” is not an element of set E.

Section 2-2: Seriation, Classification, and Sets
Page 2 - 5
A set can be defined by listing the elements inside “squiggly braces”. The set E defined above could be listed as Set E = {0, 2, 4, 6, 8, 10}. Here are some additional concepts that will be useful as we discuss and study sets. ! When every element of one set is contained in another set, the first set is called a subset of the second set. For example, the set {2, 6} is a subset of {0, 2, 4, 6, 8, 10}. The set {2, 7} is a not a subset of {0, 2, 4, 6, 8, 10}. The symbol for “is a subset of” is . So, {2, 6} {0, 2, 4, 6, 8, 10}.
Examples: A = the set of trees that grow in Washington state. V = the set of evergreen trees that grow in Washington state. D = the set of daisies that grow in Washington state. Y = the set of all plants growing in my backyard in Washington state.
• Is set V a subset of set A? Yes, since the evergreen trees in V are all part of the set A of tress that grow in Washington. V A.
• Is set D a subset of set A? No, the daisies are flowers; they are not in the set of trees.
• Is set Y a subset of set A? No. My backyard has some trees but it also has other plants. Set Y overlaps set A. But set Y is not entirely contained in set A so it is not a subset of set A.
• Is set V a subset of set V? Yes. Every element of set V is in set V! Every set is a subset of itself.
! The intersection of two sets A and B is the set of elements that are in both A and B. This could be called the “overlap” of the two sets, or the things they have in common. The notation for “the intersection of sets A and B” is A B . Example: B = the set of Joan’s breakfast foods = {milk, cereal, coffee} L = the set of Joan’s lunch foods = {bread, cheese, carrot sticks, apple, milk} The intersection of sets B and L = B L = {milk} ! The union of two sets A and B is the set of all the elements that are in A or in B or in both. This would be what you get if set A and set B are put together If something is in both sets, it is still only one thing and so it is listed in the union only once. The notation for “the union of sets A and B” is A B . Example: M = students absent Monday = {Jose, Kim, Vivian} T = students absent Tuesday = {Abe, Kim, Olga, Vivian} The union of sets M and T = M T = {Jose, Kim, Vivian, Abe, Olga}
Practice Problems on subsets, intersection, and union: 1. A = the set of trees that grow in Washington state. V = the set of evergreen trees that grow in Washington state. D = the set of daisies that grow in Washington state. Y = the set of all plants growing in my backyard in Washington state. a) Find the intersection: A Y = b) Find the intersection: A V = c) Find the intersection: A D = d) Find the union: A D = e) Find the union: A V =

Section 2-2: Seriation, Classification, and Sets
Page 2 - 6
2. M = students absent Monday = {Jose, Kim, Vivian} T = students absent Tuesday = {Abe, Kim, Olga, Vivian} S = all the students in the class a) Is M a subset of S? That is, is M S?
b) Is M a subset of T? That is, is M T?
c) Is S a subset of M? That is, is S M?
d) Find the intersection: T M = e) Find the union: S M = Answers to Practice Problems:
1. a) A Y = the set of trees that grow in my backyard [these trees are in both sets A and Y.] b) A V = V c) A D = { } ! this is “the empty set”. There are no elements in both A and D since one contains
trees and the other contains daisies. d) A D = the set of all trees and all daisies that grow in Washington state e) A V = A [since all the evergreens, of set V, are also in set A. The 2 sets together are A.] 2. a) yes, since all the students absent on Monday are in the class b) no, since some people in M are NOT in T (namely Jose) c) no, since S has students who are NOT in M d) T M = {Kim, Vivian} e) S M = S [since all students in M are also in S, the two sets together are simply S]
Using Attribute Pieces to explore intersections and unions of sets Game of “Guess the Loop Label – using two labels”
• One person chooses two of the “label cards” and keeps them secret from the rest of the group. A copy of the cards is at the end of this section. The cards label something about attribute pieces, such as “blue” or “four-sided” or “not yellow”. When first doing this activity, it is easier not to use labels that have the word “not” in them. After playing several times, then the “not” labels can be used.
• That same person sets out two loops made of yarn; the loops should each be large enough to hold at least half the attribute pieces inside.
The loops should be laid out so they overlap, something like this: Nothing is inside the loops at this point. One of the chosen, secret label cards will apply
to one loop and the other card to the other loop. • Others in the group take turns choosing an attribute piece and asking the first person
where it goes. It might go only in the first loop (not the intersection), only in the second loop (not the intersection), or in the intersection (if it belongs in both loops). The piece is placed in the appropriate place.
• When someone thinks they have figured out what the labels are for the loops they do not say it out loud but rather, pick up a piece and say they are going to put it in the right place. The person who knows the labels says whether they did it right.
• Keep going until the labels are figured out by all the group members. Then discuss: How would you describe the intersection of the two sets? How would you describe their union?
“People Sorting” activities to explore sets and classification These activities can be used in a class of young children to explore the concept of sets. They are similar to activities described in Mathematics Their Way by Mary Baratta-Lorton. It is also appropriate for a class of college students to try these activities so they gain the experience of what their future students will experience.

Section 2-2: Seriation, Classification, and Sets
Page 2 - 7
• Label one part of the room (perhaps write it on the whiteboard) “blue jeans” and another part of room “no blue jeans”. Have everyone stand up and go the correct place. Notice: Two sets were formed. Is everybody in one set or the other? What is the intersection of these sets? What is the union of these sets? Extension: A student suggests another way to sort class members – e.g., short sleeves v. long sleeves; tall v. short; button shirt v. not – and have students go into correct groups. • Do the activity above as a guessing game. One person thinks of a category (a set description) but doesn’t say what the category is. S/he tells one student to go to one side of room. Then another student stands. Everyone points whether that person goes to the same side of room or the other side. Then the leader tells the student which side to go to. Then another student stands; again everyone guesses and points to which side of the room, and then the leader says which side to go to. Continue until students are able to predict correctly. • Children under age five typically need to do the activity described above by actually moving to appropriate places in the room. Eventually children will be able to think more abstractly. Around kindergarten age, this activity could be done more abstractly without having people move to sides of the room, in the following way. Each student in the room has two cubes, one red and one blue. To indicate that someone is in the set being described, the student is told to hold up the red cube; students not in the set hold up the blue cube. • A “special person” activity (and each person can have the opportunity to be special): Everybody stands, and one person volunteers to be “special”. The leader asks the class “Based on what you can see, what can you tell me about the special person?” One characteristic should be volunteered (e.g., tall or long hair). Then the leader says ”Everyone fitting that description remain standing, while everyone else sits down.” Then the leader asks for another visual attribute of the special person. Again, everyone still standing who also has that second attribute remains standing, while others sit. Once somebody sits, s/he remains seated. Continue until everyone is sitting except the special person.
Activities to explore seriation In a classroom of young children there are many opportunities to engage in seriation
activities. It is a good idea to have the children seriate with items that are related to whatever the theme is for the week. Here are some examples:
• If the theme is seashore animals, then there will probably be a collection of seashells. Children could be given a set of about six shells, and be asked to sort the shells from smallest to largest. This activity is easier (for younger children) if all the shells in the collection are of the same type, and are simply different in size. The activity is more challenging (for older children) if the shells are not all alike in general shape. Then there can be discussions about which shell is largest if one shell is wider but another one is higher. What is important in this process is that the children talk about their reasoning for why one shell is larger than another. There is no one correct answer but there may be several answers that make sense if they can be explained. • When studying rocks, a collection of several rocks can be arranged by weight, from lightest to heaviest. If the weights of the rocks are very different so that one can tell which is heavier simply by holding them, then no extra equipment is needed. That is true for a collection of rocks that includes pumice (very light) and rocks with lead in them (very

Section 2-2: Seriation, Classification, and Sets
Page 2 - 8
heavy). If the rocks are not extremely different in weight, then a scale should be used to determine which rock is heavier. Using the scale to measure weights is a measurement activity (discussed in the chapter on measurement). Another way to seriate a collection of rocks is by how they feel (smooth versus rough). Children could arrange the rocks from smooth ones to rough ones. • In a unit on garden plants, the children plant seeds in pots indoors. The growing plants are arranged in order of height. Each week the order is re-examined because it might have changed (especially if the plants are not all of the same type). • It is good for a child to engage in activities such as those described above when the child is ready. In A Piaget Primer: How a Child Thinks, the discussion of seriation and ordering says “A preschooler has difficulty lining up dolls, sticks, or blocks of varying heights. Allowing the child to practice looking at these differences gives the child opportunities to form an image about size variation” (Singer & Revenson 1996: 116-117). Then the suggestion is made to play games such as “find me the smallest, find me the tallest” with younger children who are not yet ready to put an entire series in order.
• When children are ready, they can engage in reverse seriation. That occurs when an order that was previously decided on is then done in the opposite direction. For example, if seashells were arranged from smallest to largest, the order is reversed when children put them in order from largest to smallest. An example of reverse seriation with numbers is counting backwards. Counting backwards can be difficult for children, and might be a skill developed in first or second grade.

Section 2-2: Seriation, Classification, and Sets
Page 2 - 9
Section 2-2: Exercises on Seriation, Classification, and Sets For exercises 1 and 2, use the set of attribute pieces on the page later in this section. It consists of 24 pieces with these attributes:
Sizes: small, large. Colors: red, yellow, blue. Shapes: square, circle, hexagon, triangle Note: You might want to copy the page onto cardstock and then cut out the pieces, or else just cut out paper pieces. You can color in the grey pieces appropriately if you want.
When you write a set by listing its members, be sure to include the squiggly braces { … } 1. From the set of 24 attribute pieces, a) How many pieces are in the set of circles? ________ b) What part of the entire set is blue (what fraction of the set)? ________ c) R = the set of red pieces, H = the set of hexagons. What is in the intersection of R and H (list members)?___________________________ How many items are in the intersection of R and H ?_____ d) R = the set of red pieces, H = the set of hexagons. What is in the union of R and H (describe or list members)? _________________________________________________________________ How many items are in the union of R and H ?_____ e) Is the set of small triangles a subset of the set of triangles? _________ f) Is the set of small triangles a subset of the set of yellow triangles? _________ g) If L = the set of large pieces, describe in words a subset of L that contains exactly three
items. _________________________________________ List the items of the set you described ______________________________ h) What is in the intersection of the set of square pieces and the set of yellow pieces? ______________________________ How many items are in this intersection?_____ i) R = the set of red pieces, H = the set of hexagons, L = the set of large pieces. What is the intersection of R, H, and L? That is R H L = ____________________ How many items are in this intersection?_____ j) Describe two sets so that the union of the two sets contains exactly six pieces. k) How many pieces are NOT in the set of yellow pieces? _________ 2. Below is a description of an activity to make a “One-Difference Train” with attribute pieces. If
you can find somebody to play the game with, that is great; otherwise, play it by yourself.

Section 2-2: Seriation, Classification, and Sets
Page 2 - 10
Use the 24 attribute pieces of this set. See if you can make a train using all 24 pieces. Sometimes that is possible, but sometimes the train cannot be finished, depending on how it got started.
One-Difference Trains A group of 2 or 3 people has one set of attribute pieces. They can choose to cooperate
or compete: ! To use cooperative play - work together to make a “one-difference train”. Someone
places one piece as the “engine” to start the train. Someone puts a piece after it that differs from the first piece in only ONE characteristic. Someone puts a piece after that one that differs from it in only one characteristic. Etc.
Example of a train: large-red-square, small-red-square, small-yellow-square, small-
yellow-circle etc.
Question: Can ALL the pieces be used up to make a one-difference train? ! To play it as a game – Distribute the pieces from one set of attribute pieces so that everyone in the group has the same number (approximately). Take turns playing. The first player places one of his/her pieces as the “engine”. The next player places one of his/her pieces after the first piece, but it must differ from the first piece in only one characteristic. Take turns placing pieces that differ in only one way. If a player doesn’t have any pieces that differ in one trait, then skip that turn. Winner is the first one with no pieces left (or the player with the fewest pieces left if the train gets “stuck” and cannot be finished). Extension: the same activity can be done but make a Two-Difference Train. For example: large-red-square, large-blue-triangle, small-red-triangle, etc.
3. Look up the NCTM Standards for PreK to grade 2 at: http://standards.nctm.org/document/chapter4/index.htm
a) Find the part of the standards that specify that students should do activities such as those
in this lesson. What is the name of that standard? b) What are the “Expectations” for the student, related to this topic? 4. For each of these, state whether the student is engaging in seriation or classification.
a) In the dramatic play area, Min takes all the clothes from the dress-up box and puts the dresses in one pile, the pants in another pile, and the shirts in a third pile.
b) Kyle set down one block, next to it put two blocks on top of each other, next to that built a tower of three blocks, next to that a tower of four blocks. Then when he built a tower of five blocks, it fell down.
c) Estelle says “Let’s play three bears.” Others agree to that. Malia says “Estelle has to be papa bear because she’s tallest. I will be momma bear because I’m in the middle. And Jimmy has to be baby bear since he’s the littlest.”
d) From the box of vehicles Pat took out all the trucks. Then she put the two dump trucks in one corner on a blanket, and the three minivans were put next to the doll. Then she put the pickup trucks in a box on its side acting as a garage.
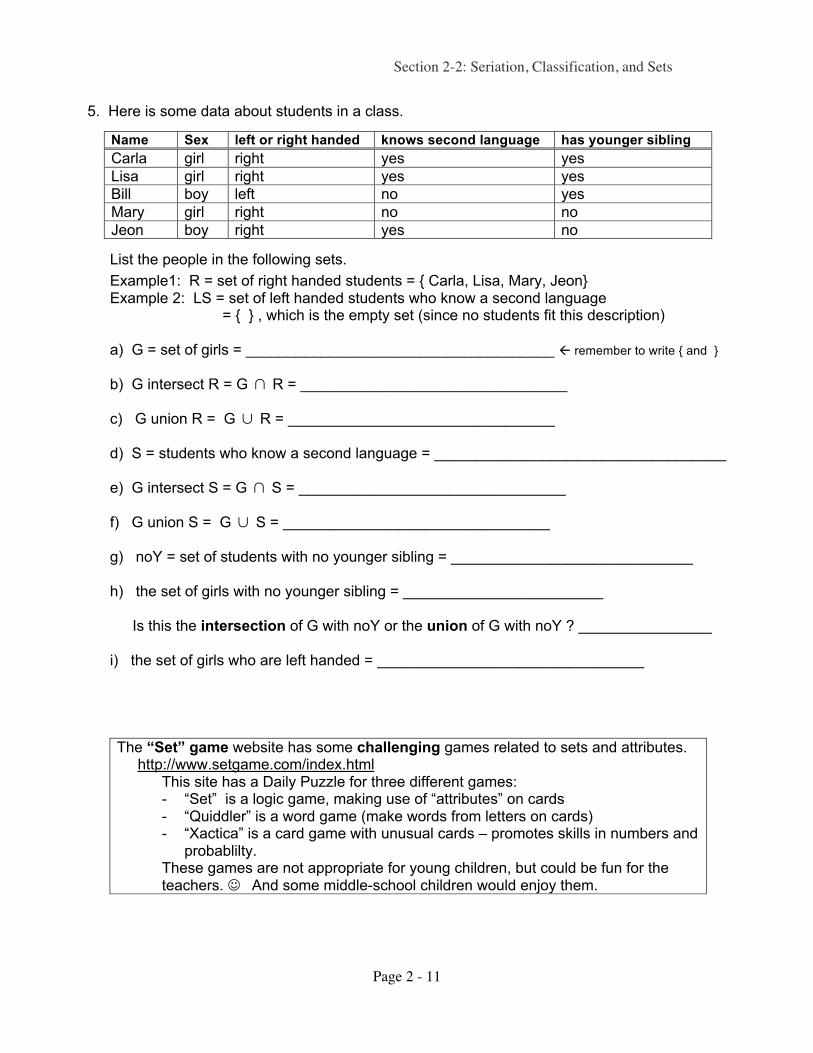
Section 2-2: Seriation, Classification, and Sets
Page 2 - 11
5. Here is some data about students in a class.
Name Sex left or right handed knows second language has younger sibling
Carla girl right yes yes
Lisa girl right yes yes
Bill boy left no yes
Mary girl right no no
Jeon boy right yes no
List the people in the following sets.
Example1: R = set of right handed students = { Carla, Lisa, Mary, Jeon} Example 2: LS = set of left handed students who know a second language = { } , which is the empty set (since no students fit this description) a) G = set of girls = _____________________________________ ! remember to write { and } b) G intersect R = G R = ________________________________ c) G union R = G R = ________________________________ d) S = students who know a second language = ___________________________________ e) G intersect S = G S = ________________________________ f) G union S = G S = ________________________________ g) noY = set of students with no younger sibling = _____________________________ h) the set of girls with no younger sibling = ________________________ Is this the intersection of G with noY or the union of G with noY ? ________________ i) the set of girls who are left handed = ________________________________
The “Set” game website has some challenging games related to sets and attributes. http://www.setgame.com/index.html This site has a Daily Puzzle for three different games:
- “Set” is a logic game, making use of “attributes” on cards - “Quiddler” is a word game (make words from letters on cards) - “Xactica” is a card game with unusual cards – promotes skills in numbers and
probablilty. These games are not appropriate for young children, but could be fun for the teachers. " And some middle-school children would enjoy them.

Section 2-2: Seriation, Classification, and Sets
Page 2 - 12
Attribute Pieces (24 piece set) Code letters are in this order: Size S = Small L = Large Color R = Red Y = Yellow B = Blue Shape S = Square C = Circle H = Hexagon T = Triangle

Section 2-2: Seriation, Classification, and Sets
Page 2 - 13
“Label cards” for Attribute pieces. Can be used to label “loops” or sets.
Yellow Blue Red Not Yellow
Not Blue Not Red Large Small
Square Hexagon Circle Triangle
Not Square Not Circle Not
hexagon Not
Triangle
Thick Thin Rectangle Four-Sided
Note: The last row of cards is not relevant for the paper set of attribute pieces pictured in this section. But they are useful if you are using a wood or plastic set of attribute pieces.

Section 2-3: Patterns and Sequences
Page 2 - 14
Section 2-3: Patterns and Sequences The world is full of patterns in art, architecture, music, stories, and especially in nature.
Young children observe and are familiar with patterns outside of school. They see the pattern of petals on a daisy, the daily setting of the sun, the beat of music, the pattern of bricks in a wall. “The teacher’s role is to provide a bridge between children’s informal observations of patterns and the more formal mathematical description of patterns and changes” (Copley 2000: 83).
Mathematics is the science of patterns “No longer just the study of number and space, mathematical science has become the science of patterns, with theory built on relations among patterns and on applications derived from the fit between pattern and observation.” Lynn Arthur Steen, Professor of mathematics at St. Olaf College and chairman of the Conference Board of the Mathematical Sciences, from http://www.sciencemag.org/cgi/content/abstract/240/4852/611 on 10/15/08
Basics about patterns and sequences • A pattern is a regular arrangement of something such as shapes, sounds, objects,
motions, or numbers. Examples include the rhythm of music, the pattern of tiles on a floor, a list of the multiples of 3. A pattern might have elements that repeat (such as floor tiles that are white, black, white, black, white, black, etc.) However a pattern does not need to have a repeating element. For example, in listing the multiples of 3 (namely 3, 6, 9, 12, 15, 18, …) none of the elements is repeated. In this case the regularity occurs in the difference from one number to the next since each is element is three larger than the preceding number. There are many ways in which an arrangement can be “regular” and thus create a pattern. • A sequence has an order to it, with something being first, then second, then third, etc.
Examples include the even numbers in order and patients who arrive at the doctor’s office from the first patient to the last.
These two ideas of pattern and sequence often go together, but not always. • A pattern is often in a sequence, but not always. When a pattern is “in a row” then it is
also a sequence. For example, this pattern of letters is also a sequence since it is in a row: M O M O M O M O M…. When music is played with a beat and pauses in the form of short-short-long-short-short-long-… that is a pattern and it is also a sequence. The pattern of flowers along my neighbor’s sidewalk is petunia, pansy, petunia, pansy, … ! this is a also a sequence since it is in a row.
A two-dimensional pattern is not thought of as a sequence since it is not simply a set of objects in a row. For example, the pattern of bricks in a wall goes left and right and up and down and is not called a sequence. To the left is a diagram of a small portion of a wall that
continues in all directions. The bricks have a pattern, but not a sequence. To the right is a geometric pattern that is not in a sequence. It moves out from the center
in all directions, not just in one row.

Section 2-3: Patterns and Sequences
Page 2 - 15
• A sequence often has a pattern to it, but it might not. The sequence listing the multiples of 3 is: 3, 6, 9, 12, 15, … ! this sequence has a pattern since each item in the list is exactly three more than the previous number. Some sequences don’t have a pattern to them. For example, consider the sequence of patients that arrive at a doctor’s office one day. Someone is first, someone is second, etc., so it is a sequence of people – but there is no pattern to this sequence of people (the times they arrive are not evenly spaced, the people have no pattern to them). Another example is at a coffee shop – there is a sequence of drinks that are made by the workers. They make whatever drinks are purchased, in the order that they are purchased. There is a sequence of drinks made, but there is no pattern to what the drinks are.
Why Patterns are in the Curriculum Why are patterns important or relevant?
- They occur naturally in many situations (e.g., the time of sunrise follows a pattern, the seasons, petals on a flower, a spider web, etc.).
- Looking for patterns often plays a role in problem solving. - Patterns are inherent in number systems (e.g., odds v. evens, counting by fives, the
sequence of fractions 1/2, 1/3, 1/4, 1/5, etc.). Marilyn Burns explains why it is important for children to study patterns:
“Patterns are key factors in understanding mathematical concepts. The ability to create, recognize, and extend patterns is essential for making generalizations, seeing relationships, and understanding the order and logic of mathematics” (Burns 2000: 112).
The National Council of Teachers of Mathematics (NCTM) has five Content Standards:
1. Number and Operations 2. Algebra (including Patterns and Functions) 3. Geometry 4. Measurement 5. Data Analysis and Probability
Notice that patterns are in the Algebra content area. The study of patterns leads to an understanding of the concept of functions. Functions are an essential component of algebra.
NCTM Standards related to Patterns
The NCTM developed Curriculum Focal Points for each grade level and then related expectations from their Principles and Standards for School Mathematics to the focal points. The expectations for two grade levels are given below; other grade levels can be found on the NCTM website.
The expectations for prekindergarten related to patterns are that the child will: • Recognize, describe, and extend patterns such as sequences of sounds and
shapes or simple numeric patterns and translate from one representation to another. • Analyze how both repeating and growing patterns are generated.
From: http://nctm.org/standards/content.aspx?id=12378 .
The expectations for third grade related to patterns are that the child will: • Describe, extend, and make generalizations about geometric and numeric patterns. • Represent and analyze patterns and functions, using words, tables, and graphs.
From http://nctm.org/standards/content.aspx?id=12386 .

Section 2-3: Patterns and Sequences
Page 2 - 16
“Algebra in the Early Years? Yes.” An article by Jennifer Taylor-Cox, published in the
“Young Children” journal of NAEYC (National Association for the Education of Young Children) in January 2003, is available in pdf format at: http://www.journal.naeyc.org/btj/200301/Algebra.pdf
The first two paragraphs follow:
What? Algebra? Don’t say yikes! Say yes! It is never too early to start thinking in terms of algebra. Of course, I am not suggesting that we ask kindergartners to solve 3y – 6 = 45. But we do need to offer young children a solid foundation of algebraic thinking. It is no longer satisfactory to simply “cover” patterns or “introduce” algebraic concepts in brief mini-units. We cannot be content with teaching only two-color patterns or offering math as a concept disconnected from the lives of children. Why is algebra important? Algebra is a generalization of the ideas of arithmetic where unknown values and variables can be found to solve problems. Algebra has long served both as a gate and a barrier for students (Lott 2000). High school students who take algebra typically proceed through the gate to higher education. Those who do not face obstacles in further academic pursuits, such as fulfilling noncredit course requirements or failing to be accepted into institutions of higher learning. Thus, algebra is a gatekeeper subject (Moses 2001). Fortunately, mathematics educators and policy makers have declared “algebra for all” as an initial step toward assuring equal educational opportunities. Encouraging all students to take algebra is an important initial step, but the problem, say some educators, lies in the preparedness of students. As NCTM (2000) suggests, we can prepare students to be successful in algebra if we begin teaching them to think algebraically in the early years. “Algebra for all.”
Repeating and Growing Patterns for Young Children Young children should explore patterns in many modes:
• auditory – sounds, such as rhythm and music • visual – seeing a pattern in objects or drawings • kinesthetic – movement or motion or placing objects
For example, children are engaging in auditory and kinesthetic experiences if they clap their hands and snap their fingers in a pattern such as: clap, clap, snap, clap, clap, snap, etc. The teacher could suggest the pattern and lead it, then children could suggest other patterns and lead classmates in new patterns.
The example of “clap, clap, snap, clap, clap, snap, etc.” is a repeating pattern since the
basic unit (clap, clap, snap) is repeated over and over. Letters are often used to represent patterns. This pattern is “aab”. A repeating pattern that is “abc” might be: clap, snap, stomp foot, clap, snap, stomp foot, etc. Many patterns are simply “ab”, for example a visual pattern of an outdoor landscaping hedge formed of tree, bush, tree, bush, etc.

Section 2-3: Patterns and Sequences
Page 2 - 17
A growing pattern is another type of pattern. For example: clap, snap, clap, clap, snap,
clap, clap, clap, snap, clap, clap, clap, clap, snap, etc. This pattern is represented as abaabaaab… . An example of a geometric growing pattern is:
Prekindergarten children should first work with patterns formed with concrete objects or
motions before making the concept more abstract. To aid with the transition to more abstraction, the children could go through several steps. For example, first children would do the kinesthetic (motion) pattern of “clap, clap, snap, clap, clap, snap, etc.” Then using colored cubes (concrete objects) that link together the children could be asked to make that same pattern using the colors of cubes. A child could link together cubes, for example in the pattern “red, red, blue, red, red, blue, etc.” Next the child could draw a picture of a similar pattern (drawing is more abstract), such as
When the child is able to abstract further, the pattern could be written in symbols as “aab”. Everyday items in the classroom or home can be used to make patterns. For example: • put a spoon and fork for the first person, then a spoon and fork for the second person, etc.
at snack time; • outdoors make a pattern of small rock, large rock, small rock, large rock, etc.; • sing a song while touching head, shoulders, knees, and toes, knees, and toes, head,
shoulders, knees and toes, knees and toes. • the song lyrics of “I know an old lady who swallowed a fly” is an example of a growing
pattern (lyrics available at http://www.peterpaulandmary.com/music/17-07.htm ). For grade-school children, one way to work with patterns and multiplication facts is to do
what is sometimes called “skip counting” or “counting by [a certain number]”. For example, students could count by four together out loud “4, 8, 12, 16, 20, …” or skip-count by fives “5, 10, 15, 20, 25, 30, …”.
Representing a Pattern – Providing Enough Information When a pattern is being explained, there must be enough of the pattern given to firmly
establish what it is. For a repeating pattern, the repeated portion should be given at least twice to establish the pattern. For example, if a pattern is written as “green, blue, green” it is not clear how it continues. Perhaps the repeating unit is “green, blue, green” (and then it should
be written as green, blue, green, green, blue, green,…) or perhaps it is only “green, blue” (and then it
should be written as green, blue, green, blue.) An alternative way to explain a repeating pattern is to say explicitly what the repeating unit is.
For a growing pattern, a large number of terms must be listed to establish the pattern. Sometimes a sequence of items can have several different ways to extend the pattern.
Sometimes several patterns are imbedded in the same sequence. For example, what would you write as the next terms of this pattern?
ANN, Brad, CAROL, Dennis, __________, __________, __________

Section 2-3: Patterns and Sequences
Page 2 - 18
Can you see more than one way to continue the list? Try a few ways. One person might decide this pattern is simply an alphabetical list, and so could continue it
with Eat, Frank, Good. Another person might notice that the list has names written in all capitals and then in lower case with the first letter capitalized, and so could continue the list with TOM, Barb, JANE. There are even more patterns to notice (the length of the names, the genders that the names typically apply to, that the names are in alphabetical order, etc.) Any of these suggested ways to continue the pattern are correct. From the list that was started there is no way to tell which of these patterns the writer had in mind.
Using Pattern Blocks to Investigate Patterns One particular set of manipulatives that is excellent for exploring patterns is called “Pattern
Blocks”. These blocks might be made of wood or plastic, and typically consist of these six shapes in these colors.
orange square red trapezoid yellow hexagon green triangle blue parallelogram white (or beige) parallelogram Note that each blue and white parallelogram in the set could also be called a rhombus
since a rhombus is a parallelogram with all of its sides the same length.
Exploring with Pattern Blocks If you have not previously worked extensively with Pattern Blocks, now would be a good
time to explore them. For children, it is essential to spend time in free exploration with the blocks. Once children have become familiar with the blocks, here are a few suggestions for beginning activities:
- use the blocks to make a design. - use the blocks to make a design that has symmetry. - put some blocks in a pattern in a sequence. Is it a repeating or growing sequence
(or neither)? - whichever kind of sequence you made last (repeating or growing), make the other
kind now. Tell someone else what you have in mind as your pattern. - Work with a partner. Each person places some pieces in a pattern, and then asks
the other person to continue the pattern. Discuss whether the results are what you expected.
- make a three-dimensional design (this could include stacks of pieces).

Section 2-3: Patterns and Sequences
Page 2 - 19
The Exercises at the end of the section have activities involving Pattern Blocks and
sequences.
Number Sequences of Various Types Three types of number sequences will be discussed: the Arithmetic Sequence, Geometric Sequence, and Fibonacci Style Sequence.
! “Arithmetic Sequence” type of Number Sequence
Consider this sequence and think about what numbers would come next: 6, 10, 14, 18, 22, … This pattern can be described in words as: to get the next number in the sequence, add
4 to the prior number. Adding 4 to each number is how to get to the next number. This is an example of an “Arithmetic Sequence”. An Arithmetic Sequence is one in
which each new number in the sequence is obtained from the one before it by adding (or subtracting) a particular number. In the example above, 4 was the number to add.
Note: When the word “arithmetic” is used as an adjective, as it is in the phrase “arithmetic sequence”, it is pronounced as air-ith-MET-ic. This is a bit different from the way the word is pronounced as a noun: ah-RITH-me-tic.
Example A: Write the first five terms of the Arithmetic Sequence that starts with 17 and
is formed by adding 9 to each term. Solution: 17, 26, 35, 44, 53, … The number that is added to each term of an Arithmetic Sequence to get the next term is
called the common difference. If you have a Arithmetic Sequence, you can calculate the common difference by subtracting any term from the following term. It is called a common difference because the difference between every two adjacent terms in the sequence is the same. For the example above of the arithmetic sequence 17, 26, 35, 44, 53, …, the common difference can be found from 26 – 17 or 35 – 26 or 44 – 35 or 53 – 44; each of these differences is equal to 9.
Note that an Arithmetic Sequence can be formed by adding a negative number to each
term to get the next term. This is equivalent to subtracting the same number from each term to get the following term. For example, in this sequence: 55, 50, 45, 40, 35, … each term is obtained from the prior term by subtracting 5 (which is the same as adding negative 5). The common difference in this sequence is -5.
Example B: State whether or not the following pattern is an arithmetic sequence. If it is,
find the common difference. 3, 4, 6, 9, 13, 18, 24, … Solution: This is not an arithmetic sequence. There is no common difference between
terms. Instead, the difference between adjacent terms changes. For instance, 4 - 3 = 1 and 6 – 4 = 2.
! “Geometric Sequence” type of Number Sequence Consider this sequence and think about what numbers would come next: 2, 6, 18, 54, 162, …

Section 2-3: Patterns and Sequences
Page 2 - 20
This pattern can be described in words as: to get the next number in the sequence, multiply the prior number by 3. Multiplying each term by 3 is how to get to the next number.
This is an example of a “Geometric Sequence”. A Geometric Sequence is one in which
each new number in the sequence is obtained from the one before it by multiplying by a particular number. In the example above, 3 was the number to multiply by.
Example C: Write the first four terms of the Geometric Sequence that starts with 11 and
is formed by multiplying each prior term by 2. Solution: 11, 22, 44, 88, … The number that is multiplied by each term of a Geometric Sequence to get the next term
is called the common ratio. The common ratio of the sequence 11, 22, 44, 88 … is the number 2. A ratio is a fraction. If the fraction is formed by taking one term of the sequence as the numerator and the previous term of the sequence as the denominator, then the ratio will be the same for all the terms of the sequence. For the sequence of 2,
6, 18, 54, 162, … the common ratio is , , , , … and each of these fractions
simplifies to equal 3. For this sequence, 3 is the common ratio.
Note that the number that is multiplied by each term of a Geometric Sequence can be a fraction. For example, if the common ratio is 1/3, and the first term is 81, then the geometric sequence would be: 81, 27, 9, 3, 1/3, 1/9, …
! “Fibonacci Style” type of Number Sequence Leonardo Fibonacci was a mathematician in Italy in the 13th century. He studied a
problem concerning the birthrate of rabbits, and the solution involved this sequence of numbers:
1, 1, 2, 3, 5, 8, 13, 21, 34, 55, 89, … This sequence was later named the Fibonacci Sequence. The sequence starts out
with a 1 followed by another 1. After that, to get the next number of the sequence you add the two prior numbers. So, add 1 + 1 to get 2. Then add 1 + 2 to get 3. Then add 2 + 3 to get 5, etc. A “Fibonacci Style” Sequence can start with any two numbers, and then follow the rule that to get the next number of the sequence you add the two prior numbers. Example: If a “Fibonacci Style” Sequence begins with 2 and then 4, how does it continue? Fill in the next four numbers of the sequence: 2, 4, _______ , ________, _______ , ________, Solution: 2, 4, 6, 10, 16, 26, … The numbers of the original sequence found by Fibonacci (1, 1, 2, 3, 5, 8, 13, 21, … ) appear in various ways in nature, such as in the spirals of a sunflower or pine cone. The numbers of petals on flowers are often one of the Fibonacci numbers (that is, one of the numbers in the sequence). For example, lilies and irises have 3 petals; buttercups and columbines have 5 petals; delphiniums have 8 petals, and so on.

Section 2-3: Patterns and Sequences
Page 2 - 21
Section 2-3: Exercises on Patterns and Sequences 1. a) Describe some common household or classroom items that young children could use
to make patterns. Describe a few of the possible patterns that could be made (perhaps you will sketch a diagram of the pattern).
b) Describe a sound pattern that young children could make or could follow along and
repeat. c) Describe and present a pattern of movement that young children could make. d) For each of the parts a, b, and c above, state whether the pattern being discussed is a
visual pattern, an auditory pattern, or a kinesthetic pattern. 2. The NCTM has five Content Standards: 1. Number and Operations, 2. Algebra, 3.
Geometry, 4. Measurement, 5. Data Analysis and Probability. Which of these Content Standards is the one that Patterns falls under?
3. For each of the following sequences, (i) write the next three items in the sequence, and (ii) state whether the sequence is arithmetic or geometric or neither.
a) 2, 4, 6, 8, …
b) 2, 7, 12, 17, …
c) 1, 5, 9, 13, 17, ….
d) 28, 26, 30, 28, 32, 30, 34, 32, 36, 34, …
e) 1, 2, 4, 8, 16, …
f) 1024, 512, 256, 128, …
g) 17, 20, 23, 26, 29, ….
h) 60, 59, 57, 54, 50, 45, …
i) 5, 10, 8, 13, 11, 16, 14, 19, 17, …
j) 38, 36, 34, 32, 30, …
4. Fill in the next 5 terms for each sequence. a) The original Fibonacci Sequence begins with 1, then 1. How does it continue?
1, 1, ________ , ________ , ________ , ________ , ________ , b) If a “Fibonacci Style” Sequence begins with 2, then 2, how does it continue?
2, 2, ________ , ________ , ________ , ________ , ________ ,

Section 2-3: Patterns and Sequences
Page 2 - 22
c) If a “Fibonacci Style” Sequence begins with 3, then 4, how does it continue?
3, 4, ________ , ________ , ________ , ________ , ________ ,
5.. Here is a sketch of some Pattern Blocks (parallelograms and triangles) in a repeating pattern. The pattern begins its repeat in the 5th figure.
a) Use your pattern blocks to construct the sixth and seventh figures that would extend the given pattern. Sketch those figures below.
1
st 2
nd 3
rd 4
th 5
th
6
th 7
th
b) What is the last shape in each of these figures (parallelogram or triangle)?: 3
rd "________________ 4
th "________________ 5
th "________________ 6th "________________
c) Based on what you notice in your answers to the last question… What is the last shape in these figures:
37
th "____________________ 94
th "___________________
d) How many of the various shapes are in these figures? Fill in the rest of the table. Notice the patterns for even-numbered figures versus odd-numbered figures
6. Here is a sketch of some pattern blocks in a repeating pattern. a) Use your pattern blocks (hexagons, triangles, squares) to construct this figure and
then put more pieces on the end. Sketch more of the figure below.
Use this figure to fill in the following tables …
Which figure: 1st
2nd
3rd
4th
5th
6th
10th
11th
42nd
43rd
61st
62nd
Number of parallelograms
1 1
Number of triangles
0 1
Total number of blocks
1 2

Section 2-3: Patterns and Sequences
Page 2 - 23
b) Think about: multiples of 3 (that is, the answers to 3 times a number). List some of the multiples of 3: ----------------------------------------------------------------------- c) Fill in the table on the left, and then the one on the right. Look for number patterns.
Position of block
in the pattern Shape of block
Position of block
in the pattern Shape of block
1st
What shape is in the position number of “one past a multiple of 3”? ________________
2nd
4th
3rd
7th
4th
10th
5th
28th
6th
What is true of a position number that has a triangle in it? ______________________
7th
2nd
8th
5th
9th
11th
What type of position number has a square in it? ____________
29th
12th
Putting together all this information, fill in
the shapes in these positions:
15th
21st
18th
47th
Since you know where the squares are, can you figure out the following?
67th
30th
90th
31st
98th
32nd
303rd
33rd
1000th

Section 2-4: Patterns and Function Rules
Page 2 - 24
Section 2-4: Patterns and Function Rules
!Patterns Leading to Function Rules: Relationship Patterns Repeating patterns and growing patterns are two types of patterns. Another type is a
relationship pattern. A relationship pattern is one that can be described by a rule that relates an “input” of one set to an “output” in another set.
Example of a relationship pattern: The input set contains each person in a particular room. The relationship rule is that for each person, the output is the number of pets that person has. Details of the relationship are that Rachelle has 2 pets; Andrew has 1 pet; Sharon has 0 pets; Lisa has 2 pets.
Example of a numeric relationship pattern: The relationship rule is that for any number chosen, multiply it by 4 and then add 1. For this rule, if 3 is chosen as the input, the result is 3•4 + 1 = 13 so 13 is the output; if 7 is chosen as the input the result is 7•4 + 1 = 29 so 29 is the output; etc.
Susan Sperry Smith mentions why relationship patterns are important: “… looking for patterns is a logical form of problem solving. When a sequence of
numbers is involved or a table of data can be organized into a pattern, a rule can be generated for making predictions about the solution in general. The rule can be turned into a formula and applied to any similar situation.” (Smith 2006: 75)
The following explorations will be more meaningful if you have a set of square tiles to
use. One-inch squares are a common type of tile, but the size does not matter for this activity. Often such tiles come in various colors, which makes the explorations interesting, but colors are not needed. Squares cut out of paper or cardboard could be used.
Exploration with Colored Tiles
This is an optional but strongly recommended activity. For children this step is necessary.
Materials: colored square tiles (any size squares, such as one-inch squares) • If the materials are not familiar to you, take time to play with them: move them around,
make designs, see all the colors, etc. • Place some tiles in a sequence or pattern, using colors and/or location of tiles to make
the pattern. Put enough tiles in the pattern so that somebody else could continue the pattern.
• If other people are also making sequences of tiles, switch with the other person so that you continue that person’s sequence and s/he continues your sequence. After a few more tiles are added, check how the patterns are going and discuss any differences of views.
• Make a pattern with the tiles that is not a sequence – but rather it might be a two-dimensional pattern (going left, right, up, and down), or perhaps it is three-dimensional.
Patterns of Tiles and Numbers, Leading to Functions
In the following examples, the colors of the tiles do not matter. It is the location of tiles and the number of tiles that matter here. It is best to actually do these activities with tiles, so that you have the experience of working with tiles, sequences, number patterns, and creating formulas.

Section 2-4: Patterns and Function Rules
Page 2 - 25
Example A i) If you have square tiles, place them to form the figures of the following sequence.
Continue the pattern by placing squares to form the next several figures. It truly is helpful to use tiles to make the patterns rather than just drawing pictures.
1
st 2
nd 3
rd 4
th 5
th 6
th
ii) Sketch in how this pattern would continue in the fifth and sixth figures. iii) Fill in this table to explore the number patterns. There is more than one way to fill in
the “What do I see” column; the words filled in here are simply one way to see it.
Figure #
What do I see? Number of tiles in figure (thinking it out)
# of tiles
1 one tile 1 1
2 2 tiles, then 1 centered on top of them
2 on bottom + 1 above = 3 3
3 3 tiles on bottom, 2 on top, then 1 on top of that
3 + 2 + 1 = 6 6
4 4 tiles on bottom, 3 above that, 2 above that, 1 above that. Each row is centered.
4 + 3 + 2 + 1 = 10 10
5
6
7
10
n n tiles on the bottom row, n-1 above that, n-2 above that, … eventually 2 in a row, then 1 on top
n + (n-1) + (n-2) + … + 3 + 2 + 1
iv) Do not actually build it, but describe what the 20th figure would look like. How many tiles would it have in it? Note: to answer that question, consider using the “staircase method” or “Gauss’
method” from the chapter on Problem Solving. Solution to Example A follows Example B.

Section 2-4: Patterns and Function Rules
Page 2 - 26
Example B i) If you have square tiles, place them to form the figures of the following sequence.
Continue the pattern by placing squares to form the next several figures. 1
st 2
nd 3
rd 4
th 5
th 6
th
ii) Sketch in how this pattern would continue in the fifth and sixth figures. iii) Fill in this table to explore the number patterns. There is more than one way to fill in
the “What do I see” column; the words filled in here are two suggested views.
Figure #
What do I see? Number of tiles in figure (thinking it out)
# of tiles
1 one tile 1 1
2 2 tiles horizontal, 1 above OR another view: 1 tile in corner, 1 on horizontal branch, 1 on vertical branch
2 on bottom + 1 above = 3 OR 1 + 1 + 1 = 3
3
3 3 tiles horizontal, 2 vertical OR another view: 1 tile in corner, 2 on horizontal branch, 2 on vertical branch
3 + 2 = 5 OR 1 + 2 + 2 = 5
5
4
5
6
7
10
n

Section 2-4: Patterns and Function Rules
Page 2 - 27
iv) What do you notice about the sequence of numbers in the final column? v) Use your tiles to build the tenth figure in this sequence. How many tiles are in that figure? What is the tenth odd number? vi) Do not actually build it, but describe in words what the 20th figure would look like. How many tiles would it have in it? Solutions to Example B follow the Solutions to Example A. Solution to Example A: i) and ii)
1st 2
nd 3
rd 4
th 5
th 6
th
iii) Fill in this table to explore the number patterns. There is more than one way to fill in
the “What do I see” column; the words filled in here are simply one way to see it.
Figure #
What do I see? Number of tiles in figure (thinking it out)
# of tiles
1 one tile 1 1
2 2 tiles, then 1 centered on top of them
2 on bottom + 1 above = 3 3
3 3 tiles on bottom, 2 on top, then 1 on top of that
3 + 2 + 1 = 6 6
4 4 tiles on bottom, 3 above that, 2 above that, 1 above that. Each row is centered.
4 + 3 + 2 + 1 = 10 10
5 5 tiles on bottom row, 4 tiles above that,
3 above that, 2 above that, 1 above
that. Each row is centered.
5 + 4 + 3 + 2 + 1 = 15 15
6 6 tiles on bottom, 5 above that, 4 tiles
above that, 3 above that, 2 above that, 1 above that. Each row is centered.
6 + 5 + 4 + 3 + 2 + 1 = 21 21
7 7 tiles on bottom row, 6 above that, 5
above that, 4 tiles above that, 3 above that, 2 above that, 1 above that. Each
row is centered.
7 + 6 + 5 + 4 + 3 + 2 + 1 = 28 28
10 10 tiles on bottom, then 9, then 8, then 7, 6 above that, 5 above that, 4 tiles
above that, 3 above that, 2 above that,
1 above that. Each row is centered.
10 + 9 + 8 + 7 + 6 + 5 + 4 + 3 + 2 + 1 = 55
55
n n tiles on the bottom row, n-1 above that, n-2 above that, … eventually 2 in a row, then 1 on top
n + (n-1) + (n-2) + … + 3 + 2 + 1

Section 2-4: Patterns and Function Rules
Page 2 - 28
iv) Do not actually build it, but describe what the 20th figure would look like. Answer: It would have 20 tiles in the bottom row, then 19 tiles above that, then 18,
etc. until the top row ha only 1 tile. All the rows are centered over each other. How many tiles would it have in it? Answer: The total number of tiles would be 20 + 19 + 18 + 17 + … + 3 + 2 + 1. To find that sum using the “staircase method”, we think of a “staircase” made of
tiles with first 1 tile, then 2 in the next column, then 3 in the next column, then 4, etc. until the last column is 20 tiles high. Then think of another copy of that staircase, but turn it upside down and set it on top of the first copy. The two copies form a rectangle that is 20 across on the bottom and is 21 tiles high. The total number of tiles in that rectangle is 20 • 21 = 420. But that is two copies of the staircase, so one copy has half as many tiles, which is 210.
OR, we could use “Gauss’ method” and write the numbers we want to add in one row, and then write it again in reverse order in a row below it. Then add the two numbers “on top of each other” (each such sum equals 21).
20 + 19 + 18 + 17 + … + 3 + 2 + 1 1 + 2 + 3 + 4 + … + 18 + 19 + 20 21 + 21 + 21 + 21 + … + 21 + 21 + 21 ! the sum of the two rows. That total sum is 21 added together 20 times, which is 20 • 21, which is 420. The sum we want is only ONE row, which is half of this total, so it is 210.
Solution to Example B: i) and ii) 1
st 2
nd 3
rd 4
th 5
th 6
th
iii) Fill in this table to explore the number patterns. There is more than one way to fill in
the “What do I see” column; the words filled in here are two suggested views.
Figure #
What do I see? Number of tiles in figure (thinking it out)
# of tiles
1 one tile 1 1
2 2 tiles horizontal, 1 above OR another view: 1 tile in corner, 1 on horizontal branch, 1 on vertical branch
2 on bottom + 1 above = 3 OR 1 + 1 + 1 = 3
3
3 3 tiles horizontal, 2 vertical OR another view: 1 tile in corner, 2 on horizontal branch, 2 on vertical branch
3 + 2 = 5 OR 1 + 2 + 2 = 5
5
4 4 tiles horizontal and 3 tiles vertically above the left end. OR 1 corner tile, 3 tiles on the horizontal branch and 3 on the vertical branch
4 + 3 = 7 OR 1 + 3 + 3 = 7
7
5 5 tiles horizontal and 4 tiles vertically above the left end. OR 1 corner tile, 4 tiles on the horizontal branch and 4 on the vertical branch
5 + 4 = 0 OR 1 + 4 + 4
9

Section 2-4: Patterns and Function Rules
Page 2 - 29
6 6 tiles horizontal and 5 tiles vertically above the left end. OR 1 corner tile, 5 tiles on the horizontal branch and 5 on the vertical branch
6 + 5 = 11 OR 1 + 5 + 5 = 11
11
7 7 tiles horizontal and 6 tiles vertically above the left end. OR 1 corner tile, 6 tiles on the horizontal branch and 6 on the vertical branch
7 + 6 = 13 OR 1 + 6 + 6 = 13
13
10 10 tiles horizontal and 9 tiles vertically above the left end. OR 1 corner tile, 9 tiles on the horizontal branch and 9 on the vertical branch
10 + 9 = 19 or 1 + 9 + 9 = 19
19
n n tiles horizontal and (n-1) tiles vertically above the left end. OR 1 corner tile, (n-1) tiles on the horizontal branch and (n-1) on the vertical branch
n + (n-1) OR 1 + (n-1) + (n-1)
2n – 1 see note below
Note: For figure n, the total number of tiles can be simplified using algebra. n + (n – 1) = n + n – 1 = 2n – 1 Or the other expression is: 1 + (n – 1) + (n – 1) = 1 + n – 1 + n – 1 = n + n + 1 – 1 –1 = 2n – 1 iv) What do you notice about the sequence of numbers in the final column? Answer: They are the odd numbers. v) Use your tiles to build the tenth figure in this sequence. How many tiles are in that figure? 19 What is the tenth odd number? 19 vi) Do not actually build it, but describe in words what the 20th figure would look like. Answer: The 20th figure would have a horizontal row of 20 tiles, and then above
the left end tile there would be a vertical column of 19 tiles. OR another way to describe it is that there would be one corner tile, then a horizontal row to the right of it with 19 tiles and a vertical column of 19 tiles. above the corner tile
How many tiles would it have in it? Answer: The number of tiles would be 20 + 19 = 39. Or another way to see the number of tiles is 1 + 19 + 19 = 39.

Section 2-4: Patterns and Function Rules
Page 2 - 30
! Sequences of Numbers, Leading to Functions “Function” is an important concept in algebra. The basic idea of a function is that it is a
rule or procedure so that when there is one input number, there is then exactly one output number. Put another way, functions take one input and produce exactly one output. (By the way, the inputs and outputs do not have to be numbers. They could be letters or pictures or people or whatever. We are going to start with examples using numbers.)
Example C The “Guess My Rule” game can be played to explore the concept of function. Look at
the beginning of this game:
The “If I say” number is the input. The “Then you say” number is the output. You can see how to continue to fill in the second column by following the pattern. What is the rule for this table? There are several ways of describing it.
• Some people might say something like “whenever the number in the first column is one bigger, then the number in the second column gets one bigger”. This idea lets one fill out the table for more and more numbers – but only if the numbers in the first column are all in a row without skipping any numbers.
• What if the number in the first column is 10 or 73 or 100? Can the number in the second column be found without going through all the numbers up to 100? To figure that out, a rule is needed that relates the number in the first column directly to the resulting number in the second column.
• If you look at the number in the first column, notice that the number in the same row of the second column is 4 larger than it. Check that this is true for every example in the table.
A rule for this table could be stated in words as “whenever there is a number in the first column, the number in the second column is that number plus 4”.
• In algebra, that rule can be stated more briefly using symbols. To do this, the number in the first column is represented by a variable (some letter of the alphabet). Any letter could be used. Here let’s use n to represent the number in the first column. Then the number in the second column next to it would be represented as n + 4. The rule could be stated as “If the number in the first column is n, then the number in the second column is n+4.”
The same rule could be stated as “If I say n, then you say n + 4.” • Using this rule, answer: a) If the first column number is 10, the second column number is _______ b) If I say 73, then you say ________ c) If the input number is 100, then the output number is _______ Solutions: a) 14, b) 77, c) 104.
If I say Then you say
1 5
2 6
3 7
4 8
5
6
7

Section 2-4: Patterns and Function Rules
Page 2 - 31
Example D Consider this input-output table:
Is this an example of a function? Remember that a function is a rule or
procedure so that when there is one input number, there is then exactly one output number.
In this example, the input number 5 has two
different outputs. So this is NOT an example of a function.
Example E Here is an input-output table for a function:
You can see how to continue to fill in the second column by following the pattern. What is the rule for this table? There are several ways of describing it. • Some people might say something like “whenever the number in the first column is one
bigger, then the number in the second column gets two bigger”. This idea lets one fill out the table for more and more numbers – but only if those numbers in the first column are all in a row (consecutive) without skipping any numbers.
• What if the number in the first column is 10 or 35 or 101? Can the number in the second column be found without going through all the numbers up to 101? To figure that out, a rule is needed that relates the number in the first column directly to the resulting number in the second column.
• Look at the input number in the first column and see how it relates to the output number next to it in the second column. This example is more complicated than the last example. The output number cannot be found simply by adding the same number every time to the input.
• One view: - Some people might notice this: the output number is always bigger than the input.
The number to add to the input to get the output is always one larger than the input number. This rule might be stated in words as “to get the output number, take the input number and add to it the number that is one more than the input number”. Check that this rule works for all the numbers in the table.
- This rule could be written in symbols by letting the input number be called n. The number to add to that input number is one more than the input number – so the number to add is (n + 1). So the rule is:
For the input number n, the output number is n + (n + 1)
Input Output
1 2
2 6
3 10
5 14
5 18
8 22
11 26
Input Output
1 3
2 5
3 7
4 9
5
6
7

Section 2-4: Patterns and Function Rules
Page 2 - 32
• Another view: - Some people might notice this: the output number is close to twice as much as the
input number. In fact, the output number is one larger than twice the input number. This rule might be stated in words as “to get the output number, take the input number, multiply by 2, and add one to it”. Check that this rule works for all the numbers in the table.
- This rule could be written in symbols by letting the input number be called n. Twice a number means to multiply by 2, so twice the number is 2•n. Then 1 is added to that. So the rule is:
For the input number n, the output number is 2•n + 1 • Using either one of these rules, answer: a) If the first column number is 10, the second column number is _______ b) If I say 35, then you say ________ c) If the input number is 101, then the output number is _______ Solutions: a) 21, b) 71, c) 203.
These two rules both give the same answers. Using algebra we can show that the two rules are actually equivalent.
The first rule states the output is: n + (n + 1) This equals (n + n) + 1 by the associative property. That equals 2 • n + 1 because n + n = 2•n This last expression is the second rule, so the two rules are equivalent. Example F Here is an input-output table for a function:
Look for a pattern, to fill in the second column. What is the rule for this table? • This pattern is more complicated than the last example. The output numbers get larger
as the input numbers get larger, but not by the same amount each time. Starting with the first input of 2, as the inputs get one larger, the outputs get larger in this pattern:
by 5 [from 2 to 7. 7 – 2 = 5] then by 7 [from 7 to 14. 14 – 7 = 7] then by 9 [from 14 to 23. 23 – 14 = 9] then by 11 [from 23 to 34. 34 – 23 = 11] Notice that there is a pattern to these amounts – they are the odd numbers.
Input Output
2 2
3 7
4 14
5 23
6 34
7
8
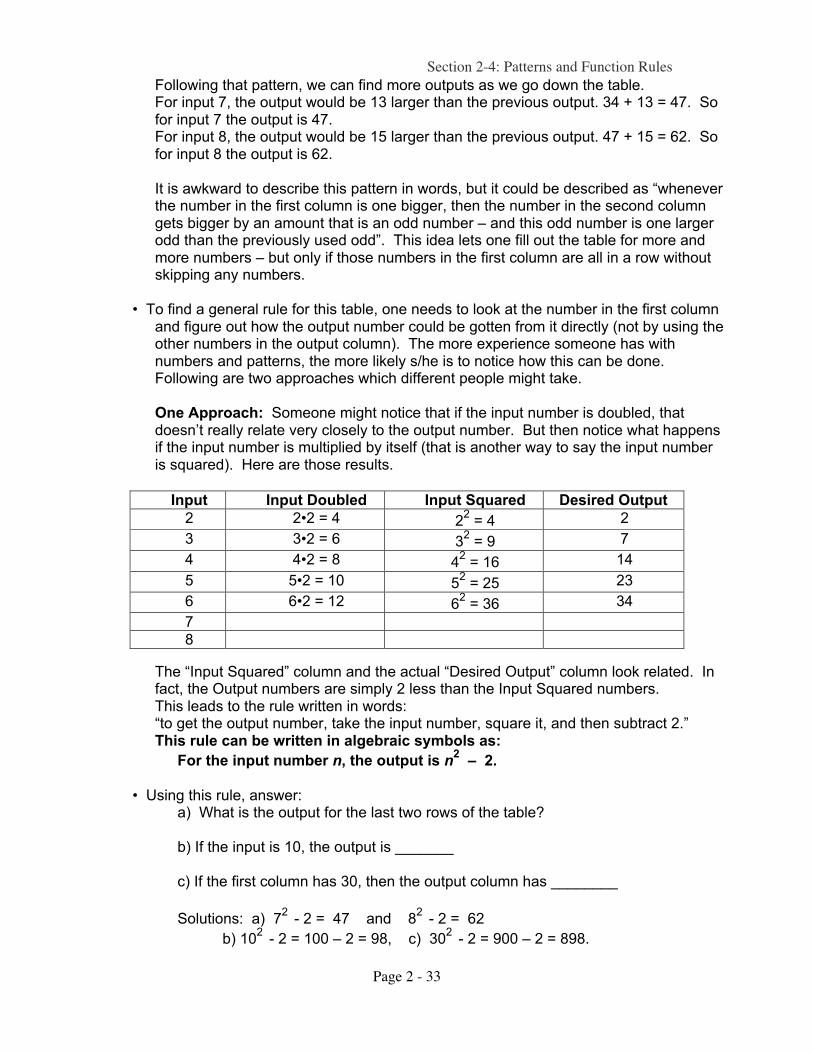
Section 2-4: Patterns and Function Rules
Page 2 - 33
Following that pattern, we can find more outputs as we go down the table. For input 7, the output would be 13 larger than the previous output. 34 + 13 = 47. So
for input 7 the output is 47. For input 8, the output would be 15 larger than the previous output. 47 + 15 = 62. So
for input 8 the output is 62. It is awkward to describe this pattern in words, but it could be described as “whenever
the number in the first column is one bigger, then the number in the second column gets bigger by an amount that is an odd number – and this odd number is one larger odd than the previously used odd”. This idea lets one fill out the table for more and more numbers – but only if those numbers in the first column are all in a row without skipping any numbers.
• To find a general rule for this table, one needs to look at the number in the first column
and figure out how the output number could be gotten from it directly (not by using the other numbers in the output column). The more experience someone has with numbers and patterns, the more likely s/he is to notice how this can be done. Following are two approaches which different people might take.
One Approach: Someone might notice that if the input number is doubled, that
doesn’t really relate very closely to the output number. But then notice what happens if the input number is multiplied by itself (that is another way to say the input number is squared). Here are those results.
The “Input Squared” column and the actual “Desired Output” column look related. In
fact, the Output numbers are simply 2 less than the Input Squared numbers. This leads to the rule written in words: “to get the output number, take the input number, square it, and then subtract 2.” This rule can be written in algebraic symbols as:
For the input number n, the output is n2 – 2.
• Using this rule, answer: a) What is the output for the last two rows of the table? b) If the input is 10, the output is _______ c) If the first column has 30, then the output column has ________
Solutions: a) 72
- 2 = 47 and 82
- 2 = 62
b) 102
- 2 = 100 – 2 = 98, c) 302
- 2 = 900 – 2 = 898.
Input Input Doubled Input Squared Desired Output
2 2•2 = 4 22 = 4 2
3 3•2 = 6 32 = 9 7
4 4•2 = 8 42 = 16 14
5 5•2 = 10 52 = 25 23
6 6•2 = 12 62 = 36 34
7
8

Section 2-4: Patterns and Function Rules
Page 2 - 34
• A Different Approach: Here is another way that someone might work on the same
problem (Example F). Notice what happens if the input number is multiplied by the number that is one less than the input number (that is, the input minus 1). Here are those results.
The “Input " (Input –1)” column and the actual “Desired Output” column are
somewhat similar, but the “Desired Output” is generally larger. One might notice that the thing to add to the “Input " (Input – 1)” to get the “Desired Output” is always 2 less than the Input number (which is Input – 2).
This leads to the rule written in words: “to get the output number, take the input number, multiply it by 1 less than itself, then
add 2 less than itself.” This rule can be written in algebraic symbols as: For the input number n, the output is n•(n – 1) + (n – 2).
• Using this rule, answer: a) What is the output for the last two rows of the table? b) If the input is 10, the output is _______ c) If the first column has 30, then the output column has ________ Solutions: a) 7•(7-1) + (7-2) = 7•6 + 5 = 47 and 8•(8-1) + (8-2) = 8•7 + 6 = 62 b) 10•(10-1) + (10-2) = 10•9 + 8 = 98, c) 30•(30-1) + (30-2) = 30•29 + 28 = 898.
• Algebra Challenge If you have studied enough algebra, show that these two rules
for the table of Example F are equivalent to each other. That is,
show that n2 – 2 = n•(n – 1) + (n – 2).
Input Input Doubled Input ! (Input – 1) Desired Output
2 2•2 = 4 2•1 = 2 2
3 3•2 = 6 3•2 = 6 7
4 4•2 = 8 4•3 = 12 14
5 5•2 = 10 5•4 = 20 23
6 6•2 = 12 6•5 = 30 34
7
8

Section 2-4: Patterns and Function Rules
Page 2 - 35
Section 2-4: Exercises on Patterns and Function Rules 1. i) If you have square tiles, place them to form the figures of the following sequence.
Continue the pattern by placing squares to form the next several figures. It truly is helpful to use tiles to make the patterns rather than just drawing pictures.
1
st 2
nd 3
rd 4
th 5
th 6
th
ii) Sketch in how this pattern would continue in the fifth and sixth figures. iii) Fill in this table to explore the number patterns. There is more than one way to fill in
the “What do I see” column.
Figure #
What do I see? Number of tiles in figure (thinking it out)
# of tiles
1
2
3
4
5
6
10
n

Section 2-4: Patterns and Function Rules
Page 2 - 36
iv) Do not actually build it, but describe what the 20th figure would look like. How many tiles would it have in it? 2. i) If you have square tiles, place them to form the figures of the following sequence.
Continue the pattern by placing squares to form the next several figures. It truly is helpful to use tiles to make the patterns rather than just drawing pictures.
1
st 2
nd 3
rd 4
th 5
th 6
th
ii) Sketch in how this pattern would continue in the fifth and sixth figures. iii) Fill in this table to explore the number patterns. There is more than one way to fill in
the “What do I see” column.
Figure #
What do I see? Number of tiles in figure (thinking it out)
# of tiles
1
2
3
4
5
6
7
10
n
iv) Do not actually build it, but describe what the 20th figure would look like. How many tiles would it have in it? Note: to answer that question, consider using the “staircase method” or “Gauss’
method” from the chapter on Problem Solving.

Section 2-4: Patterns and Function Rules
Page 2 - 37
3. i) Create a pattern of square tiles that is different from the examples and exercises in this section. This is probably easier if you use actual tiles.
ii) Sketch your pattern here.
1st 2
nd 3
rd 4
th 5
th 6
th
iii) Fill in this table to explore the number patterns.
Figure #
What do I see? Number of tiles in figure (thinking it out)
# of tiles
1
2
3
4
5
6
7
10
n
iv) Do not actually build it, but describe what the 20th figure would look like. How many tiles would it have in it?

Section 2-4: Patterns and Function Rules
Page 2 - 38
4. Here is an input-output table for a function. a) Fill in the table.
You can see how to continue to fill in the second column by following the pattern. b) What is the rule for this table? There may be several ways of describing it. Give at
least one way to state the rule. You might first state it in words: When the input number is n, the output is _________________ c) Using the function rule you figured out, answer: i) If the first column is 11, the second column is _______ ii) If I say 35, then you say ________ iii) If the input number is 120, then the output number is _______ 5. a) Here is an input-output table for a function. The rule for the function in this table is that for the input number n, the output is 3•n – 4. Fill in the missing parts of the table.
b) Here is an input-output table for a function. The rule for the function in this table is that for the input number n, the output is 5•n + 2. Fill in the missing parts of the table.
Input Output
1 12
2 13
3 14
4 15
5
6
7
Input Output
2
3
4
8
26
12
Input Output
2 12
3
5 27
37
8 42
52

Section 2-4: Patterns and Function Rules
Page 2 - 39
6. Here is an input-output table for a function. a) Fill in the table.
You can see how to continue to fill in the second column by following the pattern. b) What is the rule for this table? There may be several ways of describing it. Give at
least one way to state the rule. You might first state it in words: When the input number is n, the output is _________________ c) Using the function rule you figured out, answer: i) If the first column is 14, the second column is _______ ii) If I say 27, then you say ________ iii) If the input number is 140, then the output number is _______ 7. Here is an input-output table for a function. Notice that the input numbers given in the
table are not in sequence. a) Fill in the table.
b) What is the rule for this table? There may be several ways of describing it. Give at
least one way to state the rule. You might first state it in words: When the input number is n, the output is _________________
Input Output
1 5
2 7
3 9
4 11
5
6
7
Input Output
3 1
7 5
8 6
14 12
5
26
17

Section 2-4: Patterns and Function Rules
Page 2 - 40
8. Here is an input-output table for a function. a) Fill in the table.
You can see how to continue to fill in the second column by following the pattern. b) What is the rule for this table? There may be several ways of describing it. Give at
least one way to state the rule. You might first state it in words: When the input number is n, the output is _________________ c) Using the function rule you figured out, answer: i) If the first column is 9, the second column is _______ ii) If I say 40, then you say ________ iii) If the input number is 110, then the output number is _______ 9. Here is an input-output table for a function. a) Fill in the table.
You can see how to continue to fill in the second column by following the pattern. b) What is the rule for this table? There may be several ways of describing it. Give at
least one way to state the rule. You might first state it in words: When the input number is n, the output is _________________ c) Using the function rule you figured out, answer: i) If the first column is 11, the second column is _______ ii) If I say 50, then you say ________ iii) If the input number is 100, then the output number is _______
Input Output
1 4
2 8
3 12
4 16
5
6
7
Input Output
1 1
2 4
3 9
4 16
5
6
7

Section 2-4: Patterns and Function Rules
Page 2 - 41
10. Here is an input-output table for a function. a) Fill in the table.
You can see how to continue to fill in the second column by following the pattern. b) What is the rule for this table? There may be several ways of describing it. Give at
least one way to state the rule. You might first state it in words: When the input number is n, the output is _________________ c) Using the function rule you figured out, answer: i) If the first column is 12, the second column is _______ ii) If I say 70, then you say ________ iii) If the input number is 120, then the output number is _______ 11. Create an input-output table for a function, such as problems # 6 – 10. Provide enough
of the outputs so that a classmate could figure out what the function rule is. In class, trade tables with classmates and figure out each other’s function rules.
Input Output
1 7
2 11
3 15
4 19
5
6
7

Section 2-4: Patterns and Function Rules
Page 2 - 42
Blank Page

Section 3-1: Ancient Numeration systems
Page 3 - 1
Chapter 3 Numeration Systems (Ancient and Current) and Counting Number v. Numeral What is the difference between a “number” and a “numeral”? • A number is a concept of how many, the idea about the size. • A numeral is a symbol we use to represent a number in writing. So the number two is the concept of how many are in a group of two things. There are various numerals that can be written to represent the number two, such as:
2 or II or ! or •• or || - and many more in different number systems. It is nice to make the distinction between the concept of the number and the written numeral, but in actual practice people say “number” for both. Our Numeration System; Positional Systems A numeration system is an organized system for writing numerals to represent numbers. You are familiar with the numeration system used today throughout most of the world, the system you regularly use for writing decimals and whole numbers – the system that says, for example, that 12 is the way to write twelve and 437 is the way to write four hundred thirty-seven. This system is called the Hindu-Arabic system because it was first developed about 800 BCE by the Hindus and later the Arabs transmitted it to Europe where it was adopted. Our Hindu-Arabic system is also called a Base-10 system and a decimal system because it is based on the number ten. That is not surprising, since humans have ten fingers. The system has ten digits, namely: 0, 1, 2, 3, 4, 5, 6, 7, 8, 9 The system is a positional system since the value represented by a digit depends on the position of that digit in the numeral. For example, in “20” the 2 is in the tens place and indicates 2 tens, whereas in “200” the 2 is in the hundreds place and indicates 2 hundreds. As you know, for whole numbers in our decimal system the first seven positions have the following values:
millions, hundred-thousands, ten-thousands, thousands, hundreds, tens, ones So, 8,472,169 represents
8 x 1,000,000 + 4 x 100,000 + 7 x 10,000 + 2 x 1000 + 1 x 100 + 6 x 10 + 9 x 1 The number is called
“eight million four hundred seventy-two thousand one hundred sixty-nine”.
Notice that the word “and” does not appear in the written or spoken form of the whole number. (In the chapter on decimals we will learn that the word “and” is spoken or written only where the decimal point occurs.) In a number system where each position has a certain value it is essential to have a digit to represent zero, as we use the 0 digit in the Hindu-Arabic system. Consider the number 7 and the number 70. If we didn’t have the zero digit, these two numbers would look alike! The “0” is necessary to “hold the place” when there is no value for the particular position.

Section 3-1: Ancient Numeration systems
Page 3 - 2
Section 3-1: Ancient Numeration Systems Why should we study numeration systems other than our own? First, because knowing different systems gives a deeper understanding of our own system. And second, because you may work with young children who are experiencing the fun and challenge of learning a system of numbers for the first time. What is that experience like for them? Our system is so familiar that it is hard for us to remember what it is like to learn a number system. When we study an unfamiliar system we can gain insight into what it is like to learn a system for the first time. The sections below provide information about three ancient numeration systems, namely the systems of the ancient Egyptians, Romans, and Mayans. Every numeration system has its own advantages and disadvantages compared to other systems. As you work with the ancient numeration systems, think about their advantages and disadvantages as compared to the Hindu-Arabic system and as compared to each other. The Egyptian System The ancient Egyptians had developed a numeration system by 3000 BCE. The picture symbols they used for their basic “digits” are called hieroglyphs. The system was based on the number ten, and the hieroglyph symbols represented powers of ten.
1 = 10
0
10 = 10
1
100 = 10
2
1000 = 10
3
10,000 = 10
4
100,000 = 10
5
1,000,000 = 10
6
stick heelbone coiled rope lotus flower pointing finger
fish amazed person
The Egyptian system is additive, which means that the symbols written to represent a number are simply added together to give the value of the number. For example, 437 is written as: | | | | | | |
This system is not positional – the position that the symbols are written does not matter. For example, the symbols written the following way still represent the number 437: | | | | | | |
This way is harder to read, of course. Typically the numbers are written in an organized way. And if there are many copies of one symbol, they may be written in two rows, e.g.:
| | |
Do you see what number that is? In the Hindu-Arabic system it is 160,093.
!

Section 3-1: Ancient Numeration systems
Page 3 - 3
Roman Numerals It is useful to know Roman numerals because they are still in use today in some situations. Sometimes clock faces have Roman numerals, as do chapters in books. They are used in making outlines of notes and the Super Bowl game number. The common symbols in the Roman system are these: Roman symbol: I V X L C D M
Value: 1 5 10 50 100 500 1000 In general in a Roman numeral, the symbol with the largest value is written first, then the next largest, and so on, and in general the values of the symbols are added.
For example, 1322 is written MCCCXXII .
The Roman numeral system is not a positional system since there are not certain positions with certain values. For example, the “C”s in the numeral in the example above each have a value of 100 even though they are in different places in the numeral. However, in the Roman numeral system, the positions of symbols does make a difference because the system has a subtraction component along with an addition component – and the way to tell whether to add or subtract depends on the positions of various digits. If a symbol for a smaller number is placed before (directly to the left of) the symbol for a larger number, that indicates that the smaller value is to be subtracted from the larger one. The following combinations can be used to represent subtractions: IV = 1 subtracted from 5 = 4 IX = 1 subtracted from 10 = 9
XL = 10 subtracted from 50 = 40 XC = 10 subtracted from 100 = 90
CD = 100 subtracted from 500 = 400 CM = 100 subtracted from 1000 = 900
Examples: CCXLV = 245 CCXLIV = 244
MCM = 1900 MCCCXCII = 1392
3546 = MMMDXLVI 247 = CCXLVII
88 = LXXXVIII
The Mayan System The Mayans lived in an area that is currently part of Mexico. They knew a great deal about astronomy and their calendar was very accurate with a year of 365 days and a leap year every fourth year. The Mayan numeration system had only three symbols: Zero is represented by the shape of a shell: either or .
1 is represented by a dot: • 5 is represented by a horizontal line: To form the numerals from 1 through 19, dots and bars representing 1 and 5 are used in an additive way. The symbols should be positioned as shown in this table; position does matter. Look over the table to learn the pattern.

Section 3-1: Ancient Numeration systems
Page 3 - 4
1
2
3
4
6
0
7
5
8
9
10
14
13
12
11
15
19
18
17
16
To write numbers beyond 19, the Mayans used a positional numeration system, and the positions were arranged vertically (rather than horizontally like our current system). The Mayan system is called a “modified base 20” system because it starts out being base 20 but then switches. Here is how it works:
! the third position from the bottom is the 360s place, for 18 • 20.
! the position above the bottom is the 20s place, for 1 • 20 ! the bottom position is the units place [Note: The positions continue upward in a pattern, with18 • 202 being next, then 18 • 203 , etc., but we will not work with these higher positions.] In each position, one of the numerals 0, 1, 2, 3, etc. through 19 is put in the position. The value of the numeral in that position is the numeral multiplied by the value of the position. Examples of determining the value of Mayan numerals: A) This Mayan numeral has two position levels and represents 48. ! 2 in the “20s” position has value 2 x 20 = 40 ! 8 in the units position has value 8 x 1 = 8 total value is 40 + 8 = 48 B) This Mayan numeral has three position levels and represents 646. ! 1 in the “360s” position has value 1 x 360 = 360
! 14 in the “20s” position has value 14 x 20 = 280
! 6 in the “units” position has value 6 x 1 = 6 Total value is 360 + 280 + 6 = 646 C) If a numeral doesn’t have any value in one of the positions, the zero symbol is put in that
position as a “place holder”, just as is done in our current number system. This Mayan numeral has two position levels and represents 320.
! 16 in the “20s” position has value 16 x 20 = 320
! 0 in the “units” position has value 0 x 1 = 0
Total value is 320 + 0 = 320

Section 3-1: Ancient Numeration systems
Page 3 - 5
In Example (C) above, notice how the symbol for zero is essential as a “place holder” in writing out the numeral. Examples of determining the Mayan numeral to represent a given value: D) Express the value 153 in Mayan numerals. First note that this number is less than 360, so we will not be using the third position (the
one with value 360). The second position in a Mayan numeral indicates the number of “twenties” in this number – to figure out how many twenties, divide 153 by 20. The result is 7 with remainder 13, since 7 x 20 is 140. So the Mayan numeral will have the value 7 in the twenties place, and 13 in the units place:
E) Express the value 440 in Mayan numerals. First note that this number is more than 360, so we will be using the third position (the
one with value 360). To determine how many 360s are in 440, divide 440 by 360, getting 1 with remainder 80. So the Mayan numeral will have a 1 in the “360s position” and we now determine how to express the remainder of 80. We figure out how many twenties are in the 80 by dividing 80 by 20, getting 4 with no remainder. Our Mayan numeral will have 4 in the twenties position. There are no leftover “units”. To indicate that there is no numeral in the units position, we must put a zero there.
F) Express the value 65 in Mayan numerals. This number is less than 360, so we will not be using the third position (the one with
value 360). To figure out how many twenties, divide 65 by 20 getting the result 3 with remainder 5. So the Mayan numeral will have the value 3 in the twenties place, and 5 in the units place.
Notice that there must be a large gap between the 3 dots in the twenties place and the line in the units place, so that the number doesn’t look like everything
is in the units place. Other Numeration Systems We know our Hindu-Arabic Base 10 numeration system is in common use world-wide today. In addition, several other systems have specialized uses today. The Base 2 (Binary) system and the Base 16 (hexadecimal) systems are used in computer programming.
For further information and practice using numeration systems, check out these websites: • Addition of Mayan numbers:
http://www.niti.org/mayan/lesson.htm • Egyptian numbers and math:
http://www.eyelid.co.uk/numbers.htm • Links to other sites about numeration systems: http://mathforum.org/alejandre/numerals.html

Section 3-1: Ancient Numeration systems
Page 3 - 6
Section 3-1: Exercises on Ancient Numeration Systems (and Current) 1. What is the name of the numeration system that is in common use today?
2. a) What is the base of our common system today? b) What are the digits used in our common system?
3. a) Is our current system a positional system? Explain what that means about our current system. b) Which digit is essential for a positional system?
4. a) In the Hindu-Arabic numeral 17,348,465 i) what value does the digit 6 represent? ii) what value does the digit 7 represent? iii) what value does the digit 3 represent? b) Write these numbers in Hindu-Arabic notation: i) Eighty-three thousand forty-nine ii) Six million forty-two thousand seven hundred fifty-eight 5. a) Fill in the table to show how the numbers would be written in each system. Suggestion: Write all of the numbers for one system first, then do the next system.
Hindu-Arabic Egyptian Roman Mayan
1
2
3
4
5
6
7
8
9
10
11
12

Section 3-1: Ancient Numeration systems
Page 3 - 7
Hindu-Arabic Egyptian Roman Mayan
13
14
15
16
17
18
19
20
21
22
99
100
101
1000
Your age:

Section 3-1: Ancient Numeration systems
Page 3 - 8
Hindu-Arabic Egyptian Roman Mayan
The current year:
5b) Which of the systems (Egyptian, Roman, or Mayan) do you like best? Explain why.
5c) Which of the systems (Egyptian, Roman, or Mayan) do you like least? Explain why.
Arithmetic Operations in ancient numeration systems Directions: Attempt to do the arithmetic operations in the ancient numeration system, but if you have trouble you can translate to our system. In the end, the answers to these problems should be given in the ancient system. In Egypt 6. The librarian at the library in Alexandria shelved books before lunch
and then shelved books after lunch. How many books all together did she shelve that day? 7. On a trip into the desert, each person packs | | | baskets of food on the camel. There are | | | | | | people on the trip. How many baskets of food are on the camel? 8. One side of the pyramid requires blocks of a certain size. So far blocks have been set in place. How many more are needed? 9. The pharaoh ordered that bins be filled with grain. In the morning the
farmers filled bins and in the afternoon they filled bins. How many bins do they need to fill tomorrow to finish the job?
In Rome 10. The governor’s soldiers carried CX daggers and XLVIII spears. How many weapons did
they have all together? 11. The ruling governor had DCLXIV gold coins minted with his face on them. He gave CXV
of them to his favorite legionnaire. How many gold coins does he have left? 12. There were XXVIII people in the baths when IX more arrived. How many people were in
the baths then? 13. The XV workers each made IV cart wheels this morning. How many cart wheels were
made all together?

Section 3-1: Ancient Numeration systems
Page 3 - 9
In Mayan lands 14. One week a farmer saw rabbits in the field and deer in the field. How many rabbits and deer total did the farmer see that week? 15. Ana plans to weave blankets over the winter to sell in the market next spring. So far she has woven blankets. How many more must she weave? 16. Jose planted corn seeds every day for days.
How many corn seeds did he plant all together? 17. Grandma puts green beads into each bracelet she makes for her many
grandchildren. She will make one bracelet for each of her grandchildren for the family reunion. How many green beads total will she use? 18. a) In which of the systems (Egyptian, Roman, or Mayan) did you find it easiest to carry out
addition and subtraction computations without converting to our current system? Explain why you think this was so.
b) In which of the systems (Egyptian, Roman, or Mayan) did you find it most difficult to carry out computations without converting to our current system? Explain why you think this was so.

Section 3-2: Counting and Children
Page 3 - 10
Section 3-2: Counting and Children Counting is a much more complex task than it first appears to be. What do children need to know or be able to do before they can count? Here are some of the required skills and knowledge: " know the names of the numbers (for example, know that “two” and “ten” and “four” are
names of numbers) " know what order the number names go in (have memorized the order of the sequence of numbers “one, two, three, four, …”) " have the concept of the conservation of number (described below)
" know how to make a one-to-one correspondence (described below) " be organized in order to keep track of which items have been counted How can children learn all of this? By having many experiences in gaining these skills. Juanita Copley states that “children benefit from an exposure to a range of strategies and examples and lots of practice” (Copley 2000: 58)
Conservation of Number
The concept of “conservation of number” was described by Jean Piaget, a Swiss psychologist who researched and wrote extensively in the mid-1900s about how young children understand mathematical concepts. In his classic experiment, a child is shown two rows of objects that are lined up with each other, for example a row of seven white tiles lined up to match a row of seven grey tiles.
The child is asked if one row has more objects or if the rows have the same number of objects. Typically a child correctly says that they have the same number. Then the researcher asks the child to watch as she moves the objects of one row to spread them farther apart from each other: Then the child is asked again if one row has more objects or if the rows have the same number of objects. Younger children, who do not yet have the concept of conservation of number, say that the two rows no longer have the same number of objects and say that the row that has been spread out farther now has more objects in it.
When children acquire the concept of conservation of number, then they readily say that the
two rows have the same number of objects, no matter how the researcher spreads out the tiles in the rows.
One-to-One Correspondence
One-to-one correspondence is the process of matching items from two sets so that each item from set 1 is matched with exactly one item in set 2. For example, when a child is passing out apples for snack, one set is the children in the room and the other set is the apples " each child gets one apple. Another example is the shoes in a closet: each left shoe has a right shoe that corresponds to it. In counting objects, one of the sets is all the objects and the other set is the counting numbers.

Section 3-2: Counting and Children
Page 3 - 11
A child must have the concept of one-to-one correspondence in order to be able to count. Of course the child doesn’t need to know the name “one-to-one correspondence”, s/he just needs to know how to do it. However, teachers should know the name of this skill so they can have better insight into the child’s thinking and can better plan activities to support the child’s learning. In addition, knowing the name of the skill allows teachers to better communicate with parents and other teachers about the developmental levels of their students. A child who knows the names of the counting numbers in order might do something like “counting” by saying the numbers while pointing to items, but he might say the numbers quickly “one, two, three, four, five, six, seven, eight” while pointing more slowly to the five items on the table. To actually count items, the child must realize that each number should be matched with exactly one item. And the child must be organized enough during the counting process to keep track of which items have already been counted and which remain to be counted. Before actually counting, children can gain experience with the idea of one-to-one correspondence through a variety of activities. For example, a child can have the job of getting out one book for each child in the group. Or a child could set the table for lunch by putting out one plate for each person, one cup beside each plate, and one spoon beside each plate.
Section 3-2: Exercises on Counting and Children 1. When asked to count some items, a child quickly points to the eight items on the table while
slowly saying “one, two, three, four, five”. What is the name of the concept that this child doesn’t seem to have developed well enough to count?
2. A preschool child has a row of five small bears and next to each is a small plate. When
asked, the child says that there are the same number of bears and of plates. A friend comes along and spreads out the row of bears. The child says “now there are more bears than plates”. It seems that this child has not yet developed which concept?
3. Counting is a complex task. What are the skills and concepts a child must develop before
being able to count?

Section 3-2: Counting and Children
Page 3 - 12
Blank Page

Chapter 4 Introduction
Page 4 - 1
Chapter 4 Operations on Whole Numbers
Teachers of young children need to be thoroughly familiar with the concept of numbers and their operations. The young students may not yet be performing operations with numbers, such as multiplication or division. However in the preschool and kindergarten years the foundations for future work with numbers and operations are being laid. The teacher needs to know how to guide the students in gaining the concrete experiences that will help them be successful with later mathematics. As Juanita Copley says in The Young Child and Mathematics (p. 47)
“The teacher’s job is to gain insight into the child’s interpretation of number and to assess what each child knows and doesn’t know. The subsequent teaching can then move the child from present concepts and constructions to more formal school mathematics.”
The teacher must be able to mentally place each particular student’s understandings into an overall concept of numbers and operations. The teacher can then devise activities to further each child’s concept development.
The Content Standards for school mathematics determined by the National Council of Teachers of Mathematics (NCTM) are:
1. Number and Operations 2. Algebra [including Patterns and Functions] 3. Geometry 4. Measurement 5. Data Analysis and Probability
This chapter relates to the first of these standards: Number and Operations. The arithmetic operations are addition, subtraction, multiplication, and division.
[You can see http://standards.nctm.org/document/chapter4/index.htm for an overview of the Standards as they apply to Pre-kindergarten through Grade 2.]

Section 4-1: Addition of Whole Numbers
Page 4 - 2
Section 4-1: Addition of Whole Numbers
There are MANY ways to think about adding numbers. The two examples below present some of the various ways that people use mental calculations or mental arithmetic to figure out answers. Put simply, mental arithmetic means doing math in your head, without using a calculator and without writing anything down. The key to doing mental calculations is to have a clear concept of the operation (addition in this case) so that you can select strategies that allow you to keep track of the numbers in your head.
Example A – mental calculations of addition: In a summer workshop for elementary school teachers, the leader asked “How can you figure out the sum 8 + 9, if you don’t just have it memorized as a fact?” [Note: Of course many people just “know” what 8 + 9 equals. This exercise is meant to encourage teachers to think about the problem in ways that their students might think about it before they have the fact memorized or in case somebody forgets the answer.] 8 + 9 = ? Here are some ways people explained their reasoning: • Alice said she’d use the “friendly number” ten to help: “9 is close to 10. I want 1 more to
make it 10. So split the 8 up into 7 and 1. Then put the 1 with the 9 to get 10. That plus the 7 (left over from the number 8) makes 17 total.”
• Mike also thought of 10, but did it this way: “I thought of the 9 as 10 – 1. So then I had 8 + 9 is the same as 8 + 10 – 1. The 8 + 10 is 18. Then subtract the 1 which gives 17 as the answer.”
• Chris likes “doubles” and thought of it this way: “This problem of 8 + 9 is close to 8 + 8. I know 8 + 8 is 16, and this problem is one more. So the answer is 17.”
• Jay had a convoluted method: “8 + 9 is close to 10 + 10, which is 20. But 20 is too big, so I need to take away some. The 8 was 2 less than 10, and the 9 was 1 less than 10 – so that means I need to take away 3 (that’s the 2 and the 1). 20 take away 3 leaves 17 as the answer.”
Example B – mental calculations of addition: Here are explanations that various teachers offered for this problem: 73 + 19 = ?. • “19 is close to 20 so I used 20 as a friendly number. I thought 73 + 19 = 73 + 20 – 1 = 93
– 1 = 92” • “I split the 19 into 10 + 9. So then I had 73 + 19 = 73 + 10 + 9 = 83 + 9. Then to figure out
83 + 9, I first added 83 + 10, getting 93, but of course that was too big so then I took away 1, getting 92.”
• “I took the tens separate from the units. I mean I looked at 73 as 70 + 3, and looked at 19 as 10 + 9. I could put together the 70 + 10, getting 80. Then I still had 3 + 9; I know that’s 12. So put the 80 together with the 12 to get 92 in the end.”
• “I figured that 73 + 19 is close to 70 + 20, which is 90. But the 73 is 3 more than 70 so add 3 to the 90, giving 93. And the 19 was 1 less than 20, so take 1 away from 93, giving 92.”
Example C – mental calculations of addition of three numbers: Here are explanations for adding these three numbers mentally: 14 + 132 + 16 • “The first and last numbers are easier to deal with, so I am adding them first. The units
digits in them (the 4 and the 6) are “friendly numbers” since they add up to 10. That 10,

Section 4-1: Addition of Whole Numbers
Page 4 - 3
plus the 10 from the 14 and the 10 from the 16 add to a total of 30. Now I need to add 30 to the remaining number, 162. I can see that in the ten’s place there will be a 6. So the total is 162.”
• “I will rearrange the order of the numbers to add 14 + 16 + 132. For the first two numbers I think of it this way: 14 + 16 = 10 + 4 + 10 + 6 = (4 + 6) + 10 + 10 = (10) + 10 + 10 = 30. I had to rearrange and regroup the numbers a couple times to do that. So now I need 30 + 162. I think of this as 30 + 162 = 30 + 160 + 2 = 190 + 2 = 192.”
• “First I add 14 + 132. I ignore the 2 units in the 132 for the moment and see that 14 + 130 is 144. Then I add back in the 2 units and get 146. Now I need 146 + 16. I think of the 16 as 10 + 6, and first add the 10 to the 146. 10 + 146 = 156. Now I have 6 more to add on. From 156, if I added on 4 more I’d get to 160, and then I still have 2 more from the 6 to add on. So I’d end up with 2 + 160 = 162.”
In Examples A, B, and C, people are using properties of addition, though they don’t mention
it. Those properties are:
Commutative Property of Addition: When two or more numbers are added, the order they are added does not make a difference. Example: 5 + 7 = 7 + 5. In general: a + b = b + a. Associative Property of Addition: When three or more numbers are added, they can be grouped in different ways and the result will be the same. Example: (3 + 8) + 2 = 3 + (8 + 2). In general: (a + b) + c = a + (b + c).
! Young children and addition
Young children become familiar with the concept of addition through daily life and activities. For example, Nadia reports, “I have two dolls at home, and my sister said I can have her old one. Then I’ll have three dolls!” Once children have learned to count, they can begin to add. The first way that children add is by putting two groups of items together and counting them all. For example, to add 5 tiles and 2 tiles, the child would put the five tiles together with the two tiles and then count them to get the total of 7. Children need a lot of practice counting all the objects before they can move on to the next stage. In the next stage, children do not need to count the entire set of objects, but rather can “count on”. For example, the child would have the pile of 5 tiles and the pile of 2 tiles, and would not re-count the 5 but rather would count on from there, pointing to the other 2 tiles and say “six, seven” to get the total of 7. As children learn to be efficient with “counting on” they will realize that when adding 2 + 8 they should use the commutative property to start with the bigger number, 8, and add on two more as “nine” and “ten”. Eventually the child will be able to do the problem mentally, without having to count the objects at all. It may be that the child is mentally picturing the tiles and figuring out the answer, or perhaps the child has memorized the fact that 5 + 2 = 7.

Section 4-1: Addition of Whole Numbers
Page 4 - 4
Children can gain more experience and facility with addition when they regularly play games involving addition that they enjoy. The book The Young Child and Mathematics by Juanita V. Copley has examples of such games in Chapter 4.
Activity: All the Ways to Make Seven with Two Numbers
Goal: Use Objects to Show All the Ways to Make Seven with Two Numbers Materials: Objects of two colors. Could use tiles, or cubes, or other objects. It is ideal to use items that can link together such as unifix cubes or multilink cubes. Use about 55 objects of each color. Colored pencils matching the colors of the items would be useful but are not necessary.
What to do: (An example of the results of a simpler version of this activity are in the box below.)
• Make stacks of 7 cubes using the two colors in as many different ways as you can, but while keeping the cubes of one color next to each other in the stack. For example, if the colors are red and blue, one stack might be “red, red, blue, blue, blue, blue, blue” in that order. But you should NOT include a stack of “red, blue, red, blue, blue, blue, blue” since then the reds are not together. • Make and keep as many different stacks as you can. • Arrange your stacks in a pattern (that is, in some order that makes sense to you). • How many different stacks are there? • On grid paper (also called graph paper), record all the stacks you made. That is, draw a sketch of all the stacks. If you do not have colored pencils, you could use a regular pencil to shade. • Record all of the addition facts for 7. • How many different addition facts are there? [Because of the commutative property, we know that, for example, 3 + 4 is the same as 4 + 3. Will we count each of these as a different addition fact? For this exercise, let’s count 3 + 4 = 7 as a different fact from 4 + 3 = 7.]
! Here is an example of this activity making stacks of size 3 rather than 7. Stacks arranged in a pattern Addition facts for 3: 3 + 0 = 3 ! There are six different stacks. 2 + 1 = 3 1 + 2 = 3 0 + 3 = 3 There are four different addition facts. ! Young children could engage in the first part of an activity such as this, creating stacks of the same size that contain two colors. They should first create stacks of sizes smaller than 7. Stacks of size 5 could be emphasized. Five and ten are important numbers in our base 10 number system, and it is good for children to become very familiar with the addition facts for those numbers.

Section 4-1: Addition of Whole Numbers
Page 4 - 5
! Base Ten Materials In the chapter on Numeration Systems, we noted that our Hindu-Arabic numeration system is a base ten system. The system has ten digits, namely: 0, 1, 2, 3, 4, 5, 6, 7, 8, 9. Our system is a positional system since the value represented by a digit depends on the position of that digit in the numeral. For example, in “60” the 6 is in the tens place and indicates 6 tens, whereas in “600” the 6 is in the hundreds place and indicates 6 hundreds. It is often helpful for children learning our base ten system to use one or more models for trades to illuminate place value. For example, the nature of our base ten system can be explored with manipulatives called “Base Ten Blocks”. · The smallest piece (a cube which is 1 centimeter long on each edge) is used to represent a unit (other names for this piece are bit and one).. · The piece which has ten of the unit cubes in a row is called a long, and it represents ten (other names for the long are rod, strip, and skinny). · When ten longs (or rods, strips, or skinnies) are connected, the piece is called a flat or a mat, and it represents 100. · If ten flats (or mats) are stacked on top of each other and put together, that makes one block, which represents 1000 (other names for the block are big block and big cube).
• Base Ten Blocks big block
flat long or mat unit or rod 1 10 100 1000
Children can gain a much better understanding of the place value number system if they have the concrete experience of using Base Ten Blocks or some other set of manipulatives like them. You may never have had the opportunity to use Base Ten Blocks or other base ten manipulatives, or perhaps you used them many years ago. It is helpful for adults who are not familiar with base ten materials to explore them to learn how they can be used to explain place-value in the number system and to show how the usual addition and subtraction methods work.
• Base Ten Stick Bundles Other base ten materials can be used instead of the Base Ten blocks, or in addition to the blocks. Here is an example of a set of base ten materials you can make out of craft sticks (also called popsicle sticks). Each stick represents a unit (the number 1). Ten sticks are put together, bundled by a rubber band, and that represents 10. Ten of those bundles are put together, and again are bundled with a rubber band, and that represents 100.

Section 4-1: Addition of Whole Numbers
Page 4 - 6
100-bundle 4 units 10-bundle (ten 10-bundles) Base ten stick bundles work well for young children since they are easy for them to handle.
• Base Ten Bean Sticks
For older children who can handle small objects, another type of base ten materials can be made with craft sticks and beans. Each bean represents the number 1. Ten beans can be glued to a craft stick, representing the number 10. Ten craft sticks (with the beans glued on them) can be glued next to each other on a piece of cardboard, representing 100. 100 beans 4 units 10-bean-stick (ten sticks of 10 beans)
It is a good idea to expose children to a variety of base ten manipulatives so that they begin to understand that the bundlgin or grouping strategy remains constant regardless of how one unit is defined. This will help them later with decimal positions when one whole is defined as a skinny or a flat.
Using Base Ten Materials to Explore Place Value and Addition In this section the terminology for Base Ten Blocks will be used (unit, long, flat, block). However the activities can be done with other base ten materials. ! In order to become familiar with the pieces, complete the following. Note: you may want to have Base Ten Blocks available and handle them as you do this.
a) _____ units = 2 longs b) _____ longs = 1 flat c) _____ units = 1 flat d) _____ longs = 4 flats e) _____ flats = 1 block f) _____ flats = 3 blocks g) _____ units = 1 block h) _____ units = 7 longs

Section 4-1: Addition of Whole Numbers
Page 4 - 7
Solutions: a) 20 b) 10 c) 100 d) 40 e) 10 f) 30 g) 1000 h) 70 Minimal Sets ! When Base Ten Blocks are used to display a number, we want to use a “minimal number of pieces” to display the number – that is, we want to use as few pieces as possible to represent the number. For example, to display the number 12, you could set out 12 unit pieces. But instead you could display 12 by using the minimal set of one long and two unit pieces.
Original set Minimal set [Group 10 units] 12 units 1 long and 2 units = 12
When minimal sets are used, the pieces displayed with Base Ten Blocks correspond to the place values. For example, the minimal number of pieces to display 427 are 4 flats, 2 longs, and 7 units. ! When a number is displayed with more pieces than the minimal set, then pieces can be “traded up” (that is, exchanged for different pieces that are equal in value) until a minimal set is obtained. For example, (see the next diagram) if the display is 12 longs and 17 units, then 10 of the 17 units can be traded for a long (leaving the other 7 units). That results in a total of 13 longs.– so then 10 of those longs can be traded up for a flat (leaving the other 3 longs). The result is 1 flat, 3 longs, and 7 units – which represents the number 137.

Section 4-1: Addition of Whole Numbers
Page 4 - 8
12 longs and 17 units
Minimal set: 1 flat, 3 longs, 7 units = 137
! In forming a minimal set using Base Ten Blocks, you should never end up with more than nine of any particular type of piece. This corresponds to the fact that in the base ten number system, in any place value the largest digit possible is “9”. If you have a number displayed with Base Ten blocks with more than nine pieces of one type, then you have not simplified to the minimal set.
Practice Problems:
Use Base Ten Blocks to “trade up” and rewrite these collections as minimal sets. Example: 13 flats, 5 longs, 18 units " 1 blocks, 3 flats, 6 longs, 8 units = number 1,368 a) 4 flats, 8 longs, 17 units " blocks, flats, longs, units = number b) 15 flats, 2 longs, 1 unit " blocks, flats, longs, units = number c) 3 flats, 11 longs, 16 units " blocks, flats, longs, units = number

Section 4-1: Addition of Whole Numbers
Page 4 - 9
Solutions to Practice Problems:
a) 4 flats, 8 longs, 17 units " 0 blocks, 4 flats, 9 longs, 7 units = number 497 b) 15 flats, 2 longs, 1 unit " 1 blocks, 5 flats, 2 longs, 1 units = number 1521 c) 3 flats, 11 longs, 16 units " 0 blocks, 4 flats, 2 longs, 6 units = number 426
Activity: “Trading Up Game” with Base Ten Blocks
Materials: Base Ten Blocks and two dice
- Two or three people play together. Take turns. - On your turn, roll two dice and multiply the two numbers showing. Take that many unit cubes. Then if you can, “trade up” (that is, exchange pieces)
to make a minimal set. - On each subsequent turn, add your new batch of unit cubes to the ones you already
have and trade up if possible. - The first person to get a “flat” (i.e., 100) wins. The winner may go over 100. Alternative Cooperative Game: Combine the unit blocks you gain on each turn until the total for all the players can be
traded up for a flat (or more).
Addition algorithm using Base Ten Blocks
An algorithm is a step-by-step procedure. Base Ten Blocks can be used to demonstrate the traditional algorithm for addition. The traditional algorithm is often taught and memorized as an efficient procedure, but it is best taught after children have a conceptual understanding developed through hands-on activities and manipulatives. For example, to demonstrate the sum 457 + 164, first display each number with a minimal set of Base Ten Blocks. Then put the two sets together and “trade up” to form a minimal set. This is pictured just after these two notes: 1. Notice that ten unit pieces are grouped to form a long.
In the algorithm, this corresponds to carrying into the tens place. 2. Then ten longs are grouped to form a flat.
In the algorithm, this corresponds to carrying into the hundreds place.

Section 4-1: Addition of Whole Numbers
Page 4 - 10
457 + 164 ------------------------------------------------------------------------------------------------------------------ 1 457 + 164 1 ------------------------------------------------------------------------------------------------------------------ 11 457 + 164 21 11 457 + 164 621 " 6 flats, 2 longs, 1 unit as pictured above This set of blocks corresponds to the traditional additionalgorithm, which would be written and explained this way: 1 1 4 5 7 The idea of the traditional algorithm is to add the numbers in the “ones” + 1 6 4 column first: 7 + 4 = 11 " write the unit 1 and “carry” the other 1 above the 6 2 1 “tens” column.
Then in the tens column add the 5 + 6 + the 1 at the top "12, and write the 2 in the tens column and “carry” the 1 and write it in the “hundreds” column. Then in the hundreds column add the 4 + 1 + the 1 at the top " 6.

Section 4-1: Addition of Whole Numbers
Page 4 - 11
Practice demonstrating the addition algorithm You may want to work with a partner on the following activity, taking turns using the materials and recording the results. Use Base Ten Blocks (or other base ten materials) to display each of the numbers in these addition problems. Then “trade up” and exchange pieces as needed to display the sum with a minimal set of pieces. Record the results. a) 728 b) 1462 c) 328 d) 876 + 146 + 819 + 96 + 555 Note: Exercises for Section 4-1 are with Exercises for 4-2, following Section 4-2.
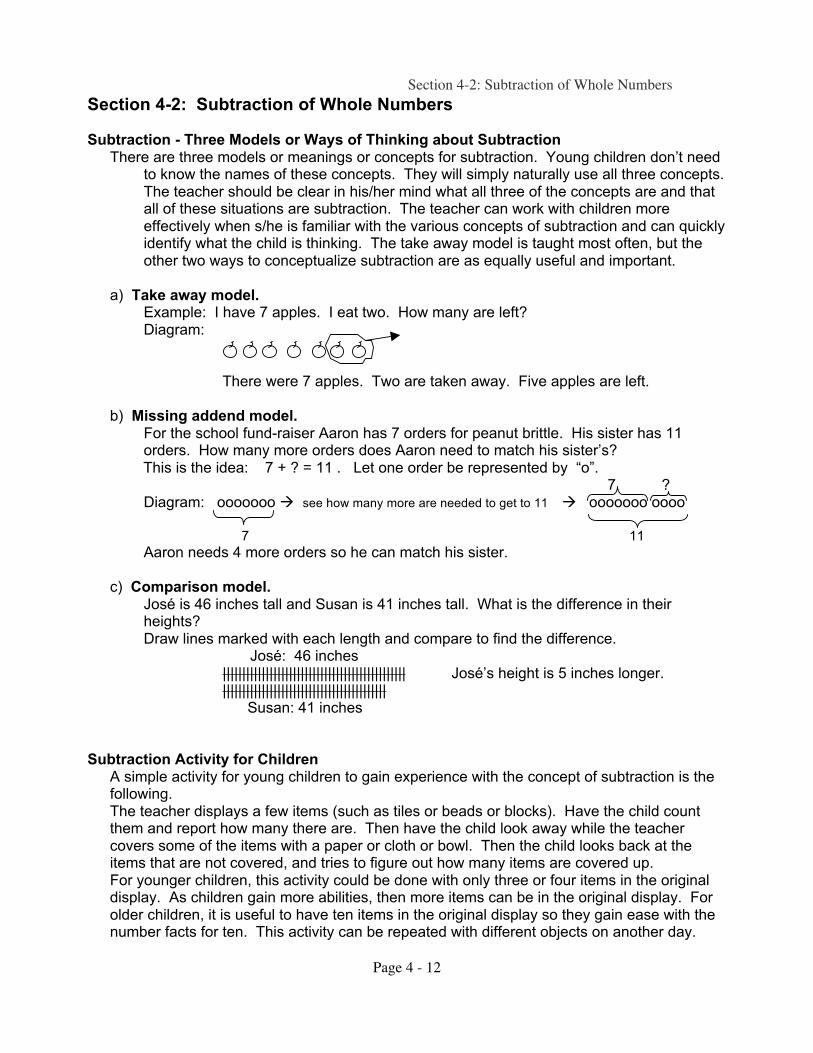
Section 4-2: Subtraction of Whole Numbers
Page 4 - 12
Section 4-2: Subtraction of Whole Numbers Subtraction - Three Models or Ways of Thinking about Subtraction There are three models or meanings or concepts for subtraction. Young children don’t need
to know the names of these concepts. They will simply naturally use all three concepts. The teacher should be clear in his/her mind what all three of the concepts are and that all of these situations are subtraction. The teacher can work with children more effectively when s/he is familiar with the various concepts of subtraction and can quickly identify what the child is thinking. The take away model is taught most often, but the other two ways to conceptualize subtraction are as equally useful and important.
a) Take away model. Example: I have 7 apples. I eat two. How many are left? Diagram: There were 7 apples. Two are taken away. Five apples are left. b) Missing addend model. For the school fund-raiser Aaron has 7 orders for peanut brittle. His sister has 11
orders. How many more orders does Aaron need to match his sister’s? This is the idea: 7 + ? = 11 . Let one order be represented by “o”. 7 ? Diagram: ooooooo " see how many more are needed to get to 11 " ooooooo oooo 7 11
Aaron needs 4 more orders so he can match his sister. c) Comparison model. José is 46 inches tall and Susan is 41 inches tall. What is the difference in their
heights? Draw lines marked with each length and compare to find the difference. José: 46 inches
||||||||||||||||||||||||||||||||||||||||||||||| José’s height is 5 inches longer. ||||||||||||||||||||||||||||||||||||||||||
Susan: 41 inches Subtraction Activity for Children A simple activity for young children to gain experience with the concept of subtraction is the
following. The teacher displays a few items (such as tiles or beads or blocks). Have the child count
them and report how many there are. Then have the child look away while the teacher covers some of the items with a paper or cloth or bowl. Then the child looks back at the items that are not covered, and tries to figure out how many items are covered up.
For younger children, this activity could be done with only three or four items in the original display. As children gain more abilities, then more items can be in the original display. For older children, it is useful to have ten items in the original display so they gain ease with the number facts for ten. This activity can be repeated with different objects on another day.

Section 4-2: Subtraction of Whole Numbers
Page 4 - 13
Mary Baratta-Lorton in Mathematics Their Way (p. 179) states: “Through these games children will develop the mental images which they will need at the
abstract level of number concepts.” She goes on to say that children should work with the same concept using a variety of
materials since that will result in their internalizing the concept more firmly. This subtraction activity can be done in many ways over the course of months. For example, use tiles and cover them with paper; use cubes and cover them with a bowl; use beans and hide them in a hand. Be creative with the many ways you can do this activity.
! Using Base Ten Materials to Explore Subtraction
Base Ten materials are useful for exploring subtraction with numbers above ten. The materials can be used to illustrate each of the three models of subtraction since place value is involved. ! Take Away Model - Show the subtraction problem 21 – 7 with base ten blocks, using the Take Away Model of subtraction. At the start display the number 21 using 2 longs and 1 unit. Then we would like to take away 7 units. But there are not 7 units to take away! So we would need to “trade down” and exchange one of the longs and replace it with 10 units. At that point the number 21 would be represented by 1 long and 11 units. Then we could take away 7 units, leaving 4 units behind with the 1 long. So the result is 14. 21 – 7 = 14.
" " " Notice that this matches the typical algorithm for doing subtraction, involving “borrowing”. 1 11 1 11
2 1 " 2 1 " 2 1 – 7 – 7 – 7 1 4 ! Missing Addend Model - Another approach to showing 21 – 7 is to use the Missing Addend
Model of subtraction. This model displays a subtraction concept using an “addition” set up. We are asking the question: 7 + ? = 21 (that is, if you have 7 items, how many more are needed to get to 21 items?). To illustrate this model with base ten blocks, we would start with 7 units. Then we would notice how much more we need to add to those 7 units to get a total of 21.
7 plus 3 units to get 10 plus 10 + 1 more to get 21
+ " + "

Section 4-2: Subtraction of Whole Numbers
Page 4 - 14
The total added on is 3 units and then a long and another unit, which is a total of a long and 4 units, which is 14. So, when starting with 7, to get the total of 21, the missing addend is 14.
! The Comparison Model of subtraction could be used to determine the answer to 21 – 7.
The idea here is to display the number 21 and to display the number 7, and then to see how they compare (that is, to determine the difference between them). One easy way to do this is to put the larger number’s pieces on the bottom, and put the pieces for the smaller number on top. Then the part not covered up is the difference between them
this uncovered part is the difference " it equals 14 units
7 "
21 "
Another example of the “comparison” model of subtraction: 136 – 74 Place Base Ten pieces for 136 on the table. Then place pieces for 74 on top of it. The part not covered is the difference.
Activity: “Trading Down Game” with Base Ten Blocks
Materials: Base Ten Blocks and two dice
- Two or three people play together. Take turns. - Each person starts with one flat.- On your turn, roll two dice and multiply the two numbers showing. Take that many unit cubes AWAY. You may need to exchange pieces in order to
do that. - On subsequent turns, subtract the indicated number of units from your remaining
pile of unit cubes. - The first person to get to zero pieces wins. The winner may go “below zero”.
The Subtraction Algorithm with Base Ten Materials Base ten materials can also be used to explain the typical algorithm for subtraction. This
algorithm is based on the “take away” model. It involves “regrouping”, when necessary. (Note, you may be familiar with “borrowing” when doing subtraction. The word “borrowing” is not typically used anymore; instead curricular materials refer to “regrouping”. “Borrowing” could sometimes imply the misconception that the value is reduced, so “regrouping” is the preferred term.)
• Example with no regrouping (no borrowing) needed: 2 5 7 Display (or draw) the pieces for the first number, 257. – 3 6 Then take away pieces for 36. (If drawing, circle the pieces for 36 and use 2 2 1 an arrow or cross them out to show they are being removed.

Section 4-2: Subtraction of Whole Numbers
Page 4 - 15
• Example when regrouping is needed. Regrouping requires an exchange (trading down) of base ten pieces. First Step: 2 5 7 Display (or draw) the pieces for the first number, 257. – 9 8 The goal is to take away 98 unit pieces from 257. Second Step: We cannot take away 8 units since there aren’t enough, so trade one of the longs for 10 units. That gives us 17 units. From the 17 units, take away 8 units, leaving 9 units behind. 4 17
2 5 7 – 9 8 9 Third Step: We cannot take away 9 longs from the 4 longs. So trade one of the flats for ten longs. That gives a total of 14 longs. Take away 9 longs from the 14 longs, leaving 6 longs behind. 1 14 17 2 5 7 – 9 8 1 5 9 Result is 159: Practice demonstrating the subtraction algorithm You may want to work with a partner on the following activity, taking turns using the materials
and recording the results. For each problem below do the following: Use a minimal number of Base Ten Blocks (or other base ten materials) to display the original number in the problem. Then take away pieces representing the number being subtracted. Trading pieces may be necessary to accomplish this. Record the results as you remove pieces, as was done in the previous example.

Section 4-2: Subtraction of Whole Numbers
Page 4 - 16
a) 748 b) 262 c) 326 d) 1376 – 126 – 19 – 48 – 595 ! Using Mental Calculations to do Subtraction As with addition, there are many ways that people do “mental arithmetic” in figuring out subtraction problems. Here are some examples. Example A – mental calculations of subtraction: The problem is 58 – 19. Here are reports from students explaining how they think about it. • “I’m subtracting 19. That is almost the same as subtracting 20 (20 is a “friendly” number).
So I did 58 – 20 = 38. But I actually only wanted to subtract 19. When I subtracted 20, I subtracted 1 too many. So now put that 1 back in. The final result is 1 more than 38, so it is 39.”
• “I want to subtract 19, but first I just subtracted the 10 (thinking that 19 is 10 +9). So 58 – 10 is 48. I still need to subtract 9 from the 48. I think of the 9 as 8 + 1. Then next I subtract 8 from 48, which gives me 40. Then I still need to subtract the 1 from 40. That leaves 39.”
• “I want to know the difference between 58 and 19. If I make each of the numbers 1 bigger, then the difference between them is still the same. I want to make them 1 bigger because then the 19 would be 20, which is an easier number. When I make them 1 bigger I have 59 – 20. That is easy since I just need to think about 5 tens minus 2 tens, giving 3 tens. So the result is 39.”
Example B – mental calculations of subtraction: The problem is 136 – 72. Here are some approaches. • “I need to subtract 72, which is 70 + 2. So first I just subtract the 2. 136 – 2 is 134. Now I
need to subtract 70 from 134. So I think that I have 13 tens, and need to subtract 7 tens, which leaves 6 tens. The result is those 6 tens, and the 4 units from the 134. The answer is 64.”
• “I decided to think about the ‘missing addend’. What I mean is, I will start with 72, and then see how much more I need to get to 136. I first thought about 72 + 70, which is 142, and that is too much (it’s more than 136). So then I decided to try 72 + 60, which is 132. That is close to 136, but I still need 4 more. So all together, I had to add 60 and then 4 to get from 72 to 136. So the answer is 64.”
• “I want to subtract 72 from 136, but it’s easier to subtract 80. 136 – 80 is 56 because the 13 tens minus 8 tens is 5 tens (and the 6 units stay). When I subtracted 80, that was subtracting too much since I really wanted to subtract 72. I subtracted 8 too much. So I need to add that 8 back in the answer. I had 56, and now I put 8 back with it. To figure that out, I think how 56 + 10 is 66, but I want 56 + 8 so that is 64.”

Section 4-2: Subtraction of Whole Numbers
Page 4 - 17
Online sites to help with mastering basic math facts. Check these out! ! To get more computation practice on your number facts, try this site which has online “math flash cards” http://www.apples4theteacher.com/flash-cards.html#top You can select add, subtract, multiply, or divide – and select a level of difficulty. Answers are checked and scores reported. ! The ArithmAttack is at http://www.dep.anl.gov/aattack.htm You see how many answers you get in 60 seconds. Choose from add, subtract, multiply, divide, or choose a random mixture of operations. This site is “A gift to the children and math students of the world from the U.S. Department of Energy's Argonne National Laboratory.” Note: Websites can go out of date; these were functioning as of Sept. 2009. There are many more websites for practicing math.

Section 4-2: Subtraction of Whole Numbers
Page 4 - 18
Activity: “Train Game” using dice and cubes for addition. This game could be played by children who know how to count well in Kindergarten or by older children.
Children of different ages would play it differently, depending on whether they can do addition or need to count the train size (the number of cubes in the “train”) each time.
YOU should play this game by doing the additions mentally.
Materials: A die or else a spinner with numbers 1 to 6. Unifix cubes, or any cubes, tiles, or other objects that can be laid in a row.
Game Directions: Two people play. Take turns. On your turn, toss the die. Take that many unifix cubes and add them to your “train”. Record the total number of cubes in your train (on the table below). After each person has had a turn, record whose train is longer, and how much longer it is.
Notes: The colors of the cubes do not matter in this game. Three people could play instead of two.
After this turn
Person A’s Train Length
Person B’s Train Length
Whose Train is Longer?
How much longer?
(optional) Person C’s Train Length
1
2
3
4
5
6
7
8
9
10
11
12
13
14
15
16
17
18
19
20

Section 4-2: Subtraction of Whole Numbers
Page 4 - 19
Sections 4-1 and 4-2: Exercises on Addition and Subtraction of Whole Numbers 1. Suppose you visit a classroom of four- and five-year-olds and the assistant teacher says “I
don’t need to know how to calculate with numbers bigger than ten! These kids don’t do numbers like that.”
Write your reflections on how you could explain to this teacher why an early childhood educator needs to know more about mathematics than the young children will be able to do.
2. Suppose you are observing a five-year-old who is trying to add 3 + 8 by getting a pile of 3
blocks and pile of 8 blocks. a) Describe how the child might proceed to find the answer if the child does not yet have the
skill of “counting on”. b) Describe how the child might proceed to find the answer if the child does have the skill of
“counting on”. c) Describe how the child might proceed if the child understand the commutative property.
3. a) Describe an addition activity you could do with children aged 4, 5, or 6. b) Describe a subtraction activity you could do with children aged 4, 5, or 6. 4. Do not use a calculator to find the answers to these addition problems. Practice illustrating
these problems using Base Ten materials to model the problem.
a) 325 b) 428 c) 2,477 d) 1,245 e) 5,799 + 643 + 719 + 693 + 578 + 6,879
5. Use “mental arithmetic” to find the answers to these addition problems. Try to just look at the problem and do the work in your head using properties of addition, and then write the answer. Prepare an explanation regarding your thought process for each problem.
a) 78 + 10 = b) 415 + 15 = c) 110 + 37 = d) 18 + 45 + 2 = e) 34 + 49 = f) 78 + 21 = g) 345 + 27 = h) 17 + 112 + 13 = i) 34 + 233 = 6. Without using a calculator find the answers to these subtraction problems. Practice
illustrating these problems using Base Ten materials..
a) 367 b) 924 c) 823 d) 1,425 e) 3,702 ! 243 ! 719 ! 147 ! 578 ! 1,279
7. Use “mental arithmetic” to find the answers to these subtraction problems. Try to just look at the problem and do the work in your head, and then write the answer. Consider the take away model and the missing addend model. Prepare an explanation regarding your thought process for each problem.

Section 4-2: Subtraction of Whole Numbers
Page 4 - 20
a) 78 – 10 = b) 415 – 15 = c) 140 – 37 = d) 84 – 71 = e) 260 – 42 = f) 92 – 38 = g) 17 – 9 = h) 98 – 44 = i) 830 – 52 = 8. For each of the following problems, select which model of subtraction is most appropriate for
solving the problem. Then solve the problem using that model, including a diagram. The choices of models are: Take Away model, Missing Addend model, and Comparison model.
a) Peggy has seven brothers at home. Four of them left for school. How many brothers are still at home?
b) Jemma’s necklace is 14 inches long and Olga’s is 23 inches long. What is the difference between the lengths of their necklaces?
c) Dale read 27 books for the library’s summer reading program. So far Manuel has read 19 books. How many more books must Manuel read to catch up to Dale’s number?
9. Write application problems ( “word problems”) that illustrate or use a specific model of
subtraction. Write a different problem for each of the models below. (Do NOT use the same application topics as in problem #8.)
a) Use the “Take Away” model b) Use the “Missing Addend” model c) Use the “Comparison” model 10. a) Make a list of all the combinations of two Whole Numbers that add to equal 8 (8 is the
“target number”). Note: the Whole Numbers are 0, 1, 2, 3, etc. For this exercise, if the numbers are written in a different order we will count that as a different combination [so, 2 + 6 is one combination and 6 + 2 is another combination].
b) How many different combinations are there? 11. Complete this table.
Target Number
Combinations of two whole numbers that add to the Target Number
# of combinations
0 0 + 0 1
1 0 + 1, 1 + 0 2
2
3 0 + 3, 1 + 2, 2 + 1, 3 + 0 4
4
5
6
7
8
20 no need to fill in this box – rather, find a pattern for the # of combinations
37 no need to fill in this box – rather, find a pattern for the # of combinations
172 no need to fill in this box – rather, find a pattern for the # of combinations

Section 4-2: Subtraction of Whole Numbers
Page 4 - 21
12. Use Base Ten Blocks to “trade up” and rewrite these collections as minimal sets. Example: 13 flats, 5 longs, 18 units " 1 blocks, 3 flats, 6 longs, 8 units = number 1,368 a) 7 flats, 2 longs, 14 units " blocks, flats, longs, units = number b) 15 flats, 2 longs, 31 units " blocks, flats, longs, units = number c) 3 flats, 17 longs, 15 units " blocks, flats, longs, units = number d) 12 flats, 11 longs, 18 units " blocks, flats, longs, units = number 13. a) Create an addition problem of a two-digit number plus a two-digit number by placing these four digits: 1, 3, 5, 7 into the boxes in the display to the right. Do this so that the sum is as large as possible. b) What is that largest possible sum? c) Is there more than one way to get that largest sum? If so, show all answers. d) What strategy did you use in placing the digits? 14. a) Create a subtraction problem of a two-digit number minus a two-digit number by placing these four digits: 3, 4, 5, 6 into the boxes in the display to the right. Do this so that the difference is as large as possible. b) What is that largest possible difference? c) Is there more than one way to get that largest difference? If so, show all answers. d) What strategy did you use in placing the digits?

Section 4-3: Multiplication of Whole Numbers
Page 4 - 22
Section 4-3: Multiplication of Whole Numbers The common chicken has two feet, and each foot has three toes. When five chickens are in
the yard, how many chicken feet are there? How many chicken toes are there? What operation is used to find these answers?
• Five chickens with two feet each ! there are 5 x 2 = 10 chicken feet in the yard. • How many toes are there? Each foot has three toes ! 10 feet x 3 toes each = 15 toes. • Multiplication is a good way to find these answers. When introducing this problem to young children you may want to sketch the chickens, feet,
and toes so the children can count the objects to obtain the answers.
The Meaning of Multiplication Multiplication by a whole number has the meaning of “repeated addition”. For example, 3 x 4 means that three times we add the number 4, which is 4 + 4 + 4.
Since 4 + 4 + 4 = 12, we know that 3 x 4 = 12.
Models for Multiplication Objects can be used to model multiplication. One way to model 3 x 4 would be to have
an array of 3 rows with 4 objects in each row, such as:
Another way of looking at that same model is to think of it as 4 columns of 3 objects in each column. That way of thinking of it is 3 + 3 + 3 + 3, which equals 12 of course. This is a model of 4 x 3.
Other models for multiplication will be discussed later in this section. Notation: There are several different multiplication symbols.
- The “x” is often used for the operation of multiplication in grade school, such as 3 x 7. - The symbol “•” is also used to mean multiplication, such as 3 • 7 = 21. - Also, multiplication can be indicated without writing any sign at all, but rather putting the
numbers in parentheses beside each other, such as (3)(7). In algebra, letters are used as variables to represent numbers. The letters x and y are
often used as variables. The letter x and the multiplication symbol x look alike, and that can be confusing. So, in later grades and in algebra, the symbol “•” is used for multiplication rather than the “x”. And in algebra parentheses are regularly used to indicate multiplication. When one is not doing algebra, any of these notations may be used.
Vocabulary review In an earlier example we wrote the multiplication problem 5 x 2 = 10. Here 5 and 2 are factors of 10, and 10 is the product. In general: A factor is something which is multiplied by something else. A product is the answer or result of a multiplication. Examples: In this equation 3 x 7 = 21, the factors are 3 and 7 while the product is 21.

Section 4-3: Multiplication of Whole Numbers
Page 4 - 23
In this equation 48 = 4 • ?, the factors are 4 and an unknown number. The product is 48. ! Properties related to multiplication
The two ways of viewing the model to the right, as either 3 x 4 (three rows of 4) or as 4 x 3 (four columns of 3) are both reasonable, which lets us see that 3 x 4 = 4 x 3.
The Commutative Property of Multiplication.
When two numbers are multiplied, the numbers can be written in either order without changing the product.
In symbolic form: a x b = b x a
Another property of multiplication involves multiplying three numbers together. Any two
of the numbers can be grouped together and multiplied first, and then that product can be multiplied by the third number.
For example: 9 x 5 x 2 = (9 x 5) x 2 = (45) x 2 = 90 9 x 5 x 2 = 9 x (5 x 2) = 9 x (10) = 90
The Associative Property of Multiplication.
When three numbers are multiplied, any two of them can be multiplied first, and then that product can be multiplied by the third number. In other words, the grouping of the numbers in multiplication does not change the product.
In symbolic form: a x (b x c) = (a x b) x c
Example: To multiply 40 x 17 x 50, it might be easier to commute the order to get 40 x
50 x 17. Then associate the first two numbers (40 x 50) x 17, which gives (2000) x 17. You may be able to do that multiplication mentally by doing this thinking:
2000 = 1000 x 2. So 2000 x 17 = 1000 x 2 x 17 = 1000 x (34) = 34,000. The Distributive Property involves both multiplication and addition. It can be
demonstrated by using the model of multiplication showing rows of objects. Consider this diagram: ! ! ! ! ! ! ! ! ! ! ! ! ! ! ! ! ! ! - The total number of dots could be found by first finding the number in the group on
the left and then adding it to the number in the group on the right. The group on the left is 2 rows of 4 dots, which is 2 x 4 = 8 dots. The group on the right is 2 rows of 5 dots, which is 2 x 5 = 10. Then the total number of dots is 8 + 10 = 18.
- Another way of getting the total number of dots would be to view the diagram as having two identical rows, and figuring out how many are in each row: that is 4 + 5 = 9 dots in each row. Then the total number of dots is 2 rows of 9, which is 2 x 9 = 18. Of course the final result is again 18.
- Viewed as two groups, the dots represent 2 x 4 + 2 x 5 (where the multiplication is done before the addition according to the agreed upon order of operations).
Viewed as two rows, the dots represent 2 x (4 + 5). The two expressions are equal: 2 x (4 + 5) = 2 x 4 + 2 x 5

Section 4-3: Multiplication of Whole Numbers
Page 4 - 24
The Distributive Property of Multiplication over addition.
In symbolic form: a x (b + c) = a x b + a x c
The Distributive Property is useful when multiplying numbers with more than one digit.
In fact, the usual algorithms for such multiplications make use of the distributive property.
For example, consider the usual algorithm for this problem: 21 x 3 63 The factor 3 is multiplied by the 1 in the units position and then the 2 in the tens
position. Those two results are then added to form the final product. If you think about it, the reason this works is that the factor 21 is being thought of as 20 + 1. The factor 3 is multiplied by (20 + 1), and we do that by distributing the 3 to multiply separately by the 1 and by the 20, and then those results are added together. That is: 3 x (21) = 3 x (20 + 1) = 3 x 20 + 3 x 1 = 60 + 3 = 63.
! Special numbers: One and Zero One is a special number in multiplication. When one is multiplied by any number, the
result is simply the other number. For example: 1 x 7 = 7, 34 x 1 = 34, 1 x 186 = 186. Since multiplying by one leaves the other number identical to what it was, the number
one is called the identity for multiplication. In general, if “a” is used to represent a number: 1 x a = a and a x 1 = a.
Multiplying by the number 1 does not change the value of the number. That fact is very
useful in working with fractions – for instance, in rewriting fractions from one form to another equal but different-looking form. Multiplying by 1 is also useful in solving equations in algebra.
Zero also plays a special role in multiplication. For example: 0 x 9 = 0, 1,342 x 0 = 0,
17 x 0 = 0 and 0 x 1 = 0.
Zero multiplied by any number equals zero.
Summary of the Properties of Multiplication Commutative Property of Multiplication: a x b = b x a Numbers can be multiplied in either order, giving the same result.
Associative Property of Multiplication: a x (b x c) = (a x b) x c The grouping of numbers in a multiplication does not change the result.
Distributive Property of Multiplication over Addition: a x (b + c) = a x b + a x c. The Multiplication Identity is 1: 1 x a = a and a x 1 = a Multiplication by Zero: 0 x a = 0 and a x 0 = 0

Section 4-3: Multiplication of Whole Numbers
Page 4 - 25
Multiplication Table for a one-digit number times a one-digit number. You should memorize all of the multiplication facts in the multiplication table below. Notice the symmetry in the table, around the diagonal from the upper left to the lower
right. The shaded upper-right “triangle” has all the same numbers as the white lower-left “triangle”-. The multiplication results appear in the table in two places because of the commutative property.
For example 3 x 4 and 4 x 3 are each displayed with the result of 12.
x 0 1 2 3 4 5 6 7 8 9
0 0 0 0 0 0 0 0 0 0 0
1 0 1 2 3 4 5 6 7 8 9
2 0 2 4 6 8 10 12 14 16 18
3 0 3 6 9 12 15 18 21 24 27
4 0 4 8 12 16 20 24 28 32 36
5 0 5 10 15 20 25 30 35 40 45
6 0 6 12 18 24 30 36 42 48 54
7 0 7 14 21 28 35 42 49 56 63
8 0 8 16 24 32 40 48 56 64 72
9 0 9 18 27 36 45 54 63 72 81
! Arrays as Models for Multiplication (also called Rectangular Area Models)
One model for multiplication is to show an array of rows and columns. Grid paper (also called graph paper) is useful for showing this. This model is similar to having rows of objects, but in this case there are no “objects” but rather just a rectangle with the width equal to one of the factors and the length equal to the other factor. Here is an array of 3 rows and 4 columns; the size of the rectangle is 3 wide and 4 long. The product of 3 x 4 equals the total number of squares in the array. The rectangle of height 3 and length 4 has area of 12 square units.
An array model of 3 x 4 !

Section 4-3: Multiplication of Whole Numbers
Page 4 - 26
Base Ten Blocks as an Array Model of Multiplication
Base Ten Blocks can be used to model multiplication. The pieces can be placed in a rectangular display so that the number of rows is one of the factors and the number of columns is the other factor. If you have Base Ten Blocks, it is useful to make these models with them. Certainly children should use the Base Ten blocks.
Multiplication Algorithm illustrated with Base Ten Blocks: Here we will show a diagram of what the Base Ten Blocks model would look like
multiplying a one-digit number times a two-digit number. This diagram is drawn as if the blocks were viewed from above.
For example, 4 x 27 would be modeled by placing four rows of the base-ten blocks for 27 It would look like this:
The result of 4 x 27 is the total number of “unit squares” in the diagram. We can
determine that number in this way: The number of individual “unit” pieces is on the right hand side, the 4 rows of 7 in each row, which is 28 units. The number of base ten pieces that are rods (or longs or strips) is 8. This gives 80. The total is 28 + 80 = 108.
This way of finding the product 4 x 27 is similar to the usual algorithm for multiplication,
but it provides the “partial products” that are eventually added together. (Recall that an “algorithm” is a step-by-step procedure.) 27 x 4 28 " partial product from 4 x 7 80 " partial product from 4 x 20 108 " sum of the partial products This instructional algorithm, showing the partial products, is useful for helping people
understand why the usual algorithm works. It is good for children in grade school to understand why the usual algorithm works as shown by the diagram above and the algorithm that matches it.
The traditional algorithm written in final form is as follows: 2
27 This is the compressed form of the algorithm above. When one multiplies x 4 4 x 7 getting 28, the 8 is written in the units place and the 2 tens are jotted 108 down over the ten’s column, to be added in later. Next the 4 is multiplied by the 2 tens (in the 27), resulting in 8 tens, and the
other 2 tens carried over from the 28 are added to the 8 tens giving 10 tens total. That “10” is written next.

Section 4-3: Multiplication of Whole Numbers
Page 4 - 27
Another example of showing how the base ten blocks can be used as a model for
multiplication using the partial products and the traditional algorithm: Model the problem 14 x 27. The array in this diagram is length 14 on one side and length 27 on the other (since 14
and 27 are the two factors we are multiplying).
The result of 14 x 27 is the total number of “unit squares” in the diagram. We can
determine that number by finding the “partial products” in the four different sections (shaded in below, labeled with letters) and then adding them together.
d c
b a
· a - The number of individual “unit” pieces is on the right hand side bottom corner is 4 rows of 7 in each row, which is 28 units.

Section 4-3: Multiplication of Whole Numbers
Page 4 - 28
· b - The number of base ten pieces that are rods in the two bottom sections on the left and middle come from 4 rows of two rods in each row – which is a total of 4 x 2 rods = 8 rods, which represents 4 x 2 tens, which is 8 tens (which is the number 80).
· c - The number of base ten pieces that are rods in the upper right hand section is 7 columns each of which is a rod, which is 7 rods, which represents 7 x 10 = 70.
· d - Finally, there are two larger sections that are each a 10 x 10 “flat” Base Ten piece. This part of the diagram comes from 10 rows of 20 long. The total of these is 200.
Here is the “partial products” algorithm. 27 x 14 28 " partial product from 4 x 7 80 " partial product from 4 x 2 tens = 4 x 20 = 80 70 " partial product from 10 x 7 200 " partial product from 10 x 20 = 200 378 " sum of the partial products The traditional algorithm for multiplying 27 times 14 is written in final form as follows: 2
27 This is the compressed form of the algorithm above. x 14 108 " from 4 x 27 27 " from 1 in the tens place x 27 378 " sum of the partial products ! Applications of Multiplication Many situations require multiplication. Here are a few examples. Example A: Jerry is collecting the money for jerseys for his son’s recreational soccer team.
Each child pays $13 for a jersey, and there are 16 children on the team. How much money is collected?
Solution: $13 is paid 16 times, so the total amount of money is 13 x 16, which is $208. Example B: Every day the neighbor’s three dogs visit Leandra and she gives them each a
biscuit. In July, how many biscuits did she give out to these dogs? Solution: First we need to recall how many days are in July. There are 31 days. So
the number of biscuits is 3 x 31 = 93. Example C: Celeste noticed that her classroom floor is covered in square tiles. She counted
30 rows of tiles, and there are 25 tiles in each row. How many tiles are there all together?
Solution: 30 rows of 25 tiles in each is 30 x 25 tiles. Using facts and properties of multiplication, this could be found mentally in this way: 30 x 25 = (3 x 10) x 25 = (10 x 3) x 25 = 10 x (3 x 25) = 10 x (75) = 750. there are 750 tiles.

Section 4-3: Multiplication of Whole Numbers
Page 4 - 29
! Using Mental Calculations to do Multiplication Here are some examples of how people might use mental calculations to figure out products.
Notice that some of these methods make use of the commutative, associative, and distributive properties to make the work easier (even though the properties are not mentioned).
Example D: The problem is 9 x 5. Here are how several students report they think about it. • “It is easy to multiply by 10. I know that 10 x 5 is 50. That means 10 fives equals 50,
but for this problem I have only 9 fives. So the result is five less than 50, which is 45.” • “I know that 8 x 5 is 40 – it is one of the facts I have memorized. So then 9 x 5 is five
more than that, which is 45.” • “I know that when multiplying by 9, the sum of the digits of the product is 9. This will
help me check my answer.” Example E: The problem is 7 x 9.
• “I first switch the order to 9 x 7 because I find that a little easier to think about. Then I know what 10 x 7 is: 70. But I want only 9 x 7, which is 9 sevens. That is seven less than 10 sevens. So I take 7 away from 70, leaving 63. 9 x 7 = 63.”
• “I break this into problems that I know fast. Think of the 7 as 3 + 4. I figure out 3 x 9 and also 4 x 9, and then put them together to get 7 x 9. I know 3 x 9 is 27. And 4 x 9 can be figured out because 4 x 10 is 40 and 4 x 9 is four less than 40, which is 36. Next I add together the 3 x 9 and 4 x 9, which is 27 + 36 = 20 + 30 + 7 + 6 = 50 + 13 = 63.”
Note that this student used the distributive property at the start: (3 + 4) x 9 = 3 x 9 + 4 x 9. Example F: The problem is 13 x 16. • “Instead of doing all of the 13 times 16 at once, I think of the 13 as being 10 + 3, and
then multiply each of those times 16. 10 x 16 is 160. 3 x 16 is 48. Now add those together to get 160 + 48 = 160 + 40 + 8 = 200 + 8 = 208.
• “I figured 13 x 20 = 260 (since 13 x 2 = 26). But I want 13 x 16, not 13 x 20. So I need to get rid of 13 x 4 (I get the 4 because 20 - 16 = 4). To figure out 13 x 4 I figure it’s twice as big as 13 x 2, which is 26. Twice 26 is 52. So 13 x 4 is 52. Now I need to take the 52 away from the 260 I figured out earlier. The difference of 60 and 52 is 8, so the difference of 260 and 52 is 208, which is the result.”
• “I realized that 16 can be rewritten as 4 x 4, and each of the 4s is 2 x 2. So 16 is 2 x 2 x 2 x 2. I did that because it isn’t too hard to double things (usually). Now back to the problem 13 x 16 = 13 x 2 x 2 x 2 x 2. I will multiply by each 2 in turn:
(13 x 2) x 2 x 2 x 2 = (26) x 2 x 2 x 2 = 52 x 2 x 2 = 104 x 2 = 208.” ! Estimating Products Sometimes you do not need an exact answer to a multiplication problem, but only an
estimate. To find an approximate, or estimated, answer, we often round one of the factors to a “friendly” nearby number such as a multiple of ten and find the product using that number. Keep in mind that if you rounded the factor to a bigger number, the estimate is larger than the exact answer. If you rounded the factor to a smaller number, the estimate is smaller than the exact answer.

Section 4-3: Multiplication of Whole Numbers
Page 4 - 30
Example G: Sets of blocks cost $24.95, and Celia would like 11 sets for her
classroom. About what would they cost? Solution: first round $24.95 to $25. Now we’d like to know $25 x 11. We know it is
a bit more than $25 x 10, which is $250. In fact, it is 25 more than 250, which is 275. The approximate cost is $275.
Example H: Rob is estimating how many square feet of fence need to be painted, so
he can buy the right amount of paint. He counted 14 sections of fence, and measured the fence to find that each section is about 8 feet long and 6 feet high. Find the number of square feet.
Solution: The square feet of a section equals length times width: 8 x 6 = 48 square feet. Each section has 48 sq. ft. and there are 14 sections so we want to know 48 x 14. To estimate that, round 48 to 50 and find 50 x 14. To find 50 x 14 as a mental calculation, think of the 14 as 10 + 4. Then multiply 50 x 10 and 50 x 4 and add them. That would be 500 + 200 = 700. There are approximately 700 square feet total. However, we rounded the number up [we used 50 rather than 48], so the actual square footage is slightly less.

Section 4-3: Multiplication of Whole Numbers
Page 4 - 31
Section 4-3: Exercises for Multiplication of Whole Numbers 1. To be sure you are current with the basic multiplication facts, fill out this multiplication
table of one-digit numbers multiplied by one-digit numbers. Notice the patterns and symmetries in the table.
x 0 1 2 3 4 5 6 7 8 9
0
1
2
3
4
5
6
7
8
9
2. Next to each diagram, write the letter(s) of the problem(s) that it is modeling. There may
be more than one answer for each diagram – write all matches.
i) ii) iii) Here are the possible matches (some of these might not be used). A) 3 x 2 B) 2 x 6 C) 3 x 2 + 3 x 3 D) 2 + 6 E) 6 + 6 F) 2 + 3 G) 6 x 2 H) 2 x 3 J) 3 x (2 + 3) K) 2 + 2 + 2 L) 3 + 3

Section 4-3: Multiplication of Whole Numbers
Page 4 - 32
3. a) Use Base Ten grid paper (it is after the Exercises) to draw an array to model 7 x 13. b) Write the multiplication of 7 x 13 using the “partial products” algorithm. And mark the
portions of the array that correspond to each of the partial products. c) Write the multiplication of 7 x 13 using the traditional algorithm. 4. a) Use Base Ten Grid paper to draw an array to model 16 x 22. b) Write the multiplication of 16 x 22 using the “partial products” algorithm. And mark the
portions of the array that correspond to each of the partial products. c) Write the multiplication of 16 x 22 using the traditional algorithm. 5. Find these products either using an algorithm, or if you have any trouble with that then
draw them out on the base 10 grid paper.
a) 17 b) 17 c) 25 d) 19 e) 27 f) 79 x 8 x 28 x 12 x 36 x 34 x 0
6. a) Write a word problem, and b) solve it. The solution must involve multiplication of
numbers and at least one of the numbers must be over 20. 7. Janel works for the school newspaper and is going to write a 500 word article on each of
the 13 candidates for student government. How many words total will she be writing for this project?
8. The garden store worker needs to move 29 bags of fertilizer, each weighing 23 pounds.
How many pounds total will she be moving? 9. Michael’s oven only holds one pan of brownies at a time. He needs to bake 3 pans of
brownies for his daughter’s school bake sale. Each pan takes 37 minutes to bake. How long will he be baking brownies?
10. Use “mental calculations” to find the answers to these multiplication problems. Be
prepared to explain your reasoning to classmates. a) 15 x 9 b) 50 x 18 c) 7 x 16 Note: There are websites you can use for practicing math facts. Several were mentioned at
the end of the previous section on Subtraction of Whole Numbers. Check them out!

Section 4-3: Multiplication of Whole Numbers
Page 4 - 33
Base 10 Grid

Section 4-4: Division of Whole Numbers
Page 4 - 34
Section 4-4: Division of Whole Numbers Relationship between Division and Multiplication Division and multiplication are related. They are called inverse operations. Every division
fact is related to a multiplication fact, and vice versa. For example:
42 7 = ? We know the answer is 6 because 6 • 7 = 42. So 42 7 = 6. Likewise, 42 6 = 7 because 6 • 7 = 42. The multiplication fact 9 • 8 = 72 leads to the division facts 72 8 = 9 and 72 9 = 8. Example: 7 • 8 = 56. What are the two division facts related to this multiplication fact? Answer: 56 7 = 8 and 56 8 = 7
Vocabulary, Notation, and Wording The answer to a division problem is called a quotient. There are three common notations for indicating division. The following three expressions all indicate the same division problem: • the division sign 42 7 = 6
• long division notation
• fraction notation = 6
Each of these can be read as “42 divided by 7 equals 6”. Another way to read the expressions is “7 divided into 42 equals 6”. For each expression, the quotient is 6.
Division vocabulary The quotient is the result or answer in a division problem. The other two numbers are called the dividend and the divisor. For each of the three
division notations, you can see which number plays which role below. In each of these examples, the letter “a” is the dividend, the letter “b” is the divisor, and the letter “c” is the quotient.
a b = c
dividend divisor quotient dividend
quotient divisor = c quotient
divisor dividend
For each of these expressions, we can say: the dividend is divided by the divisor, or the divisor is divided into the dividend

Section 4-4: Division of Whole Numbers
Page 4 - 35
Notice that the phrases “divided by” and “divided into” have different meanings (the
“direction” of the division is opposite for the two phrases). If all of life were simple and we always had the larger number divided by the smaller number, then it wouldn’t matter how we said things. But in real life, sometimes it is the smaller number that is divided by the larger number – for example, when there are 2 cookies that must be divided among 4 children. So, when two numbers are going to be divided, it is important to clearly specify which one is being divided by which one.
Example A: If there are 6 marbles and 3 children want to play with them, then each child
gets 2 marbles. We are doing the division problem “6 divided by 3”, which can be
written 6 3, or , or , and the result is 2.
Another way of saying the same thing is to say “3 is divided into 6”, which can be
written 6 3, or , or , and the result is 2.
Example B: If there are 3 yards of ribbon and 6 children each want a piece and are
sharing equally, then each child gets ! a yard of ribbon. We are doing the division problem “3 divided by 6”, which can be written
3 6, or , or , and the result is !.
Another way of saying the same thing is to say “6 divided into 3”, which is written
3 6, or , or , and the result is ! .
Practice Problems on notation and wording 1. Which of the following is a correct way to read 32 4 = 8 ? a) “32 divided into 4 equals 8” b) “32 divided by 4 equals 8” c) “4 divided by 32 equals 8”
2. Which of the following is a correct way to read
a) “3 divided by 27 equals 9” b) “3 divided into 27 equals 9” c) “3 divided by 9 equals 27” d) “27 divided by 3 equals 9”
3. Which of the following is a correct way to read = 4
a) “20 divided by 5 equals 4” b) “20 divided into 5 equals 4” c) “5 divided by 20 equals 4” d) “5 divided into 20 equals 4” 4. In the expression 32 4 = 8, what is the number “8” called? Answers to Practice Problems:

Section 4-4: Division of Whole Numbers
Page 4 - 36
1.- b; 2 – b and d are both correct; 3 – a and d are both correct; 4 –the quotient. "Calculators and Division
On a calculator there is typically one button that indicates division. Usually it is marked with the sign , though sometimes it is marked with the sign / to indicate a fraction line. In “real life” situations, division problems may be written in any of the three notations described above; or they might not use any notation but rather are simply described in words. In any case, if you want to use a calculator to find the answer to a division problem, you must know how to enter the numbers into the calculator. The general format for that is:
Dividend number Divisor number = ! displayed answer is the Quotient Dividend number / Divisor number = ! displayed answer is the Quotient Here are some examples for practicing calculator skills.
A) To do 57 3, simply enter the numbers and signs in that order: 57 3 = or 57 / 3 = and see the result 19.
B) To calculate how many times does 14 divide into 98, enter this on a calculator: 98 14 = or 98 / 14 = and see the result 7.
C) To find the answer to , enter this on a calculator:
118 8 = or 118 / 8 = and see the result 14.75
D) To find the answer to , enter this on the calculator:
74 37 = or 74 / 37 = and see the result 2 Online Calculators If you do not have a calculator but you do have access to the internet, it is possible to find
calculators to use online. One quick way to do this is to go to the google page (www.google.com ) and in the search
bar simply type the calculation you want to perform. For the various operations use these keys on the keyboard: + for addition, the hyphen - for subtraction,
the asterisk * for multiplication, and the slash / for division. You can also enter parentheses if they are needed in your calculation. After entering the expression in the search bar, press enter, and the result appears
below the search bar. Another site which has a small calculator to use is http://www.metacalc.com/ . Several calculators are available at http://www.calculateforfree.com/ . There are many more online calculator sites; you can search for “calculator”. Practice Problems for Using a Calculator: Use a calculator to find each of the following quotients in decimal form. Round answers to
three decimal places.
a) b) c) 48 225 d) e)

Section 4-4: Division of Whole Numbers
Page 4 - 37
Answers to Practice Problems: a) 11.6 b) 8.412 c) 0.213 d) 0.423 e) 0.927
"Concepts of Division There are two major concepts or meanings of division. # The “Sharing Equally” concept is illustrated by this situation: Karl bought a pack of
fifteen pencils for his three children to share equally. How many pencils does each child get? To find the solution, the fifteen pencils are divided into three groups or piles so that there is the same amount in each group. We make 3 piles (3 groups) so that there is one pile for each child. The result is the number of items in each group.
1st child 2nd child 3rd child
This represents the division problem 15 3. The result is 5 since there are 5 pencils in each group (5 pencils for each child).
# The “Repeated Subtraction” concept is illustrated by this situation: Stella has fifteen
antibiotic pills in the bottle, and she needs to take three pills each day. How many days will she be taking pills? To find the solution, from the fifteen pills Stella can subtract three pills to be taken one day, then three pills to be taken the next day, etc., until there are no pills remaining. The result (the number of days she can take the pills) is the number of times she could subtract three pills.
day 1 day 2 day 3 day 4 day 5
This represents the division problem 15 3. The result is 5 since there are 5 groups, with three pills in each group. Three pills could be subtracted five times.
Practice Problems on distinguishing between the two concepts of division. 1. Sam has 18 daffodil bulbs to plant. He has heard that it looks best to plant the bulbs in
groups of three. If he does this, in how many different spots in his garden will he be able to plant a group of three bulbs?
a) Which concept of division is being used? b) Sketch a diagram showing the concept and the result. 2. Debbie has 18 tulip bulbs to plant in three flower beds in her yard. Assuming she
wants to have the same number of bulbs in each flower bed, how many bulbs should she plant in each bed?
a) Which concept of division is being used? b) Sketch a diagram showing the concept and the result. 3. There are thirty books to be placed on shelves. Ten books fit on a shelf. How many
shelves are needed for the books? a) Which concept of division is being used? b) Sketch a diagram showing the concept and the result. 4. There are thirty books to be placed on shelves. Twelve books fit on a shelf. How
many shelves are needed for the books? a) Which concept of division is being used?

Section 4-4: Division of Whole Numbers
Page 4 - 38
b) Sketch a diagram showing the concept and the result. 5. There are 6 marbles and 3 children want to play with them. How many marbles will
each child get? (assume they each get the same number) a) Which concept of division is being used? b) Sketch a diagram showing the concept and the result. Answers to Practice Problems on distinguishing between the two concepts of
division. 1. a) The 18 bulbs are to have 3 put into one group, then three into the next group, etc.
The question is how many groups there will be. This is the Repeated Subtraction concept.
b) Sam can plant bulbs in six different spots in the garden. 2. a) The 18 bulbs are to be divided equally into three groups (into three flowerbeds),
and the question is how many bulbs will be in each group. This is the Sharing Equally concept.
b) There will be six bulbs in each flower bed. 3. a) The 30 books are taken away 10 at a time to put on a shelf. This is the Repeated
Subtraction concept. To get the answer of how many shelves are needed, we need to find out how many times we subtract away 10 books to put on a shelf.
b) ----------------------- ---------------------- ---------------------- 10 books on first shelf 10 books on second shelf 10 books on third shelf
Three shelves are needed for the books. 4. a) The 30 books are taken away 12 at a time to put on a shelf. This is the Repeated
Subtraction concept. To get the answer of how many shelves are needed, we need to find out how many times we subtract away 12 books to put on a shelf.
b) --------------------------- -------------------------- --------------------------- 12 books on first shelf 12 books on second shelf 6 books on part of third shelf
Two full shelves and half of another shelf are used for the books. So a total of 3 shelves are needed.
5. a) The 6 marbles are separated into 3 groups, one group for each child. This is the
Sharing Equally concept. b) o o o o o o Each child gets 2 marbles. "Division with Remainders Sometimes when doing a division problem, the answer does not come out to be a whole
number. Example C: Let’s look at 14 3 from two points of view.

Section 4-4: Division of Whole Numbers
Page 4 - 39
- If we use the Repeated Subtraction way of looking at this problem, we would have 14 items and subtract 3, then subtract 3 again as many times as possible. In the end, there would be some items left over, but not enough to subtract 3 again. Here is the diagram of 14 items total being “subtracted” into groups of size 3 until the last group is smaller than 3:
• • • • • • • • • • • • • • We can subtract 4 groups of 3, and then have 2 items remaining. So the result of 14 3 is 4 with a remainder of 2. This may be written 4 R 2. And it
may be written as 4
- If we think about multiplication facts related to 3 and 14, there are none that involve
only whole numbers. There is a fact involving 3 and a number close to 14, namely: 3 x 4 = 12. This is the closest multiplication fact for 3 that is less than 14. Since 14 = 12 + 2, we see that 14 = 3 x 4 + 2. So 14 3 = 4 R 2 where “4 R 2” is read “4 with Remainder of 2”. Example D: consider 43 8. - A multiplication fact for 8 that is close to 43 but a bit less is 8 • 5 = 40. Since 43 = 40 + 3, we see that 43 = 8 • 5 + 3. Thus 43 8 = 5 R 3. - From the number 43, subtract as many 8s as possible, keeping track of how many
are subtracted: 43 – 8 (subtract an 8) 35 " the amount remaining at this point – 8 (subtract an 8 again) 27 " the amount remaining at this point – 8 (subtract an 8 again) 19 " the amount remaining at this point – 8 (subtract an 8 again) 11 " the amount remaining at this point – 8 (subtract an 8 again) 3 " the amount remaining at this point We cannot subtract 8 again since only 3 remains. Count the total number of 8s that were subtracted: 5 of them.
The result is 43 8 = 5 R 3. This may also be written as 5 .
Practice Problems for Division with Remainders: 1. 30 7 a) What is a multiplication fact for 7 • ? that is close to 30 but less than 30? b) The multiplication result in part (a) is HOW MUCH less than 30? c) Find 30 7 in the format “a number Remainder a number”. d) Use Repeated Subtraction to show the result 30 7 (as in Example D). 2. 49 9 a) Use Repeated Subtraction to find the result for this problem. b) What is a multiplication fact for 9 • ? that is close to but less than 49.

Section 4-4: Division of Whole Numbers
Page 4 - 40
c) The multiplication result in part (b) is HOW MUCH less than 49? d) Express the answer to 49 9 in the form “a number Remainder a number”. Answers to Practice Problems for Division with Remainders: 1. a) 7 • 4 = 28 b) 28 is 2 less than 30 c) 4 Remainder 2
d) 30 – 7 (subtract a 7) 23 " the amount remaining at this point – 7 (subtract a 7 again) 16 " the amount remaining at this point – 7 (subtract a 7 again) 9 " the amount remaining at this point – 7 (subtract a 7 again) 2 " the amount remaining at this point We cannot subtract 7 again since only 2 remains. Count the total number of 7s that were subtracted: 4 of them.
The result is 4 Remainder 2
2. a) 49 – 9 (subtract a 9) 40 " the amount remaining at this point – 9 (subtract a 9 again) 31 " the amount remaining at this point – 9 (subtract a 9 again) 22 " the amount remaining at this point – 9 (subtract a 9 again) 13 " the amount remaining at this point – 9 (subtract a 9 again) 4 " the amount remaining at this point We cannot subtract 9 again since only 4 remains. Count the total number of 9s that were subtracted: 5 of them. The result is 49 9 = 5 R 4.
b) 9 • 5 = 45 c) 45 is 4 less than 49 d) 5 Remainder 4 "Algorithms for Division
There are several algorithms (step-by-step procedures) for doing division problems. These algorithms are useful when it would not be reasonable to simply draw a diagram and when you don’t simply know the answer because of knowing a related multiplication fact. The first algorithm described here is based on the Repeated Subtraction concept of division.
Examples of the Long Division Algorithm using Repeated Subtraction Example E:
The general idea: find out how many times 8 can be subtracted from 118
-80 subtract 10 8s 38 -32 subtract 4 8s 6 add the 10 and 4 to find the total number subtracted

Section 4-4: Division of Whole Numbers
Page 4 - 41
14 8s subtracted. And remainder is 6. Answer: quotient is 14 R 6. Example F:
The general idea: find out how many times 4 can be subtracted from 531
-400 subtract 100 4s 131 - 40 subtract 10 4s 91 -40 subtract 10 4s 51 -40 subtract 10 4s 11 - 4 subtract 1 4 7 - 4 subtract 1 4 3 add to find the total number of 4’s which were subtracted 132 4s subtracted. And remainder is 3. Answer: quotient is 132 R 3.
Example G: A more compact way to do the previous problem
The general idea: find out how many times 4 can be subtracted from 531
-400 subtract 100 4s 131 -120 subtract 30 4s 11 -8 subtract 2 4s 3 add to find the total number subtracted 132 4s subtracted. And remainder is 3. Answer: quotient is 132 R 3.
Example H: The scaffold algorithm, also called a pyramid algorithm, is a different way to record the
work of Long Division using Repeated Subtraction. In this method, the numbers of times that the divisor has been subtracted are recorded ON TOP of the division sign – and then they are added up to give the result ABOVE the recorded numbers.
Compare how this example is like the previous example, except that the numbers of 4s being subtracted (the numbers 100, 30, and 2) are written above, and then added above that.
132 R 3 2 30 100
The general idea: find out how many times 4 can be subtracted from 531
-400 (! gotten by thinking 100 • 4 = 400; then the 100 is recorded on top) 131 -120 (! gotten by thinking 30 • 4 = 120; then the 30 is recorded on top) 11 - 8 (! gotten by thinking 2 • 4 = 8; then the 2 is recorded on top)

Section 4-4: Division of Whole Numbers
Page 4 - 42
3 Answer appears at the top: quotient is 132 R 3. Some elementary school teachers like the scaffold algorithm because the mathematics
behind the procedure is still fairly clear. It is clear that the division is being figured out by subtracting the divisor a lot of times, and determining how many times it is subtracted. The place values of all the digits is clear throughout the procedure.
Example I: You may be familiar with the “traditional” Long Division algorithm. It requires less
writing, but it also makes the idea behind division less clear. The same example given above would be done the following way using the traditional algorithm.
[A student doing the example above would write ONLY the work at the far right; the rest of it is here to show the stages of when each part is written.]
1 13 132 R3
! !
4 4 4 13 13 13 12 12 11 11 8 3 "Division by Zero # Division by zero does not make sense and is not defined. If you try to do this problem “18 0” on a calculator, it would say “error” or something else to indicate that it is not
possible to get an answer. Why is it that division by zero is undefined? # We can see why division by zero doesn’t make sense if we use the various meanings
of division. For example, the Repeated Subtraction concept would say that to find 18 6 we would subtract 6 from 18 and see how many times we could do that until there is nothing remaining:
•••••• •••••• •••••• " 6 can be separated out from 18 three times 18 – 6 = 12 12 – 6 = 6 6 – 6 = 0 " we can subtract 6 from 18 three times We see that 18 6 = 3. If we use this concept to try to find 18 0, we would subtract 0 from 18 and see how
many times we could do that: 18 – 0 = 18 18 – 0 = 18 18 – 0 = 18 18 – 0 = 18 18 – 0 = 18 18 – 0 = 18 etc. We could subtract 0, and then subtract it again, forever and ever! The “number of times”
we can subtract zero is not a specific number. We could do it infinitely often. If you consider drawing a picture, there would be zero dots in the first “group” and zero dots in the second group, and so on; we’d never run out of the 18 dots and could subtract forever. So it doesn’t make sense to find 18 0.

Section 4-4: Division of Whole Numbers
Page 4 - 43
# In the example above, there was nothing special about the number 18. You could take any number and try to find: (a number) 0 = ?
There is no possible answer. # If we use the Sharing Equally concept to try to find 18 0, we would take 18 objects
and share them among zero people – how many would each person get? The question doesn’t even make sense! There is no answer.
# If we consider the meaning of multiplication as it relates to division, we consider: 18 6 = ? This is the same as asking 6 x ? = 18. The answer can be found from the multiplication fact 6 x 3 = 18. So 18 6 = 3. Then consider: 18 0 = ? This is the same as asking 0 x ? = 18 . Recall that when 0 is multiplied by something, the result is always 0; it is never 18. There
is no number that can multiply by 0 to give 18. There is no answer to 0 x ? = 18. And so there is no answer to 18 0 = ?.
Zero Divided by a Number # The examples above explain why “a number divided by zero” has no meaning. But
notice that the other way around, “zero divided by a number”, DOES make sense and has an answer!
For example: 0 5 = 0. How do we get the answer of zero? Consider the Sharing Equally concept of division. If we had 20 5 we could take 20 objects and share them equally among 5 people, determining how many each person would get:
•••• •••• •••• •••• •••• " each person would get 4 objects. So 20 5 = 4. If we have 0 5, it means we have 0 objects, and want to divide them among 5 people.
How many would each person get? Well, if there are zero objects, then each person gets zero. And so 0 5 = 0.
# Using the relationship between division and multiplication, consider this: 20 5 = ? This is the same as asking 5 x ? = 20. The answer can be found from the multiplication fact that 5 x 4 = 20. So 20 5 = 4. Now consider this: 0 5 = ? This is the same as asking 5 x ? = 0. The answer can be found from the multiplication fact that 5 x 0 = 0. So 0 5 = 0.
Summary of zero and division facts using various notations for division:
» Division by zero is undefined.
(a number) 0 = undefined. is undefined. is undefined.
» Zero divided by a number equals zero.
0 (a number) = 0. = 0

Section 4-4: Division of Whole Numbers
Page 4 - 44
"Using Mental Calculations to do Division Here are some examples of how people might use mental calculations to figure out
quotients. Example J: The problem is 120 6 . Here are how various students report they think about it. • “I think about the ‘missing factor’. What I mean is, 120 6 = ? is the same as
wondering 6 x ? = 120. I know that 6 x 2 = 12. So then I know that 6 x 20 = 120. So, 20 is the factor we wanted to find. That means 120 6 = 20”.
• “6 divides into 12 two times. 120 is 12 tens. So I think 6 divides into 12 tens 2 tens times. So the answer is 2 tens, which is 20.”
• “I think of subtracting 6 from 120. First I can subtract ten 6s: 120 – 60 = 60. Then I can subtract ten 6s again: 60 – 60 = 0. All together I subtracted twenty 6s. So 120 6 = 20”
Example K: The problem is 52 17 . • “I am trying to find: 17 x ? = 52. It might not come out an exact whole number. I just
start thinking about multiples of 17. I know 17 x 2 = 34. 34 is not big enough. To figure out 17 x 3, I know that would be 34 (which is two 17s) plus one more 17: 34 + 17 = 51. Now I know 17 x 3 = 51, which is very close to 52 (it is 1 less than 52). So 17 divides into 52 three times with one left over. That is: 52 17 = 3 R1.”
Example L: The problem is 354 17 . • “How many 17s are in 354? I know 17 x 10 = 170, not big enough. I know 17 x 20 =
340 (because 17 x 2 = 34). That is close. In fact 354 – 340 = 14, which is less than the divisor 17. So I know 354 = 340 + 14 = 17 x 20 + 14.
So then I know 354 17 = 20 R14. "What Kind of Answer Do You Want? The problem is 37 7 . Here are various answers that some students gave: i) “We know that 7 x 5 = 35, which is close to 37 but is 2 less. So 37 7 = 5 R2.” ii) “I divide 37 by 7. 7 goes into 37 five whole times, with two remaining. So the answer
is 5 .”
iii) “37 7 is the same as . That is the fraction answer.”
iv) “I took out my calculator and put in 37 7 =, and it says 5.28 – actually it gave a big decimal answer (5.285714286) and I just rounded it off to two decimal places.”
All of the answers given above in i, ii, iii, and iv are correct! Is one of them better than the
others? That depends on the situation. For each of the following situations, which answer is best?

Section 4-4: Division of Whole Numbers
Page 4 - 45
a) Melinda brought 37 balloons to a party to share equally among 7 children. How many balloons will each child get?
Solution: If every child gets the same number, each child would get 5 balloons. Then there would be two balloons remaining (they cannot “cut up” those extra balloons to share them!). The answer needed to be rounded down to a whole number. This solution is related to the previous part (i).
b) There is a flour shortage and the baker has 37 pounds of flour. He wants to use the
same amount of flour each day for a week, after which he expects to get a new delivery of flour. How much should he use each day?
Solution: The 37 pounds should be divided evenly over the seven days. On each
day, the baker should use 5 pounds of flour. This is like the previous part (ii)..
c) Dina’s garden club friends asked her to buy each of them a rose bush on sale at the garden store. She bought the 7 plants (one for herself and one for each of the other six members of the garden club). The total cost was $37. How much should each person pay for his/her plant?
Solution: The total cost of $37 should be divided evenly among the 7 people. Since we are dealing with money here, the decimal approximation answer is the best answer. On the calculator 37 7 = 5.285714286, which rounds to 5.28. So each person should pay $5.28.
Note that the symbol “ ” means “approximately equal to”, indicating that the answer is rounded off, not exact.
d) The 37 kindergarteners are going on a field trip in mini-vans. Each mini-van can hold
7 children. How many mini-vans are needed? Solution: The 37 children are divided up into groups with 7 children in each group (that
is, 7 children in each mini-van). We know 37 7 = 5 R2. If 5 mini-vans are used, each has 7 children – and that is 35 children. There would be 2 children left over. So they need to use 6 mini-vans for the field trip. Notice: the correct answer to
this problem is 6. Not 5.28 nor 5 or 5 R2. In the context of this application, 6 is
the correct answer. The appropriate process is to round up to the next whole number larger than 5.28.

Section 4-4: Division of Whole Numbers
Page 4 - 46
Section 4-4: Exercises for Division of Whole Numbers 1. a) What is the answer to a division problem called? b) In this problem 42 7 = 6, which number is the dividend? c) In this problem 42 7 = 6, which number is the divisor? d) In this problem 42 7 = 6, which number is the quotient? 2. There are three notations for writing a division problem, namely using the division sign ,
using the long division symbol, or using the fraction bar. For each of the following, rewrite the problem using each of the other two notations.
a) 21 3 = 7
b)
c) = 0.5
3. a) What is a multiplication fact that let’s us know the answer to this division problem? 36 4 = ? b) This multiplication fact is related to two division problems. What are those two division
facts? 9 x 12 = 108 4. a) Demonstrate the “sharing equally” model of division by drawing loops around these 30
circles (or “cookies”) so they are shared equally among 10 people. This shows that 30 10 = the number that each person gets, which is ________ .
O O O O O O O O O O O O O O O O O O O O O O O O O O O O O O b) Demonstrate the “repeated subtraction” model of division by drawing loops around
these 30 circles (or “cookies”) so that you subtract away 10 cookies for each person. How many people can be served?
This shows that 30 10 = the number of people that can be served, which is _________ .
O O O O O O O O O O O O O O O O O O O O O O O O O O O O O O 5. For each of the following, determine which of these two concepts of division is most
closely related to the problem: Sharing Equally or Repeated Subtraction. a) Each child needs 6 pipe cleaners for an art project. The teacher has 30 pipe cleaners.
How many children can do the art project? i) Which concept of division applies? ii) Sketch a diagram showing the concept. iii) Show the division problem set-up and clearly state the final result, including units. b) Linda brought 24 quilt blocks for her quilting club to use. If the six members of the
quilting club each use the same number of quilt blocks, how many will each use? i) Which concept of division applies? ii) Sketch a diagram showing the concept. iii) Show the division problem set-up and clearly state the final result, including units. c) Paul wants to put the tomato plants in five rows. He has 30 plants. How many will be in
each row? i) Which concept of division applies? ii) Sketch a diagram showing the concept.

Section 4-4: Division of Whole Numbers
Page 4 - 47
iii) Show the division problem set-up and clearly state the final result, including units. d) Every time Rick practices golf in Pond Park, he loses three balls. He has 18 balls. How
many times can he practice in Pond Park before he runs out of golf balls? i) Which concept of division applies? ii) Sketch a diagram showing the concept. iii) Show the division problem set-up and clearly state the final result, including units. 6..a) i) Write a word problem involving the “Sharing Equally” concept of division. This
problem should be on a different topic than any of the examples in the previous problem above.
ii) Draw a diagram and solve your problem. b) i) Write a word problem involving the “Repeated Subtraction” concept of division. This
problem should be on a different topic than any of the examples in the previous problem above.
ii) Draw a diagram and solve your problem. 7. a) Do the following problem using the “Long Division Algorithm Using Repeated
Subtraction”.
b) Then do the same problem using the “Scaffold Algorithm” method. This will be a lot like
part a), but will look somewhat different.
8. a) Do the following problem using the “Long Division Algorithm Using Repeated
Subtraction”.
b) Then do the same problem using the “Scaffold Algorithm” method. This will be a lot like
part a), but will look somewhat different.
9. Do each of the following problems using one of these methods (your choice which one): Traditional long division algorithm, Scaffold algorithm, or Long division algorithm Using
Repeated Subtraction.
a) b) c)
10. Division computation practice. Do these problems mentally, writing answers. a) 81 9 = b) 45 9 = c) 32 8 = d) 42 7 = e) 63 9 = f) 6 0 = g) 24 8 = h) 21 3 = i) 0 7 = j) 48 6 = k) 28 4 = l) 54 9 = m) 81 9 = n) 56 8 = o) 24 0 = p) 21 3 = q) 18 6 = r) 36 6 = s) 24 8 = t) 0 3 = u) 56 7 = v) 36 4 = w) 72 8 = x) 35 5 =

Section 4-4: Division of Whole Numbers
Page 4 - 48
[You can check the answers to these division problems by looking at your multiplication table from an earlier section.]
11. Clearly explain WHY the answer to 14 0 is what it is. 12. Clearly indicate the problem set-up to find the answer to each of these questions. Then
clearly indicate what the answer is, using a complete sentence. a) The custodian needs to set up chairs in the auditorium for 200 people. Twenty-eight
chairs fit nicely across in a row, with an aisle down the center. How many rows should be set up?
b) Charles played 11 songs on his mp3 player, and they lasted 44 minutes. What is the average length of the songs? (This is the same as asking: If all the songs are the same length, how long is each one?)
c) For the fundraising breakfast Jyoti figures that about 40 people will have two-egg omelets and about 25 people will have one egg each. How many dozens of eggs should she buy?
d) The Future Teachers Club is holding a fund raiser to buy supplies for a local school. They want to raise at least $400. They are selling boxes of dried fruit. The amount that they raise from each box sold is $3. How many boxes do they need to sell to meet their goal?
e) Denny is planning a driving trip from Ohio to Washington, a distance of 2,500 miles. He plans to drive about 300 miles per day. How many days of driving will the trip require?
13. Use a calculator to determine the answer to each of the following. Write each answer as
a decimal or whole number. [Do not do these problems with pencil and paper! Really do use a calculator so you gain practice entering the numbers correctly on the calculator ". ]
a) b) 513 135 c)
d) e) f)
g) 136 16 h)

Section 4-5: Exponents, Powers of Ten, and Order of Operations
Page 4 - 49
Section 4-5: Exponents, Powers of Ten, and Order of Operations Exponential Notation Exponents are a shorthand way of indicating repeated multiplication. For example,
72 means that the base, 7, is to be multiplied by itself 2 times. 7
2 = 7 • 7 = 49.
An exponential expression has a base and an exponent. The exponent can also be
called the power. Exponent, or power, is the n
an
base is the a.
The meaning of an
is that the base a is to be multiplied by itself n times:
an
= a • a • a • …. • a n times that “a” is a factor
Examples: 24
= 2 • 2 • 2 • 2 = 16
132
= 13 • 13 = 169 Note that any number raised to the exponent of one, simply equals itself.
Examples: 21
= 2 81
= 1 3471
= 347 a1
= a The Powers of Ten are the numbers that result from taking the base 10 and raising it to
various powers (or exponents). For example:
101
= 10
102
= 100 since 10 • 10 = 100
103
= 1000 since 10 • 10 • 10 = 1000
104
= 10,000 since 10 • 10 • 10 • 10 = 10,000
105
= 100,000 etc.
106
= 1,000,000
107
= 10,000,000 etc. You may notice that any power of ten equals the number 1 followed by zeros, and the
number of zeros equals the exponent number. Multiplying by Powers of Ten
Multiplying a number by 10 makes it ten times as large, of course. Examples: 7 • 10 = 70 46 • 10 = 460 870 • 10 = 8,700 Notice that the result of multiplying a number by 10 is that the digit that was previously in the one’s place is now in the ten’s place, and a zero is in the units place. This is equivalent to saying that the decimal point is moved one place to the right, and a zero is filled in as a place holder to make that happen.

Section 4-5: Exponents, Powers of Ten, and Order of Operations
Page 4 - 50
Examples of multiplying by 100: 7 • 100 = 700 46 • 100 = 4,600 870 • 100 = 87,000 Notice that the result of multiplying a number by 100 is that the digit that was previously in the one’s place is now in the hundred’s place, and a zero is in the units and tens places. This is equivalent to saying that the decimal point is moved two places to the right, and two zeros are filled in as a place holders to make that happen. This type of pattern continues for multiplying by powers of ten. The number of places that the decimal is moved to the right equals the number of zeros in the power of ten. Examples: 8 • 100,000 = 800,000 359 • 1,000 = 359,000 2,741 • 10,000 = 27,410,000 48 • 1,000,000 = 48,000,000 560,000 • 1000 = 560,000,000
93 • 105
= 9,300,000
93 • 102
= 9300
93 • 107
= 930,000,000 "Order of Operations
Some numeric expressions involve more than one operation, for example:
120 – 7 • (3 + 8 ÷ 22 + 1)
When an expression has more than one operation, there must be a general agreement about which operation is to be done first, which second, etc., so that everyone will evaluate the expression in the same way. That agreement is known as the Order of Operations.
Order of Operations
1. Expressions in parentheses or other grouping symbols. 2. Exponents 3. Multiplications and Divisions are performed in order from left to right. 4. Additions and Subtractions are performed in order from left to right.
Note: More details can be given about the Order of Operations involving topics not covered in this course.
Examples of using the correct Order of Operations
A: 13 – (9 + 1) First do the work in the parentheses: 13 – (9 + 1) = 13 – (10) = 3
B: 13 – 9 + 1 There are no parentheses nor exponents, nor multiplications or divisions, so we use step 4 and do the additions and subtractions in order from left to right. 13 – 9 + 1 = 4 + 1 since 13 – 9 equals 4
= 5

Section 4-5: Exponents, Powers of Ten, and Order of Operations
Page 4 - 51
C: 7 + 62 There are no parentheses, and there is an exponent,
so use step 2 and do the exponent first.
7 + 62
= 7 + 36 since 62
= 36 = 43
D: (7 + 6) 2
Do the work in the parentheses first.
(7 + 6) 2
= (13) 2
= 169
E: 3 + 8 • 2 – 1 The multiplication is done first. 3 + 8 • 2 – 1 = 3 + 16 – 1 Next: addition and subtraction, from left to right.
= 19 – 1 = 18
F: (3 + 8) • ( 2 – 1) First do the work in each parentheses. (3 + 8) • ( 2 – 1) = (11) • (1) = 11
G: 2 • 16 ÷ 8 • 3 Multiplications and divisions are done in order from left to right. 2 • 16 ÷ 8 • 3 = 32 ÷ 8 • 3
= 4 • 3 = 12
H: 2 + 16 ÷ 8 • 3 Multiplications and divisions are done in order from left to right. So first is 16 ÷ 8.
2 + 16 ÷ 8 • 3 = 2 + 2 • 3 = 2 + 6 = 8
I: 120 – 7 • (3 + 8 ÷ 22 + 1) Inside the parentheses, the order of operations
rules apply – so do the exponent first.
120 – 7 • (3 + 8 ÷ 22 + 1) Note that 2
2 = 4
= 120 – 7 • (3 + 8 ÷ 4 + 1) Next in parentheses, do division = 120 – 7 • (3 + 2 + 1) Next, add in the parentheses = 120 – 7 • (6) Next, multiply = 120 – 42
= 78
"Calculators and Order of Operations Some calculators follow the correct order of operations, and other calculators do not.
Generally when a calculator is programmed to follow the correct order of operations, the calculator is said to have “algebraic logic” (because the order of operations is a concept from algebra). When a calculator does not follow the order of operations, it simply does each operation as it is entered, in the order they are entered.
You should now get out your calculator and see which type it is. Enter this into your calculator: 2 + 3 • 7 = and see what the calculator displays as an answer. • The Order of Operations says 2 + 3 • 7 = 2 + 21 = 23. So if your calculator result was 23, then your calculator has “algebraic logic” and it uses the Order of Operations.

Section 4-5: Exponents, Powers of Ten, and Order of Operations
Page 4 - 52
• If your calculator result was 35, then your calculator simply does each operation as it is entered, (so it did 2 + 3 and got 5, then did that result times 7, getting 35). Such a calculator does NOT follow the correct order of operations. It is okay to have either type of calculator. What is important is that you know and understand how YOUR calculator is operating so that you can enter problems in a way to obtain the correct answers. If your calculator does not follow the correct Order of Operations, what can you do to find the correct answer to a problem such as 2 + 3 • 7 ? You must determine on your own what operation needs to be done first, and enter that into the calculator first. So in this case you would enter 3 • 7, getting the result 21. Then you would add 2, getting the result 23.
Internet Help with Order of Operations As mentioned in an earlier chapter, at the google website www.google.com, when you enter a mathematical expression into the search bar and press enter, the result of the calculation is displayed. The google search bar acts as a calculator, and it is a calculator that uses the order of operations and displays the correct order of operations by showing parentheses. For example, when 27 + 3*4/2 is entered, the result displayed is 27 + ((3 * 4) / 2) = 33 The parentheses were inserted to show which operation is performed first and then second. If you are having trouble figuring out what to calculate first in an expression, you can enter it into the google search bar and see where the parentheses are inserted.

Section 4-5: Exponents, Powers of Ten, and Order of Operations
Page 4 - 53
Section 4-5: Exercises for Exponents, Powers of Ten, and Order of Operations
1. Simplify each of these expressions. Give each answer as a number. Do not use a calculator.
a) 53
b) 104 c) 3
4 d) 8
2
e) 92
f) 02
g) 23
h) 32
i) 12 j) 1
7
2. Simplify each of these expressions. Give each answer as a number. Do not use a
calculator. a) 17 • 10 b) 3 • 10,000 c) 245 • 10
d) 6 • 105
e) 3,427 • 100 f) 100 • 84
g) 785 • 1,000 h) 104 • 8,799 i) 150 • 100
3. Use the Order of Operations to simplify each of the following. Do not use a calculator.
Show each step by re-writing the expression with only one step change per line.
a) 17 • (8 + 4 – 2) b) 3 • 15 ÷ 5 • 2 c) 8 + 14
d) (8 + 1) 2
e) 3 + 2 • (16 – 14) f) 4 • 23
g) 100 + 12 ÷ 4 • 9 h) 103 • 84 + 6 i) 10
3 • (84 + 6)
4. Use a calculator to check your answers to #3 above.

Section 4-5: Exponents, Powers of Ten, and Order of Operations
Page 4 - 54
Blank Page

Section 5-1: Fraction Introduction
Page 5 - 1
Chapter 5 Fractions
Section 5-1: Fraction Introduction Fractions, decimals, and percents provide us with different ways of talking about parts of a
whole or about quantities that are between whole numbers. In this chapter we will work with fractions.
Fractions and Young Children
Young children hear fraction words in everyday life. For example “We’ll eat lunch in half an hour” and “There is a quarter moon tonight”. Should children learn fractions in school? The National Council of Teachers of Mathematics (NCTM) answers “yes”. One of NCTM’s stated expectations for grades pre-K through second in the Number and Operations standard is that children should “understand and represent commonly used fractions, such as 1/4 , 1/3, and 1/2”. (from http://standards.nctm.org/document/chapter4/numb.htm ).
In the pre-kindergarten years, much of the work with fractions is informal. Children may
recognize that “one half” is a part of something, but might say something like “your half is bigger than my half!” because they do not yet realize that two halves of a whole must each be the same size.
Until a young child has a complete understanding of counting and number sense or number conservation, it is not possible to fully grasp fraction concepts. Concerning working with fractions in grades pre-K–2, Susan Sperry Smith says:
“On the surface this goal appears to be an easy one. First-grade students typically are able
to identify parts of a whole such as ! of an apple. They seem to grasp the idea that it is important to divide up things fairly, so everyone gets the same. …
“But the situation changes if an adult presents another kind of problem. Suppose the
adult keeps 3 graham crackers and gives the child 2 graham crackers. Initially, most children will say that the adult has more. Then if the adult breaks one of the children’s crackers into two
pieces, many children of kindergarten age will be satisfied that now both parties have the same
amount. The child uses counting, 1-2-3, and disregards the idea that the pieces must be of equal
size. This phenomenon also occurs when very young children are given 2-1/2 crackers, but say that they have 3 crackers.” (Smith 2006: 122-123)
When children are developmentally ready, Marilyn Burns suggests how to approach fractions with young children:
“Classroom instruction should build on children’s previous experiences and help children clarify the ideas they’ve encountered. It should provide many opportunities throughout the year
for children to make sense of fractions, use fractional language, and learn to represent fractions
with the standard symbols. Children should deal with fractions concretely and in the context of real life before they focus on symbolic representations.” (Burns 2000: 223)
These recommendations are echoed by Carol Seefeldt and Alice Galpher (2008: 76): Children’s books that ask the characters to divide the cookies or the pizza to accommodate
more people are a good start. Then the teacher can move children to how many parts are in the

Section 5-1: Fraction Introduction
Page 5 - 2
pizza and what fraction of the pizza each child would get if it was divided. It is best to start with
concrete things that can be divided then move to written numbers.
Goals of studying fractions Some of the work in this chapter on fractions can be related to activities for young children.
However, much of the work we will do here with fractions is not appropriate for young children. We are working with fractions because you, as an adult, need to work with fractions in your life. And you, as a teacher of young children, need to understand the topic deeply so you can better help children gain the strong foundation they need to master fractions later.
Many of the topics covered here will be familiar to you, so you may consider this to be a review. Be alert so that you can pick up the ideas that are new and not familiar to you. College instructors find that students are usually familiar with fractions, but that almost everyone, even high-level math students, have a couple gaps in understanding. This chapter gives you an opportunity to fill in your gaps, so that you will truly have a deep understanding and be comfortable with all the concepts of fractions.
Basic vocabulary and concepts • When a fraction is written, the number up on top of the fraction line is the numerator and the number down below is the denominator. Memory aid: “up” and “numerator” both have a “u” in them; while “down” and “denominator” both start with “d”.
Example: In the fraction ! the numerator is 3, the denominator is 4
! The Part-Whole View of Fractions The denominator number indicates how many equal sized parts that the “whole thing”
is to be divided into. The numerator indicates how many of those parts we are referring to.
• The fraction indicates that one whole object is to be divided into 4 equal-sized parts,
and that we are interested in 3 of those 4 parts.
Examples of :
••••••
••••••••••
•••••••••••
•••••••••••
••••••••••••••••••••••••
••••••••••••••••••••••••
••••••••••••••••••
one whole rectangle, one whole octagon divided into 4 equal size parts, divided into 4 equal size parts, with three of the parts shaded. with three of the parts striped
• If you are creating diagrams of fractions for children, note that some shapes are difficult to
divide into fraction parts. If this triangle shape were to be divided into fourths, someone might draw this, thinking each of the parts was 1/4:
Of course that is not a correct representation of " since the four parts are not equal in size (they are not equal in area).

Section 5-1: Fraction Introduction
Page 5 - 3
The triangle can be used to show fourths in this way, but it is harder to figure this out.
Activity: Paper Folding a) Take a square piece of paper and fold it in half, making a crease.
Unfold it and see the two equal sized pieces, each being ! of the whole paper.
b) Use that same paper and fold it into four equal sized pieces. c) Start again with a paper the same size as before, and fold it into four
equal sized pieces but in a different way than last time. Is there a third way you could do this?
d) Start again with a new piece of paper (it could be square or rectangular). - Fold it into three equal sized pieces. Each piece is 1/3 of the whole
paper. - Lightly shade or color in one-third of the paper. - Now fold that same sheet of paper to get six equal sized parts. - Unfold and look at the paper. What fraction of the paper is shaded or
colored, expressed as sixths? e) You have just demonstrated that which two fractions are equivalent?
f) Which of these activities could you do with young children?
! The Set View of Fractions Another view of fractions: when the “one whole” is a SET of objects. The denominator number indicates how many equal sized groups or parts that the set
of objects is to be divided into. The numerator indicates how many of those groups we are referring to.
Then means that the set is to be divided into 4 equal groups orparts, and we are
considering 3 of the groups or parts. Example: 20 moons separated into 4 equal groups. To find the number of objects in
each group, we find (the total number of objects) ÷ (the number of groups) = (the size of each group). In this case, 20 moons ÷ 4 groups = 5 moons in each group. Three of the groups is # of the moons.
# of the moons in this rectangle are circled. # of the moons equals 15 of the 20 moons.

Section 5-1: Fraction Introduction
Page 5 - 4
Practice Problems: 1. Shade 2/5 of this rectangle. 2. What fraction of this rectangle is shaded. 3. Here is a set of objects. a) What fraction of the set are triangles? b)What fraction of the set are rectangles?
Answers to Practice Problems:
1. 2. (from )
3. a) 4 objects are triangles out of the 11 objects total. Set up the fraction as
. So of the set are triangles.
b) Since there are 3 rectangles out of 11 objects. Set up the fraction as
. So of the set are rectangles.
! The Division View of Fractions
• The fraction line, also called the fraction bar, indicates division. For example, is
equivalent to saying 8 ÷ 4. For each of those expressions, it simplifies to equal 2: = 2
and 8 ÷ 4 = 2.
• When the numerator is smaller than the denominator, for example in , the fraction is
called a “proper fraction” and has a value less than 1. For proper fractions, the division view of fractions is useful for converting the fraction into a decimal. In this example,
= 2 ÷ 5 = 0.4
• When the numerator is larger than or equal to the denominator, the fraction is called an “improper fraction” and has a value greater than or equal to 1. For an improper fraction it
can be useful to think of the fraction as indicating a division problem. For example,
indicates 42 ÷ 6, and the result is 7. And = 5 ÷ 5 = 1. When the division does not
result in a whole number answer, then we get a mixed number expression (discussed
later). For example, = 43 ÷ 6 = 7 .

Section 5-1: Fraction Introduction
Page 5 - 5
– / – / – / – / – / – / – / – / – / – / – / – / – / – / – / – / – / – / – / – / –
About Notation: Horizontal or Slanted?
Fractions can be written with horizontal fraction lines such as or with slanted
fraction lines such as 3/4. Here are several reasons that the horizontal line is sometimes preferable:
- When doing calculations with fractions, such as the four operations of adding, subtracting, multiplying, or dividing them, it is generally easier to do the work if the fractions are written with horizontal fraction lines.
- Slanted fraction lines can make the fraction harder to read. For example, when 4/11 is written by hand, the slanted line might look a lot like the 1 next to it, and thus the reader might see the whole number 4111.
- If you have had algebra, you may have noticed that in algebra, the slanted line
notation can make the expression ambiguous or wrong. This fraction clearly has
denominator of xy. When written with the slanted line it appears as w/xy, and then it is not clear if the denominator is xy or whether this represents the fraction w/x being multiplied by the variable y.
- As another example, this fraction clearly has the denominator of b+c. When
it is written with a slanted line as a/b + c, then it means something else since the
denominator is only b, and c is separately being added on. To represent with a
slanted line, parentheses are required: a/(b + c). The parentheses are also required to get the correct answer on your calculator.
– / – / – / – / – / – / – / – / – / – / – / – / – / – / – / – / – / – / – / – / –
! Mixed Numbers and Fractions
A mixed number is a way of expressing a quantity that is between two whole numbers. A
mixed number has a whole number part and a fractional part. For example: or 3 .
Rewriting Mixed Numbers as Improper Fractions Every mixed number can be rewritten as a fraction with a numerator that is larger than the denominator. Such a fraction is called an improper fraction. When a mixed number is rewritten as a fraction, the denominator of the fraction is the same as the denominator in the fraction part of the mixed number. To determine the numerator, consider this example.
Example A: Rewrite as a fraction.
" diagram of

Section 5-1: Fraction Introduction
Page 5 - 6
How many parts are there all together? In each of the two whole numbers, there are
four s, for a total of 2 x 4 = 8. Plus there are 3 more s, for a final total of 8 + 3 = 11.
So = Notice how this numerator equals 4 x 2 + 3.
Example B: Consider 3 . To rewrite this as a fraction, we realize that in each of the
three wholes there are five s and then there are 2 more s. So:
3 = = .
In general, the mixed number = the improper fraction
Rewriting Improper Fractions as Mixed Numbers
$ Historically fractions were used only to indicate part of one whole, that is, the numerator of a fraction was less than the denominator.
Improper fractions have a numerator that is greater than or equal to the denominator and were not originally thought of as authentic fractions, as their name implies.
$ There is nothing wrong with an “improper fraction”! It simply has a numerator larger
than the denominator, or equal to it. An improper fraction has a value greater than or equal to one.
Each improper fraction can be re-written as a whole number or a mixed number (that is, as a combination of a whole number and a proper fraction).
Example C: Change to a mixed number: [each bar is a whole, marked in thirds]
The thirds need to be grouped 3 at a time to see how many whole numbers there are.
And then the remaining thirds are written as a fraction. So,
= 1
Example D: Change to a mixed number.
There are 14 thirds (14 squares each of size 1/3): . Group them 3 at a time to see how many whole numbers there are: 14 3 = 4 with remainder 2. So there are 4 groups of three thirds and in addition, 2 thirds remaining.
So, = 4

Section 5-1: Fraction Introduction
Page 5 - 7
Whole Numbers written as Improper Fractions Every whole number can be expressed as a fraction by writing the whole number as the
numerator over the denominator 1. For example: 7 = and = 36
Sometimes it is helpful to rewrite whole numbers as fractions in this way when doing calculations that involve both fractions and whole numbers.
Practice Problemswith Mixed Numbers and Improper Fractions: 1. Rewrite these mixed numbers as improper fractions. Draw a sketch to show why the
result makes sense.
a) 1 b) 4
2. Rewrite each of these improper fractions as a mixed number. Draw a sketch to show why the result makes sense.
a) b)
Answers to Practice problems: 1a) 1b) 2a) 1 2b) 4
Note: Exercises for Section 5-1 are with Exercises for 5-2, following Section 5-2.

Section 5-1: Fraction Introduction
Page 5 - 8
Activity: Pattern Blocks Representing Fractions Remember the pattern blocks mentioned in the chapter on Patterns. orange square red trapezoid yellow hexagon green triangle blue rhombus white (or beige) rhombus These blocks can be used to explore fractions. It would be best to do this activity with an actual set of pattern blocks, made of wood or plastic. Or you could use a “virtual set” of pattern blocks at one of these two websites:
• There is a Java applet for manipulating Pattern Block pieces online at: http://www.arcytech.org/java/patterns/patterns_j.shtml Try it – it’s fun! • National Library of Virtual Manipulatives – page with pattern blocks (click on one of the links from this page). The online access to the pattern blocks is free. http://nlvm.usu.edu/en/applets/controller/query/query.htm?qt=pattern+blocks&lang=en
1. Start with a yellow hexagon. a) How many green triangles will fit exactly on the yellow hexagon? b) How many red trapezoids will fit exactly on the yellow hexagon? c) How many blue rhombuses will fit exactly on the yellow hexagon? 2. If the yellow hexagon is 1 whole thing, then what fractional number is represented by: a) a green triangle? b) a red trapezoid?
c) a blue rhombus? d) three green triangles?
e) five green triangles? f) two red trapezoids?
g) three red trapezoids? h) four red trapezoids? 3. If the red trapezoid is 1 whole thing, then what fractional number is represented by: a) a green triangle? b) a blue rhombus?
c) a yellow hexagon? d) four green triangles?
e) two blue rhombuses? e) five green triangles?

Section 5-2: Multiplication of Fractions
Page 5 - 9
Section 5-2: Multiplication of Fractions Multiplication is the first operation we will review for fractions because it is the easiest
operation to perform with fractions. The goals of this section are for you to understand WHY the multiplication method for fractions works, as well as to be able to multiply fractions. We will start with a visual model that illuminates the ideas behind the fraction multiplication method.
A Model of Multiplication
The visual model we will use for fraction multiplication is the same one that we used for multiplication of whole numbers, namely: a rectangle with the width equal to one of the factors and the length equal to the other factor. For example, the model for 3 x 4 is a rectangle (or array) where the size of the rectangle is 3 wide and 4 long. Before making the array, we need to specify what the size of “onewhole” is (this is particularly important in work with fractions, when it is less obvious in the diagram). In the example here, “one whole” is this size:
Then a rectangle of size 3 wide and 4 long looks like this:
The product of 3 x 4 equals the total number of squares in the array: 12. Of course, we could illustrate 3 x 4 with a rectangle whose width and length are the reverse of those above, because of the commutative property of multiplication. That would look like this, with size 4 wide and 3 long, and the product of 12:
Applying the Array Model to Fraction Multiplication
When we apply this same rectangular array model to fraction multiplication, we first specify what “one unit” looks like. We could use a square or non-square rectangle to represent an area of one unit. In this example, let’s use this non-square rectangle:
" “one whole” Notice that in this example the size of “one whole” is not the same as in the previous example. The size of “one whole” must be defined in each situation.

Section 5-2: Multiplication of Fractions
Page 5 - 10
Example A: Determine the product of x using the array model.
The goal here is to make a rectangular array that is width 2/3 on one side and length 4/5 on the other side. That array would represent the product of 2/3 x 4/5. Several steps are required to carefully create that array.
We start with the rectangle of size “one whole”. Then we mark off the size ,
and shade it in. (Note – we could do this horizontally or vertically. In this example we do it horizontally.) We do this by dividing the rectangle into three equal pieces by drawing horizontal lines, and shading two of the three strips.
Next we mark off the size vertically and shade it in. We want to do this in the
same rectangle as pictured above – but in order for you to see what is being done, step-by-step, we first picture the diagram below which only has the four-fifths marked and shaded in (shaded in a darker grey than the picture above). So here, we divide the rectangle into five equal parts by drawing vertical lines, and we shade 4 of the parts.
Now the diagram with 2/3 shaded in and the diagram with 4/5 shaded in are put into one diagram. The place where the shadings overlap ends up being darker than either of the original shadings.
The product of x is where the two parts overlap, since that part has width
and length . length 4/5
width 2/3
What is the size of that overlap? It consists of 8 shaded “small pieces” out of a total of
15 “small pieces” in the one-square-unit rectangle. Thus its size is .

Section 5-2: Multiplication of Fractions
Page 5 - 11
Conclusion: x = .
The word “of” indicating multiplication
In multiplication of fractions, the word “of” is often used to indicate
multiplication. In this example, we could have said of . See how the
diagram makes sense with this wording. The product shown in the diagram
is the overlap of the shadings. It is of the shaded , which equals of
the whole.
Example B: Determine the product of x using the array model.
We start by specifying what size is “one whole” in this example:
" one whole
Then we mark off the size ; we’ll do that in the horizontal direction.
Next we mark off the size in the other direction, vertically in this case, and
shade the left half a slightly darker grey than the horizontal shadings. Notice that the place where the two shadings overlap is darker than either of the original shadings.
The product of x is the overlap of the shaded parts, which has width and
length . length 1/2
width 3/5

Section 5-2: Multiplication of Fractions
Page 5 - 12
From the diagram we see that the overlap of the shaded parts consists of 3 “small
pieces” out of a total of 10 “small pieces” in the “one whole”. So the area of the product
is (the product is of one whole).
Conclusion: x = .
Since multiplication is commutative, it doesn’t matter in this example if we mark
the horizontally or vertically, so long as the is marked in the other direction. Here
is the diagram for this problem x but marked in opposite directions from the
previous diagram. The is marked vertically and the is marked horizontally.
The overlap is still 3 small pieces out of 10 in the one whole rectangle.
Notice that the result is the same as above: the product is .
Example C: Extending this model to mixed numbers. First, let’s model 2 x 3 using the method above, with this rectangle being one unit:
" one whole
Then 2 x 3 is the area of the model that is 2 units high and 3 units across:
The result is 6 whole units, of course.

Section 5-2: Multiplication of Fractions
Page 5 - 13
Now let’s try the model for a mixed number, for example: x .
We will use the same rectangle as in the previous example to represent one whole:
" one whole
Then we need to mark a size of to shade in. To get this size, we need a length of
two rectangles, and then we will divide them into halves and shade in . We are
doing this vertically.
To multiply by 1/4 we take the diagram and mark it into fourths in the other
direction, horizontally in this case, and shade in the entire top row.
The product x is the overlap of the shading. This overlap consists of 3
“small pieces”. There are 8 “small pieces” in the rectangle representing “one whole” in this example. (Note that there are 16 “small pieces” total in the diagram, but what matters for figuring out the size of each “small piece” is how many of them are in one
whole.) The size of each “small piece” is , and so the size of the overlap area is .
So, x =
Practice Problems on Multiplying Fractions with the Array Model:
1. Determine the product of x using the array model.
Use this rectangle as “one whole” !
2. Determine the product of 2 x using the array model (same “one whole” as #1).

Section 5-2: Multiplication of Fractions
Page 5 - 14
Solutions to Practice Problem on Multiplying Fractions with the Array Model:
1. Determine the product of x using the array model. Use this one-unit rectangle.
Shade in 3/4 horizontally,
then 2/3 vertically.
There are 12 small pieces in the one whole rectangle. So each is 1/12 . And 6 parts are dark.
So the answer is 6/12, which also equals !.
Conclude: x =
2. Determine the product of 2 x using the array model.
First shade in 2 and 1/3, vertically.
Then shade in 1/2 horizontally.
Looking at just one rectangle, there are 6 resulting “small pieces” in a one whole rectangle, so each “small piece” is 1/6. Seven of those pieces are shaded dark. So the answer is 7/6.
Conclude: 2 x =

Section 5-2: Multiplication of Fractions
Page 5 - 15
! The Algorithm for Fraction Multiplication The examples above used models to determine the results of fraction multiplication problems. We can generalize the results to the fraction multiplication algorithm. The first two examples are summarized here.
x = . Notice that 2 x 4 = 8 (the numerators) and 3 x 5 = 15 (the denominators).
x = . Notice that 3 x 1 = 3 (the numerators) and 5 x 2 = 10 (the denominators).
As you drew diagrams to model fraction multiplication you may have noticed some patterns. The product of the multiplication is the area of the overlap. The number of “small pieces” in the overlap equals the product of the numerators of the two factors. And the number of “small pieces” in the unit whole equals the product of the denominators of the fractions. And so fraction multiplication can be performed in the following way, where a, b, c, and d are variables representing numbers:
Fraction Multiplication Algorithm x =
Practice Problems: Use the fraction multiplication algorithm to do these multiplications.
a) x = b) x = c) x =
Answers to Practice Problems:
a) x = = b) x = =
c) x = =
! Does multiplication result in “more” or “less”? When two whole numbers are multiplied, the product is larger than either of the factors.
Many people make that observation, and then begin to mistakenly think that ALL multiplications result in a product that is larger than the factors. For fraction multiplication, the product may not be larger. That can be surprising and confusing to grade school children learning about fraction multiplication.
What exactly IS true about multiplication? Is the product larger or smaller than the
factors? Here is how it works: • If a number greater than 1 is multiplied by another factor, then the result is larger than
that other factor. Examples: Number greater than 1 x other factor = result – larger than “other factor”
6 x 7 = 42 which is larger than 7. 3 x " = # and # is larger than ". 1 ! x " = 3/8 (this was found earlier). 3/8 is larger than 1/4.

Section 5-2: Multiplication of Fractions
Page 5 - 16
• If the number 1 is multiplied by another factor, then the result is exactly equal to that other factor. This is because 1 is the multiplication identity. Examples:
Number equal to 1 x other factor = result – equal to “other factor”
1 x 17 = 17 1 x 3/14 = 3/14 • If a positive number less than 1 is multiplied by another factor, then the result is
smaller than that other factor. Examples: Positive # less than 1 x other factor = result – less than “other factor”
x = (this was found earlier). is less than .
[note: 5/10 would equal 1/2 , so 3/10 is surely less.]
x 22 = 11 (half of 22 is 11). 11 is less than 22.
Practice Problems on determining if the product is more or les than a factor.: Without actually finding the product, determine the nature of the result.
a) Does x = a result greater than , equal to , or less than ?
b) Does x = a result greater than , equal to , or less than ?
c) Does x = a result greater than , equal to , or less than ?
d) Does x = a result greater than , equal to , or less than ?
e) and f) are more challenging. Think about the commutative property.
e) Does x = a result greater than , equal to , or less than ?
f) Does x = a result greater than , equal to , or less than ?
Answers to Practice Problems:
a) less than (since is less than 1) b) equal to 3/8 (since 7/7 equals 1)
c) less than 7/4 (since 10/11 is less than 1)
d) greater than 1/6 (since is greater than 1
e) less than (since is less than 1)
f) greater than (since is greater than 1)

Section 5-2: Multiplication of Fractions
Page 5 - 17
Sections 5-1 and 5-2: Exercises on Fraction Introduction and Multiplication 1. Here is a set of objects. a) What fraction of the set are triangles?
b) What fraction of the set are circles?
2. Give two examples of when or how fractions would come up in a kindergarten classroom.
3. Make three different sketches that illustrate the fraction . Use the Part-Whole View, the
Set View, and the Division View.
4. Draw a diagram to show that 2 is the same as .
5. a) Rewrite these mixed numbers as improper fractions.
i) 2 ii) 5 iii) 1
b) Rewrite each of these improper fractions as a mixed number. Draw a sketch to show why the result makes sense.
i) ii) iii)
6. Demonstrate the answers to each of these multiplication problems by using the array model,
as shown in the section. Also, state the final result as a fraction. Suggestion: use two different colors to shade the arrays.
The rectangle shown is one whole unit.
a) x = b) • =
c) of = d) x =

Section 5-2: Multiplication of Fractions
Page 5 - 18
e) • = f) of =
g) 1 • =
h) 2 • =
7. Use the algorithm for multiplying fractions to find these products.
a) • = b) of =
c) x = d) • =
e) of = f) x =
compare with # 6 c compare with # 6 d
8. There is no need to find the following products. Simply analyze and answer the question.
a) Is the product 7 x greater or less than ?
b) Is the product x greater or less than ?
c) Is the product 1 x greater or less than ?
d) Is the product x 7 greater or less than 7 ?

Section 5-2: Multiplication of Fractions
Page 5 - 19
e) Is the product x 5 greater or less than 5 ?
f) Is the product 1 x 5 greater or less than 5 ?
g) Is the product 5 x 1 greater or less than 1 ?

Section 5-3: Equivalent Fractions
Page 5 - 20
Section 5-3: Equivalent Fractions Two different fractions are called equivalent when they represent the same size, or amount.
We sometimes say the fractions are equal, since they represent equal sizes. For
example, is equivalent to . Or we can say = .
It is easy to see that = by considering these models, where the unit one is a rectangle of
this size:
The amount shaded for is the same as for .
Being able to convert a fraction from one form to a different but equivalent form is a very
useful skill. It comes up frequently in working with fractions. The ways that we will develop for converting fractions from one form to another are sometimes called The Fundamental Properties of Equality of Fractions.
!Fundamental Property of Equality of Fractions, Part 1
We saw above from the diagrams that = . Suppose we didn’t want to bother drawing
diagrams to show this equality. Instead we could show it “symbolically” (by writing symbols rather than diagrams). We write a series of symbols that we know are equal, explaining at each step why we know they are equal. (By the way, this is generally how mathematical proofs are done.)
! start with the fraction we want to convert
= x 1 ! multiplying something by 1 does not change its value
Now notice that the number 1 can be written as a fraction, so long as the numerator and denominator of the fraction are equal.
In particular, let’s rewrite 1 as .
= x ! rewriting the number 1 as
= ! follows from the preceding line because this is how fractions are
multiplied
= ! this results from doing the multiplications on the preceding line
Notice how the proof above started with and showed that it equals .
We can generalize this method to show that any fraction can be changed into a different but equivalent fraction by multiplying by the number one, but choose the number one to
be written as a fraction before multiplying. That is, since = 1, then for any fraction:

Section 5-3: Equivalent Fractions
Page 5 - 21
= x 1 = x =
In short form, this is The Fundamental Property of Equality of Fractions Part 1.
The Fundamental Property of Equality of Fractions Part 1
=
Example A: Rewrite as an equivalent fraction in higher terms. Higher terms means that
the numerator and denominator would be larger numbers.
We will multiply the fraction by the number 1 written as a fraction. For this example
we could choose to write 1 in any form that we like, such as or or or any other
choice. Let’s use .
= x 1 = x = = .
When you understand the process, this can be written in a shorter form as:
= x = .
Example B: Rewrite as an equivalent fraction with a denominator of 28.
We will multiply the fraction by the number 1 written as a fraction. We must choose
a form of 1 so that the denominator in our answer comes out to be 28. What can you
multiply by 7 to get 28? 4. So let 1 be written as .
= x 1 = x = = .
In a shorter form write this as:
= x = .
Example C: Rewrite as an equivalent fraction with a numerator of 30.
We will multiply the fraction by the number 1 written as a fraction.
We must choose a form of 1 so that the numerator in our answer comes out to be 30.
What can you multiply by 5 to get 30? 6. So let 1 be written as .
= x 1 = x = = .

Section 5-3: Equivalent Fractions
Page 5 - 22
In a shorter form write this as:
= x = .
!Fundamental Property of Equality, Part 2 The Fundamental Property of Equality of Fractions Part 1 states:
=
We used this property in the examples above to rewrite a fraction as an equivalent fraction but with larger numbers in the numerator and denominator. For example, we
found that could be rewritten as . Of these two equivalent fractions, is the one
written in simpler form because its numerator and denominator are smaller. This is also called “lowest terms”. Sometimes we want a fraction to be written in a form with larger numbers. But often we want a fraction to be written in a simpler form, with smaller numbers. We need to develop a way to start with a fraction, and see if we can find an equivalent fraction that has smaller numbers in the numerator and denominator. To accomplish this, we will start with the Fundamental Property part 1 written in reverse order:
=
When a, b, and k are whole numbers, the fraction on the left has larger numbers in the numerator and denominator. How can we get from that fraction to the one on the right? By noticing that the number k is a factor in BOTH the numerator and the denominator, and then dividing both the numerator and denominator by k. Notice that (a x k) k = a and that (b x k) k = b.
Here is an example with numbers:
= = =
The shorter way of writing this is: = =
The property being used above is called The Fundamental Property of Equality of Fractions Part 2 . In words this property states that if there is a fraction whose numerator and denominator have a factor in common (that is – one number can be divided evenly out of both the numerator and denominator), then each of the numerator and denominator can be divided by that factor to obtain an equivalent fraction .
The Fundamental Property of Equality of Fractions Part 2
=
Examples of using the Fundamental Property of Equality of Fractions Part 2:
Example D: Rewrite as an equivalent fraction with a denominator of 13.
The denominator we want to end up with, 13, is smaller than the original denominator, 52. This indicates we want to divide 52 by something to get 13. Think about the factors

Section 5-3: Equivalent Fractions
Page 5 - 23
of 52 until noticing that 52 4 = 13. We need to divide both the numerator and denominator by 4 to get an equivalent fraction:
= = So, is equivalent to .
Example E: Rewrite as an equivalent fraction in simplest form.
• First we think of a factor of 12 that is also a factor of 18. The largest number that is a factor of both 12 and 18 is 6. Divide both numerator and denominator by 6.
= = So, written in simplest form is .
• This problem did not have to be done exactly this way, but could have been done in two stages. Suppose you didn’t notice that 6 was a factor of both 12 and 18, but only noticed that 2 is a factor of both. Then the first step would have been:
= =
Then notice that is not as simple as possible since 3 can be divided evenly into both
numerator and denominator:
= = Finally we conclude that = in simple form.
Practice Problems for using the Fundamental Properties (Parts 1 and 2) 1. Rewrite each of these fractions as an equivalent fraction with the numerator or
denominator indicated. Show the value of that you multiply by.
a) = b) = c) = d) =
2. Rewrite each of these fractions as an equivalent fraction in simple form (that is rewrite the fraction in lowest terms). Show the value of k that you divide by in the numerator and denominator.
a) = b) = c) = d) =
Solutions to Practice Problems for using the Fundamental Properties (Parts 1 and 2) 1. Rewrite each of these fractions as an equivalent fraction with the numerator or
denominator indicated.
a) = = b) = =
c) = = d) = =
2. Rewrite each of these fractions as an equivalent fraction in simple form (that is rewrite the fraction in lowest terms).
a) = = b) = =
c) = = d) = =
Note: Exercises for Section 5-3 are with Exercises for 5-4, following Section 5-4.

Section 5-4: Division of Fractions
Page 5 - 24
Section 5-4: Division of Fractions ! Concept of Division of Fractions as Repeated Subtraction Division of fractions can be understood using the Repeated Subtraction model of division,
the same model that was used for explaining division of whole numbers.
Example A: means “how many times can be subtracted from ? This
diagram illustrates this problem, where the whole rectangle is the size of “one whole”.
Each of the three arrows indicates that can be subtracted away.
Since can be subtracted three times, the quotient is 3. = 3
Example B: How many times can be subtracted from ?
In this diagram, one full rectangle represents “one whole”. The top rectangle has
shaded.
The lower rectangle is marked off in twelfths, so we can see how many s are in .
Ten s match the . And so = 10.
Example C: How many times can be subtracted from ?
In this diagram, one full rectangle represents “one whole”. The top rectangle has
shaded.
The lower rectangle is marked off in thirds, so we can see how many s are in .
Notice that two entire sections of size
could be subtracted from , and then
exactly half of one more section of remains.
Conclusion: two and a half sections of size match up with size .

Section 5-4: Division of Fractions
Page 5 - 25
And so = 2 . Note: Pay careful attention to the remainder . The
remainder is not because the division question is asking how many groups of size
can be subtracted. The remainder must indicate how much of a piece of size remains.
!Algorithm for Division of Fractions The algorithm for dividing fractions is to take the first fraction and multiply it by the
reciprocal of the second fraction. In symbols, that is:
= x
We already know how to multiply fractions, and so the problem can be completed:
= x =
The “reciprocal” of a fraction is the fraction written with numerator and denominator switched. Another name for reciprocal is multiplication “inverse”.
Fraction Division Algorithm ÷ = x
Examples A, B, and C above are examples of fraction division problems where the
results were found using the concept of division as repeated subtraction. Below, each of those examples is presented again and this time the fraction division algorithm is used to find the answers. Notice that the answers obtained using the algorithm match the answers found above using the concept of division. This indicates that the algorithm is a good algorithm since its results match the answers we already determined were correct.
Example A: = x = = = 3
Example B: = x = = = 10
Example C: = x = = = = = 2
Practice Problems on Fraction Division Express answers in simple form (in lowest terms). Improper fractions may be changed to
mixed numbers or left as improper fractions.
1) =
2) =
3) =

Section 5-4: Division of Fractions
Page 5 - 26
Solutions to Practice Problems.
1) = x = =
2) = x = = This result may be left as an improper fraction
or could be changed to the mixed number 1 .
3) = x = = This result is not in simple form and so it
must be changed to simple form by dividing out the factor 3 from both numerator and
denominator: = = .
Below are two examples of division problems where the answer is found both by using the
concept of division and then by using the fraction division algorithm. These examples show how the algorithm can be applied in cases where some of the numbers involved are whole numbers.
Example D: An example showing that the division algorithm works: 8 4 = ? • • • • • • • • If we take 8 objects we can count how many groups of 4 there are. There are 2 groups
of 4. Thus 8 4 = 2. Compare this result with using the division algorithm (and thus changing the division to
multiplying by the reciprocal of the second number):
8 4 = 8 = 8 x = x = = = 2 (same answer as
above) Example E: A second example showing that the division algorithm works:
3 = ? First we can use the repeated subtraction concept of division to find the
result. If we have 3 objects, how many times does 1/5 occur in the objects? Here are 3 candy bars, marked into pieces of size 1/5: How many 1/5 pieces are there in 3 wholes? Answer: 15
So 3 = 15
Compare this result with using the division algorithm (and thus changing that division to multiplying by the reciprocal of the second number):
3 = 3 x = = 15 (same answer as above)

Section 5-4: Division of Fractions
Page 5 - 27
Fractions with zero as numerator or denominator Recall that in the section on division of whole numbers there were explanations of why
zero divided by a number equals zero whereas a number divided by zero is undefined. We summarized in fraction notation that:
= 0 and is undefined.
A “mnemonic” is a “memory device” – some quick thought that helps a person remember
some fact. (“Mnemonic” is pronounced neh-MON-ick.)
A mnemonic for remembering how to handle fractions with zero in them. A mnemonic for fractions and zero can be developed if we use the letter “N” to
stand for “a Number”. Then the facts above can be represented as:
= 0 and is undefined.
• In the first fraction, , it looks like the word “ON” – which indicates that this
division makes sense, it is “on” – and the result is zero.
• In the second fraction, , it looks like the word “NO” – which indicates that this
division is a “no, no” – it cannot be performed – the result is undefined.
Examples of Zero in Fractions:
a) = 0 (since this is a situation like , which is “ON”)
b) is undefined (since this is a situation like , which is “NO”)
Note: the fraction is undefined.
Applications of Fractions Fractions are used in many practical situations. Example F: For the school carnival Aaron had 7 pounds of peanuts to re-package into
bags of 3/16 pound each. How many bags will he have to sell at the carnival? Solution: The 7 pounds is being divided into “pieces” of size 3/16 pound.
7 = 7 x = x = = 37
Aaron can sell 37 bags of peanuts, and there will be some peanuts left over.

Section 5-4: Division of Fractions
Page 5 - 28
Example G: The by-laws of the Future Teachers Club state that at least 3/5 of the members must approve any changes to the by-laws The club has 23 members this year. How many would have to vote “yes” to approve a change to the by-laws?
Solution: 3/5 of the 23 members would need to vote “yes”.
of 23 = • 23 = • = = 13 At least 13 members must vote “yes”.
Since there aren’t any fractional members, this means 14 or more people must vote “yes” to approve a change to the by-laws.

Section 5-4: Division of Fractions
Page 5 - 29
Sections 5-3 and 5-4: Exercises on Equivalent Fractions and Division 1. Rewrite each of these fractions as an equivalent fraction with the numerator or denominator
indicated. Show the value of that you multiply by.
a) = b) = c) = d) =
2. Rewrite each of these fractions as an equivalent fraction in simple form (that is rewrite the fraction in lowest terms). Show the value of k that you divide by in both the numerator and denominator.
a) = b) = c) = d) =
3. Find the following products and quotients. Use the fraction multiplication and division
algorithms. If a problem cannot be answered because it is undefined, write “undefined”. Answers should be expressed in simple form (that is, in lowest terms).
a) • b) •
c) ÷ d) •
e) ÷ f) ÷
g) • h) •
i) ÷ j) 8 •
k) • l) • 4
m) 6 ÷ n) ÷ 4
o) ÷ p) •
4. Make a copy of one of your favorite recipes. Choose a recipe that has some fractional
measurements in it. (If you do not have any favorite recipes, get a recipe from a friend or relative or the internet - just be sure it has some fractional measurements in it).
a) Write what the amounts of each ingredient would be if you double the recipe. b) Write what the amounts of each ingredient would be if you halve the recipe. 5. a) Is this true or false? “When two numbers are multiplied the result is larger than either of
the numbers”.

Section 5-4: Division of Fractions
Page 5 - 30
b) Explain why you answered the way you did and provide several examples to illustrate your claim. Write this so you could convince a friend who disagreed with you.
6. a) Use the Repeated Subtraction model of division to draw a diagram to illustrate the
solution to ÷ . Specify what the answer is.
b) Use the Repeated Subtraction model of division to draw a diagram to illustrate the
solution to ÷ . Specify what the answer is.
7. Solve these application problems that involve fractions. You might want to draw a diagram
and/or do a calculation to solve the problem. Show the problem set up, and show all the calculations that you perform.
a) Janna’s play dough recipe calls for " cup salt. The only measuring cup she can locate in the classroom is the 1/8 cup size. How many times must she fill the cup to get the " cup of salt needed?
b) The toddler’s dentist reported that he already had three-fifths of his “baby teeth”. He will
have 20 teeth when he has all of his “baby teeth”. How many baby teeth does he have now?
c) The Future Teachers Club at school decided that a vote to change their by-laws would
require a two-thirds vote of the membership. There are twenty-four members in the club. How many of the members must vote “yes” in order to pass the change in the by-laws?
d) Meg is using a board that is 8 feet long to make book shelves. Each shelf will be 4/3 feet
long. How many shelves can Meg make from the board? e) Beth was doing a puzzle that had 52 pieces in it. To make it more challenging, Beth
removed # of the pieces. How many pieces remained? f) Simon’s dad got four pizzas for the party, and each pizza was cut into eight parts. Every
child says he will eat three-eighths of a pizza. How many children will be able to eat three-eighths of a pizza?

Section 5-5: Addition and Subtraction of Fractions
Page 5 - 31
Section 5-5: Addition and Subtraction of Fractions The operations of addition and subtraction of fractions have the same basic meanings, the
same concepts, as addition and subtraction of whole numbers. ! Addition is the combining or putting together of two or more amounts ! Subtraction can involve the take-away concept, the missing-addend concept, or the
comparison concept. !Adding and Subtracting Fractions that Have the SAME Denominator ! Suppose Lin’s candy bar has indentations so that it can be easily broken into five equal
parts; each part is of the candy bar. Suppose Lin eats of the candy bar and later
eats if the candy bar. How much has she eaten all together? In the diagram below the
large rectangle represents one whole candy bar. The first shaded part is the 1/5 that Lin ate, and the next shaded part is the 3/5 that she ate later. It is clear that all together she ate 4/5 of the candy bar.
=
! When two fractions have the same denominator, it is clear how to add them: The sum has
the same denominator as the original fractions, and the numerator is the sum of the original numerators. In algebraic symbols this is:
Adding fractions with the same denominator: + =
Example: + = Then this sum can be simplified: = = .
! Suppose that a carton of eggs has of a dozen remaining. Then Jerry takes away 5
eggs to use in making his favorite omelet. What part of the dozen remains? Five eggs is
part of a dozen; it is of a dozen. The diagram below shows this subtraction problem.
! !
– = which reduces to . Conclude: of a dozen remains.
! When two fractions have the same denominator, it is clear how to subtract them: The
difference has the same denominator as the original fractions, and its numerator is the difference of the original numerators. In algebraic symbols this is:

Section 5-5: Addition and Subtraction of Fractions
Page 5 - 32
Subtracting fractions with the same denominator: – =
Examples: – = and – = = =
Practice problems for adding and subtracting fractions with the same denominator. Each answer should be expressed in simplified form.
a) – b) – c) +
Solutions to Practice problems.
a) – = = =
b) – =
c) + = = =
!Using Models for Adding Fractions that Do NOT Have the Same Denominator Fraction addition can be explored using a set of Fraction Bars, such as those at the end of
this section. A set of bars must be made so that they are all based on the same size of “one whole”. To find these sums, it is helpful to have two or more sets of the bars, perhaps each set in a different color.
Example A: To show + , use the eighths fraction bar. At the end of the 1/8 mark,
start the fourths fraction bar. The sum we want is at the place where the first 1/4 mark ends.
" each piece is 1/8. One is shaded here. " each piece is 1/4. One is shaded here. To see what the sum equals, find another fraction bar to line up below to see how that
total amount can be expressed as one fraction.
" each piece is 1/8. One is shaded here. " each piece is 1/4. One is shaded here. " each piece is 1/8. The three shaded pieces represent the total, the sum, of the fractions above.
Conclude + =

Section 5-5: Addition and Subtraction of Fractions
Page 5 - 33
Example B: To show + , use the tenths fraction bar. At the end of the three of the
tenths marks, start the fifths fraction bar. The sum we want is at the place where the first 1/5 mark ends.
" each piece is 1/10. Three are shaded here. " each piece is 1/5. One is shaded here. To see what the sum equals, find another fraction bar to line up below to see how that
total amount can be expressed as one fraction.
" each piece is 1/10. Three are shaded here. " each piece is 1/5. One is shaded here. " each piece is 1/10. The five shaded pieces represent the total, or sum, of the pieces above. " each piece is ". This is another fraction bar that represents the sum. This fraction is equivalent to the piece showing 5/10.
Conclude + = =
Practice Problems. Use a set of fraction bars (or better yet, two sets) to determine the following sums.
a) + b) + c) +
Answers to Practice Problems: After using fraction bars to display the suns, the results are as follows:
a) or b) c)

Section 5-5: Addition and Subtraction of Fractions
Page 5 - 34
“Fractions Sum One” Spinner Game [used to explore fraction addition]
This is a good activity for adults or children to gain experience with adding fractions.
Materials: – Each player needs a set of Fraction pieces of sizes 1/2, 1/4, 1/8, 1/3, 1/6,
and 1. [enough of each size to make one whole]. These pieces can be the Fraction Bars sheet (at the end of this section) copied and then cut into individual pieces. Or it can be a set of plastic manipulatives. The pieces can either be parts of a circle or bars.
– A spinner with fractions labeled in the sections. Or else a die marked with fraction sizes. (Such a spinner is at the end of this section).
Directions: Each person starts with the “one whole” piece. The goal is to cover the “one” piece with other fraction pieces so that they
EXACTLY make one whole. On your turn: - spin the spinner - take a fraction piece of that size, and place it on your “one” piece - if you don’t want to take a fraction piece of that size, that is fine, just don’t
take it and skip that turn. - on your turn, if you’d prefer to remove a fraction piece from your “one” piece
rather than spin to get a new fraction piece, then do that. You can choose any of your pieces to be removed.
The winner is the first person to completely cover the “one” piece exactly with other pieces. The fractions that cover that one piece should be recorded, indicating that their sum is 1.
For example, the winner might record: + + = 1
! Adding and Subtracting Fractions with UNLIKE Denominators In order to understand the concept of fraction addition, it is useful to have experience
using fraction bars, “pie pieces”, and other fraction manipulatives. After understanding the concept, it is time to develop a way to add fractions using symbols.
The method for adding fractions with the same denominator was given above, namely:
Adding fractions with the same denominator: + =
In order to add fractions that do not have the same denominator (their denominators are unlike), the method is to rewrite the fractions as equivalent fractions that DO have the same denominator. Then those equivalent fractions can be added to give the sum. When the two fractions have the same denominator, it is called a common denominator.
Usually the fractions to be added start out in simple form. That means they cannot be
rewritten as equivalent fractions that have a smaller denominator. So the fractions will need to be rewritten as equivalent fractions that have larger denominators. Sometimes only one of the fractions needs to be rewritten to have a larger denominator.

Section 5-5: Addition and Subtraction of Fractions
Page 5 - 35
To write an equivalent fraction in larger terms, remember that we multiply the original fraction by the number one (which does not change the value of the fraction), but choose the way to write the number one so that the new denominator comes out to be the number we want.
Example C: to add + notice that the first fraction could be rewritten with a
denominator of 12 (so it would match the second fraction’s denominator) if the first fraction
were multiplied by . Here is the work:
+ = ! + = + = = =
In the example above, notice how the first fraction was changed to an equivalent one so that its denominator ended up matching the denominator of the second fraction.
Example D: to add + . This is not like the example above because neither of
these denominators can be multiplied by something to equal the other one. Rather, we need to change BOTH fractions to equivalent fractions with a larger, common denominator. What is a multiple of 4 that is also a multiple of 10?
Analyze: multiples of 4 are 4, 8, 12, 16, 20, 24, 28, 32, 36, 40, 44, … multiples of 10 are 10, 20, 30, 40, 50, 60, 70. 80, … 20 is the smallest common multiple of 4 and 10. (Note: 40 is also a common multiple, but
it is easier to use the least common multiple.) Notice that the denominator 4 needs to multiply by 5 to equal 20. The denominator 10 needs to multiply by 2 to equal 20. Here is the work:
+ = ! + ! = + =
The result here, , can be left as an improper fraction or can be rewritten as a mixed
number: = 1
Subtraction of fractions with unlike denominators is accomplished in the same way as
addition, except that the numerators are subtracted rather than added.
Example of fraction subtraction with unlike denominators: –
To determine the common denominator, consider: Multiples of 15 are: 15, 2·15 = 30, 3·15 = 45, 4·15 = 60, etc. Multiples of 6 are: 6, 2·6 = 12, 3·6 = 18, 4·6 = 24, 5·6 = 30, etc. The smallest (or least) common multiple is 30. 15·2 = 30 and 6·5 = 30. Here is the work for subtracting the fractions:
– = • – • = – =
Then simplify the result: = = . Conclude: – = .

Section 5-5: Addition and Subtraction of Fractions
Page 5 - 36
Summary:
Adding or subtracting fractions with unlike denominators: General idea: Rewrite each fraction as an equivalent fraction with the
same denominator (a common denominator) and then add or subtract those fractions.
Steps: · Determine a common multiple of the original denominators. · Multiply each original fraction by the number one written in a way so that
the denominator will end up being the common multiple · Add those fractions, since they now have the same denominator. · Simplify the answer, if possible.
Practice problems for adding and subtracting fractions with unlike denominators.
a) – b) +
Solutions to Practice problems: a) Notice that 8 can be multiplied by 3 to get 24, so 24 is the common multiple.
– = – • = – = = =
b) Multiples of 6 are: 6, 12, 18, 24, 30, 36, 42, etc. Multiples of 4 are: 4, 8, 12, 16, 20, 24, 28, 32, 36, etc. The least common multiple is 12.
+ = • + • = + = May be rewritten as 1

Section 5-5: Addition and Subtraction of Fractions
Page 5 - 37
Section 5-5: Exercises on Addition and Subtraction of Fractions
1. Add or subtract. Use fraction bars or other fraction pieces to show the answers. Express answers in lowest terms.
a) + = b) + =
c) – = d) + =
e) + = f) – =
g) + = h) – =
i) + = j) – =
2. Write at least four ways that you can write an addition problem whose answer is ".
You might lay out fraction pieces to help with this. As an example, this is one way: 1/8 + 1/16 + 1/16 + 1/16+ 1/16 + 1/16 + 1/16.
3. a) Write a subtraction problem whose answer is ". b) Write a subtraction problem whose answer is 1/3. c) Write a subtraction problem whose answer is1/4, using fractions with unlike
denominators..
4. Solve each of these application problems. When you state the answers, the units of the answer must be given too (for example, pounds or miles or hours).
a) The total length of a motor cycle race is 5/7 of a mile. Zoe has completed 1/7 of a mile. How much distance does she have left in the race?
b) The grocer mixed # pound of walnuts, " pound of almonds, and 1/3 pound of
pecans. How much did the nut mixture weigh all together? c) A truck delivered 4/5 ton of gravel and # ton of topsoil to a construction site. How
much total did the truck deliver? 5. a) Write an application problem involving fraction addition. Also solve the problem. b) Write an application problem involving fraction subtraction. Also solve the
problem.

Section 5-5: Addition and Subtraction of Fractions
Page 5 - 38
Fraction Bars Copy on “card stock” and cut into strips.
1

Section 5-5: Addition and Subtraction of Fractions
Page 5 - 39
Spinner that can be used for games. Copy the spinner and use it with a paperclip, as described below.
How to make and use a “paperclip spinner”:
- get a normal-size paper clip. Take the outer edge and bend it out straight, as in the diagram. (It is okay if it is not perfectly straight.)
- put the “loop” end of the paperclip over the center of the spinner.
- place a pencil tip inside the paperclip “loop” exactly on the spinner center.
- push or flick the straight end of the paper clip so that it spins around the pencil tip.
- the straight end will land in one of the sectors of the spinner.

Section 5-5: Addition and Subtraction of Fractions
Page 5 - 40
Copy this spinner and use it for games. You can fill in whatever labels you want for the sections.

Section 5-5: Addition and Subtraction of Fractions
Page 5 - 41
Activity: Modeling Fractions using EGG CARTONS
These fractions are familiar to you, and the activities might seem simple. And yet, there is
something to be gained, a deeper understanding and comfort with fractions. When you involve your
eyes, hands, and thoughts, you have the chance to gain a clearer understanding for yourself. Plus you
have the chance to explore ways that you might help children become experts with fractions.
Materials needed: egg cartons (12-pack and 18-pack), small objects (such as two-sided counters, small rocks, buttons – whatever will fit into an egg carton),
Yarn or string, and scissors to cut it
A. For this part of the activity, a 12 compartment egg carton is “one whole thing”.
1. a) Represent half of the 12 compartments by placing objects in some of the cells. b) Is there more than one way to do this? c) Use a length of yarn – place it across the carton in such a way as to divide the filled cells
from the empty cells. d) There more than one way to do that - try it a different way.
2. a) Use yarn lengths to divide the carton into six equal parts (each part is of the carton).
b) Place objects in 2/6 of the carton. c) Can you change the way the strings are to show that 2/6 equals 1/3? 3. Use yarn lengths and objects to show that these fractions are equivalent.
a) is equivalent to b) is equivalent to
c) is equivalent to d) is equivalent to
4. List all the fraction pairs that you can show are equivalent to .
5. Use yarn lengths and objects to demonstrate that + =
6. Use yarn lengths and objects to demonstrate that – =
7. Demonstrate another addition and another subtraction equation. Write them here. B. . For this part of the activity, an 18 compartment egg carton is “one whole thing”.
8. Use yarn lengths to show that is equivalent to and to .
9. Use yarn lengths to dhow that + =
10. Demonstrate another addition and a subtraction equation. Write them here.

Section 5-6: Comparing Fraction Sizes
Page 5 - 42
Section 5-6: Comparing Fraction Sizes There are many ways of comparing two fractions to decide which one is larger than the
other. The four methods presented below are: 1. Diagrams 2. Rewriting with a Common Denominator 3. Comparing with “Friendly Fractions” 4. Rewriting as Decimals
When comparing the sizes of two fractions, we assume that the unit, one whole, is the same
for each of them.
Quick review of the Notation for Inequality: < is read “is less than”. Example: 2 < 5 is read “2 is less than 5”. > is read “is greater than”. Example: 13 > 7 is read “13 is greater than 7”.
The symbols < and > are called “strict inequality” symbols because they indicate the two quantities are NOT equal. So, 4 < 4 is not a true statement. If x > 12 then x could be 13 or 14 or 12.1 or many other numbers, but x can NOT be 12.
< is read “is less than or equal to”. Examples: 2 < 5 is read “2 is less than or equal to 5”, which is true. 4 < 4 is read “4 is less than or equal to 4”, which is true. > is read “is greater than or equal to”. Examples 9 > 8.8 is read “9 is greater than or equal to 8.8”, which is true.
3 > 3 is read “3 is greater than or equal to 3”, which is true. Some people like to keep in mind that the larger (more “open”) end of the
inequality symbol faces the larger number.
! Method 1: Diagrams An accurate diagram can be used to easily determine which of two fractions is larger and
which is smaller. Example A: Which is larger, 1/4 or 1/2 of a diamond? ! 1/4 of this diamond shape ! 1/2 of this diamond shape is shaded is shaded It is clear that the shaded 1/4 area is smaller than the shaded 1/2 area, so
< “one-fourth is less than one-half”
Another way of expressing the same relationship is:
> “one-half is greater than one-fourth”

Section 5-6: Comparing Fraction Sizes
Page 5 - 43
Example B: Compare the size of 2/5 and 3/4. ! 2/5 of the rectangular bar is shaded ! 3/4 of the rectangular bar is shaded
Conclusion: < or equivalently >
It is not always convenient to draw accurate diagrams. When two fractions are different but very similar in size, it can be difficult or impossible to determine which is larger simply from a drawing.
! Method 2: Rewriting with a Common Denominator Another method for comparing fraction sizes is to rewrite each fraction with a common
denominator. This passage from the National Council of Teachers of Mathematics (NCTM) explains:
“…to compare 2/3 and 3/4, students can use concrete materials to represent them as 8/12 and 9/12, respectively, and then conclude that 8/12 is less than 9/12, since 8 is less than 9. Thus, they learn that comparing fractions is like comparing whole numbers once common denominators have been identified.”
Example C: Compare the size of 2/5 and 3/4. Rewrite each fraction with a common denominator. The least common multiple of 5
and 4 is 20, so that will be the common denominator.
= • = = • =
< so we conclude that <
! Method 3: Comparing with “Friendly Fractions” Another method for comparing fraction sizes is to consider how the size of the fraction
relates to “benchmark” or “friendly” fractions like 1 or 1/2 . Sometimes this is easier than rewriting the fractions with a common denominator, plus it emphasizes a good conceptual understanding of fractions.
Example D: Compare the size of and .
Notice how each of these fractions compares in size to 1.
is slightly less than 1 [since = 1 and is less.]
is somewhat larger than 1. [since = 1 .]
We conclude that < .
This problem could have been solved by finding the common denominator, but that common denominator is 323. The work to write the equivalent fractions would be tedious.

Section 5-6: Comparing Fraction Sizes
Page 5 - 44
Example E: Compare the size of and .
Each of these fractions is less than 1; so that does not help determine which is larger.
Next, compare each fraction to size .
must be less than since we know that 6 is half of 12 so = .
How does compare to ? We know that half of 13 is 6 . So 6 thirteenths
would be one-half. Thus 7 thirteenths is a bit larger than one-half.
We conclude that > .
Example F: Compare the size of and .
Each of these fractions is less than 1. Each of these fractions is greater than .
So this method of comparison is not helpful for these fractions. Instead, we can rewrite each fraction with a common denominator. The least common denominator is 40.
= • = and = • =
Since < we conclude that < .
! Method 4: Rewriting as Decimals Another method for comparing fraction sizes is to rewrite each of the fractions in decimal
form. Decimals are covered later in the book, so we will not emphasize this method here but will give one example
Example G: Compare the size of and .
To rewrite as a decimal, calculate 5 ÷ 8 = 0.625
And written as a decimal is 0.7
Since 0.625 is less than 0.7 we conclude that < ..

Section 5-6: Comparing Fraction Sizes
Page 5 - 45
O whole whole O whole whole O whole whole O whole whole O
Consider the “Whole” when comparing sizes
– When two fractions are compared as above, we are assuming that the unit
which is “one whole” is the same for each fraction. We found above that >
which is true when each fraction is part of the same size unit.
– If someone asks “Which is more books, of the books in my book bag or of
the books in my bedroom?” the question cannot be answered until we know how
many books are in each location. If the book bag has 6 books, then of the
books in the book bag is 3 books. And if the bedroom has 20 books, then or of
the books in the bedroom is 5 books. So of the books in the book bag is less
than of the books in my bedroom.
– We still know that > is true when the “whole thing” is the same for both
fractions. But in this situation, the fraction was referring to the books in the
book bag as the “whole thing” while the was referring to the books in the
bedroom as the “whole thing”.
O whole whole O whole whole O whole whole O whole whole O
Practice Problems:
1. Fill in the box with the symbol < or > or = to make a true statement about the sizes of the fractions. Explain the answers.
a) b) c)
2. In the Healthy Foods store, of the cereal boxes sold one day were high fiber cereals.
In Best Health food store, of the cereal boxes sold that day were high fiber cereals.
Can you say which store sold MORE high fiber cereal boxes that day? Explain why or why not.
3. Suppose that more information is now known about problem number 2. The Healthy
Foods store sold 90 boxes of cereal that day, and Best Health sold 210 boxes that day. How many boxes did each store sell? Which store sold MORE high fiber cereal boxes that day?

Section 5-6: Comparing Fraction Sizes
Page 5 - 46
Solutions to Practice Problems:
1. a) both fractions are more than " and less than 1, so friendly numbers are not readily helpful. Let’s rewrite the fractions with a common denominator. The common denominator would be 15.
= x = and = x = . Since > , > .
b) Compare each fraction to 1. 12/13 is less than 1. 10/9 is greater than 1.
So we know that < .
c) 1/8 is fairly small – definitely less than ". Whereas 8/9 is fairly large – almost 1
whole. So < .
2. We found in problem 1a) that > . But this question is not about which fraction is
larger; it is about which number of cereal boxes is larger. We do not know how many boxes are in “the whole set of boxes” for either store. The numbers of boxes sold at each store is probably not the same. For these two fractions, the “whole set” is not the same size, and so we cannot compare the fractions unless we know the sizes of the whole set.
3. For Healthy Foods, of the cereal boxes sold were high fiber. They sold 90 boxes. So
we want to find of 90 boxes. That is the same as x 90:
x 90 = x = x = = 360 ÷ 5 = 72
Healthy Foods sold 72 boxes of high fiber cereal.
For Best Health, of the cereal boxes sold were high fiber. They sold 210 boxes. So we
want to find of 210 boxes. That is x 210.
x 210 = x = = 420 ÷ 3 = 140.
Best Health sold 140 boxes of high fiber cereal. On that day, Best Foods sold more boxes of high fiber cereal.
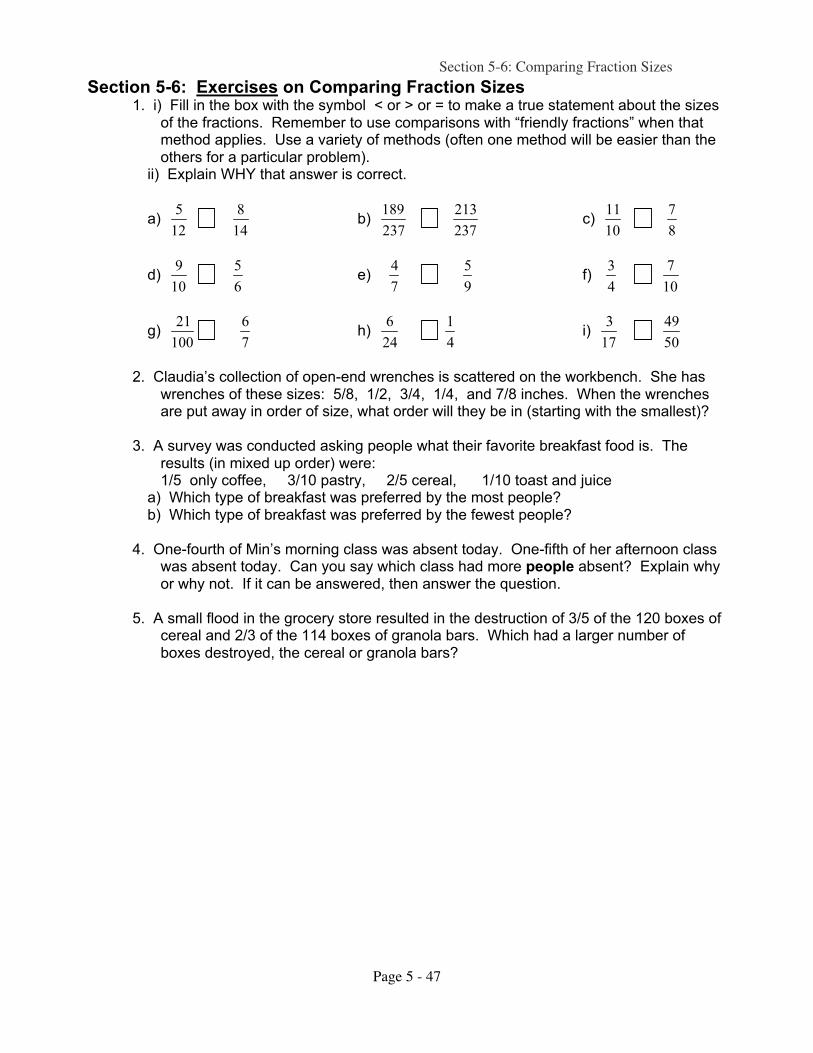
Section 5-6: Comparing Fraction Sizes
Page 5 - 47
Section 5-6: Exercises on Comparing Fraction Sizes 1. i) Fill in the box with the symbol < or > or = to make a true statement about the sizes
of the fractions. Remember to use comparisons with “friendly fractions” when that method applies. Use a variety of methods (often one method will be easier than the others for a particular problem).
ii) Explain WHY that answer is correct.
a) b) c)
d) e) f)
g) h) i)
2. Claudia’s collection of open-end wrenches is scattered on the workbench. She has
wrenches of these sizes: 5/8, 1/2, 3/4, 1/4, and 7/8 inches. When the wrenches are put away in order of size, what order will they be in (starting with the smallest)?
3. A survey was conducted asking people what their favorite breakfast food is. The
results (in mixed up order) were: 1/5 only coffee, 3/10 pastry, 2/5 cereal, 1/10 toast and juice a) Which type of breakfast was preferred by the most people? b) Which type of breakfast was preferred by the fewest people? 4. One-fourth of Min’s morning class was absent today. One-fifth of her afternoon class
was absent today. Can you say which class had more people absent? Explain why or why not. If it can be answered, then answer the question.
5. A small flood in the grocery store resulted in the destruction of 3/5 of the 120 boxes of
cereal and 2/3 of the 114 boxes of granola bars. Which had a larger number of boxes destroyed, the cereal or granola bars?

Section 5-7: Operations with Mixed Numbers
Page 5 - 48
Section 5-7: Operations with Mixed Numbers Mixed numbers are involved in many practical problems. For example: a recipe calls for
2 cups of flour, a friend is arriving in 1 hours, a suburban farm has 3 acres of land
planted in blueberries, the picture frame is 7 inches high. Often mixed numbers are
involved in calculations. Multiplying and Dividing Mixed Numbers
The way to multiply or divide mixed numbers is to first rewrite the mixed numbers as improper fractions. Then perform the operation with those fractions using the methods already developed for fractions. In the end, if the final result is an improper fraction then it should be rewritten as a mixed number.
Example A: Don is doubling the bread recipe which calls for 2 cups of flour. How much
flour should he use? Solution: Since he is doubling the recipe, he will need twice as much flour, so he will
need 2 x 2 cups. To do this multiplication, rewrite the mixed number as an improper
fraction, then do the multiplication Finally express the answer as a mixed number with units.
2 x 2 = x = = 4
Answer: Don should use 4 cups of flour when he doubles the recipe.
Example B: Farmer Joan has 1 acres of garden and she wants each of her four children
to be responsible for caring for an equal share of the garden. How many acres will each child be responsible for?
Solution: The total number of acres is to be divided by 4 to find how much each child will care for.
1 ÷ 4 = ÷ = x =
Answer: Each child will care for of an acre.
Extension of Example B: How many square feet will each child care for? Solution: Since the problem talks about acres and now we want an answer in square
feet, we need to find the relationship between the two. How many square feet are in an acre? Look it up online or elsewhere. (You can type 1 acre = ? square feet into the google searchbar and it will give the answer.)
There are 43,560 square feet in one acre.
Each child will care for of an acre, so each child will care for of 43,560 square
feet. Multiply: of 43,560 = x = (Use a calculator) = 15,246.
Answer: Each child will care for 15,246 square feet. That’s a lot!

Section 5-7: Operations with Mixed Numbers
Page 5 - 49
Adding and Subtracting Mixed Numbers – Method #1
There are two methods for adding and subtracting mixed numbers. In the first method for adding and subtracting mixed numbers, the numbers are kept as mixed numbers. The whole number parts and the fraction parts are added or subtracted separately, then the results are put together. Finally the sum is rewritten in simple form.
Example C: To decorate a large basket Marvin needs 4 yards of ribbon, and he needs 2
yards to decorate the small basket. How much ribbon does he need for both baskets? Solution: We need to add the two mixed numbers to find the total amount needed.
Using Method 2 for adding mixed numbers, the work is typically written vertically. Before adding, the fraction parts need to be rewritten with a common denominator. In this problem, the common denominator would be 4.
4 = 4 = 4
+ 2 = 2 • = + 2
-------------------------------------------
6
The result 6 is not written in a correct format. Mixed numbers are a good format,
and improper fractions are good format. In this case we have a mixed number with an improper fraction in it – and that is a bad format.
To change 6 to a correct format, realize that it means 6 + .
Change the improper fraction into a mixed number: = 1 .
Then put the 6 + together as 6 + 1 , which is 7 .
Answer: Marvin needs 7 yards of ribbon.
Example D: Marvin needs 7 yards of ribbon. He looks in the cupboard and realizes he
already has 1 yards of ribbon. How much ribbon does he need to buy?
Solution: Marvin needs 7 . We can subtract the 1 yards he already has to see
how much should be purchased. Mixed numbers can be used to do the subtraction. The fractional parts must be rewritten with a common denominator. The least common multiple of 4 and 6 is 12.
7 = 7 • = 7
– 1 = – 1 • = – 1
-------------------------------------------
6

Section 5-7: Operations with Mixed Numbers
Page 5 - 50
Answer: Marvin needs to buy 6 yards of ribbon.
Example E: Suppose that Marvin was distracted when he measured the ribbon he already
has, so he decides to check it again. Now he realizes that he has 1 yards of ribbon.
How much more should he buy to have 7 total.
Solution: As in the last example, this is still a subtraction problem. If mixed numbers are used in the calculation, the common denominator will need to be 8 since it is the least common multiple of 4 and 8.
7 = 7 • = 7
– 1 = 1 = – 1
There is a difficulty in trying to complete this subtraction of the fractional parts because
is larger than and so cannot be subtracted from it (except by going into negative
numbers – which is a method that would work but is more complicated). To resolve this
difficulty, in the top number (7 ) regroup (borrow) 1 from the 7 and put the 1 with the
fractional part . In other words, in the 7 , regroup so that the 7 is rewritten as 6 + 1.
Then 7 is 6 + 1 . Next, rewrite the 1 as an improper fraction and continue the
subtraction. Here is all the work:
7 = 7 • = 7 = 6 + 1 = 6
– 1 = – 1 = – 1 = – 1 = – 1
--------------------------------------------------
5
Answer: Marvin needs to buy 5 yards of ribbon.
Adding and Subtracting Mixed Numbers – Method #2
The second method is to rewrite all of the mixed numbers as improper fractions, and then perform the calculations using the methods already developed for fractions. In the end, if the final result is an improper fraction then it should be rewritten as a mixed number. If the mixed numbers in the problem have a large whole number part or a large denominator in the fractional part, then this method is generally less efficient.
Example F: Ramona spent 1 hours on the bus, then an hour at the doctors office, 2
hours shopping, and finally 1 hours on the bus trip back home. How much time did
she spend all together on these tasks?

Section 5-7: Operations with Mixed Numbers
Page 5 - 51
Solution: The total time is found by adding. Change the mixed numbers to fractions:
1 + + 2 + 1 = + + + To add fractions, a common
denominator is required. In this case, the least common multiple of 2, 4, and 3 is 12.
+ + + = • + • + • + •
= + + + =
Then the sum should be written as a mixed number and simplified = 5 = 5 .
Or the sum could be simplified first then written as a mixed number: = = 5 .
Answer: Ramona spent 5 hours on these tasks.
Example G: Ramona’s mom said that if she hadn’t spent so much time shopping she would have had time to complete her homework. If Ramona had not gone shopping at all, how much time would she have spent on the other tasks.?
Solution: Since she spent 5 hours total and 2 hours shopping, we can subtract 2
hours from the total to see how much time was spent on the other tasks.
5 – 2 = – The least common multiple of 6 and 4 is 12.
– = • – • = – = = 3
Note: another approach to this problem is to add the times spent on the tasks other than shopping. The final answer would be the same.
Answer: Ramona would have spent 3 hours if she had not gone shopping.
Extension to Example G: 3 hours is 3 hours and how many minutes?
Solution: We need to convert hours into minutes. To do that we need the fact that
1 hour is 60 minutes. Now we want of an hour, which is of 60 minutes.
of 60 minutes = x 60 = x = = = = 35 minutes.
Answer: 3 hours is 3 hours and 35 minutes.

Section 5-7: Operations with Mixed Numbers
Page 5 - 52
Summary of Performing Operations on Mixed Numbers
! When mixed numbers are to be multiplied or divided, that cannot be done directly.
Rather, the mixed numbers must first be rewritten as improper fractions and then the operation can be performed on those fractions. Remember that fractions do not need to have the same denominator in order to multiply or divide them.
! When mixed numbers are to be added or subtracted, there is a choice of methods.
Either: - Do the addition or subtraction directly with the mixed numbers, generally
writing it vertically. Or - Rewrite the mixed numbers as improper fractions and perform the addition or
subtraction on the fraction. For either method, remember that fractions must be rewritten with a common
denominator before adding or subtracting them. ! It the end, the result should be written as a mixed number in a proper format, with
units. Note: the answer could be left as an improper fraction, but when someone gives a problem with mixed numbers it is expected that you give the answer back to them as a mixed number.

Section 5-7: Operations with Mixed Numbers
Page 5 - 53
Section 5-7: Exercises for Mixed Number Operations 1. Perform the indicated operation. Show all steps of your work. Express answers as mixed
numbers in proper format.
a) 7 • 1 b) 4 ÷ 2
c) 7 – 1 d) 4 + 2
e) ÷ 3 f) 6 – 2
g) 5 • 3 h) 5 + 7
2. Andre lives 2 miles from school, and Coretha lives 5 miles from Andre. If Coretha
drives Andre home from school and then drives herself home, how far did she drive?
3. A brick fence was partially collapsed. The part that was still in good shape was 22 feet
long. The entire fence needed to be 54 feet long. How long was the part that had to
be replaced?
4. Each classroom needs to have 3 pounds of flour to make big batches of playdough.
There are five classrooms. How much flour is needed all together?
5. The package of yarn is labeled 55 yards. Each child needs 2 yards of yarn for an art
project. How many children can make the project with that yarn?

Section 5-7: Operations with Mixed Numbers
Page 5 - 54
Blank Page

Section 6-1: Concepts and Representation of Decimals
Page 6 - 1
Chapter 6 Decimals
Decimals are one of the types of numbers that let us talk about part of a whole. Fractions and percents are other ways of talking about part of a whole. Decimals are sometimes easier to use than fractions when doing calculations and comparisons.
Decimals are in everyday use in many applications. Can you think of a few places where you
see decimals? The first one that many people think of is money – the representation of dollars and cents uses decimals. Sports statistics, averages, and measurements are other areas where decimals are frequently used.
Activity: Finding Decimals Bring in three articles from the media that contain decimals (newspapers,
magazines, pamphlets, websites). One of these references might be money, but make sure that the other two are NOT money.
Generally Early Childhood Educators are concerned with children from birth through age 8. It is only at the older end of that range that decimals would commonly be explored. The National Council of Teachers of Mathematics (NCTM) Curriculum Focal Points for grade 3 (available at http://nctm.org/standards/focalpoints.aspx?id=330) refer to the following Related Expectations from Principles and Standards for School Mathematics Content Standards: Grade 3:
• Understand the place-value structure of the base-ten number system and be able to represent and compare whole numbers and decimals
(from http://nctm.org/standards/content.aspx?id=12386)
Though young children might not work much with decimals, all adults need to clearly
understand the concept of decimals and be proficient with decimal operations.
Section 6-1: Concepts and Representation of Decimals Place Value
In our Base 10 number system, the value of each digit depends on which place it is in. For example, in the number 427, the 4 is in the hundreds place and so it represents the value 400, the 2 is in the tens place and represents 20, while the 7 is in the units place and represents 7 ones. 427 means 4 hundreds plus 2 tens plus 7 units.
At the right side of a whole number one could write a decimal point; it isn’t always written, but it could be. For example, 17. (with a decimal point at the end) is the same as 17 (without a decimal point at the end). If a number is not a whole number and has digits on the right side of the decimal point, those digits are often called “the decimal part” of the number.

Section 6-1: Concepts and Representation of Decimals
Page 6 - 2
Consider the number 7,285 . 3149 Whole-number part Decimal part Decimal point
Notice how the places to the right of the decimal point follow the same pattern as the places
to the left of the one’s place. The one’s place (also called the units place) is to the left of the decimal point, and it does not have a counterpart to the right. The place values to the right of the decimal point all end with “…ths”.
The expanded form of 7,285.3149 is
7000 + 200 + 80 + 5 + + + +
Vocabulary and Notation
! Reminder: “digit” means a single numeral. Our base ten number system has these ten digits: 0, 1, 2, 3, 4, 5, 6, 7, 8, and 9.
! The word “decimal” is from a Latin word for “ten”. Technically, the term “decimal number” refers to any number in our Base Ten number system, even a whole number. But usually when people say the term “decimal number” they mean a number that is not a whole number but rather is one with a decimal point and a decimal part to it.
! The number of digits in a number to the right of the decimal point is generally called the “number of decimal places” in the number. For example, the number 48.167 has three decimal places.
! In the United States, the decimal point is written as a small dot at the level of the bottom of the numerals, such as “ 174.38 “. In other words, it looks very much like a period at the end of a sentence. In other countries there are different ways of writing the decimal point. • In England, it is written as a small dot but it is placed higher than in the U. S.; it is placed about half-way up the number, such as “ 174·38 “ • In some other parts of Europe, the commas and the decimal point are interchanged (from what they would mean in the U.S.) So, what in the U.S. would be written as “10,342.89” would be written as “10.342,89” - There are other notations used in other parts of the world. When you work with children from other countries, be aware that they may be familiar with a different
7 2 8 5 . 1 3 9 4

Section 6-1: Concepts and Representation of Decimals
Page 6 - 3
notation. When you are in a country, to communicate well you should use the system in use there.
! A whole number can be written in decimal notation by writing the decimal point and then a zero or several zeros after it. For example, 38 = 38.0 = 38.00 = 38.000
These numbers are all equal in value; they are mathematically equivalent. ! In the context of a scientific application, or a measurement, these numbers 38 = 38.0 =
38.00 = 38.000 each indicate something slightly different. When the decimal place is written with a zero in it, the implication is that the measurement is known to be precise to that decimal place. For example, “the book is 38 centimeters long” implies that the measurement is closer to 38 centimeters than to 37 or 39 while saying “the book is 38.0 centimeters long” implies that the measurement is closer to 38.0 than it is to 37.9 or 38.1. In other words, when a measurement is stated as 38.0, that implies the measurement is precise to the tenths place. When a measurement is stated as being 38.00, that implies it is precise to the hundredths place.
Names of Decimal Numbers
People often read decimal numbers by saying the whole number part and then the word “point” where the decimal is and then naming each digit to the right. For example, 38.724 may be read as “thirty-eight point seven two four.” This could be considered the casual name of the number. It is important to also know the formal name of the number.
To give a number its formal name, first determine the decimal place value of the last digit on the right side of the number. For example, in 38.724 the last digit on the right (the 4) is in the thousandths place. In the formal name of a decimal number, the whole number part is stated, then the word “and” is said and then the decimal part is given its name as a fraction. For example, 38.724 is read as “thirty-eight and seven hundred twenty-four thousandths”.
Examples: 7000.82 is seven thousand and eighty-two hundredths 6.4805 is six and four thousand eight hundred five ten-thousandths 0.039 is thirty-nine thousandths
Note that the word “and” should be stated ONLY in place of the decimal point and
nowhere else. So, the number 405.7 is “four hundred five and seven tenths.” Do not read it as “four hundred and five and seven tenths”.
Rounding Decimal Numbers
To round a number to a particular place value, first locate the digit in that place value. Then look at the single digit to the right. If that digit on the right is 5 or greater, the digit in the place value you are “rounding to” rounds up. But if the digit to the right is less than 5, then leave the digit alone in the place you are “rounding to”. Digits in places to the right of the place you are rounding to get replaced with zeros if they are part of the whole number. Digits in the places to the right of the place you are rounding to are left blank if they are in the decimal part of the number.

Section 6-1: Concepts and Representation of Decimals
Page 6 - 4
Examples: • Round 37,529 to the thousands place. 7 in the thousands place. The digit to the right of the thousands place is “5” and so the 7 in the thousands place is rounded up to 8. Answer: 37,529 rounded to the nearest thousand is 38,000 • Round 649.283 to the hundreds place 6 in the hundreds place. The digit to the right of the hundreds place is “4” and so the 6 in the hundreds place stays “6”. Answer: 649.283 rounded to the nearest hundred is 600 • Round 649.283 to the hundredths place 8 in the hundredths place. The digit to the right of the hundredths place is “3” and so the 8 in the hundredths place stays “8”. Answer: 649.283 rounded to the nearest hundredth is 649.28 • Round 649.283 to the tenths place 2 in the tenths place. The digit to the right of the tenths place is “8” and so the 2 in the tenths place is rounded up to 3. Answer: 649.283 rounded to the nearest tenth is 649.3
Equality and Inequality of decimal numbers: comparing sizes
! In comparing the sizes of decimal numbers, what is important to consider is the place values of the various digits in the numbers. The place values to the left represent larger values, and thus determine which of two numbers is larger.
This method is also used for whole number comparisons. For example, in deciding
which is larger, 8,001 or 7,999, we compare the digits in the same place value columns in each number, starting with the largest (most left) place value represented in either number::
8,001 7,999 in the thousands place, the top number has the larger digit, so the top number is larger. This is true even though the bottom number
has larger digits in all the other place values. Those other place values are not as “valuable” as the place value to the left.
8,001 > 7,999 ! To compare two decimal numbers, line up the decimal points. Then determine the
largest place value (from the left) where the two numbers differ. Example A: Compare 172.365 and 172.349 172.365 write the numbers so that their decimal points line up 172.349 the hundredths place is the first place where they differ, and the top
number is larger in that place. So 172.365 is greater than 172.349 172.365 > 172.349

Section 6-1: Concepts and Representation of Decimals
Page 6 - 5
Example B: Compare 9.4989 and 11.3 9.4989 write the numbers so that their decimal points line up 11.3 in the tens place, the bottom number has a digit and the top one does not. 9.4989 < 11.3 Example C: Compare 0.005 and 0.0008 0.005 write the numbers so that their decimal points line up 0.0008 the first place where the numbers differ is the thousandths place The top number is larger in the thousandths place, and so it is the larger
number. 0.005 > 0.0008 Example D: Sometimes more than two numbers need to be arranged in order of size.
Suppose that in an environmental study of a certain pollutant, the amounts found in various classrooms were the following:
A – 0.002 B – 0.0103 C – 0.0009 D – 0.015
To place these numbers in order of size, write them with the decimal points in line A – 0.002 Generally it is easier to compare number sizes if B – 0.0103 each number has the same number of decimal places. C – 0.0009 At the right end, zeros can be filled in to the empty decimal D – 0.015 places without altering the numbers value.
Here are the numbers rewritten with empty decimal places filled in with zero: A – 0.0020 Each number begins 0.0 B – 0.0103 The first place the numbers differ is the hundredths place. C – 0.0009 The numbers with a “1” in the hundredths place are larger D – 0.0150 than the numbers with a 0 there.
So B and D are larger than A and C. ! Compare just B and D to find the larger one: B – 0.0103 D – 0.0150
D has the larger digit in the thousandths place, and so is larger than B ! Then compare A and C to see which of them is larger A – 0.0020 C – 0.0009 In the thousandths place A is larger, and so A is larger than C Conclusion: D is larger than B. Both are larger than A and C. A is larger than C. Thus: D > B > A > C Writing the numbers in order: D – 0.0150 B – 0.0103
A – 0.0020 C – 0.0009

Section 6-1: Concepts and Representation of Decimals
Page 6 - 6
Decimal grids represent decimal numbers. A decimal grid is a way of picturing decimal numbers. When using decimal grids, the size
of “one whole” must be defined. When the whole is divided into ten equal parts, each part is one-tenth, or 0.1. If each of those ten parts is divided into ten parts, then there are 100 parts total. Each of the 100 parts is one-hundredth, or 0.01.
One Whole is represented by this first square.
On the second square 3 tenths or 0.3 is shaded. On the third square 23 hundredths or 0.23 is shaded.

Section 6-1: Concepts and Representation of Decimals
Page 6 - 7
Section 6-1: Exercises on Concepts and Representation of Decimals 1. In the number 43,725.1698, which digit is in each of these place values? [read carefully – noting whether there is a “ths” ending to the place value] a) in the tenths place b) in the hundreds place c) in the thousandths place d) in the thousands place e) What is the place value of the digit 8 in the number? f) What is the place value of the digit 5 in the number? g) What is the place value of the digit 6 in the number? 2. Write the number in decimal form: a) Three hundred twenty and thirty-eight hundredths b) Three hundred twenty and thirty-eight thousandths c) Seven and one hundred forty-six thousandths d) Two hundred eight ten-thousandths 3. Write the formal name of each of the following. a) 94.78 b) 3,006.005 c) 0.0072 d) 1.09 4. Round each number to the specified place. a) Round 3,498.6173 to the nearest tenth b) Round 3,498.6173 to the nearest hundred c) Round 3,498.6173 to the nearest hundredth d) Round 3,498.6173 to the nearest whole number (that is, to the ones place) e) Round 7.2894 to the nearest thousandth f) Round 7.2894 to the nearest hundredth g) Round 7.2894 to the nearest whole number (that is, to the ones place) h) Round 36,496.1085 to the nearest thousand For more practice:
i) Round 487,512.7259 to the nearest hundred. j) Round 487,512.7259 to the nearest hundredth. k) Round 487,512.7259 to the nearest thousand. l) Round 487,512.7259 to the nearest thousandth. m) Round 487,512.7259 to the nearest hundred-thousand.
5. A chemistry student weighed a compound on a digital scale, which reported a weight of
27.32865 grams. The student must round the measurement to the thousandths place. What would that answer be?
6. Place the correct sign, either <, >, or =, in the box to make a true statement.
a) 0.105 0.305 b) 0.008 0.08
c) 0.0989 0.101 d) 0.2653 0.2663

Section 6-1: Concepts and Representation of Decimals
Page 6 - 8
7. a) Write these numbers in order of size from largest to smallest. A = .0037 B = .05 C = .046 D = .007 b) Write these numbers in order of size from largest to smallest. W = 1.0003 X = 1.002 Y = .008 Z = .0246 8. For each of the following numbers, use your estimating skills to state whether the value is
closer to 0 or to .5 or to 1. Examples: i) 0.03 " this number is very near 0. ii) .7 " the number half way between .5 and 1 is .75. this number is less than that. So .7 is closer to .5 than to 1 iii) .38 " this number is fairly close to .5. The number half way between 0 and .5 is .25, but this number .38 is closer to .5
a) 0.83 b) 0.22 c) 0.0006 d) 0.19 e) 0.92 f) 1.1 g) 0.69 h) 0.1 i) .77

Section 6-2: Addition and Subtraction of Decimals
Page 6 - 9
Section 6-2: Addition and Subtraction of Decimals Operations represented with Decimal Grids
Addition of decimal numbers can be illustrated with decimal grids. · Example A: 0.2 + 0.4
Area of size 0.2 is shaded light gray, and area of size 0.4 is shaded dark gray. The total area shaded is the sum, of size 0.6. 0.2 + 0.4 0.6
· Example B: 0.21 + 0.18
Area of size 0.21 is shaded light gray, and area of size 0.18 is shaded dark gray. The total area shaded is the sum, of size 0.39. 0.21 + 0.18 0.39
The three concepts or models of subtraction can each be illustrated with Decimal Grids. !The “Take-away” concept of subtraction
Example C: 0.8 – 0.3 Example D: 0.35 – 0.11 Shade in 0.8, Shade in 0.35 then indicate that 0.3 is taken away. then indicate that 0.11 is taken away. The result is 0.5 remains. The result is 0.24 remains.

Section 6-2: Addition and Subtraction of Decimals
Page 6 - 10
!The “Missing Addend” concept of subtraction
Example E: 0.7 – 0.4 This is the same as asking: 0.4 + ? = 0.7
Shade in 0.4. Then mark off the total of 0.7, with a dark border.
Then see how much more is needed to get the total of 0.7 The result is that 0.3 is the missing addend
(the unshaded part needed to get the total of 0.7) Example F: 0.64 – 0.47 this is the same as asking 0.47 + ? = 0.64 S
Shade in 0.47. Then mark off the total of 0.64, with a dark border.
Then see how much more is needed to get the total of 0.64.
The result is: 0.17 is the missing addend (the unshaded part needed to get the total of 0.64).
!The “Comparison” concept of subtraction Example G: 0.46 – 0.35 First shade in 0.46 (as in the first square pictured). Then in another color shade in 0.35 on top of the 0.46. (note: we shade the 0.35 on top of the 0.46 so that the two can be compared). The difference between the two areas is the answer to the subtraction. The difference is 0.11.
! Base Ten Blocks and Decimal Numbers Base ten blocks can be used to represent decimal numbers. To do this, the size of
“one whole” must be clearly specified. A typical way to do this is to make the flat represent the size of one whole. Then the other pieces have the following meanings:

Section 6-2: Addition and Subtraction of Decimals
Page 6 - 11
One, 1 one-tenth, 0.1 one-hundredth, 0.01 Using the Base Ten Blocks to represent decimals could be confusing to a child who has
used the blocks with their usual meaning where the smallest cube represents 1. It is only after the child has a lot of experience using the blocks in the usual way that it would be appropriate to use the blocks to represent decimal numbers. Perhaps in third or fourth grade the transition could be made.
Algorithm for Addition and Subtraction The traditional algorithm (that is, the step-by-step procedure) for adding and subtracting
decimal numbers is very similar to the algorithm for adding and subtracting whole numbers. The algorithms are based on the same idea: that the numbers being added or subtracted should be lined up so that digits with the same place value will be combined with each other. So, the decimal points of the two numbers should be lined up with each other so that then the tenths will line up with the tenths, the hundredths with the hundredths, and so on. And the ones place will line up with the ones, the tens with the tens, and so on.
In the addition algorithm, numbers are “carried” to the column to the left when need be.
Example H: Add 48.368 and 9.725 1 1 1
48.368 ! 4 8 .3 6 8 + 9.725 + 9. 7 2 5 5 8 .0 9 3 When two numbers to be added or subtracted do not have the same number of decimal
places, the numbers should be written so that the decimal points line up, and then any places that have no digits can be filled in with zero.
Example I: Add 17.3846 + 3.79: 1 1 1
17.3846 ! 1 7 . 3 8 4 6 + 9.79 + 9 . 7 9 0 0 2 7 . 1 7 4 6
For subtraction, when the subtraction in one column (one place value) cannot be done directly because there is a smaller number minus a larger number, then regrouping (“borrowing”) can be done from the column to the left. Example J: In the tenths place below, 8 cannot be subtracted from 3, so 1 is borrowed from the ones column. The 1 from the ones column equals 10 tenths, and combines with the 3 tenths already in the tenths column to make the total of 13 in the tenths column. Then the subtraction proceeds.
4 13 4 13
125.39 ! 1 2 5 . 3 9 ! 1 2 5 . 3 9 ! 1 2 5 . 3 9 – 73.82 – 7 3 . 8 2 – 7 3 . 8 2 – 7 3 . 8 2 7 7 5 1 . 5 7

Section 6-2: Addition and Subtraction of Decimals
Page 6 - 12
As for addition, if one of the numbers to be subtracted does not have as many decimal
places as the other, then the empty places are filled in with zeros. Example K: Subtract 8.69 – 2.4936: 9 18 9 8 10 8 10 10 5 8 1010
8.69 ! 8 . 6 9 0 0 ! 8 . 6 9 0 0 ! 8 . 6 9 0 0 ! 8 . 6 9 0 0 – 2.4936 – 2 . 4 9 3 6 – 2 . 4 9 3 6 – 2 . 4 9 3 6 – 2 . 4 9 3 6 6 4 6 . 1 9 6 4
A Game: “Coin Take Away” (practice decimal subtraction)
Materials: a collection of plastic coins that look like U.S. money coins, paper and pencil for recording money amounts
• Each player starts with one Sacajawea golden $1 coin
(or else start with two 50-cent coins). • Take turns. On your turn:
- Roll two dice (or else a spinner with 12 numbers). Add the dice numbers and take away that many cents from your money. You will probably need to “trade coins” with the “bank” of extra coins. Of course you must trade equal value amounts.
- As you take your turn, record the results. Example: $1.00
! .08 $ .92 ! .11 $ .81 Etc. • Keep playing until one player gets to zero cents – but you must get to zero
cents exactly. • Note: You may choose to roll one die rather than two on any turn. Challenge: Invent some other game that you can play with the coins # Play it. Tell others about it.
Note: Exercises for Section 6-2 are with Exercises for 6-3, following Section 6-3.

Section 6-3: Multiplication and Division of Decimals
Page 6 - 13
Section 6-3: Multiplication and Division of Decimals Multiplication of Decimal Numbers ! One model used earlier to illustrate multiplication of whole numbers was an array,
which is a rectangular shape of rows and columns. For example, here we represent 3 x 4 using an array. First, the size of “one whole” must be defined for the diagram. In this case, let represent 1 whole.
To represent 3 x 4, use an array with
3 rows of 4 squares. So, the array is 3 tall and 4 long.
The product 3 x 4 = 12 since there are 12 squares, each of size 1. Of course, an array with 4 rows of 3 squares each could have been used instead to
represent 3 x 4. ! Arrays can be used to represent multiplication of decimal numbers. The size of
“one whole” must be defined for the diagram. Usually the square representing “one whole” is somewhat large so that the smaller numbers being multiplied can be pictured without being too small to draw.
For example, let “one whole” be represented by this square:
Example A: A model to represent 0.3 x 0.4 would be an array that is 0.3 tall and 0.4 long.
The length of 0.3 along the side is three-tenths of the side of length one. ---0.4---- And the length of 0.4 along the top is four-tenths of the top length of one. 0.3
The product 0.3 x 0.4 equals the amount of shaded area, which is 12 squares each of size 0.01. Thus, 0.3 x 0.4 = 0.12 Example B: What multiplication problems are represented by the diagrams here?

Section 6-3: Multiplication and Division of Decimals
Page 6 - 14
The first diagram shows that The second diagram shows that 0.2 x 0.7 = 0.14 0.8 x 0.9 = 0.72 and that 0.7 x 0.2 = 0.14 and that 0.9 x 0.8 = 0.72
! Algorithm for Multiplying Decimal Numbers In the traditional algorithm for multiplying a decimal number by a decimal number, the two numbers are multiplied as if they were whole numbers (ignoring the decimal points at first). Then the location for the decimal point in the answer must be found. The number of decimal places in the answer equals the total of the number of decimal places in the original numbers. Example C: Multiply 0.38 x 0.6 First the numbers are multiplied, then the location for the decimal point in the product is found. 0.38 ! 0.38 The 0.38 has two decimal places and x 0.6 x 0.6 the 0.6 has one decimal place. And so the total
228 .228 is three decimal places in the product.
Note that when multiplying decimal numbers, the decimal points do NOT need to be lined up, as they must be for addition or subtraction. That is because each digit in the lower number is multiplied by each digit of the upper number, which is different than in addition where digits are added only if they are in the same place value. Also note that the reason there are three decimal positions in the answer is because
0.38 x 0.6 is x = , which is 0.228 (228 thousandths)
Example D: Find the product of 5.7 x 0.62 5.7 There is one decimal place in 5.7 and two places in 0.62 x 0.62 So the product has three decimal places. 114 342
3.534 Example E: Find the product of 0.45 x 0.09 .45 To locate the decimal point, notice that each number has two x .09 decimal places, so the total is four decimal places. 395 The result of “395” does not have four places – so a zero must be appended to the left side to make a total of

Section 6-3: Multiplication and Division of Decimals
Page 6 - 15
four places. The answer is 0.0395
Division of Decimal Numbers ! Some division problems of decimal numbers can be modeled by the “Sharing Equally” concept. In the Sharing Equally model of division, the dividend number is divided into equal sized groups, where the number of groups is the divisor number. An example with whole numbers is 6 ÷ 3. 6 items are divided into 3 groups, and the number in each group is the answer to the division.
6 items • • • • • • ! • • • • • • three groups of two. So 6 ÷ 3 = 2 The Sharing Equally model can be used with decimal numbers when the divisor is a
whole number.
Example F: 0.6 ÷ 3. To illustrate this problem, first 0.6 is pictured. Then it is divided into three equal parts or groups. The size of each part or group is the answer. The diagram below shows that 0.6 ÷ 3 = 0.2
! Example G: 0.12 ÷ 4 0.12 is shaded. Then it is divided into four groups of equal size. Each group’s size is 0.3 So 0.12 ÷ 4 = 0.3 ! The “Subtract Repeatedly” concept of division can be used to model decimal number
division problems when the dividend is larger than the divisor. Example H: Use decimal grids to model 0.8 ÷ 0.4
!
Since 0.4 can be subtracted two times from 0.8, then 0.8 ÷ 0.4 = 2

Section 6-3: Multiplication and Division of Decimals
Page 6 - 16
Example I: 0.24 ÷ 0.6 The amount 0.24 is shaded. Then parts of size 0.6 are subtracted (taken away)
Then pieces of size 0.6 are subtracted repeatedly until nothing more remains.
The number of times that 0.6 can be subtracted is 4.
So 0.24 ÷ 0.6 = 4
! The traditional algorithm for dividing decimal numbers is the method called “long
division”. The algorithm is the same as the method of long division used with whole numbers, with an additional step to determine where the decimal point is located.
Recall that the divisor of the division problem is the number written on the left of the long
division sign (or the denominator if the division is expressed as a fraction). If the divisor in the division problem is a decimal number, then both the divisor and dividend are adjusted so that the divisor becomes a whole number. This is done by moving the decimal point to the right until the divisor is a whole number – and the decimal point of the dividend must be moved the same number of places. For example, this problem:
would be adjusted by moving the decimal point two places to the right,
resulting in
We can see that it is legitimate to move the decimal point in both numbers the same number of places by rewriting the problem in fraction form:
= • =
[There is no need to rewrite the problem in fraction form to do the work. Here it was written that way one time to illustrate why it is legitimate to move the decimal point the same number of places in each number of the long division problem.] Once the decimal point has been moved, if that is needed, to make the divisor a whole number, then that new location of the decimal point in the dividend tells the location of the decimal point in the quotient. The decimal point in the quotient is directly above the decimal point of the dividend. For example
!
294 126 126

Section 6-3: Multiplication and Division of Decimals
Page 6 - 17
Multiplying by 10, 100, 1000, etc. ! Multiplying by 10 makes the number 10 times as big, which results in moving the decimal place one position to the right.
Examples: 6 x 10 = 60 487 x 10 = 4870 7.235 x 10 = 72.35
! Multiplying by 100 results in moving the decimal place two places to the right. Examples: 2 x 100 = 200 38.4567 = 3845.67 0.0789 = 7.89 ! Multiplying by 1000 results in moving the decimal place three places to the right. Examples: 7 x 1000 = 7000 6.3825 = 6382.5 0.0015 = 1.5
! This pattern continues. Multiplying by 10,000 results in moving the decimal place four places to the right. Multiplying by 100,000 results in moving the decimal place five places to the right. Multiplying by 1,000,000 results in moving the decimal place six places to the right. Examples: 8.98 x 1,000,000 = 8,980,000 45.234 x 10,000 = 452,340 678.2 x 100,000 = 67,820,000 0.00074 x 1,000,000 = 740 Note: the numbers 10, 100, 1000 etc. are called “powers of ten” since each of them
could be expressed as a power of ten as shown here:
101 = 10
102 = 100
103 = 1000
104 = 10,000
105 = 100,000
106 = 1,000,000
107 = 10,000,000
Notice the pattern: the exponent (the power) of ten equals the number of zeros.
Summary for Multiplying by 10, 100, 1000, etc
When a number is multiplied by a power of ten, the number of places that the decimal point is moved right equals the number of zeros in the power of ten. This also equals the exponent of ten if the number is written in exponential form.

Section 6-3: Multiplication and Division of Decimals
Page 6 - 18
Sections 6-2 and 6-3: Exercises on Operations with Decimals NOTE: there are pages of decimal grids at the end of these exercises, in case you want to
use them.. 1. a) Represent 0.3 + 0.5 on a decimal grid. Write the resulting sum. b) Represent 0.27 + 0.18 on a decimal grid. Write the resulting sum. c) Represent 0.2 + 0.33 on a decimal grid. Write the resulting sum. 2. a) Represent 0.65 – 0.24 using the Take Away model. Write the result. b) Represent 0.7 – 0.34 using the Missing Addend model. Write the result. c) Represent 0.48 – 0.21 using the Comparison model. Write the result.
3. Do the following computations without a calculator.
a) 745.08 b) 8279.136 c) 821.13 d) 127.3916 + 426.77 + 345.148 ! 470.81 ! 83.1274
e) 17.382 + 4.29 f) 28.5 – 9.187 g) 1.005 + 18.6 – 5.24 4.a) Make a diagram of an array that represents the result of 0.3 x 0.6, and write the
product. b) Make a diagram of an array that represents 0.4 x 0.9, and write the product.

Section 6-3: Multiplication and Division of Decimals
Page 6 - 19
5. a) Use the “Sharing Equally” concept of division to represent 0.20 ÷ 5. And write the
quotient. b) Use the “Subtract Repeatedly” concept of division to represent 0.35 ÷ 0.07 . And write
the quotient. c) Use the “Subtract Repeatedly” concept of division to represent 0.35 ÷ 0.05 . And write
the quotient. 6. Do the following computations without a calculator. a) 0.35 x 0.7 b) 7.9 x 8.2 c) 0.008 x 1.6
d) 0.04 x 0.09 e) 17.5 x 0.03 f) 0.12 x 0.68 g) 1.91 ÷ 5 h) 6.12 ÷ 3.4 i) 0.3565 ÷ 0.23
7. Do the following computations without a calculator. a) 7 x 100 b) 82 x 1000 c) 7.23 x 100
d) 567.234 x 10 e) 48.2 x 1000 f) 7 x 10,000 g) 567.234 x 1,000,000 h) 246.3 x 100 i) 0.0076 x 10

Section 6-3: Multiplication and Division of Decimals
Page 6 - 20
Decimal Grids

Section 6-3: Multiplication and Division of Decimals
Page 6 - 21
Decimal Grids

Section 6-4: Converting Between Decimals and Fractions
Page 6 - 22
Section 6-4: Converting between Decimals and Fractions Terminating Decimals, Repeating Decimals,
and Non-terminating, Non-repeating Decimals ! Most of the decimals used in applications are terminating decimals, which means that the decimal stops (that is, terminates) on the right-hand side. For example, 17.3, 0.0052, and 1.43 are all terminating decimals. In a terminating decimal, we can count how many digits there are in the decimal because there are a finite number. (Finite indicates that there are a certain number of digits; it is the opposite of “infinite.”) All the decimals used thus far in this chapter have been terminating decimals. ! Some decimals are repeating decimals, which means that a certain set of digits is repeated over and over in the decimal, going on to the right infinitely long. For example, the decimal 0.72727272727272727272… The “…” at the end indicates that the repeating pattern is to continue on to the right without end. The three dots at the end of a decimal is one way to indicate that the decimal continues on forever with the same pattern. But this way of indicating a repeating decimal is not the best one because in some cases it might not be entirely clear what the repeating set of digits is, and the decimal number might have to be quite long when written. A better way of writing a repeating decimal is by using the over-bar notation. In this notation, a horizontal bar (or line) is drawn above the digits that are repeating. In the
over-bar notation, the decimal above would be written (Note that both the 7 and the 2 under the bar.) More examples of repeating decimals:
= 0.21515151515… the over-bar was only above the 15, not the 2
= 0.666666666…
= 0.142857142857142857… (Note: The three dots in a row “…” are called an ellipsis. The ellipsis is used in other contexts too. In general an ellipsis indicates that something is missing or is not being stated. In the case of a repeating decimal, the ellipsis indicates something is missing AND that the missing part follows the pattern that precedes it.) ! Some decimals are not terminating and also not repeating. One example of such a decimal is the number , called pi. You may recall that = 3.14 approximately, but that is not an exact value. The decimal for actually continues on forever to the right, and it does not have a repeating pattern (there is no set of digits that repeats over and over). If you want to see the first 10,000 digits of , look at http://www.math.utah.edu/~pa/math/pi.html . There are many other decimals that are non-terminating and non-repeating, though they do not have special names as does . Here is a decimal that has a pattern, but it does not have a repeating pattern. There is no set of digits that you could put the over-bar over to say that they repeat over and over: 0.010010001000010000010000001…

Section 6-4: Converting Between Decimals and Fractions
Page 6 - 23
A decimal that is non-terminating and non-repeating is called an “irrational number”. That is a technical term indicating that these sorts of decimals cannot be written as ratios (a ratio is a fraction). It says nothing about how crazy they are.
Converting between decimal and fraction forms of numbers " Rewriting terminating decimals as fractions
! Every terminating decimal number can be rewritten in fraction form. If you know the formal name of the decimal (as described earlier) then you can write the decimal in fraction form. For example, 0.379 is “three hundred seventy-nine thousandths”, so the
fraction form of the number is to write the fraction with that same name: .
When a decimal is converted to fraction form, the fraction might then need to be rewritten in lowest terms.
Exercises: a) Rewrite 0.35 as a fraction b) Rewrite 0.0214 as a fraction
Solutions: a) 0.35 is thirty-five hundredths = = =
b) 0.0214 is two hundred fourteen ten-thousandths = = =
! If a decimal number has a whole number part, then it can be rewritten as a mixed number. If desired, the mixed number could then be rewritten as an improper fraction.
For example, 25.7 is twenty-five and seven tenths, so it can be written as 25 . Then
that mixed number could be rewritten as the improper fraction .
Exercises: a) Rewrite 1.347 as a mixed number. b) Rewrite 12.3 as an improper fraction
Solutions: a) 1.347 is one and three hundred forty-seven thousandths = 1
b) 12.4 is twelve and four tenths = 12 = 12 =
! Rewriting fractions in decimal form
! Every fraction can be rewritten as a decimal. To rewrite the fraction as a decimal, the division indicated by the fraction line should be done, either as a long division or else on a calculator. If a calculator is used, the results might be approximate rather than exact because the calculator can display only a certain number of digits of the answer. Most calculators round to get the final digit in the display.
Remember how to rewrite fractions as division problems:
"! "! numerator ÷ denominator
Example A: Rewrite as a decimal.

Section 6-4: Converting Between Decimals and Fractions
Page 6 - 24
! [Notice that to do the long division, zeros are appended
64 at the end of the whole number 7 after its decimal point.] 60 56 40 40
Conclusion: = 0.875
Example B: Rewrite as a decimal.
! …
33 In this division, a pattern is established. 70 This division will never end. More zeros can be 66 appended to the dividend, and the pattern will 40 continue. Both the 3 and the 6 repeat endlessly. 33 70 66 40
Conclusion: =
! When a fraction is rewritten as a decimal, the decimal will either be a terminating
decimal (such as = 0.875) or else a repeating decimal (such as = ).
How can we be sure the decimal representation of the fraction will terminate or repeat? Because of the way that long division works, as explained here: a) In the long division algorithm, after a digit is written in the quotient, then that digit is multiplied by the divisor and that number is written down. Then there is a subtraction. The answer to that subtraction must be smaller than the divisor. If it is not smaller, then that means the division was done wrong, and that a different digit should be in the quotient – and so you’d go back and fix the problem until that result of the subtraction is smaller than the divisor. b) Since that result of the subtraction must be smaller than the divisor, that means there are only so many different numbers that can be the result of the subtraction. For example, if the divisor is 7, then the results of that subtraction step in the long division can be either 1, 2, 3, 4, 5, or 6 – but it cannot be any other number. As another example, if the divisor were 43, then the results of the subtraction could be any number from 1 to 42, but nothing else. c) When doing the long division to find the decimal equivalent of a fraction, perhaps the division will terminate (when it “comes out even” leaving a zero remainder and so the division has ended) – and then the decimal is a terminating decimal. But what if it does not terminate? Then it keeps going and there are more and more of the subtractions. But the results of those subtractions eventually must repeat since there

Section 6-4: Converting Between Decimals and Fractions
Page 6 - 25
are only so many numbers that the subtraction result can be. When the subtraction result is a number that has occurred before, then the decimal pattern will start repeating! So we can be sure that the decimal will have a repeating pattern. Example C: Here is the long division to find the decimal equivalent of 1/7 :
The result of the subtraction must be less than the divisor 7.
7 30 " 3 is result of subtraction 28 20 " 2 is result of subtraction 14 60 " 6 is result of subtraction 56 40 " 4 is result of subtraction 35 50 " 5 is result of subtraction 49 10 " 1 is result of subtraction " at this point, every number 1, 2, 3, 4, 5, 6 7 has occurred as result of subtraction! The next must be a repeat! 3 3 is repeated result of subtraction
Conclude: =
! Some common fractions rewritten as decimals:
The fraction 1/3 ! So 1/3 = 0.33333… =
9 10 9 10 9 1
Using long division we can find that the fraction 2/3 = 0.66666… =
Remember these results: = and =
! Caution about using a calculator to find decimals equivalent to fractions: If you use a calculator to find the fraction 2/3 as a decimal, you would enter 2 ÷ 3. Some calculators would then display 0.6666666, but other calculators would display 0.6666667 The reason that the 7 is at the end is that the actual answer is 0.6666666666666… but the calculator can only display the first seven digits, and so then it rounds to that decimal place (which in this case means rounding the 6 up to a 7). When you use a calculator to find the decimal form of a fraction, you must keep in mind that the final digit displayed might be a rounded digit. And also keep in mind that the answer displayed is probably not exact, because the exact answer has more decimal places (perhaps infinitely many) and the calculator can only display some of them.
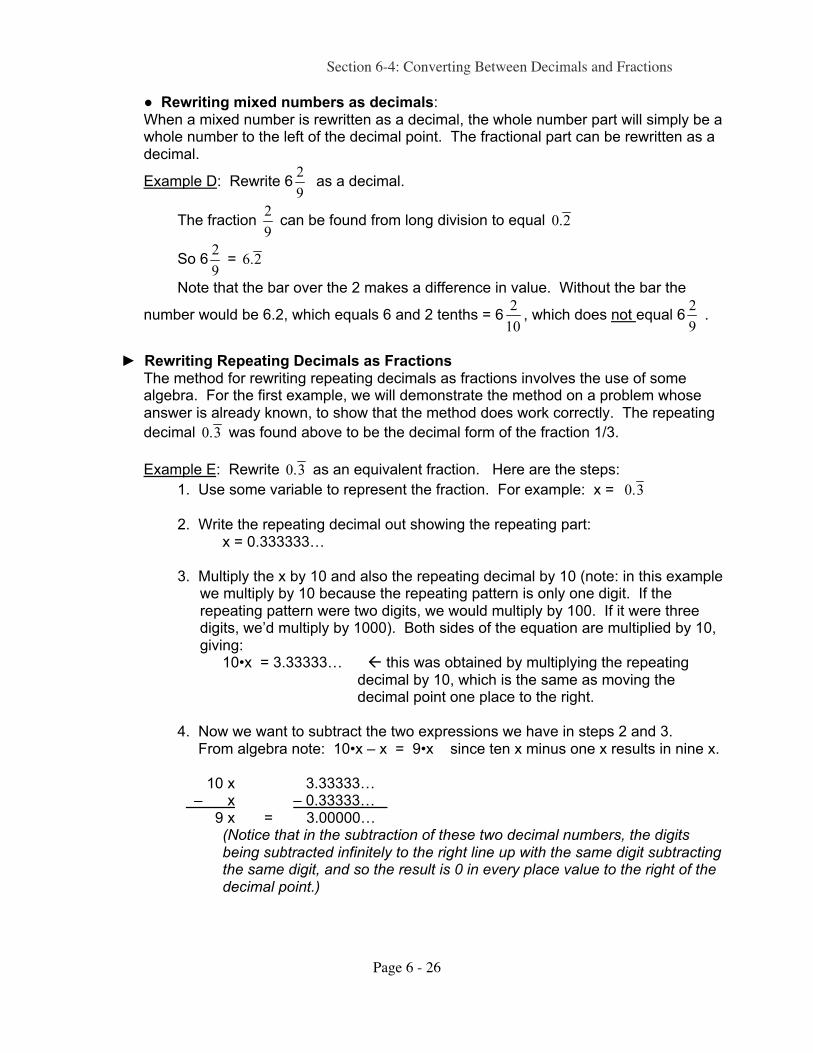
Section 6-4: Converting Between Decimals and Fractions
Page 6 - 26
! Rewriting mixed numbers as decimals: When a mixed number is rewritten as a decimal, the whole number part will simply be a whole number to the left of the decimal point. The fractional part can be rewritten as a decimal.
Example D: Rewrite 6 as a decimal.
The fraction can be found from long division to equal
So 6 =
Note that the bar over the 2 makes a difference in value. Without the bar the
number would be 6.2, which equals 6 and 2 tenths = 6 , which does not equal 6 .
! Rewriting Repeating Decimals as Fractions
The method for rewriting repeating decimals as fractions involves the use of some algebra. For the first example, we will demonstrate the method on a problem whose answer is already known, to show that the method does work correctly. The repeating
decimal was found above to be the decimal form of the fraction 1/3.
Example E: Rewrite as an equivalent fraction. Here are the steps:
1. Use some variable to represent the fraction. For example: x = 2. Write the repeating decimal out showing the repeating part: x = 0.333333…
3. Multiply the x by 10 and also the repeating decimal by 10 (note: in this example we multiply by 10 because the repeating pattern is only one digit. If the repeating pattern were two digits, we would multiply by 100. If it were three digits, we’d multiply by 1000). Both sides of the equation are multiplied by 10, giving:
10•x = 3.33333… " this was obtained by multiplying the repeating decimal by 10, which is the same as moving the decimal point one place to the right. 4. Now we want to subtract the two expressions we have in steps 2 and 3. From algebra note: 10•x – x = 9•x since ten x minus one x results in nine x. 10 x 3.33333… – x – 0.33333… 9 x = 3.00000… (Notice that in the subtraction of these two decimal numbers, the digits
being subtracted infinitely to the right line up with the same digit subtracting the same digit, and so the result is 0 in every place value to the right of the decimal point.)

Section 6-4: Converting Between Decimals and Fractions
Page 6 - 27
5. From step 4 we see that 9•x = 3
6. To determine x, divide both sides of that equation by 9: =
7. Simplify those expressions. Since 9/9 equals one, the left side equals x. And the right side in lowest terms equals 1/3.
8. Conclude: x =
Since x was our original repeating decimal, we conclude that:
=
Notice that this is correct, since we already knew that =
Example F: Rewrite as an equivalent fraction. Here are the steps:
1. Use a variable to represent the fraction. For example: x = 2. Write the repeating decimal out showing the repeating part: x = 0.454545…
3. Multiply both sides of the equation by 100 (note: we multiply by 100 in this case because there are two digits in the repeating pattern).
100•x = 45.454545… " this was obtained by multiplying the repeating decimal by 100, which is the same as moving the decimal point two places to the right. 4. Now we want to subtract the two expressions we have in steps 2 and 3. From algebra note: 100•x – x = 99•x
since one hundred x minus one x results in ninty-nine x.
100 x 45.454545… – x – 0.454545… 99 x = 45.000000… (notice that in the subtraction of these two decimal numbers, the digits
being subtracted infinitely to the right line up with the same digit subtracting the same digit, and so the result is 0 in every place value to the right.)
5. From step 4 we see that 99•x = 45
6. To determine x, divide both sides of that equation by 99: =
7. Simplify those expressions. Since 99/99 equals one, the left side equals x.
And the right side can be simplified: = =
8. Conclude: x =
Since x was our original repeating decimal, we conclude that:
=

Section 6-4: Converting Between Decimals and Fractions
Page 6 - 28
Example G: If the repeating decimal has one or several digits that do not repeat before the repeating pattern starts, then in Step 3 we need to carefully determine which power of 10 to multiply by (10 or 100 or 1000 or etc.) The goal is to multiply by a number so that the digits that go off infinitely to the right will line up with (match) the digits in the same place value positions as the original number. The digits do not need to match in the first places, but they must match eventually and then match infinitely to the right.
Rewrite as an equivalent fraction. Notice that the 7 does not repeat. Only the 68 repeats since the bar is only on top of the 68.
Here are the steps:
1. Use some variable to represent the fraction. For example: x = 2. Write the repeating decimal out showing the repeating part: x = 0.7686868…
3. Multiply both sides of the equation by some power of ten. Since there are two repeating digits under the bar, multiply by 100 (which is the second power of
10, 102).
x = 0.7686868 … 100•x = 76.8686868… " starting in the hundredths place, the digits do line up. So this is a good expression to use.
4. Now we want to subtract the two expressions we have in steps 2 and 3. From algebra note: 100•x – x = 99•x
since 100 x minus one x results in 99 x.
100 x 76.8686868… – x – 0.7686868 … 99 x = 76.100000…
5. From step 4 we see that 99•x = 76.1
6. To determine x, divide both sides of that equation by 99: =
7. Simplify those expressions. Since 99/99 equals one, the left side equals x.
And the right side can be simplified: = =
8. Conclude: x =
Since x was our original repeating decimal, we conclude that:
=

Section 6-4: Converting Between Decimals and Fractions
Page 6 - 29
Summary of Rational, Irrational, and Real Numbers Rational numbers are numbers that can be expressed as a fraction with whole numbers (positive or negative) in the numerator and denominator. • Every fraction can be converted to a decimal that is either terminating or repeating. • Every terminating decimal and every repeating decimal can be converted to a fraction. • Decimals that terminate or repeat are rational numbers. Irrational numbers are not rational. An irrational number can NOT be expressed as a fraction with whole numbers (positive or negative) in the numerator and denominator. • Decimals that are non-terminating and non-repeating are irrational numbers. • Decimals that are non-terminating and non-repeating can NOT be expressed as a fraction. Real Numbers are the combination of all rational and all irrational numbers. • Every Real Number can be expressed as a decimal (either terminating, repeating, or non-terminating-and-non-repeating). • Every decimal number is a Real Number.
Real Numbers
Rational Numbers • can be expressed as fractions
• can be expressed as terminating or repeating
decimals
Irrational Numbers • can be expressed as non-terminating, non-repeating
decimals

Section 6-4: Converting Between Decimals and Fractions
Page 6 - 30
Section 6-4: Exercises on Converting between Decimals and Fractions 1. Rewrite each decimal as a fraction or mixed number, in lowest terms. a) 0.7 b) 0.6 c) 0.29 d) 0.55 e) 0.371 f) 0.008 g) 3.47 h) 6.127 i) 0.0007 j) 0.1234 k) 9.009 2. It is important to be familiar with how to rewrite common fractions in decimal form.
Complete this table to show the fraction (in lowest terms) and decimal forms of common fractions. If the decimal is a repeating decimal, write it with over-bar notation.
Fraction Decimal
0.75
0.4
0.8
3. Use a calculator if you like. But you might need to do some long division also to be sure
of the repeating patterns. Find the decimal form for each of these fractions or mixed numbers. If it is a repeating decimal, write it with over-bar notation.
a) b)
c) d)

Section 6-4: Converting Between Decimals and Fractions
Page 6 - 31
e) 4 f) 7
4. Rewrite each of these repeating decimals as an equivalent fraction.
a) , which is 0.33333… b) , which is 0.444444….
c) , which is 0.494949494… d) , which is 0.12121212…
e) challenge: , which is 0.731313131….
f) challenge: , which is 0.4654654654…

Section 6-5: Applications of Decimals
Page 6 - 32
Section 6-5: Applications of Decimals
Example A: Molly makes $10.50 per hour, except that on Sundays her pay rate is 1 times
as much. One week Molly worked 32 hours on Tuesday through Saturday and 8 hours on Sunday. How much money did she earn?
Solution: Molly made $10.50 per hour for 32 hours. Multiply 10.50 x 32 = 336. So Molly
made $336 for the Tuesday – Saturday work.
To find the pay rate for Sunday, multiply 1 x 10.50. To do that, it is probably easier to
convert the 1 to a decimal first. 1 = 1.5. So 1 x 10.50 = 1.5 x 10.50 = 15.75.
Molly’s pay rate on Sundays is $15.75 per hour. She worked 8 hours Sunday so that pay is $15.75 x 8 = 126. Finally, add together Molly’s pay for Tues-Sat and for Sunday: 336 + 126 = 462. Molly earned $462 that week.
Example B: Juanita weighed her baby on the scale at home and saw that he weighed 12
pounds. At the doctor’s office on the digital scale the baby weighed 12.45 pounds. What is the difference in those two weights?
Solution: To find the difference we will subtract the numbers. But first they should be written
in the same format (either both written as mixed numbers or both written as decimals).
Let’s rewrite 12 as a decimal. Since # = 0.25, 12 = 12.25.
Next we subtract 12.45 – 12.25 = 0.2 The difference in the weights is 0.2 pounds.

Section 6-5: Applications of Decimals
Page 6 - 33
Section 6-5: Exercises on Applications of Decimals
1. Michelle estimated the weight of her bag of apples as 5 pounds. The digital scale at
the checkout said they weighted 6.217 pounds. How far apart was the estimate from the scale weight?
2. Ken spent $45.73 on shoes and $37.65 on a dress shirt. He started the day with $100 in
his pocket. How much did he have left after these purchases? 3. The plumber charges $55.20 per hour plus a $45 “traveling fee”. He worked at my house
for 3 hours. What was the total bill? 4. At the meat packing plant Joe makes $12.30 per hour for regular work, and “time and a
half” for hours over the first forty hours in the week (that means, his rate of pay is one and a half times his normal rate of pay for each hour he works after forty hours). Last week Joe worked 46 hours. What was his pay?
5. A mother bought identical pairs of gloves for each of her three sons. The gloves cost
$53.43 total. How much did each pair cost? 6. The unit used for measuring electricity use is the kilowatt-hour. This is the amount of
electric energy needed to operate 1000 watts of equipment for one hour. For example, if ten 100 watt light bulbs are on for one hour, they use 10 x 100 = 1000 watts of energy in that hour, and that is the same as using 1 kilowatt-hour.
a) In an “average” home, it takes about 16.2 kilowatt-hours per month to run the microwave. If electricity costs $.07 per kilowatt-hour, how much does it cost to run the microwave for a month?
b) A regular refrigerator uses about 96.8 kilowatt-hours per month while a frost-free refrigerator uses about 165.6 kilowatt-hours per month. Electricity costs $.07 per kilowatt-hour. How much more money does it take to run a frost-free refrigerator for a month rather than a regular refrigerator?
7. At the 2008 summer Olympics in Beijing, the following times were recorded for the
winning swimmers in these races: 200 m freestyle, 1:42.96 (that is, 1 minute and 42.96 seconds), Michael Phelps, U.S. 100 m freestyle, 47.05 seconds, Eamon Sullivan, Australia 100 m backstroke, 52.54 seconds, Aaron Peirson, U.S. a) How much faster did Sullivan swim the freestyle than Peirson swam the backstroke? b) Of course a person can swim 100 meters at a faster rate than he can maintain for 200
meters. If Sullivan could swim 100 meters freestyle in his winning time, and then 100 meters again in that same amount of time – would that be more or less time than Phelps swam the 200 meters freestyle? How much different is the time? [hint: to answer this problem, you need to know how many seconds are in a minute.]
8. a) What are some ways that our system of decimals and our system of money in the
United States are alike? b) What are some ways in which these systems are different?

Section 6-5: Applications of Decimals
Page 6 - 34
9. “Normal body temperature” is said to be 98.6 degrees Fahrenheit (F). a) If Kim’s temperature is 99.7 F, how much above normal is it? b) If Tony’s temperature is 98.4 F, how much below normal is it? c) If Juan’s temperature is 103.2 F, is it above or below normal? By how much?
d) If Laura’s temperature is 97.3 F, is it above or below normal? By how much? 10. a) Walnuts cost $6.59 per pound. How much do 3 pounds cost? b) Candy bars are on sale for $0.59. How much do 8 of them cost? c) How much do 12 of the candy bars cost? 11. Find at least two examples of decimals in printed media, such as newspapers,
magazines, or pamphlets. Create at least two application or word problems based on the decimal number information on your examples. Answer your problems

Chapter 7: Introduction
Page 7 - 1
Chapter 7 Percents
A morning at home …
It was a Monday morning, and Mona walked into her kitchen to have breakfast. She turned on the radio just in time to hear the DJ announce, “The weather today will see a high of 54 degrees, with an 80% chance of rain.” As she ate, she looked at the milk cartoon. The milk on her cereal would give her 30% of the calcium RDA (recommended daily allowance). Her nutritionist friend Sheila said to be sure she got at least 100% of the RDA. So Mona planned to take two calcium pills – they each gave her 33%, and then she’d have some cheese for lunch – that would get her over 100%. Her son, Derek, walked into the kitchen, waving a piece of paper. “Mommy, you need to check my spelling homework,” he said. Mona took the paper and went through the spelling words. “Okay… Great, you got 8 out of 10 – that’s 80% right. Nice improvement.” Derek’s father, Tony, prepared him a bowl of cereal and poured him a glass of juice. Since it was a large glass, he filled it only about 60%. Back at the table, Tony read aloud from the newspaper. “’The city is limiting most employees to a 1% raise.’ Doesn’t Jim next door work for the city? I hope he can keep up with his mortgage payments. He was just telling me his interest rate is going up to 8.3% next month.” Mona replied, “It might be tough for them, but his partner mentioned last week how happy he was that his business sales increased 10% last year. They should be okay for now.” Derek asked, “Dad, can we get me new sneakers this week?” Tony checked the ads in the paper. “You’re in luck. The Shoe Shop has a sale for 30% off this weekend, so let’s go on Saturday.” Mona, now reading the paper herself, said “Honey, this article says that new cholesterol drug resulted in 20% fewer deaths from heart disease. We really should tell your Dad about that.” “Great idea. He always worries about the cost since his insurance pays only 70% of prescription costs. If he could reduce his weight by 15%, maybe he could get off the drug. I’ll talk with him about a gym membership. Last week I saw a sign in the gym window saying that if two people in a family join, the cost is reduced 25%, so maybe Dad and Mom will both join. They always like a bargain.” As Derek picked up his soccer gear to take to school, he said excitedly, “I forgot to tell you last night. We voted for the most valuable soccer player – and Pedro got 75% of the vote! I voted for him because he’s awesome. He makes like almost all our goals, and he runs so fast!” “I’ll be sure to look out for him at your game tomorrow,” Mona said, picking up her purse and giving Derek a kiss. “I have to go. Remember your jacket; there’s an 80% chance of rain today.”
Percents related to elementary school curriculum and teachers
Marilyn Burns writes about percents and elementary school students:
“Students have many experiences with percents before they study them formally in school. They know that a 50% sale means that prices are cut in half and that a 10%

Chapter 7: Introduction
Page 7 - 2
sale doesn’t give as much saving. They understand what it means to earn a 90% grade on a test. They hear on TV that some tires get 40% more wear, that a tennis player gets 64% of her first serves in, that there is a 70% chance of rain tomorrow. Common to these sorts of experiences is that percents are presented in the context of situations that occur in students’ daily lives.” (Burns 2000: 245)
The National Council of Teachers of Mathematics includes percents in the Number and Operations content standard. The standards for grades 3 – 5 mention percents in this expectation “recognize and generate equivalent forms of commonly used fractions, decimals, and percents”. The NCTM Curriculum Focal Points mentions percents for the first time in the expectations related to the grade 6 focal points. These expectations are:
“ • Work flexibly with fractions, decimals, and percents to solve problems, • Compare and order fractions, decimals, and percents efficiently and find their approximate locations on a number line”.
(from http://nctm.org/standards/content.aspx?id=12392 ). Percents and their applications are also in the grades 7 and 8 expectations.
Although percents are not in the curriculum for young children (age 0 to 8), it is nonetheless essential for teachers of young children to be comfortable with percents and their applications. Teachers need to understand percents so they can read professional articles intelligently. Articles may cite percents when discussing research-based changes to developmentally appropriate practices. Assessments of students may involve percents. Teachers who also help with administration of a center will need to apply percents in financial planning, planning of nutritious meals, and in following various state regulations. In addition, of course teachers will use percents in many aspects of their personal lives (financial, shopping, nutrition, medical, etc.).

Section 7-1: Concept and Representation of Percents
Page 7 - 3
Section 7-1: Concept and Representation of Percents Meaning of Percents ! The word percent means “per hundred”, or “out of 100”. [“Cent” comes from a Latin word
meaning 100. Notice that a century is 100 years. There are 100 cents in a dollar. The French word for 100 is “cent”.]
Percents are ways of representing fractions with denominators of 100.
Examples: 23% = , which could also be expressed in decimal form as 0.23
= 71% Thirty-five hundredths = 0.35 = = 35%
• You know that a fraction that is part of a whole means that the whole is divided into equal
parts, and we are interested in some of the parts. For example, " means the whole is divided into 4 equal size parts, and we are interested in 3 of the 4 parts.
• To use percents to talk about part of a whole means that the whole is divided into 100
equal size parts, and we are interested in some of the parts. For example, 23% means we think of the whole as being divided into 100 equal size parts, and we are interested in 23 of the parts. 23% of the first square is shaded. 23% of the second square is shaded.
23% or 23% or
1% is a small part of the whole 100% is all of the whole
1% 100%
0.01 1.0
• It is convenient to use a 10 by 10 grid of 100 squares to illustrate percents (like above), but
it is not necessary to use that shape. The rectangle below has five rows of 20 columns, which is 100 subparts total.

Section 7-1: Concept and Representation of Percents
Page 7 - 4
20 out of 100 parts are shaded 20% is shaded
= is shaded
0.20 is shaded
• Half of the triangle here is shaded. If the triangle were
divided into 100 equal sized parts, 50 of them would be shaded. So 50% of the triangle is shaded.
• Sometimes it is a bit harder to determine the percent of a figure that is shaded.
! What percent of the outer square is shaded? The outer square has been divided into 100 equal little squares. Some of the shaded part covers entire small squares – there are 15 small squares that are totally shaded. Some of the shaded parts cover partial squares. In this picture there are six half-size-squares shaded, which equals 3 whole squares. The total shaded is 15 + 3 = 18 smalls squares.
Thus 15% of the figure is shaded. • Sometimes the percent shaded can only be estimated.
What percentage of the square is covered by the heart shape? It is easier to make that estimate using the diagram on the right where the square is divided
into 100 equal small squares. Determine how many small squares are shaded by counting the ones that are entirely shaded, and then estimating what parts of other squares are shaded. (You might find a couple partially-shaded squares that together look like they would equal one square. Or you might see a partially-shaded square and estimate what fraction of the square is shaded, and then add together the fractional parts.)
Solution: About 14% to 16% of the big square is covered by the heart.

Section 7-1: Concept and Representation of Percents
Page 7 - 5
Practice Problems: Find the percent of the square shaded in each of the following diagrams. a) b) c)
Solutions to Practice Problems: a) 6 whole-small-squares + 6 half-small-squares = 6 + 3 = 9 small squares. So 9% is
shaded. b) The shaded part comprises exactly half of the outer square (if this is not clear, think about
drawing a vertical line down the center and a horizontal line across the center). So 50% is shaded. (You could count the whole squares and half-squares shaded and see
that the total is 50 squares.) c) estimate partial shaded parts. About 22% to 25% is shaded.
Representing Percents using Base Ten Blocks
Base Ten Blocks can be used to represent percents. A straight forward way to do this is to have the flat piece represent “one whole”. flat
! represents one whole
Then the small cube pieces each represent 1% of the whole, and a long represents 10% of the whole.
!represents 1%
! represents 10%
Percent Applications – Solved Using Diagrams There are several approaches that can be used in solving applications involving percents. It is valuable to be familiar with many techniques so you can use the most convenient one in each situation. The technique described in the examples below involves using a diagram of a 100-square grid to represent “the whole thing” – whatever it is in the situation that is the 100%. In each situation one must determine what “the whole thing” is. It is the “base” of the percents, the whole thing that the percents are part of.
c)

Section 7-1: Concept and Representation of Percents
Page 7 - 6
Example A: There are 300 students in the child care center. 8% of them are out sick one day. How many are out sick?
Picture the 300 students as “one whole thing” and divide it into 100 equal sized parts (pictured as the 10 x 10 grid). So, think of 300 students being “spread out evenly” under this 100-square grid.
a) If this grid represents all 300 students, how many students are represented by each small square? ____________
b) Shade in 8 of the 100 squares to represent the 8% out sick.
c) How many students are represented by the 8 squares shaded? _________
d) How many students were out sick that one day? _________
e) How many students were not out sick that one day? _________
f) What percent of students were not out sick that
one day? _________ Note: Solutions for Examples A to D are after Example D.
Example B: The library has 540 books. 15% of them are math books. How many are math books?
a) If this grid represents all 540 books, how many books are represented by each small square? ____________
Think of the 540 books spread out evenly under this grid.
b) Shade in 15 of the 100 squares to represent the 15% that are math books.
c) How many math books are represented by the 15 squares shaded? _________ d) How many math books are in the library? _________ e) How many books in the library are not math books? _________ f) What percent of the books in the library are not math books? ________ Example C: This grid represents all the shirts in a store. 26% of the shirts are blue. Shade in 26 small squares to represent the shirts in the store that are blue.
a) The store has 13 blue shirts. If the 13 blue shirts are “spread out” over the 26 shaded squares, how many shirts are represented by each small square? __________

Section 7-1: Concept and Representation of Percents
Page 7 - 7
b) How many shirts are in the store? (this would be the number of shirts represented by all 100 squares) __________ c) What percent of the shirts in the store are not blue? __________ Example D: The elementary school has 248 students this year, which is 124% as many
students as it had last year.
a) Let one grid of 100 squares represents the students at the school last year. Shade in the 124%, which represents the students at the school this year.
b) Since those shaded squares represent 248 students, how many students are represented by 1 square?
_______
c) How many students were at the school last year? __________ Solutions to Examples Example A: a) 300 students spread evenly over 100 squares " each square represents 3 students b) shade in 8 squares c) 8 squares, each represents 3 students " 24 students are represented by the 8 squares d) 24 students were out sick (the ones represented by the 8 squares) e) Out of 300 students, 24 were out sick. So 300 – 24 = 276 were not out sick. f) Since 8% of students were out sick, and 100% is all the students,
then 100% - 8% = 92% were not out sick. Example B: a) the 540 books are spread evenly over 100 squares – each square represents 5.4 books b) shade 15 of the squares c) each square represents 5.4 books. The 15 shaded squares represent 15 x 5.4 = 81 books d) the 15 shaded squares represent the math books, so there are 81 math books in the library e) there are 540 books total, and 81 are math books, so 540 – 81 = 459 books are not math books f) since 15% of the books are math books, the rest must comprise 100% - 15% = 85%
that are not math books Example C: a) 13 blue shirts are spread out over 26 squares. Notice that 26 is 2 • 13. Each shirt takes up two squares. So each square represents # of a shirt. Check: # of a shirt • 26 squares = 26/2 shirts = 13 shirts b) The whole store is represented by the 100 squares, and each square represents # of a shirt. So the whole store has 50 shirts. c) Since 26% of the shirts are blue, then 100% – 26% = 74% of the shirts are not blue. Example D: a) shade in one full grid of 100 squares and also 24 squares from the other grid

Section 7-1: Concept and Representation of Percents
Page 7 - 8
b) 124 shaded squares represent 248 students. Notice that 248 students separated into 124 “squares” would give 2 students in each square, because 248 ÷ 124 = 2 c) Last year’s students are represented by one grid of 100 squares. Each square represents 2 students. So the 100-square grid represents 100 • 2 = 200 students. The school had 200 students last year.
Common Fractions and their equivalent percents and decimals It comes in handy to be very familiar with the common fractions and to know how to express them in decimal or percent form. Diagrams can help make these quantities clear. In these diagrams, the whole square represents “one whole”.
One-half:
= 50% = 0.5
other equivalent forms:
or
One-fourth: Three-fourths:
= 25% = 0.25 = 75% = 0.75
other equivalent form: other equivalent form:
One-fifth: Two-fifths:
= 20% = 0.2 = 40% = 0.4 other
equivalent forms: equivalent forms:
or or
Three-fifths: Four-fifths:
= 60% = 0.6 = 80% = 0.8
equivalent forms: equivalent forms:
or or

Section 7-1: Concept and Representation of Percents
Page 7 - 9
One-Third For one-third , the diagram is a bit more difficult to shade since 100 squares don’t divide evenly into three parts. Ninety squares would divide nicely into three equal parts, so first we will divide ninety squares into three equal parts.
Each of the three equal parts has 30 squares (shaded in light, medium, and dark grey). And there are ten more squares to shade. Ten doesn’t divide evenly into three parts, But nine squares would divide into three parts so we do that next.
There are now thirty-three squares shaded light grey,
Thirty-three squares shaded medium grey, and Thirty-three squares shaded dark grey. And there is one square left to be divided into three equal parts. Each of the three shadings will take up 1/3 of that last square.
(that part is not pictured – imagine it) Then the total shaded light grey is 1/3 of the whole, the total shaded medium grey is 1/3, and the total shaded dark grey is 1/3.
The number of squares, out of 100, shaded light grey is 33 squares, the number
shaded medium is grey 33 , and the number shaded dark grey is 33 .
The number of squares shaded light is of the whole, and it is 33 out of 100 squares,
and so = 33 %.
We earlier found the decimal form of = 1 ÷ 3 = 0.333333… =
! In summary: = 33 %. =
Other equivalent forms: = % =
Two-thirds is twice as large as one-third. Two thirds of the diagram above contains 66
small squares, and thus is 66 % of the whole.
! In summary: = 66 %. =

Section 7-1: Concept and Representation of Percents
Page 7 - 10
Other equivalent forms: = % =
! Rounding: One-third and two-thirds are often rounded when they are written as percents. 1/3 is approximately 33% 2/3 is approximately 67%
Relating Fractions to Percents in Diagrams
Sometimes we know the fractional part of a “whole thing” that we are interested in, and we need to express it as a percentage. Here we have diagrams where it is easy to determine what fraction is shaded. We can use that information to state what percent of the diagram is shaded.
Practice Problems: What percent of each diagram is shaded? What percent is not shaded? a) b) c)
Solutions to Practice Problems:
a) " is shaded, which is equivalent to 75%. b) 1/3 is shaded, which equals 33 %.
c) 3/5 of the diagram is shaded, which is 60%

Section 7-1: Concept and Representation of Percents
Page 7 - 11
Section 7-1: Exercises on Concept and Representation of Percents
1. “Percent” means ___________________________ 2. a) 17% is equivalent to what fraction? b) Shade 17% of this square " c) What percent of the square is NOT shaded? 3. This rectangle is divided into 4 rows of 25 boxes in each row.
a) Color in of the rectangle.
b) What percent is colored in? c) What percent of the rectangle is diagonally striped?
4. For each diagram, (i) What percent of the 10 x 10 grid is shaded?
(ii) What percent of the 10 x 10 grid is not shaded? a) i)shaded: _______ ii) not: _______ b) i)shaded: _______ ii) not: _______
c) i)shaded: _______ ii) not: _______ b) i)shaded: _______ ii) not: _______

Section 7-1: Concept and Representation of Percents
Page 7 - 12
5. Find the percent of the square shaded in each of the following diagrams. a) b) c)
6. Solve these percent application problems using the 100-grid provided. i) There are 1200 students in the high school. 11% of them are out sick one day. How many are out sick?
Picture the 1200 students as “one whole thing” and divide it into 100 equal sized parts, on this grid. a) If this grid represents all 1200 students, how many students are represented by each small square? ____________ b) Shade in 11% of the grid, representing the sick students c) How many students are represented by the squares shaded? _________ d) How many students were out sick that one day? _________
e) How many students were not out sick that one day? _________
f) What percent of students were not out sick that one day? _________ ii) This grid represents all the music CDs in Tom’s house. 30% of the CDs are jazz.
a) Shade in 30% of the grid, representing the jazz CDs.
b) Tom has 90 jazz CDs. If they are “spread out evenly” in the shaded part, then each small shaded square represents how many CDs? __________ c) Each square of the grid must represent the same number of CDs since Tom’s entire collection is represented by the whole grid. How many CDs are represented by the whole grid? __________
d) How many CDs does Tom have in his collection, all together? _________ e) What percent of Tom’s CDs are not jazz CDs? __________

Section 7-1: Concept and Representation of Percents
Page 7 - 13
7. Remember how common fractions are equivalent to various percents. For each figure state
i) what fraction is shaded ii) what percent is shaded. iii) what percent is not shaded. a) b) c) d) e) f) g) h) j) k)
8. Percents appear regularly in news and sports articles and in advertisements. Find five
examples of percents in magazines, newspapers, pamphlets, internet news articles, etc. The five examples should not be all of the same type. So, for example, one could be an advertisement about a sale, one an ad about financial investments, one a news article, one a pamphlet from the electric company, and one in a sports story. Bring copies of the articles to class and be prepared to talk about them.

Section 7-1: Concept and Representation of Percents
Page 7 - 14
Percent grids

Section 7-2: Converting between Percents, Fractions, and Decimals
Page 7 - 15
Section 7-2: Converting between Percents, Fractions, and Decimals • To indicate part of a whole, one may use a fraction, decimal, or percent. It is important to
know how to convert from one form to another. In many situations, one of the forms will be easier to work with than the others. In the previous section we went over the common fractions and how to represent them using all three forms, using diagrams to illustrate the conversions. In this section methods are explained for converting any fraction, decimal, or percent into another form.
! Changing a percent representation to a fraction or decimal representation Since percent means “per hundred”, instead of the percent sign you can write “/100” or
“ 100” and the meaning will be the same. Then the expression may be simplified if it isn’t already in lowest terms.
Examples:
38% = 38/100 = , which can be reduced to
38% = 38 100 = 0.38, which is 38 hundredths Remember: dividing a number by 100 results in the decimal point being moved two places to the left.
51% =
51% = 51 100 = 0.51
Summary:
To convert a percent to a fraction, write the percent number over 100 (and do not write the percent sign).
To convert a percent to a decimal, divide the percent number by 100, which means to move the decimal point
two places left (and do not write the percent sign).
Examples: Changing percent to decimal Changing percent to fraction
144% = 144 100 = 1.44 144% = = = or 1
3% = 3 100 = 0.03 3% = 3/100
6.5% = 6.5 100 = 0.065 6.5% = = = =
=
Practice Problems. Try these now. Changing percent to decimal Changing percent to fraction 75% = 75% = 4.3% = 4.2% = 110% = 110% =

Section 7-2: Converting between Percents, Fractions, and Decimals
Page 7 - 16
Solutions to Practice problems:
Changing percent to decimal Changing percent to fraction 75% = 75 ÷ 100 = 0.75 75% = 75/100 = "
4.2% = 4.2 ÷ 100 = 0.042 4.2% = = = =
110% = 110 ÷ 100 = 1.10 110% = = = or 1
Percents beyond 100% 100% = 1. Percents over 100% equal more than 1.
In the previous examples: 144% = 1.44 and 110% = 1.1 More examples: 250% = 2.5 and 400% = 4
! Changing a decimal to a percent representation We know that 100% means 1. And we know that to multiply something by 1 doesn’t
change it’s value (though it might change the way it looks). So, to change a decimal to an equal percent, multiply it by 100% - and then really do the multiplication by 100 and leave the % sign.
(Remember that multiplying by 100 results in moving the decimal point two places right.) Examples: 0.46 = 0.46 x 1 = 0.46 x 100% = 46% 0.867 = 0.867 x 100% = 86.7% 0.9 = 0.9 x 100% = 90% 1.35 = 1.35 x 100% = 135% (you know 100% = 1, so 135% is more than 1) Some people like to summarize this by saying: To rewrite a decimal as a percent, move the decimal point two places to the right and put in a % sign. ! Changing a fraction to a percent representation
First change the fraction to a decimal (by dividing the numerator by the denominator), and then change the decimal to a percent, as shown above.
Examples: " = 3 4 = 0.75 = 0.75 x 100%= 75% 5/8 = 5 8 = 0.625 = 0.625 x 100% = 62.5% ! Converting fractions to decimals or decimals to fractions
This topic was covered in detail in the chapter on decimals. Here is a short summary. • To change a terminating decimal to fraction form, determine the “formal name” of the decimal and write it as a fraction. For example 0.037 is “thirty-seven thousandths” = 37/1000. • To change a fraction to decimal form, do the division indicated by the fraction line (either as long division or on a calculator). For example, 5/8 = 5 ÷ 8 = 0.625, and 2/3 = 2 ÷ 3 =
0.66666… =

Section 7-2: Converting between Percents, Fractions, and Decimals
Page 7 - 17
Examples of Expressing parts in Fractions, Decimals, and Percents In each of the following examples, there is a “whole thing” and there is a part shaded. The
goal is to express the part of the whole that is shaded in every form: fraction, decimal, and percent. Sometimes one of the forms is easier to find first, and then it is expressed in the other forms. There is more than one way to approach these problems, so your approach might differ from the one presented here – but the final results are the same.
Example A: What part of this figure is shaded grey? Here is an approach which finds the percent answer first. • Notice that the figure is divided into four equal parts, and then one of those parts is
divided into five equal parts. We know that # = 0.25 = 25%. • The # piece that is shaded grey accounts for 25% of the figure. • The piece on the right side of the figure is # of the figure and it has been divided into
five equal sub-parts. Since that right side piece is 25% of the figure (since # equals 25%), then each of its five sub-parts is 1/5 of 25%, which equals 5%. Three of the small sub-parts are shaded grey, and each of them is 5% of the figure, so the three grey sub-parts are total of 3 • 5% = 15% of the figure.
• Putting these ideas together: the larger grey part is 25% of the figure and the three small grey pieces are 15% of the figure. The total shaded grey is 25% + 15% = 40%.
• Conclusion: 40% of the figure is shaded grey. • 40% = 40/100, which in lowest terms equals 2/5. So 2/5 of the figure is shaded. Also, 40% = 40÷100 = 0.4 So 0.4 of the figure is shaded. Example B: For this example, “one whole” is this shape: What “part” is shaded in this diagram?
• two “wholes” and a half are shaded. So 2 is the part shaded. • Since $ equals 50%, and a whole equals 100%,and two wholes equals 200%, the
part shaded is 250%
• In decimal form, 250% = 2.5 and of course 2.5 also equals 2 = 2
• Conclude: the part shaded represents 2 = 250% = 2.5
Example C: For this example, “one whole” is a collection of a dozen eggs. What part of the collection is shaded? • First find the fraction shaded: 7/12 • Convert the fraction to a decimal: 7/12 = 7 ÷ 12 = 0.58333333… 0.583 • Convert the decimal to a percent: 0.583 = 58.3% • Conclude: the part shaded is 7/12 = 0.583 = 58.3%

Section 7-2: Converting between Percents, Fractions, and Decimals
Page 7 - 18
The “Whole Thing” or the “Base” is important “How big is 25%?” That cannot be answered. First we need to know: “25% OF WHAT?”
When “25%” is mentioned, it is 25% of “a whole thing”. That “whole thing” is also called the “base”. We need to know what the base is before we can know how big 25% of it is.
For a visual example, consider these four figures. In each case, the figure is “the whole
thing” and 25% of it is shaded grey. You can see that the amount of grey in each picture is different from the other pictures. The amount of grey in each figure is “25%” - it is 25% or # of the “whole figure”. Since the whole figures are not the same, the amount of grey is not the same.
Here is the point:
For al l percent problems it i s essentia l to keep in mind what the
“base” is .
Rounding Percents When a fraction or decimal is converted to a percent, sometimes it is useful (or even
necessary) to round the percent expression. In an example above, 7/12 was converted to a decimal as 0.583333333 … and then that was converted to a percent. Since the decimal is infinitely long, we first rounded the decimal to the thousandth’s place. Then that decimal was expressed that as a percent.
Another way to handle this example would be to convert the infinitely long decimal to a
percent first, and then to round it. This would look like: 0.5833333… = 58.33333…% Then round 58.3333…%. Let’s round it to the “tenth of a percent” place. That means, to round like this: 58.3333…% ! 58.3% Example D: Rounding to a “whole number percent”. • 43.787% rounded to the nearest whole number percent is 44% • 13.293648% rounded to the nearest whole number percent is 13% Example E: Rounding to a “tenth of a percent”. • 43.787% rounded to the nearest tenth of a percent is 48.8% • 13.293648% rounded to the nearest tenth of a percent is 13.3% • 76.848484% rounded to the nearest tenth of a percent is 76.8% Percents can be rounded to other positions also, such as to a “hundredth of a percent”.
For example, 76.848484% rounded to the nearest hundredth of a percent is 76.85%. In financial applications, percents are often quoted with three decimal places in the

Section 7-2: Converting between Percents, Fractions, and Decimals
Page 7 - 19
percent. That would be the thousandth of a percent position. For example, the interest rate on a loan might be listed as 6.785%
Practice Problems: 1. a) Round 38.6211% to the nearest whole number percent. b) Round 38.6211% to the nearest tenth of a percent. 2. Convert the decimal to a percent rounded to the nearest whole number percent. a) 0.42469 b) 0.6666666666 c) 3.46 3. Convert the decimal to a percent rounded to the nearest tenth of a percent. a) 0.42469 b) 0.222222222 c) 1.65712 Solution to Practice Problems: 1. a) 39% b) 38.6% 2. a) ! 42.469% ! 42% b) ! 66.66666666% ! 67% c) 346% 3. a) ! 42.469% ! 42.5% b) ! 22.2222222% ! 22.2% c) ! 165.712% ! 165.7% Activity: Finding Percents That Land “Up” Materials:
• A collection of at least 20 coins, either plastic ones or real coins, OR else • A collection of double-sided counters (these are round objects like coins, that are one
color on one side and a different color on the other side) Two people work together. Directions:
a) The partners decide which one will record “heads up” on the coins or one particular color on the counters.
The other partner will record “tails up” on the coins or the other color on the counters.
b) Put 8 coins or counters in a container and gently drop them onto the table or floor. c) Each person figures out the part of the collection that lands the way s/he is recording
(heads up or tails up for coins; the particular color for counters). Use the table below to record results. Notice that this result should be expressed in one line of the table as a fraction, a decimal, and a percent.
d) The partners should check that their answers make sense (for example, the percents recorded by each of them should add up to 100%).
e) Repeat steps b, c, and d, but use a different number of coins each time. The numbers of coins to drop after 8 coins are: 9, then12, then 20.
Which part is recorded here? (heads up OR tails up OR which color?)
total # dropped fraction decimal percent
8
9
12
20

Section 7-2: Converting between Percents, Fractions, and Decimals
Page 7 - 20
Activity: Finding Color Percents Materials:
• one collection of about 30 small objects that are identical except for color, and there are three different colors of the objects. For example, you could use one of these:
- a set of about 30 unifix cubes or multi-link cubes in three colors, with about 10 of each color
- a set of about 30 one-inch square tiles in three colors, with about 10 of each color - a set of about 30 colored disks, with about 10 of each of three colors. • a paper bag that can hold all the objects (or any opaque bag or box that can hold
them) Two or three people may work together, or this activity can be done alone. Directions:
a) In the table below fill in the three colors of the objects. Place all the objects in a bag or box so that they cannot be seen. . b) Without looking in the bag or box, one person reaches in and takes out 8 of the
objects. c) Of the objects just selected, count how many of them are each of the three colors –
and record those numbers in the table in the correct row and column. Then figure out what percentage of the objects selected are each of the three colors. Record these results in the correct row of the table.
d) Put the selected objects back into the bag or box and mix them up. e) Repeat steps b, c, and d, but select a different number of objects each time. The
numbers of objects to select after 8 are: 9, then15, then 20, then whatever number you want.
Color:__________
Color:__________
Color:__________
number of objects
selected
number this color
Percent of this color
number this color
Percent of this color
number this color
Percent of this color
8
9
15
20
f) Look over the completed table. Check your work by looking at the numbers in each
row. Is the total of the “number this color” equal to the number of objects selected? For each row, is the total of the “percent of this color” equal to 100%? If not, can you explain why not?

Section 7-2: Converting between Percents, Fractions, and Decimals
Page 7 - 21
Activity: Percent and Fraction Art Work On the next page, using the 10 by 10 grid, make a work of art! It can be a picture, a design,
a quilt pattern, a fantasy, a message, whatever you want. Note that this project will be easier to finish if only one color is used for any one square of the grid; or at most if two colors are used in one square.
% Use at least three colors in your work of art. % At the bottom of the art work, write down each color that you used and: - write what fraction of the work was made with that color. You can write this first as a
fraction out of 100, if you want, and then reduce it to lowest terms. - write what percent of the work was made with that color. Of course, the fraction and the percent for one color should be equal to each other. Do this for each color used. Example: if 12 of the 100 squares are colored purple, you would record
Purple is = Purple is 12%
% If your picture has a white part (not colored in), be sure to include that as one of the colors
and write what fraction and percent it takes up. % Think about this: what should be the total of your fractions? What should be the total of
your percents? Those questions are asked on the next page. You can check your fraction and percent answers by making sure they add up to the right numbers.
(Note: if you think you might take a couple tries to get the art work to look the way you want it,
then photocopy the page before starting.)
% Here is an example of a smaller grid design. Your design might look entirely different. In this example, different shadings and stripes are used to represent different colors. Four “colors” are used, plus white.

Section 7-2: Converting between Percents, Fractions, and Decimals
Page 7 - 22
Percent and Fraction Art Work
a) Below, state or show the colors used, and for each color (including white) give • the fraction of the art work made with that color (in “high terms” if you want but also in lowest terms) and • the percent of the artwork made with that color. b) What should these fractions add up to? _______ c) What should these percents add up to? _______

Section 7-2: Converting between Percents, Fractions, and Decimals
Page 7 - 23
Section 7-2: Exercises on Converting between Percents, Fractions, and Decimals 1. Fill in this table so that in each row the same quantity is expressed in three ways, as: fraction, decimal, and
percent. (the first row is already complete)
Write fractions in lowest
terms.
Give exact decimals and exact percents.
Fraction Decimal Percent
0.07 7%
0.85
22%
0.6
1%
0.357
6.2%
0.035
100%
300%
1.5

Section 7-2: Converting between Percents, Fractions, and Decimals
Page 7 - 24
2. a) Round each of these percents to the closest whole number percent. i) 27.95% ii) 153.768% iii) 6.18%
b) Round each of these percents to the closest tenth of a percent. i) 85.62% ii) 153.768% iii) 2.98% 3. a) Change each of these percents to a decimal. i) 42% ii) 118% iii) 5.3% iv) 7.375%
b) Change each of these decimals to a percent rounded to the nearest tenth of a percent.
i) 0.384 ii) 0.188888888 iii) 1.7263 4. For each of these figures, find the percent of the outer shape that is shaded. Suggestion for some of these: first consider the fraction of the outer shape that is
shaded, and then express that as a percent. a) b) c) d) e) f) g) h) i) 5. a) If “one whole” is this shape: then what is represented by this shaded area:
(Express answer as a fraction, decimal, and percent.)

Section 7-2: Converting between Percents, Fractions, and Decimals
Page 7 - 25
b) If “one whole” is this shape: then what is represented by this shaded area:
(Express answer as a fraction, decimal, and percent.) 6. a) If “one whole” is this collection:
then what part of the collection is shaded?`` (Express answer as a fraction, decimal, and percent.)
b) If “one whole” is this collection:
then what part of the collection is shaded? (Express answer as a fraction, decimal, and percent.)
7. Is 40% of this rectangle the same as 40% of this rectangle ? Explain why or why not.

Section 7-3: Mental Calculations with Percents
Page 7 - 26
Section 7-3: Mental Calculations with Percents Some percent problems are easy to do mentally – without pencil, paper, or calculator –
when you understand the meaning of percents. ! 10% = 1/10 = 0.1 So, multiplying by 10% is the same as multiplying by 0.1, which
results in moving the decimal place one place left, to make a smaller number. Example A: 10% of 512.38 = 51.238 Practice – try these: a) 10% of 80 = b) 10% of 3,400 = c) 10% of 63 = Solutions to Practice problems: a) 8 b) 340 or you could write 340.0 c) 6.3 • 20% is twice as much as 10%. To find 20% of a number, first find 10% and then double
it. Example B: To find 20% of 140, first figure that 10% of 140 is 14. So 20% of 140 is 2 •
14, which is 28. Practice Problems – try these: a) 20% of 80 = b) 20% of 600 = c) 20% of 63 = Solutions to Practice problems: a) 20% of 80 is 2 • (10% of 80) = 2 • 8 = 16 b) 20% of 600 is 2 • (10% of 600) = 2 • 60 = 120 c) 20% of 63 is 2 • (10% of 63) = 2 • (6.3) = 12.6 • 5% is half of 10%. 15% is 10% + 5%. So to find a 15% tip, determine the 10% amount,
and then half of that (which would be 5%) and then add the two together. Example C: The bill in the restaurant is $28.60 Find the amount for a 15% tip. First, round the bill to a “friendly number”; the bill is about $30. 15% is 10% plus half of 10%. 10% of 30 is 3. So 5% of 30 is half of 3, which is 1.50. A 15% tip would be 3 + 1.50 = 4.50. The 15% tip is $4.50. Practice Problems – try these: a) 15% of $47.35 is approximately = ? b) 15% of $8.13 is approximately = ?
Solutions to Practice problems: a) 10% of $47.35 is about 4.70, and so 5% of $47.35 is half of 4.70 which is 2.35. So 15% is 4.70 + 2.35 = $7.05
b) 10% of $8.13 is about $0.80, and so 5% of $8.13 is half of $0.80 which is $0.40. So 15% of $8.13 is .80 + .40 = $1.20.
! 1% = 1/100 = 0.01 So, multiplying by 1% is the same as multiplying by 0.01, which
results in moving the decimal place two places left, to make a smaller number. Example D: 1% of 512.38 = 5.1238 Practice Problems – try these: a) 1% of 80 = b) 1% of 3,400 = c) 1% of 17.5 = Solutions to Practice problems: a) 0.8 b) 34 or you could write 34.00 c) 0.175 ! Some percents are easier to use in calculations when they are changed to an equivalent
fraction. Example E: find 25% of 420. ! Is the same as finding " of 420 = 420 ÷ 4 = 105 Example F: find 50% of 6.82 ! is the same as finding # of 6.82 = 6.82 ÷ 2 = 3.41

Section 7-3: Mental Calculations with Percents
Page 7 - 27
You should have memorized the common fractions and their percent equivalents, which were found earlier in this chapter.
! Here are the ways that three different people did this problem using mental calculations. Example G: Find 85% of 120. a) Marcy explains: I can get 75% of 120 because that is $ of 120. I know that " of 120
is 120÷ 4 = 30. So $ of 120 is 3 times 30 = 90. Now I have 75% of 120 is 90, but I want 85% of 120. That is 10% more. 10% of 120 is 12. I put together the 90 + 12. I do that by thinking 90 + 12 = 90 + 10 + 2 = 100 + 2 = 102. So 102 is 85% of 120
b) Jung explains: First I got 50% of 120 = half of 120 = 60. Then I figured 10% of 120 is
12. So then 30% of 120 is 3 • 12 = 36. So far I have 50% and 30% of 120, which is 60 + 36 = 96. I still need 5% more. 5% of 120 is half of (10% of 120) = half of (12) = 6. So I need to add 6 more to 96, getting 102.
c) Krystal explains: 85% of 120 is almost all of 120 – it is missing only 15%. So I figured
out what was “missing”. 10% of 120 is 12. So 5% of 120 is half of that, which is 6. I put those two together: 12 + 6 = 18. That amount is 15% of 120. I think of that as the “missing” part of 120, the part we don’t have. So what we DO have is the rest of 120, which is 120 minus 18. I figured out 120 – 18 by doing 120 – 20 is 100, but that subtracted 2 too much so I put the 2 back in and get 102. Answer: 102 is 85% of 120.
! Examples of solving applications by mental calculations. a) Sign in a store: “33% off all jeans!”. The jeans Dionna wants are normally $39.95.
What is their sale price, approximately? Solution: 33% is approximately 1/3. So the jeans are 1/3 off the regular price. 1/3 of
$39.95 is about 1/3 of $39, which 39 ÷ 3 = $13. The amount OFF is $13. The normal price of $39.95 is about $40 So the sale price is approximately $40 – $13 = $27.
b) Mr. Smith is asked to select 20% of the first graders to go on a special field trip.
There are 86 first graders. How many should Mr. Smith select? Solution: 20% is 2 • (10% of the 86 kids) = 2 • (8.6) = 17.2 So Mr. Smith should select
17 students. c) The center director announces that the center has good enrollment so the teachers’
supply budgets will be increased by 12% for next year. Kelli’s budget was $350. What will it be next year?
Solution: To get 12%, we can get 10% and 1% and 1%, and put them together. 10% of 350 is 35. 1% of 350 is 3.5. So 12% of 350 is 35 + 3.5 + 3.5 = 35 + 7 = 42. That 42 is the increase in the budget. So the budget next year will be the old budget plus that increase. New budget = 350 + 42 = 392. Kelli’s new budget will be $392.

Section 7-3: Mental Calculations with Percents
Page 7 - 28
Activity: Percent Mental Calculation Bingo Game • Materials: a) the spinner template on the next page, and a paper clip to use with it b) the bingo card on the next page (to be filled in by the player) c) the list of Base Numbers on the next page c) some item to use as markers on the bingo card (e.g., beans, coins, cm cubes, square
tiles, unifix cubes, markers from other games, etc.). 25 markers per person. • Play the game with several people (two to four people works well). • Each person must fill the numbers into his or her own bingo card, as described next to the
card. The reason for this is so that each person’s card will be different, like in a regular bingo game.
• Directions for Play: - Take turns being the person to use the spinner and choose the base. - On each person’s turn: a) The person whose turn it is spins the spinner, which gives the percent to use. b) The person whose turn it is then chooses which Base Number s/he wants. c) Everyone figures out the answer of multiplying that percent times the chosen base
number. Do not use a calculator. Be sure everyone agrees about the result. d) Each person puts a marker on their grid on top of the result number. - Repeat steps a, b, c, and d for each person on his or her turn. - Continue playing until a player has five markers in a row (either horizontal, vertical, or
diagonal). That person is the first winner. - Play can continue to find the second winner, third winner, etc.

Section 7-3: Mental Calculations with Percents
Page 7 - 29
For the spinner: Use a paper clip. Bend one end so it points out from the clip. Position the paperclip with its loop at the center, held in place by a pen or pencil tip at the center point. Spin the paperclip. [Directions for using the paperclip are at the end of Section 5-5, after the exercises.]
Base Numbers that may be chosen: 7 62 76 300 440
Your Bingo Card
Fill in the squares of your bingo card, putting one number in each square. Put the numbers in any “mixed up” order you like. Each player’s cards should have the numbers in different places. The numbers to fill in are: 0.07 0.35 0.62 0.7 0.76 1.4 3 3.1 3.8 4.4 6.2 6.3 7.6 12.4 15 15.2 22 30 44 60 68.4 83.8 88 270 396

Section 7-3: Mental Calculations with Percents
Page 7 - 30
Section 7-3: Exercises on Mental Calculations with Percents
1. Do these calculations mentally (that is, “in your head”) as much as possible. You may need to write a few things, but do not use a calculator.
a) 1% of 460 b) 10% of 460 c) 20% of 460 d) 5% of 460 e) 15% of 460 f) 12% of 460 g) 10% of 756.219 h) 1% of 756.219 2. Find these results without a calculator, using mental calculations. Explain what your
reasoning is. a) 85% of 660 b) 25% of 360
c) 75% of 104 d) 33 % of 360
e) 40% of 600 3. These problems involve fairly straight-forward numbers and can be solved with mental
calculations. Try to use mental calculations. Be prepared to explain your reasoning.
a) Jerri’s snack cube of cheese is labeled as containing 20% of the calcium requirement for the day. How many of the cubes should Jerri eat to get 100% of the calcium requirement for the day?
b) The local elementary school had a dramatic 25% increase in students since last year.
Last year there were about 800 students enrolled. About how many are enrolled this year?
c) My cousin’s goal is to lose 10% of her body weight. She weighs 180 pounds now.
How much will she weigh when she reaches her goal? d) Phil borrowed $300 from his grandpa, and said he’d pay him 4% interest. How much
interest will Phil pay? How much total will he give his grandpa when he pays him back? Hint: first figure out 1%, then 4%.
e) An ad says “Thirty-three percent of the homes we sell have energy-efficient furnaces.”
If they sold 240 homes last year, how many had energy-efficient furnaces? f) Maria’s prescription insurance covers 70% of the cost of a prescription. The full cost of
her prescription was $120. What did Maria have to pay for it? Suggestion: to do the calculations mentally, you might find 10% first, then the percent you want.

Section 7-4: Percent Applications Solved with Equations
Page 7 - 31
Section 7-4: Percent Applications Solved with Equations This method of solving percent application problems is very useful because it can be applied to all percent problems. There are other methods that work for some situations, but here we emphasize this method because it is universal. Prior skill – solving a general equation of the form A = P • B Prior to being able to use this method, one must understand how to solve a particular type of equation, described here. If you have studied algebra before, then this will be familiar. If you have not yet studied algebra, then you will be able to learn this method from the explanation and examples here. The type of equation that arises in percent applications (using the methods presented here) follows this pattern: = • where each box represents a number Two of the boxes in the equation will be known numbers, and the other one will be a variable (an unknown number) that must be found. Here are examples of how to solve this sort of equation.
Example A: To solve 96 = x • 16 divide both sides of the equation by 16.
= ! = x
Use a calculator. Get the result x = 96 16 = 6
Example B: To solve 150 = w • 220 divide both sides of the equation by 220.
= ! = w
Use a calculator. Get the result w = 150 220 = .681818 which is approximately .682 or 68.2%
Example C: To solve 234.5 = .35 • B divide both sides of the equation by .35
= ! = B
Use a calculator. Get the result B = 234.5 ÷ .35 = 670
Example D: To solve A = 3.8% of 67 rewrite the percent as a decimal and recognize that “of” signifies multiplication A = 0.038 • 67
Use a calculator to multiply. Get the result A = 2.546
Practice problems: Use a calculator. a) Solve 1,216 = x • 3,555 b) Solve 84 = 0.72 • x c) Solve x = 43% • 1200 Solutions to Practice problems:
a) Divide both sides by 3,555 ! = ! x = = 1216 ÷ 3555 0.342
Note: indicates “approximately equal to”, which indicates the answer was rounded.

Section 7-4: Percent Applications Solved with Equations
Page 7 - 32
b) Divide both sides by 0.72 ! = ! x = = 84 ÷ 0.72 116.67
c) Rewrite 43% as a decimal, and then multiply: x = 0.43 • 1200 = 516
General format of percent situations
Some Number is Some Percent of Another Number
Amount = Some Percent ! Base
Note: • There are three quantities involved. • Usually two of them are known and one of them is unknown (it’s the variable). • If the percent is known, and is therefore in the equation, then the percent should be rewritten as a decimal before it is used in any calculations. (Or it could be rewritten as a fraction, but usually decimals are easier in these calculations.) Examples:
a) The school nurse reports that 15% of the students are out sick today. The school has
120 students. How many are out sick? Solution: The characteristic being talked about in this problem is “being out sick” that day. The
question is asking how many students had that characteristic of “being out sick” that day – that is the Amount number. Let’s call it x.
X = the number who are out sick (the value of the part) The 15% is the percent with the characteristic of being out sick The 120 students is the Base since it is the whole number of students, the total Equation: Amount = Percent • Base X = 15% • 120 Next, rewrite the percent as a decimal. X = .15 • 120 To solve this equation, simply do the multiplication (use a calculator if you like) X = 18 Answer: 18 students are out sick that day. b) Flo manages an apartment complex that has 92 units. 77 of the units are currently
occupied. What percent of the units are occupied? Solution: We are looking for the percent of units occupied. So the characteristic of this problem
is “units are occupied”. The Amount is the number of units occupied, which is 77. The Base is the whole number of units, which is 92
We can let the variable x = the percent of units occupied (since that is the question)
Whole thing Or Original Amount
Total
Number with a certain characteristic; the value of the part
% with that same characteristic

Section 7-4: Percent Applications Solved with Equations
Page 7 - 33
Equation: Amount = Percent • Base 77 = x • 92 To solve this equation, both sides of the equation should be divided by 92.
=
= x
Use a calculator: x = 77 ÷ 92 = 0.8369565 --- which rounds to 0.837 Since x is to be a percent of units occupied, rewrite 0.837 as a percent: 0.837 = 0.837 x100 % = 83.7% Answer: 83.7% of the units are occupied. Another approach to solving this problem: The question is “what percent of the units are occupied”. This could be found by first
finding the fraction of the units that are occupied. 77 units are occupied out of the 92
units total. So is the fraction of units occupied. Then this fraction can be rewritten
as a percent, by first rewriting it as a decimal, using a calculator:
= 77 ÷ 92 0.836957 83.7% " this is the same result obtained using the
earlier method. c) The sales tax rate in one county is 8.2%. If the tax paid on a purchase is $3.71, what
was the cost of the item before the tax? Solution: We are looking for the cost of the item before the tax. That would be the Base since it
is the original amount. Let x = cost of the item before the tax. The 8.2% is the percent of sales tax. The Amount must stand for the amount of sales tax, which is $3.71 (The characteristic of this problem is “sales tax”.) Equation: Amount = Percent • Base 3.71 = 8.2% • x Next, rewrite the percent as a decimal. 3.71 = .082 • x To solve this equation, both sides of the equation are divided by .082
=
= x
Use a calculator: x = 3.71 ÷ .082 = 45.243902 Round to two decimal places (the hundredths place) since this is
money: x = 45.24 Answer: The cost of the item before tax was $45.24

Section 7-4: Percent Applications Solved with Equations
Page 7 - 34
Percent Increase and Percent Decrease Problems The format of the equation to solve percent increase and decrease problems is the same as the general format for all percent situations. Here that equation is written out, specifying that it is for an increase or decrease problem.
= !
= !
Notes: For an “Increase” situation: Original amount + Amount of Increase = New Amount For a “Decrease” situation: Original amount – Amount of Decrease = New Amount
When you know the original amount and the new amount, to find the Amount of Increase or Amount of Decrease: ! subtract the smaller number from the larger number ! That difference is the amount of change . ! you figure out if it is an amount of increase or an amount of decrease by noticing whether the “new amount” is more or less than the “original amount”.
Examples:
a) Dmitri’s nutritionist suggested he decrease his calorie intake by 10%. He used to eat
about 2300 calories a day. How many calories a day should he eat if he decreases the amount by 10%?
Solution: This is a decrease problem. The percent of decrease is given as 10%. The 2300 calories is what he used to eat, so that is the Original amount, the Base. In the equation, the number we don’t have is the Amount of Decrease. Let x = the Amount of Decrease. Equation: Amount of Decrease = Percent of Decrease • Base x = 10% • 2300 Rewrite percent as a decimal x = 0.10 • 2300 Multiply the two numbers to determine x: x = 230 x = the Amount of Decrease = 230.
Amount or Number of INCREASE
Percent of Increase
Original Amount or number before the increase [Base]
Amount or Number of DECREASE
Percent of Decrease
Original Amount or number before the decrease [Base]

Section 7-4: Percent Applications Solved with Equations
Page 7 - 35
Notice that we didn’t yet answer the question asked, which is “How many calories a day should he eat after the decrease?” To figure this out, we need to take the original amount of calories minus the amount of decrease: 2300 – 230 = 2070
Answer: Dmitri should eat 2070 calories to decrease his calorie amount by 10% This problem could have been solved using mental calculations, but this example is
given to show that the equation method works too. b) Kay’s annual salary was $35,320. Her boss just told her she’d make $38,500 next year.
What percent increase in salary is that? Round the answer to a tenth of a percent. (that is, round the percent number to one decimal place).
Solution: The question is to find the percent increase. Let x = the percent increase. This is an increase problem. For the equation we need the amount of increase and the
original amount. Kate’s old salary is the original amount, $35,320. The amount of increase was not stated, but we can figure it out by finding the difference
between her new and old salaries: 38,500 – 35,320 = 3180. Equation: Amount of Increase = Percent of Increase • Base 3180 = x • 35320 To solve this equation, divide both sides by 35320.
=
= x
Use a calculator to find x = 3180 ÷ 35320 = 0.09003398, rounds to 0.090 x represents the percent of increase, so rewrite it as a percent: x = 0.090 •100% = 9% Answer: The percent of increase in Kay’s salary is 9% c) In hard economic times, the Huge Machines Corp. could only support having 2,100
workers rather than the 2,733 workers they had before. They decreased their workforce by laying off workers. What percent of the workforce was laid off? Round the answer to a tenth of a percent. (that is, round the percent number to one decimal place).
Solution: This is a decrease problem, since the workforce size was decreased. We want to find
the percent of decrease, so call it x. The original amount of workers is the number they had before, 2733, which is the Base. The amount of decrease of workers was not given, but can be figured out by taking
2733 – 2100 = 633. The amount of decrease is 633. Equation: Amount of Decrease = Percent of Decrease • Base 633 = x • 2733 To solve this equation, divide both sides by 2733
=
= x
Use a calculator: x = 633 ÷ 2733 = 0.2316136. Since x represents the percent of decrease, rewrite it as a percent.

Section 7-4: Percent Applications Solved with Equations
Page 7 - 36
x = 0.2316136 = 23.16136%, which rounds to 23.2% Answer: 23.2% of the workforce was laid off.
Percents and Bases – It is Vital to Know the Base When working with percent applications, it is important to know what the “base” is for the percent – that is, what “the whole thing” is that would be 100%. In other words, a percent is always a percent of some base, and one must know what that base is. Consider this situation: Maria’s boss tells her times are tough so she’ll have a 20% decrease in salary next year. The following year the boss says the company did much better and so Maria can have a 20% raise to get back to where she was. Does that actually get her back? The 20% decrease had Maria’s salary THIS year as its base (the decrease would be 20% of this year’s salary). Then Maria would be making a lower salary for the year. At the end of that year, her raise would be a 20% increase from THAT LOWER salary (the base of the 20% increase would be her salary next year – which is lower than her salary this year). So, the raise would be less than the decrease was! Example of salaries, with numbers to see how it works: • Suppose Maria makes $30,000 a year now. • The 20% decrease in salary would be found by: Amount of Decrease = Percent of Decrease • Original amount (base) X = 20% • $30,000 = 0.20 • 30,000 = 6,000 So Maria’s salary next year would be 30,000 – 6,000 = $24,000 • At the end of next year, Maria would get a 20% increase. • The 20% increase in salary would be found by: Amount of Increase = Percent of Increase • Original amount (base) Y = 20% • $24,000 = 0.20 • $24,000 = 4,800
So Maria’s new salary would be 24,000 + 4,800 = $28,800 • Maria’s salary would NOT be back to what it had been at the start (she started at
$30,000). Even though she had a 20% decrease and then a 20% increase, the “base” of those percents were not the same, so the decrease amount was not the same as the increase amount.
Extension of this example: What percent increase would Maria need to have at the
end of next year so that her salary WOULD be back to her starting salary of $30,000?
• After a year of earning $24,000, to get back to a salary of $30,000, Maria would need to make $6,000 more.
• The percent would be found by: Amount of Increase = Percent of Increase • Base $6,000 = x • 24,000 Divide both sides by 24,000
=
so x = = 6000 ÷ 24000 = 0.25 = 25%

Section 7-4: Percent Applications Solved with Equations
Page 7 - 37
• After the year of earning $24,000, Maria would need a 25% salary increase to get back to earning $30,000
For al l percent problems it i s essentia l to keep in mind what the
“base” is .
Example of weights, with different bases: • Wilma and Rita joined a weight watching group and are working towards the goal of
losing 10% of body weight. Rita says her counselor told her she had to lose 16.5 pounds to meet the goal. Wilma, who weighed 190 pounds at the start, figures that her goal is also to lose 16.5 pounds. What is wrong with that thought?
• Solution: Wilma seems to think that everyone’s goal is to lose 16.5 pounds. She doesn’t seem to realize that 10% of weight will be different for different people. The 10% is 10% of the “base” weight that the person starts at.
Since Wilma weighed 190 lb at the start, her goal is to lose 10% of 190 which is 19 pounds.
• For Rita, since 10% of her weight is 16.5 pounds, we can find her starting weight. Call her starting weight x. Then 16.5 = 10% of x.
So 16.5 = 0.10 • x Then divide both sides of the equation by 0.10.
= ! = x ! x = 165
So Rita weighed 165 pounds at the start.

Section 7-4: Percent Applications Solved with Equations
Page 7 - 38
Section 7-4: Exercises on Percent Applications Solved with Equations
1. Solve these problems by using an equation, as described in this section. (There are other ways to solve the problems, but it would be best to practice the equation method here so that you gain skill in this method. Then the method will be available to you as a tool whenever you want it.)
a) A seasoning mix label says that 65% of the mix is salt. How many ounces of salt are
there if the whole mix weighs 12 ounces? [Think: percent is “percent of salt”. Amount must be “amount of salt”. Base is total in mix]
b) At age 6 months, a dog weighed 59 pounds, which was 84% of its predicted adult
weight. What was the predicted adult weight? [Think: one number in this problem is NOT needed to do the work. Look at what the first sentence
says: “something” was “some percent” of “something else”. Fill in those things.]
c) A survey of 320 people found that 176 drove more than 10 miles to work. What
percent of those surveyed drove more than 10 miles? [Think: one number in this
problem is NOT needed to do the work (it is a “label”).]
d) According to Globus Travel, 40% of travelers rarely or never organize vacation
photos. In a tour group of 65 people, how many do you expect will organize their vacation photos?
[Note: read carefully… there is some information given and then a different question is asked! Tricky!]
e) The number of calories in a certain brand of light ice cream is 60% of the number of
calories in regular ice cream. If a serving of light ice cream contains 252 calories, how many calories are in a serving of regular ice cream?
f) A person whose annual salary is $35,320 receives a 4% raise. What is the annual
salary after the raise? [This is a two step problem.]
2. For these application problems, choose whichever method you would like to solve the
problem. For example, draw a diagram, or use mental calculations, or use an equation. Use a calculator for problems with “messy numbers”. Round as appropriate and include units.
a) My brother used to weigh 370 pounds, and now he weighs 320 pounds. What
percent of his weight did he lose? b) The tax rate is 8.7%. An item in the store is marked $30.95. What will you have to
pay for the item, including tax? c) The lawn mowing service is offering a 20% discount if you pay for a month in
advance. The usual monthly price is $55. What would you pay if you take advantage of the discount and pay in advance?
d) The teacher’s supply budget is $450 this year. The administration says it will increase
by 7% next year. What will the new supply budget be? e) A DVD player used to cost $140. Now it costs $120. What was the percent
decrease in price?

Section 7-4: Percent Applications Solved with Equations
Page 7 - 39
f) On a test Paul got 95% of the questions correct. There were 60 questions. How
many did Paul get correct? g) On a construction project, 1% of the budget will be spent on public art. The project
budget is $2.3 million. How much will be spent on public art? h) The second-grade class has 56 students. Twenty-two of them are reading below
grade level. - What percent are reading below grade level? - What percent are reading at or above grade level?
i) To help replenish supplies at a school in an area hit by a tornado, the class decides to
donate 6% of their books. They count 85 books in the classroom. How many will be donated?
j) Marie was happy to find a shirt on sale for $28.95. Normally it sells for $37.99. - What percent of the normal price is she saving? - What percent of the normal price is she paying? k) In the classroom there was a box of 88 colored pencils at the start of the year. At the
end of the year there were 56 colored pencils in the box. - What percent of the colored pencils had been lost or broken? - What percent of the colored pencils remained? l) A form requires the teacher to state what percent of the students met the Physical
Education Standards. Of the 28 students in the class, 21 met the standards. What percent of the students met the standards?
m) The landlord sent a notice that rents would rise next year by 10% since there had
been extra expenses to put in a new roof. But he said that after that year, there would be a 10% decrease in rents so that they’d end up back where they are now. i) Is the landlord right? Would rents be back to what they are now? Show an example to prove your answer. ii) If the landlord is not right, figure out what percent decrease in rents would get them back to their starting point.
3. a) Use the examples of percents that you gathered for an exercise in Section 7-1. Or,
if you do not have those examples, then gather examples now. The exercises stated: “Percents appear regularly in news and sports articles and in advertisements. Find five examples of percents in magazines, newspapers, pamphlets, internet news articles, etc. The five examples should not be all of the same type. So, for example, one could be an advertisement about a sale, one an ad about financial investments, one a news article, one a pamphlet from the electric company, and one in a sports story. Bring copies of the articles to class and be prepared to talk about them. “
b) For each example you gathered, write an application problem using the information from the example. Then write the solutions to the problems. For example, if you have an ad stating “Sale! 20% off all shirts!”, the application problem could be “If a shirt normally costs $28.95, what will its sale price be?”

Section 7-4: Percent Applications Solved with Equations
Page 7 - 40
Percent grids
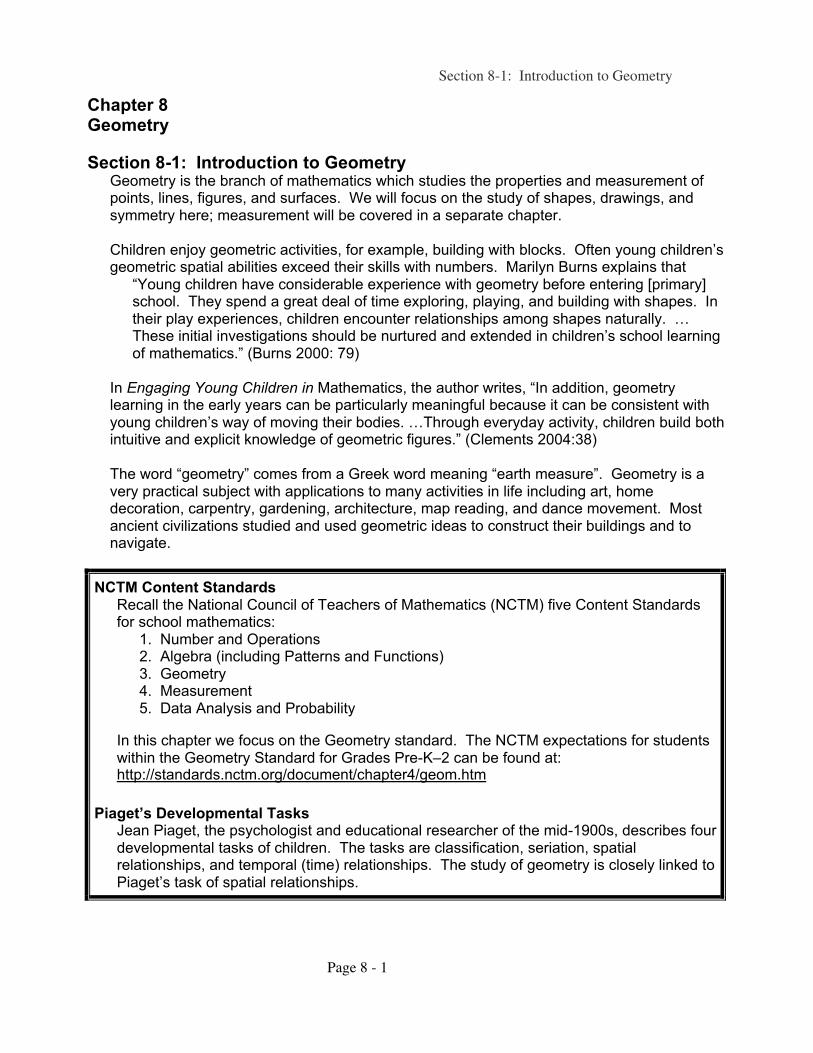
Section 8-1: Introduction to Geometry
Page 8 - 1
Chapter 8 Geometry
Section 8-1: Introduction to Geometry Geometry is the branch of mathematics which studies the properties and measurement of
points, lines, figures, and surfaces. We will focus on the study of shapes, drawings, and symmetry here; measurement will be covered in a separate chapter.
Children enjoy geometric activities, for example, building with blocks. Often young children’s
geometric spatial abilities exceed their skills with numbers. Marilyn Burns explains that “Young children have considerable experience with geometry before entering [primary] school. They spend a great deal of time exploring, playing, and building with shapes. In their play experiences, children encounter relationships among shapes naturally. … These initial investigations should be nurtured and extended in children’s school learning of mathematics.” (Burns 2000: 79)
In Engaging Young Children in Mathematics, the author writes, “In addition, geometry learning in the early years can be particularly meaningful because it can be consistent with young children’s way of moving their bodies. …Through everyday activity, children build both intuitive and explicit knowledge of geometric figures.” (Clements 2004:38)
The word “geometry” comes from a Greek word meaning “earth measure”. Geometry is a
very practical subject with applications to many activities in life including art, home decoration, carpentry, gardening, architecture, map reading, and dance movement. Most ancient civilizations studied and used geometric ideas to construct their buildings and to navigate.
NCTM Content Standards Recall the National Council of Teachers of Mathematics (NCTM) five Content Standards for school mathematics:
1. Number and Operations 2. Algebra (including Patterns and Functions) 3. Geometry 4. Measurement 5. Data Analysis and Probability
In this chapter we focus on the Geometry standard. The NCTM expectations for students within the Geometry Standard for Grades Pre-K–2 can be found at: http://standards.nctm.org/document/chapter4/geom.htm
Piaget’s Developmental Tasks
Jean Piaget, the psychologist and educational researcher of the mid-1900s, describes four developmental tasks of children. The tasks are classification, seriation, spatial relationships, and temporal (time) relationships. The study of geometry is closely linked to Piaget’s task of spatial relationships.

Section 8-1: Introduction to Geometry
Page 8 - 2
Dimensions A point is the basic unit of geometry. It has no dimensions (no length, width, or height). A
point is simply a location. A small dot made with a sharp pencil on a piece of paper is a physical representation of a point.
A line or a curve drawn on a piece of paper is an example of a one-dimensional object. It
has length, but no width or height. A representation of a one-dimensional object is a string, or the corner of a room where the two walls meet.
A two-dimensional object has a length and width, but no height. Two dimensional
objects are those that can be drawn on a flat surface. For example, this rectangle or this crescent moon shape . Representations of two-dimensional objects are the top of a table, or a piece of paper. A two-dimensional object has a length and width, but no height or depth. A three-dimensional object occupies space; it has length, width, and height. As an
example, consider a box, a chair, a can of soup. Practice Problems 1. Draw 3 examples of one-dimensional objects and 3 examples of two-dimensional objects. 2. Look around the room you are in. What are some examples of three-dimensional objects
you see? Write down a few examples.
Note: There are no Exercises for Section 8-1.

Section 8-2: One-Dimensional and Two-Dimensional Geometry
Page 8 - 3
Section 8-2: One-Dimensional and Two-Dimensional Geometry (Curves, Polygons, Angles, Triangles, Quadrilaterals) Vocabulary and Concepts To study geometry, we first need to learn some vocabulary and classifications so that we can
correctly communicate about geometric objects. A clear understanding of the vocabulary is linked to a clear understanding of geometric concepts. The words below are listed with their geometric definitions. Some of the words might have more or different meanings in everyday life, but we want to be clear here about their geometric meanings.
!One-Dimensional Concepts curve: any drawing that can be made in a single continuous motion (without lifting your
pencil from the paper). Examples of curves: The following examples are NOT curves: simple curve: a curve that does not cross itself. These examples are simple curves: Note that in geometry a straight line is called a “curve”. The word “curve” includes all
the drawings you can make with a single continuous motion of your pencil – so that includes straight lines as well as “curvy” lines.
The following examples are curves that are NOT simple because each of these curves
crosses itself: closed curve: a curve that starts and stops at the same point. Examples of different types
of closed curves are below. simple closed curve: a simple curve that starts and stops at the same point. Examples of simple closed curves : Examples of closed curves that are not simple:

Section 8-2: One-Dimensional and Two-Dimensional Geometry
Page 8 - 4
line: A line is a straight curve. Technically in geometry, a line goes on forever in both directions. Of course we cannot draw a line going on forever infinitely long. To show a line in a diagram, we put an arrow at the ends to indicate that the line is going on forever.
Examples of diagrams of lines:
About the language of lines
In everyday speech, when we use the word “line” we do not usually mean that it is infinitely
long. The technical geometric term for a line that is not infinite but rather starts at one
point and stops at another is “line segment”. In a formal geometry situation (like a high
school geometry class) it is important to use the correct terms (either “line” or “line segment”).
Here we are taking an informal approach to geometry. It is okay to use the word “line” when
the line is not infinitely long (when technically it is a line segment).
line segment: a straight simple curve that starts at one point and ends at another. Here
are two examples: parallel lines: lines that run in the same direction, never cross each other, and are always
the same distance apart. Here are two examples: and Straight railroad tracks are parallel. perpendicular lines: lines that meet in a 90 degree angle. A 90 degree angle, also called
a “right angle” is one-fourth of the way around a full circle. On a normal sheet of paper, the top edge and the side edge are perpendicular to each other.
Examples of perpendicular lines: Activity: Straight versus Curved
• Consider the capital alphabet letters printed in a “classic” way (such as A, B, C, D, etc.) Place each letter in the correct place in this Venn diagram, where one loop is for Straight-
sided letters (whose parts are line segments) and the other loop is for Curvy letters. Think about it… where will you place B, which has curves and straight parts?
Straight sides Curved

Section 8-2: One-Dimensional and Two-Dimensional Geometry
Page 8 - 5
• Notice that this activity involves skills of classification and use of Venn Diagrams in
addition to geometric concepts. • Using this activity with children: - For children who can write letters but are less sure of Venn Diagrams, a chart could
be made to simply list the letters, such as here: - For children who do not yet write letters clearly, a
set of plastic or paper-cut-out letters could be used. Be sure that they are plain, block letters. Children could place the letters in the appropriate part of the chart.
- After placing letters in the chart, children might be able to progress to the Venn Diagrams, with assistance.
The idea for this activity is from Marilyn Burns (2000: 84 and 278).
!Two-Dimensional Concepts
polygon: a simple closed curve made up of line segments. So, its sides are all straight,
and they are connected one after the other. Examples of polygons: Examples of NON-polygons: These examples of non-polygons are all simple closed curves, but their sides are not all straight. Some sides might be
straight, but not all of them, so these figures are not polygons. Practice Problems: For each of the following figures, is it a polygon or not? 1. 2. 3. 4. 5. 6. 7. Answers to Practice Problems: 1. yes 2. no 3. yes 4. no 5. no 6. yes 7. yes ! Types of Polygons • If all the sides in a polygon are the same length, it is called an equilateral polygon.
Examples: Each of these shapes is an equilateral polygon (since each shape has all of its sides
the same length). A B C D
Straight Curved Both

Section 8-2: One-Dimensional and Two-Dimensional Geometry
Page 8 - 6
• In addition, if all the sides are the same length and all the angles are equal in size, it is
called a regular polygon. Examples: Only shapes B and D are regular polygons, since their angles are all the same size. (In
shape A the top and bottom angles are wide, but the side angles are narrow. In shape C the top angle is narrow, the two side angles are wide, and the bottom two are medium.)
Polygons have different names depending on how many sides they have, as given in the
next table. Names of Polygons depending on the number of sides Number of sides Name an example the regular polygon 3-sided polygon triangle 4-sided polygon quadrilateral 5-sided polygon pentagon 6-sided polygon hexagon 7-sided polygon heptagon no diagram provided no diagram provided 8-sided polygon octagon no diagram provided 9-sided polygon nonagon no diagram provided no diagram provided 10-sided polygon decagon no diagram provided no diagram provided Practice Problem In your home or classroom, find examples of polygons. For
example, in my home the top edge of one lampshade is an octagon. Activities for Children: • Several children can lie on the floor to form a polygon shape. • Colored tape can be placed on the floor in the shape of a large polygon (large enough
to walk around. Children then walk and “dance” around the shape of the polygon.

Section 8-2: One-Dimensional and Two-Dimensional Geometry
Page 8 - 7
!Concave and Convex Shapes Two-dimensional shapes such as polygons (and other shapes too) can either be concave
or convex. A concave shape is “caved in” or “dented”. When a shape is concave, you can find two
points inside the shape that when connected with a line segment, that line goes outside the shape.
Examples of concave shapes: concave quadrilateral
Concave pentagon. Example of a line segment connecting 2 points and going outside the shape: concave polygon concave shape not a polygon
! concave shape that is not a polygon
A convex shape is not concave. Whenever you take any two points inside the shape,
the line segment joining those two points lies entirely inside the shape. All of the regular polygons are convex. Parallelograms and circles are convex. More examples of convex shapes: Pentagon that is convex shape ! an oval not regular " not a polygon "
Practice Problems: For each of the following shapes, is it concave or convex? How do you know? 1. 2. 3. 4. 5. 6. Answers to Practice Problems: 1. concave 2. convex 3. convex 4. concave 5. concave 6. convex
!Angles An angle is formed when two line segments have a common endpoint. The two line
segments are called the sides of the angle. The common endpoint is called the vertex. It does not matter how long the sides of the angle are. Side In fact, often in geometry the sides are thought of as going away from the vertex forever. When the side Vertex starts at a point and goes on infinitely in one direction, Side it is called a “ray” rather than a line segment. For example:

Section 8-2: One-Dimensional and Two-Dimensional Geometry
Page 8 - 8
Examples of angles of various sizes:
The angles pictured here are seriated by size of angle.
The size of the angle is determined by the smallest amount of rotation (or turning) needed to rotate one side to the other side. Think about the area between the two sides. We can think of this as being an amount of rotation (or turning) - think of the two sides of the angle as starting at the same place, and then one of the sides rotates or turns to the position that it ends up (keeping the vertex stable). Picture the hands of a clock starting at 12:00, and then the minute hand rotating.
“The two ways of thinking about angles, as amounts of rotation and as [line segments] meeting, are closely related. … Since even very young children have experience spinning around, the ‘rotation’ point of view is perhaps more primitive.” (Beckmann 2005: 328)
Degrees The sizes of angles are measured in degrees. One full rotation is 360 degrees. • If you stand and point one arm straight forward, then turn (rotate) all the way around
until you end back where you started, your arm has swept out an angle of 360 degrees. • If you point your arm straight forward and rotate half-way around, ending up in the
opposite direction from where you started, your arm swept out an angle of half of 360, which is 180 degrees.
• If you were to rotate one-fourth of the way around, you’ve swept out an angle of 90 degrees.
The symbol for “degrees” is a small circle at the upper right side of the number, for example 90°.
Below are examples of some degree measures and how they are represented. 360° 180° 90° 45°
A 180° angle is called a “straight angle” (which seems reasonable since the starting and
ending sides form a straight line). A 90° angle is called a “right angle”. The two sides of a right angle are perpendicular.
In a diagram, to indicate that an angle is exactly 90°, a little square is put
in the angle, such as in this diagram:

Section 8-2: One-Dimensional and Two-Dimensional Geometry
Page 8 - 9
Why are there 360 degrees in a circle? The ancient Babylonians, over 4,000 years ago, chose to use 360 degrees to measure a full turn around a circle. Their numeration system was based on 60, not base 10 like our current system. 360 equals 6 • 60, so 360 was a convenient number in their system.
It is not entirely known why they chose 360, but it was a good choice because 360 has many factors (many numbers that divide evenly into it). So when we have a fractional part of a circle, it often comes out as a whole number of degrees. For example, 1/3 of a circle is 1/3 of 360° = 120°. 1/4 of a circle is 1/4 of 360° = 90°. 1/5 of a circle is 1/5 of
360° = 72°. And so on.
A one degree angle would be difficult to picture; it is the size of 1/360 of the way around a
full rotation, so it has a very small space between the two sides of the angle. Every angle’s measure can be found by seeing what part of a full rotation it is. A
protractor is a tool for measuring the sizes of angles. Protractors do not all look exactly alike; one protractor is pictured below.
Special Angle Names Two categories of angles have special names: Acute angles have measures between 0° and 90°. They are smaller than right angles.
Examples: Obtuse angles have measures between 90° and 180°. They are larger than right angles
(that is, they have a wider angle opening than right angles). Examples: Practice Problem Look around the room you are in. Find two examples of acute angles and two examples
of obtuse angles. How many right angles can you find?

Section 8-2: One-Dimensional and Two-Dimensional Geometry
Page 8 - 10
!Triangles As people learn a new concept, they need to see examples of items that fit the concept, and
also examples of items that do not fit the concept. For the concept of “triangle”, the NCTM points out that “teachers must ensure that students see collections of triangles in different positions and with different sizes of angles and shapes that have a resemblance to triangles but are not triangles” (NCTM 2000: 98).
Here are some examples of triangles: Here are some examples that are close to triangles but are NOT triangles The NCTM explains that “Through class discussions of such examples and nonexamples,
geometric concepts are developed and refined.” (NCTM 2000: 98) Parts of a triangle The straight edges of a triangle are called its sides. Each triangle has three sides. When two sides meet they form an angle. Each triangle has three angles. The point where two sides meet is called a vertex of the triangle. The plural of “vertex” is “vertices”. Each triangle has three vertices (VER-tih-sees). Vertex In this triangle, the vertices are labeled A, B and C. A B side side C vertex side vertex The top side is called AB or BA. The left side is called AC or CA. The other side is called CB or BC.
Classifying Triangles " Triangles can be classified depending on the angles in the triangle, as follows: A Right Triangle has one right angle in it (that is, a 90 degree angle). Examples:

Section 8-2: One-Dimensional and Two-Dimensional Geometry
Page 8 - 11
An Obtuse Triangle has one obtuse angle in it (that is, an angle larger than 90°).
Examples: An Acute Triangle has all acute angles (that is, all angles less than 90°).
Examples: Think about it (experiment by making some drawings): - How many right angles can a triangle have? - How many obtuse angles can a triangle have? - How many acute angles can a triangle have? " Triangles can be classified depending on the lengths of their sides, as follows: An Equilateral Triangle has three sides that are all the same length. Also, all of its
angles are the same size, though that is not the definition. Examples: An Isosceles Triangle has exactly two sides the same length. And two of its angles
are the same size, though that is not the definition. Isosceles is pronounced “eye-SOS-eh-leez” Examples:
A Scalene Triangle has all three sides of different lengths. And all of its angles are
different in size, though that is not the definition. Examples:
" Every triangle can be classified according to its angle sizes and its side lengths.

Section 8-2: One-Dimensional and Two-Dimensional Geometry
Page 8 - 12
Practice Problems on classifying triangles: Classify each of the following triangles in two ways (one way depending on angles and
one way depending on sides). 1. 2. 3. 4. Answers to Practice Problems: 1. is Acute and Scalene 2. is Acute and Equilateral. 3. is Obtuse and Isosceles 4. is Right and Scalene. Note: The sides of a right triangle have special names. The sides that form the sides of the right 90° angle are called legs.
The side that does not touch the 90° angle is called the hypotenuse.
(pronounced high-POT-eh-noos) leg hypotenuse leg Sum of the Angles in a Triangle " Draw and cut out a triangle, then tear it and position it, as follows: • On a piece of paper draw a triangle (use a ruler or straight edge to draw the sides
straight). Draw any type of triangle you like, and make it about three inches or larger (so that the pieces below are large enough to handle).
• Label the angles P, Q, and R (write the letter near the vertex). • Carefully cut out the triangle. • Tear the triangle in to three parts, each part containing one full angle of the
triangle. Example • Take one of the pieces and place it so that the vertex point of the angle is at the
dot labeled “A” below, and one side of the angle is along the line to the left of the dot. Place a second angle (either one) so that it lies to the right of the first angle, snuggled up next to it, and its vertex too is exactly at the dot at “A”. Place the third angle piece snuggled up to the second piece (to the right of it) so that its vertex also is at the dot at “A”.
" A
P
Q R

Section 8-2: One-Dimensional and Two-Dimensional Geometry
Page 8 - 13
• The three angles of your triangle are next to each other, and their sum is the amount of rotation from the beginning of the first one to the end of the third one. How much rotation is that?
• Just to make sure, do this exercise again, drawing a different looking triangle this time, cutting it out, tearing off its angles, and placing them with their vertices together.
" Conclusion: The sum of the angles of a triangle is 180 degrees.
Sum of the Angles in a Quadrilateral A quadrilateral is another name for a 4-sided polygon. For a triangle, the sum of the angles is always 180 degrees. What is the sum of the
angles of a quadrilateral? Will the sum always be the same? Consider a rectangle. Each of its angles is size 90 degrees. . 90 90 So the sum of its angles is 4 • 90 = 360 degrees. 90 90 To find the sume of the angles of ANY quadrilateral, use the following reasoning. • Consider any quadrilateral. For example: • Draw a diagonal (a line segment from one vertex to a non-adjacent vertex): • Two triangles are formed. • All of the original quadrilateral’s angles are now part of the triangles’ angles. (Two angles of the origianal quadrilateral have been split so that one part is in each
of the triangles. Two of the angles of the original quadrilateral are not split.) • Each triangle’s angles sum to 180 degrees. The two triangles’ angles sum to 2 • 180 = 360 degrees. • So, the sum of the angles of the quadrilateral is 360 degrees.
" Conclusion: The sum of the angles of a quadrilateral is 360 degrees.
Another way to check out the sum of the angles of a quadrilateral is the following • On a piece of paper draw a quadrilateral (use a ruler or straight edge to draw the
sides straight). Draw any type of quadrilateral you like, and make it about three inches or larger (so that the pieces below are large enough to handle).
• Label the angles P, Q, R and S (write the letter near the vertex). • Carefully cut out the quadrilateral. • Tear the quadrilateral into four parts, each part containing one full angle of the
shape. Example R
Q
P
S

Section 8-2: One-Dimensional and Two-Dimensional Geometry
Page 8 - 14
• Take the four pieces and place them next to each other so the vertex of each of
the four angles lies at the same point. The four pieces should not overlap each other nor have any gaps between them.
!Classifying Quadrilaterals Any polygon with exactly four sides is called a quadrilateral. Two sides of a polygon
are called adjacent if they are “next to each other”, meaning that the two sides have an endpoint in common. In a quadrilateral, two sides that are not adjacent are said to be opposite each other.
Example: in this figure, the sides are labeled a, b, c, and d. b • a and b are adjacent sides. b and c are adjacent sides. a c c and d are adjacent sides. a and d are adjacent sides. d • a and c are opposite sides. b and d are opposite sides. Some quadrilaterals have special names. Here are the definitions of some special types of
quadrilaterals along with a few examples of each. Parallelogram – quadrilateral in which the opposite sides are parallel. Also, opposite
sides are the same length. Rectangle – quadrilateral in which opposite sides are parallel AND each of the angles
measures 90 degrees (each angle is a right angle). Also, opposites sides are the same length.
Square – a rectangle with all sides the same length. Note: Every square is a rectangle. Some rectangles are squares and some are not. Rhombus – a quadrilateral with opposite sides parallel and all sides the same length. Notes: A less formal name for a rhombus shape is diamond. If a rhombus has right angles, then it is a square. But a rhombus does not
need to have right angles.

Section 8-2: One-Dimensional and Two-Dimensional Geometry
Page 8 - 15
Trapezoid – a quadrilateral with exactly one pair of opposite sides parallel. Note 1: The first three examples above are isosceles trapezoids because the
sides that are not parallel are equal in length to each other. Note 2: Sometimes a trapezoid is defined as having one or two pairs of opposite
sides parallel. But in this book we will say that a trapezoid has exactly one pair of opposite sides parallel (so – two sides are parallel and the other two are not).
Kite – a quadrilateral in which two adjacent sides are the same length, and the other
two adjacent sides are the same length. Note: If a kite is concave, such as these " then some boks still call it a kite while other books call it a “dart” or “arrowhead” or “chevron”
“Do I REALLY have to know ALL of this vocabulary?”
Juanita Copley explains that teachers need to know much more than their students so they avoid giving wrong information:
“At their level of development, young children do not easily categorize shapes in more
than one way. Children tend to see squares and rectangles as two discrete shapes
rather than seeing suares as a subset of rectangles; they expect a rectangle to have two
long sides. A square is a special rectangle, of course, one that has equal sides. It is
also a quadrilateral, a parallelogram, and a rhombus. Introducing all these words and
concepts to young children is probably premature. However, teachers should keep
the real meaning of such terms in mind and avoid giving children ideas that are
actually wrong (for instance, by saying “No, that’s not a rectangle – it’s a
square”).” (Copley 2000: 113 [emphasis added])
Practice Problems on polygon angles: Use logical thinking and the facts about angles of triangles and quadrilaterals. [The diagrams are not necessarily drawn with the correct sizes of angles.] 1. In an equilateral triangle, all of the angles are the same size. What is the size of each angle?

Section 8-2: One-Dimensional and Two-Dimensional Geometry
Page 8 - 16
2. Carla has an obtuse isosceles triangle; she measured the obtuse angle and found it
was 110 degrees. What are the sizes of the other two angles? 3. In a parallelogram, the opposite angles are equal. If two of the angles each measure 40 degrees, what do the other two measure? 4. In this isosceles trapezoid, the two top angles each measure 125 degrees. The bottom two angels equal each other. What size are they? Answers to Practice Problems:
1. The 3 angles are the same size, and they add up to 180. So each is 180 ÷ 3. So each angle of an equilateral triangle is 60 degrees.
2. One angle is 110 degrees, and all the angles add up to 180 degrees. So the other
two angels account for 180 – 110 = 70 degrees. Those other two angles equal each other (since it is an isosceles triangle) and add up to 70, so each is 70 ÷ 2 = 35 degrees.
3. Two angles each measure 40°, so together they are 40 + 40 = 80 degrees. The
total of all four anglees is 360, so the other two angles are 360 – 80 = 280°.
Those other two angles are equal, and total 280, so each is 280 ÷ 2 = 140 degrees.
4. The two top angles are 125 degrees each, so together they are 2 • 125 = 250
degrees. The four angles total 360°, so the bottom two angles together are 360 –
250 = 110. Each bottom angle is half of 110 = 110 ÷ 2 = 55 degrees.

Section 8-2: One-Dimensional and Two-Dimensional Geometry
Page 8 - 17
Relationships among some types of quadrilaterals The following Venn Diagram illustrates the relationships among types of quadrilaterals. Some parallelograms are rhombuses and some are rectangles, and there are also parallelograms outside the rhombus and rectangle loops. A shape that is both a rhombus and a rectangle is in the intersection, or overlap, of their loops, and is thus a square.
Note that there are quadrilaterals that are outside of the parallelogram loop.
Practice Problems For each of the following shapes, write its letter in the correct place on the Venn Diagram
(that is, in the part of the diagram where the figure would belong).
A B C D E F G H J K
parallelograms
rhombuses rectangles
squares
quadrilaterals
trapezoids

Section 8-2: One-Dimensional and Two-Dimensional Geometry
Page 8 - 18
Answers to Practice Problems D K B C A H F E J
G !Congruent Figures Two figures are congruent if they are exactly the same size and shape. “Congruent”
is prounounced con-GREW-ent. Another way to look at this: if you could cut out two figures and place one on top of the other so that they would exactly match up in size and shape, then they are congruent. You might have to turn the figures around or flip them over to make them match up, but if you could do so then they are congruent.
Examples: Each figure here is congruent to the one next to it.
Note: Exercises for Section 8-2 follow section 8-3.
parallelograms
rhombuses rectangles
squares
quadrilaterals
trapezoids
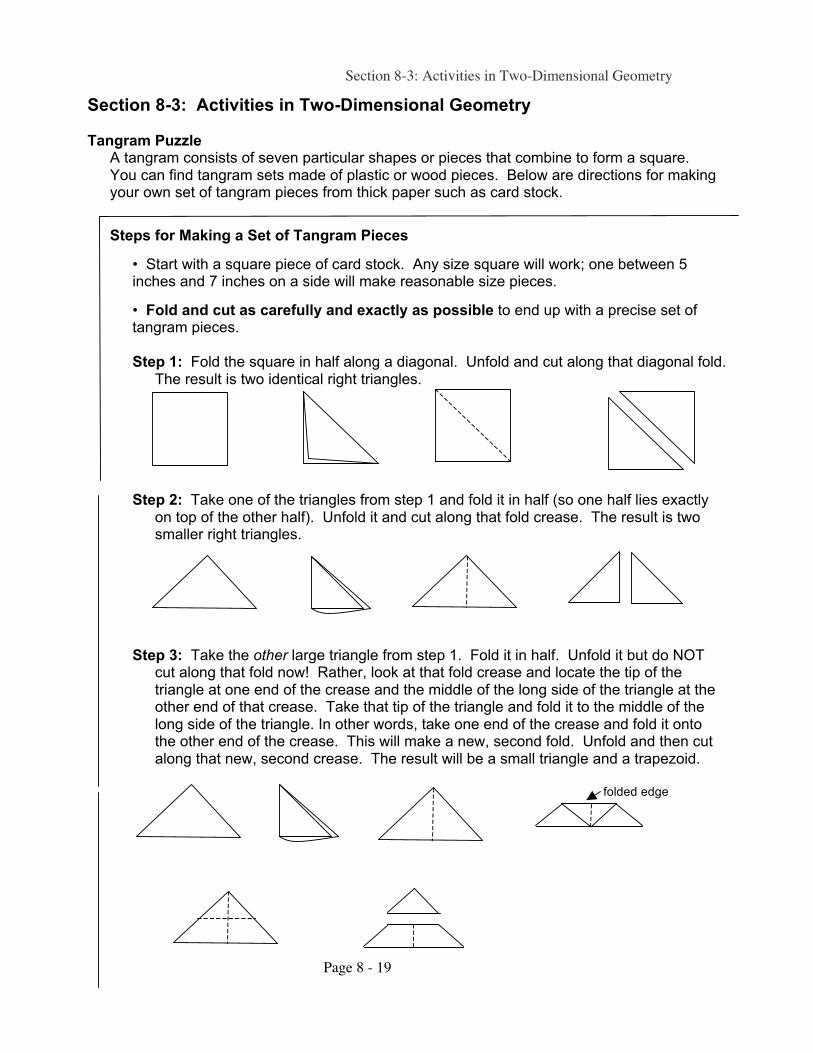
Section 8-3: Activities in Two-Dimensional Geometry
Page 8 - 19
Section 8-3: Activities in Two-Dimensional Geometry Tangram Puzzle A tangram consists of seven particular shapes or pieces that combine to form a square.
You can find tangram sets made of plastic or wood pieces. Below are directions for making your own set of tangram pieces from thick paper such as card stock.
Steps for Making a Set of Tangram Pieces
• Start with a square piece of card stock. Any size square will work; one between 5 inches and 7 inches on a side will make reasonable size pieces.
• Fold and cut as carefully and exactly as possible to end up with a precise set of tangram pieces.
Step 1: Fold the square in half along a diagonal. Unfold and cut along that diagonal fold.
The result is two identical right triangles. Step 2: Take one of the triangles from step 1 and fold it in half (so one half lies exactly
on top of the other half). Unfold it and cut along that fold crease. The result is two smaller right triangles.
Step 3: Take the other large triangle from step 1. Fold it in half. Unfold it but do NOT
cut along that fold now! Rather, look at that fold crease and locate the tip of the triangle at one end of the crease and the middle of the long side of the triangle at the other end of that crease. Take that tip of the triangle and fold it to the middle of the long side of the triangle. In other words, take one end of the crease and fold it onto the other end of the crease. This will make a new, second fold. Unfold and then cut along that new, second crease. The result will be a small triangle and a trapezoid.
folded edge

Section 8-3: Activities in Two-Dimensional Geometry
Page 8 - 20
Step 4: Take the trapezoid from step 3 and fold it in half so that one half lies exactly on the other half. Unfold it and cut along that crease. The result is two irregular trapezoids.
Step 5: Take one of the irregular trapezoids from step 4. Notice how one side has two
right (90 degree) angles along it. Take the sharp tip at the other side of the trapezoid and bring that sharp point to rest against the closest right angle corner – make the fold so that those two points stay on top of each other. Notice that you then have a square on one side of the fold and a triangle on the other side. Cut along that fold. The result is a square and a very small triangle.
Step 6: Take the other irregular trapezoid from step 4. Notice how one side has two
right (90 degree) angles along it, and the other side has a sharp tip and also a wide-angled (obtuse angle) corner. That wide-angled corner is next to one right angle and is across from the other right angle. Take the right angle corner that is across from the wide-angled corner, and put the tips of those two corners on top of each other. This fold is a bit tricky to make, but so satisfying when you do. Unfold and check that if you cut along the fold you would end up with a very small triangle and a parallelogram – if you would, then you have the right fold so cut along it.
Result: Once you have cut all the pieces, you will have a set of 7 tangram pieces that
consists of two large triangles, two small triangles, a medium triangle, one square, and one parallelogram.
Activities using the Tangram Puzzle ! Explore An essential step for children and adults with any new materials is to freely explore the
materials. Arrange the tangram pieces (some of them or all of them) to make “pictures” or shapes. When you make a picture or a shape that is pleasing to you, show it to a classmate or family member.
Draw one of your “pictures” on paper by tracing around the outside of the pieces. If you
trace only the outer edges (not the inner segments between the pieces), then you could give your outline picture to classmates and challenge them to arrange their pieces to form the shape. Be sure to tell them whether to use all 7 pieces or not.
Notice: How many pieces total are in the tangram set? (seven) What are the shapes of the pieces?

Section 8-3: Activities in Two-Dimensional Geometry
Page 8 - 21
(2 large triangles, 2 small triangles, 1 medium triangle, 1 square, and 1 rhombus parallelogram. Each triangle is an isosceles right triangle.)
Some tangram pieces are congruent to other pieces. (The 2 large triangles are congruent to each other. The 2 small triangles are congruent to each other.)
Challenge: Use all the tangram pieces to make a large square. Remember that you
started with a square piece of paper! ! Look, Make, and Fix This activity is described in Chapter 6 of The Young Child and Mathematics (Copley
2000). This activity uses an overhead projector or document camera. - While the overhead projector or document camera is turned off, the teacher places a
few tangram pieces into a “design” or model. Then the machine is turned on so that everyone can look at the design for a few moments.
- Then the machine is turned off and everyone attempts to make the same design with their own set of tangram pieces.
- Then the machine is turned on again and everyone has an opportunity to fix their design to make it match. Students might discuss what they are doing. Examples of comments that might be heard: “I almost had it but should’ve used the medium triangle and not the small one”, “I pointed the triangle up - oops! Now I’ll turn it to point down”, “Now I get it – I need to move my square to be on TOP of the parallelogram”, “I have it all right!”
During this activity, the first design shown by the teacher should be fairly simple, using
only two or three tangram pieces. Later, more complicated designs can be used. Also, students could take the role of the teacher, creating and showing designs. While engaging in this activity, it is valuable to talk about how it is going – for example: name the shapes used, discuss the direction the shape should be “pointed”, discuss if it is the small or medium triangle in a design, etc.
“Playing Look, Make, and Fix in small groups, children who have difficulty with spatial
skills can have more practice and learn new strategies… Children enjoy the activity so much that they like to play it on their own when they have the chance.” (Copley 2000: 107)
! Hidden Design Talk - At first, the whole class can play this together. - One person acts as Designer. The designer makes a “hidden” design form several
tangram pieces. It could be made on the overhead projector or by the document camera while the machine is turned OFF (because at the end the design will be revealed, but not yet).
- The Designer will then verbally describe to everyone how they can make the same design. The person will say which tangram pieces should be used, where they should be placed, and how they should be oriented (e.g., triangle pointing up or pointing down?).
- The people following the directions and trying to make the design may ask questions to clarify what to do, but may communicate only by talking (not by showing pieces).
- When the students in the class think they have made the design correctly, then the machine can be turned on so everyone can compare their shapes with the designer’s shape. Then they can adjust their pieces, if need be, to match the design.

Section 8-3: Activities in Two-Dimensional Geometry
Page 8 - 22
- After practicing this activity as a whole class, it can be played in pairs. - To play in pairs, there should be a barrier between the partners so they cannot see
each other’s tangram pieces (for example, prop up a book or a binder between the partners). One of the partners is the Designer and makes a design, then describes it verbally to the other person who tries to make it. After they have communicated and asked questions and feel the design is duplicated, then remove the barrier and check.
- Partners should reverse roles so that each person has a chance to be the Designer and describe their hidden design.
Children engaging in geometry When people of any age learn about a new topic, it can be helpful to actually handle
objects related to the topic, to use one’s kinesthetic skills for learning. For children learning about geometric concepts, it is essential to handle objects. Juanita Copley says “For the most part, young children do not develop their concepts of shape from looking at pictures or merely hearing verbal definitions (‘a triangle has three sides and three angles’). Rather, they need to handle, manipulate, draw, and represent shapes in a variety of ways” (Copley 2000: 111-112)
Young children can use items such as tangram pieces, pattern blocks, building blocks,
models of geometric solids, straws and connectors, cubes, tiles, and geoboards to learn about geometry.
Children talking about geometry When children engage in activities such as the tangram activities, they have the
opportunity to develop skills in talking about geometric concepts. They will gain skill in their “spatial vocabulary”. As described by Juanita Copley, spatial vocabulary for young children includes the following (Copley 2000: 114):
• Location/position words, such as on top of, in, above, below, beside, etc. • Movement words, such as up, down, around, toward, sideways, etc. • Distance words, such as near, far, close to, etc. • Transformation words, such as turn, flip, slide, etc.
In the Geometry Standard for Pre-K to Grade 2 from the National Council of Teachers of
Mathematics, it is noted that students need to develop “a variety of spatial understandings: direction (which way?), distance (how far?), location (where do we end up?), and representation (what objects?)” (NCTM 2000: 98).
Activity: Exploring polygons using “sticks” and “hinges”
Materials: Plenty of paper for tracing the shapes and writing answers. Some sort of “sticks” to represent the sides of the polygon and some way to attach the
sticks together at their ends in a sort of “hinge” so that the angle can be changed. • One way to make these materials: - Use drinking straws and pipe cleaners (also called chenille stems). The straws must
be narrow enough so that a pipe cleaner put into it for an inch or two fits snuggly.

Section 8-3: Activities in Two-Dimensional Geometry
Page 8 - 23
- Use drinking straws as the sides of the polygons. Cut the straws so that there are at least six straws in each of these lengths: 3 inches, 4 inches, 5 inches, 6 inches, 7 inches.
- Use pipe-cleaners to connect the straws. A pipe cleaner about 3 inches or longer can have one end put inside one straw and the other end put inside another straw so that the straws meet each other in the center of the pipe cleaner.
• Another way to make these materials: - Use drinking straws and string (such as kite string). The straws must be wide
enough so that the string can be strung through the straw from one end to another. - Use drinking straws as the sides of the polygons. Cut the straws so that there are at
least six straws in each of these lengths: 2 inches, 3 inches, 4 inches, 5 inches, 6 inches.
- Use string (a non-fuzzy kind). Put the string through one straw, then the next, then the next, etc. – and tie the two ends of the string at the end.
• Another way to get these materials: - A commercial product called “AngLegs” has plastic sticks of various sizes that can be
connected end to end in a way so that they are hinged. They work well for this activity. (Search online for “Anglegs” to find many vendors of the product.)
- There are probably other commercial products available. What to do:
1. a) Select 4 sticks of the same length and connect them to form a quadrilateral. b) Identify an item in the room (or think of one in your house) that has this shape. c) Since the sides are all the same length, what is the name of this type of
quadrilateral? d) Move the “hinges” to form different quadrilateral shapes using these four sides. On
paper, trace around this quadrilateral. What is the same about all of these quadrilaterals? (the sides remain the same). What is different about these quadrilaterals? (their angles vary).
e) Adjust the “hinges” so that all four angles are the same size. On paper, trace around this quadrilateral. What is the name of the type of quadrilateral formed?
f) Identify an item in the room (or think of one in your house) that has this shape. e) Can you adjust the hinges so that you have a concave quadrilateral? 2. a) Select 2 sticks of one length and 2 sticks of a different length. b) Put the sticks together so that the sticks that are the same size are NOT next to
each other (that is, not adjacent). Rather, the sticks of the same size will be opposite each other (on opposite sides of the quadrilateral). On paper, trace the quadrilateral.
c) Identify an item in the room (or think of one in your house) that has this shape. d) Can this quadrilateral be moved to form different shapes? If so, trace one of the
other shapes on paper. e) No matter how it moves, what is the name of the kind of quadrilateral formed? 3. a) Select three sticks and put them together to make a triangle. Trace the triangle on
paper. b) What type of triangle did you make? (that is, classify it by its angles and by its
sides). c) Identify an item in the room (or think of one in your house) that has this shape.

Section 8-3: Activities in Two-Dimensional Geometry
Page 8 - 24
d) Make more triangles so that you have one equilateral, one isosceles, and one scalene. Trace each of them (and label which is which).
e) For each of the triangles you made, can the figure move at its hinges to form a different shaped triangle? (In #1 above, the four sided figure could move at its hinges. Can a three sided figure move?)
f) Select three sticks that can NOT be made into a triangle. Explain how you know they cannot be made into a triangle. Sketch around this non-triangle.
4. a) Select five sticks and make a pentagon. i) Is your pentagon equilateral or not? ii) Can you adjust the hinges so that you have a concave pentagon? If so, trace it. b) Select six sticks and make a hexagon. i) Is your hexagon equilateral or not? ii) Can you adjust the hinges so that you have a concave hexagon? If so, trace it. c) Make a kite from four of the sticks. ii) Can you adjust the hinges so that you have a concave quadrilateral? If so, trace
it. 5. a) Use sticks to make this grid of squares: b) How many squares total are there? (Hint – there are more than ten.)
Triangle Stability In construction, triangle shapes are considered to be strong because they don’t “move” or
jiggle – they are stable. (Did you notice this in 3(e) above when you made triangles out of sticks?) In a house with a slanted roof, the wooden pieces that hold up the roof are called roof trusses, and they are usually in a triangle shape.
For example:
Diagram from http://www.ufpi.com/product/rooftrusses/types.htm

Section 8-3: Activities in Two-Dimensional Geometry
Page 8 - 25
Sections 8-2 and 8-3: Exercises in Two-Dimensional Geometry 1. Label each of the following curves as being: i) simple or not simple, and ii) closed or not closed. a) b) c) d) e) f) 2. For each of the following figures, i) Is it a polygon? If so, what type of polygon? ii) If it is a polygon, is it regular or irregular? iii) Is the shape convex or concave? a) b) c) d) e) f) g) h) i) j) k) l) 3. Can a shape ever be both convex and concave? Explain why you think so. 4. a) Sketch an irregular convex quadrilateral. b) Sketch an irregular concave quadrilateral. 5. Label each of the following as True or False. If false, explain why or give an example of why it is false (this is called a counter-example). a) Rectangles are always squares.
b) Every rectangle is a parallelogram.
c) A shape can be both a square and a rectangle.
d) Every square is a rhombus.
e) Every rhombus is a rectangle.
f) Every rhombus is a parallelogram.
g) Every rectangle is a trapezoid.
h) Squares are always rectangles.
i) Trapezoids are always parallelograms.

Section 8-3: Activities in Two-Dimensional Geometry
Page 8 - 26
6. Pattern Blocks, shown below, were discussed in the chapter on Patterns. A C B D E F a) Which of the pattern blocks are quadrilaterals?
b) What is the shape of block B?
c) Which of the pattern blocks are parallelograms?
d) Which of the pattern blocks have only acute angles?
e) Which of the pattern blocks have at least one obtuse angle?
f) Which of the pattern blocks have at least one right angle?
g) Which of the pattern blocks are regular polygons?
h) Which of the pattern blocks are rhombuses? 7. In this section we concluded that the sum of the angles of a quadrilateral equals 360
degrees. To demonstrate this, the quadrilateral was divided into triangles. Use that same method to determine the following.
a) What is the sum of the angles of a pentagon? Show how you know this. b) What is the sum of the angles of a hexagon? Show how you know this. c) Challenge: Can you predict the sum of the angles of a heptagon (7 sides) and an
octagon (8 sides)? 8. Use logical thinking and the facts about angles of triangles and quadrilaterals.
a) In a trapezoid, two of the angles are right angles, and another one measures 60 degrees. What is the measure of the fourth angle?
b) One angle of a right triangle measures 65 degrees. What are the measures of the other
angles?

Section 8-3: Activities in Two-Dimensional Geometry
Page 8 - 27
c) In an isosceles triangle, one angle measures 100 degrees. What do each of the other two angles measure?
d) In an isosceles triangle, the two angles that are equal each measure 38 degrees. What
does the third angle measure? e) An irregular quadrilateral has angles measuring 90°, 80°, and 70°. What does the fourth
angle measure? 9. Dominique was making a frame for a picture. She carefully measured and cut the pieces of
wood, and put them together. One pair of opposites sides were each exactly 10.5 inches long, and the other two sides were exactly 16 inches long. So she put them together and thought they must form a rectangle – but she was disappointed because it didn’t look quite right.
Did the pieces have to form a rectangle, simply because opposite sides were equal? Explain.
10. Two first grade students were sorting shapes of quadrilaterals into a group of rectangles
and a group of non-rectangles. They were arguing about where the square belongs. What would you tell them?
11. The clock in a classroom looks like this:
a) When it is exactly 4:00, what is the angle measure between the hour hand and minute hand?
b) When it is exactly 2:00, what is the angle measure between
the hour hand and the minute hand? c) When the minute hand sweeps out 5 minutes of time, how many degrees does it rotate
through? d) At exactly 6:00, what is the angle between the hour hand and the minute hand? e) At exactly 9:00, what is the angle between the hour hand and the minute hand? f) If the angle between the minute hand and the hour hand is about 60 degrees and the
minute hand is on or very close to the 2, what are possible times the clock could read? g) If the angle between the minute hand and the hour hand is 120 degrees and the hour
hand is on or close to the 8, what are possible times the clock could read? 12. Give an example from “everyday life”, such as items you could find in a home or classroom
or outdoors, for each of the following. Do not use the examples given in this chapter. a) Something that represents a one-dimensional object or figure. b) Something that represents a two-dimensional object or figure.

Section 8-3: Activities in Two-Dimensional Geometry
Page 8 - 28
c) Something that represents a three-dimensional object or figure. d) Something that represents parallel lines. e) Something that represents perpendicular lines. 13. Classify each of the following triangles in two ways: i) one way based on the angles and ii) one way based on the sides. a) b) c) d) 14. a) Are these two figures congruent? Explain. b) Are these two figures congruent? Explain. c) Are these two figures congruent? Explain. 15. Clarissa says “When I explain to children what a square is, I make sure that I only show
squares all week. I don’t want to confuse kids by showing something that’s not a square.” What do you think of this as a teaching strategy? Explain. 16. Explain why a responsible teacher of young children would disagree with this statement
made by a high school student: “I don’t need to know all that vocabulary in geometry class. I’m going to be teaching young children, and they don’t understand those big words.”
17. Give six examples of spatial vocabulary words that children in kindergarten might use.

Section 8-3: Activities in Two-Dimensional Geometry
Page 8 - 29
18. Using tangram pieces to make a variety of different shapes. Approach these tasks with a child’s curiosity. Children regularly face situations that are new
to them, in which they don’t know how to proceed. Part of the maturing process is to become familiar with more topics and situations. As an adult you may have to struggle with tangram pieces and to persevere when you don’t immediately know how to make shapes.
In any case, take this opportunity to explore various shapes and to share ideas. Spatial visualization improves with practice.
a) Using the medium triangle and the two small triangles, place them to make each of the
following shapes. Draw a sketch of how the pieces are placed to get the result. The first one is sketched for you. Suggestion: as you are trying to make one shape, you might happen to make a different shape, so then sketch that one.
Make this shape from the medium triangle and 2
small triangles Record how you do it
square
triangle
rectangle
parallelogram
trapezoid
b) Using the five smallest pieces (two small triangles, one medium triangle, square, and
parallelogram) place them to make each of the following shapes. Draw a sketch of how the pieces are placed to get the result. One is sketched for you. Suggestion: as you are trying to make one shape, you might happen to make a different shape, so then sketch that one.

Section 8-3: Activities in Two-Dimensional Geometry
Page 8 - 30
Make this shape from the 5 smallest tangram pieces
Record how you do it
square
triangle
rectangle
parallelogram
trapezoid
c) Using all seven tangram pieces, place them to make each of the following shapes. Draw
a sketch of how the pieces are placed to get the result. One is sketched for you. Suggestion: as you are trying to make one shape, you might happen to make a different shape, so then sketch that one.
Make this shape using all seven tangram pieces
Record how you do it
square
triangle

Section 8-3: Activities in Two-Dimensional Geometry
Page 8 - 31
rectangle
parallelogram
trapezoid

Section 8-4: Geoboards
Page 8 – 32
Section 8-4: Geoboards Geoboards are fantastic tools for exploring many aspects of geometry. A Geoboard is a flat,
square board with pegs projecting up from it. The pegs are in a square grid pattern. Rubber bands can be places around various pegs to form shapes. In another version of a geoboard, the pegs are in a circular shape rather than a square grid.
A rough drawing of a 5 x 5 Geoboard: Activity: Explorations with a Geoboard The first thing to do with a Geoboard is to engage in “free play” with it by putting one or more
of the rubber bands around one or more pegs. Then explore the geoboard in a more directed fashion as suggested in the activities below.
Students should work in small groups for the following directed activities. Each student will need a geoboard and several rubber bands. For each activity, each student should try the activity individually. Then those in the group should check each other’s work and discuss how their answers are the same or different (answers do not need to be the same). The comparisons and discussions are an important part of the activity!
In “About Teaching Mathematics” Marilyn Burns suggests directions number 1 through 4
below (Burns 2000: 95). 1. Make a shape that touches five pegs. (Think of the rubber band as a fence, and the pegs
it touches as fenceposts.) Then try shapes that touch six and four pegs. 2. Make a shape that has three pegs inside. (That means if the shape is a fence the pegs
inside are trees inside the fence.) 3. Make a shape that has ten pegs outside it, not touching the rubber band. (Think of them
as trees growing outside the fence). 4. Make a shape that has five fenceposts with three trees inside. Then try six fenceposts
with two trees inside and three fenceposts with two trees inside. A challenge: Are there any combinations of fenceposts and trees that are not possible?”
5. Line Segments A rubber band can represent a line segment by going around pegs that line up, so there
will be practically no space inside the rubber band. For example: two line segments are shown here
a) Make two line segments that are parallel to each other. b) Make two line segments that are perpendicular to each other. c) Make two line segments that intersect but are NOT perpendicular to each other. (to
intersect means that the line segments cross each other – they have one spot where their rubber bands overlap.)
d) Make the longest line segment you can make on the Geoboard.

Section 8-4: Geoboards
Page 8 – 33
e) Can you make the second-longest line segment possible? Are you sure it is the second-longest possible? Discuss.
6. Triangles
a) Make a right triangle. Notice if it is isosceles or scalene. b) Make another right triangle ! if your first one was isosceles, then make this one
scalene, and vice versa. c) Make an isosceles triangle that is obtuse. d) Make an isosceles triangle that is acute. e) Make a scalene triangle that is not a right triangle. f) Make a right triangle. Make another right triangle that is congruent to the first one, but
is in a different location. Then make a third right triangle that is congruent to the other two, but again is in a different location.
7. Quadrilaterals
a) Make two squares of different sizes. b) Make a rectangle that is not a square. c) Make a parallelogram that is not a rectangle. d) Make a rhombus that is not a square. e) Make a trapezoid. f) Can you make a kite? g) Make a quadrilateral in which all four sides are different lengths. h) Make a concave quadrilateral.
8. More Polygons
a) Make a concave pentagon. b) Make a concave hexagon. c) Make a convex pentagon. d) Make a convex hexagon. e) Make a regular octagon. f) Make a 12-sided polygon. g) Make a polygon with as many sides as possible on the Geoboard. How many sides
does it have?
Online Geoboards There is great value in using a “real” Geoboard – using the physical motions needed
for the Geoboard can aid in learning. This is especially true for kinesthetic learners. But for those times when you don’t have an actual Geoboard, and you do have internet access, consider using an online Geoboard.
The “National Library of Virtual Manipulatives” (NLVM) has online Geoboards at http://nlvm.usu.edu/en/NAV/frames_asid_172_g_2_t_3.html (The NLVM also offers many online manipulatives; see http://nlvm.usu.edu/en/NAV/vlibrary.html ) Another online Geoboard is at http://www.mste.uiuc.edu/users/pavel/java/geoboard/
(in Dec. 2008). The National Council of Teachers of Mathematics has an interactive Geoboard at http://standards.nctm.org/document/eexamples/chap4/4.2/

Section 8-4: Geoboards
Page 8 – 34
Geoboards Exercise - Recording and Classifying Triangles
GOAL: Record every possible non-congruent triangle that has the bottom of the 5 x 5 geoboard as the base of a triangle. One is completed for you.
Label each drawing for the type of triangle it is. Each drawing will have two labels: – one refers to the angle classification (right, acute, or obtuse) – one refers to the side classification (equilateral, isosceles, scalene)
There are 12 distinct triangles, and then 8 others that are congruent to some of the 12. (Two triangles are congruent when they have the same shape and size, but may be in different places or “flipped” on the geoboard. Do NOT count or draw the congruent triangles.)
Angle label: ___right_______ Angle label: _________________ Angle label: _________________
Sides label: ___isosceles____ Sides label: _________________ Sides label: _________________
Angle label: _________________ Angle label: _________________ Angle label: _________________
Sides label: _________________ Sides label: _________________ Sides label: _________________
Angle label: _________________ Angle label: _________________ Angle label: _________________
Sides label: _________________ Sides label: _________________ Sides label: _________________

Section 8-4: Geoboards
Page 8 – 35
Angle label: _________________ Angle label: _________________ Angle label: _________________
Sides label: _________________ Sides label: _________________ Sides label: _________________
Angle label: _________________ Angle label: _________________ Angle label: _________________
Sides label: _________________ Sides label: _________________ Sides label: _________________
Angle label: _________________ Angle label: _________________ Angle label: _________________
Sides label: _________________ Sides label: _________________ Sides label: _________________

Section 8-4: Geoboards
Page 8 – 36
Geoboards Exercise - Making Quadrilaterals
In each 3 x 3 geoboard, draw a distinct quadrilateral Use the dots as corners (vertices) – as if you had a rubber-band.
Sixteen different quadrilaterals are possible. Don’t draw congruent shapes
(congruent items are the same size and shape but in a different location). It’s hard to find all 16! One concave quadrilateral is completed for you. Hints: Remember to use slanted (diagonal) lines in some drawings. Some are concave.
For each quadrilateral, label it: Is it a square, rectangle, parallelogram, trapezoid, or none of
these?
Is it convex or concave?

Section 8-4: Geoboards
Page 8 – 37
Geoboard Grids - 3 x 3 – in case you want to use them.

Section 8-4: Geoboards
Page 8 – 38
Geoboard Grids - 5 x 5 – in case you want to use them.

Section 8-5: Coordinate Geometry
Page 8 – 39
Section 8-5: Coordinate Geometry In an earlier section it was mentioned that a two-dimensional object has a length and width,
but no height or depth. Examples of a two-dimensional object are a flat piece of paper and a flat table top. A plane is the geometric term that refers to the idea of a two-dimensional flat surface that extends infinitely. A plane is not officially defined When we considered two-dimensional figures, such as polygons, each figure was in a plane.
Locating a Point in a Plane
Maps are one of the first ways we encounter locating points in two-dimensions. In order to tell somebody about the location of a point in a plane or on a part of a plane such as the surface of a piece of paper, it is necessary to give two pieces of information. As an example, consider a map of a town. Maps typically have a grid system with letters of the alphabet going along one side and numbers along the other. The map might have an index listing the streets or cities on the map, and next to each entry is a letter and number combination. This letter and number gives the location of that place on the map. Both the letter and number are needed to find the location on the map. One would look in the column for the letter and the row for the number.
For children in Pre-K to grade 2, the National Council of Teachers of Mathematics content standard in Geometry states that children should be able to “Specify locations and describe spatial relationships using coordinate geometry and other representational systems”. Two of the related Expectations for preK-2 are:
“• describe, name, and interpret direction and distance in navigating space and apply ideas about direction and distance;
• find and name locations with simple relationships such as ‘near to’ and in coordinate systems such as maps.”
From http://standards.nctm.org/document/chapter4/geom.htm
Young children can explore these concepts through a number of early activities. “Following a ‘path’, ‘mapping a route’, and playing games on a grid develops informal
knowledge of coordinate geometry. Using a coordinate system, it is possible to locate a particular street on a city map.“ (Smith 2006: 68)
The Rectangular Coordinate System
The Rectangular Coordinate System is a mathematical way of locating specific locations (or points) on a plane. The system is set up by having a number line that goes horizontally (from left to right) and a number line perpendicular to the first one. So the second number line is vertical, going from down to up. The two number lines cross each other at the zero on each line.
The horizontal number line is called the horizontal axis, and is usually also called the x axis. The vertical number line is called the vertical axis, and is usually also called the y axis.

Section 8-5: Coordinate Geometry
Page 8 – 40
• The plural of the word “axis” is “axes” (pronounced AX-eez) . There are two axes, the x axis and the y axis. • The place where the two axes cross is called the “origin”. It is where the number zero is on each of the two axes. • The x-axis is a number line with negative numbers to the left of zero and positive numbers to the right. The y-axis is vertical, with negative numbers below the origin and positive numbers above the origin. In the diagram below of a rectangular coordinate system, the axes are labeled from -6 to 6 because that is the size that fit nicely in the diagram. The axes actually go on in each direction forever, but only the part that fits in the diagram is labeled.
Vertical axis, or y axis.
Horizontal axis, or x axis
To specify where a point (or location) is on the coordinate axes, we describe how to get to the point if one starts at the origin. First we name the distance to go left or right. Second we name the distance to go up or down. Those two numbers are written in
parentheses, with a comma between them. You might think of it like this: ( x , y )
Examples: Look at these points on the graph.
The point (3,1) is labeled A. The point (3, !4) is labeled B.
The point (1,3) is labeled C. The point (0,!5) is labeled D. The point (–3, 4! ) is labeled E (Notice that the height of the point is half way between 4 and 5.) If this is new for you, it helps to draw directional arrows before plotting the point. For example, point D (0, –5) is ( 0 , –5 )

Section 8-5: Coordinate Geometry
Page 8 – 41
Ordered Pairs Naming Points The name of the point is called an ordered pair because the order of the two numbers matters. • The first number says how far to go left-or-right from the origin. The first number is called the x-coordinate. • The second number says how far to go up-or-down from the origin. The second number is called the y-coordinate.
x-coordinate y-coordinate
( x , y ) distance left-or-right distance up-or-down from origin from origin
Examples: Write the names of each of the labeled points, using correct notation for an ordered pair. Answers: E is (–5, 2) F is (–4, –2.5)G is (0, 2) H is (5, 0) I is (4, 5) J is (1! , –2)
Sometimes the numbers that label the places along the axes are not written. If no numbers are written, then assume that the places along the axis are one unit apart.
Practice Problems
Draw a dot at the point (4,1). Label it K Draw a dot at the point (–5,4). Label it L What is the ordered pair name of the dot labeled M?
What is the ordered pair name of the dot labeled N?

Section 8-5: Coordinate Geometry
Page 8 – 42
Answers to Practice Problems
Draw a dot at the point (4,1). Label it K Draw a dot at the point (–5,4). Label it L What is the name of the dot labeled M? (4, –2) What is the name of the dot labeled N? (–3, –4)
Cartesian Coordinate System !" Rectangular Coordinate System
The Rectangular Coordinate System was created by René Descartes, a famous French philosopher and mathematician of the early 1600s. It brings together ideas from algebra and geometry. Descartes (pronounced deh-CART) may be more famous for his philosophical statement “I think, therefore I am”, however he made major contributions to mathematics and science in addition to philosophy. The Rectangular Coordinate System is often called the Cartesian Coordinate System in honor of Descartes.
Application examples with larger or non-whole numbers Example of Rabbits (large numbers) Suppose Ken has decided to breed rabbits, and at the start of month 1 he has two
rabbits, one male and one female. He records how many rabbits he has at the end of the following months in a chart:
month 1 2 3 4 5 6 # rabbits 2 4 7 13 26 51
This data can be plotted on a graph. The horizontal axis can represent the number of
months, and it should be labeled from 0 through 6. The vertical axis represents the number of rabbits, and it must be labeled from 0 through 51 or more.
Notice the problem that occurs if the same scale is used for each axis: The horizontal axis could be labeled with the numbers a reasonable distance apart, and then the vertical axis would be so long that it wouldn’t fit on the paper! Conversely, to make the vertical axis fit on the paper, the numbers on the horizontal axis would be too close together to read them easily.

Section 8-5: Coordinate Geometry
Page 8 – 43
The solution to this problem is to use a different scale on the two axes. The horizontal axis could be labeled from 0 through 6 with one mark for each number. The vertical axis should be planned so that it fits on the paper, so each mark might represent a distance of 5. Then the vertical axis labels would be as below. Observe the pattern of the dots. It reveals the growth pattern of the rabbit population. To understand the pattern properly, one must also notice the scales on the axes.
Notice that each axis is labeled with a word indicating what that axis is representing. In our earlier examples there were no labels on the axes since they were not representing applications. Axes should always be labeled with words when they represent an application.
Example of Earnings (large numbers) For many weeks Darla kept track of how many hours she worked as a server at the
restaurant and how much she earned in pay and tips combined. Here is what she recorded:
hrs worked 40 35 38 44 30 28 42 36 earnings in $ 410 427 345 572 372 457 500 454
• To plot this data in a coordinate graph, one of the variables is selected for the horizontal axis – let’s put hours worked on the horizontal axis. The scale on the horizontal axis must include the numbers in the table for hours worked –a low of 28 and a high of 44. The scale could begin at zero and go to 44 (or beyond). The numbers marked along the axis should be evenly spaced; marking numbers that are five apart would make a reasonable number of markings. • The scale on the vertical axis represents earnings, and it must include all the earnings numbers, which go from 345 to a high of 572. It would be convenient to mark numbers that are 50 apart, and to end the scale at 600.

Section 8-5: Coordinate Geometry
Page 8 – 44
Notice that the axes have the scales marked.
And the axes have labels in words indicating what the numbers represent.
The odd thing about the graph is that the points cluster in a small part of the grid. That makes them a bit harder to read or interpret.
In this situation, the graph might be easier to read if the axes were labeled only with the numbers in the range that is of interest in the data. So the horizontal axis would be from about 20 to 45. The vertical axis could go from about 300 to 600.
On this graph the plotted points are easier to read.
However, the reader must be careful to notice the scales on the axes. And also notice that the axes do not cross at (0, 0) like most Cartesian graphs.
Summary about axes labels
• Each axis should have its scale marked. • The two axes do not need to have the same scale. • The scales should be chosen so that the plotted points are easy to read. • The scales do not need to start at zero. But be aware that the graph can
be misleading when the scales do not start at zero. It is best to indicate the scales do not start at zero by putting a zig-zag mark in the area where numbers are missing.
• In an application, each axis should be labeled with words explaining what the numbers on that axis represent.

Section 8-5: Coordinate Geometry
Page 8 – 45
Example of Vision Therapy Times (non-whole numbers) A vision therapist assigns exercises to her clients. She wants to know how long the
clients spend on the exercises, so she asks Juanita to record each day how long the exercises took. Note that it is not a race; faster is not better. And the exercises being done are not the same each day. The therapist simply wants to gain some idea how long the work takes.
The data collected is in this table. Tables giving data can be horizontal or vertical; earlier examples had horizontal tables and this one is vertical.
To graph this data in a coordinate system, the horizontal axis could represent the days and could simply be marked from 0 through 8. The vertical axis, representing the times, must be marked to 12.4 at least, so going to 13 would be good.
Notice that the times are not all whole numbers. The vertical axis might be marked only in whole numbers. And then the dot will be placed at the correct height between the markings for the whole numbers. For example, the dot for (1, 8.1) will go slightly above the mark for 8.
Look at the dot for (7, 12.4) – notice its height at 12.4 – it is almost half way between 12 and 13, but a little less than half way between.
Day Time in minutes
1 8.1 2 7.6 3 10.5 4 11.0 5 9.2 6 10.9 7 12.4 8 9.0

Section 8-5: Coordinate Geometry
Page 8 – 46
Game: Dot Line Score Learning goal: to become familiar with the coordinate grid Play with a partner (or 3 could play together). Materials needed:
- one grid (from 0 to 6 each direction), - one set of objects/markers to place on grid points (such as small cubes),
- two dice of different colors. Before starting, decide which color of die will give the left-right distance to move (which is the first coordinate of a point) and which color of die will give the up-down distance to move (the second coordinate of a point). Remember this throughout the game or write it down. Players take turns. Decide who goes first. After each turn, record the score on Score Sheet. On a player’s turn:
• Toss the two dice. • Put a marker on the spot on the grid indicated by the dice.
Example: if the die of color indicating left-right landed 3 and the die of color indicating up-down landed 5, Then the name of the point is (3,5). Write the point name on the score sheet.
From the origin - which is point (0,0) – move right 3 and up 5. Put a marker at the place where the grid lines intersect at the point (3,5).
If there was already a marker in that place, then lose the turn. • Score this turn as shown in the box below, and write it down on the score sheet..
· Score is 1 point if the marker is not lined up next to any other markers on the board. · Score is 2 if the marker creates a line of 2 markers. · Score is 3 if a line of 3 markers is created. · Etc. · Lines can be horizontal, vertical, or diagonal. · A line might be created by the marker going to the end of an existing line,
or going in between other markers and creating a line. · If the marker creates lines in different directions – the player must decide which of those lines to score. (Of course the player wants to score the line created by the most markers. But only one line may be scored.)
Stop the play when the board is filled up or when you run out of time.
At the end, each player should add up his/her score to determine the winner.
Example of scoring:
If the piece was already at (5,5), then when you place this piece at (6,5), score 2 points for this line segment created by 2 markers.
If the three pieces at (2,4), (3,3), and (5,1) are already on the board, then when you place this piece at (4,2), score 4 points because you created a line segment using 4 markers.

Section 8-5: Coordinate Geometry
Page 8 – 47
Game: Dot Line Score - playing grid
· Score is 1 point if the marker is not lined up next to any other markers on the board. · Score is 2 if the marker creates a line of 2 markers. · Score is 3 if a line of 3 markers is created. · Etc. · Lines can be horizontal, vertical, or diagonal. · A line might be created by the marker going to the end of an existing line,
or going in between other markers and creating a line. · If the marker creates lines in different directions – the player must decide which of those lines to score. (Of course the player wants to score the line created by the most markers. But only one line may be scored.)

Section 8-5: Coordinate Geometry
Page 8 – 48
Game: Dot Line Score - Score sheet Write the name of the point rolled in standard notation. Examples: (3,5) or (6,1)
Player 1 name:
Player 2 name:
point rolled
Score this turn
Score total so far
point rolled
Score this turn
Score total so far

Section 8-5: Coordinate Geometry
Page 8 – 49
Section 8-5: Exercises on Coordinate Geometry
1. Practice plotting points – and make a picture while you do. On the rectangular coordinate system to the left: · put a dot at the first point · put a dot at the second point · draw a line segment to connect those two points · put a dot at the third point · draw a line segment to connect the second to the third
point · put a dot at the fourth point · draw a line segment to connect that point to the one
before it · etc. – keep following this pattern until all the points are
dotted and connected. first (4, 0) eighth (5, 8) second (1, 3) ninth (6, 8) third (0, 5) tenth (7, 7) fourth (1, 7) eleventh (8, 5) fifth (2, 8) twelfth (7, 3) sixth (3, 8) thirteenth (4, 0) seventh (4, 6)
2. More point plotting and picture creation.
On the rectangular coordinate system to the left, put a dot at each of the points named. Also draw a line segment from the first point to the second, then from the second point to the third, and so on. first (3, 1) Start over connecting these pts,: second (2, 2) first (0, 0) third (–2, 1) second (–1, 0) fourth (–2, –2) third (–1, –1) fifth (1, –2) fourth (0, –1) sixth (1, 0) fifth (0, 0) seventh (2, 0) eighth (2, –2) ninth (3, –2) tenth (3, 1)
3. a) On the grid to the right, write the coordinates
of each of these labeled points: A is ___________ B is ___________ C is ___________ D is ___________ b) Put a dot and label with the letter: M at (–20, 15) P at (32, –20)

Section 8-5: Coordinate Geometry
Page 8 – 50
4. a) On the grid here, draw a “picture” or a “figure” that has about five points to ten points, and has line segments between some of the points.
b) In the space below the grid, write the names
of the points and state which ones should be
connected with lines. c) Then fold this paper and trade with another student who will draw the picture on the grid below simply by reading your points, while you draw the other student’s points on
his/her grid.

Section 8-5: Coordinate Geometry
Page 8 – 51
5. The approximate times needed for cooking baked potatoes in a microwave oven depends on how many potatoes are being cooked at once, as indicated in this chart. Graph the information, after marking the scale and labeling the axes.
6. Tamara recorded her son’s weight on his birthday every year, as shown here:
age 0 1 2 3 4 5 6 weight (pounds) 7.5 19 27 31 36 41 48
Graph this data. Label the scale on each axis. Choose a reasonable scale. Label what each axis is representing.
# of potatoes
time to cook (minutes)
1 4 2 6 3 9 4 11

Section 8-5: Coordinate Geometry
Page 8 – 52
7. Students in third grade were studying trash, waste, and recycling. Their project was to have all the students place their trash from lunch into one container, and then they weighed the trash each day for two weeks. Their goal was to reduce the amount of trash. Here were the results. Label the axes and graph the data.
day # trash
weight in pounds
1 8.1 2 6.3 3 7.1 4 6.8 5 6.7 6 5.5 7 6.2 8 4.5 9 5.0 10 5.5
8. A small business owner lets potential employees know the salary scale. Salaries depend on
years of experience, as shown in the table. Label the axes, choose a good scale, and plot this data in a coordinate system.
Years of Experience
Annual Salary
0 16,000 1 19,000 2 21,000 3 22,000 4 24,000 5 25,500 6 27,000 7 28,000 8 28,500

Section 8-6: Symmetry (Introduction, Reflective, Rotational, Symmetry in Three-Dimensions)
Page 8 – 53
Section 8-6: Symmetry (Introduction, Reflective Symmetry, Rotational Symmetry, Symmetry in Three-Dimensions)
When an object has symmetry, there is something the same about different parts of the
object. The left half of an object might look like the right half, such as the chair pictured below. Or an object might look the same when it is rotated or turned around, such as the plate below. The chair is an example of reflective symmetry and the plate is an example of rotational symmetry.
Humans appreciate and enjoy symmetry in objects. Symmetry provides a sense of balance
and harmony . Some homes as well as many grand buildings have symmetry. Many objects in nature are symmetric, such as some seashells , the arc of a rainbow, and many living creatures.
The Notre Dame Cathedral in Paris, pictured here, is a majestic building that was constructed about 800 years ago. The overall shape of the building is symmetric, as can be seen in this front wall. And many of the subparts of the building have their own symmetry, such as the round window in the center and each of the doorways.

Section 8-6: Symmetry (Introduction, Reflective, Rotational, Symmetry in Three-Dimensions)
Page 8 – 54
Second Bank of the United States, in
Philadelphia, Pennsylvania. The fence along the front is also
symmetric.
Lighthouse at Cape Disappointment State Park, Washington, with rotational symmetry if viewed from above.
Statue of a frog, and photo of a flower – each with reflective symmetry.

Section 8-6: Symmetry (Introduction, Reflective, Rotational, Symmetry in Three-Dimensions)
Page 8 – 55
Practice Problem: Think of at least four objects from nature that have symmetry. Make a rough sketch of
each object and note what type of symmetry it has. Share your list with classmates.
Symmetry in NCTM Standards The National Council of Teachers of Mathematics (NCTM) Geometry Standard for
Grades Pre-K – 2 includes the standard: • “Apply transformations and use symmetry to analyze mathematical situations” and the expectation that the student will: • “recognize and create shapes that have symmetry.” (http://standards.nctm.org/document/chapter4/geom.htm).
Asymmetric A figure that is not symmetric is called asymmetric. Here is a photo of tree branches and leaves that may
have an interesting shape, but the branch structure is not symmetric – it is asymmetric.
Note that some of the individual leaves have symmetry, but not the branches.
The quadrilateral and cloud below are each asymmetric. Practice Problems:
Find some objects in the room you are in now that have symmetry. Find some objects that do not have symmetry.
Reflective Symmetry Take a piece of paper and fold it in half. Draw and then cut a figure or design out of the paper so that the figure encloses at least part of the crease of the fold. For example: After cutting the figure, unfold it: The resulting figure has reflective symmetry, which is also called line symmetry or bilateral symmetry (“bilateral” means two sided). The two halves of the figure are mirror images of

Section 8-6: Symmetry (Introduction, Reflective, Rotational, Symmetry in Three-Dimensions)
Page 8 – 56
each other, meaning that they would lie exactly on top of each other if the paper were folded. The crease of the paper is where the line of symmetry is. Some polygons have reflective symmetry. For example, this rectangle has two lines of symmetry, as indicated by the dotted lines in the drawing. A figure with reflective symmetry might have only one line of symmetry, or might have more. This regular octagon has eight lines of symmetry. Four of the lines go from a vertex to the vertex directly opposite it. And four of the lines pass through the center of a side and the center of the side opposite it. Sketch in all eight lines here. In nature, a butterfly has reflective symmetry. The mirror test for reflective symmetry One way to check whether a figure has reflective symmetry is to use a mirror. A regular metal or glass mirror can be used in this way:
• a figure on paper is suspected to have a line of symmetry • A mirror is placed along the line of symmetry, perpendicular to the paper. Then look at the half of the figure on one side of the mirror plus the reflection of the
figure in the mirror. If that looks exactly like the original figure looked on the paper, then the line is indeed a line of symmetry.
Example A mirror
The tree on this paper is being tested. mirror The suspected line of symmetry is shown dotted in this diagram. The mirror is placed along the line of symmetry, perpendicular to the paper. Looking from the side, the half-figure on the paper plus the reflection in the mirror look like the original figure. Conclude that the original figure had the line of symmetry.
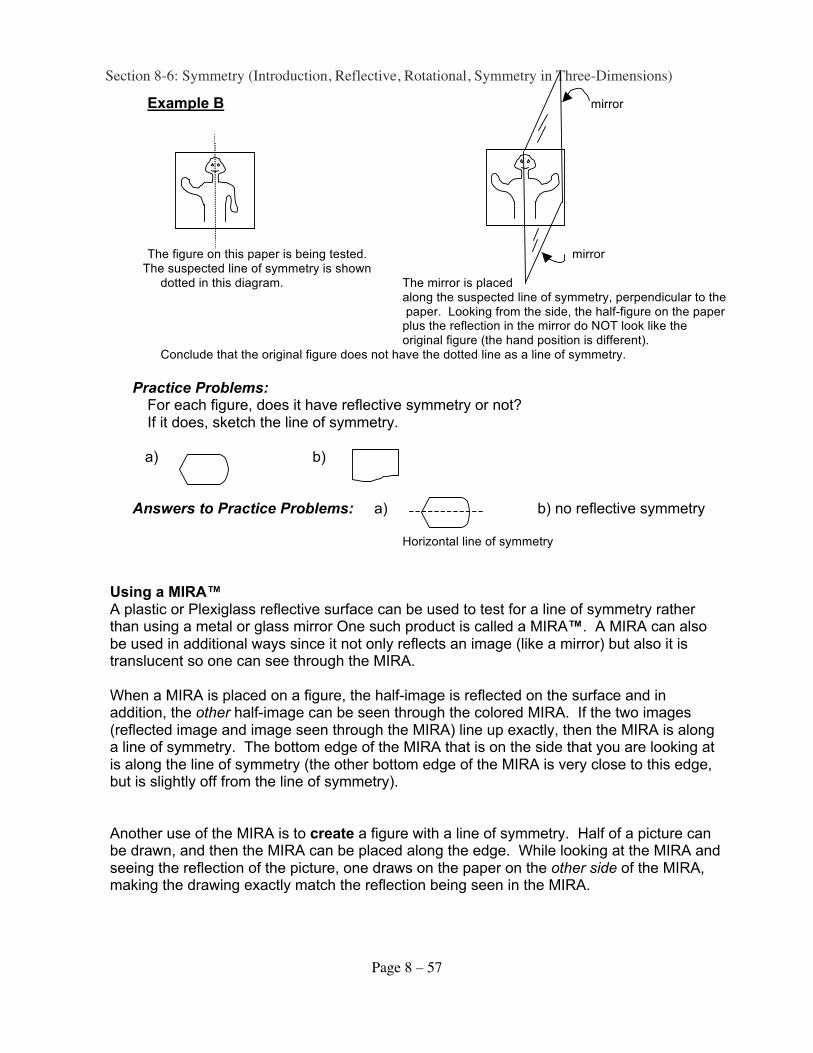
Section 8-6: Symmetry (Introduction, Reflective, Rotational, Symmetry in Three-Dimensions)
Page 8 – 57
Example B mirror
The figure on this paper is being tested. mirror The suspected line of symmetry is shown dotted in this diagram. The mirror is placed along the suspected line of symmetry, perpendicular to the paper. Looking from the side, the half-figure on the paper plus the reflection in the mirror do NOT look like the original figure (the hand position is different). Conclude that the original figure does not have the dotted line as a line of symmetry.
Practice Problems: For each figure, does it have reflective symmetry or not? If it does, sketch the line of symmetry. a) b) Answers to Practice Problems: a) b) no reflective symmetry Horizontal line of symmetry
Using a MIRA™ A plastic or Plexiglass reflective surface can be used to test for a line of symmetry rather than using a metal or glass mirror One such product is called a MIRA™. A MIRA can also be used in additional ways since it not only reflects an image (like a mirror) but also it is translucent so one can see through the MIRA. When a MIRA is placed on a figure, the half-image is reflected on the surface and in addition, the other half-image can be seen through the colored MIRA. If the two images (reflected image and image seen through the MIRA) line up exactly, then the MIRA is along a line of symmetry. The bottom edge of the MIRA that is on the side that you are looking at is along the line of symmetry (the other bottom edge of the MIRA is very close to this edge, but is slightly off from the line of symmetry). Another use of the MIRA is to create a figure with a line of symmetry. Half of a picture can be drawn, and then the MIRA can be placed along the edge. While looking at the MIRA and seeing the reflection of the picture, one draws on the paper on the other side of the MIRA, making the drawing exactly match the reflection being seen in the MIRA.

Section 8-6: Symmetry (Introduction, Reflective, Rotational, Symmetry in Three-Dimensions)
Page 8 – 58
Practice Problems using a MIRA or Mirror 1. Use a Mira or a mirror to locate lines of symmetry on these shapes. Sketch ALL of the
lines of symmetry. Write how many lines of symmetry each figure has. rectangle hexagon rhombus/diamond parallelogram

Section 8-6: Symmetry (Introduction, Reflective, Rotational, Symmetry in Three-Dimensions)
Page 8 – 59
2. Use a Mira to draw a figure with line symmetry. (A mirror won’t work for this.) Place the Mira along the dotted line, look through it at the reflection of the part of the figure provided here, and draw on the paper on the other side of the Mira so that your drawing matches the reflection you can see.
a) b) c) d) and e) Part of the drawing is given on each side of the line of symmetry. Fill in
parts on each side so that the total figure is symmetric. c) d) e) f) horizontal line of symmetry
Answers to Practice Problems using a MIRA or Mirror 1. rectangle – horizontal and vertical lines of symmetry hexagon – 6 lines of symmetry (through vertices, through centers of sides) rhombus – horizontal and vertical lines of symmetry parallelogram – no lines of symmetry 2. Check answers with classmates, or check them with the Mira.

Section 8-6: Symmetry (Introduction, Reflective, Rotational, Symmetry in Three-Dimensions)
Page 8 – 60
Cutting out designs with line symmetry Example C - Take a flat circular paper plate (small size, about 4 to 6 inch diameter, works fine) (or use a cut out circle about 6 inch in diameter) - Fold the circle in half, then in half again (perpendicular to the first fold). - Cut out pieces along any or all of the edges,
cutting through all 4 thicknesses at once – such as the dotted lines in this example. Hint: it’s easy to cut out “angles” or triangle shapes.
- Open it up and notice the symmetries.
Example D - Take a square piece of paper (maybe six inches on a side – any size is okay) - Fold the paper in half, then in half again (perpendicular to first fold). - to make it more interesting, fold once more along the diagonal of that last shape
- Cut out pieces along any or all of the edges, cutting through all 4 (or 8) thicknesses at once
- Open it up and notice the symmetries. This example shows the shape after 3 folds, with 8 thicknesses.
Extension: Make snowflakes from circular or square pieces of lightweight paper. Fold each piece of paper multiple times and cut chucks out of the layered paper on each fold.
Rotational Symmetry An object or an image has rotational symmetry if the object can be rotated, or turned, around a point and before it has turned a full circle it looks exactly like it did at the start. Example E - to explore this idea of rotational symmetry: • a) Use translucent tracing paper (that is, light paper you can “see through”) and trace the
figure below that looks a little like a pinwheel. Also write the letters on your tracing – even though the letters are not part of the figure but are there to help us describe what is going on.
• b) Place your traced figure exactly on top of the original figure on this page. And place a pencil or pen tip in the center of the figure (where the straight lines cross). Rotate or turn your tracing paper in a clockwise direction (towards the right) around the pencil tip – turn it until the figure on the tracing paper once again exactly lines up with the original figure. (Note that the letters won’t match up – they are not part of the figure.)
B
C
D
A

Section 8-6: Symmetry (Introduction, Reflective, Rotational, Symmetry in Three-Dimensions)
Page 8 – 61
• c) Did you notice that the figures line up when the triangle labeled A on the tracing paper
was directly on top of the triangle labeled B on the original figure? What size of a rotation was that? It was ! of a full rotation around a full circle. A full
circle has 360 degrees, so ! of that is 90 degrees. Hence this was a 90° rotation. We say that this figure has 90° rotational symmetry.
• d) Keep the papers lined up as they were, with the tracing paper letter A triangle on top of
the original figure letter B triangle, and keep the pencil or pen tip at the center. Rotate again in a clockwise direction until the figure on the tracing paper lines up exactly, once again, with the original figure. The triangle labeled A on the tracing paper lies on top of the triangle labeled C in the original figure.
Now the tracing paper has rotated exactly half way around a full circle, which is " of 360 degrees, which is 180°.
We say that this figure also has 180° rotational symmetry.
• e) Again rotate clockwise until the figures line up. The triangle labeled A on the tracing
paper lies on top of the triangle labeled D on the original figure. The total amount rotated was # of a whole circle, or 270°.
We say that this figure also has 270° rotational symmetry. • f) Rotate clockwise one more time until the figures line up. This time the letters in the
triangles also line up. The figure has rotated a full circle – 360 degrees. Conclusion for example E We can say that this figure has rotational symmetry for 90°, 180°, 270°, and 360°.
Example F - to explore the idea of rotational symmetry: Follow the same steps as in the previous example. That is: - Trace this figure below on translucent paper. Include the letters, though the letters and
the center dot, though the letters are not part of the figure but are useful for labeling and discussing.
- Place a pencil tip on the center dot and rotate the tracing paper until the figure lies on top of the original figure. Then letter P will lie on letter Q.
- Rotate the tracing paper again (in the same direction as before) until the two figures again coincide – and do this again if possible.
P
Q R •

Section 8-6: Symmetry (Introduction, Reflective, Rotational, Symmetry in Three-Dimensions)
Page 8 – 62
Conclusion for Example F The figures line up when the paper has been rotated 1/3 of a full circle, which is 1/3 of
360 degrees, or 120°. And they line up again after another rotation of 1/3 of a circle, which is a total of 240°, and finally at the rotation of a full circle.
We say this figure has rotational symmetry of 120°, 240°, and 360°. Practice Problems: For each figure, does it rotational symmetry? If so, what degrees of rotational
symmetry? a) b) c) Answers to Practice Problems: a) has “5-fold rotational symmetry”; degrees of rotational symmetry start at 1/5 of 360,
which is 72°, then 2•72= 144°, 3•72= 216°, 4•72= 288°, and 5•72= 360° b) no rotational symmetry c) has “2-fold rotational symmetry”; degrees of rotational symmetry are 180°, 360°
Notation and terminology for rotational symmetry The center of rotation is the point that the figure is rotated around (in these examples, it
is the point where your pencil or pen tip was kept during the rotation) There are several ways of describing the rotational symmetry of a figure. Consider the previous example E. $ We concluded that the figure of example E had rotational symmetry of 90°, 180°, 270°,
and 360°. That is one way to describe its rotational symmetry. $ Another way to describe the rotational symmetry of a figure is to name only the
smallest angle through which it can be rotated to coincide with itself. Once that smallest angle is known, then one can be certain that every multiple of that angle (up to 360°) is also an angle of rotational symmetry. In this terminology, the figure of example E has 90°
rotational symmetry. (And then it would be known without saying that it also has 2•90 = 180°, 3•90 = 270°, and 4•90 = 360°.)
$ A third way to describe rotational symmetry is to determine how many different angles
of rotational symmetry it has, up to and including 360°. In the case of example E, there are 4 angles of symmetry (90, 180, 270, and 360). In this terminology it is said that the figure of example E has 4-fold rotational symmetry. When a figure has 4-fold rotational symmetry, its smallest angle of rotation is ! of a full circle, or 90°.
Example of 6-fold rotational symmetry. As another example of the “n-fold rotational symmetry” terminology: If a figure has 6-fold
rotational symmetry, that means there are six angles up to and including 360° that it can

Section 8-6: Symmetry (Introduction, Reflective, Rotational, Symmetry in Three-Dimensions)
Page 8 – 63
rotate through and look identical to itself. The smallest of these angles would be 1/6 of a full circle; 1/6 of 360° is 60°. For such a figure, the angles of rotational symmetry would be 60° and all of its multiples until 360°, namely 60°, 120° 180°, 240°, 300°, and 360°. The figure has six angles of rotational symmetry.
What about 360° rotational symmetry? For any figure, if it is rotated 360° (which is one full circle), it will end up looking just like it
started out. It isn’t useful to say that EVERY figure has rotational symmetry! So, if the smallest angle of rotational symmetry is 360 degrees, we say that the figure does not have rotational symmetry. A figure is said to have rotational symmetry when it can be rotated through an angle of less than 360 degrees and match up with the original figure.
What about a circle? – Circular symmetry Consider a figure that is a circle, or several circles with the same center point. For
example, this figure could be rotated through ANY number of degrees and end up looking
the same as itself. There is no “smallest angle of rotational symmetry” since 1° would
work, but so would 0.5°, and 0.1°, and 0.02°, etc. smaller and smaller. Therefore, we do not say that this figure has rotational symmetry. Rather, we say that it has circular symmetry.
180 degree rotational symmetry A figure with 180° rotational symmetry looks the same upside down as right side up. A
quick way to check for 180° rotational symmetry is to turn the figure upside down and see if it looks the same. If a figure has 180° rotational symmetry, it might also have a smaller degree of rotational symmetry, which you should try to find.
If 180° is the smallest angle of rotational symmetry, then we could say the figure has 2-
fold rotational symmetry. Note that a figure with 2-fold rotational symmetry also has reflective symmetry.
Examples of rotational symmetry Many items have rotational symmetry. One example is playing cards, the typical deck of
52 cards. The cards are made so that they can be held in one’s hand with either end at the top. Most of the cards look exactly the same right side up or upside down (in fact, there is no “right” side since the two directions look the same). Some of the cards, particularly odd-number cards, do not have rotational symmetry; but some of the face cards and most of the even-numbered cards do. The cards that look the same upside down have 180° rotational symmetry (also known as 2-fold rotational symmetry). Those cards also then have reflective symmetry.

Section 8-6: Symmetry (Introduction, Reflective, Rotational, Symmetry in Three-Dimensions)
Page 8 – 64
Practice Problems on rotational symmetry: Consider the following shapes. What rotational symmetry, if any, does each figure have?
rectangle
regular hexagon isosceles trapezoid parallelogram oval circle
Answers to Practice Problems on rotational symmetry: Rectangle has 180° rotational symmetry, also known as 2-fold rotational symmetry.
Regular hexagon has 60°, 120°, 180°, 240°, 300°, and 360° rotational symmetry, also known as 6-fold.
Parallelogram has 180° rotational symmetry, also known as 2-fold. Isosceles trapezoid has no rotational symmetry. Oval has 180$ rotational symmetry, also known as 2-fold rotational symmetry. Circle has circular symmetry; it is not said to have rotational symmetry.

Section 8-6: Symmetry (Introduction, Reflective, Rotational, Symmetry in Three-Dimensions
Page 8 – 65
Symmetry in Three Dimensions The definitions of reflective and rotational symmetry given thus far all apply to two dimensional figures in a plane that include drawings or images of objects. That is, we have discussed symmetry in two dimensions. Similar concepts of symmetry apply in three dimensions, with actual objects. Reflective symmetry in three dimensions Reflective symmetry for figures or drawings in a plane was described by saying there is a line of symmetry that divides the figure so that the two halves are reflections of each other (like in a mirror). In three dimensions, reflective symmetry for an object means that there is a plane of symmetry that divides the object so that the two halves are reflections of each other (like in a mirror). So the two halves of the object are identical except for “direction” – meaning that what on one side goes left, on the other side goes right.
For example, the chair pictured here is a three-dimensional object. Consider if it were cut in half in the center by a vertical plane going from the front to the back of the chair. The two halves would look identical – except on one side the arm would curve to the left and on the other side it would curve to the right. And other parts would similarly curve left versus right.
The mug pictured here has reflective symmetry. The plane
of symmetry would be vertical and would cut the “front half” of the mug from the “back half” of the mug (here the “front” part of the mug means the part of the mug that is towards the front in this picture, and the “back” half is the part that is towards the back in this picture). That plane of symmetry would cut the handle exactly in half vertically.

Section 8-6: Symmetry (Introduction, Reflective, Rotational, Symmetry in Three-Dimensions
Page 8 – 66
Rotational symmetry in three dimensions Rotational symmetry for figures or drawings in two dimensions occurred when the figure could be rotated around a point in the plane so that the resulting figure looked just like the original figure. In three dimensions, rotational symmetry for an object means that the object can be rotated around a line so that it ends up looking just like the original object after being rotated some amount less than 360 degrees. This line is called the axis of rotation.
For example, consider this picture of a ceiling light fixture (this photo is taken looking up at the ceiling). The light fixture has three identical lamp parts projecting down from the ceiling. If the entire light fixture were rotated around a line we can imagine coming straight down from the ceiling in the center of the fixture, then after 1/3 of a rotation around the whole circle, the lamp would look identical with how it started. This line we call the axis of rotation. That angle of rotation is 1/3 of 360°, which is 120°.
This lamp has rotational symmetry of 120°,
240°, and 360°. This is also known as 3-fold
rotational symmetry.
Here is a picture of picture of a glass bowl that has
a design of leaves and grapes etched and sculpted along the sides. This picture is here so you can see what the bowl looks like from the side. The photo below is taken looking directly down at the bowl, so you can better see the symmetry of the design.
If the bowl were rotated around a line (or axis) that
came directly out of the center bottom of the bowl, then when it had rotated ! of the way around a circle, it would look identical to how it looks in its original position. The bowl and its design have 90°
rotational symmetry. And thus it also has 180°,
270°, and 360° rotational symmetry. Another way
to describe this is to say the bowl has 4-fold rotational symmetry.

Section 8-6: Symmetry (Introduction, Reflective, Rotational, Symmetry in Three-Dimensions
Page 8 – 67
Practice problem: Find an object in your home or classroom that has three-dimensional rotational symmetry.
If the vase pictured here were rotated around an axis that passes vertically through the center of the vase, it would look the same no matter how much it is rotated (except for slight imperfections in the pottery, which we can ignore). This vase has three dimensional circular symmetry. .
Practice problem: Find an object in your home or classroom that has three dimensional
circular symmetry. Young Children and Symmetry How should young children (age 0 to 8) work with symmetry? “For young children, exploration should be the primary focus of experiences with symmetry.” (Copley 2000: 115) Children explore symmetry in three dimensions when they play with building blocks or pattern blocks, and other objects. Also, on the playground some of the climbing apparatus may have symmetry. Symmetry can be explored during the study of various curriculum areas, not just math. Here are some examples of useful and easy ways of incorporating symmetry into various subjects. Art activities provide opportunities for exploring symmetry. For example, very young children can crease a paper in half then unfold it, put dabs of paint on one half, then fold and press the other half on top of it; when opened up, a symmetric pattern emerges. Once children can use scissors, they can fold a piece of paper in half, cut through both layers and open the paper to see a symmetrical image. Older children can draw half of an object, and use a Mira or mirror placed along the line of symmetry to view the whole object. Cutting snowflake shapes out of folded paper also gives insight into symmetry. Quilt patterns can be created by cutting out triangles and squares from colorful pieces of construction paper and placing them in symmetric patterns. Science studies are another rich source for observing and discussing symmetry since symmetry is so common in nature. For example, bring in insects and ask children to carefully observe them (count legs, look at wings and colors, etc.). “Using a specimen, place

Section 8-6: Symmetry (Introduction, Reflective, Rotational, Symmetry in Three-Dimensions
Page 8 – 68
a file card over one half of the insect. Ask children to predict what the covered side looks like. If they have observed insects carefully and thoughtfully, they’ll tell you its just like the side they can see.” (Seefeldt and Galper 2008: 156) Children can observe flowers such as daisies or daffodils and discuss how the flower could be rotated and it would still look the same. Many leaves have their stem as a line of symmetry. Ask children if they can fold a leaf in half so the two halves line up. In grades 1 through 4, symmetry can continue to be explored using objects, such as a butterfly or other insect specimens. Note with children how the butterfly will probably be almost symmetric, though not perfectly so. Objects in nature usually do not have “perfect symmetry”, but are very close to being symmetric. In addition, pictures, drawings, and more abstract items can be used in investigations of symmetry The symmetry of various letters of the alphabet could be discussed, and the symmetry of some words. For older children, a literature lesson could concentrate on making symmetric poems. . Musical symmetry also exists in both rhythms and musical notes. Symmetry can be explored through the use of technology using websites that provide information and experience with symmetry, or geometry programs. See the link listed below.
Website for symmetry
This link is to a great website for “playing around with symmetry”. Both reflective and rotational symmetry are included. Click on all the different options, which will allow you to check if figures have various types of symmetry, and to make figures with symmetry. http://gwydir.demon.co.uk/jo/symmetry/index.htm

Section 8-6: Symmetry (Introduction, Reflective, Rotational, Symmetry in Three-Dimensions
Page 8 – 69
Section 8-6: Exercises on Symmetry 1. a) Find at least ten items in your home that have symmetry. Choose items so that some
have line (reflective) symmetry and some have rotational symmetry. Some items may have both types of symmetry.
b) Make a list of the items. For each one, write what the item is, state its type(s) of symmetry, and draw a sketch of it or take a photo of it.
c) Bring at least one of the items to class to show others. 2. For each of the following figures (two-dimensional images), i) Draw in all the lines of symmetry (if any) ii) Write all the angles of rotational symmetry (if any) iii) Compare your results with a classmate. a) b) c) d) e) f) g) h) i) j) k) l)
MOM OX

Section 8-6: Symmetry (Introduction, Reflective, Rotational, Symmetry in Three-Dimensions
Page 8 – 70
3. If possible, sketch each of the following. a) Sketch a quadrilateral with 0 lines of symmetry. b) Sketch a quadrilateral with exactly 1 line of symmetry. c) Sketch a quadrilateral with exactly 2 lines of symmetry. d) Sketch a quadrilateral with exactly 3 lines of symmetry. e) Sketch a quadrilateral with exactly 4 lines of symmetry. 4. If possible, sketch a trapezoid with… a) no lines of symmetry b) one line of symmetry c) two lines of symmetry
5. Use this alphabet in a “plain” font (Arial is the font):
A B C D E F G H I J K L M N O P Q R S T U V W X Y Z a) Which letters have vertical line symmetry? b) Which letters have horizontal line symmetry? c) Which letters have 180° rotational symmetry?
6. Use this alphabet in a “plain” font (Arial is the font):
A B C D E F G H I J K L M N O P Q R S T U V W X Y Z a) Write at least three words that have line symmetry, and state if its vertical or horizontal. For example, MOM has vertical line symmetry. b) Can you think of a word with rotational symmetry? c) What is the longest word you can think of that has symmetry? 7. Geoboard Activity for Reflective Symmetry
Version for Two People - Two people each have their own Geoboard and play together as partners. - Place the two Geoboards next to each other. The line of symmetry will be the line where the two boards touch each other. - One person makes a figure with a rubber band on his/her Geoboard. At the beginning, make a fairly simple figure.

Section 8-6: Symmetry (Introduction, Reflective, Rotational, Symmetry in Three-Dimensions
Page 8 – 71
- The partner makes a figure on his/her Geoboard that would be a reflection of the first figure, a reflection across the line of symmetry. So, these two figures together have reflective symmetry, with the line of symmetry being the line where the two boards meet. - Switch roles: the person who makes the first figure this time is the one who made the matching figure last time. - Continue switching roles and making figures and matching them. Make more complex figures as you gain experience. - For Example: One person makes one of the figures below, and the partner makes the other.
Geoboard Activity for Reflective Symmetry
Version for One Person - This is the same as the activity for two people, except that one person plays both roles – makes a figure and then makes its symmetric figure. - This activity can be done in three ways: • use actual Geoboards • use a paper with Geoboards drawn on it, and draw the figures. Such paper is supplied at the end of these exercises. • use an online, free Geoboard program. The NCTM has one such site at
http://standards.nctm.org/document/eexamples/chap4/4.2/ This online Geoboard is large, so the line of symmetry can be thought of as
being the center row of pegs, and the figure can be made on one side and its matching figure on the other side.
The “National Library of Virtual Manipulatives” (NLVM) has online Geoboards at http://nlvm.usu.edu/en/NAV/frames_asid_172_g_2_t_3.html
- If you use actual Geoboards or online Geoboards, you can record some of your symmetric figures (the ones you find most interesting) on the Geoboard paper supplied at the end of these exercises.
8. a) Fill in this grid so that it has b) Fill in this grid so that it has horizontal line symmetry. vertical line symmetry.

Section 8-6: Symmetry (Introduction, Reflective, Rotational, Symmetry in Three-Dimensions
Page 8 – 72
c) Fill in this grid so that it has both d) Which of the completed grids horizontal and vertical line symmetry. in this problem (a, b, and/or c)
has rotational symmetry?
9. Consider each of the objects pictured here (think of them as actual objects, not as images in
a plane). For each object find the three dimensional symmetry (if any). i) Describe all of its planes of symmetry (if there are any) ii) Describe all of its degrees of rotational symmetry (if any) a) teddy bear b) door and windows
c) fan blades d) a ceiling light fixture

Section 8-6: Symmetry (Introduction, Reflective, Rotational, Symmetry in Three-Dimensions
Page 8 – 73
e) a plastic sandwich box, pictured from above
f) a craftsman style house. Ignore the house address and flag pole.
g) two views of the same salt shaker

Section 8-6: Symmetry (Introduction, Reflective, Rotational, Symmetry in Three-Dimensions
Page 8 – 74
h) a side view and top view of the same vase
i) Temple Beth Israel at Heritage Park j) a lamp in San Diego
k) a candle

Section 8-6: Symmetry (Introduction, Reflective, Rotational, Symmetry in Three-Dimensions
Page 8 – 75
l) replica of a house built by the Incas in the 1400s, m) a butterfly that is a bit battered in present day Ingapirca, Ecuador (assume the missing pieces are there)
10. a) Find at least five objects (or parts of objects) on the school campus that have either
reflective symmetry, rotational symmetry, or both. b) For each object, describe what and where it is located. Draw a quick sketch of each
object (or take a photo). And describe what type of symmetry it has. 11. Write a symmetric poem. • A symmetric poem is a poem that has some sort of symmetry in its words. It might be that
the top half and bottom half of the poem are reflections of each other. Or perhaps the left and right halves. Or perhaps if the words are rotated there would be symmetry.
• Suggestion: To write a symmetric poem, choose a topic, and make a list of words that are related to the topic, and then arrange them into some order.
• Example of a symmetric poem titled “Cows” Cows do In pastures Chew cud Contented Chew cud In pastures Cows do
• Notice that it is not that the printed words have symmetry, but rather that the use of the
words is symmetric. • Is it possible to have a poem that has both symmetry of words and symmetry of the
printing?

Section 8-6: Symmetry (Introduction, Reflective, Rotational, Symmetry in Three-Dimensions
Page 8 – 76
Geoboard Grid Paper Copy this sheet if you want more Geoboard Grid Paper.

Section 8-7: Three Dimensional Geometric Objects
Page 8 – 77
Section 8-7: Three Dimensional Geometric Objects A three dimensional object occupies space; it has length, width, and height.
National Council of Teachers of Mathematics Geometry Standards The National Council of Teachers of Mathematics (NCTM) Geometry Standard for grades
Pre-K – 2 includes both two- and three-dimensional geometry: “Analyze characteristics and properties of two- and three-dimensional geometric shapes and develop mathematical arguments about geometric relationships”
The related Expectations are that students should: “• recognize, name, build, draw, compare, and sort two- and three-dimensional shapes; • describe attributes and parts of two- and three-dimensional shapes; • investigate and predict the results of putting together and taking apart two- and three-dimensional shapes.”
(From http://standards.nctm.org/document/chapter4/geom.htm.)
For young children, playing with blocks, such as wood building blocks, is a major way to
explore three-dimensional geometric solids. Polyhedron Vocabulary
The Washington Monument, in Washington, D.C., is pictured here. The monument is an example of a three-dimensional object called a polyhedron. We will look at the components of this and other polyhedra in this section. We will start with some basic definitions.
Recall that a polygon is a two-dimensional figure whose sides are all straight line segments
and it is a simple closed curve. A polygonal region is the polygon plus its inside. The polygon is the outer edges, the polygonal region is the outer edges plus the interior.
Example: polygon: polygonal region: (“Polygonal region” is pronounced “puh-LIG-un-al RE-jun”.)

Section 8-7: Three Dimensional Geometric Objects
Page 8 – 78
In three-dimensions, a closed shape whose sides are all polygonal regions is called a
polyhedron (pronounced polly-HE-dron). To be a closed shape means that there are no holes in the shape; rather, a polyhedron closes up space inside of it, like a container with no opening to the inside. If it was full of water, the water could not come out. A polyhedron is like a container but with all of its surfaces being flat, not curved. So a can, like a soup can, is NOT a polyhedron because it has some curvy surfaces. One example of a polyhedron is a typical rectangular-shaped cardboard box with a lid. For example:
This polyhedron ! has a rectangular region in the front (shaded grey) and a congruent rectangular region in the back. The top and bottom are also rectangular regions. The left and right sides are rectangular regions that look like they might be squares. Each of the polygonal regions of a polyhedron is called a face. The example
polyhedron above has six faces. The straight line segments where two polygons meet are called edges. The example
rectangular polyhedron above has 12 edges. Each corner where two or more edges (line segments) meet is called a vertex. The
plural of vertex is vertices. In the example shown above, how many vertices are there? Answer: 8 vertices,
The vertices are pictured as dots in this diagram ! Below is another example of a polyhedron – this one might remind you of a house. It is also
similar to the shape of the Washington Monument pictured above, except the monument’s bottom rectangular portion is much taller.
This example has a rectangular region as the lower front face (shaded grey). In addition, there are rectangular regions on the right side, left side, back side, and bottom.
The upper front part is a triangular region. There are also triangular regions on the upper left, upper right, and upper back.
There are 5 rectangular faces and 4 triangular faces, for a total of 9 faces.
In the examples below, some of the vertices and some of the edges have been pointed out.
vertex edge
• •
• •
•
•
•
•

Section 8-7: Three Dimensional Geometric Objects
Page 8 – 79
The plural of polyhedron is polyhedra. In the diagram above there are two polyhedra pictured. NOTE: The dotted lines in the sketches above indicate edges that are on the “back” side of the polyhedron while the solid lines indicate edges on the “front” side of the polyhedron.
Practice problems: For each of the following polyhedra, find the following information: a) How many faces? What is the shape of each face (which type of polygon is it)? b) How many edges? c) How many vertices? 1. 2. 3. Answers to Practice Problems: 1. a) 2 triangle-shaped faces, 1 rectangle on bottom, 1 rectangle on right side, 1 rectangle
on left side ! total of 5 faces b) 9 edges c) 6 vertices 2. a) 4 rectangular faces on sides (left, right, front, back) and 2 rectangles that might also
be squares (top and bottom) ! total of 6 faces b) 12 edges c) 8 vertices 3. a) smaller triangle shape on bottom, triangle on left side, in “front” and on back side !
total of 4 faces b) 6 edges c) 4 vertices
Prisms and Pyramids

Section 8-7: Three Dimensional Geometric Objects
Page 8 – 80
Prisms and pyramids are special types of polyhedra. Here are pictures of one prism (the candy box on the left) and one pyramid (the clear plastic pyramid on the right). They are like each other in that each has a polygon as a base. They differ from each other because a prism has its “top” side the same as its base whereas a pyramid has simply one point as its “top”. (The word “top” is in quotes because the prism or pyramid can be rotated in any direction – there isn’t really a “top”. However, the figures are often pictured with one side on top and that is what is being referred to here.)
Prisms
A prism is a polyhedron with the following characteristics: - its bottom base is a polygon - its top base is a polygon that is congruent to the bottom base, and is in a plane
parallel to the bottom base - its sides are the faces which join the bases to each other. There are two general kinds of prisms: • a “right prism” which has its sides at right angles to the bases. In a right prism,
the side faces are rectangles. • an “oblique or slanted prism” which has its sides slanted between the bases. In
an oblique prism, the side faces are parallelograms. Prisms are named by the shape of the base. For example: if the base is a triangle, then it is a triangular prism; if the base is a pentagon, then it is a pentagonal prism; etc.
rectangular prism triangular prism hexagonal prism Special case: For a rectangular prism, if all six faces are congruent squares, then the shape is typically called a cube, as pictured here ! Here is an example of an oblique prism (the top and bottom bases are not directly above each other, the side faces are parallelograms). This is an oblique rectangular prism !

Section 8-7: Three Dimensional Geometric Objects
Page 8 – 81
Pyramids A pyramid is a polyhedron with the following characteristics: - its bottom base is a polygon - above the base is one point, called the apex, which is the highest point of the
pyramid, and it is the vertex of each of the triangular side faces - the side faces are triangular, with the bottom of the triangle being an edge of the
base, and the top vertex of each triangle being the apex of the pyramid There are two general kinds of pyramids: • a “right pyramid” in which all the side faces are isosceles triangles and the apex
appears to be “centered” over the base. • an “oblique or slanted prism” in which the apex appears to be off-center, and the
side faces are not isosceles triangles. Pyramids are named by the shape of the base. For example: if the base is a triangle, then it is a triangular pyramid; if the base is a square, then it is a square pyramid; etc.
Diagram of a square pyramid : (the base is square) This is a square right pyramid. The traditional pyramid is like the famous pyramids of ancient Egypt, pictured below. It is a bit difficult to tell from this photo, but the base of the pyramid is a square; it is a square right pyramid.
Public domain image from http://karenswhimsy.com/pyramids-of-egypt.shtm

Section 8-7: Three Dimensional Geometric Objects
Page 8 – 82
A triangular pyramid. A hexagonal pyramid. A triangular right pyramid A hexagonal right pyramid.
(the base is a hexagon)
Below are two examples of oblique pyramids (the apex is not centered over the base).
Oblique triangular pyramid Oblique square pyramid
Cylinders and Cones Cylinders and cones are a lot like prisms and pyramids except that they have curvy parts rather than all flat faces. Cylinders and cones are NOT polyhedra, since they do not have all flat polygonal regions as faces.
Cylinders An example of a cylinder is a typical can (such as a soup can). A cylinder is a three dimensional solid with the following characteristics: - its bottom base is a closed curve in a plane - but it is NOT a polygon. - its top base is identical to the bottom base, and is in a plane parallel to the
bottom base - its side is all of the surface that connects the bottom base to the top base (it is all
the line segments that connect points of the bottom base to the identical points of the top base).

Section 8-7: Three Dimensional Geometric Objects
Page 8 – 83
There are two general kinds of cylinders: • a “right cylinder” which has its sides at right angles to the bases. • an “oblique or slanted cylinder” which has its sides slanted between the bases. A right circular cylinder ! A right cylinder that is not circular. ! The top base (shaded grey) is the same shape as the bottom base, and the sides are perpendicular to the bases.
This is a camel puzzle. Its shape is a cylinder – a camel shaped cylinder. The bottom base (lying on the table) and the identical top base are in the shape of a camel. Note that it is a non-circular cylinder.

Section 8-7: Three Dimensional Geometric Objects
Page 8 – 84
Here is an oblique cylinder !
Activity for young children: What is a Cylinder? Interview a 6 or 7 year old child and record the conversation. Have a collection of cylindrical items such as a can of fruit, a hair roller, a towel roll. Have the child describe the shape of each object. Ask the child: How are they similar? How are they different? (The idea of this exercise, and more details about it, is in Smith 2006: 72.)
Cones An example of a cone is an ice-cream cone (not the ice cream itself, but the kind of cone that is pointed at the bottom). Another example is a “birthday party hat”. A cone is a three dimensional solid with the following characteristics: - its bottom base is a closed curve in a plane – but it is NOT a polygon. Usually it
is a circle. - above the base is one point, called the apex or vertex - the side is all of the surface that connects the edges of the bottom base to the
one vertex point. There are two general kinds of cones: • a “right cone” which has the apex appears to be “centered” over the base and the
side faces are all isosceles triangles. • an “oblique or slanted prism” in which the apex appears to be off-center, and the
side faces are not isosceles triangles.
A right circular cone An oblique circular cone

Section 8-7: Three Dimensional Geometric Objects
Page 8 – 85
Truncated pyramids and cones In general, “truncated” means cut short or chopped off. A truncated pyramid is one in which the apex and part of the pyramid near the apex has been chopped off. A truncated cone is one in which the vertex point and part of the cone near the vertex has been chopped off. Lamp shades are often in the shape of a truncated cone (the outer surface of the truncated cone). A truncated hexagonal pyramid. A truncated cone. Some salt shakers have this shape. Some lamp shades have this shape.
Note: In mathematics classes in Calculus, “cylinder” is a more general word that includes what are here called cylinders and prisms. So, if you ever take calculus, be aware that prisms and cylinders are all called cylinders.
Regular Polyhedra Recall that a regular polygon has all of its sides the same length and all of its angles the same size. A regular polyhedron has all of its faces exactly identical to each other (that is, congruent to each other), and each side is a regular polygonal region. The regular polyhedra are also called the Platonic solids. Notice that the two polyhedra pictured above are NOT regular polyhedra since their faces are NOT all identical. The polyhedron pictured on the right above has rectangular regions as all of its faces, but they are not the same size rectangles, thus it is not a regular polyhedron. The ancient Greeks determined that there are only five regular polyhedra, named and described as follows: • Tetrahedron – has four faces congruent to each other; each is an equilateral triangle. This shape is also an equilateral triangle pyramid. • Hexahedron – has six faces congruent to each other; each is a square. A hexahedron is more commonly known as a cube. • Octahedron – has eight faces congruent to each other; each is an equilateral triangle. • Dodecahedron – has 12 congruent faces; each is a regular pentagon. • Icosahedron – has 20 congruent faces; each is an equilateral triangle.

Section 8-7: Three Dimensional Geometric Objects
Page 8 – 86
Tetrahedron Hexahedron Octahedron photo and diagram photo and diagram diagram
Online Regular Polyhedra
! The National Library of Virtual Manipulatives has a site with regular polyhedra. Try it out! You can rotate the shapes by clicking and dragging. You can color various parts. Read the directions on the right side. http://nlvm.usu.edu/en/nav/frames_asid_128_g_3_t_3.html?open=instructions ! This site has information about the platonic solids, with an options to “spin” them and to print “nets” to construct the solids http://www.mathsisfun.com/platonic_solids.html

Section 8-7: Three Dimensional Geometric Objects
Page 8 – 87
Spheres and Hemispheres A sphere (pronounced sfeer) is the set of points in space that are all the same distance from a center point. A round ball is an example of a sphere. A sphere is very “regular”, but it is not a polyhedron since it does not have flat faces. So a sphere is not a regular polyhedron because it isn’t a polyhedron at all. A hemisphere is half of a sphere. sphere hemisphere
The planet earth is another example of a sphere. The planet it not perfectly round as a sphere is, but it is close. The “northern hemisphere” is the part of the earth that is north of the equator. The “southern hemisphere” is the part that is south of the equator. Those two hemispheres together make up the entire earth. Be aware of the difference between a circle and a sphere. A circle is a two dimensional figure; it is “flat” since it lies in a plane. A hula-hoop could represent a circle. A sphere is three dimensional; it takes up space, like a ball.

Section 8-7: Three Dimensional Geometric Objects
Page 8 – 88
Activities with Three-Dimensional Objects Classification of Shapes Materials: - A set of three dimensional geometric solids of many types. These solids may be
made of plastic or wood or foam. The set of objects might include “everyday objects” from home or the classroom.
- yarn or string for making loops around sets of objects. Preferably different colors of yarn or string so the sets are easier to tell apart.
- Labels that correspond to each of the type of three dimensional solid listed below. Goals: Classify and categorize 3-D objects. Use Venn Diagrams (created by loops of yarn) in the classification. Activity: Sort and classify the objects into the following sets, and place each set into a loop of yarn or string.
Prisms Pyramids Cylinders Cones Polyhedra Non-polyhedra Spheres and hemispheres Regular polyhedra
Notice that some of these sets are entirely separate from each other. Recalling the vocabulary from the earlier chapter on sets, we can say that such sets do not overlap, they have no intersection, they are disjoint.
Also notice that some of the sets do overlap; such sets have an intersection. And some of the sets are subsets of other sets. Place the yarn or string loops around the sets so that the relationships among the sets
are all clear (that is, the subsets, intersections of sets, and disjoint sets). It may be a bit difficult to position a few of the loops, but if you make some yarn into larger or smaller loops, it is possible.
Record on paper the structure of the relationships among these sets – draw the loops
(as in a Venn Diagram) showing which ones intersect, which are subsets, which are disjoint. Label each loop in the diagram with the set it is enclosing.
For example, for some two dimensional shapes, the diagram looks like this:
Make a diagram similar to this, but for three dimensional shapes.
parallelograms
rhombuses rectangles
squares

Section 8-7: Three Dimensional Geometric Objects
Page 8 – 89
Hidden 3-D Design Two people play together. Materials: - A set of three dimensional geometric solids for one person, and an identical set for
the partner. These solids may be made of plastic or wood or foam. At least five objects should be in the set.
- A barrier so that one person can pile or place some shapes without the other person seeing them (perhaps an open binder or folder or book)
Goals: Strengthen use of and familiarity with geometric language, both the vocabulary of 3-D objects and of spatial relationships.
Activity:
· Without the partner seeing this, one person uses some of her shapes to make a “design” or model. The shapes can be placed on the surface touching each other, or some may be placed on top of others, or some objects might be separate not touching others.
· Then the person who made the design verbally describes to the other person what to do with her shapes so that she ends up with exactly the same design.
Use correct vocabulary while doing this! The partner doing the building is welcome to ask questions.
· When both partners have verbally communicated and think that their designs now match, they remove the barrier and check.
If anything doesn’t match, discuss that. · The partners now switch roles and start over. So, the partner who last time was
trying to match the design, this time creates a new design.
Building “skeletons” of 3-D objects and counting parts A three dimensional solid has faces and edges, and is actually “solid”. In this activity ,
what we might call the “skeleton” of the solid is built from sticks or straws. The “skeleton” will include the edges of the solid, and one must simply visualize where the face would be.
Materials: - drinking straws, all cut to be the same length (a length from 4 to 6 inches works
well). The straws must be narrow enough so that a pipe cleaner put into it for an inch or two fits snuggly. About 36 to 40 straws per group.
- pipe cleaners (also called chenille stems). The size of the pipe cleaners should match the straws – so that the pipe cleaner inserted about two inches into the straw fits somewhat snugly. If the straws are fairly narrow, then large baggie-ties can be used instead of pipe cleaners.
- Rather than using straws and pipe cleaners, there are commercial products available for building, using plastic “sticks” and connectors.
Goals: Strengthen understanding of the shapes of some 3-D solids. Learn the relationship among the numbers of faces, edges, and vertices.

Section 8-7: Three Dimensional Geometric Objects
Page 8 – 90
Activity:
· A group of several people may work together, sharing the work. Make sure that each person in the group makes at least one of the items.
· Connect the straws and pipe cleaners (or whatever types of sticks and connectors you have) to build “skeletons” of each of the following solids:
! tetrahedron (which is also a triangular pyramid) ! square-based pyramid ! cube (which is also a square prism) ! triangular prism
· Count the faces, vertices, and edges of each shape and record the results in the following table. Note that the faces must be visualized since they are simply air in these “skeletons”. The edges are the straws. The vertices occur where three or more straws connect.
· Fill in the last column of the table by calculating (#vertices) + (# faces) – (# edges).
· If you have time to make more skeletons, then record the results in the extra rows. Alternatively, if you have models of geometric solids, you could use them to count the faces, edges, and vertices. Examples of extra shapes to record: hexagonal prism, pentagonal pyramid.
·
Observe the last column. The results should all be the same.
The fact that for all polyhedra the (#vertices) + (# faces) – (# edges) always equals the same constant number is known as Euler’s Formula. (“Euler” is a German name and is pronounced something like “OY ler” or “oiler”.) It was Rene Descartes who first stated this formula, though it is named after Leonhard Euler, who re-discovered the formula over a hundred years later, in 1752.
Shape F = # of faces V = # of vertices E = # of edges F + V– E
Tetrahedron
square-based pyramid
cube
triangular prism

Section 8-7: Three Dimensional Geometric Objects
Page 8 – 91
Making Penticubes Can you guess how many cubes are in a “penticube”? (Hint – the prefix “penti’ is like the
prefix “penta” in pentagon.) A penticube is a three dimensional solid made up of five cubes. Materials: - interlocking cubes (such as Multilink or Hexalink or Snap cubes), 145 cubes per
group are needed for making all the possible penticubes. [It is possible to do this activity with cubes that do not connect, by carefully placing
the cubes next to each other or on top of each other – but these shapes couldn’t be moved around and would break apart if they were bumped.]
Example of two penticubes: Activity: · Work in small groups.
· Put five cubes together to make a penticube. Make all the different ways that there are to construct a penticube.
· Two constructions are different if they can be picked up and moved around and flipped and rotated – and no matter how you position them, they do not look alike.
· Carefully check the constructions of your group so that you don’t end up with constructions that are identical to each other. When constructions are identical, they are just rotations or reflections of each other and they are called congruent.
· How many different penticubes did your group find? Compare with other groups. Symmetry in three dimensional geometric objects
An explanation of symmetry in three dimensional objects was given in the section on symmetry as follows: Reflective symmetry for a three dimensional object means that there is a plane of symmetry that divides the object so that the two halves are reflections of each other (like in a mirror).

Section 8-7: Three Dimensional Geometric Objects
Page 8 – 92
Consider this triangular pyramid. The base is an equilateral triangle. The pyramid has three planes of symmetry (they are not pictured). If we assume the base of this pyramid is horizontal, all three of the planes of symmetry are vertical . To visualize these planes, think about the base triangle (the one at the bottom of the pyramid). Think of the plane that goes through a vertex of that base triangle and passes through the center of the opposite side of that triangle. That plane also passes through the apex of the pyramid (the top vertex), and through one of its three edges that slant upward
to the top vertex. There are three planes like this (one for each vertex of the base triangle). Those are the three planes of symmetry. It can be challenging to find and to describe the planes of symmetry of a regular three dimensional object. Consider a cube:
There are four vertical planes of symmetry: From center of front side to center of back side From center of left side to center of right side From top left-back vertex to top right-front vertex From top right-back vertex to top left-front vertex There is a horizontal plane of symmetry, half way between the top of the cube and the bottom of the cube. There are several slanted planes of symmetry: On the front face of the cube, the plane that passes through the upper left vertex and the lower right vertex. On the front face of the cube, the plan that passes
through the upper right vertex and the lower left vertex. On the right-hand face of the cube, the plane that passes through the upper front vertex and the lower back vertex. On the right hand face of the cube, the plane that passes through the upper back vertex and the lower front vertex. The cube has nine planes of symmetry! Suggestion: Take a cube made out of foam that is about 4 inches on each edge. Slice it along several of its planes of symmetry.

Section 8-7: Three Dimensional Geometric Objects
Page 8 – 93
Rotational symmetry for a three dimensional object means that the object can be rotated around an axis of rotation (a line that the object turns around) so that it ends up looking just like the original object after being rotated some amount less than 360 degrees.
Consider this triangular pyramid. Think of the vertical line that passes through the apex of the pyramid and through the center of the base triangle. That line is an axis of rotation. The pyramid could rotate one-third of a full turn around that line (which is 120 degree rotation) and would look identical to how it started. Then it could rotate one-third of a full turn again and look identical. And finally the last one-third turn would get it back where it started. Hence we say this pyramid has 3-fold rotational symmetry around that axis. That is, 120, 240, and 360 degree rotational symmetry.
If a triangular pyramid were a tetrahedron (that is – if all the faces are identical equilateral triangles), then there would an axis of symmetry through each vertex. There would be four axes of symmetry, each with 3-fold rotational symmetry.
This rectangular prism has rotational symmetry. One axis of symmetry is the vertical line that goes through the center of the top rectangle straight down to the center of the bottom rectangle. The prism could rotate 180 degrees around that line and be identical to how it started. There is also an axis of symmetry that is a horizontal line through the center of front face and the center of the back face. There is 180 degree rotational symmetry around that line. And the third axis of symmetry is a horizontal line that passes through the center of the rectangle which is the
left side of the prism and the center of the rectangle that is the right side of the prism. Again there is 180 degree rotational symmetry about that line.

Section 8-7: Three Dimensional Geometric Objects
Page 8 – 94
Section 8-7: Exercises on Three Dimensional Geometric Objects 1. • In your home, find examples of three dimensional objects that you can categorize as
being one of the following: prism, pyramid, cylinder, cone, sphere, regular-polyhedron. • Find at least six examples of such objects. Your examples should not all be of the
same type – try to get many different types. • For each object, write what it is, describe its shape (perhaps draw a sketch), and state
which category of object it is. Example: A bottle of perfume I have is a hexagonal right prism – if we don’t include the
lid on top. It’s bottom is a hexagon, and the sides go straight up from there to the top which is also a hexagon except that the round lid is in the center.
2. For each of the following categories of objects, give an example of a “real” object in use in
homes or the workplace or schools or just the world in general. Prisms Pyramids Cylinders Cones Polyhedra Non-polyhedra Spheres and hemispheres Regular polyhedra
3. Think of a cube. a) How many faces does a cube have? b) How many vertices does a cube have? c) How many edges does a cube have? d) What is the number of faces plus number of vertices minus number of edges? 4. Think of a triangular pyramid, or look at a model or diagram of one. a) How many faces does it have? b) How many vertices does it have? c) How many edges does it have? d) What is the number of faces plus number of vertices minus number of edges?

Section 8-7: Three Dimensional Geometric Objects
Page 8 – 95
5. For each of the following, what is the name of the three-dimensional geometric object defined in this chapter that is closest in shape to the object in the photo? Usually “real life” objects don’t perfectly match the geometric definition, but they are close.
a) candle (consider its b) another candle (consider its shape before it was burned) shape before it was burned)
c) this glass structure is in the courtyard in front of the Legion of Honor museum in San
Francisco

Section 8-7: Three Dimensional Geometric Objects
Page 8 – 96
d) the roof in the upper left corner of the e) the roof in the upper right corner of the photo of this house photo of this house f) the shapes of the tree trunks

Section 9-1: Introduction to Measurement
Page 9 – 1
Chapter 9 Measurement
Section 9-1: Introduction to Measurement An Evening at Home
“Will you help me make brownies for my party?” asked eight-year-old Danny, walking into the kitchen.
“Sure,” Chris replied. “I’ll get the pan ready while you measure 1! cups flour and 1 teaspoon baking powder. What size pan do we need?”
Danny checked the recipe. “It says 9-inch by 13-inch.” “Ah, that reminds me. Pat,” Chris called, “your cousin phoned today. They had their
baby! It’s a healthy little girl weighing 7 pounds, 3 ounces and she’s 19 inches long.” “That’s great! It was a week past the due date and Sonia was tired of waiting,” Pat
noted. “When did she call?” Chris glanced at the clock. “Half an hour ago.”
“Oh, I must have been outside measuring the fence for painting. The weather report says a high of 65° Saturday, so perfect weather for painting. I counted ten sections of the
fence, each 8 feet long. I think they’re 6 feet high, so that’s 8 times 6 is 48, and then times 10 gives 480 square feet.”
“Don’t forget the back side,” Chris added. “Oh, right. So 960 square feet. One can of stain claims it covers about 400 square
feet, so we’ll need three cans.” “I can buy it tomorrow on my way home,” Chris offered. “I got gas in the car today and
it only needed nine gallons. I figured we got about 35 miles per gallon on that fill-up, which is so much better than the old car.”
By now Danny was finished with the brownie batter. “What temperature is the oven supposed to be?”
“Three-hundred fifty degrees,” Chris answered. As they poured the batter into the pan, Danny asked if he could have cans of pop at
the party. “Don’t you think it’s better to have a big two-liter bottle instead?” Chris said. “A can of
pop is twelve ounces, and that’s a lot for one person. And, there is less waste with one large bottle.”
“Okay,” Danny said. “What are you going to do for decorations?” Pat asked. “Susanna’s going to bring over this huge roll of crepe paper—it’s 500 feet long! We
could put it everywhere!” Chris laughed. “Sounds good. Now let’s set the timer for 30 minutes for the brownies.
When they come out, we’ll let them cool, and then I’ll have to try one to make sure they are good enough for the party.
“Me too!” said Danny. “And me,” Pat said, smiling. “I need to build strength for tomorrow’s painting!”
Types of Measurement As the preceding scenario illustrates, measurements are used regularly in daily life. The
properties that can be measured include length, area, volume, capacity, weight, temperature, and time. The process of measuring involves comparing the item being measured with an appropriate unit of measurement. The simple idea of measurement is that we determine

Section 9-1: Introduction to Measurement
Page 9 – 2
how many copies of the unit are in the item being measured. For example, to measure how much granola is in a bowl the unit could be a measuring cup. Cups of granola could be taken out of the bowl until we determine how many cups total there are.
Children and Measurement Clearly adults need to be familiar with many systems of measurement. What do children
need to learn? Young children (age 0 to 8) become familiar with the basic concepts of measurement beginning with comparisons and using non-standard measurements. In grade school, particularly after grade 3, children gain numerous skills in using a variety of measuring tools.
In this chapter we cover topics that adults need to know. Many of the topics can be explored
at some level by children. Some of them are not applicable to young children (such as being familiar with kilometers in the metric system, or finding the volume of air in the room in cubic yards). For many of the measurement topics, suggestions are given for how children can be engaged in the topic.
The National Council of Teachers of Mathematics points out, “Recognizing that objects have attributes that are measurable is the first step in the study of measurement. Children in prekindergarten through grade 2 begin by comparing and ordering objects using language such as longer and shorter. Length should be the focus in this grade band, but weight, time, area, and volume should also be explored.” (NCTM 2000: 44)
Stages in Exploring Measurement Children progress through various stages of learning about measurement. A child must first
grasp the general concept being discussed, the property being measured. For example, the child must learn that to estimate how heavy something is, he needs to pick up the item, not just look at it. To estimate how long an item is, the child will realize that looking at it from one end to the other gives the kind of information desired.
In the next stage the child can compare items. Several objects could be compared with each
other in terms of a particular property. For example, which friend is taller, or which book is heavier? A set of objects could be seriated by the property – for example, several children could line up by height, or boxes of toys could be arranged from lightest to heaviest. Note that there is always more than one way to seriate objects depending on what characteristic (attribute) is being considered.
In the next stage, children can use a unit to quantify the size of something. They would not
yet use a ruler or scales. Rather, children start with non-standard units. For example, they may measure the length of desks and tables by seeing how many pencils fit along them. Or a child could explore the measurement of area by seeing how many hands it takes to cover the top of the book. Two children might each measure their book’s length by seeing how many paperclips can line up along the book from top to bottom; they can compare the measurements of their books in “paper clip units”.
Eventually, at a later stage, children learn to use standard units and measuring tools – such
as inches on a ruler, pounds on a scale, and quarts from a pitcher. It is through extensive

Section 9-1: Introduction to Measurement
Page 9 – 3
exploration with both non-standard and standard units that children gain the understanding that using different units makes a difference in the result. For example, a child might notice that two of the teacher’s handfuls of beads fill the bowl, but it takes three of the child’s handfuls of beads to fill the bowl. The National Council of Teachers of Mathematics explains this process:
“If students initially explore measurement with a variety of units, non-standard as well as standard, they will develop an understanding of the nature of units. For example, if some students measure the width of a door using pencils and others use large paper clips, the number of paper clips will be different from the number of pencils. If some students use small paper clips, then the width of the door will measure yet a different number of units. Similarly, when students cover an area, some using dominoes and others using square tiles, they will recognize that ‘domino measurements’ have different values from ‘tile measurements.’ Such experiences and discussions can create an awareness of the need for standard units and tools and of the fact that different measuring tools will yield different numerical measurements of the same object.” (NCTM 2000:105)
Approaches to Measurement with Children When younger children work with length measurements, they are answering questions such
as “How wide? How long? How tall? How far away? How far around?” Young children also need an introduction to other attributes that can be measured. For example, volume and capacity can be explored in a sensory table with water or sand.
“Teachers will want to guide students by providing the resources for measuring, planning
formal and informal opportunities to measure, encouraging students to explain and discuss their findings, and asking important questions to facilitate their thinking and concept development.” (Seefeldt & Galper 2008: 118)
For young children, teachers should regularly discuss ideas of measurement so children
become familiar with the concepts. For example: How high is that block building? How heavy is that book? Are you bigger than your brother? How many little cups of water do you think it will take to fill the pitcher? How much time will our walk around the building take?
It is useful for everyone to develop estimation skills for measurements. In everyday life,
adults often need to estimate (e.g., How long will it take me to drive to the store? Will these pants fit my son? Is this container large enough for the leftover spaghetti? Will this 48 inch long rug fit in the bathroom?) Children will be better at measurement concepts and skills if they have numerous opportunities to discuss measurements and to estimate them, and then to check the estimates by actually measuring.
Piaget and Conservation of Attributes of Measurement Jean Piaget, the Swiss psychologist and educator working in the mid-1900s, observed
children doing various “conservation” tasks. In an earlier section on “Counting”, we mentioned the concept of “conservation of number” that was described by Piaget. In that task, a child will agree that two rows of items have the same number in each row when the items are lined up next to each other. However, when the items of one row are spread farther apart, a young child will think that the rows then have different numbers of items. In

Section 9-1: Introduction to Measurement
Page 9 – 4
order to count, a child must be able to “conserve number” (to recognize that moving the items around does not change their number – that the number of items is “conserved” or stays the same).
Similarly, children have stages of development in conservation of measurement and quantity
concepts. Piaget experimented with and described other conservation tasks that relate to a child’s ability to form measurement concepts. “Students who conserve length, area, and volume understand that these concepts do not change even when an object’s position or appearance is altered. Students who cannot conserve length, for example, will think a yardstick is one length in a horizontal position and a different length when it is rotated to a vertical position. They do not think that the yardstick conserves or maintains the same length in all positions.” (Kennedy, Tipps, & Johnson 2008:445)
Young children may use appearances to make judgments about measurements, but they
can also be fooled by appearances. “For example, when one of two identical balls of clay is rolled into a long sausage-like shape, children do not ‘conserve’ the initial equivalence of the clay balls, and instead judge that the sausage has more clay than the ball because it is longer.” (Clements 2004: 50)
Children cannot reliably make measurements until they have matured to reach the stage
where they can conserve the attribute being measured. “Because children vary widely in their abilities to conserve length, area, and volume, a reflective teacher guides learning activities that seem developmentally appropriate. Once the concept of a unit and the process of measuring are mastered in one system, curious young minds easily transfer these relationships from one system of units to another. There is no need to rush learning beyond the child’s capabilities.” (Smith 2006: 175)
Measurement and the National Council of Teachers of Mathematics The National Council of Teachers of Mathematics (NCTM) focuses on Measurement, making
it one of their five Content Standards. Below is listed the grades Pre-K to 2 Measurement standards and their related Expectations. Then the Curriculum Focal points related to measurement are listed by grade level.
NCTM Measurement Content Standards for Pre-K to 2 1. Understand measurable attributes of objects and the units, systems, and
processes of measurement. • recognize the attributes of length, volume, weight, area, and time; • compare and order objects according to these attributes; • understand how to measure using nonstandard and standard units; • select an appropriate unit and tool for the attribute being measured. 2. Apply appropriate techniques, tools, and formulas to determine measurements. • measure with multiple copies of units of the same size, such as paper clips laid
end to end; • use repetition of a single unit to measure something larger than the unit, for
instance, measuring the length of a room with a single meterstick; • use tools to measure; • develop common referents for measures to make comparisons and estimates. From: http://standards.nctm.org/document/chapter4/meas.htm

Section 9-1: Introduction to Measurement
Page 9 – 5
NCTM’s Curriculum Focal Points For Prekindergarten:
Measurement: Identifying measurable attributes and comparing objects by using these attributes.
Children identify objects as “the same” or “different,” and then “more” or “less,” on the
basis of attributes that they can measure. They identify measurable attributes such as
length and weight and solve problems by making direct comparisons of objects on the basis of those attributes.
From http://nctm.org/standards/focalpoints.aspx?id=300
For Kindergarten:
Measurement: Ordering objects by measurable attributes
Children use measurable attributes, such as length or weight, to solve problems by comparing and ordering objects. They compare the lengths of two objects both directly
(by comparing them with each other) and indirectly (by comparing both with a third
object), and they order several objects according to length.
From http://nctm.org/standards/focalpoints.aspx?id=308
For Grade 1, Measurement is a “connection to a focal point” (is not itself a focal point):
Measurement and Data Analysis: Children strengthen their sense of number by solving problems involving measurements and data. Measuring by laying multiple copies of a
unit end to end and then counting the units by using groups of tens and ones supports
children’s understanding of number lines and number relationships. Representing measurements and discrete data in picture and bar graphs involves counting and
comparisons that provide another meaningful connection to number relationships.
From http://nctm.org/standards/focalpoints.aspx?id=328
For Grade 2:
Measurement: Developing an understanding of linear measurement and facility in
measuring lengths. Children develop an understanding of the meaning and processes of measurement,
including such underlying concepts as partitioning (the mental activity of slicing the
length of an object into equal-sized units) and transitivity (e.g., if object A is longer than object B and object B is longer than object C, then object A is longer than object C).
They understand linear measure as an iteration of units and use rulers and other
measurement tools with that understanding. They understand the need for equal-length
units, the use of standard units of measure (centimeter and inch), and the inverse relationship between the size of a unit and the number of units used in a particular
measurement (i.e., children recognize that the smaller the unit, the more iterations they
need to cover a given length). From http://nctm.org/standards/focalpoints.aspx?id=326
Measurement activities apply to many subject areas. In a science unit children can weigh
rocks from a collection or chart the heights of plants as they grow. If there is a classroom pet or an animal visiting, its food could be measured in cups or tablespoons, and the pet could be weighed. Each child could measure the length of string he or she needs for an art project, or measure a half cup of beads.

Section 9-2: Length
Page 9 – 6
Section 9-2: Length Length is the easiest attribute to measure, and it is the one emphasized for young children.
Length is a one-dimensional property. A length measurement answers questions such as: “what is the distance from here to there?”
“how long is this worm?” “how tall am I?” “how far along this line?” “how long is this curve?”. When someone asks “how long is this piece of yarn?” a length measurement is needed to
determine the distance from one end of the yarn to the other – and the answer could be something like “ 15 inches” or “4 feet” or “40 centimeters”.
In everyday life confusions may arise because objects have multiple attributes that can be
measured. If someone asks “how much yarn is here”, they might want a length measurement, or they might want to know how much it weighs (yarn is generally sold with the weight of the yarn marked). If someone says “how big is this yarn”, they might want a length measurement, or they might want to know what the diameter of the yarn is (how thick across is the strand), or both. Good communication and discussion can clear up confusions, so be sure to engage in discussions with others to clarify what measurement is needed.
Example of measuring length:
To illustrate the process of measuring length, let’s measure the length of the classroom. 1. Pick an appropriate unit: Yards are an appropriate measurement for a room dimension
because of the size of the room. 2. Measure length with yardsticks. Get several yardsticks and starting in one corner lay
them end to end until you reach the next corner. Let’s say you get 8 full yards laid end to end with a bit left over.
3. Decide about the remaining length. Probably the length will not be exactly a certain number of yards. Estimate the leftover space. Is it almost another yard, closer to ! a yard, or hardly any part of a yard? In this case, let’s estimate the left over length as ! a yard.
4. Reporting the result. The measurement of the length of the classroom is then 8 ! yards.
The general method for measuring a length: 1. Select an appropriate unit. (This could be a standard or non-standard unit.) 2. Use the unit and copies of the unit to span the object from one end to the other. • This is more easily done if there are many copies of the unit. For example, to measure
across the top of a table with paper clips as the unit, place a row of paper clips along the table top from one side to the other. Be careful to leave no gaps between the units. Also be careful not to have any overlaps. For young children, measuring length is easier to understand if they have many copies of the unit (e.g., many paperclips, or rulers, or markers) . The length measurement is found by counting how many copies of the unit were needed to cover the object from one end to the other.

Section 9-2: Length
Page 9 – 7
• If there is only one copy of the unit (for example, if there were only one paper clip to use), then place it at the start of the object and carefully mark or note where the unit ends – then place the unit at that spot and see where it ends now, and place it in the next place, etc. The number of times this is done must be counted along the way. Of course there should be no gaps or overlaps in the places where the unit was placed.
3. Decide what to do about any leftover length at the end of the object if there is a part that
is too small to cover by the unit. • For younger children it is fine to simply find the number of whole units that fit the length.
There could be a discussion of whether to round down or round up. For example, if seven units almost span the object and there is a part not covered, discuss whether it is a small part and can be ignored or whether another copy of the unit “almost” fits and so you want to say the measurement is close to eight units.
• Older children and adults can estimate what fraction of a unit is leftover at the end. If standard units (such as feet) are being used, the ruler will probably be marked in fractional parts of the unit. Another alternative is to measure the “leftover part” with smaller units. For example, a table measures 3 feet long and the leftover part is 5 inches, so the length is 3 feet and 5 inches.
4. When the result of the measurement is reported, the answer should always include both
the number of units and also the name of the units used. For example, “the table is 13 paperclips wide” or “the fence is 14.5 meters long”. It would be incorrect to say only that “the fence is 14.5” since then it wouldn’t be clear whether it was 14.5 feet or 14.5 yards or 14.5 meters or what.
Early nonstandard units
Early in human history when people wanted to measure length they used parts of their bodies as the unit. One ancient unit of measure is the cubit, which is the distance from the elbow to the tip of the fingers. Another ancient measure is the span, which is found by stretching the fingers out and taking the distance from the tip of the thumb to the tip of the pinky. A hand was the distance across the palm, including the thumb, when the fingers are together.
cubit span hand These early measurement units were very handy because the “measuring tool” was
always with the person when s/he wanted to measure. A major disadvantage was that different people’s units were different sizes, and so their measurements would come out different. Eventually, people standardized units for measuring length. Our current units of foot and yard were standardized from early body-part measurements. The hand unit is still used today as a measurement for a horse’s height; it has now been standardized so a hand equals four inches.

Section 9-2: Length
Page 9 – 8
Children and nonstandard units It is valuable for young children to use non-standard units to measure length. A unit
based on a body part, such as their foot, gives them a chance to explore. Have students work in pairs to trace around their foot on card stock and cut out several copies. (Young children may need help with this part of the activity). Write their name on each copy of their foot. They can use their cutouts of their feet to measure distances in the classroom and on the playground. One version of this activity is “Footsteps for Fun” found on page 123 in Big Math Activities for Young Children by Overholt, White-Holtz, and Dickson .
Activity: Measuring Length with Non-Standard Units Materials: a box of paperclips, a pencil, and optionally a calculator Goals: Gain experience in measuring with non-standard units, including approximating
the results and also estimating prior to measuring. Activity overview: Make each of the following measurements with the indicated non-
standard measurements and record results.
Record results to the following measurements in the table following the questions. When answers are not whole numbers, estimate the fractional part.
1. Measure the table or desk top you are working on in cubits and then in spans, using
your personal cubit and span. 2. Measure the length of this paper (from top to bottom) in spans and in hands. 3. Compare your results for #1 and #2 with several classmates. If your results are not
the same, discuss why they are different. Come up with at least two reasons. 4. a) BEFORE measuring, estimate the length of the whiteboard in cubits and in spans
and write your estimates. (Note: if there is no whiteboard, choose another object, such as the door or the teacher’s desk.)
b) Measure the whiteboard (or chosen item) in cubits and spans and record the results.
c) Calculate how much your estimate differed from your measurement. (To get this difference, subtract the larger number minus the smaller number.)
d) Were your estimates within 10% of the correct measure? If not, are they within 20%? Notes: Recall that you can mentally calculate 10% of the correct measure by moving the
decimal point one space to the left. If your difference is less than that number, then your
estimate is within 10% of the correct amount.
Recall that 20% of the measure is twice the 10% amount. If your difference is less than that number, then your estimate is within 20% of the correct amount.
5. a) Use paperclips as the unit to measure the length of this paper from top to bottom.
b) Use your pencil as the unit to measure the length of this paper from top to bottom.

Section 9-2: Length
Page 9 – 9
6. a) Estimate the width (from left to right) of this paper in both paperclip units and pencil units. Write down your estimates before you measure the width.
b) Measure the width in both paperclips and pencil and record the results.
c) Calculate how much your estimate differed from your measurement.
d) Were your estimates within 10% of the correct measure? If not, are they within 20%?
1. table/desk __________ cubits __________ spans
2. paper length __________ spans __________ hands
3. why might your classmates’ answers differ?
4.a) whiteboard or ? Estimate: ________ cubits Estimate: _______ spans
b) Measured: ________ cubits Measured: ______ spans
c) Difference Measure – Estimate = Measure – Estimate =
d) Percent “off” * within 10%? Yes or no? _______ within 20%? Yes or no? _______
within 10%? Yes or no? _______ within 20%? Yes or no? _______
5. paper length a) ________ paperclips b) ________ pencils
6.a) paper width Estimate: _______paperclips Estimate:_______ pencils
b) Measured:_______ paperclips Measured:______ pencils
c) Difference Difference of Measure and Estimate = ________
Difference of Measure and Estimate = ________
d) Percent “off” * within 10%? Yes or no? _______ within 20%? Yes or no? _______
within 10%? Yes or no? _______ within 20%? Yes or no? _______
* Recall from the chapter on Percents that you can calculate the exact percent “off” of the
estimate. Find the difference between the actual and the correct measures. Then
find this ratio expressed as a decimal, converted to a percent.
Extension of Activity:
7. a) Look at the length and width of the paper measured in paperclips. Form the ratio of the width to the length:
= = ! express as a decimal
b) Look at the length and width of the paper measured in pencils. Form the ratio of the width to the length:

Section 9-2: Length
Page 9 – 10
= = ! express as a decimal
c) How do these ratios compare?

Section 9-2: Length
Page 9 – 11
Standard Units of Measurement There are two common systems of measurement used in the United States today. One is the U.S. Customary System and the other is the Metric system. The U.S. Customary System, also called the U.S. System, was formerly called the English or British system. However England switched to the metric system many years ago, and currently the United States is one of the few countries in the world using this system. The table below lists the most common units of length in the U.S. System.
U.S. System – Units of LENGTH
unit abbreviation equivalent to:
inch in 1/12 foot
foot ft 12 inches
yard yd 3 feet or 36 inches
mile mi 5,280 feet, about a 20-minute walk
The equivalencies for inches, feet, and yards should be memorized. Another abbreviation for inch is “ (quotation marks). For example 1 inch = 1 “ = 1 in. Another abbreviation for foot is ‘ (an apostrophe). For example 1 foot = 1’ = 1 ft.
Reading a Ruler with Inches People who are already good at reading an inch ruler might skip this section or review it quickly. " On some rulers the end of the plastic, wood, or metal of the ruler is the zero inch mark, while
on other rulers the zero inch mark is not exactly at the end (as in the ruler pictured below). The item being measured must line up with the 0 inch mark, not the end of the ruler. Or else, the object can line up with a different inch mark and you can subtract to find the measurement length – see the following example. Note that many rulers have inches on one side and centimeters on the other, so check that you are using the correct side.
" The marks for whole inch sizes are labeled. • The line labeled A to B is 3 inches long (it starts at the 0 inch mark and ends at 3). • The line labeled C to D is 2 inches long (it starts at the 4 inch mark and ends at 6, so its length is found by subtraction: 6 – 4 = 2). A 3 inches B C 2 inches D
Note: Because of the way these pages are printed, the rulers here might not be the correct size (they might not portray the true size of an inch). " When an item’s length is between the marks for whole numbers of inches, then you need to
determine what fraction of an inch is being indicated. - Look carefully between two whole-inch marks and count the number of the smallest-size
spaces you see. There are sixteen of those spaces. (Note that there are 15 marks between the whole inch marks, and 16 spaces.) Each of those small spaces is 1/16 of an inch.

Section 9-2: Length
Page 9 – 12
Look at the following ruler and the two lines drawn above it. - The shorter line below extends past the 2 inch mark to cover 3 of the 1/16 inch spaces
beyond. So its length is 2 inches.
- The longer line extends past the 4 inch mark to cover all except the final space before the 5 inch mark. So it covers 15 of the 16 spaces between 4 inches and 5 inches. Thus its
length is 4 inches.
" Using this inch ruler, length answers could all be stated as a whole number of inches and a
number of sixteenth-inches. Then fractions that reduce should be reduced. " The little vertical marks on the ruler between the whole-inch marks are not all the same length.
They are made different lengths so that it is easier to find the places for halves, fourths, and eighths of an inch.
The half-inch marks are fairly clear. Some of the fourth-inch and half-inch mark locations are labeled here. Study them.
1 1 2 3 4 6
- Some of the eighth-inch mark locations are labeled below. Be sure you understand them.
1 2 3 5
- Typically lengths are recorded in U.S. units using fractional parts, such as 3 ! inches,
rather than converting the fraction to a decimal.

Section 9-2: Length
Page 9 – 13
- Many inch rulers are marked like the one pictured here. If you use a ruler marked differently, then you will need to analyze which fractions are marked on that ruler. Many rulers used in elementary schools only mark the ! or only mark the # increments.
Practice with a Ruler in Inches
Use a ruler like the ones pictured above that is marked in inches and has marks for sixteenths of an inch. On the next page, measure the length of each of the items and record its length in inches, rounded to the closest sixteenth of an inch. If you don’t have your own ruler, you might copy and cut out the paper one at the end of this chapter. Compare your answers with your classmates.

Section 9-2: Length
Page 9 – 14
A - flashlight B – marker C - battery D – memory stick E – glue stick F - pen G – lip therapy

Section 9-2: Length
Page 9 – 15
The Metric System of measurement is also known as the International System since it is used in every country. In scientific applications it is often called the SI system (for the French term Système Internationale). In the United States, both the Metric System and the U.S. System are in wide use. The Metric System dominates in scientific settings and in businesses that deal with international markets. The U.S. Customary System is widely used in everyday activities. The metric system has several advantages over the U.S. customary system: • The metric system is used world-wide. • In the metric system it is easy to compare and to convert units since it is a base ten
system. • The basic unit of length in the metric system is the meter. Every other unit of length is
defined by multiplying the meter by a power of ten or dividing the meter by a power of ten.
The table below lists the most common units of length in the metric system.
Metric System – Units of LENGTH
unit abbreviation equivalent to:
meter m the basic unit
centimeter cm of a meter
millimeter mm of a meter
kilometer km 1000 meters
The facts in the table should be memorized. In addition, you should use a ruler and make enough measurements so that you develop a sense of how large each of these measurements is so that you can estimate metric lengths without using a ruler. Here are some examples of metric sizes:
• meter: For me, when I stretch out an arm, a meter is the distance from my fingertips to
the opposite shoulder. Check out what length a meter is on you. A meter is a bit longer than a yard (about 39 inches). A meter is also the standard height of a doorknob.
• centimeter: For me it’s the width of the nail on my little finger. What is it on you? An M&M candy piece is about 1.3 centimeters across its diameter.
• millimeter: The thickness of a dime; the width of the dot at the start of this line. A nickel is about 2 millimeters thick.
• kilometer: An average person can walk a kilometer in about 12 minutes. A kilometer is about 0.6 miles. A “10 K” run is 6.2 miles.
Metric measurements are commonly used in scientific and medical contexts in the United States. One way many parents hear about centimeters is when the mother is in labor before the birth; the midwife estimates the dilation in centimeters, waiting for a ten-centimeter dilation. Metric prefixes

Section 9-2: Length
Page 9 – 16
In the metric system, for all types of measurement (such as length, weight, and capacity), the prefix before the basic unit always has the same meaning, as follows:
centi " (one-hundredth) of the basic unit
milli " (one-thousandth) of the basic unit
kilo " 1000 times the basic unit
Notes: - There are more prefixes in the metric system, but these three are the only ones used in
this book. - The abbreviations for units in the metric system are always lower-case letters (not
capital letters). If the abbreviation has two letters, they are written next to each other (no space between letters). And there is no period at the end of the abbreviations. For example, the abbreviation for centimeter is cm; the abbreviation for kilogram is kg.
Measuring Length with a Ruler marked in Centimeters " On some rulers the end of the plastic, wood, or metal of the ruler is the zero mark, while on
other rulers the zero mark is not exactly at the end (as in the ruler pictured below). The item being measured must line up with the 0 mark. Or else, the object can line up with a different centimeter mark and you can subtract to find the measurement length – see the following example. Note that many rulers have inches on one side and centimeters on the other, so check that you are using the correct side.
" The marks for whole centimeter sizes are labeled. • The line labeled E to F is 4 centimeters long (it starts at the 0 inch mark and ends at 3). • The line labeled G to H is 6 centimeters long (it starts at the 7 and ends at the 13, so its
length is found by subtraction 13 – 7 = 6).
E 4 cm F G 6 cm H
Note: Because of the way these pages are printed, the rulers here might not be the correct size (they might not portray the true size of an centimeter). " When an item’s length is between the marks for whole numbers of centimeters, then you must
determine what fraction or decimal of a centimeter is being indicated. - Look carefully between two whole-cm marks to see how many of the smallest-size spaces
there are. There are ten of those spaces. (Note that there are 9 marks between the whole cm marks, and 10 spaces.) Each of those small spaces is 1/10 of a cm, which is 0.1 cm.
- In the metric system, parts of a unit are denoted with decimal rather than fraction notation. Look at the ruler marked in centimeters below and the two lines drawn above it.

Section 9-2: Length
Page 9 – 17
- The shorter line drawn below ends between the 3 cm and 4 cm mark. It covers 7 of the small 0.1 cm spaces between 3 and 4 cm. So its length is 3.7 cm.
- The longer line drawn below ends between the 8 and 9 cm marks. It then goes beyond 8 cm for 3 spaces, thus its length is 8.3 cm.
- Note that one-tenth of a centimeter is the same as one millimeter. That is, 0.1 cm = 1 mm. - The small spaces between two marks on the ruler above are the size of 1 mm. - When a line is 3.7 cm long, that is the same as saying it is 3 cm and 7 mm long. Another
way to report the length of the line is to say it is 37 mm long, since 3.7 cm = 37 mm. In the example above, look at the line that is 3.7 cm long and notice that it covers 37 of the small spaces on the ruler.
Practice with a Ruler in Centimeters
On the next page, measure the length of each of the items and record its length in centimeters, rounded to the closest tenth of a centimeter (that is, rounded to the closest mark on the ruler). If you don’t have your own ruler, you might copy and cut out the paper one at the end of this chapter. Compare your answers with your classmates.

Section 9-2: Length
Page 9 – 18
A - flashlight B – marker C - battery D – memory stick E – glue stick F - pen G – lip therapy

Section 9-2: Length
Page 9 – 19
Activity: Measuring length with the U.S. System Materials: a ruler in inches; a yard stick and/or a measuring tape marked in inches, string or yarn, a die or dice, scissors, paper to crumple.
• Select the appropriate measuring tool for each task. • Write the units with each measurement. (Each measurement should have a number
and the name of the unit being used – e.g. “4 ft”, not just “4”.)
1. Work with a partner to measure each other’s height and arm span in inches. a) height = _________ b) arm span = __________ c) Are you a square, a tall rectangle, or a wide-span rectangle? 2. Find one of your body parts that is 1 inch (perhaps on a finger from one joint to another).
Remember this, write it down, and use it to estimate lengths. 3. For each of the following, estimate first, and then measure with the appropriate
measuring tool. a) top of table (or desk) Estimate: ___________ Measurement: ___________ b) pencil Estimate: ___________ Measurement: ___________ c) width of room Estimate: ___________ Measurement: ___________ 4. a) Roll a die. Multiply the number you get by 2. Cut a piece of string (or yarn) whose
length in inches you estimate to be 2 times the number rolled (that means – don’t measure the yarn, just estimate).
Number of inches you are aiming for (estimated length) = __________ b) After cutting the string (or yarn), then measure it. Round to the nearest eighth inch.
Measured length = ____________
c) How far off were you? Measurement – Estimate = ___________ d) What percent off was your estimate? (measurement – estimate) / (measurement), written as a percent, = __________ NOTE: It is FINE to have a percent off! Hopefully your estimate is less than 20% off.
5. a) Roll a die. Multiply the number you get by 5. Cut a piece of string (or yarn) whose
length in inches you estimate to be 5 times the number rolled (that means – don’t measure the yarn, just estimate).
Number of inches you are aiming for (estimated length) = __________ b) After cutting the string (or yarn), then measure it. Round to the nearest eighth inch.
Measured length = ____________
c) How far off were you? Measurement – Estimate = ___________ d) What percent off was your estimate?

Section 9-2: Length
Page 9 – 20
(measurement – estimate) / (measurement), written as a percent, = __________ Extensions of Activity: 6. What is the thickness of this piece of paper? You do not have the tools to find the precise
thickness. Discuss with a partner how you could estimate its thickness by using a ruler, some measurement(s), and some calculations. Then carry out the plan.
Estimate of paper thickness = ___________ 7. • Work with a partner . • Crumple a piece of paper (perhaps a newspaper). • Stand so there is a clear space in front of you and gently toss the paper wad (perhaps
5 to 20 feet). Note where the toes of your shoes are. • Estimate how far the paper wad landed from where you are standing, in feet: ________ • Have your partner measure the distance from where you are standing to the wad of
paper: __________ • Repeat this activity, taking turns with your partner, so that you each toss and measure
two or three times. 8. Calculate the average height of everyone in the room in U.S. System units. Discuss in a small group how to best accomplish this, then carry out the plan.
Activity: Measuring length with Metric System units
Materials: A ruler in centimeters/mm; a meter stick and/or a measuring tape marked in cm, string or yarn, a die or dice, scissors, paper to crumple.
• Select the appropriate measuring tool for each task. • Write the units with each measurement. (Each measurement should have a number
and the name of the unit being used – e.g. “7 cm”, not just “7”.)
1. Work with a partner to measure each other’s height and arm span in cm. a) height = _________ b) arm span = __________ c) Are you a square, a tall rectangle, or a wide-span rectangle? 2. a) Find one of your body parts that is 1 cm (perhaps the width of a little fingernail). Remember this, write it down, and use it to estimate lengths. b) Measure and remember the length of one finger and/or the distance across your palm. Remember this and use it to estimate lengths. c) Find the spot on you where the distance to the floor is 1 meter (it might be near your
waist). Remember this spot.

Section 9-2: Length
Page 9 – 21
d) Hold one arm out to the side. From the tip of those fingers, measure 1 meter towards yourself. Where does one meter end up on you? It might be near your collar bone or shoulder.
3. Estimate first, in cm and/or m, and then measure with the right tool. a) top of table (or desk) Estimate: ___________ Measurement: ___________ b) pencil Estimate: ___________ Measurement: ___________ c) width of room Estimate: ___________ Measurement: ___________ 4. a) Roll a die, then cut a piece of string (or yarn) whose length in cm you estimate to be
four times the number rolled (that means – don’t measure the yarn, just estimate).
Number of cm you are aiming for (estimated length) = __________ b) After cutting the string (or yarn), then measure it. Round to the nearest mm.
Measured length = ____________
c) How far off were you? Measurement – Estimate = ___________ d) What percent off was your estimate? (measurement – estimate) / (measurement), written as a percent, = __________ NOTE: It is FINE to have a percent off! Hopefully your estimate is less than 20% off.
5. a) Roll a die. Multiply the number you get by 10, then cut a piece of string (or yarn) whose length in centimeters you estimate to be 10 times the rolled number (that means – don’t measure it, just estimate).
Number of cm you are aiming for (estimated length) = __________ b) After cutting the string (or yarn), then measure it. Round to the nearest tenth cm.
Measured length = ____________
c) How far off were you? Measurement – Estimate = ___________ d) What percent off was your estimate? (measurement – estimate) / (measurement), written as a percent, = __________ Extensions of Activity 6. What is the thickness of this piece of paper, in SI system units? You do not have the
tools to find the precise thickness. Discuss with a partner how you could estimate its thickness by using a ruler, some measurement(s), and some calculations. Then carry out the plan.
Estimate of paper thickness = ___________ 7. • Do this with a partner: • Crumple a piece of paper (perhaps a newspaper). • Stand so there is a clear space in front of you and gently toss the paper wad (perhaps
2 to 5 meters). Note where the toes of your shoes are. • Estimate how far the paper wad landed from where you are standing, in meters and
part of a meter: ________ • Have your partner measure the distance from where you are standing to the wad of
paper: __________

Section 9-2: Length
Page 9 – 22
• Repeat this activity, taking turns with your partner, so that you each toss and measure two or three times.
8. Calculate the average height of everyone in the room in metric units. Discuss in a small group how to best accomplish this, then carry out the plan.
Exact v. Approximate Measurements are never exact. Measurements always involve approximation and rounding. Some mathematical activities do give exact results, such as counting. For example, counting the number of people in the room gives an exact result. Note that someone could make a mistake in counting the number of people in a room, and then the stated result would be wrong. But certainly there IS a particular number of people in the room, and it is a whole number, and somebody COULD count the people and get the correct and exact result. The answers for “counts” need to be whole numbers. Those types of answers are called discrete answers. Measurement is different from counting because an “exact” answer is not possible. For example, someone might measure the length of a table with a meter stick and find it is slightly over 65 cm and believe it is closest to the mark for 65.3 cm. Then imagine an engineer with a fancy and accurate meter stick measures the table and says it is slightly over 65.3 cm, and she thinks it is 65.33 cm, but her friend looks and says his estimate is 65.34 cm. It is a judgment call; there is no way to place the meter stick accurately enough to determine which is closer – and either way, without rounding the answer will not be a whole number. Measurements do not have discrete answers, they have continuous answers. A laser measuring device could be used, and it could measure the table length more accurately – perhaps coming up with 65.337 cm. It may seem that is the “exact” answer. However, in several years there could be a new type of measuring device that could get an even more precise measurement. Our conclusion must be that there is no way to get an “exact” measurement. In the end, every measure must be rounded off to the level of precision allowed by the tool and the person using it.
All measurements are approximations.
The precision needed for a measurement depends on the application and the measuring tools being used.
Estimating versus Rounding
Two concepts related to measurement are described here. It can be confusing to talk about them because the same words in English can be used to refer to either one. Yet, they are distinct concepts. Usually one is called “estimating” and the other called “rounding”. " “Estimating” is the term used to refer to the activity when someone makes an intelligent guess about the measurement of some attribute of an object without actually making a measurement of the item. For example, an interior decorator might stand in a room, look from one end to the other, and estimate that the room is 15 feet long. Or a mother might pick up a friend’s baby and estimate that he weighs 20 pounds. No measuring is done, but the person uses past experiences with measurements of the same type to estimate the measurement in the new situation.

Section 9-2: Length
Page 9 – 23
" “Rounding” is the term used when a measurement is being taken and the size of the object lies between two units of measure. The person measuring decides which of the two measurements is closer and uses that one. For example, in measuring the length of a pencil with a ruler marked in sixteenths of an inch, the pencil might line up between the marks for
5 inches and 5 inches. The person measuring decides which mark is closer to the end
of the pencil, and rounds to that measurement. " Note that in this second situation, a person rounding the pencil’s length in this way
might say “I’m rounding the measurement to 5 inches” or might say “I estimate it’s 5
inches”, or might say “The pencil is approximately 5 inches.”
All of these wordings may be used by people. In the earlier example, the interior decorator might say “I estimate the room is 15 feet long” or might say “the room is approximately 15 feet long.” The mother might say “I think the baby weighs about 20 pounds” or “my guess is that the baby weighs 20 pounds.” The point is: in English there are many ways of saying things! Different words can be used for the same concept, and sometimes the same word can be used for different concepts.
" One final thing to note about the example of measuring the pencil: If the pencil is closer
to 5 inches it is sometimes desirable to leave the measurement as 5 inches (and not
reduce the fraction) so someone else can see the precision of the measurement. If the
measurement is reduced to 5 inches it is no longer evident that it was recorded to the
closest 16th inch. Activities for Young Children related to Length " The idea for this activity is from Active Experiences for Active Children: Mathematics (Seefeldt & Galper 2008: 123-124). Three pieces of paper are labeled; one piece is labeled “Longer”, another is labeled “Shorter”, and the third “About the Same”. (For younger children, include only Longer and Shorter.) The teacher shows the students one object (for example, a paint brush, a stool, or a pencil will work), and asks them to find objects in the room that are longer than it, shorter than it, and about the same as it. Objects that are easily moved can be placed on the appropriate paper. Other objects could have a drawing made of them on the appropriate paper, or the names listed. The goal is to find four or five objects in each category. As an extension, ask the students to look at the “Longer” objects, and arrange them in order of size, and then do the same thing with the “Shorter” objects. This extension is a seriation activity. " Here is another activity to encourage students to explore comparing lengths:

Section 9-2: Length
Page 9 – 24
Each student is given a piece of string and is asked to find a) three or more objects in the room that are about the same length as the string, b) three or more objects in the room that are longer than the string, and c) three or more objects in the room that are shorter than the string. " There are numerous items children can use as non-standard length measurement units. Examples include: pipe cleaners, paperclips, twisty ties (the kind for bags), cut out and laminated shapes such as feet or a copy of the class pet fish, building blocks, a pencil, a piece of string, and the students’ own body parts such as a hand. " For the metric system, Cuisennaire Rods can be used for measuring; they are all one centimeter in width and depth. The orange rod (the longest) is 10 cm long; the white cube is 1 cm on each edge. Using only the orange and white rods could be sufficient.
Perimeter The perimeter of a region is the length of its boundary. When a two-dimensional figure is
drawn in a plane, its perimeter is the total length of all of its outside edges. Think of perimeter as the distance around a region. Pick a starting point and imagine walking around the outside of the figure.
For the figure to the left, find its perimeter by measuring each of its edges and adding the lengths together. Use centimeters to the closest tenth cm. . Perimeter is a length measurement. The units used for perimeters are the same as those used for length. When a figure has curvy sides, such as the one here, the perimeter is still the length of the outside boundary, but it can be difficult to find that length. One way to find an approximation for the perimeter is to carefully lay a string along the edge of the curve. Then take the string away, straighten it out, and measure its length with a ruler. Note that the perimeter of a figure depends only on the edges (the straight or curvy lines that form the boundary of the region). Perimeter has nothing to do with the inside of the region. The interior part shaded grey in the last example is NOT related to the perimeter. The interior part or surface is measured as area which will be studied in the next section. A Scale Diagram

Section 9-2: Length
Page 9 – 25
Sometimes a drawing is a scale drawing representing a larger object, such as this drawing of a garden. The perimeter of the garden can be found by adding the indicated edges of the garden. (This is not the perimeter of the drawing, which would be several inches; it’s the perimeter of the garden.) In this case, the garden’s perimeter is 29 + 17 + 10 + 8 + 19 + 9 = 92 feet. If a fence were placed around the edge of the garden, it would be 92 feet long. In the diagram of the garden, notice how the top horizontal line is 29 feet, and that equals the sum of the other two horizontal lines (19 ft + 10 ft = 29 ft). Also notice the vertical lines. The 9 ft vertical line plus the 8 ft vertical line total the entire vertical distance of 17 ft, as marked on the right side of the diagram. Sometimes some lengths of a diagram are not marked because they can be figured out from the sides that are marked. Practice Problem for Missing Side Lengths: Consider this diagram, with some of the lengths marked. Find the perimeter of the figure. (First the lengths of the unmarked sides need to be determined.) Answer to Practice Problem: The bottom side of the figure is 10 + 5 = 15 m. The right side bottom vertical piece must add to 7 to give the total vertical distance of
13, so it is 6 m. Perimeter = 10 + 7 + 5 + 6 + 15 + 13 = 56 m
A Figure on a Grid To the right is pictured a region of a grid. Assume that each grid square is 1 unit wide and 1 unit long (we are using the grid lines as non-standard units of length). To find the perimeter of the figure, pick a point to start and carefully follow along the boundary of the figure. See how many unit-length lines there are in the boundary. (Note that the number of squares inside the figure, the number of squares shaded grey, is NOT relevant.) The boundary edges can be counted in any order. For example, starting at the upper left corner of the figure and going clockwise, the perimeter could be found by: 1 across, 1 down, 1 across, 1 up, 1 across, 1 down, 1 right, 2 down, 1 left, 1 down, 3 left, 4 up = 18 units total. The perimeter is 18 units. Geoboards and Perimeter
tomatoes peppers
squash 8 ft
10 ft
17 ft
29 ft
9 ft
19 ft
10 m
7 m
5 m 13 m

Section 9-2: Length
Page 9 – 26
For figures made by rubber bands on a geoboard, the perimeter can be found in several ways. One way is to use a ruler to measure the sides of the figure in standard length measurements (e.g., inches or centimeters). Another way is to use a non-standard length measurement by specifying that “1 unit” is the distance between two posts on the geoboard that are horizontally or vertically next to each other. Example Some figures on a geoboard have sides that are only in vertical or horizontal directions.
For the figure on this geoboard, if the distance between two posts horizontally or vertically next to each other is “1 unit”, then count the number of units in the boundary to find that the perimeter is 18 units. Alternatively, standard units of measurement could be used, such as centimeters, and a ruler could be used to measure the boundary edges and the sum of those lengths would be the perimeter in centimeters.
CAUTION about Geoboards and Slanted (Diagonal) Lines
Is the distance along a slanted line between two posts on the geoboard the same as the distance between two posts that are horizontally or vertically next to each other?
If you are not sure, then measure the slanted line in the diagram to the left, and compare its length with one of the vertical or horizontal lines. The slanted line from one post to the next is longer than the vertical or horizontal line from one post to the next. If the distance between two horizontal or vertical posts is called “1 unit”, then the distance between two posts along a diagonal is NOT “1 unit”, but rather is a bit longer.
There is a way to determine how long the slanted line is, compared to the horizontal and vertical lines, using the Pythagorean Theorem. Perhaps you know of this geometric theorem from an earlier math class. In this book we do not study the Pythagorean Theorem. Second Example:
Each of the three line segments on this geoboard touches 5 posts. Are the line segments the same length? Measure them if you are not sure.
Answer: No, they are not the same length. The slanted line is longer than the other two.

Section 9-2: Length
Page 9 – 27
For our purposes, if a figure on a geoboard has slanted lines, then its perimeter can be found only by measuring the lengths of the edges of the figure with a ruler. (We will not determine the perimeter by using the non-standard unit defined as the distance between two adjacent horizontal or vertical posts).

Section 9-2: Length
Page 9 – 28
Section 9-2: Exercises on Length Always include the unit of measurement for your answer to a measurement question. If you do not have a ruler, you may use the one printed on a page at the end of these exercises. 1. What are some characteristics, or properties or attributes, that can be measured?
2. Use a ruler to draw a line whose length is 4 inches, and then a line that is 2 inches.
3. Use a ruler to measure the length of each of these lines in inches rounding to the nearest
sixteenth of an inch. a) b) c) 4. Use a ruler to draw lines of these lengths: a) 5 cm b) 2.8 cm c) 4.3 cm d) 22 mm 5. Use a ruler to measure the length of each of these lines in centimeters, rounded to the
nearest tenth centimeter. a) b) c) 6. a) Estimate the length of this line in centimeters before measuring. b) Now measure the line with a ruler, in centimeters to the nearest tenth cm. c) What is the difference: (measurement) – (estimate) = ________
d) What is the percent error of the estimate? (That is, the difference from part (c) is what percent of the measurement?

Section 9-2: Length
Page 9 – 29
7. Estimate the length of each line below before measuring. Then measure it to check your estimate. You might use your hand or fingers to help with the estimate (if you remember the size of some of them in centimeters).
a) b) 8. Study the tables of standard length measurements, and then without looking at them, answer
these questions. a) 1 ft = ______ in b) 5 ft = ______ in c) 1 yd = ______ in d) 1 m = _____ cm e) 1 m = ______ mm f) ! m = ______ cm g) 1 cm = _____ mm h) 3 ft = ______ yd i) 1 cm = ______ m 9. A do-it-yourself homeowner estimated the length of a board as 48 cm, then measured and
found it was 43 cm. What percent off was that estimate? 10. Consider units of length in the U.S. system. a) What are some items that would be best measured in inches (not feet or yards)? List at
least 3. b) What are some items that would be best measured in feet or yards (not inches or miles)?
List at least 3. c) What are some items that would be best measured in miles? 11. Consider units of length in the Metric system. a) What are some items that would be best measured in centimeters? List at least 3. b) What are some items that would be best measured in meters? List at least 2. c) What are some items that would be best measured in kilometers? d) What are some items that would be best measured in millimeters? 12. Select one of the following lengths for each of the items below. Only one is reasonable. Choices: 7 in, 7 ft, 7 yd, 20 yd, 24 in a) height of the door b) width of the classroom c) height of paper on the art easel d) length of a pencil e) length of a children’s outdoor play area 13. Select one of the following lengths for each of the items below. Only one is reasonable. Choices: 1 mm, 2 m, 7 m, 7.5 cm, 75 cm a) width of the door b) length of a crayon

Section 9-2: Length
Page 9 – 30
c) thickness of a dime d) length of a dining room table e) length of a children’s outdoor play area 14. Consider the outer edges of this figure. a) Perimeter of this figure in inches = __________ to closest 16
th inch
b) Perimeter of this figure in cm = __________ to closest 0.1 cm
15. A rectangular room is 15 feet by 12 feet. A wooden molding is to be placed along the upper
edge of each wall (that is, along the perimeter of the ceiling). How long will the molding be? 16. This diagram of a play area has measurements in meters. Two measurements are missing. Figure out the missing measurements If a fence were placed around the play area, how long would it be? (that is – find the perimeter) 17. Here is a diagram of a house, with
measurements given in feet. Three measurements are not marked. Figure out the missing measurements. What is the perimeter of the house? 18. Find the perimeter of each figure. Each grid square is 1 unit long and 1 unit wide.
a) b)
25
7 7
6
29
12
4
8
5
15
30

Section 9-2: Length
Page 9 – 31
19. Ted and Min made the following shapes on their geoboard. Ted
says the shapes have the same perimeter since each of them touches exactly four posts. Min says they do not. What do you think? Explain your thinking.
20. On the geoboard, using only horizontal and vertical lines, make a shape with perimeter as large as possible. You may want to try several shapes. For each one, record what its perimeter is.
21. Which of the following are correct ways to complete this sentence? List each answer that
would be correct. “Measurements… “ a) are always whole numbers b) are sometimes fractions c) are always exact d) are always approximations e) are sometimes exact f) should always include the unit of measurement g) are fun and useful

Section 9-3: Area
Page 9 – 32
Section 9-3: Area Area is an attribute of two-dimensional objects. The area of a figure is the amount of flat surface
encompassed by the figure – that is, the amount of surface inside the boundary of the figure. For each of the following, the area is the amount of flat surface shaded grey. We will learn how to measure the area of figures such as these. For irregular figures, such as the second one, we will find only rough approximations of area. Area is one of the attributes of objects that the National Council of Teachers of Mathematics includes in the Measurement Content Standard for grades Pre-K – 2.
The general method for measuring area is the same as for measuring length, namely: 1. Select an appropriate unit. (It could be a standard or non-standard unit.) 2. Use the unit to cover the surface being measured. The units should cover the surface so
that there are no gaps between units nor overlaps of units. 3. Decide what to do about any leftover part of the surface that is too small to cover by the
unit. That is, approximate and round the answer. Any two-dimensional shape can be used as a non-standard unit for measuring area. The two-
dimensional shape might be one side of a three-dimensional object. For example, the children’s rectangular building blocks (one particular shape of block) could be used as the unit – where it is understood that it is the flat bottom of the block that is the unit. The blocks could be placed on top of a table, with no gaps, to see how many blocks it takes to cover the entire table top. That number of blocks would be the measurement of the area of the table top, in units of those particular blocks.
Round or curvy objects can be used as non-standard units, though they provide only rough
estimates of area since there would be gaps between the objects. For example, if there is a collection of coins (plastic coins or real coins), then quarters could be used as the unit of area. Each child could trace an outline of his or her hand and then cover the hand with quarters to find the area of the hand measured in quarters. Then the quarters could be removed and the hand could be covered in pennies to see the area of the hand measured in pennies. Children can explore whether the two answers come out the same or different, and discuss why that is. Of course, these area estimates would be only rough measures of area since there would be many gaps between the coins.
Activity: Measuring Area with Non-Standard Units
Work with one or two partners. 1. Get a piece of paper that is about ! the area of this page (you could tear or cut a sheet of
paper to get this). Use a set of pattern blocks if you have them. If the yellow hexagon is used as “1 unit of area”, find the area of the piece of paper. Area of the paper = ________ of yellow-hexagon-units

Section 9-3: Area
Page 9 – 33
2. Use the set of pattern blocks. For this question, let the green triangle be “1 unit of area”. Then what is the unit of area of each of the other pattern block shapes? (Omit the white-
beige parallelogram.) orange square red trapezoid yellow hexagon green triangle blue parallelogram white (or beige) parallelogram
3. For this question, let “1 unit of area” be the area of a piece of paper, or else the area of the top of this book. What is the area of the table or desk you are working on, in terms of this unit of area? Be sure to estimate any leftover parts of the table or desk that are not covered by the paper (or book).
Square Units and Non-Square Shapes The most convenient shape for measuring area is a square. The standard units of area are
based on squares. In either the U.S. System or the Metric System, a unit of area can be formed by a square whose side is the length of one unit.
For example, a square inch is this ! This square is 1 inch on each of its sides.*
The area of the figure is 1 square inch.
1 square inch is abbreviated 1 sq in or 1 in2.
* Due to differences in printing methods, the square might NOT be exactly an inch on each side. This figure is a square centimeter. ! Each side of the figure is 1 cm long.** The area of the figure is 1 square centimeter.
1 square centimeter is abbreviated 1 sq cm or 1 cm2.
** Due to differences in printing methods, the square above might NOT be exactly 1 cm on
each side. In general for this chapter, figures might not be exactly the size stated.

Section 9-3: Area
Page 9 – 34
Figures that are not in the shape of a square can still have their areas determined. Here we consider fractional parts.
If the first figure below is 1 sq. inch, then the other figures have the areas stated because they are fractional parts of the square inch. For instance, consider the " sq in rectangle. Four of those rectangles placed next to each other would cover the square inch on the left. Therefore, its area is " of the square inch, or " sq in.
1 sq. inch ! sq in " sq in " sq in ! sq in When we say a figure has an area of “1 sq in”, the figure does not need to be in the shape of a
square. Rather, its area must be equal to the area in a square that is 1 inch on each side. The long rectangle below can be covered by four copies of the " sq in rectangle above.
This rectangle’s area is 1 sq in. If this rectangle were cut up, its pieces would exactly cover the 1 sq. inch piece in the shape of a square.
" in
1 in 1 in 1 in 1 in " this entire triangle shape has area of 1 sq in since it can be covered by two triangles that each have the area of ! sq in. (We can see from the earlier diagram that each of the sub-triangles has area ! sq in.) Practice Problems:
Suppose this square has area of 1 sq unit ! Think of fractions and multiples to find or estimate the areas of the following figures. 1) 2) 3) 4) 5) Answers to Practice Problems: 1) ! sq unit 2) 2 sq units 3) 1 sq unit (It is half of the 2 sq unit rectangle) 4) ! sq unit 5) " sq unit (it is half of the ! sq unit triangle – and 4 of these fit in the
square)
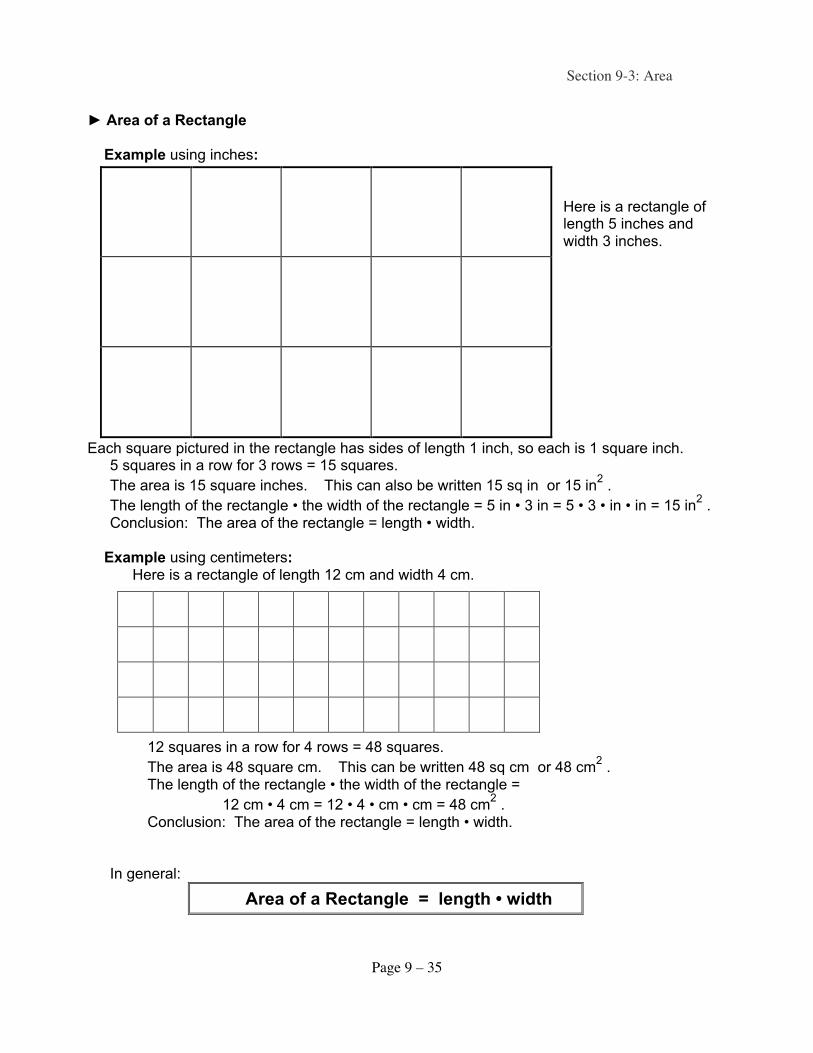
Section 9-3: Area
Page 9 – 35
! Area of a Rectangle Example using inches:
Here is a rectangle of length 5 inches and width 3 inches.
Each square pictured in the rectangle has sides of length 1 inch, so each is 1 square inch. 5 squares in a row for 3 rows = 15 squares.
The area is 15 square inches. This can also be written 15 sq in or 15 in2 .
The length of the rectangle • the width of the rectangle = 5 in • 3 in = 5 • 3 • in • in = 15 in2 .
Conclusion: The area of the rectangle = length • width. Example using centimeters:
Here is a rectangle of length 12 cm and width 4 cm.
12 squares in a row for 4 rows = 48 squares.
The area is 48 square cm. This can be written 48 sq cm or 48 cm2 .
The length of the rectangle • the width of the rectangle =
12 cm • 4 cm = 12 • 4 • cm • cm = 48 cm2 .
Conclusion: The area of the rectangle = length • width. In general:
Area of a Rectangle = length • width

Section 9-3: Area
Page 9 – 36
Combining and Moving Areas Sometimes the area of a complicated shape can be found by dividing it into several
simpler shapes. Other times the area of a complicated shape can be found by putting it “inside” a larger, simpler shape whose area is known; this is helpful if we know what part of the larger shape is encompassed by the original, smaller shape.
Example: Find the area of this diagram. The shape is not a rectangle, but it can be divided into rectangles. Note that the lengths of two sides are not labeled, but they can be found.
Below are shown three ways that the area can be found. It is handy to know multiple ways of solving a problem. • Solution 1: " 6 m since total vertical is 13 m and top part is 7 m Left rectangle area is 10 • 13 = 130 sq m. Right rectangle area is 5 • 6 = 30 sq m. Total area = 130 sq m. + 30 sq m. = 160 sq m. • Solution 2: Top rectangle area is 10 • 7 = 70 sq m. Bottom rectangle area is 15 •6 = 90 sq m. Total area = 70 + 90 = 160 sq m. 6 m 15 m • Solution 3: The “missing corner” has been filled in along the dotted lines. The area of the whole, larger rectangle is 13 • 15 = 165 sq m. The area of the upper right corner that is “missing” from the large rectangle is 7 • 5 = 35 sq m. 6 m The area of the given shape is 165 – 35 = 160 sq m. 15 m Solutions 1, 2, and 3 all have the same result. The area of the shape is 160 sq m.
10 m
7 m
5 m 13 m
10 m
7 m
5 m 13 m
10 m
7 m
5 m 13 m
10 m
7 m
5 m 13 m

Section 9-3: Area
Page 9 – 37
! Exploring triangles and their areas: A – Right Triangles 1. Start with a piece of paper that is rectangular, perhaps about 3 inches by 5 inches (a 3
by 5 index card would work fine, but the paper does not need to be exactly that size). 2. Draw in a diagonal of the rectangle (from one vertex to the opposite vertex). Then cut
along that diagonal. What is the result? - two congruent right triangles. 3. The two triangles that result are congruent to each other. They have the same area
as each other, and their area together is the area of the rectangle they came from. So the area of one of the triangles is exactly half the area of the rectangle it came from.
B – Triangles that are not right triangles. 1. Start with a piece of paper that is rectangular, perhaps about 3 inches by 5 inches (a 3
by 5 index card would work fine, but the paper does not need to be exactly that size). 2. Consider one edge of the rectangle as the bottom (or the base). That edge will be the
bottom or base side of a triangle. Write the word “base” along that edge. 3. Along the edge opposite the base, mark one point anywhere along that
edge – this point will be the top vertex of the triangle. For example: 4. Carefully draw lines from the the point along the top edge to each of the vertices at the ends of the base edge. Then carefully cut along these lines:
5. The result is a triangle with the specified base, and two other, smaller triangles. 6. Place the two smaller triangles on top of the larger triangle. Move them around until
you discover that they exactly match the area of the larger triangle. Conclusion: the area of the large triangle equals the area of the two small triangles
together. And so the area of the large triangle is exactly half of the area of the rectangle.
Extension: Try this activity again and choose a different point along the top edge. Try it again using a different size of rectangular paper. Look over the results of classmates as they do this activity.
Notice: the conclusion seems to always be true, no matter the size or shape of the triangle.
Developing the Formula for the Area of a Triangle The two explorations above provide some ideas about the area of a triangle, ideas that
we will develop more generally here for the area of any triangle. The overall strategy is to show that for any triangle, a rectangle can be drawn around the triangle, and the triangle’s area is half the area of that rectangle. Since we know how to find the area of a rectangle we can find the area of the triangle.
# Consider any triangle. Think of one side of the triangle as the bottom or base. For the
method we are using here, the base can not have an obtuse angle at one of its vertices; so – if there is an obtuse angle, put it at the “top”, not along the base. The triangle can
base
•
base
•

Section 9-3: Area
Page 9 – 38
be moved around until the base is along the bottom (this isn’t necessary, but makes it easier to see and talk about).
a triangle the same triangle moved around so one side is along the bottom Let’s call this side the “base” # Draw a rectangle “over” the triangle – using the base of the triangle as the bottom of
the rectangle, and the top of the rectangle is exactly at the height of the top vertex of the triangle.
# The “height of the triangle” is defined as the distance from the base or baseline to the
top vertex (going perpendicular from the baseline to that vertex). The height of the triangle is indicated by the dotted line in this diagram.
height base baseline # The area of the rectangle is its length • width. In this diagram, the area of the rectangle = the base of the triangle • the height of the triangle # The area of the triangle is shaded in two shades of grey in this diagram. The part
shaded light grey exactly matches the white area above it. The part shaded dark grey exactly matches the part above it. The two parts shaded grey have the same area as the two parts shaded white. So the parts shaded grey (both of those parts together) make up exactly half the area of the rectangle.
# The two parts shaded grey, together, comprise the triangle whose area we wanted to
find. Conclusion: the area of the triangle is exactly half the area of the rectangle. So, the area of the triangle = ! • the base of the triangle • the height of the triangle.
In general:
Area of a Triangle = " • base • height
Notes:
- Once the base has been located, the height of the triangle must be found perpendicular to that baseline going to the third vertex.

Section 9-3: Area
Page 9 – 39
- Any side of the triangle can be considered to be the base, and then the corresponding height, to that base, must be used as the height. The formula gives the correct area of the triangle no matter which base is used. (We have not proven this here. The proof involves more algebra than we want to use here. But it is true.)
- Sometimes the “top vertex” is not above the base but is off to the side. Then the height is “outside the triangle”, as in this diagram:
Finding Triangle Areas using the Formula
Practice Problems: A calculator may be helpful for these problems. A centimeter ruler is needed. When measuring lengths, round to the nearest tenth cm.
When calculating areas, round to the nearest tenth sq cm. Measure carefully so you get accurate answers! The goal: For each triangle, you will calculate its area three times. Any of a triangle’s sides
can be considered to be the base, and then you find the height to that base from the third vertex. In these problems you will use each side of the triangle (one at a time) to be the base and use the triangle area formula to calculate the area:
Area of a Triangle = " • base • height. Record the numbers (the measurements) used in your calculations. Include units with all measurements, including your answers, of course. 1. Find the area of this triangle in square centimeters. Use a ruler to measure the base and to measure the height (making a good estimate of
where the perpendicular line is for the height). With p as the base: With q as the base: With r as the base:
base
height
baseline
r q
p

Section 9-3: Area
Page 9 – 40
2. Find the area of this triangle in square centimeters. It is a right triangle. Use a ruler to measure the base and height.
With s as the base:
With t as the base: With v as the base:
3. Find the area of this triangle in square centimeters. Use a ruler to measure the base and to make your best estimate of the height. One side
was extended so that you could find the height to that side if you so choose. With a as the base: With b as the base: With c as the base:
t
v
s
a
b c

Section 9-3: Area
Page 9 – 41
! Geoboard Areas On the geoboard, let’s consider “1 square unit of area” to be the area of the smallest
square that can be formed by four posts – as shown in the upper left corner of this geoboard diagram. (This is a non-standard unit of area.)
Notice the rectangle of area 3 square units, near the left side. Notice that there is another rectangle of 3 square units that has been divided by the diagonal into two congruent triangular shapes. Each of those trianglular shapes must have area that is half the rectangle’s area, since they are congruent and together form the whole rectangle. So the area of each triangle shape here is ! of 3, which is 1! square units (or it could be written 1.5 square units.)
The diagonal (the line segment from one corner to the opposite corner of a rectable) divides the area of the rectangle in half.
Box-it-in Method: On the geoboard, let’s consider “1 unit of area” to be the area of the
smallest square that can be formed by four posts. The area of the dark-outlined triangle on this geoboard can be
found in this way: - A 3 by 3 square is shown in dotted lines around the top part of the
triangle. The top part of the triangle is exactly half of this 3 by 3 square. The area of the 3 by 3 square is 9 sq units, so the area of the top part of the triangle is ! of 9, which is 4! sq units.
- A 3 by 1 rectangle is shown in dotted lines around the lower part of the rectangle. The lower part of the triangle is exctly half of the 3 by 1 rectangle. That rectangle’s area is 3 sq units. So the lower part of the triangle has area of ! of 3 sq units, which is 1! sq units.
- the total area o fhte rectangle is 4! (from the top part) plus 1! (from the bottom part), which is a total of 6 sq units.
Activity: Geoboard Shapes with Specified Areas Materials: geoboard (of size 5 pegs by 5 pegs) and rubber bands.
It is best to do this activity with real geoboards. However, if none are availbe, an online geoboard may be used. (at http://standards.nctm.org/document/eexamples/chap4/4.2/
or at http://nlvm.usu.edu/en/NAV/frames_asid_172_g_2_t_3.html ) - Or else use geoboard grids on paper. - You or your instructor may want your answers recorded on geoboard grids. - Geoboard grids to copy are at the end of this section.
• You may want to work with classmates so you can discuss and compare answers –
sometimes there is more than one way to get the answer. • On the geoboard, consider “1 square unit of area” to be the area of the smallest square
that can be formed by four posts.

Section 9-3: Area
Page 9 – 42
1. On one geoboard, make separate shapes, each with one of these areas: (use one rubber band per shape)
1 sq unit; ! sq unit; 2 sq units; 2! sq units 2. Make a triangle with area of 2 sq units. Make a different triangle (one not congruent with the first one) of area 2 sq units. Continue to make non-congruent triangles of area 2 sq units. How many different (non-congruent) triangles are there of area 2 sq units? 3. Make a triangle with area of 3 sq units. Make a different triangle (one not congruent with the first one) of area 3 sq units. Continue to make non-congruent triangles of area 3 sq units. How many different (non-congruent) triangles are there of area 3 sq units? 4. Make a triangle with area of 4 sq units. How many different triangles are there with area 4 sq units on a 5x5 geoboard? 5. Make one parallelogram for each of the following areas
(use one rubber band per parallelogram)
1 sq unit; 2 sq units; 3 sq units; 4 sq units; 4 sq units in a non-congruent way 6. Make a hexagon with area 4 sq units. Make a hexagon with area 12 sq units. 7. Make as many shapes as you can with area 4 square units. Some have already been
done in this activity. What other ways can you find?
There are ten non-congruent triangles of area 2 sq units on the 5x5 geoboard. There are
six non-congruent triangles of area 3 sq units. Did you find all of them? Children and Geoboards
Geoboards provide a natural way for children to explore geometric concepts. As was mentioned in the earlier section on geoboards, a “story” can be told, such as saying that the pegs are fence posts and the rubber band is a fence, and the inner pegs are trees. This makes the geoboards more fun and also helps explain the ideas. “The concepts of area and perimeter pose a challenge to many second graders. One helpful tool is the geoboard.” (Smith 2006:177) Smith goes on to suggest that the boundary of a geoboard figure can be described as a “fence for a cow”, and children can be challenged to make a “cow pasture” of a certain area.

Section 9-3: Area
Page 9 – 43
! Activities Related to Perimeter and Area Activity: Perimeter = 30 cm
Materials: Centimeter squares grid paper a) On grid paper with centimeter squares, sketch shapes that each have a perimeter of
30 centimeters. Rules for making the shapes: stay on the grid lines as you draw the figure, and make the
figure be all “one piece” (that is, if you cut it out, it would all stay together in a piece). Make at least three shapes (they do not all need to be rectangles). b) For each figure you make, record its area inside the figure. c) Cut out your shapes that have the greatest and least areas. Put your name on them. d) Everyone should place their cut-out shapes along the edge of the room in order by size
of area. That would be the activity of seriating the cut out pieces by area. e) Discuss: i) Is there any pattern to the shapes that have more area and the shapes that
have less area? ii) If two shapes have the same perimeter, do they necessarily have the same area?
Activity: Yarn Perimeter of one length Materials: yarn or string (not a stretchy yarn but rather one whose size is stable), and one-inch square tiles (or any size square tiles could be used) Work in a group of 2 to 4 students. a) Cut a piece of string about 50 cm long. Tie the ends together to make a loop. b) On a desk or table top, make a shape with the loop (it can be a curvy shape, or not).
Keep the shape stable on the table top (perhaps by taping parts of it in place). (The shape could be placed on a soft board so that push-pins could keep the shape in
place.) c) Estimate the area inside the loop shape by filling it with 1-inch square tiles. You will
probably need to estimate “partial tiles” to get a good approximation of the area. d) Record the results in the table below. Repeat, making a total of three different shapes.
Make your three shapes very different from each other. Trial # small sketch of loop shape area in sq in
1
2
3

Section 9-3: Area
Page 9 – 44
e) Share results with other classmates. f) Conclude: What do you notice about the shapes that had the largest area? What do you notice about shapes that had the smallest area? Discuss in class.
Activity: Area Stays the Same Materials: centimeter square grid paper, scissors Colored pencils (since they will show up better on grid paper) Card-stock (or tag board) – or else pre-cut 5 cm squares (2 per person) a) From card-stock, cut out a square of size 5 cm on a side (do this as exactly as possible).
Then cut a second square like the first one. (Or, use the squares supplied.)
b) Trace the 5 cm square on the cm graph paper (use colored pencil). In the traced shape, write P = the perimeter of that square.
c) - Cut the card-stock square along the diagonal into two triangles. Put those pieces together in some way to make a new figure (the two pieces should not lie on top of each other, but should touch along an edge or part of an edge so that together they make one figure without overlapping).
- Set them on the cm graph paper and trace around that figure. - Calculate the perimeter of that figure; use the ruler if you need to. (For slanted lines,
the ruler will be needed). - Inside the shape just traced, write P = the perimeter of that figure.
d) Put the two triangles together in some different way to make another figure, different from the last one. Trace it on the cm graph paper. Calculate its perimeter (use a ruler as needed), and in the traced shape write P = the perimeter of that figure.
e) Use the second 5 cm square made of card-stock. - Cut it into two or three pieces, using straight edges (any shapes you want). - Rearrange those pieces into another figure (so the pieces touch, but don’t overlap). - Trace around it on the cm graph paper. - Calculate the perimeter of that figure, using a ruler as needed. - In the traced shape, write P = the perimeter of that figure. - Repeat this step (if you have time)
f) Conclude: What is the area of each of the figures you traced? If two figures have the same area, do they necessarily have the same perimeter?

Section 9-3: Area
Page 9 – 45
! Standard Units of Area As was mentioned near the start of this section on area, the standard units of area are based
on squares. In either the U.S. System or the Metric System, a unit of area can be formed by a square whose side length is one unit long. So, any length measurement squared is a unit of area.
The relationships between some units of area may seem confusing at first glance, but they
make sense if you consider diagrams. We know that 1 ft = 12 in. What does 1 sq ft equal? These diagrams show the reasoning.
Suppose that the first square is 1 foot on each side, and thus is 1 sq ft in size. The second square is the same size, but this time the 12 inches along each side are marked, and the square is shown with a grid of square inches. The total number of square inches is 12 • 12 = 144 sq in.
1 ft 12 in
1 ft 1 square foot = 144 square inches The following diagrams are drawn to a different scale than the ones above. They illustrate
the relationship between a square yard and square feet. Recall that 1 yd = 3 ft. 1 yd 3 ft 1 yd 1 square yard = 9 square feet Tables listing the typical units of area in the U.S. and Metric systems follow. These tables
are for reference. The equivalencies that you should understand and memorize are the two listed above: 1 sq ft = 144 sq in, and 1 sq yd = 9 sq ft.

Section 9-3: Area
Page 9 – 46
U.S. System – Units of Area
unit abbreviation equivalent to: examples of use
square inch sq in or in2 piece of paper
square foot sq ft or ft2 144 sq in floors, paint coverage
square yard sq yd or yd2 9 sq ft floors, gardens
square mile sq mi or mi2 640 acres cities, states
acre acre 43,560 sq ft farmland, large gardens
Metric System – Units of Area
unit abbreviation equivalent to: examples of use
square millimeter sq mm or mm2 science and engineering
square centimeter sq cm or cm2 100 sq mm piece of paper
square m sq m or m2 10,000 sq cm floors, gardens
square kilometer sq km or km2 1,000,000 sq m cities, states
hectare ha 10,000 sq m farmland
Practice Problem
The Top Carpets store listed the cost of carpeting as $4 per square foot. The Best Flooring store stated the cost as $32 per square yard. If Tanisha wants to purchase 12 square yards, at which store will she pay less? What will be the cost to her, before tax?
Answer to Practice Problem
First, recall that 1 sq yd equals 9 sq feet. Next, figure out what the price at Top Carpets is for a square yard of its carpet. At Top Carpets the cost of carpeting is $4 per square foot. To get a sq yd of carpet from Top Carpets, that would be getting 9 sq ft, so the cost would be 9 sq ft • $4 per sq ft = $36 for the square yard. That is more expensive than the cost per square yard at Best Flooring.
From Best Flooring, the cost of 12 sq yd will be 12 sq yd • $32 per sq yd = $384.

Section 9-3: Area
Page 9 – 47
Activity: Estimating and Measuring Area in Standard Units Materials: U.S. system and metric length measuring tools (ruler, yardstick, meter stick, tape
measure); a calculator may be useful Work with a partner or two. For each item: follow steps a, b, c for the U.S. system, and then follow a, b, c for the Metric system. a) Choose an appropriate unit of measure in the system. b) Estimate the area by estimating the length and width and then calculating area, and
record your estimate. c) Measure the item’s dimensions, calculate the area, and record the area. Reminder: include the units with each area.
U.S. System Metric System item
Estimated Area Measured Area Estimated Area Measured Area
table or desk top
this piece of paper
one section of whiteboard
floor of the room
item of your choice: ______
Look over your recorded areas. Were your estimates reasonable? Did your estimates get
more accurate as you went along?

Section 9-3: Area
Page 9 – 48
Section 9-3: Exercises on Area Always include the unit of measurement for a measurement answer. 1. A rectangular room with wall-to-wall carpeting is 15 feet by 12 feet. What is the area of the
carpet covering the floor? a) find the answer in sq ft b) find the answer in sq yd 2. This diagram of a play area has measurements in meters. Some measurements are missing but they can be figured out. What is the area of this shape? 3. Here is a diagram of a house, with
measurements given in feet. Three measurements are not marked, but can be figured out. What is the area of the house? 4. Find the perimeter and area of each figure. Each grid square is 1 unit long and 1 unit wide. Include correct measurement units.
a) b) c)
2 5
7 7
6
29
12
4
8
5
15

Section 9-3: Area
Page 9 – 49
5. Find the base, associated height, and area for each triangle. Each grid square is 1 unit long and 1 unit wide. a) b) c)
base = _______ base = _______ base = _________ height = _______ height = _______ height = _______ area = _________ area = _________ area = _________ 6. Find the area of each figure.
Each grid square is 1 unit long and 1 unit wide. a) b) c) d) e) f)
Hint for e and f: think of subtraction of the “missing area”.

Section 9-3: Area
Page 9 – 50
7. For each of these triangles, find perimeter and area. a) b) c) 8. Estimate the area of each of these figures.
Each grid square is 1 unit long and 1 unit wide. a) b) c) 9. For each item, select the measurement that is the only reasonable possibility for it. a) the area of the ceiling of a bedroom i) 180 sq ft ii) 180 sq yd iii) 180 sq cm iv) 180 acres b) the area of the cover of my calculator i) 1 sq ft ii) 10 sq cm iii) 21 sq in iv) 5 sq m
c) the area of Jose’s garden of tomatoes, peppers, and green beans in the yard of his house in the city
i) 10 acres ii) 120 sq ft iii) 200 sq cm iv) 10 sq ft d) the area of a parking space (for one car) in a parking lot i) 180 sq in ii) 180 sq ft iii) 180 sq yd iv) 180 sq m
e) the area of the deck on Sam’s suburban home, where he has a table, 6 chairs, and a grill
i) 30 sq m ii) 300 sq cm iii) 30 sq ft iv) 3,000 sq mm 10. Itzak estimates that the fence he wants to paint has an area of 60 sq yd. The paint can
label says that one can of paint should cover 350 to 400 sq ft. How many cans of paint does he need? Explain thoroughly.
28 cm 21 cm 20
32 cm 5.1
6.3
6.3 m
5.7 12 in
5 in
8 in 6 in

Section 9-3: Area
Page 9 – 51
11. On the geoboard, make a triangle of area 6 square units (where one unit is the smallest square made by a rubber band touching four posts). Make a different triangle of area 6 square units. Are there more? Find and record all non-congruent answers.
12. On the geoboard, using only horizontal and vertical lines, make a figure with perimeter of 10 units. Make at least three non-congruent such figures. For each one, record its area.
13. On the geoboard, using only horizontal and vertical lines, make a figure with area of 8 square units. Make at least three non-congruent shapes with area 8. For each one, record its perimeter.
14. Remember the tangram pieces from the Geometry chapter. Suppose that the smallest triangle is defined as having area of 1 square unit. Then what are the areas of each of the other six pieces?

Section 9-3: Area
Page 9 – 52
Geoboard Grids – in case you want to use them.

Section 9-4: Volume, Capacity, and Surface Area
Page 9 – 53
Section 9-4: Volume, Capacity, and Surface Area Volume is a measure of the amount of space in a three-dimensional object, for example the
amount of space in a refrigerator, a building, a package, or a train’s freight car. Volume helps us understand how much a given object can hold. Earlier in this chapter, we discussed length, which is a one-dimensional measurement, and area, which is two-dimensional. Volume is a three-dimensional measurement.
Capacity is another word for volume. In systems of measurement, “capacity” is the word that is
typically used when an amount of liquid is being measured or when the container is a bottle or tank. In everyday use, “capacity” is used to refer to all sorts of volumes, such as the capacity of a refrigerator or a suitcase.
The standard units used for measuring capacity (when referring to liquids) include gallons,
pints, and cups in the U.S. system, and liters in the metric system. A full discussion of capacity units will be given later in this section.
The units for measuring volume or capacity are three-dimensional. Non-standard units for
volume or capacity could be children’s play blocks, a handful, a scoop, a drop, or a truck-full. The general method for measuring volume is the same as for measuring length and area,
namely: 1. Select an appropriate unit. (It could be a standard or non-standard unit.) 2. Fill the space being measured with copies of the unit. There should be no gaps between
units nor overlaps of units. 3. Decide what to do about any leftover part of the space that is too small to be filled by one
unit. That is, approximate and round the answer. Activity for volume-capacity with non-standard units: Materials: a container of dried grain (such as rice or popcorn) or of sand, 2 or 3 plastic bottles or cylinders, and on each bottle mark all around it a height fairly
near the top (e.g., with permanent marker) if the bottles have narrow openings then have a funnel that fits in the opening, scoops of two different sizes (e.g., a sugar scoop, a coffee measuring scoop, or a large
serving spoon could be used) (Note: To make clean-up easier, all of these items could be in a large plastic tub or a
sensory table area.) What to do:
a) For one of the bottles and one of the scoops, estimate how many scoops it would take to fill the bottle to the marked height. Record the estimate.
b) Use the scoop to fill the bottle with the grain or sand up to the mark – counting the number of scoops needed. (Use the funnel if needed.) At the end you may need to

Section 9-4: Volume, Capacity, and Surface Area
Page 9 – 54
use a partial scoop and estimate what fractional part of a scoop it is. Record the number of scoops used.
c) Calculate the difference between the measured amount and the estimate. Then repeat steps a, b, and c with different bottle-and-scoop combinations. Standard Units for Volume The standard units for measuring volume are cubes. Recall that the edges of a cube are all the same length; and the faces are congruent squares. (Note: The items called “ice cubes” are often not really “cubes”.)
In either the U.S. System or the Metric System, a unit of volume can be defined by a cube whose edge length is one unit (and each face is then one square unit). Any length measurement cubed is a cubic unit of volume.
Example in Metric System: Example in U.S. System: When the edges of the cube are each When the edges of the cube are each one centimeter long, one inch long, the cube is one cubic centimeter. the cube is one cubic inch. 1 cu cm ! 1 cu in ! (each edge is (each edge is 1 cm long) 1 inch long)
There are several notations for volume measurements. For example:
1 cubic centimeter = 1 cu cm = 1 cm3. 1 cubic inch = 1 cu in = 1 in
3.
1 cubic km = 1 cu km = 1 km3. 1 cubic foot = 1 cu ft = 1 ft
3.
Note that the notation “ft3” is pronounced “feet cubed.” The notation “cu ft.” is pronounced
“cubic feet.” Both terms mean the same thing. Surface Area The area of the outer surface of a three dimensional object is called its surface area. For
example, a rectangular “box” has six faces. The surface area of the box is the sum of the areas of each of the six faces.
Example: consider this diagram of a box with height 10 in, length 50 in, and width 15 in.
50 in 15 in 10 in

Section 9-4: Volume, Capacity, and Surface Area
Page 9 – 55
To find its surface area, we find the area of each of its six faces and add them together: - front face is 50 by 10 ! area = 500 sq in - back face is same as front ! area = 500 sq in - right face is 10 by 15 ! area = 150 sq in - left face is same as right ! area = 150 sq in - top face is 15 by 50 ! area = 750 sq in - bottom face is same as top ! area = 750 sq in Sum = 2800 sq in The surface area of the box is 2,800 sq in. Activity: Measuring Volume with Cubic Inches and Surface Area in Square Inches
Materials: • Make a copy of the following page (giving a pattern or “net” for a box) on “card stock” or
“tag board”. It is okay to make a copy on regular paper, but it will be a bit easier if the copy is on slightly heavier paper.
• One-inch cubes (about 25 to 30 cubes) Write the units with each measurement. 1. Cut out along the outer edges of the pattern for a box, cutting around the outside of the
“tab” sections (leaving them attached to the pattern). 2. Then fold the cut out pattern to form a box, with no lid, and tape the edges together using
the tabs. 3. Fill the box with 1-inch cubes to determine its volume. Record the following
measurements for the box:
Length = ______ Width = _______ Height = _______ Volume = _________ Notice: The box has a bottom layer of cubes – how many cubes are in that layer? ____ How many layers of cubes are in the box? _____ How can the volume be found from these two numbers?__________________ 4. Determine the surface area of the box by observing the area of each face and adding
those areas together. Notice that this box has only five faces since there is no top.
Front face area =
Back face area =
Left face area =
Right face area =
Bottom face area = Surface Area = _______________

Section 9-4: Volume, Capacity, and Surface Area
Page 9 – 56
Pattern or “net” for a box
tab
tab
t
a
b
t
a
b

Section 9-4: Volume, Capacity, and Surface Area
Page 9 – 57
Activity: Exploring Volumes and Surface Area using Cubes Materials: One-inch cubes and/or One-centimeter cubes Work with a partner or work alone.
Overview of activity: - Count out a specified number of cubes (assigned below). - Put the cubes into the shape of a rectangular box - Record the facts about that box in a table with headings like the one below (Make the table on your own paper). - Make and record the information for all the different shapes of boxes that are possible for the amount of cubes you have.
Part A: Each person or set of partners should choose or be assigned one of these numbers
of cubes: 12 or 16 or 18 (different groups in the class should have different numbers assigned)
Count out the number of cubes you have chosen or been assigned. All of the cubes should be of the same size (either 1 inch cubes or 1 cm cubes).
a) Form the cubes into a rectangular “box”. You can place the cubes next to each other to form a rectangular base, and you can stack them. Think of the cubes as being glued together to make a solid box. Do not actually glue the cubes – just think of them as being glued so that the box is one solid.
b) Draw a sketch of the box and label the length, width, and height. For example, one of the boxes for 18 cubes is:
3cm 6 cm 1cm
c) Record the volume of the box, using appropriate units.
d) Determine and record the surface area of the box, using appropriate units. Then make a different (non-congruent) shaped boxes out of the same cubes and do
steps a, b, c, and d again for each new shape of box. (Four shapes are possible. One is long and narrow.)
Table headings to record on other paper, with one row for each box shape:
Sketch # length width height Volume Surface Area #1
Part B: Part B is just like part A, except that each person or set of partners should choose or
be assigned one of these numbers of blocks: 24 or 32 or 36 (different groups in the class should have different numbers) • Make all the shapes of rectangular boxes that you can with this number of cubes.
• There are more possibilities than in Part A. • Just as in Part A, draw sketches and record the results in a table like the one above. • Plan and describe a strategy with the blocks to ensure you don’t miss any possibilities.

Section 9-4: Volume, Capacity, and Surface Area
Page 9 – 58
Part C: Answer the following in paragraphs. Specifically refer to data from your tables in answering. i) What is the relationship of length, width, and height with volume? ii) Do boxes with the same volume always have the same surface area?
! Volume of a Right Rectangular Prism (i.e., of a rectangular box) Recall from the Geometry chapter that a right rectangular prism is a polyhedron with a bottom base that is a rectangle, a top base parallel and congruent to the bottom base and directly above it, and the rectangular sides connecting the edges of the bases. We often call that shape a rectangular box. The volume of a rectangular box can be determined by finding the area of the base (which would tell us the number of cubes that would cover the base) and then multiply that by the height of the box (which would tell us how many layers there are of the cubes). In other words:
Volume of a Rectangular Box = Length • Width • Height
Notice that the units resulting from this formula make sense. For example, if a box has length 7 ft, width 2 ft, and height 3 ft, then
Volume = 7 ft • 2 ft • 3 ft = 7 • 2 • 3 • ft • ft • ft = 42 ft3 or 42 cu ft.
The notation “ft3” is pronounced “feet cubed.” The notation “cu ft.” is pronounced “cubic feet.”
Both terms mean the same thing. Note that the measurements used for the length, width, and height must all be in the same kind of units in order for this volume formula to make sense. Example: At his small restaurant Michael stores flour in plastic containers shaped as right rectangular prisms that are 6 inches high, 9 inches wide, and 1 foot long. What is the volume of flour that can fit in one full container? Solution of Example: The measurements must all be in feet or in inches before they are multiplied. Let’s change them all to inches. Then the 1 foot length equals 12 inches. The Volume of the container = length • width • height
= 12 in • 9 in• 6 in = 648 in3, or 648 cu in.
Activity: Measuring Volume and Surface Area of various open-top-boxes Materials: scissors and tape, Cm squares grid paper of size 20 cm by 20 cm – about ten sheets – preferably on card
stock or tag board (though paper would be okay if that is all there is). (The Appendix has a 20 x 20 cm grid that may be copied.)
If you cut a square the same size from each corner of a rectangular paper and fold up the remaining part, an open top box is formed. !

Section 9-4: Volume, Capacity, and Surface Area
Page 9 – 59
• Open-top-boxes will be formed from the 20 x 20 cm grid paper. The goal is to have at least one box of every possible size that can be made from the paper (having a whole number of centimeters as the edge lengths). The class may share the work, making one set of boxes, one of each size. Or each group or person may make all the possible boxes. If the class is sharing the work, each person or group must be assigned the size of square to cut out of the corners of the 20 x 20 cm grid, going from 1 x 1 to 9 x 9. • After a box is made, its volume and its surface area should be determined. • A table recording the following information should be created, with one row for each box:
size square cut out of corner
box length box width box height Volume Surface Area
• Everybody should look at all the boxes and at the table recording the results for all of the boxes. Look for patterns or observations to make from the table. For example: - How do length and width compare? - Is there a relationship between volume and surface area? - Is it true that when the corner square that is cut out is larger, the volume of the box is
smaller? Explain. ! Standard Units of Volume
The relationships between some units of volume may seem confusing at first glance, but they make sense if you consider diagrams.
We know that 1 ft = 12 in. What does 1 cu ft equal? These diagrams show the reasoning.
Suppose that the first cube is 1 foot on each edge, and thus is 1 cu ft in volume. The second cube is the same size, but this time the 12 inches along each edge are marked, and the cube is shown as a “box” of many cubic inches. The total number of cubic inches is 12 layers of 12 rows by 12 columns in each layer: 12 • 12 • 12 = 1728 cu in.
1 ft 12 in
1 cubic foot = 12 in •12 in •12 in or 1728 cubic inches

Section 9-4: Volume, Capacity, and Surface Area
Page 9 – 60
The following diagrams are drawn to a different scale than the previous ones. They illustrate the relationship between a cubic yard and cubic feet. Recall that 1 yd = 3 ft.
1 yd 3 ft 1 cubic yard = 27 cubic feet (3 • 3 = 9 in each layer, for 3 layers) Tables listing the typical units of volume in the U.S. and Metric systems follow. These tables are
for reference.
U.S. System – Units of Volume
unit abbreviation equivalent to: examples of use
cubic inch cu in or in3 a package’s volume
cubic foot cu ft or ft3 1728 cu in refrigerator inside capacity
cubic yard cu yd or yd3 27 cu ft mulch, gravel
cubic mile cu mi or mi3 mountain volume, gravel pit size
Note about language: Supplies such as gravel, mulch, and topsoil are three-dimensional and are measured in cubic units, often in cubic yards. If you need mulch for a garden, you would calculate how many cubic yards are required. The companies that sell mulch by the cubic yard typically don’t bother saying “cubic”. They might say “the cost is $55 a yard” – but they mean per cubic yard.
Metric System – Units of Volume
unit abbreviation equivalent to: examples of use
cubic millimeter cu mm or mm3 science, medicine
cubic centimeter cc or cu cm or cm3 1000 cu mm space in food package,
medicines cubic meter cu m or m
3 1,000,000 cu cm gravel, dirt
cubic kilometer cu km or km3 mountain volume
Note: “cc” is a special abbreviation of cubic centimeter. The abbreviation cc is often used in medical contexts.
Practice Problems
1. One reference book said that a heating system should provide at least 300 cubic yards of airflow per minute when it is on. The equipment Mr. Jones is considering purchasing says it provides 8,000 cubic feet of airflow per minute. Is that sufficient?

Section 9-4: Volume, Capacity, and Surface Area
Page 9 – 61
2. A tool shed in the shape of a rectangular box is 8 feet long, 3.5 feet wide, and 7 feet high. What is the volume of the shed?
3. The science classroom is 10 meters wide, 20 meters long and 2.5 meters high. What is
the volume of the room?
Answer to Practice Problem 1. From the table we see that 1 cu yd equals 27 cu feet. The requirement is 300 cubic
yards, so let’s see how many cubic feet that is so we can tell if 8,000 cu ft is enough. Each cubic yard is 27 cubic feet, so 300 cubic yards is (300 • 27) cubic feet. 300 • 27 = 8,100. So, 8,100 cu ft of airflow per minute are required. Thus the system that provides 8,000 cu ft of airflow per minute is close but is not quite sufficient.
(Note: A general method for converting units (for example, converting cubic yards to cubic feet) is given in a later section of this chapter.)
2. Volume = length • width • height = 8 ft • 3.5 ft • 7 ft = 196 ft3. The volume of the shed is
196 cu ft.
3. 10 m • 20 m • 2.5 m = 500 m3 = 500 cu m. The volume of the room is 500 cu m.
! Volume and Surface Area of Prisms Consider any right prism. Recall that a right prism is a polyhedron with a bottom base in
the shape of a polygon, the top base congruent to the bottom base and parallel to it and directly above it. The sides are rectangles connecting the top and bottom bases.
The volume of any prism can be determined in the same way we determined the volume
of a rectangular prism. The method is to first determine the area of the base of the prism. A layer one unit high would have volume equal to that number. The volume of the entire prism as a whole is the area of the base multiplied by the number of layers that fit in the prism, which is the height of the prism.
For example: The triangular prism below has a triangle base. Suppose the prism is 5 feet
high and the area of the base is 3 square feet. A “layer” on the base that is 1 foot high has volume of 3 cubic feet. There are five such layers.
The total volume of the triangular prism is 5 layers of 3 cu ft each ! 15 cu ft.

Section 9-4: Volume, Capacity, and Surface Area
Page 9 – 62
In general, we find that:
The Volume of a Prism = (the Area of the Base) • (the Height)
To find the surface area of a prism, find the area of each face and add those areas
together. For example: The prism here has edges with the lengths marked. The sides of the
triangle base have lengths 2 ft, 3.2 ft, and 4.4 ft, with the height of the triangle (not shown) of 1.35 feet. The height of the prism is 5 feet.
Find the surface area of the prism. 4.4 ft 3.2 ft 2 ft Here is a diagram of the triangle base to help us find its area 5 ft
Solution of the surface area: - triangle base has area ! • base • height = ! ( 1.35 ft) ( 4.4 ft) ! 3 sq ft - the other triangle base has the same area ! 3 sq ft - the left side face rectangle area = 2 ft • 5 ft ! 5 sq ft - the right side face rectangle area = 3.2 ft • 5 ft ! 16 sq ft - the back side face rectangle area = 4.4 ft • 5 ft ! 22 sq ft The total surface area is the sum of these areas ! 49 sq ft.
! Children’s Understanding of Capacity Piaget’s Conservation of Liquids Task
In the section on the Introduction to Measurement it was mentioned that Jean Piaget described various “conservation” tasks that a child must understand before he or she can reliably measure various attributes. To understand capacity, the child must be in a stage where he or she comprehends the conservation of liquids task. There are several ways the conservation of liquids task can be described; following is one way.
A child is shown three clear glasses. Two of the glasses are identical, and have the
same amount of a colored liquid in them (the liquid is clearly at the same height in the two glasses.) When asked whether the two glasses have the same amount of liquid, the child answers that yes, they do.
!
4.4 ft
3.2 ft 2 ft 1.35

Section 9-4: Volume, Capacity, and Surface Area
Page 9 – 63
As the child watches, the liquid from one of the tall glasses is poured into the short, wide glass. The child is asked whether the two glasses with liquid in them have the same amount of liquid. Children who are younger than six or seven (who are in the “preoperational stage” as defined by Piaget) answer that they do NOT have the same amount of liquid. Most say that the taller glass has more, though a few children say the lower glass has more because it is wider. “The child’s thinking tends to be ruled more by perception than logic during the preoperational stage and is therefore susceptible to outward appearances: the glasses look different so must be different.” (Ormrod 1990: 142)
Children Noticing the use of Different Units of Volume/Capacity Juanita Copley in The Young Child and Mathematics describes an activity that could be
used with young children, such as kindergarteners, to explore the use of different non-standard units of measure. The activity described here is similar to that one.
Materials: One clear plastic bowl is labeled “yes” and another bowl (of the same size)
is labeled “no”. There is another container full of beans (or sand or rice). And there are two scoops of different sizes that can be used to scoop out a small amount of the beans (small scoop sizes of about one tablespoon, larger scoop perhaps 1/8 or " cup).
Only the large scoop is visible at the start. The teacher asks the children a yes-no
question (for example: Does the shirt you are wearing today have buttons?). Each child answers the question by using the scoop to put one scoopful of beans into the correct bowl (the “yes” bowl or the “no” bowl). Children realize they can compare the quantity of beans in the two bowls to find the comparison of “yes” to “no” answers for the class as a whole.
Then the activity can be done again but with a twist. Both scoops are brought out – one
for the “no” answers and one for the “yes” answers; let’s say the smaller scoop is for “no” answers. This time, the people who answer “no” use the smaller scoop to put a scoop of beans into the “no” bowl, while the “yes” answers continue to use the larger scoop to put beans into the “yes” bowl.
Copley explains: “The children then must decide if this is a fair system. Although they may be unable to
verbalize their reasoning, children quickly decide that [using the different scoops] is unfair. This indicates a developing understanding of the importance of a consistent unit of measurement.” (Copley 2000:142)
! Standard Units of Capacity Capacity units are commonly used for measuring amounts of liquids. However, they are
simply a measure of volume and can be used for measuring non-liquids also. A common use of capacity units is for measuring food for cooking – both liquids and non-liquids. For example, a recipe might call for 1 cup of milk, 2 cups of flour, 1 teaspoon of vanilla, and 1 tablespoon of baking powder.

Section 9-4: Volume, Capacity, and Surface Area
Page 9 – 64
In the U.S. System, the units of capacity do not follow much of a pattern in how they relate to each other. The common units are given in the following table.
Summary of some units useful in cooking: 1 tablespoon = 3 teaspoons " cup = 4 tablespoons
Notes: • A fluid ounce is not the same as an ounce of weight. A fluid ounce is a measure of volume – how much space the substance occupies. An ounce of weight depends on how heavy the substance is (no matter how large it is in size). • Some cleaning products, such as car-washing liquids and liquid garden fertilizer concentrates, say to use “one ounce” of the product mixed with water. This means one fluid ounce. It is the same as saying “2 tablespoons”.
In the Metric System, the liter is the basic unit of capacity. A liter is similar to the size
of a quart in the U.S. System. You may have seen a one liter bottle of water. The larger bottles of soda pop, often used at parties, are 2 liter bottles. Other units of capacity are based on the size of a liter, using the prefixes that are standard in the metric system, namely:
milli !
centi !
kilo ! 1000
Metric System – Units of Capacity
unit abbreviation equivalent to:
milliliter mL 1/1000 liter centiliter cL 1/100 liter
liter L or l
kiloliter kL 1000 L Notes: - The metric units of capacity and of volume directly relate to each other. The quantity of one milliliter occupies the space of exactly 1 cubic centimeter. That is, 1 ml = 1 cc. - The abbreviation for liter is the upper case letter “L” since the lower case letter “l” can too easily be confused with the number 1. Sometimes a cursive looking lower case script letter is used “l “, but typically the “L” is most clear.
U.S. System – Units of Capacity
unit abbreviation equivalent to:
teaspoon tsp or t 1/3 tbsp Tablespoon tbsp or tbl or T 3 tsp or ! fl oz fluid ounce fl oz 2 tbsp or 1/8 c
1 cup c 8 fl oz or 16 tbsp 1 pint pt 2 c
1 quart qt 2 pt, or 4 c 1 gallon gal 4 qt

Section 9-4: Volume, Capacity, and Surface Area
Page 9 – 65
Activity: Estimating with Metric units of Capacity Materials: Something to measure such as rice, sand, small beans, or popcorn kernels (note:
liquid could be used, but it could be a bit messier); One die per group; spoon or small scoop; bowl or other container; measuring cup marked in milliliters up to at least 100 mL; calculator Work with a partner or two. Before starting, look at the measuring cup marked in milliliters, to become familiar with metric
capacity measurements. Each person on his/her turn should do the following: a) Roll the die.
b) Multiply the number showing on the die by 10. That is your “target number” of milliliters. Record that “target number” in the chart (the chart follows).
c) Estimate: pour or scoop (but don’t measure) of that “target number” of milliliters of the substance (rice, sand, whatever you have) into an unmarked bowl or container.
d) Measure: pour the substance from the bowl or container into the measuring cup. Measure how many milliliters there are. Record the measurement in the chart.
e) Find the difference between the estimate and the measurement; record it. Then calculate the percentage off of the estimate (that is, divide the difference by the actual measurement, and express it as a percent). Record it in the chart.
For each person’s second turn, if the same number as before is rolled on the die, roll again
until you get a different number.
Person target # ml measurement # ml difference percent off
Observe the results in the chart. Did you improve in your estimation? Were the estimates better for smaller or larger amounts? This is only a small sample of estimates, so it is fine if you didn’t improve yet.

Section 9-4: Volume, Capacity, and Surface Area
Page 9 – 66
Section 9-4: Exercises on Volume, Capacity, and Surface Area
Include units of measurement with measurement answers.
1. Bring to class labels from food products that indicate a volume or capacity measurement for the item. (Bring the entire package if possible, or just the label indicating the item and its capacity.) Be prepared to tell the class about the measurements (are they in the U.S. or metric system, or are both shown?). The packages brought in by students could be seriated by labeled capacity (for the capacity inside the packages, not the size of the packaging itself). Take care not to confuse weight measures with capacity measures (especially for “ounces”).
2. A rectangular box is 2 feet wide, 3 feet long, and 7 feet high. a) What is the volume of the box? b) What is the surface area of the box? 3. The Best Beans company wants to package 72 cu in of beans in a rectangular shaped
box. What dimensions could the box have? What different dimensions could the box have? (That is, give at least two answers to what dimensions the box could have.)
4. Here is a diagram of a triangular prism, lying on its side. The two congruent triangular bases have sides as marked, and height of 20 cm as marked. The height of the prism is 40 cm. a) What is the volume of the prism? b) What is the surface area of the prism? 5. A tool shed in the shape of a rectangular box is 10 feet long, 4 feet wide, and 7 feet high
on the inside. Suggestion: Draw a sketch of the shed. a) The size of the ventilation fan needed for the shed depends on the volume of the
shed. What is the volume? b) The ventilation fan being considered says it provides sufficient ventilation for a volume
up to 12 cubic yards. Is that okay for this shed? (that is, is the volume of the shed less than 12 cubic yards?) Explain how you know.
c) The shed interior will be painted – all four sides plus the ceiling (not the floor). What is the surface area that the paint must cover?
6. A recipe calls for 1 cups of milk. Joanna will be tripling the recipe.
a) How much milk will be needed? b) Is that more or less than a pint? Explain. c) Is that more or less than a quart? Explain. d) Is that more or less than a gallon? Explain. 7. For each of the following, select the only reasonable measurement of volume or capacity. a) the volume of air in a classroom i) 2 cu m ii) 200 cu m iii) 2 cu cm iv) 200 cu cm v) 200 liters b) a pitcher of orange juice in the refrigerator i) 1.5 mL ii) 1.5 cL iii) 1.5 L iv) 1.5 kL c) amount of flour in a recipe to make a cake i) 4 mL ii) 400 mL iii) 4 L iv 40 L v) 4 kL
28 cm 21 cm 20
32 cm
40 cm

Section 9-5: Weight, Temperature, and Time
Page 9 – 67
Section 9-5: Weight, Temperature, and Time
Weight Concerning the measurement attribute of weight: “For young children, the comparison of
objects to see which one is heavier or lighter should be the primary focus.” (Copley 2000: 134)
When young children explore the concept of weight, teachers might discuss with them topics such as these:
- Is that book heavier than this book? How do you know? - Is that bucket of sand heavy? Can you lift it? - Is the box of dress-up clothes heavier or lighter than the box of blocks? - How could we find the weight of this bowling ball if we can’t place it directly on the scale? One type of weight scale that can be used in comparing weights is a balance scale,
sometimes called a pan balance scale. For this scale, some item is placed on one side and another item on the other side. The side with the heavier item will move lower than the side with the lighter item. The actual weight of the objects (in standard units) is not found; rather, what is found is how the objects’ weights compare to each other.
On this balance scale ! the “pans” are at the same height because the weight on the two sides is balanced (is equal). On this balance scale ! the “pans” are at different heights. The items in the lower pan weigh more than the items in the higher pan. Other types of weight scales can be used to find the weights of objects in standard units.
The scales might give a digital readout, or there might be a pointer pointing to a number from a list (or on a dial) – and that number is the weight of the object. A pan balance can be used to find weights in standard units if there is a set of well-made standard units that can be placed on one side (while the object is on the other side) until the two pans balance.
Activity: Comparing Weights Using a Balance Scale Materials: a balance scale, various small items in the room Work with a partner. • Select two items and hold them. Decide which you think is heavier. Your partner should
also hold the items and decide. Then place the items on the pan balance to check if you were right.
Examples of items whose weights could be compared:

Section 9-5: Weight, Temperature, and Time
Page 9 – 68
A pencil and a pen A glue stick and a roll of tape A scissors and a small stapler A ruler and a marker Note about Balance Scale: A simple balance scale could be
made by using a coat hanger, two paper or Styrofoam bowls (or those square plastic produce containers), and string. Each bowl should have a string attached, then looped across the bottom side of the hanger, and then attached to the other side of the bowl. The two bowls balance on opposite ends of the hanger. The hanger should be hung on a rod or a finger, being able to swing freely.
Activity: Seriating by Weight Using a Balance Scale Materials: a balance scale on which weights of two objects can be compared, About 5 identical containers that are opaque, such as film canisters, The containers
should be labeled (e.g., A, B, C. D, E) or be of different colors. Small items (such as coins, stones, popcorn kernels, rice, water, or small weights) that
fit inside the containers (Canisters with weighted objects that fit well in them are commercially available.) Before the activity:
Someone must prepare the containers in advance by putting a different amount of weight in each one. For ease of discussion during the activity, it is convenient to have the containers labeled so they can be told apart and talked about (so, each one might be labeled with a letter of the alphabet, or they might be different colors – but the weights should not be in the same order as the labels).
Also, it is best if the weights in the cans are similar so that it is not easy to tell which is heavier or lighter simply by holding it in one’s hands.
What to do:
Use the balance scale to compare the weights of the various containers. Place the containers in order by weight, from lightest to heaviest. That is, seriate the containers by weight. Record the order that you believe the containers belong in, sorted by weight.
Write an explanation of your process, what your reasoning was. The containers can then be opened to see if they were correctly placed in order (but
this works only if the items in the containers are all the same type of items – like weights or various levels all filled with popcorn kernels).
Activity: Using Non-Standard Units of Weight on a Balance Scale Many different items could be used as a non-standard unit of weight, such as paperclips, the
Base Ten blocks units, 1 inch square tiles, pencils, building blocks, etc. For this activity, choose one of these types of objects to serve as the non-standard unit of weight. You will need to have a collection of these “weight units” to measure the weight of various items.

Section 9-5: Weight, Temperature, and Time
Page 9 – 69
Materials: a balance scale, a collection of the same type of objects to serve as non-standard units, various items to be weighed (such as scissors, pencil, notebook, ruler, etc.) What to do: Select an item. Estimate its weight in the non-standard unit being used (by holding the
item and unit in your hands), and record the estimate in the table following. Them measure the weight of the item on the balance scales, in terms of the non-standard unit being used, and record that measurement
item estimated wt measured wt
Weight versus Mass The weight of an object depends on the force of gravity. When an astronaut is on the moon
his weight is less than when he is on earth because the gravitational force of the moon is less than on earth. When orbiting the earth in a space shuttle, an astronaut is far enough off the earth that the gravitational pull is very low, and the astronaut is weightless.
The mass of an object is a measure of the amount of matter or material in the object. Mass
does not change when an object is on the moon or in orbit or on the surface of the earth. In the U.S. System, the units used (such as pound and ounce) are measures of weight; they
depend on gravity. In the Metric System, the units used (such as gram and kilogram) are measures of mass.
So long as the objects that are being measured stay near the surface of the earth, their mass
and weight are not changing. For everyday purposes, people use the words “mass” and “weight” interchangeably. For example, people say a baby weighs five kilograms (even though technically a kilogram is a measure of mass).
Standard Units of Weight ! The U.S. System has three common units of weight measure: ounce, pound, and ton.
You should memorize the facts in this table because they will come in handy in life: 1 pound = 16 ounces and 1 ton = 2,000 pounds
U.S. System – Units of Weight
unit abbreviation equivalent to:
ounce oz 1/16 pound
pound lb 16 oz
ton ton 2,000 pounds

Section 9-5: Weight, Temperature, and Time
Page 9 – 70
How are U.S. units of weight used? - Ounces are used for lighter objects. A small candy bar might weigh an ounce; larger candy bars might be labeled, for example, 1.4 ounces or 1.75 ounces. Many food packages are labeled by weight in ounces, for example, cans of soup might be labeled 12 ounces or 15 ounces. - Pounds are used for weighing many types of things, such as food items and people. For items that don’t weigh a whole number of pounds, sometimes the weight is quoted in pounds plus the remaining ounces. For example, a baby might weigh 7 pounds 10 ounces. Another approach is to report the decimal pounds, such as saying the baby weighs 9.5 pounds (when it weighs 9 pounds and 8 ounces). - Tons are used for very heavy objects. Cars and trucks are weighed in tons. A car might weigh 2.3 tons. For trucks, the “curb weight” is the actual weight of the truck; a pickup truck might weigh 5 tons or 6 tons. Trucks also have a capacity weight; reference to a “1/2 ton pickup truck” means that the truck can carry a load of " ton.
When an ounce is NOT an ounce
A fluid ounce is not the same as an ounce of weight. It is unfortunate that the same word is used for both a volume/capacity measure (fluid ounce) and a weight measure (ounce) – because they are entirely different concepts.
A fluid ounce is a measure of volume – how much space the substance occupies. An ounce of weight depends on how heavy the substance is (no matter how large it is in size).
An ounce of weight is sometimes called a “dry ounce” to distinguish it from a “fluid ounce” and it is also called an “avoirdupois ounce” if you want to be fancy – but typically it is just called an “ounce”.
If there is a substance and its volume is one fluid ounce, it might weigh one
ounce but that would be by coincidence; it probably won’t. For example: - Lead is heavy – if the volume of lead is one fluid ounce, it will weigh much
more than an ounce of weight. - Feathers are light – if the volume of feathers is one fluid ounce, it will weigh
much less than an ounce of weight. - Water is interesting – if the volume of water is one fluid ounce, it will weigh
about one ounce of weight! (More precisely, a fluid ounce of water weighs 1.043 ounce.) Many liquids are made up largely of water (such as juice, pop, many cleaning supplies), and so a fluid ounce of the liquid might weigh close to an ounce of weight. Or it might not; there is no way to tell except by weighing the substance.
Looking at it the other way around: - If a pile of lead weighs one ounce, it will be a very small pile, taking up
much less space than a fluid ounce. - If a pile of feathers weighs one ounce, it will be a large pile, taking up much
more space than a fluid ounce. - If an amount of water weighs one ounce, it will be almost exactly one fluid
ounce in volume, but not exactly.

Section 9-5: Weight, Temperature, and Time
Page 9 – 71
! In the metric system, units of mass are based on the gram. A gram is defined as equaling the mass of one cubic centimeter of water.
Metric System – Units of Weight
unit abbreviation equivalent to:
milligram mg 1/1000 g
centigram cg 1/100 g
gram g
kilogram kg 1000 g
metric ton t 1000 kg
How are metric units of weight used? - A gram is a very light unit. A raisin weighs about 1 gram. Two “Tic-Tacs” weigh about 1 gram. It takes about 28 grams to equal 1 ounce. - A milligram is very, very light since it takes 1000 of them to equal a gram! Milligrams are used in measuring medicine. The regular dose of ibuprofen in an ibuprofen tablet is 200 milligrams. The tablet itself weighs much more than this because it also contains substances (“fillers”) besides the actual medicine to hold it all together and coat it. - In countries other than the U.S., kilograms are used for food items. For example, in a grocery store one could buy a kilogram of burger for meatloaf, or a two kilogram bag of sugar, or " kilogram of apples. People are weighed in kilograms. Note that a kilogram is about 2.2 pounds. - An average football player weighs about 100 kilograms. Ten football players would weight about 10 • 100 = 1000 kilograms. So ten football players weigh about one metric ton. - This brings up an advantage of the metric system. In the metric system 1 mL of water weighs exactly 1 gram in weight and takes up exactly 1 cu cm of volume. This is precisely how the units are defined in the system, to link weights and volumes together. (Note: this linkage is based on water; it is not true for other substances.)
Activity: Comparing to a kilogram One cubic centimeter of water, which is the same as one milliliter of water, weighs one gram
(be definition). So 1000 milliliters of water weighs 1000 grams. That is the same as saying that 1 liter of water weighs 1 kilogram.
Materials: a one-liter bottle of water, various items in the room. Use the one-liter bottle of water as the standard for 1 kilogram of weight. The bottle adds to
the weight of the water, so the bottle of water actually weighs just a bit over one kilogram, but it is close to a kilogram.

Section 9-5: Weight, Temperature, and Time
Page 9 – 72
What to do: Find items in the room (or your home) that weigh less than a kilogram, items that weigh more than a kilogram, and items that weigh close to a kilogram. List some of each type in the following table.
Weighs less than a kilogram
Weighs about a kilogram Weighs more than a kilogram
Suggestion: Read Labels for weights Look at food packages to find the weights labeled on them. Keep looking until you find some
weights in the metric system and some in the U.S. system. Some packages are labeled both ways. Discuss your findings with friends, family, classmates.
Temperature Children and Temperature Young children have everyday experiences with temperature that can be discussed so that
the children broaden their understanding of the concept. Children often learn the word “hot” as toddlers when adults warn them away from hot surfaces. Other temperature words they learn are cold, freezing, and warm.
In many classrooms there are frequent reports on the weather, which may include a
discussion of whether it is hot, warm, cool, or cold that day. Teachers may ask further questions such as these: Today is it warmer outside or inside? Do you think it is warmer inside our classroom or in the hallway – or are they about the same? Did you have hot or cold cereal for breakfast today? Do you prefer cold chocolate milk or hot chocolate milk?
Children can learn about the significance of temperature differences when they discuss the
types of clothing to be worn in different weather, and the types of activities that are appropriate depending on the weather. For the young children the current season can be discussed, but they will not have a good grasp of other seasons. As children mature, they can remember and talk about other seasons as well, and discuss clothing and activities that are appropriate for each season.

Section 9-5: Weight, Temperature, and Time
Page 9 – 73
Another topic related to temperatures is food. For example, the teacher might say: Is your soup too hot to eat? This ice cream is freezing cold! That ice cream warmed up and started melting. I like milk best when it is cold.
An activity for young children to explore temperatures could be done as follows. - On a sunny day, go outdoors to an area that has some sunny parts and some shaded parts
and that also has a variety of surfaces. Ideally, there would be a sidewalk that is partly in sun and partly in shade, and the same for a grassy area, a mulched area, etc.
- Ask the children to compare the feeling of a surface in the sun and that same surface in the shade. Perhaps they could take off their shoes and socks to walk on the sidewalk and the grass in both the sun and shade. With their hands they could feel rocks in the sun and in the shade, and tree trunks, etc.
- A discussion about how some surfaces absorb more heat from the sun and feel warmer could be had by comparing different surfaces in the sun, such as a piece of steel, a stone, a piece of wood, a tree trunk, and a green plant’s leaves. Younger children would only be able to compare two items at a time. Older children could put several items in order (could seriate the items by temperature).
Another activity for children would involve seriating cups of water of various temperatures.
The teacher could prepare cups of water at various temperatures from almost-too-hot-to-touch, through warm, medium, cool, and almost-ice-cold. Children would touch the water and arrange the cups in order by temperature.
Standard Units of Temperature ! The U.S. System measures temperature in degrees Fahrenheit. Note that the symbol for
“degree” is ° (This is the same symbol as for the measurement of angles in degrees.
However, angle measurement and temperature measurement are not related in any way except they are each called “degree”.)
Some important temperatures to recognize in Fahrenheit are the following. Oven –cake baking 350°F
Boiling water 212°F
Bath water 110°F
Human body 98.6°F
Indoor temperature 68°F
Freezing water 32°F
! The Metric System measures temperature in degrees Celsius. The Celsius system was
developed so that 100 degrees is the difference between the freezing and boiling points of water.
Some important temperatures to recognize in Celsius are the following. Oven –cake baking 180°C
Boiling water 100°C
Bath water 43°C
Human body 37°C
Indoor temperature 20°C
Freezing water 0°C

Section 9-5: Weight, Temperature, and Time
Page 9 – 74
You may want to remember that 37°C is the normal body temperature in Celsius. Some
hospitals are switching to using only use Celsius measurements for body temperatures. There are formulas for converting between the two systems of temperature. If the degrees Fahrenheit are known, to find the Celsius equivalent use:
C = (F – 32)
If the degrees Celsius are known, to find the Fahrenheit equivalent use:
F = 32 + • C (Remember to use correct order of operations.)
! For some scientific applications the Kelvin scale of temperature is used. The Kelvin scale
is based on “absolute zero” – the temperature scientists have determined is the lowest possible temperature. This temperature was given the value of zero degrees Kelvin. The “size of a degree” (the amount of heat difference for one degree) in Kelvin was set to be the same as in Celsius. Here are a few comparisons of the two scales:
Boiling water 373°K , 100°C
Freezing water 273°K, 0°C
Absolute zero 0°K, –273°C
- This means that in the Kelvin scale every possible temperature is positive. Thermometers The instrument for measuring temperature is the thermometer. Usually a thermometer looks
like a vertical number line. But there are other styles of thermometers, such as those with a dial, and there are electronic thermometers with a digital readout.
In grade school children should learn to use a thermometer to tell temperature.
Thermometers in both Fahrenheit and Celsius should be used. In order to practice reading a thermometer, there are items available commercially that are not actually thermometers but simply look like a thermometer. They have a colored ribbon that can be adjusted to various temperatures, to show what the thermometer would look like for various temperatures.
In some parts of the country, such as North Dakota, negative numbers concepts are
understood by children in winter since the temperature regularly drops “below zero”. In other parts, such as Arizona, large numbers are understood by children since summer temperatures are regularly over 100°F.
A classroom could have a thermometer inside, and also one outside that could be viewed
from a window. The study of temperatures can relate to various subjects in grade school. For example, in social studies the temperatures in different countries could be mentioned; in science there are applications of temperature in discussing plant growth, animal habitats, and global warming.

Section 9-5: Weight, Temperature, and Time
Page 9 – 75
Time There are three aspects of time that children learn about.
1. Elapsed Time Elapsed time is the duration of an event or the passage of time from start to finish. This
aspect of time answers questions such as: How long does it take to eat lunch? How long can you stand on one foot? For how long do I have to take this medicine?
2. Sequencing of Events Sequencing of events in time involves the recognition that events happen in order as time
flows. Sequencing is involved in answering questions about what the schedule is for the day, developing a bedtime routine, or planning a driving trip.
3. Clock and Calendar Time The particular time of the day, week, month, and year are “clock time” and “calendar
time”. This aspect of time answers questions such as: What time is it? What day is it? At what time will lunch start? When is your doctor appointment?
As Seefeldt and Galper point out, “Young children have difficulty with concepts of time.
Conventional clocks pose many obstacles. … The important thing for the teacher to emphasize is patterns in time, such as the progression though minutes, hours, days, weeks, and months. … Time is relative for young children and is best taught through everyday routines and conversations.” (2008: 118-119)
Children need to have many experiences and discussions about time concepts so that the
concepts slowly take root. The vocabulary of time concepts includes words such as: now, later, soon, today, tomorrow, yesterday, a long time ago, before, and after. Following are more details about each of the three aspects of time.
1. Elapsed Time To help children experience and learn about measuring elapsed time or the passage of time,
it is useful to have a sand timer – the type of timer where sand runs through a plastic or glass shape. Children can actually see the sand falling as time passes, and realize that the time period is over when all the sand has fallen. Sand timers can be found to time various numbers of minutes. The teacher might say, for example, that there are five minutes to clean up, and set the five-minute timer.
Comparisons of elapsed time can be discussed. For example, the teacher can ask
questions such as: Does it take you more time to brush your teeth or to take a bath? Did it take you longer to build that block tower or to put away the blocks afterwards?
Elapsed time can be explored by having children do something for a specific amount of time.
For example, the teacher could ask children to clap for one minute, and use the one-minute sand timer so children could watch to see when to stop (large, easily seen sand timers are commercially available). Other activities children could do for a timed minute include: snapping fingers, jumping, standing on one foot, resting, humming. After several of these activities each taking a minute, there could be a discussion of whether they all felt like the same time, or what felt different even though each was exactly a minute.

Section 9-5: Weight, Temperature, and Time
Page 9 – 76
For older children who can count well, they can be asked to count how many times they can
do something in a minute (for example, snapping fingers or jumping). Generally this counting should be done by a partner, as partners take turns doing the activity. After some experience with this, children should be asked to estimate in advance how many times they could do the activity, and then check the estimate by doing it in a timed minute.
The activity being done for a timed minute or two or three could itself be valuable. For older
children it could be: recite a poem, count by fours, count by sixes, etc. For any children it could be a physical activity to improve energy during the day, such as stretches or toe touches or hopping.
Children can regularly be asked to estimate the elapsed time that events will take. For
example, “How long do you think it will take to read this story?” or “How long will it take us to walk around the building this afternoon?”
2. Sequencing of Events in Time Many discussions with young children can occur during the day to establish the ideas of a
sequence of events. Examples of questions and topics include: When you got dressed this morning, which did you put on first, your shoes or your socks? Remember how this morning we painted pictures and listened to a story – which did we do first? After reading a story, discuss what happened first in the story, and what second, etc.
It is helpful for many young children (and their families) if there is a poster of the routine
events of the day in the classroom, such as story time, snack, outdoor time, art time, etc. There could be a drawing or photograph of the activity, and a clock face showing the time of the event. Many children wouldn’t read the clock face, but the order of the events would be noticed.
For children with an autism spectrum disorder, the schedule can be particularly helpful.
“Teachers should define the environment as much as possible for a child with autism. To reduce the child’s anxiety, create and post in each center or learning area a picture schedule using photographs or other images to display the day’s events. The child can look at the picture to get an idea of what is supposed to occur in that area. Children with autism like to know what they are supposed to do, so a picture schedule is reassuring.” (Willis 2009: 86)
Of course the teacher and children can also talk about the events of the day, such as “After
snack today the special storyteller is coming to read a story and then we will draw and paint” or “What will we do before lunch?”
A weekly calendar is helpful for noting events that occur on specific days of the week;
perhaps the special storyteller comes on Fridays, and Tuesday is always spaghetti day, etc. Children can mark off the days as they pass.
3. Reading Time from a Clock or Calendar
It takes many years in grade school for children to gain a full understanding of time and of reading time from various types of clocks. Many experiences with the concepts of time are required to gain a full understanding.

Section 9-5: Weight, Temperature, and Time
Page 9 – 77
Standard Units of Time You should be familiar with all of these units of time.
Units of Time (U.S. and Metric)
unit abbreviation equivalent to:
second s 1/60 min
minute min 60 s
hour hr 60 minutes
day day 24 hours
week week 7 days
month
year yr 365 or 366 days 12 months
• Months vary in length from 28 to 31 days. Some people remember which months have how many days from this mnemonic: “Thirty days have September, April, June, and November. All the rest have 31. Except February which has 28, until leap year gives it one day more.” Note: it is the first line of this mnemonic that is most helpful. February has exactly four weeks (except in leap year). Every other month is slightly longer than four weeks. • Most years have 365 days. Leap years have 366 days. In general, a year is a leap year if the year number is evenly divisible by 4. (However there is a complication: it is not a leap year if it is evenly divisible by 100 unless it is also evenly divisible by 400.) Leap years are needed because we intend that the year correspond with one revolution of the earth around the sun. That revolution does not take a whole number of days, but approximately 365 # days. To get the yearly calendar matched up with the seasons again, every four years we add an extra day to the year (for the # days that the calendar slipped “behind” over the previous four years). Note: There are no Exercises for Section 9-5

Section 9-6: Circles
Page 9 – 78
Section 9-6: Circles Activity: Dots at Equal Distance
Use a ruler. Draw a dot at a distance of 3 cm from the point P below. Draw five more dots, in various directions but each a distance of 3 cm from point P.
Draw six more dots, each a distance of 3 cm from point P, going in a variety of different directions. • P Can you see the pattern and imagine where more dots would be if they are 3 cm from point P? Definitions A circle is a set of points in a plane that are all the same distance from the center. The radius of a circle is the distance from the center to the circle. The diameter of a circle is the distance from one side of the circle, through the center, to
a point on the opposite side of the circle.
radius = • diameter diameter = 2 • radius
radius diameter
The perimeter of any figure is the distance around the figure (the length of its outside
edge). There is a special name for the perimeter of a circle; it is called the circumference of
the circle. Drawing Circles One way to draw a circle is to get a string that is a little longer than twice the length of the
radius of the circle you want. Tie the ends of the string, to form a loop with the string. Place a pencil or tack where you want the center of the circle to be, and place the string loop around the pencil. Stretch the string out, gently, away from that center pencil and place another pencil at the other end of the loop. With that second
anchor
draw

Section 9-6: Circles
Page 9 – 79
pencil draw around the pencil or tack in the center, keeping the loop evenly stretched out the whole way around. The radius of the circle will be approximately half the length of the string (which is the “loop” when it is stretched out long).
Drawing circles this way is a good way for children to become familiar with circles. The
definition of a circle as being points that are all the same distance from the center is illuminated by making circles with this method.
This method also comes in handy for some home projects. For example, if you needed a
circle of cloth that was two feet across (maybe to make a lamp shade or for a doll’s dress or a centerpiece place mat, or whatever), you would make the string loop so that when it is stretched out it is 1 foot long.
For drawing circles on paper, a compass can be used. (not the kind of compass that
tells directions like north, south, east west!) Older style compasses had a sharp point that was placed at the center of the circle, and a pencil angled out from that. For school use, safe compasses today do not have any sharp points. A fingertip (or possibly a pencil or pen) is placed on one end of the compuass, in the place for the center of the circle. A pencil is placed with it’s tip on another part of the compass so that the distance out equals the desired radius. The center (where the fingertip is) is kept still while the pencil draws around it.
Activity: Exploring Circumference Materials: an assortment of lids from various jars, or any other circular objects, Strip of paper (could be paper on a roll such as that used in a cash register), Ruler and/or tape measure marked with cm and mm. 1. a) Take a strip of paper long enough to wrap around the circumference of the lid. Cut
the strip so that it is exactly as long as the circumference. b) Fold the strip of paper into thirds. - - - - - - - - - - - - - - - - ! c) Place the folded-into-thirds paper on top of the lid. d) What do you notice? The circumference, folded into thirds, is about the same as the diameter.
2. We will be calculating with measurements, and that will be easier if you use cm measures (rounded to the nearest tenth of a centimeter) and a calculator..
a) Carefully measure the circumference of the lid. (If your strip of paper was cut exactly to equal the circumference, you could measure its length. Or, you could use a tape measure to measure the circumference.) Record the result in the table.
b) Carefully measure the diameter of the lid. (Probably easier to use a ruler. If the center of the lid happens to be marked, the diameter goes through the center. If there is no center marked, note that the diameter is the widest measurement you can get across the lid.) Record the result in the table.
c) Calculate the ratio of the circumference ÷ diameter, rounded to one decimal place, and record it.

Section 9-6: Circles
Page 9 – 80
Lid Circumference Diameter Circum ÷ Diam
3. Do the steps of #2 with a different size lid. And if time, do a third lid also. 4. Compare your results for circumference ÷ diameter with those of classmates.
Interesting fact: when measurements are made very precisely, the ratio of circumference to
diameter comes out the SAME for EVERY circle! That ratio is a bit larger than 3. This ratio is important and in the 1700s it was given a special name: pi (which is pronounced like the dessert pie). Pi is the name of a Greek letter, which is written .
History of Pi
The ancient Babylonians worked with the ratio of circumference to diameter about 4,000 years ago and determined that it was about 3.1. Ancient Greek mathematicians studied pi extensively, and in the third century BCE Archimedes calculated the value of pi accurately to within 2 ten-thousandths of the value that modern methods have determined precisely. Around that same time, Chinese mathematicians found the value of pi accurately to nine decimal places. In the fifth century CE a Hindu mathematician wrote that the calculation of pi would only “approach” the actual value – which indicated he realized pi was an irrational number. The fact that pi is “irrational” was proven in Europe 1000 years later. (Historical information is from Pi Day International’s website at
http://www.pidayinternational.org/Pi_History/HISTORY_OF_PI_Babylon.htm ). Pi is an irrational number, which means that it cannot be precisely written as a fraction of two
integers. Its decimal representation goes on forever, infinitely long without any repeating pattern. Modern methods of analysis allow mathematicians to calculate the value of pi to any decimal place that is desired.
For any circle, = 3.14159…
The value of pi is often approximated as 3.14 or , but these are not exact values.
Circumference One use of the number pi is to find the length of the circumference of a circle when the
diameter is known. Since (circumference) ÷ (diameter) = , this formula follows:
Circumference = • diameter
If what you know about a circle is the radius rather than the diameter, then the diameter
can be found because it is twice as big as the radius, and then the circumference can be found. The formula for circumference when the radius is known is that circumference equals • 2 • radius. This formula is typically written this way:

Section 9-6: Circles
Page 9 – 81
Circumference = 2 • • radius
Summary:
Circumference = • diameter or C = d
Circumference = 2 • • radius or C = 2 r
Memorize at least one of the formulas for circumference. In calculating with pi, it is common to round the value to 3.14. On many calculators there is a button for that provides the value of pi accurately to
about 8 decimal places (however many places the calculator displays). Answers obtained with 3.14 differ slightly from those obtained by using the more accurate
value of pi used by the pi button on the calculator. Keep this in mind if you are discussing answers with friends and they differ slightly.
Practice Problems: Round answers to one decimal place (that is, the tenths place). But do calculations with
pi to at least two decimal places. 1. Sheryl has a gift box with a circular lid. She wants to decorate the lid by wrapping a
fancy ribbon around the circumference. The lid has a diameter of 6 inches. How long should she cut the ribbon so it fits exactly around the edge of the lid?
2. A circle has radius of 15 cm. What is its circumference? Answers to Practice Problems:
1. Since diameter is known, we can use C = d. so C = (3.14)•(6) = 18.84. If the
calculator’s button is used, the result is 18.85. The ribbon could be cut to about 18.8 inches. Since it is better to have the ribbon a
little too long than too short, consider cutting it to 19 inches.
2. Since radius was given, we can use C = 2 r = 2 (3.14)• 15 = 94.2 The pi button on the calculator gives 94.248. OR We could first find the diameter = 2•15 = 30, and then use C = pi•d = 3.14 • 30 = 94.2.
The circle’s circumference is about 94.2 cm. Activity: Estimating Area of a Circle 1. Use a compass to draw a circle with radius 3 cm on one side of this cm grid paper. It
would be best to put the center of the circle at the intersection of grid lines.

Section 9-6: Circles
Page 9 – 82
2. Count squares to estimate the area of the circle of radius 3 cm. i) One approach is to estimate the areas of partial squares and add those fractional
areas to the areas of the whole squares in the circle. Area = ___________ ii) Another approach is to overestimate by counting all squares that overlap with the
circle (even if part of the square is outside the circle). And then underestimate by counting only the squares that are entirely inside the circle. Finally, average those two numbers to estimate the area.
Overestimate = ________ Underestimate = _________ Average = ________ 3. Draw a circle of radius 4 cm and estimate its area. i) estimated Area = _____________ ii) Overestimate = ________ Underestimate = _________ Average = ________ Developing the Area of a Circle The following diagrams show some things about the area of a circle. In particular, they
relate the area of a circle to the length of the radius squared. (Recall that a number squared means that the number is multiplied by itself. For example, if a radius is 8, then
the radius squared = 82 = 8•8 = 64.)
Suppose there is a circle with any radius - call the radius length r. We can make a square with side length of r.
The area of the square = length • width = r • r = r2
Circle radius = r Square of side r r
r r " area is r2

Section 9-6: Circles
Page 9 – 83
Now we place four of those squares, each of area r2, on top of the circle. The area of
the four squares, all together, is 4 • r2
. It is clear that the area of the circle is less than the area
of the four squares.
Conclude: area of the circle < 4 • r2 .
Next, again take that square of side r, and area r2
, and now draw a diagonal across it,
forming two triangles. Each of those triangles has area of half of the r2
, or r2
.
Now place four of those triangles, each of area r2
,
next to each other to form a “sideways square”. ! The area of this sideways square is four triangles each
with area r2
, so the four of them all together have
area of 4 • r2
= 2 • r2
,
Next, place this sideways square inside the circle (it fits
exactly, since the legs of those triangles have length r.) Clearly the area of the circle is larger than the area of
The sideways square, which was 2 • r2
.
Conclude: area of the circle > 2 • r2 .
We now realize that the area of the circle is between 2 • r2
and 4 • r2 .
To get some idea if the area of the circle is closer to 2 • r2
or to 4 • r2, look at this
diagram with the “outer four squares”, the “sideways square” and the circle all centered on each other.
Compare the area of the “sideways square” in darker grey with the area of the circle in light and dark grey, and the area of the outer four squares. The area of the circle seems to be approximately half-way between the area of the “sideways square” and the area of the outer four squares.

Section 9-6: Circles
Page 9 – 84
So the circle’s area is about half way between 2 • r2
and 4 • r2 .
Conclude: The area of the circle is approximately 3 • r2 .
In fact, the area of a circle = • r2 , or about 3.14 • r
2 .The diagrams and reasoning
above make this fact seem reasonable. Mathematicians over the centuries have proven it to be true.
Summary:
Area of a circle = pi • (radius) 2
that is A = • r2
Important note: In the formula for area of a circle, the radius is squared, but not pi. Memorize the formula for area of a circle. Practice Problems: Round answers to one decimal place (that is, the tenths place). But do calculations with
pi to at least two decimal places. Include units with answers. 1. A circular table has diameter 7 feet. What is the area of the top of
the table? 2. A Norman Window (the entire shape shown) has the shape of a
semicircle above a rectangle, as in the diagram. What is the area of the glass in this window?
Answers to Practice Problems:
1. Area = pi • radius2 The diameter was given as 7 feet. So the radius is half of that
or 3.5 feet. Area = (3.14) • (3.5) 2
= 3.14 • 12.25 = 30.465. The area of the table is
about 30.5 sq ft. 2. The area of the rectangular part on the bottom is 8 • 6 = 48 sq ft. The top part is half
of a circle (that is, a semicircle). The diameter of that circle is 6 ft (since that is the size at the bottom of the window, which is the length of the circle’s diameter). So the radius of the circle is half of 6 = 3 ft.
The area of a circle of radius 3 ft is • r2
= 3.14 • 32
= 3.14 • 9 = 28.26.
So the semicircle’s area is half of that: half of 28.26 = 14. 13. The area of the window is the rectangle area + semicircle area = 48 + 14.13 = 62.13. The area of the window is about 62.1 sq ft.
6 ft
8 ft

Section 9-6: Circles
Page 9 – 85
Section 9-6: Exercises on Circles Remember: Write units with all measurement answers. Round answers to one decimal place. Calculate using pi to at least 2 decimal places. 1. Find the perimeter and area of each of these circles. Write the formulas you use. a) diameter = 12 ft b)
2. A circular pond has diameter 10 feet. a) What is the area of the surface of the water?
b) If a fence is built around the pond to keep the dogs out, how long is the fence? c) a circular sidewalk is put around the outside of the pond, extending 2 feet beyond the pond all around. What is the area of the sidewalk?
3. In this drawing of the Cumler’s backyard, 1 cm in the drawing represents 2 feet of yard. The Cumler grandpa left a letter saying he buried his valuable diamond cuff links in the
yard 8 feet from the upper-right corner of the deck and 6 feet from the center of the BBQ pit. Can you find where they were buried, and mark it on this map? Hint: use a compass and ruler.
11 m
deck
•
garden
Scale: 1 cm to 2 ft
BBQ
Kiddie pool
gardengardengardengardengardengardengardengardengardengardengardengardengardengarden

Section 9-6: Circles
Page 9 – 86
4. Windows sometimes come in the shape of a semicircle on top of a rectangle. They are called “Norman windows”.
a) What is the area of this Norman window? b) What is the perimeter of the window? 5. This garden fence at each end is a semicircle. a) What is the total length of the fence that encloses
this garden? b) When the landscaper gets fertilizer for the grass
inside the fence, what is the area that the fertilizer must cover?
6. Juanita wants to paint a circle on her bedroom ceiling with a diameter of 8 feet. Half of the
circle will be painted blue, and half painted yellow. a) What is the area of the blue part? b) If she puts a silver ribbon around the entire perimeter of the circle, how long is the
ribbon? 7. George won the essay contest at the pizza shop, and for his prize he can choose to get
either: one sixteen-inch diameter pizza OR two ten-inch diameter pizzas If George wants to maximize the amount of pizza he gets, which should he choose?
Explain why! 8. Needed: about 10 pennies and 10 nickels. Use real coins or plastic coins (such as plastic
coins in a classroom). a) Place a penny on the table, and then place other pennies around it (forming a ring around
the center penny, touching the center penny) . How many fit around it? Do they fit snugly, or are there gaps between the pennies?
5 m
11 m
12 in
28 in

Section 9-6: Circles
Page 9 – 87
b) Place a penny on the table, and then place nickels around it. How many fit around it? Do they fit snugly, or are there gaps between the pennies?
c) Place a nickel on the table, and then place pennies around it. How many fit around it?
Do they fit snugly, or are there gaps between the pennies? d) Place a nickel on the table, and then place nickels around it. How many fit around it? Do
they fit snugly, or are there gaps between the nickels? e) If you have a collection of identical round objects, such as lids or two-sided counters or
poker chips or checkers pieces or larger coins: place one on the table and see how many others fit around it.
What do you conclude? 9. In this section, in the part about “Developing the Area of a Circle”, there were many
diagrams. Notice that the final diagram (with a circle inside four squares and a sideways square inside the circle, with some shading) looks interesting, like a design.
Use a compass and/or trace around circles, and use a ruler if you like and coloring implements, to make a design that is pleasing to you and has circular forms in it. Be creative!

Section 9-7: Converting Units
Page 9 – 88
Section 9-7: Converting Units Sometimes a measurement is given in one type of unit but we need to know the
measurement in another unit. For example, someone might measure the area of the living room in square yards before going to check the price of carpet, and discover that the prices are listed per square foot. So the area of the room must be converted from square yards to square feet so that the price can be determined.
There are several methods for converting a measurement from one unit to another. The
method presented here is called the “Unit Conversion Factor” method because it is a method for converting units that involves multiplying by a factor. This method has some advantages over other methods (such as setting up proportions), notably:
• The Unit Conversion Factor method ALWAYS works for converting any unit to any other unit, even if it is a complex conversion. So there is no need to learn several methods; this one method always applies.
• This method is typically used in science classes and scientific applications, though it might not be called by this name.
• The conversion fraction makes it clear which numbers need to be multiplied and which divided – there is no guessing about it. This is especially an advantage when working with unfamiliar units.
Background Information The Unit Conversion Factor method is based on some background mathematical facts and
skills that you already know. Here they are for review. 1) Multiplying something by the number “one” does not change its value (though it might
change its looks). For example:
! 47 pounds • 1 = 47 pounds 8.6 m • 1 = 8.6 m • =
2) A fraction with equal expressions in the numerator and the denominator equals one.
For example: = 1 = 1 = 1 = 1 = 1
Notice that each of the following fractions equals 1 since the numerator and denominator
of the fraction are equal, though they are expressed in different t forms:
= 1 = 1 = 1 = 1
3) When multiplying fractions, a factor that is the same in the numerator and denominator
“cancels”. Units are like factors in this respect (for example, when we say “60 minutes” it means the same as “60 times a minute”). For example:
Factors cancel:
• = • =
Units cancel:

Section 9-7: Converting Units
Page 9 – 89
• Here is the unit conversion fraction.
• = • = = hr So, 13 min = hr .
• Here is the unit conversion fraction.
• = • = = 32 oz So 2 lb = 32 oz.
How to convert from one unit of measure to another using The Unit Conversion Factor method
The Unit Conversion Factor Method ! Start with the unit you have, written as a fraction over the number 1. ! Multiply by the number one written as a fraction of two units so that the original unit
cancels and you end up with the desired unit.
Example A: Convert 10 ft to yards Think through the following steps:
! Start with 10 feet (in the numerator, over 1).
! Multiply by the number one written as a fraction with feet in the denominator so that the “feet” cancel, and in the numerator you need to have yards (since you want to end up with yards).
! Recall how many feet equal how many yards. 3 ft = 1 yd, so = 1. This is the unit
conversion factor to use.
= = = So 10 ft = .
Example B: Convert 1.75 pounds to ounces Think through the following steps:
! start with 1.75 pounds (in the numerator over 1) ! Multiply by the number one written as a fraction with pounds in the denominator so that
the “pounds” cancel, and in the numerator you need to have ounces (since you want to end up with ounces).
! Recall how many ounces are in a pound. 16 ounces = 1 pound, so = 1.
= = = 28 ounces
So 1.75 pounds = 28 ounces.

Section 9-7: Converting Units
Page 9 – 90
Following is an example of a conversion that requires two unit conversion factors equal to 1. Example C: Convert 600 yards to miles
! start with 600 yards (in a numerator, over 1). ! Multiply by one written as a fraction – we’d like to have yards in the denominator so that
yards will cancel, and miles in the numerator. The trouble is, we don’t know how many yards are in a mile! So we need to do this problem in two steps. 1st: We know how many yards equal how many feet. So the first unit conversion factor
will have yards in the denominator and feet in the numerator: 1 yd = 3 ft, so use ,
2nd: Now we need to cancel feet, and want to end up with miles. We can look up how many feet are in a mile: 5280 feet = 1 mile. So the second unit conversion factor is
= = = .34 mile
Example D: Convert 10,000,000 seconds to years
This example requires several unit conversion factors equal to 1. The reason that several factors are needed is so that the units can cancel until we end up with only the unit we want to convert to.
=
= = 0.317 years
Three methods for using a calculator to do this calculation 1. You can first multiply all the numbers in the denominator together (60 x 60 x 24 x
365, getting 31,536,000). Then do this division .
2. You can use the parenthesis keys on the calculator to put the denominator in parentheses so that the operations will be done in the correct order. So you would enter 10000000 ( 60 x 60 x 24 x 365 ) = 3. You can divide the 10,000,000 by each of the numbers in the denominator. So you would enter 10000000 60 60 24 365. Try the calculation all three ways and see which method you prefer.

Section 9-7: Converting Units
Page 9 – 91
Note that “minute” and “minutes” are the same unit and so can cancel (it is simply a matter of grammar that requires one of the words to be written in the plural – they are still the same “unit”). Also “day” and “days” are the same unit and so cancel. And so on: any unit written in the singular is the same as that unit written in the plural and so can cancel.
Example E: Converting units of area (square units): Convert 3 sq yards to sq inches.
The method is the same as for converting any units. ! Start with 3 sq yds in the numerator over 1. ! Multiply be the appropriate unit conversion factor. In this case, sq yds must cancel, and we want to end up with sq inches. The facts giving the relationship between these units are: 1 sq yard = 9 sq feet and 1 sq ft = 144 sq inches. (These were given in the section on areas.) This example requires multiplying by two unit conversion factors, as follows.
! ! = ! ! = = 3,888 sq in.
When Can Units be Converted, and When Not? Any measurement of an attribute can be converted to a different unit of measurement for that same attribute. For example, if the attribute is weight, then any unit of weight can be converted to a different unit of weight. A measurement in pounds could be converted to an equivalent number of ounces or tons or kilograms or milligrams, or any other unit measuring weight. Of course a weight measurement could not be converted to a length measurement or area measurement! In order to make a conversion between units, one must know the facts that relate the two units. For example, to convert fluid ounces to cups, one must know the fact that 8 fluid ounces equals one cup. Sometimes several facts about how units relate are needed. In earlier sections of this book, tables that gave equivalencies of units were given. Use those tables as needed to convert units. If you need a fact not available in the tables, you can look in reference books or online to find equivalencies. The google search bar, can be used to find equivalent measures. For example, if you type “1 mile in feet”, you will get the response “1 mile = 5280 feet”.; if you type “convert 1 ounce to pounds” you will get “1 ounce = 0.0625 pounds”. For metric measurements, if you remember what the prefixes mean, then you will not need to look up equivalent units.

Section 9-7: Converting Units
Page 9 – 92
Section 9-7: Exercises on Converting Units Note: It is important to practice the Unit Conversion Method. Please show the problem set
up using the unit conversion fractions and show unit cancelations. Use a calculator as needed for doing the multiplications and divisions.
Each answer should have the units labeled. Answers may be given as fractions or decimas. 1. Convert each of the following measurements in to the indicated unit. a) Convert 7 yards to feet. b) Convert 14 feet to yards. c) Convert 108 minutes to hours d) Convert 1 day to seconds. e) Convert 700 days to years. (Use 365 days per year.) f) Convert 130 square feet to square yards. g) Convert 3 sq ft to sq in. h) Convert 2 square meters to square centimeters. i) Convert 14,000 square cm to sq m. j) Convert 1.25 gallons to cups. k) Convert 1 quart to fluid ounces. l) Convert 2.7 pounds to ounces. m) Convert 1.3 tons to pounds. n) Convert 1.6 kilograms to grams. 2. Sonia measured her living room for carpet and found she needed 25 sq yds. At the store,
the carpet she selected cost $4.10 per square foot. What will be the cost of the carpet? 3. Bags of mulch at the garden store contain 2 cu ft per bag and cost $4 per bag. For his
big landscape project Ron estimates he needs 4 cu yards of mulch. He sees an advertisment for “mulch delivered for $44 a yard”. Ron realizes that means $44 per cubic yard, and it won’t be in bags. How much money does he save by having 4 cubic yards of mulch delivered rather than buying 4 cubic yards in bags from the store? (Specify the cost for each way.)
4. Susan is making a huge pot of chili for the school fundraiser. Her recipe calls for 15
quarts of tomato sauce. She can get the sauce in quart bottles for $1.30 per bottle, or

Section 9-7: Converting Units
Page 9 – 93
else in gallon bottles for $5 per gallon. What should she buy to spend the least money? Explain the costs of each way.
5. For his saw repair business Denny needs 8 cm of a very expensive wire. He finds that it
costs $7.50 per cm from Speedy Supplies, and it costs $680 per meter from Big Supplies. How much would his order for 8 cm cost from each supplier, and what would be the savings for the less expensive one?

Section 9-7: Converting Units
Page 9 – 94
Blank Page

Section 10-1: Introduction to Statistics
Page 10 - 1
Chapter 10 Statistics and Probability
Section 10-1: Introduction to Statistics
The word “statistics” can be used in several ways. Sometimes the word “statistics” refers simply to numeric facts. For example, the population of your city could be called a statistic about the city. A baseball player’s statistics would include his or her batting average and number of homeruns in the season.
The word “statistics” is also used to refer to the important branch of mathematics that
involves the collection, organization, analysis, and interpretation of data. The field of study called statistics is also called data analysis. Statistics includes two parts: descriptive statistics and inferential statistics. In this chapter we will discuss descriptive statistics.
Descriptive statistics involves the collection and summary of data. Before collecting the data
it is important to determine exactly what data should be collected and how it will be collected to help in answering the questions being investigated.
After collecting the data, it must be organized so that it can be better understood. Charts
and tables are useful for this. Visual displays such as bar graphs, line plots, and pie charts are often better than tables. Data is often summarized with average values and measures of how spread out the data is. The organization and summary of the data allows for better communication about the nature of the data.
NCTM Content Standards “Data Analysis and Probability” is one of the five Content Standards from the National Council of Teachers of Mathematics (NCTM). Details of this content standard, along with the expectations for students in Pre-K to grade 2 are listed below. 1. Formulate questions that can be addressed with data and collect, organize, and
display relevant data to answer them. • pose questions and gather data about themselves and their surroundings; • sort and classify objects according to their attributes and organize data about the
objects; • represent data using concrete objects, pictures, and graphs. 2. Select and use appropriate statistical methods to analyze data • describe parts of the data and the set of data as a whole to determine what the data
show. 3. Develop and evaluate inferences and predictions that are based on data • discuss events related to students' experiences as likely or unlikely. 4. Understand and apply basic concepts of probability.
(from http://standards.nctm.org/document/chapter4/data.htm )
NCTM further points out that “throughout the pre-K – grade 2 years, students should pose questions to investigate, organize the responses, and create representations of their data. … The main purpose of collecting data is to answer questions when the answers are not immediately obvious.” (NCTM 2000, 109)

Section 10-2: Displaying Data in Graphs
Page 10 - 2
Reasons for Learning Statistics and Probability Why should children learn about data analysis? “If young children are actively involved in the study of their world, they will need to know how to collect, describe, organize, represent, and analyze their findings. In the process of doing so, they are becoming familiar with the ideas of statistics and probability.” (Seefeldt & Galper 2008: 136) For young children, organizing data reinforces their work in classifying, seriating, and categorizing, which were discussed in an earlier chapter. In addition, data analysis skills are valuable in their own right as a means for organizing information so that it can be better analyzed and interpreted, which leads to better solutions to problems. For both children and adults, there are important reasons to understand the topic of statistics. “Our society is increasingly making use of ideas found in statistics and probability. Students need to develop skills that enable them to live in this statistical society so they will not be misled or blinded by statistics. Without these skills, they will have an incomplete understanding of the world they live in.” (Burns 2000: 59) Every citizen needs to have an understanding of statistics. Many of the decisions people make when voting involve consideration of statistical information. This might include the effect of the tax structure on business in the area, or the effect of regulations on the environment. Most families are eventually confronted with medical decisions that must be made, perhaps concerning types of treatments for cancer or other illness or injury. Thoughtful decisions can be made only after evaluating statistical information such as the probability that a certain treatment will result in a certain percentage reduction of symptoms and have some other probability of side effects. Personal financial decisions also involve evaluation of statistical information.
Section 10-2: Displaying Data in Graphs There are many ways of representing data visually. Such representations are generally
called graphs. Even young children can organize data, typically with concrete graphs. ! Concrete, Picture, and Symbolic Graphs Children should start with concrete objects in representations, then move to pictures, and
finally to symbols. Mary Baratta-Lorton explains: “Real [concrete] graphs are the most important of these graphing experiences for they
form the foundation of all graphing activities. In this kind of graph children compare groups of real objects such as chocolate chip and coconut macaroon cookies. (Students place real cookies in columns on the table.)
“Picture graphs use pictures or models to stand for real things. These graphs are more
abstract than real graphs because a picture, even if it is drawn by the child, only represents reality. An image of a cookie is not the cookie itself. These graphs are important because they form a link between the real and the abstract and prepare the children for symbolic graphs.

Section 10-2: Displaying Data in Graphs
Page 10 - 3
“Symbolic graphs use symbols to stand for real things. This is the most abstract level of graphing, because the symbols must be translated back into reality to have meaning. An ‘x’ on a piece of graph paper can only stand, abstractly, for a real cookie which the child has eaten.” (Baratta-Lorton 1995: 143-144)
Activities for Representing Data with Graphs A) Concrete Graph Here is an example of collecting data about the people in the room and forming a bar graph
using the people themselves as the visual display. • The topic to investigate about the people in the room must be selected. Some possibilities
are: people wearing jeans versus people not wearing jeans today, or hair color of people in the room.
• Labels for the columns of the graph should be made. For example, on the whiteboard could be written “wearing jeans” in one spot so that people could line up in front of that label, and in a nearby location on the whiteboard could be written “not wearing jeans”.
• Everyone should line up in the correct place. • Examine and interpret the data by noticing which group is larger. If the groups are very
different in size, it might be obvious to everyone which group is larger. If the sizes of the groups are more similar, then the people in each group could be counted.
Note for younger children: If this activity is done with younger children who are not yet able
to count, they can still determine which group is larger by “pairing off”, which uses the concept of one-to-one correspondence. The first person in each line could hold hands (or stand directly across from each other), the second person in each line could hold hands, then the third person in each line hold hands, etc. The line that has left over people, not paired with anyone, is the larger group.
Extension to a circle graph: This extension is easier to accomplish if the data collected was
for only two categories (such as “wearing jeans” and “not wearing jeans”). For older children or adults, the data that was first represented by people in a bar graph can then be formed into a circle graph in the following way:
The people in one line of the bar graph should stay next to each other, and people in the other line should stay next to each other, and everyone should stand to form one big circle. In this diagram, five people are marked “J” for “wearing jeans”. The part of the circle that is wearing jeans and the part not wearing jeans should be clear. String stretched from the center to the two divisions between “J” and “not J” should make the circle partitions more obvious.
A circle graph showing this data could be made (perhaps drawn on a round paper plate).
This would link the concrete graph of people with a symbolic graph. B) Picture Graph Here is an example of collecting data about the people in the room and forming a graph with
pictures of the data collected.
J
J
J
JJJ
J
J
JJ

Section 10-2: Displaying Data in Graphs
Page 10 - 4
• Each person in the room thinks about whether s/he prefers apples, oranges, or pears. • One part of the whiteboard is labeled “apples”, another part is labeled “oranges”, and
another part “pears”. • Everyone goes to the appropriate part of the whiteboard and draws a picture of their
favorite fruit. • The pictures of one type of fruit will appear near each other in a “blob”. A loop could be
drawn around each “blob”. • This example creates what is sometimes called a “blob” graph, not a bar or column graph. • Examine and interpret the data by noting which blob is larger. If it is difficult to tell which is
larger simply by looking, then the pictures could be counted. Alternative way of picturing the data: Rather than drawing the fruit on the whiteboard, each
person could draw his/her favored fruit on a paper, coloring as desired. Then the papers could be gathered into “blobs” on the floor (or taped on a wall). Or they could be placed in columns to form a bar graph.
C) Symbolic Graphs Here is an example of collecting data about the people in the room and forming a graph with
symbols for the data collected. • Each person in the room determines how many letters are in his/her first name (each
deciding for him/herself whether to use the formal first name or nickname). • The data will be displayed in two types of representations: a frequency table and a bar
graph. Only one graph is needed for gathering data. Two are shown here in order to illustrate both types.
• On paper or the whiteboard, two graphs should be set up – one of each of these types: 1. A Frequency Table – which is a chart, also called a table, giving the frequency of each
data value. In this case we include the tallies used to calculate the frequency. In general a frequency table does not need to include the tally column.
(Examples of ways of making tally marks are shown below this activity.)
# letters in name tally # of people
1
2
3
4
5
6
7
8
9
- Each person can make his/her own tally mark in the correct row, or else a person acting
as recorder can record the marks for everyone. Note that there may be a need for more rows than pictured here. - The last column is filled in after all the data is collected, summarizing the number of tally
marks in the row. - The numbers in the last column can be added, giving the total number of people who
provided data.

Section 10-2: Displaying Data in Graphs
Page 10 - 5
2. A bar graph or column graph using small papers.
(The usual name is “bar graph”, but since this one is formed from small pieces of paper, the result looks more like columns than bars.)
A chart such as this should be drawn on the whiteboard or a poster board.
- Each person should have one piece of paper that can be taped to the chart – a small post-it note works well for this.
- Each person places his/her small paper above the correct number, and the papers form columns. Note that there may be a need for more columns than pictured here.
• After the frequency table and bar graph are formed, examine them and interpret the data.
Consider: - Is the data clustered around some values? Or is it evenly spread out? - Is there something that the frequency table communicates more clearly? What? - Is there something that the bar graph communicates more clearly? What?
Tally Marks
! Tallies are typically made by making one vertical mark for each item up to four. Then the fifth item is represented with a slanted or horizontal line through the first four. This groups the marks by fives, making it easier to count them. For example: | | | represents 3 and | | | | | | represents 7 and | | | | | | | | | | | | represents 15.
Note: the line for the fifth item is often drawn on a slant such as: | | | |
! There are also different systems for making tally marks. Here is one you might like to try out. It’s advantage is that it is a bit easier to read (for example to tell apart 3 from 4):
1 = 2 = 3 = 4 = 5 =
6 = 7 = etc. … 10 = 14 =
Examples of Data to Collect and Graphs to make
There are numerous topics that can be explored so that children and older students gain experience with collecting and organizing data. Here are a few examples.

Section 10-2: Displaying Data in Graphs
Page 10 - 6
A) Concrete graphs: • The writing implements that people have with them (pens, pencils, markers, etc.) can
be placed on a table and organized by type. • The type of shoes children are wearing can be organized. Each child could put one
shoe into the pile. Then the shoes could be categorized into a bar graph (e.g., sandals, athletic shoes, boots, etc.) For young children, the shoes could simply be categorized as “with laces” or “no laces”.
• The children themselves can be the “concrete object” for various graphs related to them. For example, children can form lines for those with both button and zipper on their clothes, those with only buttons on their clothes, those with only a zipper on their clothes, and those with neither buttons nor zippers. Or they could line up by color of shirt.
B) Picture graphs • Each child could draw a picture of his/her family. Then the drawings could be
organized by the number of people in the family. “Family” can be chosen by the child to be whatever s/he thinks of as his/her family.
• Each child could draw a picture of the pet s/he has or would like to have. Or else there could be pictures of various types of pets and each child could use the picture that matches their type of pet. Then the pictures could be categorized in a bar graph by type of animal.
C) Symbolic graphs • Any topic that is investigated with concrete objects or pictures could instead be
represented with a symbolic graph. • Represent data about the number of letters in each person’s first name. Or last name.
Or both names together. • Numeric data is typically organized in a symbolic graph. Examples include: the number
of states each person has lived in, the number of siblings each person has, the number of pets each person has, height (if that would not bother the people involved), the number of writing implements each person has today, the number of keys each person has today, etc.
Between Concrete, Symbol, and Picture A concrete graph generally means a graph where concrete items themselves are the
data topic and those items themselves are used in the display (such as actual shoes being used in a bar graph about types of shoes). Some graphs that children make involve concrete items, but they are not concrete graphs since the concrete items are not themselves the data.
For example, perhaps the topic is “what did you eat for breakfast?”, and labels are made
for “eggs”, “cereal”, “pancakes”, “tortilla”, and “something else”. Each child gets a unifix cube, and puts it in the column next to the label or picture for the type of food s/he had for breakfast. Using a cube is more concrete than simply making a tally mark, and would be easier for children to understand at a younger age.
Note about this topic of breakfast foods: of course you should use foods that the children in the particular class are likely to eat. Depending on their ethnic backgrounds, it could vary. You might start by having a general discussion about what kids ate. Be sensitive; some children may not have eaten breakfast. If that is a concern, you could ask what the children prefer to eat for breakfast.

Section 10-2: Displaying Data in Graphs
Page 10 - 7
Choosing Categories That Avoid Hurt Feelings There is an enormous supply of topics that can be explored when young children are
working with data collection. And it is wonderful if the topics arise from the children’s own interests. But not all topics should be explored. As Susan Sperry Smith explains, “some topics are sensitive issues. Most children would prefer to be tall. Graphing height might embarrass the shorter children in the group. Likewise, a teacher wouldn’t create a real graph on tennis shoes versus other shoes if only the rich children could afford the popular tennis shoes. Teachers must know the backgrounds of the children. … There are many graphing activities that can enhance everyone’s chance to participate without emphasizing characteristics, possessions, or daily routines that stigmatize children.” (2006: 100) Another example of avoiding sensitive data would be that in a class of adults, students’ weight should not be collected as sample data.
Smith goes on to explain that people generally want to be on the “winning” side, and
“winning” is often seen as being in the most popular category. For something as simple as collecting data on children’s favorite color, a child might not want to be known as the only one whose favorite is grey. If the data is collected by having children go around the circle stating their favorite color, after a couple children say “blue”, it may become suddenly popular and everyone might say “blue” after that. A technique for avoiding this problem is to have each child color a square with their favorite color, and then individually drop the squares into a paper bag. Then the contents of the bag can be used to build a graph, and students won’t know which person favored which color.
! Types of Data When data is analyzed, there are always numbers involved. But not all the numbers play the
same roles. The analysis will go more smoothly if the different types of data are clarified. There are two broad types of data: ! Nominal, Qualitative, Categorical ! three names for the same type of data This type of data consists of labels, words, or names. Note: the word “nominal” comes from the Latin word for “name”. ! Numeric, Quantitative ! two names for the same type of data
This type of data consists of numbers (numbers which can be ordered in a meaningful way).
A subtle point: Sometimes for Nominal/Qualitiative/Categorical data, the labels for the data are numbers – but the labels are not being “used as numbers” but rather are being “used as labels”. For example, if the data collected was each person’s telephone number – then the data might seem to be numeric. However, the phone numbers are not being used in a numeric way – it wouldn’t make sense to add together two phone numbers, and if the phone numbers were put in order the order wouldn’t tell us anything about the data (a larger phone number doesn’t mean “more” of anything). Examples

Section 10-2: Displaying Data in Graphs
Page 10 - 8
A) The question being investigated is eye color. The eye color of everyone in the sample is determined. Then the number of people with each color is figured out. Which type of data is this?
This data is nominal (also known as qualitative or categorical). The data itself is the color of the eyes. For each person, a color is recorded. There are numbers involved later, in counting how many people have each color. And there may be more numbers (such as, what percent have brown eyes). But the color itself is the data, so it is nominal.
B) The question is how many courses each student has taken at this college. For each
person, the number of courses s/he has taken at the college is recorded. Then the data is categorized into groups to make a histogram showing how many people have taken various numbers of courses. Which type of data was collected?
This data is numeric (also known as quantitative). For each person, the data recorded is the number of courses the person has taken. That is a number that has meaning as a number (e.g., larger numbers really do mean more courses were taken), so the data is quantitative.
The National Council of Teachers of Mathematics points out that numbers can play several
roles in statistics. “As students work with numerical data, they should begin to sort out the meaning of the different numbers – those that represent values (‘I have four people in my family’) and those that represent how often a value occurs in a data set (frequency) (‘Nine children have four people in their families’).” (NCTM 2000: 109)
Practice Problems:
For each of the following, state whether the data collected is Nominal (also called Qualitative) or Numeric (also called Quantitative) 1. People are surveyed and asked: What make of car do you drive? 2. People are surveyed and asked: If you drive a car, how many years old is it? 3. For each child in the school, the number of people who live in his/her household is
listed. 4. For each child in the school, his/her food allergies are listed, and the list is kept in the
school office.
Answers to Practice Problems: 1. Nominal, Qualitative (the type of car is a word, a name, a category) 2. Numeric, Quantitative (the number of years is a number) 3. Numeric, Quantitative (the number of people in the household is a number) 4. Nominal, Qualitative (the list of allergies is a list of words)

Section 10-2: Displaying Data in Graphs
Page 10 - 9
! Ways of Representing Data When data is first gathered, it is called “raw data”. Raw data is the data values as they are
first obtained, before they are organized. The raw data can then be organized into charts or tables. The data can also be organized and displayed in a graph, which provides a more visual look at the data. Graphs usually make it easier to make observations about the data and to interpret it.
Line Plot (also known as Dot Plot)
A line plot (or dot plot) is formed by drawing a horizontal line and below it writing the range or span of possible data values. Then for each data value, a mark is made above its value. Usually the mark is an “x”. Sometimes it is a dot (and then the graph may be called a dot plot).
Example: Children each filled a teaspoon with dry black beans, then counted how
many beans were in the spoon. The raw data is listed here: 20, 25, 22, 22, 20, 21, 21, 21, 23, 20, 21, 19, 22, 23, 22 This is numeric, or quantitative, data. The Line Plot of this data:
x x x x x x x x x x x x x x x 18 19 20 21 22 23 24 25 26 number of black beans in a teaspoon
Some things to notice about the graph: - Each data value results in one x in the graph - The horizontal axis doesn’t start at zero, but only includes the numbers in the
range of the data – but once starting with the number 18 then ALL the numbers are included up to the final number (so – the number 24 is included in the chart, even though no data values equaled 24).
- The numbers are spaced apart equally. - There is a label under the axis indicating what the numbers represent. Examining/Discussing the data in the example: Notice that from the list of raw data values, it is difficult to find patterns. But from
the line plot we can see that the data values are centered around 21 and 22 beans per teaspoon. There is one value, 25, that was unusually high (though not extremely high).
Bar Graph
A bar graph has a bar for each category of data. On one axis, the data values are listed. On the other axis, the frequency for the data items is listed.

Section 10-2: Displaying Data in Graphs
Page 10 - 10
Example: Some citizens were asked whether they favor or oppose a new tax law.
Notice that the graph has a title giving the topic, and that each axis is labeled. Determine from the graph: - How many people favor the law? (the height of the column over “favor” is 5, so 5 people favor the law.) - How many people oppose the law, and how many have no opinion? (Seven people oppose the law, and 2 have no opinion.) - How many people were surveyed? (the total number of people is 5 + 7 + 2 = 14.) - Is this data nominal or numeric? (It is nominal or qualitative data since the data is the words “favor”, “oppose”, and
“no opinion”.) Horizontal bar graph
A bar graph can be made with bars being horizontal rather than vertical. The roles of the two axes switch. The example here displays the same data as the previous graph, but with horizontal bars.

Section 10-2: Displaying Data in Graphs
Page 10 - 11
Multiple-bar graph: Sometimes a bar graph has more than one bar per category of data. The example here
provides scores on the WASL Writing test (the state test given to children in certain grades in Washington) for 4th, 7th, and 10th graders. There are three bars for each grade level, with each bar showing the scores in a particular school year.
(WASL graph from http://reportcard.ospi.k12.wa.us/summary.aspx?year=2007-08 )
Histogram
A histogram is the same as a bar graph except that for a histogram the possible data values are continuous and the bars touch each other. That is, for a histogram the possible data values flow continuously from one category to the next and there are no gaps between the bars.
Example: Here is a histogram showing the grades of one class on a test. The grades
were grouped into categories (60-69, 70-79, 80-89, and 90-100). The categories are continuous from one to the other; for example, the first category ends at 69 and the next one starts at 70. There are no gaps between the bars.
Note that it is best in a histogram if each bar represents a group of the same size (for example, 60-69 is the same size as 70-79 and 80-89). In the graph here, the last bar represents 90-100, which is not the same size of group. Although this is not the best way

Section 10-2: Displaying Data in Graphs
Page 10 - 12
to make a histogram, in this case the bar represents the “A” grades and it is okay to use it.
Is the data of this example nominal or numeric? The data is the test scores of the
students, which are numeric. Determine from the graph: - How many people had test scores in the 80s? (the height of the column over “80-89” is 10, so 10 people scored in the 80s.) - How many people had test scores in the 60s? (one person) - How many people had test scores in the 90s? (the height of the column over “90-100” is half way between 4 and 6, so 5 people
scored in the from 90 to 100.) - Were the grades evenly distributed from 60 to 100, or did they cluster at some
values? (the grades are not evenly distributed from 60 to100. Not many grades are in the
60s or 70s. Most of the grades are in the 80s, and a fair number are in the 90s.) Line Graph
A line graph has two axes. On the horizontal axis, the data values or labels are listed. On the other axis, the frequency for the data items is listed. For each data value, a dot is placed at the height for the frequency of the data. Then the dots are connected with line segments. Often a line graph is used to show a trend over time, and the horizontal axis represents time.
Example: The line graph below shows the trend in the percentage of 10th graders who
passed the WASL Math test (the state-required test in Washington) over several school years.
(graph from the Office of the Superintendent of Public Instruction of Washington
website at:

Section 10-2: Displaying Data in Graphs
Page 10 - 13
http://reportcard.ospi.k12.wa.us/waslTrend.aspx?gradeLevelId=10&waslCategory=1&chartType=1 )
Determine from the graph: - Approximately what percent of 10th grade students met the standard (passed the test)
in the 1998-1999 school year? (The height of the mark over that school year is between 20 and 40 and is a bit
closer to 40. About 32% of students passed that year.) - Approximately what percent of 10th grade students met the standard in 2007-08?
(About 50%.) - What was the trend over these years in percent of 10th graders who passed? (There was a gradual increase in percent of students who passed, with a leveling
off in the last couple years.) Pie Graph, also known as a Circle Graph
In a pie graph, a circle is used to represent the whole (that is, to represent all of the data). Each part of the pie (shaded a different color) represents one of the categories of data. The size of each part of the circle (compared to the whole circle) is related to the fraction or percent of the amount of data in that category (compared to all the data). It is common in a pie graph for the percentage of data in each category to be listed. The percents should, of course, add up to 100%. A pie graph is also called a pie chart or a circle graph.
Example: Some
citizens were asked whether they favor or oppose a new tax law. This is the same data that was displayed earlier in the form of a bar chart.
Determine from the graph: - How many people favor the law? (The number of people who favor the law cannot be determined! All we can say
is that 36% of the people surveyed favor the law.) - How many people were surveyed? (That information is not given on this graph.) - What percent of the people surveyed had no opinion? (14%.) Stem and Leaf Plot A stem and leaf plot provides a way to list numeric data in a very compact form. In a stem
and leaf plot, ALL of the original data values can be found.

Section 10-2: Displaying Data in Graphs
Page 10 - 14
In some data displays, the data is grouped before it is graphed and then the specific data
values can no longer be seen. For example, in the histogram shown above labeled “Test Grades for the Class”, the grades have been grouped. We can see that ten people had scores in the 80s, but we do not know exactly what those scores were.
Here is a list of the raw data of test scores from the class, the list that was used to make the
histogram above. 81, 75, 83, 82, 67, 87, 87, 91, 95, 78, 86, 89, 81, 77, 91, 84, 98, 81, 93 To make a stem and leaf plot, the larger place value is considered the “stem” and the smaller
place value gives the “leaves”. For these numbers, the tens place will be the stems. Look over the numbers to see what digits are in the tens place – the digits are 6, 7, 8, and 9 – so those are the stems.
The stems are written on the left side of a vertical line. Stem Leaf 6 7 8 9 Next, look through each of the data values and write its “leaf” (the number in the ones place)
next to the correct stem. For example, in the data list above 81 is the first number; we write a 1 next to the stem of 8. The next data value is 75, so a 5 is written next to the stem of 7. For the next data value of 83, a 3 is written in the line for the 8. This is how the stem and leaf diagram looks so far:
Stem Leaf 6 7 5 8 1 3 9 Let’s keep going through the data list, writing more “leaves”. The next number in the list is
82, so we write a 2 in the row for 8. Next is 67 so put a leaf of 7 in the row for 6. Then there is 87, so put a 7 in the row for stem 8. Now we have this much:
Stem Leaf 6 7 7 5 8 1 3 2 7 9 Continue in this manner, using the rest of the numbers in the data list (namely, 87, 91, 95, 78, 86, 89, 81, 77, 91, 84, 98, 81, 93) and write each leaf in the correct row. The result is as follows: Stem Leaf 6 7 7 5 8 7 8 1 3 2 7 7 6 9 1 4 1

Section 10-2: Displaying Data in Graphs
Page 10 - 15
9 1 5 1 8 3 This stem and leaf diagram is complete, however the leaves are in a “mixed up” order. To
finish the stem and leaf diagram, rearrange the leaves in each row into number order: Stem Leaf 6 7 Key: stem is the tens place, 7 5 7 8 leaf is the units place 8 1 1 1 2 3 4 6 7 7 9 9 1 1 3 5 8 Notice that every data value appears in the stem and leaf diagram. For example, if we want
to know what the test scores are in the 70s, we can see that they are: 75, 77, and 78. Another thing to notice about the stem and leaf diagram is that it ends up looking somewhat
like a horizontal bar graph. Practice Problems for Stem and Leaf Plots:
1. For each of the following data sets, make a stem and leaf plot. a) The heights in inches of the children in a class of four and five year olds are listed
here: 40, 47, 38, 40, 51, 44, 39, 38, 42, 43, 42, 50, 48, 47 b) Many ovens were tested to see what temperature they actually were when they were
set to 350 degrees Fahrenheit (many ovens do not actually get to the temperature they are set at). The temperatures readings were:
345, 382, 350, 364, 353, 340, 359, 341, 338, 347, 368, 385 To make this stem and leaf plot, the stems will be two-digit numbers ending in the
tens place. So they will be 33, 34, 35, 36, 37, and 38. Note that none of the data items has a stem of 37, but it is included in the diagram as
a “place holder” since we want to properly space all of the stems from the smallest value to the largest value.
2. This is a two-directional stem and leaf plot. The data is the heights of children in a
child care center. The boys’ heights are listed on the left and the girls’ heights on the right. The heights are in inches.
Boys’ heights Girls’ heights Leaf Stem Leaf 8 3 9 9 8 8 7 4 1 4 2 6 8 9 7 3 3 2 5 1 2 2 4 5 6 8 8 5 4 6 0 2
a) What is the height of the shortest boy? b) What is the height of the shortest girl? c) Is one of the boys 46 inches tall? Is one of the girls 46 inches tall? d) What height is the tallest boy? e) What height is the tallest girl? f) How many boys are in the child care center?

Section 10-2: Displaying Data in Graphs
Page 10 - 16
g) How many girls are in the child care center? Answers to Practice Problems for Stem and Leaf Plots:
1. Stem Leaf 3 8 8 9 4 0 0 2 2 3 4 7 7 8 5 0 1
2. Stem Leaf
33 8 34 0 1 5 7 35 0 3 9 36 4 8 37 38 2 5
3. a ) 38 in b) 39 in c) no boy is 46”, one girl is 46” d) 65 in e) 62 in f) 13 boys g) 15 girls

Section 10-2: Displaying Data in Graphs
Page 10 - 17
Section 10-2: Exercises on Displaying Data in Graphs
1. a) Find at least three different types of graphs in newspapers, journals, or websites, and bring them in to share with the class. (Different types means, for example, that one might be a circle graph and the others are not circle graphs. The others might be a bar graph and a line plot, for example).
b) For each of your example graphs, state what type of graph it is, and describe what the graph shows about the data.
2. For each of the following, state whether the data collected is Nominal (also called Categorical or Qualitative) or Numeric (also called Quantitative) a) Each employee in the company is given a job rating of excellent, good, fair, or poor. b) For each employee, the amount of money s/he was paid last year is recorded. c) Every ice cream shop in the franchise is asked how many gallons of chocolate syrup
they used in July. d) Every ice cream shop in the franchise tells the corporate owners which ice cream
flavor was most popular each week. e) In the child care center, the number of children out sick is recorded each day. f) The child care center asks each of their teachers to fill out a form giving their address. 3. a) Give two examples of data that it would NOT be appropriate to collect in a class of
children, along with the reasons why. b) Give two examples of data that it would be appropriate to collect in a class of children. 4. This line plot, which has been drawn as a dot plot, presents data about how many siblings
each member of a class has. ! ! ! ! ! ! ! ! ! ! ! ! ! ! 0 1 2 3 4 5 6 7 8 9 10 Number of siblings
a) How many people in the group have no siblings? b) What is the largest number of siblings that anybody in the group has? c) How many people were in the group being surveyed? d) What was the most common number of siblings?

Section 10-2: Displaying Data in Graphs
Page 10 - 18
5. The weights of 53 third-grade students were measured in kilograms. The weights were grouped into categories to make this histogram. a) How many students weighed between 20 and 21.9 kg? b) How many students weighed 22 kg or more? c) What percentage of the students weighed under 18 kilograms? d) How would you describe the distribution of weights: are they spread out evenly over all the weights, or clustered in some area?
6. The records for the number of students absent and the number tardy (arriving late) for one week for one school are presented in this multi-bar graph.
a) How many absences were recorded this week? b) On which day were the most students tardy? c) If the school has 225 students, what percent were absent on Monday? d) How could you describe the pattern for absent and tardy students? (evenly spread out over the days? More absent/tardy on certain days?)

Section 10-2: Displaying Data in Graphs
Page 10 - 19
7. This chart shows the types of sandwiches selected by people at a conference. a) Which type of sandwich was selected most often? b) Which type was selected least often? c) What is the sum of the percentages labeling the sections? d) If there were 110 people who selected sandwiches, how many selected a ham sandwich?
8. The owner of a video rental store tracked the numbers of customers on Mondays and on
Fridays for several weeks. This two-directional stem and leaf plot presents the numbers of customers on Mondays (on the left side) and the numbers of customers on Fridays (on the right side). The “stem” is the tens place digit for the numbers, and the leaves are the units digits. For example, on Mondays, the smallest number of customers was 30.
Mondays stem Fridays
8 5 5 5 1 0 3 6 4 2 2 4 7 7 3 1 0 5 4 6 6 3 8 9 9 7 1 5 5 6 6 6 8 a) What was the smallest number of customers on a Friday? b) What was the largest number of customers on a Monday? c) How many weeks are represented in this diagram? 9. Students in the fifth grade measured the lengths of vines growing along the edge of the
playground, in centimeters. Present this data in a stem and leaf plot. The raw data is: 45 59 38 54 72 39 70 48 54 47

Section 10-2: Displaying Data in Graphs
Page 10 - 20
10. Suppose that the following data was collected from the students in a class. Use this data set to answer the questions below.
Student Birth Month # siblings # letters in last name
favorite color left or right handed
Alice Feb 2 7 pink right
Bert Dec 0 5 purple right
Colleen Jan 1 8 green right
David May 2 10 green left
Earl Dec 5 6 blue right
Francie April 1 6 pink right
George August 1 5 blue right
Helen October 3 6 orange right
Iris August 0 8 pink left
Jon May 2 7 blue right
Kim Feb 2 2 red right
Len Jan 1 5 blue right
Monica Nov 0 6 red right
Ned June 1 7 brown right
Oscar May 3 8 blue right
Pam June 6 4 pink left
Quincy Dec 0 8 yellow right
Ramona May 6 6 orange right
Stan July 1 7 blue right
Tess June 2 8 red right
Ursula April 1 5 yellow right
Vern Oct 2 8 blue right
Wendy August 0 4 red right
Xavier July 1 7 blue right
a) i) Which of these data items are Nominal (Qualitative) data? ii) Which of these data items are Numeric (Quantitative) data? b) Make a line plot (also known as a dot plot) of the number of siblings. c) i) Make a table to tally the Birth Months,
ii) and then make a bar chart showing the data. d) Make a circle graph (pie chart) of the data about “handedness”. e) For the favorite colors:
i) Make a table to tally the data. ii) Calculate what percent of students prefer each color. iii) Make a circle graph (pie chart) showing the favorite color data.
f) For the number of letters in the last name, make a line plot (dot plot) of the data.
11. Explain why children and adults should learn about statistics. Give at least two reasons.

Section 10-3: Measures of Center and Variability
Page 10 – 21
Section 10-3: Measures of Center and Variability Graphs provide a useful visual display of data. When data is collected and a list is made of
the raw data values, it is difficult to look at that list and understand the data, especially for a long list of data. When the data is organized and then displayed in a graph, it is much easier to make observations about the nature of the data. For example, one can see if the data is evenly spread out over all the categories or whether it is clustered around a few values.
In this section we will describe ways to summarize a set of data beyond the display provided
in a graph. These summary values provide a measure of the “center” of the data values and the “spread” of the data values. One type of measure of center can be found for nominal (categorical, qualitative) data. The other summary measures described here can be found only for numeric (quantitative) data; they cannot be computed for nominal data.
Example of “How many black beans in a teaspoon?”:
Suppose the question being investigated by a group of children is “How many black beans fit in a teaspoon?” (these are the dry, uncooked beans). The children investigated, and the raw data was listed in the previous section. Note that it is numeric data. 20, 25, 22, 22, 20, 21, 21, 21, 23, 20, 21, 19, 22, 23, 22 In the last section the line plot of this data was provided: x x x x x x x x x x x x x x x 18 19 20 21 22 23 24 25 26 number of black beans in a teaspoon
From this graph we can see that the data clusters around 20 to 23, and even more
around 21 to 22. And the data is distributed fairly symmetrically (that is, it extends to the right and left in the graph in fairly similar ways).
It would be convenient to summarize this data further – to be able to answer the question
“How many black beans fit in a teaspoon?” with one “average” number. That “average” number would be a measure of center.
Measures of Center A measure of center provides one value that gives a general idea what the “center” is of the
data values. Three different measures of center are the mean, the median, and the mode. Sometimes the measures of center are called “measures of central tendency”.
! The Mean The mean is often used to describe the “average” or “center” of a set of data values. The mean can be computed if the data is numeric. To find the mean of the data, the data
values are added and that sum is divided by the number of data values.
Mean =

Section 10-3: Measures of Center and Variability
Page 10 – 22
Example: For the number of black beans in a teaspoon example, the mean of the fifteen
data values is computed by:
Mean = = 21.5
• Note that this result of 21.5 seems reasonable. From the graph it seemed that about 21
or 22 beans generally fit in a teaspoon. • Note that the order that the data values are added in the numerator does not matter. In
this example they were added in the order of the raw data list. They could instead be added in the order of an organized list.
Practice Problem: Five people are on an elevator and their weights in pounds are: 132, 161, 195, 110, 147. Find their mean weight.
Answer to Practice Problem: = = 149
Their mean weight is 149 pounds. ! The Median The median is the number in the middle of the data values when they are arranged in order.
Half the data values are less than the median, and half are greater than the median. For example, for these numbers, which are listed in order: 3 5 9 11 12 The number in the middle is 9, and so 9 is the median. When there isn’t one data value in the middle, then the median is halfway between the two
data values in the middle. For example, for these numbers 3 5 9 11 12 18 There is not one data value in the middle – rather, the 9 and 11 are both in the middle.
So the median is exactly half way between 9 and 11, so the median equals 10. In this example it was easy to see what number is half way between 9 and 11. When it is not
easy to see what number is half way between two other numbers, then one can take the mean of those two numbers and that is half way between them. In this example, to find the
number half way between 9 and 11 we would calculate = = 10, which is the same
result we found earlier. Method for finding the Median To find the median of the data, follow these steps: 1) list the data values in sorted order from smallest to largest 2) If the number of data values is odd, then the median is the data value in the middle. If the number of data values is even, then there are two data values in the middle,
and the median is exactly half way between them. It can be calculated by adding the two middle data values and dividing that by 2.
The median can be determined if the data is numeric (quantitative).

Section 10-3: Measures of Center and Variability
Page 10 – 23
Example: Find the median for the number of black beans in a teaspoon example. The data must first be written in sorted order. The sorted data is: 19, 20, 20, 20, 21, 21, 21, 21, 22, 22, 22, 22, 23, 23, 25 The number of data values is 15, an odd number – so one data item is in the middle and
there are 14 other data items. Seven data values are less than the middle number and seven data items are greater than the middle number. The middle number is 21 (it is the fourth 21 in the list, which is the 8th item in the list).
The median is 21. Practice Problem: For the five people on elevator in the last problem, find their median
weight. Their weights are: 132, 161, 195, 110, 147. Answer to Practice Problem: Remember to first arrange the data in order: 110, 132, 147, 161, 195 The median is the middle number. The median is 147 pounds. Note that the mean and the median are not generally the same for a set of data. When the data are symmetrically distributed, then the mean and the median are similar to
each other, but they are not generally equal. ! The Mode The mode is the most frequently occurring data value. Examples: A) Here is list of test grades, in sorted order: 73, 84, 84, 84, 86, 88, 90, 91, 91, 93, 96, 98, 98, 99. The mode is 84 since that number occurs most often. B) Consider the data from the number of beans in a teaspoon example, written in order:
19, 20, 20, 20, 21, 21, 21, 21, 22, 22, 22, 22, 23, 23, 25 Notice that the value 21 occurs four times and the value 22 occurs four times. This data set
has two modes. The data is referred to as being bimodal (meaning there are two modes). Some data sets have three or more modes, if several items all occur with the same high frequency.
C) Consider the people on the elevator data set: 132, 161, 195, 110, 147. This data set has no mode. All the data values occur with the same frequency (each occurs
once). Disadvantage of the Mode The examples above point out a weakness with the mode: sometimes there is a mode,
sometimes there is more than one mode, and sometimes there is no mode. Another weakness of the mode is that sometimes its value is not very representative of the
data. In the example above of the test grades, the mode is 84, but most of the test grades are higher than 84. 84 does not seem to represent the “center” very well.
Advantage of the Mode – it can be found for nominal data One advantage of the mode is that it can be found for nominal (categorical, qualitative) data.
It is the only measure of center that can be found for nominal (categorical, qualitative) data.

Section 10-3: Measures of Center and Variability
Page 10 – 24
For example, the eye colors of a group of people are: blue, blue, brown, brown, grey, brown, hazel, brown, green, hazel, brown The mode of the eye colors is brown, since brown occurs most often. There is no mean or median since the data is not numeric. Further considerations of the mean and median Consider the example of the five people on the elevator whose weights are: 110, 132, 147, 161, 195 We found the mean weight is 149 pounds and the median weight is 147 pounds. Now suppose that the person who said his weight was 195 pounds confesses that he was
lying, and his weight is actually 212 pounds! So the new data set is 110, 132, 147, 161, 212
The new mean is = = 152.4 pounds.
The new median is 147 pounds. Notice that the change of one person’s weight has a noticeable affect on the mean
(increasing it by 3.4 pounds), but does not change the median. In general, the mean is affected by every one of the data values. If one value changes, the
mean will change at least a little. And when a data value near the extremes (near the smallest or largest values) changes, the mean is affected more strongly. However the median is only affected by the values in the middle. When extreme values of data change, the median is not affected at all.
Practice Problem:
Suppose that a small business has employees with the following annual pay rates: Six new employees make $18,000 per year Four employees with a year experience make $19,000 per year Two employees with more experience make $21,000 per year The company president makes $90,000 per year. a) What is the mean pay? b) What is the median pay? c) Which of the two, mean or median, better represents the “average pay” at the
company? Answers to Practice Problem: a) mean =
= 316000 / 13 = 24,307.69 The mean pay is $24,307.69
Note that the expression for finding the mean could have been written in a more compact form, like this:

Section 10-3: Measures of Center and Variability
Page 10 – 25
b) median is found after the salaries are arranged in order: 18000, 18000, 18000, 18000, 18000, 18000, 19000, 19000, 19000, 19000, 21000,
21000, 90000 From those thirteen pays, the middle one is the seventh from the start: 19,000 The median pay is $19,000. c) The mean pay is higher than the pay of twelve employees, and has only one person
who makes more than the mean of $24,307. So the mean does not seem to represent the pay of the typical worker.
The median pay is similar to the pay of many of the employees, and is a better representation of the pay of the workers (except for the president).
NOTICE: The Practice Problem example illustrates the following: When the data include some “extreme” values that are not close to the other data values,
such as the very high pay of the company president, then the mean is generally not good at representing the “center” of the data values. Rather, the median gives a better representation of the center of the data.
The use of the word “average”
The word “average” in English is vague. Both the mean and the median are sometimes called the “average”. So if you read a news article saying that the average home price was some number, it isn’t clear if that is the mean or the median price. More often than not, the word “average” is referring to the mean, but not always. A good journalist will specify which average is being used. For example, a news article might report “the median home price is…” or else “the mean home price is…”.
In your own work, you should specify if you are stating the mean, the median, or the
mode. Do not simply say “the average” when you report to others, since that can be misunderstood.
Physical Model to Demonstrate Mean, Median, and Mode
The concepts of the various measures of center can be demonstrated using unifix cubes to represent the numbers involved. Other cubes could be used instead, such as hexalink or multilink cubes, or cubes that don’t interlock.
Example A: Suppose the data collected is the number of pencils that Angela, Barb, Carlos, and Dmitri
have with them: Angela – 3 pencils Barb – 8 pencils Carlos – 5 pencils Dmitri – 8 pencils. Unifix cubes can be used to represent the numbers of pencils. Suggestion: get some cubes
and use them to follow along with this example. It is easier to follow if each number is represented by a different color of cubes (though this is not necessary).
3 = 8 = 5 = 8 =

Section 10-3: Measures of Center and Variability
Page 10 – 26
Mean
The mean number of pencils that these four students have is a kind of “average”. One way to think about “what is the mean average number of pencils that these four students have?” is this: if all the pencils were distributed evenly among the students, how many pencils would each have? They would each have the mean number of pencils.
We can find this mean number by rearranging the cubes in the four stacks so that the stacks are all the same height. One way to do that is shown here:
! these are the original cubes, redistributed so that all the columns are the same height – a height of 6 each. The mean of 3, 8, 5, and 8 equals 6. Median
The median number of pencils that these four students have can be found from the unifix cubes by first arranging the four stacks of cubes in order by size:
! the median is the size in “the middle”. There is no stack in the middle, so we figure out the size that is half-way between the two middle stacks. Half-way between the two middle stacks would be a stack of 6.5 cubes. The median of 3, 8, 5, and 8 equals 6.5. Mode
The mode is the size of stack that occurs most often. In this example, the stack of size 8 cubes occurs twice. The mode of 3, 8, 5, and 8 equals 8.
Example B: Suppose there are three data values 7, 9, and 6 represented by cubes. 7 = 9 = 6 = To find the mean we would try to spread the cubes out so that each stack was the
same height. We could begin that process by moving one cube from the tallest stack (9) to the shortest stack (6), getting this result:
The stacks are now of heights 7, 8, and 7. One cube must be removed from the tallest stack (8), but there is no one stack on which to put the cube to make all the stacks the same height!

Section 10-3: Measures of Center and Variability
Page 10 – 27
So, one cube should be removed from the tallest stack, and we must imagine that cube being allocated to all three cubes – each stack would get 1/3 of that cube. Of course this cannot be done with an actual cube (we cannot cut it into three equal parts) – so simply imagine it.
The mean of these three numbers 7, 9, and 6 equals 7 .
To find the median, arrange the stacks in order by size: 6 = 7 = 9 = The median is 7. There is no mode for these numbers. Activities for Practice 1. Use cubes to represent these three data numbers: 2, 9, and 10. Then arrange the cubes to determine the mean. Then start with the original stacks and determine the median and the mode. 2. Use cubes to represent these five data numbers: 3, 2, 7, 6, and 7. Then arrange the cubes to determine the mean. Then start with the original stacks and determine the median and the mode.
Measures of Variability When a set of data is being described, a measure of center (the mean, median, or mode)
gives a good measure of what value is near the center of the numbers. But that does not tell the whole story about the data. Consider these two examples:
9:00 class quiz scores: 5, 6, 7, 8, 10 " mean = 7.2, median = 7 noon class quiz scores: 1, 2, 7, 12, 14 " mean = 7.2, median = 7 These two classes have the same mean and median quiz score; they are centered around
the same values. However, look over the data sets. Does it seem that the two classes are “the same” in their quiz scores? The 9:00 class’s scores are all very similar to the mean – the students are all doing about the same as each other on the quiz. The noon class’s scores are very spread out, they very a lot – some students are doing very well, and some are doing quite poorly. The classes are not doing the same as each other, even though the mean and median scores are the same.
The thing that is different about the quiz scores for the two classes is the “measure of
variability”, which is also called the “measure of spread”. Two ways to measure the variability of a data set are the range and the standard deviation.. The easiest measure of variability to calculate is the range.
! The range of a set of data gives the distance between the highest and lowest data values
in the data set. The highest value is the largest number in the data set; the lowest value is the smallest number in the data set.
Range = highest data value – lowest data value

Section 10-3: Measures of Center and Variability
Page 10 – 28
In our example of quiz scores, here are the calculations of the range: 9:00 class quiz score range = 10 – 5 = 5 noon class quiz score range = 14 – 1 = 13 The ranges for these two sets of data are very different (the range of 13 is more than double
the range of 5). This indicates the two sets of data are different. ! The most commonly used measure of variability is called the standard deviation. The formula for
calculating the standard deviation is rather complicated. Use of technology, such as a computer or a graphing calculator, makes the calculation of the standard deviation easy. We are not going to calculate standard deviations here.
The point to remember here is simply that the standard deviation gives a measure of how variable the data is.
If two sets of data are measuring the same kind of thing, then the standard deviations of the two data sets indicate which is more spread out or more variable. For our example of quiz scores:
For the 9:00 class’s quiz scores, the standard deviation is 1.7 For the noon class’s quiz scores, the standard deviation is 5.2 Since these data sets are for the same type of data (quiz scores on the same type of quiz), the standard
deviation being higher for the noon class indicates that its data is more variable.
! Notes about range and standard deviation: - Both the range and the standard deviation can be calculated ONLY for numeric data.
They can not be used for nominal (categorical, qualitative) data. - It makes sense to compare the range for two data sets (or the standard deviation for two
data sets) ONLY if the data was the same type of data in the same type of units. For example, if a data set for the weights of some books was found to have a range of 3.2 pounds, and the data set for the heights of some students was found to have a range of 8 inches -- we can conclude nothing about which set of data was more spread out. Their units are not the same, the type of data is not the same, and so their ranges (or their standard deviations) cannot be compared.
Practice Problem: What is the range of the data for the number of black beans in a teaspoon data, which is
listed here: 20, 25, 22, 22, 20, 21, 21, 21, 23, 20, 21, 19, 22, 23, 22
Answer to Practice Problem: The highest data value in the list is 25. The lowest value in the list is 19. The range = 25 – 19 = 6. The range is 6 black beans.

Section 10-3: Measures of Center and Variability
Page 10 – 29
Section 10-3: Exercises on Measures of Center and Variability
1. Find every measure of center that you can for the data represented by this bar graph.
2. Students counted how many flash cards they could answer correctly in one minute. Here are
the results: 19, 14, 15, 12, 15, 22, 16, 18, 20 For this data set find each of the following: a) the mean b) the median c) the mode d) the range 3. In one class of third graders, the reading levels of the students was measured as: 3.3 1.2 4.4 2.8 3.8 9.4 2.7 3.2
a) Without calculating the mean, median, or mode, state which one you think would be the better measure of center for this data and explain why you think so.
b) What is the mean of the data? c) What is the median of the data? d) What is the mode of the data? e) What is the range of the data?
4. Ms. Morris summarized the weekly expenses for snacks for her class in the following stem
and leaf diagram. Each data value is the expense for one week, in dollars. Stem Leaf 1 2 8 8 9 2 1 4 6 6 6 3 1 2 a) For how many weeks did Ms. Morris record the expenses in this diagram? b) What is the modal expense? (that is, what is the mode of the data?) c) What is the median expense? d) Use a calculator to find the mean expense. e) What is the range of this data.

Section 10-4: Probability
Page 10 – 30
Section 10-4: Probability The probability of something happening is a measure of how likely it is to happen. People
are speaking about probability when they say things such as: - “It is highly likely that I will pass this course!” - “It is impossible that I can get to the airport on time” – while sitting in a massive traffic jam. - “We painted the house last summer. It is unlikely it will need painting again this year.” - “Toss a coin to settle the argument. There is a 50% chance it will come up ‘heads’.” - “Claire is in a class of 8 students. If the teacher randomly selects one of their names from
a list, the probability Claire will be selected is 1/8.”
In their expectations for Pre-K to Grade 2 children, the NCTM says “Ideas about probability at this level should be informal and focus on judgments that children make because of their experiences.” (NCTM 2000: 109)
Children are using concepts of probability when they say that something is impossible,
certain, likely, or unlikely. Juanita Copley gives these examples of comments that teachers of young children may
make in order to encourage their thinking about probability: “Looking at those dark clouds, I think it is likely to rain today” “It is 12 o’clock; where do you think we will probably go next?” “We have 22 in our class. Do you think Ethan’s mom is likely to bring 100 cupcakes for
us?” (Copley 2000:159) Older children and adults need to develop a deeper understanding of probability so that they
can function well in society. For example, a doctor may state that the probability is about 12% for side effects from a medicine, or the lottery might have a $5 million jackpot and you want to know the probability of winning, or there may be a 40% chance of snow tomorrow so you wonder whether you need to plan alternate child care. Many decisions required in everyday life are based on considerations of probability.
There are several approaches to probability: informal probability, theoretical probability and
experimental probability. Each of these approaches is described below.
Informal Probability Informal probability is the type most appropriate for young children in pre-K to grade 2. This
could also be called subjective probability. For informal probability, a person uses past experience and knowledge to estimate the probability that an event will occur.
Activity in Informal Probability Here is a “probability number line” showing the continuum of possible probabilities from
“impossible” through “unlikely” and then “likely”, ending at “certain”. impossible unlikely likely certain

Section 10-4: Probability
Page 10 – 31
Along this “probability number line” write the letter for each of the following events in the
place that you think gives a good approximation of its probability. For example, the first event “A” in the following list is impossible. So the letter A would be
written under the left end of the probability number line. Note: there may be more than one letter written under the same spot on the number line. A – a pig will fly by our window tomorrow B – It will rain in February in this city. C – It will rain in August in this city. D – school will be closed on Martin Luther King Day E – the next time class meets there will be a dog in the room F – someone will lend you a pencil if you forget yours tomorrow G – 12 + 7 = 18 H – the sun will come up tomorrow morning I – you will get eight hours of sleep tonight J – someone in your family will be sick some day next week K – the next time class meets there will be someone in the room wearing blue jeans L – you will eat turkey next Thanksgiving After writing each letter, compare with others in the class. When your answers differ,
discuss why. Different people might have different answers, but some answers should be the same for everyone.
Theoretical Probability Some probabilities can be determined theoretically, meaning that we do not have to
experiment to find them out but rather just think and analyze the situation. The general method in calculating the theoretical probability of an event includes these steps:
a) determine ALL of the different things that could possibly happen in the situation b) the various things that could happen (each possible outcome) must be known to be
equally likely c) then the probability of a particular event happening equals the fraction
An example will make this clear: Suppose the only items in my drawer are a pair of blue socks, a pair of brown socks, a pair
of black socks and a pair of pink socks (and the socks are balled up in pairs and all feel the same). Suppose it is dark and I reach in the drawer and take out a pair of socks (without looking). What is the probability that I will pull out the pair of pink socks? We can use theoretical probability to determine this probability, as follows.
blue black
brown
pink

Section 10-4: Probability
Page 10 – 32
Step (a) is noting that all the different things that could possibly happen are that I get blue
socks, I get brown socks, I get black socks, or I get pink socks. There are four different things that could happen.
Step (b) is recognizing that it is equally likely that I will get any one of the pairs of socks – since there is no way to tell them apart in the dark.
Step (c) is noting that there are four equally likely results, and only one of them is “pink socks”.
The probability of getting pink socks = = .
The numerator is 1 since that is the number of ways to get pink socks, while the denominator is 4 since that is the number of different things that could possibly happen.
Conclude that the probability of getting pink socks is .
Notation
This probability is often written P(pink socks) = .
A capital letter “P” written with parentheses next to it indicates the probability of the event in the parentheses.
This probability could also be written as P(pink socks) = 0.25 or 25%. Extension of Example For the example above about the socks, notice these probabilities:
P(blue socks) = , or .25 or 25%
P(dark-colored socks) = or 75% since there are three ways to get dark socks, namely blue, brown, or
black.
Some Vocabulary and Facts about Probability In discussing probability situations, an “event” is something that might or might not happen. We find the probability of an event. A “simple event” is an event that cannot be described in simpler terms. In the previous example about socks, getting the pink socks is a simple event (since there is only one pair of pink socks – getting pink socks can happen only in one way). Getting dark-colored socks is not a simple event because there are several ways it could happen (namely getting the blue, the black, or the brown socks). A “sample space” is a list of all the possible events that could happen, but writing them in their “simple” form, that is, as simple events. For the socks example, the sample space is: get blue socks, get brown socks, get black socks, get pink socks. Often the sample space is written as a set, with set braces. For this example we could say the sample space is { blue socks, brown socks, black socks, pink socks }. P( an event ) means “the probability of the event”.

Section 10-4: Probability
Page 10 – 33
When the probability of an event is given a numeric value, the value is always between zero and one, inclusive. The probability may be stated as a fraction, a decimal, or a percent. In the socks example, the probabilities stated were ! and " - and those values are between zero and one.
The probability of an event is always between zero and one, inclusive. In symbols we say: 0 < P( an event ) < 1
If an event is impossible, then its probability is equal to zero. For example, P(population of humans on earth will double by tomorrow) = 0. If an event is certain to occur, then its probability is equal to one. For example, P(it will rain in Tacoma, Washington, next year) = 1.
Examples of Theoretical Probability Problems 1. A typical coin has one side called “Heads” and the other side called “Tails”. A coin is called “fair” if it has an equal chance of landing on either side. For the “event” of tossing a fair coin, the sample space (which is the list of all possible
outcomes) is { Heads, Tails }. a) The probability of the coin landing Heads = P(Heads) = _______ b) The probability of the coin landing Tails = P(Tails) = _______ c) Find: P(Heads) + P(Tails) = _______ Does that result make sense? Solution: a) There is one way for the coin to land Heads, and there are two ways total for it to land
(there are two simple events in the sample space). Thus P(Heads) =
b) There is one way for the coin to land Tails, and there are two ways total for it to land.
Thus P(Tails) =
c) P(Heads) + P(Tails) = + = 1. This result makes sense because the only two
possible outcomes are Heads and Tails. We are certain that one or the other of them will happen, so their probabilities together should equal 1.
2. A box contains 15 turkey sandwiches and 7 peanut butter sandwiches, all wrapped in
opaque paper so we cannot tell which type of sandwich each is until opening it. a) If you reach in and take out one sandwich, what is the probability that it will be a turkey
sandwich? (hint: how many different turkey sandwiches are there? How many different total are there?)
b) If that first sandwich you took out was turkey, and you eat it, then you reach in again and
take out a another sandwich, what is the probability that one is turkey?

Section 10-4: Probability
Page 10 – 34
c) At the start, with 15 turkey sandwiches and 7 peanut butter sandwiches, if you reach in and take out one sandwich, what is the probability that it will be a peanut butter sandwich?
Solution: a) The probability of getting a turkey sandwich, when one is selected, is
=
since there are 15 turkey sandwiches and 22 sandwiches total b) This time, when you reach in the box there are only 14 turkey sandwiches remaining, and
there are 14+7 = 21 sandwiches total.
Thus the probability of getting a turkey sandwich is , which reduces to .
c) The probability that the sandwich is peanut butter has a numerator of 7 since there are 7 peanut butter sandwiches and a denominator of 22 since there are 22 sandwiches total.
Thus the probability of getting a peanut butter sandwich is .
3. Consider the spinner here which has four sections. The arrow can be flicked and it will spin freely and may stop in any direction.
When someone spins the arrow, … a) What is the sample space of possible results? And, is the probability of each of these simple events the same? b) What is the probability it will land in the section labeled “A”? c) What is the probability it will land in the section labeled “C”? d) What is P(A) + P(B) + P(C) + P(D)?
Solution: a) The sample space includes all the possible results. It is {A, B, C, D}. The probability of
each of these simple events is the same. b) The four sections are equal in size, and so the arrow is equally likely to stop in each
section . The probability the arrow will land in section “A” is ! c) The probability the arrow will land in section “C” is !. d) the sum is 1. These are all the distinct events that could happen – so their probabilities
together equal one. 4. Consider the spinner here which has sections labeled X, Y, and Z, as shown. The arrow can
be flicked and it will spin freely and may stop in any direction.

Section 10-4: Probability
Page 10 – 35
When someone spins the arrow, … a) What is the sample space of possible results? And, is the probability of each of these simple events the same? b) What is the probability it will land in the section labeled “X”? c) What is the probability it will land in the section labeled “Z”? d) What is P(X) + P(Y) + P(Z) ?
Solution: a) The sample space is {X, Y, Z}. The probability of these simple events are NOT all the
same since the three sections are not the same size! b) The three sections are NOT equal in size. If we think of the whole circle as having 360
degrees where the arrow may land, then section “X” has 90 degrees. The probability the
arrow lands in section X is then , which equals .
c) Section “Z” takes up half the places that the arrow may land.
The probability the arrow lands in section “Z” is .
d) P(X) + P(Y) + PZ) = + + = 1. P(X) + P(Y) + PZ) = 1 since X, Y, and Z
are the only possible outcomes – so the sum of their probabilities must be 1. 5. The theory of probability was expanded a great deal several hundred years ago by people
who were interested in games of chance. Some of those games are played with a deck of cards. Today a normal deck of playing cards has 52 cards. The deck has 13 of each suit (spades, hearts, clubs, diamonds); in each suit there is an Ace, King, Queen, Jack, and each number from 2 through 10.
The typical deck of 52 Playing Cards
Black Cards Red Cards
Ace of Spades Ace of Clubs King of Spades King of Clubs Queen of Spades Queen of Clubs Jack of Spades Jack of Clubs 10 of Spades 10 of Clubs 9 of Spades 9 of Clubs 8 of Spades 8 of Clubs 7 of Spades 7 of Clubs 6 of Spades 6 of Clubs 5 of Spades 5 of Clubs 4 of Spades 4 of Clubs 3 of Spades 3 of Clubs 2 of Spades 2 of Clubs
Ace of Hearts Ace of Diamonds King of Hearts King of Diamonds Queen of Hearts Queen of Diamonds Jack of Hearts Jack of Diamonds 10 of Hearts 10 of Diamonds 9 of Hearts 9 of Diamonds 8 of Hearts 8 of Diamonds 7 of Hearts 7 of Diamonds 6 of Hearts 6 of Diamonds 5 of Hearts 5 of Diamonds 4 of Hearts 4 of Diamonds 3 of Hearts 3 of Diamonds 2 of Hearts 2 of Diamonds

Section 10-4: Probability
Page 10 – 36
For each of the following, suppose there is a normal deck of playing cards, with 52 cards. Suppose the cards are thoroughly shuffled, and then someone randomly selects one card. Find these probabilities.
a) P(the person selects the Ace of Spades) = b) P(the person selects a King) = c) P(the person selects a Heart) = d) P(the person selects a card that is NOT a Heart) = e) P(the person selects a Heart) + P(the person selects a card that is NOT a Heart) = Solution: a) There is only 1 Ace of Spades, and there are 52 cards total that could be picked. P(the person selects the Ace of Spades) = 1 / 52 b) There are four different kings, and there are 52 cards total. P(the person selects a King) = 4 / 52 = 1 / 13. c) There are 13 cards that are Hearts, and 52 cards total. P(the person selects a Heart) = 13 / 52 = 1/4. d) There are 13 spades, 13 clubs, and 13 diamonds, which is 3 * 13 = 39 cards that are not
hearts. Thus P(the person selects a card that is NOT a heart) = 39/52 = ". e) P(the person selects a Heart) + P(the person selects a card that is NOT a Heart) = ! + " = 1. The sum of these probabilities must equal 1 since the two outcomes (select a Heart, and
NOT a heart) cover all the possible ways that something could happen. One or the other of those two events will happen. And so the sum of their probabilities must be 1.
6. Consider normal dice, the kind that have six faces, and on each face the number
represented is 1, 2, 3, 4, 5, or 6. A “fair die” is one where any one of the six faces is equally likely to land facing up. Suppose a fair die is tossed. The sample space for possible outcomes is {1, 2, 3, 4, 5, 6}. Find the probability that the face landing up is as specified.
a) P(a six) = b) P(an even number) = c) P(a seven) = d) P( a number from 1 through 6) = Solution: a) There is only one way the die can land with a six on top, and there are six ways total it can
land. So P(a six) = 1/6 b) There are three ways to land with an even number up (the numbers 2, 4, and 6), and
there are six ways total. P(an even number) = 3/6 = 1/2 . c) There is NO way to land with a seven up! P(a seven) = 0/6 = 0. d) The die will always land with a number from 1 through 6; there are six ways to do that.
P(a number from 1 through 6) = 6/6 = 1. Complementary Events In the example above for randomly selecting one card from a deck of 52 playing cards, one
event discussed was “selecting a Heart” and another event discussed was “selecting a card that is NOT a Heart”. These two events are called complementary events because they have these two properties:

Section 10-4: Probability
Page 10 – 37
• they have no overlap (that is, no simple event is in both of these events, no card selected would be in both of these events)
• the two events together comprise all the possible outcomes of the experiment (that is, no matter what card is selected, it is one or the other of these events).
You may recall from the chapter about Sets that two sets are called complementary when
they have properties similar to these.
When two events are complementary, the sum of their probabilities equals one. For a procedure, if event A and event B are complementary, then P(A) + P(B) = 1.
This fact can provide a simple way to find the probability of an event if you already know the
probability of its complementary event. For example, if events A and B are complementary, and you know the probability of event A, then the probability of event B must equal (1 minus the probability of event A) since the two probabilities together sum to one. That is:
If A and B are complementary events, then: P(A) = 1 – P(B) and P(B) = 1 – P(A).
In the example above concerning selecting one card from a deck of cards, we found
P(selecting a Heart) = !. We know that “selecting a card that is NOT a Heart” is a complementary event. And so we can find its probability by:
P(selecting a card NOT a Heart) = 1 – P(selecting a Heart) = 1 – ! = " . More examples: • If the chance of rain tomorrow is 30%, then the chance of no rain tomorrow is 70%
(since these events are complementary, so the chance of no rain is 1 – 30% = 100% - 30%). • If it is determined that the probability that a tossed shoe will land right-side-up is 62%,
then we can conclude that the probability the tossed shoe will land not right-side-up is 100% - 62% = 38%. (Note that this is not the probability the shoe will land upside down because the complement of landing right-side-up includes landing upside down and landing on its side.)
Experimental Probability Some probabilities can be estimated experimentally, meaning that we carry out a procedure to determine how frequently a certain event seems to happen. Here is an example. Suppose you have a friend who is a teacher and when she uses the eraser at the whiteboard she often drops it. She remarks to you “This eraser almost always lands upside down when I drop it.” But you don’t believe that; you think she is just complaining because she gets her hands dirty picking it up when it lands upside down. You could do an experiment to estimate “what is the probability that the eraser lands upside down when it is dropped”. How would you conduct the experiment? You would drop the eraser many times (perhaps two hundred times, or more). And each time you would record whether it landed upside down or right side up. Then you would calculate:

Section 10-4: Probability
Page 10 – 38
Probability the eraser lands upside down
Notice that the symbol “ ” was written in the line above rather than an equal sign “=”. That
is because a probability determined experimentally is always an approximation. If the experiment were conducted more times, the probability might be slightly different.
In finding an experimental probability, first one needs to be clear about what the “procedure”
is that is happening, and what the “event” is whose probability is being found. In the example above, the procedure was “an eraser is dropped”. The procedure is the thing that definitely does happen, and it might result in several different outcomes. The event is one or several of the possible outcomes that could occur. In the example above, “landing upside down” is the event whose probability is being approximated. Other possible events are that the eraser lands right-side-up or it lands on its edge. The general method in calculating the experimental probability of an event includes the following steps:
a) Conduct the procedure many times. b) While conducting the procedure, record how many times total the procedure is
conducted and how many times the result is the event being investigated. c) The probability of the particular event happening equals the fraction
Experimental probability is also called “relative frequency probability” since it is found by
determining the frequency that the event happened relative to the number of times the experiment was repeated.
Activities/Exercises on Experimental Probability 1. Toss an Object to Find the Probability it Lands Upside Down Each student will toss an object many times (about 20 to 50 times) and record whether it
lands right side up or upside down. Then results from all the students in the class will be combined so we can calculate the experimental probability that the object lands upside down, and also the probability it lands right side up.
• The object that everyone tosses could be a thumb-tack, or a whiteboard eraser, or a shoe,
or something else. • After the probabilities are found, add them: P(object lands upside down) + P(object lands right side up) = _________ Does that sum make sense? 2. Probabilities of Selecting Colorful Objects from a Bag · Prior to this activity, someone must put some colored tiles (or other objects) into opaque
paper bags. The objects must all be alike except for color. Each bag should have about 20 to 30 objects total consisting of some mix of three or four different colors.
· Two students work together with a paper bag that contains some tiles of several different colors. Do NOT look in the bag!

Section 10-4: Probability
Page 10 – 39
· Without looking in the bag, one person should draw out one of the objects and the other person should promptly record its color and mark the “tally” column of the table below. Then return the object to the bag and mix up the objects in the bag.
· Repeat this about 70 times or more. · After conducting the experiment, fill out the columns: “# tallied”, “fraction of whole”, and “percent of whole”. Use a calculator if you like. Find the sums of the last columns and record them in the bottom row. • Questions: a) Based on this experiment, if you reach in the bag without looking and draw out one
object, what is the probability that it is the first color listed in the table? b) Based on this experiment, what do you estimate to be the percentage of objects in the
bag that are the second color listed in your table? c) What should be the sum of the percents? Is the sum in your table exactly equal to
that? If not, can you explain why? • In the next table, copy the colors and the “percent of whole” information from the previous
table. Then look in the bag to find the actual numbers of the various colors and calculate the
actual percent of the objects for each color. Record the results in this table in the “After Experiment” column.
Color tally # tallied fraction of whole
percent of whole
total tally: sum of fractions: sum of percents:
Experimental Probability
After Experiment
Color Percent of whole
Actual percent
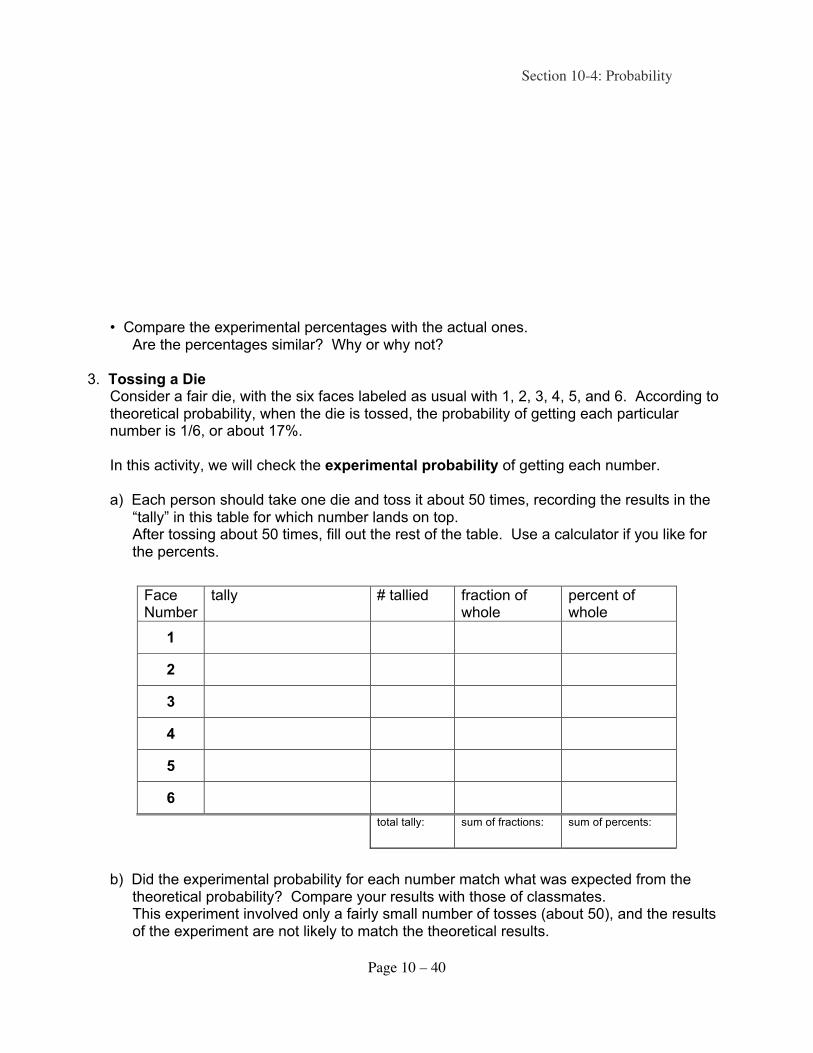
Section 10-4: Probability
Page 10 – 40
• Compare the experimental percentages with the actual ones. Are the percentages similar? Why or why not? 3. Tossing a Die Consider a fair die, with the six faces labeled as usual with 1, 2, 3, 4, 5, and 6. According to
theoretical probability, when the die is tossed, the probability of getting each particular number is 1/6, or about 17%.
In this activity, we will check the experimental probability of getting each number.
a) Each person should take one die and toss it about 50 times, recording the results in the “tally” in this table for which number lands on top.
After tossing about 50 times, fill out the rest of the table. Use a calculator if you like for the percents.
b) Did the experimental probability for each number match what was expected from the theoretical probability? Compare your results with those of classmates.
This experiment involved only a fairly small number of tosses (about 50), and the results of the experiment are not likely to match the theoretical results.
Face Number
tally # tallied fraction of whole
percent of whole
1
2
3
4
5
6
total tally: sum of fractions: sum of percents:

Section 10-4: Probability
Page 10 – 41
c) The results for everyone in the class should be combined into one table. The “# tallied” for each person should be added, for each face number. A table such as the one above should be filled out for the entire class’s combined results (but skip the “tally” column). When the total number of tosses approaches 1000, then the experimental results should more closely match the theoretical.
4. Tossing Two Dice and Noting the Sum In this activity, two dice will be tossed and the numbers on top will be added together. That
sum will be recorded. The experimental probability of getting various sums will be determined.
Before starting, note: what is the smallest possible sum from two dice? It is 2 (when adding
a 1 on each die). The largest possible sum is 12 (when adding a 6 on each die).
a) • Work with a partner. Toss the two dice about 25 to 30 times while your partner records the sum with a tally mark in this table. Then switch roles: while the partner tosses the two dice 25 to 30 times, you record the tally marks in the table.
• Then fill out the rest of the table.
b) Describe the results from the experiment. (Does it look like the probability is the same for each sum? If so, why? If not, which
sums are more probable? Why is that?)
Sum on 2 dice
tally # tallied fraction of whole
percent of whole
2
3
4
5
6
7
8
9
10
11
12
total tally: sum of fractions: sum of percents:

Section 10-4: Probability
Page 10 – 42
c) The results for everyone in the class should be combined into one table. The “# tallied” for each person should be added, for each sum.
Sum on 2 dice
# tallied fraction of whole
percent of whole
2
3
4
5
6
7
8
9
10
11
12
total tally: sum of fractions: sum of percents:

Section 10-4: Probability
Page 10 – 43
Section 10-4: Exercises on Probability
1. Suppose a bowl contains 22 orange jelly beans, 40 red jelly beans, and 8 green jelly beans. a) If you reach in without looking and take out one jelly bean, what is the probability that it
will be red? (hint: how many different red are there? How many different total are there?) b) If that first jelly bean you took out was red, and you eat it, then you reach in again without
looking and take out a another jelly bean, what is the probability that one is red? 2. Consider normal die with the six faces having a 1, 2, 3, 4, 5, or 6 represented. The die is fair.
Suppose a fair die is tossed. Find the probability that the face landing up is as specified. a) P(a three) = b) P(a ten) = c) P(a one) = d) P(an odd number) = e) P( a number less than 20) = 3. Imagine that a tiny grain of sand was dropped onto the figure on the left, and it
had an equal chance of landing anywhere on the figure. Find the probability it lands on…
a) white b) grey c) black d) grey or black e) white or grey f) white, grey, or black g) purple 4. For each of the following, suppose there is a normal deck of playing cards, with 52 cards as
described in this section. Suppose the cards are thoroughly shuffled, and then someone randomly selects one card. Find these probabilities.
a) P(the person selects the King of Hearts) = b) P(the person selects a Seven) = c) P(the person selects a Club) = d) P(the person selects a King, Queen, or Jack) = e) P(the person selects a number card less than the number six) = f) P(the person selects a red card) = g) P(the person selects a Jack) + P(the person selects a card not a Jack) = 5. A penny and a nickel are tossed (you can think of them as being tossed at the same time).
Each coin can land heads or tails. a) What is the sample space of outcomes? That is, list all the ways that the two coins might
land. b) What is the probability that both coins land heads?

Section 10-4: Probability
Page 10 – 44
6. Consider the spinner here which has sections labeled 1 through 8, as shown. The arrow can be flicked and it will spin freely and may stop in any direction.
When someone spins the arrow, find the following probabilities that the arrow will land as specified. a) P(lands on the number 4) = b) P(lands on an even number) = c) P(lands on 1, 2, 3, or, 4) = d) P(lands on a number greater than 6) = e) P(lands on 17) =
f) P(lands on a number less than 17) = 7. Make a sketch of a spinner that would have the following properties: • the number of sections is 4 • the sections are not all the same size • each section is labeled with a number from 1 through 4 • when the arrow spins, the probability of landing on various places is as follows: P(lands on 1) = # P(lands on 3) = 1/8 P(lands on an even number) = 3/8 8. Make a sketch of a spinner that would have the following properties: • the number of sections is 6 or fewer • the sections might be all the same size, or they might be different sizes • each section is labeled with a number • the numbers used as labels are not “all in a row” (they are simply some numbers, with other
numbers not included as labels). • when the arrow spins, the probability of landing on various places is as follows: P(lands on an even number) = # P(lands on a number greater than 20) = 0 P(lands on the number “10”) = 1/6 P(lands on a number less than 10) = # Note: there are many different answers that are possible for this problem. 9. A student tossed a thumb tack 1000 times and found the experimental probability that the
thumb tack lands point up was 56%. What is the probability the thumb tack will not land point up? (Hint: think about complementary events.)
10. A very persistent student tossed three dice 1000 times, and each time recorded the sum on
the dice. He found that the experimental probably that the sum equaled 3 was 6/1000. What is the experimental probability that the sum does not equal 3?

References
References
Many of these books are quoted in the text. All of them are good reference books.
Baratta-Lorton, Mary. Mathematics Their Way: An Activity-Centered Mathematics Program for Early Childhood. 20th Anniversary Edition. Addison-Wesley Publishing Company, 1995. Beckmann, Sybilla. Mathematics for Elementary Teachers. Pearson-Addison Wesley, 2005. Bennett, Albert B., Jr., and L. Ted Nelson. Mathematics for Elementary Teachers: A Conceptual Approach. 7th ed. Boston: McGraw Hill Higher Education, 2007. Burns, Marilyn. About Teaching Mathematics: A K-8 Resource. 2nd ed. Sausalito, CA: Math Solutions Publications, 2000. Clements, Douglas H.. "Major Themes and Recommendations." Engaging Young Children in Mathematics: Standards for Early Childhood Mathematics Education. Ed. Douglas H. Clements & Julie Sarama. Mahwah, NJ: Lawrence Erlbaum Associates, Publishers, 2004. Copley, Juanita V.. The Young Child and Mathematics. Washington, DC: National Association for the Education of Young Children, 2000. Kennedy, Leonard M., Steve Tipps, and Art Johnson. Guiding Children's Learning of Mathematics. 11th. Thomson Wadsworth, 2008. Ormrod, Jeanne Ellis. Human Learning: Principles, Theories, and Educational Applications. New York: Merrill Publishing Company, 1990. Overholt, James L., Jackie White-Holtz, and Sydney S. Dickson. Big Math Activities for Young Children: for Preschool, Kindergarten and Primary Children. Delmar Publishers, 1999. Principles and Standards for School Mathematics. National Council of Teachers of Mathematics, 2000. Reid, Margarette S.. The Button Box. Puffin Books, 1990. Seefeldt, Carol, and Alice Galper. Active Experiences for Active Children: Mathematics. 2nd ed. Columbus, OH: Pearson-Merrill Prentice Hall, 2008. Singer, Dorothy G., and Tracey A. Revenson. A Piaget Primer: How a Child Thinks. revised. New York: Plume, 1996. Smith, Susan Sperry. Early Childhood Mathematics. 3rd ed. Pearson -Allyn and Bacon, 2006. Willis, Clarissa. "Young Children with Autism Spectrum Disorder: Strategies That Work." Young Children: Journal of the National Association for the Education of Young Children Jan 2009: 81-89.

References

Appendix
Appendix page - 1
Appendix
In this appendix are pages that you may want to copy and use.
Page Topic
A-2 Decimal grids
A-3 10 x 10 grid squares (Decimal or Percent grids)
A-4 Larger 10 x 10 squares (Decimal or Percent grids) A-5 Geoboard grids, size 5 x 5
A-6 Geoboard grids, size 3 x 3
A-7 Inch Ruler and Centimeter Ruler
A-8 One-inch squares A-9 Centimeter squares
A-10 Pattern or “net for a box
A-11 20 x 20 centimeter square grid

Appendix
Appendix page - 2
Decimal Grids

Appendix
Appendix page - 3
10 x 10 grid squares (Decimal or Percent Grids)

Appendix
Appendix page - 4
Larger 10 x 10 grids (Decimal or Percent grids)

Appendix
Appendix page - 5
Geoboard Grids, size 5 x 5 – in case you want to use them.

Appendix
Appendix page - 6
Geoboard Grids - 3 x 3 – in case you want to use them.

Appendix
Appendix page - 7
Rulers

Appendix
Appendix page - 8
One Inch Squares

Appendix
Appendix page - 9
One Centimeter Squares

Appendix
Appendix page - 10
Pattern or “net” for a box
tab
tab
t
a
b
t
a
b

Appendix
Appendix page - 11
20 x 20 cm grid

Appendix
Appendix page - 12
Blank Page

Answers to Exercises
Answers page - 1
Answers to Exercises Answers to most of the Exercises are below.
As a general guideline: Do problems BEFORE checking answers! If your answer differs from one provided here, check your work. Talk with a classmate, tutor, or instructor
about the problem.
Chapter 1: Answers to Exercises on Problem Solving Answer to Problem Solving Strategy “C. Guess, Check Revise:” The middle number can be 1, 3, or 5. The middle number is always odd. This allows two evens and two odds left over for the other circles. 1) a) 10 people x x x x x x 14 people
x x x x x x x x b) 4 ways c) 12 and 15 d) Songhi had 32 and Trina had 20 at the start. f) one way Tomorrow they will each have 50. is this. e) Chris drove 195 miles. There are other ways.
Note: For each problem below you should also state the strategy YOU used to solve it (that will be different for different people).
2) 22 3) 10 people, 3 goats 4 a) 15 5a) 171 [from 19 x 18, then take half] 5b) 2850 [from 76 x 75, then take half] 5c) 525 [from 70 x 15, then take half. 70 is from 28 + 42] 6) a) after 3 minutes, before 4 minutes; about 3 ! minutes b) 42 steps 7) 4 on bikes, 7 on tricycles 8) 13 9) ate 6, made 30 10) 3 shelves 11) 7 trees 12) One possibility is 12, 10, 18 in the vertical and 14, 10, 16 in the horizontal 13) 24 cups 14 a) 5 people, 7 dogs 15, 4b, and 14b) – Challenge classmates to solve your problems. Do you use the same methods? Do you get the same answers?
Section 2-2: Answers to Exercises on Seriation, Classification, and Sets 1) a) 6 b) 1/3 c) {small red hexagon, large red hexagon}; 2 items d) all of the red pieces and all of the hexagon pieces; 12 items total e) yes f) no (for example, the small blue triangle is not in the set of yellow triangles) g) answers can vary. One example is “the set of large triangles” h) the set of yellow squares = {large yellow square, small yellow square}; 2 items i) {large red hexagon}; 1 item j) answers can vary. One example: The set of squares and the set of triangles. k) 16 2) do play the game 3) a) the Algebra standard, or the Patterns, Functions, and Algebra standard 3b) “sort, classify, and order objects by size, number, and other properties 4 a) classification b) seriation c) seriation d) classification 5 a) {Carla, Lisa, Mary} b) {Carla, Lisa, Mary} c) {Carla, Lisa, Mary, Jeon} d) {Carla, Lisa, Jeon} e) {Carla, Lisa} f) {Carla, Lisa, Mary, Jeon} g) {Mary, Jeon} h) {Mary}; intersection i) { } - nothing is in this set - it is the empty set.
Section 2-3: Answers to Exercises on Patterns and Sequences 1) a, b, c) answers vary d) – a is visual, b is auditory, c is kinesthetic 2) Algebra 3 a) i) 10, 12, 14 ii) arithmetic b) i) 22, 27, 32 ii) arithmetic c) i) 21, 25, 29 ii) arithmetic 3) d) i) 38, 36, 40 ii) neither e) i) 32, 64, 128 ii) geometric f) i) 64, 32, 16 ii) geometric – times ! g) i) 32, 35, 38 ii) arithmetic h) i) 39, 32, 24 ii) neither i) i) 22, 20, 25 ii) neither j) i) 28, 26, 24 ii) arithmetic: add -1, which is the same as subtract 1 4) a) 2, 3, 5, 8, 13, b) 4, 6, 10, 16, 26 c) 7, 11, 18, 29, 47 5 a) 6
th 7
th
x
x x x
x
x
x x x
x

Answers to Exercises
Answers page - 2
5 b) 3rd
!parallelogram, 4th !triangle, 5
th !parallelogram, 6th !triangle [odd ! parallelogram, even !
triangle] c) 37
th !parallelogram, 94
th ! triangle d)
6) a) a sketch b) 3, 6, 9.12, 15, 18 c)
Position of block
In the pattern Shape of block
Position of block
In the pattern Shape of block
1st
hexagon What shape is in the position number of
“one past a multiple of 3”? hexagon 2
nd triangle 4
th hexagon
3rd
square 7th
hexagon 4
th hexagon 10
th hexgon
5th
triangle 28th
hexagon
6th
square What is true of a position number that has a
triangle in it? 2 past a multiple of 3
7th
hexagon 2nd
triangle 8
th triangle 5
th triangle
9th
square 11th
triangle What type of position number has a square in it? _multiples of 3
29th
triangle
12th
square Putting together all this information, fill in
the shapes in these positions: 15th square 21
st square
18th
square 47th
triangle Since you know where the squares are, can you figure out the following?
67th
hexagon
30th
square 90th
square 31
st hexagon 98
th triangle
32nd
triangle 303rd
square 33
rd square
1000th
hexagon
Section 2-4: Answers to Exercises on Patterns and Function Rules
1) a and b) compare with classmates c) table below d) 20th figure is 3 columns of 20 each; down, up down. 3 • 20 = 60 tiles
Figure # What do I see? Number of tiles in figure
(thinking it out) # of tiles
1 3 blocks zigzagged 3 3 2 3 columns of 2; one down, one up, one
down 2 + 2 + 2 = 2 * 3 6
3 3 columns of 3; down, up, down 3 + 3 + 3 = 3 * 3 9 4 3 columns of 4 each; down, up down 4 • 3 12 5 3 columns of 5 each; down, up, down 5 • 3 15 6 3 columns of 6 each 6 * 3 18
10 3 columns of 10 each 10 • 3 30
Which figure: 1st
2nd
3rd
4th
5th
6th
10th
11th
42nd
43rd
61st
62nd
Number of parallelograms
1 1 2 2 3 3 5 6 21 22 31 31
Number of triangles
0 1 1 2 2 3 5 5 21 21 30 31
Total number of blocks
1 2 3 4 5 6
10 11
42 43
61 62

Answers to Exercises
Answers page - 3
n 3 columns of n each n • 3 3n
2) a and b) compare with classmates c) table that follows
Figure # What do I see? Number of tiles in figure
(thinking it out) # of tiles
1 1 block 1 1 2 column of 1, then of 2
OR bottom row of 2, then 1 on top 1 + 2 3
3 columns of 1, 2, and 3 OR rows of 3 on bottom, then 2, 1
1 + 2 + 3 6
4 columns of 1, 2, 3, and 4; OR rows of 4, 3, 2, 1 going up
1 + 2 + 3 + 4 10
5 columns of 1, 2, 3, 4 and 5; OR rows of 5, 4, 3, 2, 1 going up
1 + 2 + 3 + 4 + 5 15
6 1 + 2 + 3 + 4 + 5 + 6 21 7 1 + 2 + … + 6 + 7 28
10 1 + 2 + … + 9 + 10 55 n 1 + 2 + … + (n – 1) + n
d) 20
th figure as columns of size 1, 2, 3, etc. through 20. # of tiles is 1 + 2 + … + 19 + 20 = 210
“staircase method” : a staircase from 1 to 20. A second copy turned upside down and put on first one. Result is a rectangle 20 wide and 21 high – so 20 • 21 = 420. Half of it is one staircase ! 210
3) answers vary. Check with classmates. 4) b) The output is always 11 more than the input. So, when input number is n, output is n + 11. c) i) 22 ii) 35 + 11 = 46 iii) 120 + 11 = 131
5) a) 26 is the result after subtracting 4. So subtract4 from 30. Get the 30 from 3•10
5) a)
Input Output
1 12 2 13 3 14 4 15 5 16 6 17 7 18
Input Output
2 3•2 – 4 = 2 3 3•3 – 4 = 5 4 3•4 – 4 = 8 8 3•8 – 4 = 20
12 3•12 – 4 = 32 10 26
Input Output
2 12 3 3•5+2 = 17 5 27 7 37 = 35 + 2 8 42
10 52 = 50 + 2

Answers to Exercises
Answers page - 4
6)
b) take the input, double it then add 3. When the input is number n, the output is 2•n + 3 c) i) 2 • 14 = 3 = 31 ii) 2 • 27 + 3 = 57 iii) 2 • 140+ 3 = 283
7) b) the output is 2 less than the input. When the input number is n, the output is n – 2
8) b) the output is 4 times as big as the input. When the input number is n, the output is 4•n c) i) 4 • 9 = 36 ii) 4 • 40 = 160 iii) 4 + 110 = 440 9) b) the output is the input multiplied by itself. That’s the same as the saying the input is squared to get the output. When the input number is n, the output is n•n or n
2.
c) i) 121 ii) 2500 iii)10,000
10)
Input Output
1 5 2 7 3 9 4 11 5 13 6 15 7 17
Input Output
3 1 7 5 8 6
14 12 5 3
26 24 17 15
Input Output
1 4 2 8 3 12 4 16 5 20 6 24 7 28
Input Output
1 1 2 4 3 9 4 16 5 25 6 36 7 49
Input Output
1 7 2 11 3 15 4 19 5 23 6 27 7 31

Answers to Exercises
Answers page - 5
b) multiply the input by 4, then add 3. When the input number is n, the output is 4•n + 3. c) i) 51 ii) 4•70 + 3 = 283 iii) 4•120 + 3 = 483 11) Compare with classmates
Section 3-1: Answers to +Exercises on Ancient Numeration Systems (and Current) 1) Hindu-Arabic 2) a) ten b) 0, 1, 2, 3, 4, 5, 6, 7, 8, 9 3) a) Yes it is positional. The position within the numeral that a digit is in means something. For example, 723 is not the same as 237. b) 0 is essential 4) a) i) 6 tens ii) 7 million iii) 3 hundred thousand b) i) 83,049 ii) 6,042,758 5) a) Check this in class with other students. b) and c) – answers will vary 6) 7) 8) 9)
10) CLVIII (110 + 48 = 158) 11) DLXIX (664 – 115 = 549) 12) XXXVII (28 + 9 = 37)
13) LX (15 • 4 = 60)
14) (33 + 17 = 50) 15) (30 – 6 = 24) 16) (40 x 4 = 160)
17) (25 • 3 = 75) 18)a) Addition is easy in the Egyptian system because all of the symbols can be put together – and then if there are ten of some symbol, it is replaced by the “next higher” symbol. Subtraction is also fairly easy. [This was one possible answer – among many.] 18) b) Many people find calculations in the Roman system to be very difficult.
Section 3-2: Answers to Exercises on Counting and Children 1) one-to-one correspondence 2) conservation of number 3) the required skills are listed in the section.
Sections 4-1 and 4-2: Answers to Exercises on Addition and Subtraction of Whole Numbers
1) answers vary (see the beginning of chapter 4) 2) a) the child might put all the blocks together and then count them, going from 1 to 11. b) the child might say “this pile has 8. So now 9, 10, 11. There are 11 blocks.” 3) answers vary. 4) a) 968 b) 1147 c) 3170 d) 1823 e) 12678 5) a) 88 b) 430 c) 147 d) 65 e) 83 f) 99 g) 372 h) 142 i) 267 6) a) 124 b) 205 c) 676 d) 847 e) 2423 7) a) 68 b) 400 c) 103 d) 13 e) 218 f) 54 g) 8 h) 54 i) 778 8) Compare drawings with classmates.
a) Take Away model b) Comparison model c) Missing Addend model 9) answers vary. Check with classmates. 10) a) 0 + 8, 1 + 7, 2 + 6, 3 + 5, 4 + 4, 5 + 3, 6 + 2, 7 + 1, 8 + 0 b) 9 ways 11)
Number Ways for two whole numbers to add to the Number # of ways

Answers to Exercises
Answers page - 6
0 0 + 0 1
1 0 + 1, 1 + 0 2
2 0 + 2, 1 + 1, 2 + 0 3
3 0 + 3, 1 + 2, 2 + 1, 3 + 0 4
4 0 + 4, 1 + 3, 2 + 2, 3 + 1, 4 + 0 5
5 0 + 5, 1 + 4, 2 + 3, 3 + 2, 4 + 1, 5 + 0 6
6 0 + 6, 1 + 5, 2 + 4, 3 + 3, 4 + 2, 5 + 1, 6 + 0 7
7 0 + 7, 1 + 6, 2 + 5, 3 + 4, 4 + 3, 5 + 2, 6 + 1, 7 + 0 8
8 0 + 8, 1 + 7, 2 + 6, 3 + 5, 4 + 4, 5 + 3, 6 + 2, 7 + 1, 8 + 0 9
20 no need to fill in this box 21
37 no need to fill in this box 38
172 no need to fill in this box 173
12) a) 0 blocks, 7 flats, 3 longs, 4 units = number 734 b) 1 blocks, 5 flats, 5 longs, 1 units = number 1,551 c) 0 blocks, 4 flats, 8 longs, 5 units = number 485 d) 1 block, 3 flats, 2 longs, 8 units = number 1,328 13) compare with classmates 14) compare with classmates
Section 4-3: Answers to Exercises for Multiplication of Whole Numbers 1.
x 0 1 2 3 4 5 6 7 8 9
0 0 0 0 0 0 0 0 0 0 0
1 0 1 2 3 4 5 6 7 8 9
2 0 2 4 6 8 10 12 14 16 18
3 0 3 6 9 12 15 18 21 24 27
4 0 4 8 12 16 20 24 28 32 36
5 0 5 10 15 20 25 30 35 40 45
6 0 6 12 18 24 30 36 42 48 54
7 0 7 14 21 28 35 42 49 56 63
8 0 8 16 24 32 40 48 56 64 72
9 0 9 18 27 36 45 54 63 72 81
2) i) B, E, G; ii) A, H, K, L; iii) C, J; 3) showing partial products: 13 4) showing partial products: 22 x 7 x 16 21 12 70 120 91 20 200 352 5) a) 136 b) 476 c) 300 d) 684 e) 918 f) 0 6) answers vary 7) 6500 words; 8) 667 lbs; 9) 111 mins
10) Here are possible explanations. Yours may differ – there are many correct approaches.

Answers to Exercises
Answers page - 7
a) 15 x 9 is close to 15 x 10, which equals 150. But ten 15s are more than nine 15s. It is 15 too large. So subtract 15 from 150: 150 – 15 = 135.
b) Think of 50 as ! x 100. Then 50 x 18 = ! x 100 x 18 = ! x 1800 = 900 c) 16 equals 10 + 6. So 7 x 16 = 7 x (10 + 6) = 7 x 10 + 7 x 6 = 70 + 42 = 70 + 40 + 2 = 110 + 2 = 112.
Section 4-4: Answers to Exercises for Division of Whole Numbers
1) a) quotient b) 42 c) 7 d) 6 2) a) , =7 b) 35 ÷ 4 = 9, =9 c) , 23 ÷ 46 = .5
3) a) 4 • 9 = 36 b) 108 ÷ 9 = 12 and 108 ÷ 12 = 9
4) a) O O O O O O O O O O O O O O O O O O O O O O O O O O O O O O , each gets 3
b) O O O O O O O O O O O O O O O O O O O O O O O O O O O O O O , # people is 10 5) a) i) repeated subtraction ii) • • • • • • • • • • • • • • • • • • • • • • • • • • • • • • " subtract 6 at a time – we
can do that five times iii) five children can do the art project b) i) sharing equally - divide the quilt blocks in to four piles of equal size, one for each member: ii) " " " " " " " " " " " " iii) each quilter gets six quilt blocks to use. " " " " " " " " " " " " •••••• •••••• •••••• c) i) share equally - share the plants equally among the five rows ii) •••••• •••••• 5 rows iii) 6 plants will be in each row d) i) repeated subtraction – subtract 3 balls, then subtract 3 again the next day, etc. ii) """ """ """ """ """ """ iii) Rick can practice six times before he runs out of balls. 6) answers vary 7) & 8) & 9) compare with classmates 10) a) 9 b) 5 c) 4 d) 6 e) 7 f) undefined g) 3 h) 7 i) 0 j) 8 k) 7 l) 6 m) 9 n) 7 o) undefined p) 7 q) 3 r) 6 s) 3 t) 0 u) 8 v) 9 w) 9 x) 7 11) re-read the text about this 12) a) 200 ÷ 28 = 7.143 7 rows are not enough. Set up 8 rows, and there will be some extra chairs b) 44 minutes divided evenly among 11 songs ! 44 ÷ 11 = 4 The songs are 4 minutes long, on average c) number of eggs needed is 40 • 2 + 25 = 105. A dozen is 12 eggs. 105 ÷ 12 = 8.75 So, 8 dozen is not
enough. Jyoti should buy 9 dozen eggs d) 3 • ? = 400 ! 400 ÷ 3 = 133.33 They must sell 134 boxes to make at least $400. 134 boxes sold will
give them $402. e) 2,500 ÷ 300 = 8.333 The trip will take about 8 1/3 days. 13) a) 413 b) 3.8 c) 1252 d) 44.5 e) 6.5 f) 0.2 g) 8.5 h) 0.4
Section 4-5: Answers to Exercises for Exponents, Powers of Ten, and Order of Operations
1 a) 125 b) 10,000 c) 81 d) 64 e) 81 f) 0 g) 8 h) 9 i) 1 j) 1 2) a) 170 b) 30,000 c) 2450 d) 600,000 e) 342,700 f) 8400 g) 785,000 h) 87,990,000
i) 15,000 3) a) 170 b) 18 c) 9 d) 81 e) 7 f) 32 g) 127 h) 84,006 i) 90,000
Sections 5-1 and 5-2: Answers to Exercises on Fraction Introduction and Multiplication
1) a) 7/14 = ! are triangles. b) 4/14 = 2/7 are circles. 2) Many answers are possible. Here are two possible answers. Children may need to cut a piece of paper
into 5 or 10 strips to make hair for a scarecrow in a construction project. This involves the fraction 1/5. Or they may need to divide a box of 24 crayons among 4 students for a coloring project.
3) i) These are sample answers for #3

Answers to Exercises
Answers page - 8
ii)
iii) ! ! ! ! ! ! ! ! ! ! ! ! 4)
4)
5) (a) i) 19/8 ii) 47/9 iii) 3/2 (b) i) 3 3/8 ii) 3 6/7 iii) 5 2/9 6) compare with classmates
7) a) b) c) d) e) f)
8) a) greater b) less c) neither! It is equal to d) less e) less f) greater g) greater
Sections 5-3 and 5-4: Answers to Exercises on Equivalent Fractions and Division
1) a) b) c) d)
2) a) 8/42 = 4/21 b) 9/72 = 1/8 c) 24/36 = 2/3 d) 36/63 = 4/7 3) a) 15/56 b) 1/20 c) 16/35 d) 9/20 e) 5/9 f) 9/5 g) 0 h) 5/7 i) 8/125 j) 72/11 k) undefined l) 28/23 m) 54/7 n) 5/36 o) 0 p) undefined 4) answers vary 5) The product of two whole numbers greater than 1 is a number that is larger than either of the two factors.
For instance, 2x3 = 6. The concept of repeated addition shows why this is. However, a number times 1 is the number. For example 7x1=7. And 7 is not larger than 7; they are exactly equal. Zero times a number is zero; for instance, 2x0 = 0. Since 0 is less than 2, this proves the statement false. Finally, a whole number multiplied by a fraction is also smaller than the whole number. For example, 2 x ! = 1.
6) These diagrams are possible answers (your diagram may look different) a) " This diagram is of “one whole thing” with 6/8 shaded in Then pieces of size # are subtracted away from the 6/8. How many times can such pieces be subtracted? 3 times.
1 2 3 4 5 6 7

Answers to Exercises
Answers page - 9
So, ÷ = 3. Also: ÷ = x = = 3
b) This diagram is “one whole set of 15 objects”. 8/15 of the set is shaded. Then pieces of size 4/15 are subtracted away from the 8/15. How many times can 4/15 be taken away? Two times.
So ÷ = 2. Also ÷ = • = = 2.
7) a) How many 1/8 are there in $? This means answering this question:
. Since 4 x 2 equals 8, we multiply 3 by 2 to get 6. There are 6/8 in $. Therefore Janna will
need to fill the 1/8 cup 6 times.
b) This asks us to find three-fifths of 20. .
So the toddler has 12 teeth.
c) This asks us to find two-thirds of 24. .
So 16 members must vote yes to change the by-laws.
d)
e) pieces
f) How many times can 3/8 of a pizza be taken away from 4 pizzas? This is the Repeated Subtraction concept of division.
That is 4 ÷ = x = = 10 So 10 children can each have 3/8 of a pizza.
Section 5-5: Answers to Exercises on Addition and Subtraction of Fractions 1a) 1/3 1b) $ 1c) 1/3 1d) 3/8 1e) 5/9 1f) 3/10 1g) 13/12 or 1 1/12 1h) 1/30 1i) 23/12 or 1 11/12 1j) 1/30 2) answers vary. A few possibilities are: 1/3 + 1/6 = 1/2 or 1/4 + 1/8 + 1/8 = ! 3 a) answers vary. One possibility: 7/8 – 3/8 b) answers vary. One possibility 1 – 2/3 c) answers vary. One possibility: 7/12 – 1/3 = 7/12 – 4/12 = 3/12 = 1/4 4 a) 4/7 miles are left b) 19/12 or 1 7/12 pounds all together c) 31/20 or 1 11/20 tons total 5) compare answers with classmates.
Section 5-6: Answers to Exercises on Comparing Fraction Sizes 1a) < since 5/12 is less than half, while 8/14 is more than half 1b) < 1c) > since 11/10 is more than 1 but 7/8 is not 1d) > since 9/10 = 27/30 and 5/6 = 25/30 1e) > since 4/7 = 36/63 and 5/9 = 35/63 1f) > since 34 = .75 and 7/10 = .7 1g) < since 21/100 is less than half and 6/7 is more than half 1h) = since 6/24 reduces to 1/4 1i) < since 3/17 is less than half while 49/50 is way more than half 2) #, !, 5/8, $, 7/8 3a) cereal 3b) toast and juice 4) cannot be answered since the number of people in each class is not known (the “one whole” of the
fractions is not known) 5) For cereal, 3/5 • 120 = 72. For granola bars, 2/3 • 114 = 76. So more granola bar boxes were
destroyed.
Section 5-7: Answers to Exercises for Mixed Number Operations

Answers to Exercises
Answers page - 10
1a) 11 1b) 1 1c) 6 1d) 7
1e) 1f) 3 1g) 16 1h) 13
2) 8 miles 3) 32 feet 4) 16 pounds 5) 24 children (and there is some yarn
remaining)
Section 6-1: Answers to Exercises on Concepts and Representation of Decimals 1) a) 1 b) 7 c) 9 d) 3 e) ten-thousandths f) ones or units g) hundredths 2) a) 320.38 b) 320. 038 c) 7.146 d) 0.0208 3) a) Ninety-four and seventy-eight hundredths
b) Three thousand six and five thousandths c) Seventy-two ten-thousandths d) One and nine hundredths
4) a) 3,498.6 b) 3500 c) 3,498.62 d) 3,499 e) 7.289 f) 7.29 g) 7 h) 36,000 i) 487,500 j) 487,512.73 k) 488,000 l) 487,512.726 m) 500,000 5) 27.329 6) a) 0.105 < 0.305 b) 0.008 < 0.08 c) 0.0989 < 0.101 d) 0.2653 < 0.2663 7) a) B C D A (.05 > .046 > .007 > .0037) b) X W Z Y (1.002 > 1.0003 > .0246 > .008) 8) a) 1 b) 0 c) 0 d) 0 e) 1 f) 1 g) .5 h) 0 i) 1
Sections 6-2 and 6-3: Answers to Exercises on Operations with Decimals 1) check answers with classmates 2) check answers with classmates
3a) 1171.85 3b) 8624.284 3c) 350.32 3d) 44.2642 3e) 21.672 3f) 19.313 3g) 14.365 4.a) product = 0.18 b) product = 0.36 The shaded rectangle could be placed someplace else on the grid, or could reverse length and width. 5) a) 0.20 is divided into 5 equal b) From 0.35, pieces of size 0.07 c) From 0.35, pieces of size 0.05 size parts. The size of each are taken away repeatedly. Are taken away repeatedly.
part is the quotient. Quotient is the number of pieces Quotient is the number of pieces Quotient = .04 taken away. Quotient = 5. taken away. Quotient = 7.

Answers to Exercises
Answers page - 11
6) a) 0.245 b) 64.78 c) .0128 d) .0036 e) 0.525 f) 0.0816 g) .382 h) 1.8 i) 1.55
7a) 700 7b) 82,000 7c) 723 7d) 5672.34 7e) 48,200 7f) 70,000 7g) 567,234,000 7h) 24,630 7i) 0.076
Section 6-4: Answers to Exercises on Converting between Decimals and Fractions 1) a) 7/10 b) 6/10 = 3/5 c) 29/100 d) 55/100 = 11/20 e) 371/1000 f) 8/1000 = 1/125 g) 3 47/100 = 347/100 h) 6 127/1000 = 6127/1000 i) 7/10,000 j) 1234/10,000 = 617/500 k) 9 9/1000 = 9009/1000 2)
Fraction Decimal
0.5
0.25
0.75
0.2
0.4
0.6
0.8
0.125
0.375
3) a) b) c) d) e) 4.625 f)
4) a) 1/3 b) 4/9 c) 4/99 d) 12/99 = 4/33 e) 72.4/99 = 724/990 = 362/495 f) 155/333

Answers to Exercises
Answers page - 12
Section 6-5: Answers to Exercises on Applications of Decimals 1) 0.627 pounds 2) $16.62 3) $210.6 4) $602.7 5) $17.81 6) a) $1.134 (rounded to the nearest penny = $1.13) b) It costs $4.816 more ($4.82 rounded). This may seem small, but over 5 years, the cost of the frost-free refrigerator costs $289.20 more. 7) a) 5.19 seconds faster b) If Sullivan maintained his pace, he would swim 200 m in 94.1 seconds, which is 1:34.1. This is 8.86 seconds faster than Phelps’ winning time. 8) discuss with classmates 9) a) 1.1 b) 0.2 c) 4.6 d) 1.3 10) a) $19.77 b) $4.72 c) $7.08
Section 7-1: Answers to Exercises on Concept and Representation of Percents 1. per hundred, or out of 100
2. a) 17/100 c) 83% 3. b) 32% c) 100% 4. a) i) 50% ii) 50% b) i) 30% ii) 70% c) i) 14% ii) 86% d) i) 2% ii) 98% 5. a) 27% b) 50% c) about 52% to 59% 6) i) a) 12 c) 132 d) 132 e) 1068 f) 89% ii) b) 3 c) 300 d) 300 e) 70%
7) a) i) ii) 50% iii) 50% b) i) ii) 66 % iii) 33 % c) i) 1 ii) 100% iii) 0%
d) i) ii) 25% iii) 75% e) i) ii) 40% iii) 60% f) i) ii) 33 % iii) 66 %
g) i) ii) 75% iii) 25% h) ii) 80% iii) 20% j) ii) 60% iii) 40%
k) 1/5 ii) 20% iii) 80% 8) Examples vary. Show your examples to classmates.
Section 7-2: Answers to Exercises on Converting between Percents, Fractions, and Decimals 1)
Fraction Decimal Percent
0.07 7%
0.31 31%
= 0.85 85%
0.22 22%
0.6 60%
0.01 1%
0.25 25%
0.5 50%

Answers to Exercises
Answers page - 13
0.75 75%
0.2 20%
0.4 40%
or 0.357 35.7%
or 0.062 6.2%
or 0.035 3.5%
1 or 1/1 1 or 1.0 100%
3 or 3/1 3 or 3.0 300%
5 or 5.0 500%
or 1.5 150%
2) a) i) 28% ii) 154% iii) 6% b) i) 85.6% ii) 153.8% iii) 3.0% 3) a) i) 0.42 ii) 1.18 iii) 0.053 iv) .074 3 b) i) 38.4% ii) 18.9% ii) 172.6%
4) a) 30% b) 33.3% or 33 % c) 60% d) 25% e) 66.7% or 66 %
f) 55.6% g) 15% h) 16.7% i) 80%
5) a) 1 or , 1.5, 150% b) 2 or , 2.6, 260%
6) a) or , 0.8, 80% b) , 0.2667, 26.7%
7) The area that is 40% of the first rectangle does not equal the area that is 40% of the second rectangle because the original rectangles are not the same size. When the “bases” are different in size, then the percent parts are different in size.
Section 7-3: Answers to Exercises on Mental Calculations with Percents 1) a) 4.6 b) 46 c) 92 d) 23 e) 46 + 23 = 69 f) 46 + 4.6 + 4.6 = 55.2 g) 75.6219 h) 7.56219 2) a) one possible method: find 15% of 660 and subtract that amount from 660. 10% of 660 is 66. 5% of 660
is 33. so 15% of 660 is 99. 85% of 660 equals 660 minus 15% of 660 = 660 – 99 = 561 b) # of 360 = 90 c) # of 104 is 26, so $ is 78 d) 1/3 of 360 is 120
e) 10% of 600 is 60 so 40 % is 4 • 60 = 240 3) a) 5 b) 1000 c) 162 d) $12 interest. Will pay $312 e) 80 f) $36

Answers to Exercises
Answers page - 14
Section 7-4: Answers to Exercises on Percent Applications Solved with Equations 1) a) 7.8 ounces salt in the mix b) predicted adult weight was 70.2 pounds c) 55% drove more than 10 miles d) 39 people are expected to organize photos e) 420 calories in a serving of regular ice cream f) new salary is $36,732.80 2) a) about 13.5% of weight was lost b) you will pay $33.64 c) you will pay $44 d) The new budget is $481.50 e) 14.3% decrease in price f) Paul got 57 correct g) They will spend $23,000 on art h) 39.3% read below grade level, 60.7% read at or above i) they will donate 5 books j) 23.8% was saved; 76.2% was paid k) 36.4% lost or broken; 63.6% remained l) 75% met the standards m) i) landlord is wrong. One possible example: If rents are now $1000, then next year after a 10% increase
they’d be $1,100. Then after a 10% decrease they’d be 1,100 – 110 = $990, which is not back to where they started
ii) To get back to $1000, the decrease percent from 1,100 would be 9.1% (approximately). This 9.1% is the percent required no matter what the rents are.
3) Answers vary. Check your answers with classmates.
Sections 8-2 and 8-3: Answers to Exercises in Two-Dimensional Geometry 1. a) simple; not closed b) not simple; not closed c) simple; closed d) not simple; closed e) simple; not closed f) simple; closed 2. a) i) no ii) -- iii) concave b) i) yes; trapezoid ii) irregular (but is isosceles trapezoid) iii) convex c) i) yes; decagon ii) irregular iii) concave d) i) yes; rectangle ii) irregular iii) convex e) i) yes; octagon ii) regular iii) convex f) i) no ii) -- iii) concave g) i) yes; pentagon ii) regular iii) convex h) i) no ii) -- iii) convex i) i) yes; hexagon ii) irregular iii) concave j) i) no ii) -- iii) convex k) i) yes; hexagon ii) irregular iii) concave l) i) no ii) -- iii) convex 3. no. One definition of “convex” is that it is NOT concave. So a shape cannot be both. 4. answers will vary. For example: a) convex b) concave
5. a) False. Example is a rectangle of length 5 and width 2 b) True c) True d) True
e) False Example: f) True g) False Rectangles have two sets of parallel sides but trapezoids have only one set of parallel sides. h) True i) False. Trapezoids have exactly one set of parallel sides, but parallelograms have two sets.
6) a) A, C, E, F b) hexagon c) A, E, F d) D e) B, C, E, F f) A g) A, B, D h) A, E, F 7. a) pentagon has 3 triangles b) hexagon has 4 triangles So angles sum to So angles sum to 3 • 180 = 540° 4 • 180 = 720°
c) (challenge) Heptagon has 900° ; Octagon has 1080°
8. a) 120° b) 90° and 25° c) 40° and 40° d) 104° e) 120°
9) no. The shape could be a parallelogram that wasn’t a rectangle. Parallelograms have opposite sides equal; so do rectangles. To be a rectangle it also needs 90° angles. 10) a square is a special kind of rectangle 11) a) 120° b) 60° c) 30° d) 180° e) 90° f) 12:10 or 4:10 g) 8:00 or 8:20
12. Answers vary – many answers are possible. a) a pencil represents a line segment b) a wall c) a cookie jar d) In a straight hallway, the lines where the walls meet the ceiling e) the top edge and side edge of a door 13. a) i) right ii) scalene b) i) acute ii) isosceles c) i)obtuse ii) scalene d) i) acute ii) equilateral (or very close) 14. a) yes. They are reflections – same shape and size. b) no. One is bigger. c) yes. Same shape and size.
15. Research shows this is a weaker strategy than showing both examples and non-examples.

Answers to Exercises
Answers page - 15
16. Teachers need to know more than the students so they can correct errors students make, can prepare students well for what they need to learn later, and to be able to extend both the vocabulary and concepts when appropriate.
17. answers vary. For example: above, below, near, far, around, flip, inside, turn. Check with classmates. 18. Suggestion: if you don’t get one of the answers and then see it here, go back and try it again yourself..
Make this shape from the
medium triangle and 2 small triangles
Record how you do it ANSWERS
square
triangle
rectangle
parallelogram
trapezoid
Make this shape from the 5 smallest tangram pieces
Record how you do it ANSWERS
square
triangle

Answers to Exercises
Answers page - 16
rectangle
parallelogram
trapezoid
Make this shape using all seven tangram pieces
Record how you do it ANSWERS
square
triangle
rectangle
parallelogram
trapezoid
Section 8-4: No Answers since there are no exercises. Section 8-5: Answers to Exercises on Coordinate Geometry
Answers may vary a little. Check answers with classmates.

Answers to Exercises
Answers page - 17
Section 8-6: Answers to Exercises on Symmetry 1) answers vary 2a) i) no lines ii) rotational sym of 180°, 360° 2b) i) 3 lines of sym. ii) rotational of 120°, 240°, 360°
2c) i) no lines ii) rotational of 90°, 180°, 270°, 360° 2d) i) horiz and vertical lines of sym ii) 180°, 360°
2e) i) no lines ii) 180°, 360° rotational 2f) i) 5 lines of sym. ii) 72°, 144°, 216°, 288°, 360°
2g) i) no lines ii) 180°, 360° 2h) vertical line of sym. ii) no rotational sym.
2i) i) 4 lines of sym. ii) 90°, 180°, 270°, 360°
2j) i) 4 lines [horizontal, vertical, each diagonal] ii) 90°, 180°, 270°, 360° 2k) i) vertical line sym. ii) no rotational 2l) i) horizontal line sym ii) no rotational 3) – answers may vary – here are some possibilities 3a) an irregular figure, or a parallelogram 3b) a kite 3c) a rectangle 3d) none? 3e) square 4a) a non-isosceles trapezoid 4b) an isosceles trapezoid 4c) none? 5a) AH IMOTUVWXY 5b) BCDEH IOX 5c) H I NOSXZ 6a) horizontal symmetry in BED, OH, OX, HI, HE. Vertical sym. in TOT, WOW 6b) SOS 6c) ? 7) an activity – no answers here 8) a) b) c)
8 d) part c has rotational symmetry 9a) plane of symmetry vertical through bear’s nose, between eyes; no rotational sym. 9b) vertical plane through center of door – except door knob and hinges are not symmetric 9c) no reflective sym.; 120°, 240°, 360° rotational sym. [for the dark blades, not the white wire part]
9d) 6 planes of symmetry; 60°, 120°, 180°, 240°, 300°, 360° rotational symmetry [except for the white
rectangular label on the base of the light] 9e) 4 planes of symmetry; 90°, 180°, 270°, 360° rotational symmetry 9f) plane of symmetry through front door and top front window 9g) 4 planes of symmetry; 90°, 180°, 270°, 360° rotational symmetry
9h) no plane of symmetry; 90°, 180°, 270°, 360° rotational symmetry around axis through center of vase 9i) vertical plane of symmetry through center of door; no rotational sym. 9j) planes of symmetry and rotational symmetry – but it’s not clear how many! – If the lamp shade is in six parts, then it is 6-fold rotational symmetry, which works for the little “bumps” about half way down the picture since there seem to be 12 of those. There would also be 6 planes of symmetry. 9k) circular symmetry around the center axis of the candle [if the wick were standing straight up] 9l) two vertical planes of symmetry (one through center of house from front to back, one through center of house from left to right) 9m) a plane of symmetry through the center of the body 10 and 11) Answers vary. Share answers with classmates.
Section 8-7: Answers to Exercises on Three Dimensional Geometric Objects 1 and 2) Answers vary 3) a) 6 b) 8 c) 12 d) 2 4) a) 4 b) 4 c) 6 d) 2 5a) rectangular prism 5b) a star-shaped prism (bases are 8-pointed star-shaped) 5c) a square pyramid 5d) a cone 5e) a square pyramid 5f) cylinder
Section 9-2: Answers to Exercises on Length 1) length, area, volume, capacity, weight, temperature, time, angle degrees
3) a) 1 in b) 2 in c) 5 in 5) a) 3.4 cm b) 7.3 cm c) 14.1 cm 6) b) 11.4 cm

Answers to Exercises
Answers page - 18
8. a) 12 b) 60 c) 36 d) 100 e) 1,000 f) 50 g) 10 h) 1 i) .01 or 1/100 9. (difference)/(measurement) = 5/43 = 11.6% 10) and 11) compare with classmates 12. a) 7 ft b) 7 yd c) 24 in d) 7 in e) 20 yd 13. a) 75 cm b) 7.5 cm c) 1 mm e) 2 m f) 7 m 14) a) about 7 to 7 3/16 in b) about 17.7 to 18.4 cm 15. 54 feet 16. missing horizontal side = 7, missing vertical side = 9. Perimeter = fence length = 48 m 17. missing horiz. Side = 10, missing vert. sides = 18 and 2, Perimeter = 98 ft 18. a) 30 units b) 16 units 19. The slanted distance between two posts is longer than the horizontal or
vertical distance between two posts. The “slanted square” has a larger perimeter. 20. Compare with classmates to see who has the figure with largest perimeter. 21. b, d, f, g
Section 9-3: Answers to Exercises on Area 1. a) 180 sq ft b) 20 sq yd 2) 103 sq m 3) 452 sq ft 4) a) P=14 units; A=12 sq units b) P=24 units; A=36 sq units c) P=30 units; A = 17 sq units 5) a) b=3 units, h=5 units, A=7.5 sq units b) b=4 units, h=5 units, A=10 sq units c) b=4 units, h=3 units, A=6 sq units 6) a) 13.5 sq units b) 10 sq units c) 11 sq units d) 15 sq units e) 14 sq units f) 24 sq units 7) a) P=81 cm; A=320 sq cm b) P=18.3 m; A=16.065 sq m c) P=25 in; A=15 sq in 8) a) about 12 to 13 sq units b) about 11.5 to 12.5 sq units c) about 17.5 to 20 sq units. 9) a) i-180 sq ft b) iii-21 sq cm c) iii-120 sq ft d) ii-180 sq ft e) i-30 sq m 10) 60 sq yd = 540 sq ft. He needs 2 cans of paint. 11) With base 4 and height 3 (there are three such). With base 3 and height 4 (one more different from the
others). 12) there is a shape of area 6, area 5, and two with area 4 13) some of the possible perimeters are 12, 14, and 18. 14) medium triangle area = 2 sq units; square area = 2 sq units; parallelogram area = 2 sq units;
large triangle area = 4 sq units
Section 9-4: Answers to Exercises on Volume, Capacity, and Surface Area 2) a) 42 cu ft b) 82 sq ft 3) possible answers: 3 in by 4 in by 6in or 2 in by 4 in by 9 in or 3 in by 3 in by 8 in 4) a) 12,800 cu cm b) 3,880 sq cm 5) a) 280 cu ft b) (280 cu ft) ÷ (27 cu ft in each cu yd) = 10.4 cu yd. The fan is okay since vol < 12 cu yd. c) 2•(small sides of 4•7) + 2• (longer sides of 10>7) + (roof of 4 •10) = 236 sq ft 6) a) (1 2/3) • 3 = (5/3) • 3 = 5 cups b) more c) more d) less 7) a) ii-200 cu m b) iii-1.5 l c) ii-400 ml
Section 9-5: No Answers since there are no Exercises
Section 9-6: Answers to Exercises on Circles 1) a) Perim = Circum = 3.14•12 ft = 37.68 ft Area = 3.14•(6
2) 113 sq ft
b) Perim = Circum = 2•3.14•11m = 69.08 m Area = 3.14•(5.52) 95 sq m
2) a) r = (1/2)• 10 = 5; A = 3.14 • 52 = 78.5 sq ft b) P = 3.14• 10 = 31.4 ft
c) radius of outer circle = 2+5 = 7. Area of outer circle = 3.14• 72 = 153.86 sq ft.
Area of sidewalk = area of outer circle – area of pond = 153.86 – 78.5 = 75.36 sq ft. 3) Around the corner of the deck, make a circle of ‘8 ft” which is 4 cm on the drawing. Around the center of the
BBQ make a circle of “6 ft” which is 3 cm on the drawing. There are two possible locations of the buried cuff links.
4) a) area of rectangle on bottom + area of half circle on top = 28 • 12 + ! • 3.14 • 142 = 336 + 307.72 =
643.72 sq in b) Perim = ! circle circum + left side + right side + bottom = ! • 3.14 • 28 + 12 + 12 + 28 = 43.96 + 52 = 95.96 in or about 96 in.
5) a) length of the semicircle at one end, with diam of 5m, = (1/2) • 3.14 •5 = (1/2) • 15.7 = 7.85 m. fence length = 2 semicircles + 2 long edges = 2 • 7.85 + 2 • 11 = 37.7 m b) area of semicircle at one end = ! • (3.14 • 2.5
2) = ! (19.625) = 9.8125;

Answers to Exercises
Answers page - 19
total area = 2•(semicircle area) + center rectangle area = 2•(9.625) + (11•5) = 31.125 31 sq m
6) a) radius of circle = 4. Area of blue part = ! • 3.14 • 42 = 25.12 sq ft
b) perim = circum = 3.14 • 8 = 25.12 ft
7) Amount of pizza depends on area of the pizza. 16 inch diam pizza has area = 3.14 • 82 = 200.96 sq in.
10 inch pizza area = 3.14 • 52
= 78.5 sq in. So two 10 inch pizzas area is 157 sq in. There is more pizza in one 16 inch pizza than in two 10 inch pizzas.
8) and 9) Compare with classmates
Section 9-7: Answers to Exercises on Converting Units
1) a) • = 21 ft b) • =4 yd or 4.67 yd c) 1.8 hr d) 86,400 sec
e) 1.92 years f) 14.4 sq yd g) 432 sq in h) 20,000 sq cm i) 1.4 sq m j) 20 cups k) 32 fl oz l) 43.2 oz m) 2,600 lb n) 1,600 g 2) She needs 225 sq ft. Cost is $922.50 3) He’d need 54 bags to get 4 cu ft, costing $216. 4 cu yd delivered cost $176. He saves $40, plus saves the
environment from all those plastic bags.. 4) 15 quarts in quart bottles cost $19.50. 15 quarts converts to 3.75 gallons – so she would need to buy 4
gallon bottles, costing $20. It is less expensive to buy 15 quart bottles. (Although, if she could use the extra quart of sauce for lasagna for her family, it’s a better deal and also less wasteful of packaging to buy the 4 gallon bottles.)
5) From Speedy Supplies cost = $60. From Big Supplies he needs 0.08 m, and cost is $54.40. He saves $5.60 using Big Supplies.
Section 10-2: Answers to Exercises on Displaying Data in Graphs
2) a) nominal/categorical/qualitative b) numeric/quantitative c) numeric/quantitative d) nominal/categorical/qualitative e) numeric f) nominal/categorical/qualitative
3) answers vary – discuss with classmates 4) a) 2 b) 9 siblings c) 14 people d) 1 sibling 5) a) 18 students b) 20 students c) 4/53 = 7.5% d) the weights are clustered in the center, with a
few students weighing less or more than most of the students. 6) a) 46 students b) Friday c) 11/225 = 4.9% d) students are absent and tardy more on
Monday and Friday than midweek.
7) a) peanut butter b) cheese c) 100% d) 22 people 8) a) 47 b) 57 c) 14 weeks 9) 3 8 9 stem is tens place; leaf is units place 4 5 7 8 5 4 4 9 6 7 0 2 10) a) i) birth month, favorite color, left or right handed, ii) # siblings, # letters in last name b - f) compare answers with other students
Section 10-3: Answers to Exercises on Measures of Center and Variability 1) the data is nominal,/categorical so only the mode can be found. The mode is “oppose” 2) a) mean = 16.8 b) median = 16 c) mode = 15 d) range = 10 3) a) since one data value is very different from the others (the 9.4 is extremely high), the median would be a better measure of center. b) mean = 3.85 c) median = 3.25 d) no mode e) range = 8.2 4) a) 11 weeks b) $26 c) $24 d) $23 e) $20
Section 10-4: Answers to Exercises on Probability

Answers to Exercises
Answers page - 20
1) a) 40/70 = 4/7 b) 39/70 2) a) 1/6 b) 0 c) 1/6 d) 3/6 = ! e) 1 3) a) 1/2 b) 2/6=1/3 c) 1/6 e) 5/6 f) 1 g) 0 4) a) 1/52 b) 4/52 = 1/13 c) 13/52 = 1/4 d) 12/52 = 3/13 e) P(2, 3, 4, or 5) = 16/52 = 4/13 f) 26/52 = 1/2 g) 1 5) a) {penny Head & nickel Head, penny Head & nickel Tail, penny Tail & nickel Head, penny Tail & nickel Tail} b) 1/4 6) a) 1/8 b) 4/8=1/2 c) 4/8=1/2 d) 2/8= 1/4 e) 0 f) 1 7) and 8) – check answers with classmates 9) 44% 10) 994/1000
Copyright © 2022 FDOKUMEN