English Teaching Resources 1000 Pictures For Teachers To Copy
Upload
khangminh22Category
view
5download
0
THESIS SUBMITTED FOR THE DEGREE OF DOCTOR OF PHILOSOPHY
UNIVERSITY OF EAST ANGLIA
SCHOOL OF EDUCATION AND LIFELONG LEARNING
This copy of the thesis has been supplied on condition that anyone who consults it is
understood to recognise that its copyright rests with the author and that use of any
information derived therefrom must be in accordance with current UK Copyright Law. In
addition, any quotation or extract must include full attribution.
2019
Mathematics teachers’ work with resources
Four cases of secondary teachers using
technology
LINA KAYALI

1
Contents
Contents ..................................................................................................................................................... 1
List of Figures .............................................................................................................................................. 4
List of Tables ............................................................................................................................................... 6
List of Acronyms .......................................................................................................................................... 7
Abstract ...................................................................................................................................................... 8
Acknowledgements ..................................................................................................................................... 9
Introduction...................................................................................................................................... 10
Literature Review ............................................................................................................................. 14
Resources ........................................................................................................................................ 14
Technology in mathematics teaching ............................................................................................. 14
Inspirations and aspirations around technology ........................................................................ 15
Practice with technology ............................................................................................................ 18
Mathematics-education software .............................................................................................. 21
Teachers’ knowledge ...................................................................................................................... 22
Teacher beliefs, practices and identity ........................................................................................... 26
The unexpected in the classroom .................................................................................................... 30
Observing Teaching ........................................................................................................................ 31
The Teaching Triad ..................................................................................................................... 31
Instrumental Approach .............................................................................................................. 32
Documentational Approach ....................................................................................................... 34
The Knowledge Quartet ............................................................................................................. 36
Theoretical framework ................................................................................................................... 40
Why the Knowledge Quartet? .................................................................................................... 41
Why the Documentational Approach (DA)? ............................................................................... 42
The Documentational Approach in tandem with the Knowledge Quartet ................................ 42
Methodology .................................................................................................................................... 44
Methodological Approach .............................................................................................................. 44
Critical incidents .............................................................................................................................. 45
Research Context and Design ......................................................................................................... 48
Secondary school context in England ......................................................................................... 48
Secondary mathematics teacher training in England ................................................................. 49
Participants ................................................................................................................................. 51
Research Design ......................................................................................................................... 53

2
The first phase- Designing pre-observation interviews ........................................................................... 53
The second phase- Pre-observation interviews ....................................................................................... 56
Ethics ............................................................................................................................................... 58
Data Collection overview ................................................................................................................ 60
Data analysis .................................................................................................................................. 61
Data and Analysis ............................................................................................................................. 63
First teacher data - George ............................................................................................................. 63
A characteristic lesson- Trigonometry ........................................................................................ 63
Episode 1: A tour around the school website ............................................................................ 72
Three episodes on the volume of revolution: ............................................................................ 75
Episode 5 - from lesson 9: on differential equations ................................................................. 92
Episode 6- from lesson 8 on Iteration ...................................................................................... 102
Episode 7- from lesson 2: In relation to volume of revolution ................................................. 109
Discussion and Summary .......................................................................................................... 111
Second teacher data - Martin ....................................................................................................... 114
Lesson 4: Volume of revolution ................................................................................................ 115
Post observation interview ...................................................................................................... 122
Discussion and Summary .......................................................................................................... 129
Third teacher data - Adam ............................................................................................................ 131
Two episodes on Integration .................................................................................................... 132
Discussion ................................................................................................................................. 145
Fourth teacher data - Charlie ........................................................................................................ 150
Two Lessons on Polynomials .................................................................................................... 150
Lesson 9 on Transformations ................................................................................................... 162
Episode 8- From lesson 3 .......................................................................................................... 169
Discussion and Summary .......................................................................................................... 173
Findings and Conclusion ................................................................................................................. 175
Overview of findings ..................................................................................................................... 175
Students’ contributions as a resource ...................................................................................... 175
Examination requirements and other institutional factors ...................................................... 177
Teachers’ knowledge of the software ...................................................................................... 178
Connections between resources .............................................................................................. 179
Contingent moments ................................................................................................................ 179
Answering the research question ................................................................................................. 180
Contribution to theory .................................................................................................................. 182
Suggestion of new codes to the Knowledge Quartet ............................................................... 182
Scheme-in-action ...................................................................................................................... 185

3
Re-scheming ............................................................................................................................. 186
The use of Documentational approach in tandem with the Knowledge Quartet .................... 187
Implications for policy and practice .............................................................................................. 188
Limitations .................................................................................................................................... 190
Future research ............................................................................................................................. 191
Personal reflections ...................................................................................................................... 191
References .............................................................................................................................................. 193
Appendices ............................................................................................................................................. 206
List of Appendices ...................................................................................................................................... 206
Appendix A: Study poster ........................................................................................................................... 207
Appendix B: Interview opt in form ............................................................................................................. 208
Appendix C: Lesson-observations opt in form ............................................................................................ 216
Appendix D: Student consent form for lesson observations....................................................................... 224
Appendix E: Sample of Pre-observation interview questions ..................................................................... 231
Appendix F: Sample of the post-observation interview ............................................................................. 232
Appendix G: Sample of the analysis using the Knowledge Quartet ........................................................... 234
Appendix H: Application for ethical approval of a research project .......................................................... 244
Appendix I: Ethics application feedback ..................................................................................................... 256

4
List of Figures
Figure 1: MKT domains as in Ball et al. (2008, p. 403) ............................................................................... 25 Figure 2: MTSK diagram as in Carrillo-Yañez et al. (2018, p. 241) .............................................................. 26 Figure 3: The 3D scenario .......................................................................................................................... 54 Figure 4: The scenario on square and its properties .................................................................................. 54 Figure 5: The trigonometry formulae taught in lesson 1 ............................................................................ 64 Figure 6: The graph of 𝐲 = 𝟑𝐬𝐢𝐧𝐱 + 𝟐𝐜𝐨𝐬𝐱 On Autograph (reproduction of George’s work) ..................... 64 Figure 7: Right- triangle sketched by George ............................................................................................. 65 Figure 8: Past-examination question ......................................................................................................... 66 Figure 9: Trapezium rule for 𝐲 = 𝐱(𝟑 − 𝐱) with 5 divisions (reproduction of George’s work) ................... 76 Figure 10: Trapezium rule for 𝐲 = 𝐱(𝟑 − 𝐱) with 5 divisions as edited by George (reproduction of George’s
work) ................................................................................................................................................ 76 Figure 11: Simpson’s rule for 𝐲 = 𝐱(𝟑 − 𝐱) with 2 divisions (reproduction of George’s work) .................. 77 Figure 12: Rotating the shaded area in Figure 13 around the x-axis (reproduction of George’s work) ....... 78
Figure 13: The rotation of the area between 𝐲 = 𝐱 and the x-axis, around the x-axis (reproduction of
George’s work) ................................................................................................................................. 79 Figure 14: George’s attempt to show a thin slice of the shaded area on Autograph .................................. 79 Figure 15: Diagram illustrating the formula of volume of revolution in the textbook by Wiseman and
Searle (2005, p. 108) ......................................................................................................................... 79 Figure 16: Formula sheet for volume of revolution, prepared by George .................................................. 80 Figure 17: An example suggested by George ............................................................................................. 81 Figure 18: A past-examination question chosen by George to solve on the board .................................... 81 Figure 19: George’s work on the diagram illustrating the formula of volume of revolution in the textbook
by Wiseman and Searle (2005, p. 108) .............................................................................................. 82 Figure 20: One shape created from rotating 𝐲 = 𝐬𝐢𝐧(𝐚𝐱 + 𝐛) + 𝐜 on Autograph (reproduction of
George’s work) ................................................................................................................................. 84 Figure 21: Example 15 in Wiseman and Searle (2005, p. 109) .................................................................... 85 Figure 22: Example 16 in Wiseman and Searle (2005, p. 109) .................................................................... 85 Figure 23: A shape sketched by George during his second lesson on volume of revolution ....................... 85 Figure 24: An “easier” question on volume of revolution .......................................................................... 86 Figure 25: a “more difficult” question on volume of revolution ................................................................ 86
Figure 26: : 𝐱(𝐱 − 𝟏)𝐝𝐲
𝐝𝐱= 𝐲 on Autograph (reproduction of George’s work) ......................................... 93
Figure 27: George’s display of the “subroutine” for ∫𝟏
𝐲𝐝𝐲 = ∫
𝟏
𝐱(𝐱−𝟏)𝐝𝐱 ................................................... 95
Figure 28: The particular solution 𝐲 = 𝟐𝐱−𝟏
𝐱 on Autograph (reproduction of George’s work) ................... 96
Figure 29: The particular solution 𝐲 = −𝟐𝐱−𝟏
𝐱 on Autograph (reproduction of George’s work) ............... 97
Figure 30: dy/dx= 3x2+2x on Autograph showing “vertical lines”, before zooming in (reproduction of
George’s work) ................................................................................................................................. 98
Figure 31: The graph of 𝐲 = 𝐱𝟑 + 𝐱𝟐 + 𝟏 on Autograph (reproduction of George’s work) .................... 98 Figure 32: The graph of 𝐲 = 𝐱𝟑 + 𝐱𝟐 + 𝐚 on Autograph (reproduction of George’s work) ..................... 99
Figure 33: 𝐲 = 𝐱 and 𝐲 = √−𝟒𝐱 − 𝟏 on Autograph .............................................................................. 103
Figure 34: 𝐲 = 𝐱 and 𝐲 =−𝟏
𝐱+𝟒 on Autograph (reproduction of George’s work) ....................................... 104
Figure 35: Table completed using 𝐱𝐧+𝟏 =−𝟏
𝐱𝐧+𝟒 (reproduction of George’s work) .................................. 104
Figure 36: Autograph’s Staircase diagram for 𝐱 =−𝟏
𝐱+𝟒 (reproduction of George’s work) ........................ 105
Figure 37: The shape George created on Autograph in an attempt to answer student A question
(reproduction of George’s work)..................................................................................................... 110
Figure 38: Martin’s work on solving 𝐱𝟐 + 𝐲𝟐 = 𝐫𝟐 considering the positive solution only ................... 116 Figure 39: Martin’s starting to demonstrate the application of the volume of revolution formula.......... 116 Figure 40: examples of students’ work .................................................................................................... 117 Figure 41: Martin’s display of a semi-circle on GeoGebra (reproduced for clarity) .................................. 118
5
Figure 42: The rotation of a semi-circle on GeoGebra (reproduction of Martin’s work) .......................... 118 Figure 43: Starter question on dividing fractions ..................................................................................... 132 Figure 44: the worksheet Adam gave his students .................................................................................. 135 Figure 45: Textbook questions ................................................................................................................ 136 Figure 46: 𝐝𝐲/𝐝𝐱 = 𝟏 on Autograph (reproduction of Adam’s work) ..................................................... 137 Figure 47: 𝐝𝐲/𝐝𝐱 = 𝟏 and 𝐲 = 𝐱 on Autograph (reproduction of Adam’s work) ..................................... 137 Figure 48: 𝐝𝐲/𝐝𝐱 = 𝟏, 𝐲 = 𝐱 and 𝐲 = 𝐱 + 𝟏 on Autograph (reproduction of Adam’s work) ................... 138 Figure 49: 𝐝𝐲/𝐝𝐱 = 𝟏, 𝐲 = 𝐱 and 𝐲 = 𝐱 + 𝟐 on Autograph (reproduction of Adam’s work) ................... 138 Figure 50: Student A answer on Autograph (reproduction of Adam’s work) ........................................... 143 Figure 51: Student B answer on Autograph (reproduction of Adam’s work) ........................................... 144 Figure 52: The bingo game ...................................................................................................................... 144 Figure 53: 𝐲 = 𝟐 + 𝟏 and 𝐲 = 𝟏𝟎 on Autograph (reproduction of Charlie’s work) .................................. 152 Figure 54: 𝐲 = 𝐱𝟐 and 𝐲 = 𝟖 on Autograph (reproduction of Charlie’s work) ......................................... 153 Figure 55: 𝐲 = 𝐱𝟑 and 𝐲 = 𝐤 on Autograph (reproduction of Charlie’s work) ........................................ 154 Figure 56: Textbook question with function notation in Rayner and Williams (2004) ............................. 156 Figure 57: Charlie’s work on circle translation on Autograph (reproduction of Charlie’s work) ............... 162 Figure 58: A hand-sketch by Charlie on the board with Autograph in the background, with bubbles added
to clarify what he wrote next to the graph ..................................................................................... 164 Figure 59: Charlie’s display on the connection between tangent and normal of 𝐲 = 𝐱𝟐 ........................ 170 Figure 60: Charlie’s display on the connection between tangent and normal of 𝐲 = 𝐬𝐢𝐧𝐱 ...................... 170
6
List of Tables Table 1: The Knowledge Quartet dimensions and their contributory codes as listed in (Rowland & Turner,
2017, p. 106) ..................................................................................................................................... 37 Table 2: Key stages and their corresponding school years and students’ ages ........................................... 48 Table 3: Secondary school examinations and grades ................................................................................. 49 Table 4: University grades and class for honours degrees ("Study in the UK- UK Grading System," 2019) . 49 Table 5: Participants profiles at the start of the data collection ................................................................ 52 Table 6:Participation in the different stages of data collection ................................................................. 59 Table 7: The main themes that emerged from the data analysis ............................................................... 62 Table 8: George’s scheme of use in his first lesson .................................................................................... 71 Table 9: George’s scheme for lesson 2 on volume of revolution ................................................................ 74 Table 10: George’s scheme during the fourth lesson on volume of revolution .......................................... 88 Table 11: George’s scheme during the seventh lesson on volume of revolution ....................................... 89 Table 12: George’s scheme of work during the ninth lesson on differential equations ............................ 101 Table 13: George’s scheme during lesson 8 on iteration, no inferences were observed .......................... 107 Table 14: Martin learning objectives for the lesson on volume of revolution .......................................... 116 Table 15: Martin’s scheme of work for his lesson on volume of revolution ............................................. 128 Table 16: Adam’s scheme of work in episodes 1 (in row 2) & episode 2 (in row 3) .................................. 141 Table 17: Adam’s scheme of work during the first lesson observed for him ............................................ 146 Table 18: Charlie’s scheme of use in lesson 5 .......................................................................................... 160 Table 19: Charlie’s scheme of use in lesson 8 .......................................................................................... 161 Table 20: Charlie’s scheme of work during his eighth lesson on transformations .................................... 168 Table 21: Charlie’s scheme of work during his third lesson on tangent and normal lines ........................ 172

7
List of Acronyms
1 CK here is Shulman’s (1986) 2 CK here is based on Mishra and Koehler (2006)
Information and communication technologies ICT
Personal computer PC
Documentational Approach DA
Knowledge Quartet KQ
Subject matter knowledge SMK
Pedagogical content knowledge PCK
Curricular knowledge (Shulman, 1986) CK1
Technological pedagogical content knowledge TPCK
Technological content knowledge TCK
Technological pedagogical knowledge TPK
Content knowledge CK2
pedagogical knowledge PK
Technological knowledge TK
Mathematical Knowledge for teaching MKT
Common content knowledge CCK
Specialized content knowledge SCK
Knowledge of content and students KCS
Knowledge of content and teaching KCT
Mathematics teachers’ specialised knowledge MTSK
Knowledge of Mathematics Teaching KMT
Knowledge of Features of Learning Mathematics KFLM
Knowledge of Mathematics Learning Standards KMLS
Critical incidents CI

8
Abstract
This study examines teachers’ work with paper-based, technology and social resources with
the use of two theoretical frameworks: the Documentational approach and the Knowledge
Quartet. The former affords looking at teachers’ resources and resource systems and how
these are utilized under schemes of work. The latter affords a closer look at teachers’ work
during lessons and at their knowledge-in-action. Specifically, the study investigates how four
upper secondary teachers use, re-use and balance their resources by looking at their schemes
of work in class, through lesson observations; and, by reflecting on the details of their work and
knowledge-in-action in pre- and post-observation interviews. Analysis examines five themes in
relation to teachers’ work. First, teachers use students’ contributions as a resource during
lessons. Second, teachers connect (or not) different resources. Third, institutional factors, such
as examinations requirements and school policy, have impact on teachers’ decisions and on
how they balance their resource use. Fourth, when mathematics-education software is used,
teacher knowledge of the software comes into play. Fifth, there is ambiguity in the
identification of contingency moments, particularly regarding whether these moments were
anticipated (or not) or provoked by the teacher. These five themes also suggest theoretical
findings. In relation to the Knowledge Quartet, the findings indicate the potency of adding a
few new codes or extending existing codes. This is especially pertinent in the context of
teaching upper secondary mathematics with technology resources. In relation to the
Documentational approach, this study introduces two constructs: scheme-in-action and re-
scheming. A scheme-in-action is the scheme followed in class and documented from the
classroom. Re-scheming is scheming again or differently from one lesson to another. Finally,
the study discusses implications for practice and proposes the use of key incidents extracted
from classroom observations towards the development of teacher education resources (e.g.
for the MathTASK programme).

9
Acknowledgements
Many generous colleagues and friends shared their knowledge and expertise to help me. I am
however especially grateful to my exceptional supervisors Dr. Irene Biza and Prof. Elena Nardi,
for guiding and supporting me throughout my research, for being thoughtful and
understanding during my downturns, and for being such brilliant mentors.
I have been very fortunate and grateful for my studentship with the School of Education and
Lifelong Learning at the University of East Anglia. The School has helped me shape and deliver
my work, granting me the honour and tremendous boost without which I could not have done
this work.
A huge thank you to my examiners Prof. Tim Rowland and Prof. Ghislaine Gueudet for the
inspiring discussions during my viva and for their insightful comments on my thesis.
I am grateful to my extraordinary colleagues and the lively discussions and meetings in our
Research in Mathematics Education Group. The feedback was always instructive and valuable.
A huge amount of gratitude also goes to all the participants in my study, I could not have run
my work without them.
To my EDU PGR friends and colleagues, thank you for your amazing company and support.
Special thanks go to Athina Thoma for being a great friend and confidant throughout this time.
Some small portion of gratitude I guess I owe to my truely good friend, Safa Mubgar, for being
at the receiving end of my ever-demanding last minute requests! To Mrs. Mary Sinfield, thank
you for all your unstinting kindness and generosity. Sana’a Aref, my dearest friend, your love
and friendship have been my oldest rock.
To my dear parents and siblings, I owe much, during an incredibly difficult time for us all. To my
family, my beloved husband Zeino, my fabulous boys, Jude and Karam; you know full well what
you mean to me. Thank you!
10
Introduction
Teaching is a complex endeavour in which teachers interact with a range of tools and factors,
and are expected to act promptly in response to expected and unexpected incidents in their
classrooms by drawing on their knowledge and beliefs (Mishra & Koehler, 2006; Nardi, Biza, &
Zachariades, 2012). “As a rule, teachers do not have full control of their working conditions.
Instead, they have only limited control in relation to education, the context, the curriculum,
being subject to the decisions and rules established by others” (Cyrino, 2018, p. 271). The
demands the different factors and social interactions put on teachers implies that teachers’
practices are highly contextual and not a mere replication of their lesson plans, knowledge or
beliefs (Biza, Joel, & Nardi, 2015; Bretscher, 2014). In addition, such factors require
mathematics teachers to adapt and re-adapt to the different and changing factors in their
working environment (Gueudet & Trouche, 2009). For these reasons, it is essential that such
factors are taken into account when studying teachers’ practices (Herbst & Chazan, 2003).
Factors that come into play in teaching include teachers’ and students’ roles and approaches,
institutional policies, time pressure, unexpected incidents, and resources (Nardi, Biza, &
Zachariades, 2012). To consider teachers’ roles and approaches, the researcher can look at
teachers’ knowledge, beliefs or practices (Bretscher, 2014) or even at how these interplay
through looking at teachers’ identity (Goos, 2013). In turn, students influence the
teaching/learning process through their interactions with the teacher (Jaworski & Potari, 2009),
including the contributions they offer voluntarily or when invited (Rowland, Turner, Thwaites,
& Huckstep, 2009). Institutional policies and restrictions including curricula and time pressure
also have an impact on the teaching/learning process (Bretscher, 2014; Cyrino, 2018; Ruthven,
Hennessy, & Deaney, 2008). Unexpected incidents that the teacher has not planned for push
the teacher to make instantaneous decisions and impact on lessons’ agendas (Clark-Wilson &
Noss, 2015; Rowland, Thwaites, & Jared, 2015). In addition, resources play an important role
in teaching. For example, for some decades, it was thought that having access to more teaching
resources (e.g., textbooks, technology resources) meant better teaching practice (Cohen,
Raudenbush, & Ball, 2003). However, such access creates opportunities to use resources, but
“does not cause learning. Researchers report that schools and teachers with the same
resources do different things, with different results for learning” (Cohen et al., 2003, p. 119).
This implies that “more resources do not necessarily lead to better practice” (Adler, 2000, p.
206), and attention should be given to how these resources are employed in the classroom
(Adler, 2000; Cohen et al., 2003; Mishra & Koehler, 2006). Inspired by this latter argument, this
study takes a focus on resources (including technology resources) and their use as a starting

11
point to investigate teachers’ work and the different factors at play with it. It looks at how
teachers balance the different factors in play and use resources for the purpose of
accomplishing their teaching objectives.
This study adopts a broader view on resources in which resources can be material resources
(e.g. textbooks) or social interactions (e.g. discussion with colleagues) (Gueudet & Trouche,
2009). Teachers interact with these resources, and “these interactions play a central role in the
teacher’s professional activity” (Gueudet, Buteau, Mesa, & Misfeldt, 2014, p. 141) and have a
great impact on students’ learning (Carrillo, 2011). Teachers choose their resources and
manage them (Gueudet et al., 2014), and their professional knowledge influences their choices
and use of resources. This use of resources in turn shapes teachers’ professional knowledge.
Hence, a close look at the interactions between the teachers and resources help identify
opportunities to develop both (Rowland, 2013). Such a close look is particularly important
when technology resources are used due to: the inspirations and aspirations that accompanied
the development of technology resources (e.g. (Papert, 1993)), the arguments on how these
add to the complexity of the teaching profession (Clark-Wilson & Noss, 2015; Mishra & Koehler,
2006); the overwhelming number of resources currently available online; and arguments on
the use of technology resources for mathematics teaching being not well-established in
practice yet (Bretscher, 2014; Hoyles & Lagrange, 2009; Mishra & Koehler, 2006; OECD, 2015;
Trouche & Drijvers, 2014). Bretscher (2014) reports on a “widely perceived quantitative gap
and qualitative gap between the reality of teachers’ use of ICT and the potential for ICT
suggested by research and policy” (p.43) at secondary schools. She suggests:
“that given the right conditions, at least those currently existing in England, ICT might contribute
as a lever for change; however, the direction of this change might be construed as an
incremental shift towards more teacher-centred practices rather than encouraging more
student-centred practices” (Bretscher, 2014, p. 43).
She adds that ICT is not often used in mathematics classes, and specifically mathematical
software (e.g. GeoGebra) is even less frequently used. Ruthven et al. (2008) comment on the
quality of technology (particularly mathematical software) use in “older classes” that are close
to national examinations. They think that activities implementing such use “were more sharply
focused on the assessed curriculum” (p.313). They add that in these classes “the emphasis was
on avoiding student work with the software or making it manageable, and on structuring
dynamic geometry use more directly towards standard mathematical tasks” (p.315). These
12
arguments on technology use in secondary classes, especially older classes, motivated me to
focus on mathematical software use in secondary mathematics teaching with attention to older
classes (i.e. upper secondary classes).
Therefore, in this study, I investigate secondary mathematics teachers’ ways of working with
resources, including technology resources by looking at two aspects. One aspect is focused on
looking at how teachers use the available resources and manage that use to achieve their
teaching aims, and in line with their views about mathematics and of its teaching and learning
(Gueudet & Trouche, 2009). Another aspect is focused on looking at how they enact their
lessons and balance the different factors in their working environment (Jaworski, 1994;
Rowland, Huckstep, & Thwaites, 2005) in light of the available resources. To investigate these
aspects, I draw on two theoretical frameworks: the Documentational Approach (Gueudet &
Trouche, 2009) to address the first aspect; and the Knowledge Quartet (Rowland et al., 2005)
to address the second aspect. The two theories are used to analyse data from four secondary
mathematics teachers that was collected in three stages: pre-observation interviews, lesson
observations and post-observation interviews. The lesson observations were audio- or video-
recorded. They covered a range of mathematical topics including volume of revolution,
trigonometry, iteration, integration, modulus equations, polynomials and transformations. The
interviews were audio-recorded and were based on inviting participants’ reflections on critical
incidents, where a critical incident is considered as an everyday instance of when a teacher
makes a decision that shapes classroom interactions; a decision that reveals the teacher’s
approach and purpose. While the pre-observation interview was designed to allow the teacher
to reflect on specific scenarios that can happen in classroom; the post-observation interviews
were based on reflections on critical incidents from the observation. The three stages of data
collection help answer my main research question:
RQ: How do secondary mathematics teachers work with resources including technology in their
classroom?
Inspired by this research question, I include in the chapters that follow a review of relevant
literature and the adopted framework, the methodology, data and analysis, and findings and
conclusions. The second chapter, the literature review, includes seven sections covering
discussion of: resources; technology in mathematics education; teachers’ knowledge; teachers’
beliefs, practices and identity; the unexpected in the classroom; four theories on observing
teaching (the teaching triad, the instrumental approach, the Documentational Approach and
the Knowledge Quartet); and finally the theoretical framework of this study. The third chapter

13
sets the methodology of this work including the methodological approach, the definition of
critical incidents, this study’s context and design, ethics, data collection overview and how the
data is analysed. The fourth chapter on data and analysis overviews the data sets and their
analysis for the four participants George, Martin, Adam and Charlie respectively. The fifth
chapter draws on the analysis in the fourth chapter and offers a summary of findings, answers
to the research question, study limitations, future research, implications for practice and my
personal reflections.

14
Literature Review
As the research question of this study is “How do secondary mathematics teachers work with
resources including technology in their classroom?”, the literature discussed will be related to
the key aspects: teachers’ work (i.e. teaching), resources, and technology. To look at teachers’
work and teaching approaches, I review some theoretical constructs and lenses in relation to:
the definition of resources; technology in mathematics education; teachers’ knowledge;
beliefs, practices and identities; the unexpected in the classroom; and four theoretical lenses
for observing teaching the teaching triad, the instrumental approach, the Documentational
Approach, and the Knowledge Quartet. To start with, I review how resources and technology
resources are seen in mathematics education and what they present in this study.
Resources
Resources are artefacts, teaching materials, and social and cultural interactions that are
available for a teacher in her teaching and preparation for teaching (Gueudet & Trouche, 2009).
An artefact is defined as an object that is designed to be used for specific purposes (Gueudet
& Trouche, 2009). It can be a tool (e.g. a ruler), a mathematical technique (e.g. the quadratic
formula), or a piece of software (e.g. Excel). Teaching materials are materials that are designed
for mathematics teaching and learning including textbooks and calculators, for example (Adler,
2000). Social and cultural interactions refer to interactions with the environment, students and
colleagues, for example a conversation with a colleague or a student’s feedback on an activity
( Gueudet & Trouche, 2009). The term “resource” can also be “the verb re-source, to source
again or differently” (Adler, 2000, p. 207).This implies that teachers interact with resources,
manage them and reuse them to achieve their teaching aims (Gueudet, 2017), and that “the
effectiveness of resources for mathematical learning lies in their use, that is, in the classroom
teaching and learning context” (Adler, 2000, p. 205). It is noted that “different teachers enact
the same curriculum materials differently (e.g., Chavez, 2003), and that the same teacher may
enact the same curriculum materials differently in different classes (Eisenmann & Even, 2011)”
(Kieran, Tanguay, & Solares, 2011, p. 190). In this study, I examine four teachers’ work and
interactions with resources, in the wider range defined here, but with a focus on cases where
technology resources are integrated as well as other resources. Discussion about the rationale
behind the focus on technology is in the next section.
Technology in mathematics teaching
Interpretations of the term technology in mathematics education can vary (Clark-Wilson &
Noss, 2015; Mishra & Koehler, 2006). It can be used to refer to artefacts including for example

15
textbooks, pens, projectors, calculators and posters (Mishra & Koehler, 2006). However, its
more commonly used nowadays to refer to digital technologies including computers,
educational software, digital resources (like e-textbooks), and other new resources that are
“not yet part of the mainstream” (Mishra & Koehler, 2006, p.1023). In this study, the latter
interpretation is used, where the technology refers to digital technologies that transform the
classroom environment, shape teacher-student-resources interactions, and facilitate new ways
of expressing mathematical meanings (Clark-Wilson & Noss, 2015; Pepin, Choppin, Ruthven, &
Sinclair, 2017). In the following three subsection I review the inspirations and aspirations
around technology, practice with technology, and define mathematics education software
(which is the focus of this study).
Inspirations and aspirations around technology
Papert’s (1993) inspirational Mindstorms anticipated that computers “can be carriers of
powerful ideas … they can help people form new relationships with knowledge… and [establish]
an intimate contact with some of the deepest ideas from science, from mathematics, and from
the art of intellectual model building” (Papert, 1993, pp. 4-5). Since then, many developments
in the field of mathematics-teaching technology have taken place, and these were
accompanied by a great number of research studies. To start with, research studies on the use
of technology were mainly based on a constructivist perspective implying that knowledge is
constructed by the learner (Drijvers, Kieran, Mariotti, Ainley, Andresen, Chan, Dana-Picard,
Gueudet, Kidron, Leung, & Meagher, 2009; Guin & Trouche, 1998). After the rise of Vygotsky’s
sociocultural perspective (Vygotskii, 1978), some theories were influenced by this as well as
the constructivist approach (Drijvers et al., 2009). For example, Noss and Hoyles (1996)
suggested that the computers can act as a "window" on mathematics education as they:
"… afford us insights into people's mathematical meanings […]. It will provide a setting to help
us make sense of the psychology of mathematical learning, and at the same time, afford us an
appreciation of mathematical meaning-making which takes us well beyond the psychological
realm. Above all, the computer will open new windows on the construction of meanings forged
at the intersection of learners' activities, teachers' practices, and the permeable boundaries of
mathematical knowledge" (p.2)

16
They used the window metaphor: computers can be like windows on mathematical knowledge
for learners, and windows on student's ideas and progress for educators. However, they added
that:
"windows are for looking through, not looking at. It is true that windows mediate what we see
and how we see it. Equally, windows can, at times, be objects for design and study. But in the
end, what counts is whether we can see clearly beyond the window itself onto the view beyond."
(Noss & Hoyles, 1996, p. 10)
Similarly, Falbel (1991) thinks that computers are neutral, and that the way we use computers
in education is what makes them "good or bad" (p.35). As well, Papert (1993) criticized
"technocentrism" - "the fallacy of referring all questions to the technology" - which only studies
the computers' role in education in a superficial way. He added that computers had no control
on education; they should not be presented as providers of facts and information, nor as
directors of learners' work, and not even as instructors to learners (Papert, 1993). If computers
are to be employed in education, they should be used to "foster individual development" and
give learners the chance to lead their work and expand their choices (Papert, 1993). Criticism
about computers’ use was also built on what Papert (1990) called "scientism", which only
tested the effects of technology on education by conducting "small" experiments. Such
experiments, he argued, did not change enough educational factors to reveal valid results; they
did not allow computers to act as devices for a fundamental change in mathematics education.
Therefore, Papert (1990) thinks that we should appropriate technology to our needs in order
to make use of it - teachers and children are still the leaders in the educational process. This
argument refutes any criticism based on dehumanizing the educational process by using
technology by emphasizing that the use of computers for education should be an interactive
process.
"Not the imparting of 'information' from machine to person, but an enhanced communication
between people; not the transmission of A's understanding to B, but an arena in which A and
B's understandings can be externalized; not a means of displaying A's knowledge for B to see,
but a setting in which emerging knowledge of both can be expressed." (Noss & Hoyles, 1996,
p.6)

17
The main point here is that computers should mediate between teachers and learners (Hoyles
& Noss, 1992). "The computer, as we shall see, not only affords us a particularly sharp picture
of mathematical meaning-making; it can also shape and remould the mathematical knowledge
and activity on view" (Noss & Hoyles, 1996, p.5), pointing out the "construction of meaning is
a human quality" (p.2). Papert (1991) argues that "the thrust of constructionism is to create a
learning environment in which learning will come about in activities driven by enterprise and
initiative" (Papert, 1991, p.22). Theories adopting a sociocultural view on learning with
computers appeared after the rise of Vygotsky’s sociocultural perspective (Vygotskii, 1978);
one example of these is the instrumental approach (Guin & Trouche, 1998) which will be
discussed in section 2.6.2 (Drijvers et al., 2009).
Papert & Turkle (1991) argue that:
"… the computer stands betwixt and between the world of formal systems and physical settings;
it has the ability to make the abstract concrete. In the simplest case, an object moving on a
computer screen might be defined by the most formal of rules and so be like a construct in pure
mathematics; but at the same time it is visible, almost tangible and allows a sense of direct
manipulation that only the encultured mathematician can feel in traditional systems" (Papert &
Turkle, 1991, p. 162)
They add that this makes learning in an environment suitable for different learning styles by
affording "a degree of closeness to objects" (Papert & Turkle, 1991, p.167). So, students are
prepared to engage with computers and computers afford both soft and hard thinking styles.
Computers also afford the integration of the informal idea and formal mathematics where the
informal is students’ language and perceptions and the formal is the language the technology
understands (Hoyles & Noss, 2003). They afford the externalization of knowledge when
students argue and generate their own explanations that are shaped by the tools in use (Harel
& Papert, 1991; Hoyles & Noss, 2003). This can happen through verbalizing thoughts which
helps examine and organize knowledge. Verbalised arguments, explanations and thoughts can
be shared with the observer/teacher, peer(s), afford a closer look at the learners' progress and
facilitates learning not only by doing, but also by "thinking and talking about what you do"
(Harel & Papert, 1991, 42). And, the computer affords a qualitative feedback that allows self-
evaluation and correction skills to be developed (Goldstein & Pratt, 2003; Harel & Kafai, 1991).

18
Research exposed aspects to consider when working in a computer environment. One aspect
is that the environment should afford learners' expression of meaning and creativity and
encourage discovery. It should afford what Falbel (1991) describes as "active learning" instead
of a "passive education" that simply teaches the learners a series of instructions. In other
words, computers should be used to promote "learning by doing", not "learning by being told"
(Harel & Papert, 1991, p.41). Another aspect is motivation, activities should be motivating for
learners to engage with the work and use the computer to explore. To achieve that, an activity
should have a clear target the learners work to achieve (Ainley & Pratt, 2005; Goldstein & Pratt,
2003). Finally, the activities should be designed to encourage students to utilize mathematical
ideas and concepts. It is argued that one of the reasons that keep learners away from
mathematics is that they do not see the usefulness of its formal concepts. Computer-based
activities can be designed to offer this usefulness and some instrumental learning (Ainley &
Pratt, 1996; Goldstein & Pratt, 2003). Computers offer semi-concrete representations that are
easier to students to understand than abstract knowledge (Noss & Hoyles, 1996).
Practice with technology
Despite all the inspirations discussed in the previous section, it is perceived that technology use
is not yet well established in mathematics education. Trouche and Drijvers (2014) argue that:
“… the integration of digital tools is considered as problematic in the sense that their availability
questions the goals of mathematics education as well as current teaching practices (Lagrange et
al., 2003). The latter type of question has not yet been answered in a satisfying way, which may
explain the limited integration of digital tools in mathematics education in spite of earlier high
expectations”. (p.193)
Also, according to the OECD report (OECD, 2015), computers are not used frequently in
mathematics classes. This in some cases is due to the lack of ICT resources, or a reliable internet
connection, while in others it is due to the school’s preference (OECD, 2015). The report
emphasized the role of policies such as the national curriculum, as well as the efficacy of the
training provided, as drivers in the use of technology, but it also reported that the tendency to
employ technology in mathematics classes is dependent on teachers rather than school policies
(OECD, 2015). Furthermore, a survey conducted by Bretscher (2014, p. 43) explored “the widely
perceived quantitative gap and qualitative gap between the reality of teachers’ use of ICT and
the potential for ICT suggested by research and policy” at secondary schools in England. The
study showed that although teachers generally appreciated the role of technology in

19
supporting students learning of mathematics, the quantitative gap was evident in students’
direct access to technology, which took place no more than twice per term in 75% of the
studied cases, with very rare access to mathematical software (Bretscher, 2014). Whereas, the
qualitative gap reflected teachers’ tendencies to use technology in whole-class contexts and in
ways that did not promote student-centred work (Bretscher, 2014). The study also commented
on computer suites access as an obstacle that could have influenced teachers’ use of
technology in mathematics lessons (Bretscher, 2014). Though, even when such suites were
available, teachers were using technology in ways that did not disturb their classroom
management and leadership and with main reliance on presentational forms of technology like
interactive whiteboards and projectors (Bretscher, 2014). Ruthven et al. (2008) also show
teacher’s tendencies to follow a teacher-centred approach when using technology. They add
that in higher secondary classes, where students are close to taking national examinations “the
emphasis was on avoiding student work with the software or making it manageable, and on
structuring dynamic geometry use more directly towards standard mathematical tasks”
(Ruthven et al., 2008, p. 315).
The issues behind specific use/underuse of technology in mathematics education might hide
some underlined criticism of such use. For example, the OECD (2015, p.146) concluded that:
“Resources invested in ICT for education are not linked to improved student achievement …
[L]imited use of computers at schools may be better that no use at all, but levels of computer
use above the current OECD average are associated with significantly poorer results. (OECD,
2015, p.146)
The OECD (2015) report considered the quantity of ICT use in classrooms but failed to look at
the quality of such use, which is an equally important factor. Also, the report considered using
technology to support “(traditional) learning experiences… and perhaps [act] as a catalyst of
wider change” (OECD, 2015, p.50). The first scenario (i.e. supporting traditional learning
approaches) is not a strong case for the use of technology. The main point of using technology
is to revolutionize the teaching of mathematics, and achieve a major change in the way
students learn mathematics. The report recognized that such drop in students’ performance
might be associated with the distractions the computer offers like “chatting on line… and
practicing and drilling” (OECD, 2015, p.154). It is unavoidable that students will find distractions
in all sorts of learning environments (traditional and computer-based), and here the agency of
the teacher should come to play its role.
20
Although digital resources can be adapted to provide access to formal mathematical
knowledge, the overwhelming availability of such resources “yields a deep change in teachers’
professional knowledge and development” (Gueudet & Trouche, 2009, p. 199) as it adds to the
complexity of the job (Fuglestad, Healy, Kynigos, & Monaghan, 2010). It is also argued that
digital resources act best when designed by teachers as they “challenge teachers’ knowing with
respect to teaching and learning mathematics, [and] also regarding their view of the nature of
mathematics itself”. The interactions with such challenging-to-design digital resources develop
teachers’ identities, and hence develops the ways teachers orchestrate their classroom
instructions. And when looking at teachers’ work with digital resources, it is important to
consider teachers’ “hiccups” which Clark-Wilson (2013, p. 34) defines as “the perturbation
experienced by the teacher, triggered by the use of the technology that prompted him or her
to rethink their personal mathematical, pedagogical or technological knowledge”. These should
be evident moments in which the teacher reconsiders her/his choice of instructions because of
an unexpected experience during the use of technology to teach mathematics (Clark-Wilson,
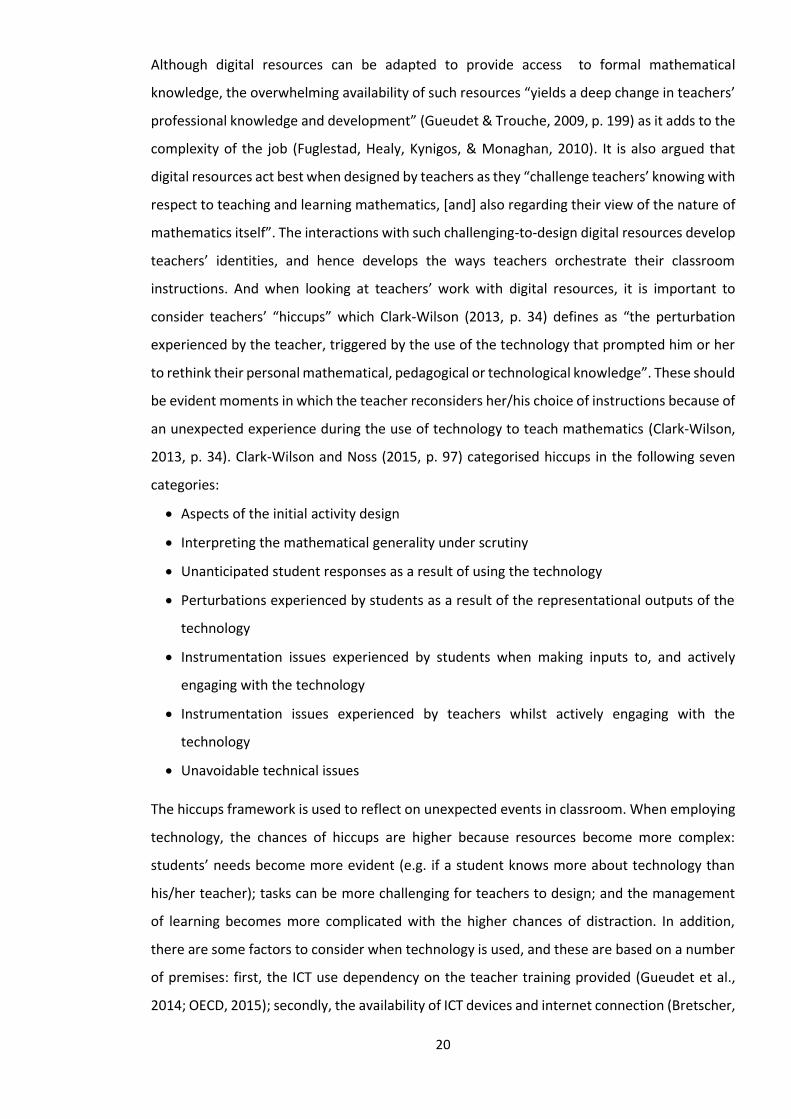
2013, p. 34). Clark-Wilson and Noss (2015, p. 97) categorised hiccups in the following seven
categories:
• Aspects of the initial activity design
• Interpreting the mathematical generality under scrutiny
• Unanticipated student responses as a result of using the technology
• Perturbations experienced by students as a result of the representational outputs of the
technology
• Instrumentation issues experienced by students when making inputs to, and actively
engaging with the technology
• Instrumentation issues experienced by teachers whilst actively engaging with the
technology
• Unavoidable technical issues
The hiccups framework is used to reflect on unexpected events in classroom. When employing
technology, the chances of hiccups are higher because resources become more complex:
students’ needs become more evident (e.g. if a student knows more about technology than
his/her teacher); tasks can be more challenging for teachers to design; and the management
of learning becomes more complicated with the higher chances of distraction. In addition,
there are some factors to consider when technology is used, and these are based on a number
of premises: first, the ICT use dependency on the teacher training provided (Gueudet et al.,
2014; OECD, 2015); secondly, the availability of ICT devices and internet connection (Bretscher,

21
2014; OECD, 2015); thirdly, the national curriculum obligations (OECD, 2015); fourthly, and
most importantly, the “[e]ducation policies that aim to embed ICT” (OECD, 2015). To reflect on
the complexity of teaching with technology, this study will look at teachers’ work when using
technology tools for mathematics teaching and their ways of orchestrating lessons. The next
section explains the technology tools and resources of interest to this study.
Mathematics-education software
The terms used to refer to technology resources in the previous two sections (i.e. technology,
computer and ICT) are general and inclusive of both hardware devices and software pieces and
digital resources. Among software pieces there are some that have been adapted and used for
teaching mathematics like spreadsheets; and others that have been designed specifically for
mathematics education like Cabri (Drijvers et al., 2009). In this study, the focus is on software
that is specifically designed for mathematics teaching; in this work I will call it mathematics-
education software. Mathematics education software started in forms of algebra software
packages (e.g. Maple, Mathematica), and then in forms of tools for geometry (e.g. Logo, Cabri)
(Jones, Mackrell, & Stevenson, 2010). The latter have become more widespread and commonly
used in mathematics classrooms (Jones et al., 2010). Some software combines algebra and
geometric packages (e.g. GeoGebra) (Hall & Chamblee, 2013). One main feature in Geometry
software that they afford “a way of building, and developing, our visual intuition across a range
of geometries” (Jones et al., 2010, p. 50). They also facilitate “watching and controlling
animations on the screen” (Butler, 2012, p. 44). Some software offer working in two-
dimensional or three-dimensional environments (e.g. Cabri, Autograph and GeoGebra). The
dragging feature in software like Cabri allows the user to watch continuous variation of the
object whose element is being dragged, while maintaining the mathematical relationships of
the constructed object (Jones et al., 2010; Sinclair & Yurita, 2008). Software like Cabri,
Autograph, GeoGebra and Desmos allow the user to see multiple representations that are
linked (Drijvers et al., 2009; Hall & Chamblee, 2013; Sinclair & Yurita, 2008). This includes
graphical, algebraic representations as well as computer based and paper-based ones. Another
feature is in the option of using sliders to control and continuously change values of some
variables; and watching the effect of this change on the graphical representation (Hall &
Chamblee, 2013). Mathematics-education software provides limited feedback to the students
by validating or not validating (e.g. not reserving one object’s intended mathematical
properties when one of its elements is dragged) their answer, and leave the prospect open for
students’ exploration and investigation (Drijvers et al., 2009). All these affordances come with
limitations. These include the flatness of screens and shortcomings in relation to the dragging

22
feature (Jones et al., 2010). Also, there are concerns about cases when users do not question
what they are seeing on the screen, leading them to non-reflective “fishing behaviour” (Artigue,
1995) in (Guin & Trouche, 1998).
This study aims to address issues of mathematics-education software use for teaching, in
relation to their affordances and limitations of software, but also in relation to how they are
used and balanced when integrated with other resources. For that purpose, the study needs to
use theoretical constructs and lenses. The next sections in this chapter will address some
theoretical constructs and lenses that are used to look at teaching, the section after identifies
which of those form the theoretical framework of this study. First, I review arguments and
discussion in relation to teachers’ knowledge, beliefs, practices and identities, and the
unexpected in the classroom. Then, I review four theoretical lenses that are used for observing
teaching: the teaching triad, the instrumental approach, the Documentational Approach and
the Knowledge Quartet respectively.
Teachers’ knowledge
Teachers’ knowledge is one of the factors that affect the teaching process, as it has implications
for what teachers teach, how they teach it and why they choose to teach it in specific way
(Mishra & Koehler, 2006; Shulman, 1986). Shulman’s (1986) work proposed that teachers’
knowledge includes subject matter knowledge (SMK), pedagogical content knowledge (PCK)
and curricular knowledge (CK). SMK represents teacher’s knowledge of the meanings and
concepts of the taught subject, as well as her knowledge of “why a particular proposition is
deemed warranted, why it is worth knowing, and how it relates to other propositions, both
within the discipline and without, both in theory and in practice” (Shulman, 1986, p. 9). It also
includes knowledge about how the subject’s facts are based on specific organisation of
perceptions and principles, and how the validity or truth of arguments is determined (Shulman,
1986). PCK concerns knowing how to present the subject’s concepts and make it accessible to
learners; this requires ability to explain and articulate the subject’s concepts using different
forms of representation where appropriate and taking into account the complexity of the
taught topics and how to make them more comprehensible to learners (Shulman, 1986).
Curricular knowledge (CK) represents the knowledge about the curriculum, framework and
teaching materials designed to teach a specific subject at a specific level. It also includes lateral
knowledge of the curriculum of other subjects taught at the same level (Shulman, 1986).
Furthermore, Shulman (1987) addressed the knowledge base which is “a codified or codifiable
aggregation of knowledge, skill, understanding, and technology, of ethics and disposition, of
23
collective responsibility — as well as a means for representing and communicating it” (p.4). He
described the knowledge base seven categories (p.8):
• Content knowledge
• General pedagogical knowledge including classroom management strategies
• Curriculum knowledge including knowledge about “materials and programs that serve
as "tools of the trade" for teachers”
• Pedagogical content knowledge
• Knowledge of learners and their characteristics
• Knowledge of educational contexts including knowledge about the classroom context,
school governance and financing and the culture of the community
• Knowledge of educational aims and values, along with their philosophical and historical
backgrounds.
Mishra and Koehler (2006) suggested the inclusion of knowledge about technology in teachers’
knowledge, they argued for extending Shulman’s pedagogical content knowledge PCK to
technological pedagogical content knowledge TPCK. The latter, they think, includes content
knowledge (CK), pedagogical knowledge (PK), technological knowledge (TK), the intersection
between each pair of these (pedagogical content knowledge (PCK), technological pedagogical
knowledge (TPK), technological content knowledge (TCK), and the intersection between the
three of them (TPCK). To explain what Mishra and Koehler (2006) have added in relation to
technology, I summarize their definitions of the technological knowledge as well as the last
three categories (TPK, TCK and TPCK). While PK and PCK definitions are based on those
mentioned earlier from Shulman (1987).
• Technological knowledge (TK) is the knowledge of how to use and manage standard
(e.g. books) and advanced technologies (e.g. digital Autograph software), and the
“ability to learn and adapt to new technologies” (Mishra & Koehler, 2006, p. 1028).
• Technological pedagogical knowledge (TPK) is about knowing how to use technology
for teaching and learning, for example for creating discussions and keeping progress
records (Mishra & Koehler, 2006).
• Technological content knowledge (TCK) is about the interplay between the content and
the technology, and how the content can be viewed and taught using a specific
technology (Mishra & Koehler, 2006). For example, how one can use GeoGebra to
construct geometrical shapes.
• Technological pedagogical content knowledge (TPCK):

24
“TPCK is the basis of good teaching with technology and requires an understanding of the
representation of concepts using technologies; pedagogical techniques that use
technologies in constructive ways to teach content; knowledge of what makes concepts
difficult or easy to learn and how technology can help redress some of the problems that
students face; knowledge of students’ prior knowledge and theories of epistemology; and
knowledge of how technologies can be used to build on existing knowledge and to develop
new epistemologies or strengthen old ones”. (Mishra & Koehler, 2006, p. 1029)
Also in relation to Shulman’s categories, Ball, Thames, and Phelps (2008, p. 402) suggested
what they described as a “refinement” of Shulman’s categories of knowledge. Their refinement
includes six categories defined as follows:
• Common content knowledge (CCK): the mathematical skills used in teaching as well as
other settings; by teachers as well as others. In brief, this knowledge is not exclusive to
teachers and teaching.
• Specialized content knowledge (SCK): the mathematical skills that are exclusive to
teaching, like “looking for patterns in students errors” (Ball et al., 2008, p. 400). It goes
beyond knowing what is being taught to students and requires higher awareness of
mathematical reasoning and interpretations. It also includes knowledge about
mathematical terminology and representations.
• Horizon knowledge: the knowledge about “how mathematical topics are related over
the span of mathematics included in the curriculum” (Ball et al., 2008, p. 403).
• Knowledge of content and students (KCS): includes teachers’ knowledge about
students as well as about mathematics. In other words, it looks at teachers’
appreciation of students’ needs, how they think and how they express their thoughts.
• Knowledge of content and teaching (KCT): includes teachers’ knowledge about teaching
as well as about mathematics, i.e. knowing how to design tasks and instructions, how
to sequence them, what representations and methods to use, and how to respond to
students’ ideas and contributions.
• Knowledge of content and curriculum: is the same as Shulman’s curricular knowledge.
The first three categories (common content knowledge, specialized content knowledge,
horizon knowledge) correspond subject matter knowledge and the last three (knowledge of
content and students, knowledge of content and teaching, knowledge of content and

25
curriculum) correspond pedagogical content knowledge and include curricular knowledge
(Figure 1). All of these categories come under what they called mathematical knowledge for
teaching (MKT) which is defined as the knowledge “entailed by teaching” referring to the
“mathematical knowledge needed to perform the recurrent tasks of teaching mathematics to
students” (Ball et al., 2008, p. 399).
Figure 1: MKT domains as in Ball et al. (2008, p. 403)
Carrillo-Yañez et al. (2018) argue that the MKT categories focus “on practice as carried out in
class, ignoring the knowledge that teachers might bring into play when carrying out any other
kind of activity as a teacher” (p. 238). They also argue that the overlay between categories
makes using the model for analysis difficult. Instead, they suggested a different model,
mathematics teachers’ specialised knowledge (MTSK), that in their opinion offers a clearer view
of the specialised knowledge teachers need for teaching. One that links mathematical
knowledge to the knowledge of its teaching and learning. Their MTSK includes two main
categories: Mathematical Knowledge and Pedagogical content knowledge, defined as follows:
• Mathematical Knowledge: Similar to Shulman’s definition of mathematical content
knowledge with broader view that considers the “characteristics of mathematics as a
scientific discipline, and at the same time recognise a differentiation between
Mathematics per se and School Mathematics” (Carrillo-Yañez et al., 2018, p. 240). It
includes three sub-domains: Knowledge of Topics which is about knowing the
mathematical content itself; Knowledge of the Structure of Mathematics which is about
the interlinks and connections between mathematical concepts; and Knowledge of
Practices in Mathematics which is about how one works systematically in mathematics
(Carrillo-Yañez et al., 2018).
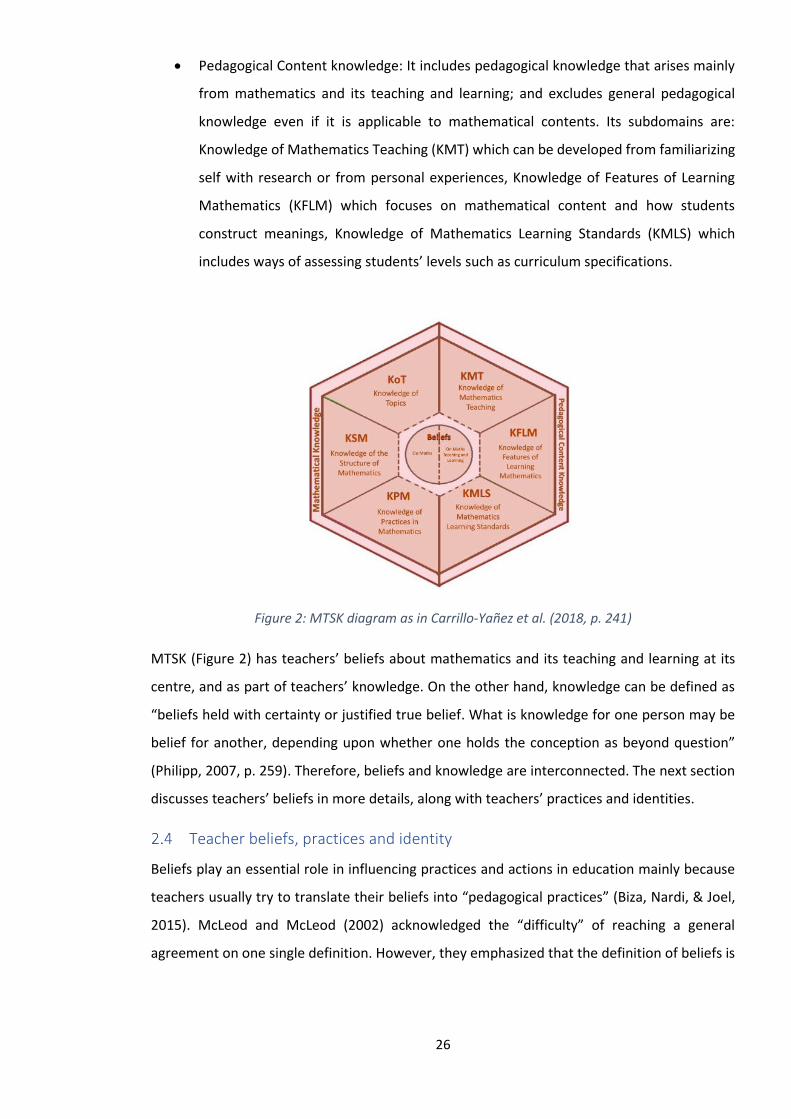
26
• Pedagogical Content knowledge: It includes pedagogical knowledge that arises mainly
from mathematics and its teaching and learning; and excludes general pedagogical
knowledge even if it is applicable to mathematical contents. Its subdomains are:
Knowledge of Mathematics Teaching (KMT) which can be developed from familiarizing
self with research or from personal experiences, Knowledge of Features of Learning
Mathematics (KFLM) which focuses on mathematical content and how students
construct meanings, Knowledge of Mathematics Learning Standards (KMLS) which
includes ways of assessing students’ levels such as curriculum specifications.
Figure 2: MTSK diagram as in Carrillo-Yañez et al. (2018, p. 241)
MTSK (Figure 2) has teachers’ beliefs about mathematics and its teaching and learning at its
centre, and as part of teachers’ knowledge. On the other hand, knowledge can be defined as
“beliefs held with certainty or justified true belief. What is knowledge for one person may be
belief for another, depending upon whether one holds the conception as beyond question”
(Philipp, 2007, p. 259). Therefore, beliefs and knowledge are interconnected. The next section
discusses teachers’ beliefs in more details, along with teachers’ practices and identities.
Teacher beliefs, practices and identity
Beliefs play an essential role in influencing practices and actions in education mainly because
teachers usually try to translate their beliefs into “pedagogical practices” (Biza, Nardi, & Joel,
2015). McLeod and McLeod (2002) acknowledged the “difficulty” of reaching a general
agreement on one single definition. However, they emphasized that the definition of beliefs is
27
audience and focus dependent (McLeod & McLeod, 2002). The definition adopted in this study
is:
Beliefs—Psychologically held understandings, premises, or propositions about the world that
are thought to be true. Beliefs are more cognitive, are felt less intensely, and are harder to
change than attitudes. Beliefs might be thought of as lenses that affect one’s view of some
aspect of the world or as dispositions toward action. Beliefs, unlike knowledge, may be held with
varying degrees of conviction and are not consensual. Beliefs are more cognitive than emotions
and attitudes. (Philipp, 2007, p. 259).
Research looked at teachers’ beliefs in relation to different areas including:
• Pedagogical beliefs: looking teachers’ preferences of a student-cantered approach or a
teacher-led one; how investigative and open-ended the tasks they choose are; and their
tendency to teach through playing, stories, or through the use of technology etc (Speer,
2005).
• Curricular beliefs (Philipp, 2007): These are about teachers’ instructional targets and
mathematical content, like consideration of specific solutions as valid/not valid
alternative methods (e.g. visual and algebraic solutions) and addressing a mathematical
skill as essential or advantage (e.g. factoring of linear equation (Speer, 2005)).
• Epistemological beliefs (Goos, 2013): These concern teachers’ beliefs about
mathematics, its nature, and methods.
• Technology-related beliefs (Philipp, 2007): These concern teachers’ individual
preferences of using or not using technology, and what types of technology use are
useful if any.
• Beliefs in relation to students (McLeod & McLeod, 2002; Philipp, 2007; Speer, 2005):
These concern how students think and learn, what they wish to achieve, and what their
behaviour is like.
• Beliefs about the social context: this was used by McLeod and McLeod (2002) to express
the students’ beliefs about the social context. However, the same category can be
helpful to address teachers’ beliefs about schools, policies, examinations, parents’
expectations, and social environment. This category enables one to extend focus and
address the social environment surrounding teachers within and outside schools.
28
Beliefs were categorized as “professed” -in reference to the verbally claimed ones- or
“attributed” -in reference to the ones reflected by practice- (Speer, 2005, p.361). They were
categorized also as espoused (i.e. stated) and enacted (i.e. refined by constraints and
contextual conditions, in order to be used in practice) (Ernest, 1989). Also in consideration of
contextual conditions, Hoyles (1992) did not approve the decontextualization of beliefs; and
argued that instead of talking about beliefs and beliefs-in-practice or about espoused and
enacted beliefs one should consider the “situatedness of beliefs” (p.40). Hoyles definition of
situated beliefs implied that they are dependent on the contexts in which they are shaped and
expressed like the classroom context. That in turn means that “situations are co-producers of
beliefs, and as situations differ, so do beliefs” (Skott, 2001, p. 5).
In addition, the complexity of the teaching situations imposes several contextual factors that
have impact on teachers’ classroom actions (Nardi et al., 2012; Speer, 2005). Therefore,
although teachers’ practices are performed by them and to some extent informed by their
beliefs, there are more factors in play and practices are not a perfect reflection of beliefs (Nardi
et al., 2012; Speer, 2005). Cyrino (2018) argues that teachers are subject to political
commitments and relationships including their school contexts and policies, educational
organizations, and public policies in relation to education. These institutional commitments
limit teachers’ control over their teaching and make them subject to rules they did not
establish. Steele (2005, p. 296) argues that teaching “is by nature conditional: conditional on
the students, the precise moment in time, the content at hand, the teachers’ beliefs, and so
forth”. This implies that any teaching act is highly contextualised and consequently unique due
to: institutional and contextual conditions that can play different roles even within one
classroom (Skott, 2001); and teachers’ beliefs are “mediated by the social contexts of
education” (Skott, 2001, p. 3) or even situated (Hoyles, 1992). To shed light on this, one can
consider the “practical rationality of teaching” which is “a network of dispositions activated in
specific situations” (Herbst & Chazan, 2003, p. 13). “Dispositions” here are contextual mutual
pledges and insights held by individuals sharing a profession, and are developed throughout
the course of work practice (Herbst & Chazan, 2003, p. 12). Using the practical rationality of
mathematics teaching one can study practices while taking into account the different
contextual conditions in relation to the actors’ personalities, institutions, circumstances,
epistemology, time issues and materials (Herbst & Chazan, 2003). Though, teachers’ agency in
the educational process should not be underestimated, as teachers act on these contexts in
the light of their beliefs and by reflecting on previous practices and experiences (Goos, 2013;
29
Hoyles, 1992; McLeod & McLeod, 2002). This latter combination of beliefs and practices is
addressed as teachers’ identities.
As beliefs and practices seem to continuously interact and affect the development of each
other, the concept of teachers’ identities was introduced to combine these two interrelated
concepts and offer a more productive tool of analysis (Lerman, 2001). By definition, “identity
is at the core of teachers’ ways of being and acting” (Thames & van Zoest, 2013, p. 583).
Therefore, Goos (2013) suggests a sociocultural analysis of “person-in-practice-in-person”
(p.522) that considers the individual’s contribution to learning through social interactions in its
first part, and those interactions influence on developing the person’s identity in its second is
appropriate to study teachers’ identities . According to Battey and Franke (2008), a focus on
identity facilitates seeing “teacher learning as both situated in practice and as an integrated,
complex system embedded in the structures, histories, and cultures of schools” (p.127). They
argue that identity can be used to examine and distinguish between how teachers perceive
professional development and how they put it into practice. “The construct of identity allows
us to begin to understand why professional development can look very different as teachers
take new ideas and put them into classroom practice” (Battey & Franke, 2008, pp. 127-128).
Studying identity affords “a practice-based approach”, and means of developing strategical use
of identity as a source of practice and practice development (Thames & van Zoest, 2013). Thus,
in this study, the attention is on identity, where identity includes the individual’s ways of
thinking, acting, and interacting (Philipp, 2007). This is because the sociocultural approach (like
in the case of teachers’ identity) focuses on actions, where actions “have a psychological
moment or dimension” without limiting that to individualistic psychological analysis (Wertsch,
Rio, & Alvarez, 1995, p. 10). In other words, psychological approaches lie within the
sociocultural approach (Kieran, Forman, & Sfard, 2002; Wertsch et al., 1995). This implies that
identity embraces psychological theoretical constructs such as the interrelated beliefs and
knowledge about subject matter, its teaching and learning, and teacher’s self-efficacy and ways
of work (Collopy, 2003; Cyrino, 2018). Cyrino (2018) adds to these teachers’ vulnerability and
sense of agency, where vulnerability is not seen as a weakening aspect but one that allows
teachers to identify their difficulties and limitations (for example, in case of a critical incident)
and deal with them. This in turn helps them develop a sense of agency in relation to where they
position themselves within a specific context of practice (Cyrino, 2018). In turn, “agency is
always mediated by the interaction between the individual (attributes and inclinations), and
the tools and structures of a social setting” (Lasky, 2005, p. 900). In general, according to

30
Wenger (1998) “identity in practice is defined socially not merely because it is reified in a social
discourse of the self and of social categories, but also because it is produced as a lived
experience of participation in specific communities” (p. 151). Hence, identity is developed and
negotiated through engagement with sociocultural contexts. Sfard and Prusak (2005) suggest
that identity is used in research that aims to investigate “human beings in action and on the
mechanisms underlying human action” (p. 14). They define identities as “collections of stories
about persons” (p.15); argue that “they are collectively shaped even if individually told, and
they can change according to the authors' and recipients' perceptions and needs” (p.17); and
stress the dynamic nature of identities as the stories that constitute them evolve. Due to “the
dynamic nature of identity as something that is constantly negotiated through the interplay of
one’s lived experience in the world and how [s/he] and others discursively interpret that
experience” Goos (2013, p. 522), Teachers, while planning and teaching, are surrounded by
many factors to consider. Those factors in turn help form and re-form the teacher’s identity
including their knowledge, beliefs and practices. Among these factors, there are some
unexpected ones and this is what the next section discusses.
The unexpected in the classroom
One face of the complexity of teaching is that although teachers can plan their intended
classroom actions, they cannot predict their students’ responses and contributions (Rowland,
Huckstep, & Thwaites, 2005). This implies that teachers need to act spontaneously in many
situations. “Split-second decision making is a crucial aspect of teaching. Given the daily
madness of life in a classroom, considering all the options and consequences is difficult” (Hole
& McEntee, 1999, p. 35). Hence, Lampert and Ball (1999) argue that teaching requires more
than applying pre-learnt teaching knowledge; it actually “depends fundamentally on being able
to know things in the situation” (p.37). That is to know about the things as they are happening,
things the teacher has not learnt about and cannot predict (e.g. student engagement in the
lesson). And, in light of that momentary “uncertain, provisional, evolving knowledge”, the
teacher must act (Lampert & Ball, 1999, p. 38). That is “to be prepared for the unpredictable”
as well as the predictable (Lampert & Ball, 1999, p. 39). The unpredictable in turn, makes
decision making complex and dependent on the individual’s momentary judgement rather than
professionals’ advice (Rowland et al., 2015).
Any unpredictable moment or event in teaching is described by Thames and van Zoest (2013)
as “pivotal teaching moment” and defined as “an instance in a classroom lesson in which an
interruption in the flow of the lesson provides the teacher an opportunity to modify instruction
31
in order to extend or change the nature of students’ mathematical understanding” (p.127) .
While the term “teachable moments” is used by Arafeh, Smerdon, and Snow (2001) and
defined as “the set of behaviors within a lesson that indicated students are ripe for, or receptive
to, learning because they express confusion, misunderstanding, uncertainty, struggle, or
difficulty with a mathematical problem, concept, or procedure” (pp. 2–3). Similar moments
were looked at using the Knowledge Quartet framework as contingent moments (Rowland et
al., 2005). Also, within technology settings such moments were addressed using the hiccups
framework (Clark-Wilson & Noss, 2015), as discussed in the technology in mathematics
education section (section 2.2.2). Although the four terms look at unexpected moments, one
main difference is that teachable moments, contingent moments and pivotal teaching
moments are identifiable by researchers while hiccups must be recognised and identified by
teachers. The second main difference is that hiccups occur when the “technology informs and
underpins the contributions made by students whilst also impinging directly on classroom
practices when it is used as a mathematical authority within whole-class teaching episodes –
to which the teacher is expected to respond” (Clark-Wilson & Noss, 2015, p. 100). Contingent
moments are discussed in detail in the following section.
Observing Teaching
The teaching and learning process is the result of a complex set of interactions in and outside
classrooms (Ball, 1988). Teachers, while planning and teaching, are surrounded by many factors
that form and re-form the teacher’s identity. In the classroom, interactions emerge as
interrelated sets of contributions from the teacher and the students (Skott, 2001). Such
interactions were studied using theories like the Teaching Triad (Jaworski, 1994), Knowledge
Quartet (Rowland et al., 2005), Instrumental Approach (Trouche, 2004), and the
Documentational Approach (Gueudet et al., 2014; Gueudet & Trouche, 2009). A brief review of
these theories is presented in this section, while a more detailed review of the Knowledge
Quartet and the Documentational Approach, is offered in the next section.
The Teaching Triad
The Teaching Triad (TT) looks at teaching as an act of harmony between three factors: student
sensitivity (SS), mathematical challenge (MC) and management of learning (ML) (Jaworski,
1994). These factors are evident when a teacher plans a lesson and starts to think of how to
consider teaching a specific mathematical idea (MC), his/her particular students’ needs (SS),
the best way to work on the task with the students (ML) (group work, individual work or
classroom discussion). The same factors will be in play during lessons, but within a different

32
context as this time the interactions with the students are happening and the teacher has to
respond on demand, in many cases not according to what was planned. So, the TT offers a
simple representation for the rich social interactions mathematics teachers have to balance,
from a constructivist point of view. It can be “used as an analytical device (by the researchers)
and as a reflective agent for teaching development (by the teachers) ” (Potari & Jaworski, 2002,
p. 351). As a complement to the Teaching Triad, there is a fourth dimension that is strongly
evident and affects teachers’ plans and practices, that is the social factor which is the social
dimension. (Potari & Psycharis, 2018) argue that sensitivity to students’ needs (SS) has a social
dimension (SSS) which involves sensitivity to students’ social background, as well as an affective
dimension (e.g., praising students) (SSA) and a cognitive dimension (e.g., inviting students’
contributions) (SSC). In fact, social factors include some that Jaworski (1994) already addressed
in her book, like time pressure having to go through a set syllabus, the requirement that
students know specific things for examinations purposes, expectations from the teacher,
school ethos, and the training provided for teachers (Jaworski, 1994; Potari & Jaworski, 2002).
Social factors were considered in Jaworski (1994) and Potari and Jaworski (2002) as part of their
“macro analysis” of classroom interactions, but not in their “micro analysis” of dialogues, but
were also included in their presentation of classroom interactions in light of the teaching triad.
The consideration of social factors is also supported by the way Goos (2013) recognised the
activities “permitted”/ “offered” to teachers within a specific environment (Goos, 2013, p.523),
she argued that “teachers re-organize aspects of their professional environment to better align
with goals emerging from new knowledge or changed beliefs”. Social factors include students’
social culture, teaching resources and materials, syllabus, assessment schemes, time
restrictions, room constraints, and cultural considerations of what constitutes good teaching
practices (Goos, 2013). In relation to the use of technology in mathematics classes, social
factors also come from school or government policies regarding such use and the facilities
offered to promote it. So, social factors are at the centre of teachers’ work, and the teaching
triad should be extended to include social factors in order to reflect the complexity of the
factors teachers face when trying to put their knowledge into practice.
Instrumental Approach
Influenced by Vygotsky’s sociocultural perspective (Vygotskii, 1978), the instrumental
approach considers tools as active carriers of social experiences and an important part of that
learning environment (Trouche, 2004). Hence, “emphasis is put on the fact that, due to their
characteristics and also due to the way they shape and constrain the possibilities of interaction
with mathematical objects, they deeply condition the mathematics which can be produced and
33
learnt” (Artigue, 1997, p. 2) in (Guin & Trouche, 1998, p. 199). (Trouche & Drijvers, 2014) argue
that the instrumental approach “highlights the importance of a meaningful relationship
between a tool and its user for carrying out a specific task” (p.194).
The instrumental approach (Guin & Trouche, 1998; Trouche, 2004) started by looking at
students’ interactions with artefacts and how they transform them into instruments. Here, an
artefact is an object designed and used for a specific purpose (Gueudet et al., 2014; Gueudet
& Trouche, 2009; Trouche & Drijvers, 2014), it could be a mathematical technique for solving a
specific problem, or a tool like a pen. An instrument is developed when the artefact is used by
the subject according to a specific scheme to achieve a specific purpose (Gueudet et al., 2014;
Gueudet & Trouche, 2009; Trouche & Drijvers, 2014). A scheme here is defined as a set of
organized procedures carried out on an artefact; it consists of aims of use and invariant
utilization scheme (Gueudet & Trouche, 2009). The utilization scheme includes the subject’s
aims of the activity, operational invariants (i.e. perceptions established throughout the activity
to be used in comparable situations), and inferences or conclusions the subject reaches due to
specific experiences. The complex process of creating an instrument is called instrumental
genesis, it includes both instrumentation and instrumentalization: instrumentation refers to
the artefact affecting the subject’s actions and knowledge; and instrumentalization refers to
the subject’s perceptions affecting the way the artefact is used (Gueudet et al., 2014; Gueudet
& Trouche, 2009; Trouche & Drijvers, 2014). Instrumentation is influenced by the artefact’s
affordances (e.g. commands in a software) and limitations; while instrumentalization is
dependent on the user (e.g. discovery approach); and the two processes are interlinked
(Trouche, 2004). “In the instrumental approach, developing techniques is creating reasons”,
and is entwined with “conceptualisation” (Trouche & Drijvers, 2014, p. 196). Schemes carry
individual and social aspects, and so do instrumental genesis (Trouche, 2004). The balance
between the individual and the social is influenced by: whether the artefact facilitates group
or individual work; the availability of the artefact; and, the way the teacher integrates the
artefact in class (Trouche, 2004).
Initially, the teacher’s role in the classroom was addressed under instrumental orchestration
which is the act of organising the learning environment (space, time, dialogs…) by the teacher,
whose responsibility is to manage the students’ instrumental genesis according to the
requisites of the task (Trouche, 2004). Attributing the role of orchestra conductor to the teacher
“allows some variation, playing on the kind of orchestra—the jazz band offers room for student
improvisation, the choice of the score, the choice of the didactical configuration. But in each of
these cases, the teacher is always central” (Trouche & Drijvers, 2014, p. 199). Trouche and
34
Drijvers (2014) note that the initial idea of instrumental orchestration “included didactical
configuration and exploitation modes […] and as such did not focus on the dynamic adaptions
made on the fly” (p.201). Later on, Gueudet and Trouche (2009) and Trouche and Drijvers
(2014) argued that teachers’ activities also involve a process of geneses in order to dynamically
integrate different resources, hence the Documentational Approach was developed as
explained in the next section.
Documentational Approach
The Documentational Approach was developed to look at teachers’ work when they integrate
different resources (Gueudet & Trouche, 2009). Hence, the above Instrumental Approach
theoretical constructs were expanded to establish the Documentational Approach (Gueudet et
al., 2014; Gueudet & Trouche, 2009) theoretical constructs. So, resources were defined as
“anything that can possibly intervene in [a teacher’s] activity”, to include artefacts, teaching
materials, and even social and cultural interactions that affect a teacher’s teaching or
preparation work (Gueudet et al., 2014, p. 142). An artefact is defined as mentioned in the
previous section, as an object designed for a specific purpose. Teaching materials are
textbooks, calculators, and any other materials designed for teaching mathematics (Adler,
2000). Social and cultural interactions are the interactions with the environment, students and
colleagues, for example a student’s feedback on an activity (Gueudet & Trouche, 2009). Both
Gueudet and Trouche (2009, p. 205) and Gueudet et al. (2014, p. 141) referred to Adler’s (2000)
definition of a resource “as the verb re-source, to source again or differently” (Adler, 2000, p.
207). This implies that teachers interact with resources, manage them and reuse them to
achieve their teaching aims (Gueudet, 2017).
"Teachers look for resources, though sometimes they meet resources that they were not looking
for (discussions with a colleague at the coffee machine, for example). They associate these
resources, modify them, conceive their own resources and use them with students." (Gueudet,
2017, p. 201)
Because “the effectiveness of resources for mathematical learning lies in their use, that is, in
the classroom teaching and learning context” (Adler, 2000, p. 205), the Documentational
Approach was developed to look at teachers’ use of resources. It examines how a teacher
develops documents, where a document is a set of resources used according to a specific
scheme for a specific goal (Gueudet et al., 2014). The scheme was addressed (Gueudet &
Trouche, 2009) as a utilization scheme with a specific goal, operational invariants and usage.
While in later work a scheme was defined as a set of organized procedures carried out on an

35
artefact; consisting of “the goal of the activity; rules of action; operational invariants; and
inferences” (Gueudet et al., 2014, p. 140, italics in original):
• The aim of the teaching activity represents the teacher’s goal, for example revising for
the examinations. González-Martín, Nardi, and Biza (2018) suggest that aims can be
general (e.g. to teach a specific topic) or specific (e.g. to solve a specific textbook
question).
• The rules of action are the actions the teacher follows to achieve her goals like solving
past-examination questions on a specific topic (Gueudet, 2017). Like in the case of aims,
rules of actions can be split into general (e.g. to do a specific activity on Autograph) and
specific (e.g. to start the activity by asking the students a specific question).
• Operational invariants are the perceptions established throughout the activity to be
used in comparable situations (Gueudet et al., 2014; Gueudet & Trouche, 2009), for
example past examination papers are a good resource for examination revision as they
familiarize students with examination-style questions. For teachers, this is
“professional knowledge” (Gueudet et al., 2014, p. 142), they are the reasons adopted
by a teacher to justify her stable actions in a range of similar situations. More recently,
they have been addressed as “beliefs and knowledge in action” (Trouche, Gitirana,
Miyakawa, Pepin, & Wang, 2019, p. 54).
• Inferences are the interpretations and conclusions a teacher reaches due to specific
teaching experiences.
Hence, a documented action scheme is the set of procedures a teacher develops to make use
of resources (Gueudet et al., 2014). And a teacher’s documentational work is the set of
resources encountered, collected, amended or developed by a teacher for a specific goal
(Gueudet et al., 2014). A resource system is “the set of resources accumulated and organised
(over time) by a teacher in line with his/her regular teaching activity” (Trouche et al., 2019, p.
54). The process of developing schemes for adapting different sets of resources to achieve a
specific target is called the Documentational Genesis (Gueudet et al., 2014; Gueudet & Trouche,
2009). The Documentational Approach studies the development of “structured documentation
system[s]” that represent teachers’ work and progress as a result of influencing and being
influenced by different resources (Gueudet et al., 2014). The Documentational Approach offers
an overview of a teacher’s work including the resources, teacher’s goals, rules of actions,
operational invariants and inferences. It acknowledges that “resources are essentially social, as
they take place, for example, in schools, or via Internet, and often in collectives” (Trouche et
al., 2019, p. 54). Moreover, it facilitates viewing “digital technologies simply as a particular type

36
of resource amongst a wider range of curriculum resources and not as something special or
unique” (Bretscher, 2014, p. 46).
The Knowledge Quartet
The Knowledge Quartet (Rowland et al., 2005) was initially developed as a tool for analysing
and reflecting on teachers’ knowledge and beliefs with the aim of developing mathematics
teaching. It was empirically developed as a conceptual framework to reflect on elementary
trainees’ mathematical knowledge and initiate discussions between teacher educators,
trainees and teacher-mentors during school-based placements (Rowland et al., 2005). Its scope
was then widened to include elementary and secondary in service teachers and trainees (e.g.
Rowland (2010), Turner (2008) and (Carrillo, 2011)). It is argued that “the quartet is
comprehensive as a tool for thinking about the ways that subject knowledge comes into play
in the classroom” (Rowland et al., 2005, p. 259). According to Rowland et al. (2005) subject
knowledge in this case includes both Shulman’s (1986) subject matter knowledge (SMK) and
pedagogical content knowledge (PCK). Based on SMK and PCK, the Quartet was developed as
“a framework for the observation, analysis and development of mathematics teaching, with a
focus on the teacher’s mathematical content knowledge” (Thwaites, Jared, & Rowland, 2011,
p. 227). The Quartet is defined by its four dimensions: Foundation, Transformation, Connection
and Contingency (Rowland et al., 2009, p. 29), under each of these dimensions Rowland et al.
(2005) and Thwaites et al. (2011) used codes that emerged empirically. Table 1 which is taken
from Rowland and Turner (2017, p. 106) summarizes the Quartet’s dimensions and their
contributory codes. I include in the following subsection the definitions of each of the four
dimensions and their constituent codes.
The Knowledge Quartet’s dimensions
The Quartet’s dimensions and their constituent codes are explained in the list below. In this
list, and also for the rest of the thesis, the Quartet’s dimensions the Quartet’s dimensions are
capitalized and italicized (e.g. Foundation) and their contributory codes are italicized (e.g.
identifying errors).
• Foundation
The first dimension “Foundation” represents teachers’ knowledge and beliefs that they acquire
during academic studies or practice. Knowledge here includes their knowledge about
mathematics as well as about the teaching and learning of mathematics. The knowledge about
mathematics goes beyond instrumental understanding of mathematics to involve “knowing
why”; it also includes “careful and deliberate” use of mathematical terminology (Rowland et
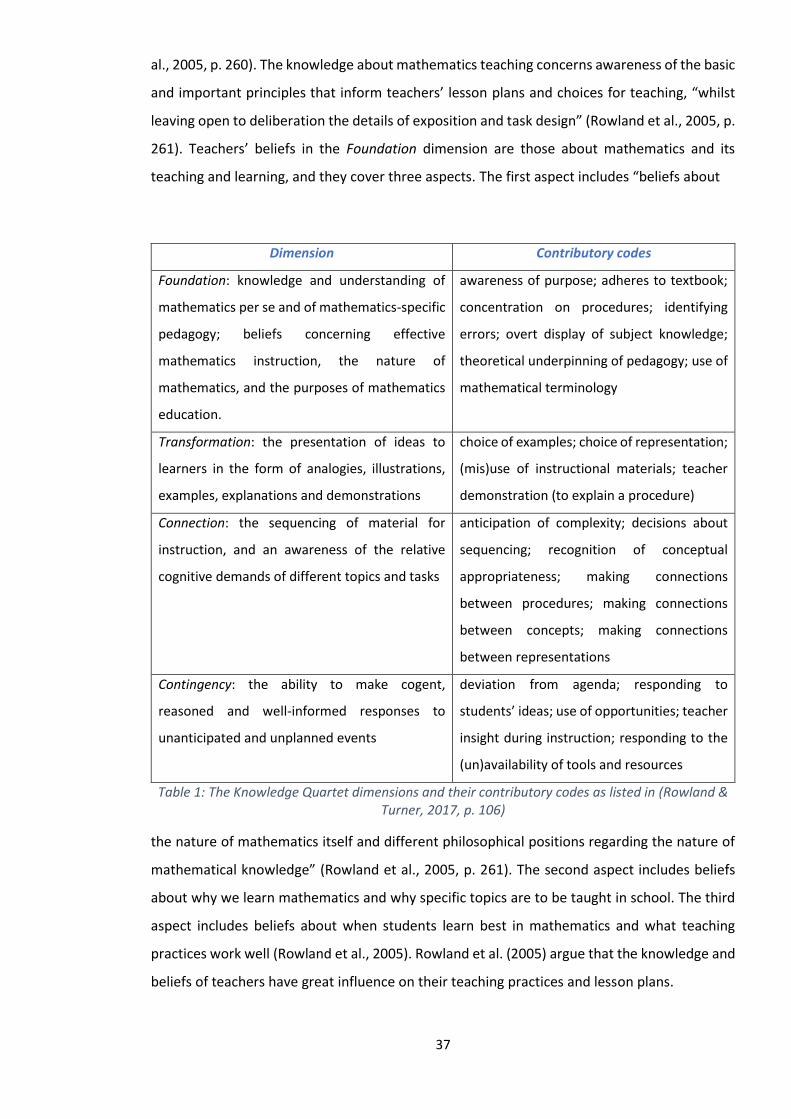
37
al., 2005, p. 260). The knowledge about mathematics teaching concerns awareness of the basic
and important principles that inform teachers’ lesson plans and choices for teaching, “whilst
leaving open to deliberation the details of exposition and task design” (Rowland et al., 2005, p.
261). Teachers’ beliefs in the Foundation dimension are those about mathematics and its
teaching and learning, and they cover three aspects. The first aspect includes “beliefs about
Dimension Contributory codes
Foundation: knowledge and understanding of
mathematics per se and of mathematics-specific
pedagogy; beliefs concerning effective
mathematics instruction, the nature of
mathematics, and the purposes of mathematics
education.
awareness of purpose; adheres to textbook;
concentration on procedures; identifying
errors; overt display of subject knowledge;
theoretical underpinning of pedagogy; use of
mathematical terminology
Transformation: the presentation of ideas to
learners in the form of analogies, illustrations,
examples, explanations and demonstrations
choice of examples; choice of representation;
(mis)use of instructional materials; teacher
demonstration (to explain a procedure)
Connection: the sequencing of material for
instruction, and an awareness of the relative
cognitive demands of different topics and tasks
anticipation of complexity; decisions about
sequencing; recognition of conceptual
appropriateness; making connections
between procedures; making connections
between concepts; making connections
between representations
Contingency: the ability to make cogent,
reasoned and well-informed responses to
unanticipated and unplanned events
deviation from agenda; responding to
students’ ideas; use of opportunities; teacher
insight during instruction; responding to the
(un)availability of tools and resources
Table 1: The Knowledge Quartet dimensions and their contributory codes as listed in (Rowland & Turner, 2017, p. 106)
the nature of mathematics itself and different philosophical positions regarding the nature of
mathematical knowledge” (Rowland et al., 2005, p. 261). The second aspect includes beliefs
about why we learn mathematics and why specific topics are to be taught in school. The third
aspect includes beliefs about when students learn best in mathematics and what teaching
practices work well (Rowland et al., 2005). Rowland et al. (2005) argue that the knowledge and
beliefs of teachers have great influence on their teaching practices and lesson plans.
38
Rowland (2010) compares the foundation knowledge needed for teaching elementary school
mathematics and that needed for teaching secondary school mathematics. He suggests that
establishing the foundations of learners’ mathematical knowledge during elementary school
years carries its own difficulty and requires considerable PCK knowledge in relevance to the
basics of mathematics. This is because the teacher is working on making basic concepts (e.g.
subtraction), that are very simple and self-evident to educated people, accessible to young
learners. To the teacher, such concept is “invisible until it becomes necessary to know it”, and
this makes teaching it challenging (Rowland, 2010, p. 1841). While, teaching at secondary level
requires more advanced MCK which includes appreciation of the complexity of the taught
concepts, the required prerequisite knowledge, and the representation systems in school
mathematics education.
Under the Foundation dimension, we find codes addressing teachers’ knowledge and beliefs:
adheres to textbook, awareness of purpose, concentration on procedures, identifying errors,
overt display of subject knowledge, theoretical underpinning of pedagogy and use of
mathematical terminology (Rowland & Turner, 2017; Turner & Rowland, 2011).
While the Foundation dimension focuses on teachers’ mathematical knowledge, the rest of the
Quartet dimensions discussed in the following “focus on knowledge-in-action” by looking at
how the teacher’s knowledge is employed during teaching and lesson planning (Rowland et al.,
2005, p. 261).
• Transformation
The Transformation dimension “concerns the ways that teachers make what they know
accessible to learners, and focuses in particular on their choice and use of representations and
examples” (Thwaites et al., 2011, p. 227). It examines how teachers illustrate mathematical
concepts and ideas to students by looking at: the examples they use (e.g. a selected exercise
for students’ activity); the representations they employ (e.g. graph or table); the instructional
materials they opt for (e.g. textbook or worksheet); and the demonstrations they give to
convey the mathematical ideas to the learners. These aspects are all informed by teachers’
knowledge and also by the literature resources available to them for example through their
institutions, professional development training or even on the internet (Rowland et al., 2005).
The codes for the transformation dimension are about the teacher’s choice of examples, choice
of representation, demonstration, and (mis)use of instructional materials (Rowland & Turner,
2017; Turner & Rowland, 2011). In this dimension, the focus on choices of representations and
examples led to recommendations in relation to these two aspects. Rowland et al. (2009)
39
recommend that teachers should “consider how different representations act as ‘scaffolds’
between concrete (enactive) experience and the abstract (symbolic) recording used in
mathematics” (p.65). They also suggest that “randomly generated examples” (p.99) should be
avoided, and that examples should be chosen after careful consideration of their educational
aims.
• Connection
The Connection dimension (Rowland et al., 2005) focuses on teacher’s choices in terms of the
plan of lesson, the sequence of activities, connecting ideas and concepts and doing so in a
coherent way. These choices are related to the mathematical content and to “the coherence
of the planning or teaching displayed across an episode, lesson or series of lessons” (Rowland
et al., 2005, p. 262). This coherence is examined in terms of: the teacher’s awareness of the
mathematical content’s integrity; her/his organization of the mathematical discourse during
lessons; and the ordering of topics and instructions s/he chooses to follow within and between
lessons (e.g. ordering of exercises) (Rowland et al., 2005). These “reflect deliberations and
choices entailing not only knowledge of structural connections within mathematics itself, but
also awareness of the relative cognitive demands of different topics and tasks” (Rowland et al.,
2005, p. 263). The codes under the connection dimension are anticipation of complexity,
decisions about sequencing, making connections between procedures, making connections
between concepts, making connections between representations, and recognition of
conceptual appropriateness (Rowland & Turner, 2017; Turner & Rowland, 2011).
• Contingency
The Contingency dimension “concerns responses to unanticipated and unplanned events: until
now, these have centred on responses to unexpected pupil contributions, and also on notable
‘in-flight’ teacher insights” (Thwaites et al., 2011, p. 227). Rowland et al. (2015) recognised
three triggers of contingency: the teacher reassessing the lesson plan; students giving an
unexpected contribution; more/less pedagogical tools and artefacts available. Thus, this
dimension includes the codes: deviation from agenda, responding to students’ ideas, use of
opportunities, responding to the (un)availability of tools and resources, and teacher insight
during instruction (Thwaites et al., 2011; Turner & Rowland, 2011). The first and third codes
are triggered by the teacher, the second code is triggered by students and the fourth code is
triggered by tools and resources (Rowland et al., 2015). The fifth code is also triggered by the
teacher (Rowland & Turner, 2017). In response to unexpected students’ ideas, a teacher can
choose “to ignore, to acknowledge but put aside, and to acknowledge and incorporate”

40
(Rowland et al., 2015, p. 79). One should also distinguish “between the contingent action of
the teacher and the contingent potential of the situation” (Rowland et al., 2015, p. 88). The
first refers to the instantaneous teacher’s response to a trigger of contingency. The latter is
about the teachers’ potential development which can result from reflecting on the contingent
moments along with teachers’ corresponding actions. This development arises either when a
teacher realizes that her/his contingent action is inadequate and reflects on it; or when the
teacher does not realize such inadequacy but a more experienced observer brings it to the
teacher’s attention for reflection (Rowland et al., 2015).
Rowland et al. (2015, p. 88) recognised that the data used to give rise to the Knowledge
Quartet’s Contingency did not include:
“… technology-related trigger of contingency, in which the technology functions as intended but
with unexpected consequences. This might be expected to occur especially when a technology
resource (such as a graph plotter, spreadsheet, dynamic geometry environment) is used in an
exploratory way in the course of teaching” (p.88).
Thus, technology-related moments that are similar to Rowland’s contingent moments were
described by (Clark-Wilson, 2013) as “hiccups” where the latter are also “moments that are
almost impossible to plan for” (Rowland et al., 2005, p. 263). Although hiccups are similar to
the contingent moments suggested by Rowland et al. (2005), the main difference between the
two is the technology factor. Hiccups are the result of working with technology in classrooms
(Clark-Wilson & Noss, 2015). Another difference is teacher’s awareness of the hiccups when
they happen, which is not always the case with Contingency. In summary, the hiccups
framework is used to reflect on unexpected events in classroom and not on teachers’ actions;
it is technology specific and includes only events noticed by the teacher. For this study, we find
contingent moment a more suitable tool that helps reflect on teachers’ practices with and
without the use of technology, regardless of whether the teacher notices the contingency or
not. Further aspects that lead to this choice of the Knowledge Quartet are discussed in the
following section.
Theoretical framework
To look at teachers work with resources; I use two theories: the Documentational Approach
and the Knowledge Quartet. Rationale behind these choices are explained in this section.

41
Why the Knowledge Quartet?
The Knowledge Quartet (KQ) can be used to reflect on teachers’ actions in class and not only
their knowledge (Neubrand, 2018). It offers a tool to explore teachers’ work in detail focusing
on teachers’ practices in classroom. According to Carrillo (2011, p. 274) the Quartet affords
analysis that does not only focus on “management issues” in teaching, but goes beyond that
by placing teachers’ mathematical knowledge at the centre of the analysis of mathematics
teaching. It even goes beyond looking at teachers’ professional knowledge to looking at
teachers’ practices and their knowledge “in action” (Carrillo, 2011, p. 275; Rowland, Turner, &
Thwaites, 2014, p. 319), which is “the knowledge that can be observed in the actual practice of
teaching” (Carrillo, 2011, p. 275). The importance of knowledge in action is based on the
argument that this knowledge impacts on students’ learning and developing it develops
learning outcomes (Carrillo, 2011). In other words “practice is both the source of problems and
the space for implementing possible solutions and approaches”(Carrillo, 2011, p. 275), thus any
study using this framework should start from the classroom.
The Knowledge Quartet is a tool that is “manageable, and not overburdened with structural
complexity” (Rowland et al., 2005, p. 256). Corcoran and Pepperell (2011) used the Quartet
and noted how the four dimensions should not be perceived as linear. In their study, and with
focus on students’ learning, participants looked at the Contingency dimension first and then
moved to Connection, Transformation and Foundation dimensions respectively. Thus, the four
dimensions are manageable and can be reordered in order to promote a specific focus that
might seem more relevant to a chosen ‘first’ dimension (Carrillo, 2011).
“The four dimensions of the KQ apparently seem to react to the broad band of possible actions
a teacher is exposed to before and during the giving of a lesson. Indeed, the KQ works quite well
in interpreting what can be seen in a mathematics lesson from outside” (Neubrand, 2018, p.
608)
However, considering that the data the Knowledge Quartet originally used did not include
lessons where digital resources were used (Rowland et al., 2015), more codes might be needed
to address the use of such resources. Oates, Callingham and Hay (2019) support the use of the
Knowledge Quartet to explore teachers’ knowledge when using technology, and suggest that
such a use may impact on the contributory codes and lead to extending or modifying them.
Also, Rowland et al. (2015) do not eliminate the possibility of finding more triggers of
contingency when looking at different data sets.
42
Although our experience to date indicates that the fundamental anatomy of the Knowledge
Quartet is complete, we take the view that the details of its component codes, and the
conceptualisation of each of its dimensions, are perpetually open to revision. This fallibilist
position seems to us to be as appropriate for a theory of knowledge-in-mathematics-teaching
as it is for mathematics itself. (Rowland & Turner, 2017, p. 108)
Why the Documentational Approach (DA)?
The Documentational Approach offers an overview of a teacher’s work including the resources,
teacher’s goals, rules of actions, operational invariants and inferences. Most of these will not
be covered if the Knowledge Quartet is used on its own. As well, “the documentational
approach aims at presenting a more holistic view of the teachers’ activity. It can naturally be
used to study technology integration phenomena and more generally to understand the
professional evolutions resulting from the generalised availability of digital resources”
(Gueudet & Trouche, 2011, p. 38). It facilitates a wider view of resources, inclusive of digital
resources but not singling them out (Bretscher, 2014). It even embraces considerations of
institutional factors, such as time pressure and the working environment (Bretscher, 2014).
Furthermore, the instrumental orchestration offers a descriptive classification of technology
use, so another tool is needed to cover the combination of resources and the details of
teacher’s actions. González-Martín et al. (2018) argue that “[w]hile DA says much about the
use of resources but not about the user, we believe that individual agency needs to come into
consideration in teachers’ documentation work” (González-Martín et al., 2018, p. 251). In order
to consider teachers’ agency, González-Martín et al. (2018) take into account what Chevallard
(2003) termed as teachers’ “personal relationship” with the topic to be taught, in other words
“their overall experiences as students and teachers of mathematics and its teaching”
(González-Martín et al., 2018, p. 233). In order to say more about the user (teacher), this study
uses the Knowledge Quartet to include and consider teachers’ beliefs-, practices- and
knowledge-in-action where appropriate.
The Documentational Approach in tandem with the Knowledge Quartet
As explained in the previous two sections the Documentational Approach helped me identify
the more general elements in a lesson observation; while the Knowledge Quartet dimensions
afford looking deeper into the details. Considering my interest in looking at how secondary
mathematics teachers work with resources including technology in their classroom, and having
in mind the Documentational Approach and Knowledge Quartet lenses, my research question
can be supported by two sub-questions as follows:

43
Research question (RQ): How do secondary mathematics teachers work with resources
including technology in their classroom?
I. What are their resource systems and their scheme of work?
II. How do they enact their schemes of work in class?
The first sub-question is answered using the Documentational Approach. The second sub-
question is answered using both the Documentational Approach and the Knowledge Quartet.
This allows me to move from the overview using the scheme of work from the former, to the
details using the dimensions of the latter: Foundation, Transformation, Connection,
Contingency. For the purpose of this study, the documentational genesis is not discussed
because it is beyond the focus of this work. Hence, there was no long-term observations and
detailed documentation by the teacher as in some DA studies. The elements that are used here
from the Documentational Approach are the ones related to teacher’s document: resources
and schemes of work including aims, rules of action, operational invariants and inferences. The
two lenses Documentational Approach and Knowledge Quartet, are used to explore how
teachers’ work with technology by addressing the two sub-questions I and II; and by using the
methodological approach and study design that are explained in detail in the next chapter
(methodology).

44
Methodology
Methodological Approach
This study focuses on teachers’ work with resources, when they employ mathematics-
education software along with other resources, in secondary mathematics lesson. According to
Adler et al. (2005, p.369) “[h]aving teachers as the focus of research leads to high complexity.
This increases the tendency to keep the sample small in order to reduce complexity” (Roesken-
Winter, Hoyles, & Blomke, 2015, p. 5). So, qualitative methods will be used in order to provide
rich qualitative findings with better understanding and higher validity (May, 2001; Merriam &
Tisdell, 2016). A “qualitative research is a situated activity that locates the observer in the
world. Qualitative research consists of a set of interpretive, material practices that make the
world visible” (Denzin and Lincoln, 2013, p.6). A qualitative research methodology will help me
understand how teachers “interpret their experiences, how they construct their worlds, and
what meaning they attribute to their experiences” (Merriam & Tisdell, 2016, p. 6). It will
facilitate listening to several views on lived experiences and social situations (Hesse-Biber,
2010). In this approach, the participants’ views are sought by the researcher who considers
the social reality as subjective and diverse; in other words “there is not just one story but
multiple stories of lived experience” (Hesse-Biber, 2010, p. 455). This implies that the
qualitative approach values participants’ reflections and empower them. This however does
not eliminate the researcher’s subjectivity and the impact of the theoretical framework on the
analysis (Merriam & Tisdell, 2016). As in other qualitative studies, in this study “the focus is on
process, understanding, and meaning; the researcher is the primary instrument of data
collection and analysis; the process is inductive; and the product is richly descriptive” (Merriam
& Tisdell, 2016, p. 15). And, the researcher’s role is to be as “responsive and adaptive” as
possible (Merriam & Tisdell, 2016, p. 16). While being informed by a theoretical framework,
she collects different pieces of information and inductively derives findings including, for
example, themes and hypotheses (Merriam & Tisdell, 2016). According to Merriam and Tisdell
(2016), a qualitative researcher should have a questioning eye and an observer stance; tolerate
ambiguity during data collection and trust the inductive process in qualitative approaches; ask
good questions and think inductively during data analysis.
It is thought that the most common approach to qualitative research is the interpretive
approach (Merriam & Tisdell, 2016) which values the participants’ interpretations and
reflections and explores meanings within the participants’ environments where the
interpretations and meanings are the participants’ not the researcher’s (Merriam & Tisdell,

45
2016; Stake, 2010). These interpretations and meanings are socially constructed through
interactions with others (Merriam & Tisdell, 2016). Such methodology “relies heavily on the
observers defining and redefining the meanings of what they see and hear” (Stake, 2010, p.
36).
One way to conduct qualitative research is through case studies. A case study offers a
comprehensive account and investigation of a unit of study within its real-life settings, where
the boundaries of the unit of study or case are chosen and set by the researcher (Merriam &
Tisdell, 2016). For example, a case can be a person or an institution; a teacher or a school.
However, the boundaries should be set in a way that gives a finite data (e.g. finite number of
participants and finite number of observations).
This study adopts an interpretive qualitative approach that aims to understand a situation
based on the teachers’ interpretations as well as the researcher’s; therefore the experiences
shared between the teacher and the researcher become more meaningful and expressive
(Stake, 2010). The research design will include asking the participants’ questions, aiming to
seek their own interpretations where needed and where possible. With the theoretical
framework in mind, I will seek an inductive approach in my analysis. And I will focus on case
study to achieve in-depth analysis. With these outlines in mind, the study design was set to
include seeking participants’ interpretations and reflections on critical incidents. Discussion of
what critical incidents are is in the next section.
Critical incidents
According to Skott (2001), “critical incidents of practice” are instances when a teacher makes
classroom decisions taking into account several motives some of which can be conflicting, vital
to the teacher’s school mathematics priorities, and crucial for the development of classroom
interactions and students’ learning. Tripp (2012) thinks that a critical incident is an ordinary
event or routine that tells the trends, purposes, and routines of a teacher’s practice; it becomes
critical when someone chooses to see it as such which in his opinion is “problematic” because
it is dependent on one’s interpretation (p.28). Goodell (2006) argues that “a critical incident
can be thought of as an everyday event encountered by a teacher in his or her practice that
makes the teacher question the decisions that were made, and provides an entry to improving
teaching” (p.224). It is believed that reflections on critical incidents can play an important role
for teachers’ learning and professional development (Goodell, 2006; Hole & McEntee, 1999;
Potari & Psycharis, 2018; Skott, 2001; Tripp, 2012). Skott (2001) argues that critical incidents of
practice are useful in two aspects.
46
“First, they provide a window on the role of teachers’ school mathematical priorities when these
are challenged as informants of teaching practice by the emergence of multiple motives of their
activities. Second, CIPs may prove significant for the long-term development of a teacher’s
school mathematical priorities” (Skott, 2001, p. 19)
Thus, identifying critical incidents and having teachers reflecting on them “may turn the
classroom into a learning environment for teachers as well as for students” (Skott, 2001, p. 4),
and consequently for researchers. Deep reflection on critical incidents inspires teachers to
think of what happened, why it happened, what it could mean and what its implications are
(Hole & McEntee, 1999).
Inspired by the arguments and discussion above, in this study, a critical incident is defined as
an everyday event or an instance of when a teacher takes a classroom decision that shapes
classroom interactions and students’ learning; such decisions are not necessarily questioned
by the teacher (like in (Skott, 2001)) and are mainly related to his/her choices of resources and
schemes of use of these resources. In other words, they are the decisions that reveal the
teacher’s routines, purposes, approaches and tendencies. Therefore, and to promote teachers’
reflections during interviews, critical incidents are used in this study in two phases.
The first phase was used for pre-observation interviews, and was inspired by the task
methodology suggested by Biza, Nardi, and Zachariades (2007) where tasks are classroom
scenarios based on critical incidents. They are defined as:
“classroom scenarios (Tasks) which: are hypothetical but grounded on learning and teaching
issues that previous research and experience have highlighted as seminal; are likely to occur in
actual practice; have purpose and utility; and, can be used both in (pre- and in-service) teacher
education and research through generating access to teachers’ views and intended practices.
Tasks initially had the following structure: reflecting upon the learning objectives within a
mathematical problem (and solving it); examining a flawed (fictional) student solution; and,
describing, in writing, feedback to the student.” (Biza et al., 2007, p. 301).
It is believed that:
“– in contrast to posing questions at a theoretical, decontextualised level – inviting teachers to
respond to highly focused mathematically and pedagogically specific situations that are likely to

47
occur in the mathematics classrooms they are (or will be) operating in can generate significant
access to teachers’ views and intended practices” (Biza et al., 2007, p. 302).
The task methodology suggests that responses to tasks afford windows on teachers’
mathematical knowledge; their pedagogical approach; their didactical practices; and on the
interactions between the these (Biza, Kayali, Moustapha-Corrêa, Nardi, & Thoma, in press; Biza,
Nardi, & Zachariades, 2009). Biza et al. (2009) recognize that as the teachers are not in the
classroom when they reflect on these tasks they would, for example, have “some time to think
about their reaction” (p.303). This would give the teachers chances to be more reflective; which
would lead to their responses being “more representative of their intentions” (Biza et al., 2009,
p. 304). Reflections on these tasks “help teachers develop their capacity to transform
theoretical knowledge into theoretically-informed practice” (Biza et al., 2009). They also
provide researchers with insights into Ball et al.’s (2008) mathematical knowledge for teaching
and Shulman’s (1987) pedagogical content knowledge (Biza et al., 2009); and with
opportunities “to trigger teachers’ reflection on their own considerations on the teaching of
mathematics and their role as a teacher” (Biza, Nardi, & Joel, 2015, p. 184). Hence, engagement
with tasks is through the teachers’ giving written responses to the task first, and then through
discussion of these responses. Further details on how this methodology is used in this study is
in the next section “Research context and design”.
In the second way, critical incidents were identified from lesson observations based on the
definition adapted for this study. The incidents that were identified and used in the post-
observations interview were selected because they were “crucial and exemplary incidents of
the teacher’s interaction with the students […] especially with regard to how the teacher
organised and orchestrated the classroom communication and conceived his or her own role
in it” (Skott, 2001, p. 8). So, for the post-observation interview, questions were based on these
critical incidents and aimed to invite teachers to interpret and reflect on their choices and
decisions during lessons. It is believed that teachers’ interpretations of such critical incidents
are based on their knowledge and experiences and relating these to the general teaching and
learning ideologies (Potari & Psycharis, 2018). So, a close look at these interpretations provides
insights on teachers’ pedagogical argumentations and thus is “a means of understanding the
resources upon which teachers base their interpretations” (Potari & Psycharis, 2018, p. 2).
Therefore, the interviews work as an interpretative device that helps understand how teachers
view their choices and orchestration of classroom interactions. Critical incidents is a tool that I
use in the design of this study. The full study design is in the next section.

48
Research Context and Design
Having the interpretive research methodology in mind, the data collection for this study was
designed to explore a number of case studies where each case is the case of one mathematics
teacher at a secondary school setting. In this section, I first include information, relevant to this
study, about: the context of secondary schools in England, secondary mathematics teacher
training in England and the participants of the study. I then explain the research design which
aims to give space for the participants to reflect on critical incidents and elaborate on their
teaching approaches.
Secondary school context in England
In England, schooling is divided into stages called key stages (KS) (Table 2) ("The national
curriculum," 2019). Primary school includes Key stages 1 and 2; 5-10 years old. And, secondary
schools include Key stages 3, 4 and 5. Key stage 3 (KS3) covers year 7 to year 9; where students’
ages are 11 to 14 ("The national curriculum," 2019). Key stage 4 (KS4) covers year 10 to year
11; where students’ ages are 14 to 16 ("The national curriculum," 2019). Key stage 5 (KS5)
covers years 12 and 13 with students’ ages between 16 and 18. At the end of KS4 students take
examinations for the General Certificate of Secondary Education (GCSE). GCSE grades used to
be A*- U (i.e. A*, A, B, C*, C , D, E, F, G, U); with A* considered as a good pass and U considered
as unsatisfactory (Table 3) (Jadhav, 2018). Since 2017, grades A* to G were replaced by
numerical grades (9-1) with 9 being equivalent to A* and grade U was kept as it is to represent
an unsatisfactory result (Jadhav, 2018). KS5 is also called upper secondary level, or A level as
short for Advanced Level ("AS and A levels," 2019). At KS5, students can choose three to four
subjects to study. Students who complete only their first year of KS5 get Advanced Subsidiary
qualification (AS level) ("AS and A levels," 2019). At the end of the second year of KS5, students
take their A level examinations; and those who wish to go to university are offered places based
on their A level grades. For AS and A level examinations A* to E are the pass grades (Table 3)
("Grading and Marking of A-levels," 2019).
Key stages School years Age range in years
KS1 Reception, year 1 and year 2 5 to 7
KS2 Year 3 to year 6 8 to 10
KS3 Year 7 to year 9 11 to 14
KS4 Year 10 to year 11 14 to 16
KS5 Year 12 to year 13 16 to 18
Table 2: Key stages and their corresponding school years and students’ ages
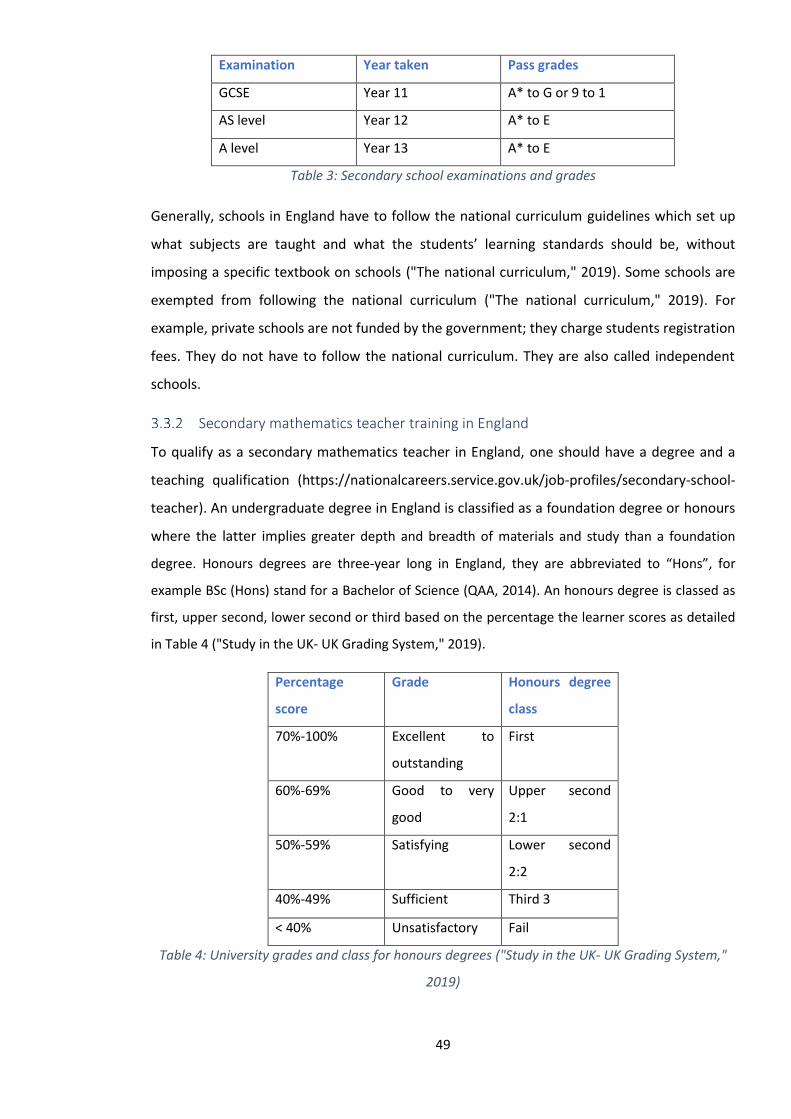
49
Examination Year taken Pass grades
GCSE Year 11 A* to G or 9 to 1
AS level Year 12 A* to E
A level Year 13 A* to E
Table 3: Secondary school examinations and grades
Generally, schools in England have to follow the national curriculum guidelines which set up
what subjects are taught and what the students’ learning standards should be, without
imposing a specific textbook on schools ("The national curriculum," 2019). Some schools are
exempted from following the national curriculum ("The national curriculum," 2019). For
example, private schools are not funded by the government; they charge students registration
fees. They do not have to follow the national curriculum. They are also called independent
schools.
Secondary mathematics teacher training in England
To qualify as a secondary mathematics teacher in England, one should have a degree and a
teaching qualification (https://nationalcareers.service.gov.uk/job-profiles/secondary-school-
teacher). An undergraduate degree in England is classified as a foundation degree or honours
where the latter implies greater depth and breadth of materials and study than a foundation
degree. Honours degrees are three-year long in England, they are abbreviated to “Hons”, for
example BSc (Hons) stand for a Bachelor of Science (QAA, 2014). An honours degree is classed as
first, upper second, lower second or third based on the percentage the learner scores as detailed
in Table 4 ("Study in the UK- UK Grading System," 2019).
Percentage
score
Grade Honours degree
class
70%-100% Excellent to
outstanding
First
60%-69% Good to very
good
Upper second
2:1
50%-59% Satisfying Lower second
2:2
40%-49% Sufficient Third 3
< 40% Unsatisfactory Fail
Table 4: University grades and class for honours degrees ("Study in the UK- UK Grading System,"
2019)

50
A qualified teacher in England is a teacher who holds qualified teacher status (QTS) which can
be earned through undergraduate (e.g. Bachelor of Education (BEd)) or postgraduate university
courses ("National Careers Service- Secondary school teacher," 2019). To achieve QTS in
secondary mathematics one should enroll in a postgraduate teacher training course, such as
postgraduate certificate in education (PGCE), postgraduate diploma in education (PGDE),
postgraduate certificate in teaching ("Teaching- What is a PGCE?," 2019). These courses require
the applicant to: hold a GCSE at grade C (i.e. grade 4) or above in mathematics and English; and
have an undergraduate degree in mathematics or another closely related subject ("Teacing-
Eligibility for teacher training," 2019).. If the applicant’s degree is not in mathematics, s/he can
enroll in a fully-funded subject knowledge course ("Teaching- Subject knowledge enhancement
(SKE) courses," 2019).
The postgraduate certificate in education (PGCE) is one- or two-year course and is a common
course for teacher training ("Teaching- What is a PGCE?," 2019). It offers the trainee “increased
confidence” and it is “an internationally recognized qualification” ("Teaching- What is a PGCE?,"
2019). The course, like other teacher training courses in England, offers:
✓ “plenty of classroom experience in at least two schools – a minimum of 24 weeks of school
experience
✓ training to meet the Teachers’ Standards, which will include classroom management and
making your subject accessible to your pupils
✓ expert academic and practical guidance from mentors and tutors who are there to help you
succeed” ("Teaching- Teacher training courses," 2019)
Once a teacher training course is completed successfully, newly qualified teacher (NQT) status
is achieved. This implies that the NQT will need to go through a period of induction, which
usually lasts for one academic year (three academic terms), during which s/he has a reduced
teaching timetable and a mentor who holds a qualified teacher status (Induction for newly
qualified teachers (England) - Statutory guidance for appropriate bodies, headteachers, school
staff and governing bodies, 2018). This period is meant to be:
“the bridge between initial teacher training and a career in teaching. It combines a personalised
programme of development, support and professional dialogue with monitoring and an
assessment of performance against the relevant standards […]. The programme should support
51
the newly qualified teacher (NQT) in demonstrating that their performance against the relevant
standards is satisfactory by the end of the period and equip them with the tools to be an
effective and successful teacher” (Induction for newly qualified teachers (England) - Statutory
guidance for appropriate bodies, headteachers, school staff and governing bodies, 2018, p.
6).
On completion of the induction period the person is considered a qualified teacher.
Participants
The participants in this study were seven secondary school mathematics teachers, with
different levels of experience and training, from four different schools in East England. Here is
a list including information about each of the schools and the participants:
School 1: A mixed upper-secondary state school that enjoyed autonomy and flexibility in the
curricular design, choices and resources as well as timetabling and terms’ dates. From this
school, three participants were willing to be interviewed (2 males and 1 female). I name the
participants: George, Martin, and Hana.
School 2: A mixed secondary state school that enjoyed autonomy and flexibility in the curricular
design, choices and resources as well as timetabling and terms’ dates. From this school, one
male participant was willing to be interviewed, the participant will be called Jude.
School 3: A mixed secondary state school that followed the national curriculum and local
authorities’ guidelines, but had the choice over which textbook to follow. From this school, two
male participants were willing to be interviewed. I name the two participants Adam and Sam.
School 4: A secondary independent school that did not have to follow the national curriculum;
and the textbook to follow was chosen by the school. From this school, one male participant
was interviewed. I name him here Charlie.
The schools were chosen from diverse contexts. So, the first school was the only upper-
secondary school, so all students were aged 16-18 and were preparing for their school leaving
examination (A-level). The rest of the schools were secondary, so they were for students aged
11-18. One of the schools (school 4) was an independent school. School 1 and school 2 were
not independent, yet they enjoyed more control over what they do than school 3 but less
control than school 4. Further details about each school’s profile are not mentioned here to
maintain the anonymity of the schools. The participants from these school also had diverse

52
profiles: two of them were the head of mathematics department; one was a newly qualified
teacher; years of experiences ranged from one to twenty years. Due to the dependency on
teachers’ volunteering to participate, all participants were white European, and all the main
participants were white British males.
The following table (Table 5) summarizes the teachers’ profiles at the start of the data
collection:
School Teacher Profile outline
1 George He had a BSc in mathematics and PGCE in secondary mathematics
teaching. He had fifteen years of teaching experience mostly in upper
secondary education; and was the head of mathematics at his school
during the data collection.
1 Martin He had a BSc in mathematics and PGCE in secondary mathematics
teaching. He was a newly qualified teacher and close to completing his
first year of teaching experience at upper secondary level.
1 Hana She had a BSc in mathematics and QTS in secondary mathematics
teaching. She had seven-years teaching experience at upper secondary
level.
2 Jude He had a BSc in business and a PGCE in secondary mathematics teaching.
He had three years’ experience of teaching mathematics at lower
secondary level.
3 Adam He had four years’ experience, during which he taught students aged 12-
18 years. He held a degree in economics, a PGCE in secondary
mathematics teaching and was about to finish an MA in education with
his dissertation focusing on mathematics education.
3 Sam He held a PhD in computer science and PGCE in secondary mathematics
teaching. He had 10 years of teaching experience at secondary level.
4 Charlie He had a BSc in mathematics and a PGCE in secondary mathematics
teaching. He had twenty-year teaching experience at secondary level and
was the head of mathematics at his school during the data collection.
Table 5: Participants profiles at the start of the data collection
These are all the participants who took part in part or all of this study. The following section
describes the different phases of the study and ends with a table (Table 6) summarizing the
participants’ contribution or non-contribution to each phase.

53
Research Design
Having the interpretive research methodology in mind, I designed the phases of data collection
in a way that allows me to look at their work with resources within context; and give the
participants the space to reflect and express their interpretations around the different aspects
of their work. Hence, the data collection for this study was done in five phases as detailed in
the next sections: designing pre-observation interviews, pre-observation interviews, pilot
observation, lesson observations, and post-observation interviews. The rationale behind each
phase is explained in the section relevant to this phase.
The first phase- Designing pre-observation interviews
The purpose of the pre-observation interviews was to listen to the participants views and
approaches about their work with technology and other resources. Having the qualitative
approach in mind, I aimed to investigate the participants views and reflection within context.
As this context was not yet available through actual teaching, I decided to follow the task
methodology (Biza et al., 2007). This methodology involves asking the participants to provide
written responses to tasks, and then conducting follow up interviews with them. Tasks were
recommended by Biza et al. (2007) as a methodological tool. They are given classroom scenario
that are designed as semi-structured interviews and aim to create and encourage discussions
of specific classroom scenarios. A task provides an opportunity for researchers and teachers to
put on the table the challenges faced, and decisions made during mathematics lessons. Tasks
offer lenses to look into teachers’ practices and beliefs and afford combining multiple factors
from practice to be addressed. They encourage teachers to “stop and reflect”, while taking into
consideration “classroom dynamics” (Biza et al., 2015, p.36).
Inspired by the task methodology, and to look at my participants’ use of resources, I created
two scenarios: The first was on 3D geometry (in Figure 3) and the second was square and its
properties (in Figure 4). These scenarios and their associated questions were validated through
three stages:
• Discussion with my supervisor about the first draft of these tasks and what they address.
• Discussion at UEA’s Research in Mathematics Education group meeting. Feedback on the
first draft of these tasks was collected from the group; discussed in the group’s meeting
and considered to make the final version in Figures 3 and 4.
• The tasks were tested by having five practising teachers (not the participants) solve them
for the purpose of giving me feedback on their content and format.

54
Figure 3: The 3D scenario
On the square and its properties
You have just introduced the properties of the square to Year 7 students. You are in a
classroom in which you have computer access with internet connection and dynamic
geometry software.
- How would you plan the next activities, and what kind of questions would you ask?
- What problems would you expect?
- In one of the activities, you asked your students to construct a square using dynamic
geometry software. One student used the line segment command to draw a 4-sided
figure that looked like a square, and then started chatting online.
- What are the issues in this case?
- How likely is this to happen?
- How would you react?
Figure 4: The scenario on square and its properties
The two task-inspired scenarios aim to give specific context of teaching situations and ask about
the teachers’ decisions, ideas, and reflections. The questions in the task were open-ended. In
addition, as I would like to discover aspects of the teachers work with digital resources, I
designed the first scenario and its questions without mentioning or suggesting any use of
technology while I asked about this use directly in the second scenario. The aim is to leave the
On 3D
A group of Year 11 students are asked the following question:
Design a milk container with a capacity of 1L. What dimensions and which design uses less
materials? Why?
- What are the mathematical ideas and activities addressed in this question?
- Would you use this question in class? Why or why not? What are the learning objectives
for which you would use this question? Would you modify it?
- Would you use technology with this question? If yes, what type of technology? If no,
why?
- If you were to use technology, how would you use it?
- What teaching approaches and resources would you suggest for this question?
Do you anticipate any problems or challenges (either with students or resources)?

55
options fully open to the teacher in the first part of the interview; and, in the second part, try
to clarify whether they are comfortable with using technology which is an important focus in
this study.
My aim was to focus on 3D Geometry in one of the interview tasks, this choice of topic was
inspired by arguments around the lack of research on technology use when teaching 3D
geometry on one hand (Jones, Mackrell, & Stevenson, 2010, p.56), and the fact that “students
have problems understanding three-dimensional geometry” (Dolonen & Ludvigsen, 2012, p.
167) on the other. Research suggested that students find it challenging to represent 3D figures
and visualize the complex relationships between their components (Pittalis & Christou, 2010),
“especially the relationship between surface area and volume” (Dolonen & Ludvigsen, 2012, p.
167). Also, the mental rotation of 3D figures “is a particularly undeveloped area of current
mathematics curricula… [although it] can be used as a reliable strategy for understanding area
measurement tasks… [and] composing and decomposing 2D and 3D figures…” (Bruce & Hawes,
2014, pp. 331-332). Pittalis and Christou (2010, p. 208), emphasized the importance of
teachers’ adopting explorative 3D geometry tasks that help students make connections
between the visual perception of a figure and its properties, and encourage them to move away
from memorizing formulas. To achieve that:
“Battista (2003) suggested that students should develop two necessary skills to calculate
conceptually the volume and surface area of a solid: (a) the conceptualisation of the numerical
operations and the link of the formulas with the structure of the solid and (b) the understanding
and visualisation of the internal structure of the solid” (Pittalis & Christou, 2010, p. 194).
The first scenario was designed with secondary school mathematical topics in mind, including:
surface area, volume, unit conversion, optimization, cube, prisms, pyramids, cylinders, cones,
problem solving or anything else the teacher would like to add. The aim from this task was to
address any issues about time with open problems like the one in this task and the chances for
different approaches and different designs: What designs would the teachers try and why? Will
they consider all designs? Will they consider optimization? Will the teacher narrow the
problem? If yes, how? For example, will they consider specific designs, or would they put
specific conditions on dimensions e.g. cuboid. Also, aiming to hear teachers’ preferences in this
case: Will they use technology or not? Why? All these questions would help me look at the
aspects of teachers’ knowledge and beliefs in relation to the 3D task. The second scenario
aimed also to looking at teachers’ ideas, knowledge and beliefs in relation to the mathematical

56
concept (square). But it was more directed to looking at the use of technology: whether the
teachers would use technology or not; and whether they would consider behaviour issues and
class management with technology. A teacher would answer the questions on these scenarios
on paper; then there would be a discussion between him/her and I about their answers: to
clarify or elaborate on these. A sample of the questions I used to manage the discussion on the
written responses is included in Appendix E (from Adam’s pre-observation interview).
Teachers’ answers to these scenarios would help the participants and me in making decisions
about who would continue to the next phase. The decision would be based on the participants
use or not use of technology and whether they see themselves as contributors to this study.
This interview was not only designed to be informative about the participants’ approaches, but
also to be an ice-breaker between the participants and me before moving to the observation
phase, which is the third phase.
The second phase- Pre-observation interviews
This phase is focused on recruiting and interviewing secondary school mathematics teachers
and conducting pre-observation interviews with them. It required me to use my questioning
skills to invite teachers to elaborate on their written answers. The interviewed teachers
provided answers to the written questions related to the scenarios given to them, they were
given the chance to further elaborate on the answers they provided and justify them. A sample
of the questions I used to manage invite their elaboration on the written responses is included
in ‘Appendix E: Sample of Pre-observation interview questions’ (where I include questions from
Adam’s pre-observation interview). The questions I asked were based on the written answers
the teachers provided, so they had to be created during the interview. This meant that, there
was a room for development by adding more questions or rephrasing them. However, as this
part of the data is only used as an indication to who would be in a participant in the next phases,
such shortcomings did not impact this study severely. At the end of this phase, and based on
the pre-observation interviews and on the study context, some of the teachers would continue
to the next phase. The choice was based on whether they used technology in their lessons, and
whether they were comfortable with being observed during lessons. Out of the seven
participants, two participants (Jude and Sam) did not wish to carry on to the next phase. Sam
decided that he would not be comfortable with lesson observations. Jude claimed that he did
not use technology, specifically mathematics-education software, because it took a lot of time
to prepare.

57
The third phase- Recorded pilot observations
These are one-lesson observations done with all the teachers who were interviewed and willing
to take part in the observation stage. These observations were audio recorded. The pilot
observations were helpful in choosing the teachers who are going to participate in the following
stage, based on the teachers’ class work, as well as their responses to the previous interviews.
Out of the five teachers who took part in this phase, four continued to the next phase. Hana
did not seem comfortable using technology in her pilot observation, and after that observation
she stated that she did not use mathematics-education software.
The fourth phase- Recorded lesson observations
In this phase, teachers were observed for up to ten lessons, depending on their use of
mathematics education software (both in terms of frequency and diversity of use). These
observations were audio or video recorded, based on the teacher’s preference. Data was
collected from the teachers’ comments, actions, worksheets, as well as students’ interactions.
At this phase, I had four participants to work with. The number of observations was set up to
ten to make sure that there is a set boundary to each case study. But the minimum number
depended on the diversity of the individual teacher’s approach to use technology. Ten
observations were recorded with George, nine with Charlie, five with Adam and five with
Martin.
The fifth phase- post-observation interviews
In this phase, the four teachers who were observed were interviewed. The interviews’
questions were semi-structured and were about the teachers’ planning, expectations,
outcomes and evaluations of the lessons. The semi-structured interviews allowed the
participants to answer using their own terms but within the set structure (May, 2010). The
structure included reflections on critical incidents observed during lessons. The discussion
about critical incidents in section 3.2 explains that a critical incident is defined in this study as
an everyday event or an instance of when a teacher takes a classroom decision that shapes
classroom interactions and students’ learning; such decisions are not necessarily questioned
by the teacher and are mainly related to his/her choices of resources and schemes of use of
these resources. Based on this definition, I identified critical incidents from all observed
lessons. Some of these incidents were more general (for example an incident related to how to
prepare students for the examination), while other incidents were focused on specific topics
(for example related to the teaching integration). Examples from the critical incidents were
shared and discussed with my supervisors; and some were shared with the Research in

58
Mathematics Education group (RME group) at the university of East Anglia for discussion in the
group meeting. For example, I shared an incident from Charlie’s first lesson observation with
the group. The feedback from my supervisors and the RME group was supportive and helpful
in validating my approach of identifying critical incidents. Interpretations of both general and
specific critical incidents were sought from each teacher based on their data, to enrich the
analysis by giving each teacher a voice. A sample of post-observation questions is included in
‘Appendix F: Sample of the post-observation interview’, where I include the questions I asked
Charlie based on the critical incidents identified in his lessons.
To summarize on all phases, the interviews and the observations were based on contextual
data and participants’ interpretations were sought in both interviews. The seven participants
from the four schools were aware that they could take part in part of or all of the study. Table
6 summarizes the phases the participants from each school took part in.
Ethics
The ethical aspects of this study were addressed in an application to the Research Ethics
Committee School of Education and Lifelong Learning (Appendix H) and the application was
approved (Appendix I). Before taking any steps in the empirical work, I aimed to seek all the
required adult and parental consents (where needed). In order to recruit participants for this
study, a poster (included in ‘Appendix A: Study poster’) about the study was handed to the
head of mathematics or to one mathematics teacher to circulate to the mathematics teachers
in the school. The poster had information about the study including research questions and
study aims, as recommended by Stake (2010). By trying to approach teachers directly, or using
a poster in a school notice board, the chances of those teachers feeling obliged to participate
because their head teachers want them to was reduced. Also, letters of invite, information
sheet and consent forms (Appendices B: Interview opt in form, and Appendix C: Lesson-
observations opt in form) were posted or handed in to secondary mathematics teachers in
different schools. Before I started lesson observations, letters of invitations were prepared and
given to students (at KS5) for adult consent (Appendix D: Student consent form for lesson
observations). Although this study is about teachers and there is no direct data collection about
students, volunteers from students were once sought when the progress of the data collection
implied a need for students’ feedback on their mathematics lessons; their input in this case was
voluntary and it was audio recorded. For the teachers participating in this study, and also for

59
Table 6:Participation in the different stages of data collection
School Participant Pre-observation interview participant
Pilot observation Observations/ Audio or video recorded
Number of observations if any
Post-observation interview participant
1 George Yes Yes Yes/ video recorded 10 Yes
1 Martin Yes Yes Yes/ video recorded 5 Yes
1 Hana Yes Yes No 1 (pilot only) Yes
2 Jude Yes No No 0 No
3 Adam Yes Yes Yes/ video recorded 5 Yes
3 Sam Yes No No 0 No
4 Charlie Yes Yes Yes/ audio recorded 9 Yes
60
their students, the consent was not only through signing the consent letter. But also by
continuing to show willingness to take part in the study (Stake, 2010). The option to opt out
was made clear to the participants through the consent letter and also through seeking their
permission to observe lessons before each observation. This, for example, lead Martin to cancel
one lesson observation within short notice. The consent letter explained that I would be the
only person to access raw data.
I chose to audio- or video-record the lesson observations to be able to analyse in detail. Videos,
audio-recordings and transcripts have been securely stored, and will be destroyed 10 years
after the end of the work. All the names mentioned in the thesis are substitutes for the
originals. All audio- and video-recordings have been reported in detail then analysed and
discussed in relation to the theoretical framework. For audio-recording, a discrete microphone
was provided to the teachers. Supporting pictures of the different steps on the board and/or
worksheets were taken. In case of video-recording, students who did not wish to participate
were seated in a way so that the camera did not capture them, and their data was not recorded
or used at all in this study. The video-recording was mainly directed at the board. Pictures of
worksheets or textbook activities were taken. Generally, following a recommendations in Stake
(2010), I tried to capture the details through recordings and interviews and to get as close
picture of the teaching as possible without intruding the teachers’ private spaces.
Data Collection overview
As described in the research design section, data was collected using different methods:
interviews and informal questioning, and lesson observations. The pre-observation interviews
and pilot observations were used to establish the teachers’ profiles for this study, and to decide
which participants were going to be observed. Seven participants took part in the pre-
observation interviews phase (Table 6): three from the first school (George, Martin, and Hana),
one from the second school (Jude), two from the third school (Adam and Sam) and one from
the fourth school (Charlie). Out of the seven participants, five participants were willing to take
part in the observation phase, both Sam and Jude did not wish to continue with lesson
observations. All other five participants were observed for one audio-recorded pilot
observation. Hana tried to use technology in that lesson but for some reason what she
prepared did not work during the lesson. So, after the pilot observation she told me that she
rarely used technology, and that she did not know a lot about its use. So, she was not observed
for the next phase. This meant that four teachers (George, Martin, Adam and Charlie) took part
in the lesson observations and post-observation interview phases. All lesson observations
(under the third phase) were video-recorded apart from Charlie’s whose observations were

61
audio recorded because he was not comfortable with video-recording. The four observed
teachers used mathematics education software in most, but not all their observed lessons. And,
although the plan was to observe up to 10 lesson for each teacher, only 5 and 6 were observed
for Adam and Martin respectively. This was because the two teachers felt they showed me all
the ways in which they usually used mathematics education software in their teaching and that
more observations would not reveal new methods in relation to technology use.
The data collected from the observations included teachers’ comments, actions,
demonstration, worksheets, as well as interactions with students. The plan was to also include
lesson plans, but none of the teachers was required to write lesson plans by their school and
they all choose not to write lesson plans. Based on the data collected from the lesson
observations, the teachers were asked to comment and reflect on critical incidents identified
by the researcher; the incidents were chosen to reflect the choices teachers made during the
observed lessons and their interactions with the students where relevant, as detailed in the
critical incidents section.
Data analysis
The pre-observation interview and the pilot observation were used to collect contextual and
background information about the participants and their suitability and willingness to take part
in the next phases of the study. For the four participants who took part in the observation and
post-observation phases, the analysis of the data collected in these phases happened in two
stages. First, a preliminary analysis of the observations was done to determine the critical
incidents in each lesson observation. This included identifying the teacher’s main steps and
choices. In the interview, each participant was invited to reflect on these choices and on the
flow of the lesson (e.g. aims of using Autograph). Second, each participant’s responses in the
interview and actions during the lesson were analysed using the Documentational Approach
and the Knowledge Quartet. The analysis using the Documentational Approach identified the
resources used and their schemes of use: aims of the teaching activity, rules of actions,
operational invariants and inferences in the context of the observed lesson. Each set of
resources and their corresponding scheme of use were summarised in a documentational work
table, similar to the one used by Gueudet (2017) in her analysis of university teachers’ work.
And, in the analysis using the Knowledge Quartet lens, the four dimensions of the Quartet were
used to explore the details of specific situations in which the scheme of use is developed and
applied. A sample of the analysis using the Knowledge Quartet lens in included in ‘Appendix G:
Sample of the analysis using the Knowledge Quartet’.

62
Early analysis led to identification of four themes or points: first, teachers use students’
contributions as a resource during lessons; second, institutional factors like examination
requirements and school policy have impact on teachers’ decisions and on how they balance
their resources; third, when mathematics-education software is used the teacher’s knowledge
of the software intertwines with this use; fourth, contingent moments can result from the lack
of mathematics-education software knowledge (e.g. leading to unexpected outcome). Also, in
some cases it is difficult for the researcher to judge whether a moment is a contingent moment
or not if the element of teacher’s expectancy (or lack of it) of that moment is not clear. The
following table (Table 7) aims to introduce the reader to how these themes appear in the data.
These themes will appear in the next section (Data and analysis) frequently, in the forms
outlined in the table above. The next chapter starts with analysis of data from George, Martin,
Adam and Charlie respectively. For each participant, I aim to include one full lesson overview
and analysis, and then focus on lesson episodes. The full lesson analysis includes analysis based
on the Knowledge Quartet and the Documentational Approach where a document table similar
to the one in Gueudet (2017) is included. The lesson episodes are part of lessons that include
critical incidents relevant to this study and supportive of the main themes summarized in Table
7. For the lesson episodes, the document table I include is for the full lesson, not only for the
chosen episodes.
Theme How it appears in the data
Students’ contributions as a resource 1. Contributions invited by the teacher to help solve questions on the board
2. Contributions invited by the teacher to support demonstration of new ideas
3. Students’ questions on a new concept that would lead the teacher to demonstrate ideas to one student or to the class.
Institutional factors like examination requirements and school policy
1. Knowledge of examination requirements and school policy
2. Responding to contingent moments by referring exam requirements
Knowledge of the software 1. In planned use 2. In contingent use
Contingent moments 1. As a result of adhering to examination requirements 2. Moments that could be contingent, but the
expectancy factor is not evident
Table 7: The main themes that emerged from the data analysis
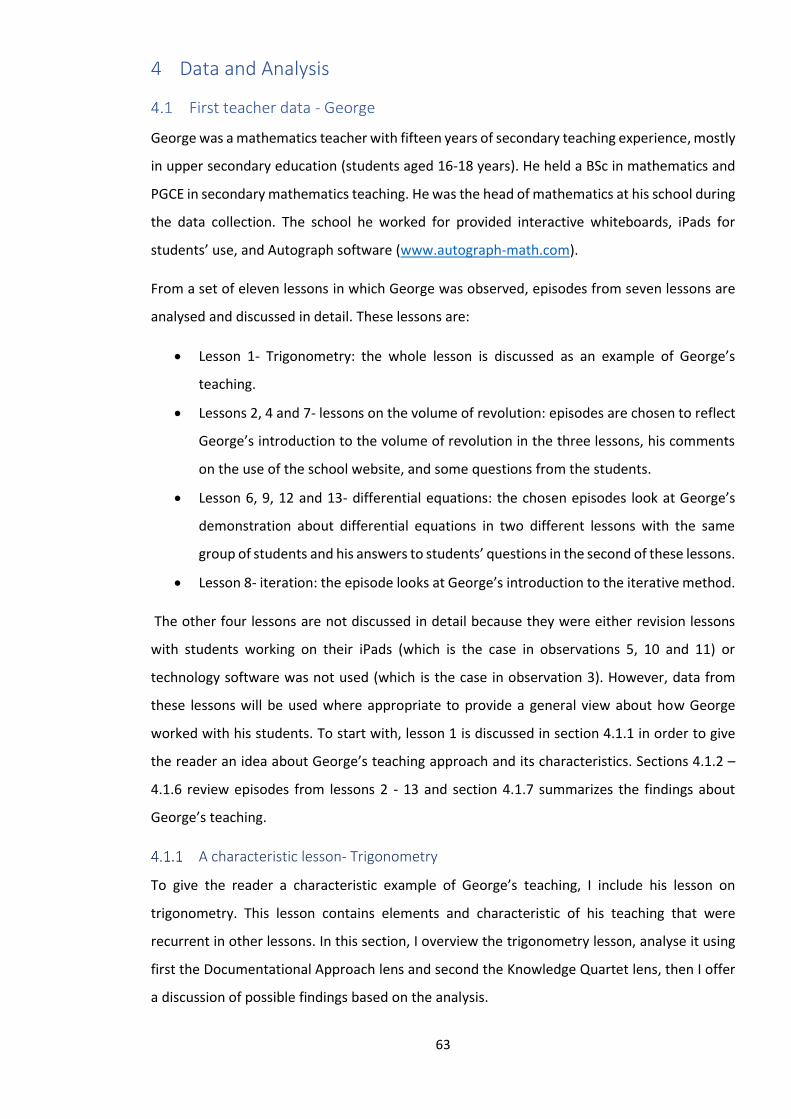
63
Data and Analysis
First teacher data - George
George was a mathematics teacher with fifteen years of secondary teaching experience, mostly
in upper secondary education (students aged 16-18 years). He held a BSc in mathematics and
PGCE in secondary mathematics teaching. He was the head of mathematics at his school during
the data collection. The school he worked for provided interactive whiteboards, iPads for
students’ use, and Autograph software (www.autograph-math.com).
From a set of eleven lessons in which George was observed, episodes from seven lessons are
analysed and discussed in detail. These lessons are:
• Lesson 1- Trigonometry: the whole lesson is discussed as an example of George’s
teaching.
• Lessons 2, 4 and 7- lessons on the volume of revolution: episodes are chosen to reflect
George’s introduction to the volume of revolution in the three lessons, his comments
on the use of the school website, and some questions from the students.
• Lesson 6, 9, 12 and 13- differential equations: the chosen episodes look at George’s
demonstration about differential equations in two different lessons with the same
group of students and his answers to students’ questions in the second of these lessons.
• Lesson 8- iteration: the episode looks at George’s introduction to the iterative method.
The other four lessons are not discussed in detail because they were either revision lessons
with students working on their iPads (which is the case in observations 5, 10 and 11) or
technology software was not used (which is the case in observation 3). However, data from
these lessons will be used where appropriate to provide a general view about how George
worked with his students. To start with, lesson 1 is discussed in section 4.1.1 in order to give
the reader an idea about George’s teaching approach and its characteristics. Sections 4.1.2 –
4.1.6 review episodes from lessons 2 - 13 and section 4.1.7 summarizes the findings about
George’s teaching.
A characteristic lesson- Trigonometry
To give the reader a characteristic example of George’s teaching, I include his lesson on
trigonometry. This lesson contains elements and characteristic of his teaching that were
recurrent in other lessons. In this section, I overview the trigonometry lesson, analyse it using
first the Documentational Approach lens and second the Knowledge Quartet lens, then I offer
a discussion of possible findings based on the analysis.
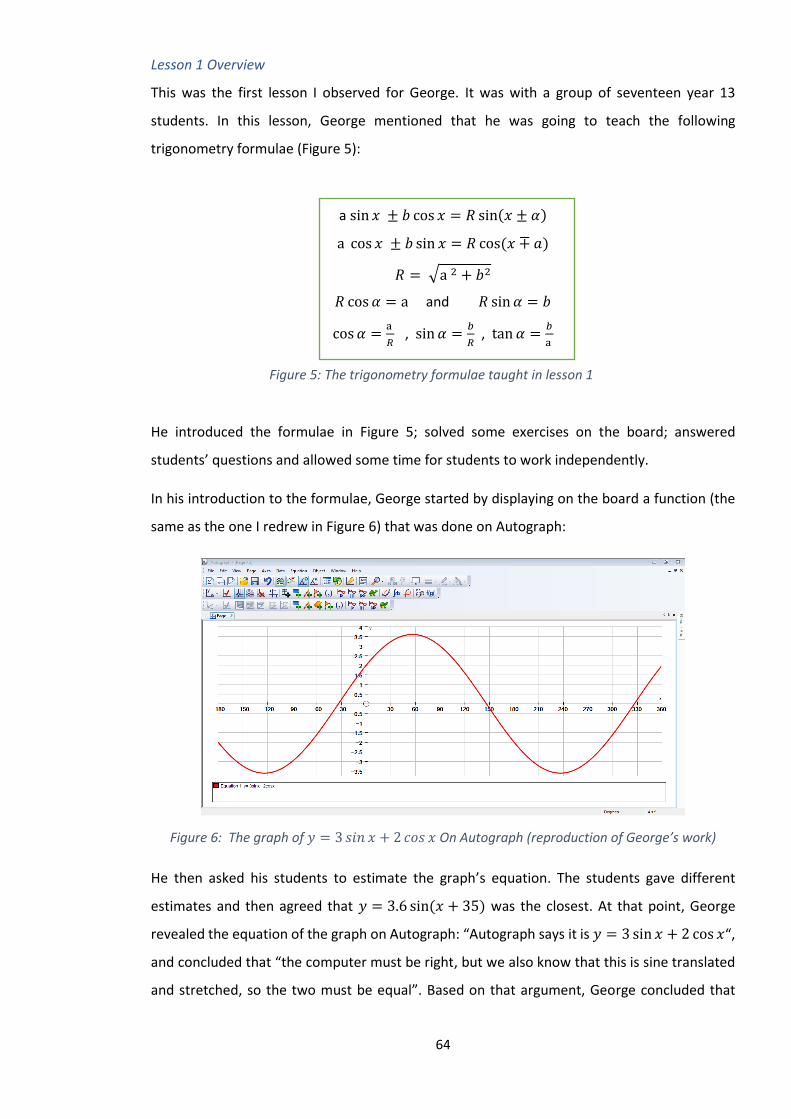
64
Figure 5: The trigonometry formulae taught in lesson 1
Lesson 1 Overview
This was the first lesson I observed for George. It was with a group of seventeen year 13
students. In this lesson, George mentioned that he was going to teach the following
trigonometry formulae (Figure 5):
a sin 𝑥 ± 𝑏 cos 𝑥 = 𝑅 sin(𝑥 ± 𝛼)
a cos 𝑥 ± 𝑏 sin 𝑥 = 𝑅 cos(𝑥 ∓ 𝑎)
𝑅 = √a 2 + 𝑏2
𝑅 cos 𝛼 = a and 𝑅 sin 𝛼 = 𝑏
cos 𝛼 =a
𝑅 , sin 𝛼 =
𝑏
𝑅 , tan 𝛼 =
𝑏
a
He introduced the formulae in Figure 5; solved some exercises on the board; answered
students’ questions and allowed some time for students to work independently.
In his introduction to the formulae, George started by displaying on the board a function (the
same as the one I redrew in Figure 6) that was done on Autograph:
Figure 6: The graph of 𝑦 = 3 𝑠𝑖𝑛 𝑥 + 2 𝑐𝑜𝑠 𝑥 On Autograph (reproduction of George’s work)
He then asked his students to estimate the graph’s equation. The students gave different
estimates and then agreed that 𝑦 = 3.6 sin(𝑥 + 35) was the closest. At that point, George
revealed the equation of the graph on Autograph: “Autograph says it is 𝑦 = 3 sin 𝑥 + 2 cos 𝑥“,
and concluded that “the computer must be right, but we also know that this is sine translated
and stretched, so the two must be equal”. Based on that argument, George concluded that

65
𝑅 sin(𝑥 + Ɵ) = 3 sin 𝑥 + 2 cos 𝑥. A student then suggested the use of compound angles rule,
George agreed and wrote on the board:
𝑅 sin(𝑥 + Ɵ) = 𝑅 sin 𝑥 cos Ɵ + 𝑅 sin Ɵ cos 𝑥
= 3 sin 𝑥 + 2 cos 𝑥
𝑅 cos Ɵ = 3 and 𝑅 sin Ɵ = 2
cos Ɵ = 3/𝑅 and 𝑠𝑖𝑛 Ɵ = 2/𝑅
Another student suggested Pythagoras, but George did not react and continued to find tan Ɵ
as follows:
sin Ɵ
cos Ɵ= tan Ɵ =
2
3
Using their calculators, the students found that Ɵ = 33.7 . George was about to rearrange the
equation, in order to find R, when the same student who mentioned Pythagoras before said
Pythagoras again. George this time commented “oh yes, Pythagoras even better”; drew the
right triangle shown in Figure 7; and concluded that 𝑅 = √32 + 22 = 3.61.
After that, George started solving exercises from the school website, he started with solving a
past-examination question. He mentioned that he chose a problem that had 𝑅 cos(Ɵ + 𝑥),
unlike the one before which had 𝑅 sin(𝑥 + Ɵ). George proposed a question about how one
would know if the tangent is 3/2 or 2/3; and he answered:
“The long way is to work it out, to crunch these through and see what you get. The short way,
now look at this… if it starts with a cos, they always ask you to do it in terms of cos here and if it
starts with sin, its sin… Now let’s double check”.
To confirm his answer, George started checking if that was the case by looking at past-
examination questions, which all followed that rule. But, one student questioned if that would
always be the case. In response, George wondered what if the question had “3 sin 𝑥 +
4 cos 𝑥 𝑅 cos(Ɵ + 𝑥)”, a student suggested to swap these around, and George approved:
Figure 7: Right- triangle sketched by George
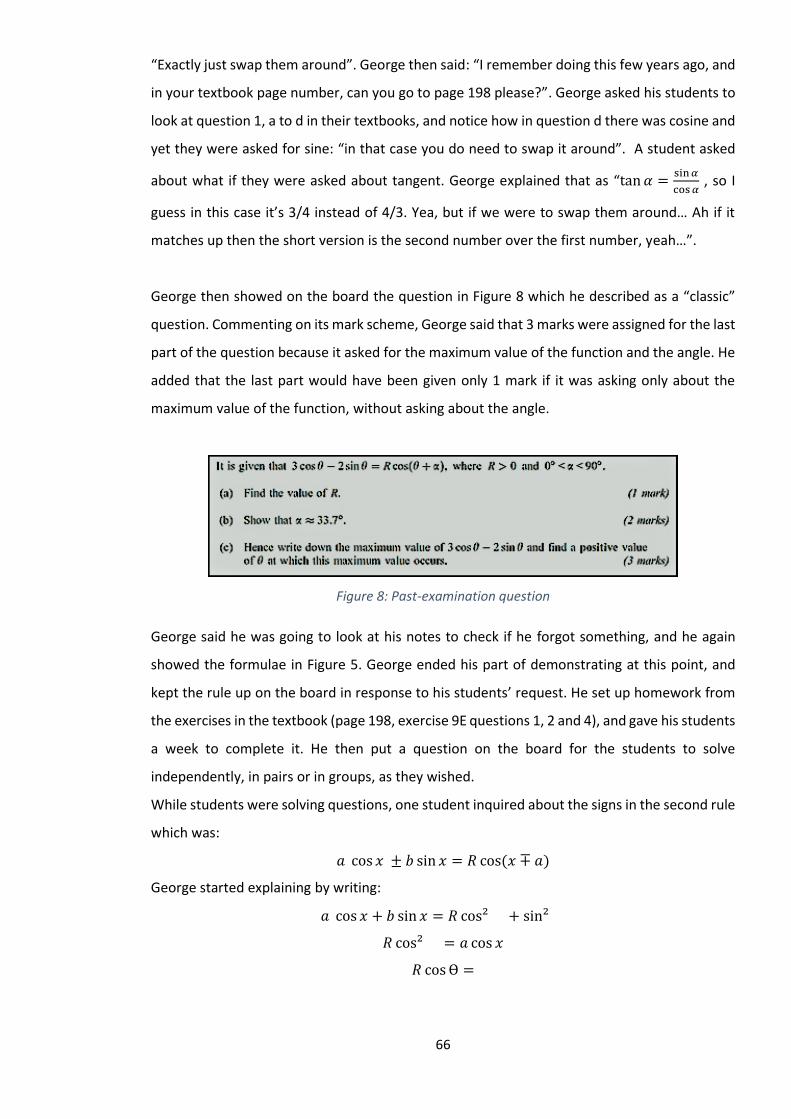
66
“Exactly just swap them around”. George then said: “I remember doing this few years ago, and
in your textbook page number, can you go to page 198 please?”. George asked his students to
look at question 1, a to d in their textbooks, and notice how in question d there was cosine and
yet they were asked for sine: “in that case you do need to swap it around”. A student asked
about what if they were asked about tangent. George explained that as “tan 𝛼 =sin 𝛼
cos 𝛼 , so I
guess in this case it’s 3/4 instead of 4/3. Yea, but if we were to swap them around… Ah if it
matches up then the short version is the second number over the first number, yeah…”.
George then showed on the board the question in Figure 8 which he described as a “classic”
question. Commenting on its mark scheme, George said that 3 marks were assigned for the last
part of the question because it asked for the maximum value of the function and the angle. He
added that the last part would have been given only 1 mark if it was asking only about the
maximum value of the function, without asking about the angle.
Figure 8: Past-examination question
George said he was going to look at his notes to check if he forgot something, and he again
showed the formulae in Figure 5. George ended his part of demonstrating at this point, and
kept the rule up on the board in response to his students’ request. He set up homework from
the exercises in the textbook (page 198, exercise 9E questions 1, 2 and 4), and gave his students
a week to complete it. He then put a question on the board for the students to solve
independently, in pairs or in groups, as they wished.
While students were solving questions, one student inquired about the signs in the second rule
which was:
𝑎 cos 𝑥 ± 𝑏 sin 𝑥 = 𝑅 cos(𝑥 ∓ 𝑎)
George started explaining by writing:
𝑎 cos 𝑥 + 𝑏 sin 𝑥 = 𝑅 cos² + sin²
𝑅 cos² = 𝑎 cos 𝑥
𝑅 cos Ɵ =
67
In these statements, George used cos2 instead of cos 𝑥 cos Ɵ, and sin2 instead of 𝑠𝑖𝑛 𝑥 𝑠𝑖𝑛 Ɵ.
Although the student who asked the questions understood the idea and said: “Sir, you’re right.
So, when there is a positive sign between the two it is positive, when it is negative between the
two it is negative”. Another student was confused by what George wrote and asked: “why is it
cos²?”. George started amending what he wrote to clarify what he meant. So, he changed
𝑅 cos² = 𝑎 cos 𝑥 to 𝑅 cos 𝑥 cos Ɵ = 𝑎 cos 𝑥.
Then, George re-demonstrated how to find R by going back to the interactive whiteboard and
what he wrote before, and telling the students that instead of the Pythagoras use to find R they
could square R cos Ɵ =3 and R sin Ɵ =2 (i.e. R² cos Ɵ = 9 and R² sin Ɵ = 4). As cos² Ɵ +sin² Ɵ =1,
he explained that adding the two equations (R² cos Ɵ = 9 and R² sin Ɵ = 4) will give R2 (sin² Ɵ +
cos² Ɵ) = 13. A student asked why not substitute the values of sine and cosine, George advised
him that it would be better not to because by using a whole number (i.e. sin2 Ɵ +cos2 Ɵ =1) he
would avoid the “tiny roundings” his calculator would do. George added that as sin2 Ɵ +cos2 Ɵ
=1 then R2 =13 and R =√13. After that, the students continued working on textbook questions,
and George moved around the class answering students’ questions until the lesson ended.
In the post-observations interview, George commented on his choice of resources for this
lesson and on his aim from using Autograph. For example, in the interview he commented on
the choice of the example and its demonstration in Autograph during the lesson:
“So, the aim of Autograph at that point I was just using Autograph just to show them the graph.
I deliberately wanted them to think that it’s, I wanted them to tell me it’s a sine graph that has
been transformed. So, I wanted them to tell me it was like whatever it was 3.5 sin (x + 35), so I
wanted that answer and then I wanted to show them. So, I was then using autograph to show
them that it was something else, 3 whatever it was sin + 2 cos or whatever it was. So, to
deliberately make them think hang on a second, we are right but we can’t be right, and so to
force that idea that these two things must be the same and we must be able to work things out
between them”.
Lesson 1 Analysis
In this section, I look at this lesson through the Documentational Approach and the Knowledge
Quartet lenses respectively. This analysis is followed by a discussion of some themes that have
been identified in George’s teaching.

68
Using the Documentational Approach- Resources and Scheme of use
The resources George used included: interactive white board, board, curriculum of year 13,
textbook, past examination questions and mark schemes, past teaching-experience, students’
contributions (including students’ previous knowledge), calculators, notebooks, Autograph,
formulae sheet (hard and soft copies). His scheme of use (i.e. his teaching aims, rules of actions,
operational invariants and inferences) is summarized in Table 8, and draws an overview of his
‘documentational work towards the introduction of some trigonometry formulae (Figure 5).
Beside the elements in the scheme of use that are related to this specific lesson, more general
elements have been identified specifically towards students’ preparation for the examinations.
So, George had a specific aim (A1) which was to introduce the trigonometry formulae in Figure
5. He also had a general aim (A2) which was to prepare students for the examinations. George’s
rules of action (numbered R1-R10 in Table 8) were included demonstrating a range of examples
for the students (R5 and R8); inviting students’ contributions (R1 and R9); allowing some time
for students’ independent work and questions (R10); making connections with students’
previous knowledge (R4); presenting some examination-style questions (R6); assigning
homework (R7); using a typed trigonometry formulae sheet (R3); and using graphs and
Autograph to illustrate ideas (R1-R2). The operational invariants (numbered O1-O5 in Table 8)
were identified from George’s teaching approach during the observation and his reflection
during the interview. For example, George said in the interview that he had typed up the
algebra and the trigonometry work (R3 & O2), so he can go back to it during the lesson to check
if a mistake was made:
“If we make a mistake in the algebra then they can get a bit confused […] And, so it’s important
for me to try and check and I’m checking all the way through ‘is that correct? is that correct? is
that correct?’. So, if I forget a step then it, kind of, they get a bit misled. But, it usually goes ok.
If it does go wrong then we are usually able to go back and go ‘okay, look I know what I’m
expecting so was it this step, this step, this step, this step?’ And, at, it’s at that point that I can
then go back I’ve got the trigonometry typed up. […] if I need to as backup, when I can show
them it’s supposed to be like this so they understand it that way”

69
In terms of inferences (I1 in Table 8), George expressed in the interview that the activity he
used on Autograph for this lesson worked well, so he would use it again in the future: “as long
as we need to teach that, I’ll probably carry on that way because it seems to work fairly well”.
Using the Knowledge Quartet
In relation to the foundation dimension, George’s mathematical and pedagogical knowledge
was noticed throughout the lesson and the interview. Awareness of purpose was not explicitly
expressed by George. His aims of teaching were: teaching the trigonometry formulae and
preparing students for the examinations. He sometimes concentrated on procedures
(concentration on procedures); for example, when he was solving exercises on finding R he
moved away from using Pythagoras (as one student suggested) in his demonstration about the
formulae, and followed the method he initially had in mind. Another example is “in his
suggestion of mnemonic rules in the identification of the right formula” (Kayali & Biza, 2018b,
p. 116). As well, George followed examination requirements. So, he solved past-examination
questions (R6 & O5) during the lesson; and commented during the interview that this is
important to prepare students for their examination: “Once you are ready you just practise
past papers because they are the best way to get you the most experience of examination-style
questions”. George also followed the school policy in relation to homework (R7), so he set up
one homework assignment every week which was due in one week. For example, the
homework for this lesson was chosen from the textbook and was due in one week. Hence, it
seems that “examination requirements” and “school policy” are part of George’s foundation
and they affected his choices in mathematics teaching.
In terms of the transformation dimension, George used Autograph to show a sine function that
had been translated and stretched in order to demonstrate how trigonometry formulae could
be related (R1, R2 & R4, O1 & O3). His instructional materials included both Autograph and the
textbook, which was his main source for the questions to work on in class and for homework.
He also relied on the students’ contributions, by asking for their estimate of the equation of the
graph he prepared. Those contributions were a resource that George used along with other
instructional materials. In terms of the connection dimension, George connected students’
contributions with the representation on Autograph and used examples and representations
in order to connect concepts and procedures (making connections between procedures,
making connections between concepts), he said: “So, I was using it to make them think one
thing and then force them to see it in a different way and then make them make the connection
between”. Also, George tried to connect the new concepts and procedures to the textbook and
examination requirements by using textbook exercises and past-examination questions (R5 &
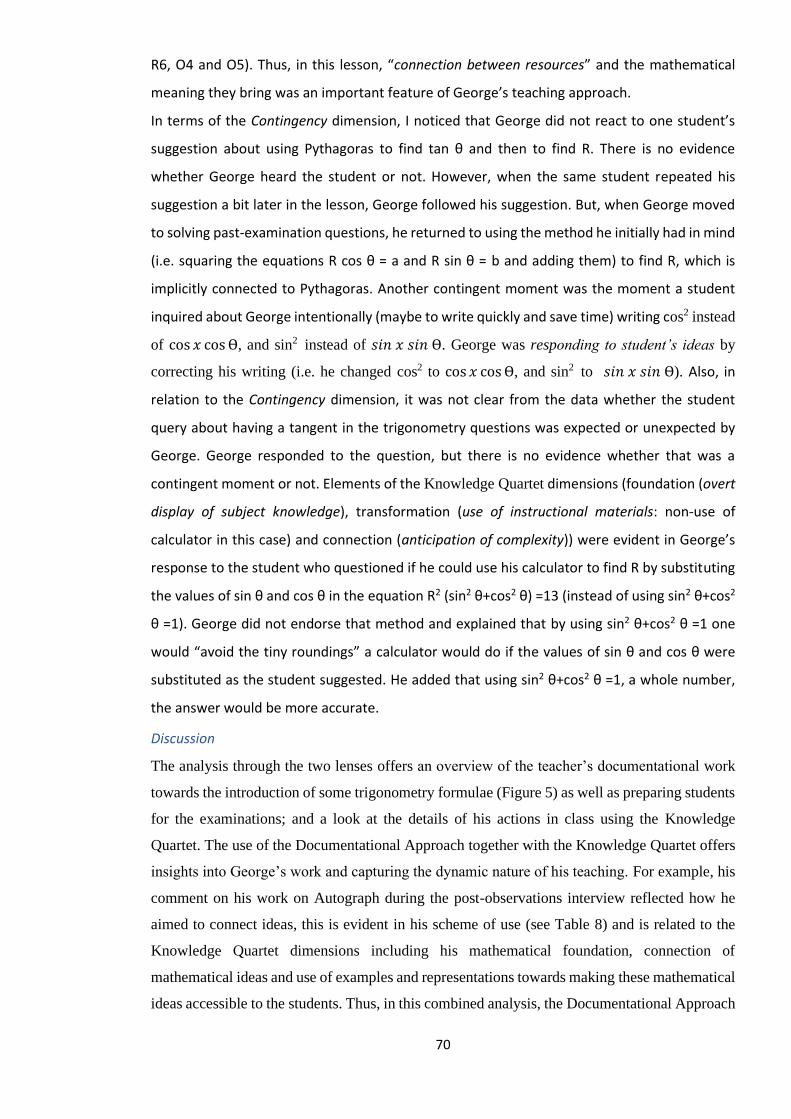
70
R6, O4 and O5). Thus, in this lesson, “connection between resources” and the mathematical
meaning they bring was an important feature of George’s teaching approach.
In terms of the Contingency dimension, I noticed that George did not react to one student’s
suggestion about using Pythagoras to find tan θ and then to find R. There is no evidence
whether George heard the student or not. However, when the same student repeated his
suggestion a bit later in the lesson, George followed his suggestion. But, when George moved
to solving past-examination questions, he returned to using the method he initially had in mind
(i.e. squaring the equations R cos θ = a and R sin θ = b and adding them) to find R, which is
implicitly connected to Pythagoras. Another contingent moment was the moment a student
inquired about George intentionally (maybe to write quickly and save time) writing cos2 instead
of cos 𝑥 cos Ɵ, and sin2 instead of 𝑠𝑖𝑛 𝑥 𝑠𝑖𝑛 Ɵ. George was responding to student’s ideas by
correcting his writing (i.e. he changed cos2 to cos 𝑥 cos Ɵ, and sin2 to 𝑠𝑖𝑛 𝑥 𝑠𝑖𝑛 Ɵ). Also, in
relation to the Contingency dimension, it was not clear from the data whether the student
query about having a tangent in the trigonometry questions was expected or unexpected by
George. George responded to the question, but there is no evidence whether that was a
contingent moment or not. Elements of the Knowledge Quartet dimensions (foundation (overt
display of subject knowledge), transformation (use of instructional materials: non-use of
calculator in this case) and connection (anticipation of complexity)) were evident in George’s
response to the student who questioned if he could use his calculator to find R by substituting
the values of sin θ and cos θ in the equation R2 (sin2 θ+cos2 θ) =13 (instead of using sin2 θ+cos2
θ =1). George did not endorse that method and explained that by using sin2 θ+cos2 θ =1 one
would “avoid the tiny roundings” a calculator would do if the values of sin θ and cos θ were
substituted as the student suggested. He added that using sin2 θ+cos2 θ =1, a whole number,
the answer would be more accurate.
Discussion
The analysis through the two lenses offers an overview of the teacher’s documentational work
towards the introduction of some trigonometry formulae (Figure 5) as well as preparing students
for the examinations; and a look at the details of his actions in class using the Knowledge
Quartet. The use of the Documentational Approach together with the Knowledge Quartet offers
insights into George’s work and capturing the dynamic nature of his teaching. For example, his
comment on his work on Autograph during the post-observations interview reflected how he
aimed to connect ideas, this is evident in his scheme of use (see Table 8) and is related to the
Knowledge Quartet dimensions including his mathematical foundation, connection of
mathematical ideas and use of examples and representations towards making these mathematical
ideas accessible to the students. Thus, in this combined analysis, the Documentational Approach
71
Table 8: George’s scheme of use in his first lesson
Scheme
Aims Rules of action Operational invariants Inferences
Specific: A1. To introduce the following trigonometry formulae:
𝑎 sin 𝑥 ± 𝑏 cos 𝑥 = 𝑅 sin(𝑥 ± 𝑎) 𝑎 cos 𝑥 ± 𝑏 sin 𝑥 = 𝑅 cos(𝑥 ∓ 𝑎)
𝑅 = √𝑎2 + 𝑏2 𝑅 cos 𝛼 = 𝑎 and 𝑅 sin 𝛼 = 𝑏
cos 𝛼 =𝑎
𝑅 , sin 𝛼 =
𝑏
𝑅 , tan 𝛼 =
𝑏
𝑎
General: A2. To prepare students for exam.
Specific: R1. Use Autograph to show the graphs of a trigonometric function on the main whiteboard, where the teacher does the work and students contribute when appropriate. R2. The trigonometric function was prepared before the lesson on Autograph. R3. Use typed trigonometry formulae.
General: R4. Connect the new ideas to students’ previous knowledge. R5. Choose exercises from the textbook, these exercises are at variety of difficulty levels. R6. Use past exam questions to show styles of questions and mark schemes and offer some practice and preparation for exam. R7. Set up homework with due date in one week. R8. Find patterns and similarities/ differences between exercises. R9. Answer students’ questions. R10. Students are given the time to solve questions and practice independently during class time.
Specific: O1. It is easier to use Autograph to connect trigonometric ideas in this case. O2. It helps to have the trigonometry typed up so at any point he can go back to that if needed, and show the students the correct steps.
General: O3. It is useful to connect new ideas to previous knowledge. O4. Choosing exercises from the textbook at variety of difficulty levels, helps to show students how to answer the question at each of these levels. O5. The use of past-exam questions helps
students practice and experience exam-style
questions, and is something requested by
students.
General: I1. The activity on Autograph went well, so the teacher will use it whenever he is teaching these formulae.
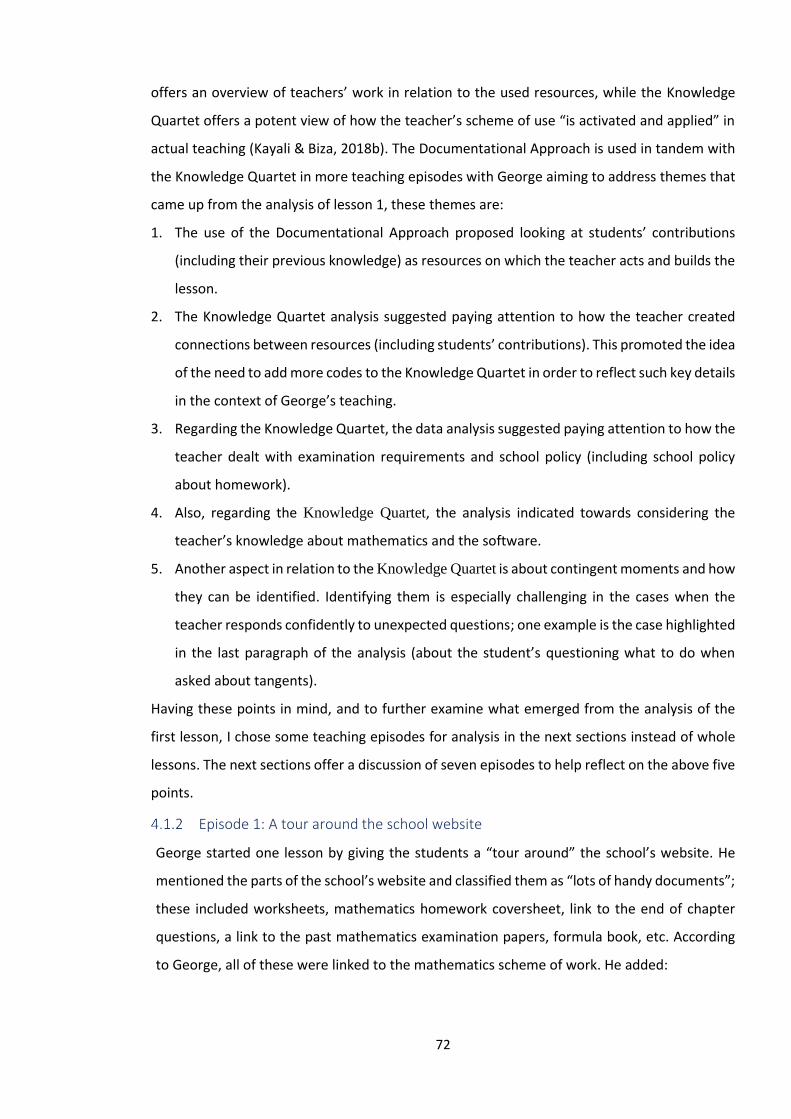
72
offers an overview of teachers’ work in relation to the used resources, while the Knowledge
Quartet offers a potent view of how the teacher’s scheme of use “is activated and applied” in
actual teaching (Kayali & Biza, 2018b). The Documentational Approach is used in tandem with
the Knowledge Quartet in more teaching episodes with George aiming to address themes that
came up from the analysis of lesson 1, these themes are:
1. The use of the Documentational Approach proposed looking at students’ contributions
(including their previous knowledge) as resources on which the teacher acts and builds the
lesson.
2. The Knowledge Quartet analysis suggested paying attention to how the teacher created
connections between resources (including students’ contributions). This promoted the idea
of the need to add more codes to the Knowledge Quartet in order to reflect such key details
in the context of George’s teaching.
3. Regarding the Knowledge Quartet, the data analysis suggested paying attention to how the
teacher dealt with examination requirements and school policy (including school policy
about homework).
4. Also, regarding the Knowledge Quartet, the analysis indicated towards considering the
teacher’s knowledge about mathematics and the software.
5. Another aspect in relation to the Knowledge Quartet is about contingent moments and how
they can be identified. Identifying them is especially challenging in the cases when the
teacher responds confidently to unexpected questions; one example is the case highlighted
in the last paragraph of the analysis (about the student’s questioning what to do when
asked about tangents).
Having these points in mind, and to further examine what emerged from the analysis of the
first lesson, I chose some teaching episodes for analysis in the next sections instead of whole
lessons. The next sections offer a discussion of seven episodes to help reflect on the above five
points.
Episode 1: A tour around the school website
George started one lesson by giving the students a “tour around” the school’s website. He
mentioned the parts of the school’s website and classified them as “lots of handy documents”;
these included worksheets, mathematics homework coversheet, link to the end of chapter
questions, a link to the past mathematics examination papers, formula book, etc. According
to George, all of these were linked to the mathematics scheme of work. He added:

73
“The reason I’m showing you this is because we’ve added new column which is your homeworks.
[…] Sometimes the homeworks are the end of chapter questions, like this one… Other times it’s
this one, we call it online test, we should call it online homework”
He then showed the link to integral maths (https://integralmaths.org/):
“Have you used MyMaths [https://www.mymaths.co.uk/] before? Yep, so it’s a little bit like that.
But this is the industry standard, this is the one that if you’re gonna use one in school, this is the
one to use. […] Have you heard of advanced maths support program or people like that? They
are the people and organisations who lead on A level maths teaching, it’s all linked together and
if they were to recommend something they’ll recommend this”.
After that George asked his students to log into the website, but not all the students in this
group were seeing the same content. Some students could only see core 2, the teacher
promised to fix that. The teacher then clicked on core 3 and explained about its content. He
asked his students how the pages appeared on mobile devices. A student answered: “it’s not
the same”. George then started setting up homework for the students and explained that the
website will enable him to see the homework assignments completed by the students and
track students’ work and progress. The teacher then gave the students ten minutes to
familiarize themselves with the site and its “resources”, in the meantime he was trying to sort
out the issues some students had with course accessibility on the website. After that, he set
up the homework of the week, which had due date next day on the website, but he asked the
students to ignore the due date and take a week to complete homework. He emailed his
students the link to the homework. The tour lasted about 25 minutes, after which George said
they should now do some “new learning”.
Analysis
This episode is part of lesson 2, the scheme of work for this full lesson is summarized in Table
9. Episode 1 focuses on George’s resources, and specifically the school website. The website
had links to the end of chapter questions, these were from the textbook - in this case Wiseman
& Searle (2005). The website also linked to past-examination papers, which reflected an
emphasis on examination requirements (O5). One link led to integral maths
(https://integralmaths.org/) and George showed appreciation of the website (O3), as it was
recommended by the people who led on A level. The part George aimed to show in this
episode was the homework part. This part was George’s tool to see who did the homework;

74
Scheme
Aims Rules of action Operational invariants Inferences
Specific: A3. To familiarize students with the school website. A4. To set up homework A5. To introduce the volume of revolution
General: A6. To prepare students for exam
Specific: R11. Explain to the students about what they find on the school website R12. Check what students see on the screen once they log into integral maths R13. Set up homework on the website R14. Start introducing the volume of revolution R15. Remind the students of the formula used to find the area of a circle R16. Use Autograph to show the students a graph drawn in 3D R17. Show students the graph is for a function they previously learnt R18. Use trapezium rule and Simpson’s rule on Autograph to shade the area between the graph and the x-axis R19. Explain that Simpson’s rule is more accurate R20. Rotate the shaded area around the x-axis R21. Show the students different positions and rotations of the shaded area
R22. Show another example prepared previously for the graph of 𝑦 = √𝑥 R23. Introduce the formula for volume of revolution using Autograph R24. Give some idea about the history of the integration notation R25. Explain why integration is used to find the volume of revolution R26. Use a textbook image to explain the formula of volume of revolution R27. Solve an example from the textbook, starting with an easy question R28. Use the formula sheet saved on the computer and give hard copies R29. Explain the formula for rotations around the y-axis General: R30. To give the students a tour around the school website R31. Give the students 10 minutes to familiarize themselves with the website R32. Introduce volume of revolution and connect it to students’ previous knowledge R33. Give tips to the students and answer their questions R34. Use exam questions to familiarize students with questions on volume of revolution R35. Use the formula sheet
Specific: O1. Graphs on Autograph help students
understand the volume of revolution
O2. With Autograph we can make all these
weird different shapes and have a bit of fun
O3. Using a familiar graph helps reinforcing
students’ previous knowledge
O4. Using graphs drawn before helps in
focusing on the new topic during the lesson
O5. The textbook image “shows it cut up a little bit easier… better than anything I could do on Autograph”
General: O6. The school website is useful O7. Students need to see the website because of the addition of homework column O8. Integral maths is recommended to students, it is designed by those who lead on A level maths teaching and has lots of helpful resources O9. Setting up homework on the website enables the teacher to see how long students spends on the it, their scores, and attempts O10. Autograph helps students visualise the rotation and volume of revolution in 3D O11. The use of exam-style questions is in
response to students’ needs
Specific: I2. The textbook image is easier than anything done on Autograph I3. It is useful to have Autograph and textbook I4. “We can make all these weird different shapes and have a bit of fun with it” I5. Using the sine function is more interesting than using polynomials
Table 9: George’s scheme for lesson 2 on volume of revolution

75
how much each student progressed and how much time s/he spend on the homework. All of
these reflected George’s appreciation of institutional factors: the school and its policies (e.g.
homework policy), the textbook, and examination requirements (O1 and O2). One important
resource here is the homework tool on the school website; which would help George monitor
students’ progress on homework, both in terms of the time spent on it and its quality.
Three episodes on the volume of revolution:
The three episodes about the volume of revolution were taken from the second, fourth and
seventh lessons I observed for George. They aimed to teach the same topic, hence I grouped
them together in this section. Each lesson lasted for fifty minutes. The first and third of these
lessons were taught to one group (G1) of Year 13 students, in the first lesson George introduced
the idea of volume of revolution and in the third one he reviewed the same idea to his students.
The second lesson was taught to another group (G2) of the same year, and this was a lesson to
introduce the volume of revolution to the students. A detailed overview of the episode from
the first lesson (lesson 2) is offered in the next sections, after that two sections are devoted to
show the changes noticed in lesson observations 4 and then 7.
Episode 2- from Lesson 2
This lesson included George familiarizing a group of year 13 students (G1) with the different
components of school website including the one for homework (episode 1); and introducing
the volume of revolution to them. The following three sections will look specifically at George’s
introduction to the volume of revolution through Autograph.
Introduction to “new learning” through Autograph
George started what he described as “new learning” in this lesson by stating the lesson topic,
which was the volume of revolution. George asked a student he chose about the area of a circle.
The student said 2𝜋 𝑟 first, then 2𝜋𝑟2, then he said that he did not remember. Another student
said the correct formula (𝜋𝑟2). The teacher then commented that these “are the two formulae”
for a circle and that “something squared that’s gonna give you the area, and 2 π r that’s gonna
give you the circumference”.
George then started using the interactive white board. He showed the students a graph of
y=x(3-x) and commented that although the graph might look like a “normal” graph to the
students, he had actually “drawn it in 3D”. He rotated the graph to show the students that it
was 3D. He added that he wanted to find the area underneath the graph and that he would use

76
the trapezium3 rule, about which students learnt in core 2. The teacher tried to use Autograph
to apply the trapezium rule, but he was not sure how to do it. His first attempt did not work,
and he reached an unexpected result. His second attempt worked, and he applied the
trapezium rule with five divisions (Figure 9). He looked for the zooming in option, a student
pointed out that it can be done using the “magnifying glass on the left side”. George zoomed
in and edited the image to get the graph in Figure 10.
Figure 9: Trapezium rule for y=x(3-x) with 5 divisions (reproduction of George’s work)
Figure 10: Trapezium rule for y=x(3-x) with 5 divisions as edited by George (reproduction of
George’s work)
3 Trapezium rule: to estimate the area under a curve 𝑦 = 𝑓(𝑥), split the required area into 𝑛 trapeziums and sum up these trapeziums’ area. This leads to the formula:
∫ 𝑦𝑑𝑥𝑏
𝑎≈
ℎ
2[ (𝑦0 + 𝑦𝑛) + 2 (𝑦1 + 𝑦2 + ⋯ + 𝑦𝑛−1)] where ℎ =
𝑏−𝑎
𝑛
(Wiseman & Searle, 2005, pp. 128-129)

77
George reminded the students that with fewer divisions the answer would be less accurate and
showed them how the answer and the covered area would change when moving from 3
divisions to 12 divisions.
He then moved to using Simpson’s4 rule, which he said he was going to explain later: “I’m gonna
use Simpsons rule because it filled it up a lot nicer. Even if you’ve got two divisions, it’s filling
in quite nicely”, so he showed his student the graph of y=x(3-x) (Figure 11) with two divisions
using Simpson’s rule. George rotated the shaded area he got using Simpson’s rule around the
x-axis, and he got a shape (Figure 12) that looked like a “pointy sphere”, a “Pacman5”, or a
“smarty” as he described it.
Figure 11: Simpson’s rule for y=x(3-x) with 2 divisions (reproduction of George’s work)
4Simpson’s rule: to estimate the area under a curve, this rule fits a quadratic function to the curve where the quadratic passes through the mid-point and each of the two end points, leading to the formula:
∫ 𝑦𝑑𝑥𝑏
𝑎≈
ℎ
3[ (𝑦0 + 𝑦𝑛) + 4 (𝑦1 + 𝑦3 + ⋯ + 𝑦𝑛−1) + 2 (𝑦2 + 𝑦4 + ⋯ + 𝑦𝑛−2)], where ℎ =
𝑏−𝑎
𝑛
and n is even (Wiseman & Searle, 2005, p. 132) 5 In reference to Pacman who was the hero character in the videogame Pacman that was released in 1980. The game can be accessed on www.webpacman.com

78
George opened another pre-prepared graph on Autograph, this time for 𝑦 = 𝑥, and showed
the students the rotation of the area between this graph and the x-axis, around the x-axis
(Figure 13). George added that the idea is not just to admire how “pretty” these shapes are,
but also to work out their volume and for that the area of a circle is needed. So, he tried to
explain to the students how to work out the volume of revolution using the software. To do
that, he rotated the graph with a small angle on the software in order to show a “thin slice” of
the shape for which he wanted to find the volume. He was dragging the end of the arc further
from the axes and make the shaded area smaller and then bigger again. After that, he dragged
a point again to show a thin slice of the shaded area (Figure 14). It seemed that George did not
feel that the software showed what he was planning to show, and he was not satisfied with the
demonstration he offered. He again tried to demonstrate how the formula can be concluded,
emphasising that the formula will include integrating 𝜋𝑟2 between the limits the students are
given in the question. After that, he moved to talking about who came up with the integration
notations and explained that integration is like “sum”, that was why the symbol for integration
(ʃ) is like an (s) shape.
Figure 12: Rotating the shaded area in Figure 13 around the x-axis (reproduction of George’s work)
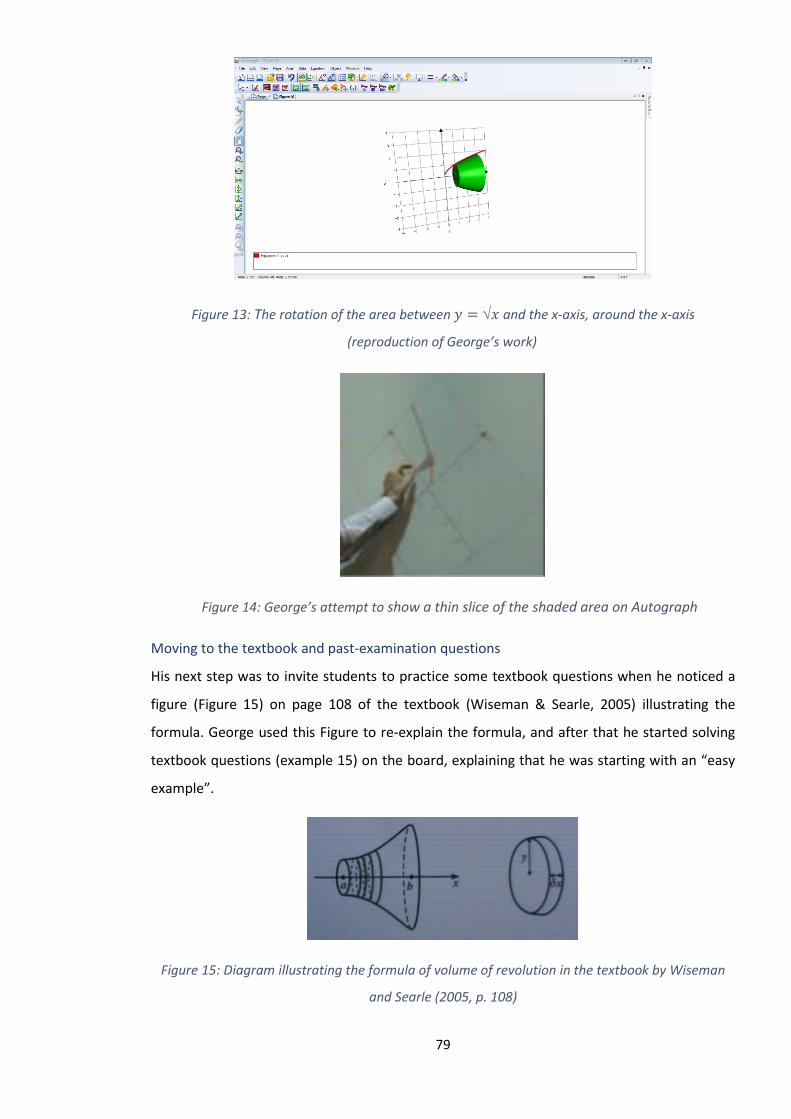
79
Figure 13: The rotation of the area between 𝑦 = 𝑥 and the x-axis, around the x-axis
(reproduction of George’s work)
Figure 14: George’s attempt to show a thin slice of the shaded area on Autograph
Moving to the textbook and past-examination questions
His next step was to invite students to practice some textbook questions when he noticed a
figure (Figure 15) on page 108 of the textbook (Wiseman & Searle, 2005) illustrating the
formula. George used this Figure to re-explain the formula, and after that he started solving
textbook questions (example 15) on the board, explaining that he was starting with an “easy
example”.
Figure 15: Diagram illustrating the formula of volume of revolution in the textbook by Wiseman
and Searle (2005, p. 108)

80
Figure 16: Formula sheet for volume of revolution, prepared by George
Afterwards, George displayed the formula sheet (Figure 16) on the interactive whiteboard, and
remembered at that point that he had not explained the formula of the volume of revolution
for rotations around the y-axis. So, he went quickly through this formula by advising the
students to replace y by x and the dx by dy in the initial formula.
He then went back to talk about Newton and Leibniz and their notations for differentiation and
integration:
“So, Newton was busy doing y dot and y double dot which actually ties on with you, you know if
you do f(x) the dot slowly became a dash and so we get the double dash. Have you seen that
before, that notation? And then you have Leibniz doing the dy by dx and d2y by dx2. Someone
asked me the other day, so I’m not sure why do we say d2y instead of d2y? I’m not sure about
that. So, this is a little bit of history about where it came from. So, it was Leibniz and Newton
both worked and independently to do Calculus…”.
After that, George gave the students some guidance on how to solve example 15 from
Wiseman and Searle (2005, p. 108). He also commented on another example (Figure 17) that
contained “horrible square root”, saying that because the students will get rid of the square
root as soon as they apply the formula which includes squaring y. A student then asked why it
was y2, so George replied by explaining again about the thin disks that form the shape and how
integrating the formula for their area, which is the formula for circle area, will give the volume
required. Then, a student asked how the questions came in the national examination and
whether there could be a need to do “integration by parts” in such questions or whether it was
“more likely to be an easier way”. The teacher answered “they could … I think so”. George
chose to do a past-examination question on the board next. He opened the school website on
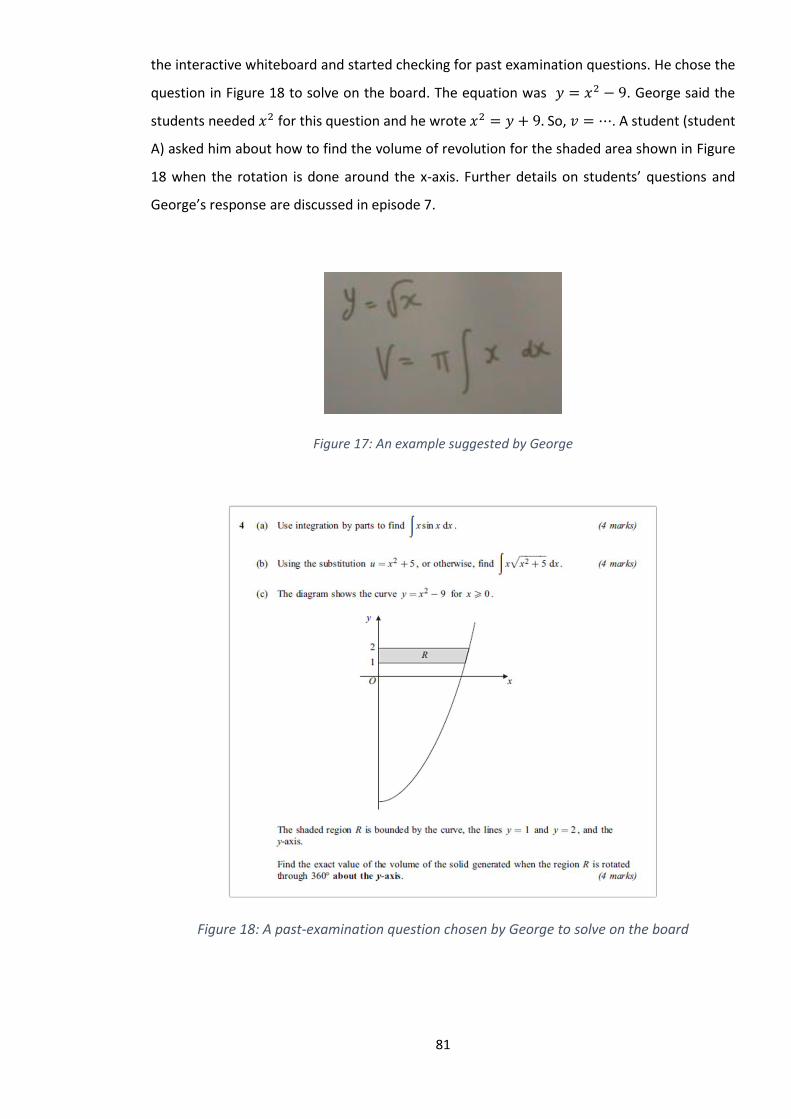
81
the interactive whiteboard and started checking for past examination questions. He chose the
question in Figure 18 to solve on the board. The equation was 𝑦 = 𝑥2 − 9. George said the
students needed 𝑥2 for this question and he wrote 𝑥2 = 𝑦 + 9. So, 𝑣 = ⋯. A student (student
A) asked him about how to find the volume of revolution for the shaded area shown in Figure
18 when the rotation is done around the x-axis. Further details on students’ questions and
George’s response are discussed in episode 7.
Figure 17: An example suggested by George
Figure 18: A past-examination question chosen by George to solve on the board
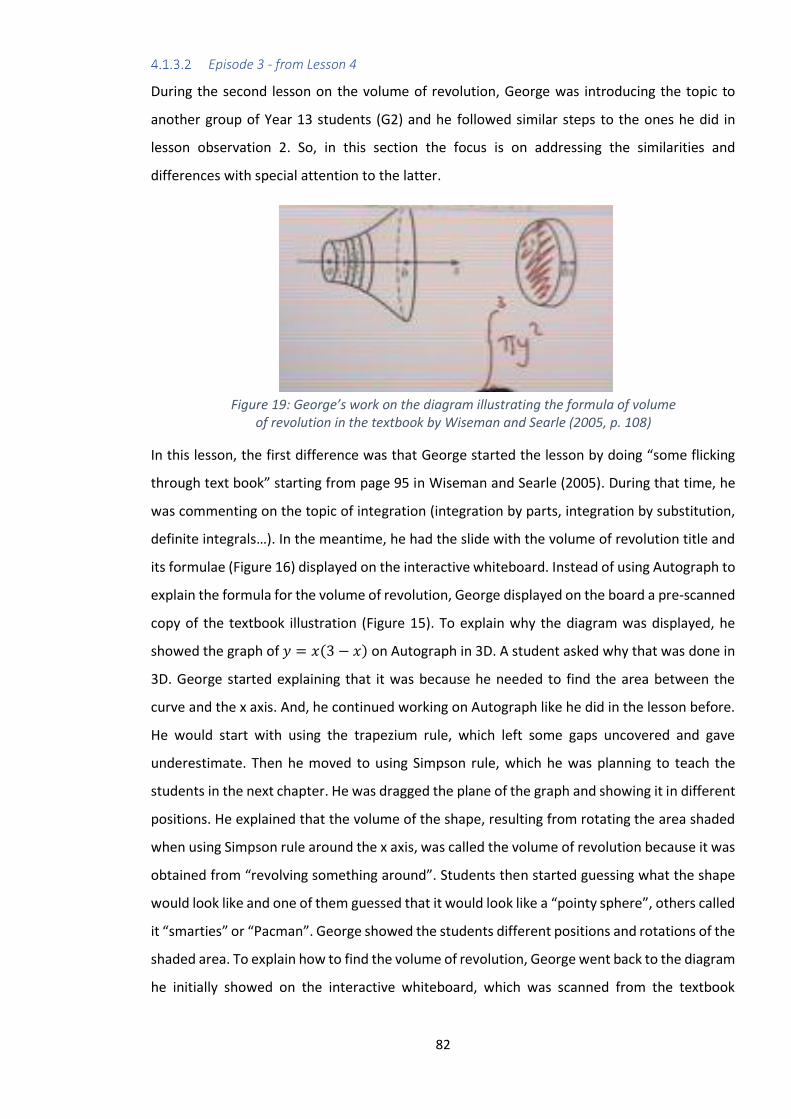
82
Episode 3 - from Lesson 4
During the second lesson on the volume of revolution, George was introducing the topic to
another group of Year 13 students (G2) and he followed similar steps to the ones he did in
lesson observation 2. So, in this section the focus is on addressing the similarities and
differences with special attention to the latter.
In this lesson, the first difference was that George started the lesson by doing “some flicking
through text book” starting from page 95 in Wiseman and Searle (2005). During that time, he
was commenting on the topic of integration (integration by parts, integration by substitution,
definite integrals…). In the meantime, he had the slide with the volume of revolution title and
its formulae (Figure 16) displayed on the interactive whiteboard. Instead of using Autograph to
explain the formula for the volume of revolution, George displayed on the board a pre-scanned
copy of the textbook illustration (Figure 15). To explain why the diagram was displayed, he
showed the graph of 𝑦 = 𝑥(3 − 𝑥) on Autograph in 3D. A student asked why that was done in
3D. George started explaining that it was because he needed to find the area between the
curve and the x axis. And, he continued working on Autograph like he did in the lesson before.
He would start with using the trapezium rule, which left some gaps uncovered and gave
underestimate. Then he moved to using Simpson rule, which he was planning to teach the
students in the next chapter. He was dragged the plane of the graph and showing it in different
positions. He explained that the volume of the shape, resulting from rotating the area shaded
when using Simpson rule around the x axis, was called the volume of revolution because it was
obtained from “revolving something around”. Students then started guessing what the shape
would look like and one of them guessed that it would look like a “pointy sphere”, others called
it “smarties” or “Pacman”. George showed the students different positions and rotations of the
shaded area. To explain how to find the volume of revolution, George went back to the diagram
he initially showed on the interactive whiteboard, which was scanned from the textbook
Figure 19: George’s work on the diagram illustrating the formula of volume of revolution in the textbook by Wiseman and Searle (2005, p. 108)

83
(Figure 15). He explained the formula of the volume of revolution in a way similar to the way
he used in the previous lesson with this image, suggesting that students should think of the
volume as “lots of slices” being added up using integration. He asked the students to look at
one “slice” and think of what the area of its face was, it was a circle (𝜋𝑟2). He explained that
instead of r it is y in this case (Figure 19). Then, the explanation became more specific as he
used the equation he entered on Autograph to find the volume of revolution and to show the
students the limits of the integration for this example:
𝑦 = 𝑥(3 − 𝑥)
𝑦 = 3𝑥 − 𝑥2
𝑉 = ∫ 𝜋𝑦2
3
0
𝑑𝑥
𝑉 = 𝜋 ∫(3𝑥 − 𝑥2)2
3
0
𝑑𝑥
𝑉 = 𝜋 ∫ 9𝑥2−6𝑥3 + 𝑥4
3
0
𝑑𝑥
A second difference was that George talked about the following example that contained a
square root:
𝑦 = √3𝑥2 − 7𝑥 + 2
𝑦2 = 3𝑥2 − 7𝑥 + 2
He used it to explain that because students needed to find 𝑦2 to find the volume of revolution,
they would get rid of the “horrible” square root. He also reminded the students that they need
to multiply the integral of 𝑦2 by π. After that, George started explaining that to find the volume
of revolution when the rotation is done around the y axis, students only need to change 𝑦2
into 𝑥2 and 𝑑𝑥 into 𝑑𝑦. This was done while the formula sheet was displayed on the interactive
whiteboard.
A third difference is that, in this lesson, George went back to Autograph to show two more
examples not just one. He showed the students the rotation of 𝑦 = √𝑥, which was pre-
prepared and used in the previous lesson. As well, he used a new pre-prepared example which
was the rotation of the sine function: 𝑦 = 𝑠𝑖𝑛(𝑎𝑥 + 𝑏) + 𝑐. With this example, he used a, b
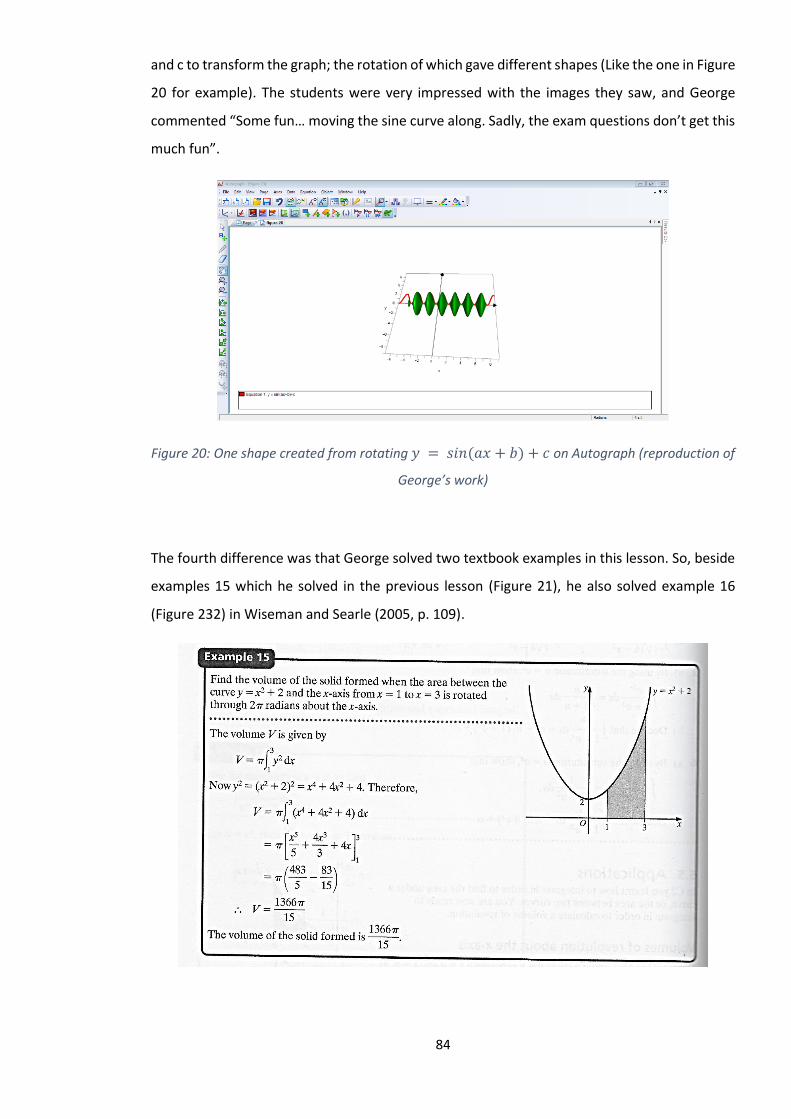
84
and c to transform the graph; the rotation of which gave different shapes (Like the one in Figure
20 for example). The students were very impressed with the images they saw, and George
commented “Some fun… moving the sine curve along. Sadly, the exam questions don’t get this
much fun”.
Figure 20: One shape created from rotating 𝑦 = 𝑠𝑖𝑛(𝑎𝑥 + 𝑏) + 𝑐 on Autograph (reproduction of
George’s work)
The fourth difference was that George solved two textbook examples in this lesson. So, beside
examples 15 which he solved in the previous lesson (Figure 21), he also solved example 16
(Figure 232) in Wiseman and Searle (2005, p. 109).

85
Figure 21: Example 15 in Wiseman and Searle (2005, p. 109)
Figure 22: Example 16 in Wiseman and Searle (2005, p. 109)
The fifth difference during this lesson was when George recalled two questions asked by
students during lesson 2 with G1. He talked about when a student (student A) asked him
about how to find the volume of revolution for the shaded area shown in Figure 18 when the
rotation is done around the x-axis. But, instead of using the original
image in Figure 18, he used a shape he drew quickly (Figure 23) and stated that the student
asked him about the volume of revolution in this case. One student voluntarily answered
“cylinder”. The teacher responded “Exactly, exactly, exactly, you do your volume of revolution
as normal take away that cylinder…”.
Figure 23: A shape sketched by George during his second lesson on volume of revolution
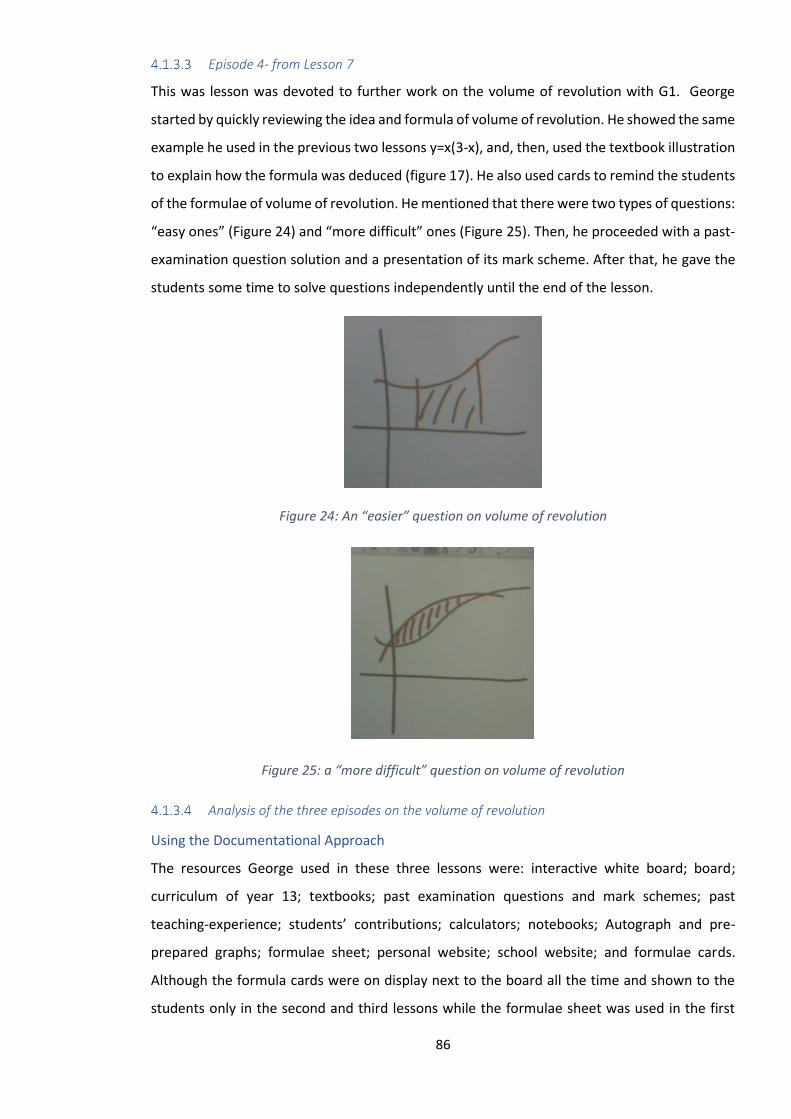
86
Episode 4- from Lesson 7
This was lesson was devoted to further work on the volume of revolution with G1. George
started by quickly reviewing the idea and formula of volume of revolution. He showed the same
example he used in the previous two lessons y=x(3-x), and, then, used the textbook illustration
to explain how the formula was deduced (figure 17). He also used cards to remind the students
of the formulae of volume of revolution. He mentioned that there were two types of questions:
“easy ones” (Figure 24) and “more difficult” ones (Figure 25). Then, he proceeded with a past-
examination question solution and a presentation of its mark scheme. After that, he gave the
students some time to solve questions independently until the end of the lesson.
Figure 24: An “easier” question on volume of revolution
Figure 25: a “more difficult” question on volume of revolution
Analysis of the three episodes on the volume of revolution
Using the Documentational Approach
The resources George used in these three lessons were: interactive white board; board;
curriculum of year 13; textbooks; past examination questions and mark schemes; past
teaching-experience; students’ contributions; calculators; notebooks; Autograph and pre-
prepared graphs; formulae sheet; personal website; school website; and formulae cards.
Although the formula cards were on display next to the board all the time and shown to the
students only in the second and third lessons while the formulae sheet was used in the first

87
and second lessons, the resources stayed almost the same across the three lessons. One more
resource is added in the second and third episodes; that is George’s experience teaching the
first episode (specifically his experience in explaining the formula using Autograph and then
the textbook diagram in Figure 15).
The schemes of use, George followed in lessons 2, 4 and 7 are summarized in Table 9, Table 10
and Table 11. The three schemes had the same aims: a specific aim “teach students about the
volume of revolution”, and a more general one “to prepare students for the exams”. In terms
of the other elements of George’s scheme of use, I notice that George’s rules of action in the
first lesson included specific rules of actions that were under general ones. Under the general
rule of action “to introduce the volume of revolution using Autograph” it is noticed that George
went through specific rules of action including: showing the students the graph of 𝑦 = 𝑥(𝑥 −
3) drawn in 3D on Autograph; the use of the trapezium rule and Simpson’s rule on Autograph;
explaining that Simpson’s rule is more accurate than the trapezium rule in this case; rotating
the shaded area around the x-axis; showing the students different positions and rotations of
the shaded area; showing another example prepared previously for the graph of 𝑦 = √𝑥;
introducing the formula for volume of revolution around the x-axis using Autograph. While
under the general rule of action “to connect new ideas with students’ previous knowledge”,
rules of action included: reminding students of the formula of circle’s area; explaining why
integration is used to find the volume of revolution. Under the general rule of action “to use
the textbook”, specific rules of actions included: using the textbook diagram to explain the
formula; solving an example from the textbook; and starting with an “easy” example. Other
rules of action were: to talk about the history of integration notation; to use the formulae sheet
to show the formulae; to explain the formula for rotations around the y-axis; to give tips to the
students; to answer students’ questions; to use past examination questions to give students
idea about how they are tested on the volume of revolution; to give hard copies of the formulae
sheet. The operational invariants included a general one like “George’s appreciation of
Autograph” under which there are specific ones including: Autograph helps students visualise
the volume of revolution in 3D; with Autograph he “can make weird shapes and have fun”; his
use of familiar graph on Autograph in order to “reinforce previous knowledge”; his use of pre-
prepared graphs in order to help helps in focusing on the new topic and saves time. Other
operational invariants included statements from George in relation to finding that for the
purpose of explain the formulae the textbook diagram worked better than Autograph; and that
the use of past-examination questions is in response to students’ needs and to give them some
practice for the examination.

88
Scheme
Aims Rules of action Operational invariants Inferences
Specific: A1. To introduce the volume of revolution
General: A2. To prepare students for exam
Specific: R1. To flick through the textbook starting from page 9, talking about integration R2. Display the volume of revolution formulae on the board R3. Start introducing the volume of revolution R4. Show the textbook diagram that illustrates the volume of revolution formula R5. Use Autograph to show the students the graph of 𝑦 = 𝑥(3 − 𝑥) in 3D R6. Use trapezium rule and Simpson’s rule on Autograph, and explain which is more accurate R7. Rotate the shaded area around the x-axis, and show its different positions and rotations R8. Use a textbook image to explain the formula of volume of revolution R9. Explain the formula specifically for 𝑦 = 𝑥(3 − 𝑥), rotated around the x-axis R10. Solve an example that has a square root R11. Explain the formula for rotations around the y-axis
R12. Use Autograph to show another example prepared previously for the graph of 𝑦 = √𝑥 rotated around the x-axis R13. Use Autograph to show another example prepared previously for the graph of 𝑦 = sin 𝑥 rotated around the x-axis R14. Show the graphs are for functions the students had seen before R15. Stretch and shift sine graph on Autograph to show interesting shapes formed by rotation R16. Mention a question asked by a student from a different group, in a previous lesson on the volume of revolution and invite students to answer it R17. Start with an easy question (from a previous lesson) R18. Show students the difficult textbook questions that exceed exam requirements R19. Use the formula sheet saved on the computer to show the formula to the students
General: R20. Connect new ideas about volume of revolution with students’ previous knowledge R21. Solve examples from the textbook R22. Give tips to the students and answer students’ questions R23. Use exam questions to show students how they are tested on volume of revolution
Specific: O1. The textbook image “shows it cut up a little bit easier… and is better than anything I could do on Autograph” O2. The graphs on Autograph help the students understand the volume of revolution and is a “kind of hook that interesting thing so they can see exactly what we are going on here” O3. With Autograph “we can make all these weird different shapes and have a bit of fun” O4. Using a familiar graph helps reinforcing previous knowledge about transformations O5. Using graphs drawn before helps in focusing on the new topic O6. Using an example that contains a square root helps the students see how they can get rid of the having a horrible square root in the formula
General: O7. Autograph helps students visualise the volume of revolution in 3D O8. The use of exam-style questions is in response to students’ needs, and to give practice for the exam
Specific: I1. The textbook image “shows it cut up a little bit easier… better than anything I could do on Autograph” I2. It is useful to have both Autograph and textbook I3. “We can make all these weird different shapes and have a bit of fun” I4. Using the sine function is more interesting than using polynomials
Table 10: George’s scheme during the fourth lesson on volume of revolution

89
Scheme
Aims Rules of action Operational invariants Inferences
Specific: A1. To continue working on the volume of revolution
General: A1. To prepare students for exam
Specific: R1. Check with the students what they learnt in previous lessons R2. Re- introduce the volume of revolution R3. Use the formula card to remind students of the formulae R4. Use Autograph to show the students the graph of 𝑦 = 𝑥(3 − 𝑥) in 3D R5. Connect the new ideas about volume of revolution with the students’ previous knowledge R6. Use trapezium rule and Simpson rule on Autograph, explain that Simpson’s rule is more accurate, and rotate the shaded area around the x axis R7. Show different positions and rotations of the shaded area and comment on colour/shade R8. Show the textbook diagram that illustrates the formula for the volume of revolution R9. Use a textbook image to explain the formula of volume of revolution R10. Answer a student’s question about why they should learn about volume of revolution R11. Explain the formula specifically for the case of = 𝑥(3 − 𝑥), rotated around the x axis R12. Use an example that contains a square root to explain how to use the formula for the volume of revolution in similar situations R13. Explain that students do not need to learn how to find the formula, but how to use it R14. Explain the formula for rotations around the y-axis R15. Mention that there are two types of questions, easy ones asking about the area between a graph and the x/y-axis, and difficult ones asking about the area between two graphs R16. Show past-exam questions to give students idea how they are tested on the volume of revolution, and solve one question and review its mark scheme in detail on the board
General: R17. Review how to find volume of revolution R18. Respond to students’ contributions and questions R19. Give tips to the students R20. Solve past exam questions on board and let students practice solving some independently
Specific: O1. Graphs on Autograph help
students understand the volume of
revolution as is a “kind of hook that
interesting thing so they can see
exactly what we are going on here”
O2. Autograph helps the students
visualise the volume of revolution in
3D and shows the rotation
O3. With Autograph we can make
all these weird different shapes and
have a bit of fun with it
O4. Using graphs drawn before
helps in focusing on the new topic
O5. The textbook image “shows it cut up a little bit easier… better than anything I could do on Autograph”
General: O6. The revision of the topic is useful for students who were not able to attend the previous lesson O7. The use of exam-style questions is in response to students’ needs, and to give them practice for exams
Specific: I1. The textbook image “shows it cut up a little bit easier… better than anything I could do on Autograph” I2. It is useful to have both Autograph and textbook I3. “We can make all these weird different shapes and have a bit of fun”
Table 11: George’s scheme during the seventh lesson on volume of revolution

90
In the second and third lessons, during which George introduced the volume of revolution to
G2 and continued working on the topic with G1, the operational invariants stayed the same.
And although, most of the rules of actions remained the same during the three lessons, there
were differences in their appearance in George’s teaching and in their order. In the rest of the
analysis, the focus is on some of these differences in the rules of actions. Also, the inferences
in George’s scheme of use will be discussed in the three observations and the follow-up
interview.
One main difference we see is in the use of Autograph. In the second lesson, did not attempt
to use Autograph to introduce the formulae for volume of revolution. He used only the
textbook diagram (Figure 19) for that purpose. He also showed one more example on
Autograph in this lesson, then moved to working on textbook questions as he did in the
previous lesson. In the third lesson, with G1, George continued working on the volume of
revolution topic by quickly showing graph of function 𝑦 = 𝑥(𝑥 − 3) and rotations of areas on
Autograph, in a way similar to the way he followed in the first lesson and second lessons. Then,
moved to solving textbook and past-examination questions.
In summary, in the last two lessons, “introduce the formula for volume of revolution around
the x-axis using Autograph” was not a rule of action. And, in the interview, George commented
on this by saying that the textbook diagram “show[ed] it cut up a little bit easier […] and [was]
better than anything [he] could do on Autograph”. So, George’s first inference from the three
lessons is that he found the textbook diagram more helpful in explaining the formulae. He
added that he found it useful to have “both Autograph and the textbook”. This leads us to his
other inference: it is useful to use both Autograph and the textbook as resources. Another
inference is related to the functions entered on Autograph and how these were chosen to
expand and build on students’ previous knowledge by using familiar graphs. George
commented during the interview on his choice of functions to graph on Autograph, and
specifically his use of the sine function during the second lesson:
“Partly from using that in previous lessons. So, knowing that that is going to give an interesting
shape, and from playing around with sine graphs and things like that in previous lessons. So,
using functions that they were aware of […] So, a transformation of the sine curve I think, we
were doing that with it. What I’m also doing there, I am also reinforcing or going back over
making sure that they know about their transformations. So, I’m kind of teaching two topics at
once. So, although we are doing this volume of revolution, I am also reminding them of what
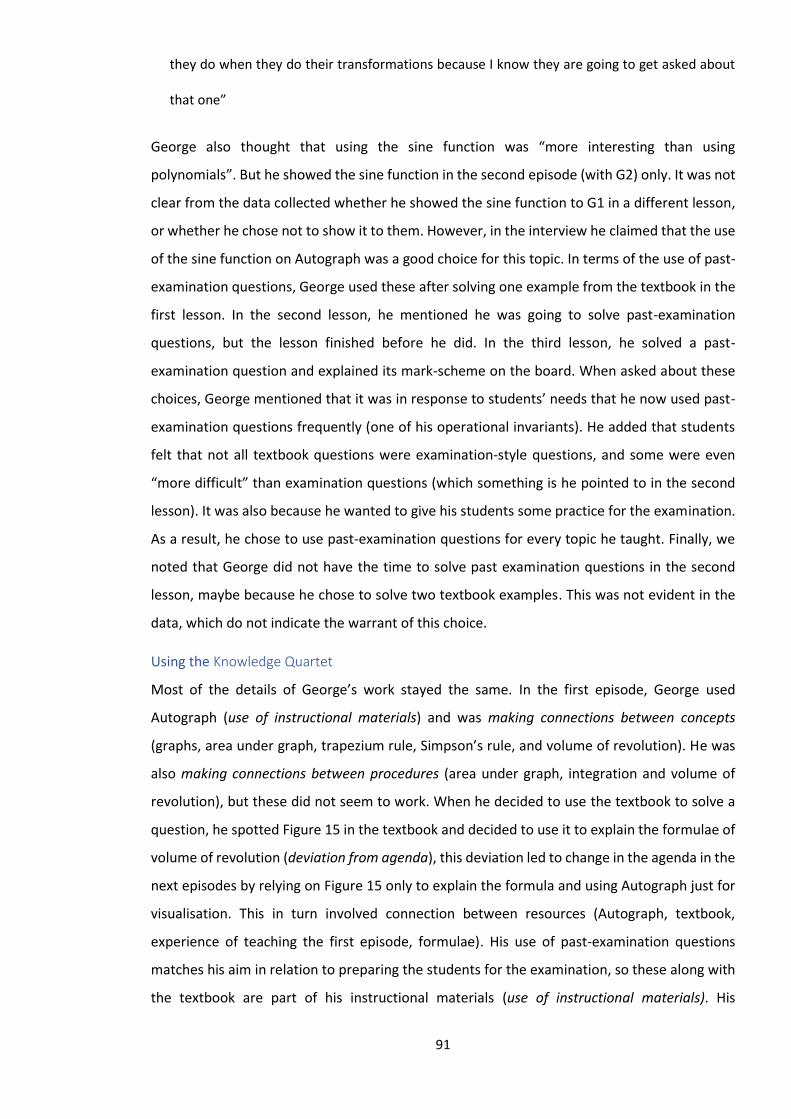
91
they do when they do their transformations because I know they are going to get asked about
that one”
George also thought that using the sine function was “more interesting than using
polynomials”. But he showed the sine function in the second episode (with G2) only. It was not
clear from the data collected whether he showed the sine function to G1 in a different lesson,
or whether he chose not to show it to them. However, in the interview he claimed that the use
of the sine function on Autograph was a good choice for this topic. In terms of the use of past-
examination questions, George used these after solving one example from the textbook in the
first lesson. In the second lesson, he mentioned he was going to solve past-examination
questions, but the lesson finished before he did. In the third lesson, he solved a past-
examination question and explained its mark-scheme on the board. When asked about these
choices, George mentioned that it was in response to students’ needs that he now used past-
examination questions frequently (one of his operational invariants). He added that students
felt that not all textbook questions were examination-style questions, and some were even
“more difficult” than examination questions (which something is he pointed to in the second
lesson). It was also because he wanted to give his students some practice for the examination.
As a result, he chose to use past-examination questions for every topic he taught. Finally, we
noted that George did not have the time to solve past examination questions in the second
lesson, maybe because he chose to solve two textbook examples. This was not evident in the
data, which do not indicate the warrant of this choice.
Using the Knowledge Quartet
Most of the details of George’s work stayed the same. In the first episode, George used
Autograph (use of instructional materials) and was making connections between concepts
(graphs, area under graph, trapezium rule, Simpson’s rule, and volume of revolution). He was
also making connections between procedures (area under graph, integration and volume of
revolution), but these did not seem to work. When he decided to use the textbook to solve a
question, he spotted Figure 15 in the textbook and decided to use it to explain the formulae of
volume of revolution (deviation from agenda), this deviation led to change in the agenda in the
next episodes by relying on Figure 15 only to explain the formula and using Autograph just for
visualisation. This in turn involved connection between resources (Autograph, textbook,
experience of teaching the first episode, formulae). His use of past-examination questions
matches his aim in relation to preparing the students for the examination, so these along with
the textbook are part of his instructional materials (use of instructional materials). His

92
reference to the history of mathematics, specifically in relation to the symbol of integration,
does not come under any of the current Knowledge Quartet codes. One possible way to include
it is by expanding on the foundation dimension to include knowledge about the history of
mathematics.
Contingency was evident during the use of Autograph in the first episode, when George was
trying different commands, in other words checking the availability of tools (e.g. to show
“slices” of shape he got on Autograph). Having spotted the textbook diagram, he then
responded to the availability of resources (i.e. the textbook diagram) (responding to the
(un)availability of tools and resources), and offered demonstration accordingly.
In summary, the differences between the three episodes on volume of revolution were related
to the scheme of work in terms of order or rules of actions, but this change of scheme of work
was due to the contingent moment George had when using Autograph in the first episode. This
demonstrates the potencies of using Documentational Approach and the Knowledge Quartet
to look at the dynamic nature of teachers’ ‘live’ work and “explore the micro-evolution, namely
the small changes and the rationale behind these changes, of teachers’ documents from one
lesson to another” (Kayali & Biza, 2018a, p. 202). Kayali and Biza (2018a) defined this micro-
evolution as re-scheming, meaning scheming “again or differently” (Adler, 2000, p. 207), from
one lesson to another. Re-scheming is further addressed in the Chapter 5 “Findings”,
Episode 5 - from lesson 9: on differential equations
Lesson 9 was taught to a group of seventeen year 13 students. It started by George solving
some textbook questions on numerical methods, specifically iteration. Then, he reminded the
students that they learned about differential equations the day before and that the example
they solved was a “nice” one. George tried to remember what the example was and thought
it was 𝑑𝑦
𝑑𝑥=
𝑥+1
𝑦, which was question 2(b) in Wiseman and Searle (2005, p. 233). He asked his
students to tell him how they solved it and he started writing:
𝑑𝑦
𝑑𝑥=
𝑥 + 1
𝑦
∫ 𝑦. 𝑑𝑦 = ∫(𝑥 + 1). 𝑑𝑥 [the dots (.) here meant multiplied by]
𝑦2
2+ 𝑐 =
(𝑥 + 1)2
2+ 𝑐
𝑦2
2+ 𝑐 =
𝑥 2
2+ 𝑥 + 𝑐
93
Although the c on the first side on the last two equations was different from the one on the
second side, George still used c on both sides instead of using 𝑐1 and 𝑐2 for example. He even
continued writing:
𝑦2
2=
𝑥 2
2+ 𝑥 + 𝑐
And explained that in his last step he combined the c’s in the previous equations and got “a big
c”, and that his next step is “rearranging”.
𝑦2 = 𝑥 2 + 2𝑥 + 𝑐
George added: “and then just square root both sides, ok. At that point you’ve got the general
solution, and that’s where we got the graphs like this. Because it’s all different solutions,
because we don’t know what the + c is” (referring to Figure 26, which is for the equation
𝑥(𝑥 − 1)𝑑𝑦
𝑑𝑥= 𝑦 on Autograph).
Figure 26: 𝑥(𝑥 − 1)𝑑𝑦
𝑑𝑥= 𝑦 on Autograph (reproduction of George’s work)
Then, the following conversation took place:
Students A: So, how did you do, you didn’t see this?
George: okay, alright, let’s. I’ve typed in a different equation (pointing to the equation
line on Autograph 𝑥(𝑥 − 1)𝑑𝑦
𝑑𝑥= 𝑦 ) that’s the one we are about to do, okay. So, we are going
to have a go at doing this question at the moment. All the computer understands is that there
was a function that when it was differentiated it gave this answer here, okay. But the computer
doesn’t know what that value of c is so, it knows what shape it is. So, imagine this graph here,
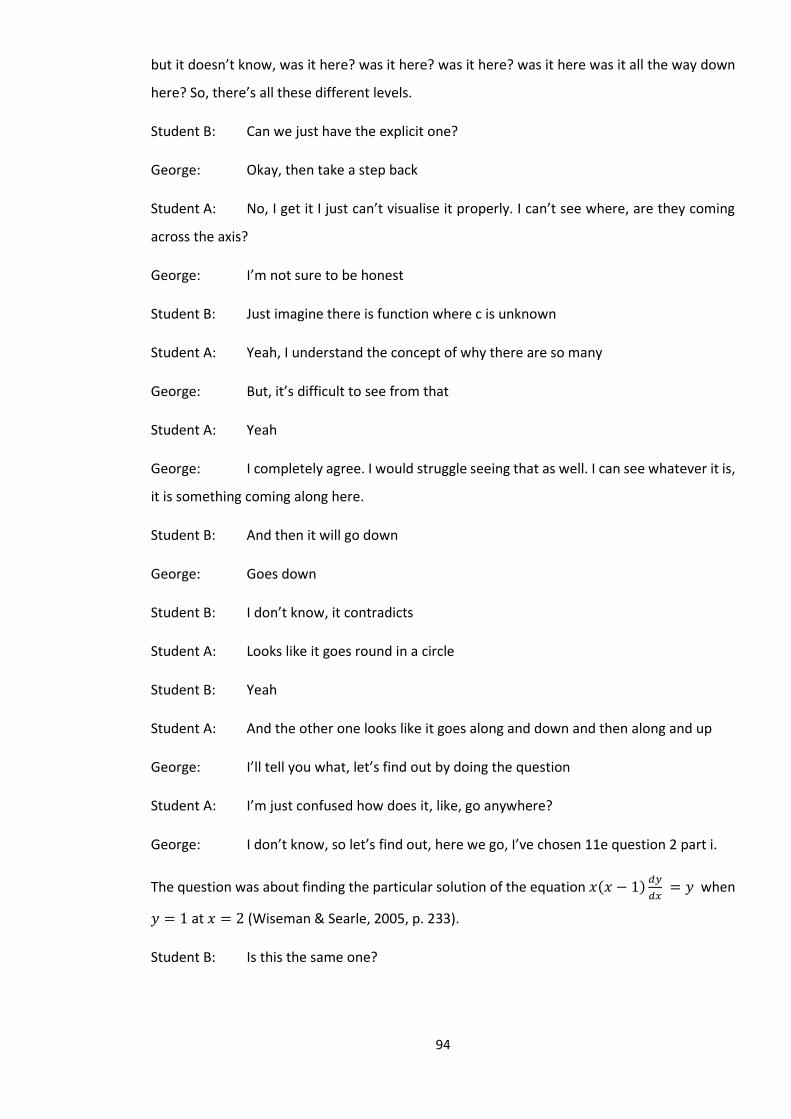
94
but it doesn’t know, was it here? was it here? was it here? was it here was it all the way down
here? So, there’s all these different levels.
Student B: Can we just have the explicit one?
George: Okay, then take a step back
Student A: No, I get it I just can’t visualise it properly. I can’t see where, are they coming
across the axis?
George: I’m not sure to be honest
Student B: Just imagine there is function where c is unknown
Student A: Yeah, I understand the concept of why there are so many
George: But, it’s difficult to see from that
Student A: Yeah
George: I completely agree. I would struggle seeing that as well. I can see whatever it is,
it is something coming along here.
Student B: And then it will go down
George: Goes down
Student B: I don’t know, it contradicts
Student A: Looks like it goes round in a circle
Student B: Yeah
Student A: And the other one looks like it goes along and down and then along and up
George: I’ll tell you what, let’s find out by doing the question
Student A: I’m just confused how does it, like, go anywhere?
George: I don’t know, so let’s find out, here we go, I’ve chosen 11e question 2 part i.
The question was about finding the particular solution of the equation 𝑥(𝑥 − 1)𝑑𝑦
𝑑𝑥 = 𝑦 when
𝑦 = 1 at 𝑥 = 2 (Wiseman & Searle, 2005, p. 233).
Student B: Is this the same one?

95
George: It’s the same one in the book, different to the one we did yesterday. In this case,
we’re going to go all the way to find a particular solution. We can do that because we can get
a general solution from this, but then we are going to pin that solution. We know that it is the
one that goes through this point, so that’s going to help us out, okay. So, step number 1
rearrange…
George started to talk about the steps, but then he noticed that student C did not follow. So,
he decided to write the solution down:
𝑥(𝑥 − 1)𝑑𝑦
𝑑𝑥 = 𝑦
∫1
𝑦𝑑𝑦 = ∫
1
𝑥(𝑥 − 1)𝑑𝑥
By doing that, George said that he “prepared” both sides for integration and that the first side
was “quite nice” as it was going to be “ln 𝑦”, while for the other side it would be “partial
fractions”. So, George displayed the work shown in Figure 27.
Figure 27: George’s display of the “subroutine” for ∫1
𝑦𝑑𝑦 = ∫
1
𝑥(𝑥−1)𝑑𝑥
He went through the “subroutine” shown in the image and then wrote:
∫1
𝑦𝑑𝑦 = ∫
−1
𝑥+
1
𝑥 − 1𝑑𝑥
ln 𝑦 = − ln 𝑥 + ln(𝑥 − 1) + 𝑐
Then George commented on having the constant c on the second side only: “So, looks like the
c went, we didn’t bother writing this one, we combined it with that one”. Then, he added that
they were looking for 𝑦 not ln 𝑦, so he showed his students the following steps of the solution:

96
𝑦 = 𝑒− ln 𝑥+ln(𝑥−1)+𝑐
𝑦 = 𝐴. 𝑒ln 𝑥−1𝑒+ln(𝑥−1)
𝑦 = 𝐴. 𝑒ln1𝑥𝑒ln(𝑥−1)
𝑦 = 𝐴.1
𝑥. (𝑥 − 1)
𝑦 = 𝐴𝑥 − 1
𝑥
George showed the students how they could use the coordinates to (2, 1) to reach the
particular solution 𝑦 = 2𝑥−1
𝑥. He then went back to answer student A’s question about the
presentation on Autograph by saying that the “particular solution 2 – 2 – x sits in like that” and
showed the graph (Figure 28) on the screen.
Figure 28: The particular solution 𝑦 = 2𝑥−1
𝑥 on Autograph (reproduction of George’s work)
Student B: So, it’s a reciprocal. Oh, that makes sense
Student A: Look at the red line
Student B: It’s a negative reciprocal.
Student A: It points down like and then we’ve got graph just drops horrifically between 1
and 0. The red lines don’t show it accurately really
Student C: And then you’ve got the upside down one on the other side
George: These ones, yeah, what are they doing?

97
Student B: I think it’s when it’s minus (Figure 29)
George: Okay, so if we minus the whole lot?
Student B: Yeah
George: Because, can we have that
Student B: They seem to fit there as well
Student A: It worked better for a cubic graph. Do it just for a normal cubic graph because
then it works a bit better.
George tried a function that integrates to a cubic one. He used 3x2+2x first (Figure 30), which
gave him “lots of vertical lines”. So he decided to zoom in to show it “a bit better”.
Figure 29: The particular solution 𝑦 = −2𝑥−1
𝑥 on Autograph (reproduction of George’s work)
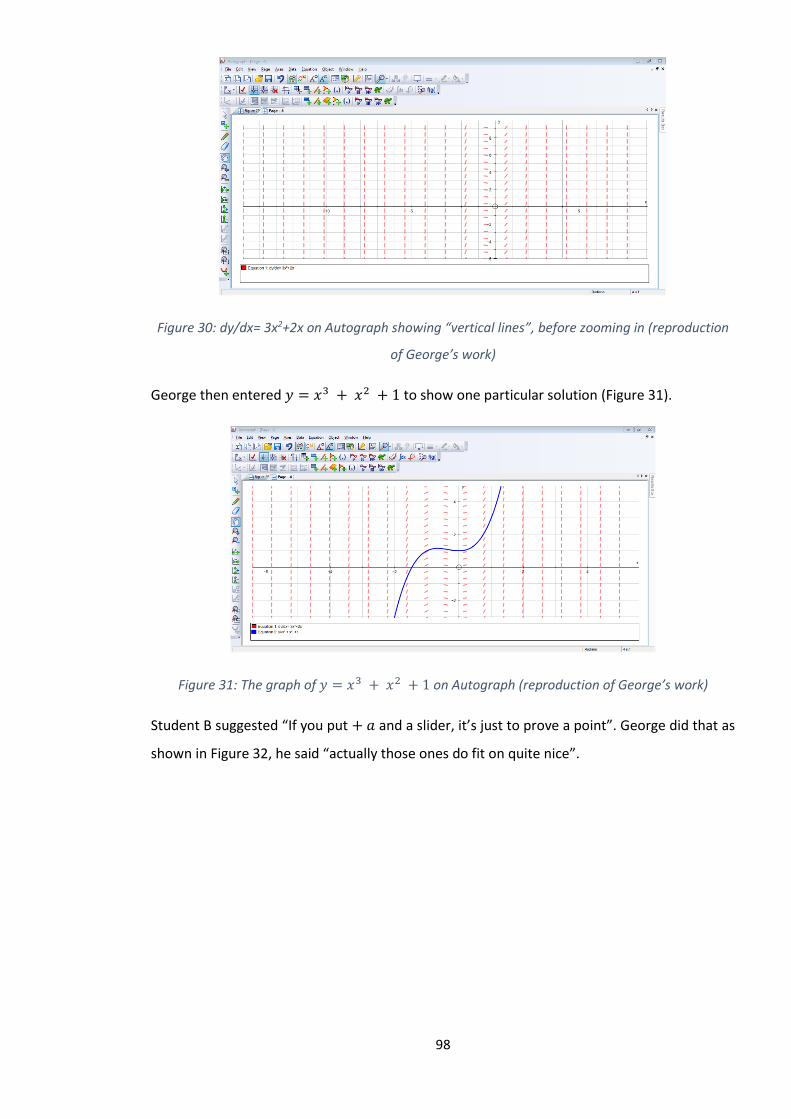
98
Figure 30: dy/dx= 3x2+2x on Autograph showing “vertical lines”, before zooming in (reproduction
of George’s work)
George then entered 𝑦 = 𝑥3 + 𝑥2 + 1 to show one particular solution (Figure 31).
Figure 31: The graph of 𝑦 = 𝑥3 + 𝑥2 + 1 on Autograph (reproduction of George’s work)
Student B suggested “If you put + 𝑎 and a slider, it’s just to prove a point”. George did that as
shown in Figure 32, he said “actually those ones do fit on quite nice”.
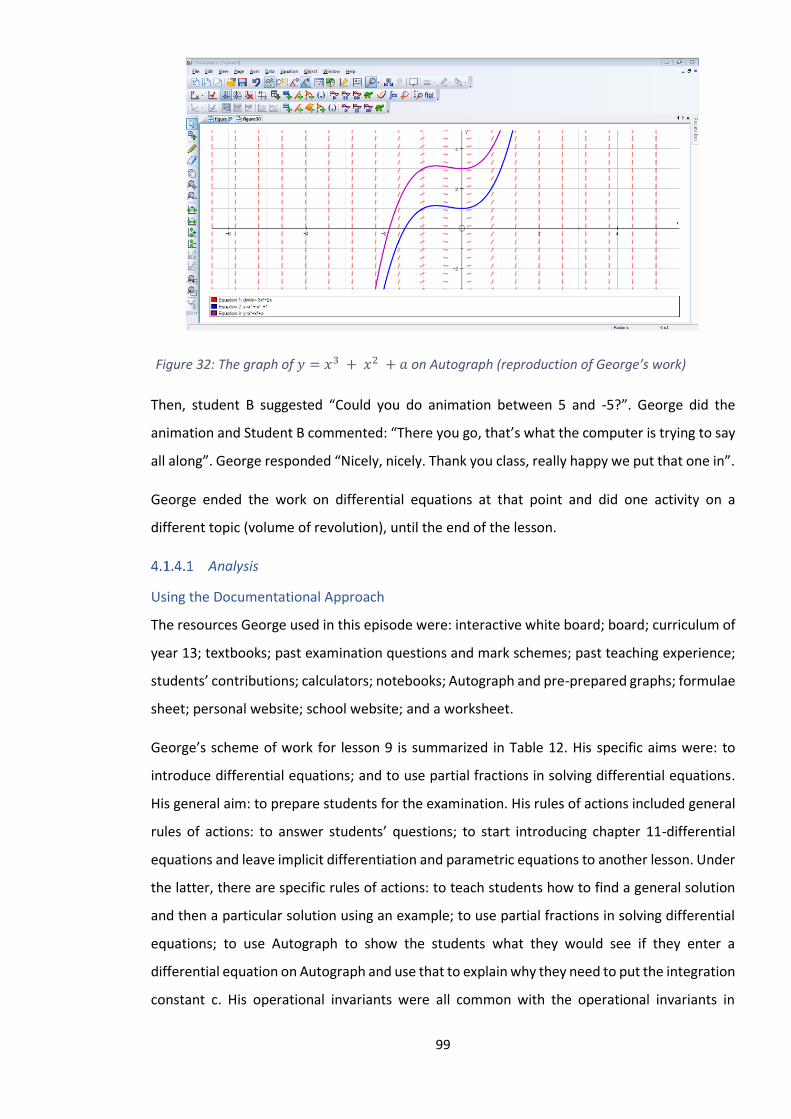
99
Figure 32: The graph of 𝑦 = 𝑥3 + 𝑥2 + 𝑎 on Autograph (reproduction of George’s work)
Then, student B suggested “Could you do animation between 5 and -5?”. George did the
animation and Student B commented: “There you go, that’s what the computer is trying to say
all along”. George responded “Nicely, nicely. Thank you class, really happy we put that one in”.
George ended the work on differential equations at that point and did one activity on a
different topic (volume of revolution), until the end of the lesson.
Analysis
Using the Documentational Approach
The resources George used in this episode were: interactive white board; board; curriculum of
year 13; textbooks; past examination questions and mark schemes; past teaching experience;
students’ contributions; calculators; notebooks; Autograph and pre-prepared graphs; formulae
sheet; personal website; school website; and a worksheet.
George’s scheme of work for lesson 9 is summarized in Table 12. His specific aims were: to
introduce differential equations; and to use partial fractions in solving differential equations.
His general aim: to prepare students for the examination. His rules of actions included general
rules of actions: to answer students’ questions; to start introducing chapter 11-differential
equations and leave implicit differentiation and parametric equations to another lesson. Under
the latter, there are specific rules of actions: to teach students how to find a general solution
and then a particular solution using an example; to use partial fractions in solving differential
equations; to use Autograph to show the students what they would see if they enter a
differential equation on Autograph and use that to explain why they need to put the integration
constant c. His operational invariants were all common with the operational invariants in

100
previous lesson and were related to: connecting new ideas with concepts students learnt
before; Autograph helps with visualisation; the textbook is a source of exercises and questions;
the use of examination-style questions is in response to students’ needs and to give them some
practice for the examination.
Using the Knowledge Quartet
In this lesson, George’s aims of teaching were: teaching differential equations and preparing
students for the examination. In his quick introduction to differential equations, he used
Autograph to demonstrate why the constant c should be included in the general solution. This
showed his knowledge about the software affordances, and how he employed that to connect
resources including the representations on Autograph, the algebraic solution, and students’
contributions (in relation to steps to do on Autograph).
George used Autograph and the textbook as instructional materials (use of instructional
materials), beside the other resources listed under the Documentational Approach analysis in
the previous section. He demonstrated an example from the textbook and used Autograph to
demonstrate the idea behind c the constant of integration. He also used the zooming in feature
in Autograph to show the students that not all the line segments on the screen were vertical,
as they initially saw. There is no evidence whether the segments appearing to be all vertical
was something George anticipated or not. So, this might be a contingent moment to which
George responded with confidence, but it could be something he anticipated and was ready
for.
George was making connections between procedures and making connections between
concepts (partial fractions, integration, and logarithms). He also connected between different
resources including students’ contributions, representation on Autograph and textbook
questions. However, the connection he tried to create when he was solving question 2(b) on
page 233 on the board, confused some students. He thought that the confusion was because
the equation he initially inserted on Autograph was not the same as the one in question 2(b).
So, he decided to solve the question 2 (i) which was about the equation in Figure 26 (i.e.
equation 𝑥(𝑥 − 1)𝑑𝑦
𝑑𝑥 = 𝑦) in order to resolve the confusion. However, the students’ question
was about the directions of the line segments, which were going sometimes “up” and
sometimes “down”. In his response to the students’ question about this, although George tried

101
Scheme
Aims Rules of action Operational invariants Inferences
Specific: A1. To check students’ work on iteration. A2. To introduce differential equations. A3. To use partial fractions in solving differential equations
General: A4. To prepare students for exam
Specific: R1. Answer students’ questions on iteration R2. Show the students the answer for question 3 p.237 and explain that it is a “meatier” question R3. Ask students to solve questions 2 (a and f) and 3 (a and c) from page 226 R4. Teach students how to find a general solution and then a particular solution of differential equations using an example R5. Use partial fractions in solving differential equations R6. Use Autograph to show the students what they would see if they enter a differential equation on Autograph and use that to explain why they need to put the integration constant c R7. Show students volume of revolution document on Autograph, using the sine function transformed 𝑦 = 𝑑 𝑠𝑖𝑛(𝑏𝑥 + 𝑎) + 𝑐 General: R8. Answer students’ questions R9. Start introducing chapter 11/differential equations and leave implicit differentiation and parametric equations to another lesson
General: O1. It is useful to connect new ideas with concepts students learnt before O2. Autograph helps with visualisation O3. The textbook is a source of exercises and questions O4. The use of exam-style questions is in response to students’ needs, and to give them some practice for the exam
Table 12: George’s scheme of work during the ninth lesson on differential equations

102
to connect resources (i.e. the representation on Autograph and the particular solution he
found), he did not connect the line segments on Autograph with the concept of slope and/or
tangent. So, the students’ reached the conclusion that those segments were not “accurate”;
they “worked better for a cubic function”; and they were related to “reciprocal” or “the
negative reciprocal”. George used a cubic function with a slider on Autograph, in response to
the students’ request, and he was happy when a student concluded that this is what “the
computer is trying to say all along”. This was a contingent moment in which the teacher
responded to the students’ question (responding to students’ ideas), but his response was
limited as he could have created more connections with concepts the students already learnt
about, to better clarify the display on the software. George did say that he did not know why
the segments were going in different directions, so it could be that he did not know about the
software features to make the latter connection.
Episode 6- from lesson 8 on Iteration
Introduction to “Numerical methods”
In his introduction to the chapter of “Numerical Methods” and its four methods (Change of
Sign method, Iterative method, Mid-ordinate rule, and Simpson’s rule) George justified its
importance as follows:
The whole chapter is about things that you can’t solve by doing the algebra to them, or just by
integrating them, okay. And, it turns out that there are way more functions and things that you
can’t solve algebraically than there are ones that you can, ok. There are loads of horrible things
to integrate that are too difficult to integrate, that it’s just easier to do a numerical thing and
kind of approximately, a bit like a trapezium rule.
George reminded the students that they saw the trapezium rule and Simpson’s rule in a
previous lesson. He explained that Simpson’s rule and the mid-ordinate rule were about finding
the area and extension of the trapezium rule, while the change of sign method and the Iterative
method were about solving equations. Then, he briefly introduced the four methods, and
mentioned that he was going to focus on the “Iterative method” and when these methods are
most useful.
Rearranging an equation – Why 𝒙𝟐 + 𝟒𝒙 + 𝟏 = 𝟎?
After the introduction, George started explaining the iterative method, he mentioned that he
needed to use an equation that cannot be factorised but can be solved using the quadratic
formula. He spontaneously chose the quadratic equation 𝑥2 + 4𝑥 + 1 = 0, and asked his

103
students to suggest its rearrangements of the form 𝑥 =⋯ (e.g. 𝑥 =−𝑥2
4−
1
4). George was
commenting on the students’ suggestions of rearrangement (i.e. when two rearrangements
were the same and just written differently and when a student completed the square instead
of rearranging the equation). He also asked them to find the equation roots using their previous
knowledge on how to solve quadratic equations or using calculators. Students used calculators
and gave the approximate answers −0.267 and −3.732.
The use of Autograph
George’s next step was to use Autograph in order to further explain about the Iterative method
and show how the different rearrangements would work. He used Autograph to graph the
functions 𝑦 = 𝑥 and 𝑦 = the other side of the rearrangement (e.g. for 𝑥 =−𝑥2
4−
1
4 he graphed
𝑦 = 𝑥 and 𝑦 =−𝑥2
4−
1
4 ). The first rearrangement he graphed on Autograph was 𝑥 =
√−4𝑥 − 1 and it did not “work”, so George said while pointing at the graphs (Figure 33) on
Autograph:
“Now, I can see that the blue one [𝑥 = √−4𝑥 − 1 ] does not quite, I think it almost touches, but
not quite touches the red one [𝑦 = 𝑥], okay. So, they in fact don’t cross. So, for that particular
rearrangement sadly it’s not going to work out. So, let’s not do that one, let’s pick a different
one. Which one do you want?”
Then, one student picked 𝑥 =−1
𝑥+4, so George graphed 𝑦 = 𝑥 and 𝑦 =
−1
𝑥+4 on Autograph (Figure
34) and commented that the two graphs crossed this time at two points. Having noted that the
two points are close to 𝑥 = −0.2 and 𝑥 = −3, George explained that the Iterative method is
based on replacing the 𝑥 in the denominator of this rearrangement by 𝑥𝑛 and replacing the
isolated 𝑥 by 𝑥𝑛+1. Thus, he suggested the formula 𝑥𝑛+1 =−1
𝑥𝑛+4 to be used to complete the
table in Figure 35 with a starting value 𝑥0 = 1.
Figure 33: 𝒚 = 𝒙 and 𝒚 = √−4𝑥 − 1 on Autograph

104
Figure 34: 𝒚 = 𝒙 and 𝒚 =−𝟏
𝒙+𝟒 on Autograph (reproduction of George’s work)
Figure 35: Table completed using 𝒙𝒏+𝟏 =−𝟏
𝒙𝒏+𝟒 (reproduction of George’s work)
After showing the Iterative method procedure on the board, George decided to show how the
Iterative method works on the graph by using Autograph (Figure 36):
“Look at this, you started with number 1, okay. The number 1 went, which way did it go? It’s
gone down to the curve, across to the line and that was our 0.2 [sic]. And then, here look at that
down to the curve across the line, down to the curve if I zoom in further, oh missed it! Down to
the curve and across to the line. Zooming in further, look at that! And we could keep on going
down to the curve, across to the line zoom in, zoom in, zoom in, there it is, look at that, and the
thing if I zoom out again looks like a staircase, kind of. So, this is staircase diagram”.
𝑥𝑛 𝑥𝑛+1
1 −
1
5= −0.2
−1
5 −
5
19= −0.26315
−5
19 −
19
71= −0.2676
−19
71
−0.26769
1
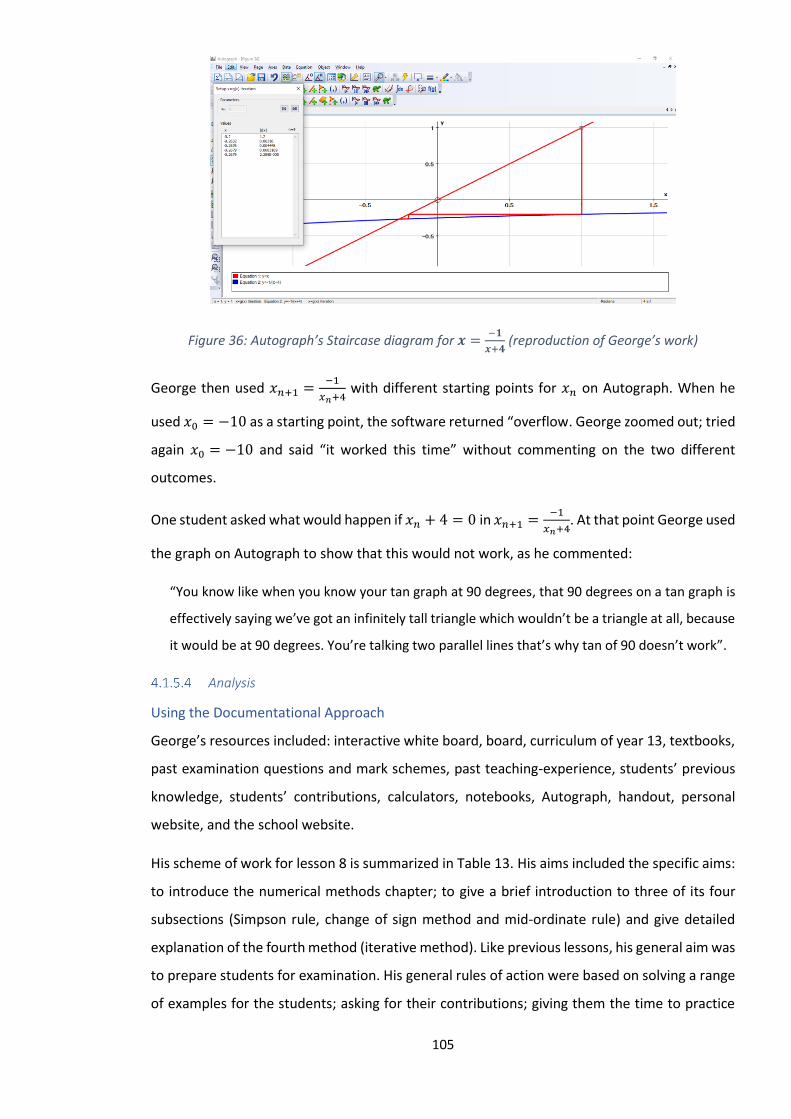
105
Figure 36: Autograph’s Staircase diagram for 𝒙 =−𝟏
𝒙+𝟒 (reproduction of George’s work)
George then used 𝑥𝑛+1 =−1
𝑥𝑛+4 with different starting points for 𝑥𝑛 on Autograph. When he
used 𝑥0 = −10 as a starting point, the software returned “overflow. George zoomed out; tried
again 𝑥0 = −10 and said “it worked this time” without commenting on the two different
outcomes.
One student asked what would happen if 𝑥𝑛 + 4 = 0 in 𝑥𝑛+1 =−1
𝑥𝑛+4. At that point George used
the graph on Autograph to show that this would not work, as he commented:
“You know like when you know your tan graph at 90 degrees, that 90 degrees on a tan graph is
effectively saying we’ve got an infinitely tall triangle which wouldn’t be a triangle at all, because
it would be at 90 degrees. You’re talking two parallel lines that’s why tan of 90 doesn’t work”.
Analysis
Using the Documentational Approach
George’s resources included: interactive white board, board, curriculum of year 13, textbooks,
past examination questions and mark schemes, past teaching-experience, students’ previous
knowledge, students’ contributions, calculators, notebooks, Autograph, handout, personal
website, and the school website.
His scheme of work for lesson 8 is summarized in Table 13. His aims included the specific aims:
to introduce the numerical methods chapter; to give a brief introduction to three of its four
subsections (Simpson rule, change of sign method and mid-ordinate rule) and give detailed
explanation of the fourth method (iterative method). Like previous lessons, his general aim was
to prepare students for examination. His general rules of action were based on solving a range
of examples for the students; asking for their contributions; giving them the time to practice

106
independently and ask questions; making connections with what they already learned; showing
some examination-style questions; and using graphs and Autograph to demonstrate how things
work. The operational invariants were identified in his teaching approach (through the
observation) and his reflection in the interview. For example, during the interview George
reflected on his spontaneous choice of a range of examples and their demonstration in
Autograph in the lesson:
“So, it’s not that I’ve chosen a specific and special example. So, I wanted to do it kind of live, but
also then this thing about sometimes the live ones if I haven’t tried them out before sometimes
it doesn’t work out. But, sometimes it’s good to show that anyway. So, they see that different
rearrangements work, different rearrangements don’t work. […] I think it’s worth showing the
ones that don’t work out anyway, so they understand that because otherwise they are going to
assume that oh it always works out we can always get everything”
He suggested that solving different examples would help show students that some
rearrangements work, and some do not. The live demonstration of a range of examples would
appear to be a pattern of George’s schemes of use.
Using the Knowledge Quartet
In his teaching about “numerical methods”, George showed awareness of purpose when he
stated the lesson topic, what he was going to focus on in that lesson “iterative method” and
explained when this lesson’s methods are useful to use. He was also trying to address
connections (e.g. numerical methods and trapezium rule). And throughout the lesson, he
frequently tried making connections between concepts/procedures. For example, he connected
Simpson’s rule which he used in previous lessons on Autograph to the methods he was teaching
this lesson. He also said that the Simpson’s rule and mid-ordinate point rule were about finding
the area and extension of the trapezium rule, while the change of sign method and the iterative
method were about solving equations.
In his demonstration about the iterative method, George was spontaneous in his choice of
examples (the equation 𝑥2 + 4𝑥 + 1 = 0 in this case). This spontaneity was visible during the
lesson observation and was confirmed by George during the interview. Within the lesson, he
created an equation that could not be factorized but can be solved using the quadratic formula.
This choice was based on awareness purpose which is to show the students that the iterative
method works and gives them an approximation of the equation’s solutions. Then, he asked

107
Scheme
Aims Rules of action Operational invariants
Specific: A1. To check and set up homework A2. To introduce numerical methods chapter and its four sections and explain the iterative method.
General: A3. To prepare students for the exams
Specific: R1. Explain when the methods in this chapter are useful to use R2. Connect Simpson’s rule and mid-ordinate rule with trapezium rule R3. Explain the iterative method in detail R4. Choose an example of quadratic equation that cannot be factorized R5. Solve examples on how to rearrange equations to the form x=… R6. Use equation roots after rearranging the equation R7. Use the equation roots to show the iterative method works R8. Ask students to pick rearrangements and starting point R9. After rearranging the equation, use graphs to show where the equations cross R10. Show students how to make and complete a table for 𝑥𝑛 and 𝑥𝑛+1 R11. Explain about the decimal places in the answer R12. Choose equations spontaneously during the lesson R13. Use Autograph with different re-arrangements and starting R14. Try to zoom in on each of the two roots of the quadratic equation R15. Use Autograph to show the graphs, their staircases and tables R16. Explain how to complete the table using calculators R17. Choose exercises from the textbook, and give a handout with graphs to students General: R18. Check if students did their homework and set up one for next week R19. Start introducing the “Numerical Methods” and its four subsections R20. Solve some examples for the students, give them tips, and show past-exam questions R21. Use students’ contributions, answer questions and let them practice independently R22. Emphasise that students can and should use calculators
Specific: O1. The numerical methods are useful to solve equations that are difficult to solve algebraically O2. With a quadratic equation, roots can be found using the quadratic formula O3. Students should know how to rearrange equations O4. Equation roots can be used to show how the iterative method zooms in on the roots O5. The graphs help students see where two equations cross O6. Solving different examples helps show the students that some re-arrangements work and some do not O7. The use of Autograph with different re-arrangements helps show that different starting points may lead to different results O8. Autograph shows what happens in the background O9. It is important to explain the use of calculators for the iterative method, as this is what they use in exams O10. The use of exam-style questions is in response to students’ needs, and to give them practice for the exam General: O11. Students should not be given too much homework in one week
Table 13: George’s scheme during lesson 8 on iteration, no inferences were observed

108
his students to create different re-arrangements of the equation. This is a way to making
connections between procedures. George was always responding to students’ ideas,
commenting on when two rearrangements were the same and just written differently and on
when a student completed the square instead of rearranging the equation. After finding the
different arrangements, George again tried to create a connection when he used the equation’s
solutions the students found on their calculators to show that the iterative methods would
“zoom in on the answers”. In this case, we also notice George’s awareness of purpose. George
was demonstrating about iteration to students while at the same time inviting them to
contribute. These students’ contributions here as resources that George used during the lesson,
along with instructional materials. Afterwards, he asked his students to solve some textbook
questions, this showed how he how he used the textbook (use of instructional materials) when
it came to choosing questions for practice. Autograph was another instructional material that
George used in order to further explain about the iterative method and show how the different
rearrangements would work (use of instructional materials). He also used different
representations (choice of representation) like tables and graphs; and tried making connections
between procedures and making connections between different resources. However, the
rearrangement 𝑥 = √−4𝑥 − 1 that he claimed (based on Autograph) would not work, would
have worked if he tried to do it using the formula and table in a similar way to what he did in
Figure 35. The issue here is that Autograph (in Figure 33) only showed the positive part of the
graph of 𝑦 = √−4𝑥 − 1, hence the rearrangement seemed not to work. This issue can be
attributed to both mathematical knowledge and knowledge of the software. After showing the
iterative method procedure on the board George decided to show what happens if the iterative
method was done on Autograph. This use of Autograph showed teacher’s knowledge about the
software affordances and its use. We also notice during the use of Autograph concentration on
procedures. One contingency incident happened when George entered the equations from one
arrangement on Autograph and noticed that the graphs of these equations did not cross, in this
case he commented that some arrangements did not work and asked the students to pick a
different arrangement (use of instructional materials/ use of resources). Another example of
contingent moment (responding to students’ ideas) was when a student asked what would
happen if 𝑥𝑛 + 4 = 0 in 𝑥𝑛+1 =−1
𝑥𝑛+4. At that point, George showed the graph on Autograph to
show that it would not work. In response to this student, George used Autograph (use of
instructional materials) and was making connections between concepts (dividing by zero, tan
90, parallel lines, asymptotes of the graph of the tangent line).

109
Here, a combination of spontaneous choice of examples and a choice of Autograph (use of
instructional materials) is noticed. Then, a student’s response was used as a resource and the
teacher connected that to what Autograph could do for the same questions, by displaying both
on the screen and using Autograph to identify any errors (identifying errors). During this process,
Autograph gave “overflow” as an outcome, the teacher did not comment on that during the
lesson but he zoomed out and tried again. George did not use this opportunity to explain what
that meant during the lesson. But when asked about it in the post-observation interview, he
said it indicates that it diverges at that point “instead of converging it will diverge”. However,
this was not the case during the lesson as Autograph then gave overflow because the point was
outside the range on Autograph screen.
During the interview, George’s comment on his spontaneous choice of equation reflected
George’s confidence in not following a specific agenda which can create more contingent
moments during the lesson. His awareness of purpose was not very clear here, as with a
different spontaneous example maybe a chosen arrangement would have worked to zoom to
roots. Would he have in this case looked for an example that would not work? Also, George did
not explain to the students the meaning of this getting “overflow” on Autograph. His focus was
on getting a number and comparing that to one of the equation roots, which could be due to
him focusing on procedure (concentration on procedure).
Episode 7- from lesson 2: In relation to volume of revolution
During the first lesson on volume of revolution, Student A asked about Figure 18:
“The graph on the board, if you rotated that around 𝑦 = 0 to get like a donut shape… you could
do the whole thing and then minus the bottom. So, you could do rotation between 0 and 1 and
then between 0 and 2 and take them away from each other, but will it work? I don’t know…”.
The teacher approved to start with by saying “you could… cylinder”. Student A objected the
cylinder idea because “the edge was slanted”. At that point the following conversation took
place:
George: You confused two types of questions, I think so. This is rotates vertically, whereas
you’re asking me about rotating around the x axis. Let me see if there is one like that
Student A: I don’t think there will be because there is a gap in the middle
George: It is quite easy to do because you could do your volume of the whole thing take away
the cylinder. And the cylinder would be quite easy because it’s just what’s the volume of the

110
cylinder? 𝜋𝑟2ℎ. So, you’re r here is constant throughout you literally just gonna work that out.
Your h is whatever the length of the cylinder is. So, you do the big volume, the whole thing,
take away the volume of the cylinder
Student B: He’s saying you’re wrong, Sir!
Student A: You’re assuming it’s a cylinder when it’s not… it’s slanted it’s not exact…
George then went on the school website looking for more past examination question trying to
find a question that has an idea similar to what Student A asked about, but he could not. He
only found what he described as classic questions. So, he decided to try to use Autograph with
the same graph he initially used to create the “packman” shape, but instead of rotating the
graph around the x axis, he rotated around a line parallel to the x-axis and got the shape in
Figure 37, which was not similar to the one Student A asked about.
Student A: This is bigger in the middle, I think it’s just confusing
George: Yes, it is confusing
Then, George went back to the original rotation with the packman.
Student B: Delete it all, and start doing it again
George: I’m not sure if there is a way of making a hole in the middle. So, it doesn’t work, don’t
even ask… Student A for your one, for that one
Student A: It’s fine I don’t need to know, it’s just this… no one will get a question like that
George: You won’t get a question like that, because you need to know that, end of it… What
we’re gonna do now, find your y2 or your x2 in this case, plug it in and work it out… What I need
from you guys can you promise not to forget this stuff between today and tomorrow, ok?
Figure 37: The shape George created on Autograph in an attempt to answer student A question
(reproduction of George’s work)
111
The teacher then asked if the students needed copies of the formula sheet and they said yes.
The lesson finished at that point, the teacher did not comment of the figure the student was
asking about. Student A was told that this does not come in the examination, so he did not
insist on getting an answer.
Analysis
A view through the Documentational Approach lens is summarized in Table 9. It shows that this
comes under the teacher’s general rule of action: to answer students’ questions. George tried
to answer the question on the board, then on Autograph but finally he said that this question
was not required for the examination. In terms of the Knowledge Quartet, this represents a
contingent moment. George tried to respond to student A question and demonstrated his
answer (responding to students’ ideas); but student A spotted a mistake in it. George tried then
to use Autograph (use of instructional materials) to clarify his demonstration; and allowed
students’ agency and contributions to help with that but the commands he used on Autograph
did not give a shape similar to the one student A asked about. This led George to say that the
question student A asked was not required for the examination. George used examination
requirement as a way out of answering the question. This indicated how examination
requirements influenced this teacher’s knowledge and way of dealing with such a contingent
moment. So, he used examination requirement to manage the moment and control the anxiety
that this question can lead him or his students to feel.
Discussion and Summary
The resources that are common in George’s teaching of the different episodes include paper
based and electronic resources: interactive white board, board, curriculum of year 13,
textbook, past examination questions and mark schemes, past teaching-experience, students’
contributions (including students’ previous knowledge), calculators, notebooks, and
Autograph. School policy and textbook were also considered by George, and were part of his
resources. In terms of the five points I addressed in the discussion of George’ characteristic
lesson, episodes 1 to 7 helped reflect further on them.
First, the use of the Documentational Approach proposed looking at students’ contributions
(including their previous knowledge) as resources on which the teacher acts and builds the
lesson. The seven episodes showed how throughout his teaching, George gave an important
role to students’ contribution, and used these as resources (as we saw in the trigonometry
lesson and episode 6 on iteration), and this was a characteristic of his teaching. George was
inviting his students to contribute and based some of his demonstration on those contributions.
112
The contributions here were within a range of expected answers, for example in episode 6
George asked for all the possible rearrangements of a specific equation. To analyse this
characteristic, the code “use of instructional materials” should be combined with “use of
resources” to include students’ contributions.
Second, the Knowledge Quartet analysis suggested paying attention to how the teacher
created connections between resources (including students’ contributions). The example that
promoted this idea in the characteristic lesson was George’s connection of students’ estimate
of the equation on a graph and the actual equation of graph on Autograph. His connection and
comparison between the two helped him propose that the two were equivalent. More
examples were addressed in the seven episodes. One is in episodes 2 to 4 on volume of
revolution, when George “re-schemed” his lesson on the volume of revolution in episode 3
based on the experience he had teaching the same topic in episode 2. We saw then a
connection created between his past teaching experience and how the students’ reacted to it,
Autograph and the textbook. Another example was addressed in episode 5, when George tried
to create connection between the textbook question, Autograph and the students’
contribution. Also, in episode 6, George used students’ contributions (choice of
rearrangement) and tried to connect that to Autograph and the iteration method. The
connection between resources created in the characteristic lesson may seem more significant,
because it involved reinforcing students’ previous knowledge on trigonometry and connected
that to a new concept and procedure. While, the example taken from episode 5 on differential
equation was not well-considered and lead to a moment of Contingency. These examples
strengthen my idea that we may need to add more codes to the Knowledge Quartet in order
to reflect and address such key details in the context of George’s teaching. This code was
suggested in Kayali and Biza (in press) to be “connection between resources”.
Third, and regarding the Knowledge Quartet, the analysis proposed paying attention to how
the teacher dealt with examination requirements and school policy (including school policy
about homework), or the institutional factors the teacher has to deal with. Regarding
examination requirements, these were one of George’s resources through his use of past-
examination papers. Despite his overt display of subject knowledge, George in two episodes
could not answer students’ question and he justified that by saying that the two questions were
not required in the examination. Thus, a code like “adhering to examination requirements”
under the Contingency dimension would help analyse situations in which examination
requirements are set as boundaries of what students need to know. This code is not to judge

113
teachers’ knowledge, but only to reflect how answering unexpected questions outside the
examination requirements is dealt with in cases similar to the two we saw with George. Having
said that, it still seems that teachers’ knowledge about the curriculum guidelines and
examination requirements comes to the front while they are teaching and shapes their subject
knowledge. Hence, it might be worth adding a code in relation to the knowledge about
examinations requirements and policies.
Fourth, also regarding the Knowledge Quartet, the analysis proposed considering the teacher’s
knowledge about mathematics and the software. This is an aspect that becomes clear when
mathematics-education software is used in the class. It is about knowing the software
affordances in relation to specific mathematical content. For example, in episode 6 about
iteration zooming out was important to avoid getting “overflow” on the screen; if the starting
point for iteration was not already within the display. Otherwise, the “overflow” in this case
could be confused with the same outcome the “overflow” that implied non-convergence.
Fifth, another aspect in relation to the Knowledge Quartet is about contingent moments and
how they can be identified. Identifying them is especially challenging in the cases when the
teacher responds confidently to unexpected questions; like the case pointed to in the last
paragraph of the analysis (about the student’s questioning what to do when asked about
tangents). Also, in terms of Contingency, George had prepared some resources to help avoid
contingency like having trigonometry formulae typed up for reference; having pre-prepared
graphs on Autograph; and having past-examination questions and textbook as references. In
addition to that, George was confident to use spontaneous and live work in the class like in the
episode about iteration and the live work on volume of revolution in episode 1, which led
sometimes to contingent moments. It was hard to decide whether some moments in George’s
teaching were contingent or not. For example, in the differential equations lesson there was
no evidence whether having one differential equation representation on Autograph appearing
as vertical line segments on the screen was something George anticipated or not. He responded
quickly to this appearance by zooming in to make the representation clearer. Thus, it is
challenging to identify whether or not this was a contingent moment (i.e. responding to
students’ ideas) to which the teacher responded efficiently and with confidence, because the
unexpected element in it was not clear or identifiable. Finally, contingent moments resulted
in “rescheming” in the episodes about the volume of revolution, where the rescheming
reflected the dynamics of teaching in George’s teaching. Rescheming can be helpful to address
changes in series of lessons on one topic.

114
In summary, the five themes addressed in the characteristic lesson were evident in the rest of
episodes with George and we summarize them as:
1. Students’ contributions are resources.
2. The code “connection between resources” will be added to the Connection dimension in
the Knowledge Quartet.
3. The code “adhering to examination requirement” will be added under the Contingency
dimension. The code “knowledge of examination requirement” will be added under the
Foundation dimension.
4. The code “Over Software Knowledge” will be added under the Foundation dimension.
5. Two aspects in relation to contingent moments: they can lead to “rescheming”; and they
can be unidentifiable to the researcher when the teacher responds with confidence to the
moment’s surprizing element being unidentifiable by the researcher.
These five points will be addressed later with analysis of lessons from other teachers in the
next sections. For the three other teachers (Martin, Adam and Charlie); teaching episodes will
be described using the Knowledge Quartet language and codes with the Documentational
Approach analysis summarized afterwards.
Second teacher data - Martin
Martin was a mathematics teacher with one-year teaching experience, during which he taught
students aged 16-18 years. He held a PGCE in secondary mathematics teaching. The school he
worked for provided interactive whiteboards, iPads for students’ use, and Autograph software
(www.autograph-math.com).
Martin’s lessons include six lessons, and were about integration, sets, volume of revolution,
and mechanics. In two of these lessons the teacher used the mathematics-education software
GeoGebra (https://www.geogebra.org/): the lesson about volume of revolution (lesson 4), and
the one about mechanics (lesson 6). One of these lessons (lesson 4 on the volume of revolution)
is included in the data for discussion below. The lesson was chosen for two reasons: first it
covered a topic that was taught by George who worked with Martin at the same school; second
the use of technology in the lesson on mechanics was based on the use of an applet found
online and the teacher input in that was minimal. So, next is an overview of lesson 4 described
using the Knowledge Quartet language and then analysed using the Documentational
Approach, followed by a discussion.

115
Lesson 4: Volume of revolution
Lesson overview
In this lesson Martin was introducing volume of revolution to his year 13 students. There were
sixteen students in this group. He started by showing a table that states the learning objectives
of the lesson. He summarized his objectives in three items: “1. revolution around the x-axis, 2.
revolution around the y-axis, 3. Integration: end of chapter questions. Find questions you can’t
do”; which reflected his decision about sequencing. He had also prepared a question (choice of
examples) about volume of revolution and displayed it on the board, below the learning
objectives table (Table 14).
In his work towards achieving his first objective, Martin chose to work on the equation of a
circle 𝑥2 + 𝑦2 = 𝑟2. Martin started explaining that in a circle 𝑥2 + 𝑦2 = 𝑟2 , so 𝑦2 = 𝑟2 − 𝑥2
and 𝑦 = ±√𝑟2 − 𝑥2. He added that in this lesson students “can disregard negative solutions”
and write 𝑦 = √𝑟2 − 𝑥2 (Figure 38), then substitute it in the formula for volume of revolution
using the limits −𝑟 and +𝑟. After that demonstration, Martin gave a worksheet (use of
instructional materials) to his students and asked them to work on finding 𝑉 for the rotation of
circle first around x-axis, and then around y-axis (Table 14). All students had individual mini
whiteboards to work on (use of resources). Martin then advised his students to ask for student
X help as he was familiar with the topic (use of resources). Student X did not belong to this year
13 group, and was there for this lesson in order to do more work on mathematics questions
and ask for Martin’s help if needed. Martin left the classroom to photocopy something as he
said. The students were working on the worksheet questions on until the teacher came back.
Martin then started explaining to a group of students about volume of revolution: “Do you
remember when we said whenever we were looking at integration, initially it was an area and
it was little slices, remember that?”. He added that in this lesson they were interested in the
volume of the shape that results from rotating a function and they were going to use
integration. One student from this group started writing on a mini whiteboard the formula for
volume of revolution (Figure 39). So far, Martin’s demonstration was mainly focused on
showing the students how to rearrange the equation of a circle to the form 𝑦 = √𝑟2 − 𝑥2,
considering only the positive solution of the square root, and using that in the formula for
volume of revolution 𝑉 = 𝜋 ∫ 𝑦2𝑏
𝑎𝑑𝑥 where 𝑎 = −𝑟 and 𝑏 = +𝑟. This reflected concentration
on procedures at the beginning of the lesson. It showed how Martin got his students working
on finding volume of revolution by using the demonstration he gave about rearranging the
formula of a circle, the introduction to the formula of volume of revolution, the worksheet he

116
prepared, and students’ contributions (including students’ previous knowledge about
integration, and student X knowledge). This is a connection between resources.
You already know the equation of a circle is 𝑥2 + 𝑦2 = 𝑟2
Rotation about x Rotation about y
𝑉 = 𝜋 ∫ 𝑦2𝑏
𝑎
𝑑𝑥
Hint: You’ll need to rearrange the equation
for a circle to make 𝑦 the subject. You can
disregard the negative solution.
Make a sketch of your function.
𝑉 = 𝜋 ∫ 𝑥2𝑏
𝑎
𝑑𝑦
Hint: You’ll need to rearrange the equation
for a circle to make 𝑥 the subject. You can
disregard the negative solution.
Make a sketch of your function.
Table 14: Martin learning objectives for the lesson on volume of revolution
Figure 38: Martin’s work on solving 𝑥2 + 𝑦2 = 𝑟2 considering the positive solution only
Figure 39: Martin’s starting to demonstrate the application of the volume of revolution formula
Martin recommended sketching the shape. He then commented on another student’s work
from the same group: “Is this a circle though? Look at what [student Y] has drawn, so if I rotate
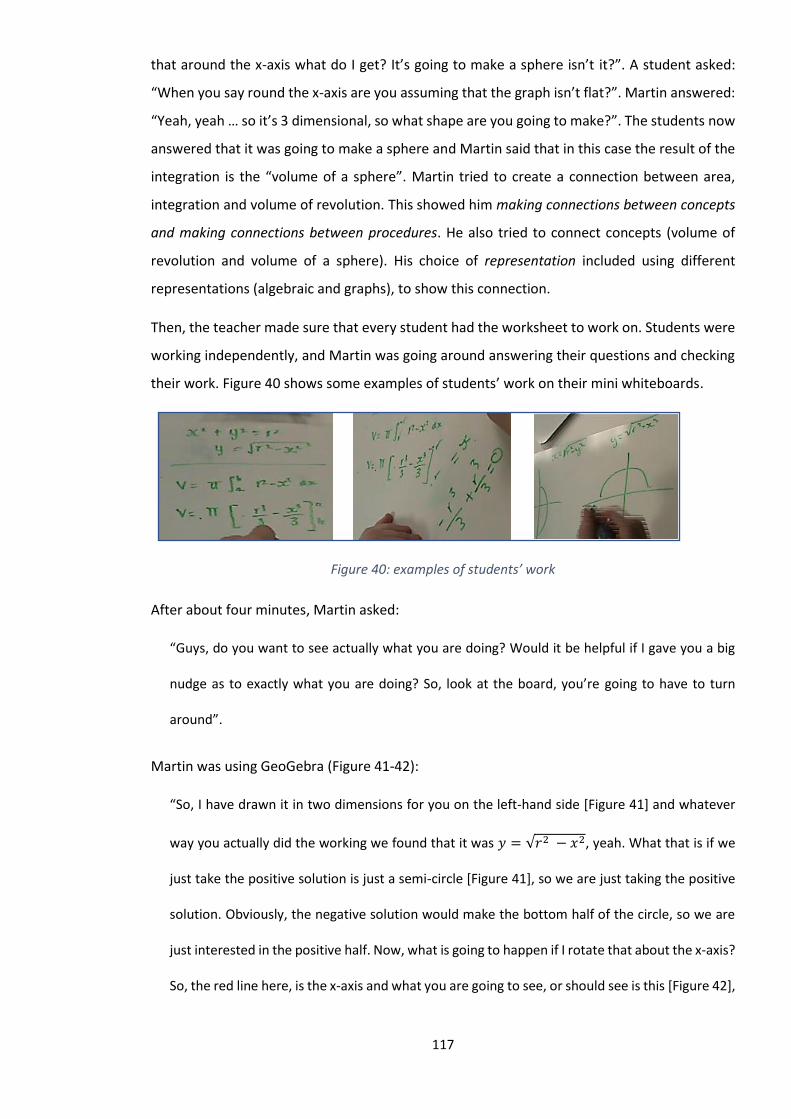
117
that around the x-axis what do I get? It’s going to make a sphere isn’t it?”. A student asked:
“When you say round the x-axis are you assuming that the graph isn’t flat?”. Martin answered:
“Yeah, yeah … so it’s 3 dimensional, so what shape are you going to make?”. The students now
answered that it was going to make a sphere and Martin said that in this case the result of the
integration is the “volume of a sphere”. Martin tried to create a connection between area,
integration and volume of revolution. This showed him making connections between concepts
and making connections between procedures. He also tried to connect concepts (volume of
revolution and volume of a sphere). His choice of representation included using different
representations (algebraic and graphs), to show this connection.
Then, the teacher made sure that every student had the worksheet to work on. Students were
working independently, and Martin was going around answering their questions and checking
their work. Figure 40 shows some examples of students’ work on their mini whiteboards.
Figure 40: examples of students’ work
After about four minutes, Martin asked:
“Guys, do you want to see actually what you are doing? Would it be helpful if I gave you a big
nudge as to exactly what you are doing? So, look at the board, you’re going to have to turn
around”.
Martin was using GeoGebra (Figure 41-42):
“So, I have drawn it in two dimensions for you on the left-hand side [Figure 41] and whatever
way you actually did the working we found that it was 𝑦 = √𝑟2 − 𝑥2, yeah. What that is if we
just take the positive solution is just a semi-circle [Figure 41], so we are just taking the positive
solution. Obviously, the negative solution would make the bottom half of the circle, so we are
just interested in the positive half. Now, what is going to happen if I rotate that about the x-axis?
So, the red line here, is the x-axis and what you are going to see, or should see is this [Figure 42],

118
is what actually you are doing. You are taking that semi-circle and you are rotating it through
three dimensions and it’s going to make a sphere. And, it’s actually the volume that’s contained
within that rotation that you are calculating. And that’s what you and I were talking about a
minute ago because what would you expect the volume of that to come out as? You would
expect it to come out at 𝑉 =4
3𝜋𝑟3 which is a volume of a sphere. Are there any questions about
that about what has actually happened there?”
Figure 41: Martin’s display of a semi-circle on GeoGebra (reproduced for clarity)
Figure 42: The rotation of a semi-circle on GeoGebra (reproduction of Martin’s work)
Student N questioned: “Why have you just used the positive solution … because you’re going
to get the same volume aren’t you?”
Martin responded:
“Well, you need to think about that circle is actually two functions. You have positive and
negative because of the square root, don’t you? So, it’s actually two separate functions and if
you do the negative one obviously you just do the same thing. So, we can disregard one of them

119
because it’s going to overlap the same. You can certainly do it with the negative one if you
wanted to try, but you would get the same result, is that alright? Student Z are you happy with
that? is it a bit clearer now? What you are doing? Student M does that make a bit more sense?
Not really, okay. I’ll come and sit with you, shall I? yeah.”
Martin’s response was that doing the negative solution would give the same answer, however
he did not comment enough on rotating a full circle. From Martin’s response to the student’s
idea, it seemed that he did not consider rotating the full circle (this choice is explored further
in the post-observations interview). This could be because he was not ready for it (subject
knowledge) or he thought the student was asking about the negative solution only. The activity
on GeoGebra created some confusion, Student M asked: “I get the rotation bit, but I don’t really
know what that has to do with this”, referring to the formula of volume of revolution.
Martin replied:
“You don’t know what that has to do with that? So, you’ve used the formula first semi-circle,
haven’t you? And you’ve plugged it into that integral between a and b. And we said that the r
goes between −𝑟 and +𝑟, because if you think about it if you look at that circle if that’s +𝑟 then
this is −𝑟 isn’t it? So, 𝑦 varies between −𝑟 and +𝑟. That’s the integral and then by integrating
and multiplying by π you actually create a sphere”
Student M: Okay
Martin: So, actually you are creating an algebra
Student M: That’s fine.
Martin’s response about the connection between the graph and shape on GeoGebra and the
formula of volume of revolution, was based on explaining the steps of using the formula.
Although Martin tried responding to students’ ideas here, his response did not explain the
connection the student questioned. Instead, it was focused on the formula. Martin here did
not use the opportunity to create the connection. He only commented that by doing the steps
in the formula they were “creating an algebra”, this showed his concentration on procedures.
Students now went back to working independently, and Martin went around to answer
questions about the formula. He also told the students that what they were doing is harder

120
than what is expected in examinations. At some point, Martin came to talk to me about the
lesson, he said:
“This is quite a bit harder than the one they see in the exam…. They will be given for instance,
I’m making them work with algebraic limits which stretches them straight away. They will be
given the numerical limits, they’ll be given a simpler function, they wouldn’t be expected to take
that and make it themselves”.
Martin’s choice of examples harder than examination questions reflected his consideration of
examination policy and requirements. And, when I asked him about his reason for choosing
this specific example he said: “Because it’s harder if they can do this they understand, and it’s
easier for me to do on GeoGebra. I have a two-dimensional trapezium”. This reflected his
knowledge of GeoGebra, as he chose a function he could easily do on the software he is familiar
with.
After some time, Martin asked his students again how they were doing. Student A replied: “I
don’t think too good”. Martin walked towards student A and started explaining to him and his
group:
“You don’t think too good, so why are you sat there doing nothing then? Okay, so which one are
you working on? What one are we working on x-axis? Okay, so I did tell you that your limits of
integration are -r and +r the thing you’re bumping into is that you’re integrating r, what should
you integrate with respect to?
Student A: should it be just 𝑟2𝑥
Martin: should it? because if you were integrating just say 3 it would just be 3𝑥,
wouldn’t it? 𝑟 is a constant so 𝑟2𝑥 …
Student A: Oh, because you times it by 𝑥
Martin: That’s what you’ve bumped into. So, it’s not actually this, it’s your integration
skills letting the side down
Martin went to talk to another group now. When looking at some students work from another
group, Martin noticed that some had the same difficulty with integration that student A had.
So, he said to them:

121
“If we were integrating say 3𝑑𝑥 what would you get? 3𝑥, yeah, exactly it’s a constant not a
variable that is why this is hard… Think about it we have a circle we have to find our circle x2+y2=r2
that’s fixed isn’t it? 𝑟 is a constant it’s not a variable. 𝑟 doesn’t change if I change x and y is that
okay? are you sure?”
Student B: So, if we integrated this twice
Martin: No, no you haven’t integrated it twice all he’s done there is ... no, no you don’t
integrate with respect to r just integrate with respect to x … no, no this is very
hard and not what you’re going to be expected to do in the exam. That’s why I
am doing it, this is properly hard
When students had difficulty integrating 𝑟 𝑑𝑥, Martin’s response showed how he was
responding to students’ ideas and identifying errors by: trying to compare; making connections
between concepts and making connections between procedures. However, Martin’s comment
about this question not being expected in the “exam” reflected how he tried to relieve himself
from the pressure of this moment by reducing the significance of this question, using
examination requirement as a reference.
After about 20 minutes of students work in groups, Martin said:
“Not just today we are going to do it over a couple of lessons you just need to be really familiar
with this kind of problems. Guys when you are ready to start some actual problems page 110 in
the core 3 core 4 book”.
Students were asked to move to the textbook questions now. In the meantime, Martin was
showing the trapezium rotation on GeoGebra to one student who was ready for it, but on the
main board. It seemed that students’ questions and progresses were treated by Martin as
resources that he used to help each student or group of students’ progress and move to the
next step.
Some students were then saying that no one from their group understood the idea. Martin was
now working with them and explaining the rotation of semicircle. While GeoGebra was playing
the rotation of trapezium, Martin continued working with the groups until the end of the
lesson. In a comment on his work on GeoGebra, Martin told me after the lesson: “So, that’s the
way I use GeoGebra. I don’t really do anything live with them on it, it’s really just to run in the
background and support the idea”. By doing this, Martin did not fully exploit the dynamicity of

122
GeoGebra. He connected between resources, but in a procedural way. By doing so he is
connecting resources (prepared task & student questions) and this influences the flow of his
lesson.
In this lesson, the teacher made decisions about sequencing (worksheet then textbook
questions) and anticipation of complexity (reassuring students that they would work on this for
2-3 lessons). Also, the rotation of trapezium on the board (use of instructional materials/ use
of resources), was not showed to the whole class but only to one student who seemed ready
for it (students’ contributions as resources). Students so far seemed to have questioned the
connection between the display on GeoGebra, the choice of semicircle, and the integration of
𝑟𝑑𝑥.
Post observation interview
In the post-observations interview, I asked Martin about the reasons behind his choice of semi-
circle and trapezium for this lesson, he said:
“So, the, I think part of it was I didn’t want to choose anything too weird and wonderful. I could
have chosen any shape really, but I had to choose something that was familiar to the students,
something they could work out the area of and then do the rotation themselves. And, for
instance choosing the trapezium was because they didn’t necessarily need to be able to
integrate to get into that task, they didn’t know they could work the area of the trapezium. And,
I think sometimes I can’t assume that they can, that their skills are yes I can integrate that
straight away. It’s got to be that they have other access points into the lesson because otherwise
you’re going to end up with somebody sitting doing nothing which is a real danger”.
His choice of examples was based on this example being familiar to students, more difficult
than examination question so if the students solve it they would be able to solve examination
questions.
When asked about choosing a semi-circle rather than a circle, Martin said it was “because then
you would just get the full circle out again, you couldn’t actually see the animation”. When
asked about the way he used pre-prepared graphs on GeoGebra, Martin described his method
as follows:

123
“I give them the task, and then without giving them any instruction will start the animation
running. So, if they are looking for support or they’re looking for, it’s there for them. But I don’t
use it to teach it; because it reinforces the concept, but it isn’t the whole concept and I don’t
want them restricting their thinking to just something moving on a board. It doesn’t work like
that in reality”
He also added that he would not do the functions live in the class “because I guess what if it
doesn’t work; I don’t have time in a lesson to sit and fiddle with GeoGebra and make it work
[…]. If I was more proficient probably I could do it live”.
In a question on whether the students connect the image they see on GeoGebra with the
formula, Martin answered:
“It’s more important that they are familiar with the formula and are able to express it using the
formula and think about what is happening with the mathematics than be able to visualise
something spinning in their head, because they are not going to have that when they are
examined. Do you know what I mean? They need to be able to use that formula and that’s the
crutch it’s a lovely way of demonstrating it, but it is a crutch it’s not what they need to know”.
Martin commented in the interview on his 40 second rule: if he could not explain something to
the students in 40 seconds it means he did not understand it enough. This meant he relied on
minimal teaching. He said:
“So, whenever I was training as a teacher, something I struggled with was basically letting the
students get on with it trying to cover every possibility and every permutation. And, then I was
thinking about that and thinking I am working far harder than they are. So, I started trying to cut
down the explanations. And, at A level trying to explain something in less than a minute or in
around 40 seconds is really, really challenging it’s really, really, really hard to do. Yeah, it’s really
hard to do but something like integration is really dull. If somebody is trying to go here and you
do this one people switch off after about 40 seconds anyway. My concept of teaching at the
moment is that all they need is the first step to get into something the rest they can just do”.
To minimise his talking time, Martin said:

124
“What I try to do is, I try to design tasks that sort of link on into each other, so that they will
when they are working I can just keep them working. If the whole class is struggling, then I will
obviously stop them and do some teaching. But, that’s the last resort. Yeah, it depends on how
they are going but I try and design lessons so that they feed on. So, you’ve seen my power point
slides even are one big continual everything links together”.
It seemed that students’ questions were treated by Martin as resources that he used to help
each student or group of students’ progress and move to the next step. This was justified by
him saying that he avoided talking for long and preferred to give tasks for the students to do.
This meant that Martin would give his students a brief introduction and a task to engage with
and complete independently, and then explain ideas to them in groups or individually based
on what questions they came up with. So, Martin particularly seemed to use students’
questions (part of students’ contributions) as resources.
On his use of the textbook, Martin said:
“I only use the questions, I don’t use the explanations from the textbook. I don’t rely on the
textbooks for learning very much […]. Because there is so much that is incorrect, like they mixed
up tangent and normal and things like that. Textbooks are very unreliable”.
According to Martin, his only online resource was the scheme which he described as “a list of
topics and I just go on to teach that”
Martin said: “I teach quite quickly the pace of lessons that I teach moves quite quickly
compared to some of the other teachers because I don’t do the talking rubbish for half an
hour”. He also said that the homework was usually past-examination questions.
On his use of GeoGebra, I asked him to elaborate on why he would not use it “live” and he said:
“Because I do something very similar for it. So, I give them the task and then without giving them
any instruction will start the animation running so if they are looking for support or they’re
looking for it’s there for them but I don’t use it to teach it because it reinforces the concept but
it isn’t the whole concept and I don’t want them restricting their thinking to just something
moving on a board, it doesn’t work like that in reality… It’s more important that they are familiar
with the formula and are able to express it using the formula and think about what is happening

125
with the mathematics than be able to visualise something spinning in their head because they
are not going to have that when they are examined do you know what I mean they need to be
able to use that formula and that’s the crutch. It’s a lovely way of demonstrating it but it is a
crutch it’s not what they need to know, does that make sense?”
This showed how Martin used GeoGebra as instructional material (use of instructional
materials), but had at the same time examination questions in his thoughts. That lead him to
concentration on procedures. His knowledge about the software was not enough for him to use
it live in class, so he relied on graphs prepared and displayed in class to avoid contingent
moments that might result from the software not working as he wishes.
On his reasons for using GeoGebra rather than other software like Autograph which was
available at his school, he commented:
“The reason why I use GeoGebra is because it works well with Mac and the graphics and
everything work really fluidly on the Mac. I’ve tried other things and they don’t work quite as
well. And, also GeoGebra is free. […]. I have Autograph, I just think it’s very limited. I don’t really
like Autograph, GeoGebra is far more powerful and I can play around with the JavaScript and
make it do whatever- exactly what I want it to do. Autograph doesn’t have that facility”.
He added that he should use GeoGebra more in the future:
“More, more way more […]. I can make them or get ones online and tweak them to what I want
them to be or whatever. But as I can do that I’ll get more and more and more and more. They
are so time consuming to make”.
In summary, Martin used textbooks to find questions for students to work on. He used the
scheme of work provided by the school and past-examination questions for homework
(provided on a website created by the head of mathematics/school policy and examination
requirements). He relied on minimal talking by him, and structured tasks for students. While
students were working on the tasks, he went around identifying errors and explaining more. His
explanation was prompted by his students’ questions, and it reflected his knowledge of the
topic he was teaching and the software he used. His choice of an example familiar to the
students (semi-circle) was based on a plan of how students can proceed with the volume of
revolution and how they can see the animation on GeoGebra. His anticipation of complexity

126
lead him to devote more than one lesson to it. He made decisions about sequencing the tasks
and moving from worksheet to textbook questions. He made making connections between
procedures (area, volume, integration). And he connected between resources (worksheet &
GeoGebra). Martin frequently responded to students’ ideas and questions. His response to the
student’s question about why he rotated just the “positive” half a circle, considered rotating
just the “negative” half but not the full circle. In the interview, Martin said he did not consider
the full circle because he wanted to avoid overlapping and because rotating a semicircle is
clearer and easier in GeoGebra.
The choice of examples (semicircle rotation as a difficult one) created confusion between
students regarding the integration and whether r is a variable. Going for a “difficult” question
to start teaching the concept reflected inexperience in students’ needs. It is an unexperienced
approach that created complications during the lesson. The choice of this approach can be due
to unfamiliarity with students’ needs and lack of experience, or it could be due to the teacher’s
attempt to save time by going for a difficult question straight away. However, this choice
reflected that there was no recognition of conceptual appropriateness. Moreover, students
could not see the purpose of the formula and how it was deduced to find the volume. The
teacher’s explanation focused on the procedural level (concentration on procedures).
The way the teacher used the formula of the volume of a sphere to show that the formula for
the volume of revolution works, showed how he used these making connections between
procedures without giving attention to the concepts behind these. Even when students asked
about the connection between the formula and the rotation on GeoGebra, the teacher’s
response showed concentration on the procedures and formula and not on the concepts. The
teacher did not consider explaining how the formula can be deduced either because he did not
know or because he did not think it was important part of the lesson. His explicit concentration
on procedures was supported by use of GeoGebra for demonstration only without showing how
the displayed graphs and figures could be constructed.
The teacher recommended sketching the graph at some point, but that did not seem something
he integrated within the lesson. He used it in a way similar to the way he used GeoGebra, i.e.
to show that the rotation of a semicircle is a sphere and that using the formula for volume of
revolution will produce the formula for the volume of a sphere.
The connection he tried to create by mentioning that integration is used to find the volume, as
it is used to find the area did not go into the details of the concepts and was limited to

127
procedures (making connections between procedures). Thus, we see prioritization of
procedures over substance and concepts.
Martin was trying to avoid Contingency when it came to the use of technology, by using ready-
made shapes. This use of ready resources contradicted his claim of using his own resources. It
seems he was searching and choosing resources, but he did not design or create ones. This
could be due to time management, as he commented in the interview.
Analysis
Using the Documentational Approach
Resources included: interactive white board, board, mini whiteboards, curriculum of year 13,
textbooks, past-examination questions and mark schemes, past teaching-experience, students’
contributions, calculators, notebooks, GeoGebra, worksheet, and the school website.
Martin’s scheme of work for this lesson is summarized in Table 15. His specific aim was to
introduce the volume of revolution, and his general aims were to prepare students for the
examination and to minimise the teaching and get students to practice. His first general rules
of actions included giving enough information to students in order to let them work
independently. This included specific rules of actions: briefly introducing the lesson objectives
and showing the formulae for volume of revolution; starting with a challenging question;
reminding the students of the equation of a circle, showing the students how to rearrange the
equation of a circle to the form y=… considering the positive solution only, asking students to
use that to find the volume of revolution around the x-axis using the formula given in the table,
connecting volume of revolution with students’ previous knowledge about integration and
area; connecting the result of the integration to students’ previous knowledge about the
volume of a sphere.
His second general rule of action was to use GeoGebra for demonstration, including: using
GeoGebra to show the students a semicircle prepared and drawn in 3D; rotating a semicircle
around the x-axis; showing another example pre-prepared using the rotation of a trapezium.
His third general rule of action was to let students work independently, including: students can
ask student X for help; students work independently on the worksheet, students solve the
questions on the worksheet; students solve the handout and textbook questions. His fourth
general rule of action was to answer students’ questions. His fifth general rule of action was
not to use the interactive function of the whiteboard.
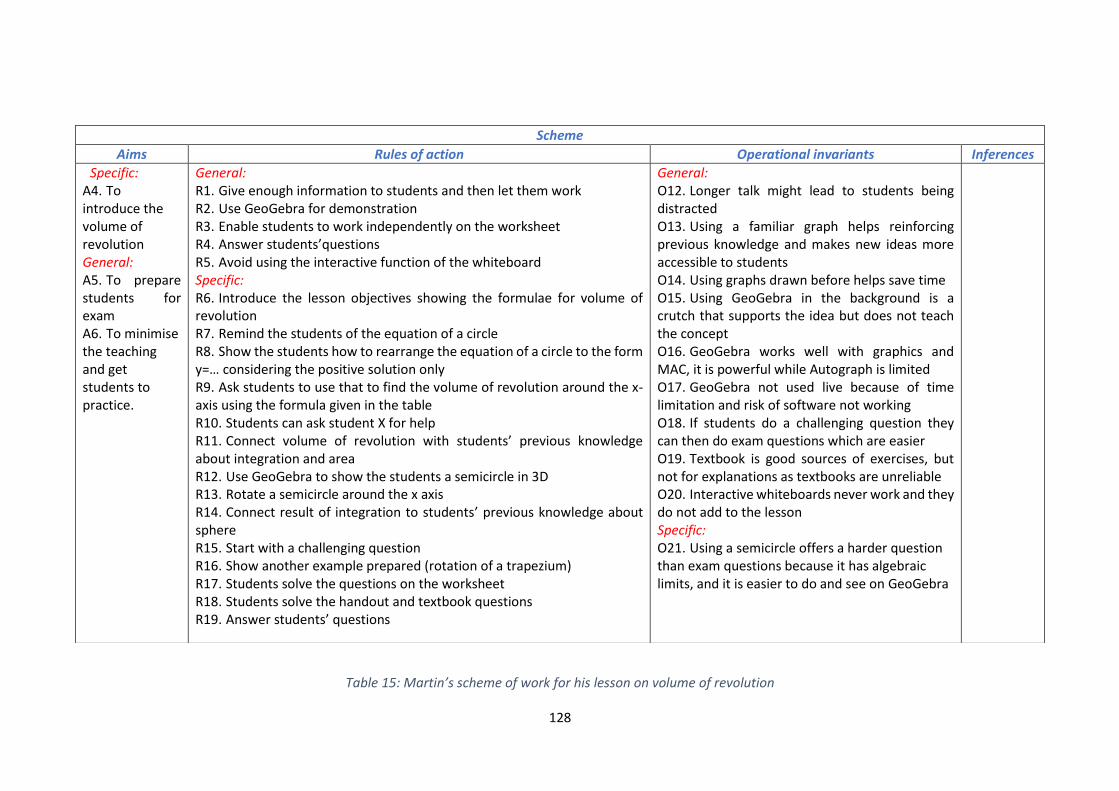
128
Table 15: Martin’s scheme of work for his lesson on volume of revolution
Scheme
Aims Rules of action Operational invariants Inferences
Specific: A4. To introduce the volume of revolution General: A5. To prepare students for exam A6. To minimise the teaching and get students to practice.
General: R1. Give enough information to students and then let them work R2. Use GeoGebra for demonstration R3. Enable students to work independently on the worksheet R4. Answer students’questions R5. Avoid using the interactive function of the whiteboard Specific: R6. Introduce the lesson objectives showing the formulae for volume of revolution R7. Remind the students of the equation of a circle R8. Show the students how to rearrange the equation of a circle to the form y=… considering the positive solution only R9. Ask students to use that to find the volume of revolution around the x-axis using the formula given in the table R10. Students can ask student X for help R11. Connect volume of revolution with students’ previous knowledge about integration and area R12. Use GeoGebra to show the students a semicircle in 3D R13. Rotate a semicircle around the x axis R14. Connect result of integration to students’ previous knowledge about sphere R15. Start with a challenging question R16. Show another example prepared (rotation of a trapezium) R17. Students solve the questions on the worksheet R18. Students solve the handout and textbook questions R19. Answer students’ questions
General: O12. Longer talk might lead to students being distracted O13. Using a familiar graph helps reinforcing previous knowledge and makes new ideas more accessible to students O14. Using graphs drawn before helps save time O15. Using GeoGebra in the background is a crutch that supports the idea but does not teach the concept O16. GeoGebra works well with graphics and MAC, it is powerful while Autograph is limited O17. GeoGebra not used live because of time limitation and risk of software not working O18. If students do a challenging question they can then do exam questions which are easier O19. Textbook is good sources of exercises, but not for explanations as textbooks are unreliable O20. Interactive whiteboards never work and they do not add to the lesson Specific: O21. Using a semicircle offers a harder question than exam questions because it has algebraic limits, and it is easier to do and see on GeoGebra
129
In terms of his operational invariants, Martin thought longer talk might lead to students being
distracted. His choice of semicircle was based on offering a harder question than examination
questions because of its algebraic limits, but easier to do and see on GeoGebra. Also, he
thought using a familiar graph helps reinforcing previous knowledge and makes new ideas
more accessible to students. By using pre-prepared graphs Martin was aiming to save time and
avoid the risk of software not working. He thought that using GeoGebra in the background is a
crutch that supports the idea but does not teach the concept. His choice of GeoGebra was
because it worked well with graphics and MAC, it was powerful while Autograph was limited.
Martin’s view on GeoGebra seemed to be based on professional development training he
received. Martin thought textbook is good sources of exercises, but not for explanations as
textbooks are unreliable. Martin thought interactive whiteboards never worked and they did
not add to the lesson. No inferences were noticed in this lesson. However, some of the
operational invariants seem to be based on inferences from previous experience like spending
less time talking and demonstrating; what works with MAC; and views about potential
problems with GeoGebra.
Discussion and Summary
The resources that are frequently noticed in Martin’s teaching include paper-based and
electronic resources: interactive white board, board, mini whiteboards, curriculum, textbooks,
past-examination questions and mark schemes, past teaching-experience, students’
contributions, calculators, notebooks, GeoGebra, and the school website. The five points
addressed in the discussion about George’s teaching also came up in the analysis from Martin
as explained below.
First, throughout his teaching, Martin gave an important role to students’ contribution, and
used these as resources. His scheme was influenced by these resources. So, he relied, as he
explained, on minimal demonstration and talking by the teacher followed by students working
individually or on groups to solve exercises. While students were working, he would go around
the class to answer questions and he relied on students’ question to find out what he needed
to explain further. These were expected questions (unlike those that come under Contingency),
for example asking about how to integrate a function given by the teacher. These questions
were Martin’s resource to decide when to answer a question to the individual student who
asked it (e.g. when the rest of the class seem to know the answer); and when to demonstrate
it on the main board to the whole class (e.g. when the same question is asked by more than
one student). This is a special characteristic of Martin’s teaching that involved scheming on the
spot, it showed the way he used students’ contributions as resources in a way different from

130
George’s way. This in turn supported replacing the code “use of instructional materials” by “use
of resources” to include students’ contributions (including students’ questions and students’
previous knowledge).
Second, is how Martin created connections between resources. We show these connections in
Martin’s teaching less, and when they happened they were sometimes procedural or
unsuccessful (like his attempt to connect the rotation on GeoGebra with the formula of volume
of revolution). When comparing this with George’s connections between resources, we notice
that George’s were deeper, meaningful and reflected the teacher’s confidence. Thus, we can
conjecture that the deeper the connections between resources are, the more confidence the
teacher have in balancing his resources and using them for demonstration that goes beyond
emphasize on the procedures.
Third, in terms of textbook use, Martin adopted this persona, in other words, he wanted to
create his own resources because according to him the textbooks are not always accurate and
included errors. But, in practice he did not reflect that entirely. The textbook in addition to the
scheme of work, past-examination questions and school website are resources related to the
school policy and examination requirements that Martin used in his lesson. Regarding
examination requirements, these were one of Martin’s resources through his use of past-
examination papers and his reference to examination requirements during the lessons. The
code “adhering to examination requirements” under the Contingency dimension is also
relevant in Martin’s case, to help analyse situations in which examination requirements are set
as boundaries of what students need to know (like the unclear connection between the
animation on GeoGebra and the formula of volume of revolution). Like with George’s case, this
code would help reflect how answering unexpected questions outside the examination
requirements is dealt with (in Martin’s case by adhering to the procedure). This code is more
obvious in Martin’s data due to his concentration on procedures that are part of examination
requirements.
Fourth, in terms of GeoGebra, Martin’s view of the software as a powerful tool seemed to be
influenced by professional development training that he received. His use of the software was
pre-prepared and not dependent on students’ contribution, unlike what we saw with George.
Martin justified this by time restrictions, which is a factor related to school and examination
policies. He also explained it by his knowledge of the software (i.e. needing to know more about
GeoGebra) and attempts to avoid Contingency.
131
Fifth, in terms of Contingency, Martin used ready-made resources (accessed online or from the
textbook) to help avoid Contingency and had past-examination questions and textbook as
references. In comparison with George, Martin was less confident to use spontaneous and live
work in the class and felt that he needed more software knowledge to be able to do that.
However, his use of ready-made resources led sometimes to contingency moments (like when
he was questioned about the connection between the animation on GeoGebra and the formula
for volume of revolution).
Finally, beside the differences addressed above between Martin’s and George’s practices,
there were also differences addressed between the perspective emerging from the interview
and what happened during the lessons. The latter differences include:
• Claiming that textbook is “rubbish” verses observing the textbook being always used in
class as the source of exercises
• Claiming that GeoGebra is very good and powerful but using it in a procedural way due
to time restrictions
• Claims related to creating own resources verses using ready-made resources, either
accessed online or from the textbook
These differences show the potency of the analysis that looks at both aspects. The differences
could be explained by arguing that although the teacher had good knowledge about
mathematics and its teaching, he just needed more time to reify his resources and balance
them. Or, they could be explained by the teacher concentration on procedures and
examinations requirement and lacking the knowledge about the software. Such differences are
not visible in George’s case, which can probably be attributed to more experience that lead to
better balance of resources.
Third teacher data - Adam
Adam was a mathematics teacher with four years’ experience, during which he taught students
aged 12-18 years. He held a PGCE in secondary mathematics teaching and was about to finish
MA in education including a dissertation which focuses on mathematics education. The school
he worked for had interactive whiteboards, a computer lab available for booking, and
GeoGebra (www.geogebra.org) and Autograph software installed on all computers
(www.autograph-math.com).
From a set of six lesson observations with Adam, three episodes will be discussed and analysed:
two episodes from lessons 4 and 5 on integration; and one episode from the pre-observation

132
lesson which was a revision lesson on simultaneous modulus equations. The rest of lessons will
not be included because mathematics-education software was not used. The next section
describes the three episodes using the Knowledge Quartet lens and then analyses them using
the Documentational Approach; starting with the two episodes on integration.
Two episodes on Integration
The episodes are taken from two lessons to one group of sixteen Year 12 students. While the
first episode addresses a full lesson in which integration was introduced to the students; the
second is a part of a lesson in which Adam used Autograph to continue working on integration
with the same group and do further demonstration on the constant of integration 𝑐.
Episode 1- Lesson 4
Starter activity
Adam started by asking his students to solve a starter question on dividing fractions (Figure 43)
commenting:
“You will definitely need to be able to do this, that’s why it is on the board, so remember make
sure you know how to divide fractions… in about three minutes we’re going to go on, but you
need to be able to divide fractions before we do anything today”.
This reflected the connections he was aiming to make with students’ previous knowledge. The
students solved the starter individually, in pairs or in groups. Adam was going around checking
students’ work, then he showed the answers on the board to allow students to check if they
got correct answers. So, he used the resources available (activity and board), to allow students
to check their answers independently.
Figure 43: Starter question on dividing fractions

133
Introduction to integration
To start introducing integration, Adam used his students’ contributions as resources. So, he
asked for two students to volunteer to go outside the classroom. When two students left the
room, Adam drew a graph on Autograph and asked his students to tell him the equation of that
graph. A student replied the equation of the graph was 𝑦 = (𝑥 − 5)2. Adam commented the
answer was right “because that translates it to the left 5 yeah along the…”, in this answer he
was making connections between concepts (equation of a graph, translation). Then, he asked if
anyone wrote it differently, a student replied that it could be written 𝑦 = 𝑥2 − 10𝑥 + 25. So,
Adam asked “then what is the gradient going to be?”, and said it would be “2𝑥 − 10”. By asking
this question about the gradient Adam was making connections between concepts (gradient,
differentiation) and making connections between representations (equation and graph). At that
point, Adam hid the equation of the graph and the graph and invited the two students outside
the class back into the room; and asked them about 2𝑥 − 10: “We’ve differentiated something,
can you tell me what it was we differentiated?”. Adam asked the two students “talk about it
out loud” and try answer this question, so he could use their contributions as resources. The
two students were guessing (𝑥2 − 5, 𝑥2 − 5𝑥,…), and then decided it should be 𝑥2 − 10𝑥 +
25, the teacher asked the students why it would be “how did you get the 𝑥2 bit?”.
Student: ‘Cause, umm I don’t know. I just know if you differentiate that [meaning 𝑥2]
and then you – 1 so it just becomes 𝑥 to the power of 1, just 𝑥 and then there
is an invisible one here (in reference to the exponent) and times that by 2 that’s
2𝑥
Adam: And how did you get the 10𝑥?
Student: Like you just – the 1 here, so it takes the power of 0, and then you times 1 by
10 so it’s 10 and then that is if you just put it into brackets like that it will be
Adam: How did you get 25?
Student: I just did that in my head… that will be that
Adam commented that he understood why the students got 𝑥2 and 10x, but he was not sure
why they went for 25 as a constant:
“I get what you’ve done here, but it doesn’t have to be factorised, this does it. So, so far you’ve
got this but and these two are linked, aren’t they? But, you don’t know what this is here
[referring to the constant of integration], Do you?”
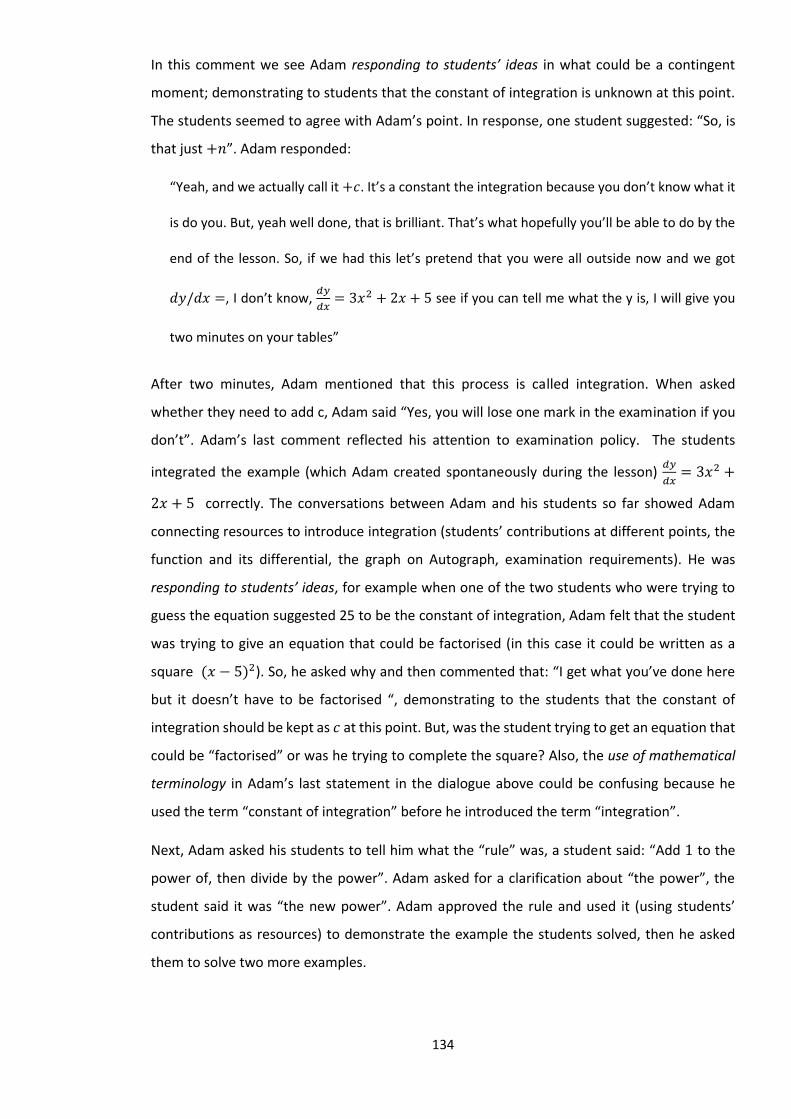
134
In this comment we see Adam responding to students’ ideas in what could be a contingent
moment; demonstrating to students that the constant of integration is unknown at this point.
The students seemed to agree with Adam’s point. In response, one student suggested: “So, is
that just +𝑛”. Adam responded:
“Yeah, and we actually call it +𝑐. It’s a constant the integration because you don’t know what it
is do you. But, yeah well done, that is brilliant. That’s what hopefully you’ll be able to do by the
end of the lesson. So, if we had this let’s pretend that you were all outside now and we got
𝑑𝑦/𝑑𝑥 =, I don’t know, 𝑑𝑦
𝑑𝑥= 3𝑥2 + 2𝑥 + 5 see if you can tell me what the y is, I will give you
two minutes on your tables”
After two minutes, Adam mentioned that this process is called integration. When asked
whether they need to add c, Adam said “Yes, you will lose one mark in the examination if you
don’t”. Adam’s last comment reflected his attention to examination policy. The students
integrated the example (which Adam created spontaneously during the lesson) 𝑑𝑦
𝑑𝑥= 3𝑥2 +
2𝑥 + 5 correctly. The conversations between Adam and his students so far showed Adam
connecting resources to introduce integration (students’ contributions at different points, the
function and its differential, the graph on Autograph, examination requirements). He was
responding to students’ ideas, for example when one of the two students who were trying to
guess the equation suggested 25 to be the constant of integration, Adam felt that the student
was trying to give an equation that could be factorised (in this case it could be written as a
square (𝑥 − 5)2). So, he asked why and then commented that: “I get what you’ve done here
but it doesn’t have to be factorised “, demonstrating to the students that the constant of
integration should be kept as 𝑐 at this point. But, was the student trying to get an equation that
could be “factorised” or was he trying to complete the square? Also, the use of mathematical
terminology in Adam’s last statement in the dialogue above could be confusing because he
used the term “constant of integration” before he introduced the term “integration”.
Next, Adam asked his students to tell him what the “rule” was, a student said: “Add 1 to the
power of, then divide by the power”. Adam asked for a clarification about “the power”, the
student said it was “the new power”. Adam approved the rule and used it (using students’
contributions as resources) to demonstrate the example the students solved, then he asked
them to solve two more examples.

135
Time for practice
Next, Adam asked the students to solve three questions that he spontaneously created and
wrote on the board. In the third one of these questions (integrate 𝑑𝑦
𝑑𝑥= 6𝑥1/2 + 12𝑥 ) the
students needed to divide fractions and Adam commented that the three questions were
getting gradually more difficult. He then gave them a worksheet (Figure 44) (use of instructional
materials) to solve, commenting: “You can write on the sheet. You got two things; you want to
differentiate one of them and integrate the other. Differentiate on the right integrate on the
left, it’s a bit like reversing a car”. So, he was making connections between procedures
(integration, differentiation). He gave the students some time to practice working
independently on the worksheet (Figure 44) and textbook questions (Figure 45) and he was
going around answering students’ questions and identifying errors. Adam frequently
commented on forgetting to add the constant c. For example, he said “There is about 20.000
people in the country that always do that and miss out on their A in AF maths, because they
forget the +𝑐. Do not forget your +𝑐”; which reflected his attention to examinations and
examination requirements. His attention to examinations was also reflected in his request that
students would be doing assessments for homework.
Figure 44: the worksheet Adam gave his students

136
Figure 45: Textbook questions
After that Adam asked students to play a race game (ActiVote pads: use of instructional
materials). The race game involved competition on answering integration questions. In terms
of the choice of these questions, Adam mentioned in the interview that “there is a software
with a bank of questions which you can use”, but not for A level questions where he had to
create the questions himself:
“You have to answer it quickly, and I try to make questions quite simple. All of them you can
answer quite quickly, and I do it almost like a check. But, actually you can’t make them gradually
harder because if you put ten questions in then it automatically just choses whichever in any
random order”
Adam also commented that this software added fun to the lesson and that he used it when
students seemed bored to give them “a bit of a break, something a bit different rather than a
lot more questions”.
Episode 2: The constant of integration 𝑐
In this episode, Adam continued working on integration with the aim of highlighting the
importance of 𝑐 the constant of integration, to the group he taught in the previous episode.
Adam used Autograph and students’ contributions for that purpose. He said: “So, can I have
you looking at the screen then. Let’s have a look at this, I was playing around with Autograph
and I went 𝑑𝑦/𝑑𝑥 = 1, what do you think? What graph is going to come up here?”. A student
suggested it would be a straight line, another suggested 𝑦 = 𝑥, another said it was going to be
horizontal and another said it would be “𝑦 = − something”.

137
Adam: I’m going to show you what happens, and I expect you to give me a good explanation as
to why. Ready? So, I’m giving you the answer then I want you to tell me why 𝑑𝑦/𝑑𝑥 = 1 is this
[referring to Figure 46].
Student A: Oh my God
Student B: I don’t have an explanation for that
Student C: I don’t know, but it looks pretty…
Adam: I’ll do 𝑦 = 𝑥. I’ll put 𝑦 = 𝑥 on there [referring to Autograph [see Figure 47], because I
actually think that actually made a bit of sense. 𝑦 = 𝑥, who said 𝑦 = 𝑥 again, there’s 𝑦 = 𝑥.
Figure 46: 𝑑𝑦/𝑑𝑥 = 1 on Autograph (reproduction of Adam’s work)
Figure 47: 𝑑𝑦/𝑑𝑥 = 1 and 𝑦 = 𝑥 on Autograph (reproduction of Adam’s work)
Student D: Gradient, doesn’t have a point
Adam: Oh, what was that? Say that again, that made sense.
Student D: It’s just a gradient, it doesn’t have a point to go through.

138
Adam: Yeah, so it’s a gradient function, isn’t it? But, you actually don’t know where. Because
if we integrated this, so 𝑑𝑦/𝑑𝑥 is what? Sorry, what did I put?
Pupil: 1
Adam: 1, therefore then we integrated it 𝑦 = 𝑥 + 𝑐 didn’t we? Does that make sense? We
don’t know what the C is. So, actually it could be 𝑦 = 𝑥, that was a little bit right but what else
could it be? 𝑥?
Student E: +1
Adam: + 1, that could’ve been the equation [referring to Figure 48], couldn’t it? What else
could it have been?
Student E: 𝑥 + 2
Adam entered both 𝑦 = 𝑥 + 1 and 𝑦 = 𝑥 + 2 on Autograph (see Figures 48 and 49).
Figure 48: 𝑑𝑦/𝑑𝑥 = 1, 𝑦 = 𝑥 and 𝑦 = 𝑥 + 1 on Autograph (reproduction of Adam’s work)
Figure 49: 𝑑𝑦/𝑑𝑥 = 1, 𝑦 = 𝑥 and 𝑦 = 𝑥 + 2 on Autograph (reproduction of Adam’s work)

139
Adam: 𝑥 + 2. Do you see [referring to Figure 49]? When you integrate it gives you a family of
curves, doesn’t it? It could be loads of them there all related. How many of this happy family
are 𝑦 = 𝑥 + 𝑐? There is an infinite amount in this family. You can see them all, we’ve only
picked out three. How would you? What do you think the exam will do to make? What
information would they have to give you so then you would have to work out exactly what
graph it is? An 𝑥 and 𝑦 co-ordinates, would they give you one or two or how many 𝑥 and 𝑦 co-
ordinates do you think they would give you?
Pupil: 1
Adam: Yeah, good. So, if they say 𝑓’(𝑥) is this, find the equation of the curve 𝑓(𝑥) you don’t
need the +𝑐 anymore, do you? You might have to use it, because of that you can find a family
of curves then hopefully you can find what the C is.
In this demonstration about integration, Adam frequently asked for students’ contributions and
used these as resources (e.g. to explain what they saw in Figure 46). He used Autograph as a
resource and connected between Autograph and students’ contributions to show students why
they need to include (+𝑐) when they do integration questions. He also connected between
these and examination requirements to explain what information the students would need in
the examination to figure out a specific “graph”. So, he demonstrated that when given the
coordinates of a point from the function the value of c can be calculated. Adam also connected
between the algebraic and graphic representations (making connections between
representations).
In the post-observations interview, Adam commented on his use of Autograph in this episode.
In terms of his choice of this activity, he said:
“I think I got this from the MEI website, and I think the point with this because it shows the
gradient at different points, doesn’t it? It shows a family of gradients and I think it makes it clear.
[…] I think it makes a point that actually, we can’t, there must be a family of curves that is the
solution and not just one and that is the main point of this”.
In terms of how Adam found the activity, he said:
“I think my thinking was if you show them this and you show them the family of curves then
they will be more inclined to understand it and then don’t forget the +𝑐. I think if you just kind
of know how to integrate and differentiate and you know just the bog standard add one to the
140
power divide it by the new power you would be inclined to forget the 𝑐. Whereas if you show
them something like this, show them the family of curves and they actually understand - oh
actually look when that goes therefore when I integrate I don’t know what that is - I think then
they would understand it more. My thinking you know at a more comprehensive level and
therefore not forget the +𝑐 but whether that is true or not I don’t know that was my thinking”
Using the Documentational Approach
In these episodes, Adam’s resources were the textbook, his computer, Autograph, interactive
whiteboard, board, his past experiences with students, the worksheet, the examination
questions and grades, Curriculum of year 12, past teaching-experience, students’ contributions
including their previous knowledge, notebooks, the school’s scheme of work, voting software
ExamView (www.turningtechnologies.com/examview) and hardware (ActiVote pads), and MEI
website (Mathematics in Education and Industry website https://mei.org.uk/).
Adam’s scheme of work in both of episodes 1 and 2 is summarized in Table 16. In the first
episode, Adam’s specific aim was to introduce integration, and his general aim was to prepare
students for the examination. His general rules of action included reminding students of
fractions division; introducing integration; giving students some questions for practice; setting
up homework/assessment; giving a concluding activity (voting race game). To remind students
of fractions division, Adam followed the specific rules of action: to show the question; to give
students time to solve it then to show the correct answers on the board. To introduce
integration, Adam followed the specific rules of action: to ask two students to volunteer to
leave the class; to draw a graph on Autograph and ask students to guess its equation; to ask
students about the “gradient” of the graph, to hide the equation of the graph; to invite the
volunteer students to come back into class and guess the graph’s equation from its gradient’s
equation; to give the students an expression to integrate; to introduce the “rule” of integration;
and to emphasise the importance of the constant of integration c. Adam’s specific operational
invariant was that many students forget c. His general operational invariants were that
ActiVote adds fun to the lesson; and to connect new concepts with students’ previous
knowledge. One inference (students forget to add c the constant of integration) that resulted
from previous experience of teaching integration lead Adam to do the activity on Autograph in
the second episode, this could potentially be an inference from the first episode as well
(because Adam noticed students forgetting to add c). In the second episode, Adam’s aims were:
specific - to continue working on integration; and general- to prepare students for the

141
Table 16: Adam’s scheme of work in episodes 1 (in row 2) & episode 2 (in row 3)
Scheme
Aims Rules of action Operational invariants Inferences
Specific: A1. To introduce integration General: A2. To prepare students for exam
Specific: R1. Ask two students to volunteer to leave the class R2. Draw a graph on autograph and ask students to guess its equation R3. Ask students about the “gradient” of the graph R4. Hide the equation of the graph and invite the volunteer students to come back into class and guess the graph’s equation from its gradient’s equation R5. Give the students an expression to integrate R6. Introduce the “rule” of integration R7. Emphasise the importance of c General: R8. To give students some questions for practice R9. To set up homework/assessment R10. Play voting race game
General: O1. Autograph ease of use as a tool for visual representation O2. ActiVote adds fun to the lesson Specific: O3. Many students forget c O4. It is useful to connect new topics with students’ previous knowledge
Many students forget to add c the constant of integration
General R11. To continue demonstration about integration Specific R12. Ask two students to solve questions about integration R13. Use Autograph to graph dy/dx=1 R14. Ask students for an explanation R15. Use Autograph to explain why students need +c R16. Demonstrate how to find the value of c
Specific O5. Autograph use makes the idea behind c clearer and works as a visual reminder
142
examination. His general rule of action was to continue his demonstration about integration
focusing on the constant of integration. Under that he had the specific rules of actions: to use
Autograph to graph dy/dx=1; to ask students for an explanation; to use Autograph to explain
why students need +c; to demonstrate how to find the value of c. Beside the operational
invariant noticed in the first episode, there was one more operational invariant: Autograph
use makes the idea behind c clearer and works as a visual reminder.
Episode 3 – Modulus equations
This episode is taken from a 75-minute revision lesson about solving simultaneous linear and
modulus equations. Preliminary analysis of this lesson was published in Kayali & Biza (2017).
The lesson was audio-recorded and was with a group of nine Year 12 students (17-18 years
old). In this episode, Adam asked his students to solve questions on simultaneous equation,
some of these questions were from the textbook (use of instructional materials). After giving
the students some time to work on the questions, Adam started solving the questions on the
board. First, he would use Autograph to show the graphs of the equations (use of instructional
materials), then he used the graphical solution as a starting point and a way to check the
algebraic solution (making connections between procedures and making connections between
representations). For example, when the teacher was solving 𝑦 = ǀ𝑥 + 2ǀ and 𝑦 = 3
simultaneously, he asked students to draw it and see the answers in the graph before solving
algebraically: “You will get two points, you can see this graphically”. Then, he started to write
one of his student’s algebraic answers on the board: “3 = 𝑥 + 2 or −3 = 𝑥 + 2”. He then
commented on the student’s answer: “So, math says x = 1 or -1... What textbook would say is
𝑦 = (𝑥 + 2) or 𝑦 = − (𝑥 + 2). Textbook would just say that, so I’ll probably do it this
way”.
In his demonstration about the algebraic solution, he frequently asked for students’
contributions and used these as resources. While solving questions, Adam commented on
which questions were “exam questions” and what grade they would help the students achieve
(knowledge of examination requirements). When a student asked why they needed to learn
about modulus equations, Adam chose to use Google to find out the answer. Based on his
Google search Adam said that modulus equations were used for “distance” and “currency
exchange”. When students asked why one would use graphs and modulus equations to
measure distance, Adam responded because distance had to be a positive number. The
students expressed that they were not convinced because they “already know” that distance
would be positive, and they did not feel they would need modulus equations for that. This
showed how Adam tried responding to students’ ideas by using Google as a resource, his
attempt in this case was not convincing. This was a contingent moment in which Adam
attempted to briefly respond to the student’s question. It reflected his subject knowledge and

143
lack of awareness of purpose, which were bounded by examination requirements, this matches
his aim of preparing students for the examination. Although Adam did not say clearly that he
was “adhering to examination requirements”, the way he dealt with this contingent moment,
reflected such adherence.
Later in the lesson, when Adam felt that some students finished answering all the questions he
initially asked them to do, he decided to come up with extension questions to keep them
engaged. In other words, this was a contingent moment in which he was responding to the
availability of tools and resources (i.e. students’ behaviour showing they finished their work).
Adam responded by asking his students to give him two different modulus functions that do
not intersect, and two that intersect once. One student (student A) gave a correct example that
Adam approved after showing the graphs on Autograph (Figure 50):
Student A: 𝑦 = ǀ 𝑥 ǀ and 𝑦 = 2 ǀ 𝑥 ǀ, shift across
Adam: Oh, yeah it is.
Student A: Yeah, you’ve translated it.
Another student (student B) gave an example that showed one intersection points on the
Autograph display but had another that was not visible on the screen (Figure 51):
Student B: 𝑦 = ǀ 𝑥 – 4 ǀ and 𝑦 = 2 ǀ 𝑥 ǀ
Adam looked at the graphs on Autograph and nodded in what seemed like a hesitant
agreement.
Figure 50: Student A answer on Autograph (reproduction of Adam’s work)

144
Student C: Change the slope.
Adam amended the equations as student C suggested and wrote y = 2 ǀ x – 4 ǀ and y = 2 ǀ x ǀ
without commenting on student’s B answer. This was a contingent moment that shows Adam
responding to students’ ideas, but he did not use this opportunity to demonstrate to the rest
of the class why student’s B answer was amended. He also did not utilize the zooming in/out
feature to show the students how many intersection points there are for student’s B answer.
This could be due to lack of knowledge and fluency in the use of the software.
After that Adam asked students to play a Bingo game (Figure 52) he had prepared on
simultaneous equations. He used Excel to list the functions and was revealing these gradually
when needed, asking the students for quick answers to the simultaneous equations in the Bingo
game (use of instructional materials).
Figure 52: The bingo game
Figure 51: Student B answer on Autograph (reproduction of Adam’s work)

145
Using the Documentational Approach
Adam’s resources were the textbook, his computer, Autograph, Excel, interactive whiteboard,
his past experiences with students, the Bingo game, the extension question which he seemed
to have made up at the point he felt it was needed, and the examination questions and grades.
Adam’s scheme of work in both of episodes 1 and 2 is summarized in Table 17. His specific aim
was to do some revision on simultaneous and modulus equations, and his general aim was to
prepare students for examination. His specific rules of action were to ask students to solve
questions on simultaneous equations; to show the graphs and algebraic solutions of the
simultaneous equations given; to have the students playing a Bingo game on simultaneous
equations. His general rules of action were to make connections with examination questions
and grades; to answer students’ questions; and to use Autograph to show the graphs of
functions and connect these with the algebraic solutions. Adam had a general operational
invariant regarding Autograph’s ease of use as a tool for visual representation, and a specific
operational invariant regarding using graphical solutions as a starting point for algebraic ones
and for the construction of meaning about c the constant of integration (choice of
representation). No specific inferences were noticed from this lesson.
Discussion
From the three episodes above we see how Adam’s resources included the interactive
whiteboard, board, Autograph, ActiVote, ExamView, textbook, curriculum, examination
requirements, past teaching experience, notebooks, scheme of work, MEI website and
students’ contributions. Adam used the textbook as an instructional material (use of
instructional materials), and this use was combined with the use of questions and activities that
Adam designed, which reflected his confidence in creating teaching materials. For example,
Adam commented on the starter activities he used at the beginning of each lesson, like the one
he used at the beginning on episode one (Figure 43). He said he usually designed these activities
based on his previous experience and inferences after trying to teach a concept in one lesson
and finding out that the students needed reminding of a concept from their previous
knowledge first. To give an example, Adam said in the interview that he would design a starter
activity on adding fractions if he knew students would need that already known concept in
order to learn a new concept. By doing this he aimed to:
“remind how to add fractions because they still make mistakes with it unfortunately. That would
be an example yeah, maybe it would’ve been a car crash three years ago and I’ve gone none of
them can add fractions, let’s have a quick reminder”.

146
Scheme
Aims Rules of action Operational invariants Inferences
Specific: A1. Revision on simultaneous modulus equations
General: A2. To prepare students for exam
Specific: R1. To remind students of the graphs of some functions R2. To show the graphs and algebraic solutions of the simultaneous equations given R3. To use autograph to show the graphs of functions including modulus ones
General: R4. To ask students to solve questions on simultaneous equations R5. To make comments on exam questions and grades R6. To answer students’ questions R7. To have the students playing a Bingo game on simultaneous equations R8. To use Autograph to show the graphs of functions and connect these with the algebraic solutions
Specific: O1. A graphical solution can be the starting point for an algebraic one.
General: O2. Autograph is easy to use as a tool for visual representation
Table 17: Adam’s scheme of work during the first lesson observed for him

147
The “car crash” would be recorded by Adam to remind himself of why the lesson did not go
well, and what he needed to do better next time. The “car crash” in other words would lead
Adam to inferences for the future, these inferences would later become operational invariant
in his practice.
Having examination requirements and the MEI website as resources, reflected Adam’s
attention to examination and school policy. His attention to examination requirement was
reflected in his comments about how questions are asked in the examination and what
mistakes students widely make (e.g. forgetting to add c the constant of integration, what
information are given in the examination to find c the constant of integration). Also, the code
“adhere to examination requirement” comes up when Adam was asked about the why one
should learn about modulus equations. As such a question was not required in the examination,
Adam did not know the answer and he chose to use Google to search for one. A similar
contingent moment happened in one of George’s lesson on the volume of revolution, when a
student asked him why they needed to learn that concept. George’s response was it could be
used by builders buying building materials to know for example how much cement they would
need. George further commented, dismissing his previous statement, that builders would just
usually estimate how much they would need and buy more later if needed. From these two
examples from George and Adam, it seems that questions outside the curriculum, specifically
about the use of mathematical concepts in practical life could be challenging for teachers.
Adam used students’ contributions as resources in two ways: to answer questions he prepared or
from the textbook; and to demonstrate ideas (like what he did in both episodes on integration).
The latter reflects confidence in having higher chances of Contingency. This shows similarity to the
way George used students’ contributions as resources, however George seemed more open to
work live with his students in different and several scenarios.
Adam connected between resources in a way that helped him demonstrate ideas. The episodes
showed him making connections between representations, students’ contributions and
examination requirements. Such connections were consistent with Adam’s teaching aims.
Adam’s knowledge of the software he used (Autograph) was essential for him to create such
connections and to demonstrate ideas in a way coherent with the topic he was teaching.
However, there are two points to address in relation to the use of Autograph:
• In the episode about simultaneous equations, a contingent moment was observed, and the
teacher did not use the software features to reflect on it in class (i.e. he could have zoomed
out to show his students one intersection point that they could not otherwise see). This
148
was a missed opportunity that he did not use to reflect on having graphical or algebraic
solutions and to create connections between representations.
• In the second episode, Adam used the same feature in Autograph as the one George used
in his work on differential equations. Adam mentioned the gradient to demonstrate to the
students what they saw on Autograph, unlike George who did not mention the gradient in
his demonstration, even when students questioned what they saw on Autograph. The
example Adam used on Autograph was for a linear function, unlike the examples George
used which were cubic or square functions. In George’s case, the representation on
Autograph created confusion and was questioned by students. This did not happen in
Adam’s lesson, and this could be due to: the choice of examples; the dynamics of the taught
group; or the demonstration about the connection between the representation on
Autograph and the gradient function.
In general, Autograph was used by Adam also as an instructional material (use of instructional
materials) that helped student visualize graphs and supported the demonstration (like in the
episodes on integration). During the interview, Adam was asked about his use of Autograph, he
commented that he used it for specific topics and that he was still learning how to use it:
“I use it for certain things that I know how to use. So, once I have built it in to my lesson, I use it.
So, I might make a note to myself oh I’ll use Autograph for this, and I will use Autograph for it.
So, for example the other day I was doing mod graphs and I must’ve done it before, where it’s
almost like mod football where you have to put a graph that goes through a certain point and
then into a goal or go through two points then the goal, and because I had done that before I go
‘ahh yeah that’s really good’ and I do it again. But, it’s almost once I’ve planned my lessons I
don’t then, I would have to sit down and really think about it. So, for example iteration in C4 I
know that you can use iteration and do spider diagrams and step diagrams for iteration, but I
haven’t done that yet. So, you know they are still in the back of my mind, it’s something that I
need to improve but it’s just coming to it. You know, I might go oh I’m teaching tomorrow, oh
I’ve got that lesson that’s quite good rather than actually because I have to teach myself how to
use Autograph for that specific skill. You know, it’s not something that you can just pick up still
and go. So, I’m getting there I feel like I am slowly getting better. But, also, as well, especially
with A level, I find that I do it, I will do that lesson once a year say rotating something round the
149
x-axis. I know how to do it but then I have to remind myself oh how do you do that again, and it
takes a good 10-15 minutes even though I’ve done it 5 times before. I’ve only ever done it 5
times before, so I’m still forgetting how to use Autograph to rotate something round so it is still
a big hindrance. But, then sometimes it is worth the effort you know. Autograph is for that skill
rotating something, it does really visually show this is what’s happening”.
I asked Adam if in his last example about rotations he was referring to the volume of revolution, he
said: “Yeah, that’s what I mean. So, sometimes it is really worth doing and sometimes it’s just almost
like a gimmick. It depends on what you’re teaching I find”
The last two quotes from Adam reflect how his knowledge of the software influenced how often he
used it. He used it with resources or activities that he was already aware of and used before. But
he did not use it when such use was more challenging. In other words, when he did not remember
exactly how to use it or when he had to learn about or develop an activity himself. These two
situations are also relevant to teachers’ struggle with time and how they prioritize their work. The
priority and time are not easily given to tasks that do not follow the examinations style and
requirements, like in many cases with technology. Another aspect in these two quotes is about
Adam’s appreciation of the software. Adam expressed his appreciation of mathematics-education
software as visual mediators. But he also expressed that software use was “sometimes” worth
doing, so he did not always find it as useful, adding that it could be “like a gimmick”. These
comments go along with the way Adam described his use of technology once to me as mainly to
graph functions and offer visual representations to the students. Furthermore, his use of digital
resources other than the software, such as in the case of the race game, seemed “like a gimmick”
that kept the students engaged using questions that followed examinations styles and
requirements with Adam being the game master.
The three episodes above reflected Adam’s subject knowledge and knowledge of the software
(Autograph here), the latter was associated with specific mathematical topics. They also
showed him using students’ contributions and creating connections between resources in a
way similar to George’s. They reflected the influence of examination requirements on what
Adam knew and demonstrated in the lessons; and shed light on two contingent moments he
faced. For example, one contingent moment was reported in the lesson about simultaneous
equations; when a student asked about the use of modulus equations and Adam relied on
Google search to give an answer. One example of a possibly contingent moment was in the first
episode when the students integrated 2𝑥 − 10 , and decided that 25 was the constant of
integration. There is no evidence to suggest whether Adam expected this answer or not. There
150
is a chance that more contingent moments happened; but went unnoticed in cases where the
teacher responded confidently without showing or addressing what he did not expect.
Fourth teacher data - Charlie
Charlie was a mathematics teacher with twenty years of teaching experience, during which he
taught students aged 12-18 years. He had a BSc in mathematics and a PGCE in secondary
mathematics teaching. He was the head of mathematics at his school during the data collection.
The school he worked for provided interactive whiteboards, iPads for students’ use, and Explain
Everything (www.explaineverything.com) and Autograph software (www.autograph-
math.com).
Out of nine lessons observed for Charlie, episodes from four lessons have been selected to be
included in this chapter: two lessons on polynomials (lessons 5 and 8), one lesson on
transformations (lesson 9), and one lesson on tangent and normal lines (lesson 3). In the rest
of the lessons (about quadrilaterals and inequalities) either mathematics education software
was not used, or the teacher’s input was minimal and mainly students were practising and
solving questions.
Two Lessons on Polynomials
Lessons 5 overview
This episode includes an overview of one full lesson (fifth lesson) that was observed for Charlie.
The lesson was 50-minutes long and it was to teach a group of twelve year 12 students, namely
(GC1) about polynomials.
4.4.1.1.1 Episode 1- Homework
Charlie started this lesson by checking if students had any questions about their homework.
One question was related to the answer given at the back of the book (by Rayner and Williams
(2004)) of question 14. The teacher commented on that “some of us disagree with the answer
at the back of the book…. I don’t know what the issue is; but I don’t agree with them. It might
be that I am making error”. The teacher then collected the pieces of homework from the
students for him to mark and then moved to introduce a new chapter. Charlie relied on the
textbook as the source of exercises for homework (use of instructional materials); and the
choice of exercises for homework was set for the mathematics department. However, he was
identifying errors that were in the textbook and telling the students about these.
In relation to homework, Charlie commented:

151
“So, the way that we set up the homework here with the A level is we have a number of small
homeworks which I don’t take in. I’ll say you can look at this if you like, you can try some
questions but if you don’t say anything I won’t be chasing it up, so that would be let’s say exercise
7A I won’t take in 7B, I won’t take in 7C, the only exercise I will take in is called an assignment
and it’s a summary of the chapter. Now, those are formal pieces of work and they come in, so
in the meantime I am saying to them ‘look if you are completely fine with this and you think
you’ve got it then you’ve got other things to do, fine you’ve still got to do the assignment. If
you’re not so happy and you want to do some questions and you found a weird one here, then
I want to know about it’. So, that’s what that’s for and they know that’s the set up, and it’s really
good for us so it allows them to raise any problems that they find. In fact, I hope I’ve said to
them you know when you’re doing those questions, you really should be doing a couple just to
check you know what you are doing but then go find the weird ones because that’s where you
do the learning”.
This suggests how Charlie used homework to identify “weird” questions, and help the students
understand them. Students’ contributions are in this case are resources in the form of the
“weird questions” identified by students for Charlie to demonstrate. Charlie elaborated:
“that’s for you as a student to find what you can’t do so I can help you with it. But, without me
slogging through question 1 which they know is right, question 2 they know it’s right, and they
only want help with question 17. So, there is no point me marking all that stuff they should be
marking it ticking it and it’s only the stuff they can’t do that I’m interested in.”
This meant that students work on homework provided a resource that Charlie used to identify
what questions students found difficult. This is connection between resources (textbook
questions & students’ work on homework). In another comment about homework, Charlie said:
“well it’s actually almost always, it’s past A level questions. So, it’s a group of past A level
questions on that chapter on that topic”. We see here past-examination questions being used
as a resource.
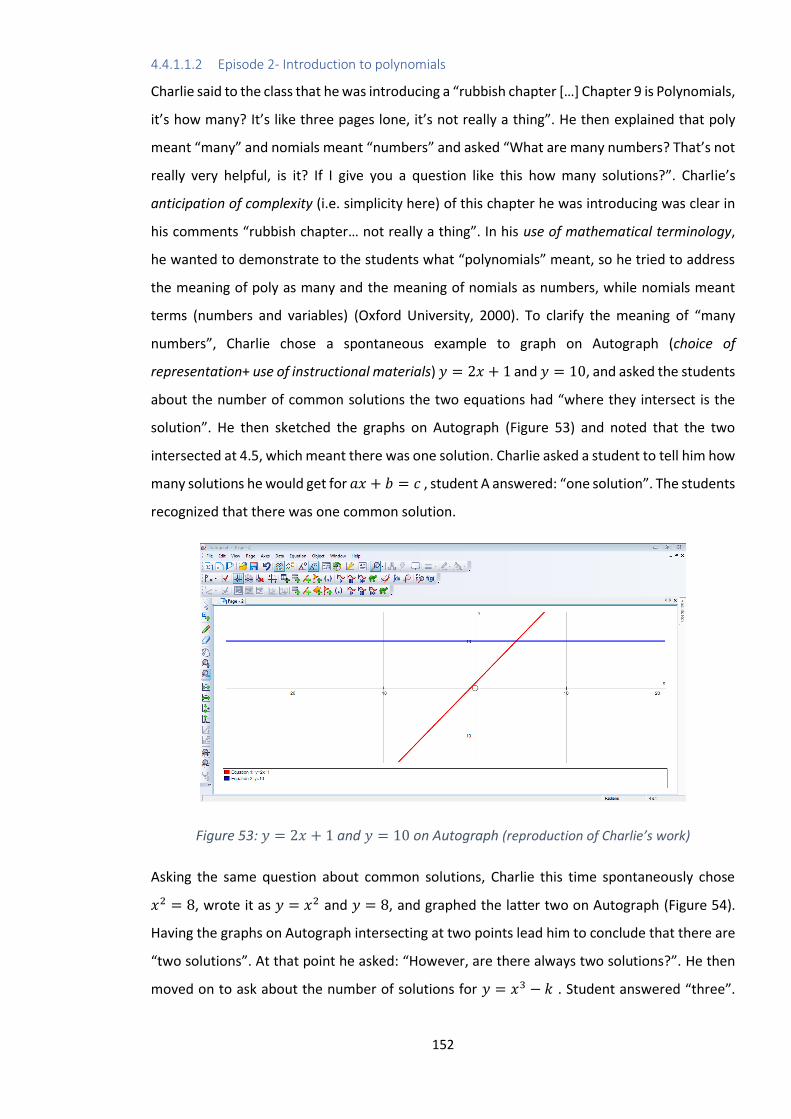
152
4.4.1.1.2 Episode 2- Introduction to polynomials
Charlie said to the class that he was introducing a “rubbish chapter […] Chapter 9 is Polynomials,
it’s how many? It’s like three pages lone, it’s not really a thing”. He then explained that poly
meant “many” and nomials meant “numbers” and asked “What are many numbers? That’s not
really very helpful, is it? If I give you a question like this how many solutions?”. Charlie’s
anticipation of complexity (i.e. simplicity here) of this chapter he was introducing was clear in
his comments “rubbish chapter… not really a thing”. In his use of mathematical terminology,
he wanted to demonstrate to the students what “polynomials” meant, so he tried to address
the meaning of poly as many and the meaning of nomials as numbers, while nomials meant
terms (numbers and variables) (Oxford University, 2000). To clarify the meaning of “many
numbers”, Charlie chose a spontaneous example to graph on Autograph (choice of
representation+ use of instructional materials) 𝑦 = 2𝑥 + 1 and 𝑦 = 10, and asked the students
about the number of common solutions the two equations had “where they intersect is the
solution”. He then sketched the graphs on Autograph (Figure 53) and noted that the two
intersected at 4.5, which meant there was one solution. Charlie asked a student to tell him how
many solutions he would get for 𝑎𝑥 + 𝑏 = 𝑐 , student A answered: “one solution”. The students
recognized that there was one common solution.
Figure 53: 𝑦 = 2𝑥 + 1 and 𝑦 = 10 on Autograph (reproduction of Charlie’s work)
Asking the same question about common solutions, Charlie this time spontaneously chose
𝑥2 = 8, wrote it as 𝑦 = 𝑥2 and 𝑦 = 8, and graphed the latter two on Autograph (Figure 54).
Having the graphs on Autograph intersecting at two points lead him to conclude that there are
“two solutions”. At that point he asked: “However, are there always two solutions?”. He then
moved on to ask about the number of solutions for 𝑦 = 𝑥3 − 𝑘 . Student answered “three”.
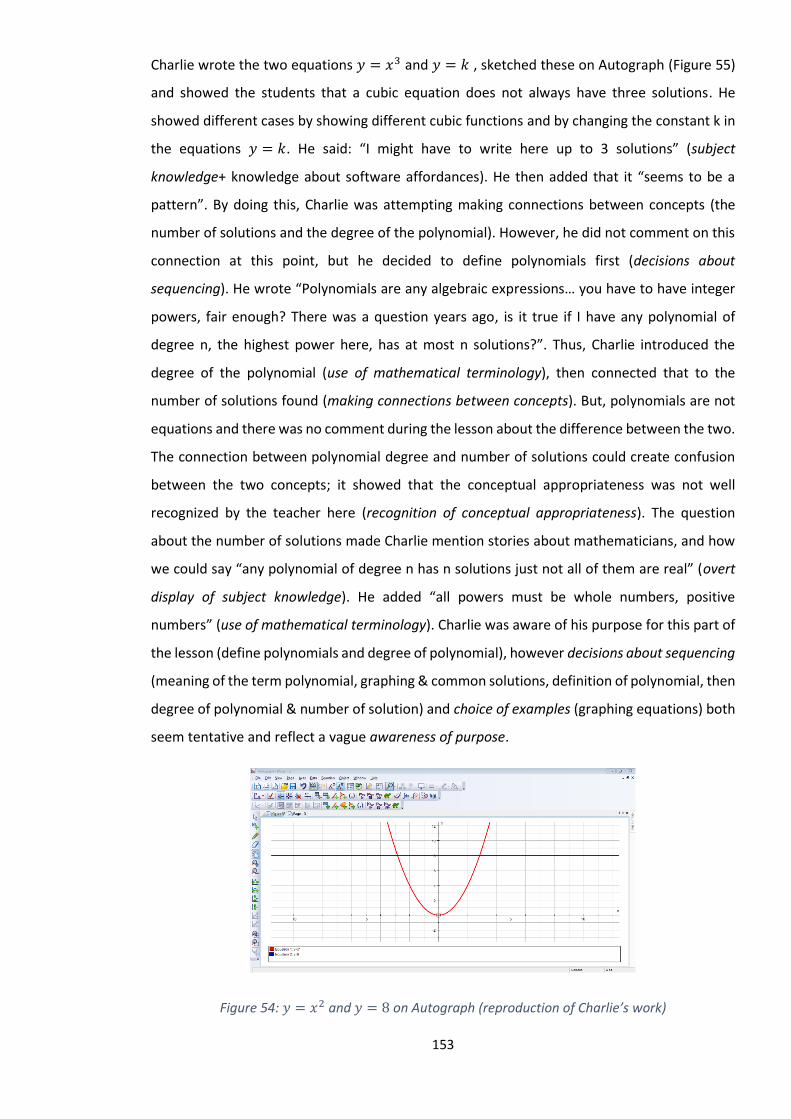
153
Charlie wrote the two equations 𝑦 = 𝑥3 and 𝑦 = 𝑘 , sketched these on Autograph (Figure 55)
and showed the students that a cubic equation does not always have three solutions. He
showed different cases by showing different cubic functions and by changing the constant k in
the equations 𝑦 = 𝑘. He said: “I might have to write here up to 3 solutions” (subject
knowledge+ knowledge about software affordances). He then added that it “seems to be a
pattern”. By doing this, Charlie was attempting making connections between concepts (the
number of solutions and the degree of the polynomial). However, he did not comment on this
connection at this point, but he decided to define polynomials first (decisions about
sequencing). He wrote “Polynomials are any algebraic expressions… you have to have integer
powers, fair enough? There was a question years ago, is it true if I have any polynomial of
degree n, the highest power here, has at most n solutions?”. Thus, Charlie introduced the
degree of the polynomial (use of mathematical terminology), then connected that to the
number of solutions found (making connections between concepts). But, polynomials are not
equations and there was no comment during the lesson about the difference between the two.
The connection between polynomial degree and number of solutions could create confusion
between the two concepts; it showed that the conceptual appropriateness was not well
recognized by the teacher here (recognition of conceptual appropriateness). The question
about the number of solutions made Charlie mention stories about mathematicians, and how
we could say “any polynomial of degree n has n solutions just not all of them are real” (overt
display of subject knowledge). He added “all powers must be whole numbers, positive
numbers” (use of mathematical terminology). Charlie was aware of his purpose for this part of
the lesson (define polynomials and degree of polynomial), however decisions about sequencing
(meaning of the term polynomial, graphing & common solutions, definition of polynomial, then
degree of polynomial & number of solution) and choice of examples (graphing equations) both
seem tentative and reflect a vague awareness of purpose.
Figure 54: 𝑦 = 𝑥2 and 𝑦 = 8 on Autograph (reproduction of Charlie’s work)
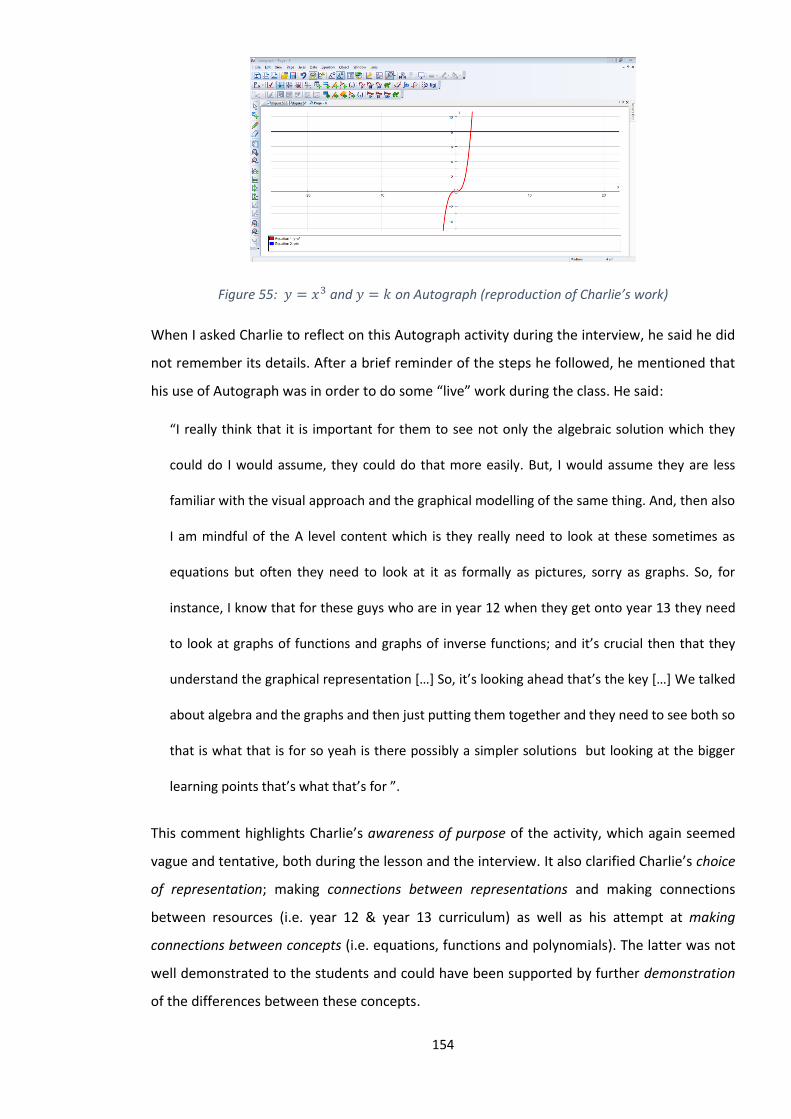
154
Figure 55: 𝑦 = 𝑥3 and 𝑦 = 𝑘 on Autograph (reproduction of Charlie’s work)
When I asked Charlie to reflect on this Autograph activity during the interview, he said he did
not remember its details. After a brief reminder of the steps he followed, he mentioned that
his use of Autograph was in order to do some “live” work during the class. He said:
“I really think that it is important for them to see not only the algebraic solution which they
could do I would assume, they could do that more easily. But, I would assume they are less
familiar with the visual approach and the graphical modelling of the same thing. And, then also
I am mindful of the A level content which is they really need to look at these sometimes as
equations but often they need to look at it as formally as pictures, sorry as graphs. So, for
instance, I know that for these guys who are in year 12 when they get onto year 13 they need
to look at graphs of functions and graphs of inverse functions; and it’s crucial then that they
understand the graphical representation […] So, it’s looking ahead that’s the key […] We talked
about algebra and the graphs and then just putting them together and they need to see both so
that is what that is for so yeah is there possibly a simpler solutions but looking at the bigger
learning points that’s what that’s for ”.
This comment highlights Charlie’s awareness of purpose of the activity, which again seemed
vague and tentative, both during the lesson and the interview. It also clarified Charlie’s choice
of representation; making connections between representations and making connections
between resources (i.e. year 12 & year 13 curriculum) as well as his attempt at making
connections between concepts (i.e. equations, functions and polynomials). The latter was not
well demonstrated to the students and could have been supported by further demonstration
of the differences between these concepts.

155
4.4.1.1.3 Episode 3- Introducing the adding, subtracting and multiplying polynomials
The next part of the lesson was about introducing how to add, subtract and multiply
polynomials and was done through the textbook. Charlie asked students to do exercise 9 in
Rayner and Williams (2004) “and see the questions you like, and go yeah I know that […] we
can go through the ones you don’t like”. We notice how Charlie here used resources (students
input regarding what they know how to do and the textbook) and connected these in order to
make decision about what questions to solve in class. Whenever Charlie solved questions on
the board, he was picking students to answer those questions and he was explaining ideas
when needed. He did some questions on the board and asked students to try to solve questions
independently then discuss them between each other. He again asked them to skip the
questions they find easy and do the ones that are “worth doing”. He then started asking
students to pick a question to do on the board. One student picked question F. The teacher
solved the question on the board and had students contributing to the answer. Thus, he used
students’ contributions as resources to solve questions on the board. These contributions were
used to help Charlie demonstrate how to add, subtract and multiply polynomials.
4.4.1.1.4 Episode 4- Time for practice
Students continued working independently and Charlie encouraged them to ask questions
(contributions as resources) when they needed. A student was confused when she saw
questions with function notation (Figure 56). Charlie commented:
“Have you heard of a function of x? … 4x+2 if x=1 y=6 if x=2 y=10 and so on. […] That is a function
of x. […] I called one function 4x+1 another function… I called that one f(x) […]. If I start with p(x)
it might stand for polynomial; […] lazy way to say polynomial […] Then say well…that is the graph
of the function, that’s the function”.
Here, Charlie attempted making connections between concepts (here the two concepts
polynomials and functions) following the textbook example. However, this connection was only
briefly demonstrated and was in response to a student question (students’ contributions as
resources).

156
Figure 56: Textbook question with function notation in Rayner and Williams (2004)
The second textbook question in Figure 56 included the use of simultaneous equations, so
Charlie commented that there are two variables and two pieces of information:
“so, this is sneaky cheeky simultaneous equations, you have two variables with two pieces of
information… I’ve got a function of x… if we multiply them together, we get ()(), expand… Shall
we do it the long way or the super quick way”.
The student asked for the quick way. Charlie said: “We only need information about the
coefficient of 𝑥3 and x”. Charlie was writing the terms that included 𝑥3 and x on the board
and asking for students’ contributions to the answer. He added: “We can group together all the
𝑥3 and all the x terms”. So, Charlie wrote that 3𝑎𝑥3 − 2𝑏𝑥3 = 6 and −2𝑎𝑥 + 3𝑏𝑥 = 1.
Charlie’s continued working on finding a and b and then finding the coefficient of 𝑥2. During
that work, he pointed at one student saying: “You’ve just made the face of understanding”. In
this work, we see Charlie making connections between procedures (multiplication of
polynomials + simultaneous equations) and showing concentration on procedures. We also
notice how “the face of understanding” was as a resource here for him to tell that the student
understood how to answer the question. Charlie continued responding to students’ ideas until
the lesson finished. In the post-observation interview, Charlie commented as follows:
“that’s because so that’s partly because I really want to celebrate this idea that in maths when
you’ve overcome a difficult task, and you’ve been in that uncertain area, it is a real joy and it’s
fleeting it doesn’t last for very long, but it’s a real joy to have overcome that. And I want to
celebrate that because again I don’t want them to just think that people who are possibly good
at maths just automatically get this and they don’t feel the same way, and it’s also partly because
yeah you’ve been in that zone of uncertainty whatever the phrase might be but you should go
through that period. So, it is worth celebrating when you come out. And, I may have said even
in the lessons, I’m not sure, and it’s because some said it to me we’re not sure in how many
157
other subjects do you get that … now it may happen in every other subject, but in maths I always
make a point in saying you don’t get that expression in many other subjects”.
Charlie’s experience in teaching (resource) made him feel that it was good to “celebrate”
“understanding” concepts in mathematics.
Episode 5- Lesson 8
This episode was also taken from a year 12 lesson on polynomials. The group that was taught
this lesson, let us call it here GC2 (with five students), was different from the group in the
episode before GC1. The lesson was the eighth lesson I observed for Charlie, and it was taught
without the use of Autograph.
Charlie started by solving question from the homework and he solved what he or the students
felt was challenging. Like in the previous episode, Charlie relied on the textbook for choice of
exercises for class practice and homework (use of instructional materials). However, he was
identifying errors that were in the textbook and telling the students about these.
He then moved to the new chapter “polynomials”; and said that the chapter was on three pages
explaining about polynomials. His teaching aims for the “polynomials” chapter was clear: “Say
what they are, then do addition and subtraction multiplication”. In his use of mathematical
terminology, he wanted to demonstrate what polynomials meant, so he asked: “what is
polynomial? Student S you've got up to two minutes to answer that. Anyway, what's
polynomial? what does poly mean?”. Student S answered “many”. Charlie asked “Nomial, what
does that mean?”. A student replied: “Poly means many, nomials means terms, many terms”.
Charlie wrote some spontaneous example and defined polynomials as a “collection of terms
but the terms have to have whole numbers powers, no negative powers and no fractions”
(decisions about sequencing). Afterward, he asked the students to do some textbook questions
(use of resources). He was asked if 7 is a polynomial and he said it was “because it could be
regarded as 7𝑥0” (subject knowledge). Then he introduced the meaning of “coefficient” (use of
mathematical terminology) as “the number and the sign”, pointing to some coefficients from
the examples he had on the board.
After that, students continued working on the textbook questions, and Charlie was answering
questions on the board whenever a student asked for help. Thus, he used students’
contributions as resources that indicated what needed further explanation. A question the
students needed help with was the same question Charlie solved in the previous episode

158
(question 2 in Figure 56); about finding the coefficient of 𝑥3. A student suggested to “times it
all out” and “put 6𝑥3” for the term with 𝑥3. Charlie agreed but added:
“How many pieces of information are you given? How many unknowns have you got? In your
experience in maths, if you have two pieces of information and two unknowns, when you have
two bits of information and two unknowns, we tend to solve these in what very very common
way to solve the question? Two equations and two unknowns?”.
A student said: “simultaneous equations” (making connections between procedures and
making connections between concepts). So, Charlie commented:
“this is a classic A-level set up: two equations two unknowns, expect simultaneous equations…
this is a classic A-level question, that is a challenging A-level question because you've got a’s and
b’s, but look at the individual elements they are all GCSE, put it together and it is an A level
question, and it is definitely a challenging question”
This reflects his consideration of examination requirements (i.e. A-level set up) and the
connections he created between resources (i.e. past-examination questions & textbook
questions, GCSE & A-level curricula). Charlie then demonstrated that students can either find
all terms (9 here) and then work out the coefficient of 𝑥3, or they could only look at the terms
with 𝑥3 and find its coefficient. He explained that although he “liked” the latter, there was
nothing wrong with the first way. A student commented that the first way was “more work”.
Charlie emphasized that he “should like” the first method as well. He also recommended what
he called “doctor A’s advice” which implied solving any question with unknown elements the
way you would solve it if those elements were known. The use of doctor A here seemed to
refer to advice on how to deal with A level examinations. Charlie and the class continued by
solving the question on the board, at the end Charlie commented: “None of the elements are
any more difficult than GCSE; but they are put together in such a way that it is difficult; it is a
big challenging A level question. None of the maths techniques is difficult”. Charlie then
mentioned what he called “doctors A's advice” which implied that solving A level questions was
like walking through a dark tunnel that you “cannot see” the end of it, unlike GCSE questions
where the “tunnel is straight” and you “see exactly where you can get to”. For that reason, it is
recommended that the students should do “the most obvious thing” (in this case to “expand
and factorise”) to solve A-level questions, to “eventually hit light at the end of the tunnel”. This

159
showed Charlie trying to create connections between GCSE and A level examination
questions (making connections between resources/ procedures). Students then continued
solving question from the textbook until the end of the lesson.
Using the Documentational Approach
Charlie’s resources in episodes 1 to 5 were: interactive white board, iPad, board, curriculum of
year 12, textbooks, past teaching-experience, students’ contributions, notebooks, Autograph,
and the school’s scheme of work.
Charlie’s scheme of work for lessons 5 and 8 are summarized in Tables 18 and 19 respectively.
His specific aim in both lessons was to introduce polynomials including their definition and
degree and how to add, subtract and multiply polynomials. His general aim was to prepare
students for examination.
His general rules of action included: to check homework; to introduce polynomials; to solve
some questions on the board with the help of students; students to work independently on
textbook questions; and to answer students’ questions on the board. In the first lesson on
polynomials, under the general aim “to introduce polynomials” there were specific rules of
action: to introduce the lesson topic; to explain the meaning of poly & nomial; to help students
discover how many solutions a polynomial can have using Autograph; to define polynomials;
to introduce the degree of polynomial and connect it with the number of solutions; to connect
polynomials and functions; and to introduce how to add, subtract and multiply polynomials. In
the second lesson, the specific rules of action did not include “to help students discover how
many solutions a polynomial can have using Autograph” or “to connect polynomials and
functions” but included all the rest. Charlie justified not using Autograph in the second episode
by the lack of time with the second group G2, as they were “behind”. And he did not talk about
functions because none of the students in this group asked him about functions, which
confirms his use of students’ questions as resources to build his demonstration on.
In the first lesson, Charlie’s operational invariants were general: school and parents expect
students will be given homework; after doing homework students come back with questions
they cannot do and need help with; Autograph is dynamic; visual and graphical representations
should be appreciated by students as well as algebraic ones; polynomials and function are
connected and it is good to talk about this connection in year 12.

160
Table 18: Charlie’s scheme of use in lesson 5
Scheme
Aims Rules of action Operational invariants Inferences
Specific: A1. To introduce
polynomials:
• definitions
• polynomial degree
• add, subtract and multiply polynomials
General: A3. To prepare students for exam
Specific: R1. Introduce the lesson topic: learning about polynomials R2. Explain the meaning of poly & nomial R3. Help students discover how many solutions a polynomial can have, using Autograph R4. Define polynomials R5. Introduce the degree of polynomial and connect it with the number of solutions R6. Connect polynomials and functions General: R7. Check homework R8. Introduce polynomials R9. Introduce how to add, subtract and multiply polynomials R10. Solve some questions on the board with the help of students R11. Enable student to work independently on textbook questions R12. Answer students’ questions on the board
General: O1. School and parents expect students will be given homework O2. After doing homework, students come back with questions they cannot do and need help with O3. Autograph is dynamic O4. Visual & graphical representations should be appreciated by students, as well as algebraic ones O5. Polynomials & function are connected, students will learn about functions in year 13. So, it is good to talk about this connection in year 12

161
Scheme
Aims Rules of action Operational invariants Inferences
Specific: A1. To introduce polynomials:
• definitions
• polynomial degree
• add, subtract and multiply polynomials
General: A4. To prepare students for exam
Specific R1. Explain the meaning of poly & nomial R2. Give some examples of polynomials R3. Define polynomials R4. Not use Autograph as this class is behind General R5. Check homework R6. Introduce polynomials R7. Solve some questions on the board with the help of students R8. Enable student to work independently on textbook questions R9. Answer students’ questions on the board
General O1. School and parents expect students will be given homework O2. After doing homework, students come back with questions they cannot do and need help with
Many students forget to add c the constant of integration
Table 19: Charlie’s scheme of use in lesson 8
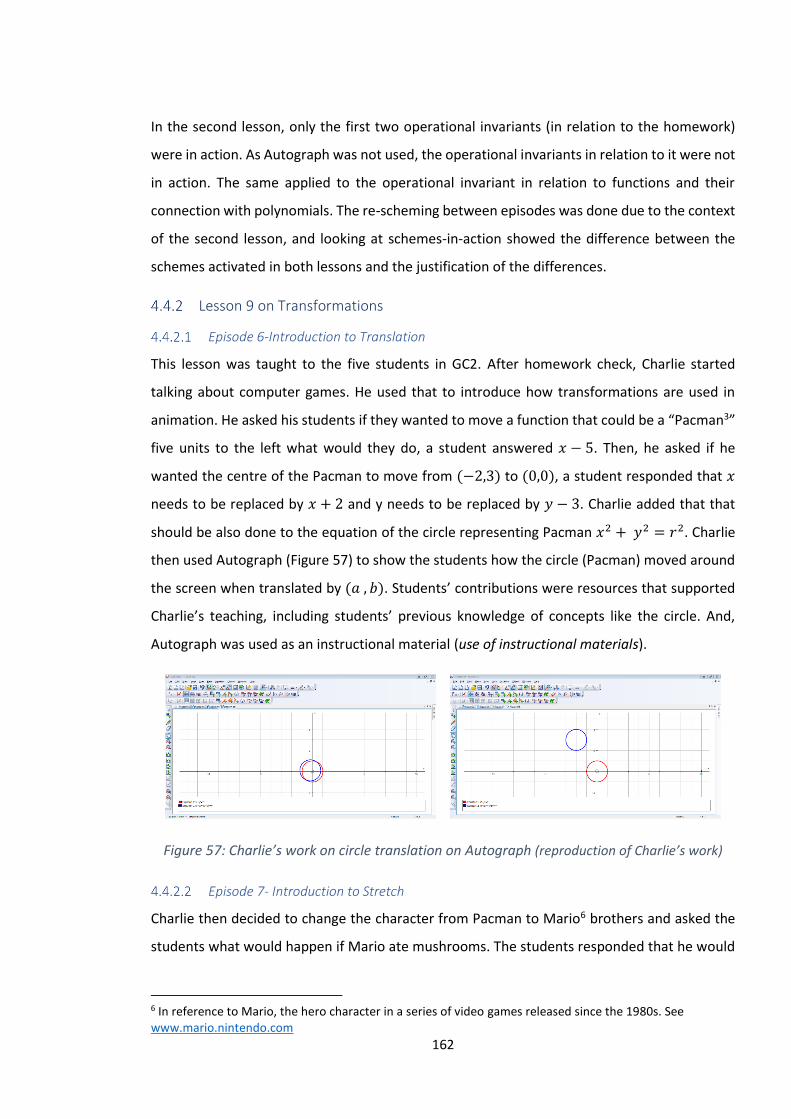
162
In the second lesson, only the first two operational invariants (in relation to the homework)
were in action. As Autograph was not used, the operational invariants in relation to it were not
in action. The same applied to the operational invariant in relation to functions and their
connection with polynomials. The re-scheming between episodes was done due to the context
of the second lesson, and looking at schemes-in-action showed the difference between the
schemes activated in both lessons and the justification of the differences.
Lesson 9 on Transformations
Episode 6-Introduction to Translation
This lesson was taught to the five students in GC2. After homework check, Charlie started
talking about computer games. He used that to introduce how transformations are used in
animation. He asked his students if they wanted to move a function that could be a “Pacman3”
five units to the left what would they do, a student answered 𝑥 − 5. Then, he asked if he
wanted the centre of the Pacman to move from (−2,3) to (0,0), a student responded that 𝑥
needs to be replaced by 𝑥 + 2 and y needs to be replaced by 𝑦 − 3. Charlie added that that
should be also done to the equation of the circle representing Pacman 𝑥2 + 𝑦2 = 𝑟2. Charlie
then used Autograph (Figure 57) to show the students how the circle (Pacman) moved around
the screen when translated by (𝑎 , 𝑏). Students’ contributions were resources that supported
Charlie’s teaching, including students’ previous knowledge of concepts like the circle. And,
Autograph was used as an instructional material (use of instructional materials).
Figure 57: Charlie’s work on circle translation on Autograph (reproduction of Charlie’s work)
Episode 7- Introduction to Stretch
Charlie then decided to change the character from Pacman to Mario6 brothers and asked the
students what would happen if Mario ate mushrooms. The students responded that he would
6 In reference to Mario, the hero character in a series of video games released since the 1980s. See www.mario.nintendo.com

163
“get bigger”. Charlie responded in an attempt to connect video games with the use of
transformations and specifically “stretch”:
“He gets bigger. So, let’s stretch Mario. Okay, Pacman never got stretched but let’s stretch
Mario. So, as you well know I am no computer programmer so I can’t, I haven’t got a Mario for
you although I suppose we could do this but I’m not going to. You’ve seen the Batman equation,
right? Have you seen the Batman equation? So, there’s a funky equation, bit of a long winded
one but we can stretch the Batman symbol. Okay, stretch it out that way stretch it out that way
Batman symbol. Have you seen the love heart equation? That’s quite nice. Have you seen the
love heart equation, no? I’ll have to find that for you sometime. There is an equation for a love
heart, so there is probably an equation for Mario. But, there’s Mario that’s the best I can do. So,
we are talking about transformation of a curve it doesn’t matter what the curve is. It’s the
principles that are important. So, it might be y= this, it might be what’s that wiggly one we did
the other day? you know do you remember we looked at a wiggly curve? Could be anything”.
Charlie’s talk about the batman equation and heart-shape equation was not supported by a
demonstration of what these were, which could be due to his lack of knowledge of the
equations.
Charlie then hand- sketched a “wiggly” curve on the board which had Autograph screen on
display (Figure 58). Charlie added:
“Now, we know how to move this about on the screen so let’s stretch it now. Now, has anyone
got an elastic band? Have you got one or a hair clip? Yeah, hair band yeah. Sorry, I’m not familiar
with these things. Now if you stretch something like an elastic band or a hair band I don’t know
if you’ve ever been aware of this but if I keep one end still if I keep that end still and it originally
looks like really exciting if it was this side and stretch it in the x direction scale factor two again
the point on the y-axis stays the same and it goes that way okay? Anything on that y-axis stays
the same the final thing is what if it straddles the y-axis stretches in the x direction scale factor
two. The points here don’t move but everything else gets doubled, okay. Now, I’ll give you some
more information about the stretch in the x direction, it’s going to involve the following, Okay,

164
so we’re going to look at a stretch in the x direction here is some random curve doesn’t matter
what it is okay. Any old random curve I don’t know what the equation is for that; but I don’t
really care [...] Now we will stretch it in that direction; but what does that mean? We’ll take
some points on whatever the curve is if we stretch it by scale factor say two in the x direction.
That simply means this start at the line x=0 which is all the y-axis here, measure the x distance
from there to the point that you are thinking of stretch scale factor to the x direction, means we
just double that distance and that distance was there […] so a stretch is quite specific thing,
probably something you’re familiar with I can do this for all the points”.
Figure 58: A hand-sketch by Charlie on the board with Autograph in the background, with bubbles
added to clarify what he wrote next to the graph
Charlie was demonstrating how to do the stretch by hand for some of the curve’s points (one
point at a time) and in his demonstration asking for students’ contribution to answer questions
about length, distance and scale factor. He was also making connections between
representations and procedures when he said:
“Now, graphically how do we get the stretch? How do we get Mario to double in height when
he eats the mushroom? So, algebraically how do we do this? And do you know, are you familiar
with this algebraically? Translation; replace 𝑥 with 𝑥 − 𝑘 and 𝑦 with 𝑦 − 𝑘. How do we do the
stretch and replace what with what?”.

165
To answer the question and demonstrate to the students, he decided to replace 𝑥 by 2𝑥 and
do it “free hand” and see what would happen. Charlie commented that the result was not what
the students expected: “It seems to have done a stretch, but it hasn’t changed the height at all
and it looks like to me that this point has come in here by what fraction? Probably a half I don’t
know”. Charlie checked for some points and commented that it “looks like all those distances
there look like they’ve been halved”. To give further examples about stretch factor, Charlie
decided to “play around” and try to replace 𝑥 by ½𝑥 this time. He commented that the
distances seemed to have “doubled”. He then he decided to consider 𝑘 and 1/𝑘 and asked the
student about the “rule”, which he confirmed was:
“Excellent, so what is our rule for a stretch in the x direction if we want to. If we want to stretch
anywhere in the x direction I’ve put a little star there because we need to clarify what that
actually means by a scale factor of two, three, four, five or 𝐾 then student I what do we do?”
The student responded that they would multiply by “one over the scale factor”. Charlie
approved:
“One over scale factor that’s a nice way to describe it. Then, we replace, this is how I think of it
but I’ll put yours in there as well we replace x with 𝑥/𝑘, that is actually how I think of it but you
actually said possibly something more helpful you said then we multiply the x term by 1/𝑘, good
stuff.”
Charlie continued demonstration and wrote the “rule” for a stretch in the y direction: “Replace
y with 𝑦/𝑘, or if you prefer multiply the 𝑦 term that’s quite a nice design I quite like that…”, he
meant here multiply 𝑦 by 1/𝑘. Thus, Charlie created a connection (i.e. 𝑥/𝑘 = 1/𝑘 𝑥 ). After
that, Charlie solved two examples on the board in which he applied the “rules” about
transformations.
In a comment about teaching transformations Charlie reflected on his previous experience of
teaching this topic:
“I really don’t like teaching that because I know having taught it for years students really
struggle. And when you’ve got it, it’s the simplest maths in the world. There is no maths to do,
but they struggle with it at GCSE. They see it in year 12, see it in year 13, they hate it every single
year”

166
Claiming that “there is no maths to do” in this chapter reflected how Charlie felt that
mathematics was linked with difficulty and that the easiness of this chapter implied that there
was “no maths” in it. His previous experience in teaching this topic was a resource that Charlie
used to make decisions about sequencing for the lessons on transformations. So, he would
introduce transformations to the students, then would dedicate a lesson for students to
practise solving questions on transformations independently:
“So, the next lesson I don’t intend to say anything really […] It’s all old school stuff. I remember
when the first video games came out and it was literally a pixel going across the screen. And,
that subject is so abstract and really dull. I always pull it back to those computer games and I
don’t think anyone is any more interested in it”.
When asked about his choice to sketch the graph by hand, although Autograph was available
and on, he justified that by saying:
“I want to focus on the idea rather than that equation. And, also having said all of this when I
get presented with a new function and very often in the exam they are just given y=f(x) and they
will have to manipulate y=f(x) so they do a stretch in the x direction they need to know that line
doesn’t change but this one if it’s a scale factor of half what’s the distance to the y axis. Its new
position will be there, so again that is modelling kind of what they will need to do in the exam
as well”.
Charlie’s focus on the idea here seemed a concentration on procedures. It reflected his
attention to examination requirement which was also mentioned in the interview:
“There are two possibly competing aspirations for a maths lesson, one is for me just to share the
experience the joy and the interest and the deductive reasoning and having time to do fun
activities and things I love to do all that and if I knew how to find the time to do all that I would
much rather do that than any exam. Okay, and in fact the whole school says we’re more than
exams. I also know which side my bread is buttered and for me I know that I have to deliver
outstanding results and we have done that. So, I think summer just gone before we had 85% A*
a level and we had other […] maths departments coming to see me to say well how are your
results so good. So, that definitely has a positive effect and I want to keep that. But, there is a

167
tension between what I would like to do which is maybe start an A level lesson with an
investigation bit of you know, it could be IT led, it could be classic sort of puzzles that you
rearrange on the table. But, I don’t know how to put all of those in and still cover all the material
that I want to cover without having lots more lessons and I don’t get more lessons. I put more
bids in for more lessons; but I don’t get them and I understand that. So, at the moment I run the
model just the best way I can which is there is a discrepancy between the two. What is going to
give, and for me and I am fully prepared to stand up and say I’m doing this wrong. But, I think
the exam results and the performance really are why the students have chosen the subject they
want to get to University. The parents want outstanding bragging rights for how their students
have got on. And, yeah if the head said to me look how about we prepare to reduce your maybe
attainment at the expense of greater enrichment; if it comes from the head I’ll do that. Whilst
it’s not coming from the head or the director of studies, then I will stick with this model because
I know it produces something but at A level the content is so heavy I personally can’t see how
to get through it otherwise”
This reflected the tension between Charlie’s aim to deliver outstanding examination results and
his aspiration to share the joy of mathematics with his students. Examination results took
priority in this case, and, based on that, Charlie balanced his use of resources.
Using the Documentational Approach
In episodes 6 and 7, Charlie’s resources included a rubber band and computer games, as well
as the resources he used in previous episodes. Charlie’s scheme of work for this lesson is
summarized in Table 20. His specific aim was to introduce transformations to his students
(translation and stretch for this lesson). His general aim was to prepare students for
examination. His specific rules of action were: to connect transformations with computer
games (Pacman and Mario); to demonstrate and introduce the rule for translation; to
demonstrate and introduce the rule for stretch. These were under the general rule of action:
to introduce transformations quickly. Other general rules of action include: solving some
examples on the board with the help of students, and for students to work independently on
textbook questions in the next lesson. The last general rule of action was justified by the specific
operational invariant: students do not like transformations, introduce it quickly and next lesson
is for students’ practice. This operational invariant was an inference from previous teaching

168
Scheme
Aims Rules of action Operational invariants Inferences
Specific:
A1. To introduce
transformations:
o translation
o stretch
o reflection
General:
A2. To prepare
students for exam
Specific:
R1. Connect transformations with computer games (Pacman
and Mario)
R2. Demonstrate and introduce the rule for translation
R3. Demonstrate and introduce the rule for enlargement
R4. Demonstrate and introduce the rule for stretch
General:
R5. Demonstrate transformation rules on the board
R6. Solve some examples on the board with the help of
students
R7. Enable students to work independently on textbook
questions in the next lesson
General:
O1. Students do not like
transformations, it is better to introduce
it quickly and leave the next lesson for
students’ practice
Table 20: Charlie’s scheme of work during his eighth lesson on transformations
169
experience that made Charlie feel that students do not like this topic; and it was best to give a
quick introduction to transformations and then leave students to practice independently. More
general operational invariant were identified in the interview including: Charlie’s personal
appreciation of the value of enjoying mathematics and enriching its teaching; his
considerations of time pressure and curriculum guidelines; his commitment to working in line
with the expectations of parents and head of school, which meant here a commitment to
delivering outstanding examinations results; his belief that having more mathematics lessons
per week would help him resolve the tension between teaching students mathematics that
they would enjoy and teaching to deliver excellent examinations results; and his understanding
that although his school expressed that they were not teaching just for examinations they still
needed to deliver excellent results.
Episode 8- From lesson 3
In this lesson, Charlie had only one year-12 student. He should have had four students, but
three of them were absent. The teacher decided to go on and teach because he was using a
software called Explain Everything, which worked as an online whiteboard and that could be
shared with his students (use of resources). This, in his view, would allow him to send his
students a summary of what was taught in that lesson.
The teacher was covering another teacher and was not sure what he was going to teach,
neither was the student aware of what she was taught the lesson before. However, with some
discussion the student could remember the chapter she was doing with the other teacher in
the previous lesson. So, the topic was decided to be on the equations of tangent and normal.
The student was asked to pick an exercise from the textbook that she found challenging
(students’ contributions as a resource), and so she did. The teacher started telling her about
what he called a “MANTRA” which was “ 𝑦 − 𝑦1 = 𝑚(𝑥 − 𝑥1) [he usually said it with a special
voice tone]”. He added: “You need to know two things which are a point and the slope which
you can usually get from differentiating the equation of the line”. The student then had to
practice solving another question on her own. Afterwards, she had a question about the
equation of the normal. At that point, Charlie tried to use Desmos to explain the idea to her,
but he could not because he was not familiar with the software (use of resources, knowledge
of the software). He then decided to use Autograph (use of resources) and showed the relation
between the tangent and normal using a quadratic function 𝑦 = 𝑥2 (Figures 59) and then
trigonometric function 𝑦 = 𝑠𝑖𝑛𝑥 (Figure 60); and commenting that it was “like a sailing boat”
(making connections between concepts). Charlie kept hinting and asking about how the slopes
of the tangent and normal lines would be related. He attempted hinting to the steepness of the

170
two lines in Figure 60-while he was dragging these on Autograph; and asking which was steeper
(the tangent or normal line) at different positions on the graphs and whether that would mean
a greater or smaller slope. But, the student did not spot the relation he wanted her to reach
between the slopes of the tangent and normal lines of a graph. So, Charlie’s attempt to
demonstrate the connection between tangent and normal of a line by making connections
between resources (Autograph and student contributions as a resource), was not successful.
This created a contingent moment that resulted from the unavailability of resources (student
contributions here). Charlie appeared responding to the unavailability of resources in this
moment by going back to telling the student explicitly about the connection between tangent
and normal. He said (referring to Figure 60):
Figure 59: Charlie’s display on the connection between tangent and normal of 𝑦 = 𝑥2
Figure 60: Charlie’s display on the connection between tangent and normal of 𝑦 = 𝑠𝑖𝑛𝑥
“As I drag this point, you can see the blue points [on the tangent line]… the purply [the normal
line] is always 90 degrees to it… Have you seen that? […] Imagine the blue line is just horizontal
so the purple line is?”
Charlie then asked the student if she knew how to work out the gradient of a function and
explained that when finding the gradient, one cannot divide by zero. He then stopped using
Autograph and said:
“Right, that was a bit getting off the track, what is the relationship connection between the
gradient and tangent and the gradient of the normal?... always at 90 degrees […] They are always

171
perpendicular to each other. And what does that mean if I give you a gradient of one of them?
[…] What if the gradient of the tangent was a fraction ℎ/𝑘?”
Student: −1, oh −𝑘/ℎ
Charlie: Fantastic, and I don’t know why 𝑘 and h, I remember a million years ago my teacher
used 𝑘/ℎ so I got stuck with those … this is the most useful thing about gradient. Two
perpendicular gradients multiply to get, take these two they multiply to?
Student: −1
Charlie: The other two?
Student: −1
Charlie: Good, flip it and change the sign. Shall we try a question now? Find the equation of the
normal; and at that point your brain should be going 𝑦 − 𝑦1 =…
Charlie’s moved from using graphs to show the connection between tangents and normal
(making connections between concepts) to using algebraic formulae (making connections
between procedures), including the use of a prescribed method i.e. “flip it and change the sign”,
with a connection between the two representation through his reference to the slope and
steepness on a line (making connections between representations). This was a safe zone for
Charlie to move to, after the contingent moment that resulted from the use of technology.
Using the Documentational Approach
Charlie did not have a pre-prepared scheme of work. So, he devised a scheme of work
(summarized in Table 21) during the lesson based on his previous experience. His resources
included: Explain Everything, students’ contributions, Autograph, Desmos and the textbook.
His aim was to teach about tangent and normal lines. His rules of action included: inviting the
student to choose a textbook exercise that she found challenging to be solved on the board;
using an activity on a software to explain the connection between normal and tangent lines of
a graph; explaining the connection between tangents and normal algebraically; then, asking
the student to work independently. His operational invariants included: students can follow
what they missed by looking at Explain Everything summary; students would remember better
if the “MANTRA” is said in a special tone during the lesson. One inference could be in relation
to the use of software; it seemed that Charlie felt more comfortable using Autograph than
Desmos for this lesson.

172
Scheme
Aims Rules of action Operational invariants Inferences
Specific: A1. To explain about normal and tangent lines
General: A2. To prepare students for exam
Specific:
R1. Invite students to choose a textbook exercise that she found challenging to be solved on the board
R2. Use an activity on a software to explain the connection between normal and tangent lines of a graph
General: R3. Solve some examples on the board with the help of the student R4. Allow student to work independently on textbook questions in the next lesson
R5. Explain the connection between tangents and normal algebraically
R6. Ask the student to work independently.
General:
O1. Students can follow what they missed by looking at Explain Everything summary
O2. Students would remember better if the “MANTRA” is said in a special tone during the lesson.
I1. To use Autograph rather than Desmos
Table 21: Charlie’s scheme of work during his third lesson on tangent and normal lines

173
Discussion and Summary In the episodes above, we see how Charlie’s resources included the interactive whiteboard, board,
Autograph, Desmos, Explain Everything, iPad, textbook, homework policy, curriculum, examination
requirements, past teaching experience, notebooks, and the school’s scheme of work for
mathematics teaching. Having examinations requirements and school’s and parents’ expectations
about homework as resources, reflected Charlie’s attention to examination and school policy. His
attention to examination requirements was reflected in his comments about how A-level questions
are formed and their connection with GCSE questions, through doctor A’s advice. His commitments
to institutional policies and factors were evident during the interview when he expressed
operational invariant including: appreciation of the value of enjoying mathematics and
enriching its teaching; considerations of time pressure and curriculum guidelines; commitment
to working in line with the expectations of parents and head of school; his belief that having
more mathematics lessons per week would help him resolve the tension between teaching
students mathematics that they would enjoy and teaching to deliver excellent examinations
results; and his understanding that although his school expressed that they were not teaching
just for examinations they still needed to deliver excellent results. The code “adhere to
examination requirement” does not come up in Charlie’s data as under Contingency. But his
commitment to examination requirements was apparent throughout his teaching, for example, in
his use of hand sketching in the third episode.
Charlie used students’ contributions as resources in two ways: first to answer questions he
prepared or from the textbook; and, second to demonstrate ideas (like with the polynomials). The
first way, implied that Charlie’s demonstration was to some extent dependent on students’
contributions. For example, the student question about the function notation in the first episode
initiated a difference in the scheme between the first and the second episodes. The second way in
relation to demonstrating ideas was within Charlie’s comfort zone and under his control. Charlie’s
use of students’ contributions as resources did not reflect confidence in having higher chances of
Contingency. His way seemed closer to Adam’s; while George seemed more open to work live with
his students in different and several scenarios. However, Charlie had to work live in his last episode
where the scheme of work was very dynamic because it was not pre-prepared and relied heavily
on students’ contributions.
Charlie also connected between resources in a way that helped him demonstrate ideas. For
example, he tried to connect stretching a hair band with the activity on stretch he did on the
board and with the algebraic “rule” in relation to stretch. The episodes also showed how he
was making connections between representations (algebraic and graphic in the episodes on
transformation). In the eighth episode, Charlie tried to create connection between student

174
contributions and his work on Autograph but that did not work and created a moment of
Contingency where student contribution was not available.
Charlie’s knowledge of the software he used (Autograph) was essential for him to create such
connections and to demonstrate ideas, like what he did in the first episode on polynomials.
However, the connection Charlie tried to create during the first episode on polynomials
between the intersection points of two equations on Autograph and the degree of polynomial
was superficial and confusing. His knowledge of Autograph use in relation to the topic of
polynomial did not seem well-established. This could explain why he did not use the same
activity in episode 2 on polynomials, and did not remember it in the interview. The third
episode showed Charlie using the pen to sketch a graph and stretch it on the board (Figure 58),
in order to demonstrate about stretch to the students. In the eighth episode, Charlie did not
know how to use Desmos and his use of Autograph was not well-integrated within the lesson
and led to a contingent moment. From the interview, it seemed that Charlie appreciated hand
sketching because it was the way the students would use in the examination. In general, Charlie
used Autograph (use of instructional materials) to help students visualize graphs and supported
the demonstration (like in the episode on transformation). It was not used to create discussions
or initiate conversations with the students.
The three episodes above reflected Charlie’s subject knowledge and knowledge of the software
(Autograph here). They also showed him using students’ contributions and creating
connections between resources and reflected the influence of examination requirements on
Charlie’s teaching. One contingent moment was reported in these episodes (in episode 8). That
moment resulted from the unavailability of resources (student’s contribution). Charlie’s
commitment to a specific teaching style that is highly dependent on the textbook and on what
he described as a “repertoire of resources” that he established over the years of his teaching
reduced the likelihood of contingent moments in his lessons.

175
Findings and Conclusion
In this chapter, I first focus on the findings and on answering the research questions of this
study. Then I overview this study’s contribution to theory, its limitations, future research, and
implications for policy and practice. I also summarize my personal reflections on conducting
this study.
Overview of findings
This section draws a view based on the five themes addressed throughout the analysis of the
data from the four participants: students’ contributions as resources; examination
requirements; connections between resources; knowledge of the software; contingent
moments. I then aim to answer the research questions of this study. First, I include a general
discussion of the five points based on the differences and similarities among the four teachers,
in relations to the five points. Some of the similarities and differences have been mentioned
briefly in the individual teacher’s data discussion; here all of them are summarized within the
next five subsections.
Students’ contributions as a resource
Students’ contributions seemed to represent an important part of a teacher’s resources. The
Documentational Approach lens facilitated seeing these contributions, which are part of the
social interactions, as a resource (Gueudet & Trouche, 2009) that had a great impact on the
schemes of work the teachers followed. Data from the four participants showed evidence of
this use. Each of the four participants followed an approach in which he invited students to
participate in a way that supported his plan for the lesson, but the teachers’ approaches to
using students’ contributions as resources had some differences. George invited them to
participate by giving him answers that he expected and used to demonstrate concepts and
create discussion in the class (in episode 6 on iteration, for example, he asked for the different
rearrangement of one equation). He also invited such contributions to answer practice
questions on the board. Martin’s use of students’ contributions was different; he did not use
these to create discussions. Instead, he only invited students to contribute after he finished his
usually brief demonstration and gave the students the time to practice working independently
on some exercises. Then, he would listen to the students’ questions, and he would use these
questions to decide what ideas to demonstrate on the board; what to demonstrate to
individual students or groups, and what did not need further demonstration. Adam, like
George, used students’ contributions as resources to support his demonstration or to answer
exercises on the board. But, in the data I observed, Adam’s use of students’ contribution to

176
support his demonstration was less frequent than his use of those contributions to support
answering exercises on the board (two out of the six lessons included using students’
contributions to support the demonstration of mathematical ideas, compared to six out of the
six lessons that included the use of students’ contributions for solving exercises on the board).
Charlie sometimes used students’ contributions to support his demonstration; he also used
them to help solve exercises on the board. Like Martin, he used students’ contributions,
specifically questions here, to find out which ideas needed further explanation from the
teacher. I noted that the use of students’ contributions as resources was directed to working
on the applications and/or the meaning of mathematical ideas to different degrees among the
teachers. George’s use of these resources tried to balance between considering both the
introduction of new mathematical ideas and their meaning, and their application to solve
exercises. Martin’s was focused on the application. Charlie’s and Adam’s focused on both giving
higher priority to applications in exercises compared to George, within the lessons included in
this study.
Based on the differences addressed in the previous paragraph, these contributions were in
three forms: contributions invited by the teacher to help solve questions on the board;
contributions invited by the teacher to support demonstration of new ideas; students’
questions on a new concept that would lead the teacher to demonstrate ideas to one student
or to the class. In what follows I summarize what each of these forms include.
• Contributions invited by the teacher to help solve questions on the board
The four teachers used these contributions to solve questions on the board for practice, and
one can see instances of that in almost all episodes. Whenever any of the four participants was
solving a question on the board, he asked for students’ contributions to help with the work.
These resources give the teacher indications about the students’ progress. Inviting students to
contribute to the solving process is a way to keep the students’ engaged; assess their progress;
and, give them feedback.
• Contributions invited by the teacher to support demonstration of new ideas
This includes the use of students’ contributions to demonstrate ideas and their meaning to the
class, instead of relying on demonstration done solely by the teacher. It seemed that using
students’ contributions to demonstrate new ideas was less common in the data than the other
two forms. We see instances of it in some of George’s work, in his lesson on trigonometry and
in his episode on iteration (episode 6). We also see that in Adam’s first and second episodes.
Also, Charlie tried to use his student contribution in his eighth episode to demonstrate the

177
connection between the normal and tangent equations, based on his work on Autograph.
Charlie’s attempt was not successful as the student did not reach the conclusion he wanted her
to reach (i.e. the normal and tangent lines are perpendicular).
• Students’ questions on new concept that would lead the teacher to demonstrate ideas to
one student or to the class
In some of the episodes, the teacher would try to minimize his demonstration time, by giving a
brief introduction to the concept (or just the procedure) and then asking the students to
practice solving exercises independently from the teacher. The teacher would then explain the
ideas the students’ ask about during their independent work. This was the case in the second
participant’s (Martin’s) lesson. Also, Charlie followed a similar strategy in episode 5 when he
explained what polynomials are, and then asked his students to work on the textbook questions
and tell him which questions they wanted to see on the board. Charlie completed the questions
the students felt they needed help with on the board. This form of contribution gives the lesson
a dynamic flow that is dependent on what students ask about. But, this dynamic flow is usually
within the teachers’ range of expected scenarios.
Examination requirements and other institutional factors
Also, in relation to resources, institutional factors, and specifically examination policy and
school policy had great contribution to teaching approaches. One can see how examination
requirements and past-examination papers were resources that the four teachers used. The
teachers even expressed the importance of these during the interviews. All four teachers
considered requirements as important. They all used past-examination papers as resources.
Some of them commented even on the examination’s mark scheme. For example, when Adam
(in his second episode) justified the need to add c, the constant of integration, by mentioning
that those who do would lose one mark in the examination. The use of past-examination papers
was because the students encouraged that, according to George and Charlie, to get some
practice for the examination. Examination requirements had impact on the teachers’ decisions
on what to explain (or not explain) in their lessons based on examination requirements. Due to
their commitment to these requirements, teachers’ knowledge seemed to some extent
bounded by these. This led to contingent moments in which the teachers backed away from
answering questions because they were not required in the examination and they did not know
how to answer them. One example of this is in George’s seventh episode when a student asked
him a question he could not answer, and he said it was not required in the examination. A
second example is in Martin’s lesson on the volume of revolution, when he did not create a
178
connection between the activity he showed on GeoGebra and the formula for volume of
revolution. His justification of that was based on that the work on GeoGebra was not required
in the examination. There is a difference between the influence of examination requirements
in the two examples. In the first, George was trying to address connections between ideas that
were not required in the examination (e.g. rotation on Autograph and the formula of volume
of revolution). However, he did not know the answer to the student’s question, so he used
examination requirements as the reason not to answer that question. While in Martin’s case,
Martin was pre-decided that such a connection (between the rotation on GeoGebra and the
formula of volume of revolution) was not important because it was not required in the
examination. So, he did not even try to address it when he was questioned by one student
about this connection. Martin’s use of technology was focused on displaying a shape (circle,
then trapezium) and their rotations and playing these in the background while the students
were working on applying the formula to solve exercises from the textbook.
Teachers’ knowledge of the software
This is important specifically in relation to the taught content, and it increases the teacher’s
confidence in using software in practice. Such knowledge is what made George do the activity
on trigonometry in his characteristic lesson. Due to the lack of such knowledge of Desmos,
Charlie could not use Desmos to do his activity in episode 8 on the normal and tangent lines.
While he could do the same activity on Autograph which he was familiar with. I note that
teachers’ knowledge of the software varied among the four participants. George seemed the
most confident when using Autograph within the range topics he introduced during this study.
Martin was not familiar with Autograph, he said he was familiar with GeoGebra. However, his
use of GeoGebra seemed procedural and did not support the construction of mathematical
meaning. For example, when he used GeoGebra in the volume of revolution lesson, his work
on GeoGebra seemed to the students disconnected from the formula they were learning. Adam
was familiar with Autograph and he used it to support his demonstration about integration.
But, he said that when he used Autograph in other lesson, his use was to graph functions only.
Charlie tried to use Desmos once, but he did not manage to. Then, he said he was not familiar
with it. So, he moved to use Autograph. This use was for graphing functions mainly. Charlie’s
knowledge of Autograph did not seem to support the integration of the software affordances
in the demonstration. For example, in episode 7, with Autograph on the board he hand-
sketched on a function on the board and transformed some of its points one by one by hand.
Also, in his first lesson on polynomials, his use of Autograph seemed tentative and was not well
integrated within the lesson.

179
Connections between resources
These are the connections a teacher creates or tries to create between some of the resources
available to him during a lesson in order to achieve a specific purpose. The purpose is usually
to support the introduction of new concepts or procedures. From the data, I note that all four
participants tried to create such connections. George’s connections between resources
seemed well-thought and balanced in some of his lesson (the lesson on trigonometry for
example), but not so well-thought in others (in episode 2 on volume of revolution for example).
For the other three participants, these connections were less frequent and mostly to explain
the application of a procedure or formula in exercises. For example, Martin did not create
connections between the volume of revolution activity on GeoGebra and the students’ work
on the volume of revolution formula on the worksheet he prepared.
The data showed that connections between resources could be crucial for the flow of the
lesson, and if they are not created, or vaguely created, the flow of the lesson can be affected.
For example, having not created connection between resources (prepared task and GeoGebra
activity), Martin tried to focus on the formula of volume of revolution and its application in
exercises. This confused the students who questioned this connection but did not elicit a
response. In contrast, the connections created in George’s lesson on Trigonometry, when he
connected students’ contributions with Autograph helped the students deduce the
trigonometric formula under scrutiny. George also connected between resources (students’
contributions, Autograph) in his sixth episode on iteration in section 4.1.5. Also, he connected
between resources (Autograph, textbook, previous experience of teaching the same topic,
formulae) in the episodes on volume of revolution. Adam’s connection in the differentiation
lesson (between students’ contribution and Autograph) is another example that supported
students’ learning (about integration in this case).
Contingent moments
All four teachers had moments of Contingency. Some moments were tricky to identify as
contingent or not, due to the expectancy element not being confirmed by the teacher. An
example of this is in George’s trigonometry lesson, when he was asked about having a tangent
in an exercise, instead of sine or cosine. Among the four teachers, Charlie was the one who
would have fewer contingent moments because he was following a specific and well-controlled
teaching approach during his lessons. The only contingent moment noticed in his lessons was
due to his attempt to use Autograph to demonstrate about the equations of tangents and
normals. His reaction was to go back to his telling and prescription of methods approach with

180
which he felt more secure. On the other hand, George’s openness to use students’
contributions as resources at different stages of the lesson lead to more contingent moments.
The latter case reflected confidence in working live with students, even with spontaneous
examples. Martin tried to avoid contingent moments by giving a limited and brief
demonstration, mostly based on the applications, and then, leaving the students to do the work
on exercises, during this work he would answer students’ question individually first. This meant
that he would have the chance to decide whether the question would be explained on the
board or not. Adam showed more confidence with demonstrating for longer and discussing
questions on the board. However, he did not reflect as much confidence as George to work live
with students. I noticed that some contingent moments were the result of students asking
questions that were not included in the plan, and some resulted from not knowing how to use
the software for the teaching of a specific idea. Based on that, it can be argued that contingent
moments may result from students asking questions that are not included in the examinations
and/or curriculum, or not knowing how to use a mathematics-education software for the
teaching of a specific content.
Answering the research question
The five points above has enabled me to answer the research questions of this study as detailed
below. The answer to the main research question is done through answering two sub-
questions:
RQ: How do secondary mathematics teachers work with resources including technology in their
classroom?
i. What are the teachers’ resource systems and schemes of work?
ii. How do they enact their schemes of work in class?
The two sub-questions were identified having in mind the theoretical framework of this study:
the Documentational Approach and Knowledge Quartet. These two lenses afforded a broader
view on teaching approaches by focusing on the more general aspects (i.e. resources, scheme
of work) as well as the detailed actions (i.e. Foundation, Transformation, Connection and
Contingency). They facilitated answering my main research question, by offering me the tools
to form and answer the two sub-questions.
In response to the first sub-question, this study offered views of teachers’ schemes of work
during lessons and their reflections on these in post-observation interviews. It afforded looking
at all aspects of schemes: resources, rules of actions, operational invariants and inferences. The
181
study highlighted the resources, used by the participants. These resources included both paper-
based and digital resources including for example a textbook and mathematics-education
software. Common resources between the four participants include students’ contributions to
the lessons, examination requirements and past-examination papers. Three of the four
participants used the mathematics-education software Autograph, while one used GeoGebra
although he had access to Autograph as well. The rules of actions the teachers had in their
schemes always included giving the students’ time to practice solving exercises independently.
Two of the teachers (Martin and Charlie) used this time for independent practice to get
questions from the students and demonstrate ideas further based on these questions. In the
four cases, students’ contributions added a dynamic factor to the lesson’s rules of action. In
terms of the operational invariants, one common operational invariant between the four
participants was related to their appreciation of the software affordances. However, this
appreciation did not always lead to well-integrated use of the software which can be attributed
to the teachers’ knowledge of the software in relation to the mathematical content they taught
in a specific lesson. Another common operational invariant is about connecting new
mathematical concepts with previous knowledge. Inferences varied depending on the topic
and did not always occur.
In response to the second sub-question, I will summarize here some aspects in relation to how
the teachers enacted their schemes of work at upper secondary level, and specifically when
digital resources were used along with other resources. The data showed the teachers using
students’ contributions as a resource along with other resources to demonstrate ideas; to
support the application of procedures and formulae; or to find out what needed further
explanation by the teacher. This implies that in the context of upper secondary mathematics
teaching, the code “use of instructional materials” under the Transformation dimension, could
be extended to “use of resources” in order to shed light on students’ contributions as a
resource. The study showed that teachers’ knowledge included knowledge of examination
requirements and school policy as well as knowledge of any software used for teaching
mathematics. So, this encouraged the addition of two new codes to the Foundation dimension
“knowledge of examination requirement and school policy” and “knowledge of the software”.
The study also offered a view on how teachers connected between different resources
including students’ contributions, to make their lessons more comprehensible to the students.
This led me to suggesting the code “connection between resources” to be added under the
Connection dimension. Also, the contingent moments identified in this study included some
that resulted from the teacher being exposed to question that are not required for the

182
examination, or from the teacher not knowing how to use the mathematics-education software
for a specific purpose dependent on the lesson context. This in turn inspired the possibility of
adding one code to the Contingency dimension “adhering to examination requirements”.
Generally, in order to enact their schemes of work, the teachers were trying to balance their
resources and to prioritize all the time. The balance or unbalance was evident when
mathematics-education was used along with other resources. In such cases, the teachers
needed to make decisions about how much time they devoted to working on activities on the
software when the activities were not directly included in the examination. Similar issues
related to time pressure were reported in Bretscher (2014). The balance was also dependent
on students’ contributions, which meant it was dynamic and changing. This dynamic nature
inspired the definition of a “scheme-in-action” as the scheme that is activated and applied
during a lesson, and is usually dependent on the context and the available resources. Teachers
also needed to change schemes from one lesson to another on one topic, due to inferences in
one lesson or to other institutional factors. Changing or amending a scheme from one lesson
to another is called here “re-scheming” whether it is done due to inferences, institutional
constraints or even new resources that become available to the teacher.
In summary, the overview of the five points revealed some aspects of teachers practices and
knowledge-in-action, which in turn inspired some theoretical findings. These theoretical
findings are discussed in the following section.
Contribution to theory
The use of the two lenses (the Documentational Approach and the Knowledge Quartet) in this
work highlighted the following aspects in relation to the theories used: suggestions of new
codes for the Knowledge Quartet; the definition of scheme-in-action; and the definition of re-
scheming. In this section, I outline these three aspects and connect them to theoretical
frameworks and constructs, I then discuss how the use of the two lenses facilitated these
findings and enriched the analysis.
Suggestion of new codes to the Knowledge Quartet
The discussion of the main five themes in Table 7 inspired some suggestions in relation to the
codes of the Knowledge Quartet in the context of using technology for secondary mathematics
teaching. New codes or extensions of existing codes are suggested below, this resulted from
the context of the data and from looking at the data using the Documentational Approach as
well as the Knowledge Quartet. First, this study included data in which technology was used,
this facilitated viewing additional issues related to the use of technology for teaching secondary

183
school mathematics. In relation to the teachers’ knowledge, this encouraged the consideration
of TPCK by (Mishra & Koehler, 2006; Shulman, 1986), instead of Shulman’s (Mishra & Koehler,
2006; Shulman, 1986) categorization of knowledge that was originally considered by Rowland
et al. (2009). Second, the suggestions resulted from the use of the Documentational Approach
which afforded a broader view on resources that included social and institutional resources
(Gueudet & Trouche, 2009). Although adding new codes to the Knowledge Quartet might
overload it (by increasing the number of codes from 22 to 26), I find these codes crucial in the
context of this study. The suggestions in relation to the codes are:
• Use of resources
The use of students’ contributions as resources in most of the episodes, supports the “use of
resources” as a possible code under the Knowledge Quartet instead of “use of instructional
materials” under Transformation dimension. This is not a completely new code, but it extends
an existing code. “Use of resources” affords looking at teachers’ interactions with students
which is a significant aspect of teaching. I envisage that it would, in future research, facilitate
the inclusion of other social interactions as resources; such as conversations with other
teachers or teacher assistants.
• Connections between resources
Rowland et al. (2009) suggest that the connection dimension reflects essential connections that
are required to achieve progression in learning. In the context of this study, ‘connection
between resources’ seems to be one of these essential connections. So, I tentatively suggest it
as a code under the Connection dimension. ‘Connections between resources’ concerns the
connections a teacher creates or tries to create between different resources available to
her/him in order to achieve her/his teaching aims during a lesson. Those aims can be about
supporting the introduction of mathematical meanings, or about their applications.
Connections between resources can affect the delivery of the teaching aims and the flow of
the lesson, as the flow of the lesson can be disturbed if such connections are not well-created
(as noticed in Martin’s lesson).
• Adhering to examination requirements
This is a code suggested under the Knowledge Quartet Contingency dimension, to help analyze
moments in which the teachers cannot answer students’ questions and justify that by the fact
that the questions asked are not required in the examinations. An example of this was in
George’s data, in the episode 7 which was on volume of revolution. Another example was in
Martin’s lesson, when Martin did not connect his use of GeoGebra with the formula of volume

184
of revolution, because GeoGebra use was not required in the examination. Jaworski and Potari
(2009) suggest that when alerted to classroom tensions, teachers tend to draw “attention to
the so-called unchangeable factors which include school and educational systems” (p.234),
including examinations systems. Such attention or adherence can be more visible with classes
closer to taking external examinations (Ruthven et al., 2008), such as the Year 13 classes
presented in the data. “In those cases involving older classes closer to external examinations,
the emphasis was on avoiding student work with the software or making it manageable, and
on structuring dynamic geometry use more directly towards standard mathematical tasks”
(Ruthven et al., 2008, p. 315).
• Knowledge of examination requirements and school policy (or knowledge of curricular and
institutional policies)
Examination requirements is one aspect of teachers’ knowledge, it helps teachers prepare
students for the examination by addressing how examination questions are phrased and
formed. These include “grading and testing practices” (Engeström, 1998, p. 76). From the
episodes in this study, sharing this aspect of knowledge with the students was done by all the
four participants who also reflected on it as a fundamental practice that is even required by
students. School policy is also one institutional aspect that affects teachers’ choices (Bretscher,
2014; Jaworski & Potari, 2009). For example, in relation to the homework in Charlie’s case and
in relation to the school website in Martin’s case. Both examination requirements and school
policy are in the seven categories of Shulman’s knowledge base: examination requirements as
part of curricular knowledge; and school policy as part of knowledge of educational contexts
(Shulman, 1987). Jaworski and Potari (2009) point to teachers’ tendencies to consider and draw
on the different elements of the educational and institutional systems. Engeström (1998)
referred to:
"grading and testing practices, patterning and punctuation of time, uses (not contents) of
textbooks, bounding and use of the physical space, grouping of students, patterns of discipline
and control, connections to the world outside the school, and interaction among teachers as
well as between teachers and parents." (p.76)
He considered these important factors that impact on classroom practices, and on making
sense of these practices. Supported by these theoretical arguments and the evidence from the
data, I propose “Knowledge of examination requirements and school policy” as a code under
the Foundation dimension.

185
• Knowledge of software
This is an essential aspect that facilitates the use of mathematics-education software for
mathematics teaching. This aspect is not included in Shulman’s categorization of knowledge,
which was the basis of the knowledge Quartet codes. But, it is an important aspect of Mishra
and Koehler (2006) TPCK, which informs the addition of the “knowledge of software” code.
Mishra and Koehler (2006) argue for the need of such knowledge and add that “thoughtful
pedagogical uses of technology require the development of a complex, multifaceted, and
situated nature of this knowledge” (p.1017).This knowledge is in-action in one lesson in relation
to the taught content or the topic of the that specific lesson, where “content, pedagogy and
technology” interplay (Mishra & Koehler, 2006, p. 1017). The episodes in this study showed
cases of when teachers knew how to use a software for specific content, for example George
and Adam had some knowledge about how to use Autograph to talk about integration
(specifically the constant of integration c). Charlie did not know how to use Desmos in episode
8 (about normal and tangent lines), but he knew how to use Autograph for that purpose.
However, even his use of Autograph was not fully integrated within the lesson and the student
did not seem to reach the conclusion he aimed for her to reach regarding the connection
between tangent and normal equations. These examples show how digital resources: add to
the complexity of teaching (Fuglestad et al., 2010); can lead to hiccups (Clark-Wilson & Noss,
2015) or contingent moments (Rowland et al., 2015); and interplay with teachers’ professional
knowledge (Gueudet & Trouche, 2009). Hence, I suggest that the analysis of this aspect of
teachers’ knowledge can be supported by adding the code “knowledge of software” under the
Foundation dimension.
Scheme-in-action
The use of the Knowledge Quartet in this study afforded looking at the details of the teachers
work in class. This included a view of their “knowledge-in-action” (Rowland et al., 2005, p. 261),
which led to a detailed consideration of what the teachers did in class and why they did it, and
how they interacted with their students. The combination of such a view with the view through
the Documentational Approach lens, afforded looking at “schemes-in-action”. A clear example
of a scheme-in-action is the scheme followed by Charlie in his two lessons on polynomials,
specifically in his last rule of action in the scheme where he answered students question on the
board. It was noticed that the different questions asked by the students in the two lessons led
Charlie to focus on different ideas in his demonstration. So, in the first lesson on polynomials
he connected these with function, because a student asked about the relation between the
two. While in the second lesson he did not mention that connection, because the students did

186
not ask about it. This was not done in the second lesson, although Charlie addressed the
importance of this connection during the interview. In other words, Charlie’s scheme-in-action
in his first lesson on polynomials included answering students’ questions on the board and
those questions made him explain the connection between polynomials and functions.
However, the same rule of action “answering students’ questions on the board” did not lead
him to the same demonstration in the second lesson, where the students did not inquire about
such connection. So, although Charlie was following the same general rules of actions, some
specific rules of action (in this case creating a connection between functions and polynomials)
was not activated or applied.
Therefore, inspired by Rowland’s knowledge-in-action (Rowland et al., 2005), a scheme-in-
action is the scheme activated and applied during a lesson. It is documented based on the steps
the teacher does in class. A scheme-in-action of a lesson on a specific topic can slightly differ
from one lesson to another on the same topic, without any intentions from the teacher to
amend or modify the scheme. Instead, the slight differences or changes are ‘live’ and in
response to the available resources within the lesson (for example students’ contributions).
Based on that, scheme-in-action sheds light on the dynamic nature of schemes of work that
teachers follow.
Re-scheming
The use of the Documentational Approach lens in this study afforded looking at the changes in
the teachers’ schemes of work from one lesson to another, in other words “re-scheming”
(Kayali & Biza, 2018a). Rescheming involves amending the scheme from one lesson to another
on the same topic. It can be a result of an inference the teacher reaches in one lesson and
decides to act on by changing his scheme for the next lessons on the same topic. For example,
in George’s three lesson on volume of revolution, George re-schemed his second lesson based
on his experience in the first lesson. In his second episode, he tried to use Autograph to explain
the formula of volume of revolution. But, he did not feel that his students could see the link
between the activity on Autograph and the formula of volume of revolution. Due to the activity
not working as he expected, George decided not to use it for that purpose in his third episode,
and to use an image from the textbook instead. The Documentational Approach facilitated
seeing the inference George reached based on his experience teaching the second episode,
and this inference led him to avoid using Autograph to explain the formula for volume of
revolution in his third episode on volume of revolution. It seems that the inference in this case
became an operational invariant later, with the teacher believing that relying on the textbook
187
image to explain the formula was better than “anything” he could use on Autograph. Another
example is in Charlie’s rescheming between his two lesson on polynomials. His first lesson’s
scheme included using Autograph to introduce polynomials; while his second lesson did not.
This was justified by him by the lack of time in the second lesson. So, he had to re-scheme
because the second group was “behind” in terms of the curriculum.
Therefore, inspired by the definition of “re-source” in Adler (2000, p. 207), re-scheming is
defined as scheming “again or differently” from one lesson to another on the same topic. It can
be justified by inferences from previous lessons (like in the example from George in the
previous paragraph). Also, justified by institutional factors (like time constraints in the example
from Charlie in the previous paragraph). I conjecture that rescheming can also happen due to
the teacher having access to a new resource that s/he decides to integrate in lessons.
The use of Documentational approach in tandem with the Knowledge Quartet
Overall, looking at the data from the four participants through two lenses, showed how the
findings from each of these lenses supported and complemented the finding from the other.
On one hand, the Documentational Approach lens afforded looking at the students’
contributions as resources; looking at institutional factors including examination requirements
and past-papers; and looking at teachers’ schemes of work in the lesson. It also afforded
looking at the changes in the schemes of work from one lesson to another, in other words “re-
scheming” (Kayali & Biza, 2018a) and was justified by the inferences or time constraints. For
example, in George’s three lesson on volume of revolution, George re-schemed his second
lesson based on his experience in the first lesson (i.e. his use of Autograph did not help explain
the formula of volume of revolution). The Documentational Approach allowed me to see the
inference the teacher reached based on his experience teaching the first lesson, and this
inference led him to avoid using Autograph to explain the formula for volume of revolution in
his second lesson. In summary, the First and Second points of the findings (i.e. students’
contributions as a resource, and examination requirements and school policy) were provoked
by the use of the Documentational Approach.
The use of the Knowledge Quartet afforded looking at the details of the teachers work in class.
This included a view of their “knowledge-in-action” (Rowland et al., 2005, p. 261), which led to
a detailed consideration of what the teachers did in class and why they did it, and how they
interacted with their students. The combination of this with the view through the
Documentational Approach lens, afforded looking at “schemes-in-action”. A clear example of
a scheme-in-action is the scheme followed by Charlie in his two lessons on polynomials,

188
specifically under his general rule of action “to answer students’ questions on the board” in the
scheme (summarized Tables 18 and 19) where he answered these on the board. I noticed that
the different questions asked by the students in the two lessons led Charlie to focus on different
ideas in his demonstration. So, in the first lesson on polynomials he connected these with
function, because a student asked about the relation between the two. In the second lesson,
he did not mention that connection, maybe because the students did not ask about it. This was
not done in the second lesson, although Charlie addressed the importance of this connection
during the interview. The difference between the two lesson’s schemes was not due to re-
scheming, but due to specific ideas (here connection with functions) being in-action due to the
resources (students’ contribution) available in that lesson (responding to the (un)availability of
tools and resources). Re-scheming is a pre-decided scheming done by the teacher (like when
Charlie decided not to use Autograph in his second lesson on polynomials due to time
constraints), while scheming-in-action is giving a scheme a dynamic dimension by allowing it to
vary from one lesson to another based on students’ contributions for example.
In summary, the use of the Documentational Approach and Knowledge Quartet afforded a
broader view on teaching approaches by focusing on the more general aspects (i.e. resources,
scheme of work) as well as the detailed actions (i.e. Foundation, Transformation, Connection
and Contingency). The findings were based on five points: students’ contributions as a
resource; examination requirements and school policy; knowledge of the software; connection
between resources; and contingent moments. This led to three main findings. First, the
suggestions of new codes for the Knowledge Quartet including: use of resources (under
Transformation), knowledge of examination requirements (under Foundation), knowledge of
software (under Foundation), connections between resources (under Connections). Second,
the definition of scheme-in-action as the scheme that is activated and applied within a lesson.
Third, the definition of re-scheming as to scheme again or differently from one lesson to
another on one topic. These theoretical contributions are accompanied by the contributions to
practice that I summarize next.
Implications for policy and practice
This work sheds light on aspects of practice including teachers’ resources, schemes of work,
knowledge-in-action (through the Knowledge Quartet’s Foundation, Transformation,
Connection, and Contingency), scheme-in-action, re-scheming. In other words, it offered a view
on what resources teachers used and how they used them. It took a holistic view on resources
using the definition from Adler (2000) adopted by Gueudet & Trouche (2009) that lead to

189
including students’ contributions as a resource. And, facilitated a view on how teachers
integrated resources in their lessons and how they (un)balanced their resources while they
were enacting their schemes of work. This (un)balance can be a learning example for other
teachers. In other words, the critical incidents in the teaching episodes in this study can be
developed into teaching scenarios to be used for professional development and teacher
training sessions (Biza et al., 2007; Goodell, 2006; Tripp, 2012). For example, the trigonometry
episode from George’s data was used as a base to create three tasks (trigonometry 1,
trigonometry 2 and trigonometry 3) and Adam’s third episode on modulus equations was used
to create one task (on simultaneous modulus equations) under the MathTASK project (Biza et
al., in press; Biza et al., 2007), these tasks are available on the MathTASK website under the
technology and resources strand ("MathTASK- Technology and resources," 2017). Personally,
as a mathematics teacher, each of these examples is a rich learning example that will inform
my future teaching practices. As a new researcher, these examples and findings will enlighten
my future research as I explain in section 5.6.
In relation to the use of mathematics-education software, this study supports previous
research findings in Bretscher (2014) and Trouche and Drijvers (2014) that such use is still
limited. It seems that the “integration of digital technology into classroom practice is also
subject to political, social and cultural factors related to mathematics, digital technologies and
to teaching and learning” (Hoyles & Lagrange, 2009, p. 351). This was evident in the data
through the teacher-centered uses of software, for example in Martin’s lesson. In the data,
there were frequent references to institutional dimensions influencing teachers’ decisions
about such use including time pressure, curriculum and examinations requirements.
Consequently, an institutional acknowledgement of well-established mathematics-education
software uses is the way promote such use. (Vale, Julie, Buteau, & Ridgway, 2009) suggest that
the “implementation of mathematics afforded by digital technologies is more likely to occur
when and where there is a shared vision among political leaders, education authorities,
mathematicians and mathematics teachers” (p.357). A similar conclusion, specifically about the
use of dynamic geometry software, was suggested by Ruthven et al. (2008):
“… explicit curricular recognition is required for the use of dynamic geometry as a disciplinary
tool, and for the need for students to develop an associated instrumental knowledge, if dynamic
geometry is to move from being a marginal amplifier of established practice to become a more
integral organiser of a renewed practice of classroom mathematics” (p. 315)

190
However, these implications do come with the limitations I summarize in the next section.
Limitations One limitation in this study is related to the fifth point of the findings, contingent moments. It
was not always possible to decide whether a specific moment is contingent or not. This was
because the teacher did not show that it was an unexpected moment, although it resulted from
a student contribution that could have been unexpected. One example is in the George’s
characteristic lesson on trigonometry, when he was asked about the tangent case after he
taught the sine and cosine cases. George seemed confident in his answer, so it was not possible
to decide whether he expected this question or not. Talking to the teacher straight after the
lesson could have helped identifying if a moment like this was a contingent or not. But, due to
how busy teachers’ timetables were, this was not practically possible. And to ask about it in the
post-observation interview would not have been helpful as the teacher would not have
remembered the exact moment. This is in fact a second limitation of this study, as pre- and
post- lesson interviews would have helped in having further views of what the teachers planned
to do during the lessons and what they actually did. But, in relation to both of these limitations,
the question is: would asking the teacher about whether s/he expected the question or not
have helped identify more contingent moments?
A third limitation is related to the methodological approach of this study. Specifically, there are
chances that my own views and biases and the theoretical lenses that informed this study have
influenced my analysis of the data. These subjectivities cannot be eliminated, but “it is
important to identify them and monitor them in relation to the theoretical framework and in
light of the researcher’s own interests, to make clear how they may be shaping the collection
and interpretation of data” (Merriam & Tisdell, 2016, p. 16).
A fourth limitation is related to the use of semi-structured interviews for data collection, which
meant a “greater degree of latitude […] and a need to understand the context and content of
the interview” (May, 2010, p. 135). This means that there are chances of the latitude not being
fully exploited, for example, by asking further questions on the content or context. Finally, due
to the use of case study, further work needs to be done to validate any generalisations from
this data set.
The fifth limitation is related to the analysis of the data set of this study. The data included the
teachers using special expressions, gestures and voice tones to express ideas and give their
students hints and reminders about the topics they were teaching. The two theoretical
191
frameworks used in this study facilitated limited analysis of these. A discursive analysis would
afford commenting further on the fine details of the use of words and gestures in the data.
Future research In future research and with the use of more data, further examination of the theoretical
findings of this study will help validate and/or refine the findings. The suggestion of new codes
to the Knowledge Quartet is one aspect that needs further validation and refining. This may
include amending the suggested new codes to include more cases. Another aspect is related to
looking at further cases of scheming-in-action and/or rescheming to refine the definition of
these terms and look at diverse scenarios that include them. Future research can also look
further at the teaching episodes in this study and create more tasks to be used for professional
development and teacher training (for example, under the MathTASK project (Biza et al., in
press; "MathTASK," 2016), or even to create teaching scenarios for students to learn from and
reflect on. Finally, research using a theory that affords a more micro analysis of the data set in
this study would be helpful to uncover the aspect of the teachers’ expressions, phrases,
gestures and voice tone and how these contributed to the teaching/learning process.
Personal reflections The journey of this work has been a treasured one for me. The diverse learning experiences I
have had since I joined the UEA as a PhD student are experiences to cherish. Academically,
doing this research gave me the opportunity to further learn about research in education, and
specifically mathematics education research. In my first year, reading about different theories
in mathematics education and education enriched my knowledge in this field. Specifically,
when I thought about how these theories would have worked in situations when I was the
teacher. Some theories and theoretical constructs have become ‘alive’ and impacted on how I
saw daily events that are not related to teaching. For example: I see resources in different
contexts with a broader view; and the instrumental approach’s instrumentation/
instrumentalization are applicable to every tool in daily life. Progressing through the years of
my PhD studies, I participated in UK-based and European conferences on mathematics
education including: the 10th Congress of the European Society for Research in Mathematics
Education (CERME 10); the 11th Congress of the European Society for Research in Mathematics
Education (CERME 11); the 9th British Congress on Mathematics Education (BCME 9); and the
42nd Conference of the International Group for the Psychology of Mathematics Education (PME
42). For each of these conferences I co-authored a paper, presented it, and reviewed papers
written by other researchers in mathematics education. The papers I presented in these
conferences reported on different stages of this study and allowed me to hear feedback from
192
researchers in mathematics education and develop my work accordingly. I also attended
meetings with the research in mathematics education group at UEA regularly. These meetings
have offered me invaluable chances for sharing experiences: to hear about the work of other
group members, and to get advice on my own work. My study period at UEA was heightened
through my participation as a research associate in two research projects, MathTASK
(www.uea.ac.uk/education/mathtask) and CAPTeaM (www.uea.ac.uk/capteam). The two
projects gave me opportunities to meet practicing teachers; listen to their reflections on
teaching practices; join workshops for teachers and/or researchers; take part in publications
relevant to the two projects (e.g. (Biza et al., in press)); work with a team of teachers and
researchers on task development for MathTASK; and develop my views on teaching
mathematics for students with diverse needs.
In relation to my teaching practice, the experience I had during this research study made me
reflect on teaching situations that my participants went through and also on situations I have
been through. Each moment I spent in class observing a participant was a learning experience
for me, and I believe this will have long term impact on my future teaching practices.
Additionally, during my study period I had the opportunity to work as an associate tutor for
some sessions both at masters and undergraduate levels. This gave me the chance to work on
planning and delivering lectures and seminars, and on the marking of assessments of masters
and undergraduate students. In relation to research practices, conducting the study was an
eye-opener for me on the challenges faced by researchers. This include the challenges related
to: choosing a theoretical framework, ethics and getting ethical approval for the study,
recruiting participants, dealing with the participants throughout the study, collecting data,
organizing data, and the lengthy process of analysing data. These challenges helped in refining
my skills as a new researcher. Overall, this work has impacted hugely on different aspects of
my life and inspired me to look forward to further work in research as well as teaching.

193
References
Adler, J. (2000). Conceptualising resources as a theme for teacher education. Journal of
Mathematics Teacher Education, 3(3), 205-224.
Adler, J., Ball, D. L., Krainer, K., Lin, F., & Jowotna, J. (2005). Reflections on an emerging field:
researching mathematics teacher education. Educational Studies in Mathematics, 60(3),
359–381.
Ainley, J. & Pratt, D. (2005). Dynamic Geometry in the Logo Spirit. In Moving on with dynamic
geometry: Extending learning in mathematics using interactive geometry software (pp.
20-25). Derby: The Association of teachers of Mathematics.
Ainley, J. & Pratt, D. (1996). The Construction of Meanings for Geometric Construction: Two
Contrasting Cases. International Journal of Computers for Mathematical Learning, 1(3),
pp. 293-322.
Arafeh, S., Smerdon, B., & Snow, S. (2001). Learning from teachable moments: Methodological
lessons from the secondary analysis of the TIMSS Video Study. Paper presented at the
Annual Meeting of the American Educational Research Association, Seattle, WA.
AS and A levels. (2019). Retrieved from https://www.nidirect.gov.uk/articles/as-and-a-
levels#toc-2
Ball, D. L. (1988). Research on Teaching Mathematics: Making Subject Matter Knowledge Part
of the Equation. Retrieved from
https://search.ebscohost.com/login.aspx?direct=true&db=eric&AN=ED301467&site=ed
s-live&scope=site
Ball, D. L., Thames, M. H., & Phelps, G. (2008). Content knowledge for teaching. Journal of
teacher education, 59(5), 389-407.
Battey, D., & Franke, M. L. (2008). Transforming identities: Understanding teachers across
professional development and classroom practice. Teacher Education Quarterly, 35(3),
127-149.
Biza, I., Joel, G., & Nardi, E. (2015). Transforming trainees’ aspirational thinking into solid
practice. Mathematics Teaching, 246, 36-40.
Biza, I., Kayali, L., Moustapha-Corrêa, B., Nardi, E., & Thoma, A. (in press). Sharpening the focus
on mathematics: Designing, implementing and evaluating MathTASK activities for the

194
preparation of mathematics teachers. In V. G. Elias (Ed.), A Formação Matemática na
Licenciatura em Matemática: Problematizando Conteúdos e Práticas.
Biza, I., Nardi, E., & Joel, G. (2015). Balancing classroom management with mathematical
learning: Using practice-based task design in mathematics teacher
education. Mathematics Teacher Education and Development, 17(2), 182-198.
Biza, I., Nardi, E., & Zachariades, T. (2007). Using tasks to explore teacher knowledge in
situation-specific contexts. Journal of Mathematics Teacher Education, 10(4-6), 301-309.
Biza, I., Nardi, E., & Zachariades, T. (2009). Teacher beliefs and the didactic contract on
visualisation. For the learning of Mathematics, 29(3), 31-36.
Bretscher, N. (2014). Exploring the quantitative and qualitative gap between expectation and
implementation: A survey of English mathematics teachers’ uses of ICT. In A. Clark-
Wilson, O. Robutti, & N. Sinclair (Eds.) The Mathematics Teacher in the Digital Era (pp.
43-70). Springer, Dordrecht.
Bruce, C. D., & Hawes, Z. (2014). The Role of 2D and 3D Mental Rotation in Mathematics for
Young Children: What Is It? Why Does It Matter? And What Can We Do about It? Zdm,
47(3), 331-343.
Butler, D. (2012). Douglas Butler Uses Autograph to Explore the Geometry of
Calculus. Mathematics Teaching, 229, 44-46.
Carrillo-Yañez, J., Climent, N., Montes, M., Contreras, L. C., Flores-Medrano, E., Escudero-Ávila,
D., Vasco, D., Rojas, N., Flores, P., Aguilar-González, Á., & Ribeiro, M. (2018). The
mathematics teacher’s specialised knowledge (MTSK) model. Research in Mathematics
Education, 20(3), 236-253.
Carrillo, J. (2011). Building mathematical knowledge in teaching by means of theorised tools.
In T. Rowland & K. Ruthven (Eds.), Mathematical Knowledge in Teaching (pp. 273-287).
Springer, Dordrecht.
Clark-Wilson, A. (2013). Learning to use new technologies: Embrace those lesson hiccups – Part
2. Mathematics Teaching, 236, 31-33.
Clark-Wilson, A., & Noss, R. (2015). Hiccups within technology mediated lessons: a catalyst for
mathematics teachers’ epistemological development. Research in Mathematics
Education, 17(2), 92-109.
195
Cohen, D. K., Raudenbush, S. W., & Ball, D. L. (2003). Resources, instruction, and
research. Educational evaluation and policy analysis, 25(2), 119-142.
Collopy, R. (2003). Curriculum materials as a professional development tool: How a
mathematics textbook affected two teachers' learning. The elementary school
journal, 103(3), 287-311.
Corcoran, D., & Pepperell, S. (2011). Learning to teach mathematics using lesson study. In T.
Rowland & K. Ruthven (Eds.), Mathematical knowledge in teaching (pp. 213-230).
Springer, Dordrecht.
Cyrino, M. C. D. C. T. (2018). Prospective Mathematics Teachers’ Professional Identity.
In Strutchens, M. E., Huang, R., Potari, D., & Losano, L. (Eds.), Educating Prospective
Secondary Mathematics Teachers (pp. 269-285). Springer, Cham.
Denzin, N. K., & Lincoln, Y. S. (2013). Strategies of qualitative inquiry / (Fourth edition.). SAGE,
Los Angeles.
Dolonen, J. A., & Ludvigsen, S. (2012). Analyzing Students' Interaction with a 3D Geometry
Learning Tool and their Teacher. Learning, Culture and Social Interaction, 1(3-4), 167-182.
Drijvers, P., Kieran, C., Mariotti, M. A., Ainley, J., Andresen, M., Chan, Y. C., Dana-Picard, T.,
Gueudet, G., Kidron, I., Leung, A., & Meagher, M. (2009). Integrating technology into
mathematics education: Theoretical perspectives. In C. Hoyles & J.-B. Lagrange
(Eds.), Mathematics education and technology-rethinking the terrain (pp. 89-132).
Springer, Boston, MA.
Engeström, Y. (1998). Reorganizing the motivational sphere of classroom culture: An activity -
theoretical analysis of planning in a teacher team. In F. Seeger, J. Voigt & U. Waschescio
(Eds.), The culture of the mathematics classroom (pp. 76-103). New York: Cambridge
University Press.
Ernest, P. (1989). The knowledge, beliefs and attitudes of the mathematics teacher: A
model. Journal of education for teaching, 15(1), 13-33.
Falbel, A. (1991). The Computer as a Convival Tool. In I. Harel and S. Papert (Eds),
Constructionism: Research Reports and Essays, 1985-1990 (pp.29-37), New Jersey: Ablex
Publishing Corporation.
196
Fuglestad, A. B., Healy, L., Kynigos, C., & Monaghan, J. (2010). Working with Teachers: Context
and Culture. In C. Hoyles & J.-B. Lagrange (Eds.), Mathematics Education and Technology:
Rethinking the Terrain: The 17th ICMI Study (pp. 292-310). Dordrechet, The Netherlanads:
Springer Science+Business Media LLC, 2010.
Goldstein, R. & Pratt, D. (2003). Teaching the Computer. In J. Way & T. Beardon (Eds), ICT and
Primary Mathematics (71- 90). Maidenhead: Open University Press.
González-Martín, A. S., Nardi, E., & Biza, I. (2018). From resource to document: scaffolding
content and organising student learning in teachers’ documentation work on the
teaching of series. Educational Studies in Mathematics, 98(3), 231-252.
Goodell, J. E. (2006). Using critical incident reflections: A self-study as a mathematics teacher
educator. Journal of Mathematics Teacher Education, 9(3), 221-248.
Goos, M. (2013). Sociocultural perspectives in research on and with mathematics teachers: a
zone theory approach. ZDM, 45(4), 521-533.
Grading and Marking of A-levels. (2019). Retrieved from http://www.a-levels.co.uk/grading-
and-marking-of-a-levels.html
Gueudet, G. (2017). University teachers’ resources systems and documents. International
Journal of Research in Undergraduate Mathematics Education, 3(1), 198-224.
Gueudet, G., Buteau, C., Mesa, V., & Misfeldt, M. (2014). Instrumental and documentational
approaches: from technology use to documentation systems in university mathematics
education. Research in Mathematics Education, 16(2), 139-155.
Gueudet, G., & Trouche, L. (2009). Towards new documentation systems for mathematics
teachers?. Educational Studies in Mathematics, 71(3), 199-218.
Gueudet, G., & Trouche, L. (2011). Teachers’ Work with Resources: Documentational Geneses
and Professional Geneses. In G. Gueudet, B. Pepin, & L. Trouche (Eds.), From Text to
'Lived' Resources Mathematics Curriculum Materials and Teacher Development (pp. 23-
41). Dordrecht: Springer, New York : Dordrecht.
Guin, D., & Trouche, L. (1998). The complex process of converting tools into mathematical
instruments: The case of calculators. International Journal of Computers for
Mathematical Learning, 3(3), 195-227.
197
Hall, J., & Chamblee, G. (2013). Teaching algebra and geometry with GeoGebra: Preparing pre-
service teachers for middle grades/secondary mathematics classrooms. Computers in the
Schools, 30(1-2), 12-29.
Harel, I & Kafai, Y. (1991) Children Learning Through Consulting. In I. Harel and S. Papert (Eds),
Constructionism: Research Reports and Essays, 1985- 1990 (pp.111-140), New Jersey:
Ablex Publishing Corporation.
Harel, I & Papert, S. (1991) Software Design as a Learning Environment. In I. Harel and S. Papert
(Eds), Constructionism: Research Reports and Essays, 1985-1990 (pp.41-84), New Jersey:
Ablex Publishing Corporation.
Herbst, P., & Chazan, D. (2003). Exploring the practical rationality of mathematics teaching
through conversations about videotaped episodes: The case of engaging students in
proving. For the learning of Mathematics, 23(1), 2-14.
Hesse-Biber, S. (2010). Qualitative approaches to mixed methods practice. Qualitative
inquiry, 16(6), 455-468.
Hole, S., & McEntree, G. H. (1999). Reflection is at the heart of practice. Educational
leadership, 56(8), 34-37.
Hoyles, C. (1992). Mathematics teaching and mathematics teachers: A meta-case study. For the
learning of mathematics, 12(3), 32-44.
Hoyles, C., & Lagrange, J. B. (2009). Introduction to Section 5. In C. Hoyles & J.-B. Lagrange
(Eds.), Mathematics Education and Technology-Rethinking the Terrain (pp. 423-424).
Springer, Boston, MA.
Hoyles, C. & Noss, R. (2003). What Can Digital Technologies Take from and Bring to Research in
Mathematics Education?. In A.J. Bishop; M.A. Clements; C. Keitel; J. Kilpatrick; and F.K.S.
Leung (Eds), Second International Handbook of Mathematics Education (pp.323-350).
Dordrecht: Kluwer Academic Publishers.
Hoyles, C. & Noss, R. (1992). Looking Back and Looking Forward. In R. Noss & C. Hoyles (Eds),
Learning Mathematics and Logo (pp. 431-468). Cambridge, Massachusetts, London: The
MIT Press.
Induction for newly qualified teachers (England) - Statutory guidance for appropriate bodies,
headteachers, school staff and governing bodies. (2018). Retrieved from

198
https://assets.publishing.service.gov.uk/government/uploads/system/uploads/attachm
ent_data/file/696428/Statutory_Induction_Guidance_2018.pdf.
Jadhav, C. (2018, 2019). The Ofqual blog - GCSE 9 to 1 grades: a brief guide for parents.
Retrieved from https://ofqual.blog.gov.uk/2018/03/02/gcse-9-to-1-grades-a-brief-
guide-for-parents/
Jaworski, B. (1994). Investigating mathematics teaching: A constructivist enquiry. London:
Falmer Press.
Jaworski, B., & Potari, D. (2009). Bridging the macro-and micro-divide: Using an activity theory
model to capture sociocultural complexity in mathematics teaching and its
development. Educational Studies in Mathematics, 72(2), 219-236.
Jones, K., Mackrell, K., & Stevenson, I. (2010). Designing Digital Technologies and Learning
Activities for Different Geometries. In C. Hoyles & J.-B. Lagrange (Eds.), Mathematics
Education and Technology: Rethinking the Terrain: The 17th ICMI Study (pp. 47-60).
Dordrechet, The Netherlanads: Springer Science+Business Media LLC.
Kayali, L., & Biza, I. (2017). “One of the beauties of Autograph is … that you don’t really have to
think”: Integration of resources in mathematics teaching. In T. Dooley & G. Gueudet
(Eds.), Proceedings of the 10th Conference of European Research in Mathematics
Education (pp. 2406-2413). Dublin: Dublin City University.
Kayali, L., & Biza, I. (2018a). Micro-evolution of documentational work in the teaching of the
volume of revolution. In E. Bergqvist, M. Österholm, C. Granberg, & L. Sumpter (Eds.),
Proceedings of the 42nd Conference of the International Group for the Psychology of
Mathematics Education (PME) (Vol. 3, pp. 195-202).
Kayali, L., & Biza, I. (2018b). Teachers' use of resources for mathematics teaching: The case of
teaching trigonometry. In J. Golding, N. Bretscher, C. Crisan, E. Geraniou, J. Hodgen, & C.
Morgan (Eds.), Research Proceedings of the 9th British Congress on Mathematics
Education (pp. 111-118). UK: University of Warwick.
Kayali, L., & Biza, I. (2019). ‘Balancing’ the ‘live’ use of resources towards the introduction of
the Iterative Numerical method. In U. T. Jankvist, M. Van den Heuvel-Panhuizen, & M.
Veldhuis (Eds.), Proceedings of the Eleventh Congress of the European Society for
Research in Mathematics Education (CERME11, February 6 – 10, 2019) (pp. 3648-3655).
199
Utrecht, the Netherlands: Freudenthal Group & Freudenthal Institute: Utrecht University
and ERME.
Kieran, C., Forman, E., & Sfard, A. (2002). Learning discourse: discursive approaches to research
in mathematics education. Dordrecht: Kluwer Academic Publishers.
Kieran, C., Tanguay, D., & Solares, A. (2011). Researcher-designed resources and their
adaptation within classroom teaching practice: Shaping both the implicit and the explicit.
In G. Gueudet, B. Pepin, & L. Trouche (Eds.), From Text to 'Lived' Resources (pp. 189-213).
Springer, Dordrecht.
Lagrange, J.-B., Artigue, M., Laborde, C.& Trouche, L. (2003). Technology and mathematics
education: a multidimensional study of the evolution of research and innovation. In A.J.
Bishop, M.A. Clements, C. Keitel, J. Kilpatrick & F.K.S. Leung (Eds), Second International
Handbook of Mathematics Education, 239–271. Dordercht, the Netherlands: Kluwer
Academic Publishers.
Lampert, M., & Ball, D. L. (1999). Aligning teacher education with contemporary K-12 reform
visions. In G. Sykes & L. Darling-Hammond (Eds.), Teaching as the learning profession:
Handbook of policy and practice, 33-53. San Francisco, CA: Jossey Bass.
Lasky, S. (2005). A sociocultural approach to understanding teacher identity, agency and
professional vulnerability in a context of secondary school reform. Teaching and teacher
education, 21(8), 899-916.
Lerman, S. (2001). A Review of Research Perspectives on Mathematics Teacher Education. In
F.-L. Lin & T. J. Cooney (Eds.), Making Sense of Mathematics Teacher Education (pp. 33-
52). Dordrecht; London: Kluwer Academic.
MathTASK. (2016). Retrieved from
https://www.uea.ac.uk/education/research/areas/mathematics-education/our-
research/mathtask_homepage
MathTASK- Technology and resources. (2017). Retrieved from
http://www.uea.ac.uk/education/research/areas/mathematics-education/our-
research/mathtask_homepage/technology
May, T. (2001). Social Research: Issues, methods and process (3rd ed.). Buckingham: Open
University Press.

200
May, T. (2010). Social research: Issues, methods and process (4th ed.). Open University Press.
McLeod, D. B., & McLeod, S. H. (2002). Synthesis—beliefs and mathematics education:
Implications for learning, teaching, and research. In G. Leder, E. Pehkonen, & G. Törner
(Eds.), Beliefs: A hidden variable in mathematics education? (pp. 115-123). Springer,
Dordrecht.
Merriam, S. B., & Tisdell, E. J. (2016). Qualitative research: A guide to design and
implementation (4 ed.). San Francisco, CA: Jossey-Bass.
Mishra, P., & Koehler, M. J. (2006). Technological pedagogical content knowledge: A framework
for teacher knowledge. Teachers college record, 108(6), 1017-1054.
Nardi, E., Biza, I., & Zachariades, T. (2012). ‘Warrant’ revisited: Integrating mathematics
teachers’ pedagogical and epistemological considerations into Toulmin’s model for
argumentation. Educational Studies in Mathematics, 79(2), 157-173.
National Careers Service- Secondary school teacher. (2019). Retrieved from
https://nationalcareers.service.gov.uk/job-profiles/secondary-school-teacher
The national curriculum. (2019). Retrieved from https://www.gov.uk/national-curriculum
Neubrand, M. (2018). Conceptualizations of professional knowledge for teachers of
mathematics. ZDM, 50(4), 601-612.
Noss, R., & Hoyles, C. (1996). Windows on mathematical meanings: Learning cultures and
computers (Vol. 17). Springer Science & Business Media.
Oates, G., Callingham, R. & Hay, I. (2019). A consideration of technology with Rowland’s
knowledge quartet framework. In M. Graven, H. Venkat, A. A. Essien & P. Vale (Eds.),
Proceedings of the 43nd Conference of the International Group for the Psychology of
Mathematics Education (PME) (Vol. 3, pp. 145-152).
OECD. (2015). Students, Computers and Learning: Making the Connection. Paris: PISA, OECD
Publishing.
Oxford English dictionary. (2000). Oxford University Press. Retrieved from
https://search.ebscohost.com/login.aspx?direct=true&db=cat07845a&AN=uea.509593
46&authtype=sso&custid=s8993828&site=eds-live&scope=site
Papert, S. (1990). A Critique of Technocentrism in Thinking About the School of the Future. A
version of this piece was published as "M.I.T. Media Lab Epistemology and Learning

201
Memo No. 2" (September 1990).
http://www.papert.org/articles/ACritiqueofTechnocentrism.html. Last retrieved
03/04/2020.
Papert, S. (1991). Perestroika and Epistemological Politics. In I. Harel and S. Papert (Eds),
Constructionism: Research Reports and Essays, 1985-1990 (pp.13-28), New Jersey: Ablex
Publishing Corporation.
Papert, S. (1993). Mindstorms: Children, Computers, and Powerful Ideas (2nd ed.). New York:
Basic Books.
Papert, S. & Turkle, S (1991). Epistomological Pluralism and Revaluation of Concrete. In I. Harel
and S. Papert (Eds), Constructionism: Research Reports and Essays, 1985-1990 (pp.161-
191), New Jersey: Ablex Publishing Corporation.
Pepin, B., Choppin, J., Ruthven, K., & Sinclair, N. (2017b). Digital curriculum resources in
mathematics education: foundations for change. ZDM-MATHEMATICS EDUCATION,
49(5), 645–661.
Philipp, R. A. (2007). Mathematics Teachers’ Beliefs and Affect. In F. K. Lester (Ed.), Second
Handbook of Research on Mathematics Teaching and Learning: A Project of the National
Council of Teachers of Mathematics (Vol. 1, pp. 257-315): Charlotte, NC : Information Age
Pub.
Pittalis, M., & Christou, C. (2010). Types of Reasoning in 3D Geometry Thinking and their
Relation with Spatial Ability. Educational Studies in Mathematics, 75(2), 191-212.
Potari, D., & Jaworski, B. (2002). Tackling complexity in mathematics teaching development:
Using the teaching triad as a tool for reflection and analysis. Journal of Mathematics
Teacher Education, 5(4), 351-380.
Potari, D., & Psycharis, G. (2018). Prospective Mathematics Teacher Argumentation While
Interpreting Classroom Incidents. In M. E. Strutchens, R. Huang, D. Potari, & L. Losano
(Eds.), Educating Prospective Secondary Mathematics Teachers (pp. 169-187). ICME-13
Monographs: Springer.
QAA. (2014). UK Quality Code for Higher Education. Retrieved from
https://www.qaa.ac.uk/docs/qaa/quality-code/qualifications-
frameworks.pdf?sfvrsn=170af781_16.
202
Rayner, D., & Williams, P. (2004). Pure Mathematics C1 C2. Elmwood Press.
Roesken-Winter, B., Hoyles, C., & Blömeke, S. (2015). Evidence-based CPD: Scaling up
sustainable interventions. ZDM, 47(1), 1-12.
Rowland, T. (2010). Foundation knowledge for teaching: Contrasting elementary and
secondary mathematics. In V. Durand-Guerrier, S. Soury-Lavergne, & F. Arzarello (Eds.),
Proceedings of the VI Congress of the European Society for Research in Mathematics
Education (CERME 6) (pp. 1841–1850). Lyon: Institut National de Recherche
Pedagogique.
Rowland, T. (2013). The Knowledge Quartet: the genesis and application of a framework for
analysing mathematics teaching and deepening teachers’ mathematics
knowledge. Sisyphus-Journal of Education, 1(3), 15-43.
Rowland, T., Huckstep, P., & Thwaites, A. (2005). Elementary teachers’ mathematics subject
knowledge: The knowledge quartet and the case of Naomi. Journal of Mathematics
Teacher Education, 8(3), 255-281.
Rowland, T., Thwaites, A., & Jared, L. (2015). Triggers of contingency in mathematics
teaching. Research in Mathematics Education, 17(2), 74-91.
Rowland, T., & Turner, F. (2017). Who owns a theory? The democratic evolution of the
Knowledge Quartet. In B. Kaur, W.K. Ho, T.L. Toh & B.H. Choy (Eds.) Proceedings of the
41st Conference of the International Group for the Psychology of Mathematics Education,
Vol. 4, pp. 105-102. Singapore: PME.
Rowland, T., Turner, F., & Thwaites, A. (2014). Research into teacher knowledge: a stimulus for
development in mathematics teacher education practice. ZDM, 46(2), 317-328.
Rowland, T., Turner, F., Thwaites, A., & Huckstep, P. (2009). Developing primary mathematics
teaching. Reflecting on practice with the knowledge quartet. Los Angeles: SAGE.
Ruthven, K., Hennessy, S., & Deaney, R. (2008). Constructions of dynamic geometry: A study of
the interpretative flexibility of educational software in classroom practice. Computers &
Education, 51(1), 297-317.
Sfard, A., & Prusak, A. (2005). Telling identities: In search of an analytic tool for investigating
learning as a culturally shaped activity. Educational researcher, 34(4), 14-22.

203
Shulman, L. (1987). Knowledge and teaching: Foundations of the new reform. Harvard
educational review, 57(1), 1-23.
Shulman, L. S. (1986). Those who understand: Knowledge growth in teaching. Educational
researcher, 15(2), 4-14.
Sinclair, N., & Yurita, V. (2008). To be or to become: How dynamic geometry changes
discourse. Research in Mathematics Education, 10(2), 135-150.
Skott, J. (2001). The emerging practices of a novice teacher: The roles of his school mathematics
images. Journal of mathematics teacher education, 4(1), 3-28.
Speer, N. M. (2005). Issues of methods and theory in the study of mathematics teachers’
professed and attributed beliefs. Educational studies in mathematics, 58(3), 361-391.
Stake, R. E. (2010). Qualitative research: Studying how things work. New York: Guilford
Publications, Inc.
Steele, M. D. (2005). Comparing knowledge bases and reasoning structures in discussions of
mathematics and pedagogy. Journal of Mathematics Teacher Education, 8(4), 291-328.
Study in the UK- UK Grading System. (2019). Retrieved from https://www.studying-in-
uk.org/uk-grading-system/
Teaching- Subject knowledge enhancement (SKE) courses. (2019). Retrieved from
https://getintoteaching.education.gov.uk/explore-my-options/teacher-training-
routes/subject-knowledge-enhancement-ske-courses
Teaching- Teacher training courses. (2019). Retrieved from
https://getintoteaching.education.gov.uk/explore-my-options/postgraduate-teacher-
training-courses/teacher-training-courses
Teaching- What is a PGCE? (2019). Retrieved from
https://getintoteaching.education.gov.uk/explore-my-options/teacher-training-
routes/pgce
Teaching- Eligibility for teacher training. (2019). Retrieved from
https://getintoteaching.education.gov.uk/eligibility-for-teacher-training
Thames, M., & Van Zoest, L. R. (2013). Building coherence in research on mathematics teacher
characteristics by developing practice-based approaches. ZDM, 45(4), 583-594.

204
Thwaites, A., Jared, L., & Rowland, T. (2011). Analysing secondary mathematics teaching with
the Knowledge Quartet. Research in Mathematics Education, 13(2), 227-228.
Tripp, D. (2012). Critical incidents in teaching: Developing professional judgement (Classic ed.).
London; New York: Routledge.
Trouche, L. (2004). Managing the complexity of human/machine interactions in computerized
learning environments: Guiding students’ command process through instrumental
orchestrations. International Journal of Computers for mathematical learning, 9(3), 281.
Trouche, L., & Drijvers, P. (2014). Webbing and orchestration. Two interrelated views on digital
tools in mathematics education. Teaching Mathematics and Its Applications:
International Journal of the IMA, 33(3), 193-209.
Trouche, L., Gitirana, V., Miyakawa, T., Pepin, B., & Wang, C. (2019). Studying mathematics
teachers interactions with curriculum materials through different lenses: Towards a
deeper understanding of the processes at stake. International Journal of Educational
Research, 93, 53-67.
Turner, F. (2008). Growth in teacher knowledge: Individual reflection and community
participation. In O. Figueras, J. L. Cortina, S. Alatorre, T. Rojano & A. Sepúlveda (Eds.),
Proceedings of the 32nd Conference of the International Group for the Psychology of
Mathematics Education (Vol 4, pp. 353-360). Morelia, Mexico: University of Saint
Nicholas of Hidalgo.
Turner, F., & Rowland, T. (2011). The knowledge quartet as an organising framework for
developing and deepening teachers’ mathematics knowledge.
In T. Rowland & K. Ruthven (Eds.), Mathematical knowledge in teaching (Vol. 50,
pp. 195–212). New York: Springer.
Vale, C., Julie, C., Buteau, C., & Ridgway, J. (2009). Introduction to Section 4. In C. Hoyles & J.-
B. Lagrange (Eds.), Mathematics Education and Technology-Rethinking the Terrain (pp.
349-360). Springer, Boston, MA.
Vygotsky, L. S. (1978). Mind in society: The development of higher psychological
processes. Cambridge, MA: Harvard University Press.
Wenger, E. (1998). Communities of practice: learning, meaning, and identity. Cambridge
University Press.

205
Wertsch, J. V., del Río, P., & Alvarez, A. (1995). Sociocultural studies: History, action, and
mediation. In J. V. Wertsch, P. del Río, & A. Alvarez (Eds.), Sociocultural studies of
mind (pp. 1–34). Cambridge: Cambridge University Press.
Wiseman, G., & Searle, J. (2005). Advanced maths for AQA: Core maths C3 and C4. Oxford:
Oxford University Press.

206
Appendices
List of Appendices_
Appendix A: Study poster ........................................................................................................................... 207
Appendix B: Interview opt in form ............................................................................................................. 208
Appendix C: Lesson-observations opt in form ............................................................................................ 216
Appendix D: Student consent form for lesson observations....................................................................... 224
Appendix E: Sample of Pre-observation interview questions ..................................................................... 231
Appendix F: Sample of the post-observation interview ............................................................................. 232
Appendix G: Sample of the analysis using the Knowledge Quartet ........................................................... 234
Appendix H: Application for ethical approval of a research project .......................................................... 244
Appendix I: Ethics application feedback ..................................................................................................... 256
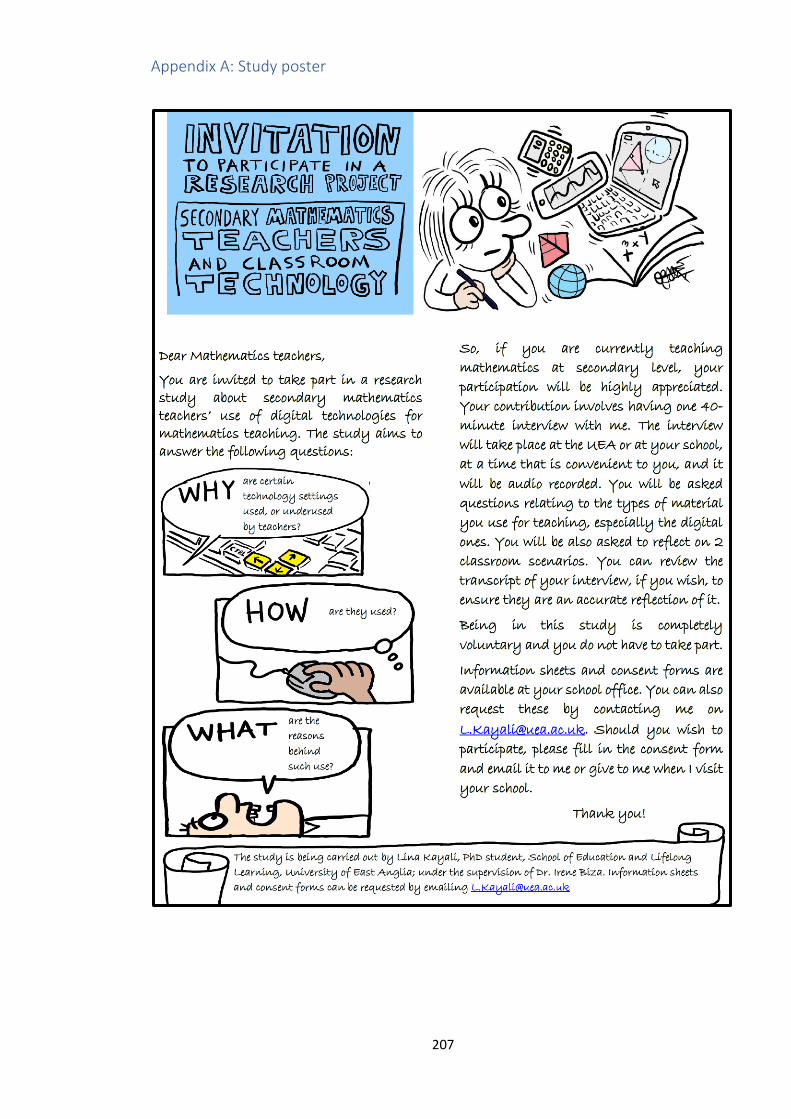
207
Appendix A: Study poster
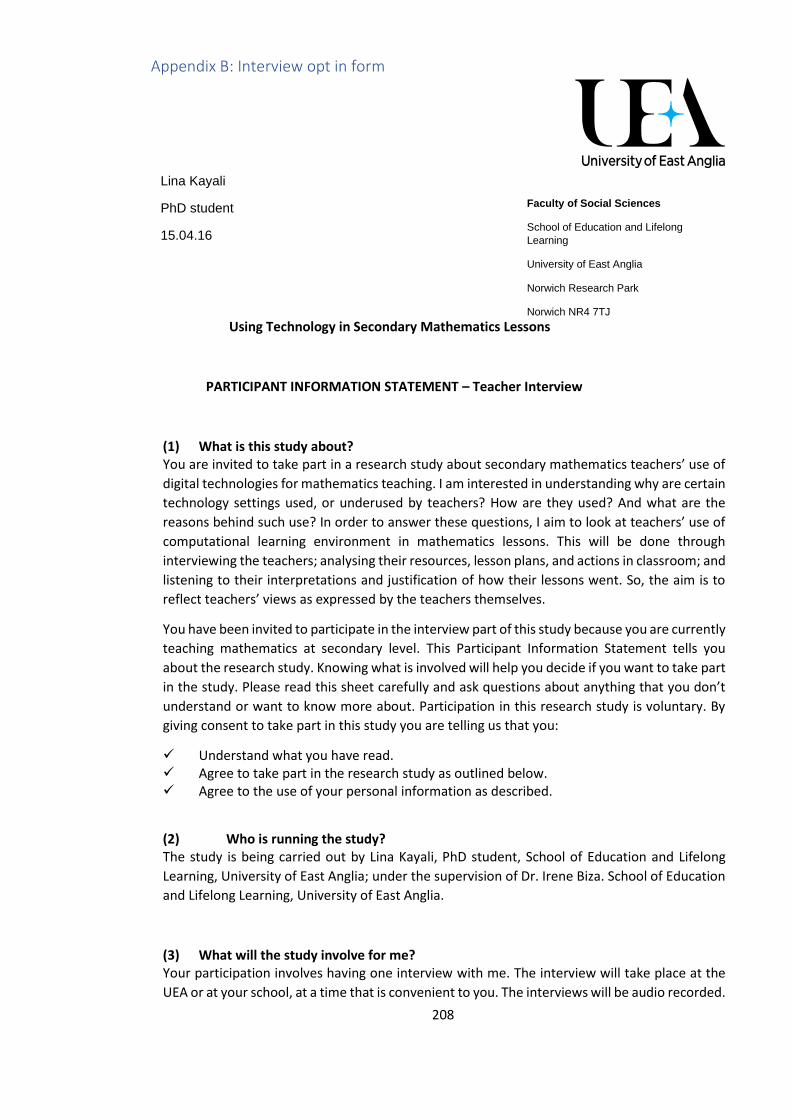
208
Appendix B: Interview opt in form
Using Technology in Secondary Mathematics Lessons
PARTICIPANT INFORMATION STATEMENT – Teacher Interview
(1) What is this study about? You are invited to take part in a research study about secondary mathematics teachers’ use of
digital technologies for mathematics teaching. I am interested in understanding why are certain
technology settings used, or underused by teachers? How are they used? And what are the
reasons behind such use? In order to answer these questions, I aim to look at teachers’ use of
computational learning environment in mathematics lessons. This will be done through
interviewing the teachers; analysing their resources, lesson plans, and actions in classroom; and
listening to their interpretations and justification of how their lessons went. So, the aim is to
reflect teachers’ views as expressed by the teachers themselves.
You have been invited to participate in the interview part of this study because you are currently
teaching mathematics at secondary level. This Participant Information Statement tells you
about the research study. Knowing what is involved will help you decide if you want to take part
in the study. Please read this sheet carefully and ask questions about anything that you don’t
understand or want to know more about. Participation in this research study is voluntary. By
giving consent to take part in this study you are telling us that you:
✓ Understand what you have read. ✓ Agree to take part in the research study as outlined below. ✓ Agree to the use of your personal information as described.
(2) Who is running the study? The study is being carried out by Lina Kayali, PhD student, School of Education and Lifelong
Learning, University of East Anglia; under the supervision of Dr. Irene Biza. School of Education
and Lifelong Learning, University of East Anglia.
(3) What will the study involve for me? Your participation involves having one interview with me. The interview will take place at the
UEA or at your school, at a time that is convenient to you. The interviews will be audio recorded.
Lina Kayali
PhD student
15.04.16
Faculty of Social Sciences
School of Education and Lifelong
Learning
University of East Anglia
Norwich Research Park
Norwich NR4 7TJ
United Kingdom
Email: [email protected]
Tel: +44 (0) 1603 592924
Web: www.uea.ac.uk
209
You will be asked questions relating to the types of material you use for teaching, especially the
digital ones. You will be also asked to reflect on 2-3 classroom scenarios. You will be able to
review the transcript of your interviews, if you wish, to ensure they are an accurate reflection
of the discussion.
(4) How much of my time will the study take? It is expected that the interview will take about 40 mins.
(5) Do I have to be in the study? Can I withdraw from the study once I've started? Being in this study is completely voluntary and you do not have to take part. Your decision
whether to participate will not affect your current or future relationship with the researchers
or anyone else at the University of East Anglia. If you decide to take part in the study and then
change your mind later, you are free to withdraw at any time. You can do this by letting me
know by email ([email protected]) or by phone (01603 592924). You are free to stop the
interview at any time. Unless you say that you want me to keep them, any recordings will be
erased and the information you have provided will not be included in the study results. You may
also refuse to answer any questions that you do not wish to answer during the interview. If you
decide at a later time to withdraw from the study your information will be removed from our
records and will not be included in any results, up to the point I have analysed and published
the results.
(6) Are there any risks or costs associated with being in the study? Aside from giving up your time, I do not expect that there will be any risks or costs associated
with taking part in this study.
(7) Are there any benefits associated with being in the study? I would hope that by talking about your experiences that it will allow you to reflect on those
areas that have helped as well as those areas that might need additional support. The study will
also contribute to the effectiveness of using technology for mathematics teaching in the future.
(8) What will happen to information about me that is collected during the study? By providing your consent, you are agreeing to me collecting personal information about you
for the purposes of this research study. Your information will only be used for the purposes
outlined in this Participant Information Statement, unless you consent otherwise. Data
management will follow the 1998 Data Protection Act and the University of East Anglia Research
Data Management Policy (2013). Your information will be stored securely and your
identity/information will only be disclosed with your permission, except as required by law.
Study findings may be published, but you will not be identified in these publications unless you
agree to this using the tick box on the consent form. Although your data will be anonymised,
there is a chance that through the study context you will be identifiable by people who know
you and know about the study. In this instance, data will be stored for a period of 10 years and
then destroyed.

210
(9) What if I would like further information about the study? When you have read this information, I will be available to discuss it with you further and
answer any questions you may have. You can contact me on [email protected] or 01603
592924.
(10) Will I be told the results of the study? You have a right to receive feedback about the overall results of this study. You can tell me that
you wish to receive feedback by providing a contact detail on the consent section of this
information sheet. This feedback will be in the form of a one page lay summary of the findings.
You will receive this feedback after the study is finished.
(11) What if I have a complaint or any concerns about the study? The ethical aspects of this study have been approved under the regulations of the University of
East Anglia’s School of Education and Lifelong Learning Research Ethics Committee.
If there is a problem please let me know. You can contact me via the University at the following
address:
Lina Kayali
School of Education and Lifelong Learning
University of East Anglia
NORWICH NR4 7TJ
If you would like to speak to someone else you can contact my supervisor:
Dr. Irene Biza
School of Education and Lifelong Learning
University of East Anglia
NORWICH NR4 7TJ
Tel: +44 (0) 1603 591741
Email: [email protected]
If you are concerned about the way this study is being conducted or you wish to make a
complaint to someone independent from the study, please contact please contact the Head of
the School of Education and Lifelong Learning, Dr Nalini Boodhoo, at [email protected].

211
(12) OK, I want to take part – what do I do next? You need to fill in one copy of the consent form and give to me when I visit your school. Please
keep the letter, information sheet and the 2nd copy of the consent form for your information.
This information sheet is for you to keep

212
PARTICIPANT CONSENT FORM (1st Copy to Researcher)
I, ................................................................................... [PRINT NAME], agree to take part in this
research study.
In giving my consent I state that:
✓ I understand the purpose of the study, what I will be asked to do, and any risks/benefits involved.
✓ I have read the Participant Information Statement and have been able to discuss my involvement in the study with the researchers if I wished to do so.
✓ The researchers have answered any questions that I had about the study and I am happy with the answers.
✓ I understand that being in this study is completely voluntary and I do not have to take part. My decision whether to be in the study will not affect my relationship with the researchers or anyone else at the University of East Anglia now or in the future.
✓ I understand that I can withdraw from the study at any time.
✓ I understand that I may stop the interview at any time if I do not wish to continue, and that unless I indicate otherwise any recordings will then be erased and the information provided will not be included in the study. I also understand that I may refuse to answer any questions I don’t wish to answer.
✓ I understand that personal information about me that is collected over the course of this project will be stored securely and will only be used for purposes that I have agreed to. I understand that information about me will only be told to others with my permission, except as required by law.
✓ I understand that the results of this study may be published, but these publications will not contain my name or any identifiable information about me unless I consent to being identified using the “Yes” checkbox below.
Yes, I am happy to be identified. No, I don’t want to be identified. Please keep my identity anonymous.
I consent to:

213
• Audio-recording YES NO • Reviewing transcripts YES NO • Would you like to receive feedback about the overall results of this study? YES NO
If you answered YES, please indicate your preferred form of feedback and address:
Postal: _______________________________________________________
Email: ___________________________________________________
.............................................................. ………………………………………………………………….
………………………..
Signature PRINT name Date

214
PARTICIPANT CONSENT FORM (2nd Copy to Participant)
I, ................................................................................... [PRINT NAME], agree to take part in
this research study.
In giving my consent I state that:
✓ I understand the purpose of the study, what I will be asked to do, and any risks/benefits involved.
✓ I have read the Participant Information Statement and have been able to discuss my involvement in the study with the researchers if I wished to do so.
✓ The researchers have answered any questions that I had about the study and I am happy with the answers.
✓ I understand that being in this study is completely voluntary and I do not have to take part. My decision whether to be in the study will not affect my relationship with the researchers or anyone else at the University of East Anglia now or in the future.
✓ I understand that I can withdraw from the study at any time.
✓ I understand that I may stop the interview at any time if I do not wish to continue, and that unless I indicate otherwise any recordings will then be erased and the information provided will not be included in the study. I also understand that I may refuse to answer any questions I don’t wish to answer.
✓ I understand that personal information about me that is collected over the course of this project will be stored securely and will only be used for purposes that I have agreed to. I understand that information about me will only be told to others with my permission, except as required by law.
✓ I understand that the results of this study may be published, but these publications will not contain my name or any identifiable information about me unless I consent to being identified using the “Yes” checkbox below.
Yes, I am happy to be identified. No, I don’t want to be identified. Please keep my identity anonymous.
I consent to: • Audio-recording YES NO

215
• Reviewing transcripts YES NO • Would you like to receive feedback about the overall results of this study? YES NO
If you answered YES, please indicate your preferred form of feedback and address:
Postal: _______________________________________________________
Email: ___________________________________________________
............................................................... ………………………………………………………………….
………………………..
Signature PRINT name Date
216
Appendix C: Lesson-observations opt in form
Using Technology in Secondary Mathematics Lessons
PARTICIPANT INFORMATION STATEMENT – Teacher Observations
(1) What is this study about? You are invited to take part in the second phase of a research study about secondary
mathematics teachers’ use of digital technologies for mathematics teaching. I am interested in
understanding why are certain technology settings used, or underused by teachers? How are
they used? And what are the reasons behind such use? In order to answer these questions, I
aim to look at teachers’ use of computational learning environment in mathematics lessons.
This will be done through interviewing the teachers; analyzing their resources, lesson plans, and
actions in classroom; and listening to their interpretations and justification of how their lessons
went. So, the aim is to reflect teachers’ views as expressed by the teachers themselves.
You have been invited to participate in this study because you are currently teaching
mathematics at secondary level, and you participated in phase one of this study. This Participant
Information Statement tells you about the research study. Knowing what is involved will help
you decide if you want to take part in the study. Please read this sheet carefully and ask
questions about anything that you don’t understand or want to know more about. Participation
in this research study is voluntary. By giving consent to take part in this study you are telling us
that you:
✓ Understand what you have read. ✓ Agree to take part in the research study as outlined below. ✓ Agree to the use of your personal information as described.
(2) Who is running the study? The study is being carried out by Lina Kayali, PhD student, School of Education and Lifelong
Learning, University of East Anglia; under the supervision of Dr. Irene Biza. School of Education
and Lifelong Learning, University of East Anglia.
Lina Kayali
PhD student
15.04.16
Faculty of Social Sciences
School of Education and Lifelong Learning
University of East Anglia
Norwich Research Park
Norwich NR4 7TJ
United Kingdom
Email: [email protected]
Tel: +44 (0) 1603 591039
Web: www.uea.ac.uk

217
(3) What will the study involve for me? Your participation will involve you completing your day to day mathematics classes as normal.
I will be present in up to 11 of your classes across the term (starting in September) and I will be
taking notes about how the class is structured, examples used, lesson plans, worksheets and
how the digital technology is used. With your permission I would also like to video record some
of these sessions (I will let you know which ones) so that I can see how all of the class interact
with each other. You can get to see any notes I take that are specifically about you. You will also
be asked, before and after each lesson, about what you think and feel about your own
mathematics lessons and planning, what went/did not go well and why.
(4) How much of my time will the study take? I will be in your mathematics classes for 1 lesson of pilot observations before you start teaching
[to be inserted: a specific mathematical topic e.g.: geometry], then I may observe 10 more
lessons of your [to be inserted: a specific mathematical topic] lessons (starting in September)
but this will be part of your normal everyday teaching. Additional time required is for pre- and
post-lesson conversations, that will together take about 15 minutes per lesson, so that will
mean no more than 2.5 hours of your time during the observation period.
(5) Do I have to be in the study? Can I withdraw from the study once I've started? Being in this study is completely voluntary and you do not have to take part. Your decision
whether to participate will not affect your current or future relationship with the researchers
or anyone else at the University of East Anglia. If you decide to take part in the study and then
change your mind later, you are free to withdraw at any time. You can do this by letting me
know by email ([email protected]) or by phone (01603 591039). You are free to stop the
interview and/or the observations at any time. Unless you say that you want us to keep them,
any recordings will be erased and the information you have provided will not be included in the
study results. You may also refuse to answer any questions that you do not wish to answer
during the interview. If you decide at a later time to withdraw from the study (interview and
observation) your information will be removed from our records and will not be included in any
results, up to the point we have analysed and published the results.
(6) Are there any risks or costs associated with being in the study? Aside from giving up your time, we do not expect that there will be any risks or costs associated
with taking part in this study.
(7) Are there any benefits associated with being in the study? I would hope that by talking about your experiences that it will allow you to reflect on those
areas that have helped as well as those areas that might need additional support. The study will
also contribute to the effectiveness of using technology for mathematics teaching in the future.
(8) What will happen to information about me that is collected during the study?
218
By providing your consent, you are agreeing to me collecting personal information about you
for the purposes of this research study. Your information will only be used for the purposes
outlined in this Participant Information Statement, unless you consent otherwise. Data
management will follow the 1998 Data Protection Act and the University of East Anglia Research
Data Management Policy (2013). Your information will be stored securely and your
identity/information will only be disclosed with your permission, except as required by law.
Study findings may be published, but you will not be identified in these publications unless you
agree to this using the tick box on the consent form. Although your data will be anonymised,
there is a chance that through the study context you will be identifiable by people who know
you and know about the study. In this instance, data will be stored for a period of 10 years and
then destroyed.
(9) What if I would like further information about the study? When you have read this information, I will be available to discuss it with you further and
answer any questions you may have. You can contact me on [email protected] or 01603
591039.
(10) Will I be told the results of the study? You have a right to receive feedback about the overall results of this study. You can tell me that
you wish to receive feedback by providing a contact detail on the consent section of this
information sheet. This feedback will be in the form of a one page lay summary of the findings.
You will receive this feedback after the study is finished.
(11) What if I have a complaint or any concerns about the study? The ethical aspects of this study have been approved under the regulations of the University of
East Anglia’s School of Education and Lifelong Learning Research Ethics Committee.
If there is a problem please let me know. You can contact me via the University at the following
address:
Lina Kayali
School of Education and Lifelong Learning
University of East Anglia
NORWICH NR4 7TJ
If you would like to speak to someone else you can contact my supervisor:
Dr. Irene Biza
School of Education and Lifelong Learning
University of East Anglia

219
NORWICH NR4 7TJ
Tel: +44 (0) 1603 591741
Email: [email protected]
If you are concerned about the way this study is being conducted or you wish to make a
complaint to someone independent from the study, please contact please contact the Head of
the School of Education and Lifelong Learning, Dr Nalini Boodhoo, at [email protected].
(12) OK, I want to take part – what do I do next? You need to fill in one copy of the consent form and give to me when I visit your school. Please
keep the letter, information sheet and the 2nd copy of the consent form for your information.
This information sheet is for you to keep
220
PARTICIPANT CONSENT FORM (1st Copy to Researcher)
I, ................................................................................... [PRINT NAME], agree to take part in this
research study.
In giving my consent I state that:
✓ I understand the purpose of the study, what I will be asked to do, and any risks/benefits involved.
✓ I have read the Participant Information Statement and have been able to discuss my involvement in the study with the researchers if I wished to do so.
✓ The researchers have answered any questions that I had about the study and I am happy with the answers.
✓ I understand that being in this study is completely voluntary and I do not have to take part. My decision whether to be in the study will not affect my relationship with the researchers or anyone else at the University of East Anglia now or in the future.
✓ I understand that I can withdraw from the study at any time.
✓ I understand that I may stop the interview at any time if I do not wish to continue, and that unless I indicate otherwise any recordings will then be erased and the information provided will not be included in the study. I also understand that I may refuse to answer any questions I don’t wish to answer.
✓ I understand that personal information about me that is collected over the course of this project will be stored securely and will only be used for purposes that I have agreed to. I understand that information about me will only be told to others with my permission, except as required by law.
✓ I understand that the results of this study may be published, but these publications will not contain my name or any identifiable information about me unless I consent to being identified using the “Yes” checkbox below.

221
Yes, I am happy to be identified. No, I don’t want to be identified. Please keep my identity anonymous.
I consent to: • Audio-recording YES
NO • Video-recording YES
NO • Reviewing transcripts YES
NO • Would you like to receive feedback about the overall results of this study? YES
NO
If you answered YES, please indicate your preferred form of feedback and address:
Postal: _______________________________________________________
Email: ___________________________________________________
................................................................ ………………………………………………………………….
………………………..
Signature PRINT name Date

222
PARTICIPANT CONSENT FORM (2nd Copy to Participant)
I, ................................................................................... [PRINT NAME], agree to take part in this
research study.
In giving my consent I state that:
✓ I understand the purpose of the study, what I will be asked to do, and any risks/benefits involved.
✓ I have read the Participant Information Statement and have been able to discuss my involvement in the study with the researchers if I wished to do so.
✓ The researchers have answered any questions that I had about the study and I am happy with the answers.
✓ I understand that being in this study is completely voluntary and I do not have to take part. My decision whether to be in the study will not affect my relationship with the researchers or anyone else at the University of East Anglia now or in the future.
✓ I understand that I can withdraw from the study at any time.
✓ I understand that I may stop the interview at any time if I do not wish to continue, and that unless I indicate otherwise any recordings will then be erased and the information provided will not be included in the study. I also understand that I may refuse to answer any questions I don’t wish to answer.
✓ I understand that personal information about me that is collected over the course of this project will be stored securely and will only be used for purposes that I have agreed to. I understand that information about me will only be told to others with my permission, except as required by law.
✓ I understand that the results of this study may be published, but these publications will not contain my name or any identifiable information about me unless I consent to being identified using the “Yes” checkbox below.
Yes, I am happy to be identified. No, I don’t want to be identified. Please keep my identity anonymous.
I consent to: • Audio-recording YES NO

223
• Video-recording YES NO • Reviewing transcripts YES NO • Would you like to receive feedback about the overall results of this study? YES NO
If you answered YES, please indicate your preferred form of feedback and address:
Postal: _______________________________________________________
Email: ___________________________________________________
............................................................... ………………………………………………………………….
………………………..
Signature PRINT name Date

224
Appendix D: Student consent form for lesson observations
Study Information Sheet: My maths class
Hello. My name is Lina Kayali. I am doing a research study to find out
more about teachers’ use of digital technology in maths classes. You are invited
to take part in a research study about secondary mathematics teachers’ use of
digital technologies for mathematics teaching. The study investigates why are
certain technology settings used, or underused by teachers? How are they
used? And what are the teachers’ reasons behind such use?
I am asking you to be in our study because you are a student in [to be inserted: teacher’s name]’s
maths class.
You can decide if you want to take part in the study or not. You don’t have to - it’s up to you.
This sheet tells you what we will ask you to do if you decide to take part in the study. Please read
it carefully so that you can make up your mind about whether you want to take part.
If you decide you want to be in the study and then you change your mind later, that’s ok. All you
need to do is tell us that you don’t want to be in the study anymore.
If you have any questions, you can ask us or your family or someone else who looks after you. If
you want to, you can contact me any time on [email protected] or 01603 591039.
What will happen if I say that I want to be in the study?
If you decide that you want to be in my study, I will ask you to do these things:
• Let me come and sit in your classroom and make some notes about what happens. This will be mainly about the teacher, but it could include things that you say or do. I may also want to take some video of your lessons so I can look at them later on.
• If you wish to, you can come along to one interview in which you will talk about what you think about your maths lessons. When I ask you questions, you can choose which ones you want to answer. If you don’t want to talk about something, that’s ok. You can stop talking to me at any time if you don’t want to talk to me anymore. If you say it’s ok, I will record what you say with a tape recorder. If you say it’s ok, I will make a video of you in the class with a video recorder.
225
You are free to stop participating at any stage or to refuse to answer any of the questions. If you decide at a later time to withdraw from the study your information will be removed from our records and will not be included in any results, up to the point we have analysed and published the results. (To be deleted: When I video record the lesson, I won’t be able to take out the things you say after you have said them. This is because you will be talking in a group and our notes will have all the things that everyone else said as well). Will anyone else know what I say in the study? I won’t tell anyone else what you say to me, except if you talk about someone hurting you or about you hurting yourself or someone else. Then I might need to tell someone to keep you and other people safe.
All of the information that I have about you from the study will be stored in a safe place and I will look after it very carefully. I will write a report about the study and show it to other people but I won’t say your name in the report
and no one will know that you were in the study, unless you tell me that it’s ok for me to say your name.
How long will the study take?
I will be in 10-11 of your maths classes. If you talk with me about what you think the maths class is like, this will take 10-15 minutes.
Are there any good things about being in the study?
I think you’ll like talking about your maths lessons and you will also be helping me do my research.
Are there any bad things about being in the study? This study will take up some of your time, but I don’t think it will be bad for you or cost you anything.
Will you tell me what you learnt in the study at the end? Yes, I will if you want me to. There is a question on the next page that asks you if you want me to
tell you what I learnt in the study. If you circle Yes, when I finish the study I will tell your teacher
what I learnt and s/he will share this with you.
What if I am not happy with the study or the people doing the study?

226
If you are not happy with how I am doing the study or how I treat you, then you or the
person who looks after you can:
• Call the university on 01603 591039
• Write an email to [email protected]
OK, I want to take part – what do I do next?
If you’re happy to fill in the 2 forms below and give number 1 to me in the next class. You can
keep this letter and the form 2 to remind you about the study.
This sheet is for you to keep.

227
Study Information Sheet: My maths class
Consent Form 1
If you are happy to be in the study, please
• write your name in the space below
• sign your name at the bottom of the next page
• put the date at the bottom of the next page.
You should only say ‘yes’ to being in the study if you know what it is about and you want to be
in it. If you don’t want to be in the study, don’t sign the form.
I, ...........................................................................................[PRINT NAME], am happy to be in
this research study.
In saying yes to being in the study, I am saying that:
✓ I know what the study is about.
✓ I know what I will be asked to do.
✓ Someone has talked to me about the study.
✓ My questions have been answered.
✓ I know that I don’t have to be in the study if I don’t want to.
✓ I know that I can pull out of the study at any time if I don’t want to do it anymore.
✓ I know that I don’t have to answer any questions that I don’t want to answer. ✓ I know that the researchers won’t tell anyone what I say when we talk to each other, unless I talk about being hurt by someone or hurting myself or someone else. Now we are going to ask you if you are happy to do a few other things in the study. Please circle ‘Yes’ or ‘No’ to tell us what you would like.
Are you happy for me to make videos of you during lessons? Yes No

228
Are you happy for me to tape record your voice during lessons and interview? Yes No
Do you want me to tell you what I learnt in the study? Yes No
………..................................................... …………………………………………………….
Signature Date

229
Study Information Sheet: My maths class
Consent Form 2
If you are happy to be in the study, please
• write your name in the space below
• sign your name at the bottom of the next page
• put the date at the bottom of the next page.
You should only say ‘yes’ to being in the study if you know what it is about and you want to be
in it. If you don’t want to be in the study, don’t sign the form.
I, ...........................................................................................[PRINT NAME], am happy to be in
this research study.
In saying yes to being in the study, I am saying that:
✓ I know what the study is about.
✓ I know what I will be asked to do.
✓ Someone has talked to me about the study.
✓ My questions have been answered.
✓ I know that I don’t have to be in the study if I don’t want to.
✓ I know that I can pull out of the study at any time if I don’t want to do it anymore.
✓ I know that I don’t have to answer any questions that I don’t want to answer. ✓ I know that the researchers won’t tell anyone what I say when we talk to each other, unless I talk about being hurt by someone or hurting myself or someone else. Now we are going to ask you if you are happy to do a few other things in the study. Please circle ‘Yes’ or ‘No’ to tell us what you would like.
Are you happy for me to make videos of you during lessons? Yes No

230
Are you happy for me to tape record your voice during lessons and interview? Yes No
Do you want me to tell you what I learnt in the study? Yes No
………..................................................... …………………………………………………….
Signature Date

231
Appendix E: Sample of Pre-observation interview questions Questions asked to Adam to clarify his answers to scenario-based interviews during the second
phase of the study
In relation to the 3D scenario
Q1. So, when you say here this task needs scaffolding, what kind of scaffolding can you offer
the student in this case? What sort of scaffolding will make it easier for them?
Q2. Why do you think it is more valuable when you do it with the paper?
Q3. Why would you not go technology with that instead of paper?
Q4. Is that a modification you are suggesting because the problem here suggest that the
volume is one litre?
Q5. With this question, what do you think the student is thinking of when they give you this
answer?
Q6. What do you expect the answer is according to the classes you are teaching now?
Q7. You are saying here that you can use GeoGebra to detail the changing in length and see
the effect on volume, what do you mean?
Q8. Would you use it as a group activity?
Q9. “Students won’t be able to learn the software quick enough to be effective”, what do you
mean?
Q10. Would you expect ICT facilities not to be available?
Q11. “Unreliable”, what kind of issues do you usually have?
Q12. And “students not able to access due to literacy”, could you explain?
Q13. You say here “if the student doesn’t know how to use the software”, how would you
tackle this?
In relation to the scenario on square
Q14. You say here the scenario is not very common is that in terms of demands, the way the
square was done or is it in terms of behaviour?
Q15. So, how would you react in this case?
Q16. Do you think it is good idea to use GeoGebra in this case? Or is it the same as in the first
problem you said like it is better to use paper?
Q17. Can you see the use of the computer in a different question? Would you rephrase the
question maybe to make it more useful to use the computer?

232
Appendix F: Sample of the post-observation interview Questions asked to Charlie based on the critical incidents identified in his lessons
Q1. The use of Autograph to discover how many solutions an equation (polynomial) has? Why was
it done in that way? Was it useful? How?
Q2. iPad not used, why?
Q3. There are clear expectations related to homework, how does that help?
Q4. A lot of “crazy” things in mathematics like “proof” and “the crazy rule of inequalities”, why?
Q5. The teacher uses many of his own special terms like: MANTRA for the equation of a line, crazy
rule of inequalities, sheep, snail (signs, numbers, individual letters), Jellyfish, billy Bedmas,
why?
Q6. The teacher tends to write common mistakes that students usually make, show why they are
wrong and then write the correct answer, why? Ex. Reversing inequality when multiplying by
a negative number, and the solution of a quadratic equation.
Q7. The teacher said they, as a maths department, aim to create a repertoire of activities and
resources. How is that helpful? What are the criteria for it? Who can amend it?
Q8. Students are always taking notes, despite that the teacher emails the presentations to them.
Why?
Q9. With a quadratic inequality the teacher said always sketch. Why not check the values within
specific ranges?
Q10. When the teacher tried to use Autograph to show the relation between tangent and
normal, the student was able to spot they were perpendicular but not able to discover the
relation between their slopes, so the teacher switched to using two pens and helped her to
reach a conclusion, why did he change from Autograph to pens?
Q11. The teacher frequently commented on students making “the face of understanding in
maths” or “the noise of understanding in maths”, and asked students to feel free to express
them…
Q12. The teacher talks a lot about examinations, past papers, what examiners like/ don’t like,
what is ok to reset (C1 & C2) and what is not ok to reset (S1 and S2). “What we want to do is
to be awesome at doing maths... But the way you’re tested on that is looking at papers and
the annoying thing is those three questions you almost never get on papers”. How important
are examination papers?
Q13. The difference between “Have I made a mistake?” said during the lesson, and “I do not
agree with the answer at the back of the book, but it could be that I made an error”. How are
the mistakes in the book dealt with? Is there any other way to confirm what the right answer
is?
Q14. I noticed a pattern of lessons: the first 5-10 minutes checking if there is any work to be
submitted and any questions to be discussed before staring the new lesson, then teacher
introducing the new ideas but frequently asking questions so that the students are involved in
discovering the new concepts and a student is picked randomly to answer at any moment,
then students work independently or in pairs/groups on solving some textbook exercises and
they ask questions on the go if needed, finally homework is set. The textbook is the main
source of exercises… Is that right?
Q15. The scheme of work is amendable by any mathematics teacher, not only by the head of
maths, how does that help? Does it create issues?
Q16. The teacher frequently commented on resources he used in previous schools and found
useful to use in this one. Could you elaborate?
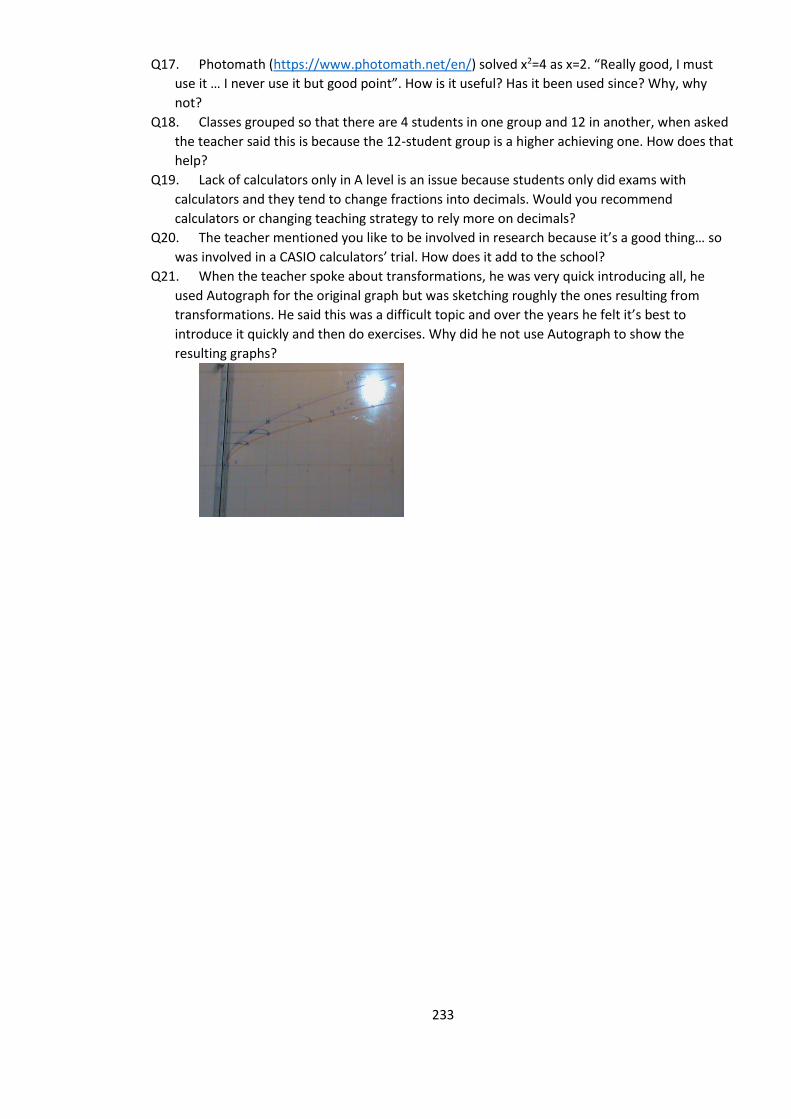
233
Q17. Photomath (https://www.photomath.net/en/) solved x2=4 as x=2. “Really good, I must
use it … I never use it but good point”. How is it useful? Has it been used since? Why, why
not?
Q18. Classes grouped so that there are 4 students in one group and 12 in another, when asked
the teacher said this is because the 12-student group is a higher achieving one. How does that
help?
Q19. Lack of calculators only in A level is an issue because students only did exams with
calculators and they tend to change fractions into decimals. Would you recommend
calculators or changing teaching strategy to rely more on decimals?
Q20. The teacher mentioned you like to be involved in research because it’s a good thing… so
was involved in a CASIO calculators’ trial. How does it add to the school?
Q21. When the teacher spoke about transformations, he was very quick introducing all, he
used Autograph for the original graph but was sketching roughly the ones resulting from
transformations. He said this was a difficult topic and over the years he felt it’s best to
introduce it quickly and then do exercises. Why did he not use Autograph to show the
resulting graphs?

234
Appendix G: Sample of the analysis using the Knowledge Quartet

235

236

237

238
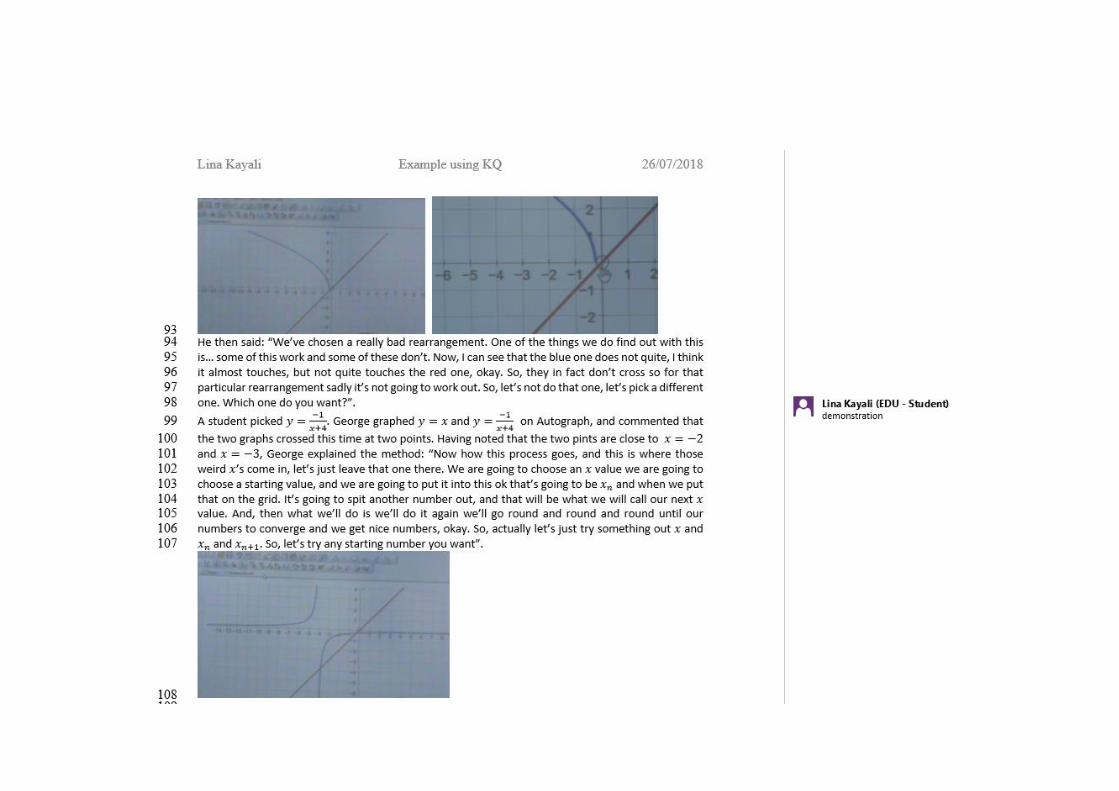
239
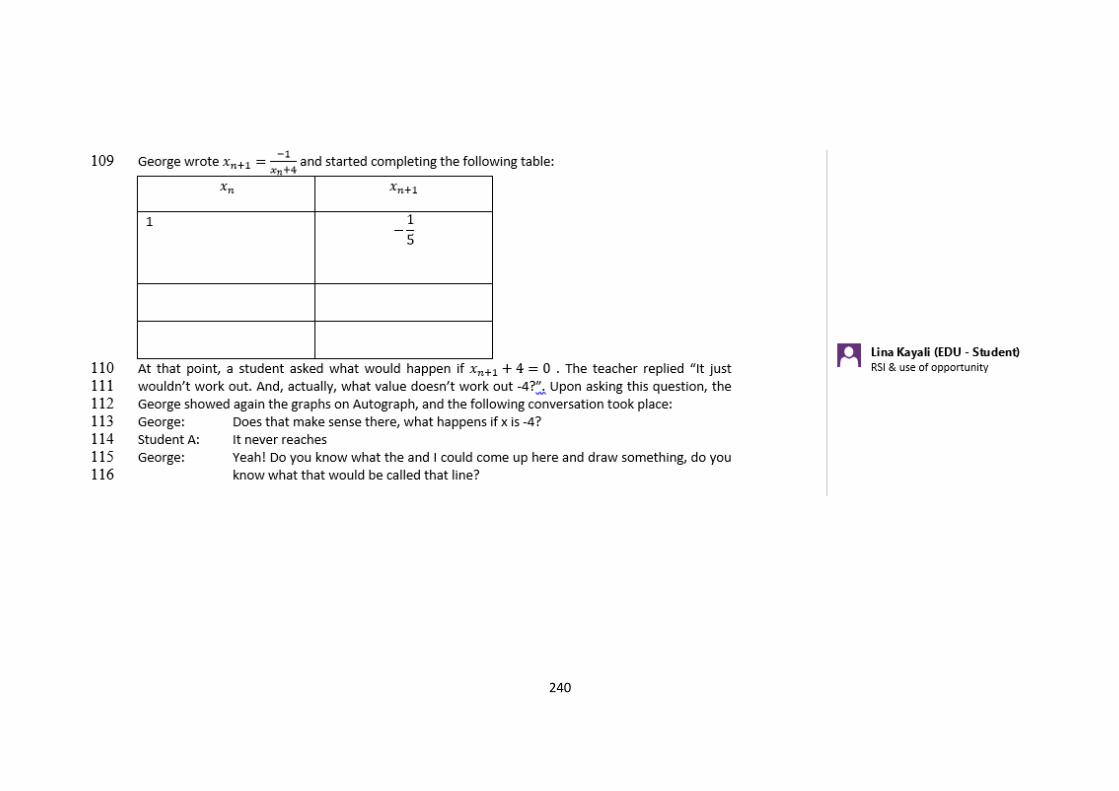
240

241
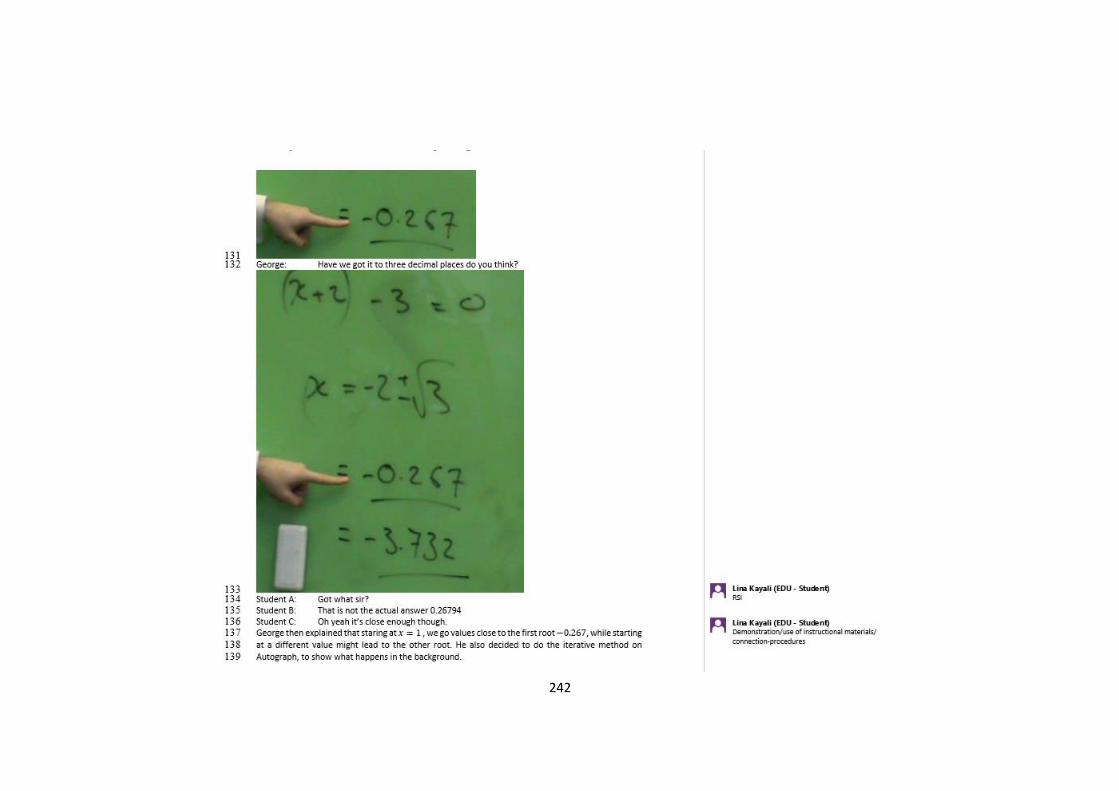
242
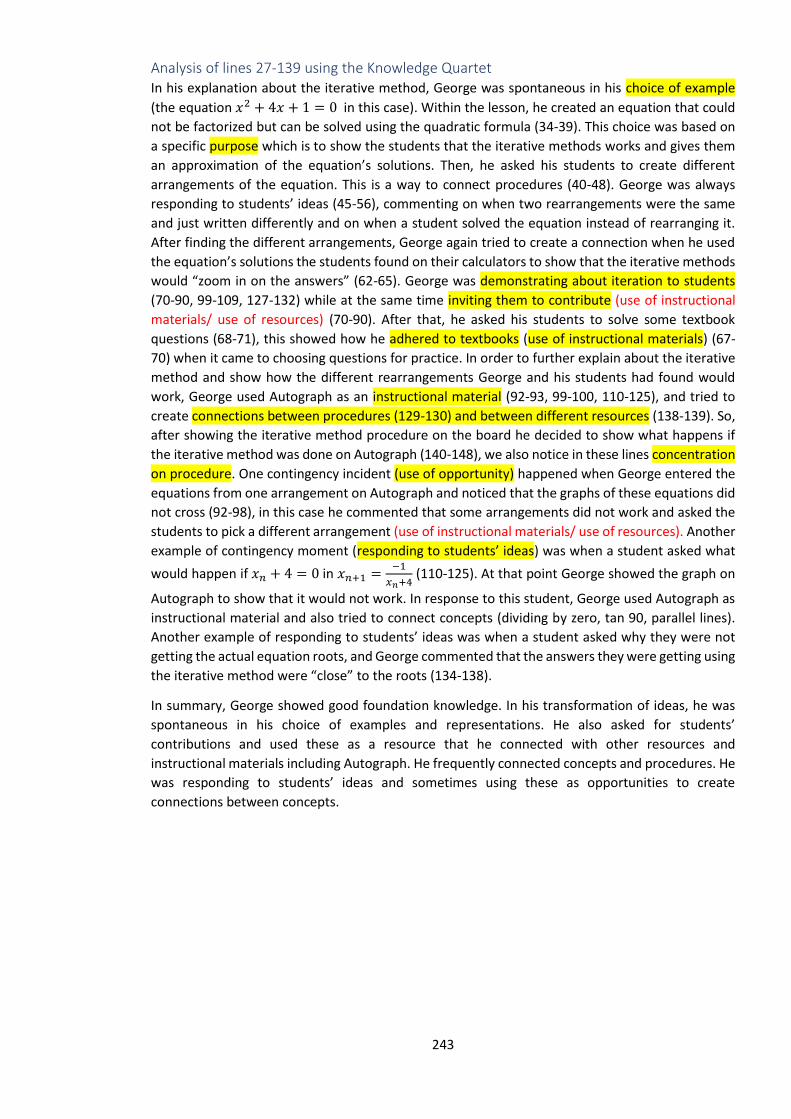
243
Analysis of lines 27-139 using the Knowledge Quartet In his explanation about the iterative method, George was spontaneous in his choice of example
(the equation 𝑥2 + 4𝑥 + 1 = 0 in this case). Within the lesson, he created an equation that could
not be factorized but can be solved using the quadratic formula (34-39). This choice was based on
a specific purpose which is to show the students that the iterative methods works and gives them
an approximation of the equation’s solutions. Then, he asked his students to create different
arrangements of the equation. This is a way to connect procedures (40-48). George was always
responding to students’ ideas (45-56), commenting on when two rearrangements were the same
and just written differently and on when a student solved the equation instead of rearranging it.
After finding the different arrangements, George again tried to create a connection when he used
the equation’s solutions the students found on their calculators to show that the iterative methods
would “zoom in on the answers” (62-65). George was demonstrating about iteration to students
(70-90, 99-109, 127-132) while at the same time inviting them to contribute (use of instructional
materials/ use of resources) (70-90). After that, he asked his students to solve some textbook
questions (68-71), this showed how he adhered to textbooks (use of instructional materials) (67-
70) when it came to choosing questions for practice. In order to further explain about the iterative
method and show how the different rearrangements George and his students had found would
work, George used Autograph as an instructional material (92-93, 99-100, 110-125), and tried to
create connections between procedures (129-130) and between different resources (138-139). So,
after showing the iterative method procedure on the board he decided to show what happens if
the iterative method was done on Autograph (140-148), we also notice in these lines concentration
on procedure. One contingency incident (use of opportunity) happened when George entered the
equations from one arrangement on Autograph and noticed that the graphs of these equations did
not cross (92-98), in this case he commented that some arrangements did not work and asked the
students to pick a different arrangement (use of instructional materials/ use of resources). Another
example of contingency moment (responding to students’ ideas) was when a student asked what
would happen if 𝑥𝑛 + 4 = 0 in 𝑥𝑛+1 =−1
𝑥𝑛+4 (110-125). At that point George showed the graph on
Autograph to show that it would not work. In response to this student, George used Autograph as
instructional material and also tried to connect concepts (dividing by zero, tan 90, parallel lines).
Another example of responding to students’ ideas was when a student asked why they were not
getting the actual equation roots, and George commented that the answers they were getting using
the iterative method were “close” to the roots (134-138).
In summary, George showed good foundation knowledge. In his transformation of ideas, he was
spontaneous in his choice of examples and representations. He also asked for students’
contributions and used these as a resource that he connected with other resources and
instructional materials including Autograph. He frequently connected concepts and procedures. He
was responding to students’ ideas and sometimes using these as opportunities to create
connections between concepts.

244
Appendix H: Application for ethical approval of a research project
UNIVERSITY OF EAST ANGLIA
SCHOOL OF EDUCATION AND LIFELONG LEARNING RESEARCH ETHICS COMMITTEE
APPLICATION FOR ETHICAL APPROVAL OF A RESEARCH PROJECT
This form is for all staff and students across the UEA who are planning educational research.
Applicants are advised to consult the school and university guidelines before preparing their
application by visiting https://www.uea.ac.uk/research/our-research-integrity and reading the
EDU Research Ethics Handbook. The Research Ethics page of the EDU website provides links to the
University Research Ethics Committee, the UEA ethics policy guidelines, ethics guidelines from
BERA and the ESRC, and resources from the academic literature, as well as relevant policy
updates: www.uea.ac.uk/edu/research/researchethics. If you are involved in counselling research
you should consult the BACP Guidelines for Research Ethics:
www.bacp.co.uk/research/ethical_guidelines.php.
Applications must be approved by the Research Ethics Committee before beginning data
generation or approaching potential research participants.
• Staff and Postgraduate (PGR) student applications (including the required attachments)
must be submitted electronically to Dawn Corby [email protected], two weeks before a
scheduled committee meeting.
• Undergraduate students and other students must follow the procedures determined by
their course of study.
APPLICANT DETAILS
Name: Lina Kayali
School: EDU
Current Status: PGR Student
UEA Email address: [email protected]
If PGR Student, name of primary supervisor and programme of study:
Primary supervisor: Dr. Irene Biza
Program of study: PhD in mathematics Education
If UG student or other student, name of Course and Module:

245
The following paperwork must be submitted to EDU REC BEFORE the application can be
approved. Applications with missing/incomplete sections will be returned to the applicant for
submission at the next EDU REC meeting.
Required paperwork ✓Applicant
Tick to
confirm
Application Form (fully completed) ✓
Participant Information sheet (EDU template) ✓
Participant Consent form (EDU templates appropriate for nature of participants
i.e. adult/parent/carer etc.)
✓
Other supporting documents (for e.g. questionnaires, interview/focus group
questions, stimulus materials, observation checklists, letters of invitation,
recruitment posters etc)
✓
2. PROPOSED RESEARCH PROJECT DETAILS:
Title: Forming Identities -The Case of Secondary Mathematics Teachers and
Classroom Technology
Start/End Dates: May 2016 - Sep 2019
3. FUNDER DETAILS (IF APPLICABLE):
Funder: UEA studentship
Has funding been applied for? YES Application Date: Feb 2015
Has funding been awarded? YES
Will ethical approval also be sought for this project from another source? NO
If “yes” what is this source?
4. APPLICATION FORM FOR RESEARCH INVOLVING HUMAN PARTICIPANTS:
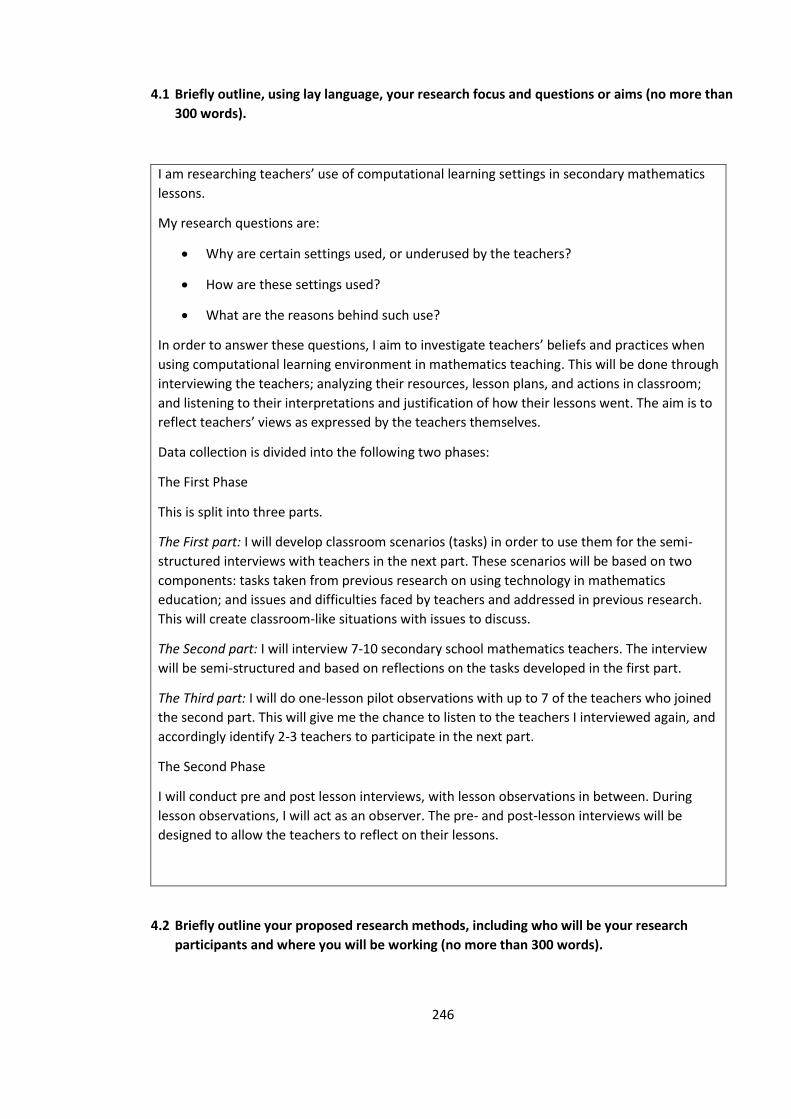
246
4.1 Briefly outline, using lay language, your research focus and questions or aims (no more than
300 words).
I am researching teachers’ use of computational learning settings in secondary mathematics
lessons.
My research questions are:
• Why are certain settings used, or underused by the teachers?
• How are these settings used?
• What are the reasons behind such use?
In order to answer these questions, I aim to investigate teachers’ beliefs and practices when
using computational learning environment in mathematics teaching. This will be done through
interviewing the teachers; analyzing their resources, lesson plans, and actions in classroom;
and listening to their interpretations and justification of how their lessons went. The aim is to
reflect teachers’ views as expressed by the teachers themselves.
Data collection is divided into the following two phases:
The First Phase
This is split into three parts.
The First part: I will develop classroom scenarios (tasks) in order to use them for the semi-
structured interviews with teachers in the next part. These scenarios will be based on two
components: tasks taken from previous research on using technology in mathematics
education; and issues and difficulties faced by teachers and addressed in previous research.
This will create classroom-like situations with issues to discuss.
The Second part: I will interview 7-10 secondary school mathematics teachers. The interview
will be semi-structured and based on reflections on the tasks developed in the first part.
The Third part: I will do one-lesson pilot observations with up to 7 of the teachers who joined
the second part. This will give me the chance to listen to the teachers I interviewed again, and
accordingly identify 2-3 teachers to participate in the next part.
The Second Phase
I will conduct pre and post lesson interviews, with lesson observations in between. During
lesson observations, I will act as an observer. The pre- and post-lesson interviews will be
designed to allow the teachers to reflect on their lessons.
4.2 Briefly outline your proposed research methods, including who will be your research
participants and where you will be working (no more than 300 words).

247
• Please provide details of any relevant demographic detail of participants (age, gender,
race, ethnicity etc)
The participants are secondary school mathematics teachers (KS 3, 4 & 5). They will be
interviewed, then 2-3 of them will be observed over 10-11 lessons. The work will take place in
1-2 schools. I will work on providing qualitative findings established on an interpretative
research methodology.
Data will be collected using interviews and lesson observations as follows:
• Audio-recorded semi-structured interviews based on tasks that will be used as a
trigger of discussion. This will be done with 7-10 teachers. Written answers to the
tasks will be required, followed by a discussion of the teacher’s answers. The data
collected at this stage, will help me identify the teachers who are going to be invited
to participate in the next stage. Interview duration is 30-40 minutes.
• Audio-recorded pilot observations (1 lesson observation) done with up to 7 teachers
that are likely to participate in the next stage. These will help me identify the
participants for the next stage based on the teachers’ actions in classroom and their
ways of using technology for mathematics teaching.
• Audio-recorded or video-recorded lesson observations (over 10 lessons) with pre-
lesson and post-lesson interviews. The interviews in this stage are informal
conversations (over up to 15 minutes per lesson) with teachers about their planning,
expectations, outcomes and evaluations of the lessons. They also include reflection
on events observed during lessons. Data will be collected from the teachers’
comments, actions, worksheets, materials, resources, as well as lesson plans. The
choice between video or audio recordings will be made depending on the consents I
get from the teachers, students, parents and schools.
I might have some of the observed teacher’s students interviewed. This is done to seek
students’ comments on their mathematics lessons and get more data about the teachers’
work. It will happen only if some students volunteer to say something about their teacher or
their lessons; and will be analysed in comparison with the teachers’ aims and comments.
4.3 Briefly explain how you plan to gain access to prospective research participants. (no more
than 300 words).
• If children/young people (or other vulnerable people, such as people with mental
illness) are to be involved, give details of how gatekeeper permission will be obtained.
Please provide any relevant documentation (letters of invite, emails etc) that might be
relevant
• Is there any sense in which participants might be ‘obliged’ to participate – as in the case
of students, prisoners or patients – or are volunteers being recruited? How will you
ensure fully informed and freely given consent in the recruitment process? Entitlement
to withdraw consent must be indicated and when that entitlement lapses.

248
I am planning to recruit participants for part two of the first phase (interviews) in one of two
ways:
1- I will look for secondary school contact details online, then contact the head of school
to check if the school is willing to take part in the study. Hence, a poster will be
handed to the head teacher to post it in the notice board. Also, letters of invite,
information sheet and consent forms will be posted or handed in to the schools and
to the mathematics teachers in these schools.
2- Some mathematics teacher might be contacted directly, without contacting their
schools first. This will happen if their email addresses are available online, or by
passing the information sheets to them through my social network.
By trying to approach teachers directly, or using a poster in a school notice board, the chances
of those teachers feeling obliged to participate because their head teachers want them to will
be reduced.
For the second phase of the study, I will approach the teachers who participated in the first
phase and check if they (upon the approval of their head teachers) are willing to take part in
the second phase of this study. Accordingly, information sheets and consent forms will be
given to head teachers and teachers.
Before I start lesson observations, letters of invites will be prepared and given to students
(KS3, 4 & 5) for parental/adult consent. Although, this study is about teachers and there is no
direct data collection about children, volunteers from students might be sought if the
progress of the data collection implies a need for students’ feedback on their mathematics
lessons. There should not be any chances of students feeling obliged to participate as this will
be on a completely voluntary basis, if needed. And the invitation will be in the form of a
sentence displayed on the board saying “If you wish, you can talk to Lina about your
mathematics lesson after this class finishes”.
4.4 Please state who will have access to the data and what measures will be adopted to
maintain the confidentiality of the research subject and to comply with data protection
requirements e.g. will the data be anonymised? (No more than 300 words.)
I will be the only one who have access the raw date. However, my supervisors will have access
to some of the data (transcripts & recordings). Videotapes, audiotapes and transcripts will be
securely stored, and then destroyed 10 years after the end of the work. Any names to be
mentioned in the thesis or publications will be substitutes for the originals.
Data will be stored in a secure place. Hard copies will be kept in a secure locker. While
electronic data will be kept is a password secured folder in my personal computer and on a
hard drive.

249
4.5 Will you require access to data on participants held by a third party? In cases where
participants will be identified from information held by another party (for example, a
doctor or school) describe the arrangements you intend to make to gain access to this
information (no more than 300 words).
No
4.6 Please give details of how consent is to be obtained (no more than 300 words).
Copies of proposed information sheets and consent forms, written in simple, non-technical
language, MUST accompany this proposal form. You may need more than one information
sheet and consent form for different types of participants. (Do not include the text of these
documents in this space).
For the first phase of this study: Information sheets and consent forms will be given the
teachers who are going to be interviewed and/or to their schools’ heads if they are contacted
through schools.
For the second phase: information sheets and consent forms will be handed in to the
teachers, their students and also their school managers.
4.7 If any payment or incentive will be made to any participant, please explain what it is and
provide the justification (no more than 300 words).
As participating in this study adds more work to the teachers’ schedule, and as a thank you
gesture, I wish to give those who participate in both of the first and second phases £10 gift
vouchers. This will be given at the end of the work and will not be mentioned before or during
the data collection, in order to avoid the risks of the teachers feeling that these vouchers are
given to them in order to say or do specific things.
4.8 What is the anticipated use of the data, forms of publication and dissemination of findings
etc.? (No more than 300 words.)
PhD thesis, conferences posters and papers, and journal articles.

250
4.9 Findings of this research/project would usually be made available to participants. Please
provide details of the form and timescale for feedback. What commitments will be made to
participants regarding feedback? How will these obligations be verified? If findings are not to be
provided to participants, explain why. (No more than 300 words.)
Findings will be made available to participants. A list of recommendations and summary of
outcomes will be handed to participants by summer 2017.
4.10 Please add here any other ethical considerations the ethics committee may need to be
made aware of (no more than 300 words).
• If you are conducting research in a space where individuals may also choose not to
participate, how will you ensure they will not be included in any data collection or
adversely affected by non-participation? An example of this might be in a
classroom where observation and video recording of a new teaching strategy is
being assessed. If consent for all students to be videoed is not received, how will
you ensure that a) those children will not be videoed and/or b) that if they are
removed from that space, that they are not negatively affected by that?
A discrete microphone will be provided to the teachers. In case of video recording, students
who do not wish to participate will be seated in a way that the camera does not capture them
and their data will not be used at all in this study.
4.11 What risks or costs to the participants are entailed in involvement in the
research/project? Are there any potential physical, psychological or disclosure dangers that
can be anticipated? What is the possible harm to the participant or society from their
participation or from the project as a whole? What procedures have been established for
the care and protection of participants (e.g. insurance, medical cover, counselling or other
support) and the control of any information gained from them or about them?
The risks include stress due to the presence of a researcher within the classroom, this applies
to teachers and students.
The information will be only available to the researcher. However, upon publication, and
because there are not many participants taking part in this study, there is a chance that the
participants will be identified by people in their small community who know about the study
and read it.
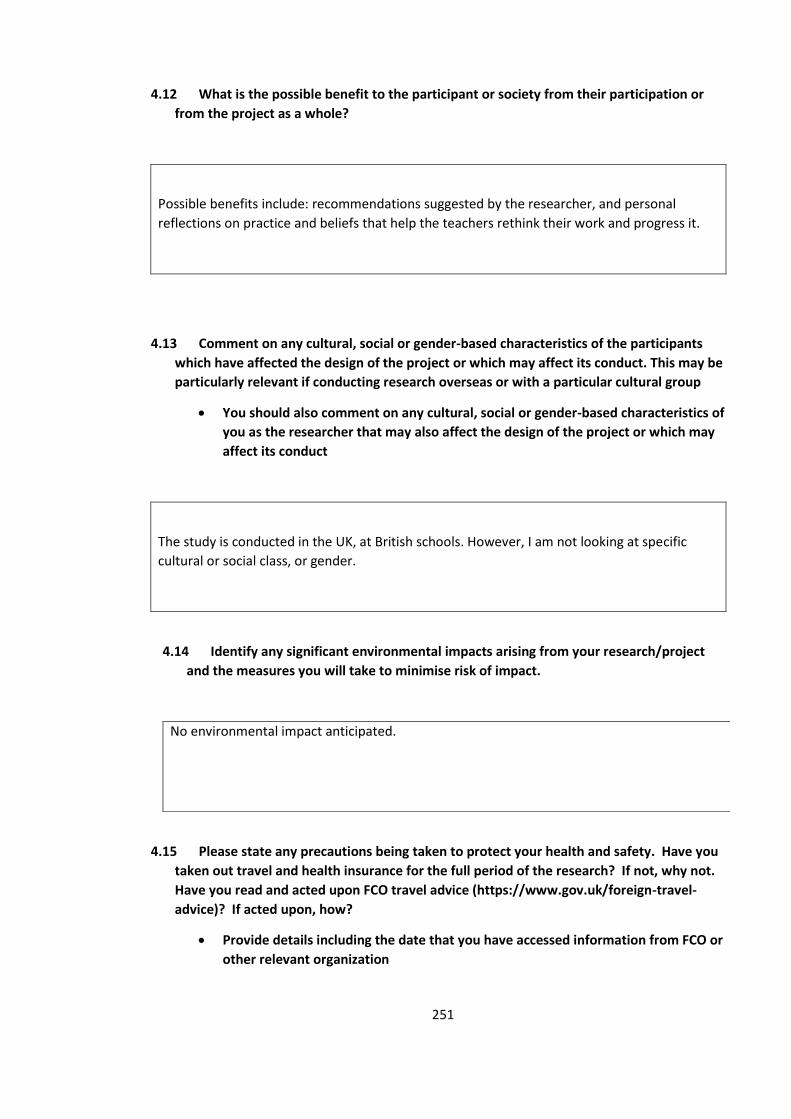
251
4.12 What is the possible benefit to the participant or society from their participation or
from the project as a whole?
Possible benefits include: recommendations suggested by the researcher, and personal
reflections on practice and beliefs that help the teachers rethink their work and progress it.
4.13 Comment on any cultural, social or gender-based characteristics of the participants
which have affected the design of the project or which may affect its conduct. This may be
particularly relevant if conducting research overseas or with a particular cultural group
• You should also comment on any cultural, social or gender-based characteristics of
you as the researcher that may also affect the design of the project or which may
affect its conduct
The study is conducted in the UK, at British schools. However, I am not looking at specific
cultural or social class, or gender.
4.14 Identify any significant environmental impacts arising from your research/project
and the measures you will take to minimise risk of impact.
No environmental impact anticipated.
4.15 Please state any precautions being taken to protect your health and safety. Have you
taken out travel and health insurance for the full period of the research? If not, why not.
Have you read and acted upon FCO travel advice (https://www.gov.uk/foreign-travel-
advice)? If acted upon, how?
• Provide details including the date that you have accessed information from FCO or
other relevant organization
252
• If you have undertaken the EDU Risk Assessment form for Field Study activities,
please indicate if this was approved and date of approval
As my study is taking part in the UK, there is no need for health or travel insurance. But, I
will make sure that my family is aware of my travelling plans and schedule and I have a
working mobile phone to contact people and be contacted when needed.
4.16 Please state any precautions being taken to protect the health and safety of other
researchers and others associated with the project (as distinct from the participants or the
applicant).
No other researchers in this project.
4.17 The UEA’s staff and students will seek to comply with travel and research guidance provided by
the British Government and the Governments (and Embassies) of host countries. This pertains to
research permission, in-country ethical clearance, visas, health and safety information, and other
travel advisory notices where applicable. If this research project is being undertaken outside the
UK, has formal permission/a research permit been sought to conduct this research? Please
describe the action you have taken and if a formal permit has not been sought please explain why
this is not necessary/appropriate (for very short studies it is not always appropriate to apply for
formal clearance, for example).
Not applicable.
4.18 Are there any procedures in place for external monitoring of the research, for instance
by a funding agency?
No
253
5. DECLARATION:
Please complete the following boxes with YES, NO, or NOT APPLICABLE:
I have read (and discussed with my supervisor if student) the University’s Research
Ethics Policy, Principle and Procedures, and consulted the British Educational
Research Association’s Revised Ethical Guidelines for Educational Research and
other available documentation on the EDU Research Ethics webpage and, when
appropriate, the BACP Guidelines for Research Ethics.
Y
I am aware of the relevant sections of the Data Protection Act (1998):
http://www.hmso.gov.uk/acts/acts1998/19980029.htm and Freedom of
Information Act (2005).
Y
Data gathering activities involving schools and other organizations will be carried
out only with the agreement of the head of school/organization, or an authorised
representative, and after adequate notice has been given.
Y
The purpose and procedures of the research, and the potential benefits and costs
of participating (e.g. the amount of their time involved), will be fully explained to
prospective research participants at the outset.
Y
My full identity will be revealed to potential participants. Y
Prospective participants will be informed that data collected will be treated in the
strictest confidence and will only be reported in anonymised form unless identified
explicitly and agreed upon
Y
All potential participants will be asked to give their explicit, written consent to
participating in the research, and, where consent is given, separate copies of this
will be retained by both researcher and participant.
Y
In addition to the consent of the individuals concerned, the signed consent of a
parent/carer will be required to sanction the participation of minors (i.e. persons
under 16 years of age).
Y
Undue pressure will not be placed on individuals or institutions to participate in
research activities.
Y
The treatment of potential research participants will in no way be prejudiced if
they choose not to participate in the project.
Y
I will provide participants with my UEA contact details (not my personal contact
details) and those of my supervisor, in order that they are able to make contact in
relation to any aspect of the research, should they wish to do so. I will notify
participants that complaints can be made to the Head of School.
Y
254
Participants will be made aware that they may freely withdraw from the project at
any time without risk or prejudice.
Y
Research will be carried out with regard for mutually convenient times and
negotiated in a way that seeks to minimise disruption to schedules and burdens on
participants
Y
At all times during the conduct of the research I will behave in an appropriate,
professional manner and take steps to ensure that neither myself nor research
participants are placed at risk.
Y
The dignity and interests of research participants will be respected at all times, and
steps will be taken to ensure that no harm will result from participating in the
research
Y
The views of all participants in the research will be respected. Y
Special efforts will be made to be sensitive to differences relating to age, culture,
disability, race, sex, religion and sexual orientation, amongst research participants,
when planning, conducting and reporting on the research.
Y
Data generated by the research (e.g. transcripts of research interviews) will be
kept in a safe and secure location and will be used purely for the purposes of the
research project (including dissemination of findings). No-one other than research
colleagues, professional transcribers and supervisors will have access to any
identifiable raw data collected, unless written permission has been explicitly given
by the identified research participant.
Y
Research participants will have the right of access to any data pertaining to them. Y
All necessary steps will be taken to protect the privacy and ensure the anonymity
and non-traceability of participants – e.g. by the use of pseudonyms, for both
individual and institutional participants, in any written reports of the research and
other forms of dissemination.
Y

255
I am satisfied that all ethical issues have been identified and that satisfactory procedures are in
place to deal with those issues in this research project. I will abide by the procedures described
in this form.
Name of Applicant: Lina Kayali
Date: 27/04/2016
PGR Supervisor declaration (for PGR student research only)
I have discussed the ethics of the proposed research with the student and am satisfied that all
ethical issues have been identified and that satisfactory procedures are in place to deal with
those issues in this research project.
Name of PGR Supervisor: Dr. Irene Biza
Date: 27/04/2016
EDU ETHICS COMMITTEE 2014/15

256
Appendix I: Ethics application feedback
EDU ETHICS APPLICATION FEEDBACK 2015-2016
APPLICANT DETAILS
Name: Lina Kayali
School: EDU
Current Status: PGR Student
UEA Email address: [email protected]
EDU REC feedback to applicant: Chair review date 2.6.16………………………..
Comments: the Chair thanks you for your responses and can now give full approval; you may
begin data collection. Please ensure you use the revised PIS forms and address the
additional point under 4.2. within any that you use.
EDU Recommendation ✓
Approved, data collection can begin ✓
Minor revisions/further details required (see feedback below)
Not Approved, resubmission required (see feedback below)
257
Application form
4.2 - the first part of the descriptor is confusing and doesn’t match to what was said in 4.1 in
regards to overall how many – it appears that the first section is describing the ‘proper’
project rather than the pilot? Please clarify
The second sentence in the descriptor has been amended to “They will be interviewed, then
I will do a pilot observation with up to 7 of them, and finally 2-3 of them will be
observed over 10 lessons” – addressed and approved
4.2 – please clarify the indication of the ‘I might have some of the observed teacher’s
students interviewed’. Will you or won’t you?
I will if I get parents’ and students’ consent, if not I will reflect on the class’s engagement and
overall participation. So, the last paragraph in 4.2 was changed to “Audio recorded
interviews with students. This is done to seek students’ comments on the mathematics
lessons I observe, and get more data about the teachers’ work. It will happen only if
some students volunteer to say something about their teacher or their lessons; and
will be analyzed in comparison with the teachers’ aims and comments. If no students
volunteer, I will not conduct any interviews with students and instead I will reflect on
students’ engagement in classroom” - – addressed and approved and you need to
ensure that the ‘possibility’ of this is identified in the relevant PIS
4.11 – even though the risks may be minimal, can you reflect on what those issues may be
in more detail and what might you do to alleviate them?
More details were added and highlighted:
• The risks include stress due to the presence of a researcher within the classroom,
this applies to teachers and students. Regarding the teachers, I will assure them
that this study is not done to evaluate their performance. Also, having the
teachers interviewed will help minimize this risk as they will be familiar with the
researcher by the time of the observation. Also having informal interviews before
and after the lesson will help making the teachers more comfortable. Regarding
258
students, I will do my best to make my presence in the class unnoticed by acting
as an observer, in a way that does not disturb their usual lesson flow.
• There is a chance that teachers might be pushed by their school management to
take part in the study. In an attempt to avoid this, I will try to approach teachers
individually or through posters in schools.
• The chances of students feeling obliged to participate in interviews should be
minimal as this will be on a completely voluntary basis. And the invitation will be
in the form of a sentence displayed on the board saying “If you wish, you can talk
to Lina about your mathematics lesson after this class finishes”. I will also assure
the students that I will not share what they say with their teachers and their
names will be anonymized. I will phrase the interview questions in a way that
makes the students feel comfortable.
• The information will be only available to the researcher. However, upon
publication, and because there are not many participants taking part in this
study, there is a chance that the participants will be identified by people in their
small community who know about the study and read it. – addressed and
approved
PIS parents
(13) Who is running the study? Should have your supervisor’s details too
(14) Supervisor details inseted “under the supervision of Dr. Irene Biza, School of
Education and Lifelong Learning, University of East Anglia”. – addressed and
approved
(15) Section ‘Does my child have to be in the study? Can they withdraw from the
study once they've
(16) started? If you’re able to identify students so they won’t be included in any
note taking etc, then
(17) you should be able to identify any student that you videoed in the classroom
observations. This
259
(18) needs to be adjusted. You need to clarify what you mean by an interview
conversation and then the
(19) ‘lesson recordings’. If the latter is the video observations you should state
this and clarify the
(20) withdrawal process.
Lesson recordings are lesson observations that are audio or video recorded, depending on
what the participants agree on. Interviews are individual interviews (to talk about the
child’s maths lesson). The sentence “However, it will not be possible to withdraw their
individual comments from our lesson recordings once they have started, as it is a group
discussion.” was deleted and replaced by “In the latter case, data from individual child
will not be used, but the data about the general group activity will be used to comment
on teachers’ use of technology”. – addressed and approved
(21)
(22) Complaint process – this should be you, then your supervisor and then Nalini
Supervisor details inserted:
“If you would like to speak to someone else you can contact my supervisor:
Dr. Irene Biza
School of Education and Lifelong Learning
University of East Anglia
NORWICH NR4 7TJ
Tel: +44 (0) 1603 591741
Email: [email protected]” – addressed and approved
(23) Consent section – in the first you have ‘interview’ and in the second you have
‘focus group’. Clarify
(24) which one and adjust forms accordingly
(25) Adjusted as “interview” – addressed and approved
(26)

260
PIS child
Videoing the session – why can’t you remove their data afterwards? See point identified in
PIS parents
Deleted the sentence: “When I video record the lesson, I won’t be able to take out the things
you say after you have said them. This is because you will be talking in a group and our
notes will have all the things that everyone else said as well”. You are free to stop
participating at any stage or to refuse to answer any of the questions. If you decide at
a later time to withdraw from the study your information will be removed from our
records and will not be included in any results, up to the point we have analysed and
published the results”. – addressed and approved
How will you plan to tell the children about the outcome of the study? You could indicate
that you will give the feedback to the teacher who will share this with them
Amended the last sentence “when I finish the study I will tell your teacher what I learnt and
s/he will share this with you.” – addressed and approved
PIS teacher interviews phase 1
Section 2 Should have your supervisor’s details too
Supervisor details inserted – addressed and approved
Section 11 - this should be you, then your supervisor and then Nalini
Supervisor details inserted – addressed and approved
PIS teachers phase 2
Section 2 Should have your supervisor’s details too
Supervisor details inserted – addressed and approved
261
Section 5 – what about withdrawal from the observations?
Withdrawal from study includes withdrawal from both observations and interviews. –
addressed and approved
Section 11 - this should be you, then your supervisor and then Nalini
Supervisor details inserted – addressed and approved
Action required by applicant:
Address requests and points of clarification
Adjust PIS documents
Signed: EDU Chair, Research Ethics Committee
Ethical approval has now been given:
Copyright © 2022 FDOKUMEN