The prospective mathematics teachers’ thought processes and views about using problem-based...
21
International Journal of Mathematical Education in Science and Technology, 2011, 1–21, iFirst The prospective mathematics teachers’ thought processes and views about using problem-based learning in statistics education Berna Cantu¨rk-Gu¨nhan a * , Esra Bukova-Gu¨zel b and Zekiye O ¨ zgu¨r c a Department of Primary Mathematics Education, Faculty of Buca Education, Dokuz Eylul University, Izmir, Turkey; b Department of Secondary Science and Mathematics Education, Faculty of Buca Education, Dokuz Eylul University, Izmir, Turkey; c Department of Curriculum and Instruction, School of Education, University of Wisconsin-Madison, Madison, WI, USA (Received 12 March 2010) The purpose of this study is to determine prospective mathematics teachers’ views about using problem-based learning (PBL) in statistics teaching and to examine their thought processes. It is a qualitative study conducted with 15 prospective mathematics teachers from a state university in Turkey. The data were collected via participant observation and semi-structured interviews. To determine their thought processes, all PBL sessions and interviews were audio-taped. The analysis of the data suggests that the participants liked the PBL application. They had overall positive views regarding PBL, although there were some stated concerns regarding the applicability of PBL in Turkish schools due to insufficient means. The findings also suggest that PBL sessions enhanced their self-expressions; hence, their thought processes had developed in the course of PBL application. We hope that this study will contribute to future studies about the use of PBL method in statistics teaching. Keywords: problem-based learning; prospective mathematics teachers; statistics education; thought processes 1. Introduction Statistics is of great importance for many disciplines such as education, business, and other social sciences, since acquiring and applying knowledge and skills gained in statistics are crucial for those disciplines [1]. Thus, teaching statistics has been attracting more attention not only from statisticians but also from various specialists involved in other disciplines. National Council of Teachers of Mathematics [2] reported that ‘collecting, organizing, describing and interpreting data ... are skills that are increasingly important in a society based on technology and communica- tion’. Therefore, improving these skills should be the main goal of statistics education. Cobb [3] argues that the main goal of statistics education is to be able to read and comprehend statistics presented in scientific publications, newspapers and other media. Statistics education is necessary for reading and understanding information encountered in daily life. However, many researchers like Shaughnessy and Garfield *Corresponding author. Email: [email protected] ISSN 0020–739X print/ISSN 1464–5211 online ß 2011 Taylor & Francis DOI: 10.1080/0020739X.2011.592611 http://www.informaworld.com Downloaded by [Institutional Subscription Access] at 04:16 06 September 2011
Transcript of The prospective mathematics teachers’ thought processes and views about using problem-based...
International Journal of Mathematical Education inScience and Technology, 2011, 1–21, iFirst
The prospective mathematics teachers’ thought processes and views
about using problem-based learning in statistics education
Berna Canturk-Gunhana*, Esra Bukova-Guzelb and Zekiye Ozgurc
aDepartment of Primary Mathematics Education, Faculty of Buca Education,Dokuz Eylul University, Izmir, Turkey; bDepartment of Secondary Science and
Mathematics Education, Faculty of Buca Education, Dokuz Eylul University, Izmir,Turkey; cDepartment of Curriculum and Instruction, School of Education,
University of Wisconsin-Madison, Madison, WI, USA
(Received 12 March 2010)
The purpose of this study is to determine prospective mathematics teachers’views about using problem-based learning (PBL) in statistics teaching andto examine their thought processes. It is a qualitative study conducted with15 prospective mathematics teachers from a state university in Turkey.The data were collected via participant observation and semi-structuredinterviews. To determine their thought processes, all PBL sessions andinterviews were audio-taped. The analysis of the data suggests that theparticipants liked the PBL application. They had overall positive viewsregarding PBL, although there were some stated concerns regarding theapplicability of PBL in Turkish schools due to insufficient means.The findings also suggest that PBL sessions enhanced their self-expressions;hence, their thought processes had developed in the course of PBLapplication. We hope that this study will contribute to future studies aboutthe use of PBL method in statistics teaching.
Keywords: problem-based learning; prospective mathematics teachers;statistics education; thought processes
1. Introduction
Statistics is of great importance for many disciplines such as education, business, andother social sciences, since acquiring and applying knowledge and skills gained instatistics are crucial for those disciplines [1]. Thus, teaching statistics has beenattracting more attention not only from statisticians but also from various specialistsinvolved in other disciplines. National Council of Teachers of Mathematics [2]reported that ‘collecting, organizing, describing and interpreting data . . . are skillsthat are increasingly important in a society based on technology and communica-tion’. Therefore, improving these skills should be the main goal of statisticseducation. Cobb [3] argues that the main goal of statistics education is to be able toread and comprehend statistics presented in scientific publications, newspapers andother media.
Statistics education is necessary for reading and understanding informationencountered in daily life. However, many researchers like Shaughnessy and Garfield
*Corresponding author. Email: [email protected]
ISSN 0020–739X print/ISSN 1464–5211 online
� 2011 Taylor & Francis
DOI: 10.1080/0020739X.2011.592611
http://www.informaworld.com
Dow
nloa
ded
by [
Inst
itutio
nal S
ubsc
ript
ion
Acc
ess]
at 0
4:16
06
Sept
embe
r 20
11
have demonstrated that students find statistics very difficult to understand [4].Research on statistics education suggests that data analysis and critical thinkingthrough realistic questions are crucial components of a statistics course. Hence,researchers conceive statistics as problem solving rather than a set of formulae andoperations [4–6]. Garfield [4] asserts that in traditional statistics classes wherestudents are lectured and assigned homework from textbooks, students cannotusually gain statistical thinking and reasoning skills; therefore, they cannot fullybenefit from the opportunities to learn statistics. In contrast, it is highly likely forstudents to enhance their understanding of statistics concepts [7] and to overcometheir misconceptions [8] if the courses are based on activities involving small groupstudies. In sum, non-traditional learning approaches and methods can improvestudents’ learning.
Statistics is considered easy to adapt to the constructivist theory which rejectsrote learning and traditional teaching in which knowledge is received by studentsthrough lectures and textbooks. Constructivism advocates student-centred learning;that is, students should play an active role in their own learning since new knowledgecan be gained only through interaction [9]. Students learn better if they are givenopportunities to apply their knowledge into new situations. As long as studentscalculate answers only to familiar problems, they cannot learn how to analyseinformation thinking critically; as a consequence, they cannot deal with originalproblems or situations [4]. From this point of view, it seems essential to use differentlearning methods based on constructivism rather than traditional teaching in orderto achieve the goals of statistics education: ‘problem based learning’ (PBL) is one ofthese methods that can be used in statistics education. At the heart of this method,small groups of students collaboratively construct new knowledge by dealing withcomplex real problems.
In Turkey, primary and secondary school mathematics curricula were revised in2004, based on the constructivist philosophy. Teaching statistics was the distinct lackof the former curricula, and with this revision, statistical concepts have eventuallygained the attention they deserve. Especially, organizing, analysing and interpretingdata have received great attention. Similar to the reform movements in Turkey, dataanalysis and statistics have also been emphasized in the mathematics curricula fromelementary education through secondary education of other countries such as theUS, Argentina and New Zealand [10,11]. When designing the new mathematicscurricula in Turkey, special attention was given to make statistics educationunremitting and coherent from the very beginning of elementary education to theend of secondary education. Therefore, this increased emphasis on statisticseducation requires mathematics teachers to have strong knowledge of statistics.According to Nicholson, Road and Darnon (2003); Batanero, Godino and Roa(2004); Rodrigues, Oliveria, Souza, Kataoka and Oliveria (2006), teachers’ poorknowledge of statistics is one of the main difficulties encountered in teachingprobability and statistics [12]. In addition to that, novice teachers are claimed to begraduating with deficiencies in basic statistical concepts, which, in turn, is highlylikely to cause difficulties in their future teaching [10]. In particular, experimentaldesign, re-sampling methods, randomization, relative risk, variation, exploratorydata analysis and statistical inference are the areas that teachers are found to failmost [11]. Thereof teachers need support in terms of both content knowledge andteaching approaches in those areas. However, research on statistics education is
2 B. Canturk-Gunhan et al.
Dow
nloa
ded
by [
Inst
itutio
nal S
ubsc
ript
ion
Acc
ess]
at 0
4:16
06
Sept
embe
r 20
11

relatively new compared to mathematics education research. Likewise, statisticalcontent knowledge that mathematics teachers ought to possess needs to be furtherexamined and established. We believe that statistics concepts should constitute asignificant component of the prospective mathematics teachers’ content knowledge.Along with statistical content knowledge acquisition, it is also necessary to benefitfrom new teaching approaches in statistics teaching.
In this study, PBL method was used in statistics teaching in the course of theprospective mathematics teachers’ training. Therefore, the purpose of this study is todetermine the prospective mathematics teachers’ views about PBL and its applicationin statistics education, and to examine their thought processes about the statisticalconcepts, such as organization, analysis and interpretation of the data. Furthermore,we investigated how PBL affects prospective teachers’ learning of statistics concepts,and how they construct knowledge and gain higher order thinking skills in thisprocess.
2. Theoretical background
2.1. Statistics education
Statistics emerged about two centuries ago to meet the needs of society, especially inscience and government, and for one century it has mostly been used in quantitativestudies [13]. Owing to the fact that statistics is of great importance for otherdisciplines as well, an effective statistics education is vitally important for people tounderstand and interpret the world and happenings around us.
Garfield [4] equates learning statistics with learning to communicate in statisticallanguage. To be more precise, she believes that solving statistical problems by meansof drawing conclusions and supporting them via explaining the reasoning behindthem are crucial. Scheaffer [13] assesses statistics learning in three stages. In the firststage, he expects students to understand what the numbers mean in a chart, graph ortable. Secondly, he thinks that students should be able to use the existing data in adecision-making process. At the final stage, students are expected to pose a specificquestion, and then to design a study to solve this problem by collecting and analysingdata and drawing a conclusion at the end.
The necessity for specific changes in teaching, generally in mathematics andscience education, and particularly in statistics education, has been stressed in severalreports [14]. In the modern philosophy of teaching statistics, as ‘understanding’ and‘communication’ are highly emphasized, ‘data analysis’ has earned a central role.This philosophy stresses the necessity of using interesting real-life problems that arerelevant to students’ lives, and suggests using more than one approach in solvingproblems. It also highlights that teachers should give students more time to think andwrite in statistics classes, instead of just doing calculations [13]. Likewise, Cobb [3]underlines the significance of statistical thinking, and considers data and concepts tobe more important than theories; therefore, he supports active learning in teachingstatistics. Heaton and Mickelson [15] also conclude that it is prevalent in the existingliterature that statistics instruction needs to be activity-based in order to confrontmisconceptions and develop correct statistical understanding.
Traditional methods of teaching introductory statistics are often viewed asineffective since they fail to establish a clear link between statistics and its uses in
International Journal of Mathematical Education in Science and Technology 3
Dow
nloa
ded
by [
Inst
itutio
nal S
ubsc
ript
ion
Acc
ess]
at 0
4:16
06
Sept
embe
r 20
11
real world. As a result, educational theorists recommend relating statistics with real
life and suggest cooperative learning activities, instead of traditional lectures [16].
Taking the above-mentioned recommendations into consideration, PBL, one of the
active learning methods, was used in the statistics training of pre-service mathematics
teachers in this study.
2.2. Problem-based learning
Constructivism is a learning philosophy which proposes that learners need to build
their own understanding of new ideas. The process of PBL, similarly, requires the
learner to construct new understanding, meanings and concepts through collabo-
ration between peers towards the solution of original real-world problems. Since
PBL is a method in which learners are actively constructing their own knowledge, the
PBL philosophy is, in essence, a constructivist philosophy [17].In accordance with the argument of constructivist philosophy that knowledge is
constructed through interactions in a group of learners, PBL method allows working
in small groups formed by randomly selected students. Indeed, student-centred
learning in small collaborative groups is the main characteristic of PBL. Owing to
small group activities, students in PBL are more actively involved in the learning
process as they can freely express their opinions and interact with their peers, as
opposed to the traditional lectures where they just listen [4].PBL is designed with several important goals. It is designed to help students
construct an extensive and flexible knowledge base and develop effective problem-
solving skills, along with self-directed, lifelong learning skills [18]. PBL is a process in
which meaningful problems are investigated, explained and resolved, respectively
[19,20]. A PBL tutorial session begins by presenting a group of students with minimal
information about a complex problem [19]. The problem should:
(1) require more information than given at first,(2) have more than one solution route,(3) allow students to be flexible as new information is obtained,(4) not be clear about the ‘right’ decision,(5) create interest and controversy,(6) be open-ended and complex, requiring collaboration and thinking and(7) be original [21,22].
Although a PBL scenario may work in different ways, the following steps are
common:
(1) The teacher presents the PBL scenario to students along with its evaluation
rubric and the steps students should follow to solve the scenario.(2) Groups work on the scenario with the presence of the teacher.(3) Students do individual research on topics related to the scenario.(4) Students share with their group the research they have done, and they
establish the problems to solve.(5) Students work collaboratively and cooperatively with their team members to
propose a solution to the problems they stated.(6) Students present their work to their classmates and hand out its report.
4 B. Canturk-Gunhan et al.
Dow
nloa
ded
by [
Inst
itutio
nal S
ubsc
ript
ion
Acc
ess]
at 0
4:16
06
Sept
embe
r 20
11
(7) The teacher comments on the similarities and differences among the groups’work, and pulls out of their presentations the main concepts involved in theproblems and their solutions.
(8) The teacher evaluates the report using the PBL rubric [23].
There is one more point that needs to be underlined: the teacher’s role. In thePBL sessions, the teacher acts as a facilitator and guides students’ learning as aimedin constructivism. By asking them appropriate questions and encouraging them tothink, the facilitator helps students justify their thinking so that they can improvetheir high-order thinking skills [24].
In fact, PBL approach is not new in education. The widespread use of PBL can befound in the US, Europe, The Middle East, The Far East and Australia [22].However, the extant literature indicates that research on PBL has generally beenconducted in the field of medical education, and that PBL has found a wider use inthat field. Its implementation in medical training dates back to the early 1960s(Thomas and Chan, 2002 as cited in [17]). On the other hand, studies regarding PBLin statistics education are quite limited. In one of these studies, Evia [23] used PBLapproach in an undergraduate statistics course and showed that it improvedstudents’ understanding of statistics, and encouraged them to use different skills tosolve problems. Boyle [25] examined the use of PBL approach in biostatisticsteaching. At the end of the study, student evaluations indicated satisfaction with thisapproach. Boyle [25] concluded that knowledge acquired in PBL is retained longer,remembered and utilized more easily as the main focus of PBL method is usinginformation to solve problems. PBL method helps students develop a strategy fordealing with problems, gives them a mental framework for evaluating alternativemethods of analysis, and motivates them to take responsibility for their ownlearning. On the other hand, Bland [26] states that he looked for a statistics courseintegrated with PBL in Australia, yet he could not find a single instance of trulyintegrated statistics teaching and research methods through PBL. Above all, there isno research, to our knowledge, about PBL application in prospective mathematicsteachers’ statistics course. Thus, this study is meant to contribute to fill this gap inthe field.
3. Methodology
This is a qualitative study that aims to determine prospective mathematics teachers’views about using PBL in teaching statistical concepts and investigate their thoughtprocesses while they learn statistical concepts through PBL sessions. A qualitativeresearch approach was taken because it allows in-depth investigation of the thoughtprocesses of participants, and thus enables us to suggest recommendations on how tomake statistics courses more effective. PBL was realized as 3-week modules ondifferent statistical concepts; the main statistical concepts, discrete probabilitydistributions and normal distributions. In this study, the module on the mainstatistical concepts is presented.
3.1. Participants
The participants of this study included 15 prospective secondary mathematicsteachers (nine female and six male), from a large state university in Turkey.
International Journal of Mathematical Education in Science and Technology 5
Dow
nloa
ded
by [
Inst
itutio
nal S
ubsc
ript
ion
Acc
ess]
at 0
4:16
06
Sept
embe
r 20
11
Prospective secondary school mathematics teachers in Turkey enrol in a 5-yearundergraduate programme which is integrated with a non-thesis master’s degree.During the first three and a half year, the main focus of the programme is subjectmatter knowledge acquisition, then the focus shifts onto pedagogical knowledgeacquisition and to pedagogical content knowledge acquisition in the last one and ahalf year. In the participants’ teacher education programme, statistics is a third-yearcourse, which covers organizing and graphing data, normal distributions, parametricand non-parametric analysis and correlation analysis. None of the participants wereat that point of their study yet, in other words, they had not taken any statisticscourse before this PBL application. Furthermore, the participants did not have astatus relationship with the researchers. They volunteered to participate in this studysince, in our opinion, they considered those PBL modules as an opportunity to beginlearning statistics earlier, and to have an experience with a new learning method.They were clearly informed that participating in this study would not affect theirgrades in any way.
3.2. Instruments
Qualitative data were collected through participant observation and semi-structuredinterviews. To better understand and describe the prospective mathematics teachers’thought processes, the researchers observed the participants while they wereengaging with the learning experiences. The entire PBL sessions were also audio-taped in order to determine their thought processes in group activities. For semi-structured interviews, two prospective mathematics teachers, one male and onefemale, were randomly selected from each of three PBL groups. Thus, six interviewswere conducted in total. Following an interview guide, four open-ended questionswere asked to the interviewees, and each interview lasted about 15–20min. Theinterview guide was presented to three mathematics educators different than theresearchers to take their suggestions. Then, the guide was revised accordingly. Allinterviews were recorded via audio-recorder, and then transcribed.
3.3. Materials
For the purposes of the study, a PBL module based on a scenario that is related toreal-world problems was designed. The module, named ‘Which one is moresuccessful?’ (Appendix 1), consists of the concepts of collecting, organizing,describing, graphing and interpreting data. The PBL scenario was carefullyconstructed in order to lead the prospective mathematics teachers step-by-stepfrom general aims to specific aims as PBL suggests. In parallel with constructivism,the PBL scenario was written so as to make it relevant to the prospectivemathematics teachers’ daily and future professional life in order to generate morediscussion and interaction among students. While writing the scenario, the learningobjectives of ‘organizing and analysing data’ were also taken into account. Thelearning objectives that were expected from the prospective mathematics teachers togain during this module are summarized in Table 1. The designed PBL module waspresented to a statistics teacher to get feedback on whether the module was suitablefor those learning objectives or not.
6 B. Canturk-Gunhan et al.
Dow
nloa
ded
by [
Inst
itutio
nal S
ubsc
ript
ion
Acc
ess]
at 0
4:16
06
Sept
embe
r 20
11

3.4. Procedure
The PBL module presented in this study was carried out for 3 weeks. The facilitators
randomly formed three groups of five prospective mathematics teachers, and twofacilitators guided each group during the application. At the beginning of the study,
the participants were informed about the guidelines of the PBL, and about how thesessions would be carried out. They were also asked to determine the rules to be
obeyed for the purpose of maintaining the efficiency of the PBL application.The sessions were conducted in a relaxing setting where the participants were
seated around an oval desk which allows them to interact with each other and discusstheir opinions freely. Each session began with informal conversation with the
participants for about 5–10min to get their attention and also to accustom them
to this method.At the beginning of the PBL module, the cover page and the tasks related to the
first session were delivered to the participants. However, they were not allowed tomove to the next page before completing the discussion on the preceding page.
Having examined only the cover page, the participants were asked to guess what thescenario could be about and to explain their thoughts.
During the application, brainstorm technique was used to leverage participants’
prior knowledge and make them recognize what they need to know for understand-ing the new concepts that occurred in the tasks. For each session, the participants
were asked to define the learning objectives for themselves, research the conceptsthey need to know and identify what they need to learn more for the tasks they were
engaging in. The facilitators avoided giving direct information when the prospectivemathematics teachers had a difficulty and needed assistance. Instead, the participants
were encouraged to reach a conclusion by their own reasoning. All PBL sessions
Table 1. The learning objectives.
Module name Subject Sessions Objectives
Which one is moresuccessful?
Organizing andanalysing data
1st session Determining the problem;developing hypotheses;discussing how to organizeand graph the data; definingthe relation of data to itsmean
2nd session Narrowing down the hypothe-ses with new information;deciding how to organize thedata; tabulating and graph-ing; calculating mean,median, and mode on table;comparing with each other
3rd session Completing the scenario;posing questions, providingtransfer of knowledge;calculating mean, median,mode, standard variation,and quartiles
International Journal of Mathematical Education in Science and Technology 7
Dow
nloa
ded
by [
Inst
itutio
nal S
ubsc
ript
ion
Acc
ess]
at 0
4:16
06
Sept
embe
r 20
11

were observed by a researcher and were also audio-taped in order to better capturethe interactions that occurred among the participants and the facilitators. At the endof the each PBL session, the participant feedbacks and evaluations were taken.Following the PBL application, six randomly selected participants – one male andone female participant from each three PBL group – were interviewed.
3.5. Analysis
The interviews were audio-taped, then transcribed, and subsequently analysed byeach researcher individually. Analysis was guided by the ideas of qualitative contentanalysis, and addressed the following main themes: ‘The Prospective MathematicsTeachers’ General Views about PBL and its Application’, ‘The ProspectiveMathematics Teachers’ Views about PBL Learning Environment versusTraditional Learning Environment’, ‘The Prospective Mathematics Teachers’Views about Changed Roles in PBL’ and ‘The Prospective Mathematics Teachers’Views about PBL Scenario’. The reliability of the interview analysis was checkedagainst three researchers’ coding. The consistency of the coding was determined bythe formula (P¼ Na
NaþNd) given in the study of Miles and Huberman [27], where P isthe per cent of consistency, Na is the consistency amount and Nd is the inconsistencyamount. The consistency of the coding was found to be 0.95 (P¼ 95).
While analysing the prospective mathematics teachers’ thought processes, theaudio records of the PBL sessions were thoroughly examined by the researchers toanalyse their participation and responses in each session.
4. Finding and results
4.1. The prospective mathematics teachers’ views about PBL and its application
In this part, we discuss the findings from the semi-structured interviews. During theinterview, the interviewees were asked to answer questions like: ‘What do you thinkabout PBL?’. ‘What are the strengths and weaknesses of PBL method?’. ‘How doyou compare the PBL learning environment with the traditional learning environ-ment?’. ‘How do students’ and teachers’ roles change in PBL?’ and ‘What needs to betaken into account in the design of a PBL scenario?’.
The prospective mathematics teachers’ general views about PBL and itsapplication were summarized in Table 2. Table 2 was organized under two mainthemes as the interviewees’ positive views and the possible problems about PBLapplication.
As it is seen in Table 2, all interviewees stated that PBL relates learning to thereal world. Five prospective mathematics teachers indicated that this methodencouraged them to share their ideas, increased communication, made lessonmore interesting and was fun for the students. Furthermore, four of the intervieweessaid that PBL created an active learning environment, developed students’self-evaluation and self-regulation abilities and gave equal opportunities foreveryone. Half of the interviewees remarked that this method improved criticaland creative thinking.
These prospective mathematics teachers generally expressed positive viewsregarding PBL, however; there were also some reservations about the applicability
8 B. Canturk-Gunhan et al.
Dow
nloa
ded
by [
Inst
itutio
nal S
ubsc
ript
ion
Acc
ess]
at 0
4:16
06
Sept
embe
r 20
11

of PBL in Turkish schools due to insufficient means. Inadequate technologicalresources, difficulties in getting access to resources at schools, unsuitable classroomsettings for PBL discussions and large number of students were among the statedconcerns regarding the PBL application in Turkish schools. Another concernexpressed by almost all interviewees (n¼ 5) was that active participation of eachstudent is at the core of this method. Active involvement of all students is soimportant for PBL that if some students do not realize their tasks in this process suchas making research, performing their responsibilities, then the PBL applicationcannot be fulfilled in a successful way. Furthermore, half of the interviewees pointedout that for some students not being able to express their thoughts can create anotherproblem in PBL application, besides inadequate facilities.
On the other hand, one of the interviewees uttered that ‘I wish we will have theopportunity to use this method when we become a teacher because I really liked thismethod!’ One interviewee suggested that ‘This method can decrease students’anxiety, fear and negative attitude towards mathematics’. Another intervieweesupported this idea by claiming that using such scenarios can make students likemathematics. A comment made by another participant is as follows: ‘Actually, Iliked this method more compared to the methods used in other courses. Whatsurprised me is that some of my friends who never participate in courses activelyparticipated in this PBL application. That’s why it was so nice!’
Another positive opinion held by the prospective mathematics teachers is thatPBL enables students to think creatively and gives them self-confidence. Aninterviewee went on to say that PBL leads students to think in different ways.Another reflected his views as in the following statement: ‘What I like in PBL is thatstudents come to see that they can interpret and think alternatives concerning thesituation discussed’. Furthermore, another interviewee claimed that ‘This methodprovides students with not only mathematical knowledge but also other importantabilities such as self-expression and helps them to be an active learner in othercourses, too’.
Table 2. The prospective mathematics teachers’ general views about PBL and its application.
The prospective mathematics teachers’ views N
The positive views It relates learning to the real world. 6It encourages students to share their ideas and increases
communication among students and teacher5
It makes lesson interesting and is fun for students. 5It enables active learning 4It helps students develop self-evaluation and self-regulation
skills.4
It gives equal opportunities for everyone 4It improves critical- and creative-thinking 3
The possible problems Students may not perform their responsibilities, e.g. makingresearch, sharing tasks . . .
5
Some students may not be able to express their thoughts inPBL sessions
3
Some schools may lack adequate basic facilities such asteacher, classroom, etc.
3
International Journal of Mathematical Education in Science and Technology 9
Dow
nloa
ded
by [
Inst
itutio
nal S
ubsc
ript
ion
Acc
ess]
at 0
4:16
06
Sept
embe
r 20
11
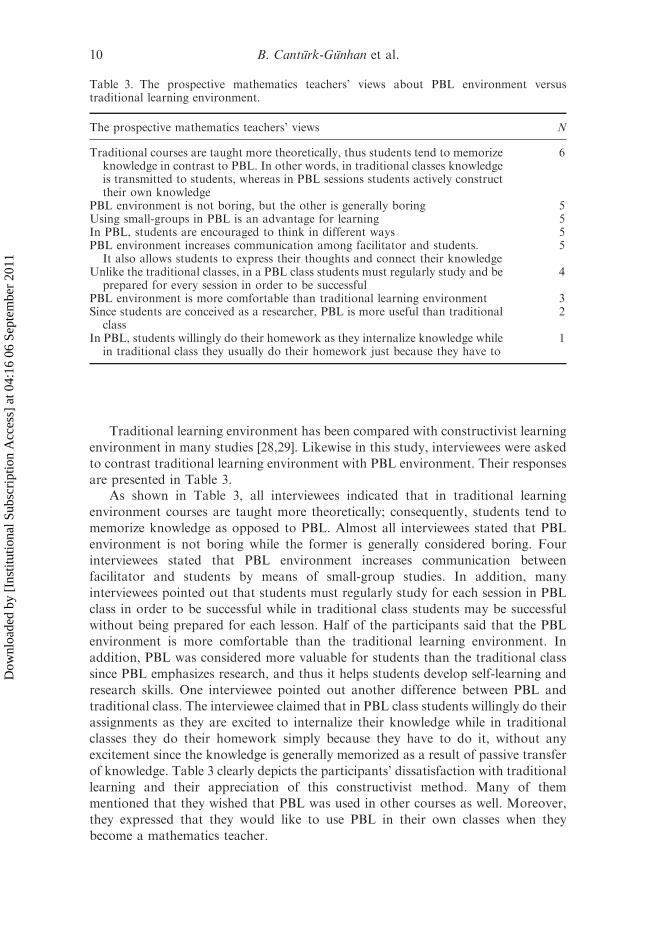
Traditional learning environment has been compared with constructivist learning
environment in many studies [28,29]. Likewise in this study, interviewees were asked
to contrast traditional learning environment with PBL environment. Their responsesare presented in Table 3.
As shown in Table 3, all interviewees indicated that in traditional learning
environment courses are taught more theoretically; consequently, students tend to
memorize knowledge as opposed to PBL. Almost all interviewees stated that PBL
environment is not boring while the former is generally considered boring. Fourinterviewees stated that PBL environment increases communication between
facilitator and students by means of small-group studies. In addition, many
interviewees pointed out that students must regularly study for each session in PBL
class in order to be successful while in traditional class students may be successful
without being prepared for each lesson. Half of the participants said that the PBLenvironment is more comfortable than the traditional learning environment. In
addition, PBL was considered more valuable for students than the traditional class
since PBL emphasizes research, and thus it helps students develop self-learning and
research skills. One interviewee pointed out another difference between PBL and
traditional class. The interviewee claimed that in PBL class students willingly do theirassignments as they are excited to internalize their knowledge while in traditional
classes they do their homework simply because they have to do it, without any
excitement since the knowledge is generally memorized as a result of passive transfer
of knowledge. Table 3 clearly depicts the participants’ dissatisfaction with traditional
learning and their appreciation of this constructivist method. Many of themmentioned that they wished that PBL was used in other courses as well. Moreover,
they expressed that they would like to use PBL in their own classes when they
become a mathematics teacher.
Table 3. The prospective mathematics teachers’ views about PBL environment versustraditional learning environment.
The prospective mathematics teachers’ views N
Traditional courses are taught more theoretically, thus students tend to memorizeknowledge in contrast to PBL. In other words, in traditional classes knowledgeis transmitted to students, whereas in PBL sessions students actively constructtheir own knowledge
6
PBL environment is not boring, but the other is generally boring 5Using small-groups in PBL is an advantage for learning 5In PBL, students are encouraged to think in different ways 5PBL environment increases communication among facilitator and students.
It also allows students to express their thoughts and connect their knowledge5
Unlike the traditional classes, in a PBL class students must regularly study and beprepared for every session in order to be successful
4
PBL environment is more comfortable than traditional learning environment 3Since students are conceived as a researcher, PBL is more useful than traditional
class2
In PBL, students willingly do their homework as they internalize knowledge whilein traditional class they usually do their homework just because they have to
1
10 B. Canturk-Gunhan et al.
Dow
nloa
ded
by [
Inst
itutio
nal S
ubsc
ript
ion
Acc
ess]
at 0
4:16
06
Sept
embe
r 20
11

When students contrasted the PBL environment with the traditional learningenvironment, they criticized traditional learning environment in many respects. Thefollowing excerpts are presented here to exemplify those critiques.
In PBL, there is a student-model who involves in lessons and who is aware of what s/heis doing as opposed to the student-model in traditional learning environment who writesand draws everything s/he sees on the chalkboard even if s/he does not understand it!While the methods used in other lessons lead us to memorize the formulas, principlesand concepts, the PBL enables us to understand them.
In other courses, sometimes . . . I can’t understand the lesson because of the lack ofconcentration. But in PBL sessions I don’t have such a problem since I activelyparticipate, and thus I have a higher concentration. Besides that, I can recall everythingalthough I didn’t study more in PBL.
Studying only before exams may perhaps work in other courses but it does not work inPBL. It is essential to regularly study and research before each session.
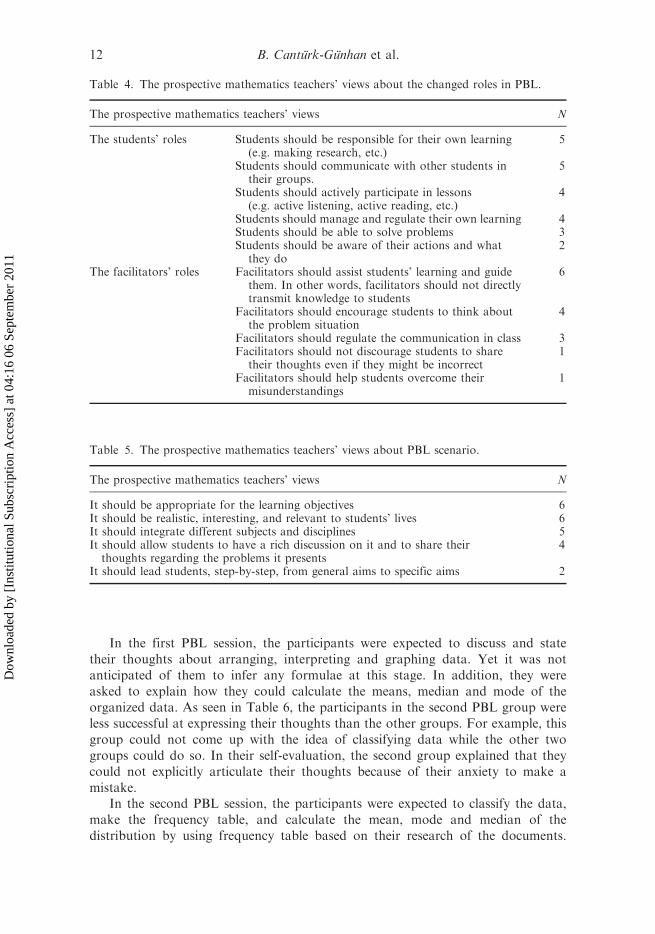
The analysis of the interviewees’ responses regarding the changed roles inPBL has led to two main categories as students’ roles and facilitators’ roles.The participants’ views are presented in Table 4.
The interviewees talked about the changed roles in PBL from two perspectives:the perspective of students and of teacher, who is the facilitator in PBL. Most of theinterviewees described the new roles of students in PBL as having responsibility fortheir own learning, communicating with other students in their groups, activelyparticipating in lessons, and managing and regulating their own learning. Theyportray the new teacher-model in PBL – the facilitator – as assisting students to learninstead of transmitting knowledge to them, encouraging students to think andregulating communication in the class. We find it satisfactory that they couldrecognize and thoroughly express those changed roles in terms of both students andteacher although they were not informed about those changes beforehand.
Table 5 presents the interviewees’ views about the characteristics of a PBLscenario. As is seen, they identified most of the characteristics that have been well-defined by a number of researchers [21,22].
All interviewees suggested that a PBL scenario should be realistic, interesting andrelevant to students’ lives. In addition, they all emphasized that the scenario shouldbe appropriate for the learning objectives. Almost all interviewees remarked on theimportance of integrating different subjects and disciplines within the scenario. Thischaracteristic seems in connection with another characteristic stated by manyinterviewees; which is the capacity of the scenario to create a rich discussion and toenhance communication among students and the facilitator about the problems thatthe scenario presents.
4.2. The prospective mathematics teachers’ thought processes about the statisticalconcepts in PBL sessions
The main concepts covered in the scenario are mean, median and mode; the mostfamiliar index of central tendency, standard deviation and quartiles; the mostfamiliar index of the distribution. Table 6 is constituted from the PBL sessions inwhich participant prospective mathematics teachers stated their thoughts aboutthose main statistical concepts.
International Journal of Mathematical Education in Science and Technology 11
Dow
nloa
ded
by [
Inst
itutio
nal S
ubsc
ript
ion
Acc
ess]
at 0
4:16
06
Sept
embe
r 20
11
In the first PBL session, the participants were expected to discuss and statetheir thoughts about arranging, interpreting and graphing data. Yet it was notanticipated of them to infer any formulae at this stage. In addition, they wereasked to explain how they could calculate the means, median and mode of theorganized data. As seen in Table 6, the participants in the second PBL group wereless successful at expressing their thoughts than the other groups. For example, thisgroup could not come up with the idea of classifying data while the other twogroups could do so. In their self-evaluation, the second group explained that theycould not explicitly articulate their thoughts because of their anxiety to make amistake.
In the second PBL session, the participants were expected to classify the data,make the frequency table, and calculate the mean, mode and median of thedistribution by using frequency table based on their research of the documents.
Table 4. The prospective mathematics teachers’ views about the changed roles in PBL.
The prospective mathematics teachers’ views N
The students’ roles Students should be responsible for their own learning(e.g. making research, etc.)
5
Students should communicate with other students intheir groups.
5
Students should actively participate in lessons(e.g. active listening, active reading, etc.)
4
Students should manage and regulate their own learning 4Students should be able to solve problems 3Students should be aware of their actions and what
they do2
The facilitators’ roles Facilitators should assist students’ learning and guidethem. In other words, facilitators should not directlytransmit knowledge to students
6
Facilitators should encourage students to think aboutthe problem situation
4
Facilitators should regulate the communication in class 3Facilitators should not discourage students to share
their thoughts even if they might be incorrect1
Facilitators should help students overcome theirmisunderstandings
1
Table 5. The prospective mathematics teachers’ views about PBL scenario.
The prospective mathematics teachers’ views N
It should be appropriate for the learning objectives 6It should be realistic, interesting, and relevant to students’ lives 6It should integrate different subjects and disciplines 5It should allow students to have a rich discussion on it and to share theirthoughts regarding the problems it presents
4
It should lead students, step-by-step, from general aims to specific aims 2
12 B. Canturk-Gunhan et al.
Dow
nloa
ded
by [
Inst
itutio
nal S
ubsc
ript
ion
Acc
ess]
at 0
4:16
06
Sept
embe
r 20
11
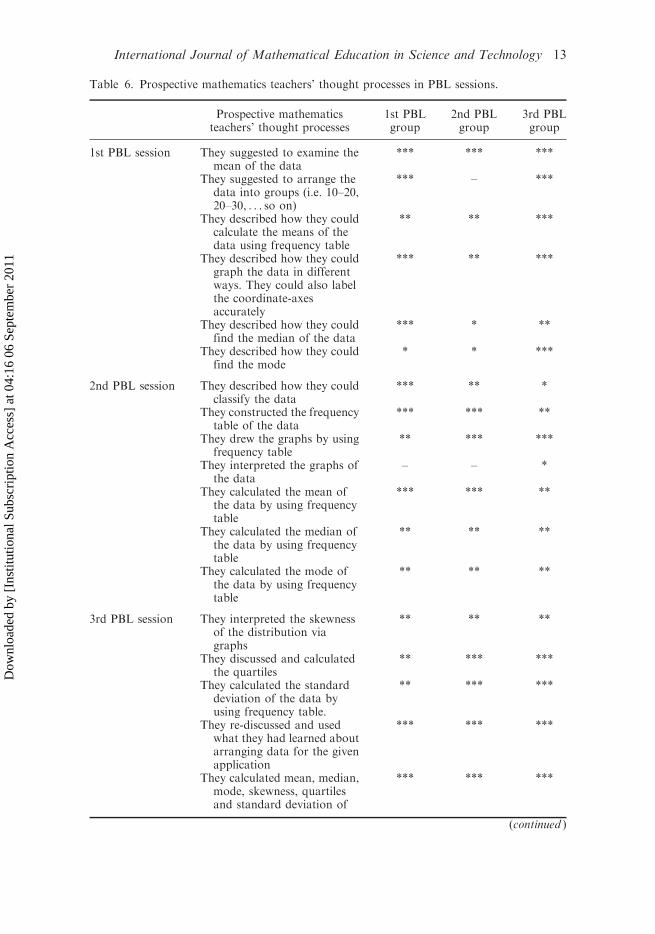
Table 6. Prospective mathematics teachers’ thought processes in PBL sessions.
Prospective mathematicsteachers’ thought processes
1st PBLgroup
2nd PBLgroup
3rd PBLgroup
1st PBL session They suggested to examine themean of the data
*** *** ***
They suggested to arrange thedata into groups (i.e. 10–20,20–30, . . . so on)
*** – ***
They described how they couldcalculate the means of thedata using frequency table
** ** ***
They described how they couldgraph the data in differentways. They could also labelthe coordinate-axesaccurately
*** ** ***
They described how they couldfind the median of the data
*** * **
They described how they couldfind the mode
* * ***
2nd PBL session They described how they couldclassify the data
*** ** *
They constructed the frequencytable of the data
*** *** **
They drew the graphs by usingfrequency table
** *** ***
They interpreted the graphs ofthe data
– – *
They calculated the mean ofthe data by using frequencytable
*** *** **
They calculated the median ofthe data by using frequencytable
** ** **
They calculated the mode ofthe data by using frequencytable
** ** **
3rd PBL session They interpreted the skewnessof the distribution viagraphs
** ** **
They discussed and calculatedthe quartiles
** *** ***
They calculated the standarddeviation of the data byusing frequency table.
** *** ***
They re-discussed and usedwhat they had learned aboutarranging data for the givenapplication
*** *** ***
They calculated mean, median,mode, skewness, quartilesand standard deviation of
*** *** ***
(continued )
International Journal of Mathematical Education in Science and Technology 13
Dow
nloa
ded
by [
Inst
itutio
nal S
ubsc
ript
ion
Acc
ess]
at 0
4:16
06
Sept
embe
r 20
11
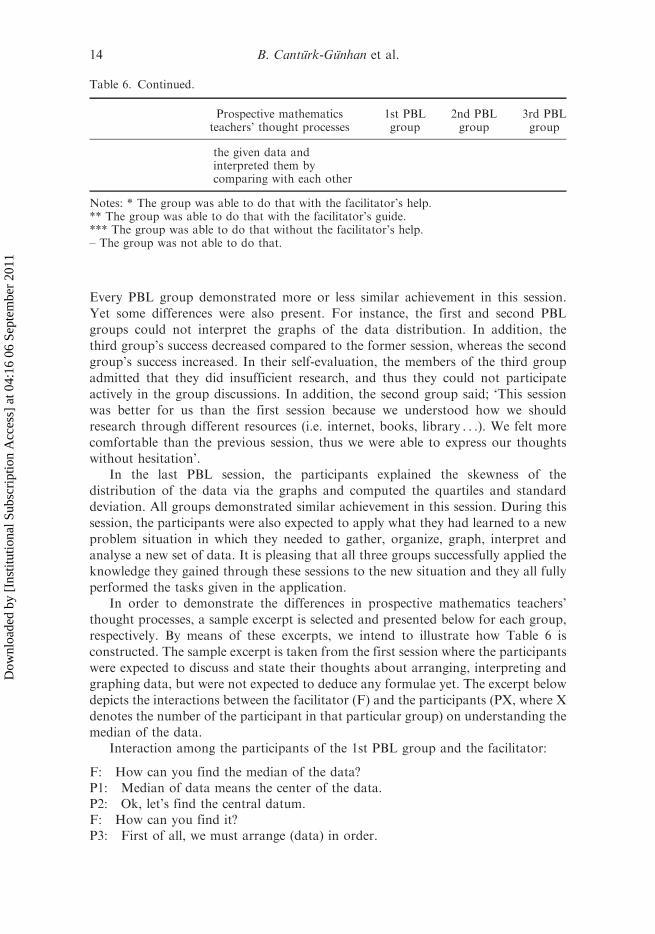
Every PBL group demonstrated more or less similar achievement in this session.Yet some differences were also present. For instance, the first and second PBLgroups could not interpret the graphs of the data distribution. In addition, thethird group’s success decreased compared to the former session, whereas the secondgroup’s success increased. In their self-evaluation, the members of the third groupadmitted that they did insufficient research, and thus they could not participateactively in the group discussions. In addition, the second group said; ‘This sessionwas better for us than the first session because we understood how we shouldresearch through different resources (i.e. internet, books, library . . .). We felt morecomfortable than the previous session, thus we were able to express our thoughtswithout hesitation’.
In the last PBL session, the participants explained the skewness of thedistribution of the data via the graphs and computed the quartiles and standarddeviation. All groups demonstrated similar achievement in this session. During thissession, the participants were also expected to apply what they had learned to a newproblem situation in which they needed to gather, organize, graph, interpret andanalyse a new set of data. It is pleasing that all three groups successfully applied theknowledge they gained through these sessions to the new situation and they all fullyperformed the tasks given in the application.
In order to demonstrate the differences in prospective mathematics teachers’thought processes, a sample excerpt is selected and presented below for each group,respectively. By means of these excerpts, we intend to illustrate how Table 6 isconstructed. The sample excerpt is taken from the first session where the participantswere expected to discuss and state their thoughts about arranging, interpreting andgraphing data, but were not expected to deduce any formulae yet. The excerpt belowdepicts the interactions between the facilitator (F) and the participants (PX, where Xdenotes the number of the participant in that particular group) on understanding themedian of the data.
Interaction among the participants of the 1st PBL group and the facilitator:
F: How can you find the median of the data?P1: Median of data means the center of the data.P2: Ok, let’s find the central datum.F: How can you find it?P3: First of all, we must arrange (data) in order.
Table 6. Continued.
Prospective mathematicsteachers’ thought processes
1st PBLgroup
2nd PBLgroup
3rd PBLgroup
the given data andinterpreted them bycomparing with each other
Notes: * The group was able to do that with the facilitator’s help.** The group was able to do that with the facilitator’s guide.*** The group was able to do that without the facilitator’s help.– The group was not able to do that.
14 B. Canturk-Gunhan et al.
Dow
nloa
ded
by [
Inst
itutio
nal S
ubsc
ript
ion
Acc
ess]
at 0
4:16
06
Sept
embe
r 20
11
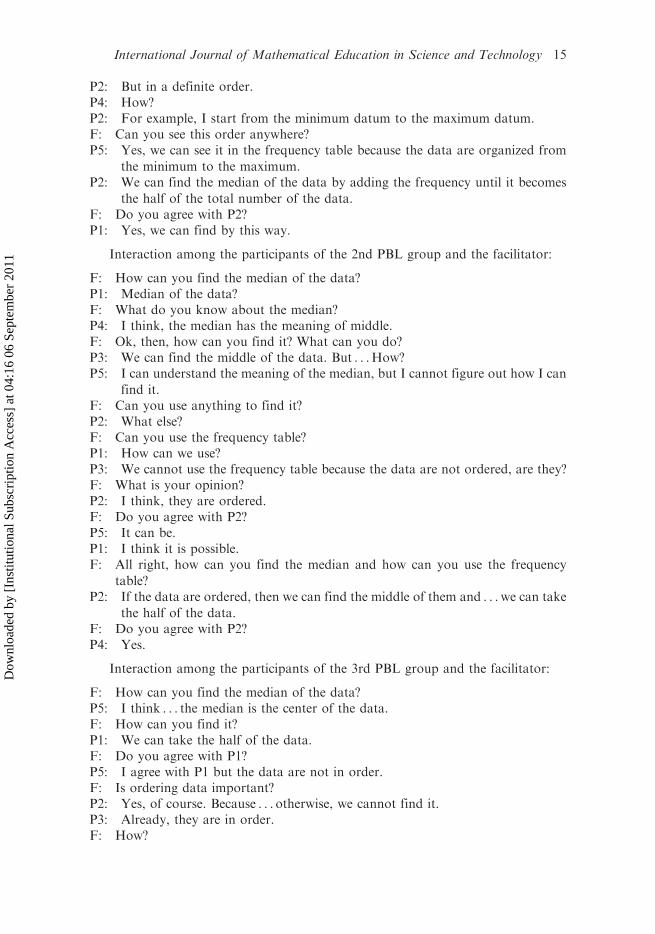
P2: But in a definite order.P4: How?P2: For example, I start from the minimum datum to the maximum datum.F: Can you see this order anywhere?P5: Yes, we can see it in the frequency table because the data are organized from
the minimum to the maximum.P2: We can find the median of the data by adding the frequency until it becomes
the half of the total number of the data.F: Do you agree with P2?P1: Yes, we can find by this way.
Interaction among the participants of the 2nd PBL group and the facilitator:
F: How can you find the median of the data?P1: Median of the data?F: What do you know about the median?P4: I think, the median has the meaning of middle.F: Ok, then, how can you find it? What can you do?P3: We can find the middle of the data. But . . .How?P5: I can understand the meaning of the median, but I cannot figure out how I can
find it.F: Can you use anything to find it?P2: What else?F: Can you use the frequency table?P1: How can we use?P3: We cannot use the frequency table because the data are not ordered, are they?F: What is your opinion?P2: I think, they are ordered.F: Do you agree with P2?P5: It can be.P1: I think it is possible.F: All right, how can you find the median and how can you use the frequency
table?P2: If the data are ordered, then we can find the middle of them and . . .we can take
the half of the data.F: Do you agree with P2?P4: Yes.
Interaction among the participants of the 3rd PBL group and the facilitator:
F: How can you find the median of the data?P5: I think . . . the median is the center of the data.F: How can you find it?P1: We can take the half of the data.F: Do you agree with P1?P5: I agree with P1 but the data are not in order.F: Is ordering data important?P2: Yes, of course. Because . . .otherwise, we cannot find it.P3: Already, they are in order.F: How?
International Journal of Mathematical Education in Science and Technology 15
Dow
nloa
ded
by [
Inst
itutio
nal S
ubsc
ript
ion
Acc
ess]
at 0
4:16
06
Sept
embe
r 20
11
P4: We can take the half of the total number of the data. But . . . how can we findthe middle of the data?
F: Has anyone thought about this?P3: Yes, em . . .We can use the table because the frequency table is formed from the
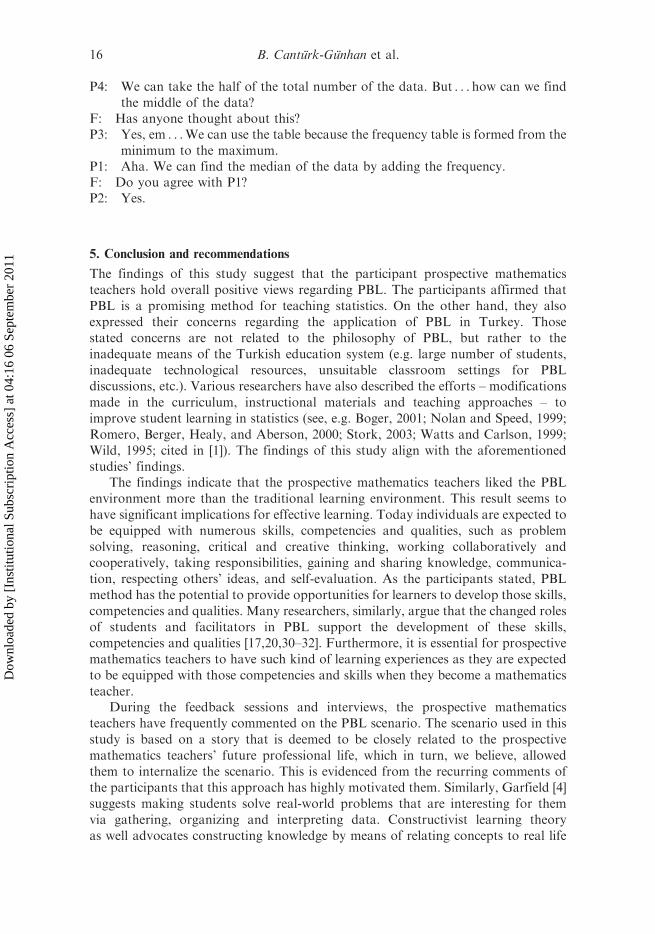
minimum to the maximum.P1: Aha. We can find the median of the data by adding the frequency.F: Do you agree with P1?P2: Yes.
5. Conclusion and recommendations
The findings of this study suggest that the participant prospective mathematicsteachers hold overall positive views regarding PBL. The participants affirmed thatPBL is a promising method for teaching statistics. On the other hand, they alsoexpressed their concerns regarding the application of PBL in Turkey. Thosestated concerns are not related to the philosophy of PBL, but rather to theinadequate means of the Turkish education system (e.g. large number of students,inadequate technological resources, unsuitable classroom settings for PBLdiscussions, etc.). Various researchers have also described the efforts – modificationsmade in the curriculum, instructional materials and teaching approaches – toimprove student learning in statistics (see, e.g. Boger, 2001; Nolan and Speed, 1999;Romero, Berger, Healy, and Aberson, 2000; Stork, 2003; Watts and Carlson, 1999;Wild, 1995; cited in [1]). The findings of this study align with the aforementionedstudies’ findings.
The findings indicate that the prospective mathematics teachers liked the PBLenvironment more than the traditional learning environment. This result seems tohave significant implications for effective learning. Today individuals are expected tobe equipped with numerous skills, competencies and qualities, such as problemsolving, reasoning, critical and creative thinking, working collaboratively andcooperatively, taking responsibilities, gaining and sharing knowledge, communica-tion, respecting others’ ideas, and self-evaluation. As the participants stated, PBLmethod has the potential to provide opportunities for learners to develop those skills,competencies and qualities. Many researchers, similarly, argue that the changed rolesof students and facilitators in PBL support the development of these skills,competencies and qualities [17,20,30–32]. Furthermore, it is essential for prospectivemathematics teachers to have such kind of learning experiences as they are expectedto be equipped with those competencies and skills when they become a mathematicsteacher.
During the feedback sessions and interviews, the prospective mathematicsteachers have frequently commented on the PBL scenario. The scenario used in thisstudy is based on a story that is deemed to be closely related to the prospectivemathematics teachers’ future professional life, which in turn, we believe, allowedthem to internalize the scenario. This is evidenced from the recurring comments ofthe participants that this approach has highly motivated them. Similarly, Garfield [4]suggests making students solve real-world problems that are interesting for themvia gathering, organizing and interpreting data. Constructivist learning theoryas well advocates constructing knowledge by means of relating concepts to real life
16 B. Canturk-Gunhan et al.
Dow
nloa
ded
by [
Inst
itutio
nal S
ubsc
ript
ion
Acc
ess]
at 0
4:16
06
Sept
embe
r 20
11
and other disciplines. Therefore, it is essential for facilitators to design scenarios
related to students’ experiences and interests.Examination of the participants’ thought processes (Table 6) suggests that many
participant prospective mathematics teachers have demonstrated mastery of
computational skills of the descriptive statistics (mean, median, mode, standard
deviation and quartiles). We consider students’ thought processes to be of great
importance in PBL. Indeed, it is consistent with the recommendation of Mvududu
[33] that statistics instructors need to (a) study how students think about the
particular statistics topics they teach and (b) try to understand their students’
thinking at a level deeper than everyday communication. When constructing the
statistical concepts in PBL, it was important for the participants to share their
thoughts, try to understand their peers’ thoughts and to discuss them to reach a
consensus. While the participants generally fulfilled all the requirements of the
sessions, they performed some requirements with some deficiencies from time-to-
time, especially in the stage of constituting and interpreting formulae. In their self-
evaluation; however, they explained those deficiencies as a consequence of their
inadequate preparation for the sessions.In this study, we examined the prospective mathematics teachers’ views about
using PBL in statistics teaching along with their thought processes about the
statistical concepts. We suggest further investigating the effect of PBL on students’
learning outcomes such as problem-solving skills, mathematical thinking and
achievement as well as their attitudes towards mathematics. Furthermore, we
claim that PBL should be implemented by means of integrating different disciplines
in teacher education. In sum, PBL is a promising method for the preparation of the
prospective mathematics teachers. It is also plausible to suggest integrating
mathematics content knowledge with pedagogical content knowledge when using
the PBL method.
References
[1] E. Manalo and D. Leader, Learning center and statistics department collaboration in
improving student performance in introductory statistics, Coll. Student J. 41(2) (2007),
pp. 454–459.[2] National Council of Teachers of Mathematics (NCTM), Curriculum and Evaluation
Standards for School Mathematics, The National Council of Teachers of Mathematics,
Reston, VA, 1989.[3] G.W. Cobb, Teaching Statistics’ Heading the Call for Change: Suggestions for Curricular
Action, Mathematical Association of America, Washington, DC, 1992.[4] J. Garfield, How students learn statistics, Int. Stat. Rev. 63 (1995), pp. 25–34.
[5] G.W. Cobb, Mere literacy is not enough, in Why Numbers Count, L.A. Steen, ed., College
Entrance Examination Board, New York, 1997, pp. 75–90.[6] J.M. Shaughnessy, Research in probability and statistics, in Handbook of Research on
Mathematics Teaching and Learning, D.A. Grouws, ed., Macmillan Publishing Company,
New York, 1992, pp. 575–596.[7] L. Jones, Using cooperative learning to teach statistics. Research Report 91-2, The
L.L. Thurston Psychometric Laboratory, University of North Carolina,
Chapel Hill, 1991.
International Journal of Mathematical Education in Science and Technology 17
Dow
nloa
ded
by [
Inst
itutio
nal S
ubsc
ript
ion
Acc
ess]
at 0
4:16
06
Sept
embe
r 20
11
[8] J.M. Shaughnessy, Misconceptions of probability: An experiment with a small- group
activity-based, model building approach to introductory probability at the college level,
Educ. Stud. Math. 8 (1977), pp. 285–316.[9] E.von Glasersfeld, The Construction of Knowledge and Contributions to Conceptual
Semantic, Intersystems Publication, Salinas, CA, 1987.[10] M.C. Fabrizio and M.V. Lopez, Statistics in teacher training colleges in Buenos Aires,
Argentina: Assessment and challenges (2007). Available at http://www.stat.aucklan-
d.ac.nz/�iase/publications/isi56/CPM80_Fabrizio.pdf[11] P. Arnold, Developing new statistical content knowledge with secondary school mathematics
teachers (2008). Available at http://www.ugr.es/�icmi/iase_study/Files/Topic4/
T4P5_Arnold.pdf
[12] A.C.S. de Oliviera, P.F. Paranaiba, V.Y. Kataoka, A.A. de Souza, F. de M.O. Fernandes,
and M.S. de Oliviera, Statistics teaching for prospective teachers of mathematics:
Reflections and perspectives (2008). Available at http://www.ugr.es/�icmi/iase_study/
Files/Topic3/T3P2_Kataoka.pdf[13] R.L. Scheaffer, Statistics education: Perusing the past, embracing the present, and charting
the future, Newslett. Sect. Stat. Educ. 7(1) (2001), pp. 3–9.[14] J. Garfield, Teaching statistics using small group cooperative learning, J. Stat. Educ. 1(1)
(1993), pp. 27–36, Retrieved 6 July 2010, Available at http://www.amstat.org/publica-
tions/jse/v1n1/garfield.html
[15] R.M. Heaton and W.T. Mickelson, The learning and teaching of
statistical investigation in teaching and teacher education, J. Math. Teach. Educ. 5
(2002), pp. 35–59.[16] M. Y|lmaz, The challenge of teaching statistics to non-specialists, J. Stat. Educ. 4(1) (1996),
pp. 1–9. Available at http://www.amstat.org/publications/jse/v4n1/yilmaz.html[17] D. Ronis, Problem-Based Learning For Math and Science: Integrating Inquiry and the
Internet, SkyLight Training and Publishing Inc., USA, 2001.[18] H. Barrows and A.C. Kelson, Problem-Based Learning in Secondary Education and the
Problem-Based Learning Institute (Monograph 1), Problem-Based Learning Institute,
Springfield, IL, 1995.[19] H.S. Barrows, Problem-Based Learning Applied to Medical Education, Southern Illinois
University Press, Springfield, 2000.[20] L. Torp and S. Sage, Problems as Possibilities: Problem-Based Learning for k-12
Education, 2nd ed., ASCD, Alexandria, VA, 2002.[21] D.E. Allen, B.J. Duch, and S.E. Groh, The power of problem-based learning in teaching
introductory science courses, in Bringing Problem-Based Learning to Higher Education:
Theory and Practice, L. Wilkerson and W.H. Gijselaers, eds., Jossey-Bass, San Francisco,
1996, pp. 43–52.
[22] S.A. Gallagher, Problem-based learning: Where did it come from, what does it do, and
where is it going? J. Educ. Gift. 20(4) (1997), pp. 332–362.
[23] G.B. Evia, Problem based learning for great statistics learning (2003). Available at http://
www.hicstatistics.org/2003StatsProceedings/Gilda%20Bolanos.pdf
[24] C.E. Hmelo-Silver, Problem-based learning: What and how do students learn? Educ.
Psychol. Rev. 16(3) (2004), pp. 235–266.
[25] C.R. Boyle, A problem-based learning approach to teaching biostatistics, J. Stat. Educ. 7(1)
(1999). Available at http://www.amstat.org/publications/jse/secure/v7n1/boyle.cfm
[26] J.M. Bland, Teaching statistics to medical students using problem-based learning: The
Australian experience. BMC Med. Educ. 4(31) (2004). Available at http://www-
users.york.ac.uk/�mb55/talks/ozpbl.htm[27] M.B. Miles and A.M. Huberman, An Expanded Source Book: Qualitative Data Analysis,
Sage, London, 1994.
18 B. Canturk-Gunhan et al.
Dow
nloa
ded
by [
Inst
itutio
nal S
ubsc
ript
ion
Acc
ess]
at 0
4:16
06
Sept
embe
r 20
11

[28] J. Boaler, Open and closed mathematics: Student experiences and understandings,J. Res. Math. Educ. 29(1) (1998), pp. 41–62.
[29] E. Bukova, The development of new curriculum to overcome the students’ difficulties inperceiving the concept of limit and constructing the relationship between the concept of limit
and the other mathematical concepts, Ph.D. diss., Dokuz Eylul University, EducationalSciences Institute, Izmir, 2006.
[30] J.R. Savery and T.M. Duffy, Problem based learning: An instructional model and its
constructivist framework, Educ. Technol. 35 (1995), pp. 135–150.[31] B. Hoffman, Integrating the disciplines in the elementary grades with problem-based
learning, Delta Kappa Gamma Bull. 64(3) (1998), pp. 9–14.
[32] H.G. Schmidt, Onderwijskundige spectra van probleemgestuurd onderwijs (Educationalaspects of problem-based learning), in Activerend onderwijs, W.M.G. Jochems, ed., DelftseUniversitaire Pers., Delft, 1990, pp. 1–16.
[33] N. Mvududu, Constructivism in the statistics classroom: From theory to practice,Teach. Stat. 27(2) (2005), pp. 49–54.
International Journal of Mathematical Education in Science and Technology 19
Dow
nloa
ded
by [
Inst
itutio
nal S
ubsc
ript
ion
Acc
ess]
at 0
4:16
06
Sept
embe
r 20
11

Appendix 1. The module’s cover page (page 1)
THE MODULE’S COVER PAGE (Page 1)
1st SESSION– 1st PART (Page 2)Current decline in mathematics test scores on the National Student Selection
Examination for High Schools has alerted authorities. Thus, Tamer lgili, the Minister of National Education, has determined to investigate the current state of the mathematics achievement of schools in Izmir.
1. Can you describe what the problem is?
2. What do you think about the reasons for decreasing mathematics achievement on the National Student Selection Examination?
3. If you were Mr. Ilgili, how would you collect information about the current state of mathematics achievements of students?
1st SESSION– 2nd PART (Page 3) Mr. Ilgili sent out the information forms (See Appendix 1) to the participating schools to collect
information about the mathematics achievements of students. The mathematics teachers in those schools were asked to fill that form by organizing the data collected from students and then to send it to the Ministry of National Education.
4. What is the new information?
5. How would you organize and tabulate the data on student achievement collected by this information form? How would you show the distribution of data by graph?
6. How can you find the mean, median and the most frequent datum of the students’ achievement scores by using the tabulated data?
Learning Objectives
ReferenceAkdeniz, F. (2006). Probability and Statistics. 12th press. Nobel Publishing. Page: 275-291.
SEE YOU IN 2nd SESSION...
20 B. Canturk-Gunhan et al.
Dow
nloa
ded
by [
Inst
itutio
nal S
ubsc
ript
ion
Acc
ess]
at 0
4:16
06
Sept
embe
r 20
11
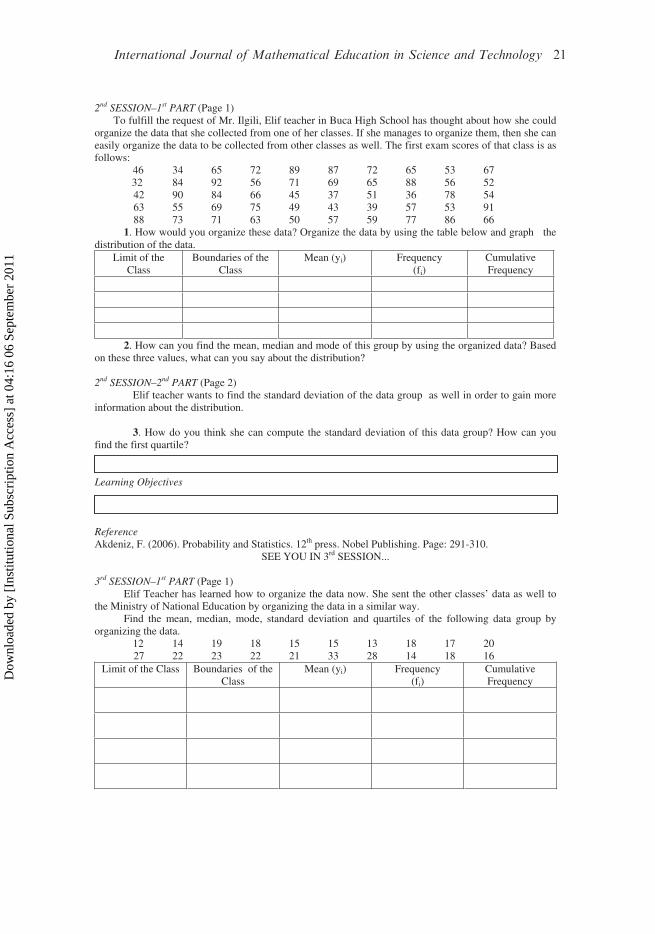
2nd SESSION–1st PART (Page 1) To fulfill the request of Mr. Ilgili, Elif teacher in Buca High School has thought about how she could organize the data that she collected from one of her classes. If she manages to organize them, then she can easily organize the data to be collected from other classes as well. The first exam scores of that class is as follows:
46 34 65 72 89 87 72 65 53 67 32 84 92 56 71 69 65 88 56 52
42 90 84 66 45 37 51 36 78 54 63 55 69 75 49 43 39 57 53 91 88 73 71 63 50 57 59 77 86 66
1. How would you organize these data? Organize the data by using the table below and graph the distribution of the data.
Limit of the Class
Boundaries of the Class
Mean (yi) Frequency (fi)
Cumulative Frequency
2. How can you find the mean, median and mode of this group by using the organized data? Based
on these three values, what can you say about the distribution?
2nd SESSION–2nd PART (Page 2)Elif teacher wants to find the standard deviation of the data group as well in order to gain more
information about the distribution.
3. How do you think she can compute the standard deviation of this data group? How can you find the first quartile?
Learning Objectives
ReferenceAkdeniz, F. (2006). Probability and Statistics. 12th press. Nobel Publishing. Page: 291-310.
SEE YOU IN 3rd SESSION...
3rd SESSION–1st PART (Page 1)Elif Teacher has learned how to organize the data now. She sent the other classes’ data as well to
the Ministry of National Education by organizing the data in a similar way. Find the mean, median, mode, standard deviation and quartiles of the following data group by
organizing the data. 12 14 19 18 15 15 13 18 17 20
27 22 23 22 21 33 28 14 18 16Limit of the Class Boundaries of the
ClassMean (yi) Frequency
(fi)Cumulative Frequency
International Journal of Mathematical Education in Science and Technology 21
Dow
nloa
ded
by [
Inst
itutio
nal S
ubsc
ript
ion
Acc
ess]
at 0
4:16
06
Sept
embe
r 20
11