Mathematics Academies 2011-2013 - ERIC
90
Office of Research Mathematics Academies 2011-2013 Cohort 1 Evaluation Study
-
Upload
khangminh22 -
Category
Documents
-
view
1 -
download
0
Transcript of Mathematics Academies 2011-2013 - ERIC

O f f i c e o f R e s e a r c h
Mathematics Academies 2011-2013Cohort 1 Evaluation Study
West Virginia Board of education
2013-2014
Gayle C. Manchin, PresidentMichael I. Green, Vice PresidentRobert W. Dunlevy, Secretary
Thomas W. Campbell, MemberTina H. Combs, Member
Lloyd G. Jackson II, MemberL. Wade Linger Jr., MemberWilliam M. White, Member
Paul L. Hill, Ex OfficioChancellor
West Virginia Higher Education Policy Commission
James L. Skidmore, Ex OfficioChancellor
West Virginia Council for Community and Technical College Education
James B. Phares, Ex OfficioState Superintendent of Schools
West Virginia Department of Education

Mathematics Academies 2011-2013
Cohort 1 Evaluation Study
Amber D. Stohr

West Virginia Department of Education Division of Teaching and Learning
Office of Assessment, Accountability, and Research Building 6, Suite 825, State Capitol Complex
1900 Kanawha Boulevard East Charleston, WV 25305
http://wvde.state.wv.us/research
March 2014 James B. Phares State Superintendent of Schools West Virginia Department of Education Robert Hull Associate Superintendent West Virginia Department of Education Juan D’Brot Executive Director Office of Assessment, Accountability, and Research Prepared for Patricia Homberg Executive Director Office of Special Programs Content Contact Amber Stohr Coordinator Office of Research [email protected]
Keywords Mathematics Academies, special education, professional development, Carnegie
Learning, LMT, algebraic thinking, proportional reasoning, Cognitive Tutor, MATHia Suggested Citation
Stohr A. D. (2013). Mathematics academies: Cohort 1 evaluation study. Charleston,
WV: West Virginia Department of Education, Division of Teaching and Learning, Office of
Research.
This research study was reviewed and approved by the West Virginia Department of
Education Institutional Review Board (IRB-CIS-010). Should you desire additional details
about this study’s approval status, you may contact the WVDE IRB chairperson, Patricia Ca-
hape Hammer ([email protected]).

iii
Executive Summary
Commencing in 2011, the Mathematics Academies Initiative is a series of
professional development academies (lasting 1 to 2 years, depending on cohort) with the
primary objectives of (a) providing educators with a high quality professional development
experience that enhances their mathematical content knowledge and pedagogical skills, and
(b) increasing positive attitudes and confidence when providing mathematical instruction.
As coordinator of the initiative, the West Virginia Department of Education (WVDE) Office
of Special Programs (OSP) partners with regional education service agencies (RESAs) and
local school districts to identify and invite teachers to the math academies, and with
Carnegie Learning Inc., an external vendor, to provide instruction and materials. This
research study is an evaluation of the first cohort (hereafter, Cohort 1) of the Mathematics
Academies Initiative. Cohort 1, a 2-year cohort, began in the summer of 2011 and was
completed in the spring of 2013. Each year the cohort focused on a different content area;
Year 1 focused on proportional reasoning, and Year 2 on developing algebraic thinking.
Methods
The OSP sent a math academy description to special education directors across WV
outlining the purpose, expected outcomes, and academy components, as well as a short list
of appropriate participant characteristics to help directors determine whom to invite. OSP
suggested recruitment of special educators who (a) served students in Grades 5 through 12;
(b) taught mathematics either in a coteaching partnership or in a pull-out class; and/or (c)
served students taking the general assessment—WESTEST 2.
This mixed methods study used three instruments each year to gather quantitative
and qualitative data: (a) a post-professional-development survey (hereafter, post-PD survey)
distributed shortly after the initial weeklong summer academy; (b) an end-of-year survey
conducted at the conclusion of academy activities; and (c) when appropriate, a pre- and
post-test assessment of mathematical content and pedagogical knowledge, the Learning
Mathematics for Teaching assessment (LMT; Hill, Schilling, & Ball, 2004). The post-PD and
end-of-year surveys collected perceptual information regarding (a) the quality of academy
elements (i.e., instruction, materials, content, etc.), and (b) changes in knowledge, attitudes,
and practices related to mathematics and mathematical instruction. The LMT assessment is
an empirically validated research- and evidence-based instrument that measures changes in
mathematics content knowledge and instructional capacity.
Findings
Of the 119 participants in the 1st year of the Mathematics Academies Initiative, nearly
80% (n = 95) responded to the post-PD survey, approximately 65% (n = 77) responded to
the end-of-year survey, and 42 qualified to take part in an LMT assessment.1 Those respond-
1 The LMT instrument is normed for elementary and middle school educators. The assess-
ment was not appropriate for high school educators.
Executive Summary
iv | Mathematics Academies 2011-2013
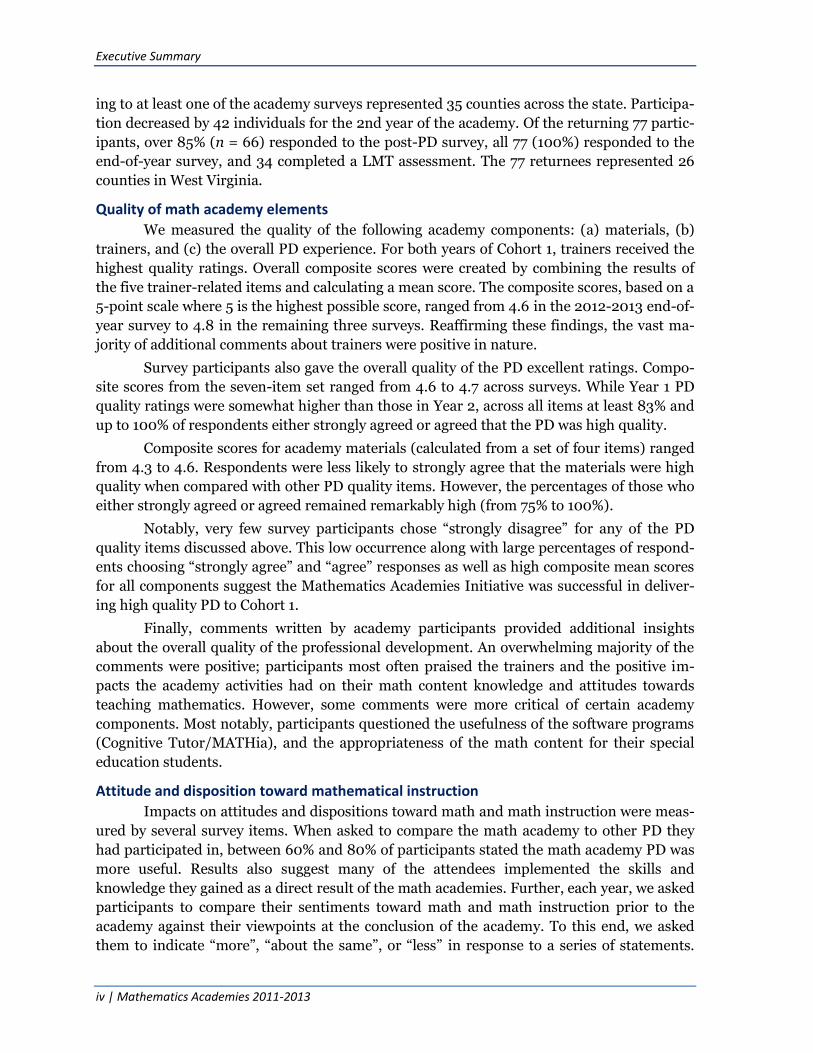
ing to at least one of the academy surveys represented 35 counties across the state. Participa-
tion decreased by 42 individuals for the 2nd year of the academy. Of the returning 77 partic-
ipants, over 85% (n = 66) responded to the post-PD survey, all 77 (100%) responded to the
end-of-year survey, and 34 completed a LMT assessment. The 77 returnees represented 26
counties in West Virginia.
Quality of math academy elements
We measured the quality of the following academy components: (a) materials, (b)
trainers, and (c) the overall PD experience. For both years of Cohort 1, trainers received the
highest quality ratings. Overall composite scores were created by combining the results of
the five trainer-related items and calculating a mean score. The composite scores, based on a
5-point scale where 5 is the highest possible score, ranged from 4.6 in the 2012-2013 end-of-
year survey to 4.8 in the remaining three surveys. Reaffirming these findings, the vast ma-
jority of additional comments about trainers were positive in nature.
Survey participants also gave the overall quality of the PD excellent ratings. Compo-
site scores from the seven-item set ranged from 4.6 to 4.7 across surveys. While Year 1 PD
quality ratings were somewhat higher than those in Year 2, across all items at least 83% and
up to 100% of respondents either strongly agreed or agreed that the PD was high quality.
Composite scores for academy materials (calculated from a set of four items) ranged
from 4.3 to 4.6. Respondents were less likely to strongly agree that the materials were high
quality when compared with other PD quality items. However, the percentages of those who
either strongly agreed or agreed remained remarkably high (from 75% to 100%).
Notably, very few survey participants chose “strongly disagree” for any of the PD
quality items discussed above. This low occurrence along with large percentages of respond-
ents choosing “strongly agree” and “agree” responses as well as high composite mean scores
for all components suggest the Mathematics Academies Initiative was successful in deliver-
ing high quality PD to Cohort 1.
Finally, comments written by academy participants provided additional insights
about the overall quality of the professional development. An overwhelming majority of the
comments were positive; participants most often praised the trainers and the positive im-
pacts the academy activities had on their math content knowledge and attitudes towards
teaching mathematics. However, some comments were more critical of certain academy
components. Most notably, participants questioned the usefulness of the software programs
(Cognitive Tutor/MATHia), and the appropriateness of the math content for their special
education students.
Attitude and disposition toward mathematical instruction
Impacts on attitudes and dispositions toward math and math instruction were meas-
ured by several survey items. When asked to compare the math academy to other PD they
had participated in, between 60% and 80% of participants stated the math academy PD was
more useful. Results also suggest many of the attendees implemented the skills and
knowledge they gained as a direct result of the math academies. Further, each year, we asked
participants to compare their sentiments toward math and math instruction prior to the
academy against their viewpoints at the conclusion of the academy. To this end, we asked
them to indicate “more”, “about the same”, or “less” in response to a series of statements.

Executive Summary
Mathematics Academies 2011-2013 | v
Results indicate 44% of Year 1 and 58% of Year 2 participants reported enjoying teaching
math more after attending the math academy. Between 40% (Year 1) and 43% (Year 2) re-
sponded “more” to the statement, “Mathematics is my strongest subject to teach.” Perhaps
most telling, 62% and 66% (respectively by academy year) chose “more” for the item, “Over-
all I know the mathematics needed to teach my students.” Finally, several participants pro-
vided additional comments stating that as a result of the math academy, they are now more
confident when teaching math. Others said they enjoyed learning at the academy and now
like teaching mathematics, some for the first time in their lives. These results suggest the
Mathematics Academies Initiative made a positive impact on the attitudes and dispositions
of teachers concerning math and math instruction.
Content knowledge in math focus areas
A key objective of the math academies was to increase content knowledge in specific
focus areas: proportional reasoning in Year 1 and developing algebraic thinking during Year
2. Changes in knowledge among educators were measured using both self-reported survey
items and the LMT pre-/post-assessments. At the conclusion of Year 1, over 71% of partici-
pants reported an increase in their mathematics content knowledge; and 74% stated their
knowledge base was more adequate to the task of teaching subjects related to proportional
reasoning. At the conclusion of Year 2, nearly 80% of participants reported having stronger
knowledge of algebraic functions and 75% said they had an increased ability to examine mul-
tiple representations of algebraic functions. Among items concerning the impact of both
academy years, nearly 77% of participants reported their knowledge as more adequate for
teaching subjects related to proportional reasoning and algebraic thinking; 78% said they
were better able to differentiate high- and low-level cognitive tasks; 69% indicated stronger
knowledge of the Standards for Mathematical Practice; and 66% reported increased confi-
dence when analyzing mathematical tasks.
When examining pre-/post-LMT data, we found statistically significant mathematics
content and pedagogical knowledge gains for proportional reasoning, but not algebraic
thinking. The proportional reasoning findings provide compelling evidence to substantiate
self-reported gains. However, Year 2’s algebraic thinking LMT did not yield statistically sig-
nificant results and as a result, increases in knowledge or pedagogy reported by teachers
could not be verified.
Elements of effective PD present in the Mathematics Academies Initiative
While evaluation results indicate PD provided to Cohort 1 has been mostly successful,
how do we know if the PD has been effective or not? To determine the answer, we refer to
what current research considers best practices for implementing effective PD, and compare
those elements to academy activities. According to a recent review of relevant research, there
are five common elements to effective PD: (a) content and pedagogy focus; (b) coherence; (c)
active learning; (d) collective participation; and (e) duration and timespan (Hammer, 2013).
Arguably, Cohort 1 of the Mathematics Academies Initiative practiced four of the five
elements. Math academies were content focused (proportional reasoning in Year 1 and de-
veloping algebraic thinking in Year 2) with an emphasis on increasing pedagogical capacity.
They exhibited coherence; activities progressively built upon one another, were in alignment
with school goals for instructional improvement, as well as the Standards for Mathematical
Executive Summary
vi | Mathematics Academies 2011-2013
Practice and the Common Core/WV Next Generation Mathematics Standards and Objec-
tives. Academies incorporated active learning into all face-to-face sessions; participants took
the role of students while trainers modeled appropriate and successful teaching techniques.
Further, with 100 hours of direct contact over 2 years, academy activities exceeded the min-
imum recommendation of 30 hours per year. The single element not utilized by Cohort 1
math academies was collective participation (participation of a group of teachers/personnel
from the same school). However, beginning with Cohort 3 (2013-2014), the OSP actively en-
couraged coteaching pairs as well as math coaches, math specialists, grade-level math teams,
and math curriculum teams from the same district or school to attend the academy as a
group.
Limitations of study
The limitations of this evaluation study are typical of other studies that rely on par-
ticipant perceptions as collected in a survey. Self-reported information always contains a risk
of response bias. Respondents may exaggerate or underestimate, may have recall difficulties,
and/or may report information they perceive as socially acceptable. Further, less than 100%
of academy attendees participated in each of the surveys and the academy lost over 40 at-
tendees from Year 1 to Year 2. While high survey response rates mitigate the likelihood of a
nonrepresentative sample of academy participants, the potential for response bias still ex-
ists. Additionally, while the LMT was appropriate for measuring changes in knowledge and
pedagogical capacity among elementary and middle school programmatic levels, the study
lacked a tool to measure whether or not any knowledge or pedagogical changes occurred at
the high school programmatic level.
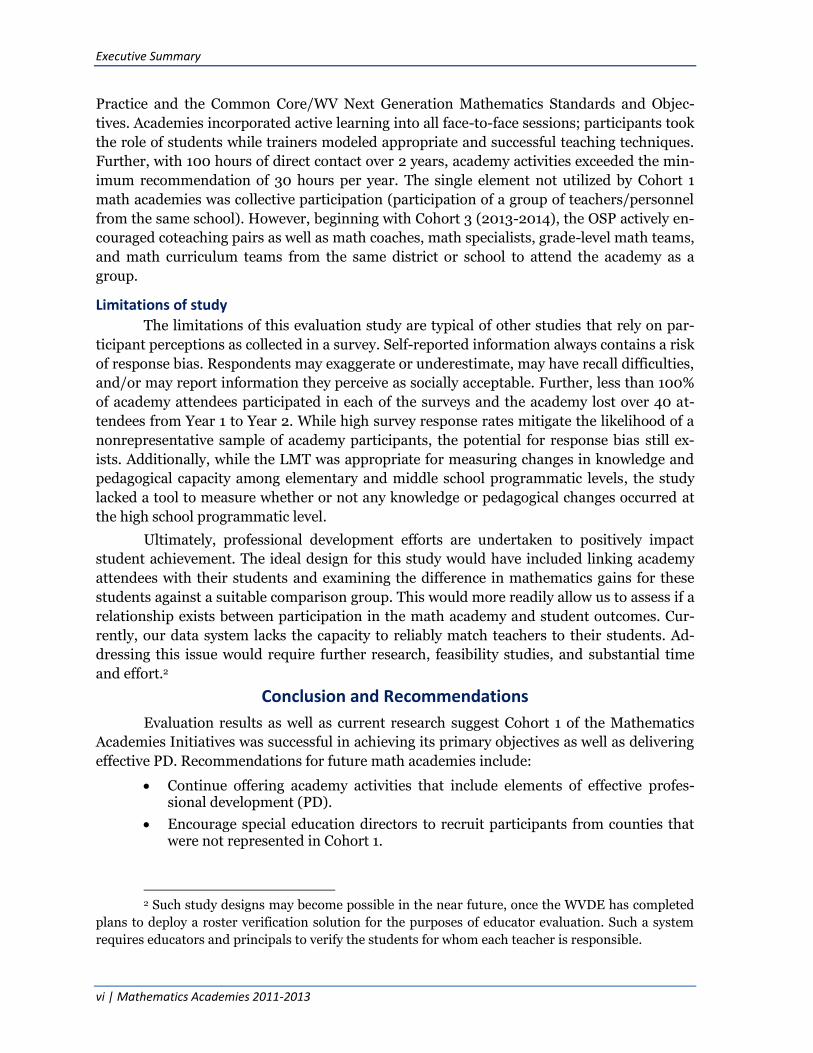
Ultimately, professional development efforts are undertaken to positively impact
student achievement. The ideal design for this study would have included linking academy
attendees with their students and examining the difference in mathematics gains for these
students against a suitable comparison group. This would more readily allow us to assess if a
relationship exists between participation in the math academy and student outcomes. Cur-
rently, our data system lacks the capacity to reliably match teachers to their students. Ad-
dressing this issue would require further research, feasibility studies, and substantial time
and effort.2
Conclusion and Recommendations
Evaluation results as well as current research suggest Cohort 1 of the Mathematics
Academies Initiatives was successful in achieving its primary objectives as well as delivering
effective PD. Recommendations for future math academies include:
Continue offering academy activities that include elements of effective profes-sional development (PD).
Encourage special education directors to recruit participants from counties that were not represented in Cohort 1.
2 Such study designs may become possible in the near future, once the WVDE has completed
plans to deploy a roster verification solution for the purposes of educator evaluation. Such a system
requires educators and principals to verify the students for whom each teacher is responsible.

Executive Summary
Mathematics Academies 2011-2013 | vii
Review academy content and classroom examples, and consider providing more strategies and scaffolding that special education students may need to be success-ful with grade-level, standards-based instruction.
Promote collective participation by encouraging the recruitment and participa-tion of coteaching pairs and/or teams of teachers and specialists from the same school or district.
Continue to develop the algebra content knowledge and instructional skills of middle school special education teachers.
Consider the feasibility of determining if any correlation exists between the Mathematics Academies Initiative and gains in math performance and/or profi-ciency among special education students.

viii

ix
Contents
Executive Summary ................................................................................................................. iii
Introduction ............................................................................................................................... 1
Relevant Scholarship .......................................................................................................... 2
Methods .................................................................................................................................... 5
Population Characteristics .................................................................................................. 5
Sampling Procedures .......................................................................................................... 5
Data Analysis ...................................................................................................................... 5
Post-PD Survey ................................................................................................................... 6
End-of-Year Survey ............................................................................................................. 6
Learning Mathematics for Teaching Assessment ................................................................7
Results ....................................................................................................................................... 9
Year 1–Proportional Reasoning .......................................................................................... 9
Post-PD survey and end-of-year survey ....................................................................... 9
Learning Mathematics for Teaching assessment ........................................................ 17
Year 2–Developing Algebraic Thinking ............................................................................. 18
Post-PD survey and end-of-year survey ...................................................................... 18
Learning Mathematics for Teaching assessment ....................................................... 27
End-of-Year Survey Items, Years 1 and 2 ......................................................................... 27
Discussion ................................................................................................................................ 31
Quality of Math Academy Elements .................................................................................. 31
Attitude and Disposition Toward Mathematics Instruction ............................................ 32
Content Knowledge in Mathematics Focus Areas ............................................................ 32
Elements of Effective PD Present in the Mathematics Academies Initiatives ................. 34
Limitations ........................................................................................................................ 35
Recommendations .................................................................................................................. 37
References ............................................................................................................................... 39
Appendix A. .............................................................................................................................. 41
Cohort 1 Year 1–Post-PD and End-of-Year Survey Results ............................................... 41
Appendix B. ............................................................................................................................. 53
Contents
x | Mathematics Academies 2011-2013
Cohort 1 Year 2–Post-PD and End-of-Year Survey Results .............................................. 53
Appendix C. ............................................................................................................................. 65
Cohort 1 Years 1 and 2–Items Unique to the End-of-Year Surveys .................................. 65
List of Figures
Figure 1. Item Characteristic Curves (ICCs) .......................................................................... 8
Figure 2. Counties Represented by Cohort 1, Year 1 Academy Attendees .............................. 9
Figure 3. Academy Participant Characteristics by Survey, 2011-2012 ................................. 10
Figure 4. Usefulness of Math Academy PD, 2011-2012 ......................................................... 11
Figure 5. Meeting Teachers’ Professional Needs, 2011-2012 ................................................ 11
Figure 6. Comparing the Math Academy to Other PD, 2011-2012 ........................................ 11
Figure 7. Post-PD Survey: Applying Math Academy Knowledge/Skills, 2011-2012 ............ 12
Figure 8. End-Of-Year Survey: Applying Math Academy Knowledge/Skills, 2011-2012 .... 12
Figure 9. Math Academy Material Quality Ratings, 2011-2012 ........................................... 13
Figure 10. Math Academy Trainer Quality Ratings, 2011-2012 ............................................. 14
Figure 11. Math Academy PD Quality Ratings, 2011-2012 .................................................... 15
Figure 12. Counties Represented by Cohort 1, Year 2 Academy Attendees ........................... 18
Figure 13. Academy Participant Characteristics by Survey, 2012-2013 ................................ 19
Figure 14. Post-PD Survey: Usefulness of Math Academy PD, 2012-2013 ............................ 20
Figure 15. End-Of-Year Survey: Usefulness of Math Academy PD, 2012-2013 .................... 20
Figure 16. Meeting Teachers’ Professional Needs, 2012-2013 ............................................... 21
Figure 17. Comparing the Math Academy to Other PD, 2012-2013 ...................................... 21
Figure 18. Post-PD Survey: Applying Math Academy Knowledge/Skills, 2012-2013 ........... 22
Figure 19. End-Of-Year Survey: Applying Math Academy Knowledge/Skills, 2012-2013 .... 22
Figure 20. Math Academy Material Quality Ratings, 2012-2013 ........................................... 23
Figure 21. Math Academy PD Quality Ratings, 2012-2013 .................................................... 24
Figure 22. Math Academy Trainer Quality Ratings, 2012-2013 ............................................ 24
Figure 23. Change In Mathematical Attitudes, 2011-2013 ..................................................... 27
Figure 24. Change in Proportional Reasoning Knowledge, Year 1, 2011-2012 ...................... 28
Figure 25. Change in Math Academy Content Knowledge and Attitude, Year 2, 2012-2013 28
Figure 26. Helpfulness of Math Academy Components, 2011-2013 ...................................... 29
Figure 27. Levels of Support for Math Academy Participants, 2011-2013 ............................. 30
Contents
Mathematics Academies 2011-2013 | xi
List of Tables
Table 1. Cohort 1 Post-PD Survey Organization ................................................................ 6
Table 2. Cohort 1 End-of-Year Survey Organization .......................................................... 7
Table 3. Proportional Reasoning LMT Results, 2011-2012 .............................................. 18
Table 4. Patterns, Functions and Algebra LMT Results, 2012-2013 ................................ 27
Table 5. Comparison of Effective PD Elements to Math Academy Cohort 1 (2011-
2013) ................................................................................................................... 35
Table A 1. County of Employment (2011-2012)................................................................... 41
Table A 2. Grade Levels Taught (2011-2012) ...................................................................... 42
Table A 3. Years of Experience in Current Position (2011-2012) ....................................... 43
Table A 4. Years of Experience in Education (2011-2012) .................................................. 43
Table A 5. Academy Activities Attendance (2011-2012) ..................................................... 43
Table A 6. Usefulness of the Math Academy (2011-2012) .................................................. 44
Table A 7. Meeting Teachers’ Professional Needs (2011-2012) .......................................... 44
Table A 8. Applying/Practicing Math Academy Skills (2011-2012).....................................45
Table A 9. Alignment With Goals for Instructional Improvement (2011-2012) ................ 46
Table A 10. Comparison of the Math Academy to Other PD (2011-2012) ............................. 47
Table A 11. Participant Evaluation of Math Academy PD (2011-2012) ............................... 48
Table A 12. Participant Evaluation of Math Academy Materials (2011-2012) ..................... 48
Table A 13. Participant Evaluation of Math Academy Trainers (2011-2012) ....................... 50
Table A 14. Average Evaluation of Math Academy PD (2011-2012) ..................................... 51
Table A 15. Average Evaluation of Math Academy Materials (2011-2012) ........................... 51
Table A 16. Average Evaluation of Math Academy Trainers (2011-2012) ............................. 51
Table B 1. County of Employment (2012-2013) .................................................................. 53
Table B 2. Grade Levels Taught (2012-2013) ......................................................................54
Table B 3. Years of Experience in Current Position (2012-2013) ........................................54
Table B 4. Years of Experience in Education (2012-2013) .................................................. 55
Table B 5. Academy Activities Attendance (2012-2013) ..................................................... 55
Table B 6. Usefulness of the Math Academy (2012-2013) ...................................................56
Table B 7. Meeting Teachers’ Professional Needs (2012-2013) .......................................... 57
Table B 8. Applying/Practicing Math Academy Skills (2012-2013) ................................... 58
Table B 9. Alignment With Goals for Instructional Improvement (2012-2013) .................59
Contents
xii | Mathematics Academies 2011-2013
Table B 10. Comparison of the Math Academy to Other PD (2012-2013) ............................ 59
Table B 11. Participant Evaluation of Math Academy PD (2012-2013) ............................... 60
Table B 12. Participant Evaluation of Math Academy Materials (2012-2013) ..................... 61
Table B 13. Participant Evaluation of Math Academy Trainers (2012-2013) ....................... 62
Table B 14. Average Evaluation of Math Academy PD (2012-2013) .................................... 63
Table B 15. Average Evaluation of Math Academy Materials (2012-2013) .......................... 63
Table B 16. Average Evaluation of Math Academy Trainers (2012-2013) ............................ 63
Table C 1. Mathematical and Pedagogical Attitudes at the Conclusion of the
Proportional Reasoning Academy; Year 1 (2011-2012) ..................................... 65
Table C 2. Mathematical and Pedagogical Attitudes at the Conclusion of the
Developing Algebraic Thinking Academy; Year 2 (2012-2013) ......................... 66
Table C 3. Self-Reported Proportional Reasoning Mathematical Knowledge; Year 1
(2011-2012)......................................................................................................... 67
Table C 4. Self-Reported Developing Algebraic Thinking Mathematical Knowledge;
Year 2 (2012-2013) ............................................................................................. 67
Table C 5. Helpfulness snd Understandability of Proportional Reasoning Academy
Components; Year 1 (2011-2012) ....................................................................... 68
Table C 6. Helpfulness of Developing Algebraic Thinking Academy Components; Year
2 (2012-2013) ..................................................................................................... 70
Table C 7. Reported Support From Offices and/or Individuals Among Proportional
Reasoning Participants; Year 1 (2011-2012) ....................................................... 71
Table C 8. Reported Support From Offices and/or Individuals Among Developing
Algebraic Thinking Participants; Year 2 (2012-2013) ....................................... 72
Table C 9. Average Helpfulness of Academy Components (2011-2013) ............................. 74

1
Introduction
At the request of the West Virginia Department of Education (WVDE) Office of Spe-
cial Programs (OSP), the WVDE Office of Research (OR) is conducting evaluation studies
across multiple years of activities related to the Mathematics Academies Initiative. The initi-
ative is a partnership among West Virginia school districts, OSP, and Carnegie Learning,
Inc., in which OSP provides coordination and Carnegie Learning provides the content train-
ing to teachers identified and invited through district offices. The first cohort (hereafter Co-
hort 1) to participate in the Mathematics Academies Initiative began in the summer of 2011
and concluded during the spring of 2013. Throughout the 2-year span, math academies pro-
vided specific content-area professional development (PD) to this group of primarily special
education teachers from across the state of West Virginia. The purpose of the current study
is to evaluate outcomes for Cohort 1.3
In collaboration with the OSP, the OR designed this evaluation study to measure the
effectiveness and impact of the math academies in three areas: (a) the quality of academy
elements (i.e. materials, trainers, overall PD); (b) the impact of the academy on teachers’ at-
titudes and dispositions toward mathematics instruction; and (c) the impact of the academy
on teachers’ content and pedagogical knowledge in specific mathematics focus areas. While
there are currently technical limitations in our ability to study possible links between the
Mathematics Academies Initiative and student achievement gains in math (see Limitations,
page 35), the initiative operates based on the assumption that “deeper understanding of the
WV Next Generation Mathematics Standards and Objectives (NxGCSOs), mathematical rea-
soning and problem solving [will] enhance teachers’ abilities to provide high quality instruc-
tion to maximize success for each student” (Farrell, 2014).
The math academies focused on two different content areas. In 2011, the content fo-
cus for Cohort 1 was proportional reasoning; in 2012 it was developing algebraic thinking. To
increase statewide access for participants, academy activities were repeated in multiple loca-
tions across the state (Cohort 1 locations included the greater areas of Charleston, Hunting-
ton, Beckley, and Clarksburg/Bridgeport). Each academy year involved multiple activities
beginning with a 5-day face-to-face summer academy and concluding the following spring
with a 1-day face-to-face follow up. Additionally, academy activities included a 1-day face-to-
face follow up in the autumn, and self-paced online modules (MATHia and Cognitive Tutor,
developed by Carnegie Learning). Each year, academy participants received nearly 50 hours
of face-to-face instruction. Further, during the 1st year Cohort 1 spent approximately 8 hours
completing the online modules; in the 2nd year they used approximately 26 hours to com-
plete the modules. Across both academy years, participants dedicated over 130 hours to
math academy activities.
3 This study was reviewed and approved by the WVDE Institutional Review Board (IRB); the
study’s approval number is IRB-CIS-010. Visit http://wvde.state.wv.us/research/IRB/ for more in-
formation.
Introduction
2 | Mathematics Academies 2011-2013
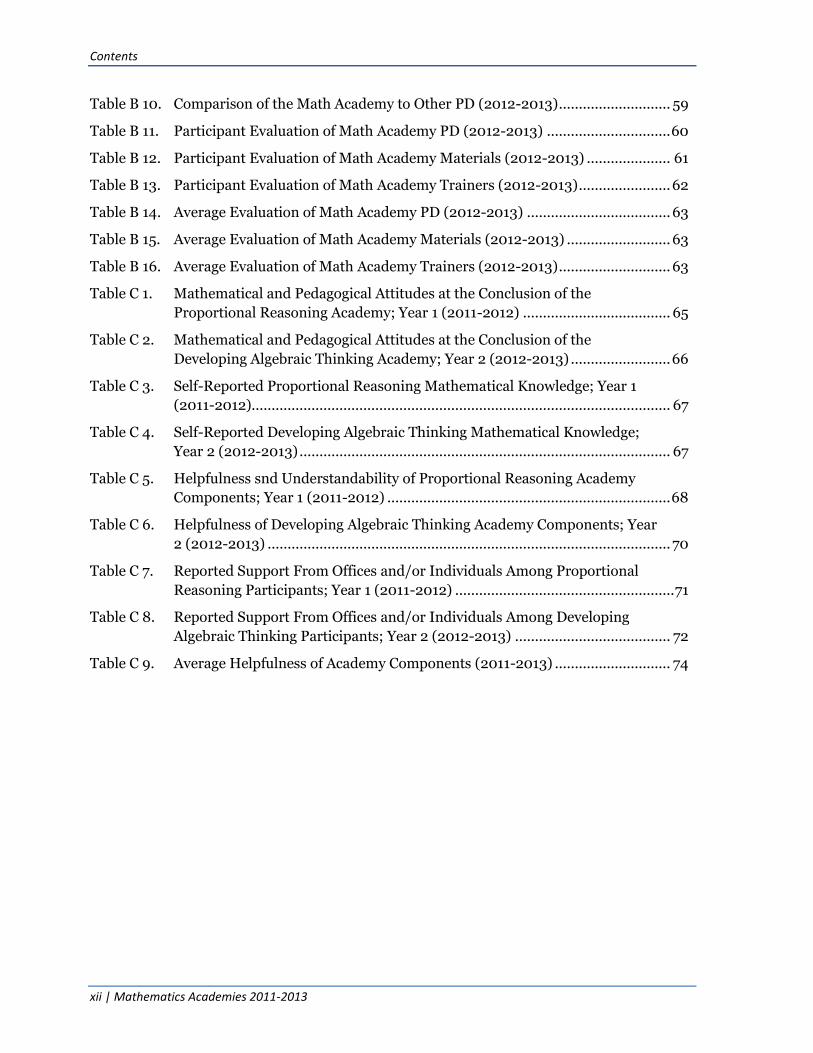
This mixed methods study used three tools to gather quantitative and qualitative da-
ta: (a) a post-professional-development survey (hereafter, post-PD survey) distributed short-
ly after the initial weeklong summer academy; (b) an end-of-year survey conducted at the
conclusion of academy activities; and (c) when appropriate, the Learning Mathematics for
Teaching (LMT) pre-/post-knowledge assessment. The post-PD and end-of-year surveys col-
lected perceptual information regarding (a) the quality of academy elements (i.e. instruction,
materials, content, etc.), and (b) changes in knowledge, attitudes, and practices related to
mathematics and mathematics instruction. The LMT assessment (developed by the Univer-
sity of Michigan4) is a research- and evidence-based tool that measured changes in content
knowledge and instructional capacity.5
Primarily, the results of the study are organized by cohort year and content focus.
First, we compare and contrast results from Year 1 post-PD and end-of-year surveys. Second,
Year 1 LMT results (proportional reasoning) will be presented in the form of descriptive sta-
tistics; inferential statistics are used to test the significance of pre-to-post-test gains on the
assessment. Third, results from Year 2 post-PD and end-of-year surveys are compared and
contrasted. Fourth, Year 2 LMT results (algebraic thinking) are described and interpreted.
Last, with a number of items unique to the end-of-year surveys, we will compare Year 1 re-
sults to those of Year 2. The report concludes with a discussion of study findings and rec-
ommendations to help inform decision making for future PD opportunities.
Relevant Scholarship
Academy content provided by Carnegie Learning is based on both the changing
needs among classroom teachers and on evidence-based curriculum development. The fol-
lowing excerpt from Carnegie Learning’s project proposal (Carnegie Learning, Inc., n.d.[a])
describes what prompted them to develop multiple content-focused math academies, and
the research base they drew from:
In 2008, the National Math Advisory Panel advised educators to make fundamental changes to curriculum and instruction in mathematics: Among these recommenda-tions were: (1) focusing the K-8 curriculum to prepare students to connect learning to concepts they will need in later years of math; (2) applying knowledge from rigorous research on children’s math learning; and (3) promoting more effective math teach-ers through better in-service and pre-service training (National Mathematics Adviso-ry Panel, 2008). Based on these recommendations, NCTM developed new standards for the teaching of mathematics, and Carnegie Learning developed the K-8 Math Academies, applying the new research along with those new standards. All six courses offered by the K-8 Math Academies incorporate three key components: (1) grade-appropriate content, (2) pedagogy based on problem solving, and (3) heightened awareness of teaching as a basis for continuous professional growth.
The first core element of the K-8 Math Academies involved Carnegie Learning’s crea-tion of specific grade-appropriate content spans. This development was based on the teaching prescriptions put forward by Lou Ann Lovin and John Van de Walle’s
4 Visit http://sitemaker.umich.edu/lmt/home for more information regarding the LMT.
5 The LMT assessment is available among specific content focus areas for elementary and
middle school teachers.

Introduction
Mathematics Academies 2011-2013 | 3
(2006) work emphasizing (1) appropriately differentiated grade span and (2) stretch as the dual bases for the teaching of mathematics in the elementary grades.
The second core element of the Math Academy development, problem-solving in a student-centered classroom, underlies all Carnegie Learning’s pedagogical approach-es to mathematics instruction. Problem-solving in both teaching and learning is based on John Anderson’s ACT-R model of learning and performance (Anderson 1993) and John Van de Walle’s (1999) work applying problem solving specifically to the teaching of early mathematics to children. Both performance knowledge in An-derson’s (1993) work, or “network” knowledge in Van de Walle’s (1999) rest on re-search-backed assumptions that both mathematics and the teaching of mathematics can only be learned by actively doing, not by just passively listening or watching. In Carnegie’s K-8 Math Academies, instructors facilitate teachers’ learning through problem-solving, enabling educators to learn exactly as their students do, by actively engaging in discourse with colleagues and peers around their learning to enhance and sustain it.
The third core component reflects a heightened awareness about teaching. This com-ponent, based on the research of Brookfield (1995), facilitates teachers’ meta-cognitive reflections on their own teaching practices. In this project, the Math Acad-emies will provide the initiation of this process of reflection. Coaching in the tech-nique and an active online Community of Practice will provide the essential follow-up.
Additionally, the online modules accompanying the math academies (Cognitive Tutor
and MATHia) have a strong research and evidence base. According to Carnegie Learning
(Carnegie Learning, Inc., n.d. [b]), the Cognitive Tutor software—based on the ACT-R theory
of learning, memory, and performance—has been validated in more than 50 publications.
For more information about Carnegie Learning’s curriculum and software development, visit
their website at http://www.carnegielearning.com/research/.

4
5
Methods
Population Characteristics
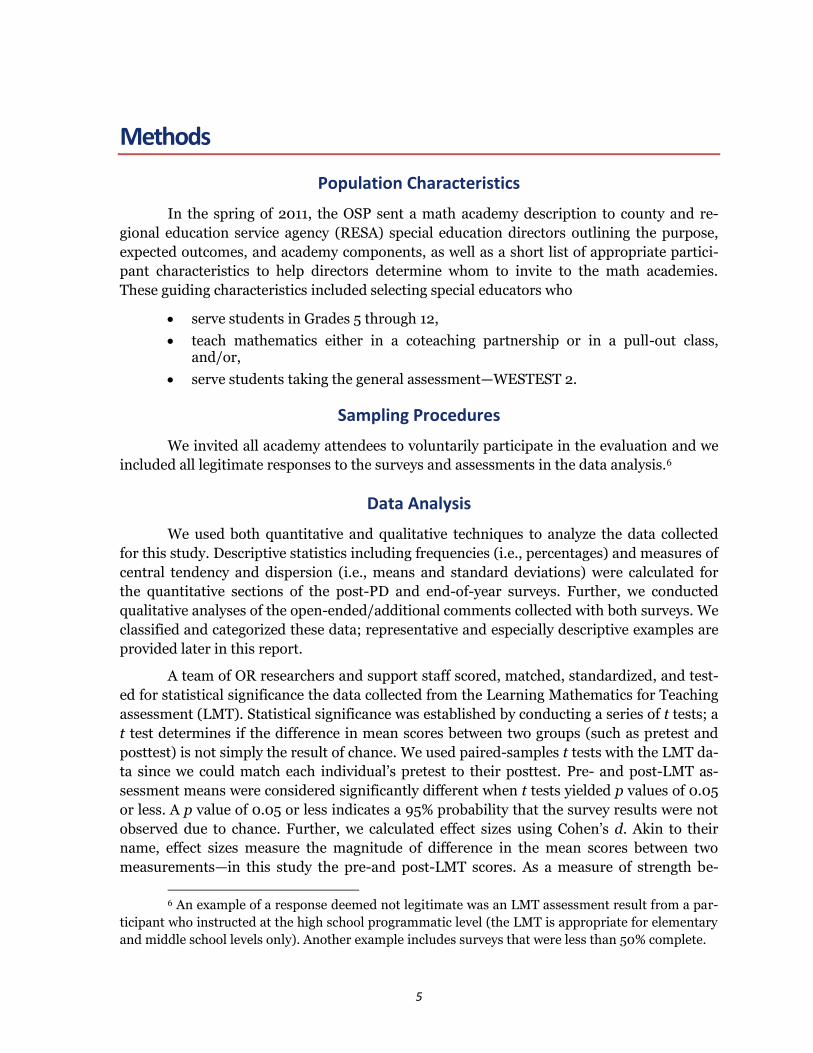
In the spring of 2011, the OSP sent a math academy description to county and re-
gional education service agency (RESA) special education directors outlining the purpose,
expected outcomes, and academy components, as well as a short list of appropriate partici-
pant characteristics to help directors determine whom to invite to the math academies.
These guiding characteristics included selecting special educators who
serve students in Grades 5 through 12,
teach mathematics either in a coteaching partnership or in a pull-out class, and/or,
serve students taking the general assessment—WESTEST 2.
Sampling Procedures
We invited all academy attendees to voluntarily participate in the evaluation and we
included all legitimate responses to the surveys and assessments in the data analysis.6
Data Analysis
We used both quantitative and qualitative techniques to analyze the data collected
for this study. Descriptive statistics including frequencies (i.e., percentages) and measures of
central tendency and dispersion (i.e., means and standard deviations) were calculated for
the quantitative sections of the post-PD and end-of-year surveys. Further, we conducted
qualitative analyses of the open-ended/additional comments collected with both surveys. We
classified and categorized these data; representative and especially descriptive examples are
provided later in this report.
A team of OR researchers and support staff scored, matched, standardized, and test-
ed for statistical significance the data collected from the Learning Mathematics for Teaching
assessment (LMT). Statistical significance was established by conducting a series of t tests; a
t test determines if the difference in mean scores between two groups (such as pretest and
posttest) is not simply the result of chance. We used paired-samples t tests with the LMT da-
ta since we could match each individual’s pretest to their posttest. Pre- and post-LMT as-
sessment means were considered significantly different when t tests yielded p values of 0.05
or less. A p value of 0.05 or less indicates a 95% probability that the survey results were not
observed due to chance. Further, we calculated effect sizes using Cohen’s d. Akin to their
name, effect sizes measure the magnitude of difference in the mean scores between two
measurements—in this study the pre-and post-LMT scores. As a measure of strength be-
6 An example of a response deemed not legitimate was an LMT assessment result from a par-
ticipant who instructed at the high school programmatic level (the LMT is appropriate for elementary
and middle school levels only). Another example includes surveys that were less than 50% complete.
Methods
6 | Mathematics Academies 2011-2013
tween the differences of two mean scores, effect sizes are not affected by sample size. Cohen
(1988) interpreted effect sizes lower than 0.15 to be negligible, between 0.15 and 0.40 to be
small, between 0.40 and 0.75 to be medium, between 0.75 and 1.10 to be large, and above
1.10 to be very large.
Post-PD Survey
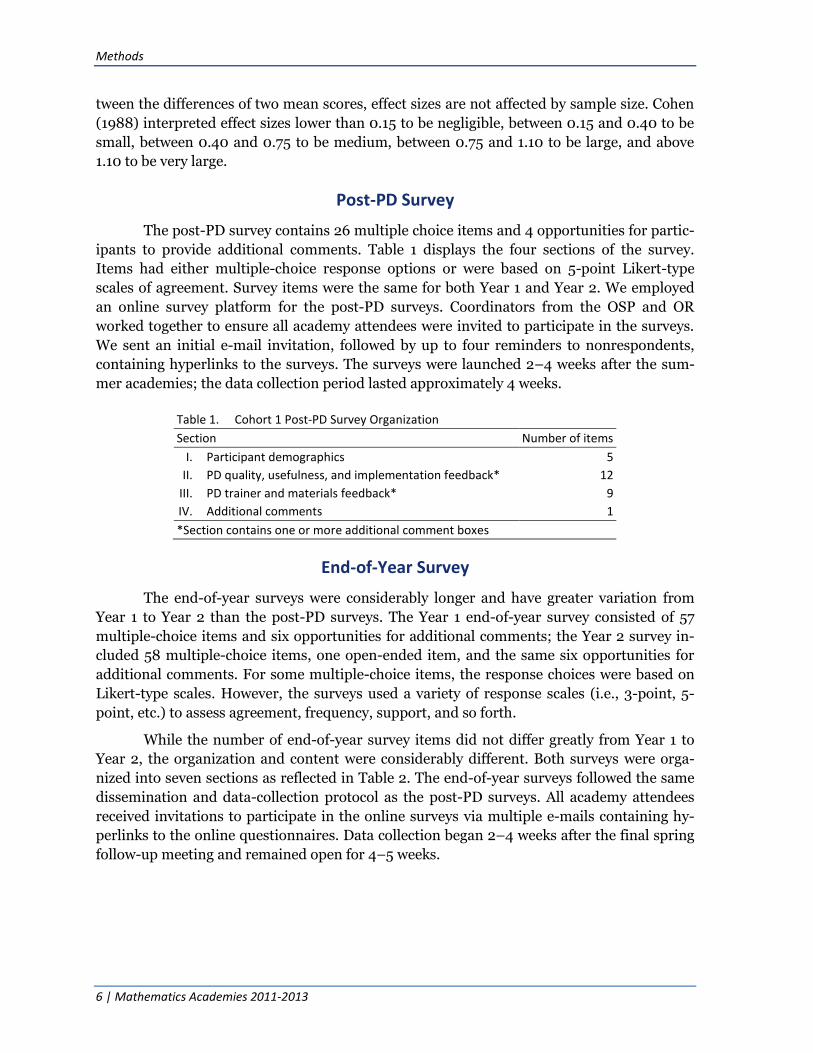
The post-PD survey contains 26 multiple choice items and 4 opportunities for partic-
ipants to provide additional comments. Table 1 displays the four sections of the survey.
Items had either multiple-choice response options or were based on 5-point Likert-type
scales of agreement. Survey items were the same for both Year 1 and Year 2. We employed
an online survey platform for the post-PD surveys. Coordinators from the OSP and OR
worked together to ensure all academy attendees were invited to participate in the surveys.
We sent an initial e-mail invitation, followed by up to four reminders to nonrespondents,
containing hyperlinks to the surveys. The surveys were launched 2–4 weeks after the sum-
mer academies; the data collection period lasted approximately 4 weeks.
Table 1. Cohort 1 Post-PD Survey Organization
Section Number of items
I. Participant demographics 5
II. PD quality, usefulness, and implementation feedback* 12
III. PD trainer and materials feedback* 9
IV. Additional comments 1
*Section contains one or more additional comment boxes
End-of-Year Survey
The end-of-year surveys were considerably longer and have greater variation from
Year 1 to Year 2 than the post-PD surveys. The Year 1 end-of-year survey consisted of 57
multiple-choice items and six opportunities for additional comments; the Year 2 survey in-
cluded 58 multiple-choice items, one open-ended item, and the same six opportunities for
additional comments. For some multiple-choice items, the response choices were based on
Likert-type scales. However, the surveys used a variety of response scales (i.e., 3-point, 5-
point, etc.) to assess agreement, frequency, support, and so forth.
While the number of end-of-year survey items did not differ greatly from Year 1 to
Year 2, the organization and content were considerably different. Both surveys were orga-
nized into seven sections as reflected in Table 2. The end-of-year surveys followed the same
dissemination and data-collection protocol as the post-PD surveys. All academy attendees
received invitations to participate in the online surveys via multiple e-mails containing hy-
perlinks to the online questionnaires. Data collection began 2–4 weeks after the final spring
follow-up meeting and remained open for 4–5 weeks.

Methods
Mathematics Academies 2011-2013 | 7
Table 2. Cohort 1 End-of-Year Survey Organization
Survey Section Number of items
Year 1 I. Demographics and mathematical knowledge/attitudes 13
II. Academy activity attendance 3
III. PD quality, usefulness, and implementation feedback* 20
IV. PD trainer and materials feedback* 9
V. Organizational support* 8
VI. Suggestions for future PD activities* 4
VII. Additional comments 1
Year 2 I. Demographics and mathematical knowledge/attitudes 14
II. Activity attendance, comparison of Year 1 vs. Year 2 and content specific items
9
III. PD quality, usefulness, and implementation feedback* 16
IV. PD trainer and materials feedback* 9
V. Organizational support* 7
VI. Suggestions for future PD activities* 4
VII. Additional comments 1
*Section contains one or more additional comment boxes
Learning Mathematics for Teaching Assessment
The LMT assessments are research-based pre-/post-tests developed by the Universi-
ty of Michigan’s School of Education to measure elementary and middle school teachers’
mathematical knowledge and pedagogical abilities in specific content areas. The University
of Michigan describes the LMT as follows:
Our project investigates the mathematical knowledge needed for teaching, and how such knowledge develops as a result of experience and professional learning. We do so through the writing, piloting, and analysis of problems that reflect real mathemat-ics tasks teachers face in classrooms - for instance, assessing student work, represent-ing numbers and operations, and explaining common mathematical rules or procedures. Assessments composed of these problems are often used to measure the effectiveness of professional development intended to improve teachers' mathemati-cal knowledge (LMT, n.d. [b]) .
Items in each category capture whether teachers can not only answer the mathemat-ics problems they assign students, but also how teachers solve the special mathemati-cal tasks that arise in teaching, including evaluating unusual solution methods, using mathematical definitions, representing mathematical content to students, and identi-fying adequate mathematical explanations.
Each elementary (K-6) item has each been piloted with over 600 elementary teachers, yielding information about item characteristics and overall scale reliabilities for pi-loted forms. Our middle school items have each been piloted with over 300 middle school teachers (LMT, n.d. [a]).
Most LMT assessments consist of two equated forms (A and B), and depending on
content focus, each form typically includes 13-16 items. If a participant takes Form A at the
pretest (administered during the first day of the summer academy), then they take Form B
as a posttest (administered at the spring follow-up), and vice versa. To reduce the possibility
of test-retest effects, the majority of items on each form are unique. Pre-post comparisons

Methods
8 | Mathematics Academies 2011-2013
are possible because the two forms are equated using item response theory (IRT). IRT in-
volves the calculation of item-level statistics that are used to estimate the probability of an
individual correctly responding to an item based on their ability and several important di-
mensions. Most commonly these dimensions include item difficulty and discrimination (i.e.
the item’s ability to differentiate accurately among high- and low-ability test takers).
Item characteristic curves (ICCs) illustrate these dimensions. For example, the hori-
zontal position of the two ICCs depicted in Figure 1 shows the difficulty levels of two test
items (represented by Curve 1 and Curve 2) and the slope of each curve depicts the item’s
ability to differentiate among test takers of varying ability levels. The further to the right the
ICC, the more difficult the item. Likewise, the steeper the item curve, the better its ability to
differentiate among test takers. A flat ICC would represent an item for which the probability
of a correct response was not dependent at all on test taker ability.
In this example the difficulty level of the first item (Curve 1) is 0; and the difficulty
for the second item (Curve 2) is 1. Figure 1 also visualizes the relationships between proba-
bility, item difficulty, and ability. Curve 1 is an item that individuals with average ability have
an equal chance of providing a correct response. Curve 2, with a higher difficulty level, would
require an individual to have above average ability for an equal chance to provide a correct
response. As indicated by their slopes, both items discriminate similarly among test takers of
different ability levels.
To ensure proper in-
terpretation and use of
LMT results, the University
of Michigan requires indi-
viduals to attend training
prior to administering the
assessments. In 2011, a
small group of staff mem-
bers from WVDE and local
education agencies attend-
ed this training.
Pro
bab
ility
1.0
0.9
0.8
0.7
0.6
0.5
0.4
0.3
0.2
0.1
0.0
-5 -4 -3 -2 -1 0 1 2 3 4 5 Measurement scale Low ability High ability
Figure 1. Item Characteristic Curves (ICCs)
This figure, adopted from a State Collaborative on Assessment and Student Standards publication, A Practitioner’s Introduction to Equating (http://www.ccsso.org), depicts the difficulty level of 2 items (Curve 1 and Curve 2) at the 0.5 (or 50/50) probability rate. Curve 1 has a difficulty level of 0; Curve 2 a difficulty level of 1.
Curve 1
Curve 2

9
Results
Cohort 1 results are organized by year; first results from Year 1 will be discussed fol-
lowed by Year 2 results. To provide a way to compare and contrast, several items on the
post-PD and end-of-year surveys are the same or similar. This process allowed us to collect
feedback from participants at the onset of the academy and then again at the conclusion of
the academy year. Learning Mathematics for Teaching assessment (LMT) results will also be
presented by year.
While most results are confined to a specific academy year, some survey items ap-
peared in the end-of-year surveys only. These items, mostly centered on mathematical atti-
tudes and beliefs, provide some interesting findings across the 2-year period.
Year 1–Proportional Reasoning
Post-PD survey and end-of-year survey
Of the 119 participants in the 1st year of the Mathematics Academies Initiative, nearly
80% (n = 95) responded to the post-PD survey, and approximately 65% (n = 77) responded
to the end-of-year survey. Those responding to at least one of the academy surveys repre-
sented 35 counties across the
state (see Figure 2). Additionally,
in some cases these counties
were represented by more than
one teacher. While matching in-
dividual responses was not pos-
sible from the post-PD survey to
the end-of-year survey, examin-
ing results from the two surveys
revealed substantially similar
characteristics from both groups
of respondents. Therefore, with
alike demographic traits, it is
reasonable to draw general infer-
ences when comparing results
from the post-PD survey to the
end-of-year survey.
As depicted in Figure 3,
those participating in each of the
academy surveys shared similar
percentages in the grades they
taught (the majority of teachers
reported instructing at the mid-
dle- and high-school program-
Figure 2. Counties Represented by Cohort 1, Year 1 Academy
Attendees
Math academy attendees (responding to at least one academy survey) represented 35 counties across West Virginia. Put another way, teachers from more than 60% of the counties in the state attended Year 1 of the Math Academy.

Results
10 | Mathematics Academies 2011-2013
matic levels). Further, they exhibited comparable years of experience in their current teach-
ing positions (most reporting 1–5 years), as well as similar years of experience in the field of
education (the majority of responding teachers had over 16 years of experience, but many
also reported 1–5 years of ex-
perience as well as 6–10). Fi-
nally, the four locations of the
initial summer academies were
represented relatively equally
from one survey to the other.
These results indicate not only
comparable characteristics
from the post-PD to the end-
of-year surveys, but also a rela-
tively good mixture of teachers
representing various pro-
grammatic levels, years of ex-
perience, and locales. All
descriptive statistics for Cohort
1, Year 1 surveys can be found
in Appendix A, starting on
page 41.
Both the post-PD and
end-of-year surveys asked
academy participants several
series of questions relating to
the usefulness and quality of
the Mathematics Academy.
This type of survey design al-
lows us to evaluate partici-
pants opinions after the initial
5-day summer academy and
then again at the conclusion of
the academy nearly 1 year lat-
er. As is evidenced in the fol-
lowing pages, results of these
pre-/post-items remained no-
tably consistent from the post-
PD to end-of-year surveys.
0 50 100 150
No reply
Huntington
Beckley
Clarksburg
Charleston
No reply
16+
11 to 15
6 to 10
1 to 5
<1 year
No reply
16+
11 to 15
6 to 10
1 to 5
<1 year
12th
11th
10th
9th
8th
7th
6th
5th
4th
3rd
2nd
1st
K
Percentage
Post-PD survey
End-of-year survey
Year
s o
f
exp
erie
nce
in
Tota
l yea
rs o
f
teac
hin
g ex
per
ien
ce
Loca
tio
n o
f
sum
mer
aca
dem
y G
rad
es
tau
ght
(se
lect
all
that
ap
ply
)
Figure 3. Academy Participant Characteristics by Survey, 2011-
2012
This figure shows participants responding to the post-PD (n = 95) and end-of-year (n = 77) surveys shared similar demographics, including grades taught, total years of teaching and years of experience in current position, as well as representing similar percentages of academy locations.

Results
Mathematics Academies 2011-2013 | 11
When asked about
the usefulness of the acade-
my, the majority of respond-
ents indicated the PD was a
good start and that they look
forward to using what they
have learned (approximately
54% in the post-PD results,
and slightly more than 57%
in the end-of-year survey).
The next most common re-
sponse with nearly 16% and
25% of the responses, re-
spectfully, was it was a good
start. The least common re-
sponse was I don’t think that
these ideas will work very
well, representing just over
1% in both the surveys. See
Figure 4 to view all response
results.
Next respondents
were asked to indicate the
extent to which the PD met
their professional needs (see
Figure 5). With nearly 77% in
the post-PD survey and over
71% in the end-of-year sur-
vey, the predominant re-
sponse was it addressed some
of my professional learning
needs. Only 1% in the post-PD
and less than 3% in the end-
of-year surveys stated that it
did not address my profes-
sional learning needs.
The next survey item
asked teachers to compare
the PD they received in the
math academy to any other
PD experiences from the past
3 years (see Figure 6). Ap-
proximately 59% of respond-
ents in the post-PD survey and over 66% in the end-of-year survey said the math academy
Figure 4. Usefulness of Math Academy PD, 2011-2012
Post PD survey n = 95 and end-of-year survey n = 77
I don’t think that these ideas will work very well
It provided everything I need to use in my classroom
No reply
It was a good start, but I have a lot of questions
It’s too early to tell
It was a good start
It was a good start, and I look forward to using what Ilearned
0 20 40 60 80 100 120Percentage
Which of the following statements best describes the usefulness of this training/PD for your classroom/work setting?
Post-PD survey End-of-year survey
Figure 5. Meeting Teachers’ Professional Needs, 2011-2012
Post PD survey n = 95 and end-of-year survey n = 77
0 20 40 60 80 100 120 140 160
It did not address my professional learning needs
No reply
It addressed my professional learning needscompletely
It addressed some of my professional learningneeds
Percentage
Indicate the extent to which the training/PD met your professional needs.
Post-PD survey End-of-year survey
Figure 6. Comparing the Math Academy to Other PD, 2011-2012
Post-PD survey n = 95 and end-of-year survey n = 77
0 50 100 150
Less useful
No PD in last 3 years
No reply
No opinion
About the same
More useful
Percentage
Which of the following statements best describes how this training/PD compares with other PDs in which you have
participated in the last three years?
Post-PD survey End-of-year survey

Results
12 | Mathematics Academies 2011-2013
was more useful. Additionally, only 1% in the post-PD survey and zero teachers in the end-
of-year survey indicated the PD was less useful.
Both surveys also asked teachers the likelihood of applying what they learned in the
math academy in their classrooms/work settings. The post-PD survey offered four response
choices; they are listed in the key under Figure 7. The predominant response, with close to
78% of all responses, was (a) I look forward to practicing/applying the knowledge/skills in
my classroom during the upcoming school year.
Figure 7. Post-PD Survey: Applying Math
Academy Knowledge/Skills, 2011-2012
Figure 7 key a. I look forward to practicing/applying the
knowledge/skills in my classroom during the upcoming school year
b. I already practice/apply the knowledge/ skills this training provided in my classroom, and it seems to work well
c. I have already practiced/applied the knowledge/skills this training provided in my classroom, but it is not appropriate for my students
d. I don’t think what I learned here will work for my students so I don’t envision applying the knowledge/skills
Note: Total % 100 (percent of no response was excluded)
77.89
7.37
5.26
2.11
a b c d
n = 95
Figure 8. End-Of-Year Survey: Applying Math
Academy Knowledge/Skills, 2011-2012
Figure 8 key a. I now practice/apply the knowledge/skills
the academy provided in my classroom b. I previously practiced/applied the know-
ledge/skills the academy provided in my classroom AND I continue to do so
c. I have not practiced/applied what I learned BUT I plan to practice/apply the knowledge/ skills in my classroom soon
d. I do not practice/apply what I learned at the math academy because it is not appropriate for my students
e. I do not practice/apply what I learned at the math academy because of other reasons
f. I previously practiced/applied the know-ledge/skills the academy provided in my classroom BUT I no longer do so
Note: Total % 100 (percent of no response was excluded)
41.56
33.77
9.09
7.79
2.6 1.3
a b c d e f
n = 77

Results
Mathematics Academies 2011-2013 | 13
The corresponding end-of-year survey item offered six response choices. The six op-
tions may be viewed in the key under Figure 8. At just under 34%, (b) I previously prac-
ticed/applied the knowledge/skills the academy provided in my classroom AND I continue
to do so, was the second most common response. These results indicate that many of the
teachers who intended to implement knowledge and skills gained in the math academy did
so within the 2011-2012 school year.
The next survey item asked teachers how closely the math academy PD was related to
their schools’ or programs’ goals for improving instruction. Among both the post-PD and
end-of-year surveys more than 50% of teachers said the math academy was very closely
aligned with their school’s/program’s goals. Just under 30% in the post-PD survey and
slightly less than 40% in the end-of-year survey said the PD was somewhat aligned. Eight
percent and 5%, respectively, reported I do not know; and approximately 1% of responses to
both surveys stated the PD was not aligned.
The final three sets of survey items directly comparable from post-PD to end-of-year
responses focused on the quality of math academy materials, trainers, and overall PD. Each
set of survey items was based on a 5-point Likert-type scale of agreement (strongly agree,
agree, neutral, disagree, and strongly disagree). The three sets of items were analyzed in
two different ways. First, looking at the individual items in each set, frequencies (represent-
ed as percentages) were determined for each response on the 5-point scale. Second, we aver-
aged the individual items (where 5 = strongly agree, 4 = agree, 3 = neutral, 2 = disagree,
and 1 = strongly disagree) to create an overall composite score for each set.
Four items were used to measure the quality of math academy materials. They were:
(a) adequate amounts of training materials/resources were provided; (b) materials/
resources were relevant to my work; (c) the materials/resources provided were of high qual-
ity (i.e., based on recent research and evidence-based; and (d) the materials/resources pro-
vided were useful to my
work. Figure 9 shows the
individual item results
stacked by post-PD survey
and end-of-year survey.
Note the item names in
the figure correspond
with italicized words in
the complete description
of the 4 items above.
While strongly
agree was the most fre-
quent response across all
items and both surveys
(ranging from 40% to
61%) it is evident in Fig-
ure 9 that more teachers
chose strongly agree in
Figure 9. Math Academy Material Quality Ratings, 2011-2012
Note: PPD:11 = Post-PD survey (n = 95), 2011 and EY:12 = End-of-year survey (n = 77), 2012
0% 20% 40% 60% 80% 100%
Useful (EY:12)
Useful (PPD:11)
High quality (EY:12)
High quality (PPD:11)
Relevant (EY:12)
Relevant (PPD:11)
Adequate amounts (EY:12)
Adequate amounts (PPD:11)
Percentage
Strongly agree Agree Neutral Disagree Strongly disagree No reply

Results
14 | Mathematics Academies 2011-2013
the end-of-year survey compared to the post-PD survey. Likewise, among all items, the se-
cond most frequent response, agree (ranging from 35% to 45%) exhibited an increase from
the post-PD to end-of-year surveys. This trend may be attributable to a decrease in those
choosing “neutral” or not responding in the end-of-year survey. Typically, “disagree” repre-
sented only 1% to 2% of responses among both surveys. There were no strongly disagree
responses in the end-of-year survey and never more than 2% in the post-PD survey.
Calculating a composite mean of the material items resulted in a post-PD mean of 4.3
(out of a possible 5) and end-of-year mean of 4.4. Overall, teachers attending the math acad-
emy gave high quality ratings to the academy materials.
Five items were developed to gauge the quality of the math academy trainers: (a)
trainer(s) were knowl-
edgeable about the top-
ic; (b) trainer(s) were
well organized; (c)
trainer(s) presented the
material clearly and ef-
fectively; (d) trainer(s)
facilitated discussions
well; and (e) trainer(s)
answered questions
raised during sessions
adequately. Figure 10
shows the individual
item results stacked by
post-PD survey and end-
of-year survey. Note the
item names in the figure
correspond with itali-
cized words in the com-
plete description of the
five items above.
Teachers gave math academy trainers overwhelmingly high ratings by selecting
strongly agree most frequently to all items in both surveys. In fact, strongly agree account-
ed for 68% to 83% of the total responses. At a distant second, agree represented from 7% to
22% of the responses. Often no teachers selected disagree or strongly disagree, and the fre-
quencies for these responses did not exceed 2% on either survey. Additionally, fewer re-
spondents opted for neutral, disagree, strongly disagree or provided no response in the
end-of-year survey compared to the post-PD survey.
Moreover, the composite mean was 4.8 (on a 5 point scale) for both the post-PD and
end-of-year surveys. Clearly, participating teachers were highly satisfied with the quality of
the math academy trainers.
Figure 10. Math Academy Trainer Quality Ratings, 2011-2012
Note: PPD:11 = Post-PD survey, 2011 (n = 95) and EY:12 = End-of-year survey, 2012 (n = 77)
0% 20% 40% 60% 80% 100%
Answered questions (EY:12)
Answered questions (PPD:11)
Facilitated discussions (EY:12)
Facilitated discussions (PPD:11)
Clear and effective (EY:12)
Clear and effective (PPD:11)
Well organized (EY:12)
Well organized (PPD:11)
Knowledgeable (EY:12)
Knowledgeable (PPD:11)
Percentage
Strongly agree Agree Neutral Disagree Strongly disagree No reply
Results
Mathematics Academies 2011-2013 | 15
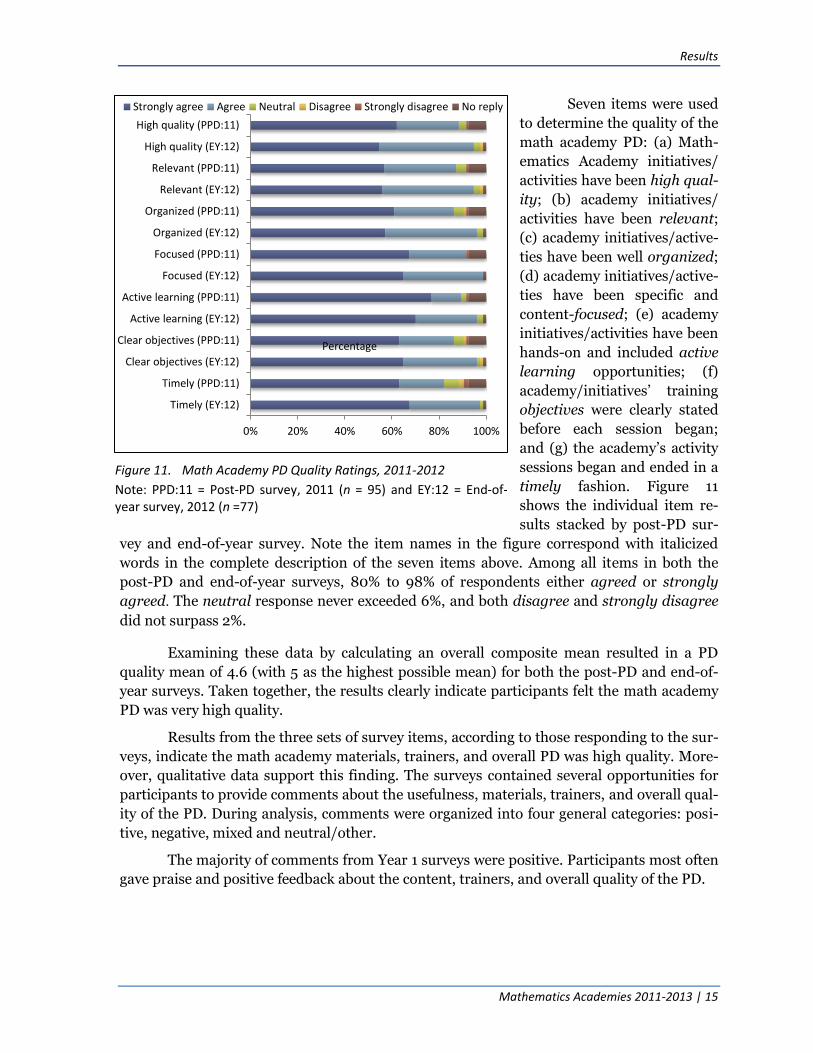
Seven items were used
to determine the quality of the
math academy PD: (a) Math-
ematics Academy initiatives/
activities have been high qual-
ity; (b) academy initiatives/
activities have been relevant;
(c) academy initiatives/active-
ties have been well organized;
(d) academy initiatives/active-
ties have been specific and
content-focused; (e) academy
initiatives/activities have been
hands-on and included active
learning opportunities; (f)
academy/initiatives’ training
objectives were clearly stated
before each session began;
and (g) the academy’s activity
sessions began and ended in a
timely fashion. Figure 11
shows the individual item re-
sults stacked by post-PD sur-
vey and end-of-year survey. Note the item names in the figure correspond with italicized
words in the complete description of the seven items above. Among all items in both the
post-PD and end-of-year surveys, 80% to 98% of respondents either agreed or strongly
agreed. The neutral response never exceeded 6%, and both disagree and strongly disagree
did not surpass 2%.
Examining these data by calculating an overall composite mean resulted in a PD
quality mean of 4.6 (with 5 as the highest possible mean) for both the post-PD and end-of-
year surveys. Taken together, the results clearly indicate participants felt the math academy
PD was very high quality.
Results from the three sets of survey items, according to those responding to the sur-
veys, indicate the math academy materials, trainers, and overall PD was high quality. More-
over, qualitative data support this finding. The surveys contained several opportunities for
participants to provide comments about the usefulness, materials, trainers, and overall qual-
ity of the PD. During analysis, comments were organized into four general categories: posi-
tive, negative, mixed and neutral/other.
The majority of comments from Year 1 surveys were positive. Participants most often
gave praise and positive feedback about the content, trainers, and overall quality of the PD.
Figure 11. Math Academy PD Quality Ratings, 2011-2012
Note: PPD:11 = Post-PD survey, 2011 (n = 95) and EY:12 = End-of-year survey, 2012 (n =77)
0% 20% 40% 60% 80% 100%
Timely (EY:12)
Timely (PPD:11)
Clear objectives (EY:12)
Clear objectives (PPD:11)
Active learning (EY:12)
Active learning (PPD:11)
Focused (EY:12)
Focused (PPD:11)
Organized (EY:12)
Organized (PPD:11)
Relevant (EY:12)
Relevant (PPD:11)
High quality (EY:12)
High quality (PPD:11)
Percentage
Strongly agree Agree Neutral Disagree Strongly disagree No reply
Results
16 | Mathematics Academies 2011-2013
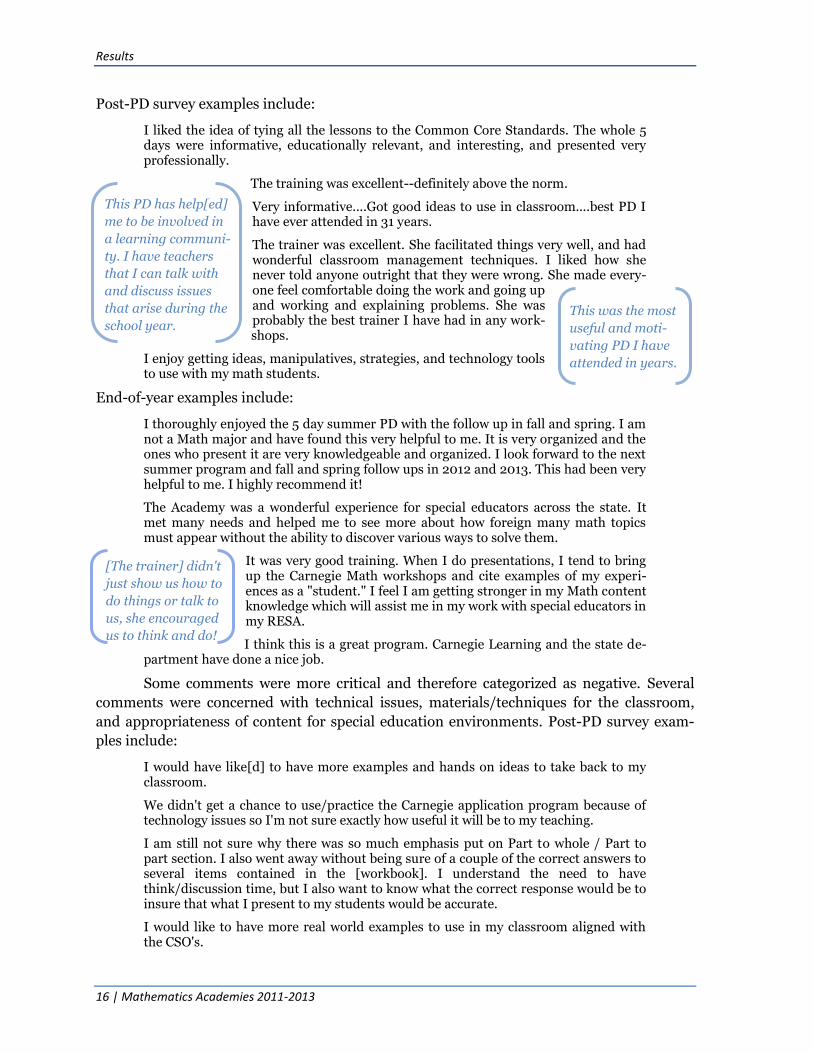
Post-PD survey examples include:
I liked the idea of tying all the lessons to the Common Core Standards. The whole 5 days were informative, educationally relevant, and interesting, and presented very professionally.
The training was excellent--definitely above the norm.
Very informative....Got good ideas to use in classroom....best PD I have ever attended in 31 years.
The trainer was excellent. She facilitated things very well, and had wonderful classroom management techniques. I liked how she never told anyone outright that they were wrong. She made every-one feel comfortable doing the work and going up and working and explaining problems. She was probably the best trainer I have had in any work-shops.
I enjoy getting ideas, manipulatives, strategies, and technology tools to use with my math students.
End-of-year examples include:
I thoroughly enjoyed the 5 day summer PD with the follow up in fall and spring. I am not a Math major and have found this very helpful to me. It is very organized and the ones who present it are very knowledgeable and organized. I look forward to the next summer program and fall and spring follow ups in 2012 and 2013. This had been very helpful to me. I highly recommend it!
The Academy was a wonderful experience for special educators across the state. It met many needs and helped me to see more about how foreign many math topics must appear without the ability to discover various ways to solve them.
It was very good training. When I do presentations, I tend to bring up the Carnegie Math workshops and cite examples of my experi-ences as a "student." I feel I am getting stronger in my Math content knowledge which will assist me in my work with special educators in my RESA.
I think this is a great program. Carnegie Learning and the state de-partment have done a nice job.
Some comments were more critical and therefore categorized as negative. Several
comments were concerned with technical issues, materials/techniques for the classroom,
and appropriateness of content for special education environments. Post-PD survey exam-
ples include:
I would have like[d] to have more examples and hands on ideas to take back to my classroom.
We didn't get a chance to use/practice the Carnegie application program because of technology issues so I'm not sure exactly how useful it will be to my teaching.
I am still not sure why there was so much emphasis put on Part to whole / Part to part section. I also went away without being sure of a couple of the correct answers to several items contained in the [workbook]. I understand the need to have think/discussion time, but I also want to know what the correct response would be to insure that what I present to my students would be accurate.
I would like to have more real world examples to use in my classroom aligned with the CSO's.
This was the most
useful and moti-
vating PD I have
attended in years.
[The trainer] didn't
just show us how to
do things or talk to
us, she encouraged
us to think and do!
This PD has help[ed]
me to be involved in
a learning communi-
ty. I have teachers
that I can talk with
and discuss issues
that arise during the
school year.

Results
Mathematics Academies 2011-2013 | 17
There were few negative comments in the end-of-year survey, a couple of examples
include:
The activities were mostly too difficult for the students I have to work with.
Carnegie Learning's methods do not work with MM/MI students. Research has shown that project based learning works with the general student and maybe the LD student. NOT the MM/MI student. Connecting all of the CSO's at one time is too con-fusing and overwhelming for most of these students.
Finally, some of the comments categorized as mixed or neutral/other may be helpful
when considering areas for improvement in the math academies. The following are examples
from both the post-PD and end-of-year surveys:
I really enjoyed the training, however, if WVDE wants special educators to learn the content knowledge in order to meet the needs of the students they also need to have sessions that teach strategies to teach the concepts to our students.
I love the summer training and even a few meetings throughout the year, but the ad-ditional course work required was not made clear before the training began. This ad-ditional work is taking away the one thing that educators do not have enough of already- TIME.
I wish the training had been more content specific, but it was a very good start.
Having student access [to MATHia] would make application more effective and if the school used this approach instead of the "standard" teaching to help students who have skill gaps.
The training was well-organized and had useful information, however, the math classes I teach do not do any proportional reasoning. I would like to have a training that focuses more on Algebra or Geometry concepts. This would be more relevant and better meet my needs.
It would be nice to have follow-up in years 2013-2014 (anoth-er academy) to keep the incentive going and to keep current as we transfer to the common core standards.
More opportunities for discussion of what participants have tried; what worked what didn't. Ideas for hands-on projects that correlate with these skills.
MATHia software was not very user friendly and not very interesting to students. The tutorials were helpful but unfortunately most students would not read the lengthy di-rections and examples.
Learning Mathematics for Teaching assessment
Among the Year 1, Cohort 1 academy attendees, 42 participated in the proportional
reasoning LMT assessment. The pre-/post-assessments were designed to measure any
changes in mathematical knowledge and pedagogical skills in the area of proportional rea-
soning. A paired t test of the pre- and post-scores yielded a p value of 0.046 (see Table 3).
Therefore, we can state with 95% confidence that math academy teachers who took the LMT
increased their proportional reasoning knowledge and pedagogical skills. With a Cohen’s d
value of 0.4, the effect size substantiates this finding, indicating a medium effect from pre- to
post-LMT assessment scores.
General math teachers
should participate.
Some still have "one
way" to get the answer.
Difficult for someone to
go in and try to change
that.

Results
18 | Mathematics Academies 2011-2013
Table 3. Proportional Reasoning LMT Results, 2011-2012
Year Academy content n df t score p value Interpretation
2011-2012 proportional reasoning 42 41 2.054 0.046 Statistically significant difference from pre to post test scores
Year 2–Developing Algebraic Thinking
Post-PD survey and end-of-year survey
The 2nd year of the
Mathematics Academies Ini-
tiative hosted 77 Cohort 1
participants. Participation
decreased by 42 individuals;
this attrition was caused by
several different factors in-
cluding but not limited to
certification transfers (i.e.
teachers transferring from
special to general education),
location transfers (both in-
state and out-of-state), re-
tirement, health constraints,
time and commitment barri-
ers, and loss of interest. Of
the returning 77 participants,
over 85% (n = 66) responded
to the post-PD survey and all
77 (100%) responded to the
end-of-year survey. Those
responding to at least one of
the academy surveys repre-
sented 26 counties across the
state (see Figure 12). While
in some cases multiple
teachers came from the same county, overall, nine fewer counties were represented in Year 2
compared to Year 1. Although matching survey responses was possible due to a revision in
the study research design, we decided to present findings unmatched because (a) Year 1 re-
sults were presented unmatched; (b) matching would require excluding 11 end-of-year sur-
vey records, diminishing the richness of the data; and most importantly (c) demographic
results yielded similar participant characteristics. Thus it is still reasonable to draw general
inferences when comparing results from the post-PD survey to the end-of-year survey.
Figure 12. Counties Represented by Cohort 1, Year 2 Academy At-
tendees
Math Academy attendees (responding to at least one academy survey) represented 26 counties across WV. This is nine fewer counties than were represented in year 1 of the Math Academy.

Results
Mathematics Academies 2011-2013 | 19
As depicted in Figure 13,
those participating in each of the
academy surveys shared similar
percentages in the grades they
taught (the majority of teachers
reported instructing at the mid-
dle- and high-school program-
matic levels). Further, they
exhibited comparable years of
experience in their current teach-
ing positions (most reporting 1–5
years), as well as similar years of
experience in the field of educa-
tion (the majority of responding
teachers had over 16 years of ex-
perience, but many also reported
1–5 years of experience as well as
6–10). Finally, although attend-
ance at the four locations of the
initial summer academies dif-
fered from location to location,
attendance was comparable from
one survey to the other. These
results indicate not only compa-
rable characteristics from the
post-PD to end-of-year surveys,
but also a relatively good mixture
of teachers from various pro-
grammatic levels, years of experi-
ence, and localities. All
descriptive statistics for Cohort 1,
Year 2 surveys can be found in
Appendix B, starting on page 53.
Designed nearly identical-
ly to Year 1 surveys, both the
post-PD and end-of-year surveys
asked academy participants sev-
eral series of questions relating to the usefulness and quality of the math academy. Again,
this type of survey design allows us to evaluate participants’ opinions after the initial 5-day
summer academy and then once more at the conclusion of the academy. Akin to Year 1 find-
ings, results for Year 2 surveys tended to remain relatively consistent from the post-PD to
end-of-year surveys.
Even though Year 2 surveys are similar to Year 1 surveys, a few items differ. Our dis-
cussion begins with one of those items. When asked about the usefulness of the academy, the
Figure 13. Academy Participant Characteristics by Survey, 2012-
2013
Post-PD survey n = 66 and end-of-year survey n = 77
0 20 40 60 80 100 120
Huntington
Beckley
Clarksburg
Charleston
No reply
16+
11 to 15
6 to 10
1 to 5
<1 year
No reply
16+
11 to 15
6 to 10
1 to 5
<1 year
12th
11th
10th
9th
8th
7th
6th
5th
4th
3rd
2nd
1st
K
Percentage
Post-PD survey End-of-year survey
Gra
des
ta
ugh
t (
sele
ct a
ll th
at a
pp
ly)
Year
s o
f e
xper
ien
ce
in c
urr
ent
po
siti
on
To
tal y
ears
of
te
ach
ing
exp
erie
nce
Loca
tio
n o
f
sum
mer
aca
dem
y
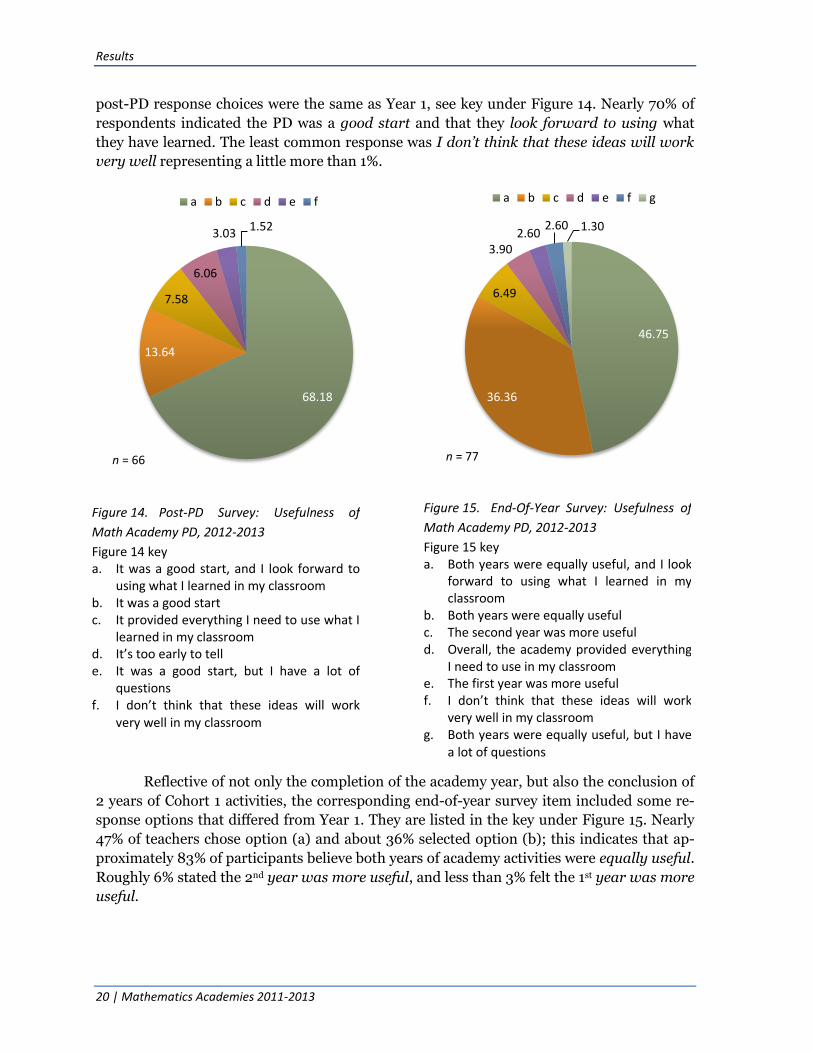
Results
20 | Mathematics Academies 2011-2013
46.75
36.36
6.49
3.90 2.60
2.60 1.30
a b c d e f g
n = 77
Figure 15. End-Of-Year Survey: Usefulness of
Math Academy PD, 2012-2013
Figure 15 key a. Both years were equally useful, and I look
forward to using what I learned in my classroom
b. Both years were equally useful c. The second year was more useful d. Overall, the academy provided everything
I need to use in my classroom e. The first year was more useful f. I don’t think that these ideas will work
very well in my classroom g. Both years were equally useful, but I have
a lot of questions
post-PD response choices were the same as Year 1, see key under Figure 14. Nearly 70% of
respondents indicated the PD was a good start and that they look forward to using what
they have learned. The least common response was I don’t think that these ideas will work
very well representing a little more than 1%.
Reflective of not only the completion of the academy year, but also the conclusion of
2 years of Cohort 1 activities, the corresponding end-of-year survey item included some re-
sponse options that differed from Year 1. They are listed in the key under Figure 15. Nearly
47% of teachers chose option (a) and about 36% selected option (b); this indicates that ap-
proximately 83% of participants believe both years of academy activities were equally useful.
Roughly 6% stated the 2nd year was more useful, and less than 3% felt the 1st year was more
useful.
Figure 14. Post-PD Survey: Usefulness of
Math Academy PD, 2012-2013
Figure 14 key a. It was a good start, and I look forward to
using what I learned in my classroom b. It was a good start c. It provided everything I need to use what I
learned in my classroom d. It’s too early to tell e. It was a good start, but I have a lot of
questions f. I don’t think that these ideas will work
very well in my classroom
68.18
13.64
7.58
6.06
3.03 1.52
a b c d e f
n = 66

Results
Mathematics Academies 2011-2013 | 21
Next the surveys
asked respondents to indicate
at what level the PD met their
professional needs (see Fig-
ure 16). With 65% in the
post-PD survey and 61% in
the end-of-year survey, the
predominant response was it
addressed some of my pro-
fessional learning needs.
Perhaps more notably, 33%
and 35%, respectively, stated
it addressed my professional
learning needs completely.
No participants in the post-
PD survey chose either of the
two unfavorable response
options. Slightly over 1% of
end-of-year survey respond-
ents indicated that the PD
did not address their profes-
sional learning needs; and
fewer than 3% felt they al-
ready know what they need
to know about the topic and
the academy would not help
them.
The next survey item
asked teachers to compare
the PD they received in the
math academy to any other
PD experiences from the past
3 years (see Figure 17). Near-
ly 79% of respondents in the
post-PD survey and close to
68% in the end-of-year survey replied that the math academy was more useful. Fewer than
2% in the post-PD survey and not quite 3% of teachers in the end-of-year survey indicated
the PD was less useful.
0 20 40 60 80 100 120 140
This academy did not help much because Ialready know what I need to know about this
topic
No reply
It did not address my professional learningneeds
It addressed my professional learning needscompletely
It addressed some of my professional learningneeds
Percentage
Indicate the extent to which the second year of the Math Academy met your professional needs.
Post-PD survey End-of-year survey
Figure 16. Meeting Teachers’ Professional Needs, 2012-2013
Post-PD survey n = 66 and end-of-year survey n = 77
0 50 100 150 200
No PD in last 3 years
No opinion
No reply
Less useful
About the same
More useful
Percentage
Which of the following statements best describes how this training/PD compares with other PDs in which you have
participated in the last three years?
Post-PD survey End-of-year survey
Figure 17. Comparing the Math Academy to Other PD, 2012-2013
Post-PD survey n = 66 and end-of-year survey n = 77

Results
22 | Mathematics Academies 2011-2013
As with the Year 1 surveys, both Year 2 surveys asked teachers about the likelihood of
applying what they learned at the math academy in their classrooms/work settings. The
post-PD survey offered four response choices, see Figure 18. The most prevalent response, at
62%, was (a), followed by (b) with 24% of all responses. Fewer than 2% of responding teach-
ers felt the techniques they learned would not work for my students.
Figure 18. Post-PD Survey: Applying Math
Academy Knowledge/Skills, 2012-2013
Figure 18 key a. I look forward to practicing/applying the
knowledge/skills in my classroom during the upcoming school year
b. I already practice/apply the knowledge/ skills this training provided in my class- room, and it seems to work well
c. I have already practiced/applied the knowledge skills this training provided in my classroom, but it is not appropriate for my students
d. I don’t think what I learned here will work for my students so I don’t envision applying the knowledge/skills
Note: Total % 100 (percent of no response was excluded)
Figure 19. End-Of-Year Survey: Applying Math
Academy Knowledge/Skills, 2012-2013
Figure 19 key a. I now practice/apply the knowledge/skills
the academy provided in my classroom b. I previously practiced/applied the
knowledge/ skills the academy provided in my classroom AND I continue to do so
c. I have not practiced/applied what I learned BUT I plan to practice/apply the knowledge/ skills in my classroom soon
d. I do not practice/apply what I learned at the math academy because it is not appropriate for my students
e. I do not practice/apply what I learned at the math academy because of other reasons
f. I previously practiced/applied the knowledge/skills the academy provided in my classroom BUT I no longer do so
Note: Total % 100 (percent of no response was excluded)
62.12
24.24
10.61
1.52
a b c d
n = 66
57.14
27.27
3.9 3.9
1.3 2.6
a b c d e f
n = 77

Results
Mathematics Academies 2011-2013 | 23
The corresponding item on the end-of-year survey offered six response choices, see
key under Figure 19. At 57%, the most frequent response was (a) with 27%, (b) was the se-
cond most common response. Approximately 8% of the participants are not utilizing and do
not plan to utilize academy techniques—responses (d), (e), and (f). Nevertheless, when com-
paring post-PD results to those from the end-of-year, findings suggest many of the teachers
who intended to implement knowledge and skills gained in the math academy did so within
the 2012-2013 school year.
The next survey item asked teachers how closely the math academy PD was related to
their schools’ or programs’ goals for improving instruction. This particular survey item ap-
peared only in the post-PD survey; it was excluded from the end-of-year survey as academy
stakeholders deemed it no longer integral to the study. Results from the post-PD survey in-
dicated solid alignment between the math academy and school goals for instructional im-
provement as 62% of respondents stated they were very closely aligned and 35% reported
they were somewhat aligned. The remaining 3% said they did not know. No teachers report-
ed that the academy and school goals were not aligned.
Unchanged from Year 1 surveys,7 the final three sets of survey items comparable be-
tween post-PD and end-of-year survey responses are focused on the quality of math acade-
my materials, trainers, and overall PD. As before, each set of survey items were based on a 5-
point Likert type scale of agreement (where 5 = strongly agree, 4 = agree, 3 = neutral, 2 =
disagree, and 1 = strongly disagree). Also, the items were analyzed in the same manner;
first frequencies were calculated for individual items (represented as a percentage) and then
an overall composite score
(with a maximum point
value of 5) was determined
for each set of items.
Generally, academy
materials continued to re-
ceive high ratings. With
only one exception, (see
Figure 20) at least 90% or
more of respondents chose
agree or strongly agree
for each of the math acad-
emy material statements.
Further, disagree and
strongly disagree were
seldom chosen, especially
in the post-PD survey. Of
note, the percentage of
strongly agree responses
7 Refer to page 13 of Year 1–Proportional Reasoning for complete item descriptions.
Figure 20. Math Academy Material Quality Ratings, 2012-2013
Note: PPD:12 = Post-PD survey, 2012 (n = 66) and EY:13 = End-of-year survey, 2013 (n = 77)
0% 20% 40% 60% 80% 100%
Useful - End-of-Year Survey
Useful - Post PD Survey
High quality - End-of-Year Survey
High quality - Post PD Survey
Relevant - End-of-Year Survey
Relevant - Post PD Survey
Adequate amounts - End-of-Year Survey
Adequate amounts - Post PD Survey
Percentage
Strongly agree Agree Neutral Disagree Strongly disagree No reply
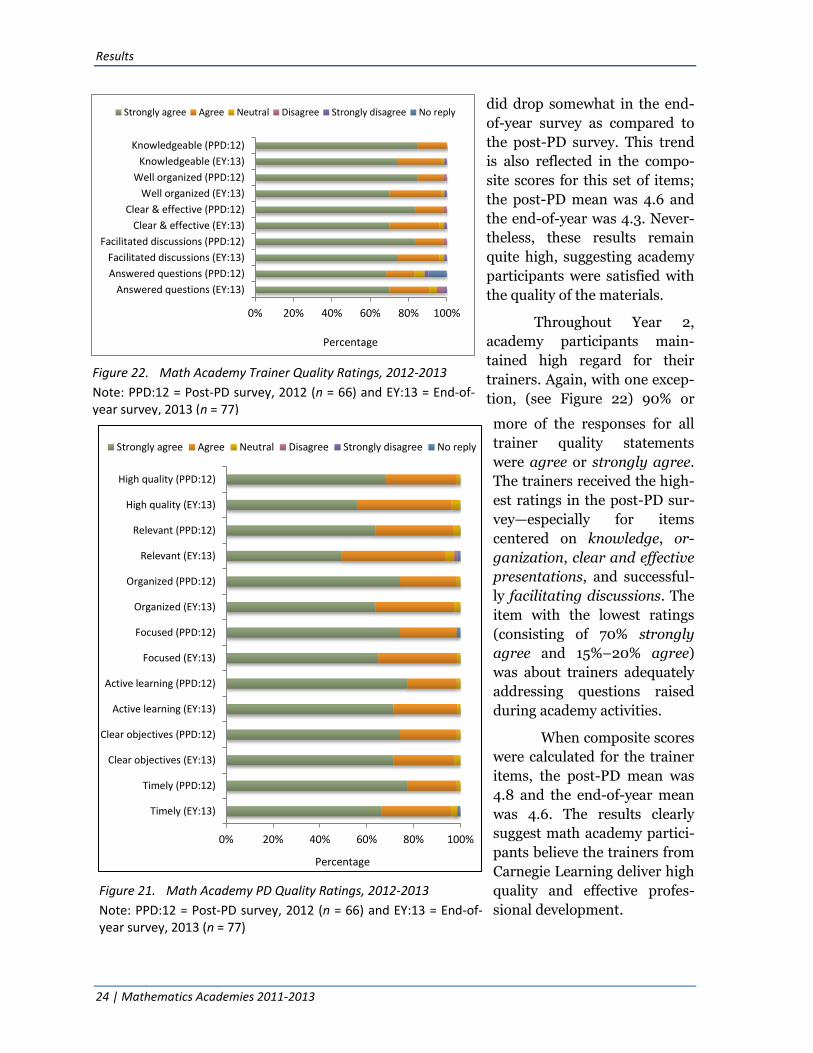
Results
24 | Mathematics Academies 2011-2013
did drop somewhat in the end-
of-year survey as compared to
the post-PD survey. This trend
is also reflected in the compo-
site scores for this set of items;
the post-PD mean was 4.6 and
the end-of-year was 4.3. Never-
theless, these results remain
quite high, suggesting academy
participants were satisfied with
the quality of the materials.
Throughout Year 2,
academy participants main-
tained high regard for their
trainers. Again, with one excep-
tion, (see Figure 22) 90% or
more of the responses for all
trainer quality statements
were agree or strongly agree.
The trainers received the high-
est ratings in the post-PD sur-
vey—especially for items
centered on knowledge, or-
ganization, clear and effective
presentations, and successful-
ly facilitating discussions. The
item with the lowest ratings
(consisting of 70% strongly
agree and 15%–20% agree)
was about trainers adequately
addressing questions raised
during academy activities.
When composite scores
were calculated for the trainer
items, the post-PD mean was
4.8 and the end-of-year mean
was 4.6. The results clearly
suggest math academy partici-
pants believe the trainers from
Carnegie Learning deliver high
quality and effective profes-
sional development.
Figure 22. Math Academy Trainer Quality Ratings, 2012-2013
Note: PPD:12 = Post-PD survey, 2012 (n = 66) and EY:13 = End-of-year survey, 2013 (n = 77)
0% 20% 40% 60% 80% 100%
Answered questions (EY:13)
Answered questions (PPD:12)
Facilitated discussions (EY:13)
Facilitated discussions (PPD:12)
Clear & effective (EY:13)
Clear & effective (PPD:12)
Well organized (EY:13)
Well organized (PPD:12)
Knowledgeable (EY:13)
Knowledgeable (PPD:12)
Percentage
Strongly agree Agree Neutral Disagree Strongly disagree No reply
Figure 21. Math Academy PD Quality Ratings, 2012-2013
Note: PPD:12 = Post-PD survey, 2012 (n = 66) and EY:13 = End-of-year survey, 2013 (n = 77)
0% 20% 40% 60% 80% 100%
Timely (EY:13)
Timely (PPD:12)
Clear objectives (EY:13)
Clear objectives (PPD:12)
Active learning (EY:13)
Active learning (PPD:12)
Focused (EY:13)
Focused (PPD:12)
Organized (EY:13)
Organized (PPD:12)
Relevant (EY:13)
Relevant (PPD:12)
High quality (EY:13)
High quality (PPD:12)
Percentage
Strongly agree Agree Neutral Disagree Strongly disagree No reply
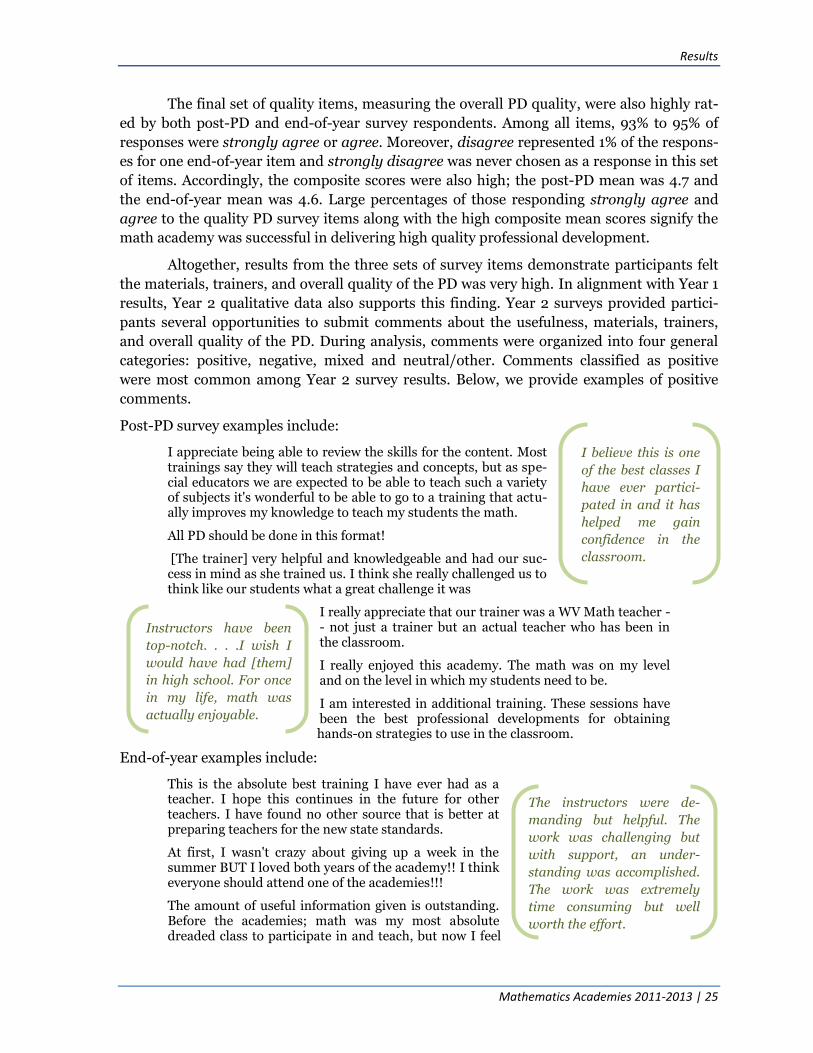
Results
Mathematics Academies 2011-2013 | 25
The final set of quality items, measuring the overall PD quality, were also highly rat-
ed by both post-PD and end-of-year survey respondents. Among all items, 93% to 95% of
responses were strongly agree or agree. Moreover, disagree represented 1% of the respons-
es for one end-of-year item and strongly disagree was never chosen as a response in this set
of items. Accordingly, the composite scores were also high; the post-PD mean was 4.7 and
the end-of-year mean was 4.6. Large percentages of those responding strongly agree and
agree to the quality PD survey items along with the high composite mean scores signify the
math academy was successful in delivering high quality professional development.
Altogether, results from the three sets of survey items demonstrate participants felt
the materials, trainers, and overall quality of the PD was very high. In alignment with Year 1
results, Year 2 qualitative data also supports this finding. Year 2 surveys provided partici-
pants several opportunities to submit comments about the usefulness, materials, trainers,
and overall quality of the PD. During analysis, comments were organized into four general
categories: positive, negative, mixed and neutral/other. Comments classified as positive
were most common among Year 2 survey results. Below, we provide examples of positive
comments.
Post-PD survey examples include:
I appreciate being able to review the skills for the content. Most trainings say they will teach strategies and concepts, but as spe-cial educators we are expected to be able to teach such a variety of subjects it's wonderful to be able to go to a training that actu-ally improves my knowledge to teach my students the math.
All PD should be done in this format!
[The trainer] very helpful and knowledgeable and had our suc-cess in mind as she trained us. I think she really challenged us to think like our students what a great challenge it was
I really appreciate that our trainer was a WV Math teacher -- not just a trainer but an actual teacher who has been in the classroom.
I really enjoyed this academy. The math was on my level and on the level in which my students need to be.
I am interested in additional training. These sessions have been the best professional developments for obtaining hands-on strategies to use in the classroom.
End-of-year examples include:
This is the absolute best training I have ever had as a teacher. I hope this continues in the future for other teachers. I have found no other source that is better at preparing teachers for the new state standards.
At first, I wasn't crazy about giving up a week in the summer BUT I loved both years of the academy!! I think everyone should attend one of the academies!!!
The amount of useful information given is outstanding. Before the academies; math was my most absolute dreaded class to participate in and teach, but now I feel
I believe this is one
of the best classes I
have ever partici-
pated in and it has
helped me gain
confidence in the
classroom.
Instructors have been
top-notch. . . .I wish I
would have had [them]
in high school. For once
in my life, math was
actually enjoyable.
The instructors were de-
manding but helpful. The
work was challenging but
with support, an under-
standing was accomplished.
The work was extremely
time consuming but well
worth the effort.
Results
26 | Mathematics Academies 2011-2013
more confident and able to really understand my students frustration and offer many ways of helping them to better understand the material.
I enjoyed the setting. It was nice to be able to meet with so many educators from around the state to discuss what works for them. I was able to get some great ideas and make lifelong friends. Thank you!
At first, I felt lost, but I gained more confidence during the 2 year program.
There were not too many negative comments in either the post-PD or end-of-year
surveys. Most were concerned with the desire to have more materials and the use of Cogni-
tive Tutor. Examples from both surveys include:
Sometimes the amount of time provided for a specific activity seemed to be too long. There is a thin line between giving time to think and work while insuring that all stu-dents are still working on the task. My group frequently finished and had time to wait while others were working. However at one time we had about 1 1/2 to 2 hours left over.
I think we would all like to have more "take home" activities that we can incorporate into our classrooms. I realize that Carnegie wants everyone to buy their product, but not all counties have the funds to do so.
I wasn't the biggest fan of the Cognitive Tutor. I didn't find it very user friendly
Finally, some of the comments categorized as mixed or neutral/other may be helpful
when considering areas for improvement in the math academies. Many comments that were
placed in these categories called for considerations for special education environments/
students, appropriateness of difficulty levels, and MATHia/Cognitive Tutor. The following
are examples from both the post-PD and end-of-year surveys
I would have like[d] some specific special education ideas.
I have suggested this academy to my peers, especially those who co-teach or are new to teaching. These courses would help any math teacher get a grasp of the new common core standards and how to best present them. About the Mathia software, I can see how it helps deepen understanding but it is quite frustrating for some of us. Thank you for the oppor-tunity, this was the best PD I have been a part of in 13 years.
I enjoyed this PD and the wealth of math knowledge I
gained from it, but a 1 week training with 2 follow up days should not overshadow a Master's Degree, numerous other coursework, and years teaching experience in another content area. This deepened my math knowledge, but a 1 week training in Math I content should not make adminis-trators view me as qualified to teach higher math (Conceptual Math and College Transition Math for example).
The training opportunities
have been fantastic. The pre-
senter is a super educator
and she provides an immense
amount of information. How-
ever, my particular class-
room situation does not al-
low me to use a great deal of
advanced mathematics. I
would really like to learn of
methods and materials relat-
ing to a less advanced popu-
lation of students
I was a bit frustrated in
the beginning because
of answering a question
with a question format
but I quickly adjusted
and knew I was going
to be forced to solve for
my own answer. This
made me think and was
difficult but awesome!
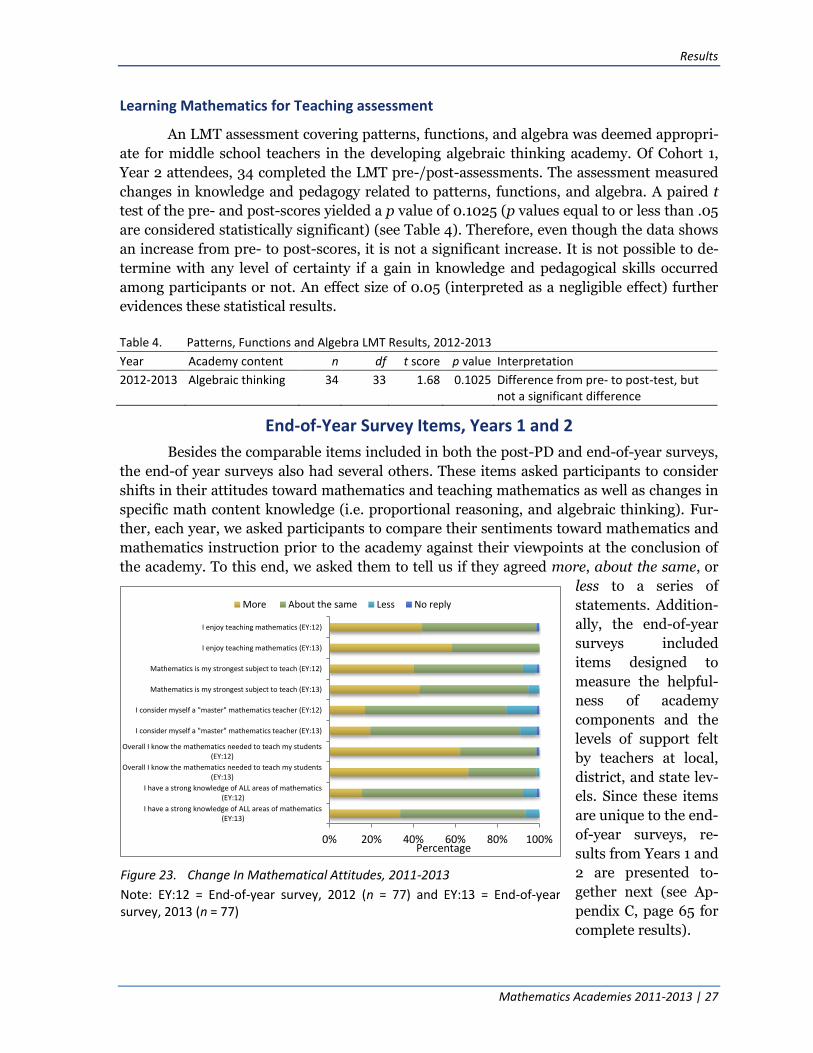
Results
Mathematics Academies 2011-2013 | 27
Learning Mathematics for Teaching assessment
An LMT assessment covering patterns, functions, and algebra was deemed appropri-
ate for middle school teachers in the developing algebraic thinking academy. Of Cohort 1,
Year 2 attendees, 34 completed the LMT pre-/post-assessments. The assessment measured
changes in knowledge and pedagogy related to patterns, functions, and algebra. A paired t
test of the pre- and post-scores yielded a p value of 0.1025 (p values equal to or less than .05
are considered statistically significant) (see Table 4). Therefore, even though the data shows
an increase from pre- to post-scores, it is not a significant increase. It is not possible to de-
termine with any level of certainty if a gain in knowledge and pedagogical skills occurred
among participants or not. An effect size of 0.05 (interpreted as a negligible effect) further
evidences these statistical results.
Table 4. Patterns, Functions and Algebra LMT Results, 2012-2013
Year Academy content n df t score p value Interpretation
2012-2013 Algebraic thinking 34 33 1.68 0.1025 Difference from pre- to post-test, but not a significant difference
End-of-Year Survey Items, Years 1 and 2
Besides the comparable items included in both the post-PD and end-of-year surveys,
the end-of year surveys also had several others. These items asked participants to consider
shifts in their attitudes toward mathematics and teaching mathematics as well as changes in
specific math content knowledge (i.e. proportional reasoning, and algebraic thinking). Fur-
ther, each year, we asked participants to compare their sentiments toward mathematics and
mathematics instruction prior to the academy against their viewpoints at the conclusion of
the academy. To this end, we asked them to tell us if they agreed more, about the same, or
less to a series of
statements. Addition-
ally, the end-of-year
surveys included
items designed to
measure the helpful-
ness of academy
components and the
levels of support felt
by teachers at local,
district, and state lev-
els. Since these items
are unique to the end-
of-year surveys, re-
sults from Years 1 and
2 are presented to-
gether next (see Ap-
pendix C, page 65 for
complete results).
Figure 23. Change In Mathematical Attitudes, 2011-2013
Note: EY:12 = End-of-year survey, 2012 (n = 77) and EY:13 = End-of-year survey, 2013 (n = 77)
0% 20% 40% 60% 80% 100%
I have a strong knowledge of ALL areas of mathematics(EY:13)
I have a strong knowledge of ALL areas of mathematics(EY:12)
Overall I know the mathematics needed to teach my students(EY:13)
Overall I know the mathematics needed to teach my students(EY:12)
I consider myself a "master" mathematics teacher (EY:13)
I consider myself a "master" mathematics teacher (EY:12)
Mathematics is my strongest subject to teach (EY:13)
Mathematics is my strongest subject to teach (EY:12)
I enjoy teaching mathematics (EY:13)
I enjoy teaching mathematics (EY:12)
Percentage
More About the same Less No reply

Results
28 | Mathematics Academies 2011-2013
Adjustments in attitudes concerning math and mathematics pedagogy for both acad-
emy years can be seen in Figure 23 (above). Compared to their attitudes prior to participat-
ing in the Mathematics Academy Initiative, approximately 44% of Year 1 teachers reported
they enjoy teaching mathematics more. At the conclusion of Year 2, the percentage respond-
ing more to the same item exceeded 58%; representing a 14% increase from Year 1 to Year 2.
Results for the next item,
“Mathematics is my
strongest subject to teach,”
remained relatively con-
sistent across both acade-
my years with 40–42%
responding more. When
asked if they considered
themselves a “master”
mathematics teacher the
percentage of those choos-
ing less dropped from 14%
in Year 1 to less than 8% at
the conclusion of Year 2.
Sizeable percentages of re-
sponders chose more to the
statement, “Overall I know
the mathematics needed to
teach my students,” across
both years of the academy
(62% and 66% respective-
ly). Finally, the percentage
of those responding more
to the item “I have a strong
knowledge of ALL areas of
mathematics,” rose from
15% in Year 1 to nearly 34%
in Year 2.
There were two
content-specific items in
the Year 1 end-of-year sur-
vey. Seen in Figure 24, over
70% of responses were
more for both of the pro-
portional reasoning items.
Year 2 end-of-year survey
contained eight items pertaining not only to algebraic thinking knowledge and attitudes, but
also related to knowledge gained over the 2 years of academy activities.
Figure 25. Change in Math Academy Content Knowledge and Attitude,
Year 2, 2012-2013
Figure 24. Change in Proportional Reasoning Knowledge, Year 1, 2011-
2012
0% 20% 40% 60% 80% 100%
My knowledge of ratio, proportionalreasoning, and rate is adequate tothe task of teaching those subjects
I have a strong knowledge of ratio,proportional reasoning, and rate
Percentage
More About the same Less No reply
(n=77)
0% 20% 40% 60% 80% 100%
Overall, my knowledge of ratio, proportionalreasoning, rate, and algebraic functions is
adequate to the task of teaching those…
I use technology to explore algebraicfunctions.
I am confident in comparing linear, quadraticand exponential functions
I have the ability to examine multiplerepresentations of algebraic functions.
I have a strong knowledge of algebraicfunctions
I can differentiate high- and low-levelcognitive tasks and their implications for
teaching
I have a strong knowledge of the Standardsfor Mathematical Practice
I am confident in analyzing mathematicaltasks
Percentage
More About the same Less
(n=77)

Results
Mathematics Academies 2011-2013 | 29
Depicted in Figure 25, those responding more ranged from 52% (“I use technology to
explore algebraic functions”) to 79% (“I have a strong knowledge of algebraic functions”).
Nearly 77% responded more to “Overall, my knowledge of ratio, proportional reasoning,
rate, and algebraic functions is adequate to the task to teaching those subjects,” the item that
synthesized knowledge and pedagogy ability gained over the 2 years of the initiative.
Next, participants were asked to rate how helpful they felt the different components
of the Mathematics Academy Initiative were. Response options were based on a 5-point Lik-
ert-type scale of agreement ranging from strongly agree to strongly disagree. Results seen
in Figure 26 indicate participants viewed the 5-day summer academy as the most helpful
component; approximately 95% of responses were strongly agree and agree across both
years. Again, combining the strongly agree and agree responses, participants felt the fall
and spring follow-up meetings were about equally helpful (75%–85%). Finally, while about
80% reported Cognitive Tutor/MATHia as being helpful, 15-17% indicated their feelings
were neutral. Notably, the percentage of those strongly agreeing with each of the statements
was greater in Year 2 than in Year 1. Mean scores calculated for the items further support
these findings (see Appendix C Table C 9). The summer academy had the highest mean (4.55
in Year 1 and 4.65 in Year 2; with 5 as the highest possible result) and Cognitive Tu-
tor/MATHia received the lowest mean scores (4.24 in Year 1 and 4.19 in Year 2). The Year 2
survey contained an additional Cognitive Tutor/MATHia item, which asked participants if
using Cognitive Tutor/MATHia had deepened their understanding of mathematics; approx-
imately 75% of responses were strongly agree or agree.
Figure 26. Helpfulness of Math Academy Components, 2011-2013
Notes: EY:12 = End-of-year survey, 2012 (n = 77) and EY:13 = End-of-year survey, 2013 (n = 77); response of N/A may indicate individual did not attend a specific academy activity
0% 20% 40% 60% 80% 100%
I found Cognitive Tutor/MATHia helpful (EY:13)
I found Cognitive Tutor/MATHia helpful (EY:12)
I found the one-day SPRING follow-up helpful (EY:13)
I found the one-day SPRING follow-up helpful (EY:12)
I found the one-day FALL follow-up helpful (EY:13)
I found the one-day FALL follow-up helpful (EY:12)
I found the five-day SUMMER PD helpful (EY:13)
I found the five-day SUMMER PD helpful (EY:12)
Percentage
Strongly agree Agree Neutral Disagree Strongly disagree No reply N/A
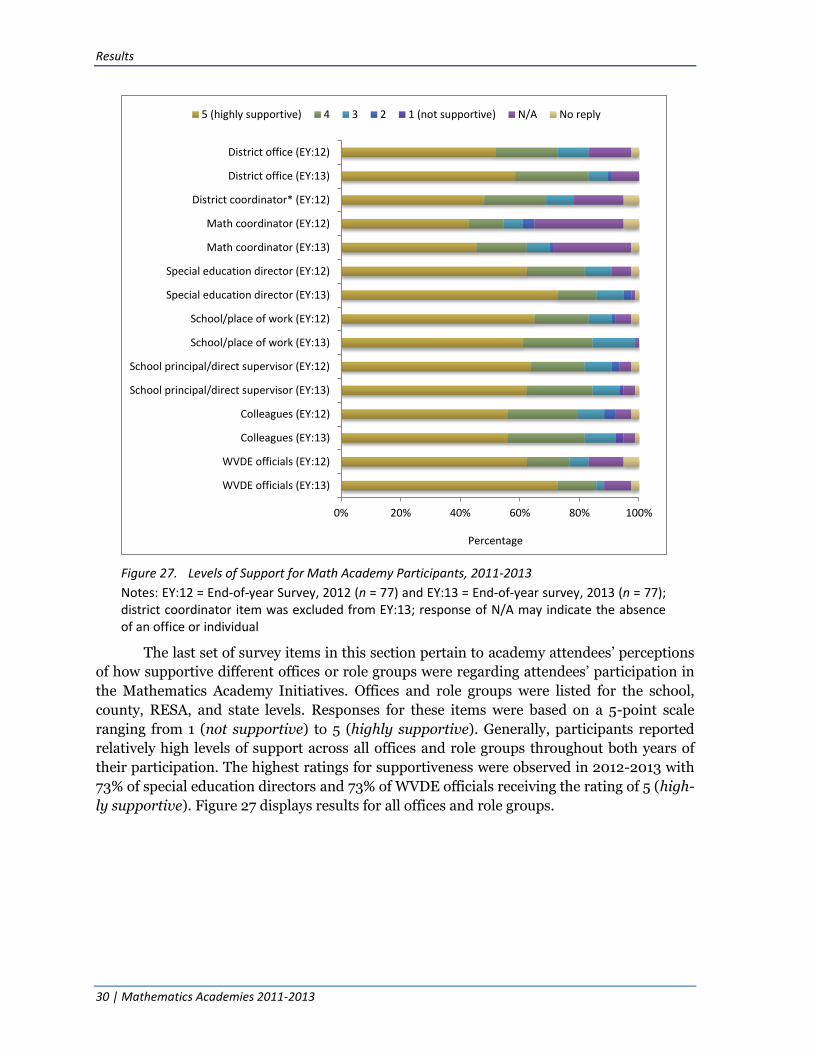
Results
30 | Mathematics Academies 2011-2013
The last set of survey items in this section pertain to academy attendees’ perceptions
of how supportive different offices or role groups were regarding attendees’ participation in
the Mathematics Academy Initiatives. Offices and role groups were listed for the school,
county, RESA, and state levels. Responses for these items were based on a 5-point scale
ranging from 1 (not supportive) to 5 (highly supportive). Generally, participants reported
relatively high levels of support across all offices and role groups throughout both years of
their participation. The highest ratings for supportiveness were observed in 2012-2013 with
73% of special education directors and 73% of WVDE officials receiving the rating of 5 (high-
ly supportive). Figure 27 displays results for all offices and role groups.
Figure 27. Levels of Support for Math Academy Participants, 2011-2013
Notes: EY:12 = End-of-year Survey, 2012 (n = 77) and EY:13 = End-of-year survey, 2013 (n = 77); district coordinator item was excluded from EY:13; response of N/A may indicate the absence of an office or individual
0% 20% 40% 60% 80% 100%
WVDE officials (EY:13)
WVDE officials (EY:12)
Colleagues (EY:13)
Colleagues (EY:12)
School principal/direct supervisor (EY:13)
School principal/direct supervisor (EY:12)
School/place of work (EY:13)
School/place of work (EY:12)
Special education director (EY:13)
Special education director (EY:12)
Math coordinator (EY:13)
Math coordinator (EY:12)
District coordinator* (EY:12)
District office (EY:13)
District office (EY:12)
Percentage
5 (highly supportive) 4 3 2 1 (not supportive) N/A No reply

31
Discussion
The purpose of the Mathematics Academy Initiative research study is to determine
the effectiveness and impact of the math academies in three areas: (a) the quality of academy
elements (i.e. instruction, materials, overall PD); (b) teacher attitude and disposition toward
mathematics instruction; and (c) teacher content knowledge in specific mathematics focus
areas. We will discuss the evaluation results for each of these areas followed by an examina-
tion of how the math academy compares to current research findings on the elements of ef-
fective professional development.
Quality of Math Academy Elements
Participants responding to the four evaluation surveys (a post-PD survey and end-of-
year survey for each year) clearly felt the academy elements were high quality. Among acad-
emy materials, trainers, and overall PD and across both years of Cohort 1, Carnegie Learning
trainers received the highest ratings. Overall composite scores were created by combining
the results of the five trainer-related items and calculating a mean score. The composite
scores, based on a 5-point scale where 5 is the highest possible score, ranged from 4.6 in the
2012-2013 end-of-year survey to 4.8 in the remaining three surveys. Further, an examina-
tion of individual trainer items revealed participants most strongly agreed with the state-
ment, “Trainer(s) were knowledgeable about the topic.” Finally, reaffirming these findings,
the vast majority of additional comments about trainers were positive in nature.
Those responding to our surveys also gave the overall quality of the PD excellent rat-
ings. Again, calculating composite scores by averaging the seven items in this set, we see
scores with a small span, 4.6 to 4.7 (note, the 4.6 composite score occurred in three of the
four surveys). While Year 1 ratings were somewhat higher than those in Year 2, across all
items at least 83% and up to 100% of responses were strongly agree and agree.
Of the academy quality items, academy materials received the lowest ratings. Com-
posite scores for the set of four items ranged from 4.3 to 4.6. The composite scores reflect
the fact that these items received fewer strongly agree ratings than any of the other PD qual-
ity items. However, the percentages of those choosing strongly agree or agree remained re-
markably high (from 75% to 100%).
Notably, very few survey participants chose strongly disagree among any of the PD
quality items discussed above. This finding along with the large percentages of strongly
agree and agree responses as well as high composite mean scores suggest the Mathematics
Academy Initiative was successful in delivering high quality PD to Cohort 1.
Finally, comments written by academy participants provided additional insights
about the overall quality of the professional development. An overwhelming majority of the
comments were positive; participants most often praised the trainers and the positive im-
pacts the academy activities had on their math content knowledge and attitudes towards
teaching mathematics. However, some comments were more critical of certain academy
components. Most notably, participants questioned the usefulness of the software programs
Discussion
32 | Mathematics Academies 2011-2013
(Cognitive Tutor/MATHia), and the appropriateness of the math content for their special
education students.
Attitude and Disposition Toward Mathematics Instruction
Impacts on attitudes and disposition toward mathematics and mathematics instruc-
tion were measured by several survey items. First, participants consistently reported that the
math academy was useful. When asked to describe the usefulness of the PD, over 50% of
Year 1 (for both surveys) and nearly 70% of Year 2 post-PD responses indicated participants
felt the academy was a good start and that they looked forward to implementing what they
learned into their classrooms or work settings. At the conclusion of Year 2, nearly 85% of
participants reported both years of academy activities were equally useful. Furthermore,
when asked to compare the math academy to other PD at least 60% and up to 80% of partic-
ipants stated the math academy was more useful.
Second, when the post-PD survey asked about the likelihood of applying what they
learned at the math academy into their classrooms or work settings, 78% of Year 1 and 62%
of Year 2 participants said they looked forward to practicing new skills in their class-
rooms/work settings within the school year. In the corresponding end-of-year survey item,
42% of Year 1 and 57% of Year 2 participants reported that they now practice the skills the
math academy taught them in their classrooms or work settings. This suggests many of the
attendees implemented the skills and knowledge they gained as a direct result of the math
academies.
Third, the end-of-year surveys contained a series of items asking participants about
their attitudes concerning mathematics and teaching mathematics. When asked to compare
their sentiments prior to the academy against their viewpoints at the conclusion of the acad-
emy year, 44% of Year 1 and 58% of Year 2 participants reported enjoying teaching more af-
ter attending the math academy. Between 40% (Year 1) and 43% (Year 2) reported
“Mathematics is my strongest subject to teach” as more the case after attending the acade-
mies. Perhaps most telling, 62% (Year 1) and 66% (Year 2) of respondents indicated more
agreement after participation in the academies, with the item “Overall I know the mathemat-
ics needed to teach my students.”
Finally, shifts in mathematics attitudes and dispositions are demonstrated by some
of the additional comments. Several participants wrote that as a result of the math academy,
they are now more confident when teaching math. Others said they enjoyed learning at the
academy and now like teaching mathematics, some for the first time in their lives. These re-
sults imply the Mathematics Academies Initiatives have made a positive impact on the atti-
tudes and dispositions of teachers concerning mathematics and mathematics instruction.
Content Knowledge in Mathematics Focus Areas
A key objective of the math academies was to increase content knowledge in specific
focus areas; proportional reasoning in Year 1, and developing algebraic thinking during Year
2. Change in knowledge was measured using both self-reported survey items and the LMT
pre-/post-assessments. While the LMT is an evidence-based tool with established reliability,
we felt it was also important to collect self-reported data. This twofold approach gave all
Discussion
Mathematics Academies 2011-2013 | 33
academy attendees the opportunity to participate (the LMT is appropriate for elementary
and middle school teachers only) and allowed us to capture both subjective perceptual in-
formation and more objective assessment data concerning shifts in content knowledge.
The Year 1 end-of-year survey included two proportional reasoning content items.
Again, instructing teachers to consider how they felt prior to attending the math academy to
their current perceptions, over 71% of participants said they have a stronger knowledge of
ratio, proportional reasoning, and rate. Further, 74% stated their knowledge of ratio, propor-
tional reasoning, and rate is more adequate to the task of teaching those subjects.
The Year 2 end-of-year survey included content-specific items as well as items per-
taining to changes in knowledge throughout Cohort 1’s 2-year timespan. Of the algebraic
thinking items, nearly 80% of participants reported having stronger knowledge of algebraic
functions and 75% said they have an increased ability to examine multiple representations of
algebraic functions. Among the items covering the entirety of Cohort 1, nearly 77% of partic-
ipants reported their knowledge of ratio, proportional reasoning, rate, and algebraic func-
tions is now more adequate to the task of teaching those subjects; 78% said they are better
able to differentiate high- and low-level cognitive tasks; 69% indicated stronger knowledge
of the Standards for Mathematical Practice; and 66% reported an increase in their confi-
dence in analyzing mathematical tasks.
Based on LMT results for Year 1, participants realized statistically significant gains in
proportional reasoning from pre- to post-assessments. This allows us to report with 95%
confidence that there was an increase in teacher content knowledge and pedagogical capaci-
ty. Further, the magnitude of the increase in LMT scores was measured by calculating the
effect size. The resulting effect size of 0.4 indicates a medium effect, further corroborating a
measurable positive impact in the knowledge and pedagogy skills among those who took the
proportional reasoning LMT assessments.
Even though Year 2 findings for algebraic thinking on the LMT showed an increase
from pre- to post-assessments, it was not statistically significant. Therefore, it is not possible
to report with any certainty that an observable change in algebraic functions knowledge
and/or pedagogy took place. Additionally, calculation of the effect size yielded only a negli-
gible effect. While these data are reliable, there are other possible explanations as to why we
did not observe statistically significant results. One possible explanation is that the special
education teachers in the group had not previously taught algebra and may need further
support to increase their content and instructional knowledge. Another possibility relates to
statistical power, or the ability to detect differences that are real (i.e. avoiding a false nega-
tive result). Power may be influenced by sample size (larger samples typically increase the
statistical power of a test); the variance of the distribution of results (it is easier to detect
change among distributions that exhibit greater variance); the magnitude of the true differ-
ence being tested (measured by the effect size); and stringency of significance establishment,
most commonly statistical significance is established with a minimum of a p value equaling
0.05 (more stringent significance criteria are p values of 0.01 and 0.001).
According to the self-reported data, academy participants experienced content spe-
cific increases in knowledge, pedagogical capacity, and confidence during the 2 years of
academy activities. Year 1 proportional reasoning LMT results substantiate these findings.

Discussion
34 | Mathematics Academies 2011-2013
However, Year 2’s algebraic thinking LMT did not yield statistically significant results and
any changes in knowledge or pedagogy cannot be objectively verified.
Elements of Effective PD Present in the Mathematics Academies Initiatives
Results from the evaluation tools used in this study (post-PD surveys, end-of-year
surveys, and LMT assessments) indicate Cohort 1 of the Mathematics Academies Initiatives
has been successful. Participants reported satisfaction with academy materials, trainers, and
overall PD; findings also suggest improvements concerning mathematics attitudes and dis-
position toward mathematics instruction. Further, self-reported survey data and Year 1 LMT
results show increases in content knowledge and pedagogical abilities. Yet, without linking
student outcomes to math academy participants (see Limitations), what other evidence do
we have that this PD has been effective?
To determine the answer, we refer to what current research considers best practices
for implementing effective PD, and compare those elements to academy activities. According
to a recent review of relevant research (Hammer, 2013), there are five common elements to
effective PD. These include: (1) content and pedagogy focus; (2) coherence; (3) active learn-
ing; (4) collective participation; and (5) duration.
Arguably, Cohort 1 of the Mathematics Academies Initiatives practiced four of the
five elements (see Table 5). Below we describe how the math academy implemented (and
plans to implement) these elements:
1. Each year of the math academies explored a different content focus (proportional reasoning in Year 1 and developing algebraic thinking in Year 2) and was designed to increase teacher knowledge as well as their pedagogical abilities.
2. Math academies exhibited coherence; the PD activities progressively built upon each other and were in alignment with school goals for instructional improvement, the Standards for Mathematical Practice and the Common Core/WV Next Generation Mathematics Standards and Objectives.
3. Academies incorporated active learning into all face-to-face sessions; participants took the role of students while trainers modeled appropriate and successful teaching techniques.
4. Collective participation refers to participation of a group of teachers/personnel from the same school or the same specialization within a district. While Cohort 1 did not involve collective participation, beginning with Cohort 3 (2013-2014), the OSP ac-tively encouraged coteaching pairs (special and general education pairs) as well as math coaches, math specialists, grade-level math teams, and math curriculum teams from the same district or school to attend the academy as a group.
5. Research differs on the exact number of hours required for effective PD, ranging from 30 to 180 hours. Further, some studies suggest duration is a crucial component, and others indicate content focus impacts the number of contact hours needed. Gen-erally, however, effective PD should include at minimum 30 contact hours distribut-ed across a timespan of at least a year. Cohort 1 lasted for 2 years and involved 100 hours of direct contact and on average 34 hours of Cognitive Tutor/MATHia interac-tion.

Discussion
Mathematics Academies 2011-2013 | 35
Table 5. Comparison of Effective PD Elements to Math Academy Cohort 1 (2011-2013)
Element High quality PD
Math academy Cohort 1 (2011-2013)
Content/content pedagogy focus Coherence Active learning Collective participation Sufficient duration and timespan
Therefore, using these criteria, Cohort 1 of the Mathematics Academies Initiatives was most-
ly successful in delivering PD that has a high potential of improving instructional practice.
Limitations
While sound research methods are an integral component of quality studies, elimi-
nating all potential risks of bias is impossible. The limitations of this evaluation study are
typical of other studies with similar designs. Surveys (such as the post-PD and end-of-year
surveys) that rely upon self-reported information always contain a risk of response bias. Re-
spondents may exaggerate or underestimate, may have recall difficulties, and/or may report
information they perceive as socially acceptable.
Furthermore, less than 100% of academy attendees participated in each of the sur-
veys, and the academy lost more than 40 attendees from Year 1 to Year 2. While high survey
response rates mitigate the likelihood of a nonrepresentative sample of academy partici-
pants, the potential for response bias still exists. Individuals opting to participate in the sur-
veys may have stronger opinions (either negative or positive) and there is a chance these
viewpoints could skew the results. Considering demographic characteristics were compara-
ble between post-PD and end-of-year surveys, we can presume but not guarantee survey re-
sults accurately represent the opinions of academy attendees. Additionally, the LMT was
appropriate for measuring changes in knowledge and pedagogical capacity among elemen-
tary and middle school programmatic levels only. The study lacked a tool to measure wheth-
er or not any knowledge or pedagogical changes occurred at the high school programmatic
level.
Ultimately, professional development efforts are undertaken to positively impact
student achievement. The ideal design for this study would have included linking academy
attendees with their students and examining the difference in mathematics gains for these
students against a suitable comparison group. This would more readily allow us to assess if a
relationship exists between participation in the Mathematics Academy Initiative and student
outcomes. Currently, our data system lacks the capacity to reliably match teachers to their
students. However, such study designs may become possible in the near future once the
WVDE has completed plans to deploy a roster verification solution for the purposes of edu-
cator evaluation. Such a system requires educators and principals to verify the students for
whom each teacher is responsible.

36
37
Recommendations
Continue offering academy activities that include elements of effective professional
development (PD). Maintain academies that: (a) are focused on specific content and content
pedagogy; (b) exhibit coherence with alignment to school goals, state standards, curriculum,
and assessments; (c) engage in active learning, such as the current method of participants
learning as students and trainers modeling as classroom teachers; (d) have collective partic-
ipation of groups of teachers from the same school or specialization within the same district;
and (e) maintain the level of contact time and timespan (at least 1 year) provided to Cohort 1
participants.
Encourage special education directors to recruit participants from counties that
were not represented in Cohort 1. As a program with longevity and new content focus areas
offered each year, the math academies are appropriate for many math teachers across the
state. The West Virginia Department of Education Office of Special Programs and special
education directors should encourage each school district to send at least one teacher to an
academy. This will help ensure increased math knowledge and pedagogical capacity
throughout WV.
Review academy content and classroom examples to ensure their application is ap-
propriate for special education students/environments. Some Cohort 1 participants stated
they felt the content and examples were not at an appropriate level for their students and
therefore not applicable in their classrooms. While these sentiments may be a reflection of
teachers not expecting or requiring enough from their students, academy designers should
consider providing more strategies and scaffolding that special education students may need
to be successful with grade-level, standards-based instruction.
Promote collective participation by encouraging the recruitment and participation
of coteaching pairs and/or teams of teachers and specialists from the same school or spe-
cialization within the same district. One element of effective PD not incorporated into Co-
hort 1 activities was collective participation. While this practice was not implemented until
the 2013-2014 (Cohort 3) Mathematics Academy Initiative, we encourage the continuation
of this practice. Collective participation may be especially beneficial among coteaching
teams, enhancing both general and special education teachers’ mathematics content and
pedagogical capacity.
Continue to develop the algebra content knowledge and instructional skills of mid-
dle school special educators. Beginning in 2014–2015, NxGen standards call for middle
school special education teachers to teach algebra for the first time. Their success in teaching
this content will have a strong bearing on the success of their students in math courses
throughout high school and in closing the mathematics achievement for students with disa-
bilities.
Consider the feasibility of determining if any correlation exists between the Mathe-
matics Academies Initiative and gains in mathematics performance and/or proficiency
among special education students. Currently, we do not have a method to study the exist-

Recommendations
38 | Mathematics Academies 2011-2013
ence of any linkage between math academy PD and student outcomes. Further research is
required to (a) determine if it is possible to link special education teachers to their students,
and (b) determine if there are other reliable ways to measure changes in student outcomes
attributable to math academy activities.
39
References
Carnegie Learning, Inc. (n.d.[a]). Math content academies for teachers of special education.
[Proposal to the West Virginia Department of Education Office of Special Programs].
Pittsburgh, PA: Author.
Carnegie Learning, Inc. (n.d.[b]). Why is Carnegie Learning so effective? Retrieved from
http://www.carnegielearning.com/research/.
Cohen, J. (1988). Statistical power analysis for the behavioral sciences (2nd ed.). Hillsdale,
NJ: Lawrence Erlbaum Associates.
Farrell, M. P. (2014). West Virginia Mathematics Academies Initiative. Unpublished paper.
Charleston, WV: West Virginia Department of Education, Office of Special Programs.
Hammer, P. C. (2013). Creating the context and employing best practices for teacher pro-
fessional development: A brief review of recent research. Charleston, WV: West Vir-
ginia Department of Education, Division of Teaching and Learning, Office of
Research.
Hill, H. C., Schilling, S. G., & Ball, D. L. (2004). Developing measures of teachers' mathemat-
ics knowledge for teaching. The Elementary School Journal, 105(1), 11-30.
Learning Mathematics for Teaching (LMT) Project. (n.d.[a]) About our measures: Content
and tasks measured. Ann Arbor, MI: University of Michigan, School of Education.
Retrieved from http://sitemaker.umich.edu/lmt/content.
Learning Mathematics for Teaching (LMT) Project. (n.d.[b]) What is LMT? Ann Arbor, MI:
University of Michigan, School of Education. Retrieved from http://sitemaker.
umich.edu/lmt/home.

40

41
Appendix A.
Cohort 1 Year 1–Post-PD and End-of-Year Survey Results
Table A 1. County of Employment (2011-2012)
Post-PD survey End-of-year survey
Response Fre-
quency Percent Cumulative
frequency Cumulative
percent Fre-
quency Percent Cumulative
frequency Cumulative
percent
No reply 33 34.74 33 34.74 0 0 NA NA
Barbour 2 2.11 35 36.84 4 5.19 4 5.19
Boone 6 6.32 41 43.16 6 7.79 10 12.99
Clay 0 0 NA NA 5 6.49 15 19.48
Fayette 2 2.11 43 45.26 3 3.90 18 23.38
Hampshire 1 1.05 44 46.32 1 1.30 19 24.68
Hancock 1 1.05 45 47.37 2 2.60 21 27.27
Hardy 3 3.16 48 50.53 0 0 NA NA
Harrison 0 0 NA NA 1 1.30 22 28.57
Jefferson 4 4.21 52 54.74 0 0 NA NA
Kanawha 2 2.11 54 56.84 8 10.39 30 38.96
Lewis 3 3.16 57 60.00 3 3.90 33 42.86
Lincoln 2 2.11 59 62.11 3 3.90 36 46.75
Logan 3 3.16 62 65.26 2 2.60 38 49.35
McDowell 2 2.11 64 67.37 1 1.30 39 50.65
Marion 1 1.05 65 68.42 4 5.19 43 55.84
Marshall/Mason* 2 2.11 67 70.53 1 1.30 44 57.14
Mercer 2 2.11 69 72.63 3 3.90 47 61.04
Mineral 1 1.05 70 73.68 2 2.60 49 63.64
Mingo 0 0 NA NA 1 1.30 50 64.94
Morgan 3 3.16 73 76.84 0 0 NA NA
Nicholas 0 0 NA NA 3 3.90 53 68.83
Ohio 0 0 NA NA 1 1.30 54 70.13
Preston 9 9.47 82 86.32 0 0 NA NA
Putnam/Raleigh* 1 1.05 83 87.37 11 14.29 65 84.42
Randolph 0 0 NA NA 2 2.60 67 87.01
Roane 3 3.16 86 90.53 0 0 NA NA
Summers 1 1.05 87 91.58 3 3.90 70 90.91
Taylor 0 0 NA NA 2 2.60 72 93.51
Tyler 3 3.16 90 94.74 0 0 NA NA
Upshur 1 1.05 91 95.79 2 2.60 74 96.10
Wayne 0 0 NA NA 1 1.30 75 97.40
Wirt 4 4.21 95 100.00 0 0 NA NA
Wood 0 0 NA NA 2 2.60 77 100.00
*An error in the design of the online surveys resulted in Marshall and Mason, and Putnam and Raleigh counties appearing in pairs as one response option

Appendix A.
42 | Mathematics Academies 2011-2013
Table A 2. Grade Levels Taught (2011-2012)
Post-PD survey End-of-year survey
Grade* Response Frequency Percent Cumulative
frequency Cumulative
percent Frequency Percent
Cumulative frequency
Cumulative percent
K No reply 6 6.32 6 6.32 0 0 NA NA
N 84 88.42 90 94.74 73 94.81 73 94.81
Yes 5 5.26 95 100.00 4 5.19 77 100.00
1st
No reply 6 6.32 6 6.32 0 0 NA NA
No 86 90.53 92 96.84 73 94.81 73 94.81
Yes 3 3.16 95 100.00 4 5.19 77 100.00
2nd
No reply 6 6.32 6 6.32 0 0 NA NA
No 85 89.47 91 95.79 73 94.81 73 94.81
Yes 4 4.21 95 100.00 4 5.19 77 100.00
3rd
No reply 6 6.32 6 6.32 0 0 NA NA
No 85 89.47 91 95.79 73 94.81 73 94.81
Yes 4 4.21 95 100.00 4 5.19 77 100.00
4th
No reply 6 6.32 6 6.32 0 0 NA NA
No 82 86.32 88 92.63 73 94.81 73 94.81
Yes 7 7.37 95 100.00 4 5.19 77 100.00
5th
No reply 6 6.32 6 6.32 0 0 NA NA
No 78 82.11 84 88.42 68 88.31 68 88.31
Yes 11 11.58 95 100.00 9 11.69 77 100.00
6th
No reply 6 6.32 6 6.32 0 0 NA NA
No 58 61.05 64 67.37 50 64.94 50 64.94
Yes 31 32.63 95 100.00 27 35.06 77 100.00
7th
No reply 6 6.32 6 6.32 0 0 NA NA
No 60 63.16 66 69.47 44 57.14 44 57.14
Yes 29 30.53 95 100.00 33 42.86 77 100.00
8th
No reply 6 6.32 6 6.32 0 0 NA NA
No 59 62.11 65 68.42 46 59.74 46 59.74
Yes 30 31.58 95 100.00 31 40.26 77 100.00
9th
No reply 6 6.32 6 6.32 0 0 NA NA
No 43 45.26 49 51.58 45 58.44 45 58.44
Yes 46 48.42 95 100.00 32 41.56 77 100.00
10th
No reply 6 6.32 6 6.32 0 0 NA NA
No 42 44.21 48 50.53 47 61.04 47 61.04
Yes 47 49.47 95 100.00 30 38.96 77 100.00
11th
No reply 6 6.32 6 6.32 0 0 NA NA
No 47 49.47 53 55.79 48 62.34 48 62.34
Yes 42 44.21 95 100.00 29 37.66 77 100.00
12th
No reply 6 6.32 6 6.32 0 0 NA NA
No 52 54.74 58 61.05 49 63.64 49 63.64
Yes 37 38.95 95 100.00 28 36.36 77 100.00
*Respondents were instructed to select all grades that apply

Appendix A.
Mathematics Academies 2011-2013 | 43
Table A 3. Years of Experience in Current Position (2011-2012)
Post-PD survey End-of-year survey
Response Frequency Percent Cumulative
frequency Cumulative
percent
Frequency Percent Cumulative
frequency Cumulative
percent
No reply 7 7.37 7 7.37 4 5.19 4 5.19
<1 year 6 6.32 13 13.68 42 54.55 46 59.74
1-5 years 44 46.32 57 60 12 15.58 58 75.32
6-10 years 19 20 76 80 8 10.39 66 85.71
11-15 years 9 9.47 85 89.47 11 14.29 77 100.00
16+ years 10 10.53 95 100.00 4 5.19 4 5.19
Table A 4. Years of Experience in Education (2011-2012)
Post-PD survey End-of-year survey
Response Frequency Percent Cumulative
frequency Cumulative
percent
Frequency Percent Cumulative
frequency Cumulative
percent
No reply 6 6.32 6 6.32 20 25.97 20 25.97
<1 year 1 1.05 7 7.37 21 27.27 41 53.25
1-5 years 20 21.05 27 28.42 9 11.69 50 64.94
6-10 years 20 21.05 47 49.47 27 35.06 77 100.00
11-15 years 14 14.74 61 64.21 20 25.97 20 25.97
16+ years 34 35.79 95 100.00 21 27.27 41 53.25
Table A 5. Academy Activities Attendance (2011-2012)
Survey and activity Response Frequency Percent Cumulative
frequency Cumulative
percent
Post-PD survey Summer 2011 academy
No reply 6 6.32 6 6.32
Charleston 19 20 25 26.32
Clarksburg 29 30.53 54 56.84
Beckley 28 29.47 82 86.32
Huntington 13 13.68 95 100.00
End-of-year survey Summer 2011 academy
Charleston 22 28.57 22 28.57
Clarksburg 25 32.47 47 61.04
Beckley 22 28.57 69 89.61
Huntington 8 10.39 77 100.00
End-of-Year survey Fall 2011 follow-up
Beckley 17 22.08 17 22.08
Huntington 8 10.39 25 32.47
Bridgeport 25 32.47 50 64.94
Nitro 17 22.08 67 87.01
None 10 12.99 77 100.00
End-of-Year survey Spring 2012 follow-up
Bridgeport 25 32.47 25 32.47
Huntington 7 9.09 32 41.56
Nitro 21 27.27 53 68.83
Beckley 19 24.68 72 93.51
None 5 6.49 77 100.00
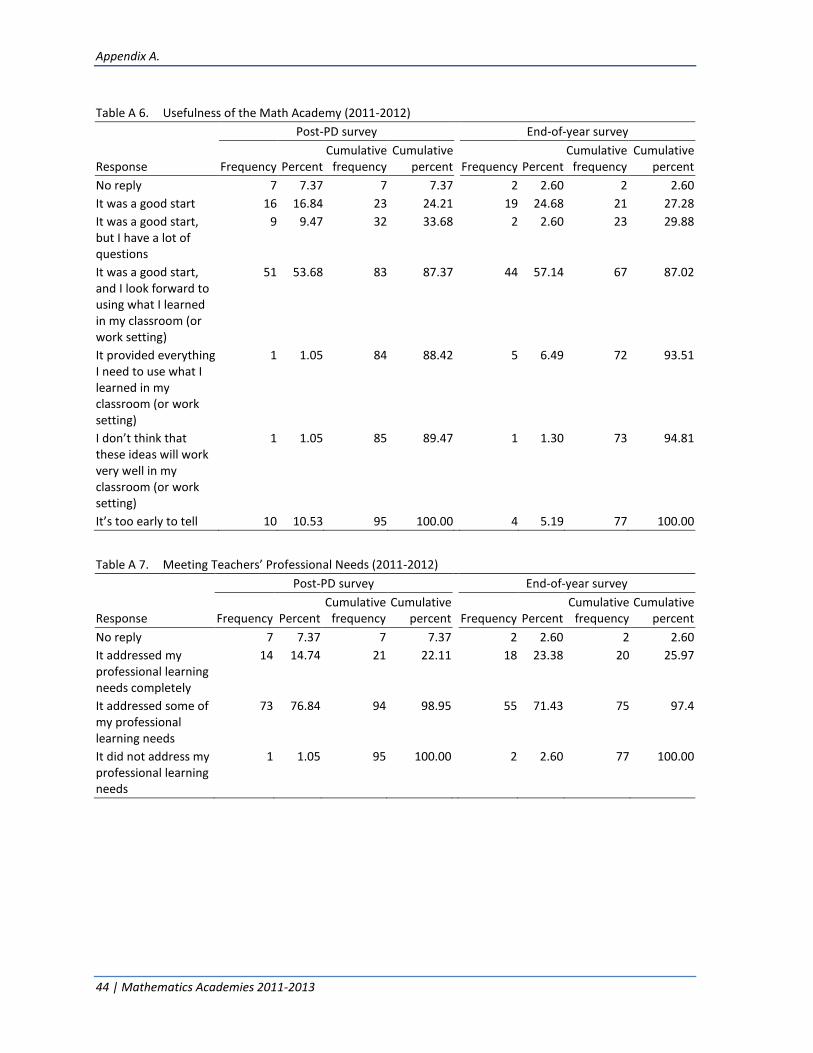
Appendix A.
44 | Mathematics Academies 2011-2013
Table A 6. Usefulness of the Math Academy (2011-2012)
Post-PD survey End-of-year survey
Response Frequency Percent Cumulative
frequency Cumulative
percent Frequency Percent
Cumulative frequency
Cumulative percent
No reply 7 7.37 7 7.37 2 2.60 2 2.60
It was a good start 16 16.84 23 24.21 19 24.68 21 27.28
It was a good start, but I have a lot of questions
9 9.47 32 33.68 2 2.60 23 29.88
It was a good start, and I look forward to using what I learned in my classroom (or work setting)
51 53.68 83 87.37 44 57.14 67 87.02
It provided everything I need to use what I learned in my classroom (or work setting)
1 1.05 84 88.42 5 6.49 72 93.51
I don’t think that these ideas will work very well in my classroom (or work setting)
1 1.05 85 89.47 1 1.30 73 94.81
It’s too early to tell 10 10.53 95 100.00 4 5.19 77 100.00
Table A 7. Meeting Teachers’ Professional Needs (2011-2012)
Post-PD survey End-of-year survey
Response Frequency Percent Cumulative
frequency Cumulative
percent Frequency Percent
Cumulative frequency
Cumulative percent
No reply 7 7.37 7 7.37 2 2.60 2 2.60
It addressed my professional learning needs completely
14 14.74 21 22.11 18 23.38 20 25.97
It addressed some of my professional learning needs
73 76.84 94 98.95 55 71.43 75 97.4
It did not address my professional learning needs
1 1.05 95 100.00 2 2.60 77 100.00

Appendix A.
Mathematics Academies 2011-2013 | 45
Table A 8. Applying/Practicing Math Academy Skills (2011-2012)
Survey Response Frequency Percent Cumulative
frequency Cumulative
percent
Post-PD No reply 7 7.37 7 7.37
I already practice/apply the knowledge/skills this training provided in my classroom (or work setting), and it seems to work well
7 7.37 14 14.74
I have already practiced/applied the knowledge/skills this training provided in my classroom (or work setting), but it is not appropriate for my students
5 5.26 19 20.00
I look forward to practicing/applying the knowledge/skills in my classroom (or work setting) during the upcoming school year
74 77.89 93 97.89
I don’t think what I learned here will work for my students so I don’t envision applying the knowledge/skill
2 2.11 95 100.00
End-of-year No reply 3 3.90 3 3.90
I now practice/apply the knowledge/skills the academy provided in my classroom (or work setting)
32 41.56 35 45.45
I previously practiced/applied the knowledge/skills the academy provided in my classroom (or work setting) AND I continue to do so
26 33.77 61 79.22
I have not practiced/applied what I learned BUT I plan to practice/apply the knowledge/skills in my classroom (or work setting) soon
7 9.09 68 88.31
I previously practiced/applied the knowledge/skills the academy provided in my classroom (or work setting) BUT I no longer do so
1 1.30 69 89.61
I do not practice/apply what I learned at the math academy because it is not appropriate for my students
6 7.79 75 97.40
I do not practice/apply what I learned at the math academy because of other reasons
2 2.60 77 100.00

Appendix A.
46 | Mathematics Academies 2011-2013
Table A 9. Alignment With Goals for Instructional Improvement (2011-2012)
Post-PD survey End-of-year survey
Response Frequency Percent Cumulative
frequency Cumulative
percent
Frequency Percent Cumulative
frequency Cumulative
percent
No reply 8 8.42 8 8.42 2 2.60 2 2.60
The PD was VERY CLOSELY aligned with school’s/program’s goals for instructional improvement*
50 52.63 58 61.05 40 51.95 42 54.55
The PD was SOMEWHAT aligned with school’s/program’s goals for instructional improvement*
28 29.47 86 90.53 30 38.96 72 93.51
The PD was NOT ALIGNED with school’s/program’s goals for instructional improvement*
1 1.05 87 91.58 0 0 NA NA
The PD was INCONSISTENT with school’s/program’s goals for instructional improvement*
0 0 NA NA 1 1.30 73 94.81
I don’t know 8 8.42 95 100.00 4 5.19 77 100.00
* End-of-year survey wording slightly altered; “The PD” was replaced with “The objectives of the initiatives”

Appendix A.
Mathematics Academies 2011-2013 | 47
Table A 10. Comparison of the Math Academy to Other PD (2011-2012)
Post-PD survey End-of-year survey
Response Frequency Percent Cumulative
frequency Cumulative
percent
Frequency Percent Cumulative
frequency Cumulative
percent
No reply 7 7.37 7 7.37 1 1.30 1 1.30
This professional development was MORE USEFUL than other professional development that I have participated in*
56 58.95 63 66.32 51 66.23 52 67.53
This professional development was ABOUT THE SAME AS other professional development that I have participated in**
25 26.32 88 92.63 18 23.38 70 90.91
This professional development was LESS USEFUL than other professional development that I have participated in**
1 1.05 89 93.68 0 0 NA NA
I don’t have an opinion
5 5.26 94 98.95 5 6.49 75 97.40
I haven’t participated in any other professional development in the last three years
1 1.05 95 100.00 2 2.60 77 100.00
* End-of-year survey wording slightly altered; “This professional development” was replaced with “The math academy” ** End-of-year survey wording slightly altered; “This professional development” was replaced with “This academy”

Appendix A.
48 | Mathematics Academies 2011-2013
Table A 11. Participant Evaluation of Math Academy PD (2011-2012)
Post-PD survey End-of-year survey
Survey item* Response Frequency Percen
t Cumulative
frequency Cumulative
percent
Frequency Percent Cumulative
frequency Cumulative
percent
The training was high quality
No reply 7 7.37 7 7.37 1 1.30 1 1.30
Strongly disagree 1 1.05 8 8.42 0 0 NA NA
Disagree 0 0 NA NA 1 1.30 2 2.60
Neutral 3 3.16 11 11.58 2 2.60 4 5.19
Agree 25 26.32 36 37.89 31 40.26 35 45.45
Strongly agree 59 62.11 95 100.00 42 54.55 77 100.00
The training was relevant
No reply 7 7.37 7 7.37 1 1.30 1 1.30
Strongly disagree 1 1.05 8 8.42 0 0 NA NA
Disagree 0 0 NA NA 1 1.30 2 2.60
Neutral 4 4.21 12 12.63 2 2.60 4 5.19
Agree 29 30.53 41 43.16 30 38.96 34 44.16
Strongly agree 54 56.84 95 100.00 43 55.84 77 100.00
The training was well organized
No reply 7 7.37 7 7.37 1 1.30 1 1.30
Strongly disagree 1 1.05 8 8.42 0 0 NA NA
Disagree 1 1.05 9 9.47 0 0 NA NA
Neutral 4 4.21 13 13.68 2 2.60 3 3.90
Agree 24 25.26 37 38.95 30 38.96 33 42.86
Strongly agree 58 61.05 95 100.00 44 57.14 77 100.00
The training was specific and content focused
No reply 7 7.37 7 7.37 1 1.30 1 1.30
Strongly disagree 1 1.05 8 8.42 0 0 NA NA
Disagree 0 0 NA NA 0 0 NA NA
Neutral 0 0 NA NA 0 0 NA NA
Agree 23 24.21 31 32.63 26 33.77 27 35.06
Strongly agree 64 67.37 95 100.00 50 64.94 77 100.00
The training was hands-on and included active learning opportunities
No reply 7 7.37 7 7.37 1 1.30 1 1.30
Strongly disagree 1 1.05 8 8.42 0 0 NA NA
Disagree 0 0 NA NA 0 0 NA NA
Neutral 2 2.11 10 10.53 2 2.60 3 3.90
Agree 12 12.63 22 23.16 20 25.97 23 29.87
Strongly agree 73 76.84 95 100.00 54 70.13 77 100.00
Training objectives were clearly stated before sessions began
No reply 7 7.37 7 7.37 1 1.30 1 1.30
Strongly disagree 1 1.05 8 8.42 0 0 NA NA
Disagree 1 1.05 9 9.47 1 1.30 2 2.60
Neutral 4 4.21 13 13.68 1 1.30 3 3.90
Agree 22 23.16 35 36.84 24 31.17 27 35.06
Strongly agree 60 63.16 95 100.00 50 64.94 77 100.00
Training sessions began and ended in a timely fashion
No reply 7 7.37 7 7.37 1 1.30 1 1.30
Strongly disagree 2 2.11 9 9.47 0 0 NA NA
Disagree 2 2.11 11 11.58 0 0 NA NA
Neutral 6 6.32 17 17.89 1 1.30 2 2.60
Agree 18 18.95 35 36.84 23 29.87 25 32.47
Strongly agree 60 63.16 95 100.00 52 67.53 77 100.00
* End-of-year survey wording slightly altered; “Training” was replaced with “The initiatives”
Table A 12. Participant Evaluation of Math Academy Materials (2011-2012)

Appendix A.
Mathematics Academies 2011-2013 | 49
Post-PD survey End-of-year survey
Survey item Response Frequency Percent Cumulative
frequency Cumulative
percent
Frequency Percent Cumulative
frequency Cumulative
percent
Adequate amounts of training materials/resources were provided
No reply 9 9.47 9 9.47 1 1.30 1 1.30
Strongly disagree 1 1.05 10 10.53 0 0 NA NA
Disagree 1 1.05 11 11.58 1 1.30 2 2.60
Neutral 6 6.32 17 17.89 1 1.30 3 3.90
Agree 33 34.74 50 52.63 27 35.06 30 38.96
Strongly agree 45 47.37 95 100.00 47 61.04 77 100.00
Materials/resources were relevant to my work
No reply 10 10.53 10 10.53 1 1.30 1 1.30
Strongly disagree 2 2.11 12 12.63 0 0 NA NA
Disagree 0 0 NA NA 2 2.60 3 3.90
Neutral 10 10.53 22 23.16 3 3.90 6 7.79
Agree 33 34.74 55 57.89 35 45.45 41 53.25
Strongly agree 40 42.11 95 100.00 36 46.75 77 100.00
The materials/ resources provided were of high quality (i.e., based on recent research and evidence-based)
No reply 10 10.53 10 10.53 1 1.30 1 1.30
Strongly disagree 1 1.05 11 11.58 0 0 NA NA
Disagree 1 1.05 12 12.63 1 1.30 2 2.60
Neutral 5 5.26 17 17.89 3 3.90 5 6.49
Agree 33 34.74 50 52.63 29 37.66 34 44.16
Strongly agree 45 47.37 95 100.00 43 55.84 77 100.00
The materials/ resources provided were useful to my work
No reply 10 10.53 10 10.53 2 2.60 2 2.60
Strongly disagree 1 1.05 11 11.58 0 0 NA NA
Disagree 2 2.11 13 13.68 2 2.60 4 5.19
Neutral 11 11.58 24 25.26 8 10.39 12 15.58
Agree 33 34.74 57 60 32 41.56 44 57.14
Strongly agree 38 40 95 100.00 33 42.86 77 100.00
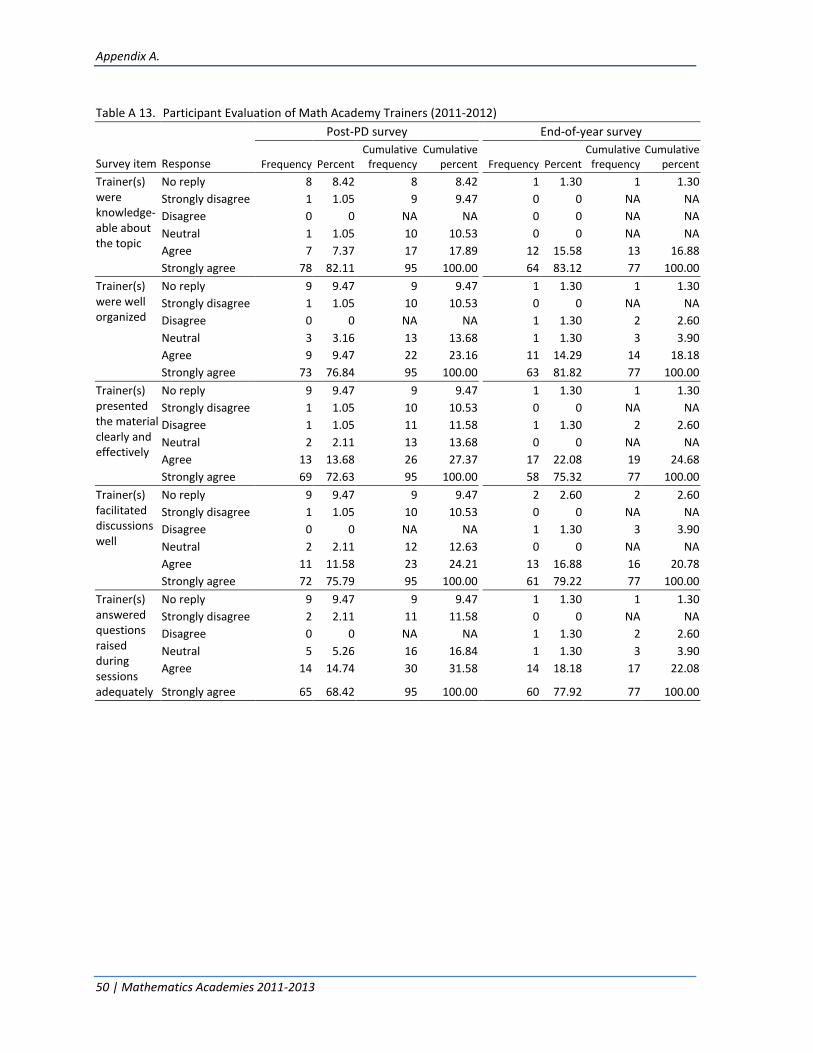
Appendix A.
50 | Mathematics Academies 2011-2013
Table A 13. Participant Evaluation of Math Academy Trainers (2011-2012)
Post-PD survey End-of-year survey
Survey item Response Frequency Percent Cumulative
frequency Cumulative
percent
Frequency Percent Cumulative
frequency Cumulative
percent
Trainer(s) were knowledge-able about the topic
No reply 8 8.42 8 8.42 1 1.30 1 1.30
Strongly disagree 1 1.05 9 9.47 0 0 NA NA
Disagree 0 0 NA NA 0 0 NA NA
Neutral 1 1.05 10 10.53 0 0 NA NA
Agree 7 7.37 17 17.89 12 15.58 13 16.88
Strongly agree 78 82.11 95 100.00 64 83.12 77 100.00
Trainer(s) were well organized
No reply 9 9.47 9 9.47 1 1.30 1 1.30
Strongly disagree 1 1.05 10 10.53 0 0 NA NA
Disagree 0 0 NA NA 1 1.30 2 2.60
Neutral 3 3.16 13 13.68 1 1.30 3 3.90
Agree 9 9.47 22 23.16 11 14.29 14 18.18
Strongly agree 73 76.84 95 100.00 63 81.82 77 100.00
Trainer(s) presented the material clearly and effectively
No reply 9 9.47 9 9.47 1 1.30 1 1.30
Strongly disagree 1 1.05 10 10.53 0 0 NA NA
Disagree 1 1.05 11 11.58 1 1.30 2 2.60
Neutral 2 2.11 13 13.68 0 0 NA NA
Agree 13 13.68 26 27.37 17 22.08 19 24.68
Strongly agree 69 72.63 95 100.00 58 75.32 77 100.00
Trainer(s) facilitated discussions well
No reply 9 9.47 9 9.47 2 2.60 2 2.60
Strongly disagree 1 1.05 10 10.53 0 0 NA NA
Disagree 0 0 NA NA 1 1.30 3 3.90
Neutral 2 2.11 12 12.63 0 0 NA NA
Agree 11 11.58 23 24.21 13 16.88 16 20.78
Strongly agree 72 75.79 95 100.00 61 79.22 77 100.00
Trainer(s) answered questions raised during sessions adequately
No reply 9 9.47 9 9.47 1 1.30 1 1.30
Strongly disagree 2 2.11 11 11.58 0 0 NA NA
Disagree 0 0 NA NA 1 1.30 2 2.60
Neutral 5 5.26 16 16.84 1 1.30 3 3.90
Agree 14 14.74 30 31.58 14 18.18 17 22.08
Strongly agree 65 68.42 95 100.00 60 77.92 77 100.00

Appendix A.
Mathematics Academies 2011-2013 | 51
Table A 14. Average Evaluation of Math Academy PD (2011-2012)
Post-PD survey End-of-year survey
Survey item* n mean** sd n mean** sd
The training was high quality 88 4.60 6.29 76 4.50 5.42
The training was relevant 88 4.53 6.51 76 4.51 5.42
The training was well organized 88 4.56 6.95 76 4.55 4.81
The training was specific and content-focused 88 4.69 5.57 76 4.66 4.16
The training was hands-on and included active learning opportunities
88 4.77 5.64 76 4.68 4.55
Training objectives were clearly stated before sessions began
88 4.58 6.93 76 4.62 5.13
Training sessions began and ended in a timely fashion 88 4.50 8.41 76 4.67 4.36
Composite academy PD mean 4.61 4.61
* End-of-year survey wording slightly altered; “Training” was replaced with “The initiatives” ** Means are based on 5-point Likert type scale of agreement, where 1 = strongly disagree and 5 = strongly agree
Table A 15. Average Evaluation of Math Academy Materials (2011-2012)
Post-PD survey End-of-year survey
Survey item n mean* sd n mean* sd
Adequate amounts of training materials/resources were provided
86 4.40 7.15 76 4.58 5.18
Materials/resources were relevant to my work 85 4.28 7.87 76 4.38 6.03
The materials/resources provided were of high quality (i.e., based on recent research and evidence-based)
85 4.41 7.01 76 4.50 5.60
The materials/resources provided were useful to my work
85 4.24 7.88 75 4.28 6.61
Composite academy materials mean 4.33 4.44
* Means are based on 5-point Likert type scale of agreement, where 1 = strongly disagree and 5 = strongly agree
Table A 16. Average Evaluation of Math Academy Trainers (2011-2012)
Post-PD survey End-of-year survey
Survey item n mean* sd n mean* sd
Trainer(s) were knowledgeable about the topic 87 4.85 5.03 76 4.84 3.20
Trainer(s) were well organized 86 4.78 5.76 76 4.79 4.57
Trainer(s) presented the material clearly and effectively
86 4.72 6.31 76 4.74 4.58
Trainer(s) facilitated discussions well 86 4.78 5.58 75 4.79 4.34
Trainer(s) answered questions raised during sessions adequately
86 4.63 7.40 76 4.75 4.75
Composite academy trainer(s) mean 4.75 4.78
* Means are based on 5-point Likert type scale of agreement, where 1 = strongly disagree and 5 = strongly agree

52
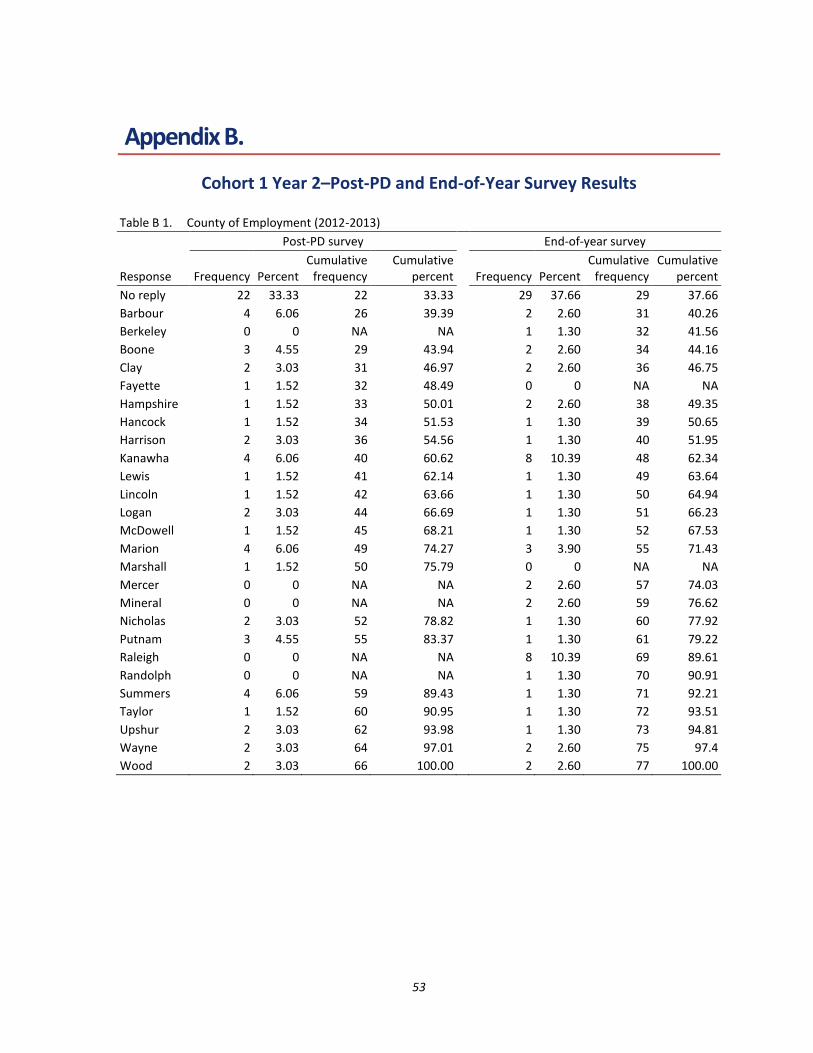
53
Appendix B.
Cohort 1 Year 2–Post-PD and End-of-Year Survey Results
Table B 1. County of Employment (2012-2013)
Post-PD survey End-of-year survey
Response Frequency Percent Cumulative
frequency Cumulative
percent
Frequency Percent Cumulative
frequency Cumulative
percent
No reply 22 33.33 22 33.33 29 37.66 29 37.66
Barbour 4 6.06 26 39.39 2 2.60 31 40.26
Berkeley 0 0 NA NA 1 1.30 32 41.56
Boone 3 4.55 29 43.94 2 2.60 34 44.16
Clay 2 3.03 31 46.97 2 2.60 36 46.75
Fayette 1 1.52 32 48.49 0 0 NA NA
Hampshire 1 1.52 33 50.01 2 2.60 38 49.35
Hancock 1 1.52 34 51.53 1 1.30 39 50.65
Harrison 2 3.03 36 54.56 1 1.30 40 51.95
Kanawha 4 6.06 40 60.62 8 10.39 48 62.34
Lewis 1 1.52 41 62.14 1 1.30 49 63.64
Lincoln 1 1.52 42 63.66 1 1.30 50 64.94
Logan 2 3.03 44 66.69 1 1.30 51 66.23
McDowell 1 1.52 45 68.21 1 1.30 52 67.53
Marion 4 6.06 49 74.27 3 3.90 55 71.43
Marshall 1 1.52 50 75.79 0 0 NA NA
Mercer 0 0 NA NA 2 2.60 57 74.03
Mineral 0 0 NA NA 2 2.60 59 76.62
Nicholas 2 3.03 52 78.82 1 1.30 60 77.92
Putnam 3 4.55 55 83.37 1 1.30 61 79.22
Raleigh 0 0 NA NA 8 10.39 69 89.61
Randolph 0 0 NA NA 1 1.30 70 90.91
Summers 4 6.06 59 89.43 1 1.30 71 92.21
Taylor 1 1.52 60 90.95 1 1.30 72 93.51
Upshur 2 3.03 62 93.98 1 1.30 73 94.81
Wayne 2 3.03 64 97.01 2 2.60 75 97.4
Wood 2 3.03 66 100.00 2 2.60 77 100.00

Appendix B.
54 | Mathematics Academies 2011-2013
Table B 2. Grade Levels Taught (2012-2013)
Post-PD survey End-of-year survey
Grade* Response Frequency Percent Cumulative
frequency Cumulative
percent
Frequency Percent Cumulative
frequency Cumulative
percent
K** No 64 96.97 64 96.97 NA NA NA NA
Yes 2 3.03 66 100.00 NA NA NA NA
1st
No 64 96.97 64 96.97 75 97.4 75 97.40
Yes 2 3.03 66 100.00 2 2.60 77 100.00
2nd
No 63 95.45 63 95.45 74 96.1 74 96.10
Yes 3 4.55 66 100.00 3 3.90 77 100.00
3rd
No 63 95.45 63 95.45 74 96.1 74 96.10
Yes 3 4.55 66 100.00 3 3.90 77 100.00
4th
No 62 93.94 62 93.94 71 92.21 71 92.21
Yes 4 6.06 66 100.00 6 7.79 77 100.00
5th
No 54 81.82 54 81.82 66 85.71 66 85.71
Yes 12 18.18 66 100.00 11 14.29 77 100.00
6th
No 41 62.12 41 62.12 49 63.64 49 63.64
Yes 25 37.88 66 100.00 28 36.36 77 100.00
7th
No 40 60.61 40 60.61 43 55.84 43 55.84
Yes 26 39.39 66 100.00 34 44.16 77 100.00
8th
No 43 65.15 43 65.15 50 64.94 50 64.94
Yes 23 34.85 66 100.00 27 35.06 77 100.00
9th
No 39 59.09 39 59.09 44 57.14 44 57.14
Yes 27 40.91 66 100.00 33 42.86 77 100.00
10th
No 39 59.09 39 59.09 46 59.74 46 59.74
Yes 27 40.91 66 100.00 31 40.26 77 100.00
11th
No 39 59.09 39 59.09 49 63.64 49 63.64
Yes 27 40.91 66 100.00 28 36.36 77 100.00
12th
No 40 60.61 40 60.61 49 63.64 49 63.64
Yes 26 39.39 66 100.00 28 36.36 77 100.00
*Respondents were instructed to select all grades that apply **Kindergarten was not an option on the End-of-Year Survey
Table B 3. Years of Experience in Current Position (2012-2013)
Post-PD survey End-of-year survey
Response Frequency Percent Cumulative
frequency Cumulative
percent
Frequency Percent Cumulative
frequency Cumulative
percent
No reply 0 0 NA NA 1 1.30 1 1.30
<1 year 3 4.55 3 4.55 1 1.30 2 2.60
1-5 years 31 46.97 34 51.52 38 49.35 40 51.95
6-10 years 14 21.21 48 72.73 18 23.38 58 75.32
11-15 years 8 12.12 56 84.85 11 14.29 69 89.61
16+ years 10 15.15 66 100.00 8 10.39 77 100.00

Appendix B.
Mathematics Academies 2011-2013 | 55
Table B 4. Years of Experience in Education (2012-2013)
Post-PD survey End-of-year survey
Response Frequency Percent Cumulative
frequency Cumulative
percent Frequency Percent
Cumulative frequency
Cumulative percent
No reply 0 0 NA NA 1 1.30 1 1.30
<1 year 0 0 NA NA 0 0 NA NA
1-5 years 12 18.18 12 18.18 14 18.18 15 19.48
6-10 years 20 30.30 32 48.48 26 33.77 41 53.25
11-15 years 9 13.64 41 62.12 8 10.39 49 63.64
16+ years 25 37.88 66 100.00 28 36.36 77 100.00
Table B 5. Academy Activities Attendance (2012-2013)
Survey and activity Response Frequency Percent Cumulative
frequency Cumulative
percent
Post-PD survey Summer 2012 academy
Charleston 14 21.21 14 21.21
Clarksburg 22 33.33 36 54.55
Beckley 20 30.30 56 84.85
Huntington 10 15.15 66 100.00
End-of-year survey Summer 2012 academy
Charleston 18 23.37 18 23.37
Clarksburg 27 35.06 45 58.43
Beckley 24 31.17 69 89.60
Huntington 8 10.39 77 100.00
End-of-year survey Fall 2012 follow-up
Nitro (previously Charleston) 22 28.57 22 28.57
Clarksburg/Bridgeport 26 33.77 48 62.34
Beckley 19 24.68 67 87.01
Nitro (previously Huntington) 6 7.79 73 94.81
None of the above 4 5.19 77 100.00
End-of-year survey Spring 2013 follow-up
Nitro (previously Charleston) 18 23.38 18 23.38
Clarksburg/Bridgeport 22 28.57 40 51.95
Beckley 17 22.08 57 74.03
Nitro (previously Huntington) 5 6.49 62 80.52
None of the above 15 19.48 77 100.00

Appendix B.
56 | Mathematics Academies 2011-2013
Table B 6. Usefulness of the Math Academy (2012-2013)
Survey Response Frequency Percent Cumulative
frequency Cumulative
percent
Post-PD It was a good start 9 13.64 9 13.64
It was a good start, but I have a lot of questions
2 3.03 11 16.67
It was a good start, and I look forward to using what I learned in my classroom (or work setting)
45 68.18 56 84.85
It provided everything I need to use what I learned in my classroom (or work setting)
5 7.58 61 92.42
I don’t think that these ideas will work very well in my classroom (or work setting)
1 1.52 62 93.94
It’s too early to tell 4 6.06 66 100.00
End-of-year The first year was more useful 2 2.60 2 2.60
The second year was more useful 5 6.49 7 9.09
Both years were equally useful 28 36.36 35 45.45
Both years were equally useful, and I look forward to using what I learned in my classroom (or work setting)
36 46.75 71 92.21
Overall, the academy provided everything I need to use in my classroom (or work setting)
3 3.90 74 96.10
Both years were equally useful, but I have a lot of questions
1 1.30 75 97.40
I don’t think that these ideas will work very well in my classroom (or work setting)
2 2.60 77 100.00

Appendix B.
Mathematics Academies 2011-2013 | 57
Table B 7. Meeting Teachers’ Professional Needs (2012-2013)
Post-PD survey End-of-year survey
Response Frequency Percent Cumulative
frequency Cumulative
percent Frequency Percent
Cumulative frequency
Cumulative percent
No reply 1 1.52 1 1.52 0 0 NA NA
It addressed my professional learning needs completely
22 33.33 23 34.85 27 35.06 27 35.06
It addressed some of my professional learning needs
43 65.15 66 100.00 47 61.04 74 96.10
It did not address my professional learning needs
0 0 NA NA 2 2.60 76 98.70
This professional development did not help much because I already know what I need to know about this topic*
0 0 NA NA 1 1.30 77 100.00
* End-of-year survey wording slightly altered; “This professional development” was replaced with “This academy”
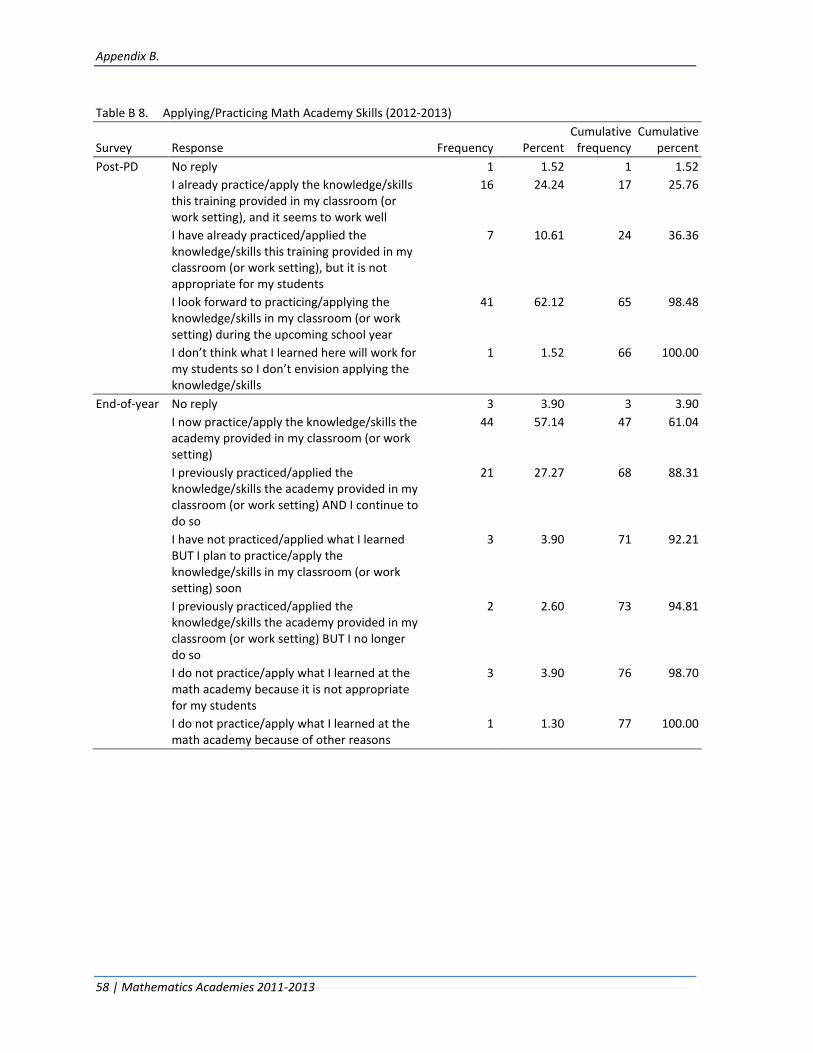
Appendix B.
58 | Mathematics Academies 2011-2013
Table B 8. Applying/Practicing Math Academy Skills (2012-2013)
Survey Response Frequency Percent Cumulative
frequency Cumulative
percent
Post-PD No reply 1 1.52 1 1.52
I already practice/apply the knowledge/skills this training provided in my classroom (or work setting), and it seems to work well
16 24.24 17 25.76
I have already practiced/applied the knowledge/skills this training provided in my classroom (or work setting), but it is not appropriate for my students
7 10.61 24 36.36
I look forward to practicing/applying the knowledge/skills in my classroom (or work setting) during the upcoming school year
41 62.12 65 98.48
I don’t think what I learned here will work for my students so I don’t envision applying the knowledge/skills
1 1.52 66 100.00
End-of-year No reply 3 3.90 3 3.90
I now practice/apply the knowledge/skills the academy provided in my classroom (or work setting)
44 57.14 47 61.04
I previously practiced/applied the knowledge/skills the academy provided in my classroom (or work setting) AND I continue to do so
21 27.27 68 88.31
I have not practiced/applied what I learned BUT I plan to practice/apply the knowledge/skills in my classroom (or work setting) soon
3 3.90 71 92.21
I previously practiced/applied the knowledge/skills the academy provided in my classroom (or work setting) BUT I no longer do so
2 2.60 73 94.81
I do not practice/apply what I learned at the math academy because it is not appropriate for my students
3 3.90 76 98.70
I do not practice/apply what I learned at the math academy because of other reasons
1 1.30 77 100.00

Appendix B.
Mathematics Academies 2011-2013 | 59
Table B 9. Alignment With Goals for Instructional Improvement (2012-2013)
Post-PD survey*
Response Frequency Percent Cumulative
frequency Cumulative
percent
The PD was VERY CLOSELY aligned with school’s/program’s goals for instructional improvement
41 62.12 41 62.12
The PD was SOMEWHAT aligned with school’s/program’s goals for instructional improvement
23 34.85 64 96.97
The PD was NOT ALIGNED with school’s/program’s goals for instructional improvement
0 0 NA NA
The PD was INCONSISTENT with school’s/program’s goals for instructional improvement
0 0 NA NA
I don’t know 2 3.03 66 100.00
*This survey item was not included in the End-of-year survey
Table B 10. Comparison of the Math Academy to Other PD (2012-2013)
Post-PD survey End-of-year survey
Response Frequency Percent Cumulative
frequency Cumulative
percent Frequency Percent
Cumulative frequency
Cumulative percent
No reply 0 0 NA NA 3 3.90 3 3.90
This professional development was MORE USEFUL than other professional development that I have participated in*
52 78.79 52 78.79 52 67.53 55 71.43
This professional development was ABOUT THE SAME AS other professional development that I have participated in**
13 19.70 65 98.48 17 22.08 72 93.51
This professional development was LESS USEFUL than other professional development that I have participated in**
1 1.52 66 100.00 2 2.60 74 96.10
I don’t have an opinion 0 0 NA NA 2 2.60 76 98.70
I haven’t participated in any other professional development in the last three years
0 0 NA NA 1 1.30 77 100.00
* End-of-year survey wording slightly altered; “This professional development” was replaced with “The math academy” ** End-of-year survey wording slightly altered; “This professional development” was replaced with “This academy”
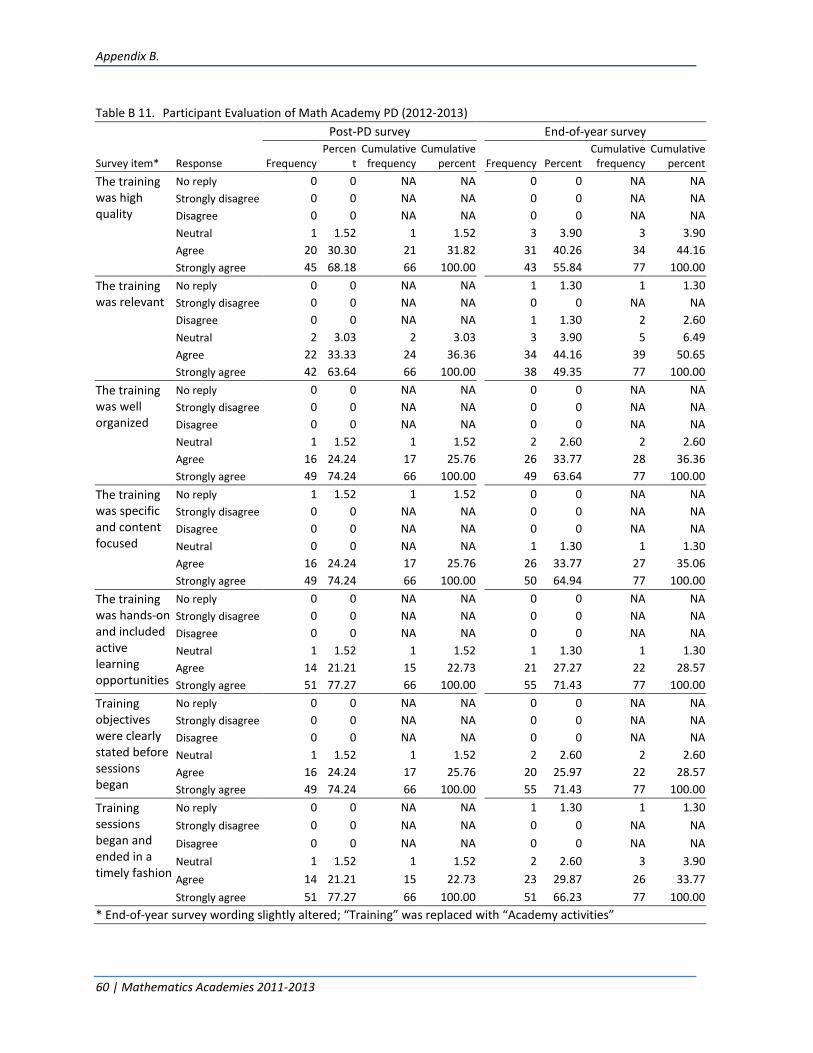
Appendix B.
60 | Mathematics Academies 2011-2013
Table B 11. Participant Evaluation of Math Academy PD (2012-2013)
Post-PD survey End-of-year survey
Survey item* Response Frequency Percen
t Cumulative
frequency Cumulative
percent Frequency Percent
Cumulative frequency
Cumulative percent
The training was high quality
No reply 0 0 NA NA 0 0 NA NA
Strongly disagree 0 0 NA NA 0 0 NA NA
Disagree 0 0 NA NA 0 0 NA NA
Neutral 1 1.52 1 1.52 3 3.90 3 3.90
Agree 20 30.30 21 31.82 31 40.26 34 44.16
Strongly agree 45 68.18 66 100.00 43 55.84 77 100.00
The training was relevant
No reply 0 0 NA NA 1 1.30 1 1.30
Strongly disagree 0 0 NA NA 0 0 NA NA
Disagree 0 0 NA NA 1 1.30 2 2.60
Neutral 2 3.03 2 3.03 3 3.90 5 6.49
Agree 22 33.33 24 36.36 34 44.16 39 50.65
Strongly agree 42 63.64 66 100.00 38 49.35 77 100.00
The training was well organized
No reply 0 0 NA NA 0 0 NA NA
Strongly disagree 0 0 NA NA 0 0 NA NA
Disagree 0 0 NA NA 0 0 NA NA
Neutral 1 1.52 1 1.52 2 2.60 2 2.60
Agree 16 24.24 17 25.76 26 33.77 28 36.36
Strongly agree 49 74.24 66 100.00 49 63.64 77 100.00
The training was specific and content focused
No reply 1 1.52 1 1.52 0 0 NA NA
Strongly disagree 0 0 NA NA 0 0 NA NA
Disagree 0 0 NA NA 0 0 NA NA
Neutral 0 0 NA NA 1 1.30 1 1.30
Agree 16 24.24 17 25.76 26 33.77 27 35.06
Strongly agree 49 74.24 66 100.00 50 64.94 77 100.00
The training was hands-on and included active learning opportunities
No reply 0 0 NA NA 0 0 NA NA
Strongly disagree 0 0 NA NA 0 0 NA NA
Disagree 0 0 NA NA 0 0 NA NA
Neutral 1 1.52 1 1.52 1 1.30 1 1.30
Agree 14 21.21 15 22.73 21 27.27 22 28.57
Strongly agree 51 77.27 66 100.00 55 71.43 77 100.00
Training objectives were clearly stated before sessions began
No reply 0 0 NA NA 0 0 NA NA
Strongly disagree 0 0 NA NA 0 0 NA NA
Disagree 0 0 NA NA 0 0 NA NA
Neutral 1 1.52 1 1.52 2 2.60 2 2.60
Agree 16 24.24 17 25.76 20 25.97 22 28.57
Strongly agree 49 74.24 66 100.00 55 71.43 77 100.00
Training sessions began and ended in a timely fashion
No reply 0 0 NA NA 1 1.30 1 1.30
Strongly disagree 0 0 NA NA 0 0 NA NA
Disagree 0 0 NA NA 0 0 NA NA
Neutral 1 1.52 1 1.52 2 2.60 3 3.90
Agree 14 21.21 15 22.73 23 29.87 26 33.77
Strongly agree 51 77.27 66 100.00 51 66.23 77 100.00
* End-of-year survey wording slightly altered; “Training” was replaced with “Academy activities”

Appendix B.
Mathematics Academies 2011-2013 | 61
Table B 12. Participant Evaluation of Math Academy Materials (2012-2013)
Post-PD survey End-of-year survey
Survey item Response Fre-
quency Percent Cumulative
frequency Cumulative
percent Fre-
quency Percent Cumulative
frequency Cumulative
percent
Adequate amounts of training materials/ resources were provided
No reply 0 0 NA NA 0 0 NA NA
Strongly disagree 0 0 NA NA 1 1.30 1 1.30
Disagree 0 0 NA NA 0 0 NA NA
Neutral 1 1.52 1 1.52 2 2.60 3 3.90
Agree 24 36.36 25 37.88 38 49.35 41 53.25
Strongly agree 41 62.12 66 100.00 36 46.75 77 100.00
Materials/ resources were relevant to my work
No reply 0 0 NA NA 0 0 NA NA
Strongly disagree 0 0 NA NA 1 1.30 1 1.30
Disagree 0 0 NA NA 0 0 NA NA
Neutral 1 1.52 1 1.52 7 9.09 8 10.39
Agree 28 42.42 29 43.94 38 49.35 46 59.74
Strongly agree 37 56.06 66 100.00 31 40.26 77 100.00
The materials/ resources provided were of high quality (i.e., based on recent research and evidence-based)
No reply 0 0 NA NA 0 0 NA NA
Strongly disagree 0 0 NA NA 1 1.30 1 1.30
Disagree 0 0 NA NA 0 0 NA NA
Neutral 0 0 NA NA 3 3.90 4 5.19
Agree 24 36.36 24 36.36 32 41.56 36 46.75
Strongly agree 42 63.64 66 100.00 41 53.25 77 100.00
The materials/ resources provided were useful to my work
No reply 0 0 NA NA 0 0 NA NA
Strongly disagree 0 0 NA NA 1 1.30 1 1.30
Disagree 0 0 NA NA 2 2.60 3 3.90
Neutral 2 3.03 2 3.03 8 10.39 11 14.29
Agree 30 45.45 32 48.48 36 46.75 47 61.04
Strongly agree 34 51.52 66 100.00 30 38.96 77 100.00

Appendix B.
62 | Mathematics Academies 2011-2013
Table B 13. Participant Evaluation of Math Academy Trainers (2012-2013)
Post-PD survey End-of-year survey
Survey item Response Fre-
quency Percent Cumulative
frequency Cumulative
percent Fre- quency Percent
Cumulative frequency
Cumulative percent
Trainer(s) were knowledgeable about the topic
No reply 0 0 NA NA 0 0 NA NA
Strongly disagree 0 0 NA NA 1 1.30 1 1.30
Disagree 0 0 NA NA 0 0 NA NA
Neutral 0 0 NA NA 1 1.30 2 2.60
Agree 10 15.15 10 15.15 18 23.38 20 25.97
Strongly agree 56 84.85 66 100.00 57 74.03 77 100.00
Trainer(s) were well organized
No reply 0 0 NA NA 0 0 NA NA
Strongly disagree 0 0 NA NA 1 1.30 1 1.30
Disagree 1 1.52 1 1.52 0 0 NA NA
Neutral 0 0 NA NA 1 1.30 2 2.60
Agree 9 13.64 10 15.15 21 27.27 23 29.87
Strongly agree 56 84.85 66 100.00 54 70.13 77 100.00
Trainer(s) presented the material clearly and effectively
No reply 0 0 NA NA 0 0 NA NA
Strongly disagree 0 0 NA NA 1 1.30 1 1.30
Disagree 1 1.52 1 1.52 0 0 NA NA
Neutral 0 0 NA NA 2 2.60 3 3.90
Agree 10 15.15 11 16.67 20 25.97 23 29.87
Strongly agree 55 83.33 66 100.00 54 70.13 77 100.00
Trainer(s) facilitated discussions well
No reply 0 0 NA NA 0 0 NA NA
Strongly disagree 0 0 NA NA 1 1.30 1 1.30
Disagree 1 1.52 1 1.52 0 0 NA NA
Neutral 0 0 NA NA 2 2.60 3 3.90
Agree 10 15.15 11 16.67 17 22.08 20 25.97
Strongly agree 55 83.33 66 100.00 57 74.03 77 100.00
Trainer(s) answered questions raised during sessions adequately
No reply 9 9.47 9 9.47 0 0 NA NA
Strongly disagree 2 2.11 11 11.58 1 1.30 1 1.30
Disagree 0 0 NA NA 3 3.90 4 5.19
Neutral 5 5.26 16 16.84 3 3.90 7 9.09
Agree 14 14.74 30 31.58 16 20.78 23 29.87
Strongly agree 65 68.42 95 100.00 54 70.13 77 100.00

Appendix B.
Mathematics Academies 2011-2013 | 63
Table B 14. Average Evaluation of Math Academy PD (2012-2013)
Post-PD survey End-of-year survey
Survey item* n mean** sd n mean** sd
The training was high quality 66 4.67 4.11 77 4.52 5.05
The training was relevant 66 4.61 4.48 76 4.43 5.57
The training was well organized 66 4.73 3.91 77 4.61 4.75
The training was specific and content-focused 65 4.75 3.50 77 4.64 4.48
The training was hands-on and included active learning opportunities
66 4.76 3.79 77 4.70 4.29
Training objectives were clearly stated before sessions began
66 4.73 3.91 77 4.69 4.56
Training sessions began and ended in a timely fashion
66 4.76 3.79 76 4.64 4.66
Composite academy PD mean 4.71 4.60
* End-of-year survey wording slightly altered; “Training” was replaced with “The initiatives” ** Means are based on 5-point Likert type scale of agreement, where 1 = strongly disagree and 5 = strongly agree
Table B 15. Average Evaluation of Math Academy Materials (2012-2013)
Post-PD survey End-of-year survey
Survey item n mean* sd n mean* sd
Adequate amounts of training materials/resources were provided
66 4.61 4.25 77 4.40 5.91
Materials/resources were relevant to my work 66 4.55 4.32 77 4.27 6.47
The materials/resources provided were of high quality (i.e., based on recent research and evidence-based)
66 4.64 3.94 77 4.45 6.13
The materials/resources provided were useful to my work
66 4.48 4.56 77 4.19 7.26
Composite academy materials mean 4.57 4.33
* Means are based on 5-point Likert type scale of agreement, where 1 = strongly disagree and 5 = strongly agree
Table B 16. Average Evaluation of Math Academy Trainers (2012-2013)
Post-PD survey End-of-year survey
Survey item n mean* sd n mean* sd
Trainer(s) were knowledgeable about the topic 66 4.85 2.94 77 4.69 5.56
Trainer(s) were well organized 66 4.82 4.01 77 4.65 5.65
Trainer(s) presented the material clearly and effectively
66 4.80 4.09 77 4.64 5.85
Trainer(s) facilitated discussions well 66 4.80 4.09 77 4.68 5.77
Trainer(s) answered questions raised during sessions adequately
66 4.79 3.91 77 4.55 7.47
Composite academy trainer(s) mean 4.81 4.64
* Means are based on 5-point Likert type scale of agreement, where 1 = strongly disagree and 5 = strongly agree

64
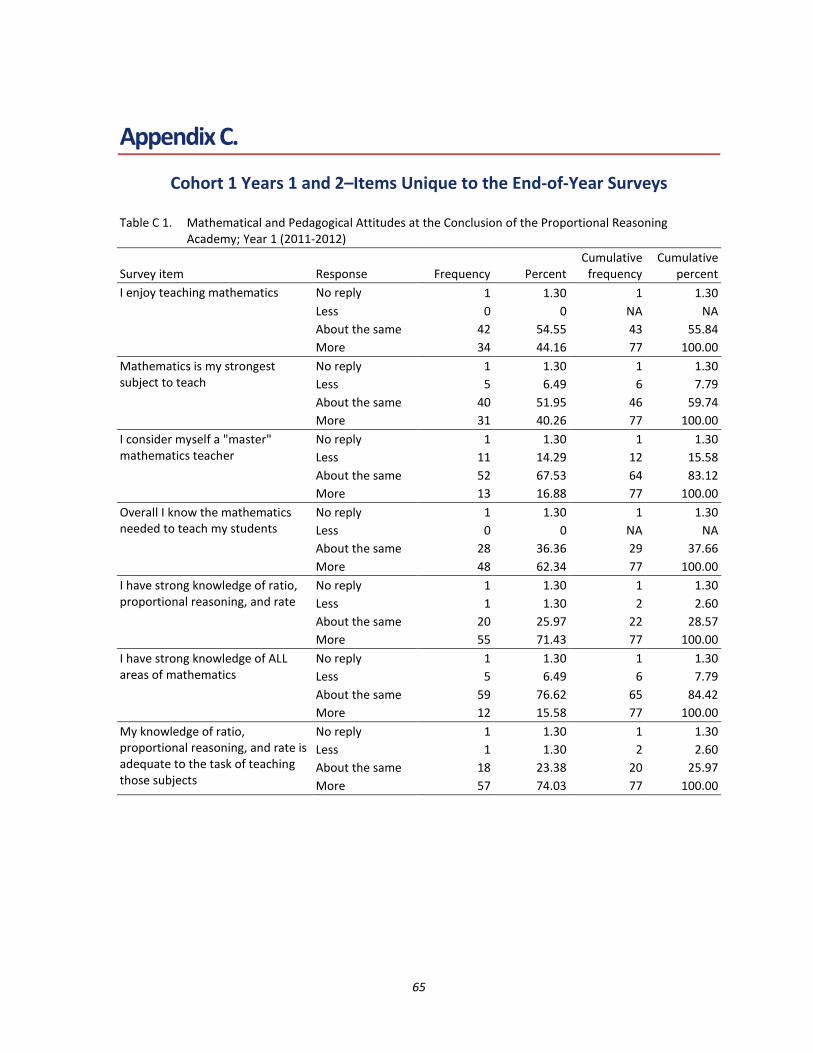
65
Appendix C.
Cohort 1 Years 1 and 2–Items Unique to the End-of-Year Surveys
Table C 1. Mathematical and Pedagogical Attitudes at the Conclusion of the Proportional Reasoning Academy; Year 1 (2011-2012)
Survey item Response Frequency Percent Cumulative
frequency Cumulative
percent
I enjoy teaching mathematics No reply 1 1.30 1 1.30
Less 0 0 NA NA
About the same 42 54.55 43 55.84
More 34 44.16 77 100.00
Mathematics is my strongest subject to teach
No reply 1 1.30 1 1.30
Less 5 6.49 6 7.79
About the same 40 51.95 46 59.74
More 31 40.26 77 100.00
I consider myself a "master" mathematics teacher
No reply 1 1.30 1 1.30
Less 11 14.29 12 15.58
About the same 52 67.53 64 83.12
More 13 16.88 77 100.00
Overall I know the mathematics needed to teach my students
No reply 1 1.30 1 1.30
Less 0 0 NA NA
About the same 28 36.36 29 37.66
More 48 62.34 77 100.00
I have strong knowledge of ratio, proportional reasoning, and rate
No reply 1 1.30 1 1.30
Less 1 1.30 2 2.60
About the same 20 25.97 22 28.57
More 55 71.43 77 100.00
I have strong knowledge of ALL areas of mathematics
No reply 1 1.30 1 1.30
Less 5 6.49 6 7.79
About the same 59 76.62 65 84.42
More 12 15.58 77 100.00
My knowledge of ratio, proportional reasoning, and rate is adequate to the task of teaching those subjects
No reply 1 1.30 1 1.30
Less 1 1.30 2 2.60
About the same 18 23.38 20 25.97
More 57 74.03 77 100.00
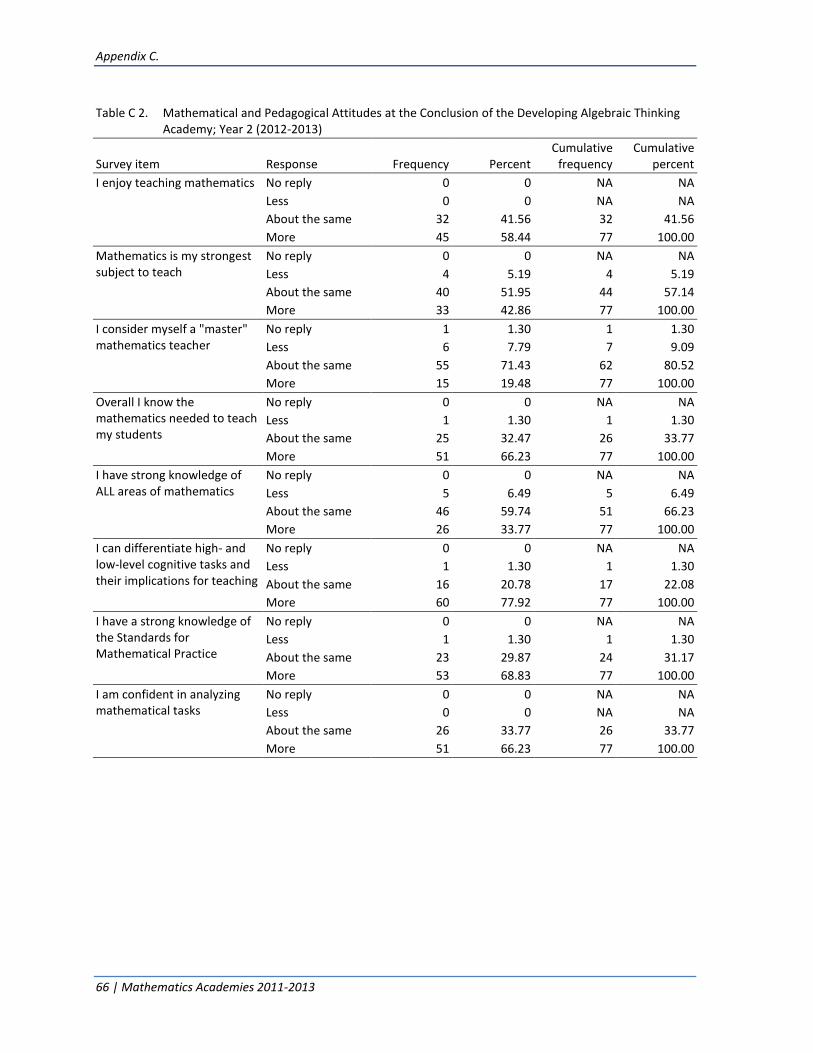
Appendix C.
66 | Mathematics Academies 2011-2013
Table C 2. Mathematical and Pedagogical Attitudes at the Conclusion of the Developing Algebraic Thinking Academy; Year 2 (2012-2013)
Survey item Response Frequency Percent Cumulative
frequency Cumulative
percent
I enjoy teaching mathematics No reply 0 0 NA NA
Less 0 0 NA NA
About the same 32 41.56 32 41.56
More 45 58.44 77 100.00
Mathematics is my strongest subject to teach
No reply 0 0 NA NA
Less 4 5.19 4 5.19
About the same 40 51.95 44 57.14
More 33 42.86 77 100.00
I consider myself a "master" mathematics teacher
No reply 1 1.30 1 1.30
Less 6 7.79 7 9.09
About the same 55 71.43 62 80.52
More 15 19.48 77 100.00
Overall I know the mathematics needed to teach my students
No reply 0 0 NA NA
Less 1 1.30 1 1.30
About the same 25 32.47 26 33.77
More 51 66.23 77 100.00
I have strong knowledge of ALL areas of mathematics
No reply 0 0 NA NA
Less 5 6.49 5 6.49
About the same 46 59.74 51 66.23
More 26 33.77 77 100.00
I can differentiate high- and low-level cognitive tasks and their implications for teaching
No reply 0 0 NA NA
Less 1 1.30 1 1.30
About the same 16 20.78 17 22.08
More 60 77.92 77 100.00
I have a strong knowledge of the Standards for Mathematical Practice
No reply 0 0 NA NA
Less 1 1.30 1 1.30
About the same 23 29.87 24 31.17
More 53 68.83 77 100.00
I am confident in analyzing mathematical tasks
No reply 0 0 NA NA
Less 0 0 NA NA
About the same 26 33.77 26 33.77
More 51 66.23 77 100.00

Appendix C.
Mathematics Academies 2011-2013 | 67
Table C 3. Self-Reported Proportional Reasoning Mathematical Knowledge; Year 1 (2011-2012)
Survey item Response Frequency Percent Cumulative
frequency Cumulative
percent
I have strong knowledge of ratio, proportional reasoning and rate
No reply 1 1.30 1 1.30
Less 1 1.30 2 2.60
About the same 20 25.97 22 28.57
More 55 71.43 77 100.00
My knowledge of ratio, proportional reasoning, and rate is adequate to the task of teaching those subjects
No reply 1 1.30 1 1.30
Less 1 1.30 2 2.60
About the same 18 23.38 20 25.97
More 57 74.03 77 100.00
Table C 4. Self-Reported Developing Algebraic Thinking Mathematical Knowledge; Year 2 (2012-2013)
Survey item Response Frequency Percent Cumulative
frequency Cumulative
percent
I can differentiate high- and low-level cognitive tasks and their implications for teaching
Less 1 1.30 1 1.30
About the same 16 20.78 17 22.08
More 60 77.92 77 100.00
I have a strong knowledge of the Standards for Mathematical Practice
Less 1 1.30 1 1.30
About the same 23 29.87 24 31.17
More 53 68.83 77 100.00
I am confident in analyzing mathematical tasks
Less 0 0 NA NA
About the same 26 33.77 26 33.77
More 51 66.23 77 100.00
I have a strong knowledge of algebraic functions
Less 0 0 NA NA
About the same 16 20.78 16 20.78
More 61 79.22 77 100.00
I have the ability to examine multiple representations of algebraic functions
Less 0 0 NA NA
About the same 19 24.68 19 24.68
More 58 75.32 77 100.00
I am confident in comparing linear, quadratic and exponential functions
Less 1 1.30 1 1.30
About the same 30 38.96 31 40.26
More 46 59.74 77 100.00
I use technology to explore algebraic functions
Less 1 1.30 1 1.30
About the same 36 46.75 37 48.05
More 40 51.95 77 100.00
Overall, my knowledge of ratio, proportional reasoning, rate, and algebraic functions is adequate to the task of teaching those subjects
Less 1 1.30 1 1.30
About the same 17 22.08 18 23.38
More 59 76.62 77 100.00

Appendix C.
68 | Mathematics Academies 2011-2013
Table C 5. Helpfulness and Understandability of Proportional Reasoning Academy Components; Year 1 (2011-2012)
Survey item Response Frequency Percent Cumulative
frequency Cumulative
percent
I found the five-day SUMMER PD provided by Carnegie helpful
No reply 1 1.30 1 1.30
Strongly disagree 1 1.30 2 2.60
Disagree 0 0 NA NA
Neutral 2 2.60 4 5.19
Agree 26 33.77 30 38.96
Strongly Agree 47 61.04 77 100.00
I found the five-day SUMMER PD provided by Carnegie easy to understand
No reply 1 1.30 1 1.30
Strongly disagree 0 0 NA NA
Disagree 1 1.30 2 2.60
Neutral 7 9.09 9 11.69
Agree 28 36.36 37 48.05
Strongly Agree 40 51.95 77 100.00
I found the one-day FALL follow-up helpful
No reply 9 11.69 9 11.69
Strongly disagree 1 1.30 10 12.99
Disagree 1 1.30 11 14.29
Neutral 7 9.09 18 23.38
Agree 27 35.06 45 58.44
Strongly Agree 32 41.56 77 100.00
I found the one-day FALL follow-up easy to understand
No reply 9 11.69 9 11.69
Strongly disagree 0 0 NA NA
Disagree 1 1.30 10 12.99
Neutral 4 5.19 14 18.18
Agree 28 36.36 42 54.55
Strongly Agree 35 45.45 77 100.00
I found the one-day SPRING follow-up helpful
No reply 8 10.39 8 10.39
Strongly disagree 1 1.30 9 11.69
Disagree 0 0 NA NA
Neutral 6 7.79 15 19.48
Agree 30 38.96 45 58.44
Strongly Agree 32 41.56 77 100.00
I found the one-day SPRING follow-up easy to understand
No reply 9 11.69 9 11.69
Strongly disagree 0 0 NA NA
Disagree 0 0 NA NA
Neutral 3 3.90 12 15.58
Agree 34 44.16 46 59.74
Strongly Agree 31 40.26 77 100.00
Table C 5 continues on next page

Appendix C.
Mathematics Academies 2011-2013 | 69
Table C 5. Helpfulness and Understandability of Proportional Reasoning Academy Components; Year 1 (2011-2012)
Survey item Response Frequency Percent Cumulative
frequency Cumulative
percent
I found MATHia helpful No reply 3 3.90 3 3.90
Strongly disagree 1 1.30 4 5.19
Disagree 1 1.30 5 6.49
Neutral 11 14.29 16 20.78
Agree 27 35.06 43 55.84
Strongly Agree 34 44.16 77 100.00
I found MATHia easy to use No reply 4 5.19 4 5.19
Strongly disagree 1 1.30 5 6.49
Disagree 11 14.29 16 20.78
Neutral 13 16.88 29 37.66
Agree 21 27.27 50 64.94
Strongly Agree 27 35.06 77 100.00

Appendix C.
70 | Mathematics Academies 2011-2013
Table C 6. Helpfulness of Developing Algebraic Thinking Academy Components; Year 2 (2012-2013)
Survey item Response Frequency Percent Cumulative
frequency Cumulative
percent
I found the five-day SUMMER PD provided by Carnegie helpful
No reply 0 0 NA NA
Strongly disagree 1 1.30 1 1.30
Disagree 0 0 NA NA
Neutral 3 3.9 4 5.19
Agree 17 22.08 21 27.27
Strongly Agree 56 72.73 77 100.00
I found the one-day FALL follow-up helpful
No reply 0 0 NA NA
Strongly disagree 1 1.30 1 1.30
Disagree 1 1.30 2 2.60
Neutral 6 7.79 8 10.39
Agree 23 29.87 31 40.26
Strongly Agree 43 55.84 74 96.10
NA* 3 3.90 77 100.00
I found the one-day SPRING follow-up helpful
No reply 0 0 NA NA
Strongly disagree 1 1.30 1 1.30
Disagree 1 1.30 2 2.60
Neutral 7 9.09 9 11.69
Agree 21 27.27 30 38.96
Strongly Agree 38 49.35 68 88.31
NA* 9 11.69 77 100.00
I found Cognitive Tutor/MATHia helpful
No reply 0 0 NA NA
Strongly disagree 1 1.30 1 1.30
Disagree 3 3.90 4 5.19
Neutral 13 16.88 17 22.08
Agree 23 29.87 40 51.95
Strongly Agree 37 48.05 77 100.00
Using Cognitive Tutor/MATHia deepened my understanding of mathematics
No reply 2 2.60 2 2.60
Strongly disagree 1 1.30 3 3.90
Disagree 3 3.90 6 7.79
Neutral 13 16.88 19 24.68
Agree 23 29.87 42 54.55
Strongly Agree 35 45.45 77 100.00
*NA = Participant responded that they did not attend this academy activity
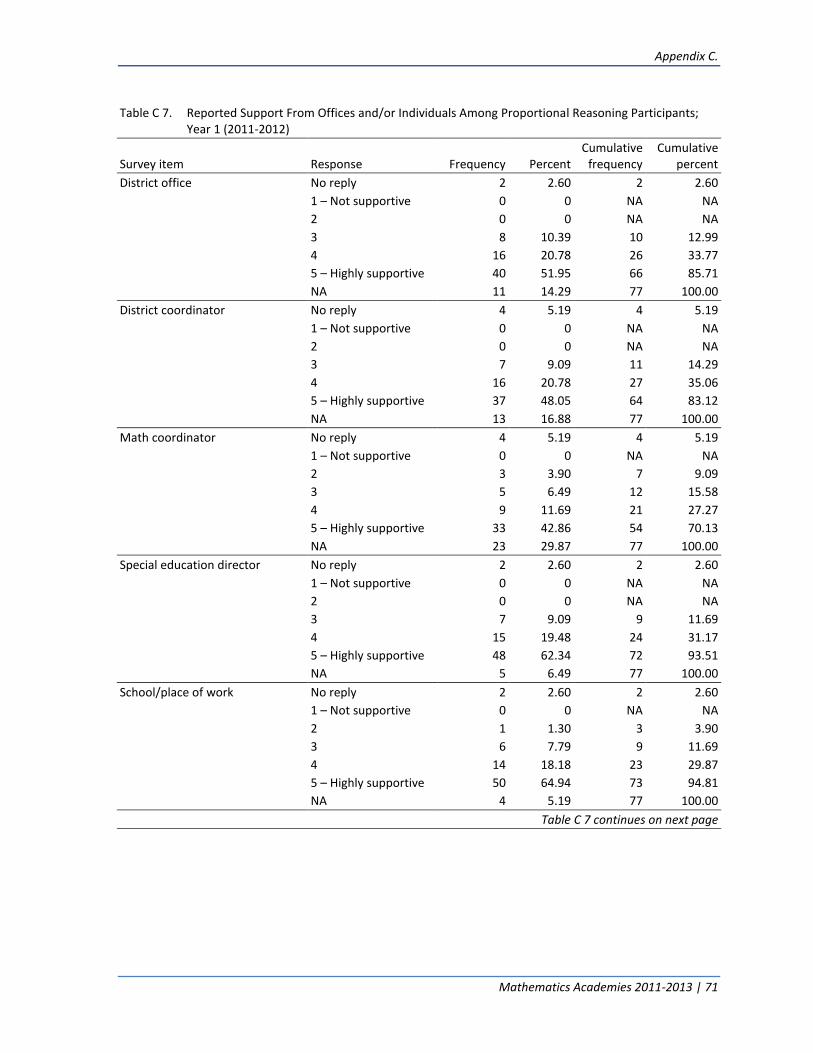
Appendix C.
Mathematics Academies 2011-2013 | 71
Table C 7. Reported Support From Offices and/or Individuals Among Proportional Reasoning Participants; Year 1 (2011-2012)
Survey item Response Frequency Percent Cumulative
frequency Cumulative
percent
District office No reply 2 2.60 2 2.60
1 – Not supportive 0 0 NA NA
2 0 0 NA NA
3 8 10.39 10 12.99
4 16 20.78 26 33.77
5 – Highly supportive 40 51.95 66 85.71
NA 11 14.29 77 100.00
District coordinator No reply 4 5.19 4 5.19
1 – Not supportive 0 0 NA NA
2 0 0 NA NA
3 7 9.09 11 14.29
4 16 20.78 27 35.06
5 – Highly supportive 37 48.05 64 83.12
NA 13 16.88 77 100.00
Math coordinator No reply 4 5.19 4 5.19
1 – Not supportive 0 0 NA NA
2 3 3.90 7 9.09
3 5 6.49 12 15.58
4 9 11.69 21 27.27
5 – Highly supportive 33 42.86 54 70.13
NA 23 29.87 77 100.00
Special education director No reply 2 2.60 2 2.60
1 – Not supportive 0 0 NA NA
2 0 0 NA NA
3 7 9.09 9 11.69
4 15 19.48 24 31.17
5 – Highly supportive 48 62.34 72 93.51
NA 5 6.49 77 100.00
School/place of work No reply 2 2.60 2 2.60
1 – Not supportive 0 0 NA NA
2 1 1.30 3 3.90
3 6 7.79 9 11.69
4 14 18.18 23 29.87
5 – Highly supportive 50 64.94 73 94.81
NA 4 5.19 77 100.00
Table C 7 continues on next page
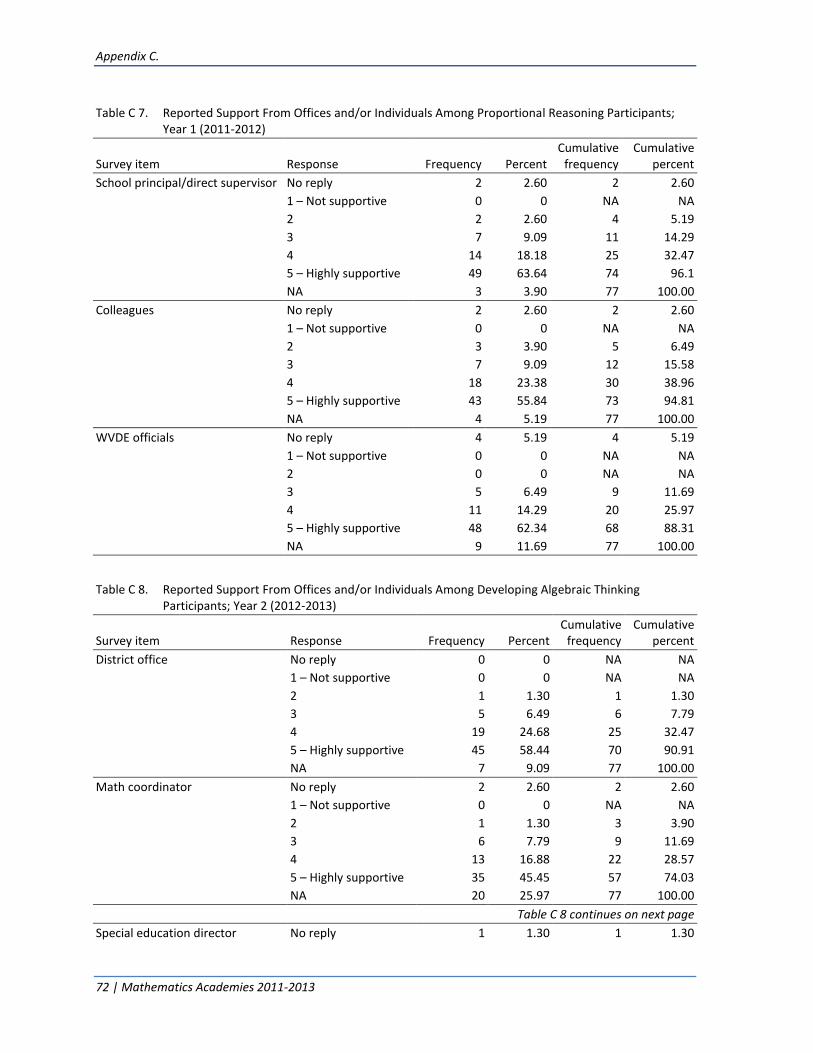
Appendix C.
72 | Mathematics Academies 2011-2013
Table C 7. Reported Support From Offices and/or Individuals Among Proportional Reasoning Participants; Year 1 (2011-2012)
Survey item Response Frequency Percent Cumulative
frequency Cumulative
percent
School principal/direct supervisor No reply 2 2.60 2 2.60
1 – Not supportive 0 0 NA NA
2 2 2.60 4 5.19
3 7 9.09 11 14.29
4 14 18.18 25 32.47
5 – Highly supportive 49 63.64 74 96.1
NA 3 3.90 77 100.00
Colleagues No reply 2 2.60 2 2.60
1 – Not supportive 0 0 NA NA
2 3 3.90 5 6.49
3 7 9.09 12 15.58
4 18 23.38 30 38.96
5 – Highly supportive 43 55.84 73 94.81
NA 4 5.19 77 100.00
WVDE officials No reply 4 5.19 4 5.19
1 – Not supportive 0 0 NA NA
2 0 0 NA NA
3 5 6.49 9 11.69
4 11 14.29 20 25.97
5 – Highly supportive 48 62.34 68 88.31
NA 9 11.69 77 100.00
Table C 8. Reported Support From Offices and/or Individuals Among Developing Algebraic Thinking Participants; Year 2 (2012-2013)
Survey item Response Frequency Percent Cumulative
frequency Cumulative
percent
District office No reply 0 0 NA NA
1 – Not supportive 0 0 NA NA
2 1 1.30 1 1.30
3 5 6.49 6 7.79
4 19 24.68 25 32.47
5 – Highly supportive 45 58.44 70 90.91
NA 7 9.09 77 100.00
Math coordinator No reply 2 2.60 2 2.60
1 – Not supportive 0 0 NA NA
2 1 1.30 3 3.90
3 6 7.79 9 11.69
4 13 16.88 22 28.57
5 – Highly supportive 35 45.45 57 74.03
NA 20 25.97 77 100.00
Table C 8 continues on next page
Special education director No reply 1 1.30 1 1.30

Appendix C.
Mathematics Academies 2011-2013 | 73
Table C 8. Reported Support From Offices and/or Individuals Among Developing Algebraic Thinking Participants; Year 2 (2012-2013)
Survey item Response Frequency Percent Cumulative
frequency Cumulative
percent
1 – Not supportive 0 0 NA NA
2 2 2.60 3 3.90
3 7 9.09 10 12.99
4 10 12.99 20 25.97
5 – Highly supportive 56 72.73 76 98.70
NA 1 1.30 77 100.00
School/place of work No reply 0 0 NA NA
1 – Not supportive 0 0 NA NA
2 0 0 NA NA
3 11 14.29 11 14.29
4 18 23.38 29 37.66
5 – Highly supportive 47 61.04 76 98.70
NA 1 1.30 77 100.00
School principal/direct supervisor No reply 1 1.30 1 1.30
1 – Not supportive 1 1.30 2 2.60
2 0 0 NA NA
3 7 9.09 9 11.69
4 17 22.08 26 33.77
5 – Highly supportive 48 62.34 74 96.10
NA 3 3.90 77 100.00
Colleagues No reply 1 1.30 1 1.30
1 – Not supportive 2 2.60 3 3.90
2 0 0 NA NA
3 8 10.39 11 14.29
4 20 25.97 31 40.26
5 – Highly supportive 43 55.84 74 96.10
NA 3 3.90 77 100.00
WVDE officials No reply 2 2.60 2 2.60
1 – Not supportive 0 0 NA NA
2 0 0 NA NA
3 2 2.60 4 5.19
4 10 12.99 14 18.18
5 – Highly supportive 56 72.73 70 90.91
NA 7 9.09 77 100.00

Appendix C.
74 | Mathematics Academies 2011-2013
Table C 9. Average Helpfulness of Academy Components (2011-2013)
Year 1 (2011-2012) proportional reasoning
Year 2 (2012-2013) developing algebraic thinking
Survey item n mean* sd n mean* sd
I found the five-day SUMMER PD provided by Carnegie helpful
76 4.55 5.94 77 4.65 6.00
I found the one-day FALL follow-up helpful 68 4.29 6.84 77 4.49 7.48
I found the one-day SPRING follow-up helpful 69 4.33 6.32 77 4.57 8.35
I found Cognitive Tutor/MATHia helpful 74 4.24 7.37 77 4.19 8.31
Academy components helpfulness mean 4.36 4.48
* Means are based on 5-point Likert type scale of agreement, where 1 = strongly disagree and 5 = strongly agree


James B. Phares Ed.D.State Superintendent of Schools