Material Hygiene and life cycle analysis of an electric scooter
105
Green two-wheeled mobility -Material Hygiene and life cycle analysis of an electric scooter DARIO BRACONI Master of Science Thesis Stockholm, Sweden 2014
-
Upload
khangminh22 -
Category
Documents
-
view
0 -
download
0
Transcript of Material Hygiene and life cycle analysis of an electric scooter

Green two-wheeled mobility -Material Hygiene and life cycle analysis of an
electric scooter
DARIO BRACONI
Master of Science Thesis Stockholm, Sweden 2014

Green two-wheeled mobility -Material Hygiene and life cycle analysis of an electric scooter
Dario Braconi
Master of Science Thesis MMK 2014:85 IDE 134
KTH Industrial Engineering and Management
Machine Design
SE-100 44 STOCKHOLM

Master of Science Thesis MMK 2014:85 IDE 134
Green two-wheeled mobility
-Material Hygiene and life cycle analysis of an electric scooter
Dario Braconi}
Approved
2014-oct-20
Examiner
Conrad Luttropp
Supervisor
Conrad Luttropp
Commissioner
Contact person
Abstract In the last years electric vehicles gained importance as a more sustainable alternative to traditional vehicles. The introduction of an electric powertrain leads to lower air-pollution emissions but it also involves the introduction of new materials in the product life cycle, e. g., the rare earths and lithium contained in the motor and in the batteries. Those materials have an environmental impact and they need to be disposed properly. The aim of this thesis is to have a quantitative knowledge of the environmental balance linked to the use of a different powertrain. Furthermore, this study explores how this balance can be modified improving the recycling and the end of life management. Specifically in this thesis, an average electric scooter has been chosen as a case study. The electric scooter is used as object of comparison with a traditional internal-combustion-engine scooter. The choice of a two-wheeled mean of transport is linked to the low level of facilities involved. This report first includes a definition of the case of study; this section also presents a description of the technologies taken into exam. It is also presented the result of interviews with dismantlers to depict the current process of EoL management of a scooter. The central part of thesis deals with different recycling scenarios. With the help of the Material Hygiene mind-set, a qualitative analysis and different recycling scenarios are proposed. The recycling scenarios involve the component of the electric powertrain that are peculiar of the electric vehicle. They mainly are the electric motor and the lithium battery pack. The last part of the analysis encompasses a Life Cycle Assessment of an average electric scooter to give a quantitative meaning to the life cycle comparison and to assess the environmental benefits of the proposed recycling scenarios. To perform the Life Cycle Assessment a software, SimaPro 7.3, is used. This software lets the user insert the bill of materials of the product and it associates to each material its environmental loads according to the database EcoInvent v.2.2.
Keywords: electric scooter, lithium battery, permanent magnet, neodymium, Material Hygiene, Design for Disassembly, Life Cycle Assessment, LCA

I
FOREWORD
Several people contributed to the development and the implementation of this thesis. In this
section, the author would like to acknowledge them.
First of all the author would like to thank the professors that supervised this work. Professor Mario
Guagliano that made this experience possible accepting to supervise this thesis from Italy and
Professor Conrad Luttropp that guided the author through the dumpy roads of the EcoDesign,
always ready to share his experience and to provide help. Moreover, a special thanks to all the
other people that took part to this work such as the interviewed companies and to all the staff of
KTH that helped the author through the daily life of a student writing his master’s thesis abroad.
Dario Braconi
Milan, September 2014

III
Riassunto Negli ultimi anni i veicoli elettrici sono emersi come un’alternativa sostenibile ai veicoli
tradizionali. L’introduzione di un gruppo propulsore elettrico permette emissioni inquinanti più
basse ma comporta anche l’introduzione di nuovi materiali nel ciclo di vita del prodotto, e.g., le
terre rare e il litio contenuti rispettivamente nel motore e nelle batterie. Questi materiali hanno un
impatto ambientale e hanno bisogno di essere trattati correttamente.
Lo scopo di questa tesi è di avere una comprensione quantitativa del bilancio dal punto di vista
ambientale legato all’adozione di sistema di propulsione elettrico. Inoltre, è indagato come questo
bilanco possa essere influenzato migliorando il riciclaggio e la gestione dell’ultima fase di vita del
prodotto.
Nello specifico, in questa tesi, uno scooter elettrico è stato scelto come caso di studio. Lo scopo è
di comparare questo scooter con uno tradizionale considerando il ciclo di vita del prodotto. Il
mezzo di trasporto a due ruote è stato scelto perché considerato più semplice da modellare in
quanto privo di componenti non inerenti al trasporto (es. aria condizionata, hi-fi, etc.).
Questo report anzitutto include una definizione del caso di studio, questa sezione presenta anche
una descrizione delle principali tecnologie coinvolte nel prodotto studiato. In questa parte del
lavoro è anche riportato il risultato di interviste a rottamatori di scooter per illustrare l’attuale iter
di rottamazione di uno scooter.
La parte centrale della tesi tratta i differenti scenari di riciclaggio. Sfruttando la mentalità Material
Hygiene vengono proposte un’analisi qualitativa e differenti scenari di riciclaggio. Gli scenari di
riciclaggio coinvologono il progettista a livelli differenti. Questi scenari riguardano i componenti
del sistema di propulsione elettrico. Essi sono principalmente il motore elettrico e le batterie al
litio.
L’ultima parte dell’analisi riguarda il Life Cycle Assessment di uno scooter elettrico al fine di dare
un significato quantitativo al confronto tra i cicli di vita delle due alternative. Inoltre, il life cycle
assessment ha lo scopo di verificare e quantificare i benefici di impatto ambientale collegati
all’adozione degli scenari di riciclaggio proposti.
Per svolgere il Life Cycle Assessment è stato usato un sofware, SimaPro 7.3. Questo software
permette all’utente di inserire l’elenco dei materiali di un prodotto e di associare a ciascun
materiale il proprio impatto ambientale. Il software ha a disposizione per la modellazione i
database di impatto ambientale EcoInvent 2.2.
Parole chiave: scooter elettrico, batteria al litio, magnete permanente, neodimio, Material
Hygiene, Design for Disassembly, Life Cycle Assessment, LCA

IV
NOMENCLATURE
Abbreviations
EV Electric vehicle
PTW Powered two-wheeler
MH Material Hygiene
GHGs Greenhouse Gasses
LCA Life Cycle Assessment
LCI Life Cycle Inventory
LCIA Life Cycle Impact Assessment
ELV End of Life of Vehicle
EoL End of Life
ICE Internal Combustion Engine
ICE-scooter Internal Combustion Engine scooter
E-motor Electric motor
E-scooter Electric scooter
BLDC motor Brushless DC motor
WEEE Waste Electrical and Electronic Equipment

V
TABLE OF CONTENTS
FOREWORD I
ABSTRACT II
RIASSUNTO III
NOMENCLATURE IV
TABLE OF CONTENTS V
LIST OF FIGURES VIII
LIST OF TABLES XI
1 INTRODUCTION 1
1.1 Background 1
1.2 Motivation 2
1.3 Purpose 2
1.4 Scope 3
1.5 Thesis structure 3
2 METHOD 5
2.1 Material Hygiene, a mind-set 5
2.2 Data collection 6
2.3 Methods used to propose recycle scenarios 6
2.4 LCA, Life Cycle Assessment 7
3 ELECTRIC SCOOTER, A CASE STUDY 9
3.1 Scooter, a definition 9
3.2 Description of scooter market 9
3.3 Components and design differences 11
3.4 The new components: lithium battery 14

VI
3.5 The new components: electric motor 16
4 RECYCLING DIRECTIVES AND OPPORTUNITIES 17
4.1 Waste management and recycling directives in EU 17
4.2 End of life of scooters 19
4.2.1 Scooter manufacturers and recycling 19
4.2.2 A waste management investigation 21
4.3 Disposal of the electric powertrain 23
4.3.1 Lithium battery waste management 23
4.3.2 Permanent magnet waste management 25
5 MATERIAL HYGIENE OF AN E-SCOOTER 27
5.1 Material Hygiene, the mind-set 27
5.2 Material Hygiene, E-scooter a case of study 29
5.2.1 Material flow qualitative analysis 29
5.2.2 The method 30
5.3 Material Hygiene, recycling scenarios 33
5.3.1 Lithium manganese oxide recycling scenario 33
5.3.2 Permanent magnet recycling scenario 38
5.3.3 Permanent magnet reusing scenario 39
5.3.4 Copper recycling scenario 42
6 LITERARY REVIEW 43
6.1 Comparison between an electric and a traditional car 43
6.2 Comparison between an electric and a traditional scooter 43
7 LCA, ANALYSIS OF E-SCOOTER LIFECYLE 45
7.1 LCA, description of the method 45
7.2 LCA of an electric scooter 47
7.2.1 Goal 47

VII
7.2.2 Scope 47
7.2.3 Life Cycle Inventory, LCI 48
7.2.4 Life Cycle Impact Assessment, LCA 55
7.2.5 Uncertainties 58
8 ANALYSIS OF RESULTS AND INTERPRETATON 59
8.1 Analysis 59
8.1.1 Life cycle analysis and contribution analysis 59
8.1.2 Benefits of recycling scenarios 66
8.1.3 Sensitivity analysis 68
8.2 Interpretation 69
8.2.1 E-scooter life phases 69
8.2.2 E-scooter weaknesses 69
8.2.3 NdFeB, a Trojan horse for MH 70
9 DISCUSSIONS AND CONCLUSIONS 73
9.1 Discussions 73
9.2 Conclusions 74
10 REFERENCES 75
10.1 Literature references 75
10.2 Web references 78
APPENDIX A 81
A.1 Literature references 81
A.2 Web references 83
APPENDIX B 84
B.1 Uncertainties 84
B.2 LCI of an E-scooter 85
B.3 LCIA, impact of metals involved in recycling scenarios 88

VIII
LIST OF FIGURES
Figure 1.1, Thesis outline 4
Figure 2.1, MH factors 4
Figure 3.1, Internal-combustion-engine scooter sketch (Aprilia SR 50) 12
Figure 3.2, Components and functional groups of an ICE-scooter 12
Figure 3.3, Powertrain component of an E-scooter (Penelope) 13
Figure 3.4, Components and functional groups of an E-scooter 13
Figure 3.5, Physical operation of a lithium-ion battery [18] 14
Figure 3.6, Physical operation of a BLDC motor [21] 16
Figure 4.1, The waste hierarchy 17
Figure 4.2, Recycled pigmented polypropylene parts of a Piaggio scooter 18
Figure 4.3, The E-scooter disposal process flow 22
Figure 4.4, Different recycling opportunities [33] 25
Figure 4.5, Different recycling flows for permanent magnets [34] 25
Figure 5.1, Design freedom in product development [3] 27
Figure 5.2, Qualitative material flow comparison 30
Figure 5.3, Qualitative material flow comparison after improved recycling 30
Figure 5.4, Batrec recycling process flow 34
Figure 5.5, Retriev tech. recycling process flow 35
Figure 5.6, Recupyl recycling process flow 36
Figure 5.7, Umicore recycling process flow 37
Figure 5.8, Recycling process flow proposed for lithium 38
Figure 5.9, Retriev tech. recycling process flow 39
Figure 5.10, CAD of a wheel hub motor [44] 40
Figure 5.11, Motor disassembly scheme and resting loads 41

IX
Figure 7.1, Background and foreground system 48
Figure 7.2, Cut-off model 54
Figure 7.3, System expansion and substitution model for lithium and NdFeB chain
54
Figure 7.4, Lifecycle comparison with contribution of each life phase CML2001
55
Figure 7.5, Lifecycle comparison with the contribution of each life phase EI99
56
Figure 7.6, Improved recycling of E-scooter CML2001 57
Figure 7.7, Improved recycling of E-scooter EI99 57
Figure 8.1, Abiotic depletion life cycle flow 60
Figure 8.2, Global Warming Potential life cycle flow 60
Figure 8.3, Manufacturing impact assessment CML2001 61
Figure 8.4, Manufacturing impact assessment EI99 61
Figure 8.5, Lithium battery contribution analysis – GWP100 62
Figure 8.6, Lithium battery contribution analysis – Water ecotoxicity 62
Figure 8.7, Electric motor contribution analysis – Abiotic depletion 63
Figure 8.8, Electric motor contribution analysis – Water ecotoxicity 63
Figure 8.9, Use phase impact assessment CML 2001 64
Figure 8.10, Use phase impact assessment EI99 64
Figure 8.11, Dispoal impact assessment CML2001 65
Figure 8.12, Disposal impact assessment EI99 65
Figure 8.13, Benefits of the best case scenario CML2001 67
Figure 8.14, Benefits of the best case scenario EI99 68
Figure 8.15, Price share of valuable materials in a wheel hub motor 71
Figure 8.16, Impact share of valuable materials in a wheel hub motor 71
Figure 8.17, Water ecotoxicity of a wheel hub motor with different recycling
approaches 72

X
Figure A.1, Nd mining 81
Figure A.2, NdFeB production chain 82
Figure B.1, Specific abiotic depletion of materials 88
Figure B.2, Specific GWP100 of materials 88
Figure B.3, Specific Water ecotoxicity of materials 88

XI
LIST OF TABLES
Table 3.1, Top ten E-scooter manufacturers 10
Table 3.2, European/Asian market comparison 10
Table 3.3, Performance comparison 11
Table 3.4, Comparison among cathode technologies [18] 15
Table 3.5, Comparison among battery technologies [20] 16
Table 4.1, Recycle/recovery goals for ELV 17
Table 4.2, Collection goals for batteries 17
Table 4.3, Recycle goals for batteries 17
Table 4.4, Li-ion battery recycling companies 23
Table 4.5, Average composition of a lithium battery with cobalt cathode [22] 23
Table 5.1, Relation between MH factors and MH actors 30
Table 5.2, Bill of materials of an E-scooter 31
Table 5.3, Lithium battery recycling companies 32
Table 5.4, Components of a wheel hub motor 38
Table 5.5, Resting load index 39
Table 7.1, Impact categories of CML2001 and their characterization [57] 46
Table 7.2, Impact categories of EI99 and their characterization [57] 46
Table 7.3, Assembly of Aprilia SR 50 CAT [58] 49
Table 7.4, Weight ratios 50
Table 7.5, Percentage bill of materials of the two scooters 50
Table 7.6, Components of a BLDC motor [61] 51
Table 7.7, Materials of a BLDC motor [62] 51
Table 7.8, Lithium manganese oxide, recycling scenario on SimaPro 7.3 53
Table 7.9, NdFeB, recycling scenario on SimaPro 7.3 53

XII
Table 8.1, Impact assessment according to CML2001 59
Table 8.2, Impact assessment according to EI99 59
Table 8.3, Benefits of recycling scenarios – CML2001 66
Table 8.4, Benefits of recycling scenarios – EI99 66
Table 8.5, Benefits of best-case scenario – CML2001 67
Table 8.6, Benefits of best-case scenaio – EI99 67
Table 8.7, Uncertainty factors 69
Table A.1, Solutions for recycling of permanent magnets 83
Table B.1, Uncertainty factor table 84
Table B.2, LCI of a E-motor on SimaPro 7.3 85
Table B.3, LCI of a BLDC-controller on SimaPro 7.3 85
Table B.4, LCI of an E-scooter on SimaPro 7.3 86
Table B.5, Energy consumption for manufacturing according to Honda 2013 data
87
Table B.6, Energy consumption for manufacturing according to Piaggio 2013 data
87

XIII

XIV

1
1 INTRODUCTION
‘We will not stop till every car in the road is electric’ –Elon Musk. This statement has been
pronounced by the CEO of Tesla Motor, one the most famous mass-produced and purpose-
designed electric vehicle automaker [1.W]. Despite the strong advertising content of the previous
quote, what is true is that in future more and more electric vehicles will share road infrastructures
with traditional vehicles.
An electric vehicle, either a car or a scooter, is often presented as a greener alternative to the
traditional mobility. This is true just considering the use-phase emissions but many factors have
to be inspected to depict a complete framework.
With electric vehicles, new materials like permanent magnets, used in the brushless motors, or
lithium, used in the batteries, are introduced in the life cycle of the product.
‘The main interest of EcoDesign is to examine the conditions for and to provide help in creating
a sustainable future by improving recycling, energy savings and products well suited for its
purpose’ –Conrad Luttropp [2.W]. With these words, it is possible to understand the outlook that
has been used to perform the whole study. There are no easy solution nor easy answer to obtain an
environmentally effective design. This study has been conduct to have a clearer view of the electric
mobility as an environmentally effective alternative to internal combustion engine mobility.
1.1 Background
This study is linked to three wide areas. The first one is two-wheeled mobility; the second one is
the introduction of electric vehicles as a more sustainable mean of transport and the third one is
EcoDesign and the Material Hygiene as methods towards a more sustainable approach to product
development.
Cities are becoming more populated, and scooters are gaining captivation as an alternative to cars
[1]. Nevertheless, traditional scooters, especially the ones equipped with the two-stroke engine,
are supposed to be, with their exhausted gases, one of the main causes of air pollution. According
to Environmental Protection Administration, Government of Republic of China, an average two-
stroke engine scooter produces from three to seven times more pollutants, exhaust pollution per
kilometer, than an average 2000 c.c. car [2].
After an examination of either electric cars or electric scooters history, it is interesting to notice
how they do not represent a new product. Both of them, in fact, were considered an alternative to
internal combustion engine vehicles before 20s. During the 90s different driving forces, such as
oil-price raising and environmental concern, led to rediscover of the electric vehicles. In the last
fifteen years, manufactures spent many efforts to produce electric vehicles comparable to
traditional vehicles. Several of the major automakers have electric cars available among their in-
production models.
One of the most powerful design tool towards a greener product is EcoDesign. The main purpose
of EcoDesign is to design a more sustainable product without noteworthy tradeoffs regarding the
product properties and price.
In this study, great importance is given to the work carried out by the EcoDesign group at KTH.
The Ten Golden Rules [3] are seen as a starting point. In this report, a specific field of EcoDesign
gains great relevance: the Material Hygiene as a mindset for recycling of products [4].

2
1.2 Motivation
This master’s thesis has been written within the EcoDesign group at KTH. This work would
become part of different research works regarding the life cycle management, the material
management and the recycling of electric vehicles in comparison with traditional vehicles.
The research motive behind this thesis is to perform a comparison between the life cycle
management of a traditional and an electric vehicle with specific focus on material and energy
flows linked to the different powertrain alternatives.
The mind-set used for this work is Material Hygiene as a tool towards an improved material
management of a product.
The vehicle chosen for the comparison is a scooter. The scooter seems more suitable as a case
study. The comparison is mainly focused on material and energy flows involved in the powertrain
alternatives, and the scooter is a mean of transport that inherently enhances the powertrain. The
weight of the powertrain is a consistent percentage of the total weight of a scooter. Furthermore,
an average scooter does not include the facilities of an average a car. There are fewer materials
involved (no conditioning liquid, fewer electronic devices, etc.) and the bill of materials of the
product is less “diluted” by components not related to the powertrain. In addition, considering the
significant amount of data to analyse the choice to the two-wheeled vehicles is more suitable for
the scope of a master’s thesis.
1.3 Purpose
One purpose of this thesis is to perform a life cycle analysis of the material and energy flows of
an electric scooter in comparison with an internal combustion engine scooter. As it comes out
intuitively, there is a balance, between the advantages (e.g. the zero-emission tail pipe, the higher
efficiency at low speed…) and the disadvantages (e.g. higher manufacturing impact, new materials
involved…) that the electric vehicle brings regarding the material and energy flows.
Another aim of this paper is to consider the life cycle material management of an electric scooter
in order to depict, evaluate and assess recycling scenarios for an electric scooter. The recycling
opportunities for the new materials encompassed in the life cycle are then added to the overall
balance already showed as first purpose of this thesis. The target is to weight the effect of an
improved material management and to draw considerations for the product development.
In other words, this thesis aims to answer to the following research questions:
1. “What is the quantitative balance, from an environmental point of view, between the
benefits and the drawbacks of an electric scooter, regarding the material and the energy
embraced in the product lifecycle?
2. “What are the recycling opportunities for the new materials involved in the life cycle of
an electric scooter and what are the quantitative benefits linked to these recycling
scenarios? Furthermore, which is the role of the designers on those scenarios?”
The choice of the scooter as case study, leads to another research question explored in this thesis:
3. “What is the standard procedure for the disposal of a scooter?”

3
1.4 Scope
This master’s thesis involves many different fields: two-wheeled vehicles, electric mobility,
EcoDesign, recyclability and industrial design. The goal, anyhow, is to have a concrete answer to
the research questions of the previous section.
The vehicle chosen for the comparison between the two-powertrain technologies is a scooter. The
scooter considered is an average electric scooter from the European market. The market boundaries
and the specification of the model chosen are specified further in the paper.
The data employed for the life cycle analysis comparison are from manufacturers, scientific
literature, private databases and personal consultancies. The level of technologies described, the
two average models of scooters, represents models already familiar to the scooter market since at
least one year. Although the recycling scenarios for the new materials are referred to the state-of-
art of the industrial technologies or to processes available only on lab-scale. The data used for the
recycling scenarios are from recycling companies, patent analysis, scientific literature and private
databases. The aim is to assess the recycling opportunities of the product according to the available
technologies whether or not these technologies are then used in industrial processes. The
recycling/reusing chain of a product, needs a certain volume of disposed units to be affordable,
this is currently impossible for electric scooter, and electric vehicles in general, since their
relatively recent appearance in the vehicle market.
1.5 Thesis structure
This thesis is outlined through a scheme, see Figure 1.1. The scheme tries also to let the reader
understand the process flow followed by this work.
After the introduction, the second chapter regards the definition of the methods. The third chapter
explains the case study, there the electric scooter is better defined also in terms of technical
specification and regional boundaries. The fourth chapter describes the recycling background and
the research efforts to depict it. It contains information about the directives and the disposal of
scooters. The fifth chapters treats the Material Hygiene both the theoretical background and the
case study. This chapter leads to the definition of recycling scenarios for the E-scooter. The sixth
chapter presents the literary review regarding other comparison between electric and traditional
alternative. The seventh chapter describes the theoretical background of the LCA and the way that
the method has been applied to the E-scooter. The eighth chapter reports the analysis and the
interpretation of the results of the LCA. The ninth chapter encompasses discussions and
conclusions. The scheme outlines the fact that the workflow is divided in two stages, the first one
of data collection, powered by the material hygiene mind-set, that ends up with the proposal of
recycling scenarios. The second stage is the implementation of the LCA of an electric scooter and
the interpretation of its results.

4
RECYCLING SCENARIOS
CONCLUSIONS and FUTURE WORK
3. SCOOTER,
Case study
4. DIRECTIVES
and RECYCLING
5.MATERIAL HYGIENE
9. DISCUSSIONS AND CONLUSIONS
MATERIAL HYGIENE
6. LITERARY REVIEW
7. LCA8.
ANALYSIS
LCA
1.INTRODUCTION
2.METHOD
Research towards a qualitative
improvement of the E-
scooter life cycle
Quantitative comparison
and quantitative analysis of
the scenarios
Figure 1.1, Thesis outline

5
2 METHOD
This chapter presents the methods used in this thesis. Furthermore, this chapter describes also
the general approach, the mind-set, used to draw the outline of the work.
2.1 Material hygiene, a mind-set
Material Hygiene, MH, as a way to analyse and improve the material management of a product,
represents the most import method encompassed in this work. Although, material hygiene has to
be considered more as a work approach or a general mind-set than a proper method. Material
Hygiene, in fact, denotes a tool for EcoDesign to collect, understand and merge information and
data regarding a specific product toward a more efficient management of the material lifecycle of
the just-defined product. MH can also be used to describe a high level of material efficiency
through the whole life cycle. In this sense, it is possible to state that an efficient material
management of a product increases its MH.
The mind-set defines five factors that actively influence the product MH. See Figure 2.1, see
Chapter 5.
Table 2.1, Material Hygiene factors
MH MIX
Involves the mix of materias used to manufacture a product
MH IDENTIFICATION
Involves an overall knowledge of everything regarding the lifecycle of a product (directive, lifecycle actors, recycling...)
MH RESOURCES
Focuses on the hazarous or the more environmental impacting resources
MH WEIGHT
Focuses on the role played by the weight of the product
MH MAP
Focuses on the role played by the structure of the product

6
The activity of collecting and understanding information and data is part of the mind-set but it can
actually be accomplished with different methods. The methods to use are not part of the mind-set,
and they are left at author’s discretion and experience. Furthermore, the product in itself and the
goal of the study influence the choice of those methods. The methods used in this paper,
encompassed in the material hygiene mind-set are: database research, interviews, patent analysis,
and a Design for Disassembly method.
2.2 Data collection
As first an initial literature research is performed thorough KTHB Primo [3.W], the scientific
search engine of the Royal Institute of Technology. Then, other, more specific, scientific databases
are used, e.g. the IMechE Journal database [4.W], the MechanicalENGINEERINGnet database
[5.W] and the Engineering Village [6.W]. These databases are designed for engineering with the
possibility to define very specific queries.
A peculiar way of conducting the research, especially after the first less detailed study phase, has
been the “snowballing” method [5]. This method consists in finding new articles through reading
reference lists of already read papers. This process increases the knowledge of the subject as a
snowball rolling down a hill increases its volume.
This study involves also the use of interviews with experts or companies related to the life cycle
of scooter. This thesis reports interviews with dismantlers and manufactures to have a general
framework of the disposal of scooters. The outline of the interviews is reported further in this
work, see Chapter 4.
The data collection and the interviews are used according to Material Hygiene mind-set, and
specifically to MH identification, to depict the current EoL framework of an E-scooter, see Chapter
4.
The data collection has been used also to collect the information for the literary review on vehicle
alternative comparisons of chapter 6, see Chapter 6.
2.3 Methods used to propose recycling scenarios
This study aims to assess effective ways to increase the MH of an E-scooter. The chosen way to
do so is to propose recycling scenarios for those materials that are currently not recycled. Hence,
this study treats both recycling technologies and disassembly processes. To interpret and
encompass these recycling technologies into realistic recycling scenarios a patent research and
functional analysis has been conducted. There are different ways of conduct this kind of analysis.
The method used in this work involves four steps:
1. Identify components (or phases) of the invention and their functions;
2. Identify at which step of the process flow each component performs its function;
3. Draw a flow diagram to show the relationships between the components (or phases) of the
recycling treatment and to depict the overall process.
4. Considering separately the input/output flows of disposed product/recycled material and
material/energy needed by the process.
This method is an adaptation made by the author of the functional analysis method developed in
the course “methods and tools for systematic innovation” held at Polytechnic of Milan by Cascini
[6].
The recycling scenarios deal also with Design for Disassembly and disassembly procedures. The
method used to depict disassembly flows is the graphic tool developed by Luttropp [7] for Design
for Disassembly structure, DfDs, the part of Design for Disassembly that treats the product

7
structure. The method is graphical. It defines the concept of describing joints as resting load cases.
Each of these resting loads can be graded, with an ordinal scale, regarding the information, the
equipment, the force and the time needed to “wake up” the resting load. Once each resting load is
waken up the module or the structure is disassembled.
2.4 LCA, life cycle assessment
The method chosen to answer to the quantitative research questions of this paper is the Life Cycle
Assessment, LCA. A quantitative meaning to the comparison between the powertrain technologies
is a primary goal of this work. The reasons of the choice of the LCA as method for this work are:
LCA is a renowned method for quantitative analysis of the life cycle of a product, also in the
product development and in the choice between alternatives [8].
The LCA is a method spread in the academic and industrial world since more than 20 years.
The LCA has an ISO standard (ISO14040) that assures a strong level of repeatability.
Several software help to run LCAs. The software used in this work to run the LCA is
SimaPro7.3 and the data used are mainly from EcoInvent data v2.2 (2010)
The LCA is designed to give an overall interpretation of the lifecycle of a product. It does not
provide just mere quantitative mass balance but it provides directly a measure of the
environmental impact.
Other methods that could accomplish the task of a quantitative flow analysis are Material/Energy
Flow Analysis or Material/Energy Flow Accountings [9]. These methods mostly consist in two
steps: a system definition and a mass/energy balance. These methods provides only mass/energy
balances. Furthermore, system definition and mass/energy balance are actually part of a LCA.
LCA, in fact, encompasses a boundary definition step and the Life Cycle Inventory that mainly
consists in a mass/energy inventory regarding the whole life of the product. As last, these methods
do not have an ISO and they are not as well defined as the LCA. LCA seems more robust and
gives a complete understanding of life cycle. With the LCA the answer to the research question is
more meaningful.
Reliability is discussed for the LCA in relation with the quality of the data within the idea of
“garbage in-garbage out” model. The quality of the results of a method cannot be better than the
quality of the input data that the method uses. In other words, LCA as a model of analysis is
strictly related to the quality of the data and to the goal of the assessments. The matter is further
deepened in the LCA chapter and in the discussions.
Validity is discussed in relation with the spatial (European region) and temporal boundaries (time
horizon of the data involved). This matter too is further deepened in the LCA chapter and in the
discussions.
The second purpose of LCA is to give a validation to the qualitative recycling scenarios depicted
in Material Hygiene analysis. Associating an environmental impact to the different recycling
solutions let the author have a quantitative understanding of the work done within the material
management research. The reliability of this validation is debated in the discussion chapter.

8

9
3 ELECTRIC SCOOTER, A CASE STUDY
This chapter introduces the electric scooter as case study. The following paragraphs present a
definition of the scooter and a description of the market. The description of the market is important
since each market has a product with different features. The market chosen is the European
market. The chapter presents also a description of the components and the basic design of a
scooter.
3.1 Scooter, a definition
The case of this study is the scooter in its two main powertrain technologies, electric and thermic.
First, it is important to give a definition of scooter. The Oxford dictionaries defines the scooter as
follows:
‘A light two-wheeled open motor vehicle on which the driver sits over an enclosed engine with
their legs together and their feet resting on a floorboard.’-Oxford Dictionaries [7.W]
The previous definition involves also a brief description of the standard structure of a scooter.
Another useful efinition is the one of the European vehicle category. In this case study, it is
considered L1 and L2 category scooters:
‘ A two-wheeled vehicle with an engine cylinder capacity in the case of a thermic engine not
exceeding 50 cm3 and whatever the means of propulsion a maximum design speed no exceeding
50 km/h [8.W]. ’
‘A two-wheeled vehicle with an engine cylinder capacity in the case of a thermic engine
exceeding 50 cm³ and whatever the means of propulsion a maximum design speed exceeding
50 km/h [8.W].’
3.2 Description of scooter market
In this report, the market borders are the European ones. This choice is explained in the next
paragraphs and is due to the electric scooter market features.
The circulating park of PTWs in Europe amounted in 2011 to over 36 million of units. In the last
decade, the number of motorcycles and mopeds increases of over 6 million of unit. Year by year
the number of PTWs in Europe were increasing until 2010 when, because of the economic crisis,
the vehicle market fell. Considering the last ten years, the average number of scooters and
motorcycles registered in Europe each year was approximately 2100000 [10].
The European country which produces more motorcycles and scooters is Italy with over 400000
units followed by Germany, 110000, and Spain 95000. What need to be specified is that some
European brands have their production sites in India or China whilst some manufacturers are
Japanese so their production amount in Europe is almost negligible [11, 12].
Considering the top ten sold PTWs of the 2012 [10], seven out of ten models are L1 or L2 category
vehicles. The main manufactures of PTWs up to 125 cc of cylinder capacity are the Italian Piaggio
and Vespa, both part of the Piaggio Group and the Japanese Honda Motors and Yamaha Motors.
The top sold scooters in Europe sell over 14000 units each.

10
To give a quick idea of the electric scooter market the Navigant Research Leaderboard Report
[9.W] concerning electric scooters states that the electric scooter market in Europe is around the
2% of the traditional one. What comes out from the report is that the two main market areas are
Asia Pacific and Western Europe. The two markets, however, have different features. Asian market
account more than 99% of the global sales. The E-scooters sold in Asia Pacific are low-cost
vehicles with relatively few features. To participate in the Asian market these models have to be
price-competitive to the internal combustion engine scooters. The Western European market is the
second world market, even if its volume is dramatically smaller than the Eastern one. The features
of models sold in Europe are different. The market challenge with traditional scooter is played on
another level. In Europe, E-scooters have more features and they can compete as performance with
traditional ones. Although, the electric scooters present in the European market are significantly
more expensive than the ICE ones. In this case plays a role also the green perceived value of the
customer and its sensitivity to less GHG emitting and noise polluting vehicles.
A brief review of the manufactures showed by the report has been performed, see Table 3.1. The
idea is to point out the differences between an average model for the Asian market and one for the
European market. It is worth specifying that Japan is not part of Asian market in this analysis.
Japanese market features are similar to Western European.
COMPANY TARGET
MARKET
COUNTRY PRODUCES also ICE
scooters
Jiangsu Xinri E-Vehicle
Co. [10.W]
ASIAN CHINA NO
Vmoto [11.W] BOTH AUSTRALIA NO
SYM [12.W] EUROPEAN TAIWAN YES
Vectrix [13.W] EUROPEAN USA NO
Terra motors [14.W] EUROPEAN JAPAN NO
Govecs [15.W] EUROPEAN GERMANY NO
Yamaha [16.W] EUROPEAN JAPAN YES
Peugeot [17.W] EUROPEAN FRANCE YES
iO Scooter [18.W] BOTH AUSTRIA NO
BV Nimag (Nimoto)
[19.W]
EUROPEAN NETHERLANDS YES
Table 3.1, Top ten E-scooter manufacturers
It is possible to point out the principal design differences between the two markets, see Table 3.2.
ASPECT EU MARKET MODEL ASIAN MARKET MODEL
Battery technology Lithium Lead acid
Battery recharging time 3-5 h 6-8 h
Weight 100-120 kg 120-140 kg
Maximum speed 50-65 km/h 45 km/h
Table 3.2, European/Asian market comparison

11
There are differences also concerning other specifications like brake technology, energy recovery
technologies, average distance range, etc. These specifications often differ from model to model
[10.W, 11.W, 12.W, 13.W, 14.W, 15.W, 16.W, 17.W, 18.W, 19.W]. Hence, without losing
generality it is possible to assert that the main difference stays in the battery technologies. Lead
batteries from one side let the price be lower but from the other they have less performance
features.
Since the aim of this report is to make a technology comparison between a traditional scooter and
an E-scooter and to evaluate future waste scenarios of new technologies, the average model for the
E-scooter is chosen from the European market. The idea is to give more significance to the
technology competition than to the price one.
Once chosen the representing technology, it seems worth to propose a comparison between
performances and price of European electric scooter and the traditional scooter, see Table 3.3. The
data for the electric scooter are taken from the models designed for the European market listed in
the Table 3.1. The data for the traditional scooter are from the top two model of the European
market [10]. To give more meaning to the economic comparison, considering the average cost in
Europe [20.W] of a litre of petrol (2.04 $) and of a kWh (0.26 $), a fuel cost is provided with the
hypothesis of 50000 km use life expectance, although the comparison is not complete since no
maintenance is accounted.
Table 3.3, Performance comparison
3.3 Components and design differences
This section shows the scooter as a mechanical system composed by mechanical components. It
seems reasonable to present this description to let the reader better understand the topic of the next
chapters.
This section reports the sketch of an average scooter, see Figure 3.1. The model presented is the
Aprilia SR 50, the same used in the LCA further in the paper, see Chapter 7.
At this point seems worth to list the principal components that constitute a traditional scooter, the
components can be collected in functional groups, see Figure 3.2. The functional groups defined
are four: the electronic & electrical system, the motion systems, the structure and the powertrain.
This division is made by the author, other solutions are possible. The groups are linked among
each other.
The electronic & electrical system involves the electric system and its power source, the battery.
The electronic control manages all the electric devices such as turn indicators, horn, lights, etc.
The motion systems group encompasses the steering system, the wheels, the tyres, the suspensions,
the braking system, the transmissions and their subsystems.
The structure group includes the parts designed to give structural solidity to the mean of transport.
The principal parts are the polymeric body, the steel frame, the chassis and the seat.
ASPECT E-SCOOTER ICE-SCOOTER
Recharging spot Home/work plugs Gas stations
Recharging time 3-5 h <10 min
Weight 100-120 kg 90-100 kg
Maximum speed 50-65 km/h 60 km/h
Range 65 km 250 km
Average consumption 3.3 kWh/100km 3.3 l/100km
Price 5400 $ 2700$
Fuel cost over 50000 km 345 $ 3341 $

12
Figure 3.1, Internal-combustion-engine scooter sketch (Aprilia SR 50)
Figure 3.2, Components and functional groups of an ICE-scooter
The last group is the thermic powertrain. The components that take part to this group represent the
power source to the motion. It involves the engine, the tank and the silencer.
1. ELECTRICAL & ELECTRONIC
SYSTEM
-Electronics
- Electric system
-Signalling system
- Battery2. MOTION SYSTEMS
-Steering system
-Wheels and Tyres
- Suspensions
-Breaking system
- Transmission
3. STRUCTURE
-Body
- Chassis
- Frame
- Seat4. POWERTRAIN
-Engine
-Tank
-Silencer
#Number Component
1 Rear
dumper
2 Battery
3 Fork
4 Brake
5 Silencer
6 Engine
7 Fuel tank

13
Figure 3.3, Powertrain components of an E-scooter (Penelope MotoriniZanini)
The picture above is taken from the approval certificate of the model Penelope, an electric scooter
sold by the Italian company MotoriniZanini. This scooter is presented as reference for the LCA,
see Chapter 7.
A strong assumption made in this case study, regarding the comparison between the two
alternatives, is that, for simplicity’s sake, the powertrain is the only difference between the two
technical solutions, see Figure 3.4. The first consequence of this assumption is to not consider the
transmission. The ICE solution inherently need a complex transmission. The Electric solution,
instead, is usually simpler. This study considers a wheel hub motor that have a theoretical 100%
transmission efficiency since it does not actually need a transmission. Hence, the assumption
seems correct.
The electric powertrain group consists in three component: the lithium battery, the electronic
controller and the hub wheel motor.
Figure 3.4, Components and functional groups of an E-scooter
1. ELECTRICALS
-Electric system
-Signalling system
2. MOTION SYSTEMS
-Steering system
-Wheels and Tyres
- Suspensions
-Breaking system
- Transmission
3. STRUCTURE
-Body
- Chassis
- Frame
- Seat
4. POWERTRAIN
-E-motor
-BLDC controller
-Battery

14
The electronic and electrical system group is also changed. The electronic controller is considered
part of the E-powertrain since it is crucial for the E-motor functionality. Furthermore, it is
considerably different from a traditional scooter electronic system. The traditional scooter uses the
fuel tank as energy storage and thermic engine as source of power. The lithium batteries and the
electric motor substitute the previous components in the electric scooter. The relations among the
different functional groups changes (e.g. the battery that powers the electricals is in the powertrain,
etc.) but these assumptions do not affect the results of the study. The idea is to consider in the same
functional group the new components. They are “outsider” parts for the traditional automotive
engineering and they are the ones adding new challenges regarding a proper dismantle and
recycling. It seems worth to have a clearer vision of these new objects. The next paragraphs
describe in short the physical operation of lithium batteries and the brushless electric motors.
3.4 The new components: lithium battery
Sony sold the first lithium-ion battery in 1991. Since then the lithium-ion battery technology has
had a great development. Next paragraphs present a brief description of this technology. The
reference for this section is the work of Dingguo and Xia [18], this section treats the lithium battery
as follows:
Electrochemical process description;
Components;
Performance and comparison;
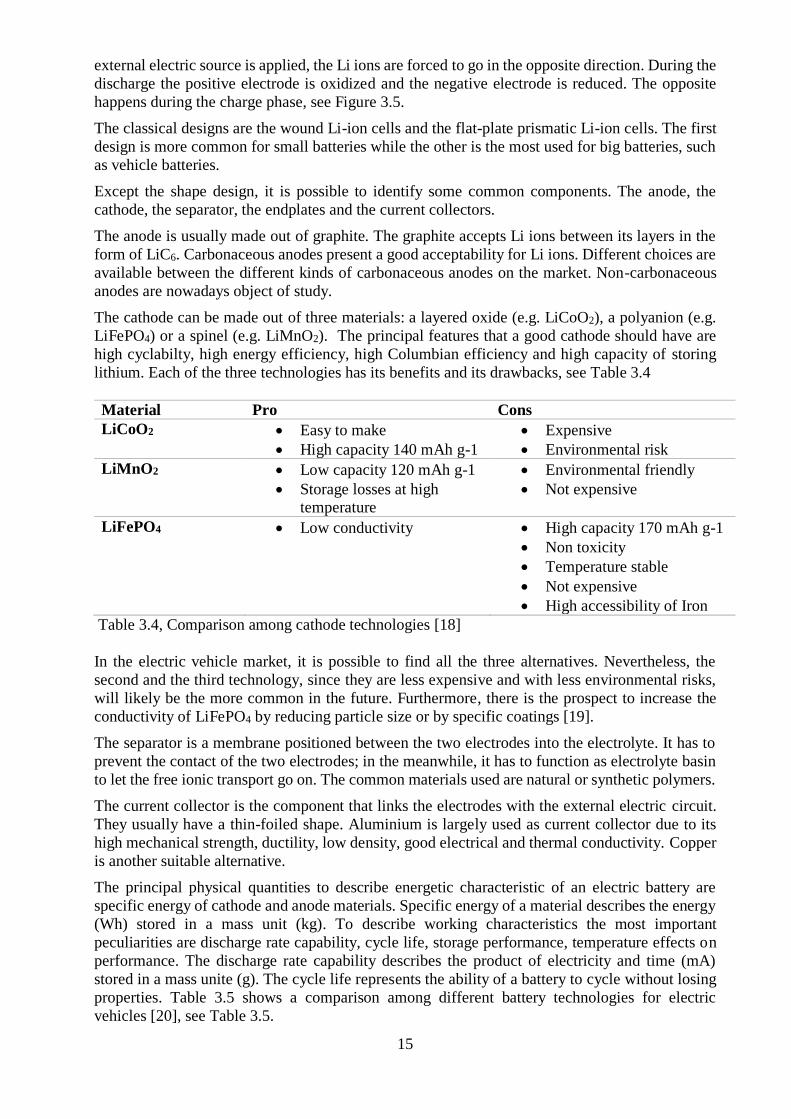
Figure 3.5, Physical operation of a lithium-ion battery [18]
The three main actors of the electrochemical process are the anode, the cathode and the electrolyte.
During the useful phase of a battery, the discharge, the Li ions, Li+, convey the current from the
negative to the positive electrode passing through the electrolyte and the separator. When an
15
external electric source is applied, the Li ions are forced to go in the opposite direction. During the
discharge the positive electrode is oxidized and the negative electrode is reduced. The opposite
happens during the charge phase, see Figure 3.5.
The classical designs are the wound Li-ion cells and the flat-plate prismatic Li-ion cells. The first
design is more common for small batteries while the other is the most used for big batteries, such
as vehicle batteries.
Except the shape design, it is possible to identify some common components. The anode, the
cathode, the separator, the endplates and the current collectors.
The anode is usually made out of graphite. The graphite accepts Li ions between its layers in the
form of LiC6. Carbonaceous anodes present a good acceptability for Li ions. Different choices are
available between the different kinds of carbonaceous anodes on the market. Non-carbonaceous
anodes are nowadays object of study.
The cathode can be made out of three materials: a layered oxide (e.g. LiCoO2), a polyanion (e.g.
LiFePO4) or a spinel (e.g. LiMnO2). The principal features that a good cathode should have are
high cyclabilty, high energy efficiency, high Columbian efficiency and high capacity of storing
lithium. Each of the three technologies has its benefits and its drawbacks, see Table 3.4
Material Pro Cons
LiCoO2 Easy to make
High capacity 140 mAh g-1
Expensive
Environmental risk
LiMnO2 Low capacity 120 mAh g-1
Storage losses at high temperature
Environmental friendly
Not expensive
LiFePO4 Low conductivity High capacity 170 mAh g-1
Non toxicity
Temperature stable
Not expensive
High accessibility of Iron
Table 3.4, Comparison among cathode technologies [18]
In the electric vehicle market, it is possible to find all the three alternatives. Nevertheless, the
second and the third technology, since they are less expensive and with less environmental risks,
will likely be the more common in the future. Furthermore, there is the prospect to increase the
conductivity of LiFePO4 by reducing particle size or by specific coatings [19].
The separator is a membrane positioned between the two electrodes into the electrolyte. It has to
prevent the contact of the two electrodes; in the meanwhile, it has to function as electrolyte basin
to let the free ionic transport go on. The common materials used are natural or synthetic polymers.
The current collector is the component that links the electrodes with the external electric circuit.
They usually have a thin-foiled shape. Aluminium is largely used as current collector due to its
high mechanical strength, ductility, low density, good electrical and thermal conductivity. Copper
is another suitable alternative.
The principal physical quantities to describe energetic characteristic of an electric battery are
specific energy of cathode and anode materials. Specific energy of a material describes the energy
(Wh) stored in a mass unit (kg). To describe working characteristics the most important
peculiarities are discharge rate capability, cycle life, storage performance, temperature effects on
performance. The discharge rate capability describes the product of electricity and time (mA)
stored in a mass unite (g). The cycle life represents the ability of a battery to cycle without losing
properties. Table 3.5 shows a comparison among different battery technologies for electric
vehicles [20], see Table 3.5.

16
Battery tech. Specific energy Cycle life Energy
efficiency
Lead acid 35-50 500-1000 80%
NiCd 40-60 800 75%
NiMH 75-95 750-1200 70%
Li-ion 114 1000 -
Na/S 100 - -
Table 3.5, Comparison among battery technologies [20]
3.5 The new components: electric motor
The electric motor is the unit that provides power to electric scooter. The electric motor is part of
the electric powertrain that also encompasses the power electronics and the controller. There are
different technologies for electric motors are available. Although, the most suitable motor for
electric vehicles is the brushless DC motor. The main feature of this motor is the great specific
power. Great specific power means a lighter motor once the power is decided [21]. Within this
thesis the terms electric motor, E-motor, BLDC motor always denote the brushless DC motor.
The brushless DC motor is actually an AC motor. It is called DC because the motor needs the
alternative current to be variable in frequency and a DC power supply provides that current.
Figure 3.6, Physical operation of a BLDC motor [21]
The Figure 3.6 shows the physical operation, see Figure 3.6. The current flows through the stator
and it gives a momentum to the rotor. The rotor is made of a steel structure and permanent magnets.
The rotor turns clockwise. When the rotor reaches the stator poles, the current in the stator switches
off. The rotor keeps turning because of the inertia. In the meanwhile, the power supply changes
the stator current flow in reverse. The rotor turns clockwise again. The process continues and the
motor keeps transferring mechanical power to the rotor. The principal components of the motor
are the stator, consisting in a steel core and copper windings, the rotor, consisting in a steel core
and NdFeB permanent magnet, the inverter and the sensors.
Roughly simplifying the framework, the permanent magnet is the component that provides one of
the most import features of the brushless DC motor: the power density. As already stated is the
power density of this motor that leads to the weight reduction, a crucial feature for vehicles.

17
4 RECYCLING: DIRECTIVES AND OPPORTUNITIES
This chapter resumes the author efforts to depict the framework in which the end of life of an
electric scooter takes place. The work consists in three main part: a brief analysis of the European
directives involving the EoL of vehicles and the disposal of batteries and accumulators, an
investigation performed through interviews regarding the EoL of scooters and a description of the
current recycling management of the electric powertrain.
4.1 Waste management and recycling directives in EU
This section presents the main lines of the EU directives regarding recycling and EoL of vehicles,
the directives treated are:
Directive 2008/98/EC on waste management;
Directive 2000/53/EC on ELV;
Directive 2006/66/EC on batteries and accumulators;
In the European Union the Directive 2008/98/EC covers the general issue of the waste
management and recycling. This Directive depicts a legal framework for the treatment of waste
among the countries of the Union. The purpose is to protect both the environment and human
health through the right handling of waste [13].
An important point touched by the Directive is the “waste hierarchy”, see Figure 4.1. The “waste
hierarchy” is a central issue of the waste management. This issue is also significant for the product
development. In fact, it is during the “conceptual design” of a product, in the early life of it, where
market analysis are performed and the first resources are allocated, that the engineer or the designer
has the most powerful means to design a product recycle-friendly [3].
Prevention
Reuse
Recycling
Recovery
Disposal
Import
ance
Figure 4.1, the waste hierarchy

18
Another important role is acted by the Commission Communication of 21 December 2005 “aking
sustainable use of resources forward: A Thematic Strategy on the prevention and recycling of
waste” [14]. This communication represents a list of guidelines for the members of EU towards a
more effective and sustainable waste management. The objectives to achieve were encompassed
in seven points
1. Implementation and enforcement of existing EU waste legislation
2. Simplification and modernisation
3. Introducing life-cycle thinking in waste policy
4. Waste prevention
5. Improving the knowledge base
6. Development of recycling standards
7. Further elaboration of the EU’s recycling policy
In 2000 the EU approved a directive about the end of life of vehicles [15]. The directive concerns
vehicles with at least three wheels, so, scooters, and two-wheeled vehicles in general, are not
affected. The directive pointed out some goals to be persecuted during the following years.
Interesting to underscore is the recovery/reuse weight ratio and the recycle/reuse weight ratio
thresholds to reach in the future, see Table 4.1. The mainlines of the directive are:
Limit waste production
Organise waste collection
Organise waste treatment
Prioritise the reuse and recovery of waste
Facilitate dismantling through
information on components and
materials
Evaluate progress made through
implementation reports
Table 4.1, recovery/recycle goals for ELV
A concern proper of vehicles is the disposal of spent batteries and accumulators. Traditional
vehicles contain lead batteries. Lead batteries, as a well-known technology, have an efficient
collection and recycling chain [16]. It is interesting to underscore, though, that electric vehicles
contain lithium batteries. Lithium batteries as a relatively new technology do not have an efficient
recycling chain.
The European directive concerning the spent batteries and accumulators is the directive
2006/66/EC [17]. This directive brings an important change from legislation point of view. The
new directive, in fact, regards all kind of batteries and accumulators, and not only the hazardous
ones (the batteries containing mercury, lead or cadmium). Interesting are the collection and
recycling rate thresholds that each Member State shall achieve in the next years, see Table 4.2,
4.3.
Table 4.3, recycle goals for batteries
Table 4.2, collection goals for batteries
year %of
recovery/reuse
%of
recycle/reuse
2006 85 80
2015 95 85
year %of collection
2012 25
2016 45
year %of coll.(PbA) %of coll.(NiCd) %of coll.(Oth.)
2011 65 75 50

19
4.2 End of life of scooters
The end of life of scooters is an interesting case study. As written in the previous paragraphs the
European directive ELV regards only vehicles with at least three wheels. Hence, about the disposal
of scooters there is not legal responsibility of the manufacturers as for the cars.
The investigation of this field of study is performed in three parts. First is reported the position of
the ACEM, the body representing both the major manufactures and the national two-wheeler
associations. Then information from the yearly environmental reports of several manufacturers are
presented. Finally, the result of interviews with vehicle disposal companies are reported to depict
how scooters are currently handled. This section mainly involves the ICE-scooter. The E-scooter
is “too new” to have enough material for a proper investigation.
4.2.1 Scooter manufacturers and recycling
The ACEM [21.W], the Motorcycle Industry in Europe, is an Association constituted by 18
national associations and 14 powered-two-wheeler, PWT, manufactures. ACEM was instituted in
1994 by merging two professional bodies the COLIMO (Comité de Liason de l’Industrie du
Motocycle) founded in 1962 and ACEM (Association des Constructeurs Européens de
Motocycles) founded in 1990. The ACEM manufactures give jobs to more than 127000 people
and the yearly turnover of the members of ACEM amounted to 26 billion € in 2010. The ACEM
manufacturers hold up to 95% share of the European PTW market. The ACEM gives its own
answer to End-of-life issue regarding the PTW [22.W]. ACEM asserts that the End-of-life of
PTWs represents a non-existing issue in the EU waste management discussion. The reasons that
ACEM presents to justify the previous statement are:
In the EU states there are no reported case of illegal dumping of dismissed PTWs.
Old PTWs are still an object of value. Vintage scooters are articles suitable for collection.
The second hand spare parts are object of a well-established market. This also contributes
to limit the waste.
PTWs are designed for easy accessibility and maintenance.
PTWs rider groups and sport associations promote the reuse market.
ACEM analysis shows that the 75% by weight of an average PTW is reused through high-
value recycling as spare parts. The 25% is disposed as waste.
An ACEM survey reveals that almost any PTW is returned to the dealer/manufacturer
circuit for the disposal.
An ACEM survey reveals that the ratio of dismissed PTWs over dismissed cars treated by
the dismantling companies is 1 to 150/400. The difference is two orders of magnitude.
A review of the environmental reports of the two most valuable scooter manufacturers in Europe
has been conducted. According to ACEM among the top 10 sold motorcycle models three are
manufactured by Piaggio Group and four by Honda. The environmental report of Honda and
Piaggio are analysed for what concerns the waste management of their products.
From the review of the 2013 Honda environmental report, some interesting features emerge [11].
First, there are interesting statements among the “environmental issues for Japan”. Honda motor
co. declares to reduce waste per unit of revenue by 5% by fiscal year 2014. More specifically
Honda motor co. declares to maintain the zero landfill strategy and to involve its manufacturing
holdings. The Company is also aiming to increase the effective recycle of motorcycle up to 95%.
In the report there is also a section dedicate to waste management and recycling, the most important issues are:
Regarding the 3Rs (reduce, reuse, recycle) Honda motor co. claims to adopt a 3R pre-
assessment system during the first stages of the product development. Classical measures

20
are making lighter vehicles, use recycled materials, disassemble-friendly design and
product labelling. The 3R pre-assessment system has been adopted for the design of PTWs
since 1992.
Size and weight reduction is taking into account. The reduced gear oil capacity by 20%
and the reduced use of radiant coolant by 20% of the PCX scooter is the result of the weight
reduction purposed design.
As already stated in the “environmental issues for Japan” the aim is to reach the threshold
of 95% of recyclability rate for motorcycle, calculated with the Japanese directive.
An interesting issue of Honda motor co. is the “voluntary initiatives to recycle
motorcycles”. Since 1st October 2004, Honda and other Japanese manufactures started a
voluntary recycling initiative that continues until today. It represents the first voluntary
attempt of this kind in the motorcycle industry. The results of the initiative during the 2013
were that 1724 products, the 58% of the total amount collected, were Honda products. The
recycling rate for these products was 92.4% on weight, an increase of 4.6% points in
respect to the previous year.
Figure 4.2, Recycled pigmented polypropylene parts of a Piaggio scooter [12].
In the paragraph is presented a brief analysis of the 2013 corporate social responsibility report of
Piaggio [12]. The main aspect to underscore are:
In 2007, Piaggio performed a recycle analysis of its products according to the ISO 22628.
The average recycling rate was around 90%, higher than the 85% required by the car
directive at that time.
In the vehicle is endorsed the use of recycled pigmented polypropylene for the parts like
footboards, seat, etc., see Figure 4.2. The report states that the plastic body represents the
10% of the whole scooter weight. The pigmented polypropylene, that could be recycled,
represents the 70% of the plastic body.
“Re-Produced” project. The “Re-Produced” project involves the recycling of plastic
materials usually used for thermal recovery. A new material called Plasmix is made out of
the plastic waste.
4.2.2 A waste management investigation
To depict a framework of the end-of-life of the scooters several interviews through phones and
emails have been conducted. The companies chosen are from the centre-north of Italy. The reason
is the high level of diffusion and use of the two wheelers in that area. According to ACEM, the
European association of motorcycle manufactures, Italy is historically the European country with
more two wheelers registered and that produces more motorcycles and scooters. Piaggio Group,
the main European two-wheeler producer, is Italian.

21
The companies involved in the investigation are three dismantle companies and one manufacturer
[23.W, 24.W, 25.W, 26.W]. The choice to include a manufacturer is to reach a wider framework
of the topic.
The most frequently asked question were:
1. What is the normal procedure for the acceptance of a scooter? What is the difference with
a car?
2. Which is the disassembly process flow?
3. Have you ever treated an electric scooter? How would you treat it, in case?
To the first question, the answer was very similar among the four parties. The normal procedure
is to receive the powered two wheeler, PTW, like a standard car. The first operation is to accept
the vehicle and to release a certification to hold harmless the last owner. From that moment on,
the scooter ends its life as a mean of transport and starts the new one as waste. For the car, the
dismantler is obliged to accept to dispose the vehicle without any costs but taxes and the
transportation. For the PTWs the decision is up to the dismantler. Usually the same rule is applied.
This is also linked to the profitable market of the spare parts [23.W, 25.W]. It can happen that the
reason of the disposal is an accident and the scooter is so damaged that the only residual value is
represented by the materials to recycle. The dismantler in that case can apply an extra charge
[26.W].
The process for the disassembly is divided in three steps, see Figure 4.3:
hazardous component treatment;
disassembly of valuable parts;
safe stock.
The hazardous component treatment consists in the removal of batteries, fluids, oils and fuel.
Before this treatment, the scooter is a hazardous waste. It contains fluids with high environmental
risk. The first step is the removal of the battery and the safe stock of it. The safe stock is in a tin
container to avoid any fluid loss. The second step is the removal of the fuel. The fuel can be easily
reused. The third step is the removal of the engine oil, transmission oil and brake fluid. These
fluids have to be safe stocked in tin containers. There could be a fourth step for the removal of the
oil filter. It depends if the engine meant to be reused or disposed. For disposed batteries and waste
oils, there are national disposal unions. The lead of the batteries is recycled. The 95% of the lead
in the vehicle battery market is secondary [27.W]. The oils are recycled or thermic recovered
[28.W].
The second stage is the disassembly of valuable parts. The scooter parts have different levels of
value. The most valuable are the spare parts for the spare part market. The spare parts represent a
high level of reuse of disposed material.
“The spare part market represents the only remunerative reuse/recycle method of the entire
disposal chain of a vehicle” – Autodemolizioni Busche [23.W].
With this statement, a dismantler wanted to underscore that often the value of a vehicle for the
recycled material market is not even enough to cover the manual work for the disassembly whilst
the spare market is a profitable market. After this step, there is the disassembly of the cost-effective
material for recycling. These materials can be divided in metals, polymers and tyres. The more
important metals for recycling are copper, aluminium and magnesium. For the polymers there are
two option the recycling or the thermal recovery. The tyres too have a specific recycle union for
their recycling or their thermal recovery [29.W].
The dismantler after the disassembly performs a volume reduction of the different materials. The
dismantler performs also a volume reduction of what remains from the second stage. Each group
of materials waits in a safe stock until it leaves the dismantle company for following

22
recycle/recovery treatments. In addition, the residual car body is stocked waiting for
shredding/sorting treatment.
Key:
Hazardous material treament
Disposedscooter
Battery
Engine oilTransmission oil
Brake fluid
Fuel
Recycling thorough national disposal
union
Recycling/Recoverig thorough national
disposal union
Re-use
Disassembly
Spare parts
Metal-sorting-driven disassembly
tyres
Re-use through spare part market
Volume reduction
Recycling/Recoverig through national
disposal union
Recycling/Recoverig through recycling
company
Polymer-sorting-driven disassembly
Volume reductionRecycling/Recoverig
through recycling company
Residual car body
Safe stock
Safe stock
Safe stock
Volume reduction
Recycling/Recovering through
shredding and sorting
EoL substepRecycling/Disposal solution
EoL step
Figure 4.3, the E-scooter disposal process flow
Among the three dismantlers interviewed, no one has ever treated an electric scooter. To the
question “What would you do if?”, the answers have been similar. The main differences between
the two designs are the lithium battery and the electric motor. The lithium battery is removed in
the first stage as a standard battery. Therefore, from the dismantler point of view the removal is
conducted in the same way.

23
“The electric motor actually increases the value of an electric scooter compared to a traditional
scooter, at least because of the copper. It would probably be easier to sell than a thermic
engine” –Ecostrada [26.W].
This statement underscores the fact that the E-scooter actually includes more valuable materials
than a traditional scooter. In the most probable scenario depicted, the dismantler disassembles the
E-motor during the second stage of the process flow and sells it to a metal recycle company. At
the moment the interviewed dismantlers do not treat printed board circutis, PCBs, part of the
controllers of an E-motor. The PCBs contain small amounts of precious materials like gold. They
state that whether it is economical worth they would treat them [23.W].
4.3 Disposal of the electric powertrain
This section explains how the management of the electric powertrain takes place.
4.3.1 Lithium battery waste management
As already mentioned in the third chapter, there is a European directive [17] regarding the spent
battery management. This directive involves also the management of spent lithium batteries. An
important issue of the directive is that the waste management of batteries is under producers’
responsibility. EU member countries have to set up the waste collection but it is up to producers
to run the collecting system and take care of the proper disposal.
The lithium battery is a relatively new technology. The collection system has been implemented
in all European countries. The treatment implants, instead, are not equally distributed. In Italy, for
example, there are still not plants for the proper disposal of lithium accumulators. Nowadays, the
batteries are collected and then they are sent to mainly Germany and Switzerland for the disposal
and recycling [27.W].
According to Georgi-Maschler, T. et al. [21] the collection rate of lithium batteries in the EU in
2007 was just the 3% whilst in Germany in 2008 9%. The collection rate of a disposed product is
the ratio between the disposed units and the sold units of that product over a certain period.
However, the collection rate is expected to increase rapidly since the main share of lithium
batteries was sold in the last 10 years.
The recycle chain of disposed lithium batteries is still not well defined. There are different
technologies and process flows applied all around the world to treat these batteries, see Table 4.4.
Company websites and scientific literature have been the main tools to collect information.
Company Location Technology Li
recovery
Other
metals
References
Batrec Switzerland Pyrometallurgical NO Steel, Ni,
Co
[22, 23, 24, 30.W]
Retriev
Tech.
USA Hydrometallurgical YES Al, Cu, Co [22, 23, 24, 31.W]
Recupyl France Hydrometallurgical YES Steel, Cu,
Co
[22, 23, 24, 32.W]
Umicore Belgium Pyrometallurgical NO Ni, Cu,
Co, Slag
[22, 23, 24, 33.W]
Table 4.4, Li-ion battery recycling companies

24
During the last ten years, a strong driving force towards the recycling has been the value of some
materials. Considering the average composition of a lithium battery, see Table 4.5, with the cobalt
cathode the price in terms of materials is between 4000-6000€/ton [22]. The 80% of the total price
is actually the cobalt, that by itself has a value between 3000-4000€/ton. This is why most
processes are mainly focused on the recycling of valuable metals like cobalt or nickel.
Battery component Mass-%
Casing (Aluminum) 20-25
Cathode (LiCoO2) 25-30
Anode (graphite) 14-19
Electrolyte 10-15
Copper electrode foil 5-9
Aluminum electrode foil 5-7
Separators (polymers) -
Table 4.5, Average composition of a lithium battery with cobalt cathode [22]
Nevertheless is possible to underscore some driving forces that are gaining more importance in the
lithium recycle framework:
Regulations: European directive 2006/66/EC is giving energy to collection and recycling. The directive states that from September 2011 the recycle content of a lithium battery has
to be at least the 50%. The regulations states also that the collection level to be reached
within September 2016 is 45%.
Lithium market increasing: The lithium market has enormous potentiality. At the moment
lithium batteries are the most suitable for portable technologies, such as laptop or
smartphones, and for the full electric vehicles. Hence, from this point of view is important
to improve the recycle chain to avoid the introduction of virgin material in the market.
4.3.2 Permanent magnet waste management
The NdFeB permanent magnet is an unknown component for the traditional vehicle life cycle. The
neodymium has a considerable environmental impact, the mining of neodymium leads to
radioactive dust [25], a complete review of the neodymium life cycle, the same used for the LCA,
see chapter 7, is reported in the appendix, see Appendix A.1. Furthermore, neodymium is a
peculiar case of one-country resource, since over the 90% of neodymium comes from China [26].
Considering the increasing need of brushless electric motors, the environmental impact of rare
earth element mining and the China control over the world reserves the recycling of this material
becomes crucial [27, 28].
The permanent magnets are made of an alloy of neodymium, iron and boron. The most important
material of the alloy is the rare earth neodymium. Neodymium, as all the other rare earths, is
mainly mined in China. According USGS national minerals information, China owns the 40% of
the world rare earth element reserves and the 91% production market share [34.W]. There are
different mining sites in China. The biggest ones are Sichuan and Bayan-Obo in the Inner
Mongolia [29]. According different studies Bayan-Obo is actually, the most prolific, holding
around the 50% of the Chinese production [30].
As already stated in the previous paragraph the recycle of rare earth elements, REEs, is becoming
crucial. However, the level of recycling is still very low. The implementation level of the recycling
technologies is still at a lab-scale [31]. Nowadays, the level of recycling is less than 1% [32]. Jones
et al. [33] discriminate among three different recycling perspectives. The first is the direct recycle
of pre-consumer WEEE manufacturing scrap, the urban mining as the possibility to see the urban
waste as a source of REEs, and the landfill mining of residues containing WEEEs scrap.

25
Primary oresPrimary material or
recyclatesMaterials,
alloysProducts/goods
Residues
End-of-life products
Landfill
recycling
Urban mining
Landfill mining
Figure 4.4, different recycling opportunities [33]
Focusing on permanent magnet, K. Binnemans et al. [34] define three different flows. One is for
magnet manufacturing; one is for disposed WEEE and another one for large magnets from wind
turbines and electric vehicles. The manufacturing actually produces a large amount of scrap,
almost the 30%, but the recycling is effective. For long time, though, the recycling during the
production was the only kind of recycling of REEs [35].
Magnets in products
Basic REE alloy for magnets
End-of-life big magnets
WEEE magnets
Manufacturing swarf
Collected REE-containing recyclates
Figure 4.5, different recycling flows for permanent magnets [34]
Also involving the case of electric scooter, a very interesting approach is the direct reuse of
magnets in their original shape. K. Binnemans et al. think that this could represents the best
alternative for large electric motors used in wind turbines, industrial machines and electric
vehicles. However, this kind of reuse is not currently available. The number of electric vehicles or
E-scooters is not enough to build a proper reuse chain. First, there must be a strong penetration of
the vehicle market by the EVs, and then there will be another time gap linked to the long service
period of these devices.
Hard disk drives, HDDs, present in the WEEE are at moment the widest source of permanent
magnets. Currently, the procedure does not include a disassembly pre-step for HDDs. The WEEEs
are usually shredded. After the shredding is very hard to sort ferrous powder and NdFeB powder
because of the strong magnetic properties of the neodymium. The following sorting operations
consist in a series of physical treatments. It let sort mainly ferrous materials, aluminum, copper
and plastics. The most advanced procedures can separate valuable materials like lead, nickel or
precious metals trough smelting. In these processes, REEs still are not treated. They become part
of the smelter slags, not recoverable in the nowadays recycle processes. The pre-step for the

26
disassembly remains an issue. Further information on the recycling opportunities of neodymium
are presented in the appendix, see Appendix A.2.

27
5 MATERIAL HYGIENE
The Material Hygiene is a mind-set developed by the EcoDesign staff at KTH. This mind-set helped
and suggested the whole research topic of this report.
5.1 Material Hygiene, the mind-set
Material Hygiene is a mind-set aimed to improve the recycling of materials throughout the product
life cycle. The name of Material Hygiene has been chosen as an “evocative” name. The authors
wanted to recall a metaphor for the treatment of provisions. Meat and vegetable lifecycle requires
to preserve a cold chain to maintain high hygienic standards from the producers to the last users,
to keep information about the origin of a product throughout the whole food life, etc. [4]. In the
same way, the material hygiene aims towards a purpose-recycled mind-set that attempts to
preserve a high level of effective recyclability during the whole product life cycle. The definition
of Material Hygiene proposed by the KTH EcoDesign research group is:
MH is to, in every step of the product life cycle to act towards larger amounts
of useful material from recycling, on the same quality level as virgin material.
MH represents a tool to keep the recycling to a high level. High levels of recycling mean high
effectiveness of material use. Furthermore, the MH mind-set should be encompassed in the early
stages of the product development where there is more design freedom, see Figure 5.1.
Figure 5.1, Design freedom in product development [3]
MH represents a tool for material management. As a tool, MH aims to build a virtuous chain of
material production/consumption/recycling.
Concerning the waste management, the three procedures of dismantling, shredding and sorting are
often seen as alternatives. MH underlines the difference and the conflict between these procedures.
The shredding and the downstream sorting, the most common process flow at the moment for
WEEE, is the cause of the loss of valuable resources. The dismantling and the upstream sorting
represents an alternative process flow at a higher MH level. MH always considers reuse and
remanufacturing.
MH, as an evolution of the ten golden rules for Ecodesign, defines more areas of interest. The next
paragraphs show these factors.
MH mix. The first issue is the use of materials. MH first position is to decrease the material involved in the project. However, this first statement leads to different consequences. More

28
materials involved in the material mix could lead to lower weight, crucial parameter for
automotive consumptions. Another strong design issue is to keep materials as separate as
possible towards an easier sorting. More materials involved in the material mix could lead
to a more disassemble-friendly product.
MH identification. MH aims to let, not only the material chain, but also the information chain unbroken throughout the lifecycle of the product. The analysis of this information
chain runs on two levels. The first level aims to figure out what kind of information is
transmitted. The second level aims to figure out how the person/machine on charge of the
product interprets this information. For metal sorting, for example, the information
transmitted by the material is usually a physical property. The responsible of sorting, e.g.
a density-based filter, reads the physical “information”. For other materials, like hazardous
fluids, a pre-treatment is required.
MH resources. Often in the bill of materials of product, there are hazardous materials. These materials have to be handled with care. There are different approaches to deal with
these materials. Lead batteries, e.g., have to be recycled according to a specific directive.
The recycle chain of lead is one of the more efficient among the metal recycling chains.
The RoHS [36] is a directive that states weight percentage thresholds for some hazardous
materials. RoHS, as MH, involves material management. Nevertheless, the main difference
between RoHS and MH is that RoHS attempts to keep out some materials of the product
lifecycle while MH attempts to keep some other materials in the lifecycle product as long
as possible.
MH weight. As already said, weight could be crucial in automotive. Sometime, although,
weight or material saving can go against an easy disassembly. More weight can lead to a
disassemble-friendly product. For MH is not just important the amount of material that you
save in the first life phase of a product but it is also important what you can recover
afterwards.
MH map. The MH map is a pre requisite of the MH mind set. A more efficient recycling or disassembly of a product is often achievable with small design changes. A clear idea of
the basic product structure is crucial.
According to the MH there are six principal actors that play an active role in the material
management of a product:
Designers. They have a primary impact on the material mix choice and the Design for
Disassembly solutions.
Purchasers of the manufacturing companies. They have a primary impact on the material
mix choice. They have to balance, together with designers, the cost of materials with the
recycling thresholds imposed by the EU directives.
Retailers. According to EU directives WEEE and ELV, retailers have to support the
recycling costs. They have the opportunity and the duty to keep the MH chain unbroken.
Recycling costs might decrease with an effective material management.
Consumers. They have the opportunity and the duty to preserve the MH chain with a
proper handling of the disposed products.
Recyclers. They have a primary impact on the value of the recycled material. Their work
acts downstream the work of the designers, since the efficiency of the recycling is
dependent to the disassembly-friendly design of a product. Although, current recycling
processes have a strong potential: recycling degree of technology is still far from the
manufacturing.
Managers and Owners of manufacturing companies. Since their dominant position on the
strategic choices of the company, they have to understand fully the value of disposed
material.

29
The five factors indicate five areas that directly influence the Material Hygiene of a product. In
the same way, the six actors indicate six stakeholders that affect the material management
throughout the life cycle. It possible to relate these two lists considering the role played by the
most important actors on each factor, see Table 5.1.
Designers Recyclers Users Managers
MH MIX +++ ++ - +
MH RESOURCES ++ ++ ++ ++
MH IDENTIFICATION ++ ++ + +
MH WEIGHT ++ ++ - -
MH MAP +++ + - -
Table 5.1, Relation between MH factors and MH actors
5.2 Material Hygiene, E-scooter as case study
The aim of this section is to assess different ways to increase the MH of an electric scooter. The
first step related to the analysis of the E-scooter is to point out the qualitative flow of material
involved in the life cycle. The chapter 4 shows the current level of recycling of the studied product.
The first goal of the material hygiene is to get a high level of material efficiency through a proper
material management. The qualitative graph hypothesized by the author is meant to clarify the
purpose of a proper material management. In the graphs is also reported the qualitative balance of
an ICE-scooter for comparison.
5.2.1 Material flow qualitative analysis
The first goal of the material flow quantitative analysis is to resume all the information collected
in the previous chapter, see Chapter 4. The knowledge already presented about the current waste
management of a scooter lets the author have a clearer idea of which are the materials and the
components which require a higher material hygiene. The material flow analysis allows a graphical
understanding of the aim of the Material Hygiene.
The material use is higher in the first phase, materials are, in fact, needed to manufacture and
assemble the product. The material use of the electric alternative is assumed higher due to the new
materials involved in the powertrain.
During the use phase, the material consumption of the two alternative is similar. The electric
vehicle has to change the lithium batteries, heavy and containing different rare materials, the
thermic scooter incurs in more maintenance of the “hot” components. In addition, the lead battery
of the traditional scooter, is expected to last less than the lithium battery of an electric scooter.
The end of life of E-scooters does not include the recycling of permanent magnet and lithium.
Other materials like aluminium and steel are recycled. The recycle rate of E-scooter is lower than
the one of an ICE-scooter. Therefore, the “use” of material in the end of life of E-scooter is less
effective.
In the qualitative comparison proposed, see Figure 5.2, the materials involved in the manufacturing
and maintenance are considered “embedded” in the product lifecycle. Recycling in end of life is a
way to keep these materials still embedded in the system.

30
Use phase EndofLifeManfucturing
E-scooter
ICE-scooter
Material embedded in
recycling chain
Material loss after recycling
Material loss after recycling
Figure 5.2, Qualitative material flow comparison
An efficient waste management means high recycling/reusing rates of the disposed product. High
recycling rates improve the material use of the E-scooter. What just stated is one of the, already
mentioned, purposes of this master’s thesis. See Figure 5.3.
Figure 5.3, Qualitative material flow comparison after improved recycling
5.2.2 The method
To achieve an improvement on material use different recycling scenarios regarding the electric
powertrain are hypothesised. The electric powertrain, in fact, is the new mechanical system that
currently is not involved in a recycle chain, according to the investigation of chapter 4, see Chapter
4. The method consists in:
Decide which are the MH actors more involved in the recycling scenario according to the
scope of this work.
Define which components and materials are the target of the improved material
management.
Depict the final scenarios according to the chosen materials and the scope of MH actors.
The principal features that the designed recycling scenarios have to embody are:
Reasonableness. The recycling scenario has to be plausible. There must be scientific evidences of the feasibility of this process;
Use phase EndofLifeManfucturing
E-scooter
ICE-scooterMaterial embedded in
recycling chain
Material loss after recycling
Material loss after
IMPROVED recycling

31
Measurability. The recycling scenario has to be quantifiable. The level of detail has to allow the author to assess the overall impact assessment of the scenario;
High level of material use. The recycling scenario’s first aim is to have a high level of
material use.
The three stakeholders more involved by this study are the managers of the companies, the
recyclers and the designers.
The managers of the companies share the biggest responsibility to improve the recycling of their
products according with a larger market penetration of the electric vehicles. Nowadays,
neodymium magnets, for example, are not recycled because the amount of disposed electric cars
or scooters is still too low to build up an efficient recycling chain. Nevertheless, it is responsibility
of the owners to understand the value of the material. A feature of the MH is that
‘Owners and company executives should see material as a second, different kind of share
capital. If material is seen as a bank loan then the losses in recycling can be regarded as interest
charge’ (J. Johansson on MH, 2006).
To assess the statement that the material embedded in the life cycle of the product is a shared
capital, the author presents a bill of materials on electric scooter see Table 5.2. The data are from
the literature and from the manufactures. This bill of material is a part of the inventory of the LCA
of an electric scooter presented in the next chapters, see Chapter 7.
Together with the raw bill of materials is presented also a rough estimation of the price of each
material involved. The total value computed, 343 $, is representative of the value as disposed E-
scooter. The traditional scooter, with the same material prices $/t, has a total raw material value of
93$. This comparison shows the higher inner value of the E-scooter. The permanent magnet value
considers it suitable for direct reusing.
material weight (kg) price $/t $/product $% references steel 40.8 380 15.50 4.52% [35.W]
copper 7.68 6995 53.72 15.65% [35.W]
nickel 0.141 19300 2.72 0.79% [35.W]
aluminium 25.1 1823 45.76 13.33% [35.W] polyethylene 4.94 1639 8.10 2.36% [36.W]
polypropylene 12.3 1406 17.29 5.04% [36.W]
polyvinylchloride 2.06 440 0.91 0.26% [37.W]
synthetic rubber 4.96 410.55 2.04 0.59% [38.W] alkyd paint 0.459 - - - -
lead 0.04 2084 0.08 0.02% [35.W]
gold 0.000512 40053000 20.51 5.97% [39.W]
zinc 0.739 2073 1.53 0.45% [35.W] silver 0.0016 602500 0.96 0.28% [39.W]
LiMnO 3.91 20000 78.20 22.78% [40.W]
NdFeB 0.48 200000 96.00 27.96% [41.W]
others 2.39 - - - - total 106 343.32 100.00%
Table 5.2, Bill of materials of an E-scooter

32
According to Autodemolizioni Brusche, one of the company interviewed, the labour cost of a
complete dismantling, considering also the treatment of the hazardous fluids, of a vehicle is around
70€ (c.ca 95$). As already stated, without the market of the second hand spare parts the recycling
of an ICE scooter is not economical worth.
The E-scooter introduces new challenges and new environmental loads but it also has a higher
inner value that could lead to economical-worthy recycle chain.
This work focuses on three materials. The NdFeB magnets, the lithium manganese oxide and the
copper. These three materials share over 60% of the EoL value of the product while they constitute
just the 11% of the total weight. The NdFeB is not recycled at the moment. The recycling of the
lithium manganese oxide is a rare exception of in the normal procedures that usually do not recycle
lithium. The copper is recycled, but it is usually recycled downstream a shredding procedure
through handpicking or automatic separation. Since the increased amount of copper in the electric
alternative (almost seven times more than the traditional scooter), also a more efficient recycling
procedure for copper is matter of study.
Once pointed out which are the most valuable materials on which the stakeholders should focus.
The recycling scenarios are described within the scopes of the two stakeholders more involved in
recycling procedures: the recyclers and the designers. For this work has been considered scope of
the recyclers all the recycling procedures that act downstream the disposal and are not specifically
design-dependant. These scenarios are linked to state of art of the recycling technologies and are
linked the idea that the
“Current recycling process has a lot of potential for industrialization; still recycling is far from
reaching the level of manufacturing” (J. Johansson on MH, 2006).
From this point of view, the recycling processes proposed are:
1. Lithium battery recycling flow. The lithium battery recycling flow depicted comes
downstream a patent analysis of the most used technologies on the market for the disposal
of lithium accumulators. The cathode material recycled according to process step is the
lithium manganese oxide (LiMnO2). There is another cathode technology common
nowadays, LiFePO4, although, the choice has been made because more reliable data were
available for LiMnO2 cathode, especially for the LCA.
2. Neodymium recycling flow. The recycling flow for permanent magnet of electric motor
that is hypothesised comes downstream a patent analysis. It is important to point out that
whilst the patents linked to the lithium battery are used on industrial scale, nowadays the
patents linked to the recycling of permanent magnets are just used on a laboratory scale.
For this thesis has been considered scope of the designers all the recycling procedures that are
strongly design-dependant. A classic example of design-dependant procedure is the disassembly.
The recycling scenario proposed linked to the disassembly is:
3. Permanent magnet reuse flow. The reuse flow for permanent magnet consists in sequence
of steps for the disassembly of the wheel hub motor and the extraction of the permanent
magnets. The principal method used is the disassembly graphical model defined by
Luttropp.
The third material involved in the study is the copper. Both the battery (in the anode) and the
electric motor (in the stator windings) have considerable amount of copper. Two copper recycling
scenarios are modelled together with the previous scenarios. More specifically is considered the possibility to recycle copper within the lithium battery recycling flow 1 and it is considered to
disassemble the copper windings of the E-motor together with the permanent magnets during the
reuse flow 3.
It is worth to discuss also the recycling of the electronic controller for the electric motor. The
valuable part of the electronic controller are the print circuit boards, PCBs. The PCBs contain

33
precious metals like gold. Nevertheless, electric vehicles and scooters are one out of the thousands
of products that use that component. The share of disposed PCBs from the vehicle market is
negligible in respect to the ones from the electronic system market. Furthermore, since the great
penetration market of electronic devices in the last decade different companies developed
remunerative recycling processes already well established. For this reasons no recycling scenario
is proposed for the electronic controller. The assumption is that it is disassembled, see Chapter 4,
and recycled according to already existing procedures, see Chapter 7, section 7.2.4.
5.3 Material Hygiene, recycling scenarios
5.3.1 Lithium cathode recycling scenario
The author selected four technologies that should represent the top industrial standards available
nowadays. The list of these technologies, and of the companies that use them, comes after literature
review [22, 23, 24]. This section contains the patent analysis of the four process flows. Then, a
plausible process flow is proposed. The table 5.3 resumes the features of the companies selected,
see Table 5.3.
Company Location Technology Li
recovery
Other
metals
References
Batrec Switzerland Hydrometallurgical NO Steel, Ni,
Co
[22, 23, 24, 30.W]
Retriev
Tech.
USA Hydrometallurgical YES Al, Cu, Co [22, 23, 24, 31.W]
Recupyl France Hydrometallurgical YES Steel, Cu,
Co
[22, 23, 24, 32.W]
Umicore Belgium Pyrometallurgical NO Ni, Cu,
Co, Slag
[22, 23, 24, 33.W]
Table 5.3, Lithium battery recycling companies
Batrec [37]
The technology is modelled as a process flow, see Figure 5.4. The method used to neutralize
lithium reactivity in standard atmoshpere is the use of CO2 as inert gas. The process involves also
a method for the proper storage and transport of the lithium batteries. The metal recovered are
chrome-nickel steel, cobalt, non-ferrous metals, manganese oxide and plastic.

34
Key:
Create protective atmosphere
Shredder
Neutralize
Realise protective atmosphere
Leach/wash
Further processing
Exhausted Li-ion batteries
CO2
CO2
Moist air
Waste gases
Acidified aqueous
liquid
Residual waste
Recovered chemical
substances
Product materials in/out
Processmaterials in/out
Process step
Metal fractions
Figure 5.4, Batrec recycling process flow
Retriev Tech. [29.W]
The company claims to be able to recycle any size or type of lithium battery. An important step is
the neutralization of lithium reactivity through a cryogenic treatment. This treatment is effective
but it is very energy consuming. In the last years, an alternative process involving mechanical
shredding and lithium brine has been proposed and implemented. The rest of the process flow is
then a mixture of mechanical treatment and hydrometallurgical process. In the last stages through
the adding of Na2CO3 and a further washing and drying, lithium carbonate is obtained. Other
materials recovered are cobalt, steel and copper. See Figure 5.5
Recupyl [38]
Recupyl collects and recycles primary and secondary lithium batteries. The company uses a
patented hydrometallurgical recycling process, see Figure 5.6. The material recovered are steel,
copper, cobalt and lithium. The following part of the paragraph describes shortly the patent owned
by Recupyl. The safe inactivation of lithium is realized through an inert atmosphere of argon and
carbon dioxide. Then mechanical and magnetic filters sort recyclable metals such as steel and
copper. Lithium hydroxide and water are added to obtain a lithium solution plus solid cobalt. In
the next step, solid/liquid are separated in two streams. The liquid containing lithium in solution
is processed to obtain precipitated lithium carbonate. Interesting to notice is that this process
generates hydrogen. The process recycles gas from the inert atmosphere employed in the early
stages to keep the oxygen percentage under the inflammable range of hydrogen. The stream for
the solid part leads to the recycle of cobalt and more lithium.

35
Converyor
Shredder
Shake strainer
PressFilter
Mixing
Washing
Exhausted Li-ion batteries
Lithium brine
Water
Lithium brine
Na2CO3
Lithium carbonate
Steel
Copper, colbat
Cobalt
Drying
Figure 5.5, Retriev tech. recycling process flow
Umicore [39]
The following paragraphs present a brief description of the process flow. The description comes
from an analysis of both Umicore website and the U.S. patent owned by the company describing
the recycle technology, see Figure 5.7. Large batteries, like vehicle batteries, are first dismantled
in Hanau, Germany. The rest of the process takes place in Hoboken, Belgium. The core of the
process is the pyrometallurgical furnace. The exhausted lithium batteries together with coke,
limestone and sand are fed into a vertical shaft furnace. Oxygen enriched air blows from the bottom
of the furnace. The furnace works in three different stages: preheating zone, plastic pyrolysing
zone and metal smelting zone. The temperature steps are from 300 °C to 1450°C. At the end of
the process, there are two products: a slag and an alloy. The slag mainly contains aluminum,
silicon, calcium and iron. In the slag is present also all the lithium held in the batteries. Currently
the lithium is not recovered. The slag can be used in the construction industry. The alloy contains
iron, copper and cobalt.

36
Create protective atmosphere
Mechanical separation with double crushing
ScreeningDensimetric tableMagnetic sorting
Fine screening
Leach
Acid leaching
Exhausted Li-ion batteries
CO2, Ar
Lithium hydroxide
+ water
Waste gas
Stainless steelNon ferrous metal
Paper & plastic
Metal impurities but cobalt
Lithium carbonatePrecipitation
Washing
Drying
Recycledwaste
Gas
Purification
ElectroclysisOxidation
Solid/liquid separation
Copper
Cobalt hydroxide Lithium carbonate
Sulphuric acid
Sodium hypochlorite
Figure 5.6, Recupyl recycling process flow
According to the processes analysed the most effective process for the recovery of lithium is the
hydrometallurgical method together with a mechanical crushing step. The combination of
hydrometallurgical and crushing processes is crucial. The mechanical process is important because
gives the possibility to the recyclers to separate polymers and several metals, such as steel and
copper, whilst the hydrometallurgical step leads to the recycling of the most precious materials
like cobalt and lithium. The lithium causes explosive reaction with the standard atmosphere
therefore an inactivation treatment has to be performed before or during the mechanical crushing.
The hydrometallurgical process needs different chemicals, mostly acids, to be implemented.
The pyrometallurgical process is easier to implement. The most of the phases take place in the
furnace. The fact that the disposed product is treated by pyrolysis makes the inactivation treatment
unnecessary. Although, the pyrolysis does not allow the recycling of polymers and lithium because
they are burnt during the process. The aim of MH is to look for a higher material efficiency, the

37
pyrolysis, in comparison with the hydrometallurgical treatment, seems not to satisfy that
requirement.
A recycling process for lithium based on a crushing step and a mechanical step is proposed. The
outline of the proposed process consists in a hydrometallurgical flow with a crushing pre-step that
could lead to a more complete recycling. The crushing pre-step is crucial for the separation of
Top of the furnace
Furnace:Preheating
(300°C)
Furnace:Plastic pyrolisis
(700°C)
Furnace:Metal smelting(1200-1450°C)
Exhausted Li-ion batteries
CokeLimestone
Sand
Gas treatments
Granulation
Cu, Co, FeLithium containing
slag Figure 5.7, Umicore recycling flow process
materials like polymers and copper. Before the crushing step is necessary to inactivate the lithium.
This is done through a protective atmosphere of CO2. After the crushing takes place a step of
filtering to sort metals, such as steel and copper, and polymers. Afterwards, a hydrometallurgical
treatment, the most suitable is acid leaching, is suggested with downstream a drying stage to obtain
lithium manganese oxide powder. The author proposes just a simple outline of the process, also
because it is out of the scopes of this thesis get into more details. The recycling scenario suggested
respects the aimed features:
Reasonableness. The patent analysis seems to satisfy this condition;
Measurability. The process depicted, see Figure 5.8, seems detailed enough. Furthermore,
this process has actually been assessed in a LCA, see Chapter 7.
High level of material use. With the recycling of lithium and copper this feature seems to be achieved.

38
Converyor
Inactivation treatment (e.g. inert
atmosphere)
Shredding/Crushing step
Filtering (magnetic, densimetric)
Hydrometallurgical treatment
Drying
Exhausted Li-ion batteries
CO2
Wastegasses
Acidified aqueous
liquid
Lithium (i. e. lithium
phosphate, lithium
carbonate, lithium oxide
Steel, Cu, Polymers
Figure 5.8, Recycling process flow proposed for lithium
5.3.2 Permanent magnet recycling scenario
According to the framework of the scooter disposal of the chapter 4, the E-motor is normally sorted
and sold to some metal recycling company. The options for the E-motor are two. If the E-motor is
big enough, in other words it contains enough copper to justify a disassembly pre-step, is
dismantled and the copper windings are sorted out [40] otherwise it is shredded creating
“meatballs” where the recovery of copper is less effective. In both cases, the permanent magnet
follows the ferrous materials along the whole process. To increase the Material Hygiene of an E-
scooter the permanent magnet has to be recycled. The approach used for the first scenario consists
in the implementation of a process that does not requires a manual disassembly. No disassembly
step means higher removal rate, a crucial parameter for recyclers. The recycling of neodymium is
considered according the patent and the research work of the researchers A. Wallace and A. Walton
[41, 42, 43]. The process is named hydrogen decrepitation, see Figure 5.9. The process flow is
relatively simple. It exploits the hydrogen decrepitation, the fact that in hydrogen atmosphere the
Nd rich boundary phase, between the bigger grains of NdFeB in permanent magnet, expands in
volume. The permanent magnet breaks up and becomes powder. The demagnetization that let
powder fall apart from the ferrous material is obtained by heating. The recycling rate is more than
90%. The details of the physical operation of the machine are descripted in the patent and in
research work of Wallace and Walton. The hydrogen decrepitation is not important in itself but it
represents a technical feasible solution for the recycling of permanent magnet. The goal of
recycling neodymium is achieved. The rare earth is in the state of solid powder.

39
Sieving/shaking stage
Metal scrap Reactor
Standard atmosphere
Argon/Hydrogenmixture
Degassing furnace
ValveRare earth powder
Figure 5.9, Recycling flow process for neodymium
The rare earth can then be inserted again in the process flow of NdFeB permanent magnet (for
further information about the NdFeB life cycle see Appendix A.1). The recycling scenario
suggested respects the aimed features:
Reasonableness. Also in this case the analysis of an existing patent gives plausibility to this scenario;
Measurability. The process depicted, see Figure 5.9, seems detailed enough. Furthermore,
this process has actually been assessed in a LCA, see Chapter 7.
High level of material use. The process achieves the goal of recycling the neodymium.
5.3.3 Permanent magnet reusing scenario
To reuse the permanent magnet is necessary to disassemble the electric motor. Furthermore, this
disassemble pre-step is important towards a more effective recycling of the copper in the stator.
This scenario involves a manual disassembly pre-step. The manual disassembly pre-step before
recycling is a tricky topic for recyclers since involves skilled workers and design-dependant
solutions that generally decrease the removal rata of a material. Nevertheless, the pre-step involves
significant benefits towards a high level of material reuse and recycling.
According to what said about the MH it is very important to have a solid idea of the structure of
the product analysed. MH map factor mainly embodies this concept. Towards a higher knowledge
of the product, the figure below presents the CAD [44] of a wheel hub motor. The wheel hub
motors can have different design solutions, nevertheless, is possible to identify one common
prerogative [27.W]: the physical operation and the parts are the same of a classic BLDC motor but
unlike it the rotor is external and stator is internal.
The method used to achieve an effective understanding of the motor structure and to propose a
disassembly process is the one designed by Luttropp [7]. Luttropp developed the method as a tool
for “Design for Disassembly structure”, DfDs, the part of Design for Disassembly, DfD, that deals
with product structure. The method is graphical. It defines the concept of describing joints as
resting load cases. Each of these resting loads can be graded, with an ordinal scale, regarding the
information, the equipment, the force and the time needed to “wake up” the resting load. A graph
is presented below. The implementation of the graph is qualitative.

40
12
3
4
5
67
Figure 5.10, CAD of a wheel hub motor [44]
Table 5.4, Components of a wheel hub motor
Considering the joint evaluation, the most critical joints are the forcing joint (2.75 index), the
magnetic field (3.0 index) and the glued joint (3.0 index). For the forcing joint, the use of a powered
tool seems the plausible solution. For the magnetic field of the magnet that keeps it attached to
the rotor, a demagnetization step should be included. There are two different approaches to
demagnetization: the thermal and the electromagnetic. The thermal is easier and less expensive
but has drawbacks such as the melting and vaporization of the glued bond between the magnet and
the rotor that could lead to toxic vapour [34]. Thermal demagnetization would also preclude a
hypothetical worker to work downstream. The electromagnetic solution seems more suitable [29].
The glued joint that attachs the magnet to the rotor is considered the main weakness towards an
efficient disassembly.
Number Component Description
1 Closing ring It hosts screws. It holds the left endcap on the rotor
2 Left endcap
3 Permanent magnet Are glued to the internal part of the rotor
4 Rotor It is linked to the two endcaps and the rest of the wheel
5 Righ endcap
6 Stator The stator with ferrous material and copper windings. it is
stiffly mounted on the shaft (hub shaft)
7 Hub shaft It is linked to the rotor by the resting load of the bearings

41
Key:
Shaft
Bearing
Stator
Magnet
Left endcap
Right endcap
Rotor
Screw jointLi=0.25Lq=0.5Lf=0.5Lt=1
Forcing jointLi=0.75
Lq=1Lf=0.5Lt=0.5
Screw jointLi=0.25Lq=0.5Lf=0.5Lt=1
Magnetic JointLi=1Lq=1
Lf=0.5Lt= 0.5
Glue jointLi=0.5Lq=1Lf=1
Lt=0.5
Screw jointLi=0
Lq=0.25Lf=0.5Lt=1 Component
Component to recycle
Join evaluation
Figure 5.11, Motor disassembly scheme and resting loads
Index Topic Meaning
Li Information 0-Easy to understand, 1-almost impossible to understand
Lq Equipment 0-No tools needed, 1-special tools needed
Lf Force 0-Just fingers needed, 1-power tools needed
Lt Time 0-less than 10 s, 1-more than 30s needed
Table 5.5, Resting load index
The reuse is an available solution for permanent magnet of a certain dimensions [29]. The
hypothetic reuse shown in this section is a four-step disassembly process:
1. Disassembly of the end cap; the assumption for the disassembly of the end cap is the
unscrewing of the screw joints that connect end cap to the rotor.
2. Extraction of the stator/shaft component; the forcing joint between the shaft and the
rotor might request a considerable force. A power tool that holds the rotor and pull out the
stator and the shaft is needed.
3. Electromagnetic demagnetization; the permanent magnet needs a demagnetization step.
The process designed involves an electromagnetic demagnetization. The electromagnetic
demagnetization physical operation consists in electromagnetic pulse with the same
magnetic field magnitude and opposite polarity. The electromagnetic demagnetization
process is based on the patent US 2011/0100981 [45]. The invention selected, and the

42
process flow for the demagnetization, are not important in themselves but, as for the
hydrogen decrepitation, they represents the feasibility of the process.
4. Tool-aided magnet extraction; the assumption made is that a skilled worker can extract
a magnet with the help of a tool. The resting load of the glue joint is considered weak. This
assumption has been made because the deterioration of the glue bond at the last stage of
the use life of BLDC motors is one the causes of failure for these components [46].
This process flow is an example of the disassembly for reuse of a permanent magnet. The magnet
needs to be magnetized again before being reused. The magnet is attached to the rotor with a glued
joint. Glued joints may cause problems to the disassembly since the resting load linked to this kind
of joints changes case by case according to the state of deterioration of the adhesive layer. To have
a standardize disassembly pre-step it would be better to use different joint designs like screws or
a supporting collars of magnetically non-conductive material.
. The recycling scenario suggested respects the aimed features:
Reasonableness. For this scenario the Luttropp DfDs graphical tool seems to depict the disassembly step with plausibility;
Measurability. The steps described in this section seems detailed enough. Furthermore, this process has actually been assessed in the LCA, see Chapter 7.
High level of material use. This process ensures a high level of material use. This scenario,
compared to the other regarding the permanent magnet, appears more environmental
friendly since does not involve chemical treatments, brings to the reuse of permanent
magnets and encompasses the disassembly of the stator that could lead to sort the copper
windings.
5.3.4 Copper recycling scenario
The copper amount in the electric alternative is seven times bigger than in the ICE-scooter. As
already stated the copper is usually recycled but the effectiveness of this recycling can be
improved.
In the E-scooter, the greatest amounts of copper are in the battery and in the motor, according to
these two components the hypothesised recycling scenario are:
Copper recovery in lithium battery recycling process. The assumption made is to consider that the crushing/sorting process is also able to sort copper. This assumption seems
coherent with the patent analysis performed;
Copper recycling after the E-motor disassembly pre-step. The assumption made is that the disassembly of the E-motor to take out the permanent magnet gives also the opportunity to
sort out the copper windings of the stator. This assumption seems plausible since, once the
stator pull out from the motor the extraction of the windings is a relatively simple operation
for tool-aided operator [47].
The importance of an efficient sorting of copper from other metals is important also because copper
is a contaminant if present in other metals especially steel. To sort copper downstream a shredding
process, even if economically worth, leads to losses of copper (more than 10%) that remains mixed
up with ferrous materials. This causes a high environmental load since the recycled ferrous
materials have to be diluted with primary steel to decrease the average amount of copper. A case
study involving this recycling matter is present in the work of Johansson [4].

43
6 LITERARY REVIEW
This chapter shows the result of a literary review regarding quantitative comparisons between
electric and traditional vehicles. The chapter reports both comparisons of cars and scooters. The
author thinks that these notions are useful to understand the LCA of the next chapter and to
comprehend better its results.
6.1 Comparison between an electric and a traditional car.
There have been in the scientific literature some examples of comparison between electric and
traditional cars. The electric mobility as an alternative mobility has to face this comparison trying
to solve or at least reduce the traditional mobility concerns.
Thomas [48] performed the comparison between electric and traditional vehicle from the
emissions point of view. It states that the electric vehicle is still an oil-dependent technology and
that the GHGs can be reduced only by 25%.
Boureima et al. [49] performed a comparative Life Cycle Assessment between a gasoline car and
an electric car. The result of the study states that the electric car represents the greener alternative
considering all the impact (GHGs, human health, acidification). However, this study appears too
optimistic. Some assumptions that may have affected the result are the choice, as average electric
car for the study, of the model “Tesla” by Tesla motor. The car Tesla is actually a high performance
roadster that costs around 80000 $ [42.W]. Furthermore, the bill of material of the electric car is
not accurate enough especially regarding the electric motor and the lithium battery.
In a LCA comparison [50] performed by EMPA, a research institute of the ETH, the internal
combustion engine vehicle results worst as fossil fuel consumption and global warming potential,
whilst the electric vehicle has worst effects on the human health, the ecosystem and the metal
depletion. The main reason for the negative features of the electric vehicle is the amount of further
energy and materials needed to manufacture the battery and the brushless motor. Nevertheless, in
this study is underscored that to reduce the impact of an electric vehicle two main conditions are
required. First, increasing the fragment of electricity produced by renewable sources in the
electricity production mix and, second, increasing of the amount of recycled materials at the end
of the life of the product.
A study conducted by H. Ma et al. [51] involves the comparison between the life cycle of a
traditional and electric vehicle. The report estimates the global warming potential, through the
parameter carbon dioxide grams per kilometre, of the two vehicle. The report states that for both
the vehicle the life phase in which more GHGs are produced is the use phase. The results confirm
the idea that the electric vehicle has a lower global warming potential.
Bartolozzi et al. [52], regarding the private transport in Tuscany, have conducted a comparison
among different mobility alternatives. The method used was a complete life cycle assessment and
the results were that the electric vehicle is better than the traditional one regarding the abiotic
depletion, the acidification, the global warming and the ozone. The electric vehicle is more
affecting, though, regarding eutrophication, human toxicity, aquatic and terrestrial Eco-toxicity.
6.2 Comparison between an electric and a traditional scooter.
The scientific literature concerning the comparison between electric and traditional scooters is
quite poor.
Bishop, at the University of Oxford, performed a comparison between the operation costs of a traditional scooter and an electric scooter [53] and the environmental impact linked to the use

44
phase. The result of the investigation is that the electric scooter produces 54% less GHGs and it
used 35% less energy during its use phase. The result of the comparison between the operational
costs is that the E-scooter operational cost results higher because of the cost for the replacement
of the battery.
An important work, used also as reference for the Life Cycle Assessment of this reports, is the
“Life Cycle Assessment of two wheel vehicles” performed by ESU-services Ltd. [54] and then
implemented in the ecoinvent data 2.2. The complete life cycle assessment of an electric scooter
and a traditional one are performed. The overall impact of the E-scooter according to the
Ecoindicator99 is lower than the one of the ICE-scooter. The model, tough, has some strong
assumptions. The Life Cycle Inventory, LCI does not include the permanent magnet and the bill
of materials is obtained through a weight ratio with an electric car.

45
7 LCA, ANALYSIS OF E-SCOOTER LIFECYCLE
This chapter aims to answer quantitatively to the research questions declared in the purpose of
the report. The method chosen is the Life Cycle Assessment. This chapter presents a section to
introduce the theory of LCA method and a second part that describes the Life Cycle Assessment of
an E-scooter.
7.1 LCA, description of the method
The method used in this report to answer this question is the life cycle assessment (LCA). Next
paragraphs present a description of the method. The book “the hitch hiker’s guide to LCA” is the
main reference used for this section [55].
The LCA is a method to assess the whole life cycle of a product. LCA meaning is relatively easy
to understand intuitively. Another way to call this method is from “cradle to grave” analysis. In
few words, the LCA is an assessment method that quantify all the life phases of a product, from
the production, the “cradle” up to the disposal, the “grave”. LCA is actually more than this, it is
also a procedure that lets us deal with complex problems.
The international standard ISO 14040:2006 [56] describes the method in detail. The procedure
used to perform the LCA of this method tries to follow the standard approved procedure.
Nevertheless, it can happen that the procedure used differs from the ISO. Anyway, each
assumption has been commented and justified.
The LCA consists in a sequence of steps:
1. Definition of goal and scope of the LCA
2. Life Cycle Inventory, LCI
3. Life Cycle Impact Assessment, LCIA
a. Classification
b. Characterization
c. Optional steps (Normalization, Grouping, Weighting, etc.)
The main feature of the goal should be a proper description of the reason why the study is
performed. The main reason is usually the question that leads to perform the study.
The scope of the Life Cycle Assessment depicts the way to achieve the goal. In other words, it
represents how to answer the question that causes the LCA. Hence, the scope should define the
system boundaries, the allocation methods and the data quality.
The Life Cycle Inventory, LCI, represents a list of all the materials and the processes involved in
the lifecycle of the product investigated. To collect this data is possible to use different resources.
The more reliable are the resources provided by the manufacturers. Other sources of information
and data are literature and personal consulting. In the LCI there is always a ranking between the
data. Those data that influence directly the goal and scope of the LCA have the highest ranking
and they shall have the highest reliability.
The Life Cycle Impact Assessment, LCIA, is the stage of the LCA that gives actually a meaning
to the great amount of data collected during the previous phase of the method. The LCIA translates
each amount of material and emission to indexes that can be understood by the readers of the study.
The LCIA involves compulsory and optional steps. Classification is compulsory. It represents the
first step. The classification defines the different impact categories. The impact categories are
defined according to a classification method. The two classification methods adopted in this LCA are CML2001 e Ecoindicator’99. CML2001 has been developed by The Centre of Environmental
Science at Leiden University in the Netherlands it defines eight different impact categories, see
Table 7.1. Ecoindicator’99 is a ready-made LCIA method. It was specifically created for designers.

46
The ECOINDICATOR ’99 finds eleven impact categories that may be grouped in three main
impact areas, see Table 7.2.
Impact category Unit Description
Abiotic depletion Kg Sb eq. It refers to the consumption of natural resources
Eutrophication Kg 1.4 DCB-
eq.
It accounts all the effects of macronutrients in ecosystems
Acidification Kg SO2-eq. It refers effects of acidifying substances
GWP100 KgCO2-eq. It quantifies the global warming potential within 100 years
Ozone layer depletion KgCFC11-
eq.
It quantifies the stratospheric ozone layer depletion
Human toxicity Kg 1.4 DCB-
eq.
It concerns effects of toxic substances on human
environment
Fresh water ecotoxicity Kg 1.4 DCB-
eq.
It refers effects of toxic substances on fresh water
ecosystems
Marine
CML2001aquatic
ecotoxicity
Kg 1.4 DCB-
eq.
It refers effects of toxic substances on marine w.
ecosystems
Terrestrial ecotoxicity Kg 1.4 DCB-
eq
It refers effects of toxic substances on terrestrial
ecosystems
Photochemical
oxidation
Kg ethyl.-eq. It computes formation of reactive sub.s, mainly ozone
Table 7.1, impact categories of CML2001 and their characterization [57]
Impact category Unit Description
Carcinogens DALY/kg Carcinogenic effects due to emissions
Respiratory organics DALY/kg Respiratory effects resulting from summer smog
Respiratory
inorganics
DALY/kg Respiratory effects resulting from winter smog
Climate change DALY/kg Health damage resulting from climate changes
Radiation DALY/kg Health damage resulting from radioactive
radiation
Ozone layer DALY/kg Health damage resulting from increased UV
radiation
Ecotoxicity PAF*m2*yr/kg Damage to ecosystem quality due to UV ecotoxic
subst.
Acidification/Eutroph. PDF*m2*yr/kg Damage to ecosystem quality due to acidification
Land use PDF*m2*yr/m2 Damage due to occupation and conversion of
land
Minerals Surplus
energy/kg
Decreasing ore grades
Fossil fuels Surplus
energy/MJ
Results of lower quality resources
Table 7.2, impact categories of EI99 and their characterization [57]
With the classification, each substance is classified in impact categories. The characterization
quantifies the contribution of each substance to its impact categories. To do this operation the
amount of material or emission is translated into an equivalent unit. The impact categories defined
by CML2001 are translated in kg of equivalent impacting substances. This translation does not
imply complex calculations. This leads to fewer uncertainties but the results are less intuitive. The
global warming potential, e.g., is translated in KgCO2-eq. The impact categories of EI99 are based

47
on complex unit. They have more uncertainties but they are more intuitive. The climate changes
are quantified as disability adjusted life years/kg. This unit describes the deaths and the diseases
caused by climate changes. The other unit of EI99 acronyms are PDF, potential disappeared
fraction and PAF, potential affected fraction. Optional steps for the LCIA are the normalization,
the grouping and the weighting. The ones involved in this report are grouping and normalization.
The grouping summarizes more impact categories in three more easy-to-understand categories:
human health, ecosystem quality and resources. It is available only for the EI99. The normalization
is a step that relates (i.e. divides by) the results of the characterization to the predicted values of
impact categories for the region (spatial boundaries) taken into exam by the study. The predicted
value of an impact category for a region is the magnitude of that impact category considering all
the technosphere of that region.
The database is a very important part of the LCA. For this study the data concerning the
background system and part of the data concerning the foreground system (see next chapter for
background/foreground) are from the EcoInvent 2.2 database [43.W]. Performing an LCA is a
time-consuming operation if not made with the proper tools. The software SimaPro 7.3.3 by
PréConsultants is the tool selected for running this LCA. SimaPro 7.3.3 is an all-included software.
SimaPro 7.3.3 has step to implement different data and gives the user the possibility to calculate
inventories, networks and impact assessments.
7.2 LCA of an electric scooter
7.2.1 Goal
This life cycle assessment has two main goals. The first is to perform a comparison between an
average traditional scooter and average E-scooter encompassing the environmental impact of the
permanent magnets in the E-motor and the lithium in the Li-ion battery cathode. The second is to
analyse the effect of the recycling of those two “new” materials on the overall environmental
impact of the scooter, according to the recycle models depicted in the previous chapter, see Chapter
5. This LCA is an attempt to answer to the research question of this thesis:
“What is the quantitative balance between the benefits and the drawbacks of an electric scooter,
from an environmental point of view? Furthermore, what are the benefits on the just-defined
balance of an improved material management?”
In addition, this LCA attempts to perform a comparison phase by phase between the two
alternatives.
7.2.2 Scope
According to the purposes described in the previous paragraphs, this LCA aims to give an overall
understanding of the electric mobility and of the environmental weight of the recycling of new
materials. Hence, a scientific audience and more in general a public audience is the target of this
work.
The product system studied is the scooter in its two different alternative powertrains. The main
function of the product is the private transportation in urban area. The products are supposed to be
design for the European market. The selection of the market leads to consequences according to
the design of the product, such as the average weight, the battery technology, the life expectancy.
The electric production mix considered for the use phase is the European one. The product is
studied in all its life phases. The life phases are the manufacturing, the use phase that encompasses the maintenance and the operation and the waste scenario. For the ICE scooter the only fuel

48
Background
Scooter assembly
Electric powertrain
Lithium battery
Foreground
Manufacturing
NeodymiumLife cycle
Operation
Maintenance
Use-phase
Disposal of assembly
Disposal of battery
EoL
Materials
Infrastructure
Energy
Materials InfrastructureEnergy
Landfill
Material disassembly
Material recycling
considered is petrol (not biofuels) since the aim is to compare the fossil fuel consumption of the
two alternatives.
The functional unit chosen is one pkm, so the transportation of one person for one kilometer of
European roads. To have an easier comprehension of the LCA the system has been divided in
foreground and background system. The foreground system includes the life phases of the product.
The data for these process are implemented according literature and manufacturer data. The
foreground encompasses the most important data of the LCI and the most sensible. These data are
the ones that effect more the results of the LCA. The foreground system describe also the life cycle
of neodymium . The background system describes all the resources and the materials that represent
the inputs and the outputs for the foreground system. The background system, as first analysis,
includes also the data for the recycling according with the cut-off model.
Figure 7.1, Background and foreground system
Regarding the data quality, the data come from the literature and manufacturer. Since the main
goal of the LCA is the comparison, the main concern is to have a proper definition of the life cycle
of those components that are different between the two alternatives. The data quality describing
the recycling scenarios are affected by wide uncertainties since some of the process described are
still on lab-scale. The impact assessment are computed with the software SimaPro 7.3.3.
7.2.3 Life Cycle Inventory, LCI
The life phases of the product represent the structure of this LCI. This allows making comparison
between the different life cycle phases and the different components.
The following paragraphs describe all the models used. The functional unit is the transport of 1
person for 1 kilometre. The scooters are considered with a capacity utilization of 1.1 (average

49
value) since two people actually can ride them. The LCI presented in this section encompasses
each life phase according to the following list:
Production phase o Scooter structure
o Electric powertrain
Use phase o Maintenance
o Operation
Disposal
o Cut-off model
o System expansion and substitution model
The approach used for the structure LCI of this LCA mainly takes into account documents from
the manufacturers. The Aprilia SR 50 CAT PD by Aprilia (Piaggio Group) [58], a top-sold scooter
of the early two thousands, has been used for the LCI of the ICE scooter. The model Penelope
from MotoriniZanini [59] has been used for the LCI of the E-scooter.
Assembly Weight (kg)
Rear dumper 1
Battery (PbA) 2
Body 20
Wheels 12.4
Fork 5
Brake 4
Tyres 5
Cooling system 1
Electric system 1.4
Handlebar 1
Silencer 5
Engine and transmission 24
Seat 1.2
Tank 0.6
Chassis 11
Screws, bearings, etc. 1.5
Table7.3, assembly of Aprilia SR 50 CAT [58]
For the Aprilia model the analysis of the technical drawings [44.W], personal consulting [60, 61]
and the list of the weighted components, see Table 9.3, brought to the definition of a bill of
materials. Nevertheless, some other manufacturer data are used. To define the amount of polymers
and, the proportion between the polypropylene and the polyethylene, is used the information
provided by Piaggio. To maintain the model chosen representative for the whole ICE-scooter
category a weight ratio has been applied referring the weight of Aprilia SR 50 CAT PD to the
average weight of the top sold scooters in Europe in 2012 according to ACEM. The Honda
environmental report of 2013 is used as reference for the consumption of energy and natural
resources linked to the production of a single scooter, see Appendix B.2. Since the list of all the
weighted components of Penelope was not available, the approach used is to subtract the weight
of the thermic powertrain and to add the weight of the electric powertrain (battery, E-motor and
BLCD controller of Penelope) to the previous assembly. The resources consumption data are
assumed the same that for the other model since the battery and the E-motor have their own
resource allocation. In addition, a weight ratio has been applied to adapt the weight of Penelope
scooter to the average weight of scooters produced by the top ten E-scooter manufacturers

50
according to the Navigant Search Border. Paint, Chromium, Nickel and Zinc are estimated using
a weight ratio with an average ICE-car from the EcoInvent database 2.2.
Vehicle Weight(kg) Weight ratio vs ICE car
Aprilia SR 50 CAT 96.1 0.072
Average ICE-scooter 93 0.07
Penelope 100 0.075
Average E-scooter 106 0.08
ICE car, EcoInvent 2.2 1320 1
Table 7.4, weight ratios
The bill of materials of the two scooters:
Material E-s, w% ICE-s, w% References
Steel 25.89 49.43 Aprilia SR [58]
Copper 0.56 1.17 Aprilia SR [58]
Aluminium 17.11 20.31 Aprilia SR [58]
Polymers 14.81 20.95 Piaggio group [12]
Chromium 0.15 0.17 Ecoinvent [43.W]
Nickel 0.09 0.10 Ecoinvent [43.W]
Paint 0.42 0.47 Ecoinvent [43.W]
Zinc 0.36 0.41 Ecoinvent [43.W]
Lead 1.54 [20]
Sulphuric acid 0.31 [20]
Synthetic rubber 4.57 5.14 Aprilia SR [58]
Li-ion battery 22.64 Penelope [59]
E-motor 11.32 Penelope [59]
BLDC controller 2.08 Penelope [59]
Total 100 100
Table 7.5, percentage bill of materials of the two scooters
The previous ICE-scooter inventory already encompasses the ICE-powertrain. This section
describes the electric powertrain. In the model analysed, the scooter Penelope, the E-drivetrain is
composed by three components. The Li-ion battery, the BLDC controller and the E-motor. The
Lithium battery weights 24 kg according to Penelope model. The Li-ion is described through the
process of Ecoinvent 2.2 /battery, LiIo, rechargeable, at plant. The dataset represents a battery
with a LiMnO2 cathode. According to the technology description of chapter 4, this choice is
reliable. It is worth to underscore that these batteries are cobalt free. The E-motor considered
weights 12 kilograms. It is a hub wheel motor produced in China by the Chinese manufacturer
Angell. The power of the motor is 1500 W. Since there were not data available from the
manufacturer, the assembly is taken from the literature [62], see Table 7.7 . Then, also from
literature, a bill of material for the brushless DC motor is proposed [63], see Table 7.8 and see
Appendix B.2. The brushless DC motor controller, BLDC controller, considered weights 2.2 kg.
The model is a close-box controller that controls the electric components of the scooter. As the
hub wheel motor, the Chinese manufacturer Angell produces it. The only information provided by
the producer is that the housing is made of aluminium. Therefore, the process used in LCA is an
adaptation, considering the aluminium housing, of the EcoInvent 2.2 process /Electronics for
control unit/RER U, see Appendix B.2. The neodymium permanent magnet is modelled according
to the LCI performed by Sprecher et al. [25]. The life cycle flow of the permanent magnet reported
in the LCI is depicted in the appendix, see Appendix A.1.

51
Component W%
Stator core 27.4
Stator winding 12.6
Housing 24.0
Rotor 18.3
Magnets 4.0
Attachment band 0.6
Shaft 6.3
Miscellaneous 6.8
Total 100
Table 7.6, components of a BLDC motor [62] Table 7.7, materials of a BLDC motor [63]
For the use phase encompasses maintenance and operation. Concerning the maintenance, for both
the models, it has been estimated a life expectance of 50000 km. For the ICE-scooter is considered
as reference the EcoInvent process /maintenance, scooter. The process considers that maintenance
accounts the sostitution of the 5% of metals and 15% of polymers of the original bill of materials
of the scooter. The process is updated according to the bill of materials proposed by the author.
The ICE scooter needs, also, two lead acid batteries for 50000 km. The E-scooter follows the same
approach. The E-scooter needs 0.5 lithium battery pack for 50000 km [59]. The maintenance is
computed in respect to pkm. The operation are described through the two EcoInvent 2.2 models
/operation, scooter and /operation, electric scooter. The two models contain the emissions due to
the operation of the two scooters. The electric scooter has emissions due to the wearing of components (brakes, tyres, transmission…) and due to the production of electricity used to charge
the batteries. The consumption considered is 3.3 kWh/100 km The traditional scooter has
emissions due to the wearing of the components and to the combustion. The consumption
considerd is 3.3 litres of fuel every 100 km. The emissions due the combustion are averaged
between the two and the four-stroke engine. The operation is computed in respect to pkm. The
infrastructure consumption is described trough the EcoInvent 2.2 processes for roads. The
infrastructure processes to make, maintain and control a road are the same between the two models.
The description of the waste scenario represents a complex subject. According to the principles of
the LCA the disposal of materials has to be accounted in the life cycle of a product. It is true,
tough, that materials are recycled. Recycling generates a problem regarding where to account
processes. The problem is whether they are accountable to the first product lifetime and in which
measures. The simplest approach to this matter is the cut-off method. The cut-off method is the
same used by Ecoinvent 2.2. This approach cuts off the life cycle of the recyclable materials before
the end of life. Processes linked to the recycling are not accounted on the disposal. Nevertheless,
the input resources, the resources accounted during the manufacturing, for those materials suitable
for recycling, are considered a mix of primary and secondary materials, according to statistical
market data. So, as an example, considering 1 kg of copper for the manufacturing phase, according
to the cut-off model, a certain share, the 20% for Ecoinvent 2.2, is of secondary copper and actually
accounts for the recycling. The cut-off method, however, is not meaningful for those materials that
do not have a proper recycle market. Since the aim of this LCA is to evaluate the effect of recycling
of the “new” materials in the life cycle of the electric vehicles, another method to describe the
allocation process of these materials is needed. The method chosen is the system expansion and
substitution just for those materials that usually are not recycled but, in this specific case, could be
recycled through one of the recycling process described in the chapter 5. This method expands the
product system to include the recycling processes for the involved materials. However, according
to the method the waste scenario accounts as avoided products all the effective (after applying a
recycle/recovery rate) recycled materials and the recovered energy. The system expansion and
substitution is particular suitable for product development and more specifically for scenario
comparisons. The theoretical background behind this section is the “Hitch hiker’s guide to LCA”.
Material W%
Steel 49.59
Aluminium 25.65
Stainless steel 6.72
Copper 13.43
NdFeB 4.0
Synthetic 0.61
Total 100

52
A first waste scenario, following a cut-off approach, is assessed. This scenario is described by the
waste treatment already present in the EcoInvent 2.2, the /disposal, scooter. It accounts the
transport to the scrap yard, the disposal of the lead battery, the incineration of polymers, half of
the synthetic rubber and of the zinc. All the other materials are considered recycled so, according
to the cut-off model, they do not have to be accounted on the product lifecycle. For the E-scooter,
the process considered is similar to the ICE-scooter one. The differences involve those components
that require a specific disposal. For the Li-ion battery is hypothesized that half the amount is treated
by pyrolysis and half by hydrometallurgy processes, the most diffused treatments at the moment.
These treatments, usually just recover valuable metals like nickel or cobalt. The lithium is not
recovered. The model already considered this since the lithium used for the production of the
LiMnO2 cathode is primary lithium. The neodymium of the electric motor is not recovered as well.
However, the lithium battery has to be disposed anyway as the directive states. The neodymium,
instead, takes part to the recycling flow of ferrous materials. The final results is that it joins other
metal oxides in the slag of the steel recycling process. The BLDC controllers are usually processed.
The disposal process is described by the Ecoinvent 2.2 process /disposal of electronics for control
units. All the other materials of the E-motor of an electric scooter are considered recycled,
according to the end of life framework, see Chapter 4. The figure 7.2 shows the cut-off model, see
Figure 7.2. The product system is the one managed by the performer of the LCA.
The second modelling approach adopted for waste scenario is the system expansion and
substitution model. This scenario involves those materials that could become part of recycling
processes in the future. The system expansion and substitution model designs four recycling
scenarios, according with chapter 5, see chapter 5:
1. Recycling of lithium manganese;
2. Recycling of NdFeB alloy;
3. Reuse of NdFeB permanent magnet;
4. High-level recycling of copper;
5. Recycling of gold;
The recycling of the battery represents a first scenario. The process flow modelled is the one of
chapter 5. Therefore, in the EcoInvent2.2 process defining the disposal of the Li-ion battery with
a hydrometallurgical treatment have been added a crushing process and the inert atmosphere
production process. The energy for the crushing is considered equivalent to crush 1 kg of electronic
scrap (process from the EcoInvent2.2 database). Lithium oxide manganese becomes avoided
product with a recovery rate of 90% [24]. The inputs required by the treatment (the inputs and
their quantities) are from the patent analysis, e.g. quantity of CO2, or the EcoInvent2.2 process for
chemical treatment, e.g. chemical plant. The emissions are default emissions defined by the
software for hydrometallurgical treatment.A table describing the process implemented in the LCI
realized with the software SimaPro 7.3 is reported, see Table 7.8. It is useful also because it
outlines how the software works.
Another recycling scenario is the one regarding the permanent magnets. There are two scenarios
involving Neodymium. The first method uses the hydrogen decrepitation to sort the magnet and
steel. The magnet obtained is in the state of a powder. According to the model of Sprecher et al.
this powder can newly take part to the process flow of permanent magnet production at level of
the milling of the powder, see Appendix A.1. The process implemented for the recycling thorough hydrogen decrepitation of hydrogen in SimaPro 7.3 is reported, see Table 7.9. The amounts of
hydrogen and argon are from the patent analysis.
In relation to what depicted in the Material Hygiene chapter, see Chapter 5, the best scenario for
the permanent magnet is the reuse. This solution consists in a manual disassemble with a
demagnetization step, a new magnetization and a direct reuse. As for the previous step the manual
disassembly and the demagnetization step is not accounted. This scenario include a reuse rate of
0.9 to account magnetic property loss of the NdFeB alloy.

53
Waste treatment specification: Lithium ion battery hydrometallurgical/mechanical treatment, 1
kg
1. Avoided product
Process type Materials EcoInvent 2.2 dataset Unit Amount
Material LiMnO Lithium Manganese
Oxide, at plant
kg 0.154707
2. Known input from nature (resources)
Process type Materials EcoInvent 2.2 dataset Unit Amount
Material Water Water, unspecified origin m3 0.00072
3. Known input form technosphere (material/fuels)
Process type Materials EcoInvent 2.2 dataset Unit Amount
Material Chemicals Chemicals, at plant Kg 0.025
Material Sulphuric acid Sulphuric acid, liquid, at
plant
Kg 0.025
Material Carbon dioxide Carbon dioxide, liquid, at
plant
Kg 0.005
Auxiliaries Electricity, medium
voltage, from grid
KWh 0.14
Auxiliaries Transport, lorry tkm 0.5
Auxiliaries Chemical plant P 0.000000004
Emissions to air
Process type Materials EcoInvent 2.2 dataset Unit Amount
Heat, waste MJ 0.504
Sulphuric dioxide kg 0.0000045
Emissions to water
Process type Materials EcoInvent 2.2 dataset Unit Amount
Material Copper Copper, ion Kg 0.00000016
Material Fluoride Fluoride Kg 0.0000003
Material Nickel Nickel, ion Kg 0.00000016
Known outputs to technosphere
Process type Materials EcoInvent 2.2 dataset Unit Amount
Disposal Inert waste disposal Kg 0.202
Disposal Plastic mixture disposal Kg 0.0605
Processing Electronic
goods
Shredding, electronic
scrap
Kg 1
Table 7.8, Lithium manganese oxide, recycling process on SimaPro 7.3
Waste treatment specification: NdFeB, hydrogen decrepitation treatment, 1 kg
1. Avoided product
Process type Materials EcoInvent 2.2 dataset Unit Amount
Material Permanent
magnet powder
NdFeB flakes, at plant kg 0.9
3. Known input form technosphere (material/fuels)
Process type Materials EcoInvent 2.2 dataset Unit Amount
Material Hydrogen Hydrogen, at plant Kg 0.025
Material Argon Argon, at plant Kg 0.025
Auxiliaries Electricity, medium
voltage, from grid
KWh 0.1
Auxiliaries Transport, lorry tkm 1.5
Auxiliaries Iron scrap plant P 0.000000004
Table 7.9, NdFeB, recycling process on SimaPro 7.3

54
According to the bill of materials of an E-scooter, the copper has an important share of the total
amount. The Li-ion battery contains a large amount of copper, according to the EcoInvent2.2
model /battery, LiIo, rechargeable, at plant about the 15% of weight is copper. Copper in lithium
Disposal
Production
Use phase(maintenance)
Materials with a recycle chain
Materials without a recycle chain
(lithium and neodymium)
Materials with a recycle chain
Materials without a recycle chain (lithium)
Disposal scooter
Primary materials (from ore)
Secondary materials(from recycle)
Scrap materials
Product system
Background
Figure 7.2, Cut-off model
Disposal
Production
Use phase(maintenance)
Materials with a recycle chain
Materials without a recycle chain
(lithium and neodymium)
Materials with a recycle chain
Materials without a recycle chain involved in
the study
Disposal scooter
Primary materials (from ore)
Secondary materials(from recycle)
Scrap materials
Product system
Background
Secondary materials(from recycle)
Primary materials (from ore)
Scrap materials involved in the study
Figure 7.3, system expansion and substation model for lithium and NdFeB recycle chain

55
battery is in the anode and in the current collector, see Chapter 4. The recycling of copper from
lithium battery is not a standard procedure. Among the process flow analysed the
hydrometallurgical processes claim to recover also copper. An extra system expansion and
substitution model is implemented for the recycling of copper from battery and motor.
This report focuses more its attention to lithium and neodymium since their higher weight share
in the bill of materials. Since the original cut-off model of the EcoInvent 2.2 database does not
consider any recycling of precious metals for the electronic control, a system expansion and
substitution scenario is depicted. The material recycled is gold. To describe this model anyway is
used the default process /gold, secondary, at precious metal refinery.
7.2.4 Life cycle impact assessment, LCIA
The impact assessment methods chosen for this LCIA are CML2001 and ECOINDICATOR99.
Specifically from CML2001 the categories chosen are abiotic depletion, GWP100 and water
ecotoxicity. From ECOINDICATOR99 the categories chosen for this assessment are radiation,
land use and the three groups: human health, ecosystem quality and resources. Those impact
categories have been chosen for different reasons. Abiotic depletion and GWP100 embody two
important concerns of the contemporary industrial world since they are related, respectively, to the
resource scarcity and to the climate changes. The water ecotoxiticy has been selected since it
emerges, together with the GWP100, as the most affecting impact categories out of the
normalization step, performed during the LCIA. It means that the relative weight of its magnitude
related to the system regional boundaries is the greatest among all the other impact categories.
Land use is chosen because it is representative of the benefits linked to the recycling. Recycle a
metal reduces the need of primary metal, hence, reduces the land needed for the mining of that
metal. Radiation points out an interesting weakness of the E-scooter. The human health, the
ecosystem quality and resources give an overall look to the comparison.
Figure 7.4, lifecycle comparison with the contribution of each life phase CML2001
0%
10%
20%
30%
40%
50%
60%
70%
80%
90%
100%
LIFE CYCLE - CML 2001
E manufacturing ICE manufacturing E use phase ICE use phase E disposal ICE disposal

56
The first field assessed is a life cycle comparison between the two alternatives. The two life cycles
are presented according to the cut-off model. Each impact category has its own unit, as specified
in the previous section, here the difference are showed as percentage spread see Figure 7.4 and
7.5. The result is that, according to main part of the impact categories, the ICE scooter has a higher
environmental load than the E-scooter and the reason is the high relative weight of its use phase.
Nevertheless, the manufacturing of the E-scooter is more impacting than the one of the traditional
scooter. The analysis and the interpretation of the results is reported in the next chapter, see
Chapter 8.
To answer to the second field of research, the one regarding the weight of the recycling, is reported
the comparison, not considering the use-phase, among the environmental impact of the ICE-
scooter, the environmental impact of the E-scooter considering the recycling of new materials
(LiMnO2, NeFeB and Au recycling) and the environmental impact considering a higher level of
copper recycling, see Figure 7.6 and Figure 7.7. This last comparison aims to be a quantitative
validation to the waste scenario depicted according to the Material Hygiene mind-set. In the
graphs, the impact is reported out of 100% and the patterned area represents the reduction due to
the recycling scenario. The results of this comparison are that a high level of recycling of copper
brings to higher environmental benefits than the recycling of the other new materials involved in
the study. Further analysis is reported in the next chapter, see Chapter 8.
Figure 7.5, lifecycle comparison with the contribution of each life phase, EI99
0%
10%
20%
30%
40%
50%
60%
70%
80%
90%
100%
LIFE CYCLE - EI99
E manufacturing ICE manufacturing E assembly ICE assembly E disposal ICE disposal

57
Figure 7.6, improved recycling of E-scooter CML2001
Figure 7.7, improved recycling of E-scooter EI99
0%
10%
20%
30%
40%
50%
60%
70%
80%
90%
100%
RECYCLING BENEFITS - CML2001
E-scooter new material S % Reduction Cu S% Reduction ICE
0%
10%
20%
30%
40%
50%
60%
70%
80%
90%
100%
RECYCLING BENEFITS- EI99
E-scooter new material S % Reduction Cu S% Reduction ICE

58
7.2.5 Uncertainties
Two level of data analysis is presented:
Data uncertainties
Sensitivity and contribution analysis
The uncertainties for the data are inserted by the author according with the Pedrigree matrix of
SimaPro software. Each data is assessed regarding six rules or criteria plus so-defined basic
uncertainty factor. The square geometric standard deviation is calculated using the formula:
𝑆𝐷𝑔95 = 𝑒𝑥𝑝√[ln(𝑈1)2]+[ln(𝑈2)
2]+[ln(𝑈3)2]+[ln(𝑈4)
2]+[ln(𝑈5)2]+[ln(𝑈6)
2]
The factors from U1 to U6 refer to the score in the table reported in the appendix, see Appendix
B. They take into consideration reliability, completeness, temporal correlation, geographical
correlation, further technological correlation and sample size.
The sensitivity analysis is a way to assess how the assumptions influence the results. To perform
this analysis the author changes some assumptions and see how the results change. This LCA has
a specific goal. The representativeness and the robustness of the model are very difficult to
evaluate since the electric motor is still a young product on the market and the recycling scenarios
proposed are not currently implemented in an existing recycling chain. Although an analysis has
been performed involving the relative weight of the use phase in respect with the other life phases.
A sort of sensitivity analysis has already been performed regarding the comparison between the
two end of life model of cut-off and system expansion and substitution. These two model describes
in fact the same thing changing the assumption. A sensitivity analysis has been performed in the
next chapter. The contribution analysis is a way to assess what is the contribution of a single
material /component/life phase to the whole life cycle of a product. A contribution analysis is
performed in the next chapter.

59
8 ANALYSIS OF RESULTS AND INTERPRETATION
This chapter analyses the results gained through the LCA and proposes an interpretation to
them.
8.1 Analysis
This section presents an analysis of the results according to the research questions of this work.
8.1.1 Life cycle analysis and contribution analysis
impact assessment unit less
impacting
Spread
abiotic depletion kg Sb eq E-scooter 64.7%
GWP100 kg CO2 eq E-scooter 72.1%
marine w ecotox kg 1,4-DB eq ICE-scooter 44.9%
Figure 8.1, Impact assessment according CML2001
impact assessment unit less
impacting
Spread
radiation DALY ICE-scooter 70.2%
land use PDF*m2yr E-scooter 50.3%
human health DALY E-scooter 14.3%
ecosystem quality PDF*m2yr E-scooter 14.4%
resources MJ surplus E-scooter 71.8%
Figure 8.2, Impact assessment according EI99
According to this study, the E-scooter results more environmentally sustainable according to six
indicators out of eight. The principal reason of these results is the use of fossil fuel for the internal
combustion in the use phase. Fossil fuels, in fact, are one of the closest resources to depletion. The
impact of the fuel extraction and use is also affecting human health and ecosystem quality more
than the use of new materials in E-scooters. The fuel mining and extraction accounts more land
use than the mining of the materials like neodymium and lithium up to the whole life cycle. The
radiation assessment of the E-scooter is 70% higher than the traditional one. The reason is the
European electric mix and its share of electricity produced by nuclear power plants. The need of
electric energy from grid is considerably higher for the E-scooter than for the traditional one. All
the electric energy used by the E-scooter for the transportation is, in fact, taken from the European
electric grid. The reason of the higher water ecotoxicity is the large amount of copper (battery
anode and BLDC motor) and in a smaller part of the precious metals in the BLDC controller. The
mining of these metals, especially copper, leads to the disposal of sulfidic tailing that has a strong
impact on water ecosystems. The disposal of sulfidic tailings leads to a lower pH in the water [64].
In the MH analysis, a qualitative graph regarding the material and the energy consumption of the
product was presented. This section proposes a quantitative graph resulted from the LCA. The
abiotic depletion indicator is chosen to give a quantitative proposal of the material consumption
flow. The abiotic depletion accounts as consumed materials the metals and polymers used in the
manufacturing and the fuel consumed during the use phase.

60
Figure 8.1, Abiotic depletion life cycle flow
The disposal does not account any recycling, according to the cut-off model. Hence, it does not
consider the approach that a material recycled is embedded in the life cycle as in the qualitative
graph of chapter 5, see Figure 5.2, Chapter 5. Nevertheless, it is believed that the figure helps the
reader anyway. The results are similar to what predicted in the qualitative analysis. The GWP100
is chosen to give a quantitative meaning of the energy flow through the life cycle. For both the
impact categories is possible to see how different the proportions of the life phases are between
the two alternatives. For the traditional scooter the impact of the use phase accounts for more than
the 80% of the whole life cycle. This is due to the fuel consumption. For the E-scooter the most
Figure 8.2, Global Warming Potential life cycle flow
E
ICE0.00%
20.00%
40.00%
60.00%
80.00%
100.00%
Abiotic depletion flow
E ICE
E
ICE0.00%
20.00%
40.00%
60.00%
80.00%
100.00%
Manufacturing
Use Phase
Disposal
GWP100 flow
E ICE

61
affecting life phase is the manufacturing. The manufacturing of an E-scooter actually has a heavier
environmental load than the manufacturing of the ICE-scooter. This shows the relative strong
weight of the new materials.
A contribution analysis is performed to assess the relative weight of the different components for
the most important indicators across the different life phases.
Figure 8.3, Manufacturing impact assessment CML2001
Figure 8.4, Manufacturing impact assessment EI99
0%
10%
20%
30%
40%
50%
60%
70%
80%
90%
100%
MANUFACTURING - CML2001
E man. others E man. battery E man. BLDC E man. Controller ICE manufacturing
0%
10%
20%
30%
40%
50%
60%
70%
80%
90%
100%
MANUFACTURING - EI99
E others E battery E BLDC E Controller ICE

62
The lithium battery is the heaviest among the three E-powertrain components and is the one that
gives the greatest contribution to the environmental impact. The battery is the component with
largest amount of copper. In those impact categories such as human health, ecosystem quality
(EI99) or water ecotoxiciy (CML2001) where the copper has considerable environmental load the
relative share of the battery increases. Other materials with a considerable environmental load for
the battery assembly are the aluminium (GWP) and the lithium manganese oxide (GWP and land
use). The pie charts below reports a comparison between the contribution analyses of two
indicators of CML2001. The comparison is reported to show the influence of each material on
each indicator. The Ecotoxicity of copper linked to the sulfidic tailings makes the amount of the
copper in the battery accounts for the 25% of the whole E-scooter environmental impact on Water
ecotoxicity.
Figure 8.5, Lithium battery contribution analysis - GWP100
Figure 8.6, Lithium battery contribution analysis – Water ecotoxicity
The BLDC motor contains copper as well. Considering other impact categories but the ones
affected strongly by the copper, the materials with a higher environmental load are aluminium and
the magnetic alloy NdFeB. For the abiotic depletion and the GWP, the aluminium and the NeFeB
10.1%10.9%
55.0%
copper, 7.2%
aluminium, 7.2%
LiMnO, 6.0%
others, 3.6%
battery
GWP100 - Li battery contribution analysis
motor controller others
15.6%
19.9%
19.7%copper, 25%
aluminium, 7%
LiMnO, 9%
others, 4%
battery
Water ecotoxicity - Li battery contribution analysis
motor controller others

63
share respectively around the 40% and the 20% of the total environmental load of the E-motor.
The NeFeB has an important relative environmental impact. In a mass ratio, it accounts for just
the 0.5%. In the GWP100, tough, it gives a contribution of 2%.
The gold is the more affective material throughout all the impact categories of the BLDC
controller. The specific impact of gold according to the CML2001 and EI99 is the most affecting.
This is the reason why the controller that accounts just for the 2% of the weight of the scooter
always shares more than the 5% of the environmental load.
Figure 8.7, Electric motor contribution analysis – Abiotic depletion
Figure 8.8, Electric motor contribution analysis – Water ecotoxicity
It is possible to perform a contribution analysis also of the other life phases. The weight of the bill
of materials is less important since some parts are not considered involved by the maintenance.
24.8%8.8%
56.3%
copper, 2%
aluminium, 4%
NeFeB, 2%
others, 2%
motor
Abiotic depletion - motor contribution analysis
battery controller others
44.8%
19.9%19.7%
copper, 9.9%
aluminium, 5.0%
NeFeB, 3.0%
others, 2.0%
motor
Water ecotoxicity - motor contribution analysis
battery controller others

64
Figure 8.9, Use phase impact assessment CML2001
Figure 8.10, Use phase impact assessment EI99
The ICE scooter results by far the less environmentally sustainable throughout almost all the
categories. The environmental load of the fossil fuels is very high. In certain impact categories
such as GPW and abiotic depletion there is a spread between the two alternatives of more than
80%. The only two categories where the E-scooter results with a higher environmental load are
the radiation, for the same reason already explained in the previous paragraphs, and the water
ecotoxicity. The water ecotoxicity is strongly affected by the lithium battery. It is possible to see,
0%
10%
20%
30%
40%
50%
60%
70%
80%
90%
100%
USE PHASE- CML2001
E others E battery ICE
0%
10%
20%
30%
40%
50%
60%
70%
80%
90%
100%
USE PHASE - EI99
E others E battery ICE

65
in fact, that is the contribution of the lithium battery the crucial contribution to let the indicator
value overtake the ICE scooter one.
Figure 8.11, Disposal impact assessment CML2001
The author also proposes a comparison between the EoL phases of the two scooters according the
cut-off model.
Figure 8.12, Disposal impact assessment EI99
0%
10%
20%
30%
40%
50%
60%
70%
80%
90%
100%
DISPOSAL - CML2001
E others E battery E controller ICE
0%
10%
20%
30%
40%
50%
60%
70%
80%
90%
100%
DISPOSAL - EI99
E others E battery E controller ICE

66
This model accounts just for the resources used for the collection, the dismantling and treatment
of lithium battery and electronic controller without considering any recycling. The E-scooter since
accounts those components that actually need more treatments than the others is, of course, more
affecting. Nevertheless, the relative weight of this life phase is under 5%.
8.1.2 Benefits of recycling scenarios
This section reports the assessment of the recycling of the “new materials”. This time the model
adopted is the system expansion and substitution model for all the material involved in the
scenarios. The waste scenarios assessed are:
1. Lithium manganese oxide recycling with a mixture of mechanical and hydrometallurgical
processes;
2. NdFeB magnet recycling using a hydrogen decrepitation treatment;
3. NdFeB magnet reuse with a manual disassembly step, a demagnetization step and tool-
aided extraction step of the permanent magnet;
4. The recycling of gold according to the default process /gold, secondary, from electronic
from the print wiring board of the electronic for control units.
5. A best case scenario, summary of the best solutions for the three materials
6. A scenario involving a high level of recycling of copper modelled according to system
expansion and substitution. This scenario represents the will of the recyclers to collect a
high percentage (90%) of the copper of the battery anode and of the motor windings. The
third scenario that encompasses the manual disassembly of an electric motor is crucial
towards this goal.
impact
assessment
unit scenario1 scenario2 scenario3 scenario4 scenario5 scenario 6
abiotic depletion kg Sb eq -5.31% -2.06% -2.06% -1.02% -7.06% -15.89%
GWP100 kg CO2 eq -5.71% -0.78% -1.57% 0.00% -6.94% -8.18%
marine w ecotox kg 1,4-DB eq -1.82% -0.60% -0.90% -2.13% -4.76% -22.02%
Table 8.3, benefits of recycling scenarios – CML2001
impact
assessment
unit scenario1 scenario2 scenario3 scenario4 scenario5 scenario 6
Radiation DALY -11.48% 0.00% 0.00% 0.00% -10.29% -6.76%
land use PDF*m2yr -3.34% -2.85% -3.34% -0.93% -7.40% -10.77%
human health DALY -1.67% -0.83% -1.46% -1.67% -4.52% -21.97%
ecosystem quality PDF*m2yr -1.20% -0.80% -1.20% -0.80% -2.77% -18.18%
resources MJ surplus -3.03% -0.85% -0.85% 0.00% -4.20% -23.53%
Table 8.4, benefits of recycling scenarios – EI99
The reductions are calculated comparing the manufacturing and the disposal of the whole E-
scooter to the manufacturing and disposal of the E-scooter with improved recycling scenarios. The
impact of the use phase is not linked to the material management but to the electricity production
mix. The impact of the use phase is the same for all the scenarios. This is why it is not accounted
in this comparison. This comparison focuses on the material management: production-
consumption.
Among the three new components, the most affecting in terms of recycling is lithium manganese oxide.
Lithium manganese oxide is also the most abundant in the bill of materials among the three “new”
materials (gold, NeFeB alloy and lithium manganese oxide).

67
The neodymium has a very high specific impact, especially regarding mining. The reuse solution, for
example, causes the same land use reduction than the lithium manganese oxide recycle. Although, the
weight amount of lithium manganese oxide is eight times bigger than the NdFeB alloy.
An electric scooter contains a large amount of copper. According to the model depicted, an E-scooter
has almost 8 Kg of copper mainly held in the battery anode and in the E-motor stator. The proper
recycling of the copper results as the most affecting among the recycling procedures. The cut-off model
considers that the 22% of copper comes from the recycle streams. This data comes from market
analysis conducted by EcoInvent2.2. In the system expansion and substitution scenario the recycling
rate of copper is considered 90%, value not difficult to reach if a disassemble step for the E-motor is
considered and the battery disposal companies encompasses a process to recover the copper in the
anode and in the current collectors. After this assessment, it is possible to analyse the benefits of a best
case scenario encompassing the recycling of lithium manganese oxide, the recycling of gold, the reuse
of permanent magnets and that increases the recycling of rate of copper. The benefits are considered
as percentage spreads in comparison with the current end of life scenario that does not involve the
electric powertrain, see Table 8.5 and 8.6
impact assessment unit Best case scenario
abiotic depletion kg Sb eq -22.5%
GWP100 kg CO2 eq -15.1%
marine w ecotox kg 1,4-DB eq -26.7%
Table 8.5, benefits of the best-case scenario – CML2001
impact assessment unit Best case scenario
radiation DALY -17.1%
land use PDF*m2yr -18.1%
human health DALY -22.6%
ecosystem quality PDF*m2yr -20.9%
resources MJ surplus -27.7%
Table 8.6, benefits of the best-case scenario – EI99
Figure 8.13, Benefits of the best-case scenario – CML2001
0.00%
10.00%
20.00%
30.00%
40.00%
50.00%
60.00%
70.00%
80.00%
90.00%
100.00%
REDUCTION - CML2001
Best case scenario Old ICE

68
Figure 8.14, Benefits of the best-case scenario – EI99
Considering a comparison with the manufacturing of the ICE scooter, see Figure 8.13 and 8.14. It
see possible to show that with a more efficient material management some parameters are
considerably improved. The abiotic depletion (CML2001) and the resources (EI99) of the two
alternatives have a spread lower than 10%. For other indicators, such as water ecotoxicity, even if
the impact reduces of more than 20% the spread with the traditional scooter is still wide. In this
sense is meaningful to state that it is the indicator for the ICE-scooter that is very low, since the
ICE-scooter assembly has a very low amount of copper and not lithium, gold and neodymium at
all, and not the indicator for the E-scooter that is that high. In this sense what is meaningful is the
reduction percentage over 20%.
8.1.3 Sensitivity analysis
A sensitivity analysis has been performed according to the variation of the hypothesised use phase
of a scooter. The use-phase according to the contribution analysis of the life cycle is the phase that
lets the E-scooter be more environmental friendly than the ICE-scooter. Nevertheless the use phase
is linked to an assumption. Reducing the expected kilometres of the use-phase the manufacturing
of the E-scooter weights more in respect with the manufacturing of the ICE-scooter.
The most important breakeven points between the life cycles of the two alternatives are:
2799 km, for the abiotic depletion. So, according to the model, it is worth to drive an
electric scooter for more than 2800 km to have a more sustainable life cycle compared to
the traditional scooter according to material and fossil fuel depletion.
1982 km, for the GWP100.
According to this values the results obtained seem enough robust. 2800 is less than 10% of the
proposed life expectance of the product
0.00%
10.00%
20.00%
30.00%
40.00%
50.00%
60.00%
70.00%
80.00%
90.00%
100.00%
REDUCTION - EI99
Best case scenario Old ICE

69
Another analysis is approached to assess which should be the life expectance of an electric scooter
to have the use phase to weigh more than the manufacturing phase:
76800 km, for abiotic depletion.
73500 km, for GWP100.
According to the model result, over 75000 km the use phase of the scooter accounts more than its
manufacturing.
The author proposes also an evaluation of the uncertainties related to the representativeness of this
LCA. The uncertainties are calculated in relation with two aspects: the results of the overall LCA
according to the cut- off model and the uncertainties according to the recycling process proposed.
The model used to assess the uncertainties is the model proposed by SimaPro 7.3, see Appendix
B.1. A table reports the evaluation of the different factors according six areas of evaluation. 1
corresponds to no uncertainty 5 to maximum uncertainty, see Table 8.7.
Life cycle analysis
with cut-off
model
Recycling
scenarios
Reliability 3 4
Completeness 2 3
Temporal
correlation
2 3
Geographical
correlation
2 3
Further
technological
correlation
3 4
Sample size 3 4
Table 8.7, Uncertainty factors
The GEOMETRIC standard deviation, covering the 95% confidence interval, of the two model
results:
Life cycle analysis with cut-off model: SDg95= 1.24. It means that the computed valued for
the LCIA have a 95% confidence interval of -19.3% and +24%.
Recycling scenarios: SDg95= 1.59. It means that the computed valued for the recycling
scenarios have a 95% confidence interval of -37% and +59%.
An LCA, especially involving product development and choice among alternatives has always to
deal with great amount of uncertainties. The author believes the life cycle analysis results, even
considering the huge uncertainties, are satisfactory, since some indicators (GWP100, abiotic
depletion) have spreads far wider than 24%.
It was easy to guess that the recycling scenarios had great uncertainties. Nevertheless, this thesis’s
scopes were to propose and assess recycling scenarios to have an overall understanding of the
benefits and not to provide certain answers. In this sense, the results of the recycling scenarios
show that there is room for reducing the EoL environmental impact of an Electric scooter and that
the designer’s choices (DfDs) play an important role.

70
8.2 Interpretation
This section embraces the interpretation of the results showed before. The considerations involves
the E-scooter life phases and its comparison with the ICE-scooter, the E-scooter weakness emerged
in the comparison and the role of the new materials, especially the neodymium, towards a higher
level of material managements.
8.2.1 E-scooter life phases and design goals
What comes out from the quantitative analysis concerning the life cycle of an electric scooter is
that the manufacturing phase is the most impacting phase among the others. This result leads to
different interpretations. The environmental impact of the manufacturing is mainly due to two
factors: the production processes and the material lifecycle of the new components encompassed
in the E-scooter assembly. In a product where the production phase is such heavy in respect with
the others, a high level of recycling is an effective way to improve the overall environmental
impact. From this point of view, the result of the qualitative analysis is more coherent with the
recycling thresholds imposed by the European directives in the last decades. For the traditional
vehicles, where the use phase accounts for over the 90% of the lifecycle environmental load, the
imposed recycling thresholds can lead to a contradiction. The contradiction is that to obtain high
level of recycling rate the designers have to use more recyclable and sometimes heavier materials
(metals instead polymers or composites), but heavier materials increase the fuel consumption rate,
and the fuel consumption rate plays a crucial role in the use phase impact. This contradiction is an
historical concern of vehicle manufacturers [65]. In the E-scooter the concern caused by the
manufacturing let the designer focus more freely on compliance with the recycling thresholds. The
conflict between the weight and energy consumption obviously remains but this time an effective
recycling improves the most impacting life phase and worsens the second most impacting and not
vice versa as happens for the traditional vehicles. In this sense, the results of this study can set
more clear design goals.
8.2.2 E-scooter weaknesses
The E-scooter results less environmental sustainable for the radiation and the water ecotoxicity.
The radiation is linked to the European electricity production mix and to its share of electricity
produced by nuclear power plants. The improvement of this indicator is not related to any specific
feature of the product. A way to reduce the indicator is to increase the share of renewable energies
in the electricity production mix. This solution does not only reduce GHG emissions but also
radiation emissions. However, this scenario is out of the scopes of this work.
The water ecotoxicity is a general problem of metal mining. A higher level of recycling decreases
the ecotoxicity. The copper gives the greatest contribution to the ecotoxicity. The recycling of
copper from the lithium battery and the disassembly step of the stator are improvements toward a
reduction of the ecotoxicity.
8.2.3 NdFeB, a Trojan horse for MH
The study shows that the recycling of copper is crucial for environmental sustainability. The
dismantling of the stator of the motor or the crushing and hydrometallurgical treatment of the
battery to sort the copper are steps that give an effective contribution to reduce the environmental
impact (around 10%).
The NdFeB represents less than the 0.5% of total weight of an E-scooter. Nevertheless, considering the reuse scenario hypothesized in the chapter 5 the land use decrease of 3.5% and the GWP100

71
of more than 2%. Furthermore, a reused permanent magnet accounts for almost the 25% of whole
value of a disposed E-scooter.
The two forces that drive recycling are usually thresholds decided by international directives or
economic reasons. The reuse of permanent magnets can be an economic reason. A disassembly-
purposed design (e.g. no use of glue bondage) of wheel hub motors can reduce the disassembly
time and make the reuse of NdFeB magnets remunerative. Within this boundary, the designer plays
a dominant role since he is the main responsible for the disassembly of product. In this sense, the
NdFeB could be the economic motive to justify the systematic disassembly of the E-motor. A
disassembly pre-step plays an important role towards a high rate of recycling of the copper
windings. From this point of view the permanent magnet could be an economic Trojan horse that
starts a virtuous combination based on the disassembly pre-step that leads to the complete sorting
of the material of the disposed component, see Figure 8.15 and 8.16. This pre-step, in fact, leads
to the sorting of both the most valuable material (magnet) and the most environmental impacting
material (copper) of the component. The disassembly step has also a positive influence on the
overall impact assessment of E-motor compared to the other recycling scenario proposed for the
magnet, the hydrogen decrepitation, see Figure 8.17.
Figure 8.15, Prices share of valuable materials in a wheel hub motor
Figure 8.16, Impact share of valuable materials in a wheel hub motor
Copper
NdFeB
Others
PRICE SHARE of motor copper windings and NdFeB on a disposed E-scooter
CopperNdFeB
Others
IMPACT SHARE of motor copper windings and NdFeB on the whole E-scooter

72
Figure 8.17, Water ecotoxicity of a wheel hub motor with different recycling approaches
0.00%
10.00%
20.00%
30.00%
40.00%
50.00%
60.00%
70.00%
80.00%
90.00%
100.00%
Water ecotoxity of E-motor assembly

73
9 DISCUSSION AND CONCLUSIONS
In this chapter, the author discusses the methods and the results of this master’s thesis and draws
the conclusions.
9.1 Discussions
The method used in this work are literature research, interviews, Material Hygiene as a mind-set,
patent analysis, disassembly model and LCA.
The literature research has been used to depict the way the recycling takes place and to get familiar
with all the works regarding the comparison between the two alternatives. The field of research is
very wide, especially regarding the recycling opportunities linked to the components of the electric
powertrain, nevertheless it seems to satisfy the needs of this work.
The interviews to the dismantler companies have been done to identify the EoL management of
the scooter. The companies interviewed let the author depict a sufficient framework of the
traditional scooter disposal. The fact the all the companies selected were Italian is considered a
point of strength that gives the work reliability since, as already said, Italy holds a primary position
regarding two-wheeled production and selling. For what concerns the electric scooter disposal, the
framework is not completely represented since the substantial lack of electric vehicles treated by
disposal companies. Nevertheless, the information collected let the author hypothesise a plausible
dismantle process that encompasses the sorting of the electric powertrain. The recycling of the
different E-powertrain materials takes place in further steps.
The Material Hygiene as a mind-set has been used as a way to coordinate all the data and the
information recruited during the first stages of this thesis. The Material Hygiene has been also
used to direct the efforts towards a concrete goal. The Material Hygiene, as said, works more as a
mind-set than as a proper method (proper methods are disassembly model, etc.), in this sense it
has helped to interpret the results and to give specific understanding of the matter, such as, for
example, the value analysis of the disposed scooter.
The patent analysis and the disassembly model play a role within the proposal of recycling
scenarios. These methods had the task to let the author reach an adequate understanding of the
recycling technologies or the product structure to describe plausible process flows or disassembly
steps. Furthermore, those recycling and disassembly steps had to be in a manner that allowed the
author to perform a LCA, to obtain a quantitative interpretation. Within these boundaries, the
methods appear satisfactory. It is important to state that these recycling scenarios, especially the
ones involving chemical processes might be recycling standards in the future but they also might
be not. It is believed that to design a concreate and effective chemical recycling process could be,
by itself, the topic of a master’s thesis since it requires many specific competences out of the
boundaries of this work. Nevertheless, the proposed scenarios worked properly to have the
understanding of the weight of recycling of the “new” materials in the lifecycle and to assess the
influence of the mechanical designers (Design for Disassembly) in respect to the influence of the
recycling technologies.
The Life Cycle Assessment has been chosen as method to have a quantitative knowledge of the
life cycle of the two alternatives and to validate and give quantitative meaning to the scenarios.
Within these boundaries, the LCA seems to be satisfactory. The limit of this method stays
fundamentally in the limit of the chosen data, which in a certain sense stays in the limit of the chosen topic. The point is that the wider are the boundaries of the study, and in this case study the
boundaries are wide both for the product design (average electric scooter) and for the time
boundaries (plausible recycling scenarios), wider are the data uncertainties. Data cannot represent
each case and the method can lose reliability. Nevertheless, the work investigated a field, in some

74
sense, unexplored, at least, for what concerns such a wide understanding of the material
management of a complex and relatively new product as the E-scooter. The numerical results are
considered satisfactory and useful to depict the role of the electric vehicle as an alternative for
private transportation and the benefits achievable with a proper material management. They also
point out the benefits achievable by a proper DfD and the contribution of disassemble-friendly
design
9.2 Conclusions
This master’s thesis had two aims. The first one was to perform a lifecycle comparison of a
traditional scooter and an electric scooter, regarding the energy and material flows and their
environmental load, pointing out the relative weight of the electric powertrain. The author, within
the boundaries of the chosen methods, gave a consistent answer to this question. The E-scooter
represents a green alternative considering the whole life cycle even if the its manufacturing needs
more resources than the ones required by the traditional two wheeler.
The second aim was to assess how an efficient material management could improve the
environmental load of an electric scooter. Regarding this topic, the results provide a reasonable
answer. The interpretation of this results leads to some considerations. Some recycling processes,
such as the lithium recovery process and the neodymium recycling with hydrogen decrepitation,
represent a plausible option for recycling but they actually involve several different parties such
as recycling technology developers, recycling companies, threshold directives, etc. These variables
do not allow the author to draw specific conclusions about the future of this opportunity.
Nevertheless, there is the evidence of environmental benefits for this scenario. The disassembly of
NdFeB permanent, as way to get the E-motor completely sorted out and to have a higher copper
recycling rate, represents a very interesting opportunity both from economic and environmental
opportunities strictly related to designers’ working scope.

75
10 REFERENCES
This chapter presents two lists of reference. The first list contains the references from scientific
literature, the second from websites.
10.1 Literature references
[1]Colella, Wh. G. (2000) Market prospect, design features, and performance of a fuel cell-
powered scooter. Journal of Power Sources
[2] EPA, Environmental protection administration (1998). Electric motorcycle development action
plan
[3] Luttropp, C. & Lagerstedt, J. (2006) Ecodesign and the ten golden rules: generic advice for
merging environmental aspects into product development. Journal of Cleaner Production 14
[4] Johansson, J. & Luttropp, C. (2009) Material Hygiene: improving recycling of WEEE
demonstrated on dishwashers. Journal of Cleaner Production 17, 26-35
[5] Booth, A., Papaioannou, D., & Sutton, A. (2011). Systematic Approaches to a Successful
Literature Review: SAGE Publications.
[6] Cascini, G. (2013) Functinal analysis of patent. Methods and tools for systematic innovation
course at Polytechnic of Milan
[7] Luttropp, C. (2001) Ecodesign with focus on product structures. Mechanical life cycle
handbook: Good Environmental Design and Manufacturing
[8] Poudelet, V. et al. (2012) A process-based approach to operationalize life cycle assessment
through the development of an eco-design decision support system. Journal of Cleaner Production
33, 192-201
[9] Fischer-Kowalski, M. (1998) The Intellectual History of Materials Flow Analysis, Journal of
Industrial Ecology 2(1), 61-78
[10] ACEM (2013) The motorcycle industry statistical overview
[11] Honda (2013) Environmental annual report 2013
[12] Piaggio (2013) Corporate Social Responsibility report 2013
[13] Directive 2008/98/EC on waste (2008)
[14] EU Commission (2005 ) Taking sustainable use of resources forward: A Thematic Strategy
on the prevention and recycling of waste, Commission communication
[15] Directive 2000/53/EC on ELV (2000)
[16] EPA (2014) Environmental Protection Agency of United States of America Report 2013

76
[17] Directive 2006/66/EC on batteries (2000)
[18] Xia, X. & Dinnguo, Y. (2012) chapter 3: Lithium-ion rechargeable batteries. Electrochemical
technologies for energy storage and conversion
[19] Zhao, G. et al. (2012) Recycling opportunities for Lithium-ion power batteries. Advanced
Materials Research Vols. 518-523, 3441-3444
[20] Sullivan, J.L. & Gaines, L. (2012) Status of life cycle inventories for batteries. Energy
Convension and Management 58, 134-148
[21] Larminie, J. & Lowry, J. (2012) chapter 6: Electric machines and their controllers. Electric
vehicle technology explained, 2nd Ed
[22] Georgi-Maschler, T. et al. (2012) Development of a recycling process for Li-ion batteries.
Journal of Power Sources 207, 173-182
[23] Vadenbo, C. O. (2009) Prospective environmental assessment of lithium recovery in battery
recycling
[24] Aspireco (2011) Metal battery recovery methods
[25] Sprecher, B. et al (2014) Life cycle Inventory of the production of rare earths and the
subsequent production of NdFeB rare earth permanent magnets. Environmental Science &
Technology 48(7), 3951-3958
[26] Dent, P. C. (2012) Rare earth elements and permanent magnets. Journal of applied physics
111
[27] European commissions (2010) Critical raw materials for the EU. Adhoc working group
[28] U.S. department of energy (2011) Critical materials strategy
[29] Tao, H. & Huiging, P. (2009) Formation cause, composition analysis and comprehensive
utilization of rare earth solid wastes. Journal of rare earths, vol. 27, No. 6, 1096
[30] Du, X. & Graedel, T. E. (2011) Global In-Use stocks of rare earth elements: a first estimate.
Environmental Science & Technology 45(9), 4096-4101
[31] Alonso, E. et al. (2012) Evaluating rare earth element availability: a case with revolutionary
demand from clean technologies. Environmental Science & Technology 45(9), 4096-4101
[32] Graedel, T. E. et al. (2011) What do we know about metal recycling rates? Journal of
Industrial Ecology. Volume 15, Issue 3, 355-366
[33] Leuven, K.U. et al. (2011) CR: cornerstone to the sustainable inorganic materials
management. JOM, Journal of Minerals, Metals & Materials Society, Vol. 63, Issue 12, 14-15
[34] Binnemans, K. et al. (2013) Recycling of rare earths: a critical review. Journal of cleaner
production 51, 1-22

77
[35] Tanaka, M., Koyama, K. et at. (2013) Recycling of rare earths from scrap. Handbook on the
Physics and Chemistry of Rare Earths, vol. 43, 159 – 212
[36] RoHS, Restriction of Hazardous Substances. EU 2008/35/EC (2008)
[37] Zenger, T. et al. (2003) Method of and apparatus for dismantling and storage of objects
comprising alkali metals such as alkali metal containing batteries”. Patent No. US7833646B2
[38] Tedjar, F. et al. (2010) Method for the mixed recycling of lithium-based anode batteries and
cells. Patent No. US7820317 B2
[39] Cheret, D. et al. (2007) Battery recycling. Patent No. US7169206 B2
[40] Kiser, K. (2007) Motors & Meatballs – From Trash to Treasure
[41] Walton, A. et al. (2012) The use of hydrogen to separate and recycle NdFeB magnets form
electronic waste. 22nd International Workshop on Rare Earth Magnets and their Applications
[42] Walton, A. & Williams, A. (2011) Rare earth recovery. Material World 19, 22-26.
[43] Harris, I.R., Walton, A. & Williams, A. (2013) Magnet recycling. Patent No. US0263699 A1
[44] Gua, C. Z. (2012) CAD of KITMOTTER0002 E-motor
[45] Lim, T. Y. (2011) Demagnetization system and method. Patent No. US0100981 A1
[46] Toliyat, H. A. & Kliman, G. B. (2004) Handbook of Electric Motors.
[47] Di Matthew J.K., et al. (2011) Chapter 18: Collection and Processing of Recycled Copper.
Extractive Metallurgy of Copper, 373-388
[48] Thomas, S. (2012) How green are electric vehicles? International Journal of Hydrogen
Energy, Vol. 37, Issue 7, 6053-6052
[49] Boureima, F.-S. et al. (2009) Comparative LCA of electric, hybrid, LPG and gasoline cars in
Belgian context. World Electric Vehicle Journal Vol. 3
[50] Habermacher, F. & Althaus, H.-J. (2011) Modeling material inventories and environmental
impacts of electric passenger cars
[51] Ma H. et al. (2012) A new comparison between the life cycle greenhouse gas emissions of
battery electric vehicles and internal combustion vehicles. Energy Policy 44, 160-173
[52] Bartolozzi I. et al. (2013) Comparison between hydrogen and electric vehicles by life cycle
assessment: A case study in Tuscany, Italy. Applied Energy 101, 103-111
[53] Bishop, J. D. K. et al. (2011) Investigating the technical, economic and environmental
performance of electric vehicles in the real-world: A case study using electric scooters
[54] Leuenberger, M. & Frischknecht, R. (2010) Life cycle assessment of two wheeled vehicles

78
[55] Baumann H. & Tillman A. (2004) The Hitch Hiker’s guide to LCA
[56] International standard ISO 14040 (2006)
[57] PRé Consultants (2010) SimaPro Database Manual: Methods library
[58] Fantin, N. (2003) SR assembly . Analisi mediante LCA e valutazione economica dei traposrti
nella città di Padova, 165
[59] MotoriniZanini (2010) Penelope Model Approval Certificate
[60] Sgoluppi, G. (May, 2014) Personal Consulting. Team leader of Squadracorse-Polito.
[61] Hellgren, M. (March, 2014) Personal Consulting. Research engineer at Machine Design
department KTH. [email protected]
[62] Cuenca, R.M. et al. (1999) Evaluating of Electric vehicle production and operation costs.
Report of Center for Transportation Research, Energy Systems Division of Argonne national
laboratory, 27
[63] Mubeen, M. (2008) Brushless DC Motor Primer
[64] Nordstrom D. K. Et al. (2000) Negative pH and Extremely Acidic Mine Waters from Iron
Mountain, California". Environmental Science & Technology 34 (2), 254–258
[65] Rainer, L. & Schwartze, D. (2001) End-of-life vehicle regulation in Germany and Europe –
problems and perspectives. Wuppertal Papers
10.2 Web references
[1.W] http://www.teslamotors.com/en_GB/about/executives/elonmusk, (May, 2014)
[2.W] http://www.kth.se/en/itm/inst/mmk/forskning/forskningsenheter/system-
komponentdesign/ecodesign, (May, 2014)
[3.W] KTH Primo search tool http://www.kth.se/en/kthb/litteratursokning/2.52929/kthb-primo-
1.184917 (April, 2014)
[4.W] IMechE Journal database, http://www.uk.sagepub.com/imeche.sp (April, 2014)
[5.W] MechanicalENGINEERINGnet database
http://www.crcnetbase.com/page/mechanical_engineering_ebooks (April, 2014)
[6.W] Engineering Village database, http://www.engineeringvillage.com/home.url?acw= (April,
2014)
[7.W] http://www.oxforddictionaries.com/definition/english/scooter (June, 2014)
[8.W] http://www.unece.org/trans/main/wp29/wp29wgs/wp29gen/wp29classification.html (June,

79
2014)
[9.W] http://www.navigantresearch.com/research/navigant-research-leaderboard-report-electric-
scooters (June, 2014)
[10.W] Jiangsu Xinri E-Vehicle Co., http://english.xinri.com/ (June, 2014)
[11.W] Vmoto, http://www.vmoto.com/ (June, 2014)
[12.W] Sym, http://www.sym-global.com/index (June, 2014)
[13.W] Vectrix, http://www.vectrixitalia.it/ (June, 2014)
[14.W] Terra Motors, http://www.terra-motors.com/ (June, 2014)
[15.W] Govecs, http://www.govecs.it/ (June, 2014)
[16.W] Yamaha Motors, http://www.yamaha-motor.eu/it/prodotti/scooter/index.aspx (June,
2014)
[17. W] Peugeot scooter, http://www.peugeotscooters.it/ (June, 2014)
[18. W] iO scooter, http://www.io-scooter.com/ (June, 2014)
[19. W] Nimag B.V (Nimoto), http://www.nimoto.nl/contact (June, 2014)
[20.W]http://epp.eurostat.ec.europa.eu/statistics_explained/index.php/Energy_price_statistics#C
onsumer_prices_for_petroleum_products (September, 2014)
[21.W] http://www.acem.com (May, 2014)
[22.W] http://www.acem.eu/index.php/policy-access/environment/end-of-live-directive (May,
2014)
[23.W] Autodemolizioni Busche s.n.c. , http://www.autodemolizionebusche.it/ (April, 2014)
[24.W] Motoriciclo, http://www.motoriciclo.it/ (April 2014)
[25.W] R.E.S. demolizioni, http://www.resautodemolizioni.com/ (April 2014)
[26.W] Ecostrada, http://www.ecostrada.it/ (April 2014)
[27.W] COBAT, Italian collection consortium for spent batteries, http://www.cobat.it/ (May,
2014)
[28.W] COOU, Italian collection consortium for waste oil, http://www.coou.it/ (May, 2014)
[29.W] EcoTyre, collection consortium for tyres, http://www.ecotyre.it/index.php?lang=en
(May, 2014)
[30.W] Batrec, http://www.batrec.com (May, 2014)

80
[31.W] Retriev tech., http://retrievtech.com/ (May, 2014)
[32.W] Recupyl, http://www.recupyl.com (May, 2014)
[33.W] Umicore, http://www.umicore.com/en (May, 2014)
[34.W] http://minerals.usgs.gov/minerals/pubs/commodity/rare_earths/mcs-2014-raree.pdf (June,
2014)
[35. W] London stock exchange, http://www.londonstockexchange.com (June, 2014)
[36.W] Platts, http://www.platts.com (June, 2014)
[37.W] Plasticker, http://plasticker.de/recybase/index_en.php (June, 2014)
[38.w] Indexmundi, http://www.indexmundi.com/commodities/ (June, 2014)
[39.W] Goldprice, http://goldprice.org/ (June ,2014)
[40.W] Gelon, http://www.gelonlib.net/product/1683090137-
219915679/Spinel_lithium_manganese_oxide.html (June, 2014)
[41.W] Hanhaimagnet http://hanhaimagnet.com/index.php?c=list&cs=sintered_ndfeb (June,
2014)
[42.W] Teslamotor http://www.teslamotors.com/models/design (June, 2014)
[43.W] Ecoinvent http://www.ecoinvent.org (June, 2014)
[44.W] Technical drawings of Aprilia SR 50 1997-2001
http://www.easyparts.it/choosedrawings/1/65/l.ye/0-968-1-m412-m167-m459-m11852-m65-
s744/Ricambi_Originali_Aprilia_SR_50_Air_Lemon_Yellow_Sport_2001.html (May, 2014)

81
APPENDIX A
This appendix shows the results of a literature research regarding the permanent magnet life
cycle. The lifecycle is the same used for the LCA. There is also a section involving the recycling
opportunities for the rare earths.
A.1 Permanent magnet life cycle
The permanent magnets are made of an alloy of NdFeB. The most important material of the alloy
is the rare earth neodymium.
The process flow towards the mining of neodymium consists in different steps [25]. The first
operation aims to extract the rare earth materials. It takes place with traditional mining technique.
The ore has 4.1% of rare earth oxide, REO, and 30-35% of iron. After the mining, the REO
containing materials (bastnasite and monazite) are separated from iron and brought to the
beneficiation site. The ore has also 0.04% of ThO2. The beneficiation consists in a mechanical,
magnetic and chemical process. The beneficiation results is a 61% REO-containing mineral.
The next operation is acid roasting. The acid roasting removes all not-water soluble materials. The
acid roasting is a preparation step for the acid leaching. The acid leaching process let the solution
have a higher level of purity. After the acid leaching with the help of soda the REO salt precipitates
and then is washed and dried. The last steps it solvent extraction that gives a REO with a purity up
to 99.99%. The process flow just described has been hypothesized by Sprecher et al., see Figure
A.1. It is the same implemented in the life cycle assessment of this thesis.
Mining(4.1% REO)
Crushing
Magnetic separation
Flotation
Beneficiation(61% REO)
AlcoholPolypropylene
Pine oils
Acid roasting(RE2(SO4)3)
Sulphuricacid
Leaching(92% RECl3)
Solvent extraction(99.99% Nd2O3)
Soda
Organic solvent P204HCl
Kerosene
Figure A.1, Nd mining

82
Sprecher et al. hypothesized also the NdFeB production route. The scheme is reported after this
paragraph, see Figure A.2. Also this process has been implemented in the life cycle assessment.
The first step for the production of the magnet usually dissolves the REO in molten salt and then
electrolyzes to obtain pure liquid neodymium. The next process leads to the making of the NdFeB
alloy. A mixture of the three materials, Nd, Fe and B is molten in a furnace. To have a fast cooling
the molten alloys is poured over a rapid rotating copper wheel. Hydrogen decrepitation exploits
structural properties of the NdFeB flakes. The contact with a hydrogen atmosphere causes the alloy
to fall apart in a fine powder. This process reduces the energy needed for the following process the
jet milling. The jet milling is the last process to reduce the size of the powder of the alloy before
the sintering. The final size of the particle is 5-7 µm. Before the sintering, the last processes are
the aligning, made through a magnetic pulse, and the pressing. The sintering takes place in a
vacuum chamber at the temperature of 1000°C to let the alloy particles liquefy. The next operations
are the grinding and the slicing with traditional mechanical methods. A further operation is the
nickel coating made through electroplating. At last, the magnetizing and the testing take place.
Nd-Oxide molten salt electrolysis(Pure Nd liquid)
NdFeB alloying
NdFeB strip casting
Hydrogen decrepitation
Hydrogen
Jet milling
Aligning and pressing
Vacuum sintering
Fluoride base molten salt
Iron,Boron
Vacuum sintering
Vacuum sintering
Grinding and slicing
Electroplating
Pulse magnetizing and testing
Figure A.2, NdFeB production chain

83
A.2 Recycling opportunities for permanent magnets Considering the complex architectures of the devices using permanent magnets a turning point
could be a sorting method downstream a shredding step, like the magnetic step that let the recyclers
sort ferrous and non-ferrous metals. Nowadays, there is not available method for this kind of
downstream shorting for REEs. However, if this process will become available a high
concentration of oxygen and impurities will be present in the recovered material not allowing a
direct re-processing. It is from this point of view that all the other methods, currently just present
at a lab-scale, could become part of the recycle chain. A panoramic view upon these methods is
reported in a table, see Table A.1 [34]
Table A.1, Solution for the recycling of permanent magnet [34]
Method Pro Cons
Direct re-use Most economical and environmental
friendly: no use of
chemicals or energy
No waste generate
Only for specific products like wind
turbine or vehicle
electric motors
Not enough volume today
Mechanical dismantle Less energy-consuming than
pyrometallurgical and
hydrometallurgical
processes
No waste generated
Too much related to specific architectures
Reprocessing after
hydrogen decrepitation Less energy-
consuming than
pyrometallurgical and
hydrometallurgical
processes
No waste generated
Too much related to specific architectures
No suitable with for magnets with big
compositional
variations
Hydrometallurgical
methods Generally applicable
to all kind of magnet
composition
Same processing step from primary ore
Complex process flow
Large consumption of
chemicals
Large consumption of water
Pyrometallurgical methods Generally applicable
to all kind of magnet
composition
Less steps than the hydrometallurgical
methods
Obtaining of REEs in liquid state
Large energy
consumption
Electroslag refining and glass slag method
generate large amount
of waste.
Gas-phase extraction Generally applicable to all types of magnet
compositions
No generation of waste water
Large chlorine gas consumption
Aluminum chloride is very corrosive

84
APPENDIX B
This appendix contains integrations to the LCA chapter, see Chapter 7.
B.1 Uncertainties
The uncertainties have been valued according to the table proposed by SimaPro 7.3. See Table
B.1. The factors are then input for the equation:
𝑆𝐷𝑔95 = 𝑒𝑥𝑝√[ln(𝑈1)2]+[ln(𝑈2)
2]+[ln(𝑈3)2]+[ln(𝑈4)
2]+[ln(𝑈5)2]+[ln(𝑈6)
2]
Table B.1, Uncertainty factor table

85
B.2 LCI of an E-scooter This section reports the LCI as they have been reported in the LCA run with the software
SimaPro 7.3. The LCI defines the components and the manufacturing processes of the BLCD
motor, see Table B.3, of the BLDC controller, see Table B.4, and of the whole E-scooter, see
Table B.5.
Product: BLDC motor, 1 kg
1. Known input form technosphere (material/fuels)
Process type Materials EcoInvent 2.2 dataset Unit Amount
Material Steel Steel, at plant Kg 0.4959
Material Chromium steel Chromium steel 18/8, at
plant
Kg 0.0672
Material Copper Copper, at storage Kg 0.1343
Material Permanent
magnet
NdFeB magnet, at plant Kg 0.04
Material Aluminium Aluminium, product mix Kg 0.2565
Material PVC PVC, at plant kg 0.0061
Processing Steel Sheet rolling, steel Kg 0.4959
Processing Copper Wire drawing Kg 0.1343
Auxiliaries Manufacturing plant p 0.000000004
Table B.2, LCI of BLDC motor on SimaPro 7.3
Product: BLDC controller, 1 kg
1. Known input form technosphere (material/fuels)
Process type Materials EcoInvent 2.2 dataset Unit Amount
Material Steel Steel, at plant Kg 0.06
Material Polyethylene Polyethylene, HDPE Kg 0.3219
Material Aluminium Aluminium, product mix Kg 0.4
Material Cable Cable, ribbon cable Kg 0.032
Material PCB Printed circuit board,
mixed, at plant
Kg 0.14
Processing Steel Sheet rolling, steel Kg 0.06
Processing Aluminium Sheet rolling, aluminium Kg 0.4
Processing Injection
moulding
Injection moulding Kg 0.32
Auxiliaries PCB plant p 0.000000004
Table B.3, LCI of BLDC controller on SimaPro 7.3

86
Product: E scooter, 1 unit
1. Known input form technosphere (material/fuels)
Process type Materials EcoInvent 2.2 dataset Unit Amount
Material Steel Steel, at plant Kg 6.93
Material Reinforcing steel Steel, at plant Kg 20.51
Material Chromium Chromium, at storage Kg 0.16
Material Nickel Nickel 99%, at storage Kg 0.093
Material Aluminium Aluminium, product mix Kg 18.18
Material Polyethylene Polyethylene, HDPE Kg 1.82
Material Polypropylene Polypropylene, at plant Kg 11.92
Material Polyvinylchloride Cable, ribbon cable Kg 1.92
Material Synthetic rubber Synthetic rubber, at plant Kg 4.85
Material Paint Alkyd paint, at plant Kg 0.45
Material Zinc Zinc, primary, at plant Kg 0.38
Processing Steel Sheet rolling, steel Kg 14.31
Processing Steel Section bar rolling, steel Kg 7.91
Processing Copper Wire drawing, copper Kg 0.59
Processing Polymers Injection moulding Kg 15.7
Auxiliaries Natural gas, burnt in
furnace, at plant
MJ 39.67
Auxiliaries Electricity, medium
voltage, at grid
kWh 23.17
Auxiliaries Light fuel oil, burnt in
furnace, at plant
MJ 12.63
Auxiliaries Diesel, burnt in furnace,
at plant
MJ 9.09
Auxiliaries Tap water, at user Kg 215
Auxiliaries Ethylene, at plant Kg 1.24
Auxiliaries Transport, lorry tkm 5
Auxiliaries Transport, freight tkm 1870
Auxiliaries Road vehicle plant p 0.000000193
Component LiMnO battery Kg 24
Component BLDC motor Kg 12
Component BLDC controller kg 2.2
Table B.4, LCI of E-scooter on SimaPro 7.3
The calculation of the energy allocation for the manufacturing of an average scooter is calculated
using the approach proposed by Leuenberger, M. & Frischknecht, R., [54]. The assumption is that
the energy needed to manufacture an E-scooter is the same of an ICE-scooter, except for the
electric powertrain that has its own energy allocation. The data are from the Environmental report
of Honda [11]. The report presents the total amount of electricity from grid, natural gas, oil based
fuel and diesel consumed during 2013. These data are to be multiplied by the percentage share of
sales due to motorcycles. Then, the obtained values are divided by the annual production of
motorcycles by Honda. These last values are finally divided by a factor two to account just for the
production of scooters (50cc). The process is reported in a table, see Table B.6. The same approach
has been used for the Annual report of Piaggio [12], see Table B.7. The results are different. The
choice of one or the other of the results does not affect the comparison between the alternatives.
In fact, the original assumption is that the energy allocation for the manufacturing is the same for
the ICE-scooter and the E-scooter. The model adopts the values from Honda to be comparable
with the work of Leuenberger, M. & Frischknecht, R. that uses as reference the Honda Annual
Report of 2008.

87
Table B.5, Energy consumption for manufacturing according to Honda 2013 data.
PIAGGIO
Consumption Piaggio
2013
Italy Spain India Vietnam Total
Electricity demand
(1000*kWh)
45887 913 26198 13979 86977
Natural gas
demand(1000*GJ)
282.27 0.17 - - 282.45
Oil based fuel
demand(1000*GJ)
- - 17.81 1.04 18.85
Diesel(1000*GJ) 0.07 3.80 75.18 31.32 110.37
Consumption per scooter
(50cc)
Total
Electricity demand (kWh) 112.87
Natural gas demand(MJ) 366.55
Oil based fuel demand(MJ) 24.46
Diesel(MJ) 143.24
Table B.6, Energy consumption for manufacturing according to Piaggio 2013 data.
HONDA
Consumption Honda
2013
Japan N.America S.America Europe Asia Total
Electricity demand
(1000*MWh)
1560 1820 322 151 1610 5463
Natural gas
demand(1000*GJ)
85 6410 240 526 2093 9354
Oil based fuel
demand(1000*GJ)
806 273 336 7 1556 2978
Diesel(1000*GJ) 8 301 41 7 1788 2145
Sales Sales (¥_106) Sales(%)
Motorcycle 1339549 13.51
Totale sales 9915065 100
Annual Production Total Japan Others
Motorcycle 15926000 184000 15742000
Consumption per
motorcycle fleet
production
Total
Electricity demand
(1000*MWh)
738.06
Natural gas
demand(1000*GJ)
1263.75
Oil based fuel
demand(1000*GJ)
402.33
Diesel(1000*GJ) 289.79
Consumption per scooter
(50cc)
Total
Electricity demand (kWh) 23.17
Natural gas demand(MJ) 39.67
Oil based fuel
demand(MJ)
12.63
Diesel(MJ) 9.09

88
B.3 LCIA, impact of metals involved in recycling scenarios This appendix section reports the LCIA of NdFeB, LiMnO2 and Copper. The comparison involves
both the primary and the secondary (from recycle) metals. The results of the LCIA are a balance
between the amount of a certain material in the LCI and its specific impact assessment. In this
section are reported the specific impact assessment to have a wider view of the LCI. The gold is
not reported since it has by far the greatest environmental load, around three order of magnitude
more affecting than copper. See Figure B.1, B.2 and B.3.
Figure B.1, Specific abiotic depletion of materials
Figure B.2, Specific GWP100 of materials
Figure B.3, Specific Water Ecotoxicity of materials
0.00%10.00%20.00%30.00%40.00%50.00%60.00%70.00%80.00%90.00%
100.00%
Abiotic depletion - 1 kg of material comparison
0.00%10.00%20.00%30.00%40.00%50.00%60.00%70.00%80.00%90.00%
100.00%
GWP100 - 1 kg of material comparison
0.00%10.00%20.00%30.00%40.00%50.00%60.00%70.00%80.00%90.00%
100.00%
Water Ecotox - 1 kg of material comparison

89