Material comparators for end-of-waste decisions - GOV.UK
37
Title here in 8pt Arial (change text colour to black) i Material comparators for end-of-waste decisions: Manufactured fertilisers
-
Upload
khangminh22 -
Category
Documents
-
view
2 -
download
0
Transcript of Material comparators for end-of-waste decisions - GOV.UK
Title here in 8pt Arial (change text colour to black) i
Material comparators for end-of-waste decisions:
Manufactured fertilisers

ii Material comparators: manufactured fertilisers
The Environment Agency is the leading public body protecting and improving the environment in England and Wales.
It’s our job to make sure that air, land and water are looked after by everyone in today’s society, so that tomorrow’s generations inherit a cleaner, healthier world.
Our work includes tackling flooding and pollution incidents, reducing industry’s impacts on the environment, cleaning up rivers, coastal waters and contaminated land, and improving wildlife habitats.
This report is the result of research carried out by the Environment Agency’s Evidence Directorate.
Published by: Environment Agency, Horizon House, Deanery Road, Bristol, BS1 5AH www.environment-agency.gov.uk ISBN: 978-1-84911-300-7 © Environment Agency – September 2013 All rights reserved. This document may be reproduced with prior permission of the Environment Agency. The views and statements expressed in this report are those of the author alone. The views or statements expressed in this publication do not necessarily represent the views of the Environment Agency and the Environment Agency cannot accept any responsibility for such views or statements. Further copies of this report are available from our publications catalogue: http://publications.environment-agency.gov.uk or our National Customer Contact Centre: T: 08708 506506 E: [email protected].
Authors: Bob Barnes, Fran Walker, Stuart Homann and Roger Hoare Dissemination Status: Internal only Keywords: Waste, resources, land, fertilisers, end of waste Environment Agency’s Project Manager: Bob Barnes, Evidence Directorate Environment Agency’s Project Executive: Roger Hoare, Environment and Business
Material comparators: manufactured fertilisers iii
Evidence at the Environment Agency Evidence underpins the work of the Environment Agency. It provides an up-to-date understanding of the world about us, helps us to develop tools and techniques to monitor and manage our environment as efficiently and effectively as possible. It also helps us to understand how the environment is changing and to identify what the future pressures may be.
The work of the Environment Agency’s Evidence Directorate is a key ingredient in the partnership between research, guidance and operations that enables the Environment Agency to protect and restore our environment.
This report was produced by the Scientific and Evidence Services team within Evidence. The team focuses on four main areas of activity:
Setting the agenda, by providing the evidence for decisions;
Maintaining scientific credibility, by ensuring that our programmes and projects are fit for purpose and executed according to international standards;
Carrying out research, either by contracting it out to research organisations and consultancies or by doing it ourselves;
Delivering information, advice, tools and techniques, by making appropriate products available.
Miranda Kavanagh
Director of Evidence
iv Material comparators: manufactured fertilisers
Acknowledgements The Environment Agency wishes to thank the following organisations and individuals for assistance in producing this report:
NiPERA – The Nickel Producers Environmental Research Association
Fiona Nicholson, ADAS UK Ltd
Executive summary This report details the work undertaken to define non-waste material comparators for end-of-waste decisions for waste-derived materials intended for use as a fertiliser.
The Waste Framework Directive (Article 6) provides criteria for identifying when a waste material has become a product and no longer needs to be regulated as a waste. Through Article 6 the case law requires us to consider the environmental and human health impacts from materials in comparison with their non-waste material alternatives.
... "It should be enough that the holder has converted the waste material into a distinct, marketable product, which can be used in exactly the same way as a [non-waste material], and with no worse environmental effects...”
Data have been collected via a literature review and are presented for:
• Triple superphosphate (TSP)
• Other straight phosphate fertilisers
• Phosphate potassium (PK) fertilisers
• Nitrate phosphate (NP) fertilisers
• Low N (N<19%) fertilisers
• High N (N≥19%) fertilisers
Where more than ten data points have been identified, a 90th percentile of the dataset has been calculated.
We recommend that the 90th percentile concentration of a contaminant in the waste is compared to the relevant 90th percentile for the element in the non-waste comparator (adjusted as necessary where the application rate of the waste differs from that of the comparator).
We were not able to find any papers or data identifying organic contaminants in manufactured fertilisers and therefore assume that any such contaminants are below an appropriate level of detection.
The comparison against the data from the literature acts as a screening stage in the end-of-waste process. Where the composition of the waste material falls outside the 90th percentile value this should trigger further analysis and risk assessment.

Material comparators: manufactured fertilisers v
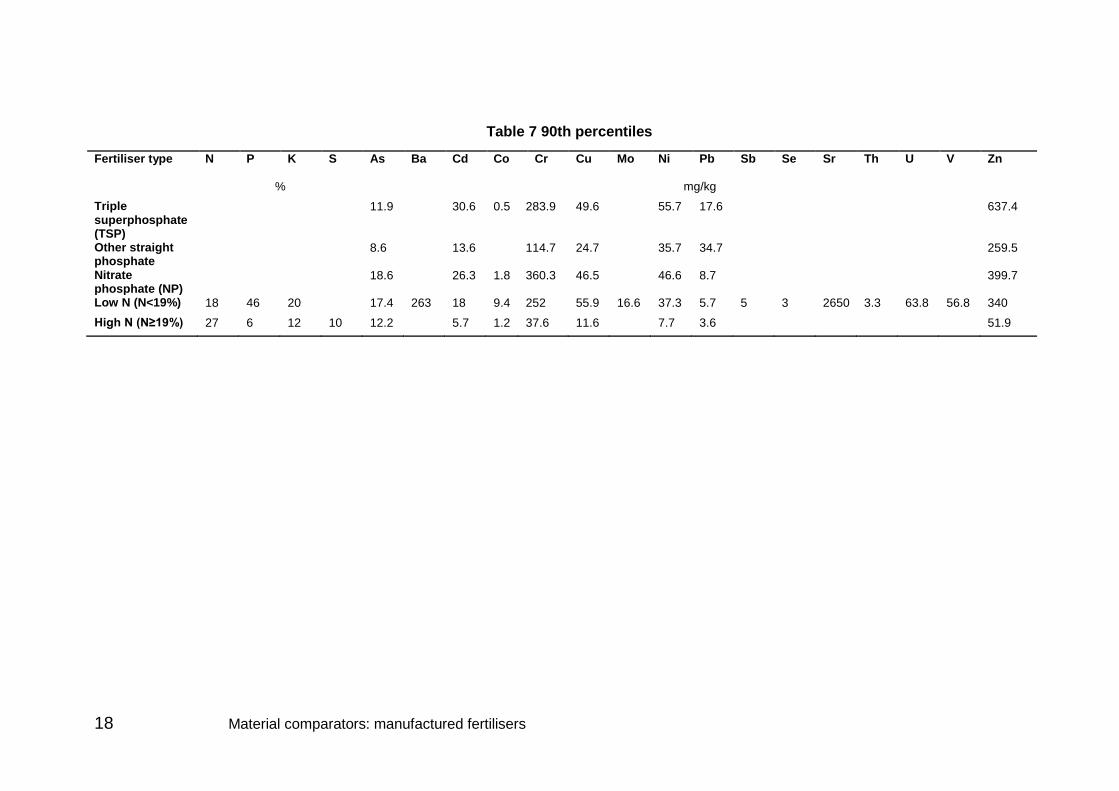
The 90th percentile levels (mg/kg) for the main contaminants are given in the table below.
Fertiliser type As Cd
Co
Cr (total)
Cu
Ni
Pb
Zn
Triple superphosphate (TSP)
11.9 30.6 0.5 283.9 49.6 55.7 17.6 637.4
Other straight phosphate
8.6 13.6 114.7 24.7 35.7 34.7 259.5
Nitrate phosphate (NP)
18.6 26.3 1.8 360.3 46.5 46.6 8.7 399.7
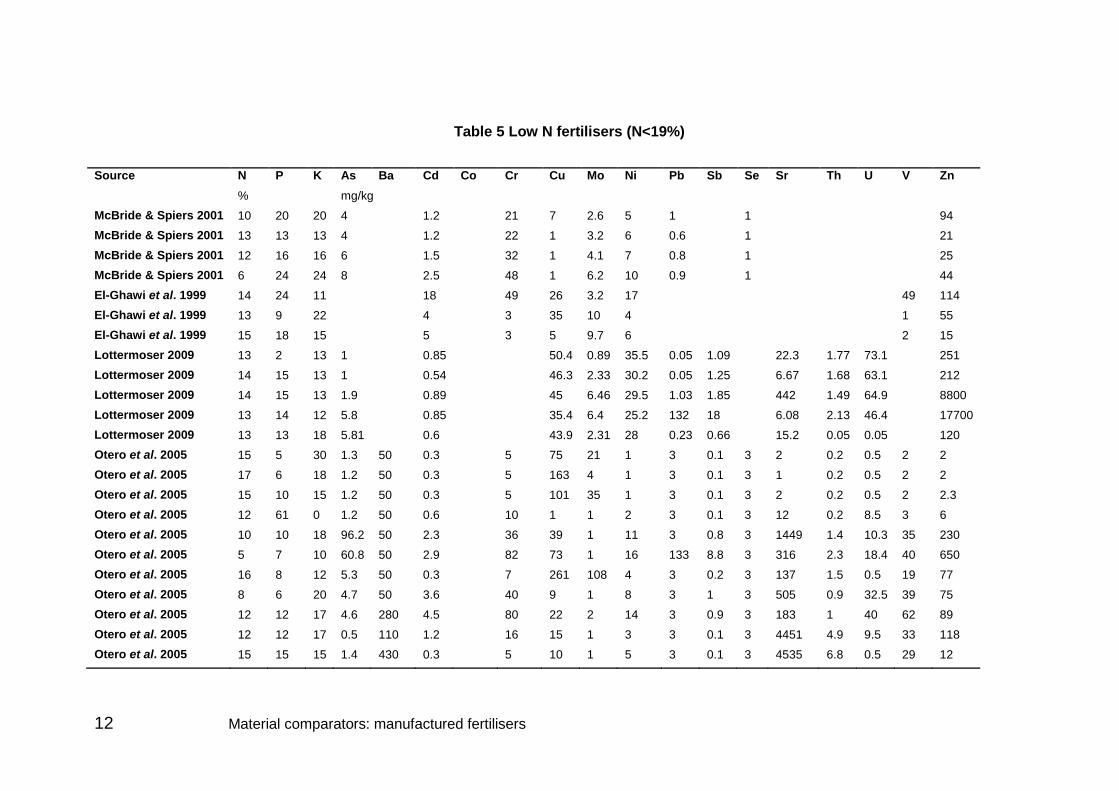
Low N (N<19%) 17.4 18 9.4 252.1 55.9 37.3 5.7 339.9
High N (N≥19%) 12.2 5.7 1.2 37.6 11.6 7.7 3.6 51.9
vi Material comparators: manufactured fertilisers
Contents Introduction 1
Types of fertiliser 2
Recommendations for end-of-waste decision making 4
References 19
Abbreviations and acronyms 24
Appendix 1 Literature search terms 25
Appendix 2 Results of the literature review 27
Appendix 3 Statistical analysis of data 29
Tables and figures
Table 1 Triple superphosphate (TSP) 6 Table 2 Other straight phosphate fertilisers 8 Table 3 Nitrate phosphate (NP) fertilisers 9 Table 4 Phosphate potassium (PK) fertilisers 11 Table 5 Low N fertilisers (N<19%) 12 Table 6 High N fertilisers (N≥19%) 16 Table 7 90th percentiles 18 Table 8 Elemental composition of fertilisers (mg/kg) 28 Table 9 Fertiliser weight based (n=196) 28
Figure 1 Low nitrogen fertilisers (N<19%) 29
Material comparators: manufactured fertilisers 1
Introduction The Evidence Directorate of the Environment Agency has been tasked with investigating and developing a dataset of different ‘non-waste material comparators’ to assist with making end-of-waste decisions.
The Waste Framework Directive (Article 6) provides criteria for identifying when a waste material has become a product and no longer needs to be regulated as a waste. Through Article 6 the case law requires us to consider the environmental and human health impacts from materials in comparison with their non-waste alternatives.
... "It should be enough that the holder has converted the waste material into a distinct, marketable product, which can be used in exactly the same way as a [non-waste material], and with no worse environmental effects...”
For example, if we were assessing the impact from a biodiesel derived from waste we would compare it against contaminants within regular diesel.
It is not the purpose of this work to undertake any comparisons between the non-waste materials and the wastes. It is purely to collect and collate the data so that the comparisons can be made by others.
This report presents the results of a literature review designed to collect and collate published data on the chemical analysis of manufactured commercial fertilisers.
Bibliographic search engines and general internet searches were conducted. Contacts within Defra, the Agricultural Industries Confederation (AIC) and ADAS were approached to source grey literature. The literature review search terms are reproduced in Appendix 1.
2 Material comparators: manufactured fertilisers
Types of fertiliser The Defra publication ‘Fertiliser Manual (RB209)’ states that:
Some 13 elements, in addition to carbon (C), hydrogen (H) and oxygen (O) are known to be essential for plant growth and they can be divided into two groups:
• Macronutrients: these are nitrogen (N), phosphorus (P), potassium (K), calcium (Ca), magnesium (Mg) and sulphur (S) and are required in relatively large amounts.
• Micronutrients (trace elements): these include iron (Fe), copper (Cu), manganese (Mn), zinc (Zn), boron (B), molybdenum (Mo) and chlorine (Cl), and are required in smaller amounts than the macronutrients.
The names macro- and micro- nutrients do not refer to relative importance in plant nutrition; a deficiency of any one of these elements can limit growth and result in decreased yield. It is therefore important to ensure that there is an optimum supply of all nutrients – if a plant is seriously deficient in, for example, potassium it will not be able to utilise fully any added nitrogen and reach its full potential yield and any unutilised nitrogen may be lost from the field.
In the UK, two conventions are used as follows:
• For fertiliser contents and for recommendations, phosphorus is expressed in the oxide form phosphate (P2O5) and potassium as potash (K2O). Sulphur, magnesium and sodium also are expressed in oxide forms (SO3, MgO and Na2O).
• Soil and crop analysis reports usually show elemental forms for example mg P/kg or mg K/l.
Other elements found in plants, which may not be essential for their growth include, cobalt (Co), nickel (Ni), selenium (Se), silicon (Si) and sodium (Na). Sodium has a positive effect on the growth of a few crops. Some elements, such as cobalt, iodine (I), nickel and selenium are important in animal nutrition. These are normally supplied to the animal via plants, and must consequently be available in the soil for uptake by plant roots.
We have followed this naming convention for oxides within this report with respect to N, P and K. However, all other elements, whether plant nutrient or ‘contaminant’, are expressed in the elemental forms above.
The Defra report The British Survey of Fertiliser Practice: Fertiliser Use on Farm Crops for Crop Year 2011 places fertilisers into the following categories:
• Ammonium nitrate
• Urea
• Calcium ammonium nitrate (CAN)
• Urea ammonium nitrate (UAN)
• Other straight N
• Triple superphosphate (TSP)
• Other straight P
Material comparators: manufactured fertilisers 3
• Muriate of potash (MOP)
• Other straight K
• PK
• NK
• Low N (<19% N)
• High N (≥19% N)
We have attempted to follow this characterisation; however, sufficient data were only available for those categories highlighted in bold above. In addition data is presented for NP fertilisers, such as monoammonium phosphate and diammonium phosphate (MAP and DAP).
References are presented in two sections:
• One containing references, data from which have been used in Tables 1 to 6 (nine in total).
• The other containing references which, for the reasons explained in Appendices 2 and 3, have not been used to derive non-waste comparators (48 in total).

4 Material comparators: manufactured fertilisers
Recommendations for end-of-waste decision making Data gaps
We have good data for only a limited number of fertiliser types (see below).
Where the composition data do not exist, we recommend that sampling and analysis of fertilisers used in the UK is undertaken.
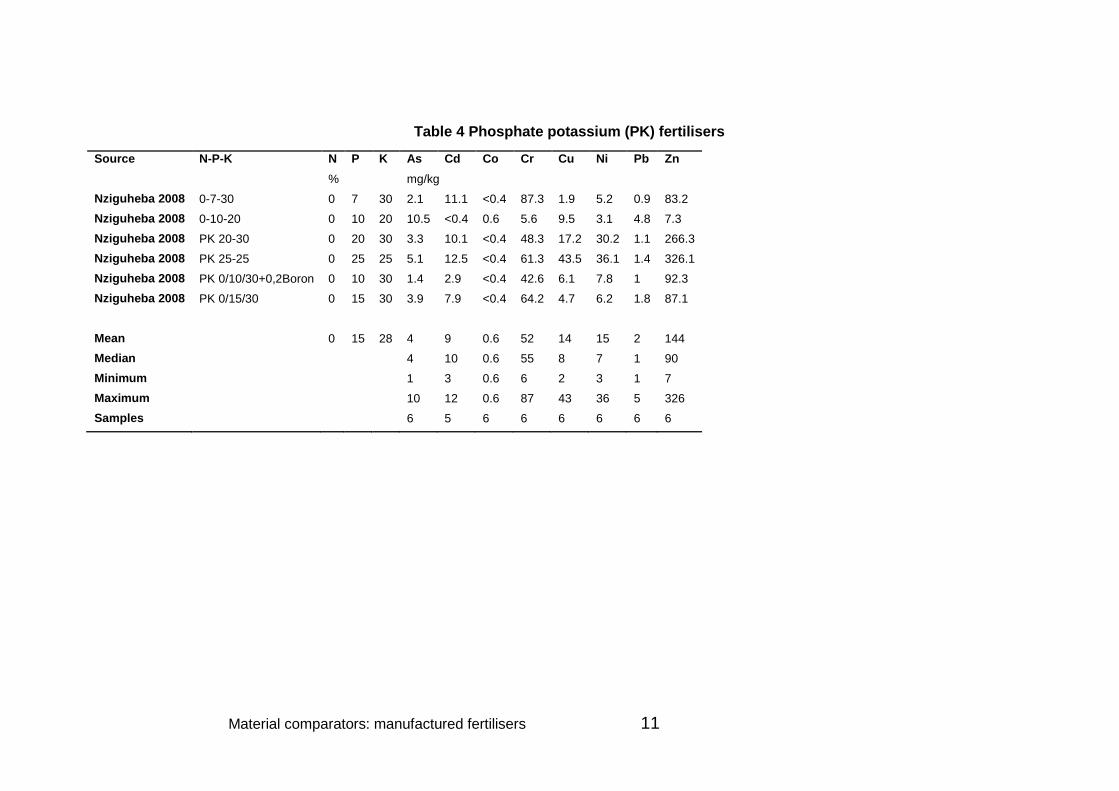
We recommend that this sampling programme covers all fertiliser types (including those for which data do already exist) to ensure a consistent and comprehensive dataset. Of the six datasets, only Table 4 (PK fertilisers) does not contain enough data to support producing 90%ile values.
For a number of years now, the European Union has discussed setting a maximum cadmium concentration in agricultural fertilisers. Clearly were such a level set for this or other elements, this report would have to be re-visited.
Existing data
Where good data currently exist, we recommend that these are used to screen the materials to be used in the place of manufactured fertilisers. This screening exercise will help compare differences between the waste derived material and the non waste comparator and in doing so identify where additional risk to the environment and human health may exist. The screening process is set out below.
Using the data tables
Data are split into six different fertiliser types as follows: Table 1 Triple superphosphate (TSP) Table 2 Other straight phosphate fertilisers Table 3 Nitrate phosphate (NP) fertilisers Table 4 Phosphate potassium (PK) fertilisers Table 5 Low N fertilisers (N<19%) Table 6 High N fertilisers (N≥19%) Figure 1 in Appendix 3 illustrates the nature of the data distribution and the influence of outliers upon it. We recommend comparing the 90th percentile (90th%ile) concentration of ‘contaminants’ in the waste-derived material to the 90th%ile concentration in the comparators. The 90th%ile contaminant concentrations are given in Table 7.
Material comparators: manufactured fertilisers 5
The 90th%iles lessen the effects of high-end outliers in the data while not making this screening test too onerous. If the waste was compared to the highest concentrations in fertilisers then this could potentially increase the loading of these contaminants to land. For phosphate potassium (PK) fertilisers there are fewer than ten data points and so the data is not adequate to produce a 90th%ile for screening purposes. In making the comparison with the 90th%ile contaminant concentrations it is important to make any necessary adjustments for the application rate. The levels of N, P and K are specified in the tables. Where a waste-derived product has significantly different levels of N, P and K from the comparator then the effect of application rate must be taken into account. For example, a waste-derived fertiliser with half of the P content of a non-waste comparator will typically require twice the application rate to deliver the same amount of P to an agricultural soil. In order to pass this screening stage, the assessor can take account of this effect by reducing the effective concentration of the comparator (in the example above the level of a contaminant in the comparator would be halved). Other more complex differences in application rates and methods may require more detailed risk assessment. The data may not cover all the potential contaminants that may be found in waste materials. For example, we were not able to find any papers or data identifying organic contaminants in manufactured fertilisers. Where the data do not exist, we recommend that the level of the contaminant must be below an appropriate limit of detection in order to pass this screening stage. Where a waste material does not pass this end-of-waste screening stage, this should trigger further testing and risk assessment to meet (or otherwise) the end-of-waste legal test.

6 Material comparators: manufactured fertilisers
Table 1 Triple superphosphate (TSP)
Source Name N P K As Cd Co Cr Cu Mo Ni Pb Sr V Zn F % mg/kg Conceicao 2006 TSP 0 47 0 2 6 10 16 23 25 492 Conceicao 2006 TSP 0 47 0 2 5 9 14 22 20 546 McBride & Spiers 2001 TSP 0 47 0 11 8.1 83 4 538 Molina 2009 TSP (mean) 0 47 0 17.9 28.8 633 75.1 6.9 10.6 16.5 430 600 USEPA 1999 TSP 0 47 0 13.9 6.4 90.1 45.1 21.9 13.2 132 87.1 Marks 1996 TSP (mean n=8) 0 47 0 7.5 30.6 258.1 21.9 18.4 36.5 1.2 485.6 19600 Nziguheba 2008 TSP 0 47 0 7.5 8.4 0.4 167.3 30.6 21 4 281.5 Nziguheba 2008 TSP 0 47 0 5.9 30.7 0.5 248.3 4.7 12.2 3 223.3 Nziguheba 2008 TSP 0 47 0 8.6 8.7 0.5 161.3 25.8 21.4 4.6 247 Nziguheba 2008 TSP 0 47 0 8 23.7 0.5 160.5 50.1 55.4 3.9 603 Nziguheba 2008 TSP 0 47 0 6.5 31.9 0.4 261.5 4.9 13.6 2.4 247.7 Nziguheba 2008 GTSP 0 47 0 7.6 24.8 0.4 160.1 39.9 66.4 3.2 636.3 Nziguheba 2008 GTSP 0 47 0 3.4 13 0.4 65.5 21.2 30.6 2.9 253.4 Nziguheba 2008 GTSP 0 47 0 6.5 29.6 0.4 150.9 39.1 56.9 2.5 641.7 Nziguheba 2008 TSP 0 47 0 8.1 22.7 0.4 150 41.6 52.6 2.4 593 Nziguheba 2008 TSP 0 47 0 7.3 8 0.4 162.1 25.5 20.5 4.7 250.4 Nziguheba 2008 TSP 0 47 0 5.1 9.4 0.4 177.7 29.7 23.6 4 303 Nziguheba 2008 TSP 0 47 0 5.2 29.5 0.4 251.6 49.5 12.7 4.7 669.7 Nziguheba 2008 TSP 0 47 0 7.8 8.6 0.4 154.5 26.6 19.9 4.1 272.4 Nziguheba 2008 TSP 0 46 0 9.3 24.9 0.4 485.8 44.4 44 3.6 469.4 Mean 8.2 17.6 0.4 191.6 29.9 12.7 28.9 6.6 538 281 363.6 6879.3 Median 7.5 17.9 0.4 160.9 28.2 12.7 21.4 4 538 281 281.5 546 Minimum 3.4 2 0.4 5 4 6.9 10.6 1.2 538 132 20 492
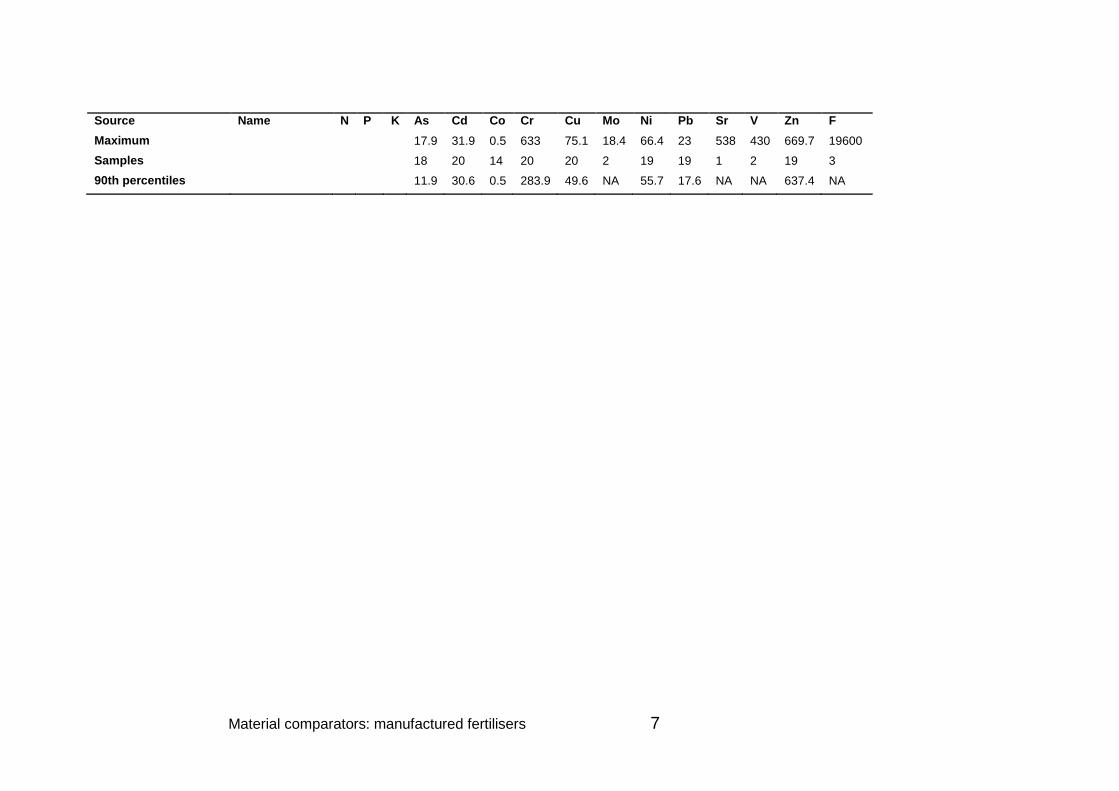
Material comparators: manufactured fertilisers 7
Source Name N P K As Cd Co Cr Cu Mo Ni Pb Sr V Zn F Maximum 17.9 31.9 0.5 633 75.1 18.4 66.4 23 538 430 669.7 19600 Samples 18 20 14 20 20 2 19 19 1 2 19 3 90th percentiles 11.9 30.6 0.5 283.9 49.6 NA 55.7 17.6 NA NA 637.4 NA
8 Material comparators: manufactured fertilisers
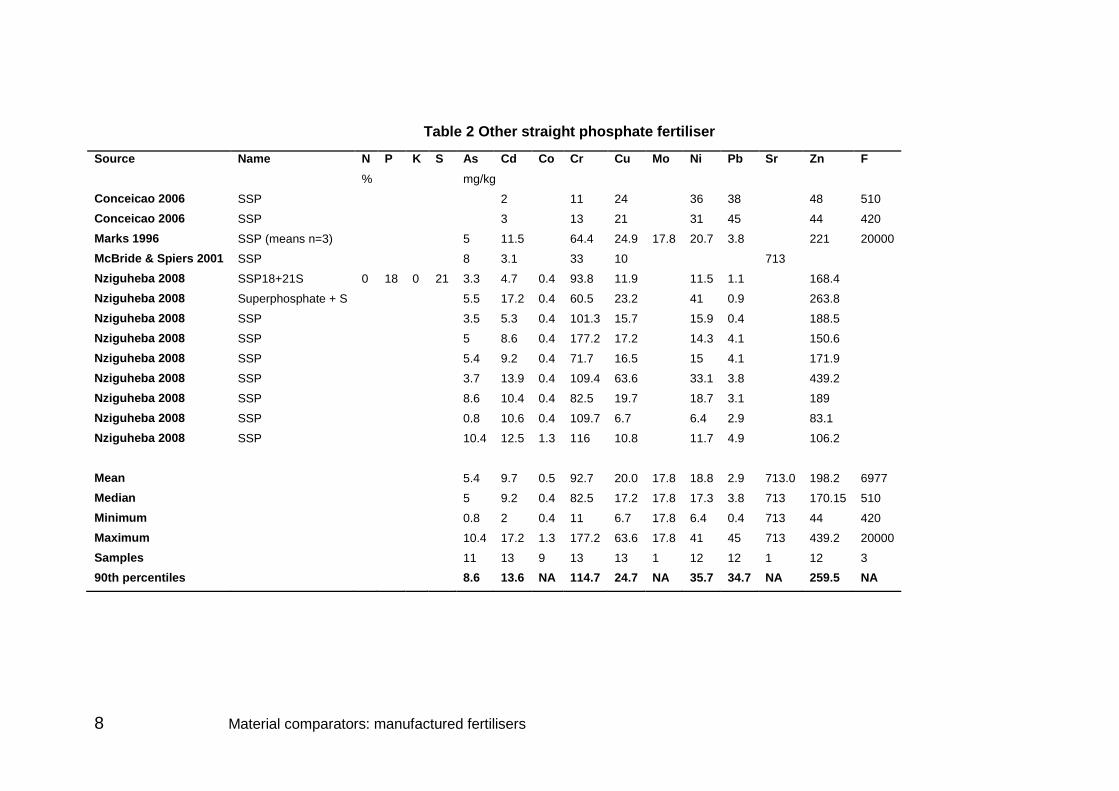
Table 2 Other straight phosphate fertiliser
Source Name N P K S As Cd Co Cr Cu Mo Ni Pb Sr Zn F % mg/kg Conceicao 2006 SSP 2 11 24 36 38 48 510 Conceicao 2006 SSP 3 13 21 31 45 44 420 Marks 1996 SSP (means n=3) 5 11.5 64.4 24.9 17.8 20.7 3.8 221 20000 McBride & Spiers 2001 SSP 8 3.1 33 10 713 Nziguheba 2008 SSP18+21S 0 18 0 21 3.3 4.7 0.4 93.8 11.9 11.5 1.1 168.4 Nziguheba 2008 Superphosphate + S 5.5 17.2 0.4 60.5 23.2 41 0.9 263.8 Nziguheba 2008 SSP 3.5 5.3 0.4 101.3 15.7 15.9 0.4 188.5 Nziguheba 2008 SSP 5 8.6 0.4 177.2 17.2 14.3 4.1 150.6 Nziguheba 2008 SSP 5.4 9.2 0.4 71.7 16.5 15 4.1 171.9 Nziguheba 2008 SSP 3.7 13.9 0.4 109.4 63.6 33.1 3.8 439.2 Nziguheba 2008 SSP 8.6 10.4 0.4 82.5 19.7 18.7 3.1 189 Nziguheba 2008 SSP 0.8 10.6 0.4 109.7 6.7 6.4 2.9 83.1 Nziguheba 2008 SSP 10.4 12.5 1.3 116 10.8 11.7 4.9 106.2 Mean 5.4 9.7 0.5 92.7 20.0 17.8 18.8 2.9 713.0 198.2 6977 Median 5 9.2 0.4 82.5 17.2 17.8 17.3 3.8 713 170.15 510 Minimum 0.8 2 0.4 11 6.7 17.8 6.4 0.4 713 44 420 Maximum 10.4 17.2 1.3 177.2 63.6 17.8 41 45 713 439.2 20000 Samples 11 13 9 13 13 1 12 12 1 12 3 90th percentiles 8.6 13.6 NA 114.7 24.7 NA 35.7 34.7 NA 259.5 NA
Material comparators: manufactured fertilisers 9
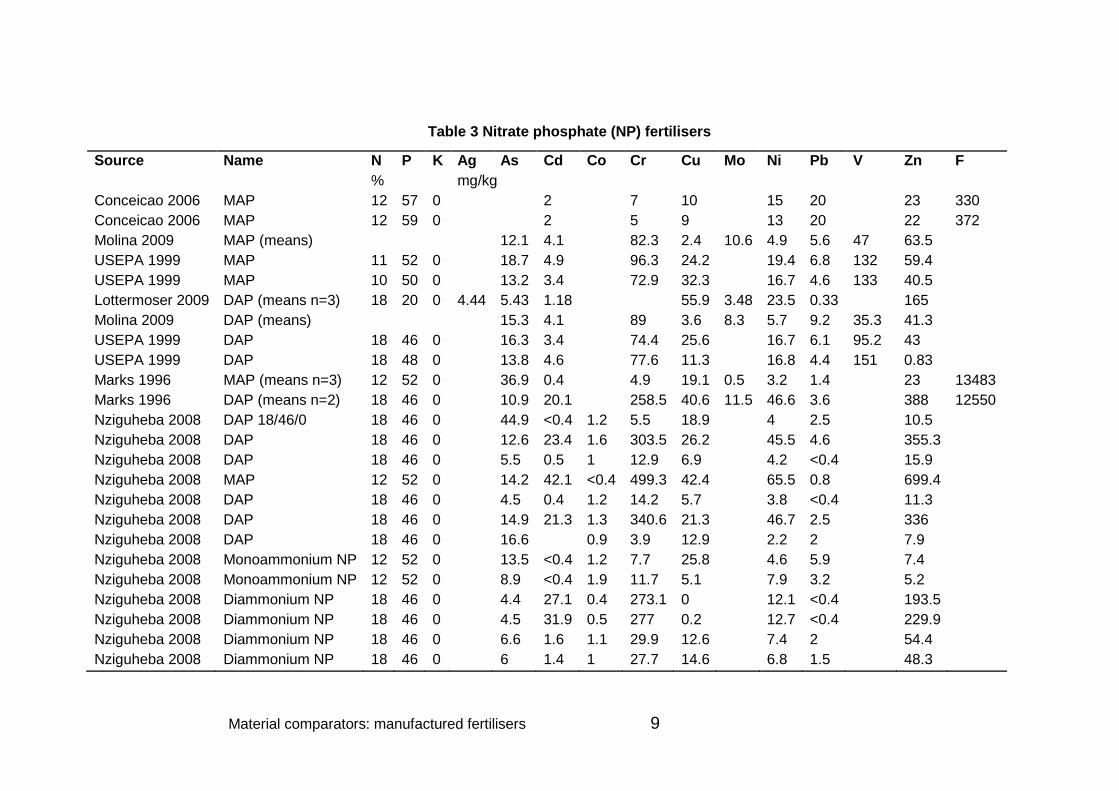
Table 3 Nitrate phosphate (NP) fertilisers
Source Name N P K Ag As Cd Co Cr Cu Mo Ni Pb V Zn F % mg/kg Conceicao 2006 MAP 12 57 0 2 7 10 15 20 23 330 Conceicao 2006 MAP 12 59 0 2 5 9 13 20 22 372 Molina 2009 MAP (means) 12.1 4.1 82.3 2.4 10.6 4.9 5.6 47 63.5 USEPA 1999 MAP 11 52 0 18.7 4.9 96.3 24.2 19.4 6.8 132 59.4 USEPA 1999 MAP 10 50 0 13.2 3.4 72.9 32.3 16.7 4.6 133 40.5 Lottermoser 2009 DAP (means n=3) 18 20 0 4.44 5.43 1.18 55.9 3.48 23.5 0.33 165 Molina 2009 DAP (means) 15.3 4.1 89 3.6 8.3 5.7 9.2 35.3 41.3 USEPA 1999 DAP 18 46 0 16.3 3.4 74.4 25.6 16.7 6.1 95.2 43 USEPA 1999 DAP 18 48 0 13.8 4.6 77.6 11.3 16.8 4.4 151 0.83 Marks 1996 MAP (means n=3) 12 52 0 36.9 0.4 4.9 19.1 0.5 3.2 1.4 23 13483 Marks 1996 DAP (means n=2) 18 46 0 10.9 20.1 258.5 40.6 11.5 46.6 3.6 388 12550 Nziguheba 2008 DAP 18/46/0 18 46 0 44.9 <0.4 1.2 5.5 18.9 4 2.5 10.5 Nziguheba 2008 DAP 18 46 0 12.6 23.4 1.6 303.5 26.2 45.5 4.6 355.3 Nziguheba 2008 DAP 18 46 0 5.5 0.5 1 12.9 6.9 4.2 <0.4 15.9 Nziguheba 2008 MAP 12 52 0 14.2 42.1 <0.4 499.3 42.4 65.5 0.8 699.4 Nziguheba 2008 DAP 18 46 0 4.5 0.4 1.2 14.2 5.7 3.8 <0.4 11.3 Nziguheba 2008 DAP 18 46 0 14.9 21.3 1.3 340.6 21.3 46.7 2.5 336 Nziguheba 2008 DAP 18 46 0 16.6 0.9 3.9 12.9 2.2 2 7.9 Nziguheba 2008 Monoammonium NP 12 52 0 13.5 <0.4 1.2 7.7 25.8 4.6 5.9 7.4 Nziguheba 2008 Monoammonium NP 12 52 0 8.9 <0.4 1.9 11.7 5.1 7.9 3.2 5.2 Nziguheba 2008 Diammonium NP 18 46 0 4.4 27.1 0.4 273.1 0 12.1 <0.4 193.5 Nziguheba 2008 Diammonium NP 18 46 0 4.5 31.9 0.5 277 0.2 12.7 <0.4 229.9 Nziguheba 2008 Diammonium NP 18 46 0 6.6 1.6 1.1 29.9 12.6 7.4 2 54.4 Nziguheba 2008 Diammonium NP 18 46 0 6 1.4 1 27.7 14.6 6.8 1.5 48.3
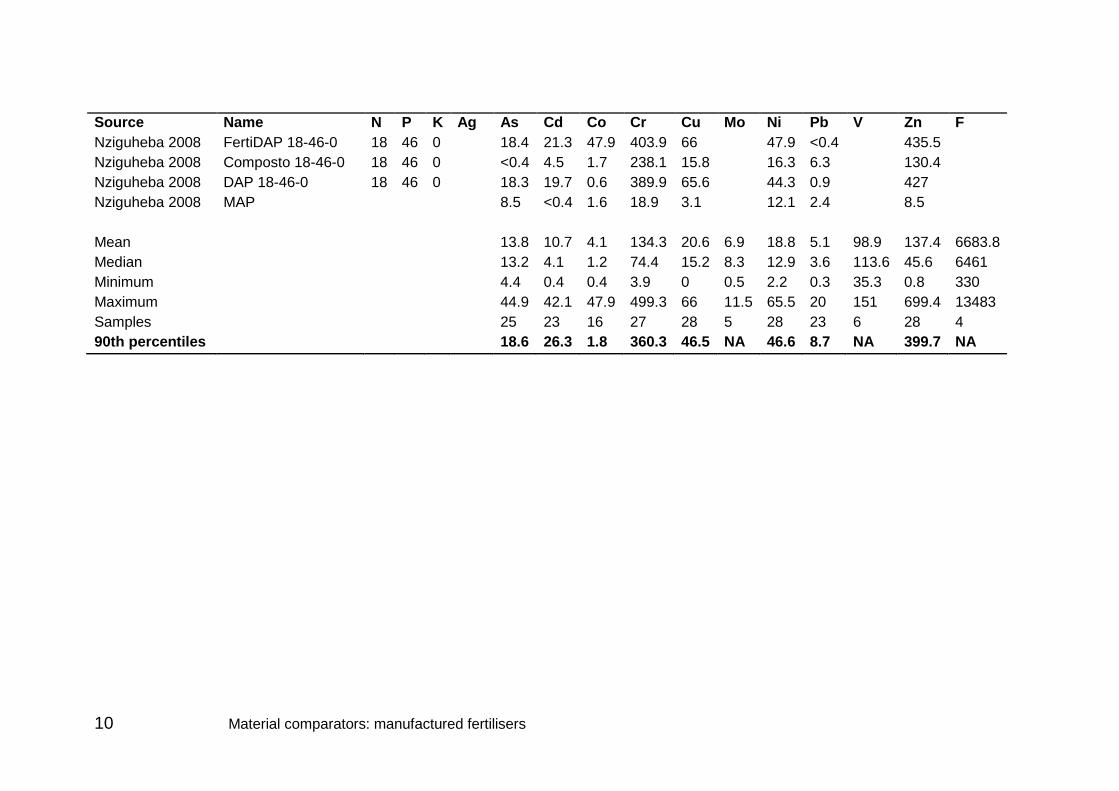
10 Material comparators: manufactured fertilisers
Source Name N P K Ag As Cd Co Cr Cu Mo Ni Pb V Zn F Nziguheba 2008 FertiDAP 18-46-0 18 46 0 18.4 21.3 47.9 403.9 66 47.9 <0.4 435.5 Nziguheba 2008 Composto 18-46-0 18 46 0 <0.4 4.5 1.7 238.1 15.8 16.3 6.3 130.4 Nziguheba 2008 DAP 18-46-0 18 46 0 18.3 19.7 0.6 389.9 65.6 44.3 0.9 427 Nziguheba 2008 MAP 8.5 <0.4 1.6 18.9 3.1 12.1 2.4 8.5 Mean 13.8 10.7 4.1 134.3 20.6 6.9 18.8 5.1 98.9 137.4 6683.8 Median 13.2 4.1 1.2 74.4 15.2 8.3 12.9 3.6 113.6 45.6 6461 Minimum 4.4 0.4 0.4 3.9 0 0.5 2.2 0.3 35.3 0.8 330 Maximum 44.9 42.1 47.9 499.3 66 11.5 65.5 20 151 699.4 13483 Samples 25 23 16 27 28 5 28 23 6 28 4 90th percentiles 18.6 26.3 1.8 360.3 46.5 NA 46.6 8.7 NA 399.7 NA
Material comparators: manufactured fertilisers 11
Table 4 Phosphate potassium (PK) fertilisers
Source N-P-K N P K As Cd Co Cr Cu Ni Pb Zn % mg/kg Nziguheba 2008 0-7-30 0 7 30 2.1 11.1 <0.4 87.3 1.9 5.2 0.9 83.2 Nziguheba 2008 0-10-20 0 10 20 10.5 <0.4 0.6 5.6 9.5 3.1 4.8 7.3 Nziguheba 2008 PK 20-30 0 20 30 3.3 10.1 <0.4 48.3 17.2 30.2 1.1 266.3 Nziguheba 2008 PK 25-25 0 25 25 5.1 12.5 <0.4 61.3 43.5 36.1 1.4 326.1 Nziguheba 2008 PK 0/10/30+0,2Boron 0 10 30 1.4 2.9 <0.4 42.6 6.1 7.8 1 92.3 Nziguheba 2008 PK 0/15/30 0 15 30 3.9 7.9 <0.4 64.2 4.7 6.2 1.8 87.1 Mean 0 15 28 4 9 0.6 52 14 15 2 144 Median 4 10 0.6 55 8 7 1 90 Minimum 1 3 0.6 6 2 3 1 7 Maximum 10 12 0.6 87 43 36 5 326 Samples 6 5 6 6 6 6 6 6
12 Material comparators: manufactured fertilisers
Table 5 Low N fertilisers (N<19%)
Source N P K As Ba Cd Co Cr Cu Mo Ni Pb Sb Se Sr Th U V Zn % mg/kg McBride & Spiers 2001 10 20 20 4 1.2 21 7 2.6 5 1 1 94 McBride & Spiers 2001 13 13 13 4 1.2 22 1 3.2 6 0.6 1 21 McBride & Spiers 2001 12 16 16 6 1.5 32 1 4.1 7 0.8 1 25 McBride & Spiers 2001 6 24 24 8 2.5 48 1 6.2 10 0.9 1 44 El-Ghawi et al. 1999 14 24 11 18 49 26 3.2 17 49 114 El-Ghawi et al. 1999 13 9 22 4 3 35 10 4 1 55 El-Ghawi et al. 1999 15 18 15 5 3 5 9.7 6 2 15 Lottermoser 2009 13 2 13 1 0.85 50.4 0.89 35.5 0.05 1.09 22.3 1.77 73.1 251 Lottermoser 2009 14 15 13 1 0.54 46.3 2.33 30.2 0.05 1.25 6.67 1.68 63.1 212 Lottermoser 2009 14 15 13 1.9 0.89 45 6.46 29.5 1.03 1.85 442 1.49 64.9 8800 Lottermoser 2009 13 14 12 5.8 0.85 35.4 6.4 25.2 132 18 6.08 2.13 46.4 17700 Lottermoser 2009 13 13 18 5.81 0.6 43.9 2.31 28 0.23 0.66 15.2 0.05 0.05 120 Otero et al. 2005 15 5 30 1.3 50 0.3 5 75 21 1 3 0.1 3 2 0.2 0.5 2 2 Otero et al. 2005 17 6 18 1.2 50 0.3 5 163 4 1 3 0.1 3 1 0.2 0.5 2 2 Otero et al. 2005 15 10 15 1.2 50 0.3 5 101 35 1 3 0.1 3 2 0.2 0.5 2 2.3 Otero et al. 2005 12 61 0 1.2 50 0.6 10 1 1 2 3 0.1 3 12 0.2 8.5 3 6 Otero et al. 2005 10 10 18 96.2 50 2.3 36 39 1 11 3 0.8 3 1449 1.4 10.3 35 230 Otero et al. 2005 5 7 10 60.8 50 2.9 82 73 1 16 133 8.8 3 316 2.3 18.4 40 650 Otero et al. 2005 16 8 12 5.3 50 0.3 7 261 108 4 3 0.2 3 137 1.5 0.5 19 77 Otero et al. 2005 8 6 20 4.7 50 3.6 40 9 1 8 3 1 3 505 0.9 32.5 39 75 Otero et al. 2005 12 12 17 4.6 280 4.5 80 22 2 14 3 0.9 3 183 1 40 62 89 Otero et al. 2005 12 12 17 0.5 110 1.2 16 15 1 3 3 0.1 3 4451 4.9 9.5 33 118 Otero et al. 2005 15 15 15 1.4 430 0.3 5 10 1 5 3 0.1 3 4535 6.8 0.5 29 12
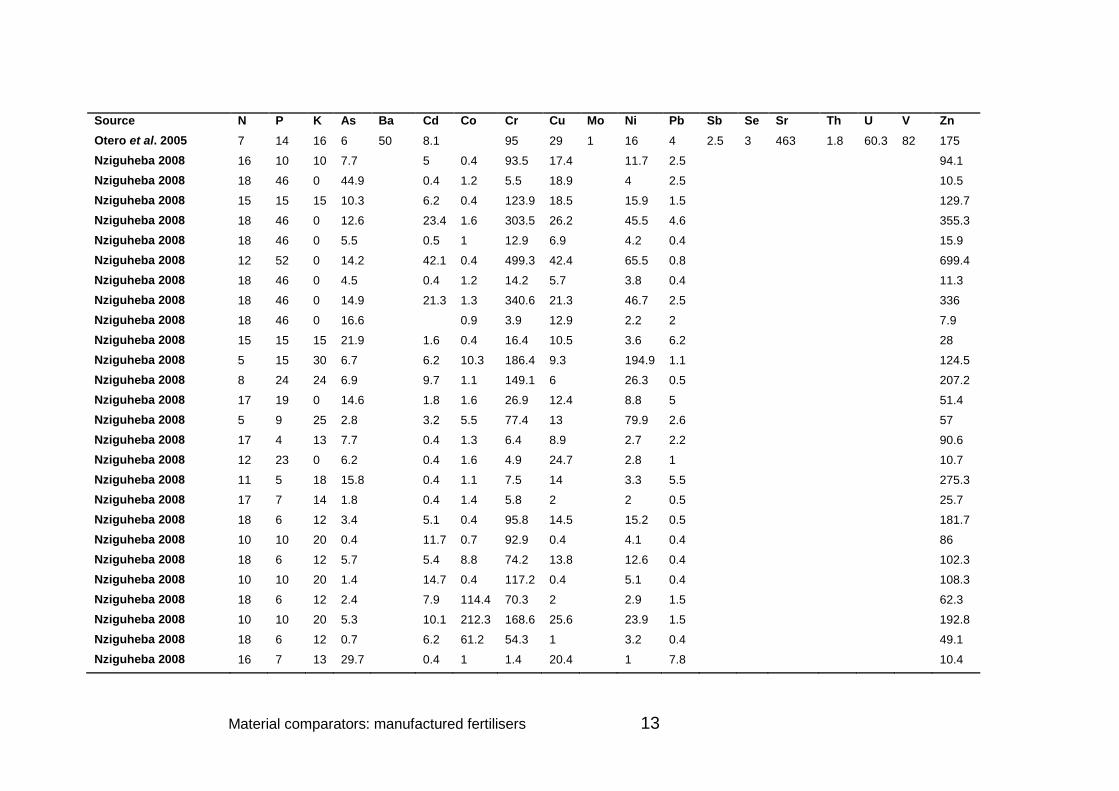
Material comparators: manufactured fertilisers 13
Source N P K As Ba Cd Co Cr Cu Mo Ni Pb Sb Se Sr Th U V Zn Otero et al. 2005 7 14 16 6 50 8.1 95 29 1 16 4 2.5 3 463 1.8 60.3 82 175 Nziguheba 2008 16 10 10 7.7 5 0.4 93.5 17.4 11.7 2.5 94.1 Nziguheba 2008 18 46 0 44.9 0.4 1.2 5.5 18.9 4 2.5 10.5 Nziguheba 2008 15 15 15 10.3 6.2 0.4 123.9 18.5 15.9 1.5 129.7 Nziguheba 2008 18 46 0 12.6 23.4 1.6 303.5 26.2 45.5 4.6 355.3 Nziguheba 2008 18 46 0 5.5 0.5 1 12.9 6.9 4.2 0.4 15.9 Nziguheba 2008 12 52 0 14.2 42.1 0.4 499.3 42.4 65.5 0.8 699.4 Nziguheba 2008 18 46 0 4.5 0.4 1.2 14.2 5.7 3.8 0.4 11.3 Nziguheba 2008 18 46 0 14.9 21.3 1.3 340.6 21.3 46.7 2.5 336 Nziguheba 2008 18 46 0 16.6 0.9 3.9 12.9 2.2 2 7.9 Nziguheba 2008 15 15 15 21.9 1.6 0.4 16.4 10.5 3.6 6.2 28 Nziguheba 2008 5 15 30 6.7 6.2 10.3 186.4 9.3 194.9 1.1 124.5 Nziguheba 2008 8 24 24 6.9 9.7 1.1 149.1 6 26.3 0.5 207.2 Nziguheba 2008 17 19 0 14.6 1.8 1.6 26.9 12.4 8.8 5 51.4 Nziguheba 2008 5 9 25 2.8 3.2 5.5 77.4 13 79.9 2.6 57 Nziguheba 2008 17 4 13 7.7 0.4 1.3 6.4 8.9 2.7 2.2 90.6 Nziguheba 2008 12 23 0 6.2 0.4 1.6 4.9 24.7 2.8 1 10.7 Nziguheba 2008 11 5 18 15.8 0.4 1.1 7.5 14 3.3 5.5 275.3 Nziguheba 2008 17 7 14 1.8 0.4 1.4 5.8 2 2 0.5 25.7 Nziguheba 2008 18 6 12 3.4 5.1 0.4 95.8 14.5 15.2 0.5 181.7 Nziguheba 2008 10 10 20 0.4 11.7 0.7 92.9 0.4 4.1 0.4 86 Nziguheba 2008 18 6 12 5.7 5.4 8.8 74.2 13.8 12.6 0.4 102.3 Nziguheba 2008 10 10 20 1.4 14.7 0.4 117.2 0.4 5.1 0.4 108.3 Nziguheba 2008 18 6 12 2.4 7.9 114.4 70.3 2 2.9 1.5 62.3 Nziguheba 2008 10 10 20 5.3 10.1 212.3 168.6 25.6 23.9 1.5 192.8 Nziguheba 2008 18 6 12 0.7 6.2 61.2 54.3 1 3.2 0.4 49.1 Nziguheba 2008 16 7 13 29.7 0.4 1 1.4 20.4 1 7.8 10.4
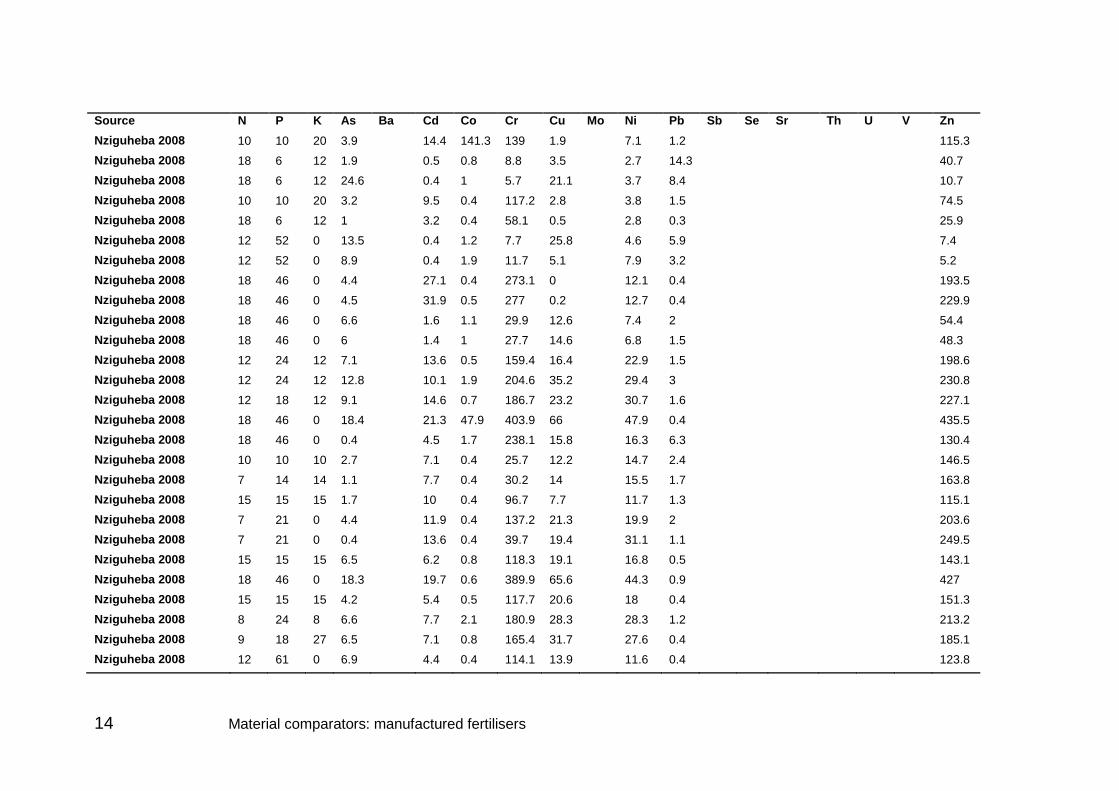
14 Material comparators: manufactured fertilisers
Source N P K As Ba Cd Co Cr Cu Mo Ni Pb Sb Se Sr Th U V Zn Nziguheba 2008 10 10 20 3.9 14.4 141.3 139 1.9 7.1 1.2 115.3 Nziguheba 2008 18 6 12 1.9 0.5 0.8 8.8 3.5 2.7 14.3 40.7 Nziguheba 2008 18 6 12 24.6 0.4 1 5.7 21.1 3.7 8.4 10.7 Nziguheba 2008 10 10 20 3.2 9.5 0.4 117.2 2.8 3.8 1.5 74.5 Nziguheba 2008 18 6 12 1 3.2 0.4 58.1 0.5 2.8 0.3 25.9 Nziguheba 2008 12 52 0 13.5 0.4 1.2 7.7 25.8 4.6 5.9 7.4 Nziguheba 2008 12 52 0 8.9 0.4 1.9 11.7 5.1 7.9 3.2 5.2 Nziguheba 2008 18 46 0 4.4 27.1 0.4 273.1 0 12.1 0.4 193.5 Nziguheba 2008 18 46 0 4.5 31.9 0.5 277 0.2 12.7 0.4 229.9 Nziguheba 2008 18 46 0 6.6 1.6 1.1 29.9 12.6 7.4 2 54.4 Nziguheba 2008 18 46 0 6 1.4 1 27.7 14.6 6.8 1.5 48.3 Nziguheba 2008 12 24 12 7.1 13.6 0.5 159.4 16.4 22.9 1.5 198.6 Nziguheba 2008 12 24 12 12.8 10.1 1.9 204.6 35.2 29.4 3 230.8 Nziguheba 2008 12 18 12 9.1 14.6 0.7 186.7 23.2 30.7 1.6 227.1 Nziguheba 2008 18 46 0 18.4 21.3 47.9 403.9 66 47.9 0.4 435.5 Nziguheba 2008 18 46 0 0.4 4.5 1.7 238.1 15.8 16.3 6.3 130.4 Nziguheba 2008 10 10 10 2.7 7.1 0.4 25.7 12.2 14.7 2.4 146.5 Nziguheba 2008 7 14 14 1.1 7.7 0.4 30.2 14 15.5 1.7 163.8 Nziguheba 2008 15 15 15 1.7 10 0.4 96.7 7.7 11.7 1.3 115.1 Nziguheba 2008 7 21 0 4.4 11.9 0.4 137.2 21.3 19.9 2 203.6 Nziguheba 2008 7 21 0 0.4 13.6 0.4 39.7 19.4 31.1 1.1 249.5 Nziguheba 2008 15 15 15 6.5 6.2 0.8 118.3 19.1 16.8 0.5 143.1 Nziguheba 2008 18 46 0 18.3 19.7 0.6 389.9 65.6 44.3 0.9 427 Nziguheba 2008 15 15 15 4.2 5.4 0.5 117.7 20.6 18 0.4 151.3 Nziguheba 2008 8 24 8 6.6 7.7 2.1 180.9 28.3 28.3 1.2 213.2 Nziguheba 2008 9 18 27 6.5 7.1 0.8 165.4 31.7 27.6 0.4 185.1 Nziguheba 2008 12 61 0 6.9 4.4 0.4 114.1 13.9 11.6 0.4 123.8
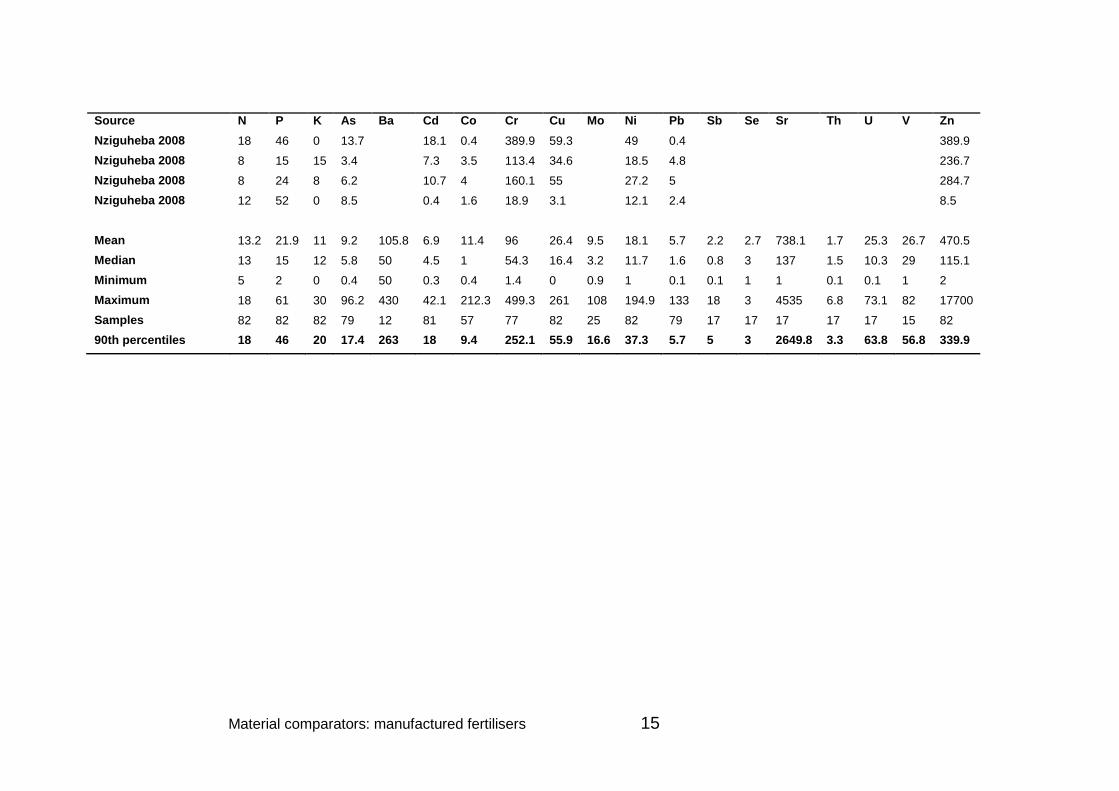
Material comparators: manufactured fertilisers 15
Source N P K As Ba Cd Co Cr Cu Mo Ni Pb Sb Se Sr Th U V Zn Nziguheba 2008 18 46 0 13.7 18.1 0.4 389.9 59.3 49 0.4 389.9 Nziguheba 2008 8 15 15 3.4 7.3 3.5 113.4 34.6 18.5 4.8 236.7 Nziguheba 2008 8 24 8 6.2 10.7 4 160.1 55 27.2 5 284.7 Nziguheba 2008 12 52 0 8.5 0.4 1.6 18.9 3.1 12.1 2.4 8.5 Mean 13.2 21.9 11 9.2 105.8 6.9 11.4 96 26.4 9.5 18.1 5.7 2.2 2.7 738.1 1.7 25.3 26.7 470.5 Median 13 15 12 5.8 50 4.5 1 54.3 16.4 3.2 11.7 1.6 0.8 3 137 1.5 10.3 29 115.1 Minimum 5 2 0 0.4 50 0.3 0.4 1.4 0 0.9 1 0.1 0.1 1 1 0.1 0.1 1 2 Maximum 18 61 30 96.2 430 42.1 212.3 499.3 261 108 194.9 133 18 3 4535 6.8 73.1 82 17700 Samples 82 82 82 79 12 81 57 77 82 25 82 79 17 17 17 17 17 15 82 90th percentiles 18 46 20 17.4 263 18 9.4 252.1 55.9 16.6 37.3 5.7 5 3 2649.8 3.3 63.8 56.8 339.9

16 Material comparators: manufactured fertilisers
Table 6 High N fertilisers (N≥19%)
Source N P K S As Cd Co Cr Cu Ni Pb Zn % mg/kg Nziguheba 2008 24 14 0 4 11.3 6.7 0.4 114.1 835.1 14.5 2.6 1374 Nziguheba 2008 20 8 8 5.5 4.3 <0.4 66.6 11 8.6 2.2 65.6 Nziguheba 2008 21 6 12 1 0.7 1.2 9.6 2.7 7.7 <0.4 26 Nziguheba 2008 21 6 12 6.3 <0.4 0.9 4.4 7.3 3.1 2.6 15.1 Nziguheba 2008 21 6 12 12.2 <0.4 0.5 3.9 9.5 2.7 3.1 9.1 Nziguheba 2008 20 20 0 4.1 8.8 <0.4 135.8 3 14.9 1 130.8 Nziguheba 2008 22 5 5 9.9 <0.4 2.8 5.5 10.1 2.2 2.8 23.9 Nziguheba 2008 20 3 8 8.4 <0.4 1.2 4.6 9.7 3.3 3.5 1124 Nziguheba 2008 20 4 8 7.3 <0.4 1.4 16.1 4.5 2.8 2.1 7.1 Nziguheba 2008 21 4 8 21.1 <0.4 0.5 3.1 12.8 2 5.3 7.7 Nziguheba 2008 26 4 4 1.4 <0.4 0.6 3.9 2 1.7 0.4 10.8 Nziguheba 2008 21 3 10 1.1 <0.4 0.7 3 0.7 1.5 <0.4 13.3 Nziguheba 2008 27 2 5 5 11.9 <0.4 <0.4 4.8 9.9 2.4 3.1 3 Nziguheba 2008 24 2 5 10 2.2 2.1 <0.4 36.8 7.8 5.2 0.6 39.1 Nziguheba 2008 27 2 5 5 11.3 <0.4 <0.4 4.6 10.6 2.2 3.1 3.1 Nziguheba 2008 24 2 5 10 2 <0.4 0.9 5.2 6.1 2.4 1.6 15.5 Nziguheba 2008 27 2 5 5 9.7 <0.4 0.4 5.6 9.8 2.7 2.7 2.2 Nziguheba 2008 27 3 5 5 2.1 2.2 <0.4 40.8 7.6 6.1 0.5 44.9 Nziguheba 2008 24 2 5 10 1.4 0.8 <0.4 14.3 4.2 2.6 0.7 16.4 Nziguheba 2008 24 2 5 5 2 <0.4 0.8 5.5 5.7 2.4 1.3 14.3 Nziguheba 2008 24 2 5 10 11.6 <0.4 <0.4 2.9 11.5 0.8 3.8 8.3 Nziguheba 2008 27 2 5 5 7 1.3 <0.4 23.7 10.6 4 1.6 30.2 Nziguheba 2008 24 2 5 10 9 <0.4 0.6 5.1 10.1 2.9 3.2 3.7 Nziguheba 2008 27 2 5 5 9.8 <0.4 0.4 5.6 9.7 2.5 2.7 2.3

Material comparators: manufactured fertilisers 17
Source N P K S As Cd Co Cr Cu Ni Pb Zn Nziguheba 2008 27 2 5 5 14.3 <0.4 <0.4 0.9 10.1 0.4 3.5 4.2 Nziguheba 2008 27 2 5 5 1 <0.4 <0.4 1.2 0.3 0.6 <0.4 0.4 Nziguheba 2008 24 2 5 10 10 <0.4 0.4 0.7 8 0.6 3.4 4.6 Nziguheba 2008 24 2 5 10 8.2 1 <0.4 19.5 11.6 3.2 1.9 26 Nziguheba 2008 27 2 5 5 11.4 <0.4 <0.4 4.3 8.9 2.9 2.9 3.1 Nziguheba 2008 27 2 5 5 10.2 <0.4 <0.4 0.6 6.5 0.3 2.5 2.7 Nziguheba 2008 24 2 5 10 13.7 <0.4 <0.4 0.8 11 0.6 4 5.1 Nziguheba 2008 27 2 5 5 2.9 2.1 <0.4 25.7 5.9 6 0.6 51.9 Nziguheba 2008 24 2 5 10 12.7 <0.4 0.6 5.2 12.6 4 3.7 4.3 Nziguheba 2008 24 2 5 10 9.5 <0.4 0.4 4.2 10.5 3 2.8 7.3 Nziguheba 2008 24 2 5 10 9.5 <0.4 0.6 5.3 12.2 2.8 3.4 5 Nziguheba 2008 27 2 5 5 9.4 0.8 <0.4 14.1 11 3 2.7 21.7 Nziguheba 2008 27 2 5 5 3.1 2.7 <0.4 33 7.4 7.8 0.9 51.9 Nziguheba 2008 27 2 5 5 11.6 <0.4 0.4 1 8.5 0.5 3.4 4.3 Nziguheba 2008 27 2 5 5 8.6 0.9 <0.4 15.2 9.6 3 2.4 22.1 Lottermoser 2009 30 3 14 1 0.11 6.21 2.78 0.53 27.8 Lottermoser 2009 29 0 18 1 0.05 1.22 2.07 2.78 5.5 Mean 24.6 3.4 6.3 6.8 7.5 2.3 0.8 16.8 28.1 3.5 2.4 79 Median 24 2 5 5 8.6 1.3 0.6 5.2 9.5 2.8 2.7 10.8 Minimum 20 0 0 4 1 0.1 0.4 0.6 0.3 0.3 0.4 0.4 Maximum 30 20 18 10 21.1 8.8 2.8 135.8 835.1 14.9 5.3 1374.2 Samples 41 41 40 29 41 15 20 39 41 41 38 41 90th percentiles 27 6 12 10 12.2 5.7 1.2 37.6 11.6 7.7 3.6 51.9
18 Material comparators: manufactured fertilisers
Table 7 90th percentiles
Fertiliser type N
P
K
S
As
Ba
Cd
Co
Cr
Cu
Mo
Ni
Pb
Sb
Se
Sr Th
U
V
Zn
% mg/kg Triple superphosphate (TSP)
11.9 30.6 0.5 283.9 49.6 55.7 17.6 637.4
Other straight phosphate
8.6 13.6 114.7 24.7 35.7 34.7 259.5
Nitrate phosphate (NP)
18.6 26.3 1.8 360.3 46.5 46.6 8.7 399.7
Low N (N<19%) 18 46 20 17.4 263 18 9.4 252 55.9 16.6 37.3 5.7 5 3 2650 3.3 63.8 56.8 340 High N (N≥19%) 27 6 12 10 12.2 5.7 1.2 37.6 11.6 7.7 3.6 51.9
Material comparators: manufactured fertilisers 19
References Used references
da Conceicao, F. and Bonotto, D., 2006. Radionuclides, heavy metals and fluorine incidence at Tapira phosphate rocks, Brazil, and their industrial (by) products. Environmental Pollution, 139 (2), 232–243.
El-Ghawi, U., Patzay, G., Vajda, N. and Bodizs, D., 1999. Analysis of selected fertilizers imported to Libya for major, minor, trace and toxic elements using ICP-OES and INAA. Journal of Radioanalytical and Nuclear Chemistry, 242 (3), 693–701.
Lottermoser, B.G., 2009. Trace metal enrichment in sugarcane soils due to the long-term application of fertilisers, North Queensland, Australia: geochemical and Pb, Sr, and U isotopic compositions. Australian Journal of Soil Research, 47 (3), 311–320.
Marks, M.J., 1996. Survey of the trace contaminants in phosphatic fertilisers. Unpublished MAFF report.
McBride, M. and Spiers, G., 2001. Trace element content of selected fertilizers and dairy manures as determined by ICP-MS. Communications in Soil Science and Plant Analysis, 32 (1–2), 139–156.
Molina, M., Aburto, F., Calderon, R., Cazanga, M. and Escudey, M., 2009. Trace element composition of selected fertilizers used in Chile: phosphorus fertilizers as a source of long-term soil contamination. Soil & Sediment Contamination, 18 (4), 497–511.
Nziguheba, G. and Smolders, E., 2008. Inputs of trace elements in agricultural soils via phosphate fertilizers in European countries. Science of the Total Environment, 390 (1), 53–57.
Otero, N., Vitoria, L., Soler, A. and Canals, A., 2005. Fertiliser characterisation: major, trace and rare earth elements. Applied Geochemistry, 20 (8), 1473–1488.
USEPA, 1999. Background Report on Fertilizer Use, Contaminants and Regulations. EPA 747-R-98-003. USEPA.
Assessed and discarded references
Abdel-Haleem, A., Sroor, A., El-Bahi, S. and Zohny, E., 2001. Heavy metals and rare earth elements in phosphate fertilizer components using instrumental neutron activation analysis. Applied Radiation and Isotopes, 55 (4), 569–573. Adesanwo, O.O., Adetunji, M.T., Dunlevey, J.N., Diatta, S., Osiname, O.A. and Adesanwo, J.K., 2009. X-ray fluorescence studies of Ogun phosphate rock. Journal of Environmental, Agricultural and Food Chemistry, 8 (10), 1052–1061. Adesanwo, O.O., Dunlevey, J.N., Adetunji, M.T., Adesanwo, J.K., Diatta, S. and Osiname, O.A., 2010. Geochemistry and mineralogy of Ogun phosphate rock. African Journal of Environmental Science and Technology, 4 (10), 698–708.
20 Material comparators: manufactured fertilisers
Al-Hwaiti, M.S., Contamination of potentially trace metals in Aqaba and Eshidiya. Phosphogypsum in Jordan. International Journal of Economic and Environment Geology, 1 (2), 35–42. Aydin, I., Imamoglu, S., Aydin, F., Saydut, A. and Hamamci, C., 2009. Determination of mineral phosphate species in sedimentary phosphate rock in Mardin, SE Anatolia, Turkey by sequential extraction. Microchemical Journal, 91 (1), 63–69. Aydin, I., Aydin, F., Saydut, A., Bakirdere, E.G. and Hamamci, C., 2010. Hazardous metal geochemistry of sedimentary phosphate rock used for fertilizer (Mazidag, SE Anatolia, Turkey). Microchemical Journal, 96 (2), 247–251.
Baysal, A., Akba, O., Merdivan, M., Hamamci, C. and Gumgum, B., 2002. Comparison of microwave digestion procedures for the determination of some elements in asphaltite ash using ICP-AES. Annali di Chimica, 92 (11–12), 1127–1133.
Bech, J., Suarez, M., Reverter, F., Tume, P., Sanchez, P., Bech, J. and Lansac, A., 2010. Selenium and other trace elements in phosphate rock of Bayovar-Sechura (Peru). Journal of Geochemical Exploration, 107 (2), 136–145. Bolan, N., Adriano, D. and Mahimairaja, S., 2004. Distribution and bioavailability of trace elements in livestock and poultry manure by-products. Critical Reviews in Environmental Science and Technology, 34 (3), 291–338. Brigden, K., Stringer, R. and Santillo, D., 2002. Heavy metal and radionuclide contamination of fertilizer products and phosphogypsum waste produced by The Lebanese Chemical Company, Lebanon, 2002. Greenpeace Research Laboratories. Camelo, L., Demiguez, S. and Marban, L., 1997. Heavy metals input with phosphate fertilizers used in Argentina. Science of the Total Environment, 204 (3), 245–250. Cao, X., Ma, L., Rhue, D. and Appel, C., 2004. Mechanisms of lead, copper, and zinc retention by phosphate rock. Environmental Pollution, 131 (3), 435–444. Chen, W., Chang, A.C. and Wu, L., 2007. Assessing long-term environmental risks of trace elements in phosphate fertilizers. Ecotoxicology and Environmental Safety, 67 (1), 48–58. Defra, 2005. Sources and Impacts of Past, Current and Future Contamination of Soil. SP0547. Defra. Defra, 2011. Fertiliser Use on Farm Crops for Crop Year 2010 – British Survey of Farm Practice. Defra. Divrikli, U., Akdogan, A., Soylak, M. and Elci, L., 2009. Factorial design for multivariate optimization of preconcentration system for spectrophotometric phosphorus determination. Talanta, 79 (5), 1287–1291. Franco, A., Schuhmacher, M., Roca, E. and Domingo, J.L., 2006. Application of cattle manure as fertilizer in pastureland: estimating the incremental risk due to metal accumulation employing a multicompartment model. Environment International, 32 (6), 724–732. Hill, W.L., Marshall, H.L. and Jacob, K.D., 1931. Composition of mechanical separates from ground phosphate rock. Industrial and Engineering Chemistry, 23 (10), 1120–1124.
Material comparators: manufactured fertilisers 21
Jasinski, S.M., 2011. 2009 Minerals Yearbook – Phosphate Rock. U.S. Geological Survey. Jasinski, S.M., 2011. Mineral Commodity Summaries – Phosphate Rock. U.S. Geological Survey. Jiang, S., Zhao, H., Chen, Y., Yang, T., Yang, J. and Ling, H., 2007. Trace and rare earth element geochemistry of phosphate nodules from the lower Cambrian black shale sequence in the Mufu Mountain of Nanjing, Jiangsu province, China. Chemical Geology, 244 (3–4), 584–604. Khan, K., Khan, H., Tufail, M., Khatibeh, A. and Ahmad, N., 1998. Radiometric analysis of Hazara phosphate rock and fertilizers in Pakistan. Journal of Environmental Radioactivity, 38 (1), 77–84. Koleli, N. and Kantar, C., 2005. Toxic heavy metal (Cd, Pb, Ni and As) Concentration in phosphate rock, phosphoric acid and phosphorous fertilizers. Ekoloji, 55, 1–5. Lopes, C., Herva, M., Franco-Uria, A. and Roca, E., 2011. Inventory of heavy metal content in organic waste applied as fertilizer in agriculture: evaluating the risk of transfer into the food chain. Environmental Science and Pollution Research, 18 (6), 918–939. Martin, J., Garcia-Tenorio, R., Respaldiza, M., Ontalba, M., Bolivar, J. and Da Silva, M., 1999. TTPIXE analysis of phosphate rocks and phosphogypsum. Applied Radiation and Isotopes, 50 (2), 445–449. Moudgil, B.M., 1994. On-Line Analysis of Phosphate Rock Slurry by Prompt Neutron Activation Technique. 02-080-109. Florida Institute of Phosphate Research. Nicholson, F., Chambers, B., Williams, J. and Unwin, R., 1999. Heavy metal contents of livestock feeds and animal manures in England and Wales. Bioresource Technology, 70 (1), 23–31. Nicholson, F., Smith, S., Alloway, B., Carlton-Smith, C. and Chambers, B., 2006. Quantifying heavy metal inputs to agricultural soils in England and Wales. Water and Environment Journal, 20 (2), 87–95. Nicholson, F., Rollett, A. and Chambers, B., 2010. An Inventory of Heavy Metal Inputs from Organic and Inorganic Materials to Agricultural Soils in England and Wales. RAMIRAN: ADAS Gleadthorpe. Oezer, A.K., Guelaboglu, M.S., Bayrakceken, S. and Weisweiler, W., 2006. Changes in physical structure and chemical composition of phosphate rock during calcination in fluidized and fixed beds. Advanced Powder Technology, 17 (5), 481–494. Ogunleye, P., Mayaki, M. and Amapu, I., 2002. Radioactivity and heavy metal composition of Nigerian phosphate rocks: possible environmental implications. Journal of Environmental Radioactivity, 62 (1), 39–48. Pantelica, A., Salagean, M., Georgescu, I. and Pincovschi, E., 1997. INAA of some phosphates used in fertilizer industries. Journal of Radioanalytical and Nuclear Chemistry, 216 (2), 261–264.

22 Material comparators: manufactured fertilisers
Paradelo, R., Villada, A., Devesa-Rey, R., Belen Moldes, A., Dominguez, M., Patino, J. and Teresa Barral, M., 2011. Distribution and availability of trace elements in municipal solid waste composts. Journal of Environmental Monitoring, 13 (1), 201–211. Perez-Lopez, R., Miguel Nieto, J., Lopez-Coto, I., Luis Aguado, J., Pedro Bolivar, J. and Santisteban, M., 2010. Dynamics of contaminants in phosphogypsum of the fertilizer industry of Huelva (SW Spain): from phosphate rock ore to the environment. Applied Geochemistry, 25 (5), 705–715. Ranawar, P.S., 2011-last update, Apatite and rock phosphate [online]. Available from: http://www.psranwat.org/non_mettalic/rock.htm2011. Accessed June 2012. Rogowski, D., Golding, S., Bowhay, D. and Singleton, S., 1999. Screening Survey for Metals and Dioxins in Fertilizer Products and Soils in Washington State. 99–309. Washington State Department of Ecology. Rutherford, P.M., Dudas, M.J. and Arocena, J.M., 1995. Radioactivity and elemental composition of phosphogypsum produced from three phosphate rock sources. Waste Management & Research, 13, 407–423. Sabiha-Javied, Mehmood, T., Chaudhry, M.M., Tufail, M. and Irfan, N., 2009. Heavy metal pollution from phosphate rock used for the production of fertilizer in Pakistan. Microchemical Journal, 91 (1), 94–99. Sager, M., 2007. Trace and nutrient elements in manure, dung and compost samples in Austria. Soil Biology & Biochemistry, 39 (6), 1383–1390. Sager, M., 2009. Fertilization loads of less common elements to arable soils in Austria. In: Organic Farming: Methods, Economics and Structure, edited by M. Nelson and I. Artamova, pp. 145–178. Nova Science Publishers. Sattouf, M., Kratz, S., Diemer, K., Rienitz, O., Fleckenstein, J., Schiel, D. and Schnug, E., 2007. Identifying the origin of rock phosphates and phosphorus fertilizers through high-precision measurement of the strontium isotopes Sr-87 and Sr-86. Landbauforschung Volkenrode, 57 (1), 1–11. Schipper, W., Klapwijk, A., Potjer, B., Rulkens, W., Temmink, B., Kiestra, F. and Lijmbach, A., 2001. Phosphate recycling in the phosphorus industry. Environmental Technology, 22 (11), 1337–1345. Shomar, B.H., 2006. Trace elements in major solid-pesticides used in the Gaza Strip. Chemosphere, 65 (5), 898–905. Stoica, L., Georgescu, I., Filip, D. and Bunus, F., 1997. Determination of valuable elements in natural phosphates. Journal of Radioanalytical and Nuclear Chemistry, 216 (2), 161–163. Vitoria, L., Otero, N., Soler, A. and Canals, A., 2004. Fertilizer characterization: isotopic data (N, S, O, C, and Sr). Environmental Science & Technology, 38 (12), 3254–3262. Wilhide, W.D. and Ash, D.H., 1985. Analysis of phosphate ores and related raw materials by X-ray spectrometry. Journal of Agricultural and Food Chemistry, 33 (5), 887–890.
Material comparators: manufactured fertilisers 23
Zaghloul, R., Elabbady, W. and Ghoma, N., 1987. An application of the monostandard epithermal neutron-activation technique for the analysis of domestic phosphate ores. Journal of Radioanalytical and Nuclear Chemistry-Articles, 116 (2), 235–241.
24 Material comparators: manufactured fertilisers
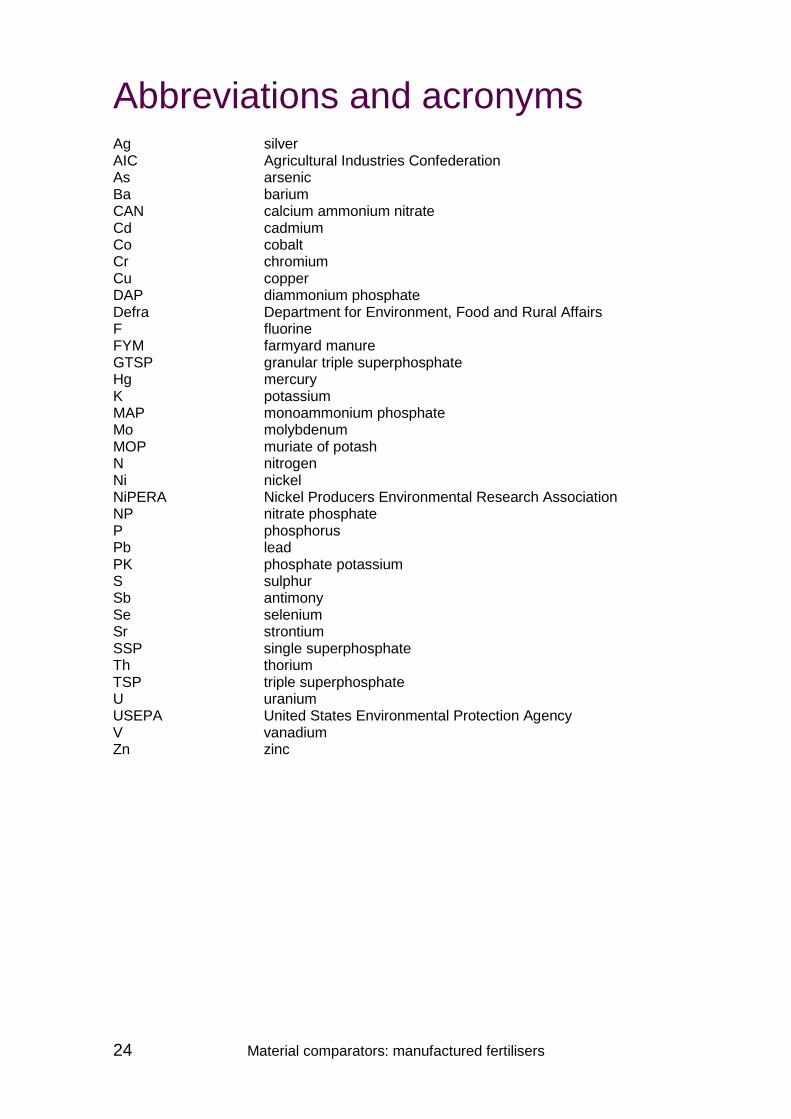
Abbreviations and acronyms Ag silver AIC Agricultural Industries Confederation As arsenic Ba barium CAN calcium ammonium nitrate Cd cadmium Co cobalt Cr chromium Cu copper DAP diammonium phosphate Defra Department for Environment, Food and Rural Affairs F fluorine FYM farmyard manure GTSP granular triple superphosphate Hg mercury K potassium MAP monoammonium phosphate Mo molybdenum MOP muriate of potash N nitrogen Ni nickel NiPERA Nickel Producers Environmental Research Association NP nitrate phosphate P phosphorus Pb lead PK phosphate potassium S sulphur Sb antimony Se selenium Sr strontium SSP single superphosphate Th thorium TSP triple superphosphate U uranium USEPA United States Environmental Protection Agency V vanadium Zn zinc
Material comparators: manufactured fertilisers 25
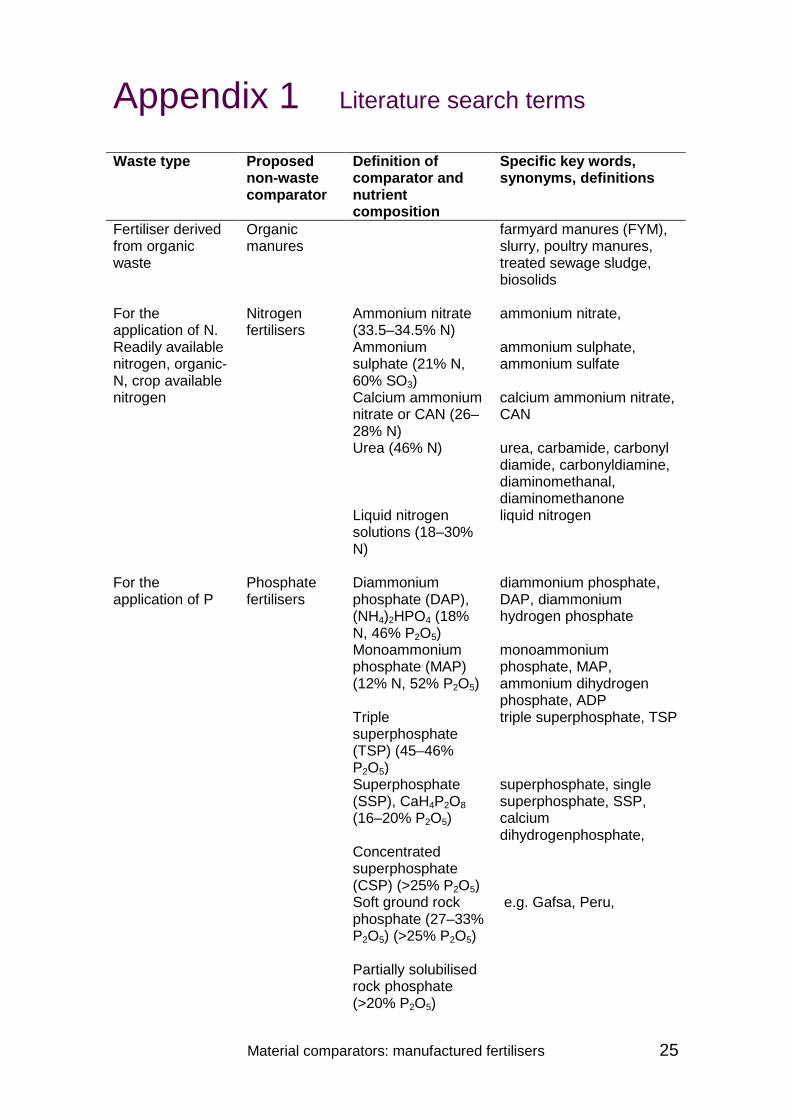
Appendix 1 Literature search terms Waste type Proposed
non-waste comparator
Definition of comparator and nutrient composition
Specific key words, synonyms, definitions
Fertiliser derived from organic waste
Organic manures
farmyard manures (FYM), slurry, poultry manures, treated sewage sludge, biosolids
For the application of N. Readily available nitrogen, organic-N, crop available nitrogen
Nitrogen fertilisers
Ammonium nitrate (33.5–34.5% N)
ammonium nitrate,
Ammonium sulphate (21% N, 60% SO3)
ammonium sulphate, ammonium sulfate
Calcium ammonium nitrate or CAN (26–28% N)
calcium ammonium nitrate, CAN
Urea (46% N) urea, carbamide, carbonyl diamide, carbonyldiamine, diaminomethanal, diaminomethanone
Liquid nitrogen solutions (18–30% N)
liquid nitrogen
For the application of P
Phosphate fertilisers
Diammonium phosphate (DAP), (NH4)2HPO4 (18% N, 46% P2O5)
diammonium phosphate, DAP, diammonium hydrogen phosphate
Monoammonium phosphate (MAP) (12% N, 52% P2O5)
monoammonium phosphate, MAP, ammonium dihydrogen phosphate, ADP
Triple superphosphate (TSP) (45–46% P2O5)
triple superphosphate, TSP
Superphosphate (SSP), CaH4P2O8 (16–20% P2O5)
superphosphate, single superphosphate, SSP, calcium dihydrogenphosphate,
Concentrated superphosphate (CSP) (>25% P2O5)
Soft ground rock phosphate (27–33% P2O5) (>25% P2O5)
e.g. Gafsa, Peru,
Partially solubilised rock phosphate (>20% P2O5)
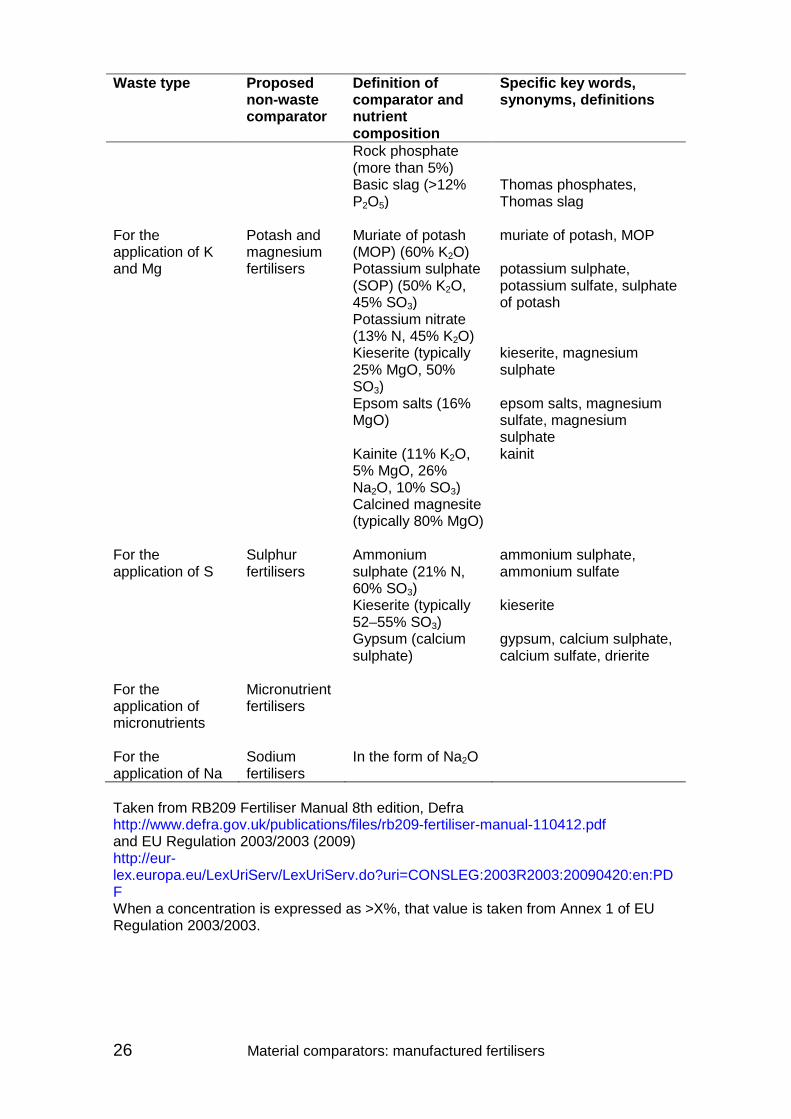
26 Material comparators: manufactured fertilisers
Waste type Proposed non-waste comparator
Definition of comparator and nutrient composition
Specific key words, synonyms, definitions
Rock phosphate (more than 5%)
Basic slag (>12% P2O5)
Thomas phosphates, Thomas slag
For the application of K and Mg
Potash and magnesium fertilisers
Muriate of potash (MOP) (60% K2O)
muriate of potash, MOP
Potassium sulphate (SOP) (50% K2O, 45% SO3)
potassium sulphate, potassium sulfate, sulphate of potash
Potassium nitrate (13% N, 45% K2O)
Kieserite (typically 25% MgO, 50% SO3)
kieserite, magnesium sulphate
Epsom salts (16% MgO)
epsom salts, magnesium sulfate, magnesium sulphate
Kainite (11% K2O, 5% MgO, 26% Na2O, 10% SO3)
kainit
Calcined magnesite (typically 80% MgO)
For the application of S
Sulphur fertilisers
Ammonium sulphate (21% N, 60% SO3)
ammonium sulphate, ammonium sulfate
Kieserite (typically 52–55% SO3)
kieserite
Gypsum (calcium sulphate)
gypsum, calcium sulphate, calcium sulfate, drierite
For the application of micronutrients
Micronutrient fertilisers
For the application of Na
Sodium fertilisers
In the form of Na2O
Taken from RB209 Fertiliser Manual 8th edition, Defra http://www.defra.gov.uk/publications/files/rb209-fertiliser-manual-110412.pdf and EU Regulation 2003/2003 (2009) http://eur-lex.europa.eu/LexUriServ/LexUriServ.do?uri=CONSLEG:2003R2003:20090420:en:PDF When a concentration is expressed as >X%, that value is taken from Annex 1 of EU Regulation 2003/2003.
Material comparators: manufactured fertilisers 27
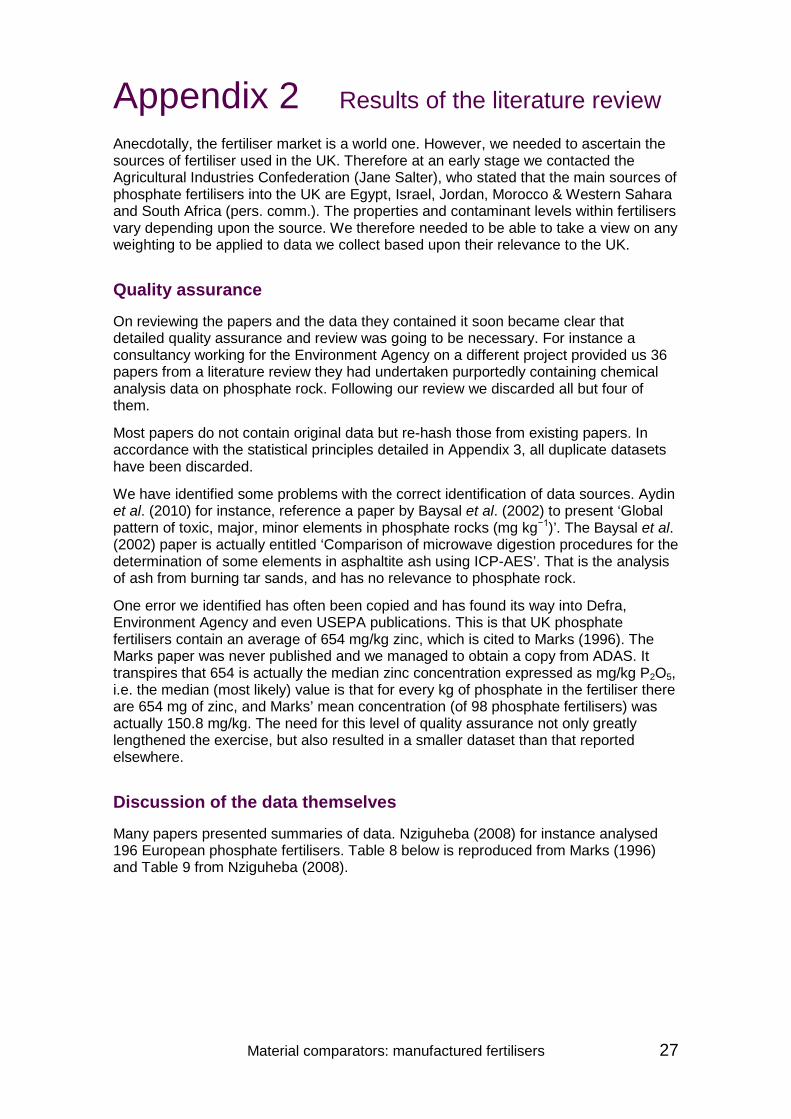
Appendix 2 Results of the literature review
Anecdotally, the fertiliser market is a world one. However, we needed to ascertain the sources of fertiliser used in the UK. Therefore at an early stage we contacted the Agricultural Industries Confederation (Jane Salter), who stated that the main sources of phosphate fertilisers into the UK are Egypt, Israel, Jordan, Morocco & Western Sahara and South Africa (pers. comm.). The properties and contaminant levels within fertilisers vary depending upon the source. We therefore needed to be able to take a view on any weighting to be applied to data we collect based upon their relevance to the UK.
Quality assurance
On reviewing the papers and the data they contained it soon became clear that detailed quality assurance and review was going to be necessary. For instance a consultancy working for the Environment Agency on a different project provided us 36 papers from a literature review they had undertaken purportedly containing chemical analysis data on phosphate rock. Following our review we discarded all but four of them.
Most papers do not contain original data but re-hash those from existing papers. In accordance with the statistical principles detailed in Appendix 3, all duplicate datasets have been discarded.
We have identified some problems with the correct identification of data sources. Aydin et al. (2010) for instance, reference a paper by Baysal et al. (2002) to present ‘Global pattern of toxic, major, minor elements in phosphate rocks (mg kg−1)’. The Baysal et al. (2002) paper is actually entitled ‘Comparison of microwave digestion procedures for the determination of some elements in asphaltite ash using ICP-AES’. That is the analysis of ash from burning tar sands, and has no relevance to phosphate rock.
One error we identified has often been copied and has found its way into Defra, Environment Agency and even USEPA publications. This is that UK phosphate fertilisers contain an average of 654 mg/kg zinc, which is cited to Marks (1996). The Marks paper was never published and we managed to obtain a copy from ADAS. It transpires that 654 is actually the median zinc concentration expressed as mg/kg P2O5, i.e. the median (most likely) value is that for every kg of phosphate in the fertiliser there are 654 mg of zinc, and Marks’ mean concentration (of 98 phosphate fertilisers) was actually 150.8 mg/kg. The need for this level of quality assurance not only greatly lengthened the exercise, but also resulted in a smaller dataset than that reported elsewhere.
Discussion of the data themselves
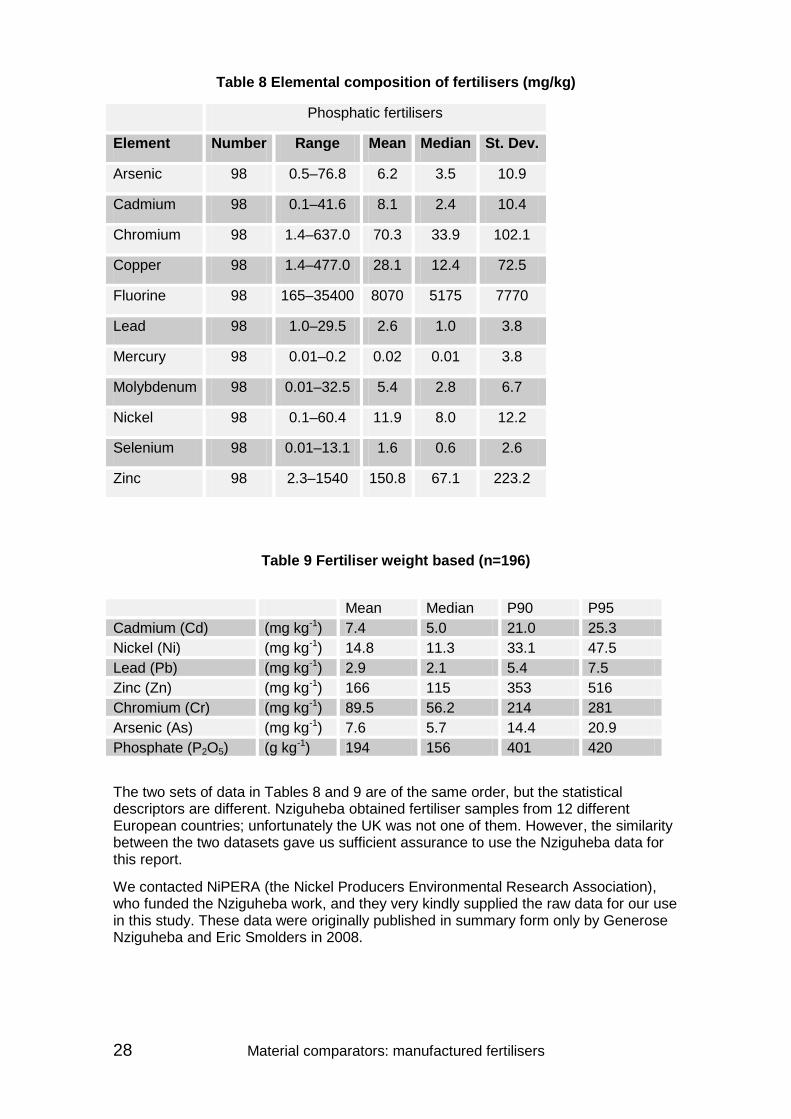
Many papers presented summaries of data. Nziguheba (2008) for instance analysed 196 European phosphate fertilisers. Table 8 below is reproduced from Marks (1996) and Table 9 from Nziguheba (2008).
28 Material comparators: manufactured fertilisers
Table 8 Elemental composition of fertilisers (mg/kg)
Phosphatic fertilisers
Element Number Range Mean Median St. Dev.
Arsenic 98 0.5–76.8 6.2 3.5 10.9
Cadmium 98 0.1–41.6 8.1 2.4 10.4
Chromium 98 1.4–637.0 70.3 33.9 102.1
Copper 98 1.4–477.0 28.1 12.4 72.5
Fluorine 98 165–35400 8070 5175 7770
Lead 98 1.0–29.5 2.6 1.0 3.8
Mercury 98 0.01–0.2 0.02 0.01 3.8
Molybdenum 98 0.01–32.5 5.4 2.8 6.7
Nickel 98 0.1–60.4 11.9 8.0 12.2
Selenium 98 0.01–13.1 1.6 0.6 2.6
Zinc 98 2.3–1540 150.8 67.1 223.2
Table 9 Fertiliser weight based (n=196)
Mean Median P90 P95 Cadmium (Cd) (mg kg-1) 7.4 5.0 21.0 25.3 Nickel (Ni) (mg kg-1) 14.8 11.3 33.1 47.5 Lead (Pb) (mg kg-1) 2.9 2.1 5.4 7.5 Zinc (Zn) (mg kg-1) 166 115 353 516 Chromium (Cr) (mg kg-1) 89.5 56.2 214 281 Arsenic (As) (mg kg-1) 7.6 5.7 14.4 20.9 Phosphate (P2O5) (g kg-1) 194 156 401 420
The two sets of data in Tables 8 and 9 are of the same order, but the statistical descriptors are different. Nziguheba obtained fertiliser samples from 12 different European countries; unfortunately the UK was not one of them. However, the similarity between the two datasets gave us sufficient assurance to use the Nziguheba data for this report.
We contacted NiPERA (the Nickel Producers Environmental Research Association), who funded the Nziguheba work, and they very kindly supplied the raw data for our use in this study. These data were originally published in summary form only by Generose Nziguheba and Eric Smolders in 2008.

Material comparators: manufactured fertilisers 29
Appendix 3 Statistical analysis of data While extracting the data from published material, care was taken to:
• assess whether the data are applicable to the UK market;
• deal with ‘<’ values and consider using statistical techniques to deal with them;
• make sure each sample is independent of the others, i.e. a sample’s data was not simply a duplicate of another sample’s data separately reported;
• compare data between studies.
Data were assessed using both Excel and Minitab. All < values were taken as the value themselves. While there were other data with analyses for that particular determinand lower than some of the < values, they were only by an order of magnitude or two. All < values were at least an order of magnitude below the median value. Box and whiskers plots of the low nitrogen fertilisers data are presented in Figure 1. These diagrams demonstrate the issue of outliers in the datasets, outliers being identified with an asterisk.
Figure 1 Low nitrogen fertilisers (N<19%)
UThSeSbHgCd
80
70
60
50
40
30
20
10
0
mg/
kg
31.927.1
42.1
23.4
8.8
18.0
6.804.90
Low Nitrogen (<19% N) Fertilisers
Outliers can adversely affect the statistical analysis by:
• giving serious bias or influence to estimates that may be of less interest; • increasing the error variance and reducing the power of statistical tests;
PbNiMoCuCoAs
250
200
150
100
50
0
Dat
a
253022
4561
96
4.03.5
47.9
141.3
61.2
212.3
114.4
8.85.510.3
65.666.0
261.0
73.0
101.0
163.0
75.0
108.0
35.021.0
79.9
194.9
65.5
8.414.3
7.8
133.0132.0
Low Nitrogen (<19% N) Fertilisers
CrBa
500
400
300
200
100
0
Dat
a
430
280
390390404
341
499
Low Nitrogen (<19% N) Fertilisers
ZnSr
20000
15000
10000
5000
0
mg/
kg
4535.04451.0
1449.0 699650
17700
8800
Low Nitrogen (<19% N) Fertilisers
30 Material comparators: manufactured fertilisers
• decreasing normality (if non-random) and altering the odds of Type I and II errors.
In addition we are interested in providing a reasonable dataset for comparison purposes. As the data are taken from a variety of papers with different analytical suites, the number of samples for each determinand varies. Where we consider there is sufficient sample size (n ≥10) to calculate a 90th percentile of the data we have done so. We were unable to discover any data on organic contaminants in primary manufactured fertilisers in the searches conducted. While some dioxin data have been identified (Rogowski 1999, USEPA 1999) they are from the analysis of waste-derived fertilisers or soil improvers. For the purposes of non-waste comparators it is recommended we assume that primary manufactured fertilisers contain organic contaminants at a level below an appropriate limit of detection. Full and trimmed data are presented in Tables 1 to 6.