The Analysis of the Some Matches of Turkey National Futsal ...
Upload
independentCategory
view
0download
0
This article was downloaded by: [UGR-BTCA Gral Universitaria]On: 07 November 2012, At: 02:13Publisher: RoutledgeInforma Ltd Registered in England and Wales Registered Number: 1072954 Registered office: Mortimer House,37-41 Mortimer Street, London W1T 3JH, UK
Journal of Sports SciencesPublication details, including instructions for authors and subscription information:http://www.tandfonline.com/loi/rjsp20
Match analysis and heart rate of futsal players duringcompetitionJ. C. Barbero-Alvarez a , V. M. Soto b , V. Barbero-Alvarez a & J. Granda-Vera aa Department of Teaching of Corporal Expressionb Department of Physical Education and Sport, University of Granada, Granada, SpainVersion of record first published: 20 May 2008.
To cite this article: J. C. Barbero-Alvarez, V. M. Soto, V. Barbero-Alvarez & J. Granda-Vera (2008): Match analysis and heartrate of futsal players during competition, Journal of Sports Sciences, 26:1, 63-73
To link to this article: http://dx.doi.org/10.1080/02640410701287289
PLEASE SCROLL DOWN FOR ARTICLE
Full terms and conditions of use: http://www.tandfonline.com/page/terms-and-conditions
This article may be used for research, teaching, and private study purposes. Any substantial or systematicreproduction, redistribution, reselling, loan, sub-licensing, systematic supply, or distribution in any form toanyone is expressly forbidden.
The publisher does not give any warranty express or implied or make any representation that the contentswill be complete or accurate or up to date. The accuracy of any instructions, formulae, and drug doses shouldbe independently verified with primary sources. The publisher shall not be liable for any loss, actions, claims,proceedings, demand, or costs or damages whatsoever or howsoever caused arising directly or indirectly inconnection with or arising out of the use of this material.
Match analysis and heart rate of futsal players during competition
J. C. BARBERO-ALVAREZ1, V. M. SOTO2, V. BARBERO-ALVAREZ1, & J. GRANDA-VERA1
1Department of Teaching of Corporal Expression and 2Department of Physical Education and Sport, University of Granada,
Granada, Spain
(Accepted 19 February 2007)
AbstractHeart rates were monitored and time – motion analysis performed for 10 players (mean age 25.6 years, s¼ 2.5; body mass73.8 kg, s¼ 5.7 kg; height 1.75 m, s¼ 0.06) during four competitive futsal matches. Mean heart rate during the match was90% (s¼ 2) of maximum heart rate. Heart rate records were classified based on the percentage of time spent in three zones(485%, 85 – 65%, and 565% maximum heart rate); players spent 83%, 16%, and 0.3% in these three zones, respectively.During the second period, there was a significant reduction (P5 0.01) in the percentage of time spent at an intensity above85% of maximum heart rate (first vs. second period: 86% vs. 79%). Players’ movements were classified as standing, walking,jogging, medium-intensity running, high-intensity running, and sprinting (maximal speed running). Time – motion analysisindicated that the mean distance covered per minute of play was 117.3 m (s¼ 11.6), of which 28.5% (s¼ 2.2) was coveredwhile performing medium-intensity running, 13.7% (s¼ 2) during high-intensity running, and 8.9% (s¼ 3.4) whilesprinting. From the results, we conclude that futsal is a multiple-sprints sport in which there are more high-intensity phasesthan in soccer and other intermittent sports.
Keywords: Futsal, match analysis, heart rate, competition demands
Introduction
Futsal (the official name for five-a-side indoor
soccer) was introduced in 1930 with the aim of
allowing football to be played in restricted spaces. It
has enjoyed a spectacular increase in popularity over
recent years and is played worldwide in both
professional and amateur leagues by men and
women, boys and girls. Its organizing body remains
FIFA, under whose auspices international com-
petitions are arranged. However, it now has its own
character using aspects of different sports
(basketball, handball, and hockey).
Futsal is an intermittent sport that makes high
physical, technical, and tactical demands on
players. It is played on a court of 40620 m with
goals of 362 m (the same as in handball). As in
basketball, two 20-min periods are scheduled, and
here there is an important distinction from football,
in that like basketball, the clock is stopped for some
events, which usually means that the game lasts
75 – 85% longer than the scheduled 40 min. This
varies according to the possibilities given by the
rules: time-outs, double penalties, court cleaning,
stoppages for injuries, medical attention, and
so on. Teams can request a time-out (1 min) in
each half and there is a break of 10 min between
halves.
A team comprises five players, four on-court
players and the goalkeeper, with an unlimited
number of substitutions, so that the intensity and
rhythm of the game are very high and do not decline
as the match progresses (Alvarez, Gimenez,
Corona, & Manonelles, 2002). The maximum
number of players in a squad for a match is 12 (ten
court players and two goalkeepers). Each match is
officiated by two referees and a linesman. From a
tactical perspective, blocking (as in basketball) is
frequently used and rotation of the components of
the team is as in ice-hockey.
Many researchers have tried to evaluate the
demands of competition in these sports using both
internal and external performance indicators. They
have used movement analysis (Carter, 1996; Mohr,
Krustrup, & Bangsbo, 2003) and measurement of
physiological parameters (internal indicators) such as
heart rate (Burke, 1998) and the concentrations
of blood lactate (Bangsbo, 1994b; Deutsch,
Correspondence: V. M. Soto, Facultad de Ciencias de la Actividad Fisica y el Deporte, Universidad de Granada, Carretera de Alfacar s/n, 18011 Granada,
Spain. E-mail: [email protected]
Journal of Sports Sciences, January 1st 2008; 26(1): 63 – 73
ISSN 0264-0414 print/ISSN 1466-447X online � 2008 Taylor & Francis
DOI: 10.1080/02640410701287289
Dow
nloa
ded
by [
UG
R-B
TC
A G
ral U
nive
rsita
ria]
at 0
2:13
07
Nov
embe
r 20
12
Maw, Jenkins, & Reaburn, 1998), blood glucose
(Jardine, Wiggins, Myburgh, & Noakes, 1988), and
plasma free fatty acids (Van Rensburg, Kielblock,
Van der Linde, & Van der Walt, 1986) to esta-
blish physiological responses in intermittent team
sports.
Time – motion analysis has been used to quantify
the movements of a range of sports, including soccer
(Bangsbo, Norregaard, & Thorso, 1991; Castagna,
Abt, & D’Ottavio, 2002), handball (Alexander &
Boreskie, 1989; Pers, Bon, Kovacic, Sibila, &
Dezman, 2002), basketball (McInnes, Carlson,
Jones, & McKenna, 1995), rugby (Docherty,
Wenger, & Neary, 1988), and hockey (Boyle,
Mahoney, & Wallace, 1994). However, there has
been limited time – motion analysis of futsal players
during match-play (Barbero, Soto, & Granda,
2004a), and the activity patterns of futsal could
differ from other sports since each player has to
perform both attacking and defensive tasks. Only a
few scientific studies have been done on futsal,
although some researchers have carried out time –
motion analysis in indoor football; however, these
studies were undertaken more than a decade ago
(1991), but published only recently (Hernandez,
2001). These were done with juvenile category
players (Oliveira, 1999), or on courts with reduced
dimensions (Bello, 1998) in the Brazilian League.
Moreover, indoor football has an extremely high
anaerobic component (8.5 mmol � l71, s¼ 2.6, range
4.1 – 12.6 in five players, unpublished dates) and
requires a cardiovascular demand of between 85 and
90% of individual maximum heart rate, in most
matches reaching maximum heart rate (Alvarez et al.,
2002; Barbero, Soto, & Granda, 2004b).
Using time – motion analysis and heart rate
monitoring, the aim of the present study was to
examine the activity profile and physiological de-
mands associated with the physical effort made by
professional futsal players during competitive
matches.
Methods
Participants
Ten male professional futsal players on the team of a
Spanish Professional Futsal League club, with a
mean playing experience of 8 years, agreed to
participate in the study after being fully informed of
what was required of them and providing their
written consent. Their mean age, height, and body
mass were 25.6 years (s¼ 2.5), 1.75 m (s¼ 0.06),
and 73.8 kg (s¼ 5.7), respectively. The players
trained five times per week for *1.5 h per training
session and participated in a professional match once
a week.
Match analysis
Players were monitored by a video system during
four regular games, played at the beginning, during,
and at the end of the season; all players (n¼ 8 – 10)
who participated in each match were followed
(except the goalkeepers).
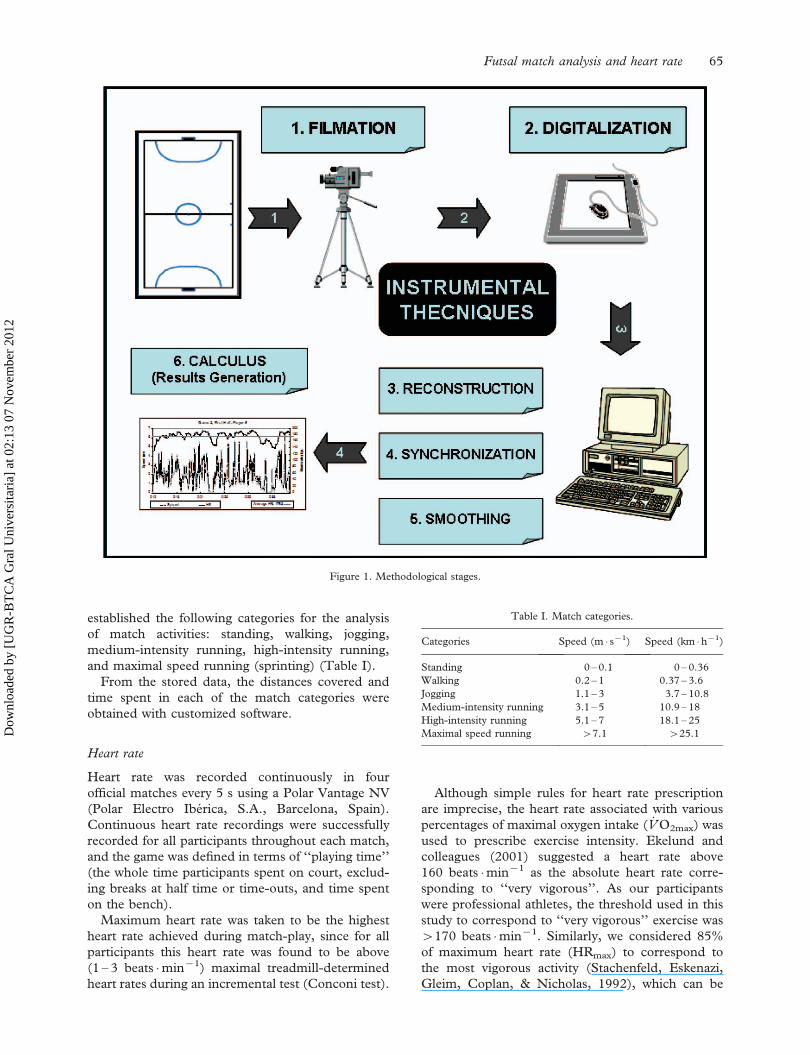
A bi-dimensional photogrammetric system
(Barbero, 2002) was used. Play was recorded by
two digital video cameras (Panasonic NV-DS1 EG)
set up approximately 5 m from one court sideline
and 10 m above the field of play, each recording one
half of the court. The images were captured and
stored in a computer using a video capture card (AV
Master 98 – Fast Multimedia). Next, the player was
digitized in real-time with specially designed software
(Runner v. 1.0) so as to follow movements and to
determine distances and speeds during the game,
before the positional register was reconstructed,
synchronized, and smoothed to obtain the results
(Barbero, Soto, & Granda, 2003) (Figure 1).
Reconstruction is necessary because the coordi-
nates obtained are deformed because of the perspec-
tive. Synchronization allows adjustment of the data
obtained by both cameras, and the smoothing of
the player’s positional data is intended to minimize
the possible errors produced as a consequence of
imprecise digitization. The possible errors generated
by the system are constant and can be easily
smoothed using digital filters. The accuracy and
intra-operator reliability of the method employed was
calculated using the following protocol: the same
operator was always used for the digitizing phase.
Before data acquisition, this operator was thoroughly
trained in digitizing skills, analysing more than 10 h
of futsal players’ motions. To determine reliability,
the operator repeated 5 min of real futsal motions
10 times at different speeds (walking, jogging, and
running), where the spatial and temporal dimensions
were well known as a reference square was used.
The results of this analysis showed that the reliability
and accuracy of the system is from 0.4 to 1.5%
(Barbero, 2002), depending on the speed at which
the player is moving. At high speeds, the estimated
error is+ 8.6 m each 5 min; when the player is still
or moving slowly, the error is+ 2.3 m each 5 min
(Barbero et al., 2003). Finally, the calculus module
(specifically designed and developed software for
calculating the kinematic data) allows the results
to be generated through numeric or graphic
parameters.
All games were played on a high-quality indoor
court consisting of a parquet flooring system. Based
on the descriptions of Reilly and Thomas (1976) and
Docherty et al. (1988), and adaptations to this model
as proposed by several authors (Hernandez, 2001;
Van Gool, Van Gerven, & Boutmans, 1988), we have
64 J. C. Barbero-Alvarez et al.
Dow
nloa
ded
by [
UG
R-B
TC
A G
ral U
nive
rsita
ria]
at 0
2:13
07
Nov
embe
r 20
12
established the following categories for the analysis
of match activities: standing, walking, jogging,
medium-intensity running, high-intensity running,
and maximal speed running (sprinting) (Table I).
From the stored data, the distances covered and
time spent in each of the match categories were
obtained with customized software.
Heart rate
Heart rate was recorded continuously in four
official matches every 5 s using a Polar Vantage NV
(Polar Electro Iberica, S.A., Barcelona, Spain).
Continuous heart rate recordings were successfully
recorded for all participants throughout each match,
and the game was defined in terms of ‘‘playing time’’
(the whole time participants spent on court, exclud-
ing breaks at half time or time-outs, and time spent
on the bench).
Maximum heart rate was taken to be the highest
heart rate achieved during match-play, since for all
participants this heart rate was found to be above
(1 – 3 beats �min71) maximal treadmill-determined
heart rates during an incremental test (Conconi test).
Although simple rules for heart rate prescription
are imprecise, the heart rate associated with various
percentages of maximal oxygen intake ( _V O2max) was
used to prescribe exercise intensity. Ekelund and
colleagues (2001) suggested a heart rate above
160 beats �min71 as the absolute heart rate corre-
sponding to ‘‘very vigorous’’. As our participants
were professional athletes, the threshold used in this
study to correspond to ‘‘very vigorous’’ exercise was
4170 beats �min71. Similarly, we considered 85%
of maximum heart rate (HRmax) to correspond to
the most vigorous activity (Stachenfeld, Eskenazi,
Gleim, Coplan, & Nicholas, 1992), which can be
Table I. Match categories.
Categories Speed (m � s71) Speed (km �h71)
Standing 0 – 0.1 0 – 0.36
Walking 0.2 – 1 0.37 – 3.6
Jogging 1.1 – 3 3.7 – 10.8
Medium-intensity running 3.1 – 5 10.9 – 18
High-intensity running 5.1 – 7 18.1 – 25
Maximal speed running 47.1 425.1
Figure 1. Methodological stages.
Futsal match analysis and heart rate 65
Dow
nloa
ded
by [
UG
R-B
TC
A G
ral U
nive
rsita
ria]
at 0
2:13
07
Nov
embe
r 20
12
considered to be equivalent to 80% of peak oxygen
uptake.
Relative time was determined in three intensity
zones based on the classification proposed by
Woolford and Angove (1991) and the recommenda-
tions of the ACSM: supra-threshold or very vigorous
activity (485% HRmax), aerobic zone or moderate
activity (65 – 85% HRmax), and sub-aerobic or
low activity (565% HRmax).
Statistical analysis
Data collection, treatment, and analysis were per-
formed using a Microsoft Office Excel 2003 spread-
sheet and the SPSS for Windows statistical package
(v. 11.0). Data are presented as means, standard
deviations (s), and ranges. Mean values for match
activities and heart rates were compared. Differences
between the two halves were compared using a
Student’s t-test. Comparison was made of heart rates
recorded and speed attained during the first and last
5 min of each half. Statistical significance was set at
P5 0.05.
Results
Distances covered
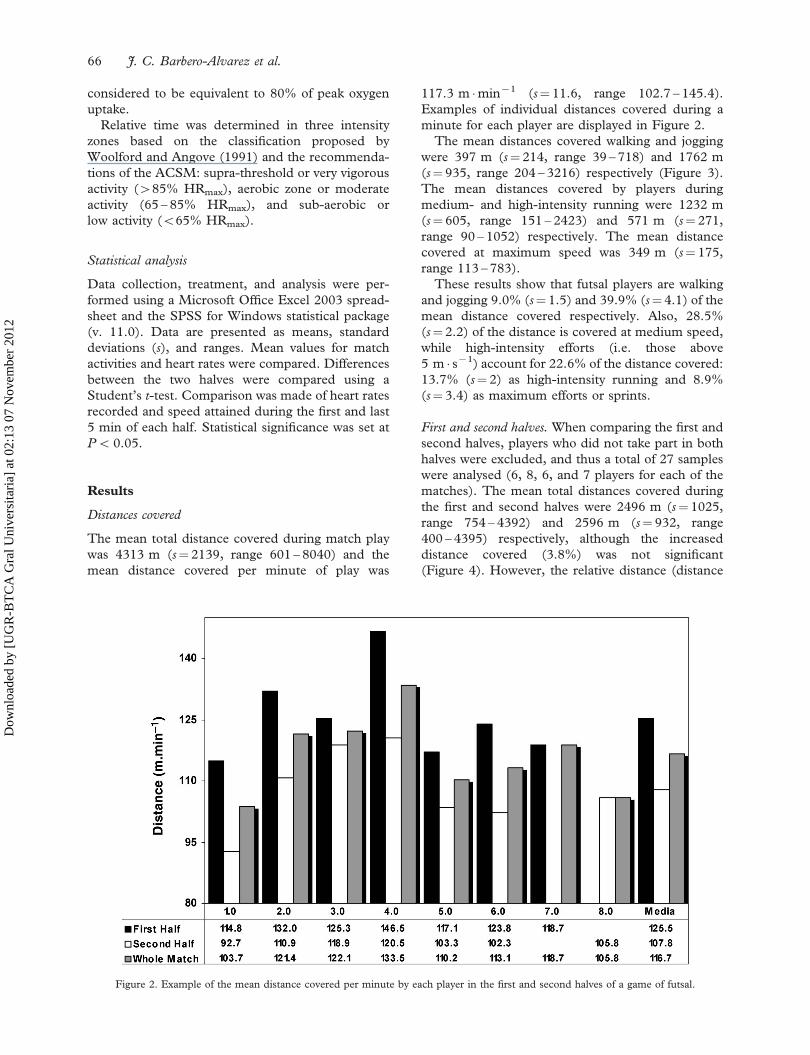
The mean total distance covered during match play
was 4313 m (s¼ 2139, range 601 – 8040) and the
mean distance covered per minute of play was
117.3 m �min71 (s¼ 11.6, range 102.7 – 145.4).
Examples of individual distances covered during a
minute for each player are displayed in Figure 2.
The mean distances covered walking and jogging
were 397 m (s¼ 214, range 39 – 718) and 1762 m
(s¼ 935, range 204 – 3216) respectively (Figure 3).
The mean distances covered by players during
medium- and high-intensity running were 1232 m
(s¼ 605, range 151 – 2423) and 571 m (s¼ 271,
range 90 – 1052) respectively. The mean distance
covered at maximum speed was 349 m (s¼ 175,
range 113 – 783).
These results show that futsal players are walking
and jogging 9.0% (s¼ 1.5) and 39.9% (s¼ 4.1) of the
mean distance covered respectively. Also, 28.5%
(s¼ 2.2) of the distance is covered at medium speed,
while high-intensity efforts (i.e. those above
5 m � s71) account for 22.6% of the distance covered:
13.7% (s¼ 2) as high-intensity running and 8.9%
(s¼ 3.4) as maximum efforts or sprints.
First and second halves. When comparing the first and
second halves, players who did not take part in both
halves were excluded, and thus a total of 27 samples
were analysed (6, 8, 6, and 7 players for each of the
matches). The mean total distances covered during
the first and second halves were 2496 m (s¼ 1025,
range 754 – 4392) and 2596 m (s¼ 932, range
400 – 4395) respectively, although the increased
distance covered (3.8%) was not significant
(Figure 4). However, the relative distance (distance
Figure 2. Example of the mean distance covered per minute by each player in the first and second halves of a game of futsal.
66 J. C. Barbero-Alvarez et al.
Dow
nloa
ded
by [
UG
R-B
TC
A G
ral U
nive
rsita
ria]
at 0
2:13
07
Nov
embe
r 20
12
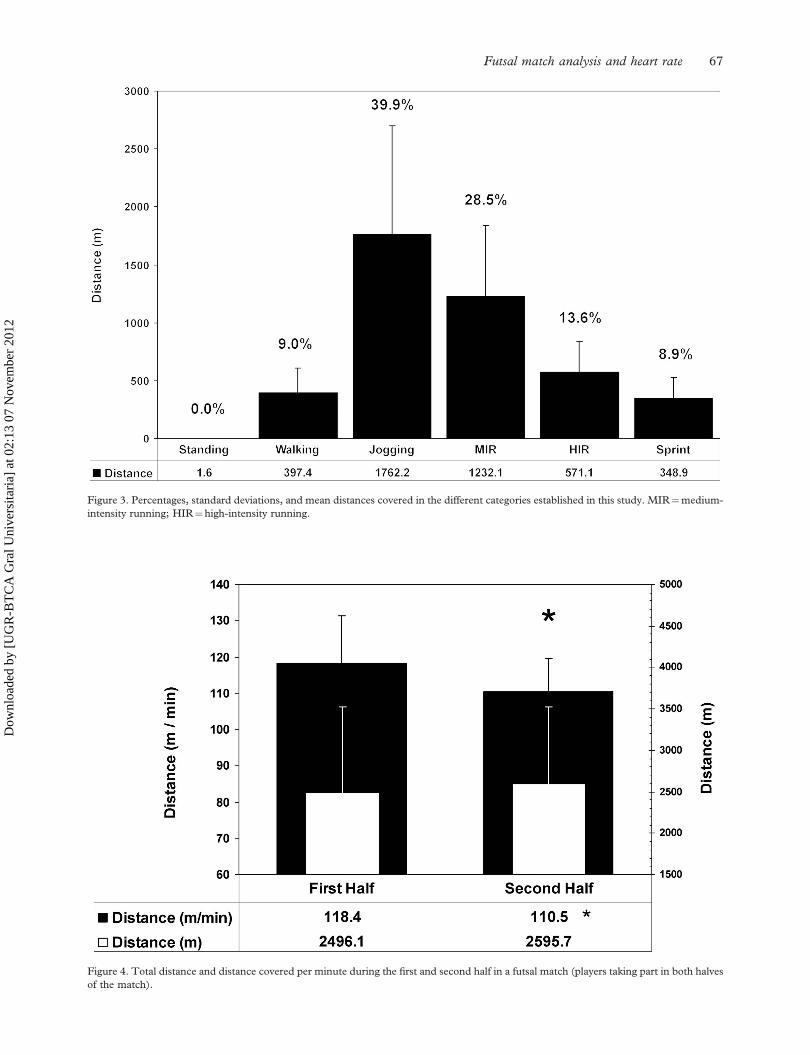
Figure 3. Percentages, standard deviations, and mean distances covered in the different categories established in this study. MIR¼medium-
intensity running; HIR¼high-intensity running.
Figure 4. Total distance and distance covered per minute during the first and second half in a futsal match (players taking part in both halves
of the match).
Futsal match analysis and heart rate 67
Dow
nloa
ded
by [
UG
R-B
TC
A G
ral U
nive
rsita
ria]
at 0
2:13
07
Nov
embe
r 20
12
covered per minute played) decreased by 7.1%, from
118 m �min71 (s¼ 13, range 92 – 147) in the first
half to 111 m �min71 (s¼ 9, range 101 – 129), which
was significantly different (P¼ 0.023). No such
differences were found in the two halves for the
distance covered in the established categories, except
for the periods in the standing category (P¼ 0.013):
0.7 m vs. 1 m.
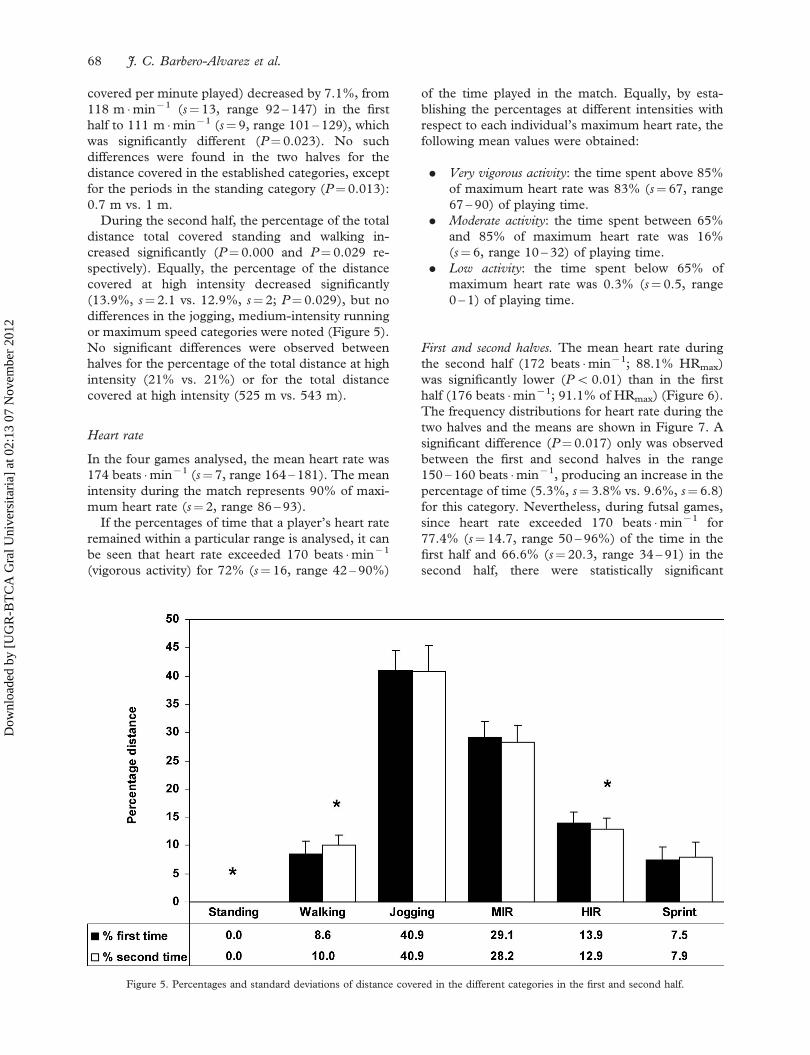
During the second half, the percentage of the total
distance total covered standing and walking in-
creased significantly (P¼ 0.000 and P¼ 0.029 re-
spectively). Equally, the percentage of the distance
covered at high intensity decreased significantly
(13.9%, s¼ 2.1 vs. 12.9%, s¼ 2; P¼ 0.029), but no
differences in the jogging, medium-intensity running
or maximum speed categories were noted (Figure 5).
No significant differences were observed between
halves for the percentage of the total distance at high
intensity (21% vs. 21%) or for the total distance
covered at high intensity (525 m vs. 543 m).
Heart rate
In the four games analysed, the mean heart rate was
174 beats �min71 (s¼ 7, range 164 – 181). The mean
intensity during the match represents 90% of maxi-
mum heart rate (s¼ 2, range 86 – 93).
If the percentages of time that a player’s heart rate
remained within a particular range is analysed, it can
be seen that heart rate exceeded 170 beats �min71
(vigorous activity) for 72% (s¼ 16, range 42 – 90%)
of the time played in the match. Equally, by esta-
blishing the percentages at different intensities with
respect to each individual’s maximum heart rate, the
following mean values were obtained:
. Very vigorous activity: the time spent above 85%
of maximum heart rate was 83% (s¼ 67, range
67 – 90) of playing time.
. Moderate activity: the time spent between 65%
and 85% of maximum heart rate was 16%
(s¼ 6, range 10 – 32) of playing time.
. Low activity: the time spent below 65% of
maximum heart rate was 0.3% (s¼ 0.5, range
0 – 1) of playing time.
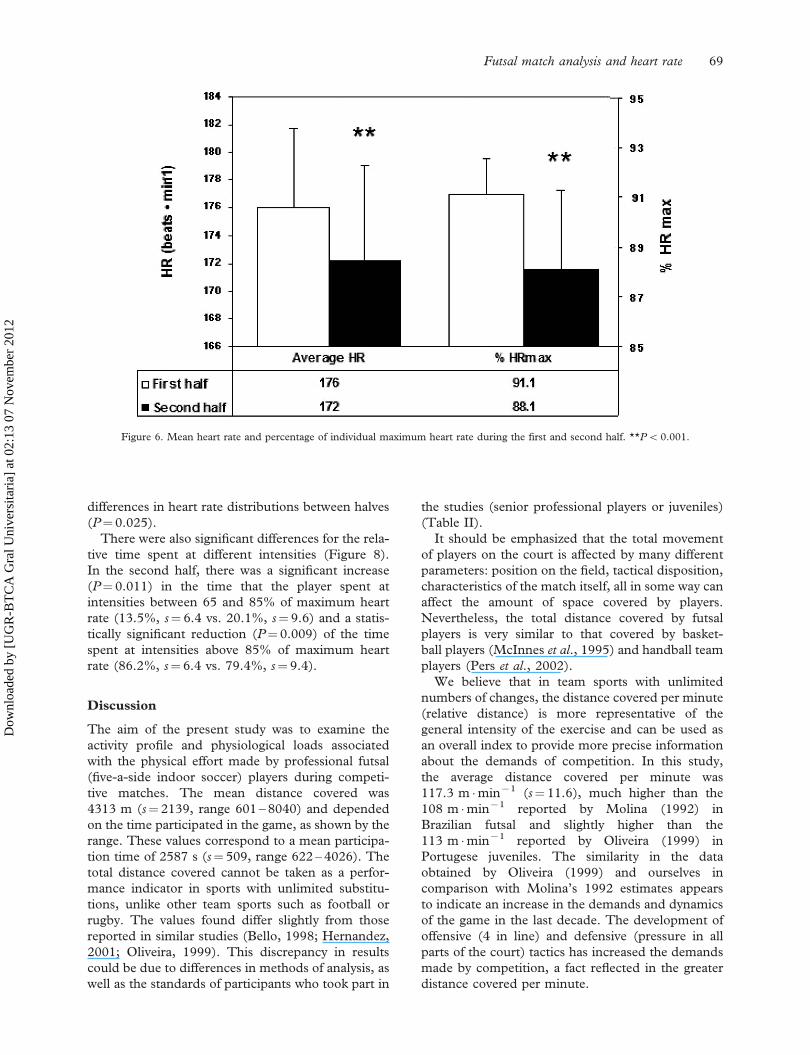
First and second halves. The mean heart rate during
the second half (172 beats �min71; 88.1% HRmax)
was significantly lower (P5 0.01) than in the first
half (176 beats �min71; 91.1% of HRmax) (Figure 6).
The frequency distributions for heart rate during the
two halves and the means are shown in Figure 7. A
significant difference (P¼ 0.017) only was observed
between the first and second halves in the range
150 – 160 beats �min71, producing an increase in the
percentage of time (5.3%, s¼ 3.8% vs. 9.6%, s¼ 6.8)
for this category. Nevertheless, during futsal games,
since heart rate exceeded 170 beats �min71 for
77.4% (s¼ 14.7, range 50 – 96%) of the time in the
first half and 66.6% (s¼ 20.3, range 34 – 91) in the
second half, there were statistically significant
Figure 5. Percentages and standard deviations of distance covered in the different categories in the first and second half.
68 J. C. Barbero-Alvarez et al.
Dow
nloa
ded
by [
UG
R-B
TC
A G
ral U
nive
rsita
ria]
at 0
2:13
07
Nov
embe
r 20
12
differences in heart rate distributions between halves
(P¼ 0.025).
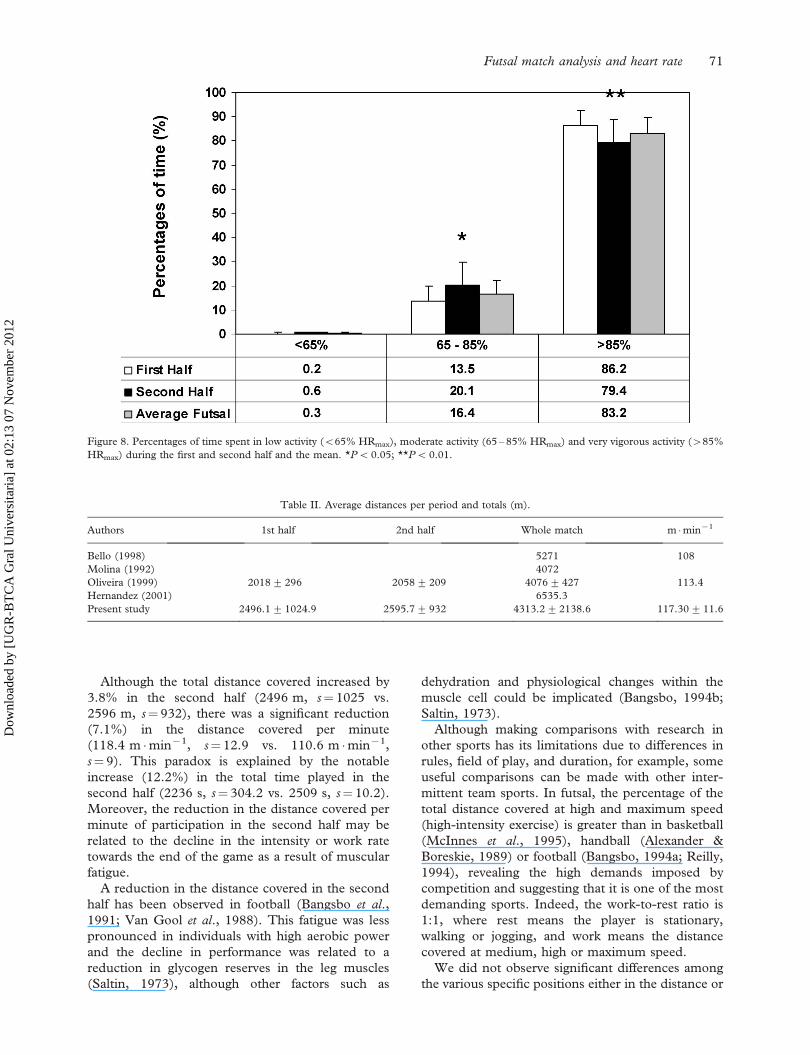
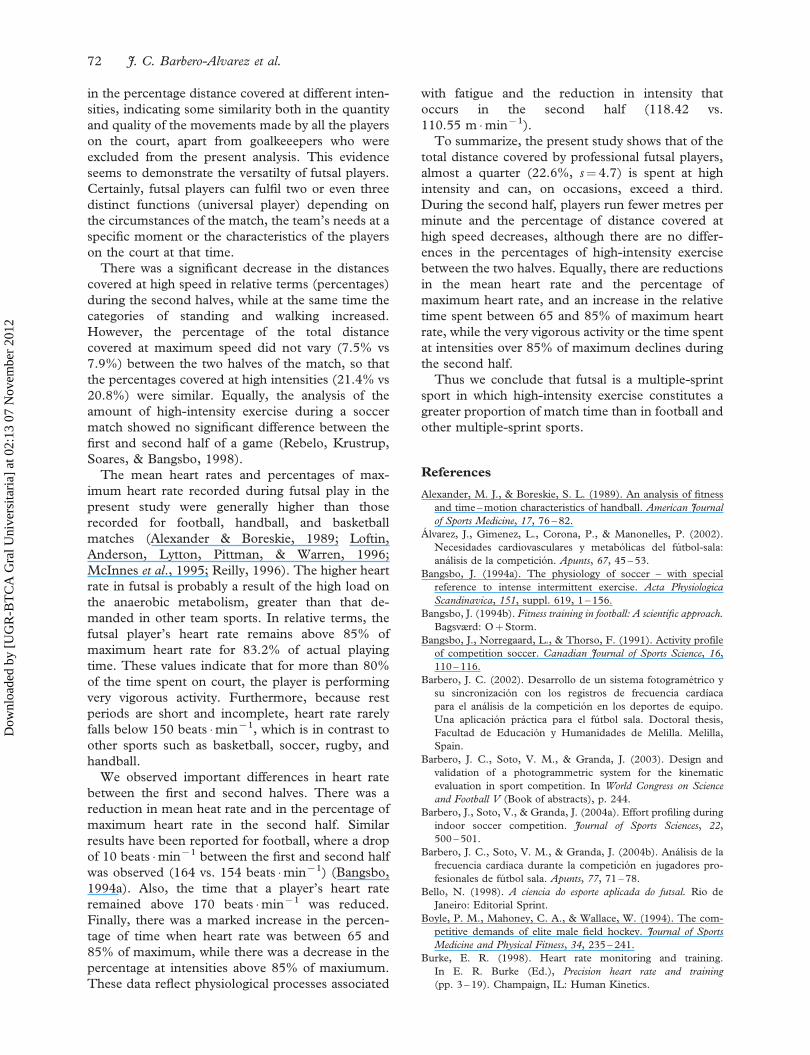
There were also significant differences for the rela-
tive time spent at different intensities (Figure 8).
In the second half, there was a significant increase
(P¼ 0.011) in the time that the player spent at
intensities between 65 and 85% of maximum heart
rate (13.5%, s¼ 6.4 vs. 20.1%, s¼ 9.6) and a statis-
tically significant reduction (P¼ 0.009) of the time
spent at intensities above 85% of maximum heart
rate (86.2%, s¼ 6.4 vs. 79.4%, s¼ 9.4).
Discussion
The aim of the present study was to examine the
activity profile and physiological loads associated
with the physical effort made by professional futsal
(five-a-side indoor soccer) players during competi-
tive matches. The mean distance covered was
4313 m (s¼ 2139, range 601 – 8040) and depended
on the time participated in the game, as shown by the
range. These values correspond to a mean participa-
tion time of 2587 s (s¼ 509, range 622 – 4026). The
total distance covered cannot be taken as a perfor-
mance indicator in sports with unlimited substitu-
tions, unlike other team sports such as football or
rugby. The values found differ slightly from those
reported in similar studies (Bello, 1998; Hernandez,
2001; Oliveira, 1999). This discrepancy in results
could be due to differences in methods of analysis, as
well as the standards of participants who took part in
the studies (senior professional players or juveniles)
(Table II).
It should be emphasized that the total movement
of players on the court is affected by many different
parameters: position on the field, tactical disposition,
characteristics of the match itself, all in some way can
affect the amount of space covered by players.
Nevertheless, the total distance covered by futsal
players is very similar to that covered by basket-
ball players (McInnes et al., 1995) and handball team
players (Pers et al., 2002).
We believe that in team sports with unlimited
numbers of changes, the distance covered per minute
(relative distance) is more representative of the
general intensity of the exercise and can be used as
an overall index to provide more precise information
about the demands of competition. In this study,
the average distance covered per minute was
117.3 m �min71 (s¼ 11.6), much higher than the
108 m �min71 reported by Molina (1992) in
Brazilian futsal and slightly higher than the
113 m �min71 reported by Oliveira (1999) in
Portugese juveniles. The similarity in the data
obtained by Oliveira (1999) and ourselves in
comparison with Molina’s 1992 estimates appears
to indicate an increase in the demands and dynamics
of the game in the last decade. The development of
offensive (4 in line) and defensive (pressure in all
parts of the court) tactics has increased the demands
made by competition, a fact reflected in the greater
distance covered per minute.
Figure 6. Mean heart rate and percentage of individual maximum heart rate during the first and second half. **P5 0.001.
Futsal match analysis and heart rate 69
Dow
nloa
ded
by [
UG
R-B
TC
A G
ral U
nive
rsita
ria]
at 0
2:13
07
Nov
embe
r 20
12
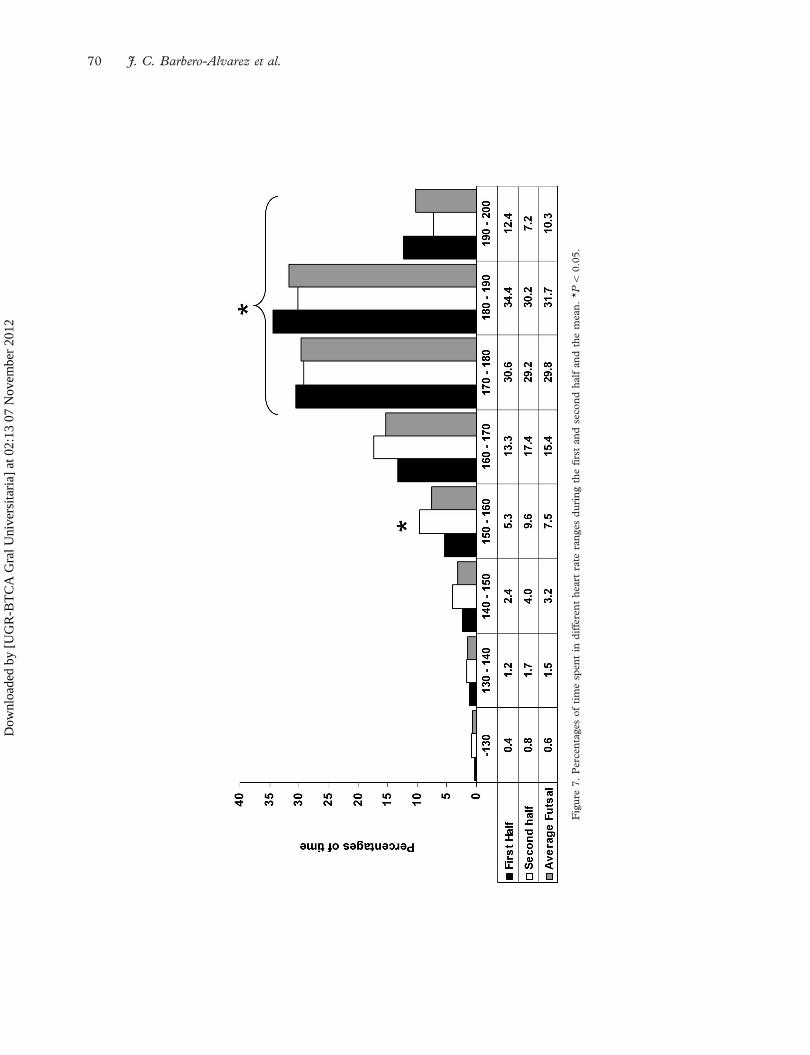
Fig
ure
7.
Per
cen
tages
of
tim
esp
ent
ind
iffe
ren
th
eart
rate
ran
ges
du
rin
gth
efi
rst
and
seco
nd
hal
fan
dth
em
ean
.*P5
0.0
5.
70 J. C. Barbero-Alvarez et al.
Dow
nloa
ded
by [
UG
R-B
TC
A G
ral U
nive
rsita
ria]
at 0
2:13
07
Nov
embe
r 20
12
Although the total distance covered increased by
3.8% in the second half (2496 m, s¼ 1025 vs.
2596 m, s¼ 932), there was a significant reduction
(7.1%) in the distance covered per minute
(118.4 m �min71, s¼ 12.9 vs. 110.6 m �min71,
s¼ 9). This paradox is explained by the notable
increase (12.2%) in the total time played in the
second half (2236 s, s¼ 304.2 vs. 2509 s, s¼ 10.2).
Moreover, the reduction in the distance covered per
minute of participation in the second half may be
related to the decline in the intensity or work rate
towards the end of the game as a result of muscular
fatigue.
A reduction in the distance covered in the second
half has been observed in football (Bangsbo et al.,
1991; Van Gool et al., 1988). This fatigue was less
pronounced in individuals with high aerobic power
and the decline in performance was related to a
reduction in glycogen reserves in the leg muscles
(Saltin, 1973), although other factors such as
dehydration and physiological changes within the
muscle cell could be implicated (Bangsbo, 1994b;
Saltin, 1973).
Although making comparisons with research in
other sports has its limitations due to differences in
rules, field of play, and duration, for example, some
useful comparisons can be made with other inter-
mittent team sports. In futsal, the percentage of the
total distance covered at high and maximum speed
(high-intensity exercise) is greater than in basketball
(McInnes et al., 1995), handball (Alexander &
Boreskie, 1989) or football (Bangsbo, 1994a; Reilly,
1994), revealing the high demands imposed by
competition and suggesting that it is one of the most
demanding sports. Indeed, the work-to-rest ratio is
1:1, where rest means the player is stationary,
walking or jogging, and work means the distance
covered at medium, high or maximum speed.
We did not observe significant differences among
the various specific positions either in the distance or
Table II. Average distances per period and totals (m).
Authors 1st half 2nd half Whole match m �min71
Bello (1998) 5271 108
Molina (1992) 4072
Oliveira (1999) 2018+296 2058+ 209 4076+427 113.4
Hernandez (2001) 6535.3
Present study 2496.1+1024.9 2595.7+ 932 4313.2+2138.6 117.30+ 11.6
Figure 8. Percentages of time spent in low activity (565% HRmax), moderate activity (65 – 85% HRmax) and very vigorous activity (485%
HRmax) during the first and second half and the mean. *P50.05; **P5 0.01.
Futsal match analysis and heart rate 71
Dow
nloa
ded
by [
UG
R-B
TC
A G
ral U
nive
rsita
ria]
at 0
2:13
07
Nov
embe
r 20
12
in the percentage distance covered at different inten-
sities, indicating some similarity both in the quantity
and quality of the movements made by all the players
on the court, apart from goalkeeepers who were
excluded from the present analysis. This evidence
seems to demonstrate the versatilty of futsal players.
Certainly, futsal players can fulfil two or even three
distinct functions (universal player) depending on
the circumstances of the match, the team’s needs at a
specific moment or the characteristics of the players
on the court at that time.
There was a significant decrease in the distances
covered at high speed in relative terms (percentages)
during the second halves, while at the same time the
categories of standing and walking increased.
However, the percentage of the total distance
covered at maximum speed did not vary (7.5% vs
7.9%) between the two halves of the match, so that
the percentages covered at high intensities (21.4% vs
20.8%) were similar. Equally, the analysis of the
amount of high-intensity exercise during a soccer
match showed no significant difference between the
first and second half of a game (Rebelo, Krustrup,
Soares, & Bangsbo, 1998).
The mean heart rates and percentages of max-
imum heart rate recorded during futsal play in the
present study were generally higher than those
recorded for football, handball, and basketball
matches (Alexander & Boreskie, 1989; Loftin,
Anderson, Lytton, Pittman, & Warren, 1996;
McInnes et al., 1995; Reilly, 1996). The higher heart
rate in futsal is probably a result of the high load on
the anaerobic metabolism, greater than that de-
manded in other team sports. In relative terms, the
futsal player’s heart rate remains above 85% of
maximum heart rate for 83.2% of actual playing
time. These values indicate that for more than 80%
of the time spent on court, the player is performing
very vigorous activity. Furthermore, because rest
periods are short and incomplete, heart rate rarely
falls below 150 beats �min71, which is in contrast to
other sports such as basketball, soccer, rugby, and
handball.
We observed important differences in heart rate
between the first and second halves. There was a
reduction in mean heat rate and in the percentage of
maximum heart rate in the second half. Similar
results have been reported for football, where a drop
of 10 beats �min71 between the first and second half
was observed (164 vs. 154 beats �min71) (Bangsbo,
1994a). Also, the time that a player’s heart rate
remained above 170 beats �min71 was reduced.
Finally, there was a marked increase in the percen-
tage of time when heart rate was between 65 and
85% of maximum, while there was a decrease in the
percentage at intensities above 85% of maxiumum.
These data reflect physiological processes associated
with fatigue and the reduction in intensity that
occurs in the second half (118.42 vs.
110.55 m �min71).
To summarize, the present study shows that of the
total distance covered by professional futsal players,
almost a quarter (22.6%, s¼ 4.7) is spent at high
intensity and can, on occasions, exceed a third.
During the second half, players run fewer metres per
minute and the percentage of distance covered at
high speed decreases, although there are no differ-
ences in the percentages of high-intensity exercise
between the two halves. Equally, there are reductions
in the mean heart rate and the percentage of
maximum heart rate, and an increase in the relative
time spent between 65 and 85% of maximum heart
rate, while the very vigorous activity or the time spent
at intensities over 85% of maximum declines during
the second half.
Thus we conclude that futsal is a multiple-sprint
sport in which high-intensity exercise constitutes a
greater proportion of match time than in football and
other multiple-sprint sports.
References
Alexander, M. J., & Boreskie, S. L. (1989). An analysis of fitness
and time – motion characteristics of handball. American Journal
of Sports Medicine, 17, 76 – 82.
Alvarez, J., Gimenez, L., Corona, P., & Manonelles, P. (2002).
Necesidades cardiovasculares y metabolicas del futbol-sala:
analisis de la competicion. Apunts, 67, 45 – 53.
Bangsbo, J. (1994a). The physiology of soccer – with special
reference to intense intermittent exercise. Acta Physiologica
Scandinavica, 151, suppl. 619, 1 – 156.
Bangsbo, J. (1994b). Fitness training in football: A scientific approach.
Bagsværd: OþStorm.
Bangsbo, J., Norregaard, L., & Thorso, F. (1991). Activity profile
of competition soccer. Canadian Journal of Sports Science, 16,
110 – 116.
Barbero, J. C. (2002). Desarrollo de un sistema fotogrametrico y
su sincronizacion con los registros de frecuencia cardıaca
para el analisis de la competicion en los deportes de equipo.
Una aplicacion practica para el futbol sala. Doctoral thesis,
Facultad de Educacion y Humanidades de Melilla. Melilla,
Spain.
Barbero, J. C., Soto, V. M., & Granda, J. (2003). Design and
validation of a photogrammetric system for the kinematic
evaluation in sport competition. In World Congress on Science
and Football V (Book of abstracts), p. 244.
Barbero, J., Soto, V., & Granda, J. (2004a). Effort profiling during
indoor soccer competition. Journal of Sports Sciences, 22,
500 – 501.
Barbero, J. C., Soto, V. M., & Granda, J. (2004b). Analisis de la
frecuencia cardiaca durante la competicion en jugadores pro-
fesionales de futbol sala. Apunts, 77, 71 – 78.
Bello, N. (1998). A ciencia do esporte aplicada do futsal. Rio de
Janeiro: Editorial Sprint.
Boyle, P. M., Mahoney, C. A., & Wallace, W. (1994). The com-
petitive demands of elite male field hockey. Journal of Sports
Medicine and Physical Fitness, 34, 235 – 241.
Burke, E. R. (1998). Heart rate monitoring and training.
In E. R. Burke (Ed.), Precision heart rate and training
(pp. 3 – 19). Champaign, IL: Human Kinetics.
72 J. C. Barbero-Alvarez et al.
Dow
nloa
ded
by [
UG
R-B
TC
A G
ral U
nive
rsita
ria]
at 0
2:13
07
Nov
embe
r 20
12
Carter, A. (1996). Time and motion analysis and heart rate
monitoring of a back-row forward in first class rugby union
football. In M. Hughes (Ed.), Notational analysis of sport, I & II
(pp. 145 – 160). Cardiff: Centre of Notational Analysis,
University of Wales Institute.
Castagna, C., Abt, G., & D’Ottavio, S. (2002). The relationship
between selected blood lactate thresholds and match per-
formance in elite soccer referees. Journal of Strength and
Conditioning Research, 16, 623 – 627.
Deutsch, M. U., Maw, G. J., Jenkins, D., & Reaburn, P. (1998).
Heart rate, blood lactate and kinematic data of elite colts
(under-19) rugby union players during competition. Journal of
Sports Sciences, 16, 561 – 570.
Docherty, D., Wenger, H. A., & Neary, P. (1988). Time – motion
analysis related to the physiological demands of rugby. Journal
of Human Movement Studies, 14, 269 – 277.
Ekelund, U., Poortvliet, E., Yngve, A., Hurtig-Wennlov, A.,
Nilsson, A., & Sjostrom, M. (2001). Heart rate as an
indicator of the intensity of physical activity in human
adolescents. European Journal of Applied Physiology, 85,
244 – 249.
Hernandez, J. (2001). Analisis de los parametros espacio y tiempo
en el futbol sala. La distancia recorrida, el ritmo y direccion del
desplazamiento del jugador durante un encuentro de competi-
cion: Los casos de J. Gay (defensa), C. Marrero (cierre), J. Beto
(pivote), J. Limones (ala) y J. Claverıa (portero). Apunts
Educacion Fısica y Deportes, 65, 17 – 25.
Jardine, M. A., Wiggins, T. M., Myburgh, K. H., & Noakes, T. D.
(1988). Physiological characteristics of rugby players including
muscle glycogen content and muscle fibre composition. South
Africa Medical Journal, 73, 529 – 532.
Loftin, M., Anderson, P., Lytton, L., Pittman, P., & Warren, B.
(1996). Heart rate response during handball singles match-play
and selected physical fitness components of experienced male
handball players. Journal of Sports Medicine and Physical Fitness,
36, 95 – 99.
McInnes, S. E., Carlson, J. S., Jones, C. J., & McKenna, M. J.
(1995). The physiological load imposed on basketball
players during competition. Journal of Sports Sciences, 13,
387 – 397.
Mohr, M., Krustrup, P., & Bangsbo, J. (2003). Match perfor-
mance of high-standard soccer players with special reference to
development of fatigue. Journal of Sports Sciences, 21, 519 – 528.
Molina, R. (1992). Futsal: Um estudo das capacidades aerobica e
anaerobica do jogadores e das actividades em jogo. Monografıa
Universidad Estadual Paulista. Rio Claro: UNESP.
Oliveira, L. M. (1999). Perfil de actividade do jovem jogador de futsal.
Dissertacao apresentada as provas de mestrado. Porto:
FCDEF-UPX.
Pers, J., Bon, M., Kovacic, S., Sibila, M., & Dezman, B. (2002).
Observation and analysis of large-scale human motion. Human
Movement Science, 21, 295 – 311.
Rebelo, N., Krustrup, P., Soares, J., & Bangsbo, J. (1998).
Reduction in intermittent exercise performance during a soccer
match. Journal of Sports Sciences, 16, 482 – 483.
Reilly, T. (1994). Analysis of work rate in soccer.
In S. A. Robertson (Ed.), Contemporary ergonomics: Proceedings
of the Annual Conference of the Ergonomics Society (pp. 377 – 381).
London: Taylor & Francis.
Reilly, T. (1996). Science and soccer. London: E & FN Spon.
Reilly, T., & Thomas, V. (1976). A motion analysis of work rate in
different positional roles in professional football match-play.
Journal of Human Movement Studies, 2, 87 – 97.
Saltin, B. (1973). Metabolic fundamentals in exercise. Medicine
and Science in Sports, 5, 137 – 146.
Stachenfeld, N. S., Eskenazi, M., Gleim, G. W., Coplan, N. L., &
Nicholas, J. A. (1992). Predictive accuracy of criteria used to
assess maximal oxygen consumption. American Heart Journal,
123, 922 – 925.
Van Gool, D., Van Gerven, D., & Boutmans, J. (1988).
The physiological load imposed on soccer players during real
match play. In T. Reilly, A. Lees, K. Davids, & W. J. Murphy
(Eds.), Science and football (pp. 51 – 60). London: E & FN Spon.
Van Rensburg, J. P., Kielblock, A. J., Van der Linde, A., &
Van der Walt, W. H. (1986). Physiological responses to a rugby
match. South Africa Journal for Research in Sport, Physical
Education and Recreation, 7, 47 – 57.
Woolford, S., & Angove, M. (1991). A comparison of training
techniques and game intensities for national level netball
players. Sports Coach, 14, 18 – 21.
Futsal match analysis and heart rate 73
Dow
nloa
ded
by [
UG
R-B
TC
A G
ral U
nive
rsita
ria]
at 0
2:13
07
Nov
embe
r 20
12
Copyright © 2022 FDOKUMEN