Mastitis Causing Pathogens Within the Dairy Cattle Environment 3 Ayuba Caleb Kudi, MP Bray, Aziwo....
112
Transcript of Mastitis Causing Pathogens Within the Dairy Cattle Environment 3 Ayuba Caleb Kudi, MP Bray, Aziwo....
International Journal of Biology January, 2009
1
ContentsMastitis Causing Pathogens Within the Dairy Cattle Environment 3Ayuba Caleb Kudi, M.P. Bray, Aziwo.T.Niba & Demo.J.U.Kalla Protective Effect of Total Flavones of Buckwheat Flowers on Carbon Tetrachloride-induced Hepatic Impairment
14
Jinxiu Chu, Guangmin Li & Shuying Han Biosorption of Acid Yellow by Spent Brewery Grains in a Batch System: Equilibrium and Kinetic Modelling
21
V.Jaikumar & V Ramamurthi Research of msh Locus of the Bundle Forming Pilus (Bfp) of Aeromonas Veronii bv Sobria 30Qin Yang & Zezhi Huang Antimicrobial Potential of Plant Seed Extracts against Multidrug Resistant Methicillin Resistant Staphylococcus aureus (MDR-MRSA)
34
E.S. Karthy, P. Ranjitha & A. Mohankumar Study on the Fat-related Genes of Chicken 41Guang Han, Herong Liao, Xiuxia Liu, Jincheng Zhang & Ming Ni Variation on Male Mating Success to Short-Term High Thermal Stress among Three Geographical Strains of Drosophila melanogaster
45
Banu Sebnem ÖNDER Optimized Design of Acid Red B for Degradation by Corynebacterium 51Hao Zhang, Zanmin Wu, Fang Dong & Limin Han Outbreak of Egg Drop Syndrome in Bangladesh 56Jahangir Alam, Md. Al-Mamun, Mohammed Abdus Samad, Mohammed Rahamat Ullah, Md. Giasuddin & M. J. F. A. Taimur Effect of IGF-1 on Expression of GH Receptor, IGF-1, IGF-1 Receptor, KAP3.2 and KAP6-1 mRNA in the Skin of Sheep
65
Chengxian Zhang, Herong Liao & Yan Zhao Study of Bioassay the Allelopathical Effect of Neem (Azadirachta indica) n-hexane, Acetone and Water-soluble Extracts on Six Weeds
71
Zoheir.Y.Ashrafi, Sedigheh Sadeghi, Hassan.M.Alizade, Hamid.R.Mashhadi & Ebrahim.R.Mohamadi The Measurement Method of Population Dynamics and New Measurement Index 78Chengguo Jiang, Tong Liu & Dan Wang Influences of Bedding Material in Vermicomposting Process 81Latifah Abd Manaf, Mohd Lokman Che Jusoh, Mohd Kamil Yusoff, Tengku Hanidza Tengku Ismail, Rosta Harun, Hafizan Juahir & Kamaruzaman Jusoff Cloning and Characterization of NAD-dependent Deacetylase Sirtuin 2 Homolog from the Silkworm, Bombyx mori.
92
Yijia Li, Keping Chen, Qin Yao, Lu Gao, Jun Li & Lin Wang

Vol. 1, No. 1 International Journal of Biology
2
ContentsCutting Across Discipline Boundaries: Statistical Prospects in Disclosing and Handling the Workings of Natural Biodiversity
101
Crispin M. Mutshinda Characterization and Prokaryotic expression of Glucuronyltransferase-S Gene in Silkworm Bombyx mori 104Yukun Chen, KePing Chen, Fang Bao & Qin Yao
International Journal of Biology January, 2009
3
Mastitis Causing Pathogens within the Dairy Cattle Environment
Ayuba Caleb Kudi (Corresponding Author), M.P. Bray & Aziwo.T.NibaFaculty of Science, School of Biological Sciences, University of Plymouth
Drake Circus, Plymouth, Devon PL 4 8AA, United Kingdom E-mail: [email protected]
Demo.J.U.Kalla Animal Production Programme, Abubakar Tafwa Balewa University
P.M.B.0248 Bauchi 740004, Bauchi State E-mail: [email protected]
AbstractThe aim of this study was to investigate the relationship between bacterial numbers found within the bedding material and those found upon the teats in cattle herds bedded on three different bedding materials; sand, sawdust and straw. The bacteria to be studied are known to be responsible for the development of mastitis within the mammary glands resulting in reduced milk quality and poor welfare conditions for the animal. Samples for the analysis were collected under natural housing conditions from the bedding and from the teats of a representative sample of each herd. These were then plated to isolate numbers of the environmental bacteria, Streptococcus uberis and Escherichia coli (E. coli), and to conduct a total viable count for comparison. Statistical analysis showed that six of the nine relationships tested resulted in a P<0.05. The microbial test results also showed that the straw bedding hosted the lowest total number of bacteria at 8.5 x 10. When compared with the incidence of mastitis infections within the herd, the straw bedding had a considerably higher number of infections than from the sand or sawdust with thirty-one cases recorded. In conclusion, minimising pathogen growth within the bedding material, results in lower numbers of pathogens being transmitted onto the cow's teats thereby reducing the possibility of intrammamary infections. It is recommended that further work is carried out through repeating the study on a larger number of farms to identify whether the relationship between the bacterial numbers exists on further farms. In addition to this, it is also recommended that further analysis of the pathogens responsible for the mastitis within the herds be undertaken to identify if the environmental pathogens are responsible for these intrammamary infections.Keywords: Environmental mastitis, Strep uberis, E.coli, Sand, Sawdust, Straw, Clinical mastitis 1. IntroductionMastitis (Mast: breast, itis: inflammation) is defined as ‘an inflammation of the udder resulting in an inflamed quarter or quarters with a change in the appearance of the milk’ (Blowey 1999). Mastitis can either be infectious, caused as a response to the presence of microbial organisms or non-infectious, as a result of physical injury to the mammary gland. The inflammatory response results in an increase in the blood proteins and white blood cells in the mammary tissue, which can then pass into the milk product. This response aims to destroy the irritant, repair the damaged mammary tissue and return the udder to its normal function. However, as a result of such mastitic inflammations, a loss in milk output is often experienced (Table 1). Economic losses from mastitis infections to the National Dairy Herd are estimated at £93 million per year to the UK Dairy Industry through discarded milk, quality penalties, treatment and reduced output (Kossaibati & Esslemont 1997). It has been calculated by Esslemont (2002) that a single mild case of mastitis can cost almost £150 through direct and indirect costs. The quality of milk is affected in a number of ways (Table 2) including composition such as fat and protein and also through the increase in somatic cells that can lead to penalties imposed by milk buyers. Edmondson (2004) states that ‘high cell counts result in farmers losing money: 0.3ppl, which is the minimum penalty, is the equivalent of £20 per cow per year’. In addition to this, Edmondson (2004) also states that 'low cell count milk tastes
Vol. 1, No. 1 International Journal of Biology
4
good, has a longer shelf life for the consumer and gives maximum value to the processor,' whilst mastitic infections can also lead to reductions in the components important to human health such as calcium and potassium. The inflammatory response to mastitic infections also gives rise to welfare issues within the herd with inflammations of the udder causing undue pain and discomfort for the animal, whilst severe cases can lead to poisoning and premature death (Blowey 1999). In terms of the sources of infection it has been established that bacteria are the most common cause of mastitis although other sources of infection including mycoplasms, algae and fungi, are also prevalent (Cassel 1993). There are several species of such infectious bacteria responsible for causing these infections including Staphyloccocus aureus, Streptococcus agalactaie, Streptococcus dysgalactiae, and the environmental bacteria, E. coliand Streptococcus uberis.The simple classification of mastitis recognises two major groups; environmental mastitis and contagious mastitis. Environmental mastitis, which is to be examined within this study, is caused by organisms such as E. coli and Streptococcus uberis that do not usually live upon the skin but enter the teat canal when the cow comes into contact with a contaminated environment. Further divisions between the two groups can be made including clinical, sub-clinical and chronic mastitis. Mustafa (2003) states that only a small proportion of udder infections result in "clinical mastitis" whereby there are changes in udder condition and milk quality. The vast majority of cases exist as sub-clinical; with an estimated 20 - 40 cases for every clinical mastitis case within the herd. Therefore mastitic problems may be present within a herd despite no visible presence within the cows or the milk. Edmondson (2001) states that 'environmental infections account for nearly two-thirds of all cases of clinical mastitis,' with the infection occurring either between milkings, such as teat contact with pathogenic material, or during the udder preparation. Dodd (1987) states that 'contamination with the teat end of a susceptible quarter from a pathogen is the first stage in the infection process' and thus the problem of environmental bacteria from contaminated material is one of great concern within the dairy sector. A study conducted by Rendos, Eberhart & Kesler (1975) identified that different bedding materials influenced the types and numbers of bacteria within such materials whilst a later study by Ward, Hughes, Faull, Cripps, Sutherland & Sutherst (2002) studied the effects of straw bedding upon the incidence of mastitic infections from environmental pathogens. The aim of this study, however, is to use three different bedding materials sand, sawdust and straw to examine the relationship between the bacterial numbers within the bedding material and the bacterial numbers found upon the teats within each herd. The results of this investigation will also be compared against the incidence of mastitis within the herd to identify the suitability of these bedding materials in the aim of reducing mastitic infections. This study will examine the two most prevalent environmental bacteria, E. coli and Streptococcus uberis to identify ways to reduce mastitic infections caused by such bacteria. 2. Materials and Methods 2.1 Site selection The farms were chosen based on their use of the three bedding materials; sand, sawdust or straw, their daily routine within the cubicle housing and the herd number. Each farm removes faeces from cubicles, rakes the bedding material about and cleans the dunging areas twice each day ensuring adequate cleanliness and similarities between the three farms. Farm size and average cell count can be seen in Table 3. These similarities between farms allow the relationships between bacterial numbers to be more fairly compared under such natural conditions. It is necessary to highlight the difference in the addition of new bedding materials to the cubicles; the farms using sand and sawdust both apply fresh bedding to cubicles on a weekly basis whilst straw is added fresh on alternative days at the straw bedded farm. Although there is a difference in the addition of fresh bedding between the three farms, each farm rakes cubicles about daily to provide cleaner material to the area in contact with the udder. The difference in bedding styles will also show the effects upon bacterial numbers of applying fresh bedding on a regular basis in comparison with the weekly applications. 2.2 Collection of samples Bedding Samples - Every fourteen days five samples of each bedding material were collected on the day of plating to ensure minimal bacterial change between the collection and plating processes. Samples of approximately 30 grams of bedding were collected from the area of the cubicle in contact with the cow's udder and placed into sterilised bags before being sealed to prevent contamination. Teat Samples - At the fourteen day intervals five teat swabs were also collected from each farm. This was carried out during the milking process with all cows dry wiped before sample collection to remove loose bedding debris. A single teat from each cow was sampled using a moistened sterilised swab rotated over the teat end five times before being placed into a bottle of 10ml diluents for transport.

International Journal of Biology January, 2009
5
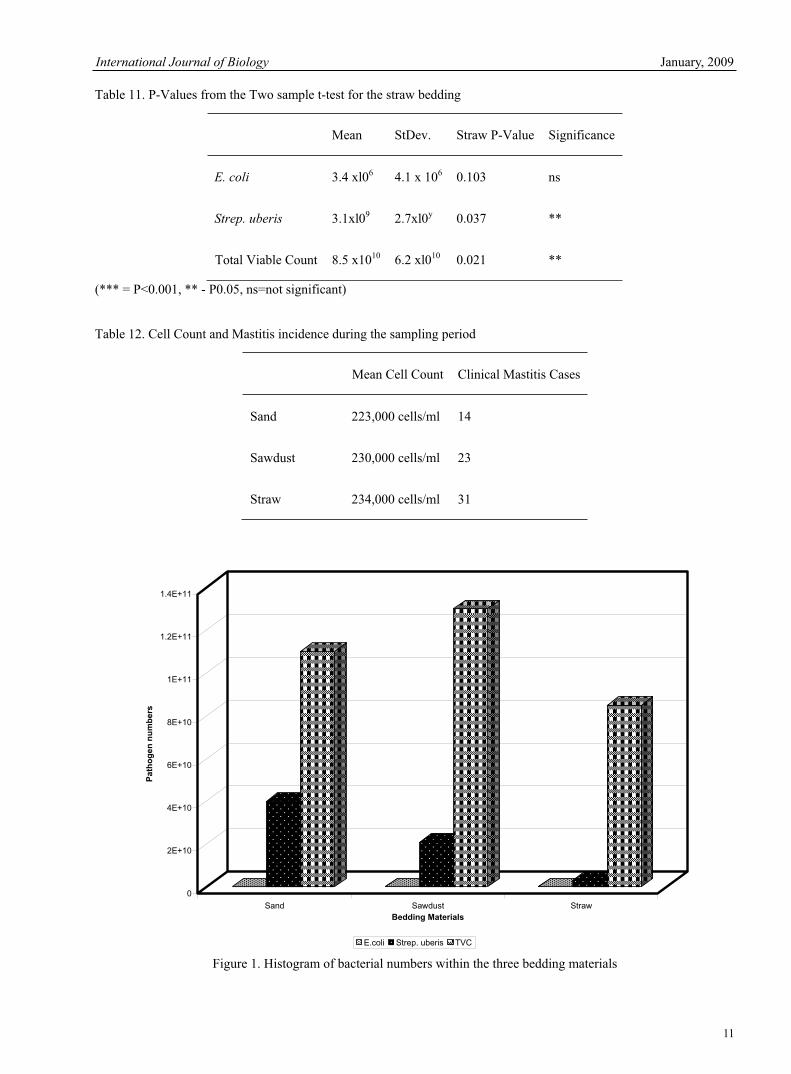
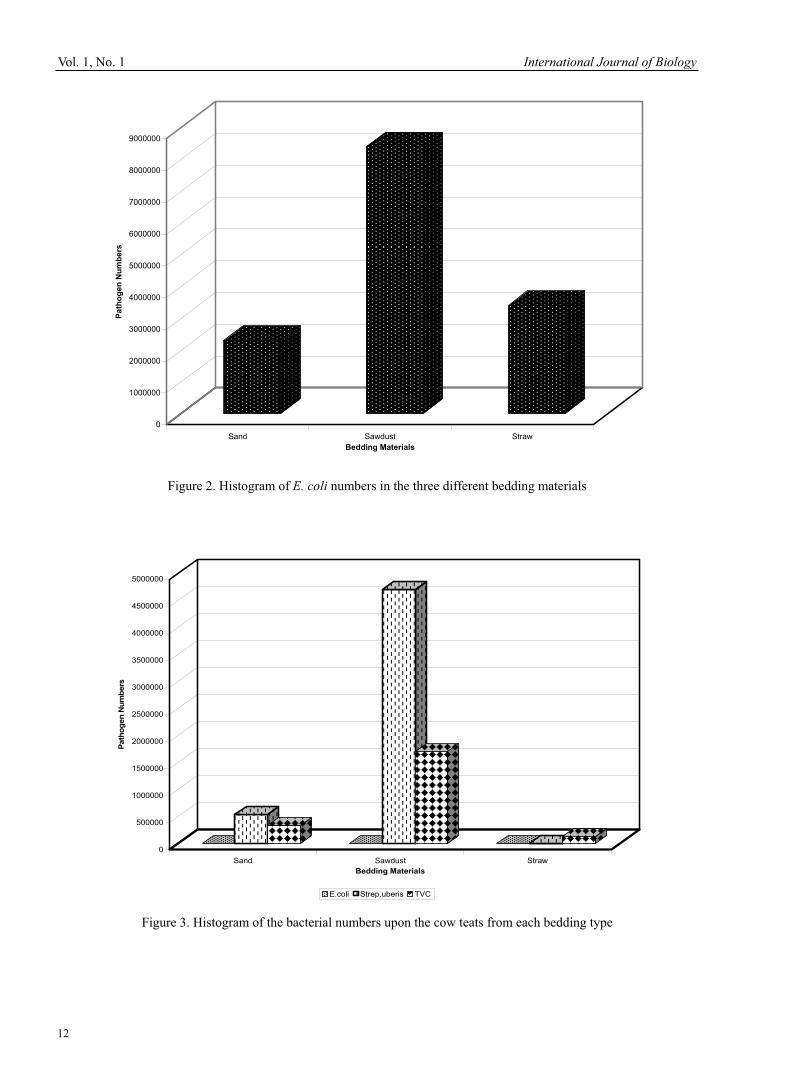
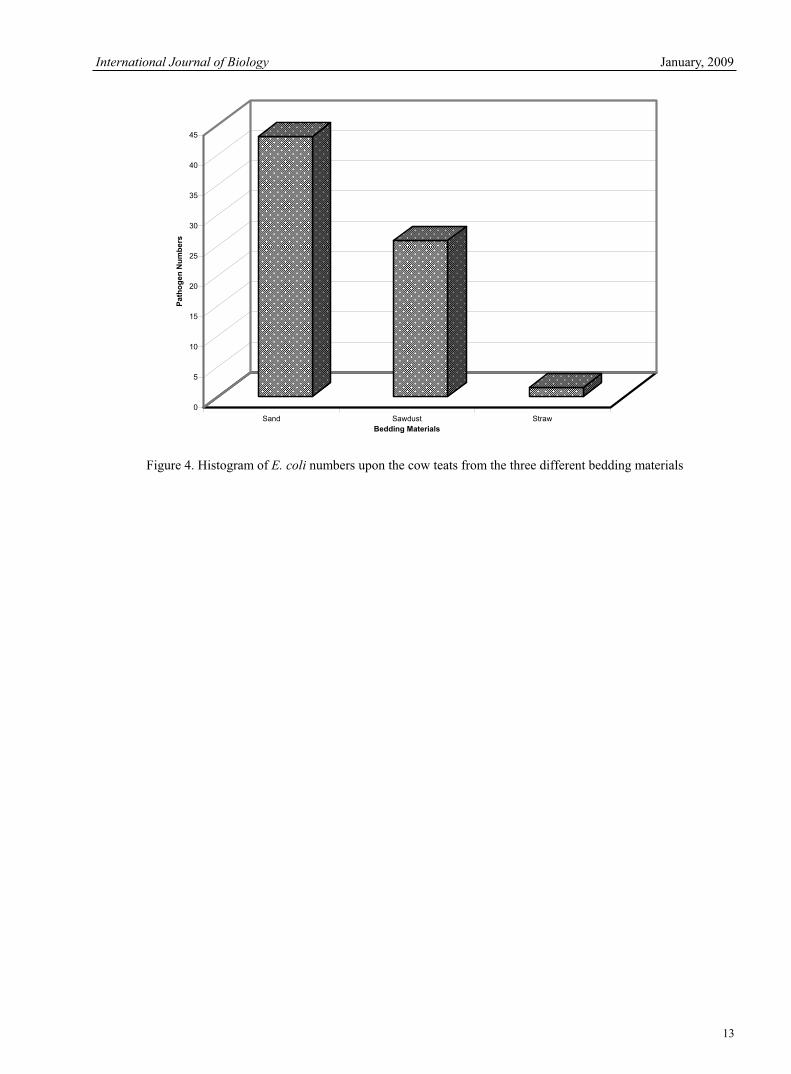
All of the samples were then transported from farm to laboratory under low temperature conditions to reduce bacterial change before being plated. 2.3 Procedures for microbial analysis - plating techniques 2.3.1 Plating bedding samples Under aseptic conditions within the laboratory 10 grams of the bedding material was transferred from the collection bag into a sterilised stomacher bag with 90ml of diluent added, this was then placed in a macerator for 30 seconds to remove the bacterial species from the bedding material. The solution produced represented a 10-1 sample of the bacteria present within the bedding material with further dilutions made down to 10-8 using 1ml of the previous dilution to 9ml of diluent. A 0.2ml sample of the required dilution was then placed onto the selected agar plate and spread over the entire surface. After this was carried out upon on all samples, the agar plates were incubated for 24 hours before inspection and analysis. Table 4 displays the dilutions used for each bedding material. 2.3.2 Plating teat samples Under aseptic conditions, the teat samples were agitated for 10 seconds to extract the bacteria from the swab before a sample was taken. One millilitre of the solution was taken for use in producing dilutions down to 10-3, with a 0.2ml sample taken for spreading upon the bacteria specific agar plates. Table 5 displays the dilutions used for the microbial tests upon the teats from each type of bedding.2.3.3 Analysis of bacteria specific agar plates The agar plates were incubated for 24 hours at 37°C before being removed for inspection and counting using a tally counter. Isolation of the bacteria required was carried out through the use of the bacteria specific agar plates, these being MacConkey agar to isolate E. coli bacteria and the Edward's medium agar to isolate the Streptococci bacteria. Further isolation of the Streptococci uberis strain was carried out through the exposure of plates to ultra-violet light to which Strep, uberis appears dark black, whilst the clear agar and other Streptococci strains become pink. After the bacteria are counted, calculations need to be undertaken to identify the bacterial content in 1ml of the neat sample. This is carried out through multiplication by five to change the samples from 0.2ml to 1ml samples, these can then be multiplied by the dilution factor to identify the bacterial number within a 1ml sample. 3. ResultsFrom each farm the five results were recorded with the mean calculated for each of the sampling periods. These sampling periods were conducted at two week intervals over a three month period to provide data at regular stages whilst the cows are housed during winter. From these six results the mean was calculated for each farm and each microbial test for use within the tabulated and graphical comparisons. For statistical tests the six results were used to provide a larger data source for better comparison. 3.1 Statistical analyses The data was analysed using MINITAB 13 to compare the teat and bedding data. The first test was used to identify whether the data was significantly different between the three farms, was analysed using the Analysis of Variance (ANOVA) test. A further test, the two-sample t-Test, was used to ascertain the relationship between the numbers of bacteria found within the bedding and those found upon the teat ends.3.2 Bedding material resultsThe results above show no significant difference between the data for the E. coli and total viable count with P>0.05. The Strep, uberis test results in a P-value of only slightly above this significant value with P=0.051 resulting in the possibility of some degree of difference between the data sets. The mean results for each microbial test conducted can be best viewed when displayed within a histogram (Figure 1). The graph above identifies that the material hosting the lowest Strep, uberis and total bacterial number was the straw. The sand bedding has a slightly lower total viable count (TVC) than that of the sawdust although has the highest number of Strep, uberis bacteria compared with the straw and sawdust materials. Further analysis of the E. coli data can be viewed in Figure 2. Further graphical analysis of the E. coli bacteria on a smaller scale identifies that the material hosting the greatest number of E. coli bacteria is the sawdust which has three times the amount found within the sand bedding and twice as many as found within the sawdust. 3.3 Teat end results The results from the ANOVA test show there to be no significant difference between the data for each microbial test conducted with values of P>0.05. The mean results from the microbial tests can be viewed graphically in Figures 3 and 4. The histogram displays the straw bedding to be the most suitable form of bedding material for reducing total bacterial

Vol. 1, No. 1 International Journal of Biology
6
numbers (TVC) and Strep, uberis numbers upon the teat. The sand suit in high numbers of Strep, uberis upon the teat ends. By examining the total viable count for the sawdust material it can be seen that it is considerably higher than that of either the sand or straw bedding materials. Again closer analysis of the E.coli data needs to be undertaken which can be seen in Figure 4. After closer graphical analysis of the E.coli bacteria upon the teat ends, the numbers of E.coli bacteria can be seen to be considerably higher within the sand and sawdust materials than from within the straw bedding.3.4 Further tests Two additional tests were also carried out to identify possible sources for the environmental bacteria. These tests included testing the drinking water to ensure this was not a possible source of infection and secondly through examining the unused bedding material for bacterial numbers.3.5 Water testing The water was sampled from its source and tested for bacterial presence. After testing it was established that two of the farms, those using sand and sawdust, had shown positive for bacterial presence and thus further isolation of the bacterial species was required. Further analysis identified that the sawdust sample indicated negative for the presence of E.coli whilst the sand sample indicated positive. However, after through this analysis it was identified that the presence of bacteria was below the requirements set for mains water supply and thus not a potential source for such environmental mastitis pathogens. 3.6 Tests on unused bedding A further test was carried out upon the unused bedding prior to be added to the cubicles with the results shown in Table 8. These results identify that the unused bedding materials are potential sources of mastitic infection prior to use. Therefore in the housing conditions these bacteria are at their optimum pH, temperature and have available food sources from the organic bedding materials therefore encouraging rapid bacterial growth resulting in possible infections of the mammary gland. 3.7 Analysis of the relationship 3.7.1 Comparison of the data - two sample t-test The main aim of this study was to identify the relationship between the bacterial numbers found within the bedding and those found upon the teat ends of cows from each of the three bedding materials. This relationship analysis was carried out using MINITAB 13 and the Two sample t-test. The results of this test are shown displayed in Tables 9, 10 & 11.The Two sample t-test identified a significant relationship between the numbers of bacteria in two-thirds of the nine relationships tested with P<0.05. The three remaining relationships do not show a significant relationship with P>0.05 although the P-values formed as a result are still relatively low at between 0.072 and 0.103 which may be due to anomalous data from faeces or wetter bedding. The relationships established show a distinct relationship for the bacteria Strep, uberis within all three bedding materials. Whilst in contrast the E.coli relationships identify only the sand as having a significant relationship with the P=0.072 and 0.103 for the sawdust and straw respectively. In addition, the total viable count carried out identifies significant relationships between data for both the sand and straw material, whilst the sawdust P-value is slightly greater than the significant value with P= 0.073. 4. DiscussionWork carried out by Blowey (1999) and a study by Ward et al. (2002) have established that a relationship exists between bacterial numbers within bedding materials and the incidence of mastitis infections within the herd. A further study by Rendos et al. (1975) identifies similar links, as found within this study, between bedding and bacteria numbers, although their study was carried out upon different bedding materials. This study however aims to identity whether there is a direct relationship between the bacteria upon the teat ends and those found within the three different bedding materials of sand, sawdust and straw. Through the analysis of the data collected from the three farms this study has identified that the straw bedding hosts the lowest number of Strep, uberis and the total viable count whilst the sand bedding hosts the lowest numbers of E. coli (Table 6). In contrast the sawdust bedding hosts high numbers of both environmental bacteria and the total viable count. On the second test upon the cow's teat ends the straw bedding again hosted the lowest numbers of environmental bacteria whilst the sand bedding hosted the lowest numbers of bacteria within the total viable count (Table 7). Examining this data it would appear that the straw bedding appears to be the most suitable bedding material for reducing bacterial numbers, both within the bedding and upon the teat ends, whilst the sawdust appears to be the worst. The reason for the poor performance of the sawdust is due to its small particle size which, being organic, encourages the rapid growth of bacteria. This small particle size is also said to allow greater contact with teat ends increasing the risk of new infections (Godkin 2002). In terms of the performance of the straw it is important to note that, although the straw bacterial numbers are the lowest recorded, the regular renewal of bedding

International Journal of Biology January, 2009
7
materials will result in reduced bacterial growth within the bedding. The additional test carried out upon the unused bedding identifies the sand bedding material as having the lowest numbers of bacteria when looked at overall, whilst the straw material appears to host exceptionally high numbers of environmental bacteria and has a considerably high total viable count (Table 8). The unused bedding may therefore be a major source of environmental bacteria, with such bacteria capable of surviving for long periods and remaining viable between 15-45°C with pH conditions up to 9.5, with damper bedding materials promoting greater growth of bacteria increasing the level of contamination of the teat ends (Godkin 2002). Based on the information, it is worthwhile comparing the results from the experiments with the occurrence of mastitic infections within each herd to identify the most suitable type of bedding for reducing clinical infections (Table 12). As shown in Table 12 the straw bedding material has the highest number of clinical mastitis cases in comparison with the sand bedding, which experiences the lowest number of mastitis cases over the sampling period. This is in contrast with the data from the microbial tests conducted from the housing conditions which would have tended to indicate that the straw, which experienced low bacterial numbers both within the bedding and upon the teat ends, would have reduced mastitic infections. An explanation for this is the inert nature of the sand material which does not support bacterial growth as it has little or no nutritive value to sustain bacterial development, (Reader 2003) whilst within the laboratory conditions these bacteria are allowed nutritive agar and thus begin to grow and develop. Thus under the housing conditions these bacterial numbers would remain low due to lack of nutritive availability. Sand, unlike straw and sawdust, does not heat up and does not support moisture to the same extent and therefore does not allow the optimum growth of bacteria to occur (Reader 2003). If the straw bedding had been used in a week long period however, bacterial growth would have been expected to be far higher due to the accumulation of bacterial growth from increased temperatures, moisture and nutritive value in the form of straw, resulting in the possibility of additional cases of mastitis within the herd. The main aim of this study was to identify whether a relationship exists between the bacterial numbers within the bedding materials and the numbers of bacteria upon the teat ends. The analysis of the data using the Two sample t-test identified significant relationships in 66% of the bedding material and teat end relationships, with the resulting 33% slightly above the significant P=0.05. It is therefore apparent, that through minimising the growth and development of pathogens within the bedding material, numbers of mastitic pathogens upon the teat ends can also be reduced, resulting in the possibility of fewer intramammary infections. 5. Conclusion In conclusion, this study has identified that a relationship exists between the bacterial numbers within the bedding materials and those found upon the teat ends. As a result, by aiming to reduce bacterial numbers within the bedding materials, the number of infectious bacteria upon the teat ends can be reduced leading to a possible reduction in intramammaiy infections from the contact of teat ends with infectious bacteria. This study also identified straw as being host to the lowest number of bacteria on an overall basis, whilst sawdust appeared to harbour the most. Regular renewal of the straw bedding on alternative days explains the resulting lower bacterial numbers than within the weekly bedded sand or sawdust. It is expected, from research into literature surrounding the subject, that sand is the most suitable type of bedding material for reducing clinical mastitis within the cow environment, which is also supported by the results in Table 12. Increasing the frequency of new cubicle bedding within the farms using sand and sawdust would help to reduce the accumulation of environmental pathogens and further reduce the chance of mastitic infections. From the analysis of the results and available literature, there are a number of possible ways to reduce intramammary infections. This study has highlighted the importance of the regular change of bedding upon reducing bacterial numbers and has also identified the effects of bedding material type upon the incidence of mastitic infections within the herd. Through reducing mastitic pathogens within the bedding material, it has also been shown that the transfer of pathogens onto the susceptible teat ends can be reduced allowing the animal's own defence mechanisms to manage such infections more effectively. Through the reduction of incidence in these intramammary infections, advantages can be seen for the consumer; through improved milk quality and longer shelf life, the processor; through improved quality of milk for cheese making and to the producer; through reduced costs from dealing with clinical cases and through the improved milk quality, resulting in reduced penalties. Recommendations for further workRecommended further work includes expanding the research to incorporate a wider range of farms to gain greater reliability within the data. Additional bedding materials could also be included within the research to include newer materials such as paper, wood pulp or rubber mats. Further work could also be carried out to analyse the types of bacteria causing the clinical mastitis infections to identify whether such infections are caused by the same environmental bacteria found within the bedding materials. This would
Vol. 1, No. 1 International Journal of Biology
8
identify whether a relationship exist between the bedding materials and the mastitic infections.Mastitis is a vast subject to study and therefore there is a large amount of further work that still needs to be undertaken to understand the subject fully. References Blowey, R. and Edmondson, P. (1995). Mastitis control of dairy herds. Farming Press Books, London. Blowey, R.W. (1999). A Veterinary book for dairy farmers, (3r Ed). Farming Press Books, London. Cassel, E. K. (1993). Mastitis control, Reducing somatic cell counts. [Online] http://www.abs.sdstate.edu/flc/foodsafetv/safety/mastitis.htm (14.10.2003). Cook, N.B. (2001). How good is sand bedding for your cows?. Hoard's Dairyman, 146(18), 667. Dodd, F. (1987). Environmental influences in bovine mastitis. International Federation No. 217/1987. Edmondson, P. (2001). Environmental mastitis, A matter of control. Dairy Farmer, 48 (5), 14-15. Edmondson, P. (2004) Celling out. Express Milk Partnership, Express Dairies, April-04, p16. Esslemont, D. (2002). What is mastitis really costing you? Dairy Farmer, 49 (12), 30 -31. Godkin, G. (2002). Feeding for higher production may be linked to environmental mastitis. [Online] http://www.govonca3.gov.on.ca/OMAFRA/english/livestock/dairy/facts/mfo feeding.htm (13.10.2003). Hughes, J. (1999). Bedding systems and mastitis. Proceedings of the British Mastitis Conference(1999), p73-78. [Online] http://www.iah.bbrsc.ac.uk/bmc/1999/papers&postersl999/Hughes.doc (14.10.2003). Kossaibati, M. A. and Esslemont, R. J. (1997). The costs of production diseases in dairy herds in England, Proceedings of British Mastitis Conference 1997: Progress in Mastitis Control, 8 October 1997. [Online] http://www.iah.bbsrc.ac.uk/bmc/1997/1997 papers - wordppl-14 kossaibati.doc. Mustafa, A. (2003). Mastitis in dairy cows; Dairy cattle production 342-450A. Macdonald Campus of Mcgill University, Faculty of Agricultural & Environmental Sciences, Department of Animal Science. Reader, J. (2002). Sand is clean, cool and comfortable but. Dairy Farmer, 49 (11), 50 - 53. Rendos, J.J. Eberhart, R.J. and Kesler E.M., (1974).Microbial populations of teat ends of dairy cows, and bedding materials. Journal of Dairy Science, 58, 1492 - 1500. Ward W.R, Hughes J.W, Faull W.B, Cripps P.J, Sutherland J.P, Sutherst J.E. (2002). Observational study of temperature, moisture, pH and bacteria in straw bedding and faecal consistency, cleanliness and mastitis in four dairy herds. Veterinary Record, 151, 199 – 206.
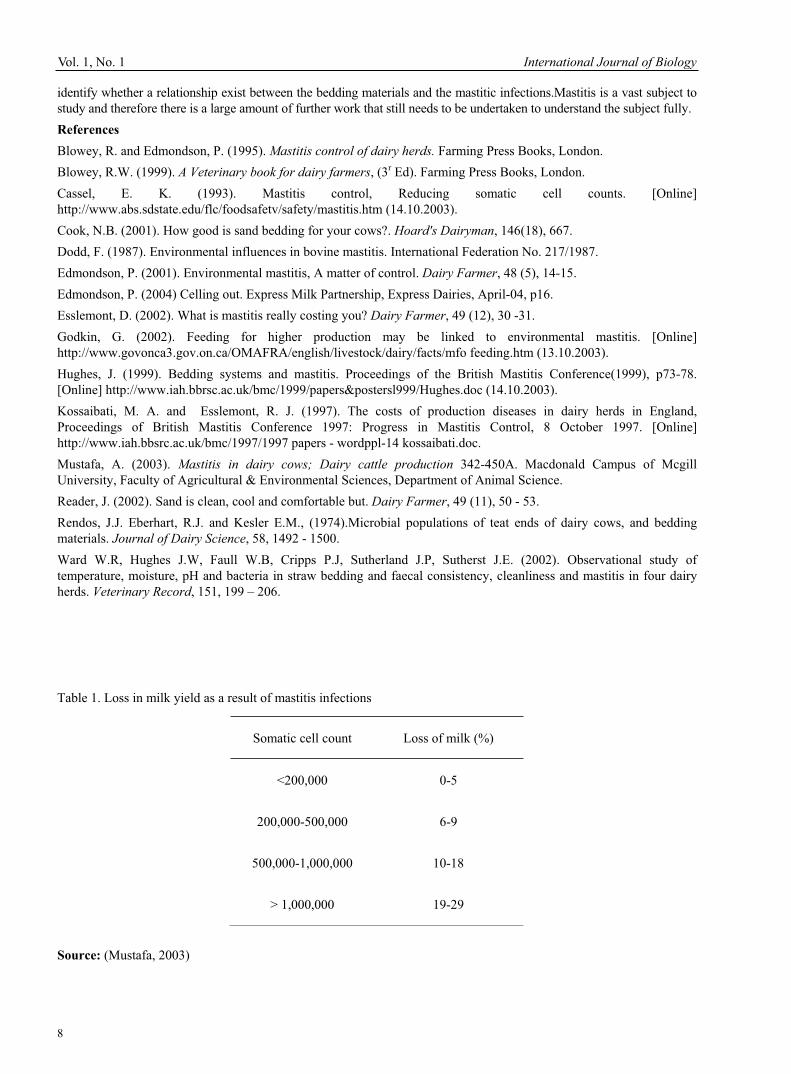
Table 1. Loss in milk yield as a result of mastitis infections
Somatic cell count Loss of milk (%)
<200,000 0-5
200,000-500,000 6-9
500,000-1,000,000 10-18
> 1,000,000 19-29
Source: (Mustafa, 2003)
International Journal of Biology January, 2009
9
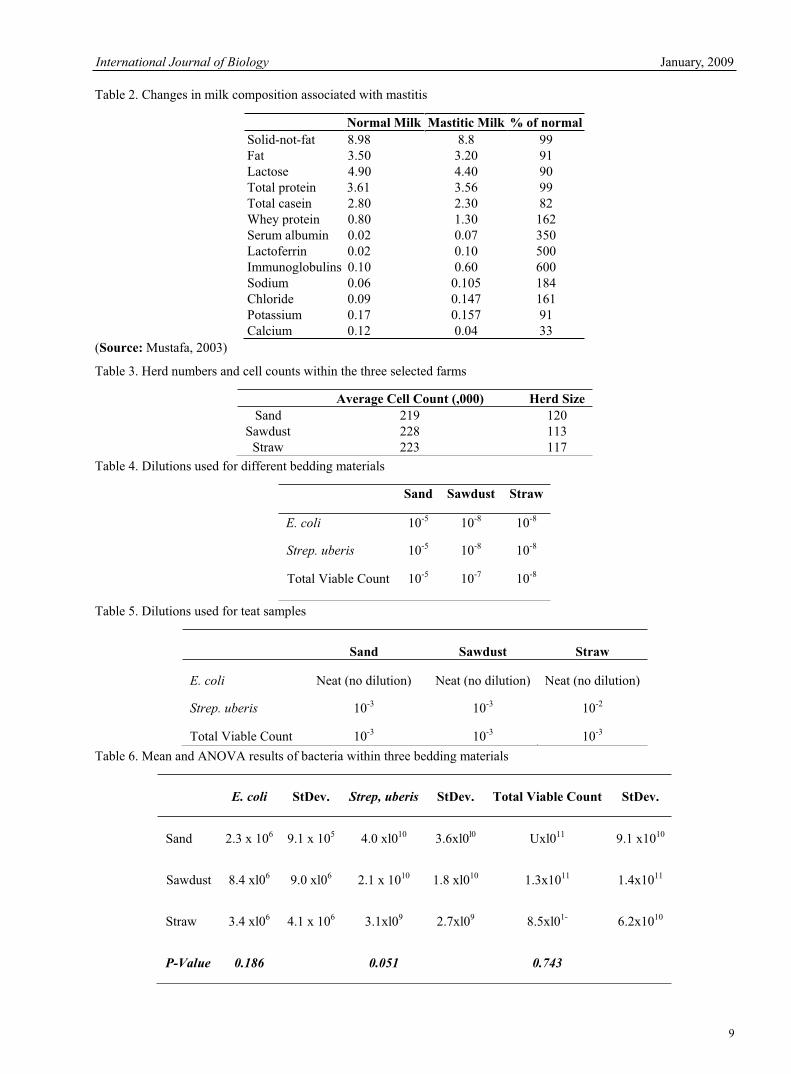
Table 2. Changes in milk composition associated with mastitis
Normal Milk Mastitic Milk % of normal Solid-not-fat 8.98 8.8 99 Fat 3.50 3.20 91 Lactose 4.90 4.40 90 Total protein 3.61 3.56 99 Total casein 2.80 2.30 82 Whey protein 0.80 1.30 162 Serum albumin 0.02 0.07 350 Lactoferrin 0.02 0.10 500 Immunoglobulins 0.10 0.60 600 Sodium 0.06 0.105 184 Chloride 0.09 0.147 161 Potassium 0.17 0.157 91 Calcium 0.12 0.04 33
(Source: Mustafa, 2003)
Table 3. Herd numbers and cell counts within the three selected farms
Average Cell Count (,000) Herd SizeSand 219 120
Sawdust 228 113Straw 223 117
Table 4. Dilutions used for different bedding materials
Sand Sawdust Straw
E. coli 10-5 10-8 10-8
Strep. uberis 10-5 10-8 10-8
Total Viable Count 10-5 10-7 10-8
Table 5. Dilutions used for teat samples
Sand Sawdust Straw
E. coli Neat (no dilution) Neat (no dilution) Neat (no dilution)
Strep. uberis 10-3 10-3 10-2
Total Viable Count 10-3 10-3 10-3
Table 6. Mean and ANOVA results of bacteria within three bedding materials
E. coli StDev. Strep, uberis StDev. Total Viable Count StDev.
Sand 2.3 x 10⁶ 9.1 x 10⁵ 4.0 xl010 3.6xl0l0 Uxl011 9.1 x10¹⁰
Sawdust 8.4 xl06 9.0 xl06 2.1 x 10¹⁰ 1.8 xl010 1.3x10¹¹ 1.4x10¹¹
Straw 3.4 xl06 4.1 x 10⁶ 3.1xl09 2.7xl09 8.5xl01- 6.2x10¹⁰
P-Value 0.186 0.051 0.743

Vol. 1, No. 1 International Journal of Biology
10
Table 7. Mean and ANOVA results of teat end bacteria from the three bedding materials
E. coli StDev. Strep, uberis StDev. Total Viable Count StDev.
Sand 43.1 92.4 5.4x10⁵ 1.2 xl06 3.4 x 10⁵ 3.0x10⁵
Sawdust 25.8 15.3 4.7 x 10⁶ 1.0x10⁷ 1.7x10⁶ 3.0x10⁶
Straw 1.6 2.2 1.0 xl04 1.8x10⁴ 1.3xl05 2.3x10⁵
P-Value 0.431 (ns) 0.388 (ns) 0. 266 (ns)
Table 8. Results of bacterial numbers in unused bedding
Sand Sawdust Straw
Strep. uberis 1.9 x 10³ 2.4xl0J 9.3 xl04
E.coli l.0xl02 0 3.5 xl02
Total Viable Count 4.0 xl05 5.1xl05 2.9 xl06
Table 9. P-Values from the Two sample t-test for the sand bedding
Mean StDev. Sand P-Value Significance
E. coli 2.3 x 10⁶ 9.1 x l05 0.001 ***
Strep. uberis 4.0 x l010 3.6 x l010 0.043 **
Total Viable Count 11 x l011 9.1 x 10IU 0.031 **
(*** = P0.001, ** = P<0.05, ns=not significant)
Table 10. P-Values from the Two sample t-test for the sawdust bedding
Mean StDev. Sawdust P-Value Significance
E. coli 8.4 xl06 9.0 x 10⁶ 0.072 ns
Strep. uberis 2.1 x 10ltJ 3.6xl0lu 0.040 **
Total Viable Count 1.3x10" 1.4x10" 0.073 ns
(*** = P0.001, ** = P0.05, ns=not significant)
International Journal of Biology January, 2009
11
Table 11. P-Values from the Two sample t-test for the straw bedding
Mean StDev. Straw P-Value Significance
E. coli 3.4 xl06 4.1 x 10⁶ 0.103 ns
Strep. uberis 3.1xl09 2.7xl0y 0.037 **
Total Viable Count 8.5 x10¹⁰ 6.2 xl010 0.021 **
(*** = P<0.001, ** - P0.05, ns=not significant)
Table 12. Cell Count and Mastitis incidence during the sampling period
Mean Cell Count Clinical Mastitis Cases
Sand 223,000 cells/ml 14
Sawdust 230,000 cells/ml 23
Straw 234,000 cells/ml 31
0
2E+10
4E+10
6E+10
8E+10
1E+11
1.2E+11
1.4E+11
Path
ogen
num
bers
Sand Sawdust StrawBedding Materials
E.coli Strep. uberis TVC
Figure 1. Histogram of bacterial numbers within the three bedding materials
Vol. 1, No. 1 International Journal of Biology
12
0
1000000
2000000
3000000
4000000
5000000
6000000
7000000
8000000
9000000
Path
ogen
Num
bers
Sand Sawdust StrawBedding Materials
Figure 2. Histogram of E. coli numbers in the three different bedding materials
0
500000
1000000
1500000
2000000
2500000
3000000
3500000
4000000
4500000
5000000
Path
ogen
Num
bers
Sand Sawdust StrawBedding Materials
E.coli Strep.uberis TVC
Figure 3. Histogram of the bacterial numbers upon the cow teats from each bedding type
International Journal of Biology January, 2009
13
0
5
10
15
20
25
30
35
40
45
Path
ogen
Num
bers
Sand Sawdust StrawBedding Materials
Figure 4. Histogram of E. coli numbers upon the cow teats from the three different bedding materials

Vol. 1, No. 1 International Journal of Biology
14
Protective Effect of Total Flavones of Buckwheat Flowers on Carbon Tetrachloride-induced Hepatic Impairment
Jinxiu Chu Department of Pharmacology, North China Coal Medical College
57 South Jian She Road, Tangshan 063000, China E-mail: [email protected]
Guangmin Li Department of Radiology, Tangshan Womenfolk and Infant Hospital
14 South Jian She Road, Tangshan 063000, China E-mail: [email protected]
Shuying Han (Corresponding author) Department of Pharmacology, North China Coal Medical College
57 South Jian She Road, Tangshan 063000, China E-mail: [email protected]
The research is financed by Science Committee of Hebei Province. No. 03276421 (Sponsoring information) Abstract Objective: The protective effect and possible mechanism of total flavones of buckwheat flowers (TFBF) on experimental hepatic impairment in mice were studied. Methods: The hepatic impairment model of mice was induced by injecting carbon tetrachloride (CCl4) subcutaneously (sc) every 4 days for 7 times. Meanwhile, mice in the two treatment groups were given TFBF at dosages of 0.04 g•kg-1•d-1 and 0.02 g•kg-1•d-1 respectively through intragastric (ig) injection, and mice in the positive control group were treated with methionine (MET) by contrast. Next the day CCl4was lastly injected, half the mice were killed. The contents of alanine aminotransferase (ALT) in serum and ALT, superoxidase dismutase (SOD), glutathione (GSH), malonaldehyde (MDA), triglyceride (TG), total cholesterol (TC) in liver tissue, the liver indexes (LI), and the hepato-pathologic changes of the mice were examined. The rest mice were given identical treatment for another 2 weeks. Results: TFBF could inhibit the rising of serum ALT, liver MDA, TG, TC, LI, and the lowering of liver SOD and GSH in CCl4-induced hepatic impairment mice. It could obviously ease the hepato-pathologic damages as well. Conclusion: TFBF could effectively protect the hepatic impairment in CCl4-induced mice. Keywords: Buckwheat, Flavones, Hepatic impairment, Carbon tetrachloride Buckwheat flowers, which contain abundant flavone compounds such as rutin and quercetin, are blossoms of a plant of polygonaceae named F.esculentum Moench. Studies demonstrated that the flavones of buckwheat possessed many pharmacological activities -- lowering blood glucose and blood lipid, anti-oxidation, improving the hemorheology, regulating vasoactive substances (Han, 2001, pp.694-696; 2003, pp.64-66; 2003, pp477-478; Przybylski, 1998, pp.1595-1601) and so on. But till now no report about its influence on hepatic impairment has been found, so we observed the protective effect of total flavones extracted from buckwheat flowers on CCl4-induced hepatic impairment mice and explored the possible mechanism. 1. Materials
1.1 Animal Kunming strain mice of either sex, Grade , weighing (21±2) g each, were provided by experimental animal centre of Henan Province, China. Certificate : 410115.
International Journal of Biology January, 2009
15
1.2 Medicine and reagent TFBF with 90% purity was extracted in our laboratory from flowers of buckwheat which was planted in Ku Lun Inner Mongolia. Carbon tetrachloride (CCl4)(Shanghai) ;Methionine (MET)(Chengdu); Glutamic pyruvic transaminase (ALT),Triglyceride (TG),Total cholesterol (TC), Malonaldehyde (MDA), Superoxidase dismutase (SOD), Glutathione (GSH) reagent (Nanjing).
1.3 Instruments Rotating evaporator (Tianjin); Boehringer Mannheim / Hitachi 7150 Analyzer (Japan); RILI 850 fluorescence emission spectrophotometry equipment (Japan); 721 spectrophotometer (Shanghai); LXJ-II centrifugal equipment (Shanghai); MP200A electronic balance (Shanghai); OLYMPUS VANOXPM-10AD microscopy (Japan). 2. Methods
2.1 Hepatic impairment model making and medicating One hundred mice were divided through randomization into 5 groups with 20 in each group, namely, normal group, model group, MET group, high dose TFBF group (HTFBF) and low dose TFBF group (LTFBF). Hepatic impairment model was induced by sc 40% CCl4-bean oil solution (5ml·kg-1) every 4 days for 7 times to all of the groups except the normal one which was just treated with bean oil of the same volume. In addition, MET (0.2 g·kg-1·d-1), HTFBF (0.04 g·kg-1·d-1) and LTFBF (0.02 g·kg-1·d-1) were given to the relevant groups by ig, while normal and model groups were given water (ig) of the same volume. After a fast of 15 h from the last injection of CCl4, 10 mice in each group were killed randomly and the targets (I) were detected. The targets (II) of the rest mice were detected after ig medicating for another 2 w.
2.2 Target detection After weighing the body weight of each mouse, blood from their eyeballs was taken and centrifuged, and then the content of ALT in serum was determined with the automatic biochemical analyzer. Mice were killed quickly after their blood was taken. Then the livers were taken out, rinsed with cold normal saline, absorbed dry with filter paper, and weighed. The external appearances of the livers were observed with naked eyes and the LI [LI=liver weight(g)/body weight(g)×100%] of each mouse was calculated. After that, the left lobe of the liver was halved. One half was made into 10% even pulp (W/V) with normal saline and was centrifuged. The contents of ALT, SOD, MDA, GSH, and protein in the upper fluid were determined according to the direction. Another half was made into 10% even pulp (W/V) with methyl alcohol-chloroform (1:1, V/V) and centrifuged. The contents of TG and TC in the upper fluid were determined with the automatic biochemical analyzer. Part of the right lobe of the liver was fixed with 10% formalin, embedded in paraffin, cut into slices, and stained with H.E. The pathological changes were observed with light microscopy.
2.3 Statistical analysis Statistical analyses were performed with the instat software package. Data were expressed as mean ± SD ( sx ) and values of variable were compared with ANOVA q test. 3. Results
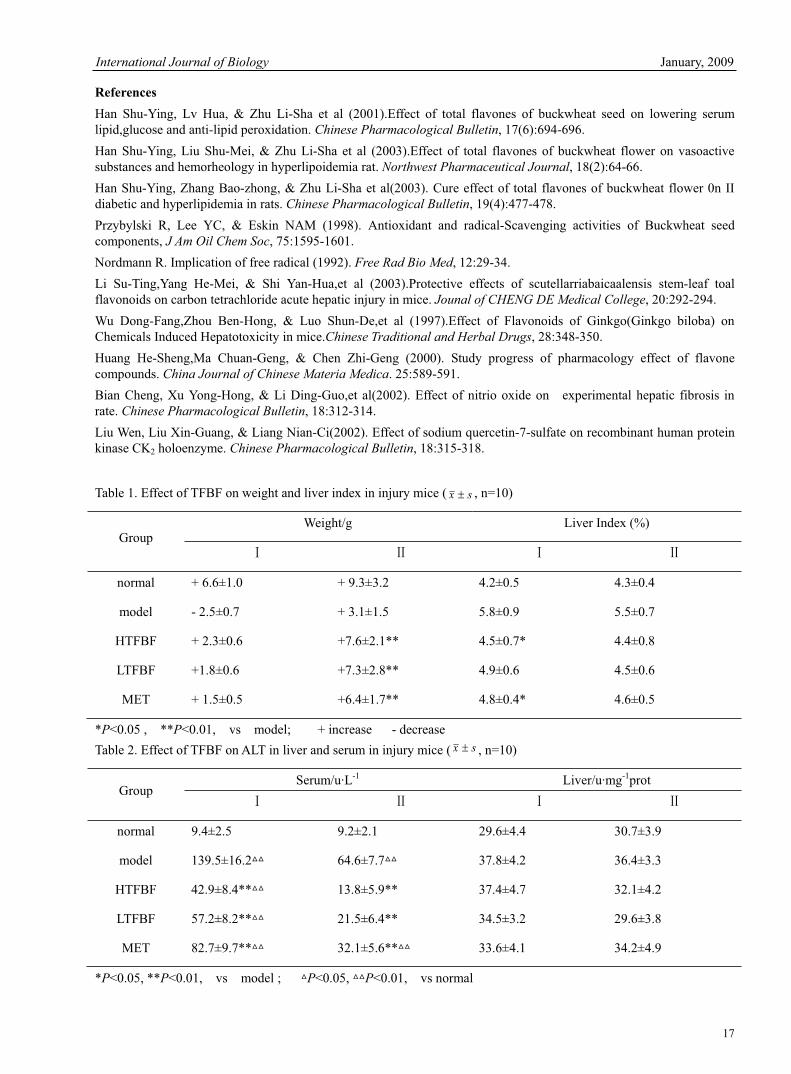
3.1 Influence of TFBF on weight and liver indexes in CCl4-induced mice From table 1, we can see that the mice in model group lost some weight instead of putting on when treated with CCl4.This meant that CCl4 could inhibit the mice from growing. Different dosages of TFBF could antagonize the inhibition effect of CCl4 on body weight variously. Mice in TFBF groups put on weight more apparently when the irritation of CCl4 was ceased (P<0.01). When CCl4 was injected, LI of mice in model group were obviously greater than those in normal group. However, they were much smaller in TFBF groups than in model group, especially in HTFBF group. When the irritation of CCl4 was removed, liver indexes of all the groups had little difference.
3.2 Influence of TFBF on ALT in liver and serum in CCl4-induced mice Compared with normal group, the activity of serum ALT in model group was apparently higher (P <0.01). But both dosages of TFBF could lower that markedly (P<0.01), and HTFBF did better. The activity of serum ALT of mice in HTFBF group was almost restored after stopping the injection of CCl4 for 2 w (P>0.05, vs normal). It also became lower in model group, but the P value was smaller than 0.01 when compared with normal group. The activity of liver ALT had no significant difference in all of the groups. See also table 2.
3.3 Influence of TFBF on liver MDA, SOD and GSH in CCl4-induced mice CCl4 could increase the amount of liver MDA in mice, but decrease that of SOD and GSH greatly. TFBF could apparently antagonize the rising of MDA and the lowering of SOD and GSH in liver of CCl4-induced mice (P<0.01). Effects on MDA and SOD had no significant difference between the two dosages. Besides, they were approximate to those of MET. As to GSH, HTFBF worked more evidently. See also table 3.
Vol. 1, No. 1 International Journal of Biology
16
3.4 Influence of TFBF on liver TG and TC in CCl4-induced mice The contents of liver TG and TC were obviously higher in model group than in normal group (P<0.01), and could be lowered by both dosages of TFBF, particularly HTFBF (P<0.01), which lowered the content of TG more than MET did. See also table 4.
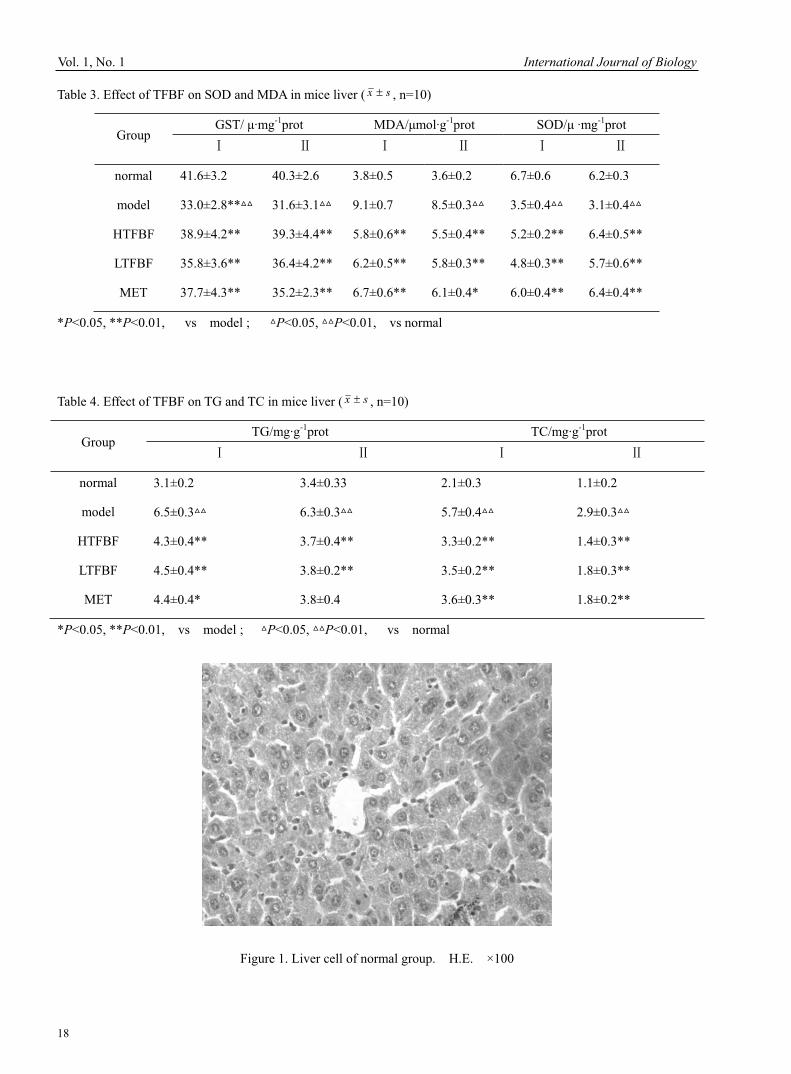
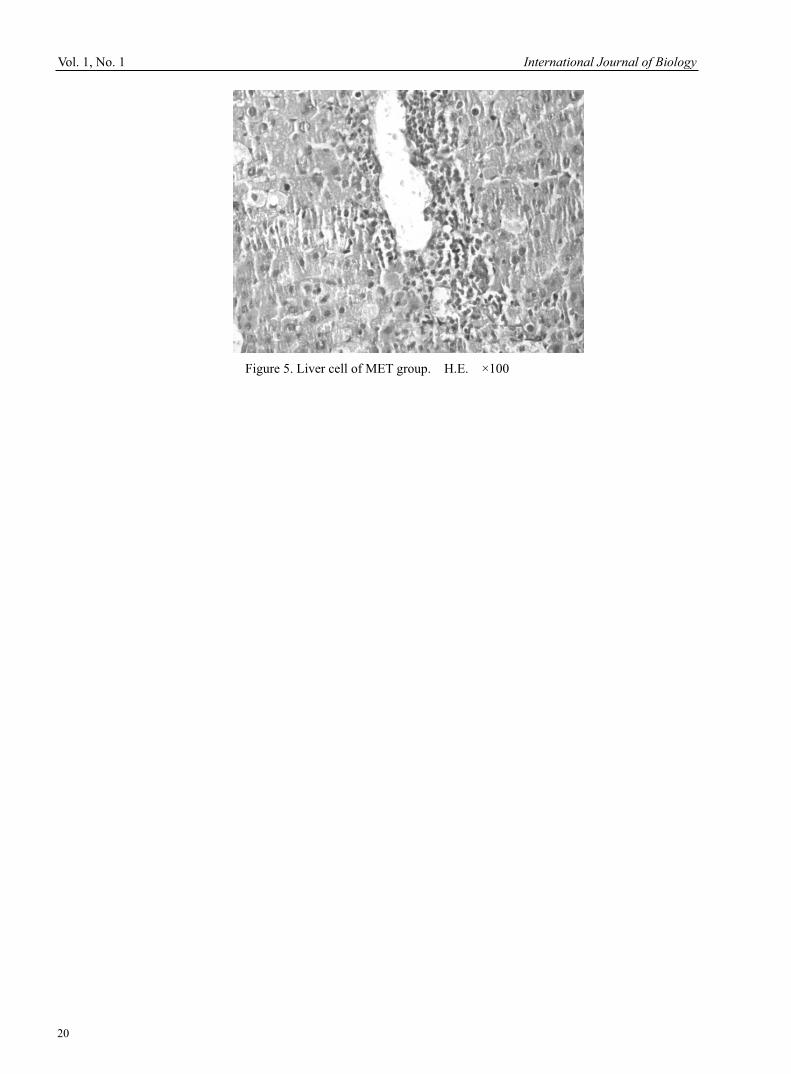
3.5 Influence of TFBF on external appearances and pathological changes of liver in CCl4-induced mice In normal group, macroscopy of the livers presented dark red with a smooth surface. They were soft and full of flexibility. Microscopically the shape and structure of the liver cells were integral without abnormal changes such as degeneration and necrosis (See also figure 1). In model group, the livers were much friable with gathered volume, a pinkish-grey appearance, and a rough surface. The structure of the liver lobe was destroyed. The liver cells swelled and degenerated with poor-distributed liposome of varying sizes and had obvious vacuolar degeneration. The portal tracts of the liver cells had spotty or focal necrosis and were infiltrated with a lot of inflammatory cells (See also figure 2). In both TFBF groups and MET group, the shape and structure of the livers through macroscopy and microscopy were obviously improved (v.s normal). Degeneration, necrosis, liposome, vascular degeneration, and infiltration of a few inflammatory cells could be found only occasionally (See also figure 3-5). After stopping injecting CCl4 for 2w, the shape and structure of livers of mice in TFBF groups almost tended to be normal and showed regeneration of the cells. In model group, liver cells had some improvement too, but were inferior to those of TFBF groups by comparison. 4. Discussion Hepatism is a kind of disease with a high occurrence rate, which endangers the health of mankind extremely, and is hard to be cured for good. It may be caused by bad diet habits, medicines, and toxicants etc. Hepatic impairment is a complicated process in which many factors participate. CCl4-induced hepatic impairment is a classical hepatoxic model. Its mechanism is that CCl4 can be resolved and activated into free radicals --·CCl3, ·CCl2, ·CL, ·OOCCl3 and so on -- by cytochrome P450 of hepatic microbody. Then, these free radicals combine covalently to the macromolecules in hepatic cells, which produces lipid peroxidants, thus damages the constructions and functions of the cell membranes, and dysfunctions the membrane transportation and calcium reserves of the cells, and results in the death of the cells (Nordmann, 1992,29-34) . The results of this experiment showed that CCl4 could obviously increase the amount of serum ALT and liver MDA, TG and TC, but decrease that of liver SOD and GSH in mice. Meanwhile, it could make the LI much greater and cause hepato-pathologic changes including degeneration and necrosis etc. TFBF of both dosages could evidently antagonize the changes above--lower the level of serum ALT, liver MDA, TG, TC and LI, raise that of liver SOD and GSH, and ease hepato-pathologic changes obviously. According to documentary reports (Li, 2003, 292-294; Wu, 1997, 348-350), flavone compounds had hepatoprotective effect. The mechanism was to inhibit the producing of lipid peroxidants by enhancing the electron transmitting effect between NADP-cytochrome-P450 reductase and P450, reducing the formation of free radicals, and raising the level of radical-scavenging enzyme. The main components of buckwheat flavones are rutin, quercetin, and flavanonol etc. Their hepatoprotective effect is probably that the phenolhydroxyl group in some of the components or their structure can combine to free radicals directly or indirectly and become intermediums of free radicals, thus prevent the chain reactions of free radicals and terminate lipid peroxidation. Studies (Huang, 2000, 589-591) proved that rutin and quercetin etc. could lower the friability but raise the flexibility of capillary membranes to protect them. Document (Liu,2005,315-318) also reported that NO and PGI2 could vasodilate hepatic vessels, inhibit thrombocyte aggregation, decrease microthrombosis in ischemia areas, improve microcirculation, and lower the activity of serum ALT obviously, so they had protective effect on hepatic cells . Liu (2005, 315-318) et al reported that quercetin had effects of inhibiting protein kinase C and signal transduction. Our research found that TFBF had the effect of regulating vasoactive substances in serum of rats with diabetes mellitus and hyperlipoidemia -- decreasing the amount of ET, AngII & increasing that of NO and PGI2 -- besides lowering blood glucose , blood lipid and anti-oxidation etc.; therefore, it might be inferred that the hepatoprotective effect of TFBF is relevant to their effects of raising the flexibility but lowering the friability and permeability of hepatic cell membranes, inhibiting [Ca2+]i, and regulating vasoactive substances so as to stabilize the membranes and improve microcirculation etc.In short, TFBF had protective effect on CCl4-induced hepatic impairment. This might be the synthetic result of anti-oxidation, scavenging free radicals, improving microcirculation and lipid metabolism, regulating vasoactive substances, and stabilizing cell membranes etc. The satisfactory mechanism remains to be explored deeply. Buckwheat is a yearly herb belonging to buckwheat genus of the polygonaceae family. It originates from China, and is widely planted in the north. There are abundant flavone compounds in its flowers and leaves. TFBF function at low specificity and wide scope with no toxicity; in addition, frost comes quite early in the north (Inner Mongolia), and lots of buckwheat can’t fruit in autumn so that the local herdsmen use it to feed their livestock. If exploited as medicines and food for health care, waste will be made into treasures. Moreover, we have rich resources. So, buckwheat really has extensive prospects both in exploitation and application.
International Journal of Biology January, 2009
17
References Han Shu-Ying, Lv Hua, & Zhu Li-Sha et al (2001).Effect of total flavones of buckwheat seed on lowering serum lipid,glucose and anti-lipid peroxidation. Chinese Pharmacological Bulletin, 17(6):694-696. Han Shu-Ying, Liu Shu-Mei, & Zhu Li-Sha et al (2003).Effect of total flavones of buckwheat flower on vasoactive substances and hemorheology in hyperlipoidemia rat. Northwest Pharmaceutical Journal, 18(2):64-66. Han Shu-Ying, Zhang Bao-zhong, & Zhu Li-Sha et al(2003). Cure effect of total flavones of buckwheat flower 0n II diabetic and hyperlipidemia in rats. Chinese Pharmacological Bulletin, 19(4):477-478. Przybylski R, Lee YC, & Eskin NAM (1998). Antioxidant and radical-Scavenging activities of Buckwheat seed components, J Am Oil Chem Soc, 75:1595-1601. Nordmann R. Implication of free radical (1992). Free Rad Bio Med, 12:29-34. Li Su-Ting,Yang He-Mei, & Shi Yan-Hua,et al (2003).Protective effects of scutellarriabaicaalensis stem-leaf toal flavonoids on carbon tetrachloride acute hepatic injury in mice. Jounal of CHENG DE Medical College, 20:292-294. Wu Dong-Fang,Zhou Ben-Hong, & Luo Shun-De,et al (1997).Effect of Flavonoids of Ginkgo(Ginkgo biloba) on Chemicals Induced Hepatotoxicity in mice.Chinese Traditional and Herbal Drugs, 28:348-350. Huang He-Sheng,Ma Chuan-Geng, & Chen Zhi-Geng (2000). Study progress of pharmacology effect of flavone compounds. China Journal of Chinese Materia Medica. 25:589-591. Bian Cheng, Xu Yong-Hong, & Li Ding-Guo,et al(2002). Effect of nitrio oxide on experimental hepatic fibrosis in rate. Chinese Pharmacological Bulletin, 18:312-314. Liu Wen, Liu Xin-Guang, & Liang Nian-Ci(2002). Effect of sodium quercetin-7-sulfate on recombinant human protein kinase CK2 holoenzyme. Chinese Pharmacological Bulletin, 18:315-318.
Table 1. Effect of TFBF on weight and liver index in injury mice ( sx , n=10)
*P<0.05 , **P<0.01, vs model; + increase - decrease Table 2. Effect of TFBF on ALT in liver and serum in injury mice ( sx , n=10)
*P<0.05, **P<0.01, vs model ; P<0.05, P<0.01, vs normal
Group Weight/g Liver Index (%)
normal + 6.6±1.0 + 9.3±3.2 4.2±0.5 4.3±0.4
model - 2.5±0.7 + 3.1±1.5 5.8±0.9 5.5±0.7
HTFBF + 2.3±0.6 +7.6±2.1** 4.5±0.7* 4.4±0.8
LTFBF +1.8±0.6 +7.3±2.8** 4.9±0.6 4.5±0.6
MET + 1.5±0.5 +6.4±1.7** 4.8±0.4* 4.6±0.5
Group Serum/u·L-1 Liver/u·mg-1prot
normal 9.4±2.5 9.2±2.1 29.6±4.4 30.7±3.9
model 139.5±16.2 64.6±7.7 37.8±4.2 36.4±3.3
HTFBF 42.9±8.4** 13.8±5.9** 37.4±4.7 32.1±4.2
LTFBF 57.2±8.2** 21.5±6.4** 34.5±3.2 29.6±3.8
MET 82.7±9.7** 32.1±5.6** 33.6±4.1 34.2±4.9
Vol. 1, No. 1 International Journal of Biology
18
Table 3. Effect of TFBF on SOD and MDA in mice liver ( sx , n=10)
Group GST/ μ·mg-1prot MDA/μmol·g-1prot SOD/μ ·mg-1prot
normal 41.6±3.2 40.3±2.6 3.8±0.5 3.6±0.2 6.7±0.6 6.2±0.3
model 33.0±2.8** 31.6±3.1 9.1±0.7 8.5±0.3 3.5±0.4 3.1±0.4
HTFBF 38.9±4.2** 39.3±4.4** 5.8±0.6** 5.5±0.4** 5.2±0.2** 6.4±0.5**
LTFBF 35.8±3.6** 36.4±4.2** 6.2±0.5** 5.8±0.3** 4.8±0.3** 5.7±0.6**
MET 37.7±4.3** 35.2±2.3** 6.7±0.6** 6.1±0.4* 6.0±0.4** 6.4±0.4**
*P<0.05, **P<0.01, vs model ; P<0.05, P<0.01, vs normal
Table 4. Effect of TFBF on TG and TC in mice liver ( sx , n=10)
*P<0.05, **P<0.01, vs model ; P<0.05, P<0.01, vs normal
Figure 1. Liver cell of normal group. H.E. ×100
Group TG/mg·g-1prot TC/mg·g-1prot
normal 3.1±0.2 3.4±0.33 2.1±0.3 1.1±0.2
model 6.5±0.3 6.3±0.3 5.7±0.4 2.9±0.3
HTFBF 4.3±0.4** 3.7±0.4** 3.3±0.2** 1.4±0.3**
LTFBF 4.5±0.4** 3.8±0.2** 3.5±0.2** 1.8±0.3**
MET 4.4±0.4* 3.8±0.4 3.6±0.3** 1.8±0.2**

International Journal of Biology January, 2009
19
Figure 2. Liver cell of model group. H.E. ×100
Figure 3. Liver cell of HTFBF group. H.E. ×100
Figure 4. Liver cell of LTFBF group. H.E. ×100
Vol. 1, No. 1 International Journal of Biology
20
Figure 5. Liver cell of MET group. H.E. ×100

International Journal of Biology January, 2009
21
Biosorption of Acid Yellow by Spent Brewery Grains in a Batch System: Equilibrium and Kinetic Modelling
V.Jaikumar Department of Chemical Engineering, A.C.Tech. Campus
Anna University Chennai, Chennai 600025, INDIA Tel: 91-44-2220-3536 E-mail: [email protected]
V Ramamurthi (Corresponding author) Department of Chemical Engineering, A.C.Tech. Campus
Anna University Chennai, Chennai 600025, INDIA Tel: 91-44-2220-3523 E-mail: [email protected]
The research is financed by Council of Scientific and Industrial Research (CSIR), New Delhi, India, grant number CSIR Lr. No. 9/468(371)/2007-EMR-1 dated 30.03.2007.Abstract Biosorption of Acid Yellow (AY17) a monoazo acid dye currently used in textile and dyeing industries was investigated using Spent Brewery Grains (SBG) a brewing industry waste in a batch system with respect to initial pH, temperature, initial dye concentration, biosorbent dosage, and contact time. The biomass exhibited the highest dye uptake capacity at 303 K, initial pH value of 2, the initial dye concentration of 150mg/L, biosorbent dosage of 0.5 g and contact time of 40 min. The extent of dye removal increased with increase in time, biosorbent dosage and decreased with increase in temperature. The equilibrium sorption capacity of the biomass increased on increasing the initial dye concentration up to 150 mg/L and then started decreasing in the studied concentration up to 600 mg/L.The experimental results has shown that the acidic pH favours the biosorption. Langmuir and Freundlich adsorption model is used for the mathematical description of the biosorption equilibrium and isotherm constants are evaluated at different temperatures. Equilibrium data fitted very well to the Freundlich model in the studied concentration (25-600 mg/L) and temperature (303-323 K) ranges. The pseudo first- and second-order kinetic models were also applied to the experimental data. The results indicated that the dye uptake process followed the pseudo second-order rate expression and adsorption rate constants increased with increasing concentration. Keywords: Biosorption, Acid yellow, Spent brewery grains, Isotherm, Kinetics 1. Introduction Synthetic dyestuffs are used extensively in textile, paper, printing industries and dye houses. It is reported that there are over 100,000 commercially available dyes (Crini, 2006). The effluents from dyeing industries constitute one of the most problematic wastewaters to be treated not only for their high chemical and biological oxygen demands, suspended solids in toxic compounds but also for color, which is the first contaminant to be recognized by human eye. Dyes may significantly affect photosynthetic activity in aquatic life reducing light penetration and may also be toxic to some aquatic life due to the presence of aromatics, metals, chlorides, etc. Dyes usually have a synthetic origin and complex aromatic molecular structures which make them more stable and more difficult to biodegrade. Textile dyes are also designed to be resistant to fading by chemicals and light. They must also be resilient to both high temperatures and enzyme degradation resulting from detergent washing. For these reasons, degradation of dyes is typically a slow process. Dye wastewater is usually treated by physical or chemical treatment processes. These include chemical coagulation/flocculation, precipitation, ozonation, adsorption, oxidation, ion exchange and photo degradation. Some of
Vol. 1, No. 1 International Journal of Biology
22
these techniques have shown to be effective, although they have limitations. Among these are: excess amount of chemical usage, or accumulation of concentrated sludge with disposal problems; expensive plant requirements and operational costs; lack of effective color reduction; and sensitivity to a variable wastewater input (Khattri & Singh, 1998). Adsorption has shown to be the most promising option for non-biodegradable dyes for the color removal from aqueous streams, activated carbons being the most common adsorbent for this process due to its effectiveness and versatility. Activated carbon is one of the most popular adsorbent used widely for adsorption studies. Activated carbon is usually obtained from materials with high carbon content and possessing a great adsorption capacity, which is mainly determined by their porous structure. Although activated carbon, in granular or powdered form has a good capacity for the adsorption of dyes, it suffers from a number of disadvantages. Activated carbon is quite expensive and the higher the quality the greater the cost. Both chemical and thermal regeneration of spent carbon is expensive, impractical on a large scale and produces additional effluent and results in considerable loss of the adsorbent. This has led many researchers to search for the use of cheap and efficient alternative materials such as Peat (McKay et al., 1981), Chitin (McKay et al., 1983), Silica (McKay, 1984), the hardwood sawdust (Asfour et al., 1985), Bagasse pith (McKay et al.,1987), Fly ash (Khare et al., 1987), Paddy straw (Deo, 1993), Rice husk (Lee & Low, 1997), Slag (Ramakrishna & Viraraghavan, 1997), Chitosan (Juang, et al., 1997), Palm fruit bunch (Nasser, 1997), and Bone char (Ko, et al., 2000). The use of biomaterials as sorbents for the treatment of wastewaters will provide as a potential alternate to the conventional treatment methods. The process of uptake of solute using biomaterials (microbial cells), whether dead or alive, is known as biosorption. In the present investigation, the biomass SBG a brewery industry waste was used as biosorbent and its capacity to remove acid yellow an acidic (anionic) dye was evaluated. A survey of literature showed that no work has been done so far on dye removal process using SBG as biosorbent for the removal of acid yellow dye stuffs from their aqueous solutions. Acid yellow has wider applications, which include paper industry, leather industry, dyeing and textile industries etc. The aim of this present work is to explore the possibility of utilizing SBG for the biosorptive removal of AY 17 dye from aqueous solution. The effect of factors such as temperature, initial dye concentration, biosorbent mass, contact time and pH of the solution was investigated. The kinetics of AY 17 adsorption onto SBG was analyzed by fitting to kinetics model. Experimental equilibrium data were fitted to Freundlich and Langmuir isotherm equation. 2. Materials and Methods 2.1 Biosorbent Spent Brewery Grains, taken from Mohan breweries and distilleries Limited, Chennai, India, was suspended in 0.13M sulphuric acid solution (20g of SBG per 100mL of acid solution) for one hour. Then it was filtered and the acid solution was discarded. The biomass was washed with distilled water many times until it is completely free from the acid and dried at 60ºC for 24 hours. The dried biomass was ground and stored for further use in the experiments. 2.2 Adsorbate The adsorbate AY 17 dye (C.I. = 18965, Chemical formula = C16H10Cl2N4Na2O7S2
F W = 551.29, nature = acid yellow 17) was supplied by Sigma-Aldrich Chemicals Ltd., India. The structure of AY 17 is given in Fig. 1. An accurately weighed quantity (1 g) of AY 17 was dissolved in double distilled water to prepare stock solution of 1000 mg/L. Experimental solutions of the desired concentrations were prepared by dilution with double-distilled water. 2.3 Analytical measurements The concentration of the dye AY 17 were determined using a UV-vis spectrophotometer (HITACHI U 2000, spectrophotometer) at a wavelength corresponding to the maximum absorbance of the dye ( max = 401.5 nm). Calibration curves were plotted between absorbance and concentration of the dye solution. 2.4 Batch experiments Batch experiments were conducted using 250 mL Erlenmeyer flasks to which 50 mL of dye containing waste water and biomass were added. These flasks were agitated in a temperature –controlled orbital shaker at a constant speed of 150 rpm to study the effect of important parameters like pH, adsorbent dosage, initial dye concentration, contact time and temperature. Samples were withdrawn at appropriate time intervals and these samples were centrifuged (Research centrifuge Remi scientific work, India) at 4000 rpm. The supernatant was used for analysis of the residual dye concentration. The effect of pH on dye removal was studied over a pH range of 2-12. pH was adjusted by addition of dilute aqueous solutions of 0.1N HCl or 0.1N NaOH. For the optimum amount of adsorbent per unit mass of adsorbate, a 50mL dye solution was contacted with different amounts of SBG till equilibrium was attained. The kinetics of adsorption was determined by analyzing adsorptive uptake of the dye from the aqueous solution at different time

International Journal of Biology January, 2009
23
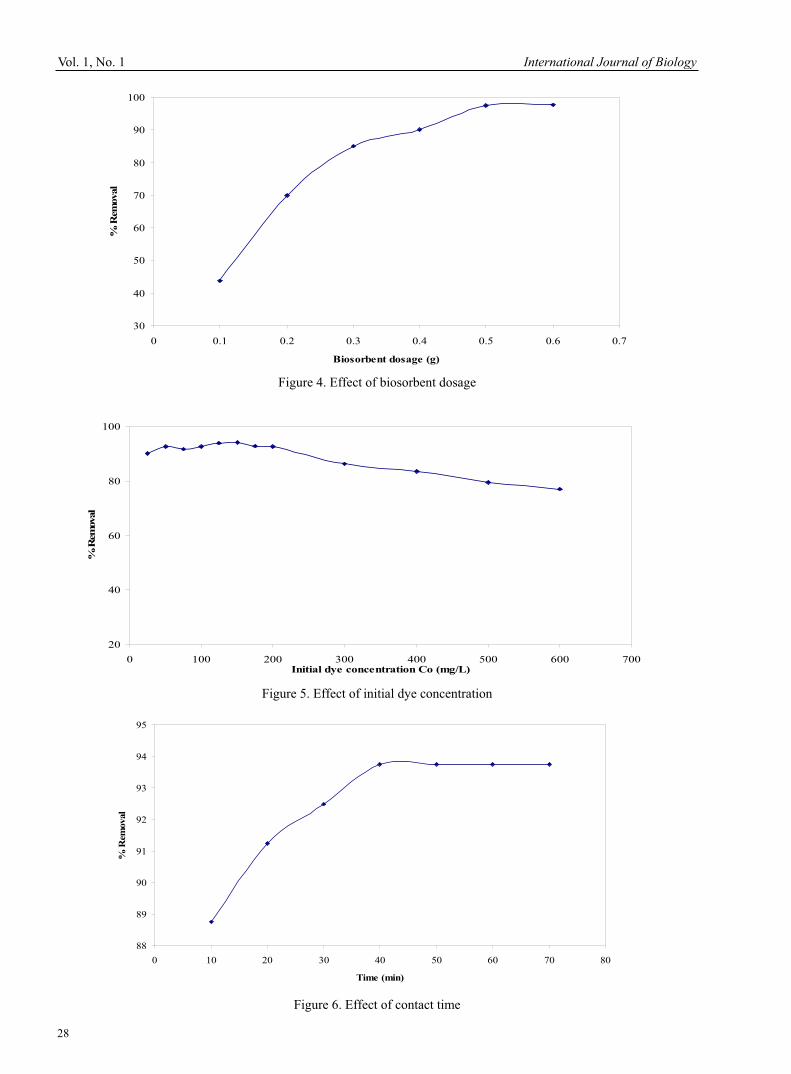
intervals. The adsorption isotherm was found by agitating AY 17 solution of different concentrations with the known amount of SBG till the equilibrium was achieved. The effect of temperature on the sorption characteristics was investigated by determining the adsorption isotherms at 303, 313,323 K. Co (initial dye concentration) varied from 25 to 600 mg/L. 3. Results and Discussion 3.1 Effect of pHpH affects not only the biosorption capacity, but also the color of the dye solution and the solubility of some dyes (Fu & Viraraghavan, 2001). Therefore, the pH value of the solution was an important controlling factor in the biosorption process, and the initial pH value of the solution has more influence than the final pH (Waranusantigul et al., 2003). The effect of initial pH on AY17 biosorption by SBG is shown in the Fig. 2. The maximum dye sorption occurred at pH 2 and the removal decreased thereafter. This may be due to high electrostatic attraction between the positively charged surface of the SBG and anionic dye AY 17. Acid dyes are also called as anionic dyes because of the negative electrical structure of the chromophore group. As the initial pH increases, the number of negatively charged sites on the biosorbent surfaces increases and the number of positively charged sites decreases. A negative surface charge does not favor the biosorption of dye anions due to electrostatic repulsion (Namasivayam & Kavitha, 2002). In general, the acidic dye uptakes are much higher in acidic solutions than those in neutral and alkaline conditions (Chiou & Li, 2002). 3.2 Effect of temperature Investigation of temperature effect on the biosorption of acidic dyes is very important in the real application of biosorption as various textile and other dye effluents are produced at relatively high temperatures. The biosorption of AY 17 on SBG was investigated as a function of temperature and maximum uptake value was obtained at 303 K as can be seen from Fig. 3. Adsorption decreased with further increase in temperature due to the decreased surface activity suggesting that biosorption between AY 17 and SBG was an exothermic process and the mechanism was mainly physical adsorption. 3.3 Effect of biosorbent dosage The effect of biosorbent dosage on the removal of AY 17 by SBG at Co = 100 mg/L is shown in the Fig. 4. It can be seen that the AY 17 removal increases up to a certain limit and then it remains constant. The increase in the biosorption with the biosorbent dosage can be attributed to greater surface area and the availability of more adsorption sites. At biosorbent dosage greater than 0.5 g the surface AY 17 concentration and the solution AY 17 concentration come to equilibrium with each other. 3.4 Effect of initial dye concentration The effect of initial dye concentration on the adsorption of dye was investigated and shown in Fig. 5. It provides an important driving force to overcome all mass transfer resistances of the dye between the aqueous and solid phases, thus increases the uptake. The equilibrium uptake values increased from 1.8 to 38.5 mg/g with increasing initial dye concentration from 25 to 600 mg/L as a result of the increase in the driving force. However, AY 17 removal yield increased from 90 to 94 % from 25 to 150 mg/L concentration, and then started to decrease from 94 to 77 % for initial dye concentration of 175 to 600 mg/L. At lower dye concentrations solute concentrations to biosorbent sites ratio is higher, which cause an increase in color removal (Aksu & Kabasakal, 2004). At higher concentrations, lower adsorption yield is due to the saturation of adsorption sites. 3.5 Effect of contact time The effect of contact time on adsorption of AY 17 by SBG at Co = 100 mg/L for adsorbent dosage 0.5 g is presented in Fig. 6. It can be observed from the figure that rapid adsorption of dye has taken place in the first 10 min and, thereafter, the rate of adsorption decreased gradually and reached equilibrium in about 40 min. around 94 % of AY 17 removal was obtained in about 40 min. This may be due to strong attractive forces between the dye molecules and the adsorbent. Fast diffusion on the external surface was followed by fast pore diffusion into the intra particle matrix to attain rapid equilibrium (Ho & Chiang, 2001). Further increase in contact time showed that there is no significant increase in the removal of AY 17 by SBG, so further experiments were conducted for 40 min contact time only. 3.6 Kinetic modelling In order to investigate the biosorption processes of AY 17 on the SBG, pseudo-first order and pseudo-second order kinetic models were used. 3.6.1 Pseudo-first-order model The pseudo-first-order equation is given as:
)(/ teft qqkdtdq (1)

Vol. 1, No. 1 International Journal of Biology
24
where qt is the amount of adsorbate adsorbed at time t (mg/g), qe is the adsorption capacity at equilibrium (mg/g), kf is the pseudo-first-order rate constant (min-1), and t is the contact time (min). The integration of Eq. (1) With the initial condition, qt = 0 at t = 0 leads to:
tk
qqq fete 303.2
log)log( (2)
The values of adsorption rate constant (kf) for AY 17 adsorption on SBG were determined from the plot of log (qe-qt)against t (not shown here). These values are given in Table 1. 3.6.2 Pseudo-second-order model The pseudo-second-order model is given as:
2)( tes qqkdtdq
(3)
Where ks is the pseudo-second-order rate constant (g/mg min), qe is the amount of dye adsorbed at equilibrium (mg/g), and qt is the amount of dye adsorbed at time t (mg/g). Integrating Eq. (3) for the boundary conditions t = 0 to t = t and qt=0 to qt = qt gives
tkqtkq
qse
set 1
2
(4)
Eq. (4) is the integrated rate law for a second-order reaction (Ho, 2006) and can be rearranged to obtain
ees
t
qt
qk
tq2
1 (5)
This has a linear form of
tqqkq
t
eest
112 (6)
The initial adsorption rate, h (mg/g min) is defined as: 2
es qkh (7)
The rate parameters ks and qe can be directly obtained from the intercept and slope of the plot (t/ qt) against t (Fig. 7). Values of ks, qs, h and correlation coefficient R2 are listed in Table 2. The calculated correlation coefficients are closer to unity for pseudo-second-order kinetics than that for the pseudo-first-order kinetic model. Therefore, the sorption can be approximated more appropriately by the pseudo-second-order kinetic model for the biosorption of AY 17 by SBG. 3.7 Equilibrium modelling The equilibrium sorption isotherm is fundamentally important in the design of adsorption system. Equilibrium studies in adsorption gives the capacity of the sorbent. Equilibrium relationships between sorbent and sorbate are described by adsorption isotherms, usually the ratio between the quantity sorbed and that remaining in the solution at a fixed temperature at equilibrium (Ho et al., 2002). Freundlich and Langmuir isotherm constants were determined from the plots of ln qe versus ln Ce (Fig.8) and Ce/ qe versus Ce (not shown here) respectively, at 303, 313, 323 K. It was found that the Freundlich isotherm best represents the equilibrium adsorption of AY 17 on SBG. The isotherm constants and the correlation coefficient, R2 with the experimental data is given in Table 3. As seen from Table 3, the parameter KF(Freundlich constant) related to the adsorption density increased with a decrease in temperature. This was consistent with the experimental observation; it also indicates that n (intensity of adsorption) is greater than unity, indicating that the dye is favourably adsorbed by biomass at all temperatures studied. 4. Conclusions The capability of the use of spent brewery grains for the removal of Acid Yellow dye was examined, including equilibrium and kinetic studies. Experiments were performed as a function of initial solution pH, temperature, initial dye concentration, biosorbent dosage and contact time. The solution pH, temperature and initial dye concentration played a significant role in affecting the capacity of biosorbent. The further increase in pH over 2.0, temperature over 303 K and initial dye concentration of 150 mg/L led to a reduction of the biosorption capacity of the biomass. Optimum
International Journal of Biology January, 2009
25
sorbent dosage was 0.5 g/L of solution. The equilibrium between the adsorbate in the solution and on the adsorbent surface was practically achieved in 40 min. Biosorption kinetics was found to follow pseudo-second-order rate expression. Equilibrium biosorption data for AY 17 on SBG were best represented by Freundlich isotherm. The present study concludes that spent brewery grains could be employed as a low-cost and ecofriendly biosorbent as an alternative to the current expensive methods of removing dyes from textile effluents. The spent biosorbent SBG may be dried and incinerated. 5. Acknowledgements The financial support for this investigation given by Council of Scientific and Industrial Research (CSIR), Ministry of Human Resources Development, New Delhi, India under the grant CSIR Lr. No. 9/468(371)/2007-EMR-1 dated 30.03.2007 is gratefully acknowledged.
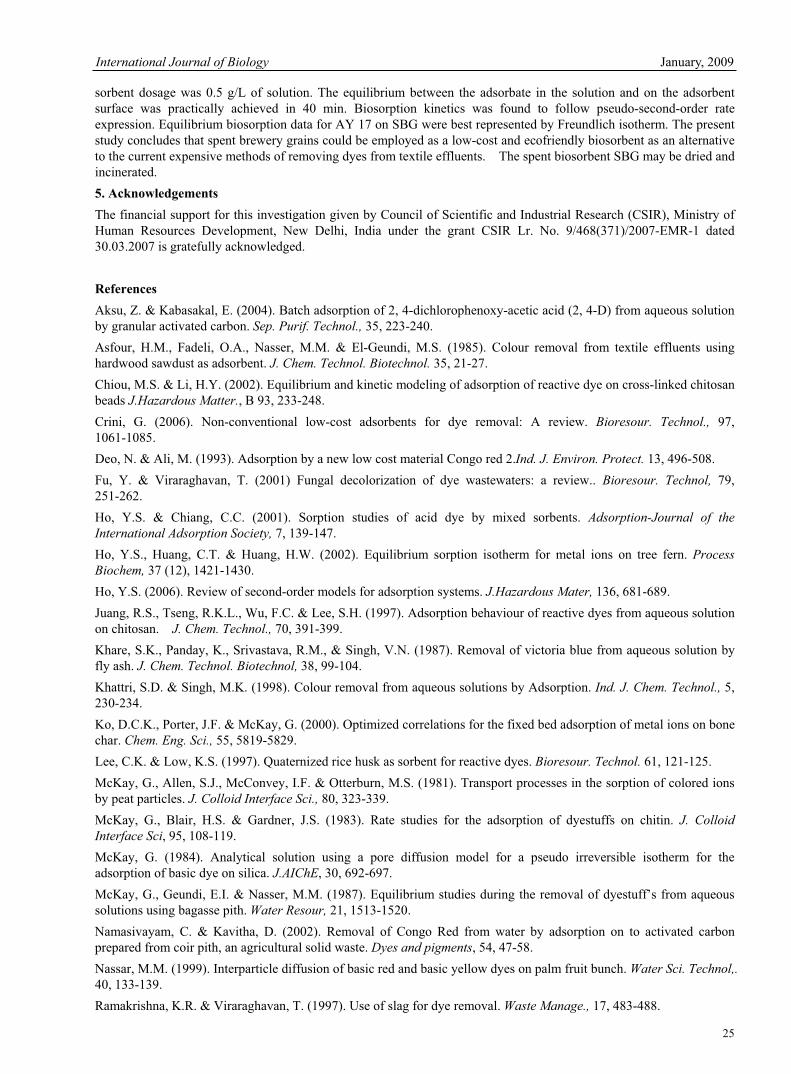
References Aksu, Z. & Kabasakal, E. (2004). Batch adsorption of 2, 4-dichlorophenoxy-acetic acid (2, 4-D) from aqueous solution by granular activated carbon. Sep. Purif. Technol., 35, 223-240. Asfour, H.M., Fadeli, O.A., Nasser, M.M. & El-Geundi, M.S. (1985). Colour removal from textile effluents using hardwood sawdust as adsorbent. J. Chem. Technol. Biotechnol. 35, 21-27. Chiou, M.S. & Li, H.Y. (2002). Equilibrium and kinetic modeling of adsorption of reactive dye on cross-linked chitosan beads J.Hazardous Matter., B 93, 233-248. Crini, G. (2006). Non-conventional low-cost adsorbents for dye removal: A review. Bioresour. Technol., 97, 1061-1085.Deo, N. & Ali, M. (1993). Adsorption by a new low cost material Congo red 2.Ind. J. Environ. Protect. 13, 496-508. Fu, Y. & Viraraghavan, T. (2001) Fungal decolorization of dye wastewaters: a review.. Bioresour. Technol, 79, 251-262. Ho, Y.S. & Chiang, C.C. (2001). Sorption studies of acid dye by mixed sorbents. Adsorption-Journal of the International Adsorption Society, 7, 139-147. Ho, Y.S., Huang, C.T. & Huang, H.W. (2002). Equilibrium sorption isotherm for metal ions on tree fern. Process Biochem, 37 (12), 1421-1430. Ho, Y.S. (2006). Review of second-order models for adsorption systems. J.Hazardous Mater, 136, 681-689. Juang, R.S., Tseng, R.K.L., Wu, F.C. & Lee, S.H. (1997). Adsorption behaviour of reactive dyes from aqueous solution on chitosan. J. Chem. Technol., 70, 391-399. Khare, S.K., Panday, K., Srivastava, R.M., & Singh, V.N. (1987). Removal of victoria blue from aqueous solution by fly ash. J. Chem. Technol. Biotechnol, 38, 99-104. Khattri, S.D. & Singh, M.K. (1998). Colour removal from aqueous solutions by Adsorption. Ind. J. Chem. Technol., 5, 230-234. Ko, D.C.K., Porter, J.F. & McKay, G. (2000). Optimized correlations for the fixed bed adsorption of metal ions on bone char. Chem. Eng. Sci., 55, 5819-5829. Lee, C.K. & Low, K.S. (1997). Quaternized rice husk as sorbent for reactive dyes. Bioresour. Technol. 61, 121-125. McKay, G., Allen, S.J., McConvey, I.F. & Otterburn, M.S. (1981). Transport processes in the sorption of colored ions by peat particles. J. Colloid Interface Sci., 80, 323-339. McKay, G., Blair, H.S. & Gardner, J.S. (1983). Rate studies for the adsorption of dyestuffs on chitin. J. Colloid Interface Sci, 95, 108-119. McKay, G. (1984). Analytical solution using a pore diffusion model for a pseudo irreversible isotherm for the adsorption of basic dye on silica. J.AIChE, 30, 692-697. McKay, G., Geundi, E.I. & Nasser, M.M. (1987). Equilibrium studies during the removal of dyestuff’s from aqueous solutions using bagasse pith. Water Resour, 21, 1513-1520. Namasivayam, C. & Kavitha, D. (2002). Removal of Congo Red from water by adsorption on to activated carbon prepared from coir pith, an agricultural solid waste. Dyes and pigments, 54, 47-58. Nassar, M.M. (1999). Interparticle diffusion of basic red and basic yellow dyes on palm fruit bunch. Water Sci. Technol,.40, 133-139. Ramakrishna, K.R. & Viraraghavan, T. (1997). Use of slag for dye removal. Waste Manage., 17, 483-488.

Vol. 1, No. 1 International Journal of Biology
26
Waranusantigul, P., Pokethitiyook, P., Kruatrachue, M. & Upatham, E.S. (2003). Kinetics of basic dye (methylene blue) biosorption by giant duckweed (Spirodela polyrrhiza). Environ. Pollut, 125, 385-392.
Table 1. Kinetic parameters for the removal of AY 17 by SBG, Pseudo-first-order model
Co (mg/L) qe (mg/g) kf (1/min) R2
100 0.904 0.066 0.9278 150 0.904 0.066 0.9278 200 0.904 0.066 0.9278 300 3.773 0.283 0.7987
Table 2. Kinetic parameters for the removal of AY 17 by SBG, Pseudo-second-order model
Co (mg/L) qe (mg/g) ks (g/mg min) h (mg/g min) R2
100 7.911 0.181 11.335 0.9999 150 12.077 0.185 27.086 1 200 16.233 0.187 49.491 1 300 24.570 0.190 114.942 1
Table 3. Freundlich isotherm constants for biosorption of AY 17 onto SBG
T (K) KF (mg/g)(L/mg)n n R2
303 1.934 1.534 0.8937 313 0.828 1.195 0.8213 323 0.474 1.073 0.7465
Cl
Cl
Figure 1. Chemical structure of Acid yellow 17

International Journal of Biology January, 2009
27
0
20
40
60
80
100
0 2 4 6 8 10 12 14pH
% R
emov
al
Figure 2. The effect of initial pH of dye solution
40.0
60.0
80.0
100.0
0 100 200 300 400 500 600 700
Initial dye concentration (mg/L)
% R
emov
al
303 K313 K323 K
Figure 3. The Effect of temperature
Vol. 1, No. 1 International Journal of Biology
28
30
40
50
60
70
80
90
100
0 0.1 0.2 0.3 0.4 0.5 0.6 0.7
Biosorbent dosage (g)
% R
emov
al
Figure 4. Effect of biosorbent dosage
20
40
60
80
100
0 100 200 300 400 500 600 700Initial dye concentration Co (mg/L)
% R
emov
al
Figure 5. Effect of initial dye concentration
88
89
90
91
92
93
94
95
0 10 20 30 40 50 60 70 80
Time (min)
% R
emov
al
Figure 6. Effect of contact time

International Journal of Biology January, 2009
29
Figure 7. Pseudo-second-order kinetic plot for the removal of AY 17
Figure 8. Freundlich isotherm
Vol. 1, No. 1 International Journal of Biology
30
Research of msh Locus of the Bundle Forming Pilus (Bfp) of Aeromonas Veronii bv Sobria
Qin Yang & Zezhi Huang
Department of medical laboratory science of Shaoyang Medical College
Shaoyang, Hunan 422000, China
E-mail: [email protected]
AbstractSequencing msh locus of the bundle forming pilus (Bfp) of Aeromonas veronii bv sobria and characterization of mshA promoter region for further research. A direct genomic sequencing and genomic walking were performed to sequence Bfp. PCR, PCR screen, restriction reaction, and agarose gel electrophoresis were attempted to construct a reporter gene gusA contained plasmid. We extended the sequence by 3.4 kb. Some encoded proteins and a promoter between mshBgene and mshA gene was detected. Work with promoter region did not succeed. The sequence got so far still contained some errors, though 15 encoded proteins and a promoter were found. But the reason that the promoter region project did not work was unknown. Keywords: Aeromonas, Bfp, mshB, mshAThe genus Aeromonas was taxonomically in the family Vibrionaceae. However now it has its own familyAeromondaceae. To date, only seven of named species have been associated with human disease including: A. hydrophila, A. veronii biovar sobria, A. caviae, A. veronii biovar veronii, A.jandaei, A. schubertii and A. trota(Martin-Carnahan, 2005).These purified pili represent a family of typeIV pili(Barnett, 1997). Research of msh locus of the bundle forming pilus (Bfp) of Aeromonas veronii bv sobria is very rare around the world. Sequencing the genes encoding Bfp from a diarrhoeal isolate of Aeromonas veronii biovar sobria (strain BC88) paved the way to a further work on how it works. 1. Materials and methods 1.1 Sequencing 1.1.1 Primers A direct genomic sequencing was originally performed, using a primer designed on the basis of the nucleotide sequence corresponding to the N-terminal amino-acid sequence previous reported by Kirov etal (Kirov & Sanderson, 1996) -MSHAF2: 5’CTGGTTATCGTGATCATCATTCTG3’ -MSHAR2: 5’CACACGATACGACCACCGTTAGAT3’ -MshORev2: GGCGACACAGCGGCCATATT3’ 1.1.2 Chromosomal extraction Bacterial strains were grown in BHIB at 37 overnight. Then the cells were centrifuged (3,000RPM=1614×g, 15min, room temperature) and resuspended in solution A containing lysozyme. The mixture was incubated at 37 for 30 min, and then frozen at -80 for 10 min. Solution B was added to the cell suspension, and the tube was inverted till the mixture became clear and viscous. RNAse was added, mixed and incubated at 37 for 30 min. An equal volume of phenol was then added to the mixture. The layers were separated by centrifugation (13,200RPM=16100×g, 5min, room
International Journal of Biology January, 2009
31
temperature). The upper layer was transferred to a new tube. The same process was repeated for two further times. Precipitation of DNA was done by the addition of sodium acetate and ice-cold absolute ethanol. The mixture was kept for 30 min in -20 , then centrifuged (13,200RPM=16100×g, 20min, 4 ). Finally the pellet was resuspended in sterile distilled water and left overnight at 4 , before to be stored at -20 .Slution A Slution B -10 mM Tris-HCl, PH7.2 -100 mM Tris-HCl, PH8.8 -150 mM NaCl -1% SDS -100 mM EDTA -100 mM NaCL 1.1.3 Sequencing machine and software Perkin Elmer ABI PRISM Dye Terminator Cycle Sequencing Ready Reaction Kit and AmpliTaqrDNA polymerase were used for performing DNA sequencing. This was then sequenced by a Perkin Elmer ABI PRISM 377 DNA Sequencer. Routine sequence manipulations were carried out using the Gene Jockey II package. Sequence comparisons were carried out using different sequence analysis programmers such as BLASTN, ORF finder,BLASTX. 1.2 Plasmid 1.2.1 Amplify promoter region of mshA fragment Primers MSHAKFOR1 and XYLMSHAR, and Pfx were used. -MSHAKFOR1 5’CGATACCCAGATCAGCAACGGCGA 3’ -XYLMSHAR 5’CTTACGAGCAGGATCCTGCAGATT 3’ 1.2.2 Insert the amplified fragment into plasmid pGJH-TpgusALigate the fragment with SmaI cut plasmid pGJH-TpgusA. This new plasmid was designated pGJH-TpgusA3.1.2.3 Plasmid pUC19 was used for constructing the plasmid pGJH-TpgusA3 with right direction. Ligate the fragment with SmaI cut plasmid pUC19, and then use PstI to choose the new plasmid pUC19PCR3 with right direction. The chosen pUC19, PCR3 and plasmid pGJH-TpgusA were ligated after being both cut with SacI/Xbal.2. Results 2.1 Bfp sequencing The sequencing result showed we found mshB gene, mshA gene, mshC gene mshD gene and part of mshO gene in A.veronii bv sobria. <Figure 1> <Table 1> 2.2 Construction of plasmid pGJH-TpgusA <Figure 2> <Figure 3> 3. Discussions The mshB, A, C, D genes are thought to be in an operon with a promoter upstream of mshB by research of msh locus of close related bacterial (Mattick, 2002). Prokaryotic promoter predictions by BCM launcher demonstrated the possibility of a promoter between mshB gene and mshA gene at nucleotides 1022 and 1067 with a core value of 0.97. Type IV pilus always have the major gene beside the promoter region, and the mshA gene usually is the major gene in Bfp locus (Kirov, 1996). All these demonstrate there is a really promoter between mshB gene and mshA gene. Many of the genes located upstream of the mshA pilin subunit gene including mshB gene encode homologs of general secretory pathway components. The 15 encoded proteins got in this research have a very important value for understanding how msh locus of the Bfp of Aeromonas veronii bv sobria causes human desease. We have got 2.3kb long sequence of Bfp of Aeromonas veronii bv sobria so far. However it is not good enough to fully understand its translation and regulation mechanism, so further work could be done later. In order to determine under what conditions the Bfp is expressed in addition to finding what proteins are involved in its express. Construction of transcriptional fusions of the mshA promoter region to the reporter gene gusA was attempted. Two methods were applied to the construction, but both failed. Firstly, we inserted the amplified promoter region directionally into report gene involved plasmid. PCR screen showed a positive result, but nucleotide sequencing found
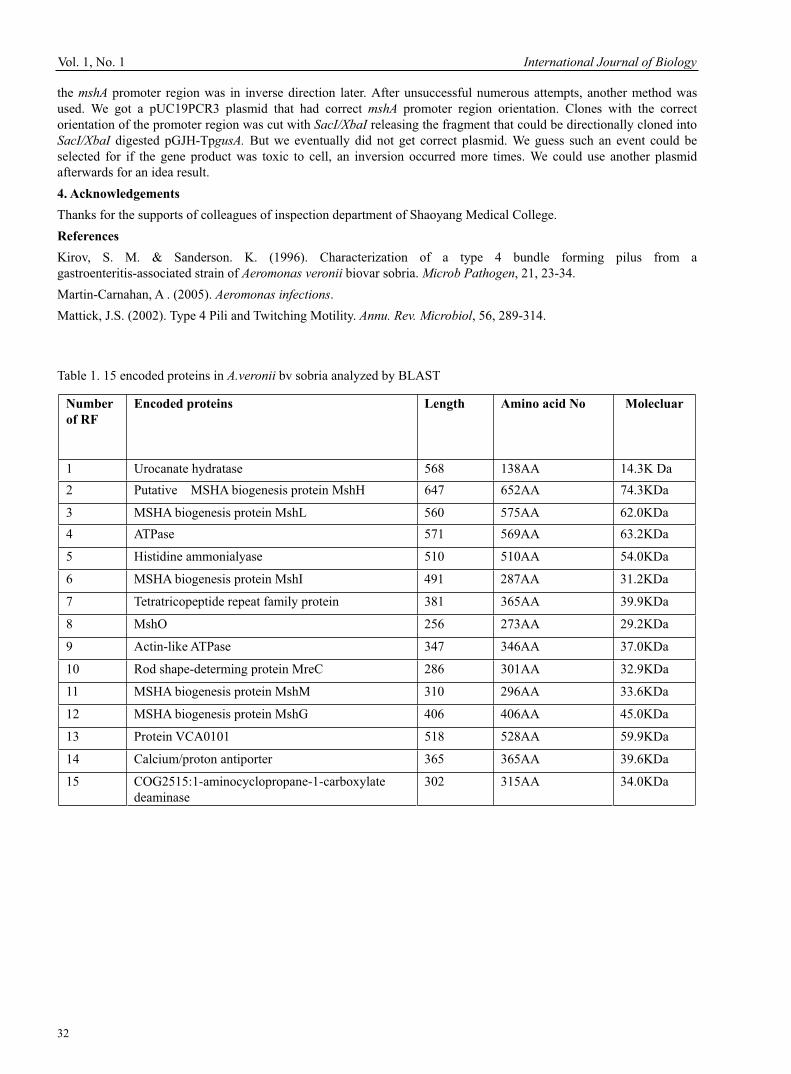
Vol. 1, No. 1 International Journal of Biology
32
the mshA promoter region was in inverse direction later. After unsuccessful numerous attempts, another method was used. We got a pUC19PCR3 plasmid that had correct mshA promoter region orientation. Clones with the correct orientation of the promoter region was cut with SacI/XbaI releasing the fragment that could be directionally cloned into SacI/XbaI digested pGJH-TpgusA. But we eventually did not get correct plasmid. We guess such an event could be selected for if the gene product was toxic to cell, an inversion occurred more times. We could use another plasmid afterwards for an idea result. 4. Acknowledgements Thanks for the supports of colleagues of inspection department of Shaoyang Medical College. References Kirov, S. M. & Sanderson. K. (1996). Characterization of a type 4 bundle forming pilus from a gastroenteritis-associated strain of Aeromonas veronii biovar sobria. Microb Pathogen, 21, 23-34. Martin-Carnahan, A . (2005). Aeromonas infections.Mattick, J.S. (2002). Type 4 Pili and Twitching Motility. Annu. Rev. Microbiol, 56, 289-314.
Table 1. 15 encoded proteins in A.veronii bv sobria analyzed by BLAST
Number of RF
Encoded proteins Length Amino acid No Molecluar
1 Urocanate hydratase 568 138AA 14.3K Da 2 Putative MSHA biogenesis protein MshH 647 652AA 74.3KDa
3 MSHA biogenesis protein MshL 560 575AA 62.0KDa 4 ATPase 571 569AA 63.2KDa
5 Histidine ammonialyase 510 510AA 54.0KDa
6 MSHA biogenesis protein MshI 491 287AA 31.2KDa
7 Tetratricopeptide repeat family protein 381 365AA 39.9KDa
8 MshO 256 273AA 29.2KDa
9 Actin-like ATPase 347 346AA 37.0KDa
10 Rod shape-determing protein MreC 286 301AA 32.9KDa
11 MSHA biogenesis protein MshM 310 296AA 33.6KDa
12 MSHA biogenesis protein MshG 406 406AA 45.0KDa
13 Protein VCA0101 518 528AA 59.9KDa
14 Calcium/proton antiporter 365 365AA 39.6KDa
15 COG2515:1-aminocyclopropane-1-carboxylate deaminase
302 315AA 34.0KDa
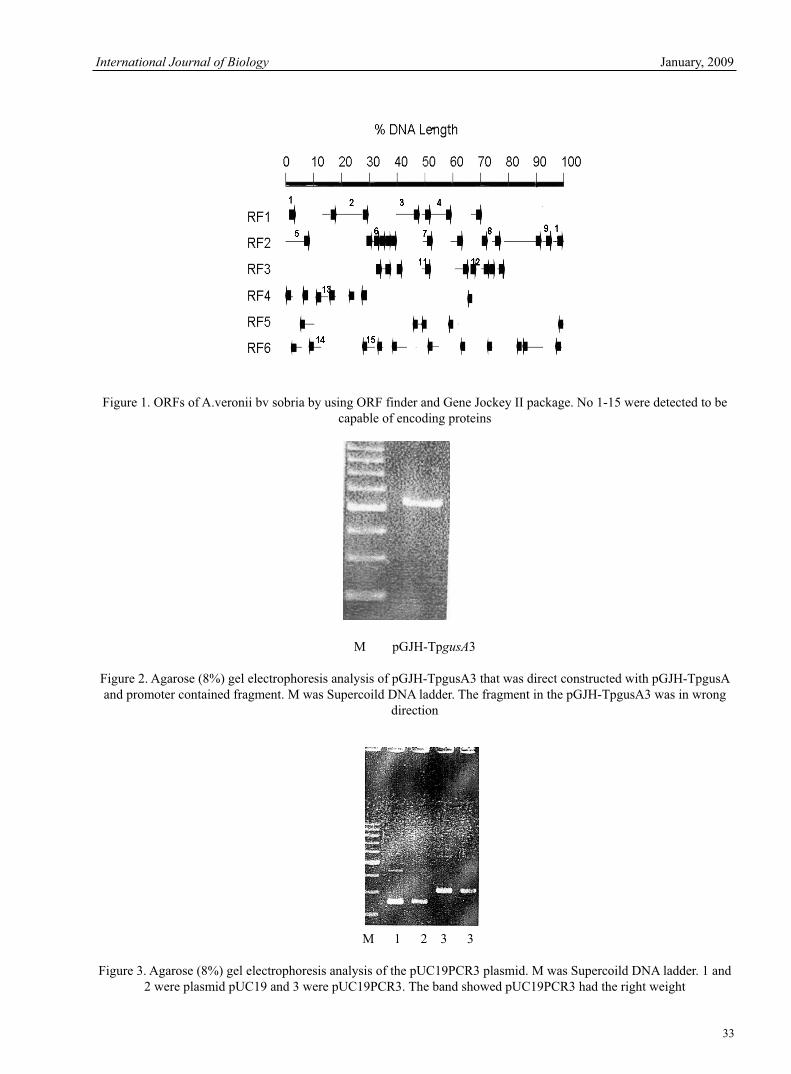
International Journal of Biology January, 2009
33
Figure 1. ORFs of A.veronii bv sobria by using ORF finder and Gene Jockey II package. No 1-15 were detected to be capable of encoding proteins
M pGJH-TpgusA3
Figure 2. Agarose (8%) gel electrophoresis analysis of pGJH-TpgusA3 that was direct constructed with pGJH-TpgusA and promoter contained fragment. M was Supercoild DNA ladder. The fragment in the pGJH-TpgusA3 was in wrong
direction
M 1 2 3 3
Figure 3. Agarose (8%) gel electrophoresis analysis of the pUC19PCR3 plasmid. M was Supercoild DNA ladder. 1 and 2 were plasmid pUC19 and 3 were pUC19PCR3. The band showed pUC19PCR3 had the right weight

Vol. 1, No. 1 International Journal of Biology
34
Antimicrobial Potential of Plant Seed Extracts against Multidrug Resistant Methicillin Resistant Staphylococcus aureus (MDR-MRSA)
E.S. Karthy (Corresponding author) Research Department of Microbiology, Sengunthar Arts and Science College
Tiruchengode 637205, Tamilnadu, India E-mail: [email protected]
P. Ranjitha Research Department of Microbiology, Sengunthar Arts and Science College
Tiruchengode 637205, Tamilnadu, India
A. Mohankumar Research Department of Microbiology, Sengunthar Arts and Science College
Tiruchengode 637205, Tamilnadu, India
Abstract Based on ethnopharmacological information, four different varieties of seeds were obtained from authentic seed suppliers. Ethanol, methanol, acetone, chloroform and petroleum ether seed extracts were assessed for antibacterial activity against wound isolates of Multi Drug Resistant - Methicillin Resistant Staphylococcus aureus (MDR-MRSA). Ethanol, methanol and acetone extracts of Moringa oleifera, Elettaria cardamomum and Tamarindus indica seeds showed more effective anti MRSA activity than Artocarpus heterophyllus. In addition Moringa oleifera seed extracts may have the potential to restore the effectiveness of -lactam antibiotics against MRSA. Keywords: mecA, Antibacterial, Checkerboard assay, Seed extracts, Multi drug resistant 1. IntroductionAntibiotic resistance is the ability of a microorganism to withstand the effects of an antibiotic. The extensive use of antibiotics over the last 50 years has led to the emergence of bacterial resistance and to the dissemination of resistance genes among pathogenic microorganisms. Staphylococcus aureus is one of the most important pathogens that can cause suppuration, abscess formation, a variety of pyogenic infection and even fatal septicemia in human beings. MRSA is still considered as an emerging pathogen and public health threats result from the spread of hospital-acquired as well as community-acquired MRSA (Chambers, 2001). The heterogeneous expression of methicillin resistance can make it difficult to determine the resistance phenotype definitively (Frebourg et al., 1998), therefore detection of the mecA gene remains the “gold standard” (Bignardi et al., 1996). During the last decade, many studies have demonstrated the extremely high capacity of PCR for specifically detecting bacteria and genes of interest (Salisbury et al., 1996). Several authors have already shown the feasibility of the PCR methodology for the identification of S. aureus strains and for the detection of antibiotic resistance genes (Cockerill, 1999). MRSA is resistant to not only methicillin and other - lactams but also may other antibacterial agents; therefore new agents are needed to treat the MRSA. The treatment of infectious diseases with antimicrobial agents continues to present problems in modern-day-medicine with many studies showing a significant increase in the incidence of bacterial resistance to several antibiotics (Finch, 1998). Many plants have been investigated scientifically for antimicrobial activity and a large number of plant products have been shown to inhibit growth of pathogenic bacteria. Though
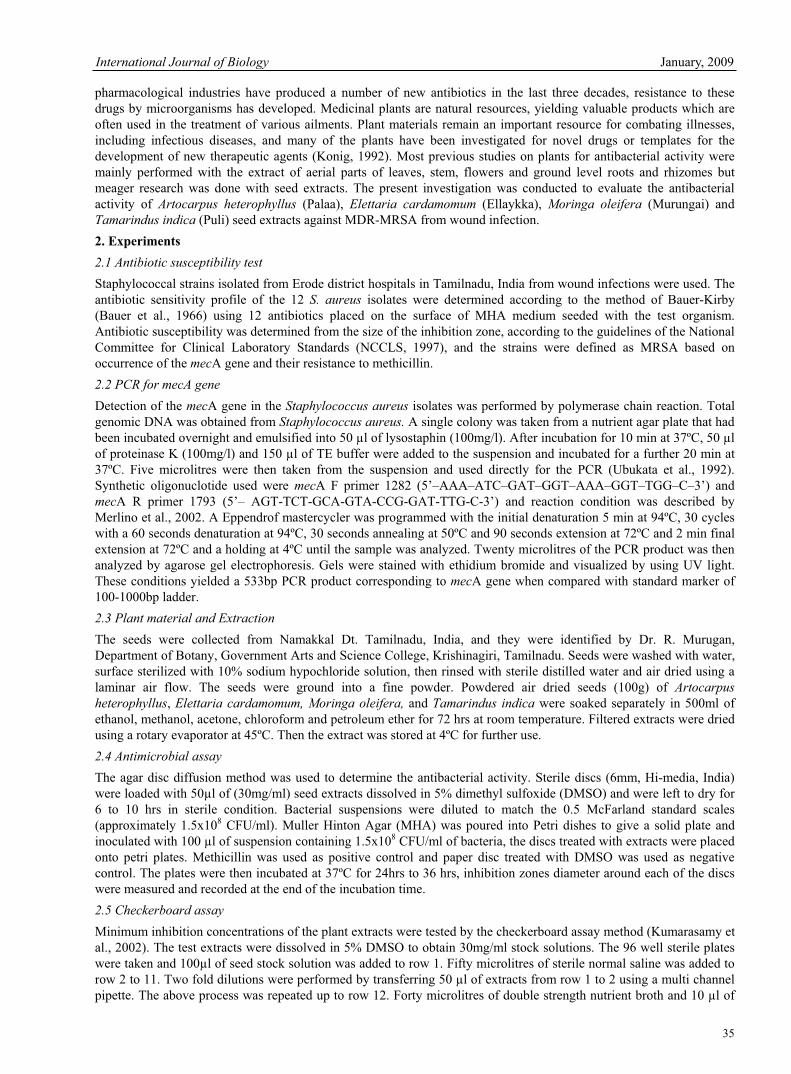
International Journal of Biology January, 2009
35
pharmacological industries have produced a number of new antibiotics in the last three decades, resistance to these drugs by microorganisms has developed. Medicinal plants are natural resources, yielding valuable products which are often used in the treatment of various ailments. Plant materials remain an important resource for combating illnesses, including infectious diseases, and many of the plants have been investigated for novel drugs or templates for the development of new therapeutic agents (Konig, 1992). Most previous studies on plants for antibacterial activity were mainly performed with the extract of aerial parts of leaves, stem, flowers and ground level roots and rhizomes but meager research was done with seed extracts. The present investigation was conducted to evaluate the antibacterial activity of Artocarpus heterophyllus (Palaa), Elettaria cardamomum (Ellaykka), Moringa oleifera (Murungai) andTamarindus indica (Puli) seed extracts against MDR-MRSA from wound infection. 2. Experiments2.1 Antibiotic susceptibility test Staphylococcal strains isolated from Erode district hospitals in Tamilnadu, India from wound infections were used. The antibiotic sensitivity profile of the 12 S. aureus isolates were determined according to the method of Bauer-Kirby (Bauer et al., 1966) using 12 antibiotics placed on the surface of MHA medium seeded with the test organism. Antibiotic susceptibility was determined from the size of the inhibition zone, according to the guidelines of the National Committee for Clinical Laboratory Standards (NCCLS, 1997), and the strains were defined as MRSA based on occurrence of the mecA gene and their resistance to methicillin. 2.2 PCR for mecA geneDetection of the mecA gene in the Staphylococcus aureus isolates was performed by polymerase chain reaction. Total genomic DNA was obtained from Staphylococcus aureus. A single colony was taken from a nutrient agar plate that had been incubated overnight and emulsified into 50 μl of lysostaphin (100mg/l). After incubation for 10 min at 37ºC, 50 μlof proteinase K (100mg/l) and 150 μl of TE buffer were added to the suspension and incubated for a further 20 min at 37ºC. Five microlitres were then taken from the suspension and used directly for the PCR (Ubukata et al., 1992). Synthetic oligonuclotide used were mecA F primer 1282 (5’–AAA–ATC–GAT–GGT–AAA–GGT–TGG–C–3’) and mecA R primer 1793 (5’– AGT-TCT-GCA-GTA-CCG-GAT-TTG-C-3’) and reaction condition was described by Merlino et al., 2002. A Eppendrof mastercycler was programmed with the initial denaturation 5 min at 94ºC, 30 cycles with a 60 seconds denaturation at 94ºC, 30 seconds annealing at 50ºC and 90 seconds extension at 72ºC and 2 min final extension at 72ºC and a holding at 4ºC until the sample was analyzed. Twenty microlitres of the PCR product was then analyzed by agarose gel electrophoresis. Gels were stained with ethidium bromide and visualized by using UV light. These conditions yielded a 533bp PCR product corresponding to mecA gene when compared with standard marker of 100-1000bp ladder. 2.3 Plant material and ExtractionThe seeds were collected from Namakkal Dt. Tamilnadu, India, and they were identified by Dr. R. Murugan, Department of Botany, Government Arts and Science College, Krishinagiri, Tamilnadu. Seeds were washed with water, surface sterilized with 10% sodium hypochloride solution, then rinsed with sterile distilled water and air dried using a laminar air flow. The seeds were ground into a fine powder. Powdered air dried seeds (100g) of Artocarpus heterophyllus, Elettaria cardamomum, Moringa oleifera, and Tamarindus indica were soaked separately in 500ml of ethanol, methanol, acetone, chloroform and petroleum ether for 72 hrs at room temperature. Filtered extracts were dried using a rotary evaporator at 45ºC. Then the extract was stored at 4ºC for further use. 2.4 Antimicrobial assay The agar disc diffusion method was used to determine the antibacterial activity. Sterile discs (6mm, Hi-media, India) were loaded with 50μl of (30mg/ml) seed extracts dissolved in 5% dimethyl sulfoxide (DMSO) and were left to dry for 6 to 10 hrs in sterile condition. Bacterial suspensions were diluted to match the 0.5 McFarland standard scales (approximately 1.5x10⁸ CFU/ml). Muller Hinton Agar (MHA) was poured into Petri dishes to give a solid plate and inoculated with 100 μl of suspension containing 1.5x10⁸ CFU/ml of bacteria, the discs treated with extracts were placed onto petri plates. Methicillin was used as positive control and paper disc treated with DMSO was used as negative control. The plates were then incubated at 37ºC for 24hrs to 36 hrs, inhibition zones diameter around each of the discs were measured and recorded at the end of the incubation time. 2.5 Checkerboard assayMinimum inhibition concentrations of the plant extracts were tested by the checkerboard assay method (Kumarasamy et al., 2002). The test extracts were dissolved in 5% DMSO to obtain 30mg/ml stock solutions. The 96 well sterile plates were taken and 100μl of seed stock solution was added to row 1. Fifty microlitres of sterile normal saline was added to row 2 to 11. Two fold dilutions were performed by transferring 50 μl of extracts from row 1 to 2 using a multi channel pipette. The above process was repeated up to row 12. Forty microlitres of double strength nutrient broth and 10 μl of
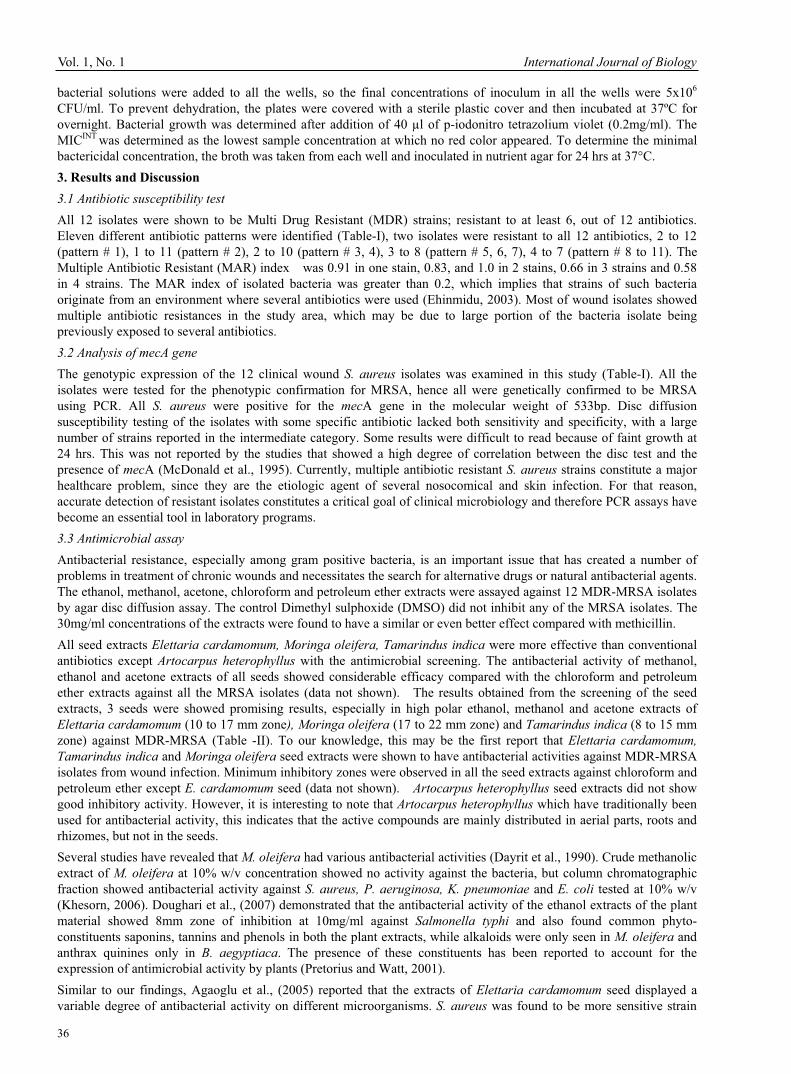
Vol. 1, No. 1 International Journal of Biology
36
bacterial solutions were added to all the wells, so the final concentrations of inoculum in all the wells were 5x10⁶
CFU/ml. To prevent dehydration, the plates were covered with a sterile plastic cover and then incubated at 37ºC for overnight. Bacterial growth was determined after addition of 40 μl of p-iodonitro tetrazolium violet (0.2mg/ml). The MICINT was determined as the lowest sample concentration at which no red color appeared. To determine the minimal bactericidal concentration, the broth was taken from each well and inoculated in nutrient agar for 24 hrs at 37°C. 3. Results and Discussion 3.1 Antibiotic susceptibility testAll 12 isolates were shown to be Multi Drug Resistant (MDR) strains; resistant to at least 6, out of 12 antibiotics. Eleven different antibiotic patterns were identified (Table-I), two isolates were resistant to all 12 antibiotics, 2 to 12 (pattern # 1), 1 to 11 (pattern # 2), 2 to 10 (pattern # 3, 4), 3 to 8 (pattern # 5, 6, 7), 4 to 7 (pattern # 8 to 11). The Multiple Antibiotic Resistant (MAR) index was 0.91 in one stain, 0.83, and 1.0 in 2 stains, 0.66 in 3 strains and 0.58 in 4 strains. The MAR index of isolated bacteria was greater than 0.2, which implies that strains of such bacteria originate from an environment where several antibiotics were used (Ehinmidu, 2003). Most of wound isolates showed multiple antibiotic resistances in the study area, which may be due to large portion of the bacteria isolate being previously exposed to several antibiotics. 3.2 Analysis of mecA geneThe genotypic expression of the 12 clinical wound S. aureus isolates was examined in this study (Table-I). All the isolates were tested for the phenotypic confirmation for MRSA, hence all were genetically confirmed to be MRSA using PCR. All S. aureus were positive for the mecA gene in the molecular weight of 533bp. Disc diffusion susceptibility testing of the isolates with some specific antibiotic lacked both sensitivity and specificity, with a large number of strains reported in the intermediate category. Some results were difficult to read because of faint growth at 24 hrs. This was not reported by the studies that showed a high degree of correlation between the disc test and the presence of mecA (McDonald et al., 1995). Currently, multiple antibiotic resistant S. aureus strains constitute a major healthcare problem, since they are the etiologic agent of several nosocomical and skin infection. For that reason, accurate detection of resistant isolates constitutes a critical goal of clinical microbiology and therefore PCR assays have become an essential tool in laboratory programs. 3.3 Antimicrobial assayAntibacterial resistance, especially among gram positive bacteria, is an important issue that has created a number of problems in treatment of chronic wounds and necessitates the search for alternative drugs or natural antibacterial agents. The ethanol, methanol, acetone, chloroform and petroleum ether extracts were assayed against 12 MDR-MRSA isolates by agar disc diffusion assay. The control Dimethyl sulphoxide (DMSO) did not inhibit any of the MRSA isolates. The 30mg/ml concentrations of the extracts were found to have a similar or even better effect compared with methicillin. All seed extracts Elettaria cardamomum, Moringa oleifera, Tamarindus indica were more effective than conventional antibiotics except Artocarpus heterophyllus with the antimicrobial screening. The antibacterial activity of methanol, ethanol and acetone extracts of all seeds showed considerable efficacy compared with the chloroform and petroleum ether extracts against all the MRSA isolates (data not shown). The results obtained from the screening of the seed extracts, 3 seeds were showed promising results, especially in high polar ethanol, methanol and acetone extracts ofElettaria cardamomum (10 to 17 mm zone), Moringa oleifera (17 to 22 mm zone) and Tamarindus indica (8 to 15 mm zone) against MDR-MRSA (Table -II). To our knowledge, this may be the first report that Elettaria cardamomum, Tamarindus indica and Moringa oleifera seed extracts were shown to have antibacterial activities against MDR-MRSA isolates from wound infection. Minimum inhibitory zones were observed in all the seed extracts against chloroform and petroleum ether except E. cardamomum seed (data not shown). Artocarpus heterophyllus seed extracts did not show good inhibitory activity. However, it is interesting to note that Artocarpus heterophyllus which have traditionally been used for antibacterial activity, this indicates that the active compounds are mainly distributed in aerial parts, roots and rhizomes, but not in the seeds. Several studies have revealed that M. oleifera had various antibacterial activities (Dayrit et al., 1990). Crude methanolic extract of M. oleifera at 10% w/v concentration showed no activity against the bacteria, but column chromatographic fraction showed antibacterial activity against S. aureus, P. aeruginosa, K. pneumoniae and E. coli tested at 10% w/v (Khesorn, 2006). Doughari et al., (2007) demonstrated that the antibacterial activity of the ethanol extracts of the plant material showed 8mm zone of inhibition at 10mg/ml against Salmonella typhi and also found common phyto- constituents saponins, tannins and phenols in both the plant extracts, while alkaloids were only seen in M. oleifera and anthrax quinines only in B. aegyptiaca. The presence of these constituents has been reported to account for the expression of antimicrobial activity by plants (Pretorius and Watt, 2001). Similar to our findings, Agaoglu et al., (2005) reported that the extracts of Elettaria cardamomum seed displayed a variable degree of antibacterial activity on different microorganisms. S. aureus was found to be more sensitive strain
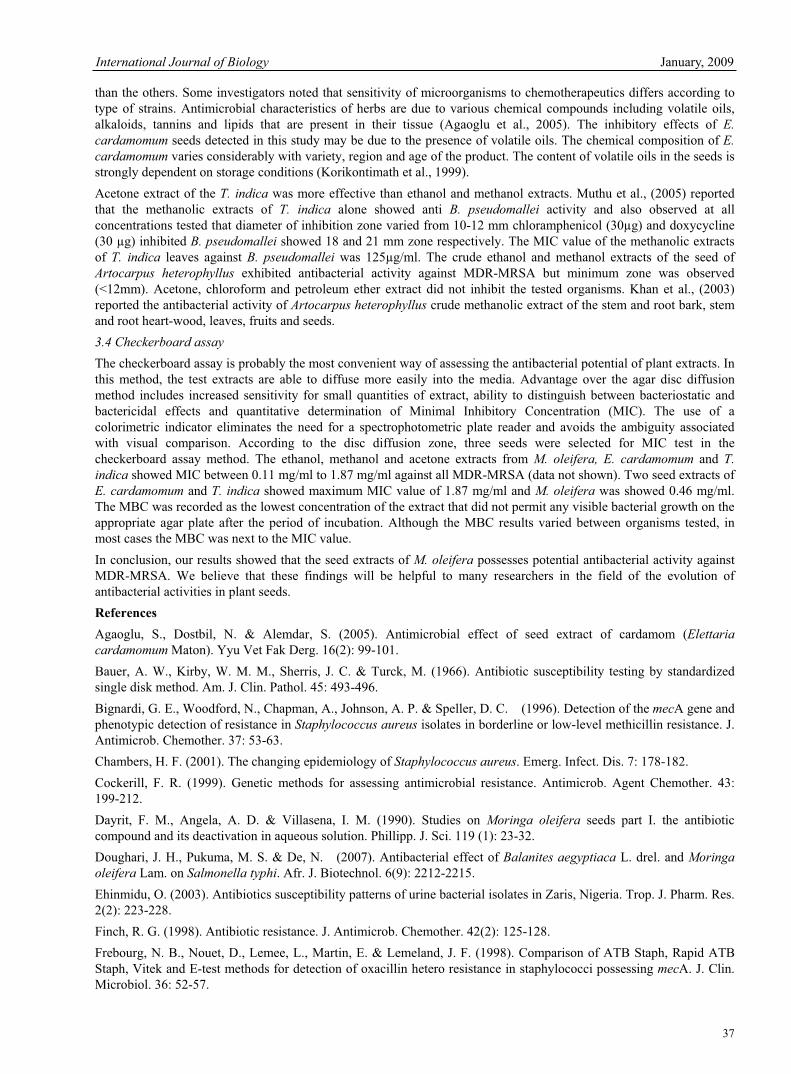
International Journal of Biology January, 2009
37
than the others. Some investigators noted that sensitivity of microorganisms to chemotherapeutics differs according to type of strains. Antimicrobial characteristics of herbs are due to various chemical compounds including volatile oils, alkaloids, tannins and lipids that are present in their tissue (Agaoglu et al., 2005). The inhibitory effects of E. cardamomum seeds detected in this study may be due to the presence of volatile oils. The chemical composition of E. cardamomum varies considerably with variety, region and age of the product. The content of volatile oils in the seeds is strongly dependent on storage conditions (Korikontimath et al., 1999). Acetone extract of the T. indica was more effective than ethanol and methanol extracts. Muthu et al., (2005) reported that the methanolic extracts of T. indica alone showed anti B. pseudomallei activity and also observed at all concentrations tested that diameter of inhibition zone varied from 10-12 mm chloramphenicol (30μg) and doxycycline (30 μg) inhibited B. pseudomallei showed 18 and 21 mm zone respectively. The MIC value of the methanolic extracts of T. indica leaves against B. pseudomallei was 125μg/ml. The crude ethanol and methanol extracts of the seed ofArtocarpus heterophyllus exhibited antibacterial activity against MDR-MRSA but minimum zone was observed (<12mm). Acetone, chloroform and petroleum ether extract did not inhibit the tested organisms. Khan et al., (2003) reported the antibacterial activity of Artocarpus heterophyllus crude methanolic extract of the stem and root bark, stem and root heart-wood, leaves, fruits and seeds.3.4 Checkerboard assayThe checkerboard assay is probably the most convenient way of assessing the antibacterial potential of plant extracts. In this method, the test extracts are able to diffuse more easily into the media. Advantage over the agar disc diffusion method includes increased sensitivity for small quantities of extract, ability to distinguish between bacteriostatic and bactericidal effects and quantitative determination of Minimal Inhibitory Concentration (MIC). The use of a colorimetric indicator eliminates the need for a spectrophotometric plate reader and avoids the ambiguity associated with visual comparison. According to the disc diffusion zone, three seeds were selected for MIC test in the checkerboard assay method. The ethanol, methanol and acetone extracts from M. oleifera, E. cardamomum and T. indica showed MIC between 0.11 mg/ml to 1.87 mg/ml against all MDR-MRSA (data not shown). Two seed extracts of E. cardamomum and T. indica showed maximum MIC value of 1.87 mg/ml and M. oleifera was showed 0.46 mg/ml. The MBC was recorded as the lowest concentration of the extract that did not permit any visible bacterial growth on the appropriate agar plate after the period of incubation. Although the MBC results varied between organisms tested, in most cases the MBC was next to the MIC value. In conclusion, our results showed that the seed extracts of M. oleifera possesses potential antibacterial activity against MDR-MRSA. We believe that these findings will be helpful to many researchers in the field of the evolution of antibacterial activities in plant seeds.References Agaoglu, S., Dostbil, N. & Alemdar, S. (2005). Antimicrobial effect of seed extract of cardamom (Elettaria cardamomum Maton). Yyu Vet Fak Derg. 16(2): 99-101. Bauer, A. W., Kirby, W. M. M., Sherris, J. C. & Turck, M. (1966). Antibiotic susceptibility testing by standardized single disk method. Am. J. Clin. Pathol. 45: 493-496. Bignardi, G. E., Woodford, N., Chapman, A., Johnson, A. P. & Speller, D. C. (1996). Detection of the mecA gene and phenotypic detection of resistance in Staphylococcus aureus isolates in borderline or low-level methicillin resistance. J. Antimicrob. Chemother. 37: 53-63. Chambers, H. F. (2001). The changing epidemiology of Staphylococcus aureus. Emerg. Infect. Dis. 7: 178-182. Cockerill, F. R. (1999). Genetic methods for assessing antimicrobial resistance. Antimicrob. Agent Chemother. 43: 199-212. Dayrit, F. M., Angela, A. D. & Villasena, I. M. (1990). Studies on Moringa oleifera seeds part I. the antibiotic compound and its deactivation in aqueous solution. Phillipp. J. Sci. 119 (1): 23-32. Doughari, J. H., Pukuma, M. S. & De, N. (2007). Antibacterial effect of Balanites aegyptiaca L. drel. and Moringa oleifera Lam. on Salmonella typhi. Afr. J. Biotechnol. 6(9): 2212-2215. Ehinmidu, O. (2003). Antibiotics susceptibility patterns of urine bacterial isolates in Zaris, Nigeria. Trop. J. Pharm. Res. 2(2): 223-228. Finch, R. G. (1998). Antibiotic resistance. J. Antimicrob. Chemother. 42(2): 125-128. Frebourg, N. B., Nouet, D., Lemee, L., Martin, E. & Lemeland, J. F. (1998). Comparison of ATB Staph, Rapid ATB Staph, Vitek and E-test methods for detection of oxacillin hetero resistance in staphylococci possessing mecA. J. Clin. Microbiol. 36: 52-57.

Vol. 1, No. 1 International Journal of Biology
38
Khan, M. R., Omoloso, A. D. & Kihara, M. (2003). Antimicrobial activity of Artocarpus heterophyllus. Fitoterapia 74: 5001-505. Khesorn, N. (2006). Antimicrobial activity of the capsules of Moringa oleifera (Moringaceae). CMU J. 5(3): 365-368. Konig, G. M. (1992). Meeresorganismen als quelle pharmazeutisch bedeutsamer naturstoffe. Detsche Apotheker Zeitung 132 (14), 673-683.Korikontimath, V. S., Mulge, R. & Zachariah, J. T. (1999). Variations in essential oil constituents in high yielding selections of cardamom. J. Plantation. Crops. 27: 230-232. Kumarasamy, Y., Philip, J. C., Marcel, J. Lutfun, N. & Satyajit, D. S. (2002). Screening seeds of Scottish plants for antibacterial activity. J. Ethnopharmacol. 83(1-2): 73-77. McDonald, C. L., Maher, W. E. & Fass, R. J. (1995). Revised interpretation of oxacillin MICs for Staphylococcus epidermidis based on mecA detection. Antimicrob. Agents. Chemother. 39: 982-984. Merlino, J., Watson, J., Rose, B., Beard, M. P., Gottlieb, T. & Harbour, C. (2002). Detection and expression of Methicillin/ Oxacillin resistance in multidrug resistant and non-multidrug resistant Staphylococcus aureus in central Sydney, Australia. J. Anti. Chem. 49: 793-801. Muthu, S. E., Nandakumar, S. & Rao, U. A. (2005). The effect of methanolic extract of Tamarindus indica on the growth of clinical isolates of Burkholderia pseudomallei. Indian J. Med. Res. Pp 525-528. National Committee for Clinical Laboratory Standards – NCCLS. (1997). Methods for dilution antimicrobial susceptibility tests for bacteria that grow aerobically. Fourth Edition: Approved Standard M7-A4. NCCLS; Wayne, PA. Pretorius, C. J. & Watt, E. (2001). Purification and identification of active components of Carpobrotus edulis L. J. Ethnopharmacol. 76: 87-91. Ubukata, K., Nakagami, S., Nitta, A., Yamane, A., Kawakami, S. & Sugiura, M. (1992). Rapid detection of the mecAgene in methicillin resistant staphylococci by enzymatic detection of polymerase chain reaction products. J. Clin. Micro. 30 1728-33. Salisbury, S. M., Sabatini, L. M. & Spiegel, C. A. (1996). Identification of methicillin-resistant staphylococci by multiplex polymerase chain reaction assay. Microbiol. Infect. Dis. 107: 368-373.
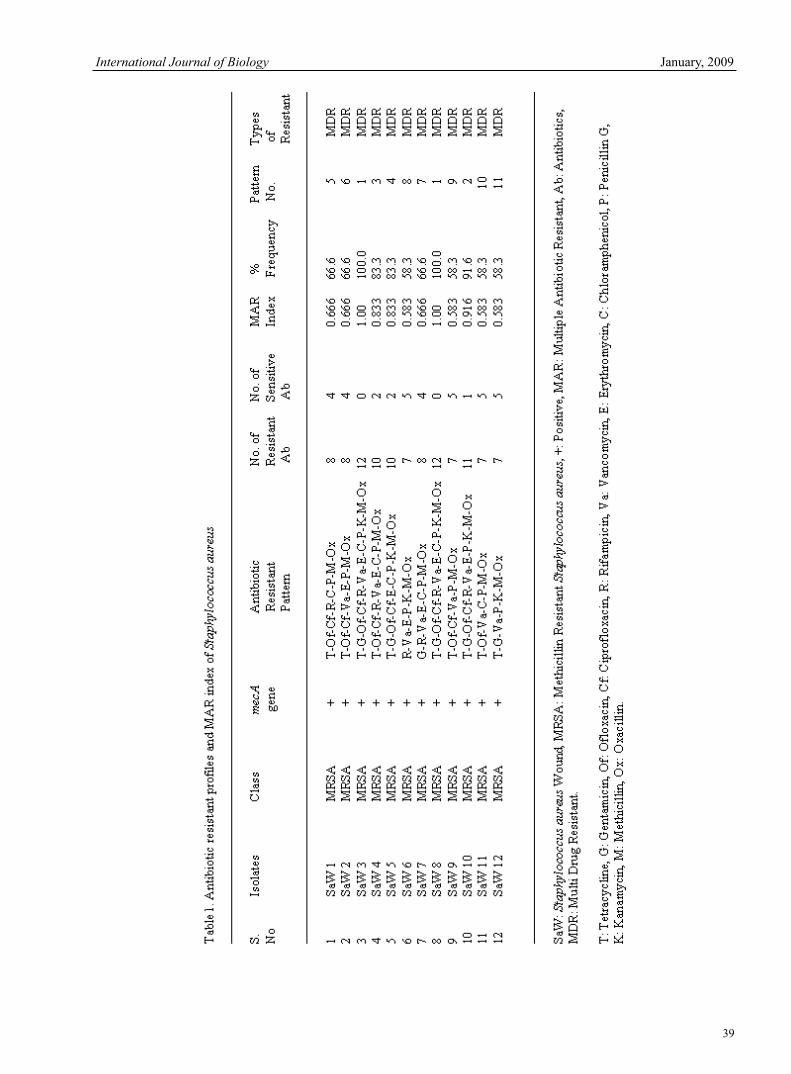
International Journal of Biology January, 2009
39
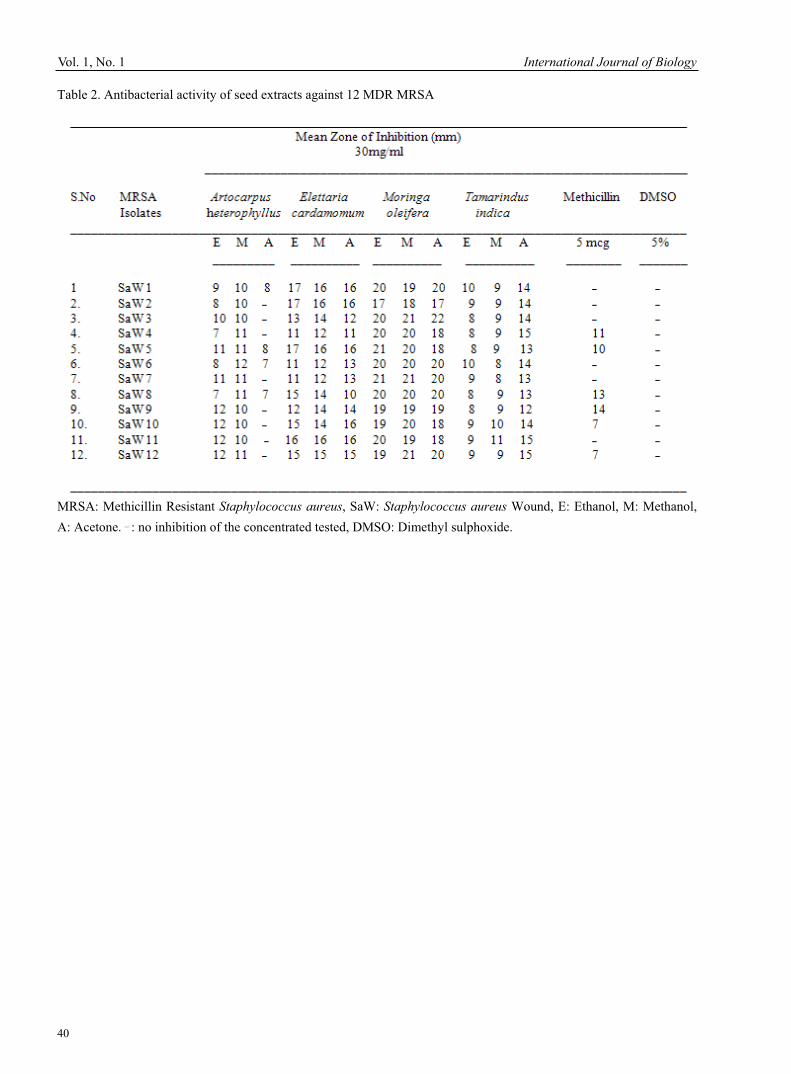
Vol. 1, No. 1 International Journal of Biology
40
Table 2. Antibacterial activity of seed extracts against 12 MDR MRSA
MRSA: Methicillin Resistant Staphylococcus aureus, SaW: Staphylococcus aureus Wound, E: Ethanol, M: Methanol, A: Acetone. _ : no inhibition of the concentrated tested, DMSO: Dimethyl sulphoxide.
International Journal of Biology January, 2009
41
Study on the Fat-related Genes of Chicken
Guang Han, Herong Liao, Xiuxia Liu, Jincheng Zhang & Ming Ni College of Animal Science and Technology Shihezi University, Shihezi 832000, China
E-mail: [email protected]
Abstract For chicken, the study about fat-related traits is one important aspect of the breading and economic benefit. The intramuscular fat can enhance the taste and flavor of muscle, and study of chicken on the level of DNA has become into a research spot for modern biologics. In this article, we summarized deeper research developments of fatty acid-binding protein gene (FABP), leptin receptor gene (OBR), peroxisome proliferators-activated receptor gene (PPAR), thyroid hormone response albumen Spot14 gene (THRSP), melanocortin receptor gene (MCR), apolipoprotein B and lipoprotein lipase gene (LPL) about chicken fat-related traits in recent years. Keywords: O, O-diethyl acrylamide phosphate, Intumescent flame retardant, LOI, SEM With the enhancement of human living, people require more and more chicken quality. The intramuscular fat is the fat in the muscle. On the one hand, it can dissolve the muscular fasciculi and enhance the taste and flavor of the muscle when the muscular fat is oxidated. On the other hand, because the muscular fat largely contains phosphatide which can produce aroma though Mailard reaction (Oleagineux et alt, 1997), so the content of muscular fat is the important factor to influence the quality and taste of animal meat. With the accomplishment of the chicken genome plan, as the important biological representative biology, the chicken will certainly exert larger function in the age of post genome. Numerous genes, which compose the chicken production traits and special idioplasm inheritance base will be developed and the function of genes will be analyzed. Therefore, the study of relative genes of fowl fat traits has become into one of spots studied by many fowl inheritance and breeding scholars. 1. Fatty acid-binding protein gene (FABP) In the species of bird, as one part of dissoluble non-enzyme albumen in the cytoplasm, FABP is broad distributed in multiple histocytes, and it occupies 3%~8% of the total protein in cytoplasm, and its molecular weight is 14~16k. Albumens combining with fatty acid are some small proteins existing in the cell (Wang, 2002). FABPs participate to incept the fatty acid in the cell, and help to carry fatty acid to the locales of -oxygenation (such as plastosome or peroxide enzyme) and the combination part of triglycerides and phophatide (Veerkamp and Maatman, 1995). When studying the adjustment of rat fatty acid absorption, Ockneir et al found FABP in the intestinal mucosa. At present, there are nine sorts of FABP including small intestine type (I), heart type (H), lipocyte type (A), liver type (L), brain type (B), ileum type (II), epidermal cell type (E), phospholipids (MY) and spermary type (S). The main function of FABP is to combine with the long chain fatty acids (LCFAs), and different types of FABP have different abilities to combine with LCFAs (Wang, 2002), and the type H and the type A are regarded as the candidate gene of intramuscular fat (IMF). The gene of H-FABP is positioned in the sixth chromosome of pig, the fourth chromosome of small rat and the first chromosome of human being. As the candidate gene of intramuscular fat, the researches about the gene of A-FABP and H-FABP in birds have achieved some results. Wang, Qigui (2004) cloned the genes of A-FABP and H-FABP of chicken, and found different gene types produced by part SNPs had important influences to the avoirdupois and ventral fat traits, and speculated that the reason is in the major gene influencing these traits or the close linkage with the major gene. Ye, Manhong et al (2003) used the method of PCR-RFLP found that the polymorphism existed in the third intron of chicken A-FABP and the second intron of chicken H-FABP. The sequence length of EX-FABP gene is 5148bp, and it includes 6 exontras and 178 amino acids codes, and the polymorphism of chicken EX-FABP has significant correlation with ventral fat (Wang, 2001). Ao, Jinxia (2003) cloned and tested the goosey A-FABP gene code area, and its length was 399bp, and the homology of nucleotide acid sequence with chicken A-FABP gene code area achieved 94%, and the

Vol. 1, No. 1 International Journal of Biology
42
homology after deducting amino acid achieved 97%. And she also measured the intron 2 of the gene, and the length was 221bp, and she found that the expression quantity of goosey A-FABP gene is higher in fat, heart and liver, and it had no expression in spleen and small intestine (Gerbens F, 1998). 2. Leptin receptor gene (OBR) The gene of OBR was found and cloned by Tartaglia (1995) through the strategy of clone. It is a sort of trans-membrane albumen, and it belongs to the type cell factor super family acceptor which has five isomers including OBRa, OBRb, OBRc, OBRd and OBRe, and they possess same exterior area of cell, but their interior structures of cell are different in length and sequence. The main physiological function of OBR is to combine with leptins and make leptins to adjust body energy balance and fat storage. There are few researches about brids OBR gene, and Guy et al (2000) first cloned the sequency of chicken OBR cDNA, and its homology with mammals could averagely achieve 60%. Dunn et al (2000) oriented the chicken OBR gene in the eighth chromosome (Carre W, 2001, p.289-297). Gu, Zhiliang et al (2002) found one base mutation on the exontra 9 of OBR gene, and speculated that the allele A might be related with much ventral fat. Wangying et al (2004) found two gene mutations of T C and G Ain the intron 8 of chicken OBR gene, and the different gene types were obviously different in the ventral fat weight and ventral fat rate, and the individual ventral fat weight and ventral fat rate of BB type were significantly higher than the individual of AB type, and the significance was higher than the individual of AA type (Hardiman, 1996, P.461-467 & Jeffrey, 1998, P.763-770). So we can primarily judge that the gene OBR might be the major gene influencing the chicken fat traits or closely linked with the major gene. 3. Peroxisome proliferators-activated receptor gene (PPAR) The existing researches indicated that three PPARs including PPAR , PPAR (orPPAR or NUC1) and PPAR (Robert, 1998). According to the report of Diot, the cDNA sequences of PPAR gene among different species are highly homologized. As same as other steroid hormones acceptor super-family members, PPAR has six regions (A-F) or four functional structure regions. The region C in the center of the acceptor molecule is the DNA-binding domain (DBD), the E/F region of carboxyl port is the ligand-binding domain (LBD) which exerts important function in the process that the hormone signals are converted into the transcriptional activation signals, and the A/B region of amido port is the adjustment domain. PPAR can promote fat metabolism, adjust glucide metabolism and differentiate lipocytes. Menghe adopted the PCR-SSCP technology and found three types of gene in the chicken samples with eight weeks old, and he found a mutation from C to T at the point of 297bp, but the statistical analysis showed the gene type of the point had no significant difference in ventral fat rate, ventral fat weight and other six traits (Lemberger, 1996, P.335-363). Grindflek implemented PCR-RFLP analysis to the PPAR gene of Norway pig and found a polymorphism point, and statistical analysis indicated that the waist muscle fatty acid composing is different of the individuals with different gene types, but the indexes of back-fat and intramuscular fat had no obvious differences (Meng, 2002 & Meng, 2002, p. 119-123). 4. Thyroid hormone response albumen Spot14 gene (THRSP) The gene of THRSP is a sort of acidic protein with less molecular weight in mammals, and it was found in the research about the reaction of thyroxin in the fat (Seeling et al, 1981). The gene mainly exists in fat-produced organizations such as liver, ventral fat and galactophore (Compe E, 2001, P.175-183). Because this albumen can produce response reaction to the stimulation of thyroxin and the high dextrose level, so the chromosome domain where the genes exist is related with the adiposity, and the gene is thought to possess important function for the production of fat. The researches about the gene mainly concentrated in human, big rat and small rat, and the THRSP gene of chicken was first confirmed by Cogbum et al (2000) who used the micro-array method to separate the chicken liver. The gene was oriented in the chromosome of lq41244 (Beccavin, 2001, 297-306). The chromosome domain contains sebum traits points and the ventral fat quantity traits points (Ikeobi et al, 2002). The gene can be divided into THRSP and THRSP 2 according to its polymorphism (Kinlaw, 1995, 16615-16618 & Liu H C, 1994, 1021-1037). The gene of THRSP was related with the ventral fat traits in the crossbreed resource colony of table poultry and leghorn. Yan, Wenlong et al (2004) pointed out the chicken gene of THRSP was significantly correlated with the fat bandwidth and fat weight, and various gene types of this gene were significantly correlated with the influences of traits (Cunningham, 1997, 5184-5188). Li, Huifeng et al (2005) applied the gene chip technology to analyze the expressions of 20 genes in the fat metabolism approaches in different growth periods of Beijing oil chicken, established the Bayesian interactive network of these genes, and found the spot14 and H-FABP genes which largely influenced the fat traits, and deeply analyzed the influences of these two genes to the fat traits (Liu H C, 1994, 1021-1037). The gene of H-FABP presented significantly negative correlation with the intramuscular fat content of Beijing oil chicken. Li, Zhihui et al (2005) pointed out the combination gene type of OBR and UCP significantly influenced ventral fat weight and ventral fat rate of table poultry, and the individual of BBBB was lower 17.81g than the individual of AAAA, its inheritance contribution rates to ventral fat weight and ventral fat rate aberrance respectively could achieve 16.61% and 11.04% (Cao, 2008, 258-288).
International Journal of Biology January, 2009
43
5. Melanocortin receptor gene (MCRs) The family is the smallest G albumen coupling acceptor sub-family at present, and they all belong to the 7 trans-membrane helix G albumen acceptor of A class, and they are the production of a series of small gene (SchiothHB, 2003, 504-509). Up to now, there are five melanocortin receptor genes (MC1R-MC5R) to be cloned, identified and oriented. The melanocortin receptor board participates in the controls of multiple physiological channels including pigmentation, food intake behaviors, weight and energy metabolism and balance, anti-infection, sex function and ache. High homology exists in all MCRs which possess common molecule structure character (Vaisse C, 1998, p.113-114 & Jeffrey M, 1997, P.119-120). The human chromosome database sequence in Gene bank has not the similar sequence with rat MC2Rxon1f and its flank sequence, which indicates that the human fat organization has no the expression of MC2R because of the deficiency of exon1f. Blondet et al also found an E-box (oriented in -1020bp) participated in restraining the expression of MC2R in the adrenal gland cell. The electrophoresis analysis shows the restriction function is implemented by the mutual function of various factors such as catalytic albumen enzyme-4. Jiang, Siwen et al took the Plymoute rock 3 as the experiment materials and found 5 new MC3R genes SNPs including T452G, A549G, C564T, A882G and C894T, and the first mutation produced Len151Arg amino acid substitution, and the second mutation produced a new Dde limited endonuclease enzyme cutting site which could be utilized to establish the MC3R gene type PCR-RFLP molecule test method. The variance analysis result showed that the MC3R gene could significantly influence the weight of cock and hen, and the ventral fat content of cock, and the result advised that the MC3R gene could be as the reason to explain the significant difference of crossbreed chicken weights (Jiang, 2002, 322-325). 6. Apolipoprotein B gene Apolipoprotein B (ApoB) gene possesses important function in the processes of energy absorption, transportation and metabolism (Glickman et al, 1986). In mammals, ApoB is expressed in small intestine and liver, and it is the VLDL synthesis of triglyceride and excretory framework albumen which has important function of the transportation and metabolism of fat (Schumaker et al, 1994). The ApoB albumen in mammals mainly includes two forms, i.e. ApoB-100 and ApoB-48, and they are coded by same gene, and formed by special compiling mechanism (Glickman et al, 1986 & Schumaker et al, 1994). The mRNA of ApoB in the chicken small intestine is not be compiled, so the expression of ApoB-48 doesn’t exist in the chick small intestine. ApoB is the component of VLDL, IDL, LDL, and it is the frame albumen of fat albumen synthesis exudation and transportation, and it has important function for the energy transportation and metabolism, and it can directly or indirectly influence the fat accumulation and growth (Innerarity et al, 1996). Zhangsen et al (2005) found a T G synonymy mutation on extron 26 of chicken ApoB gene, and it had large influence to the weight and ventral fat traits, and 1 week weight and 3 week weight of GG gene type were significantly lower than other gene type, but the ventral fat weight and ventral fat rate of TT gene type were significantly higher than GT gene type and GG gene type (Zhang, 2006). 7. Lipoprotein lipase gene (LPL) The research about the LPL gene of chicken is clear. In 1989, Cooper et al separated the chicken fat LPLcDNA clone from a -gt11 expression library and tested its sequence. According to the analysis of cDNA sequence and purification enzymatic N-port sequence, the chicken fat LPL is a mutual protein containing 465 amino acids, and possesses the signal peptide with 19 or 25 amino acids. All chicken LPL genes have been separated and determined by the primer extension and sequence analysis (Cooper, 1992), and the length of the gene is 17kb. All cutting sites of all introns and extrons must abide the rule of gt-ag. As same as human LPL gene, the chicken LPL gene also contains 10 extrons and 9 introns. Raisonnier (1995) implemented linear arrangement to the LPL nucleotide acid and amino acid sequence of 8 species (human, pig, cattle, sheep, small rat, big rat, guinea pig and chicken), and found the main structure domain including catalytic action, N-candy base and liver element combination point are highly conservative, and the sequence of amino acid chain with same code is in the end of the second extron to the start of the third extron. In 7 sorts of mammal, extron 10 has not been completely translated and it contains special deficiency, insert or A and A+T components of species, but in chicken, the start of extron 10 is translated, and the linear arrangement of these 8 species will offer useful tool for further studying the function of LPL. The experiment result of Whitehead et al (1982) showed that under the condition of raising HFD, the sum of VLDL and LDL is closely related with the fat weight of 7 weeks old, and the type correlation was 0.45. In addition, the research by Griffin et al (1982) also indicated that strong correlation existed in VLDL and the accumulation of fat. But the physiological function of LPL is the triglyceride in VLDL which charges in the storage of fat. Therefore, it has extensive research foreground to study the relationship between different gene types of LPL and the intramuscular fat content, confirm the molecule inheritance sign of the intramuscular fat content, and enhance the veracity of chicken high quality traits breeding (Wang, 2007). References Beccavin, C. B, Chevalier, L. A., Cogburn, J. Simon & M. J. Duclos. (2001). Insulin-like growth factors and body growth in chickens divergently selected for high or low growth rate. J. Endocrinol. No.168. P.297-306. Cao, Zhiping & Lihui. (2008). Research Progress of Spot14 Gene. Journal of Northeast Agricultural University. No. 2.
Vol. 1, No. 1 International Journal of Biology
44
P.258-288. Carre W, Diot C, Fillon V, et al. (2001). Development of 112 unique expressed sequence tags from chicken liver using an arbit rarily primed reverse t ranscrip tase polymerase chain reaction and singlest rand conformation gel purification met hod. Anim Genet. No.32. P.289-297. Compe E, de Sousa G, Francois K, et al. (2001). Spot 14 protein interactsand cooperates with chicken ovalbumin upstream promoter trans-cription factor 1 in the transcription of the L-type pyruvate kina-se gene through a specificity protein 1(Sp1) binding site. Bi-ochem J. No.358. P.175-183. Cunningham B A, Maloney M, Kinlaw W B. (1997). Spot 14 protein-pr-otein interactions:evidence for both homo-and heterodimer form-ation in vivo. Endocrinology. No.138. P.5184-5188. Gerbens F, Jansen A, van Erp AJ, et al. (1998). The adipocyte fatty acidbinding protein locus: characterization and association with intramus cular fat content in pigs. Mamm Genome. No.9(12). P.1022-1026. Hardiman J W. (1996). Broiler breeding by the 2006 year. Proceedings of the 20th World’s Poultry Congress. No.1. P.461-467. Jeffrey M F & Jeffrey L H. (1998). Leptin and the regulation of body weightin mammals. Nature. No.395. P.763-770. Jeffrey M. Friendman. (1997). The alphabet of weight control. Nature. No.385. P.119-120. Jiang, Siwen, Jacobsson Lina, Kerje Susanne. (2002). Studies of Relationship between the Melanocortin-3 Receptor Gene and Body Weight in Chicken for High and Low Weight Lines’ Intercross. Acta Genetica Sinica. No. 29(4). P.322-325. Kinlaw W B, Church J L, Harmon J, et al. (1995). Direct evidence for arole of theSpot14protein in the regulation of lipid synthesis. J Biol Chem. No.270(28). P.16615-16618. Lemberger T., Desvergne B. & Wahli W. (1996). Peroxisome proliferator activated receptors: A number receptor signaling pathway in lipid physiology. Annu Rey Cell Bev Biol. No.12. P.335-363. Liu H C & Towle H C. (1994). Functional synergism between multiple thy-roid hormone response elements regulates hepatic expression ofthe rat S14 gene. Mol Endocrinol. No.8. P.1021-1037. Meng He. (2002). Genetic Study on the Relationship between Chicken PPAR Gene and Fact Growth. Doctor Thesis of Northeast Agricultural University. Meng He, Wang, Guihua & Wang, Qigui. (2002). Studies of Single Nucleotide Polymorphism of PPAR Gene and Its Associations with Fattiness Trait in Chicken. Acta Genetica Sinica. No. 29(2). P.119-123. Robert C, Palin MF, Coulombe N, et al. (1998). Backfat thickness in pigsis positively associated with leptin mRNA levels. Canadian J Animal Sci. No.78 (4). P.473-482. SchiothHB, Raudsepp T, Ringholm A, et al. (2003). Remarkable synteny cones- rvation ofmelanocortin receptors in chicken , human , and otherverte brates. Genomics. No.81(5). P.504-509. Vaisse C, Clement K, Guy-Grand B & Froguel P. (1998). A frameshift mutation in human MC4 R is associated with a dominant form of obesity. Nat. Genet. No.20(2). P.113-114. Wang, Qigui, Li Ning & Deng, Xuemei. (2002). Cloning and Sequencing of Fatty Acid Binding Proteins Gene in Chicken. Acta Genetica Sinica. No. 29(2). P.115-118. Wang, Qigui, Li Ning & Deng, Xuemei. (2002). Study on Single Nucleotide Polymorphism of PPAR Gene and Its Associations with Fattiness Trait in Chicken. Progress in Natural Science. No. 4. Wang Qi, Zhang, Lihong, Zhang, Lijie & Yang, Gongshe. (2007). Study on the Characteristics of Tissue Expression of Hormone Sensitive Lipase and Triacylglycerol Hydrolase in Pigs. Chinese Journal of Biotechnology. No.5. Zhangsen & Li Hui. (2006). Advances in the Research of Apolipoprotein B. International Journal of Genetics. No.5.
International Journal of Biology January, 2009
45
Variation on Male Mating Success to Short-Term High Thermal Stress among Three Geographical Strains of Drosophila melanogaster
Banu Sebnem ÖNDER Hacettepe University, Faculty of Science
Department of Biology, Ankara 06800, Turkey Tel: 90-312-297-6291 E-mail: [email protected]
Abstract The effect of high temperature stress on mating success is investigated in three natural populations of Drosophila melanogaster from different geographical origins. In this experiment, the males of the control group were continuously kept at 25°C while the males of the second and third groups were kept at 36°C and 38.5°C respectively for 1 h before mating to evaluate the male mating success. One group of males exposed to short-term high thermal stress were immediately put into the vials to mate with females, while males of the second group were kept in the vials for a relaxation period for 1 h before mating. I found that mating success which was measured as the number of offsprings was higher in the group which was mated immediately after short-term high thermal stress. Also it is seen that the individuals exposed to 38.5oC were much more successful than the individuals which were kept at 25oC. There is also some variation between the populations of different origins as a respond to thermal stress. This results show us that genotype environment interaction is higher for male mating success and the relaxation period after short-term thermal stress has a negative effect on male mating success. Keywords: Heat-shock response, Male mating success, Relaxation period, Drosophila melanogaster1. Introduction Temperature is one of the most important environmental factors which have effects on some life history traits in ectotherms. It is well known that temperature is affecting many life history traits in Drosophila such as viability and reproduction (David, Allemand, Herrewege & Cohet, 1983). Many physiological changes occur as temperature rises (Feder, 1996). High-temperature stress affects organisms in a variety of ways, and therefore the variation underlying this tolerance should depend upon how tolerance to stress is measured (Bennett, 1987; Hoffmann, Dagher, Hercus & Berrigan 1997; Shine, Harlow, Elphick, Olsson & Mason, 2000; Sørensen, Dahlgaard & Loeschcke, 2001). Thermal stress, for example, can lead to shifts in the genetic and/or phenotypic correlations between life-history traits (Krebs & Loeschcke, 1999). Consequences to fitness after heat stress may progress from a decline in oviposition and fertility, reduction in body size, a failure to mate, the cessation of locomotion (knockdown) and increased mortality (Feder & Krebs, 1997; Fasolo & Krebs, 2004). In addition, there are some evidences that responds to high temperature stress vary among Drosophila melanogasternatural populations and this variation is probably the consequence of the populations being from different genetic backgrounds (Parsons, 1973). Surely, it can be said that mating success is one of the most important component of fitness when compared with the other fitness components (Fulker, 1966; Prout, 1971; Parsons, 1973). In addition, evidences that show the importance of mating success of males in wild Drosophila melanogaster populations are already exist (Anderson et al., 1979; Brittnacher, 1981). These results are also supported by other field examples from other groups of insects and vertebrates (Trivers, 1972; Parsons, 1997). In another study, Prout (1971) found that male mating success was much more important than female fecundity while comparing the fitness components in Drosophila melanogaster populations. For species using habitats which fluctuate in temperature, resistance to thermal extremes may be closely related to fitness (Krebs & Loeschcke, 1994a). How much genetic variation for temperature resistance is present in these
Vol. 1, No. 1 International Journal of Biology
46
populations is important with respect to any evolutionary responses associated with colonization of new environments (Hoffmann & Parsons, 1991). Possible mechanisms for variation in heat stress resistance are genetic variation in heat shock proteins, their regulation or in the thermal stability of structural and enzymatic proteins necessary for cell function (Morrison & Milkman, 1978; Martin, Horwich & Hartl, 1992). According to the results of the previous studies, very small quantity of induced heat shock proteins may affect life history traits such as development, stress resistance, life span and fecundity (Silbermann & Tatar 2000; Patton & Krebs, 2001; Sorensen et al., 2003; Sisodia & Singh, 2006;). The presence of genetic variation without pre-treatment, is best explained by variation for non-stress quantities of those proteins that are mass produced in the presence of a stress, or by differences in the activation temperatures for the rapid transcription of these proteins (Krebs & Loeschcke, 1994b). Beside, Bourg et al. (2001) studied the hsp70 protein expression exposed to 45-minutes long heat shock at 37°C. 0, 1, 2, 4, 6, 8 and 12 hours later they measured the expression consecutively. The results showed that hsp70 expression increased significantly 4 hours after the heat stress. It can thus be concluded that the time after heat shock is important for heat shock protein expression. In the scope of this study, I tested whether male mating success is affected under thermal stress conditions. I applied a comparative approach to assess why different populations of one species may vary in their response to different stress conditions. I chose high but non-lethal temperature regimes (36°C for 1 h and 38,5°C for 1 h) for this purpose. These temperature conditions are known to be very high and act as a stress source for D. melanogaster. In addition, flies mating immediately after heat shock and flies mating after a 1 h relaxation period in 25°C were compared to find out the effect of relaxation after heat shock. I asked four additional questions in this study using three natural populations of D. melanogaster, (1) Does mating success vary among populations? (2) Will mating success decrease as a consequence of inhibition of male mating ability after males are exposed to high temperatures? (3) How does relaxation period affect the organisms exposed to thermal stress?2. Material and methods The flies were collected between June-August 2002 at Ankara (39°57’S, 32°52’W), Giresun (40°55’S, 38°25’W) and Kerpe - Izmit (41°13’S, 30°20’W), Turkey. These sampling sites are almost similar in some climatic parameters important for Drosophila development and habitation, for example total yearly values of rainfall (Ryear), temperature (Tyear) and humidity (Hyear) (Table 1). Table 1 shows climatic data and sample size for the population. After sampling in wild, flies were brought to laboratory and the lines had been maintained in standard corn meal Drosophila medium (Bozcuk, 1978) at 25°C ±1°C, 60% R.H. in population cage culture. Table 1 Twenty pairs of flies were taken from each population and brown stock to be the parents of the experimental flies and were transferred to laying pots containing yeasted corn meal medium. After an acclimatory period of 24 h at 25°C the flies were transferred to fresh medium for a 2 h pre-lay period and then transferred again to fresh medium for 4 h at 25°C for egg collection. Eggs were collected 4 h after the midpoint of lay. Fifty eggs were placed in vials containing 7 mL medium, with five vials per natural population and ten vials for brown stock. Collection of unmated emerging flies from these vials was carried out by anesthesia with ether within 8 h of eclosion. 2.1 Measurement of male mating success The high thermal stress applied to unmated males from the natural populations exposure for 1 h in an incubator set to 36°C and 38,5°C. Mating success was compared among males in three natural population and in three treatment groups: 1- untreated (25°C); 2- treated at 36°C for 1 h; 3- treated at 38.5°C for 1 h. All groups are carrying out in two way; 1 – mating occurs behind a 1 h relaxation period, 2 – mating occurs with out a relaxation period after the thermal stress. Mating success analyses were performed using the same protocol of Reeve et al. (2000). At each temperature, for each population, 10 virgin brown females, three wild type males, and seven brown males were set up in each of 10 replicate vials, each containing 7 mL of food medium and active yeast. This design ensured that the wild type males competed mainly with brown males, rather than with each other. Two hours later, adult flies were removed from the vials. Because long mating period may prevent us to observe the putative effects of the relaxation period. The brown eye color recessive mutant marker stock used as a competitor stock. Crosses between wild type males (red eye) and males and females of brown mutant (brown eye) were conducted. To provide an estimate of male mating success for each population the phenotypes of progenies were recorded. In all crosses only the red eye phenotype numbers were counted from each vial after 15 days. Figure 1 summarizes the percentage of progeny for three populations, in all temperatures with and without relaxation period. Figure 1

International Journal of Biology January, 2009
47
2.2 Statistical analysis Univariate analysis of variance (ANOVA) provides an extremely powerful and useful tool for statistical tests of factors and their interactions in experiments (Underwood 1981, 1997). The ANOVA procedure is robust with respect to deviations from normality. The normality assumption was tested by Shapiro-Wilk test (p<0.05) and the assumption of heterogeneity of variances was tested by Levene’s test (p<0.05). These tests showed that the assumptions were not satisfied. The raw data on number of offspring was logarithmic transformed to ensure normality and homogeneity of variances before subjecting to statistical analysis. 3. Results The significance of the effect of temperature, population and relaxation period on the number of offspring was analyzed using a three-way analysis of variance (ANOVA), in which temperature (25°C, 36°C, 38.5°C), population (Giresun, Ankara, Kerpe) and relaxation period (1 – mating occurs after a 1 h relaxation period, 2 – mating occurs with out a relaxation period after the thermal stress), constituted the three factors in the analysis. When significant effects of temperature were established (F=27.411, df=2, p<0.05), differences among temperatures were tested using Dunnett’s test and also when significant effects of population were established (F=48.242, df=2, p<0.05), differences among populations were tested using Student-Newman-Keuls test. Dunnett’s test exposed that the temperature 36°C differed significantly from the control group whereas the temperature 38.5°C didn’t differ from the control group and Student-Newman-Keuls multiple comparison test exposed that all types of population differed from each other (p<0.05). Significant differences were found between the groups of relaxation period (F=10.711, df=1, p<0.05). The results of three-way analysis of variance (ANOVA) are presented in Table 2. Table 2 4. Discussion It is well known that Drosophila melanogaster shows numerous genetic differences between tropical and temperate populations (Trotta et al, 2006), but in my study there is not much temperature differences between collection sites of natural populations used in this experiment (Table 1). However, my results indicate some thermal stress response differences between populations although they are from similar temperature conditions. The common result for all populations is the negative effect of the relaxation period on mating success after thermal stress exposure. Besides, comparison of 38.5oC treatment with 36oC treatment shows us that offspring number increases generally at 38.5oC treatment with or without a relaxation period. This increase especially can be seen in Ankara population as a 5 fold increase of the control group (Fig. 1). Male mating success effects were also large to high heat stress (38.5°C), although offspring production of males that mated after a exposure of a lower heat stress (36°C) was in general not less than that of unstressed males. However, in a similar examined by Krebs and Loeschcke (1994a) exposure to a short-term thermal extreme, is not effected reproductive output of males, although survival rate decrease by high thermal exposure. Additionally, Nishinokubi et al. (2006) found that mating rates of wild type Drosophila melanogasteradults increased slightly under short term heat shock (37°C) in opposite to the unstressed flies. It is possible that an increase in temperature enhances the volatility of pheromones and therefore increases mating activity (Nishinokubi, Shimoda & Ishida, 2006). In contrast to my measures after exposed to a non-lethal high temperature at 38.5°C, it was found that the number of offspring of males exposed to 36°C were lower than the control or almost similar to the control. Indeed, heat shock exposures, nearly the lethal ranges have a positive effect of male mating success (Krebs & Loeschcke 1996). The objective of my study is to reveal the possible differences between the mating successes of groups had a relaxation period and those did not. However, some of the previous studies tested the temperature effect on life history traits immediately after the stress and the others test its effect after a relaxation period (Krebs & Loeschcke, 1994b; 1999; Patton & Krebs, 2001; Fasolo & Krebs, 2004; Krebs & Thompson, 2005; Nishinokubi et al., 2006; Sisodia & Singh, 2006). My data show that relaxation period had a negative effect of male mating success. Flies waited 1 h after the heat shock exposures were found to be unsuccessful when they were compared to the unstressed flies. However, the groups that mated immediately after the high thermal heat exposure - despite of Giresun population - were more successful in mating. Heat shock protein expressions in D. melanogaster are increase through time after the temperature exposure and peak at 4 hours after heat stress (Nishinokubi et al., 2006). But is unclear how heat shock protein expressions lead to effect life history traits. Besides, heat shock protein levels after the heat shock and after the relaxation period were not studied. Further studies should be focused on the effects of heat shock exposure time variying 0 to 12 hours to explain the possible effects of heat shock protein expression on fitness components. Global and local changes in climate are well documented (Permesan & Galbraith, 2004). With increases in either the mean temperature or its variance, populations will more likely become exposed to short-term thermal stress, and the
Vol. 1, No. 1 International Journal of Biology
48
amount of genetic variation present within a population for stress resistance may be an indicator of how that population will adapt. In conclusion, these three populations I examined showed different response to thermal stress. Thus, it gives me the idea that the different responses shown to environmental stresses may be related to the population’s genetic background. However, although I did not find any relationships between the general climatic values and mating success, micro climatic conditions where populations originated should be evaluated in relation to this fitness component. Acknowledgement The author thanks Banu Arvas, Sevil Cevik, Irem Matur and Ekim Taskiran for their excellent technical assistance, Nihal Ata and Murat Yilmaz for his comments of the manuscript and Dr. Ergi Deniz Özsoy for his comment until the experimental design. I thank the reviewers for their contributions to improvement of the manuscript. References Anderson, W.W., Levine, L., Olvera, O., Powell, J.R., de la Rosa, M.E., Salceda, V.M., Gaso, M.I., Guzmán, J. (1979). Evidence for selection by male mating success in natural populations of Drosophila pseudoobscura. Proc Natl Acad Sci U S A. Mar, 76(3), 1519–1523. Bennet, A.F. (1987). Interindividual variability: an underutilized resource. In Feder, M.E., Bennet, A.F., Burggren, W.W., Huey, R.B. (Eds.), New directions in ecological physiology (pp. 147-165). Cambridge: Cambridge University Press.Brittnacher, J. G. (1981). Genetic variation and genetic load due to the male reproductive component of fitness in Drosophila. Genetics 97, 719-730. Bourg, E.L., Valenti, P., Lucchetta, P., Payre, F. (2001). Effects of mild heat shocks at young age on aging and longevity in Drosophila melanogaster, Biogerontology, 2, 155-164. Bozcuk, A.N. (1978).The effects of some genotypes on longevity of adult Drosophila. Exp. Gerontology, 13, 279-286. David, J.R, Allemand, R., Van Herrewege, J. & Cohet, Y. (1983). Ecophysiologie: abiotic factors. In: M. Ashburner, H.L. Carson and J.N. Thompson, (Eds.) Genetics and biology of Drosophila (pp. 105-170) Academic Press, New York. Fasolo, A.G. & Krebs, R.A. (2004). A comparison of behavioural change in Drosophila during exposure to thermal stress, Biological Journal of the Linnean Society, 83, 197-205. Feder, M. E. (1996). Ecological and evolutionary physiology of stress proteins and the stress response: The Drosophila melanogaster model. In I. A. Johnston, A. F. Bennett (Eds.), Animals and tem- perature: Phenotypic and evolutionary adaptation (79-102). Cambridge University Press, Cambridge, U.K. Feder, M.E. & Krebs. R.A. (1997). Ecological and evolutionary physiology of heat-shock proteins and the stress response in Drosophila: complementary insights from genetic engineering and natural variation. In Bijlsma, R. & Loeschcke, V. (Eds.), Stress, Adaptation, and Evolution (pp. 155-173). Birkhuser Verlag, Basel. Fulker D.W. (1966). Mating speed in male Drosophila melanogaster: A psychogenetic analysis. Science 153, 203-205. Hoffmann, A.A. & Parsons, P.A. (1991). Evolutionary Genetics and Environmental Stress. Oxford Science Publications, Oxford. Hoffmann, A.A., Dagher, H., Hercus, M., Berrigan, D. (1997). Comparing different measures of heat resistance in selected lines of Drosophila melanogaster. Journal of Insect Physiology 43, 393–405. Krebs, R. A. & Loeschcke, V. (1994a). Costs and benefits of activation of the heat shock response in Drosophila melanogaster. Funct. Ecol. 8, 730–737. Krebs, R. A. & Loeschcke, V. (1994b). Effects of exposure to short-term heat stress on fitness components in Drosophila melanogaster. J. Evol. Biol. 7, 39–49. Krebs, R.A. & Loeschcke, V. (1996). Acclimation and Selection for increased resistance and acclimation to thermal stress in Drosophila buzzatii. Genetics 142, 471–479. Krebs, R. A. & Loeschcke, V. (1999). A genetic analysis of the relationship between life-history variation and heat-shock tolerance in Drosophila buzzatii. Heredity 83, 46-53. Krebs, R.A. & Thompson, K.A. (2005). A genetic analysis of variation for the ability to fly after exposure to thermal stress in Drosophila mojavensis, Journal of Thermal Biology 30, 335-342. Martin, J., Horwich, A.L., Hartl, F.U. (1992). Prevention of protein denaturation under heat stress by the Chaperonin Hsp60. Science, 58, 995-998.
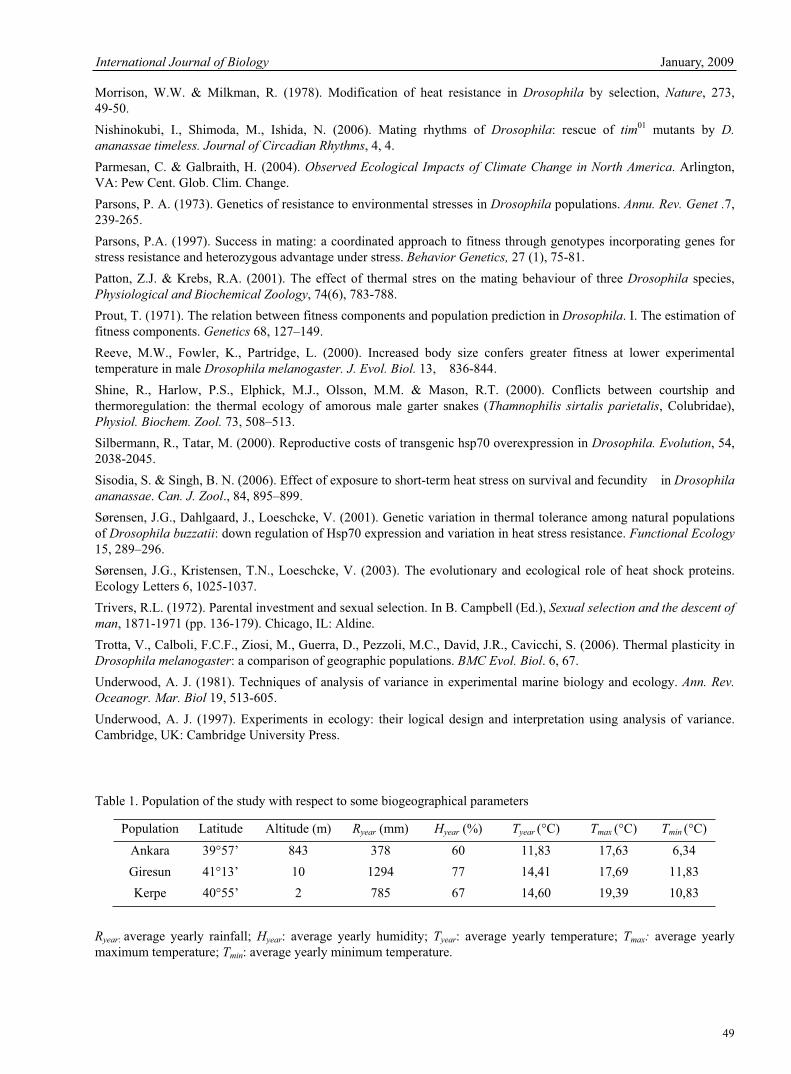
International Journal of Biology January, 2009
49
Morrison, W.W. & Milkman, R. (1978). Modification of heat resistance in Drosophila by selection, Nature, 273, 49-50. Nishinokubi, I., Shimoda, M., Ishida, N. (2006). Mating rhythms of Drosophila: rescue of tim01 mutants by D. ananassae timeless. Journal of Circadian Rhythms, 4, 4. Parmesan, C. & Galbraith, H. (2004). Observed Ecological Impacts of Climate Change in North America. Arlington, VA: Pew Cent. Glob. Clim. Change. Parsons, P. A. (1973). Genetics of resistance to environmental stresses in Drosophila populations. Annu. Rev. Genet .7, 239-265. Parsons, P.A. (1997). Success in mating: a coordinated approach to fitness through genotypes incorporating genes for stress resistance and heterozygous advantage under stress. Behavior Genetics, 27 (1), 75-81. Patton, Z.J. & Krebs, R.A. (2001). The effect of thermal stres on the mating behaviour of three Drosophila species, Physiological and Biochemical Zoology, 74(6), 783-788. Prout, T. (1971). The relation between fitness components and population prediction in Drosophila. I. The estimation of fitness components. Genetics 68, 127–149. Reeve, M.W., Fowler, K., Partridge, L. (2000). Increased body size confers greater fitness at lower experimental temperature in male Drosophila melanogaster. J. Evol. Biol. 13, 836-844. Shine, R., Harlow, P.S., Elphick, M.J., Olsson, M.M. & Mason, R.T. (2000). Conflicts between courtship and thermoregulation: the thermal ecology of amorous male garter snakes (Thamnophilis sirtalis parietalis, Colubridae), Physiol. Biochem. Zool. 73, 508–513. Silbermann, R., Tatar, M. (2000). Reproductive costs of transgenic hsp70 overexpression in Drosophila. Evolution, 54, 2038-2045. Sisodia, S. & Singh, B. N. (2006). Effect of exposure to short-term heat stress on survival and fecundity in Drosophila ananassae. Can. J. Zool., 84, 895–899. Sørensen, J.G., Dahlgaard, J., Loeschcke, V. (2001). Genetic variation in thermal tolerance among natural populations of Drosophila buzzatii: down regulation of Hsp70 expression and variation in heat stress resistance. Functional Ecology15, 289–296. Sørensen, J.G., Kristensen, T.N., Loeschcke, V. (2003). The evolutionary and ecological role of heat shock proteins. Ecology Letters 6, 1025-1037. Trivers, R.L. (1972). Parental investment and sexual selection. In B. Campbell (Ed.), Sexual selection and the descent of man, 1871-1971 (pp. 136-179). Chicago, IL: Aldine. Trotta, V., Calboli, F.C.F., Ziosi, M., Guerra, D., Pezzoli, M.C., David, J.R., Cavicchi, S. (2006). Thermal plasticity in Drosophila melanogaster: a comparison of geographic populations. BMC Evol. Biol. 6, 67. Underwood, A. J. (1981). Techniques of analysis of variance in experimental marine biology and ecology. Ann. Rev. Oceanogr. Mar. Biol 19, 513-605. Underwood, A. J. (1997). Experiments in ecology: their logical design and interpretation using analysis of variance. Cambridge, UK: Cambridge University Press.
Table 1. Population of the study with respect to some biogeographical parameters
Population Latitude Altitude (m) Ryear (mm) Hyear (%) Tyear (°C) Tmax (°C) Tmin (°C)
Ankara 39°57’ 843 378 60 11,83 17,63 6,34 Giresun 41°13’ 10 1294 77 14,41 17,69 11,83 Kerpe 40°55’ 2 785 67 14,60 19,39 10,83
Ryear: average yearly rainfall; Hyear: average yearly humidity; Tyear: average yearly temperature; Tmax: average yearly maximum temperature; Tmin: average yearly minimum temperature.
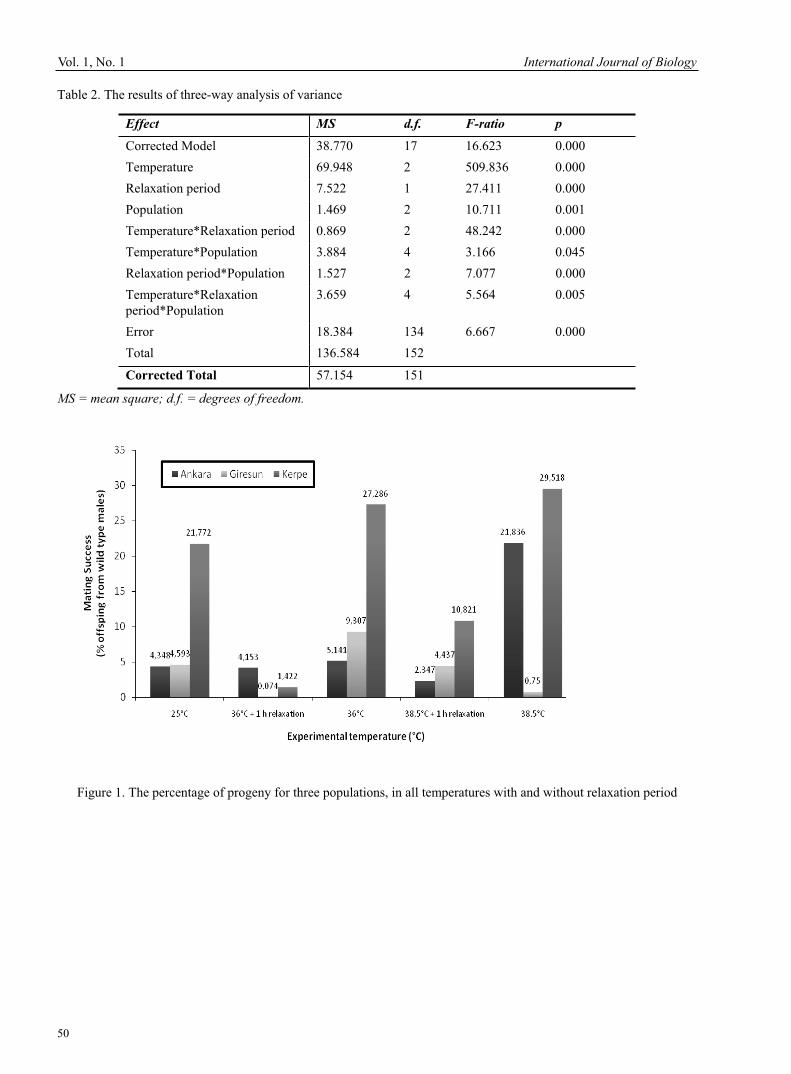
Vol. 1, No. 1 International Journal of Biology
50
Table 2. The results of three-way analysis of variance
Effect MS d.f. F-ratio p Corrected Model 38.770 17 16.623 0.000 Temperature 69.948 2 509.836 0.000 Relaxation period 7.522 1 27.411 0.000 Population 1.469 2 10.711 0.001 Temperature*Relaxation period 0.869 2 48.242 0.000 Temperature*Population 3.884 4 3.166 0.045 Relaxation period*Population 1.527 2 7.077 0.000 Temperature*Relaxation period*Population
3.659 4 5.564 0.005
Error 18.384 134 6.667 0.000 Total 136.584 152
Corrected Total 57.154 151
MS = mean square; d.f. = degrees of freedom.
Figure 1. The percentage of progeny for three populations, in all temperatures with and without relaxation period

International Journal of Biology January, 2009
51
Optimized Design of Acid Red B for Degradation by Corynebacterium
Hao Zhang (Corresponding author) College of Material and chemical, Tianjin Polytechnic University
Tianjin 300160, China E-mail: [email protected]
Zanmin Wu & Fang Dong College of Material and chemical, Tianjin Polytechnic University
Tianjin 300160, China
Limin Han Shanxi College of Education, Shanxi 710000, China
Abstract The optimized experimental parameters of degradation obtained with a four-factor at three-level orthogonal array experimental design L18(36) were temperature, rotation speed, inoculum size and liquid level by Corynebacterium variabile in the shaking bottle as 33 , 22h after shaking at the same temperature and 120 rpm for 14h, 4%, 80mL in 150mL triangle bottle, respectively. Among four factors, liquid level is paramount.
Keywords: Corynebacterium variabile, Acid Red B, Orthogonal design
1. Introduction Azo dyes, as the mainly dyeing material in the world (Yuzhu, 2001,PP.251-262), are ofren used in the colouring process of several textiles, dyestuff and paper-making products. Relatively recently it has been recognised that some azo dyes agents may bring a large amount of waste water, which flow abroad in aqueous solutions. The researches in the field have led to laboratory demonstration of the applicability of technique, and to industrial pilot plant and full-scale established technologies for treating effluents of dying factories. Dye wastewater is usually treated by physical- or chemical-treatment processes such as flocculation, absorption and electrolysis etc, by most factories in China, nevertheless, both physical and chemical methods have their shortcomings which incurs less decolorization, more electric power and thus high operating expenses. In recent years, there have been an intensive research focused on the degradation of dyes by microorganism in the world(Ping,2002, P.59,Wenwen, 2008, PP.120-123, Xinjiao, 1999, PP.220-224, Chunlong, 1998, PP.41-58, Long,2007). In aerobic or anaerobic condition, azo dyes were likely degradated to low molecular aromatic structures which could be further used. The reaction rate of degradation was usually quite slow, and thus promotion of the reaction could be helpful to the application of these techniques. In the present paper, Corynebacterium variabile, as a microbial agent, was undertaken to investigate the degradation effect in Acid Red B and the experimental parameters of degradation were also optimized. Hence data obtained from these experiments would give some novelty in the application of dye degradation by this fungus.
2 Materials and methods 2.1 Fungus Microorganism used in this study was separated and purified from sullage sample of printworks effluent contaminated sites in Wuqing District, Tianjin with a good effect of dye degradation, and was identified and named as Corynebacterium variabile, briefed as fungus B.
Vol. 1, No. 1 International Journal of Biology
52
2.2 Medium Domesticated medium: Beef grease 3g, Peptone 10g, Acid Red B 0.04g, pH 7.2, sterilized for 30 min under 0.10Mpa. Inorganic medium: NaH2PO4 ·2H2O 0.5g, MgSO4·7H2O 0.2g, K2HPO4 0.5g, (NH4)2SO4 2g, CaCl2 0.1g, Glucose 10g, Acid Red B0.04g, Distilled water 1000ml. Acid Red B powder was commercially available dye used without further purification. The maximum absorption wavelength was 515 nm in UV–vis measurements. 2.3 Culture condition confirmation 14 150ml taper flask was arranged for seven groups, each group 2 in order to compare. Every flask was filled with 50ml inorganic medium, sterilized for 20min under 0.05Mpa and then was added with fungus B. After that, the first group was incubated at 33 and the other six were incubated in the shaking bottle at the speed of 120r/min at 33 for 12 h, then every 2h, one group was transferred to incubator until decolorization. 2.4 Culture method 150ml taper flasks were filled with different dose inorganic medium respectively. Based on orthogonal array experimental design, flasks added with fungus B was incubated at the optimal condition for 36h. 2.5 Orthogonal design To obtain the optimised experimental parameters, a four-factor at three-level orthogonal array experimental design L18(36) was adopted by Orthogonal Design Assistant and the absorbance of degradation in each test were measured. The four factors were temperature, rotation speed, inoculum size and liquid level. Based on the experimental results of the previous orthogonal design and ANOVA analysis, the optimal ranges for each factor and their degradation effection could be obtained, and speculated the optimal conditions for fungus B in the degradation of Acid Red B. The factors studied and the assignments of the corresponding levels are listed in Table 1. 2.6 Measurement The fungus solution incubated till decolorization was centrifuged to remove cells, and supernate was undertaken to determine the absorbance of Acid Red B before or after degradation by UV-vis measurements (spectrophotometer 731, China). Decolorization rate was defined as follows:
%1000
0
AAA
q t
Where Ao is the initial absorbance combined with fungus B and At is the absorbance after incubated for 36h. 3. Results and discussions 3.1 Incubating condition As seen in Table 2, efficiencyies of decolorization was not good when fungus was incubated always in incubator or shaking apparatus, however, when incubated first in shaking apparatus for some time, then transferred to incubator was all good. At a time ratio of 14:22 (shaking /quiescence ), efficiency of decolorization was the highest and was not increased by adding the time in shaking apparatus, but decreased inversely. Therefore, time ratio of 14:22 (shaking /quiescence ) was the optimal condition for growth of fungus and degradation of Acid Red B. 3.2 Effect of Acid Red B degradation by fungus B in different conditions According to Orthogonal Design Assistant, 18 tests were performed. The analytical results are listed in Table 3. The average of the decolorization rate in each test were calculated. The values of |kmax-kmin| and F in Table 3 and 4 indicate the effect of temperature, rotation speed, inoculum size and liquid level. The efficiency of these four factors were classified in the order of liquid level (D)>inoculun size(C)>temperature(A)>rotation speed(B). Thus, liquid level was the major factor affecting the decolorization rate, whilst inoculun size, temperature and rotation speed had a less obvious influence. More attention should be paid to liquid level and inoculun size two factors in the experiment. As seen in Figure 1, in order to obtain the maximum decolorization rate, temperature, rotation speed, inoculum size and liquid level were chosen as 33 , 120r/min, 6%and 80mL, respectively, namely A2B2C3D3.3.3 Validated experiment According to the orthogonal design results, the optimized parameters of decorlorization were undertaken to validate the effect of acid red B degradation by fungus B. With three replicates, results were listed in the Table 5.As seen from Table 5, results were conformed to Table 4 and Figure 1 and the average decolorization rate was 95.4% under the optimized condition where temperature, rotation speed, inoculum size and liquid level were chosen as 33 , 120r/min, 6%and 80mL, respectively. Decolorization rate was high and repeatable, which showed that the optimized condition was reasonable.

International Journal of Biology January, 2009
53
4. Conclusions Fungus B separated from sullage has strong degradation activity of dyes. Through orthogonal design, degradation condition of acid red B by fungus B was optimized. Results showed that at a time ratio of 14:22 (shaking /quiescence), degradation efficiency of acid red B was best, and the decolorization was 94.6%;In this way, the optimized incubating parameters of temperature, rotation speed, inoculum size and liquid level were 33 , 120r/min, 6%and 80mL, respectively, whilst the decolorization rate was above 95%. References Dong, Xinjiao, Wu, Chu & Lin, Xianfen, et al. (1999). Isolation of decolorizing bacteria group and its decolorization of red azo dyes. Jiangxi Science, 17(4):220~224. Fu, Yuzhu, & Viraraghanvan, T. (2001). Fungal decolorization of dye wastewaters: a review. Bioresource Technology,79:251~262. Zhang, Chunlong, Valsaraj, K.T., et al.(1998). Nutrient and surfactant enhancement for the biodegradation of chlorinated hydrocarbons in the wastewater from a Louisiana Superfund site. Journal of Hazardous Material, 62:41 58. Zhang, Long. (2007). Enhanced biological decolourzation of azo dyes by products reduced from acid azo dye. Dissertation for the master degree in Dalian science and technology University.Zheng, Ping. (2002). Environmental microbiology. Hangzhou:Zhejiang University press, 59. Zhong, Wenwen. (2008). Screening of bioflocculant-producing strains and study on optimization of their cultural conditions. Acta Agriculturae Boreali-Occidentalis Sinica, 17(1):120~123.
Table 1. Assignments of the levels to factors in orthogonal design
Level Factors
ATemperature ( )
BRotating speed (r/min)
CInoculation size (%)
DLiquid level (mL)
1 28 90 2 20 2 33 120 4 50 3 38 150 6 80
Table 2. Effect of the time ratio of shaking to resting
Time ratio of shaking to quiescence
0:36 12:24 14:22 16:20 20:16 24:12 36:0
Decolorization rate(%) 32.6 92.6 94.6 93.4 91.7 70.7 46.9
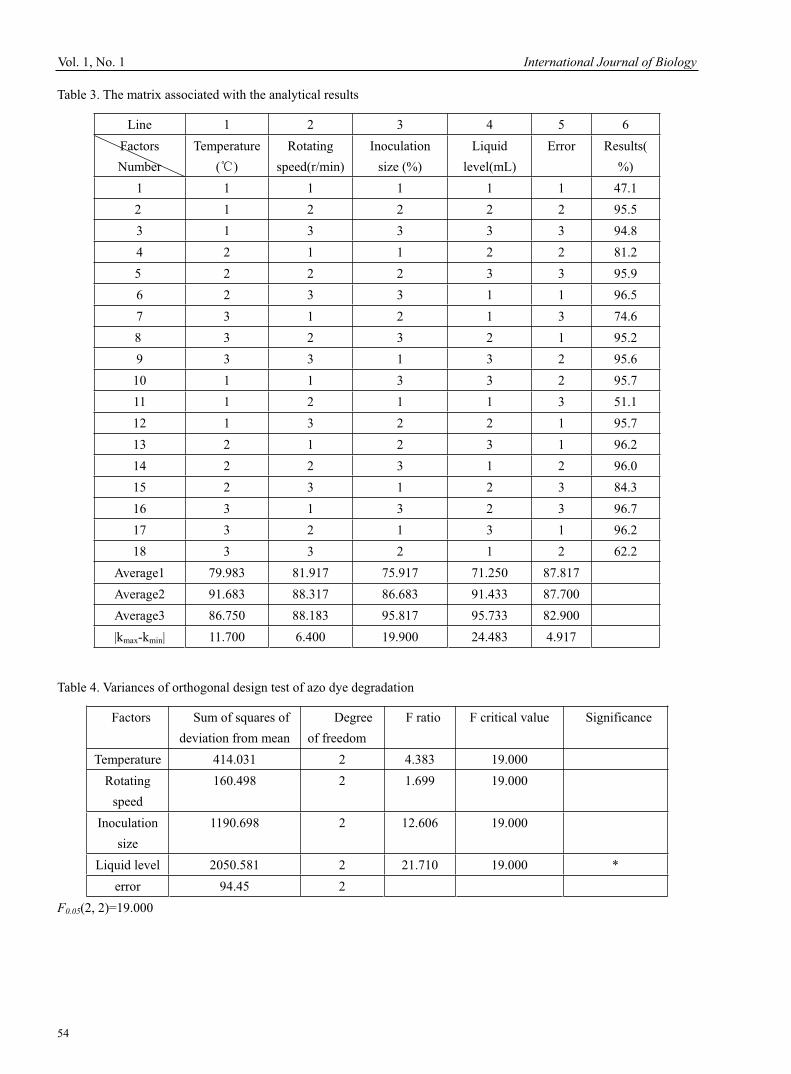
Vol. 1, No. 1 International Journal of Biology
54
Table 3. The matrix associated with the analytical results
Line 1 2 3 4 5 6 Factors Number
Temperature ( )
Rotating speed(r/min)
Inoculation size (%)
Liquid level(mL)
Error Results(%)
1 1 1 1 1 1 47.1 2 1 2 2 2 2 95.5 3 1 3 3 3 3 94.8 4 2 1 1 2 2 81.2 5 2 2 2 3 3 95.9 6 2 3 3 1 1 96.5 7 3 1 2 1 3 74.6 8 3 2 3 2 1 95.2 9 3 3 1 3 2 95.6
10 1 1 3 3 2 95.7 11 1 2 1 1 3 51.1 12 1 3 2 2 1 95.7 13 2 1 2 3 1 96.2 14 2 2 3 1 2 96.0 15 2 3 1 2 3 84.3 16 3 1 3 2 3 96.7 17 3 2 1 3 1 96.2 18 3 3 2 1 2 62.2
Average1 79.983 81.917 75.917 71.250 87.817 Average2 91.683 88.317 86.683 91.433 87.700 Average3 86.750 88.183 95.817 95.733 82.900 |kmax-kmin| 11.700 6.400 19.900 24.483 4.917
Table 4. Variances of orthogonal design test of azo dye degradation
Factors Sum of squares of deviation from mean
Degree of freedom
F ratio F critical value Significance
Temperature 414.031 2 4.383 19.000 Rotating
speed 160.498 2 1.699 19.000
Inoculation size
1190.698 2 12.606 19.000
Liquid level 2050.581 2 21.710 19.000 * error 94.45 2
F0.05(2, 2)=19.000
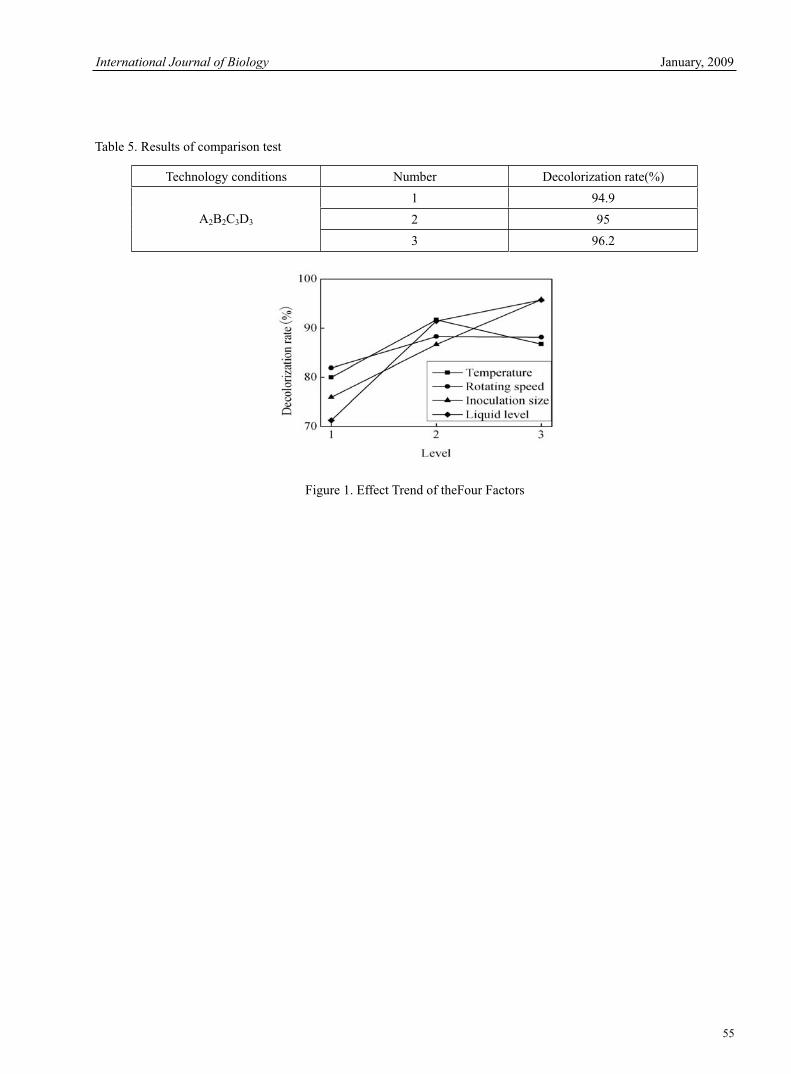
International Journal of Biology January, 2009
55
Table 5. Results of comparison test
Technology conditions Number Decolorization rate(%)
A2B2C3D3
1 94.9 2 95 3 96.2
Figure 1. Effect Trend of theFour Factors
Vol. 1, No. 1 International Journal of Biology
56
Outbreak of Egg Drop Syndrome in Bangladesh
Jahangir Alam (Corresponding author) Animal Health Research Division
Bangladesh Livestock Research Institute, Savar, Dhaka, 1341. Bangladesh E-mail: [email protected]
Md. Al-Mamun Animal Health Research Division
Bangladesh Livestock Research Institute, Savar, Dhaka, 1341. Bangladesh E-mail: [email protected]
Mohammed Abdus Samad Animal Health Research Division
Bangladesh Livestock Research Institute, Savar, Dhaka, 1341. Bangladesh E-mail: [email protected]
Mohammed Rahamat Ullah Nestle Bangladesh Limited, Sreepur, Gazipur, Bangladesh
E-mail: [email protected]
Md. Giasuddin Animal Health Research Division
Bangladesh Livestock Research Institute, Savar, Dhaka, 1341. Bangladesh E-mail: [email protected]
M. J. F. A. Taimur Animal Health Research Division
Bangladesh Livestock Research Institute Savar, Dhaka,1341. Bangladesh
Abstract An incident alike to egg-drop syndrome (EDS) occurred in commercial egg laying chickens in Gazipur district, Bangladesh from July to November 2005. The chickens showed decreased egg production along with production of shell less and soft shelled eggs when they were at predicted peak production age. Nutritional status, especially crude protein (16.65-18.50%) and calcium (2.15-3.62%) content of the supplied feed was within the range. Virological and serological investigations on causes of decreased egg production and production of soft-shelled and shell less egg by the laying hens revealed that the responsible causative agent is EDS virus. Total seven EDS viruses were isolated from cloacal swab (4), soft-shelled eggs (2) and feces (1). The isolation rate 71.43% (5/7) was higher in second passage than in first passage 28.57% (2/7) in duck embryos. None of the 7 viruses grew in chicken embryo even after second passage. All five flocks tested, were vaccinated against infectious bronchitis and Newcastle disease along with other common
International Journal of Biology January, 2009
57
vaccines generally used in Bangladesh but not against EDS. Serological investigation revealed that birds in all tested farms (100%) had antibody against EDS virus (in 2 farms in 100% samples and in 3 farms in 80% samples). The source of the virus remained to be determined. To the best of our knowledge, this is the first report of EDS outbreak in Bangladesh. To save poultry industry in Bangladesh from harm of this disease the biosecurity measures should be strictly followed along with vaccination against the disease. Keywords: Soft shell egg, Reduced egg production, Laying chicken, Bangladesh 1. Introduction A syndrome causing lower egg production associated with the laying of soft-shelled and shell less egg was first described in the Netherlands in 1976 and reported that the possible causative agent of the syndrome was fowl adenovirus (Van Eck et al., 1976). Later, several haemagglutinating adenoviruses were isolated by McFerran et al.,(1978) from affected hens in Northern Ireland and the correlation between the syndrome and the isolate was demonstrated (McFerrin et al., 1977; McCraken et al., 1978). The disease now called egg drop syndrome (EDS) caused by EDS virus is the foremost cause of loss of egg production in laying hens throughout the world. The most common feature of the disease is production of shell less or thin-shelled eggs by apparently healthy birds. The disease is cosmopolitan in distribution and virus was isolated from France, Great Britain, Belgium, Israel, Australia, Japan, Hungary, Singapore, Taiwan, South Africa, India and China, (Picault, 1978; Baxendale, 1978; Meulemans et al., 1979; Malkinson, & Weisman, 1980; Firth et al., 1981; Yamaguchi et al., 1981; Zsak et al., 1981; Singh & Chew-Lim, 1981; Lu, et al., 1985b; Bragg, et al., 1991; Kumar et al., 1992; Zhu & Wang, 1994). Antibody to the virus was demonstrated from chickens of Denmark, Brazil, Mexico, Nigeria and New Zealand (Badstue & Smidt, 1978; Hwang et al., 1980; Rosales et al., 1980; Nawathe et al., 1980; Howell, 1982). In the last two decades the poultry industry has grown from a handful of medium sized operations to a large industry in Bangladesh. Poultry farms having sizes ranging from a few hundred birds to several hundred thousand birds are mushrooming throughout the country. Side by side small-scale family poultry system (backyard poultry) is also one of the most important income-generating source for rural women, landless poor and marginal farmers. In 1997-98 the small-scale family poultry system in Bangladesh has been estimated to account for about 80% of the total poultrypopulation (Huque, 1999).Different infectious and non-infectious diseases have been affecting both native and high performing commercial poultry across the country (Giasuddin et al., 2002) round the year. From July to November 2005, many farmers from Gazipur district reported that their birds have been laying shell less and soft-shelled eggs along with dropped egg production. Farm owners supplied extraneous vitamins like vit. AD3E, B complex and minerals viz. calcium phosphorus preparation, oyster shell, dicalcium phosphate etc. to chickens but hens did not get improvement. Present report deals with the virological and serological investigation of the etiologic agent (s) responsible for the aforesaid problems. 2. Materials and Methods 2.1 Farmer’s interview and sample collection Farmer’s interview was taken using a set of preformed questioner. Information regarding age, breed, population, origin or source of chick, age of occurrence of dilemma, duration of occurrence, feed used to fed, affect on bird or on egg production, measures already taken (medication and extra feed ingredients supplementation), vaccination and recovery status, etc. were collected. During investigation the following infectious diseases viz. Newcastle disease (ND), infectious bronchitis (IB), egg drop syndrome (EDS) and noninfectious cases viz. nutritional deficiency were considered and indispensable information and samples were collected. A total of five farms from four villages under Sadar upazilla of Gazipur district were visited to collect information and samples. After collection the samples were soon transferred to Poultry Disease Diagnosis Laboratory, Bangladesh Livestock Research Institute (BLRI), Savar, Dhaka, Bangladesh, about 30 km far from sampling area, maintaining appropriate measures. A total of 90 different samples from 5 different farms were collected that includes cloacal swab (n= 25, 5 samples from each farm), environmental sample that is feces from floor (n= 25, 5 samples from each farm), thin-shelled eggs (n= 10, 2 samples from each farm), blood (n= 25, 5 samples from each farm), and feed (n= 5, 1 samples from each farm). Collected samples were processed and tested for above-mentioned infectious and non-infectious cases. Feed samples were used for analysis of crude protein (CP) and calcium (Ca) content. Serological tests were done with sera separated from blood samples. Cloacal swabs, feces and egg samples were processed and used for virus isolation and identification. 2.2 Inocula preparation and embryo inoculation Soon after collection cloacal swabs were put in to a tube having 1.0 ml of transport buffer which contains penicillin 100 units/ml, streptomycin 100 μg/ml, gentamycin 50 μg/ml, amphotericin B 0.5 μg/ml in phosphate buffered saline (PBS pH 7.2) and stored at 40C overnight to facilitate antimicrobial activity. After vortex the samples were centrifuged in refrigerated centrifuge machine at 10,000 g for 5 minutes and supernatant was collected and used as inoculum. On the

Vol. 1, No. 1 International Journal of Biology
58
other hand 25% suspension of feces and egg samples were made with antibiotic solution in PBS and the inocula were prepared as mentioned above. Specific pathogen free eggs (SPF) were obtained from a research farm of BLRI. All the virological samples were inoculated in SPF embryonated chicken and duck eggs (White Leg Horn incase of chicken and Khaki Campbell incase of duck) through allantoic cavity route for Newcastle disease virus (NDV) and EDS virus and chorioallantoic membrane route for infectious bronchitis virus (IBV) according to the method described (Alexander, 2003; McFerrin etal., 2003; Cavanagh & Naqi, 2003). Age of inoculated embryo was 9-11 days. Each egg was inoculated with 0.2 ml of inoculum and for each inoculum 5 eggs were used. PBS was inoculated in 5 eggs as negative control. The eggs were incubated at 37°c for 5 days and checked twice daily for livability. Death of embryos within 24 hours was considered as accidental. The eggs were chilled soon after found dead or upon incubation period. 2.3 Haemagglutination (HA) test The HA test was carried out by the conventional microtiter method using 0.5% chicken red blood cell (RBC) suspension. The highest dilution showing complete agglutination was taken as the virus titer. 2.4 Haemagglutination inhibition (HI) Test ( -method) To identify and differentiate the haemagglutinating virus/es present in the allantoic fluid, HI test was conducted using NDV and EDS virus specific antisera. Japan International Co-operation Agency (JICA) provides specific antisera of NDV and EDS virus. HI test was conducted by the conventional microtiter method (alpha method) for virus (antigen) detection. Briefly, two fold serial dilution of 25μl HA positive allantoic fluid was made with PBS in U bottom microtiter plate (Nunc). Pretitrated 25μl antiserum/well either for NDV or EDS virus was added and allowed to stand at room temperature for 60 minutes to facilitate antigen antibody reaction. About 50μl of 0.5% chicken red blood cell (RBC) suspension was added into each well and again allowed to stand at room temperature for 40 minutes. The result was observed without any aids. 2.5 Antibody Titration Serum was separated from collected blood samples. To clarify, the serum was centrifuged at 800 x g for 10 minutes and used in serological tests. HI test was employed for NDV antibody detection whereas enzyme linked immunosrobant assay (ELISA) was performed for IBV and EDS virus antibody titration. 2.5.1 Haemagglutination inhibition (HI) Test ( -method) The test was done as described in the chapter on Newcastle Disease in the world Organization for Animal Health (OIE) Manual for Diagnostic Tests and Vaccines for Terrestrial Animals, Chapter 2.1.15 [http://www.oie.int/eng/normes/mmanual/A_00038.htm entered on 4 June 2008] using 4 haemagglutinating units of antigen. Highest dilution of serum causing complete inhibition of 4 HA unit of antigen is considered as HI titer of the serum. The validity of results was assessed against a negative and a positive control serum along with back titration of antigen used in HI test. HI titer is considered as positive if there is inhibition at a serum dilution of 1/8 (23 or log2 3 when expressed as the reciprocal). 2.5.2 Enzyme linked immunosorbant assay (ELISA) ELISA kits (FlockChek Infectious Bronchitis Virus Antibody Test Kit, IDEXX, USA) and BioCheck Egg Drop Syndrome Antibody Test Kit, BioCheck B. V. Holland) were obtained and ELISA procedures were followed (manufacturer instruction). ELISA plate was read using an ELISA plate reader (BIORAD-550, California, USA). 2.6 Feed analysis Feed analysis was done by Poultry feed analysis laboratory of BLRI following standard protocol. 3. Results 3.1 Outbreak information, egg production loss and feed analysis Since July 2005, egg laying chickens started to lay abnormal shaped, thin-shelled, and shell less eggs along with lower egg production in many layer farms of Gazipur district in Bangladesh. The chickens were quiet healthy apparently and showed no other clinical symptoms. The feed consumption, water intake, plumage color, comb, etc were normal. The authors visited five farms of four villages of Sadar Upazila of Gazipur district and gathered information and relevant clinical samples for laboratory analysis. Information collected through interview is presented in Table 1. All 5 farmers rear chicken in the cage and have been facing this problem for last 2-3 weeks. Soon after start of laying shell less, soft-shelled, misshapen eggs, the farmers applied i) medicine like Gentamycin, Oxytetracycline (Renamycin, Bactitab) and other sulfur drugs ii) feed ingredients like, calcium-phosphorus premixes, oyster shell, dicalcium phosphate (DCP), calcium carbonate, soybean oil and iii) Vitamin B complex and AD3E preparation. No effect has been observed either on egg production or in reduces production of shell less and soft-shelled eggs. The egg production reduces
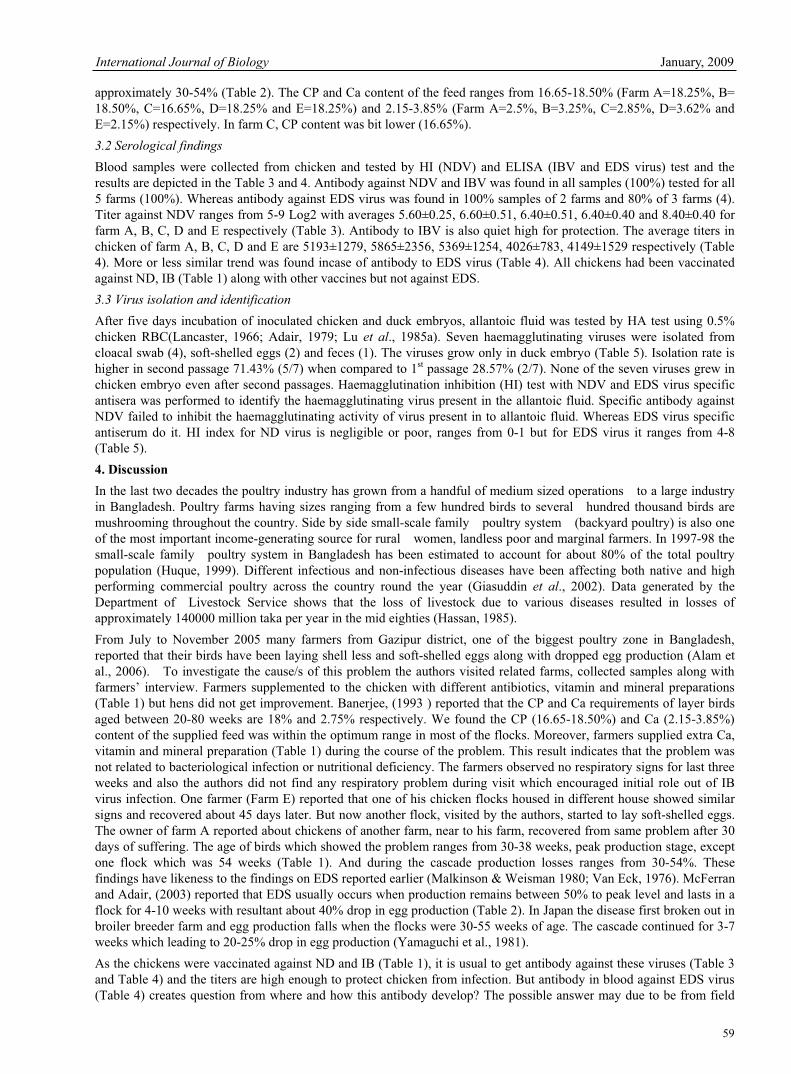
International Journal of Biology January, 2009
59
approximately 30-54% (Table 2). The CP and Ca content of the feed ranges from 16.65-18.50% (Farm A=18.25%, B= 18.50%, C=16.65%, D=18.25% and E=18.25%) and 2.15-3.85% (Farm A=2.5%, B=3.25%, C=2.85%, D=3.62% and E=2.15%) respectively. In farm C, CP content was bit lower (16.65%). 3.2 Serological findings Blood samples were collected from chicken and tested by HI (NDV) and ELISA (IBV and EDS virus) test and the results are depicted in the Table 3 and 4. Antibody against NDV and IBV was found in all samples (100%) tested for all 5 farms (100%). Whereas antibody against EDS virus was found in 100% samples of 2 farms and 80% of 3 farms (4). Titer against NDV ranges from 5-9 Log2 with averages 5.60±0.25, 6.60±0.51, 6.40±0.51, 6.40±0.40 and 8.40±0.40 for farm A, B, C, D and E respectively (Table 3). Antibody to IBV is also quiet high for protection. The average titers in chicken of farm A, B, C, D and E are 5193±1279, 5865±2356, 5369±1254, 4026±783, 4149±1529 respectively (Table 4). More or less similar trend was found incase of antibody to EDS virus (Table 4). All chickens had been vaccinated against ND, IB (Table 1) along with other vaccines but not against EDS. 3.3 Virus isolation and identification After five days incubation of inoculated chicken and duck embryos, allantoic fluid was tested by HA test using 0.5% chicken RBC(Lancaster, 1966; Adair, 1979; Lu et al., 1985a). Seven haemagglutinating viruses were isolated from cloacal swab (4), soft-shelled eggs (2) and feces (1). The viruses grow only in duck embryo (Table 5). Isolation rate is higher in second passage 71.43% (5/7) when compared to 1st passage 28.57% (2/7). None of the seven viruses grew in chicken embryo even after second passages. Haemagglutination inhibition (HI) test with NDV and EDS virus specific antisera was performed to identify the haemagglutinating virus present in the allantoic fluid. Specific antibody against NDV failed to inhibit the haemagglutinating activity of virus present in to allantoic fluid. Whereas EDS virus specific antiserum do it. HI index for ND virus is negligible or poor, ranges from 0-1 but for EDS virus it ranges from 4-8 (Table 5). 4. DiscussionIn the last two decades the poultry industry has grown from a handful of medium sized operations to a large industry in Bangladesh. Poultry farms having sizes ranging from a few hundred birds to several hundred thousand birds are mushrooming throughout the country. Side by side small-scale family poultry system (backyard poultry) is also one of the most important income-generating source for rural women, landless poor and marginal farmers. In 1997-98 the small-scale family poultry system in Bangladesh has been estimated to account for about 80% of the total poultrypopulation (Huque, 1999). Different infectious and non-infectious diseases have been affecting both native and high performing commercial poultry across the country round the year (Giasuddin et al., 2002). Data generated by the Department of Livestock Service shows that the loss of livestock due to various diseases resulted in losses ofapproximately 140000 million taka per year in the mid eighties (Hassan, 1985). From July to November 2005 many farmers from Gazipur district, one of the biggest poultry zone in Bangladesh, reported that their birds have been laying shell less and soft-shelled eggs along with dropped egg production (Alam et al., 2006). To investigate the cause/s of this problem the authors visited related farms, collected samples along with farmers’ interview. Farmers supplemented to the chicken with different antibiotics, vitamin and mineral preparations (Table 1) but hens did not get improvement. Banerjee, (1993 ) reported that the CP and Ca requirements of layer birds aged between 20-80 weeks are 18% and 2.75% respectively. We found the CP (16.65-18.50%) and Ca (2.15-3.85%) content of the supplied feed was within the optimum range in most of the flocks. Moreover, farmers supplied extra Ca, vitamin and mineral preparation (Table 1) during the course of the problem. This result indicates that the problem was not related to bacteriological infection or nutritional deficiency. The farmers observed no respiratory signs for last three weeks and also the authors did not find any respiratory problem during visit which encouraged initial role out of IB virus infection. One farmer (Farm E) reported that one of his chicken flocks housed in different house showed similar signs and recovered about 45 days later. But now another flock, visited by the authors, started to lay soft-shelled eggs. The owner of farm A reported about chickens of another farm, near to his farm, recovered from same problem after 30 days of suffering. The age of birds which showed the problem ranges from 30-38 weeks, peak production stage, except one flock which was 54 weeks (Table 1). And during the cascade production losses ranges from 30-54%. These findings have likeness to the findings on EDS reported earlier (Malkinson & Weisman 1980; Van Eck, 1976). McFerran and Adair, (2003) reported that EDS usually occurs when production remains between 50% to peak level and lasts in a flock for 4-10 weeks with resultant about 40% drop in egg production (Table 2). In Japan the disease first broken out in broiler breeder farm and egg production falls when the flocks were 30-55 weeks of age. The cascade continued for 3-7 weeks which leading to 20-25% drop in egg production (Yamaguchi et al., 1981). As the chickens were vaccinated against ND and IB (Table 1), it is usual to get antibody against these viruses (Table 3 and Table 4) and the titers are high enough to protect chicken from infection. But antibody in blood against EDS virus (Table 4) creates question from where and how this antibody develop? The possible answer may due to be from field
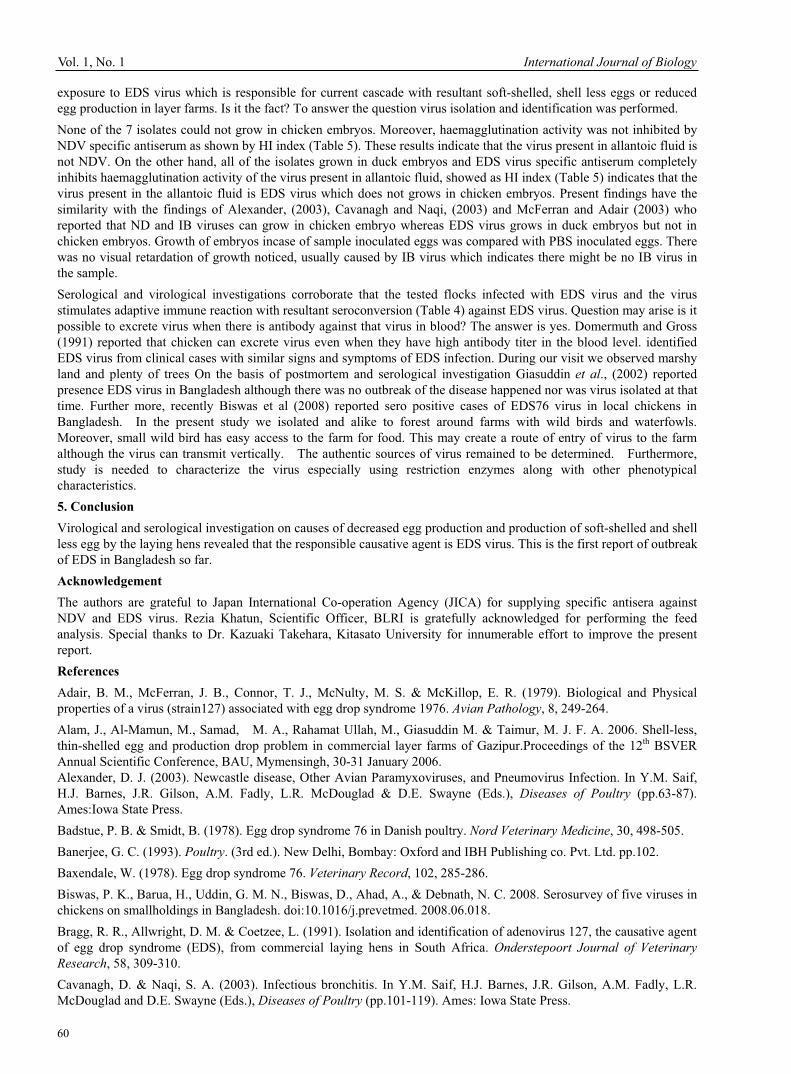
Vol. 1, No. 1 International Journal of Biology
60
exposure to EDS virus which is responsible for current cascade with resultant soft-shelled, shell less eggs or reduced egg production in layer farms. Is it the fact? To answer the question virus isolation and identification was performed. None of the 7 isolates could not grow in chicken embryos. Moreover, haemagglutination activity was not inhibited by NDV specific antiserum as shown by HI index (Table 5). These results indicate that the virus present in allantoic fluid is not NDV. On the other hand, all of the isolates grown in duck embryos and EDS virus specific antiserum completely inhibits haemagglutination activity of the virus present in allantoic fluid, showed as HI index (Table 5) indicates that the virus present in the allantoic fluid is EDS virus which does not grows in chicken embryos. Present findings have the similarity with the findings of Alexander, (2003), Cavanagh and Naqi, (2003) and McFerran and Adair (2003) who reported that ND and IB viruses can grow in chicken embryo whereas EDS virus grows in duck embryos but not in chicken embryos. Growth of embryos incase of sample inoculated eggs was compared with PBS inoculated eggs. There was no visual retardation of growth noticed, usually caused by IB virus which indicates there might be no IB virus in the sample. Serological and virological investigations corroborate that the tested flocks infected with EDS virus and the virus stimulates adaptive immune reaction with resultant seroconversion (Table 4) against EDS virus. Question may arise is it possible to excrete virus when there is antibody against that virus in blood? The answer is yes. Domermuth and Gross (1991) reported that chicken can excrete virus even when they have high antibody titer in the blood level. identified EDS virus from clinical cases with similar signs and symptoms of EDS infection. During our visit we observed marshy land and plenty of trees On the basis of postmortem and serological investigation Giasuddin et al., (2002) reported presence EDS virus in Bangladesh although there was no outbreak of the disease happened nor was virus isolated at that time. Further more, recently Biswas et al (2008) reported sero positive cases of EDS76 virus in local chickens in Bangladesh. In the present study we isolated and alike to forest around farms with wild birds and waterfowls. Moreover, small wild bird has easy access to the farm for food. This may create a route of entry of virus to the farm although the virus can transmit vertically. The authentic sources of virus remained to be determined. Furthermore, study is needed to characterize the virus especially using restriction enzymes along with other phenotypical characteristics. 5. Conclusion Virological and serological investigation on causes of decreased egg production and production of soft-shelled and shell less egg by the laying hens revealed that the responsible causative agent is EDS virus. This is the first report of outbreak of EDS in Bangladesh so far. Acknowledgement The authors are grateful to Japan International Co-operation Agency (JICA) for supplying specific antisera against NDV and EDS virus. Rezia Khatun, Scientific Officer, BLRI is gratefully acknowledged for performing the feed analysis. Special thanks to Dr. Kazuaki Takehara, Kitasato University for innumerable effort to improve the present report. References Adair, B. M., McFerran, J. B., Connor, T. J., McNulty, M. S. & McKillop, E. R. (1979). Biological and Physical properties of a virus (strain127) associated with egg drop syndrome 1976. Avian Pathology, 8, 249-264. Alam, J., Al-Mamun, M., Samad, M. A., Rahamat Ullah, M., Giasuddin M. & Taimur, M. J. F. A. 2006. Shell-less, thin-shelled egg and production drop problem in commercial layer farms of Gazipur.Proceedings of the 12th BSVER Annual Scientific Conference, BAU, Mymensingh, 30-31 January 2006. Alexander, D. J. (2003). Newcastle disease, Other Avian Paramyxoviruses, and Pneumovirus Infection. In Y.M. Saif, H.J. Barnes, J.R. Gilson, A.M. Fadly, L.R. McDouglad & D.E. Swayne (Eds.), Diseases of Poultry (pp.63-87). Ames:Iowa State Press. Badstue, P. B. & Smidt, B. (1978). Egg drop syndrome 76 in Danish poultry. Nord Veterinary Medicine, 30, 498-505. Banerjee, G. C. (1993). Poultry. (3rd ed.). New Delhi, Bombay: Oxford and IBH Publishing co. Pvt. Ltd. pp.102. Baxendale, W. (1978). Egg drop syndrome 76. Veterinary Record, 102, 285-286. Biswas, P. K., Barua, H., Uddin, G. M. N., Biswas, D., Ahad, A., & Debnath, N. C. 2008. Serosurvey of five viruses in chickens on smallholdings in Bangladesh. doi:10.1016/j.prevetmed. 2008.06.018.Bragg, R. R., Allwright, D. M. & Coetzee, L. (1991). Isolation and identification of adenovirus 127, the causative agent of egg drop syndrome (EDS), from commercial laying hens in South Africa. Onderstepoort Journal of Veterinary Research, 58, 309-310. Cavanagh, D. & Naqi, S. A. (2003). Infectious bronchitis. In Y.M. Saif, H.J. Barnes, J.R. Gilson, A.M. Fadly, L.R. McDouglad and D.E. Swayne (Eds.), Diseases of Poultry (pp.101-119). Ames: Iowa State Press.

International Journal of Biology January, 2009
61
Domermuth, C. H. & Gross, W. B. (1991). Haemorrhagic enteritis and related infections. In B.W. Calnek, H.J. Barnes, C.W. Beard, W.M. Reid & H.W. Yoder Jr. ( Eds.), Diseases of Poultry (pp.567-572.). Ames: Iowa State University press. Firth, G. A., Hall, M. J. &McFerran, J. B. (1981). Isolation of haemagglutinating adeno-like virus related to virus 127 from an Australian poultry flock with an egg drop syndrome. Australian Veterinary Journal, 57, 239-242. Giasuddin, M., Sil, B. K., Alam, J., Islam, M. R. & Rahman, M.(2002). Prevalence of poultry diseases in Bangladesh. OnLine Journal of Biological Science, 2, 212-213. Hassan, A. F. M. R. (1985). Foot and mouth disease in Bangladesh. Paper presented at the World Country Training Programme on Foot and Mouth Disease Control, Bangkok, Thailand. Howell, J. (1982). Egg drop syndrome in Ross Brown hens:An interim report. Surveillance, 9, 10-11. Huque, Q.M.E. (1999). Nutritional status of family poultry in Bangladesh. Livestock Rural Development, 11, 3. Hwang, M. H., Lamas, J. M., Hipolito, O. & Silva, E. N. (1980). Egg drop syndrome 1976 a serological survey in Brazil. Proceedings of the 6th European Poultry Conference (p.371-378). Hamburg, Germany. Kumar, R., Mohanty, G. C., Verma, K. C. & Ram-Kumar. Epizootiological studies on egg drop syndrome in poultry. Indian Journal of Animal Science, 62, 497-501. Lancaster, J. E. (1966). Newcastle disease, a review 1926-1964. Monograph No. 3. Canadian Department of Agriculture. Ottawa.Lu, Y. S., Lin, D. F., Tasi, H. J., Lee, Y. L., Chui, S. Y., Lee, C. & Huang, S. T. (1985a). Outbreaks of egg drop syndromen1976 in Taiwan and isolation of the etiological agent. Journal of Chinese Society of Veterinary Science, 11, 157-165. Lu, Y. S., Tasi, H. J., Lin, D. F., Chui, S. Y., Lee, Y. L. & Lee, C. (1985b). Survey of antibody against egg drop syndromen1976 virus among bird species in Taiwan. Journal of Chinese Society of Veterinary Science, 11, 151-156. Malkinson, M. & Weisman, Y. (1980). Serological survey for the prevalence of antibodies to egg drop syndrome 1976 virus in domesticated and wild birds in Israel. Avian Pathology, 9, 421-426. McCraken, R. M. & McFerran, J. B. (1978). Experimental reproduction of the egg drop syndrome 1976 with a haemagglutinating adenovirus. Avian Pathology, 7, 483-490. McFerran, J. B. & Adair, B. M. (2003). Egg drop syndrome. In Y.M. Saif, H.J. Barnes, J.R. Gilson, A.M. Fadly, L.R. McDouglad and D.E. Swayne (Eds.). Diseases of Poultry (pp. 227-237). Ames:Iowa State Press. McFerran, J. B., Rowley, H. M., McNulty, M. S. & Montgomery, L. J. (1977). Serological studies on flock showing depressed egg production. Avian Pathology, 6, 405-413. McFerran, J. B., McCraken, R. M., McKillop, E. R., McNulty, M. S. & Collins, D. S. (1978). Studies on a depressed egg production syndrome in Northern Ireland. Avian Pathology, 7, 35-47. Meulemans, G., Dekegel, D., Peeters, J., Van Meirhaeghe, E. & Halen, P. (1979). Isolation of an adenolike virus from laying chickens affected by egg drop syndrome 1976. Vlaams Diergeneeskd Tijdschr, 2, 151-157. Nawathe, D. R. & Abegunde, A. (1980). Egg drop syndrome 76 in Nigeria: Serological evidence in commercial farms. Veterinary Record, 107: 466-467. Picault, J. P. (1978). Chutes de ponte associees a la production d`oeufs sans coquille fragile: Proprietes de l`agent infectious isole au cours de la maladie. L`Aviculteur, 379, 57-60. Rosales, G., Antillon, A. & Morales, C. (1980). Reporte en Mexico sobre la presencia de anticuerpos contra el adenovirus causante del syndrome de la baja en postura (CEPABC-14) en parvadas de gallinas domesticas. Proceedings of 29th West Poultry Disease Conference. p.192-196. Singh, K. Y. & Chew-Lim, M. (1981). Breeder farm egg drop syndrome 1976 (EDS76) in Singapore. Singapore Veterinary Journal, 5, 8-13. Van Eck, J. H. H., Davelaar, F. G., van Den Heuvel-Plesman, T. A. M., van Kol, N., Kouwenhoven, B. & Guldie, F. H. M. (1976). Dropped egg production, soft shelled and shell less eggs associated with appearance of precipitins to adenovirus in flocks of laying fowls. Avian Pathology, 5, 261-272. Yamaguchi, S., Imada, H., Kawamura, H., Taniguchi, T., Saio, H. & Shimamatsu, K. (1981). Outbreaks of egg drop syndrome 1976 in Japan and its etiological agent. Avian Diseases, 25: 628-641. Zhu, G. Q. & Wang, Y. K. (1994). Study on egg drop syndrome 1976 (EDS-76) and its control. Journal of Jiangsu Agricultural Coll., 15, 5-13.

Vol. 1, No. 1 International Journal of Biology
62
Zsak, L. & Kisary, J. (1981). Some biological and physico-chemical properties of egg drop syndrome (EDS) avian adenovirus strainB8/78. Archives of Virology, 68, 211-219. World Organization of Animal Health (OIE). 2004. Newcastle Disease In: Manual of Diagnostic Tests and Vaccines for Terrestrial Animals. 5th edn. Part 2, Section 2.1, Chapter 2. 1. 15.
Table 1. History of visited farms about genotype, age, feed, medication and vaccination located at different villages of Sadar Upazilla of District Gazipur
Farm and Address
Breed and Population
Origin of chicken
Age (wks)
FeedSource
Medication Vaccination
A- Vhurulia
Gazipur
Brown Nick
2000
Victor Breeders
38 Paragon (Readyfeed)
Gentamycin, Anthelmintics, Megavit-WS,
Vit.-AD3E, Calgophos, Sancal P, DCP, Methionine, Oyster shell etc.
IB+ND, Gumboro, G+ND, RDV etc.
B- Bhanua
Gazipur
Hi Line
500
Dhaka Hatchery
52 Mixed (Hand made)
CTC, Sancal P, Iocal, Vit. B+C, Vit. AD3E,Embavit- WS, DCP, CaCO3
IB+ND, D78, 228E, RDV, Fowl pox etc.
C-Bhanua, Gazipur
Star Cross
1000
Paragon Poultry
36 Paragon (Readyfeed)
Bactitab, Renamycin, Sulphar drug, Acimix,
Rena- WS, Megavit- WS, Livertonic,
Vit. -AD3E, Sancal P etc.
IB+ND, 228E, Gumboro2, ND killed etc.
D-Torof Para Gazipur
Shaver
Star Cross
1600
Biman Poultry
34 Mixed (Hand made)
CTC, Iocal, Calphos,
Vit. - B+C,
Vit. AD3E, Oyster shell, Phosphocal, Soybean oil etc.
IB+ND, D78, 228E, Clone30, RDV,
Fowl pox etc.
E-Harinal, Gazipur
Lohman Browm
1200
Phenix Poultry
30 Mixed (Hand made)
Oyster shell, DCP, Sancal P, Vit. - AD3E
IB+ND, 228E,
ND killed etc.
Megavit-WS: Megavit-water soluble vitamin preparation, DCP: Dicalcium phosphate, CTC: Chlorotetracycline, IB+ND: Infectious bronchitis+ Newcastle disease, G+ND: Gumboro+Newcastle disease, RDV: Ranikhet disease vaccine, D78: Gumboro D78 strain, 228E: Gumboro 228E strain, Clone30: Newcastle disease clone30 strain.

International Journal of Biology January, 2009
63
Table 2. Performance of birds before and during laying of soft shell and shell less eggs along with reduced egg production
Farm Previous performance Current performance Production loss (%) Age
(wks) Production
(%) Age (wks)
Production (%)
Normal Abnormal Total
A 30-35 90 38 30 6 36 54 B 28-32 95 52 54 4 58 37 C 28-32 96 36 45 6 51 45 D 28-32 78.75 34 34.50 6.75 41.25 37.5 E 28 80 30 43.75 6.25 50 30
aAbnormal egg includes soft-shelled, misshapen, discolored eggs but not included shell less eggs that dropped from the cage and difficult to count.
Table 3. Distribution of haemagglutination inhibition antibody titer against Newcastle disease virus in chickens of different farms sampled (n= 25, 5 samples from each farm)
Farm HI titer (Log2)Individual Titer Mean±SE
A 6 (3), 5 (2) 5.60±0.25 B 8 (1), 7(2), 6(1), 5 (1) 6.60±0.51 C 8(1), 7 (1), 6 (2), 5 (1) 6.40±0.51 D 7 (3), 6 (1), 5 (1) 6.40±0.40 E 9 (3), 8 (1), 7 (1) 8.40±0.40
Values in the parenthesis designate number of sample showed that individual titer.
Table 4. Distribution of ELISA antibody titer against infectious bronchitis and egg drop syndrome virus in chickens of different farms sampled (n= 25, 5 samples from each farm)
Farm Individual Titer Mean ±SE % positive
i) Antibody titer against infectious bronchitis virus A 3727, 7374, 5261, 8371, 1230 5193±1279 100 B 3293, 3989, 5544, 1563, 14936 5865±2356 100 C 10226, 5257, 3698, 4260, 3406 5369±1254 100 D 3819, 2239, 2622, 4924, 6525 4026±783 100 E 1688, 2264, 1805, 5344, 9646 4149±1529 100 ii) Antibody titer against egg drop syndrome virus A 3172, 965, 3473, 2579, 1130 2264±517 100 B 3147, 104, 3473, 1635, 3306 2890±424 80 C 3275, 378, 2852, 3306, 3172 3151±104 80 D 3286, 3225, 3455, 3455, 3230 3330±52 100 E 3473, 2463, 101, 3466, 3773 3294±286 80
Antibody titer below 396 is considered as negative. Negative samples are not included in calculation of mean and standard error.

Vol. 1, No. 1 International Journal of Biology
64
Table 5. Isolation and identification of haemagglutinating virus from the samples inoculated in embryos at 5th day post inoculation both at first and second passage in chicken and duck embryos
Farm Sample Haemagglutinating virus titer (log2) HI Index
(log2) Chicken embryo Duck embryo
1st a 2nd b 1st 2nd NDV EDSV
A Cloacal swab -c - - -
Feces - - - -
Egg - - - +d (4) 0 4
B Cloacal swab - - - + (7) 0 7
Feces - - - -
Egg - - - -
C Cloacal swab - - - + (6) 0 6
Feces - - - -
Egg - - - -
D Cloacal swab - - + (4) nd 0 4
Feces - - - -
Egg - - + (4) nd 0 4
E Cloacal swab - - - + (8) 1 8
Feces - - - + (7) 0 7
Egg - - - - afirst passage and bsecond passage; cnegative and dpositive for haemagglutinating activity; nd: not done; values in the parenthesis designate virus titer (Log2 ); HI index is calculated as HA in haemagglutination test minus HA in Haemagglutination inhibition test (HA – HA in HI). HI index 3 is considered as specific inhibition. NDV: Newcastle disease virus, EDSV: Egg drop syndrome virus.

International Journal of Biology January, 2009
65
Effect of IGF-1 on Expression of GH Receptor, IGF-1, IGF-1 Receptor, KAP3.2 and KAP6-1 mRNA in the Skin of Sheep
Chengxian Zhang College of Animal science, Shihezi University
Xinjiang 832000, China E-mail: [email protected]
Herong Liao (Corresponding author) College of animal breeding and genetics, Shihezi University
Xinjiang 832000, China Tel: 86-993-206-6527 E-mail: [email protected]
Yan Zhao College of Animal science, Shihezi University
Xinjiang 832000, China Tel: 86-535-726-2978 E-mail: [email protected]
Abstract Thirty-six healthy and similar Chinese Merino sheep were selected and divided into six groups at random. The treatment group was injected intradermally with 0.5 mL IGF-1 (10ng/mL). Treatment skin tissue of sheep were sampled respectively for 0,3,6,9,12 and 50 days and the skin expression of growth hormone receptor (GHR), insulin-like growth factor1 (IGF-1), insulin-like growth factor receptor (IGF- R), KAP3.2 and KAP6-1 mRNA were measured by RT-PCR. The results indicated that IGF-1 could degrade GHR gene expression, have no effect of IGF-1 and IGF-1R gene expression, and increase significantly KAP3.2 and KAP6-1 gene expression. Taken together these findings that the improvement of KAP3.2 and KAP6-1 gene expression may correlates with other pathway beyond the insulin-like growth factor axis.
Keywords: Sheep, Gene expression, Growth hormone receptor (GHR), Insulin-like growth factor1 (IGF-1), Insulin-like growth factor receptor (IGF-1R), Keratin intermediate filament-associated protein 3.2 (KAP3.2), Keratin-associated protein 6-1(KAP6-1)
1. Introduction Insulin-like growth factor I (IGF-1) and insulin-like growth factor II (IGF-II), as main insulin-like growth factor family, have an irritant effect on hair follicle epithelium and dermis, especially IGF-1 more significant than IGF-II. Extrinsic IGF-1 not only stimulate the DNA synthesis and keratinocyte proliferation of human skin in vitro culture, but also stimulate hair follicle growth in vitro culture, and impact hair follicle morphological development. In contrast, IGF-1 was injected either in vein or subcutaneous sectional in vivo; there were no significant changes in wool growth. But it is indispensable that IGF-1 maintains the wool normal growth, particularly early stage of hair follicle cycling, and prevents hair follicle from accessing catagen in advance. So the modulation of IGF-1 to hair follicle remains ambiguous at present.
We focus on the abundance of GHR, IGF-1, IGF-1R, KAP3.2 and KAP6-1 mRNA in sheep skin by injecting IGF-1 into local subcutaneous tissue periodically and quantitatively, and on the influence of IGF-1 to the expression of the previous gene related to hair follicle growth, which would lay a foundation for further study the modulation of growth factors to hair follicle.

Vol. 1, No. 1 International Journal of Biology
66
2. Materials and Methods 2.1 Experimental designThirty-six healthy and similar Chinese Merino sheep were selected and divided into six groups at random. The treatment group was injected intradermally with 0.5 mL IGF-1 (10ng/mL), then the treatment skin tissue of sheep were sampled about 1cm 2cm respectively for 0,3,6,9,12 and 50 days. The obtained samples were immediately frozen in liquid nitrogen and stored at -80 until isolation of RNA. 2.2 RT-PCR assay the abundance of GHR, IGF-1, IGF-1R, KAP3.2 and KAP6-1 mRNA Total RNA Isolation: Total RNA was extracted from the homogenized skin tissue according to the TRIzol instructions and quantified by UV absorbance. Obtaining the ratio of absorbance values at 260 and 280 nm assessed the quantity of the RNA, and its integrity confirmed by visualizing on 2.0%agarose gels with ethidium bromide staining. If the proportion of the net intensity of 28S and 18S near or above 2.0, and no trailing smear and other bands, we can assure the quality reliability of RNA integrity. Reverse transcription: Each cDNA obtained from total RNA was reverse transcribed by random primers. Reverse transcription reaction contained 2ug total RNA, 5uM random primers, 0.5mM dNTP, 20U RNase inhibitor,200U inverse transcriptase(M-MLV-RT),5μL10×RTBuffer(250mol·L-1 Tris HCl (pH8.3),50mol·L-1 MgCl2,250mol·L-1
KCl,50mol·L-1 DTT,2.5mol·L-1 Spermidine),in a total volume of 20μL. The mixture of total RNA, dNTP and random primers was incubated at 75°C for 5 minutes, then kept cool snap in ice, put in other reagents. Conditions used were 37°C for 60 minutes, and 95°C for 5 minutes. PCR amplification reactions: The primers sequence of GHR, IGF-1, IGF-1R, KAP3.2, KAP6-1 and beta-actin were designed according to cDNA sequence of sheep GHR (M82912), IGF-1 (M30653), IGF-1R (X54980), KAP3.2 (AY483216), KAP6-1 (M95719) and -actin (U39357) in GenBank. The primers sequence and PCR amplification conditions were shown in Table 1 and Table 2. Each reverse transcription product contained two repeats, as a control, using ddH2O and total RNA sample replace RT(reverse transcription) product that check out if there having extrinsic DNA and genome DNA contaminates. To correct the efficiency difference of reverse transcription and PCR between different batches, the best PCR reaction conditions were established with the mixture that the same volume mixed all total RNA. PCR reaction conditions included 2ug RT product, 2U Taq DNA polymerase, 5uL 10×buffer (50mol·L-1
Tris-HCl(pH9.0),100mol·L-1NaCl,1.0mol·L-1DTT,0.1mol·L-1EDTA,50%glycerol,10%TritonX100),0.2mmol·L-1 dNTP, 1.0~2.0mol·L-1 MgCl2, 0.5μmol·L-1 target gene primers and proper -actin primers. Electrophoresis and intensity analysis: Reslting PCR products(10-20ul) were analyzed by electrophoresis on 2.0% agarose gels, with DNA visualized by ethidium bromide staining. LabWork3.0 Analysis System could be used to analyze the electrophoresis photo and bands intensity. The relative abundance of target gene mRNA in samples would be assayed according to the ratio of bands intensity between target gene and beta-actin. 2.3 Statistical analysis of experiments data Experiments data obtained from skin specimen were analyzed using ANOVA of STATISTICA Software, and its statistical significance was analyzed by LSD test. 3. Results The relative abundance of GHR mRNA did not significant changes in skin tissues injected IGF-1, compared with control, but there was a gradual falling tendency in general (Fig1). The findings indicated that IGF-1 could down regulate the expression of GHR gene in sheepskin. The Fig2 and Fig3 shown that the expression of IGF-1 and IGF-1R beyond 32.29% and 36.29% respectively, but did not reached statistical significance. The results suggested that subcutaneous injection of IGF-1 has no evidently effect on levels of IGF-1 and IGF-1R mRNA. The Fig4 and Fig5 displayed that levels of KAP3.2 and KAP6-1 mRNA have no clear fluctuation between 0 and 3 days, then increased gradually between 3 and 9 days, and reached the peak marked difference in 9 day, subsequently decreased significantly and restored the levels before injection IGF-1. The findings claim that the level of KAP3.2 and KAP6-1 mRNA expression was improved remarkably by injecting IGF-1 in subcutaneous tissue. 4. Discussion Extensive findings indicate that there was expression of GHR, IGF-1, IGF-1R and IGFBPs in sheepskin and hair follicle. Growth hormone can improve the expression of IGF-1 gene, while IGF-1 may selectively inhibit the transcription of growth hormone and affect on the expression of growth hormone receptor. IGF-1 may cause the cell proliferation and the expression of IGF-1R, which decreased evidently in high differentiation epidermal cell or tumor cell. Hocking et al finds that the endogenous IGF-1 reduced significantly within 7 day of IGF-1 infusion, and then increased remarkably.

International Journal of Biology January, 2009
67
Our results indicate that IGF-1 has fall-down effect on expression of growth hormone receptor and no significant effect on expression of IGF-1 and IGF-1R. IGF-1 could be able to improve the growth of hair follicle through regulate the androgen in vivo and in vitro, however, hair follicles maintained in the absence of IGF-1 showed premature entry into a catagen-like state. Growth hormone had no effect on hair follicle growth or morphology in the absence of IGF-1. The changes of IGF-1R expression vary from site to site during hair cycles. These results suggest that IGF-1 and its receptor play an important role in regulating hair follicle growth. In contrast, the results in vivo fall out of to in vitro. Cottam et al (1992) injected IGF-1 to lamb and then the concentration of IGF-1 in blood flow increased, but no effects were found in the wool growth after 8 weekends. The results injected IGF-1 to local sheepskin demonstrate that IGF-1 caused protein synthesis increase on short term, while the synthesis of protein decreased on long term and wool growth still remained the same. Our results suggest that IGF-1 caused keratin-associated protein 3.2 (KAP3.2) and keratin associated protein 6-1 (KAP6-1) expression increase, possibly IGF-1 caused keratin synthesis through other pathway beyond the insulin-like growth factor axis. References Shen, S., Alt, A., Wertheimer, E., et al. 2001. PKCdelta activation: a divergence point in the signaling of insulin and IGF-1-induced proliferation of skin keratinocytes. Diabetes, 50(2),255-64. Rudman, SM., Philpott, MP., Thomas, GA., et al. 1997. The role of IGF-1 in human skin and its appendages: morphogen as well as mitogen? J Invest Dermatol, 109(6), 770-7. Kamiya, T., Shirai, A., Kawashima, S., et al. 1998. Hair follicle elongation in organ culture of skin from newborn and adult mice. J Dermatol Sci, 17, 54-60. Dicks, P., Morgan, CJ., Morgan, PJ., et al. 1996. The localisation and characterisation of insulin-like growth factor-I receptors and the investigation of melatonin receptors on the hair follicles of seasonal and non-seasonal fibre-producing goats. J Endocrinol, 151(1),55-63. Lewis, AJ., Wester, TJ., Burrin, DG., et al. 2000. Exogenous growth hormone induces somatotrophic gene expression in neonatal liver and skeletal muscle. Am J Physiol Regul Integr Comp Physiol, 278(4), R838-44. Dupont, J., Holzenberger, M. 2003. Biology of insulin-like growth factors in development. Birth Defects Res Part C Embryo Today; 69(4), 257-71. Fruchtman, S., Gift, B., Howes, B, et al. 2001. Insulin-like growth factor-I augments prolactin and inhibits growth hormone release through distinct as well as overlapping cellular signaling pathways. Comp Biochem Physiol B Biochem Mol Biol, 129(2-3),237-42. Kajimura S, Uchida K, Yada T, et al. 2002. Effects of insulin-like growth factors (IGF-I and -II) on growth hormone and prolactin release and gene expression in euryhaline tilapia, Oreochromis mossambicus. Gen Comp Endocrinol, 127(3), 223-31. Melmed S, Yamashita S, Yamasaki H, et al. 1996. IGF-I receptor signalling: lessons from the somatotroph. Recent Prog Horm Res, 51,189-215; discussion 215-6. Fruchtman S, McVey DC. & Borski RJ. 2002. Characterization of pituitary IGF-I receptors: modulation of prolactin and growth hormone. Am J Physiol Regul Integr Comp Physiol, 283(2), R468-76. Hodak E, Gottlieb AB, Anzilotti M, et al . 1996 . The insulin-like growth factor 1 receptor is expressed by epithelial cells with proliferative potential in human epidermis and skin appendages: correlation of increased expression with epidermal hyperplasia. J Invest Dermatol, 106(3), 564-70. Romano, G. 2003. The complex biology of the receptor for the insulin-like growth factor-1. Drug News Perspect, 16(8), 525-31. Hocking Edwards, JE., Khalaf, SK., Sinclaire, BR., et al. 1995. Metabolic response of sheep skin to a chronic infusion of a variant of insulin-like growth factor I. Biochem J, 308 (Pt 2), 411-8. Little, JC., Redwood, KR., Stones, AJ., Gibson, WT. & Granger, SP. 1994. The insulin-like growth factors are important in controlling the hair growth cycle. J Invest Dermatol, 102, 533. Lobley, GE., Lee, J., Hocking Edwards, J., et al. 1997, A comparison of changes in whole body and skin amino acid metabolism of sheep in response to 24h continuous infusion of variants of insulin-like growth factor 1. Canda J Anim Sci, 77, 695-706.

Vol. 1, No. 1 International Journal of Biology
68
Table 1. Parameters of oligo-nucleotide primer pairs for the oGHR, oIGF-I, oIGF-IR,oKAP3.2,oKAP6-1 and o -actin
target gene sequence origin primer sequence PCR product
oGHR GenBank M82912
F:5'-AGGTTGCTCAGCCACAAA-3' R:5'-TGGGGAAAGGACCACATT-3'
281bp (1412-169
2)
oIGF-1 GenBank M30653
F:5'-AGTTGGTAGATTGCTGTTGAT-3'R:5'-GAGAAGGGAGCGGGATAG-3'
277bp (680-956)
oIGF-1R GenBank X54980
F:5'-GCGGTTCTGTTGATAGTGG-3' R:5'-GCCTCGTTCACCGTCTTA-3'
287bp (646-932)
oKAP3.2 GenBank
AY483216 F:5'-TCATCAACCCAACAAAACC-3'
R:5'-GGGGCTCGCAGACATT-3' 322bp
(20-341)
oKAP6-1 GenBank M95719
F:5'-CTCTACCCGAGAACAACCT-3' R:5'-TCGTGGCATCCTCAATAGT-3'
296bp (1010-130
5)
o -actinGenBank U39357
F:5'-GCAGGTCATCACCATCGG-3' R:5'-GCCAATCTCATCTCGTTTTC-3'
467bp (821-1287
)
Table 2. RT-PCR condition for skin GHR, IGF-1, IGF-1R, KAP3.2 and KAP6-1 mRNA in sheep
GHR IGF-1 IGF-1R KAP3.2 KAP6-1
PCR
conditions
0.8mol/LMgCl2,
94 30s,56 45s,
72 30s,
30 cycles
0.8mol/LMgCl2,
94 30s,56 45s,
72 60s,
31 cycles
0.8mol/LMgCl2,
94 30s,56 45s,
72 30s,
31 cycles
0.8mol/LMgCl2,
94 30s,56 45s,
72 30s,
30 cycles
0.8mol/LMgCl2,
94 30s,61 45s,
72 30s,
30 cycles
Figure 1. Effect of IGF-1 on relative abundance of skin GHR mRNA Up: Representative agarose gel electrophoresis photo of RT-PCR result. I0~I50 represent injection IGF-1 day 0~50 respectively, C0~C50represent control skin day 0~50 respectively; M: Marker (PUC19). Down: result analysis of effect of IGF-1 on relative abundance of GHR mRNA in skin, n=6. * P<0.05; ** P<0.01.

International Journal of Biology January, 2009
69
Figure 2. Effect of IGF-1 on relative abundance of skin IGF-1 mRNA Up: Representative agarose gel electrophoresis photo of RT-PCR result. I0~I50 represent injection IGF-1 day 0~50 respectively, C0~C50 represent control skin day 0~50 respectively; M: Marker (PUC19). Down: result analysis of effect of IGF-1 on relative abundance of IGF-1 mRNA in skin, n=6. * P<0.05; ** P<0.01.
Figure 3. Effect of IGF-1 on relative abundance of skin IGF-1R mRNA Up: Representative agarose gel electrophoresis photo of RT-PCR result. I0~I50 represent injection IGF-1 day 0~50 respectively, C0~C50 represent control skin day 0~50 respectively; M: Marker (PUC19). Down: result analysis of effect of IGF-1 on relative abundance of IGF-1R mRNA in skin, n=6. * P<0.05; ** P<0.01.
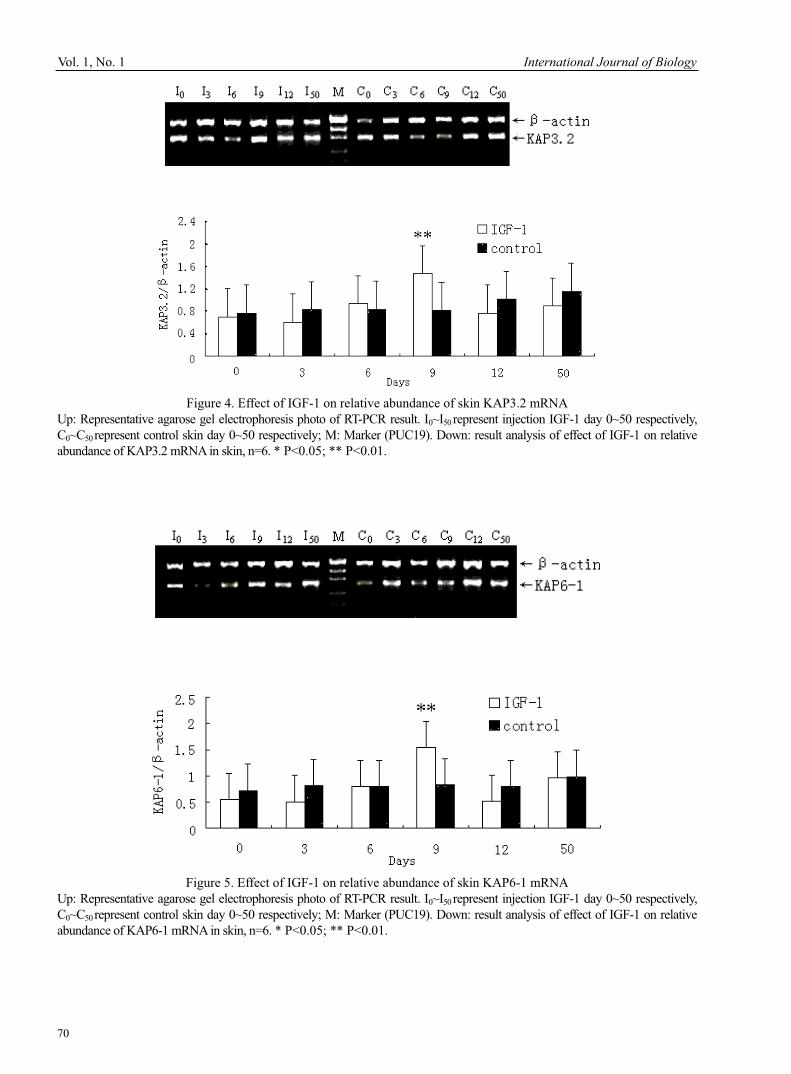
Vol. 1, No. 1 International Journal of Biology
70
Figure 4. Effect of IGF-1 on relative abundance of skin KAP3.2 mRNA Up: Representative agarose gel electrophoresis photo of RT-PCR result. I0~I50 represent injection IGF-1 day 0~50 respectively, C0~C50represent control skin day 0~50 respectively; M: Marker (PUC19). Down: result analysis of effect of IGF-1 on relative abundance of KAP3.2 mRNA in skin, n=6. * P<0.05; ** P<0.01.
Figure 5. Effect of IGF-1 on relative abundance of skin KAP6-1 mRNA Up: Representative agarose gel electrophoresis photo of RT-PCR result. I0~I50 represent injection IGF-1 day 0~50 respectively, C0~C50represent control skin day 0~50 respectively; M: Marker (PUC19). Down: result analysis of effect of IGF-1 on relative abundance of KAP6-1 mRNA in skin, n=6. * P<0.05; ** P<0.01.

International Journal of Biology January, 2009
71
Study of Bioassay the Allelopathical Effect of Neem (Azadirachta indica) n-hexane, Acetone and
Water-soluble Extracts on Six Weeds
Zoheir.Y.Ashrafi (Corresponding author) M. Sc. of Weed Science Faculty of Agronomy and Animal Science
University college of Agricultural and Natural Resource, Karaj Paradaise University of Tehran and Lecture at Payame Noor University (PNU), Tehran, Iran
Tel: 98-261-280-1011 E-mail: [email protected]
Sedigheh Sadeghi M. Sc. of Weed Science Faculty of Agronomy and Animal Science
University college of Agricultural and Natural Resource, Karaj Paradaise University of Tehran and Lecture at Payame Noor University(PNU), Tehran, Iran
Tel: 98-229-236-1357 E-mail: [email protected]
Hassan.M.Alizade Professor of Department Weed Science, Faculty of Agronomy and Animal Science
University college of Agricultural and Natural Resource, Karaj Paradaise, University of Tehran
Hamid.R.MashhadiProfessor of Department Weed Science, Faculty of Agronomy and Animal Science
University college of Agricultural and Natural Resource, Karaj Paradaise, University of Tehran.
Ebrahim.R.Mohamadi M. Sc. of Weed Science Faculty of Agronomy and Animal Science
University college of Agricultural and Natural Resource, Karaj Paradaise, University of Tehran
The research is financed by University of Tehran (Sponsoring information) AbstractAzadirachta indica, or Neem Tree, is an evergreen tree native to Southeast Asia. All parts of the tree have been used medicinally for centuries. The allelopathic potential of extracts of Azadirachta indica L., which is one of the most dominant weeds in tropical regions of South-west Asia, was investigated under laboratory conditions. The n-hexane-soluble, acetone-soluble and water-soluble fractions obtained from the acetone extract of A. indica shoots inhibited the germination and the growth of roots and shoots of six test plant species. The inhibitory activity of the water-soluble fraction was greatest, followed by that of the n-hexane-soluble and acetone-soluble fractions in all bioassays. Significant reductions in the germination and growth of the roots and hypocotyls were observed as the extract concentration increased. The concentration-dependent responses of the test plants to the fractions suggested that all three fractions might contain allelochemicals, but that the greatest potential was in the water-soluble fraction. These
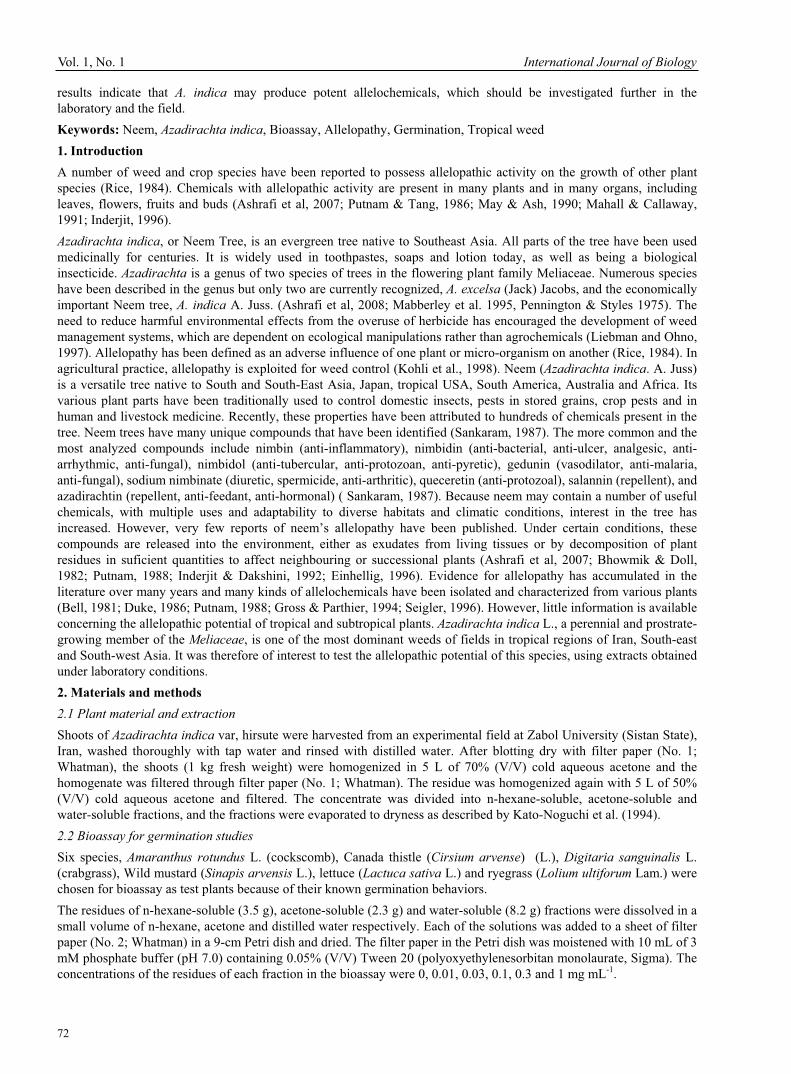
Vol. 1, No. 1 International Journal of Biology
72
results indicate that A. indica may produce potent allelochemicals, which should be investigated further in the laboratory and the field. Keywords: Neem, Azadirachta indica, Bioassay, Allelopathy, Germination, Tropical weed 1. Introduction A number of weed and crop species have been reported to possess allelopathic activity on the growth of other plant species (Rice, 1984). Chemicals with allelopathic activity are present in many plants and in many organs, including leaves, flowers, fruits and buds (Ashrafi et al, 2007; Putnam & Tang, 1986; May & Ash, 1990; Mahall & Callaway, 1991; Inderjit, 1996). Azadirachta indica, or Neem Tree, is an evergreen tree native to Southeast Asia. All parts of the tree have been used medicinally for centuries. It is widely used in toothpastes, soaps and lotion today, as well as being a biological insecticide. Azadirachta is a genus of two species of trees in the flowering plant family Meliaceae. Numerous species have been described in the genus but only two are currently recognized, A. excelsa (Jack) Jacobs, and the economically important Neem tree, A. indica A. Juss. (Ashrafi et al, 2008; Mabberley et al. 1995, Pennington & Styles 1975). The need to reduce harmful environmental effects from the overuse of herbicide has encouraged the development of weed management systems, which are dependent on ecological manipulations rather than agrochemicals (Liebman and Ohno, 1997). Allelopathy has been defined as an adverse influence of one plant or micro-organism on another (Rice, 1984). In agricultural practice, allelopathy is exploited for weed control (Kohli et al., 1998). Neem (Azadirachta indica. A. Juss) is a versatile tree native to South and South-East Asia, Japan, tropical USA, South America, Australia and Africa. Its various plant parts have been traditionally used to control domestic insects, pests in stored grains, crop pests and in human and livestock medicine. Recently, these properties have been attributed to hundreds of chemicals present in the tree. Neem trees have many unique compounds that have been identified (Sankaram, 1987). The more common and the most analyzed compounds include nimbin (anti-inflammatory), nimbidin (anti-bacterial, anti-ulcer, analgesic, anti-arrhythmic, anti-fungal), nimbidol (anti-tubercular, anti-protozoan, anti-pyretic), gedunin (vasodilator, anti-malaria, anti-fungal), sodium nimbinate (diuretic, spermicide, anti-arthritic), queceretin (anti-protozoal), salannin (repellent), and azadirachtin (repellent, anti-feedant, anti-hormonal) ( Sankaram, 1987). Because neem may contain a number of useful chemicals, with multiple uses and adaptability to diverse habitats and climatic conditions, interest in the tree has increased. However, very few reports of neem’s allelopathy have been published. Under certain conditions, these compounds are released into the environment, either as exudates from living tissues or by decomposition of plant residues in suficient quantities to affect neighbouring or successional plants (Ashrafi et al, 2007; Bhowmik & Doll, 1982; Putnam, 1988; Inderjit & Dakshini, 1992; Einhellig, 1996). Evidence for allelopathy has accumulated in the literature over many years and many kinds of allelochemicals have been isolated and characterized from various plants (Bell, 1981; Duke, 1986; Putnam, 1988; Gross & Parthier, 1994; Seigler, 1996). However, little information is available concerning the allelopathic potential of tropical and subtropical plants. Azadirachta indica L., a perennial and prostrate-growing member of the Meliaceae, is one of the most dominant weeds of fields in tropical regions of Iran, South-east and South-west Asia. It was therefore of interest to test the allelopathic potential of this species, using extracts obtained under laboratory conditions. 2. Materials and methods 2.1 Plant material and extraction Shoots of Azadirachta indica var, hirsute were harvested from an experimental field at Zabol University (Sistan State), Iran, washed thoroughly with tap water and rinsed with distilled water. After blotting dry with filter paper (No. 1; Whatman), the shoots (1 kg fresh weight) were homogenized in 5 L of 70% (V/V) cold aqueous acetone and the homogenate was filtered through filter paper (No. 1; Whatman). The residue was homogenized again with 5 L of 50% (V/V) cold aqueous acetone and filtered. The concentrate was divided into n-hexane-soluble, acetone-soluble and water-soluble fractions, and the fractions were evaporated to dryness as described by Kato-Noguchi et al. (1994). 2.2 Bioassay for germination studies Six species, Amaranthus rotundus L. (cockscomb), Canada thistle (Cirsium arvense) (L.), Digitaria sanguinalis L. (crabgrass), Wild mustard (Sinapis arvensis L.), lettuce (Lactuca sativa L.) and ryegrass (Lolium ultiforum Lam.) were chosen for bioassay as test plants because of their known germination behaviors. The residues of n-hexane-soluble (3.5 g), acetone-soluble (2.3 g) and water-soluble (8.2 g) fractions were dissolved in a small volume of n-hexane, acetone and distilled water respectively. Each of the solutions was added to a sheet of filter paper (No. 2; Whatman) in a 9-cm Petri dish and dried. The filter paper in the Petri dish was moistened with 10 mL of 3 mM phosphate buffer (pH 7.0) containing 0.05% (V/V) Tween 20 (polyoxyethylenesorbitan monolaurate, Sigma). The concentrations of the residues of each fraction in the bioassay were 0, 0.01, 0.03, 0.1, 0.3 and 1 mg mL-1.
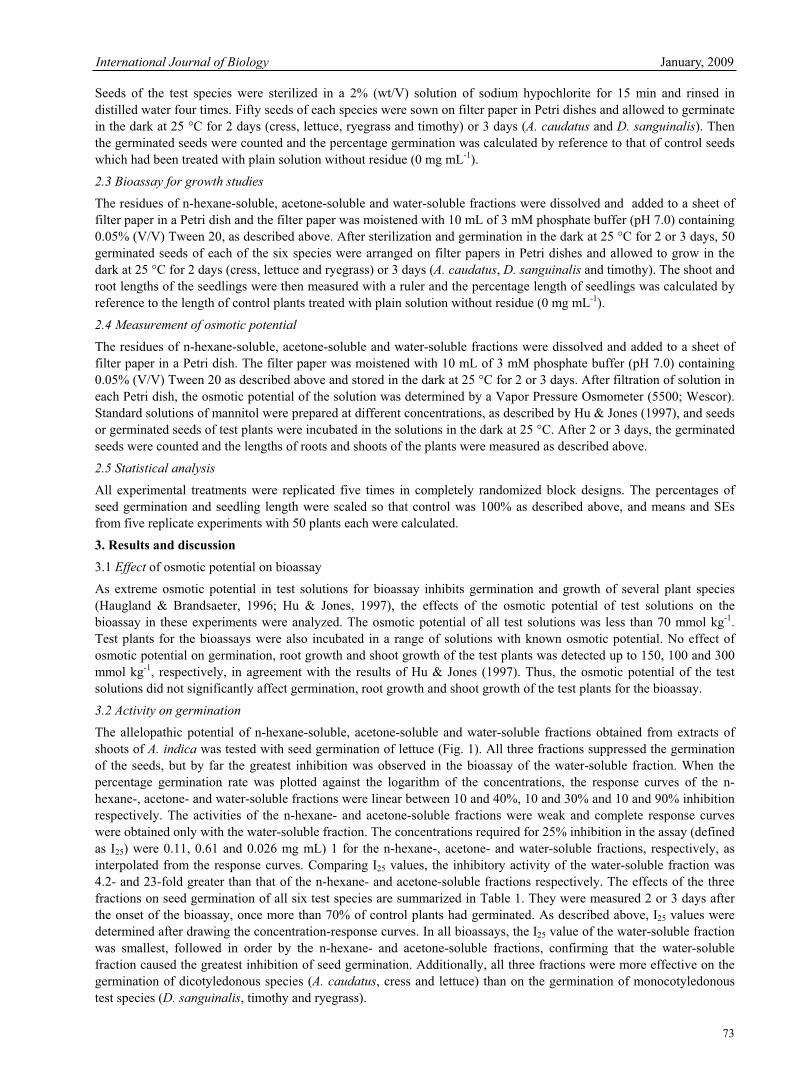
International Journal of Biology January, 2009
73
Seeds of the test species were sterilized in a 2% (wt/V) solution of sodium hypochlorite for 15 min and rinsed in distilled water four times. Fifty seeds of each species were sown on filter paper in Petri dishes and allowed to germinate in the dark at 25 °C for 2 days (cress, lettuce, ryegrass and timothy) or 3 days (A. caudatus and D. sanguinalis). Then the germinated seeds were counted and the percentage germination was calculated by reference to that of control seeds which had been treated with plain solution without residue (0 mg mL-1).
2.3 Bioassay for growth studies The residues of n-hexane-soluble, acetone-soluble and water-soluble fractions were dissolved and added to a sheet of filter paper in a Petri dish and the filter paper was moistened with 10 mL of 3 mM phosphate buffer (pH 7.0) containing 0.05% (V/V) Tween 20, as described above. After sterilization and germination in the dark at 25 °C for 2 or 3 days, 50 germinated seeds of each of the six species were arranged on filter papers in Petri dishes and allowed to grow in the dark at 25 °C for 2 days (cress, lettuce and ryegrass) or 3 days (A. caudatus, D. sanguinalis and timothy). The shoot and root lengths of the seedlings were then measured with a ruler and the percentage length of seedlings was calculated by reference to the length of control plants treated with plain solution without residue (0 mg mL-1).
2.4 Measurement of osmotic potential The residues of n-hexane-soluble, acetone-soluble and water-soluble fractions were dissolved and added to a sheet of filter paper in a Petri dish. The filter paper was moistened with 10 mL of 3 mM phosphate buffer (pH 7.0) containing 0.05% (V/V) Tween 20 as described above and stored in the dark at 25 °C for 2 or 3 days. After filtration of solution in each Petri dish, the osmotic potential of the solution was determined by a Vapor Pressure Osmometer (5500; Wescor). Standard solutions of mannitol were prepared at different concentrations, as described by Hu & Jones (1997), and seeds or germinated seeds of test plants were incubated in the solutions in the dark at 25 °C. After 2 or 3 days, the germinated seeds were counted and the lengths of roots and shoots of the plants were measured as described above.
2.5 Statistical analysis All experimental treatments were replicated five times in completely randomized block designs. The percentages of seed germination and seedling length were scaled so that control was 100% as described above, and means and SEs from five replicate experiments with 50 plants each were calculated.
3. Results and discussion 3.1 Effect of osmotic potential on bioassay
As extreme osmotic potential in test solutions for bioassay inhibits germination and growth of several plant species (Haugland & Brandsaeter, 1996; Hu & Jones, 1997), the effects of the osmotic potential of test solutions on the bioassay in these experiments were analyzed. The osmotic potential of all test solutions was less than 70 mmol kg-1.Test plants for the bioassays were also incubated in a range of solutions with known osmotic potential. No effect of osmotic potential on germination, root growth and shoot growth of the test plants was detected up to 150, 100 and 300 mmol kg-1, respectively, in agreement with the results of Hu & Jones (1997). Thus, the osmotic potential of the test solutions did not significantly affect germination, root growth and shoot growth of the test plants for the bioassay.
3.2 Activity on germination The allelopathic potential of n-hexane-soluble, acetone-soluble and water-soluble fractions obtained from extracts of shoots of A. indica was tested with seed germination of lettuce (Fig. 1). All three fractions suppressed the germination of the seeds, but by far the greatest inhibition was observed in the bioassay of the water-soluble fraction. When the percentage germination rate was plotted against the logarithm of the concentrations, the response curves of the n-hexane-, acetone- and water-soluble fractions were linear between 10 and 40%, 10 and 30% and 10 and 90% inhibition respectively. The activities of the n-hexane- and acetone-soluble fractions were weak and complete response curves were obtained only with the water-soluble fraction. The concentrations required for 25% inhibition in the assay (defined as I25) were 0.11, 0.61 and 0.026 mg mL) 1 for the n-hexane-, acetone- and water-soluble fractions, respectively, as interpolated from the response curves. Comparing I25 values, the inhibitory activity of the water-soluble fraction was 4.2- and 23-fold greater than that of the n-hexane- and acetone-soluble fractions respectively. The effects of the three fractions on seed germination of all six test species are summarized in Table 1. They were measured 2 or 3 days after the onset of the bioassay, once more than 70% of control plants had germinated. As described above, I25 values were determined after drawing the concentration-response curves. In all bioassays, the I25 value of the water-soluble fraction was smallest, followed in order by the n-hexane- and acetone-soluble fractions, confirming that the water-soluble fraction caused the greatest inhibition of seed germination. Additionally, all three fractions were more effective on the germination of dicotyledonous species (A. caudatus, cress and lettuce) than on the germination of monocotyledonous test species (D. sanguinalis, timothy and ryegrass).

Vol. 1, No. 1 International Journal of Biology
74
3.3 Activity on seedling growth Figure 2 shows the effects of the n-hexane-, acetone- and water-soluble fractions on the root growth of lettuce. All three fractions inhibited the growth of the roots, with the most marked inhibition being achieved by the water-soluble fraction. When the percentage length was plotted against the logarithm of the concentrations, although complete response curves were obtained only with the water-soluble fraction, the response curves of the n-hexane-, acetone- and water- soluble fractions were linear between 0 and 60%, 0 and 30%, and 0 and 90% inhibition respectively. As interpolated from the response curves, the I25 values in the assay were 0.032, 0.14 and 0.01 mg mL-1 for the n-hexane-, acetone- and water-soluble fractions respectively. Figure 3 shows the effects of the n-hexane-, acetone- and water-soluble fractions on the shoot growth of lettuce. These fractions inhibited shoot growth to a considerably less extent than root growth, the I25 values in the assay being 0.24, 0.78 and 0.049 mg mL-1 for the n-hexane-, acetone- and water-soluble fractions respectively. Increasing the concentrations of all fractions increased the inhibition of both root and shoot growth. The effects of these fractions on the root and shoot growth of all six test species were measured 2 or 3 days after onset of the bioassay and the I25 values were determined as described above (Tables 2 and 3). In all bioassays, the I25 value of the water-soluble fraction was smallest, followed in order by the n-hexane- and acetone-soluble fractions. The effectiveness of all three fractions on the roots of the test species was greater than that on the shoots of the same species. This observation agrees with that of Stachon & Zimdahl (1980) who found the ethanol extracts of Cirsium arvense L. (Canada thistle) more inhibitory to cucumber (Cucumis sativis L.) roots than to hypocotyls. The distinction between dicotyledonous and monocotyledonous species was less clear in shoot and root tests than in germination tests. Plant-to-plant interference is a complex combination of competition for resources such as light, nutrients and water, and allelopathic reaction (Fuerst & Putnam, 1983; Qasem & Hill, 1989), and distinguishing allelopathic effects from the competitive interference is diffcult (Leather & Einhelling, 1988; Inderjit & Dakshini, 1994). However, the seedlings of each test species used in these experiments were grown in a single Petri dish without intraspecies competition for resources, as young seedlings withdraw nutrients from the seeds and light is unnecessary in the developmental stage (Fuerst & Putnam, 1983). Thus, germination and growth inhibition of the test species are likely to have been caused by the allelopathic reaction rather than by competitive interference. Significant reductions in the germination and growth of the roots and shoots were observed as the extract concentration increased. The results are in agreement with previous investigations in that the activity of either water-extracts or weed residues was directly related to the concentration of the residue rates (Caussanel, 1979; Chung & Miller, 1995; Babu & Kandasamy, 1997). Such concentration-dependent responses of the test plants to the fractions suggest that each fraction separated from the extract of A. indica might contain allelochemicals, that the allelopathic potential of the water-soluble fraction was greatest and that this fraction may contain the most active allelochemicals. This preliminary research suggests that A. indica contains potent allelochemicals that may enhance its efficiency as a weed. On the other hand, residues or aqueous extracts of the plant may be useful for weed management. It has been shown that some plant residues and extracts can work as weed inhibiting agents (Bhowmik & Doll, 1982; Putnam & Tang, 1986; Einhellig, 1996).ReferencesAshrafi,Z. Y., H. R.Mashhadi, S. Sadeghi. (2007). Allelopathic Effects of Barley (Hordeum vulgare) on Germination and Growth of Wild Barley (Hordeum spontaneum). Pak. J.weed Sci.Res.13(1-2): 99-112. Ashrafi,Z. Y., H. R.Mashhadi, S. Sadeghi, H. M. Alizade. (2008). Effects Allelopathical of sunflower (Helianthus annuus) on Germination and Growth of Wild Barley (Hordeum spontaneum). J. Agric. Tech. 4(1): 219-229.Babu, R.C & O.S Kandasmy. (1997). Allelopathic effect of Eucalyptus globulus Labill. on Cyperus rotundus L. and Cynodon dactylon L. Pers. Journal of Agronomy and Crop Sciences 179, 123-126. Bell, A. B. (1981). Biochemical mechanisms of disease resistance. Annual Review of Plant Physiology 32, 21-81. Bhowmik, P. C & J.D Doll. (1982). Corn and soybean response to allelopathic effects of weed and crop residues. Agronomy Journal 74, 601-606. Caussanel, J.P. (1979). Non-competitive effects between lamb's quarters (Chenopodium album L.) and maize (INRA 258). Weed Research 19, 123-135. Chung, I. M & D. A Miller. (1995). Natural herbicide potential and alfalfa residue on selected weed species. Agronomy Journal 87, 920-925. Duke,S. O. (1986). Naturally occurring chemical compounds as herbicides. Reviews of Weed Science 2, 17-65. Einhelling, F.A. (1996). Interactions involving allelopathy in cropping systems. Agronomy Journal 88, 886- 893. Furest,E.P. & A. R Putnam. (1983). Separating the competitive and allelopathic components of interference: theoretical principles. Journal of Chemical Ecology 8, 937-944. Gross, D. & B. Paritheir. (1994). Novel natural substances acting in plant growth regulation. Journal of Plant Growth Regulation 13, 93-114.

International Journal of Biology January, 2009
75
Haugland, E. & L. O. Brnand. (1996). Experiments on bioassay sensitivity in the study of allelopathy. Journal of Chemical Ecology 22, 1845-1859. Inderjit. (1996). Plant phenolics in allelopathy. Botanical Review 62, 186-202. Inderjit & KM. Dakshini. (1992). Formation 7-O-glucoside (ononin), an additional growth inhibitor in soils associated with the weed, Pluchea lanceolata (DC) C.B. Clarke (Asteraceae). Journal of Chemical Ecology 18, 713-718. Inderjit & KM. Dakshini. (1994). Allelopathic effect of Pluchea lanceolata (Asteraceae) on characteristics of four soils and tomato and mustard growth. American Journal of Botany 81, 799-804. Kato,N.H, et al. (1994). Allelopathy of oats. I. Assessment of allelopathic potential of extract of oat shoots and identification of an allelochemical. Journal of Chem. Ecol. 20, 309-314. Leather,G.R & F.A Einhelling. (1988). Bioassay of naturally occurring allelochemicals for phytotoxicity. Journal of Chemical Ecology 14, 1821-1828. Mahall, B. E & R.M.Callaway. (1991). Root communication among desert shrubs. Proceedings of the National Academy of Science of the United State of America 88, 874-876. May, F.E & J. E Ash. (1990). An assessment of the allelopathic potential of Eucalyptus. Australian Journal of Botany 38, 245-254. Putnam, A. R. (1988). Allelochemicals from plants as herbicides. Weed Technology 2, 510-518. Putnam, A. R & C. Tang. (1986). The Science of Allelopathy. John Wiley & Sons, New York, USA. Qasem, J.R & T.A. HILL. (1989). On difficulties with allelopathy methodology. Weed Research 29, 345-347. Seligler, D.S. (1996). Chemistry and mechanisms of allelopathic interactions. Agro. J. 88, 876-885. Zimdahl, R.L. & W.J. Stachon. (1980). Allelopathic activity of Canada thistle (Cirsium arvense) in Colorado. Weed Science 28, 83-86. Mabberley, D. J. et al. (1995). Azadirachta, pp. 337-343. In: Flora Malesiana ser. 1 Spermatophyta 12(1): 1-407. Pennington, T. D. & B. T. Styles. (1975). A generic monograph of the Meliaceae. Blumea 22: 419-540. Kohli, R.K., (1993). Allelopathic impact of sunflower on weeds and crops of Punjab. PSCST Project Report, India. Kohli, R.K., Batish, D. & Singh, H.P., (1998). Allelopathy and its implications in agroecosystems. J. Crop Prod. 1, pp. 169–202.Liebman, M. & Ohno, T. (1997). Crop rotation and legume residue effects on weed emergence and growth: applications for weed management. In: Hatfield, J.L. et al., 1997. Integrated Weed and Soil Management, Ann Arbor Press, Chelsea, MI, pp. 181–221. Rice, E.L. (1984). Allelopathy, 2nd Edition. Academic Press, London, pp. 309–316. SAS Institute. (1997). SAS User’s Guide: Statistic. SAS Institute, Cary, NC. Sankaram, A.V.B. (1987). Chemistry, biological activity and utilization aspects of some promising neem extractives. In: Proceedings of the Third International Neem Conference, Nairobi, Kenya, 10 July 1986, pp. 127–148. NotesNote 1. A laboratory experiment was conducted at Agricultural Campus, Tehran of University, in Karaj city May-2008.
Table 1. I25 of n-hexane-, acetone- and water-soluble fractions obtained from shoot extracts of Azadirachta indicafor seed germination. Means ±SE from five replicate experiments with 50 plants each are shown
L25(mg ml-1) Control plants germination % Test species n-hexane soluble Acetone soluble Water soluble
A. rotundus 0.11 0.71 0.021 76 Canada thistle 0.22 0.76 0.018 89 lettuce 0.09 0.64 0.031 84 D. sanguinalis 0.24 0.79 0.044 71 Wild mustard 0.29 0.89 0.047 85 Ryegrass 0.34 0.94 0.053 69

Vol. 1, No. 1 International Journal of Biology
76
0
20
40
60
80
100
120
0 0.01 0.03 0.1 0.3 1 1.1
Concentration (mg mL-1)
Ger
min
atio
n,%
of c
ontr
ol
25%inhibition
Figure 1. Effects of n-hexane- ( ), acetone- ( ) and water-soluble ( ) fractions obtained from shoot extracts of Azadirachta indica on germination of lettuce seeds. Means ± SE from 50 seeds are shown. Germination rate of control
plants was 88 ± 7.7%.
0
20
40
60
80
100
120
0 0.01 0.03 0.1 0.3 1 1.1
Concentration (mg mL -1)
Roo
t len
gth,
% o
f con
trol
25%inhibition
Figure 2. Effects of n-hexane- ( ), acetone- ( ) and water-soluble ( ) fractions obtained from shoot extracts of Azadirachta indica on root growth of lettuce. Means ± SE from 50 plants are shown. Length of control seedlings was
19.1 ± 1.4 mm.
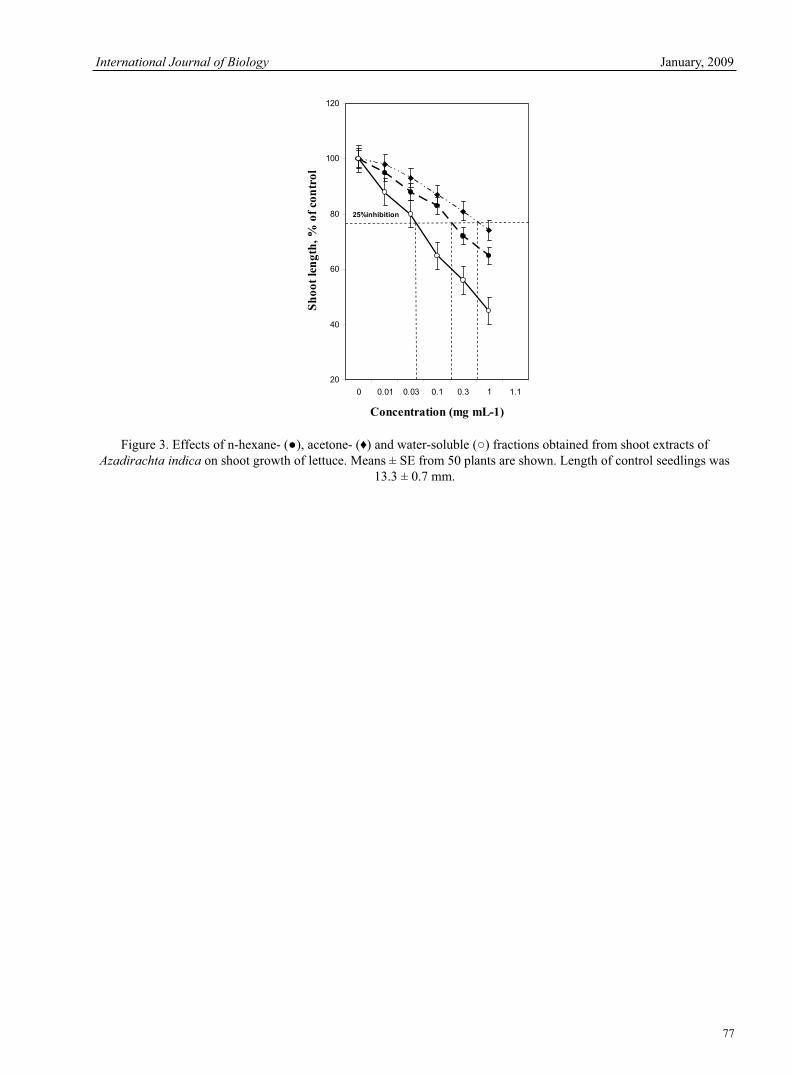
International Journal of Biology January, 2009
77
20
40
60
80
100
120
0 0.01 0.03 0.1 0.3 1 1.1
Concentration (mg mL-1)
Shoo
t len
gth,
% o
f con
trol
25%inhibition
Figure 3. Effects of n-hexane- ( ), acetone- ( ) and water-soluble ( ) fractions obtained from shoot extracts of Azadirachta indica on shoot growth of lettuce. Means ± SE from 50 plants are shown. Length of control seedlings was
13.3 ± 0.7 mm.

Vol. 1, No. 1 International Journal of Biology
78
The Measurement Method of Population Dynamics and
New Measurement Index
Chengguo Jiang College of Life Science, Shihezi University
Xinjiang 832003, China
E-mail: [email protected]
Tong Liu
College of Life Science, Shihezi University
Xinjiang 832003, China
E-mail: [email protected]
Dan Wang
College of Life Science, Shihezi University
Xinjiang 832003, China
Abstract
It is hard to describe the population dynamics by specific numbers because there are many influencing factors, such as accepting pollination, nutrition source, predator, disease and breeding way, and so on. The paper adopts the method of appropriate concentric circle and new population dispersing index for population dynamics study.
Its main purposes includes: the comparison for same area in different years; the comparison for same community in different areas; the comparison for the advantages and disadvantages in different population in same community. Meanwhile, the paper points out the advantages and disadvantages of this index, probe into the further optimized measures and try to study the population dynamics scientifically and rationally. Keywords: Index of scale, Concentric circle quadrat, Population dispersion index, Weighted disposal
1. Introduction
Plant population is dynamic, so there is certain degree of difficulty for its study. Generally speaking, once the plant survives, it has no removability and its reproduction is influenced by both the external and the internal factors. Among the evaluation system of the plant population indications, the quadrat position of the plant is vital. The present studies of population dynamics mainly consider the genetic structure, spatial structure, age structure and size structure, which have some limitation because they do not unity the sample plot. The values of statistical equation in population statistics stress in the quantity change and can not forecast effectively the future development tendency of population. In view of the above reasons and the results observed by myself for many years, I proposed the method of concentric circle quadrat to carry on the sampling and the new evaluation index, that is, population dispersion index. This quadrat and the dispersion index can be combined well, and unifies the sample plot position of each plant to describe the future trend of population scientifically.
2. Design of survey quadrat
Concentric circle quadrat is a kind of quadrat made of a group of concentric circles which takes the distribution centre

International Journal of Biology January, 2009
79
of population as the center of circle, a group of arithmetic progressions as the radius. The grid method and transect method are two common methods for survey of population and community dispersion because they are easy to operate and for statistics. However, these two methods are different to discover the center of sample plot and to calculate precisely the concrete position of each plant.
Concentric circle quadrat can determine the differences and units of radiuses between two neighboring circles according to different need. All neighboring radius differences must be equal, and this difference value should be the radius of minimum quadrat circle so that all the radiuses of quadrats circles form to be a group of arithmetic progressions. The detailed quadrat mold illustrations are as follows: As shown in Picture 1, “S1,S2,S3 …… Sn” respectively represent the area of Quadrat i, which require S1= r1
2 , S2= r2
2- r12, S3= r3
2- r22 ……. Sn= rn
2- rn-12. Among them, the unit should be determined by radius.
“N1,N2,N3 …… Nn” in Picture 2 respectively represent the surveyed plant number of Quadrat n. “L1,L2,L3 ……Ln” in Picture 3 respectively represent the distance between the center of Quadrat n and that of sample plot. Among them, the starting point of L is the center of sample plot and the end points of L are the center line between the Circle n and Circle n-1. 3. Definition of population disperse index and formula
3.1 Conception of population dispersion index
The population dispersion index is the indicator of the quantity, reproductive ability, dispersion condition in some area or space for the plant population and the survival potential of this species. It is the index to describe the dispersion condition of some species, the degrees of outward expanding and increasing and inward contracting of this species. Especially for the community of endangered species or the growth condition of local community, it can obtain the annual changing conditions and good or bad local communities according to the comparison of survey datum and then forecast their development tendencies so that propose the relative scientific measures in good season for population protection. 3.2 Population dispersion index
Dp= )( 1
1 sNS
rL
i
in
i n
i
As is shown in the above formula, “i” represents Quadrat i, “n” represents the total number of quadrat, “Dp” represents population dispersion index, L i
represents the distance between center of Quadrat i and center of sample plot, “Rn” represents the radius of maximum quadrat circle, “S1” represents the area of minimum quadrat, “Si” represents the area of Quadrat i and “Ni” represents the number of this species in Quadrat i..
3.3 Further disposal of population dispersion index
The population belongs to an aggregate and the perennial plants' age structure decided its reproductive capacity, which is very a big influence to the local community. To eliminate this influence, we could adopt the weighted disposal for the plant numbers. For the better reproductive individual, adding a parameter before Ni. For example, one plant is 1.2 times as better as other plant, we could calculate it as 1.2 plants. However, this weighted disposal is not advocated except there is a full comprehend to the plant.
3.4 Application of population dispersion index
Population dispersion index is suitable for the survey of animal, plant and microorganism. Detailed Applications include:
(1) The comparison for same area in different years. If DpN/DpN-1>1, this population belongs to Increasing Type; if DpN/DpN-1=1, this population belongs to Steady Type; if DpN/DpN-1<1, this population belongs to Decline Type. (2) The comparison for same community in different areas. For example, there are two district of A and B. If the dispersion index of A is bigger than that of B, District A is better than District B; otherwise District A is worse than District B. (3) The comparison for the advantages and disadvantages in different population in same community. Generally speaking, the bigger dispersion index means the better advantages of this species. The above applications must be based on the same sample plot and unit for comparison.
3.4 Potential error and correction
The potential error of population dispersion index may be resulted from two points: the setting of quadrat area; the
Vol. 1, No. 1 International Journal of Biology
80
determination of quadrat center. Considering the above points must be depend on human's subjective judgement, the size and location of the quadrat should be determined according to the density, the distribution, the terrain and the reproduction characteristic in the survey process. The center of circle must be located in the center of population distribution, and it should adopt the same center for same population in different years. For the comparison of different populations, it can also adopt the same quadrat.
4. Discussion
There are many influencing factors for population dynamics, such as accepting pollination, nutrition source, predator, disease and breeding way, and so on. Meanwhile, the plants are influenced largely by its own population density and the seed dissemination way and the location of the species is just one factor, however, it is a distinctive method comparing with the previous statistical methods. This research technique and the statistical method have higher rationality and the comparison using this population dispersion index can have more advantages. Of course, like the grid method and transect method this survey method may has some difficulty in the operation and it may depend on the personal experience, so the selection of quadrat center and the circle space should referred to various factors. ReferencesGilpin, M. (1972). Enriched predator–prey systems: theoretical stability. Science, 177, 902–904. Hastings, A. (2001). Transient dynamics and persistence of ecological systems. Ecol. Lett. 4, 215–220. Holmes, E.E., Lewis, M.A., Banks, J.E., Veit, R.R., (1994). Partial differential equations in ecology: spatial interactions and population dynamics. Ecology, 75, 17–29. Kot, M. (2001). Elements of Mathematical Ecology. Cambridge Univeristy Press, Cambridge, UK. Kullback, S., (1959). Information Theory and Statistics. John Wiley & Sons, New York. Loehle, C., Li, B.-L., (1996). Habitat destruction and the extinction debt revisited. Ecol. Appl. 6, 784–789. Ma K P. Measurement of biodiversity. In: Qian Y Q ed. Principle and methods of biodiversity studies*. Beijing: Chinese Scientific & Technological Press. (1994). 2(3): 162-168. Perter Turchin, George O.Batzli. Availability of Food and the Population Dynamics of Arvicoline Rodents. The Ecological Society of American, (2001). 82(6): 1521-1534. Perter Turchin. Complex Population Dynamics: A Theoretical Empirical Synthesis. New Jersey: Princetor University Press, (2003). Yoshizawa T. Stability Theory By Liapunov Second Method Tokyo: The Mathematical Society of Japan ,1966. 59-61. Zhang Jintun. Quantitative Ecology. Science Press. (2003). 94-96.
1N2N
o
3N4N
5N
o1S
2S3S
4S5S
o1L
2L3L
4L
5L
Figure 1 Figure 2 Figure 3

International Journal of Biology January, 2009
81
Influences of Bedding Material in Vermicomposting Process
Latifah Abd Manaf, Mohd Lokman Che Jusoh, Mohd Kamil Yusoff Tengku Hanidza Tengku Ismail, Rosta Harun & Hafizan Juahir
Department of Environmental Sciences, Faculty of Environmental Studies Universiti Putra Malaysia, 43400 UPM Serdang, Selangor Darul Ehsan, Malaysia
Tel: 603-8946 6747 E-mail: [email protected]
Kamaruzaman Jusoff (Corresponding author) Yale University, Yale’s Centre for Earth Observation
Environnent Science Centre, 21 Sachem St, New Haven, CT 06511, USA Tel: 203-432-1384 E-mail: [email protected]
This project is funded by Universiti Putra Malaysia.Abstract Rapid growth of urbanization and industrialization has led to generation of large quantities of wastes. Major portion of organic waste is dumped in landfill sites, creates the organic load on the ground water, and more emissions of landfill gases. The best possible alternative to reduce these potential pollutants is through vermicomposting. Vermicomposting is essentially composting with worms. This experiment was done to determine which bedding materials (either newspaper or sawdust) is more suitable for vermicomposting by using biological parameter which measured the growth rate (pH), number of worm, number of cocoons and worm biomass. The worms were breed in vermicomposter and the period of vermicomposting using Perionyx excavatus worm is six weeks. All of the four biological parameters showed that there are significant different between this two type of bedding using ANOVA test. The Duncan test demonstrated that newspaper bedding is more influential in worm biomass production and growth rate while sawdust bedding is better for cocoons production and number of worm. For pH analysis it reveals that the optimum pH for worm growth rate is near to neutral condition. As conclusion, different types of bedding material will influence the worm growth.Keywords: Vermicomposting, Bedding materials, Biological parameters 1. Introduction In recent years much attention has been paid to manage different organic waste resources at low-input as well as eco-friendly basis. Vermicomposting is one of the ways to reduce this organic waste and its have been practically used all over the world. Vermes is Latin word for worms and vermicomposting is essentially composting with worms (Ghatnekar et al., 1998). In nature, all organic matter eventually decomposes. But in vermicomposting, the worm speed up the process of decomposition and get a richer end product called “worm castings”. On the other hand vermicomposting is a process of utilizing earthworms and it is an eco-biotechnological process that transforms energy rich and complex organic substances into a stabilized humus-like product (Benitez et al., 2000). A wormery is a self-contained composting system that does not generate heat, retains most nutrients for reuse and properly maintained its odorless (Munroe, 2004). Vermicomposting is an easy way to make a positive environmental impact by reducing the amount of organic waste that finds its way into landfills, incinerators, and sometimes the ocean. Vermicomposting can be classified as an innovative and alternative technology that represents a technology that is environmentally sound and relatively new technology. In some countries mainly, Canada, United States, Australia, France, and some Southeast Asia countries, earthworms have been used for waste stabilization for many years (Martin et al., 1988).Earthworms are one of the major soil macro invertebrates and are known for their contributions to soil formation and turnover with their widespread global distribution (Norbu, 2002). It plays a significant role in decomposition due to their symbiotic relationship with bacteria. As earthworms ingest and digest organic matter, they also take in microorganisms and metabolize them. When the organic material passes through the gut of the earthworm it again increases the surface area of the material so that the microorganisms can break it down further. The undigested
Vol. 1, No. 1 International Journal of Biology
82
materials, or castings, are fertile and rich in nutrients readily available to plants (Hansen, 2007). Organic manure and other agriculture organic wastes are essential sources for maintenance of soil organic matter and to sustain soil productivity. Usually there is a huge amount of animal excreta being generated in intensive livestock farming. Proper utilization of these wastes can enhance soil physical condition and environmental quality as well as provide nutrients for plant (Mishra et al., 1989; Bhardwaj, 1995). However if this organic manure are not been manage well it can pollute our environment especially river and groundwater by it runoff that contain lot of nitrates, phosphates, and ammonia. Horse manure is one of organic waste which regularly used in vermicomposting. Horse manure is suitable for the growth of earthworms and does not need any pretreatment and can be applied directly as a feed (Norbu, 2002). Ronald et al. (1978) reported that horse manure contains 0.7 % of nitrogen, 4.38 % of protein and 60% of organic matter and trace amounts of phosphoric acid and potassium oxide. Any material that provides the worms with a relatively stable habitat is called bedding. This habitat must have the following characteristics such as high absorbency, good bulking potential and low protein and/or nitrogen content (high Carbon: Nitrogen ratio). Worms need bedding in addition to food. Shredded paper or newspaper, coir (coconut husk fiber), and shredded cardboard are common bedding materials used for worm composting. Normally, the bedding will soak well with clean water and then squeeze it to remove excess liquid. Selection of bedding materials is a key to successful of vermicomposting process. They provide protection from extremes in temperature, the necessary levels and consistency of moisture, and an adequate supply of oxygen (Munroe, 2004). Sawdust is a main organic waste in sawmill. It has a variety of practical uses including as mulch, an alternative to clay cat litter, a fuel, or for the manufacture of particleboard. Sawdust may collect in piles and add harmful leachates into local water systems, creating an environmental hazard. The biggest concern with sawdust are substances such as lignins and fatty acids which protect trees from predators while they are alive, can leach into water and poison wildlife (Canadian Geographic Online, 2008). Newspaper is a highly recyclable material in Malaysia. It will be contaminated when mix together with organic waste and will lower the grade. Newspaper consists of combination of fibers that are stick together. Sometimes wide variety of synthetic fibers, such as polypropylene and polyethylene, may be incorporated into paper as a way of imparting desirable physical properties. The aim of this study is mainly to determine the suitability of two type of bedding materials which are newspaper and sawdust for vermicomposting. 2. Methodology2.1 Collection and culturing of earthworm The earthworms, Perionyx excavatus, were obtained from horses stable by digging up inside the composted horse manure (Figure 1). P. excavatus can be identified by its iridescent blue or violet sheen to its skin clearly visible under bright light. It is a very small worm, poorly suited as fishing bait, but has an impressive growth and reproductive rate far in excess of the other species grown in bin culture. This tropical worm species has very poor tolerance with low temperature fluctuations in the bin environment, handling or disruption to the system (Anphu Earthworm Farm, 2004). <<Figure 1. Perionyx excavatus in vermicomposter>> 2.2 Collection of horse manure The organic waste used to feed the earthworm is horses manure. It was collected from horses stable at Faculty of Veterinary, Universiti Putra Malaysia. The manure then air dried in the sun first before used. The main reason of using horses manure is because P. excavatus lived in the environment where the horses manure decomposed. Horse manure is used as feeding material to adapt P. excavatus to new environment. Another reason is it does not require addition of other material for moisture retention, aging, porosity and above all it does not require checking for the acidity of the bedding (Norbu, 2002). 2.3 Experimental Setup The experiments were performed in small plastic aquarium with 1.5 liter of volume (Figure 2). The surface of aquarium was coated with paint to ensure that the light will not penetrate into the bins. A total of 10 earthworm bins were build where four bins for each treatment and each treatment has two bins for control. In this experiment, newspaper and sawdust are used as bedding materials. To prepare the bedding, sawdust and shredded newspaper were weighed for 50g for each boxes and mix with 40g of horse manure. The bedding was put on the base of bin and sprays with water to moist the bedding. A total of 10 of earthworms were placed into each of the boxes with their mean weight been recorded and fed with horse manure. An optimal feeding rate of 0.75 kg feed/kg worm/day (Ndegwa et al., 1999) was applied to all treatments. The experiment was conducted for six weeks in open but shaded area in Faculty of Environmental Studies, UPM. <<Figure 2. Vermicomposter from coated plastic aquarium>>
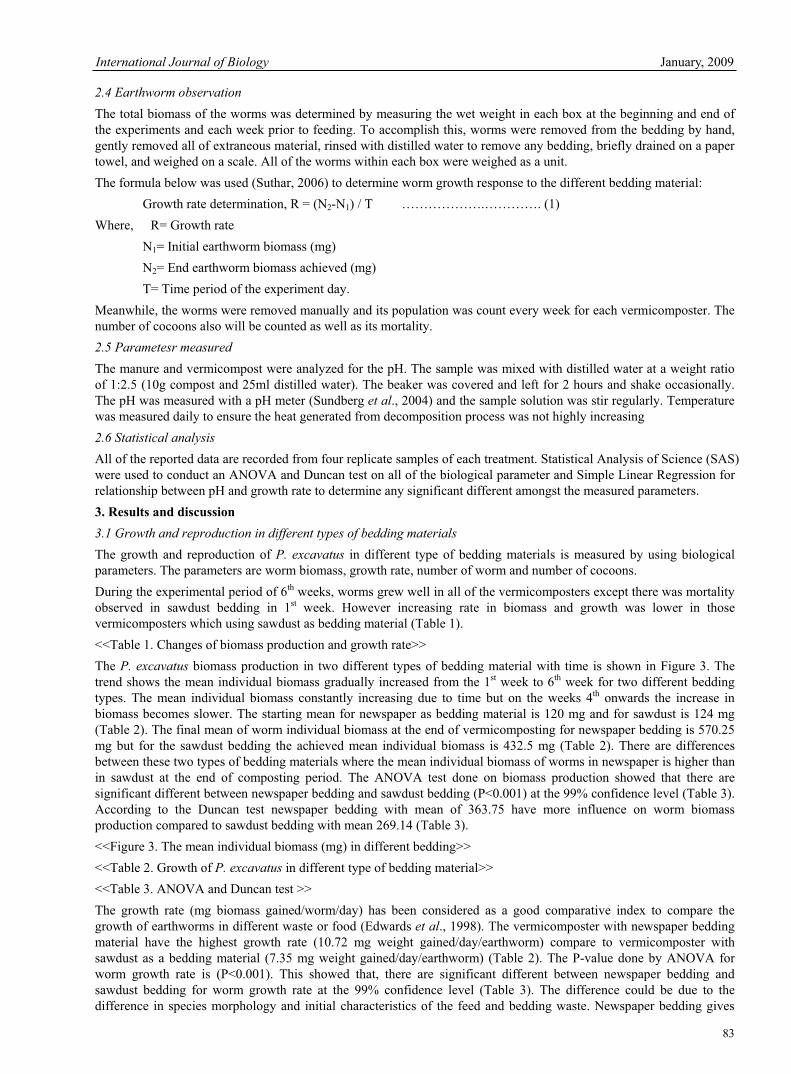
International Journal of Biology January, 2009
83
2.4 Earthworm observation The total biomass of the worms was determined by measuring the wet weight in each box at the beginning and end of the experiments and each week prior to feeding. To accomplish this, worms were removed from the bedding by hand, gently removed all of extraneous material, rinsed with distilled water to remove any bedding, briefly drained on a paper towel, and weighed on a scale. All of the worms within each box were weighed as a unit. The formula below was used (Suthar, 2006) to determine worm growth response to the different bedding material:
Growth rate determination, R = (N2-N1) / T ……………….…………. (1) Where, R= Growth rate
N1= Initial earthworm biomass (mg) N2= End earthworm biomass achieved (mg) T= Time period of the experiment day.
Meanwhile, the worms were removed manually and its population was count every week for each vermicomposter. The number of cocoons also will be counted as well as its mortality. 2.5 Parametesr measured The manure and vermicompost were analyzed for the pH. The sample was mixed with distilled water at a weight ratio of 1:2.5 (10g compost and 25ml distilled water). The beaker was covered and left for 2 hours and shake occasionally. The pH was measured with a pH meter (Sundberg et al., 2004) and the sample solution was stir regularly. Temperature was measured daily to ensure the heat generated from decomposition process was not highly increasing2.6 Statistical analysis All of the reported data are recorded from four replicate samples of each treatment. Statistical Analysis of Science (SAS) were used to conduct an ANOVA and Duncan test on all of the biological parameter and Simple Linear Regression for relationship between pH and growth rate to determine any significant different amongst the measured parameters. 3. Results and discussion 3.1 Growth and reproduction in different types of bedding materials The growth and reproduction of P. excavatus in different type of bedding materials is measured by using biological parameters. The parameters are worm biomass, growth rate, number of worm and number of cocoons. During the experimental period of 6th weeks, worms grew well in all of the vermicomposters except there was mortality observed in sawdust bedding in 1st week. However increasing rate in biomass and growth was lower in those vermicomposters which using sawdust as bedding material (Table 1). <<Table 1. Changes of biomass production and growth rate>> The P. excavatus biomass production in two different types of bedding material with time is shown in Figure 3. The trend shows the mean individual biomass gradually increased from the 1st week to 6th week for two different bedding types. The mean individual biomass constantly increasing due to time but on the weeks 4th onwards the increase in biomass becomes slower. The starting mean for newspaper as bedding material is 120 mg and for sawdust is 124 mg (Table 2). The final mean of worm individual biomass at the end of vermicomposting for newspaper bedding is 570.25 mg but for the sawdust bedding the achieved mean individual biomass is 432.5 mg (Table 2). There are differences between these two types of bedding materials where the mean individual biomass of worms in newspaper is higher than in sawdust at the end of composting period. The ANOVA test done on biomass production showed that there are significant different between newspaper bedding and sawdust bedding (P<0.001) at the 99% confidence level (Table 3). According to the Duncan test newspaper bedding with mean of 363.75 have more influence on worm biomass production compared to sawdust bedding with mean 269.14 (Table 3). <<Figure 3. The mean individual biomass (mg) in different bedding>> <<Table 2. Growth of P. excavatus in different type of bedding material>> <<Table 3. ANOVA and Duncan test >> The growth rate (mg biomass gained/worm/day) has been considered as a good comparative index to compare the growth of earthworms in different waste or food (Edwards et al., 1998). The vermicomposter with newspaper bedding material have the highest growth rate (10.72 mg weight gained/day/earthworm) compare to vermicomposter with sawdust as a bedding material (7.35 mg weight gained/day/earthworm) (Table 2). The P-value done by ANOVA for worm growth rate is (P<0.001). This showed that, there are significant different between newspaper bedding and sawdust bedding for worm growth rate at the 99% confidence level (Table 3). The difference could be due to the difference in species morphology and initial characteristics of the feed and bedding waste. Newspaper bedding gives
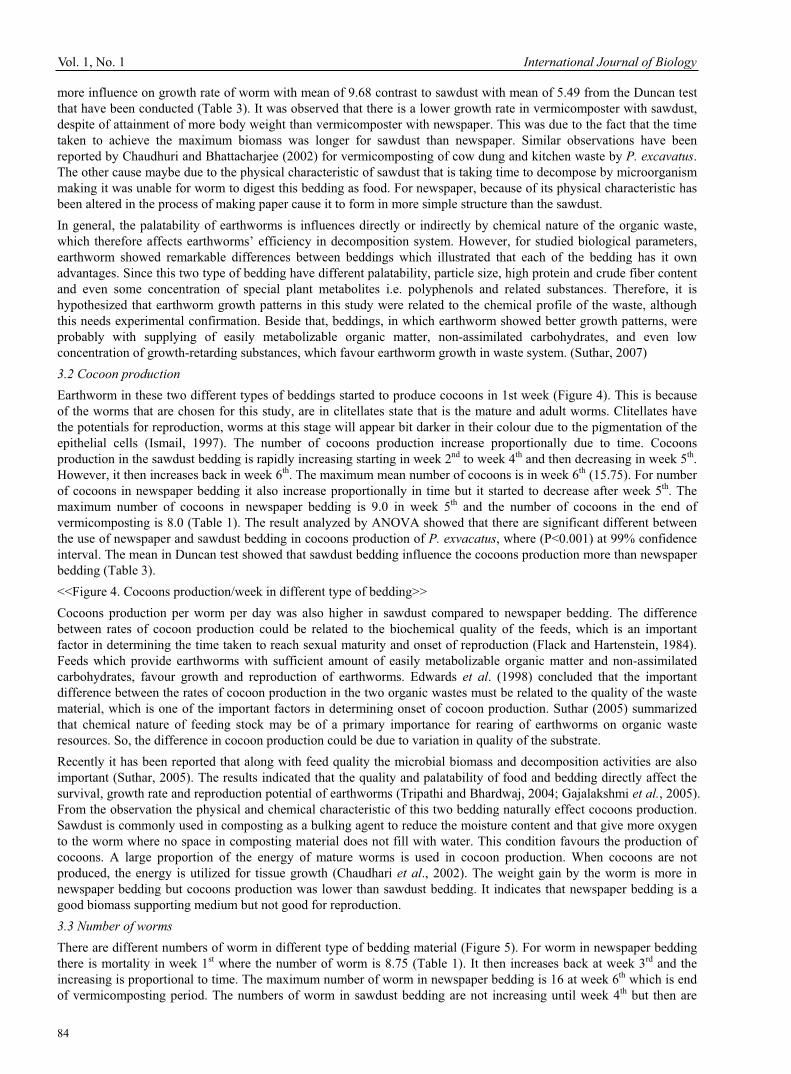
Vol. 1, No. 1 International Journal of Biology
84
more influence on growth rate of worm with mean of 9.68 contrast to sawdust with mean of 5.49 from the Duncan test that have been conducted (Table 3). It was observed that there is a lower growth rate in vermicomposter with sawdust, despite of attainment of more body weight than vermicomposter with newspaper. This was due to the fact that the time taken to achieve the maximum biomass was longer for sawdust than newspaper. Similar observations have been reported by Chaudhuri and Bhattacharjee (2002) for vermicomposting of cow dung and kitchen waste by P. excavatus.The other cause maybe due to the physical characteristic of sawdust that is taking time to decompose by microorganism making it was unable for worm to digest this bedding as food. For newspaper, because of its physical characteristic has been altered in the process of making paper cause it to form in more simple structure than the sawdust. In general, the palatability of earthworms is influences directly or indirectly by chemical nature of the organic waste, which therefore affects earthworms’ efficiency in decomposition system. However, for studied biological parameters, earthworm showed remarkable differences between beddings which illustrated that each of the bedding has it own advantages. Since this two type of bedding have different palatability, particle size, high protein and crude fiber content and even some concentration of special plant metabolites i.e. polyphenols and related substances. Therefore, it is hypothesized that earthworm growth patterns in this study were related to the chemical profile of the waste, although this needs experimental confirmation. Beside that, beddings, in which earthworm showed better growth patterns, were probably with supplying of easily metabolizable organic matter, non-assimilated carbohydrates, and even low concentration of growth-retarding substances, which favour earthworm growth in waste system. (Suthar, 2007) 3.2 Cocoon production Earthworm in these two different types of beddings started to produce cocoons in 1st week (Figure 4). This is because of the worms that are chosen for this study, are in clitellates state that is the mature and adult worms. Clitellates have the potentials for reproduction, worms at this stage will appear bit darker in their colour due to the pigmentation of the epithelial cells (Ismail, 1997). The number of cocoons production increase proportionally due to time. Cocoons production in the sawdust bedding is rapidly increasing starting in week 2nd to week 4th and then decreasing in week 5th.However, it then increases back in week 6th. The maximum mean number of cocoons is in week 6th (15.75). For number of cocoons in newspaper bedding it also increase proportionally in time but it started to decrease after week 5th. The maximum number of cocoons in newspaper bedding is 9.0 in week 5th and the number of cocoons in the end of vermicomposting is 8.0 (Table 1). The result analyzed by ANOVA showed that there are significant different between the use of newspaper and sawdust bedding in cocoons production of P. exvacatus, where (P<0.001) at 99% confidence interval. The mean in Duncan test showed that sawdust bedding influence the cocoons production more than newspaper bedding (Table 3). <<Figure 4. Cocoons production/week in different type of bedding>> Cocoons production per worm per day was also higher in sawdust compared to newspaper bedding. The difference between rates of cocoon production could be related to the biochemical quality of the feeds, which is an important factor in determining the time taken to reach sexual maturity and onset of reproduction (Flack and Hartenstein, 1984). Feeds which provide earthworms with sufficient amount of easily metabolizable organic matter and non-assimilated carbohydrates, favour growth and reproduction of earthworms. Edwards et al. (1998) concluded that the important difference between the rates of cocoon production in the two organic wastes must be related to the quality of the waste material, which is one of the important factors in determining onset of cocoon production. Suthar (2005) summarized that chemical nature of feeding stock may be of a primary importance for rearing of earthworms on organic waste resources. So, the difference in cocoon production could be due to variation in quality of the substrate. Recently it has been reported that along with feed quality the microbial biomass and decomposition activities are also important (Suthar, 2005). The results indicated that the quality and palatability of food and bedding directly affect the survival, growth rate and reproduction potential of earthworms (Tripathi and Bhardwaj, 2004; Gajalakshmi et al., 2005). From the observation the physical and chemical characteristic of this two bedding naturally effect cocoons production. Sawdust is commonly used in composting as a bulking agent to reduce the moisture content and that give more oxygen to the worm where no space in composting material does not fill with water. This condition favours the production of cocoons. A large proportion of the energy of mature worms is used in cocoon production. When cocoons are not produced, the energy is utilized for tissue growth (Chaudhari et al., 2002). The weight gain by the worm is more in newspaper bedding but cocoons production was lower than sawdust bedding. It indicates that newspaper bedding is a good biomass supporting medium but not good for reproduction. 3.3 Number of worms There are different numbers of worm in different type of bedding material (Figure 5). For worm in newspaper bedding there is mortality in week 1st where the number of worm is 8.75 (Table 1). It then increases back at week 3rd and the increasing is proportional to time. The maximum number of worm in newspaper bedding is 16 at week 6th which is end of vermicomposting period. The numbers of worm in sawdust bedding are not increasing until week 4th but then are
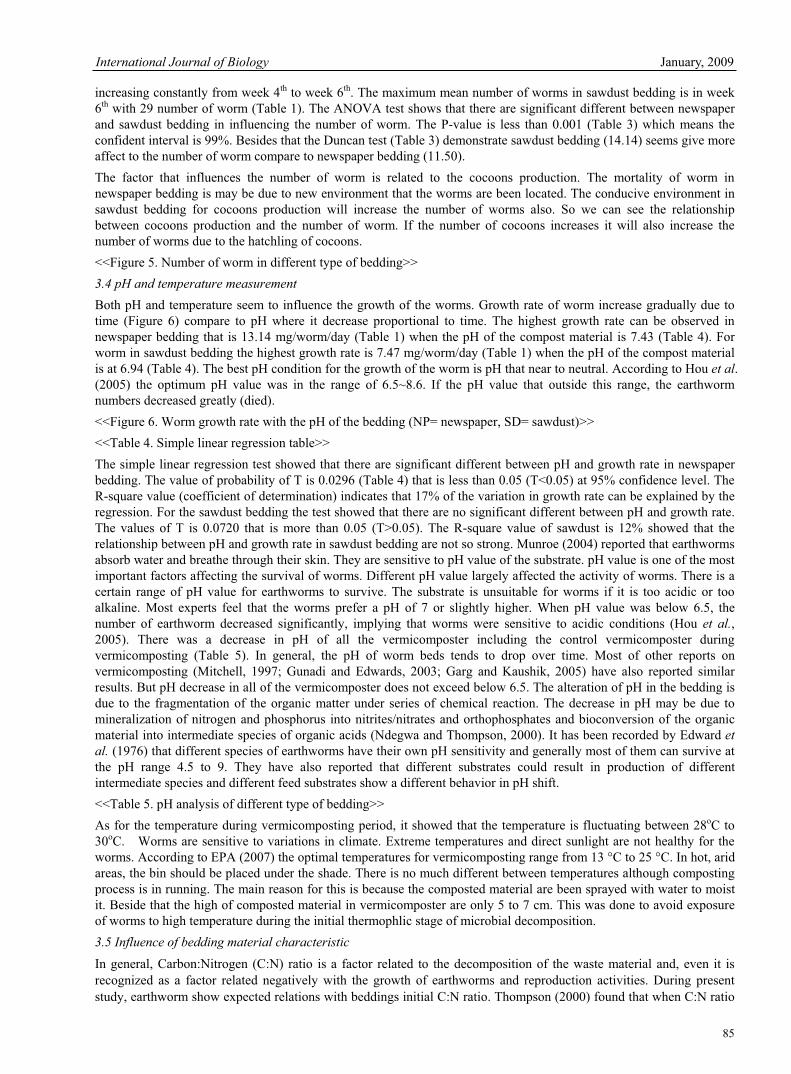
International Journal of Biology January, 2009
85
increasing constantly from week 4th to week 6th. The maximum mean number of worms in sawdust bedding is in week 6th with 29 number of worm (Table 1). The ANOVA test shows that there are significant different between newspaper and sawdust bedding in influencing the number of worm. The P-value is less than 0.001 (Table 3) which means the confident interval is 99%. Besides that the Duncan test (Table 3) demonstrate sawdust bedding (14.14) seems give more affect to the number of worm compare to newspaper bedding (11.50). The factor that influences the number of worm is related to the cocoons production. The mortality of worm in newspaper bedding is may be due to new environment that the worms are been located. The conducive environment in sawdust bedding for cocoons production will increase the number of worms also. So we can see the relationship between cocoons production and the number of worm. If the number of cocoons increases it will also increase the number of worms due to the hatchling of cocoons. <<Figure 5. Number of worm in different type of bedding>> 3.4 pH and temperature measurement Both pH and temperature seem to influence the growth of the worms. Growth rate of worm increase gradually due to time (Figure 6) compare to pH where it decrease proportional to time. The highest growth rate can be observed in newspaper bedding that is 13.14 mg/worm/day (Table 1) when the pH of the compost material is 7.43 (Table 4). For worm in sawdust bedding the highest growth rate is 7.47 mg/worm/day (Table 1) when the pH of the compost material is at 6.94 (Table 4). The best pH condition for the growth of the worm is pH that near to neutral. According to Hou et al.(2005) the optimum pH value was in the range of 6.5~8.6. If the pH value that outside this range, the earthworm numbers decreased greatly (died). <<Figure 6. Worm growth rate with the pH of the bedding (NP= newspaper, SD= sawdust)>> <<Table 4. Simple linear regression table>> The simple linear regression test showed that there are significant different between pH and growth rate in newspaper bedding. The value of probability of T is 0.0296 (Table 4) that is less than 0.05 (T<0.05) at 95% confidence level. The R-square value (coefficient of determination) indicates that 17% of the variation in growth rate can be explained by the regression. For the sawdust bedding the test showed that there are no significant different between pH and growth rate. The values of T is 0.0720 that is more than 0.05 (T>0.05). The R-square value of sawdust is 12% showed that the relationship between pH and growth rate in sawdust bedding are not so strong. Munroe (2004) reported that earthworms absorb water and breathe through their skin. They are sensitive to pH value of the substrate. pH value is one of the most important factors affecting the survival of worms. Different pH value largely affected the activity of worms. There is a certain range of pH value for earthworms to survive. The substrate is unsuitable for worms if it is too acidic or too alkaline. Most experts feel that the worms prefer a pH of 7 or slightly higher. When pH value was below 6.5, the number of earthworm decreased significantly, implying that worms were sensitive to acidic conditions (Hou et al.,2005). There was a decrease in pH of all the vermicomposter including the control vermicomposter during vermicomposting (Table 5). In general, the pH of worm beds tends to drop over time. Most of other reports on vermicomposting (Mitchell, 1997; Gunadi and Edwards, 2003; Garg and Kaushik, 2005) have also reported similar results. But pH decrease in all of the vermicomposter does not exceed below 6.5. The alteration of pH in the bedding is due to the fragmentation of the organic matter under series of chemical reaction. The decrease in pH may be due to mineralization of nitrogen and phosphorus into nitrites/nitrates and orthophosphates and bioconversion of the organic material into intermediate species of organic acids (Ndegwa and Thompson, 2000). It has been recorded by Edward etal. (1976) that different species of earthworms have their own pH sensitivity and generally most of them can survive at the pH range 4.5 to 9. They have also reported that different substrates could result in production of different intermediate species and different feed substrates show a different behavior in pH shift. <<Table 5. pH analysis of different type of bedding>> As for the temperature during vermicomposting period, it showed that the temperature is fluctuating between 28oC to 30oC. Worms are sensitive to variations in climate. Extreme temperatures and direct sunlight are not healthy for the worms. According to EPA (2007) the optimal temperatures for vermicomposting range from 13 °C to 25 °C. In hot, arid areas, the bin should be placed under the shade. There is no much different between temperatures although composting process is in running. The main reason for this is because the composted material are been sprayed with water to moist it. Beside that the high of composted material in vermicomposter are only 5 to 7 cm. This was done to avoid exposure of worms to high temperature during the initial thermophlic stage of microbial decomposition. 3.5 Influence of bedding material characteristic In general, Carbon:Nitrogen (C:N) ratio is a factor related to the decomposition of the waste material and, even it is recognized as a factor related negatively with the growth of earthworms and reproduction activities. During present study, earthworm show expected relations with beddings initial C:N ratio. Thompson (2000) found that when C:N ratio
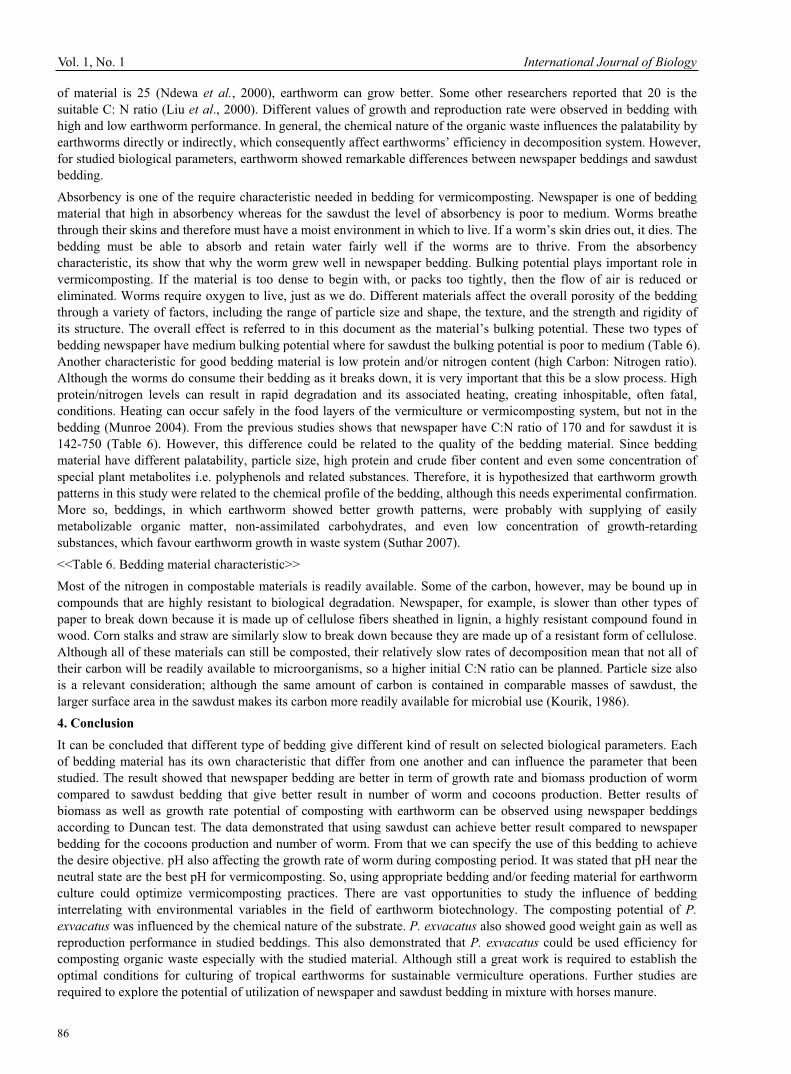
Vol. 1, No. 1 International Journal of Biology
86
of material is 25 (Ndewa et al., 2000), earthworm can grow better. Some other researchers reported that 20 is the suitable C: N ratio (Liu et al., 2000). Different values of growth and reproduction rate were observed in bedding with high and low earthworm performance. In general, the chemical nature of the organic waste influences the palatability by earthworms directly or indirectly, which consequently affect earthworms’ efficiency in decomposition system. However, for studied biological parameters, earthworm showed remarkable differences between newspaper beddings and sawdust bedding. Absorbency is one of the require characteristic needed in bedding for vermicomposting. Newspaper is one of bedding material that high in absorbency whereas for the sawdust the level of absorbency is poor to medium. Worms breathe through their skins and therefore must have a moist environment in which to live. If a worm’s skin dries out, it dies. The bedding must be able to absorb and retain water fairly well if the worms are to thrive. From the absorbency characteristic, its show that why the worm grew well in newspaper bedding. Bulking potential plays important role in vermicomposting. If the material is too dense to begin with, or packs too tightly, then the flow of air is reduced or eliminated. Worms require oxygen to live, just as we do. Different materials affect the overall porosity of the bedding through a variety of factors, including the range of particle size and shape, the texture, and the strength and rigidity of its structure. The overall effect is referred to in this document as the material’s bulking potential. These two types of bedding newspaper have medium bulking potential where for sawdust the bulking potential is poor to medium (Table 6). Another characteristic for good bedding material is low protein and/or nitrogen content (high Carbon: Nitrogen ratio). Although the worms do consume their bedding as it breaks down, it is very important that this be a slow process. High protein/nitrogen levels can result in rapid degradation and its associated heating, creating inhospitable, often fatal, conditions. Heating can occur safely in the food layers of the vermiculture or vermicomposting system, but not in the bedding (Munroe 2004). From the previous studies shows that newspaper have C:N ratio of 170 and for sawdust it is 142-750 (Table 6). However, this difference could be related to the quality of the bedding material. Since bedding material have different palatability, particle size, high protein and crude fiber content and even some concentration of special plant metabolites i.e. polyphenols and related substances. Therefore, it is hypothesized that earthworm growth patterns in this study were related to the chemical profile of the bedding, although this needs experimental confirmation. More so, beddings, in which earthworm showed better growth patterns, were probably with supplying of easily metabolizable organic matter, non-assimilated carbohydrates, and even low concentration of growth-retarding substances, which favour earthworm growth in waste system (Suthar 2007). <<Table 6. Bedding material characteristic>> Most of the nitrogen in compostable materials is readily available. Some of the carbon, however, may be bound up in compounds that are highly resistant to biological degradation. Newspaper, for example, is slower than other types of paper to break down because it is made up of cellulose fibers sheathed in lignin, a highly resistant compound found in wood. Corn stalks and straw are similarly slow to break down because they are made up of a resistant form of cellulose. Although all of these materials can still be composted, their relatively slow rates of decomposition mean that not all of their carbon will be readily available to microorganisms, so a higher initial C:N ratio can be planned. Particle size also is a relevant consideration; although the same amount of carbon is contained in comparable masses of sawdust, the larger surface area in the sawdust makes its carbon more readily available for microbial use (Kourik, 1986). 4. Conclusion It can be concluded that different type of bedding give different kind of result on selected biological parameters. Each of bedding material has its own characteristic that differ from one another and can influence the parameter that been studied. The result showed that newspaper bedding are better in term of growth rate and biomass production of worm compared to sawdust bedding that give better result in number of worm and cocoons production. Better results of biomass as well as growth rate potential of composting with earthworm can be observed using newspaper beddings according to Duncan test. The data demonstrated that using sawdust can achieve better result compared to newspaper bedding for the cocoons production and number of worm. From that we can specify the use of this bedding to achieve the desire objective. pH also affecting the growth rate of worm during composting period. It was stated that pH near the neutral state are the best pH for vermicomposting. So, using appropriate bedding and/or feeding material for earthworm culture could optimize vermicomposting practices. There are vast opportunities to study the influence of bedding interrelating with environmental variables in the field of earthworm biotechnology. The composting potential of P.exvacatus was influenced by the chemical nature of the substrate. P. exvacatus also showed good weight gain as well as reproduction performance in studied beddings. This also demonstrated that P. exvacatus could be used efficiency for composting organic waste especially with the studied material. Although still a great work is required to establish the optimal conditions for culturing of tropical earthworms for sustainable vermiculture operations. Further studies are required to explore the potential of utilization of newspaper and sawdust bedding in mixture with horses manure.

International Journal of Biology January, 2009
87
References Anphu Earthworm Farm (2004). About Peronyx excavatus. [Online] Available. http://[email protected]. (April 15, 2008). Benitez, E., Nogales, R., Masciandro, G. & Ceccanti, B. (2000). Isolation by isoelectric focusing of humic–urease complexes from earthworm (Eisenia fetida) processed sewage sludges. Biology and Fertility of Soils, 31, 489–493. Bhardwaj, K. K. R. (1995). Recycling of crop residues oilcakes and other plant products in agriculture. In H. L. S. Tandon (Ed.), Recycling of crop, animal, human and industrial wastes in agriculture. New Delhi: Fertilizer Development and Consultation Organization. pp 9–30. Canadian Geographic Online. (2008). Toxic solution: Sawyers lumber under new environmental policies. [Online] Available: http://www.canadiangeographic.ca/magazine/SO05/indepth /environment (April 4, 2008). Chaudhari, P. S. & Bhattacharjee, G. (2002). Capacity of various experimental diets to support biomass and reproduction of Perionyx excavatus. Bioresourse Technology, 82, 147–150. Edwards, C. A., Dominguez, J. & Neuhauser, E. F. (1998). Growth and reproduction of Perionyx excavatus (Per.) (Megascolecidae) as factors in organic waste management. Biology Fertility of Soils, 27, 155–161. Environmental Protection Agency (EPA). (2007). Vermcomposting. [Online] Available: http://www.epa.gov/ compost/vermi.htm (April 7, 2008). Flack, F. M. & Hartenstein, R. (1984). Growth of the earthworm Eisenia foetida on microorganisms and cellulose. Soil Biology of Biochemistry, 16, 126-130. Gajalakshmi, S., Ramasamy, E. V. & Abbasi, S. A. (2005). Composting vermicomposting of leaf litter ensuing from the trees of mango (Magnifera indica). Bioresource Technology, 96, 1057–1061. Garg, V. K. & Kaushik, P. (2005). Vermistabilization of textile mill sludge spiked with poultry droppings by an epigeic earthworm Eisenia foetida. Bioresource Technology, 96, 1063– 1071. Ghatnekar, S.D., Mahavash, F.K., Ghatnegar, G.S., (1998). Management of solid waste through vermiculture biotechnology, Ecotechnology for pollution control and Environmental Management. pp 58- 67. Gunadi, B. & Edwards, C. A. (2003) The effect of multiple applications of different organic wastes on the growth, fecundity and survival of Eisenia foetida (Savigny) (Lumbricidae). Pedobiologia, 47(4), 321–330. Hansen, D. (2007).Vermicomposting:innovative kitchen help. [Online] Available: http://www.dnr.mo.gov/env/swmp/docs/vermicomposting.pdf (April, 12 2008). Hou, J., Qian, Y., Liu, G. & Dong, R. (2005). The influence of temperature, pH and C/N ratio on the growth and survival of earthworms in municipal solid waste. Agricultural Engineering International. The CIGR Ejournal. Manuscript. Vol. 7.Ismail, S. A. (1997). Vermicolgy - biology of earthworms. Chennai: Orient Longman Limited. Kourik, R. (1986). Designing and maintaining your edible landscape naturally. [Online] Available: http://www.oregonbd.org/Class/CtoN.htm (April 1, 2008). Martin, A. & Lavelle, P. (1992). Effect of soil organic matter quality on its assimilation by Millsonia anomala, a tropical geophagous earthworm. Soil Biology and Biochemistry, 24, 1535-1538. Mitchell, A. (1997). Production of Eisenia foetida and vermicompost from feedlot cattle manure. Soil Biology and Biochemistry, 29, 763–766. Mishra, M. M., Kukreja, K., Kapoor, K. K. & Bangar, K. C. (1989). Organic recycling for plant nutrients. In L. L. Somani, & C. S. Bhandari (Eds.), Soil Microorganisms and Crop Growth. Jodhpur: Divyajyoti Parkashan. pp 195–232. Munroe,G. (2004). Manual of on-farm vermicomposting and vermiculture. [Online] Available: http://www.organicagcentre.ca/DOCs/Vermiculture_FarmersManual_gm.pdf (September 15, 2007). Ndegwa, P. M. & Thompson, S. S. (2001). Integrating composting and vermicomposting in the treatment and bioconversion of biosolids. Bioresource Technology, 76, 107–112. Norbu, T. (2002). Pretreatment of municipal solid waste by windrow composting and vermicomposting. [Online] Available: http://www.faculty. ait.ac.th /visu/data/AIT-Thesis /Master%20Thesis%20final /Tenzin% 20pdf% 2002. pdf (February 1, 2008). Ronald, E. G. & Donald, E. D. (1977). Earthworms for ecology and profit: Scientific Earthworm Farming. Ontario: Bookworm Publishing Company.Sundberg, C., Smars, S. & Jonsson, H. (2004). Low pH as an inhibiting factor in the transaction from the mesophilic to thermophilic phase in composting. Bioresource Technology, 95, 145-150.
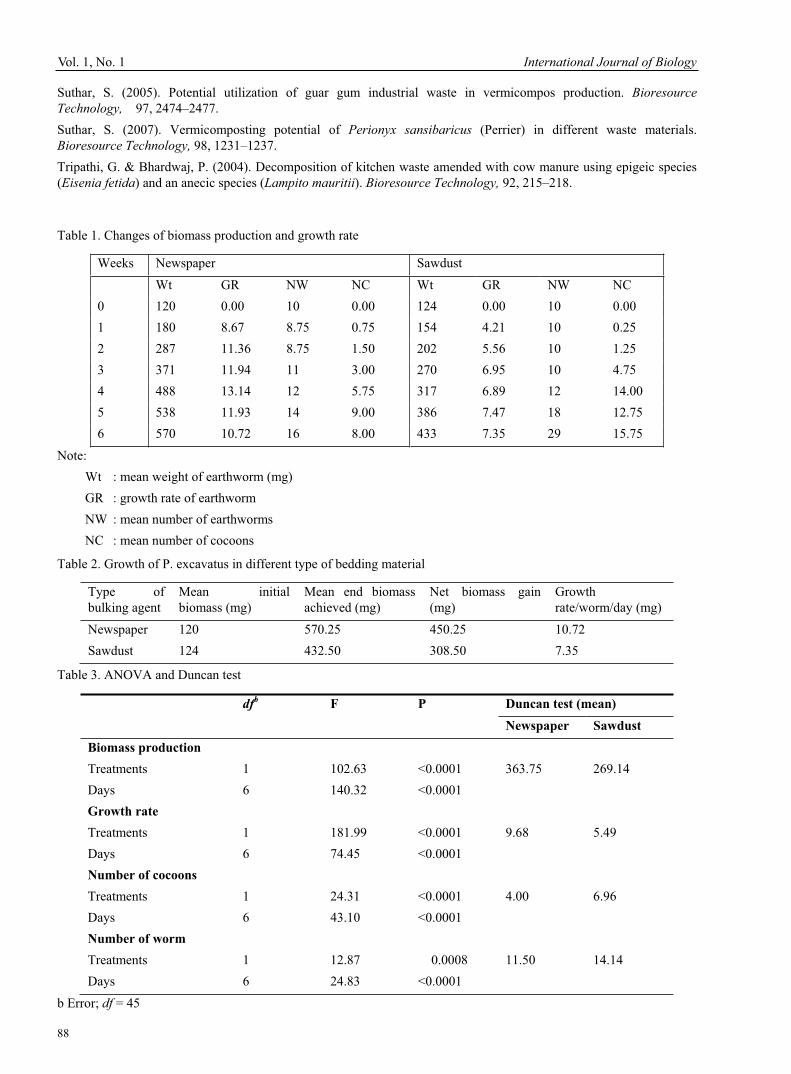
Vol. 1, No. 1 International Journal of Biology
88
Suthar, S. (2005). Potential utilization of guar gum industrial waste in vermicompos production. Bioresource Technology, 97, 2474–2477. Suthar, S. (2007). Vermicomposting potential of Perionyx sansibaricus (Perrier) in different waste materials. Bioresource Technology, 98, 1231–1237.Tripathi, G. & Bhardwaj, P. (2004). Decomposition of kitchen waste amended with cow manure using epigeic species (Eisenia fetida) and an anecic species (Lampito mauritii). Bioresource Technology, 92, 215–218.
Table 1. Changes of biomass production and growth rate
Weeks Newspaper Sawdust
Wt GR NW NC Wt GR NW NC 0 120 0.00 10 0.00 124 0.00 10 0.00 1 180 8.67 8.75 0.75 154 4.21 10 0.25 2 287 11.36 8.75 1.50 202 5.56 10 1.25 3 371 11.94 11 3.00 270 6.95 10 4.75 4 488 13.14 12 5.75 317 6.89 12 14.00 5 538 11.93 14 9.00 386 7.47 18 12.75 6 570 10.72 16 8.00 433 7.35 29 15.75
Note: Wt : mean weight of earthworm (mg) GR : growth rate of earthworm NW : mean number of earthworms NC : mean number of cocoons
Table 2. Growth of P. excavatus in different type of bedding material
Type of bulking agent
Mean initial biomass (mg)
Mean end biomass achieved (mg)
Net biomass gain (mg)
Growth rate/worm/day (mg)
Newspaper 120 570.25 450.25 10.72 Sawdust 124 432.50 308.50 7.35
Table 3. ANOVA and Duncan test
dfb F P Duncan test (mean) Newspaper Sawdust
Biomass production Treatments Days
16
102.63 140.32
<0.0001 <0.0001
363.75 269.14
Growth rate Treatments Days
16
181.99 74.45
<0.0001 <0.0001
9.68 5.49
Number of cocoons Treatments Days
16
24.31 43.10
<0.0001 <0.0001
4.00 6.96
Number of worm Treatments Days
16
12.87 24.83
0.0008 <0.0001
11.50 14.14
b Error; df = 45

International Journal of Biology January, 2009
89
Table 4. Simple linear regression table
Type of Bedding Prob > T R-Square (%)
Newspaper 0.0296 17 Sawdust 0.0720 12
Table 5. pH analysis of different type of bedding
Days Newspaper Sawdust
Experiment Control Experiment Control
0 7.87 7.15 7.53 7.23 7 7.84 7.43 7.83 7.77 14 7.70 7.67 8.13 7.94 21 7.53 7.25 7.93 7.85 28 7.43 6.83 7.34 7.46 35 7.27 6.74 6.94 6.84 42 6.92 6.75 6.68 6.51
Table 6. Bedding material characteristic
Type of bedding Absorbency Bulking potential C:N ratio
Newspaper Good Medium 170-812:1 Sawdust Poor-medium Poor-medium 142-750:1
Sources: Kourik, 1986; Munroe, 2004
Figure 1. Perionyx excavatus in Vermicomposter

Vol. 1, No. 1 International Journal of Biology
90
Figure 2. Vermicomposter from Coated Plastic Aquarium
100150200250300350400450500550600
0 1 2 3 4 5 6 7
Time (Weeks)
Mea
n in
divi
dual
bio
mas
s (m
g)
Newspaper Sawdust
Figure 3. The Mean Individual Biomass (mg) in Different Bedding
0
2
4
6
8
10
12
14
16
18
0 1 2 3 4 5 6 7
Time (weeks)
Num
ber o
f coc
oons
Newspaper Sawdust
Figure 4. Cocoons Production/week in Different Types of Bedding
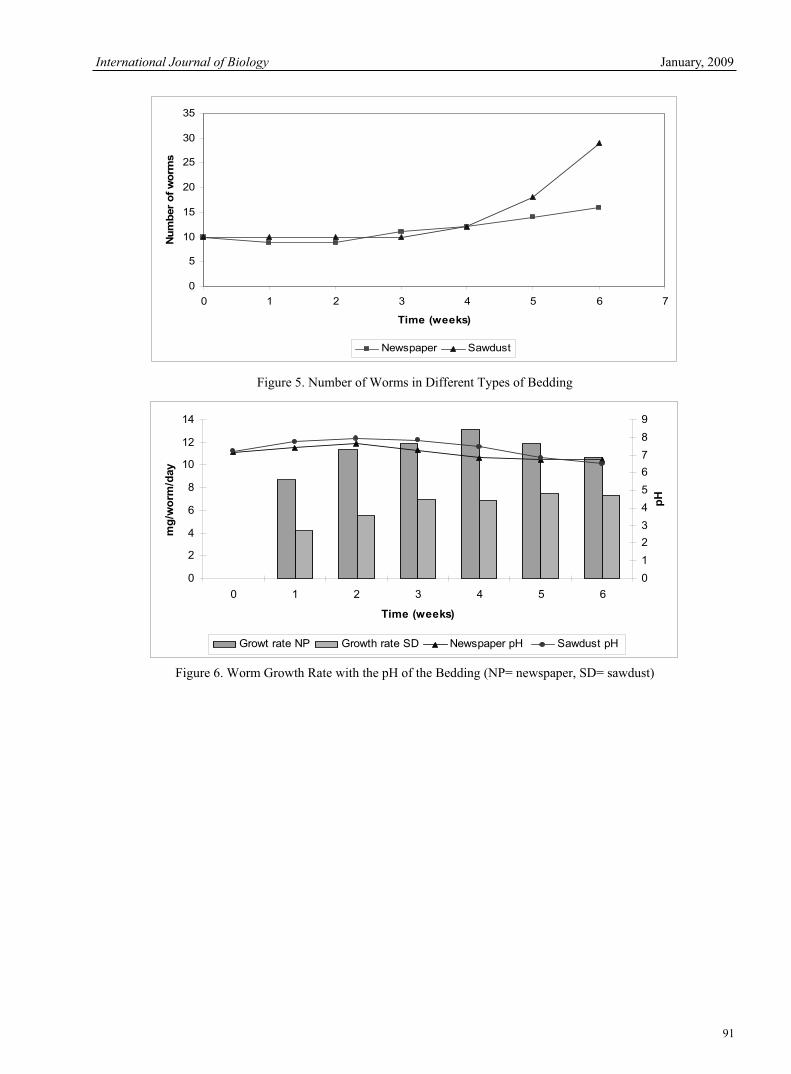
International Journal of Biology January, 2009
91
0
5
10
15
20
25
30
35
0 1 2 3 4 5 6 7
Time (weeks)
Num
ber
of w
orm
s
Newspaper Sawdust
Figure 5. Number of Worms in Different Types of Bedding
0
2
4
6
8
10
12
14
0 1 2 3 4 5 6
Time (weeks)
mg/
wor
m/d
ay
0123456789
pHGrowt rate NP Growth rate SD Newspaper pH Sawdust pH
Figure 6. Worm Growth Rate with the pH of the Bedding (NP= newspaper, SD= sawdust)
Vol. 1, No. 1 International Journal of Biology
92
Cloning and Characterization of NAD-dependent Deacetylase Sirtuin 2 Homolog from the Silkworm, Bombyx mori.
Yijia Li Institute of Life Sciences, Jiangsu University 301 Xuefu Road, Zhenjiang 212013, China
E-mail: [email protected]
Keping Chen (Corresponding author) Institute of Life Sciences, Jiangsu University 301 Xuefu Road, Zhenjiang 212013, China
E-mail: [email protected]
Qin Yao Institute of Life Sciences, Jiangsu University 301 Xuefu Road, Zhenjiang 212013, China
E-mail: [email protected]
Lu Gao Institute of Life Sciences, Jiangsu University 301 Xuefu Road, Zhenjiang 212013, China
E-mail: [email protected]
Jun Li Institute of Life Sciences, Jiangsu University 301 Xuefu Road, Zhenjiang 212013, China
E-mail: [email protected]
Lin Wang Beijing Entry-Exit Inspection and Quarantine Bureau
No. 6 Tianshuiyuan Street, Chaoyang District, Beijing 100026, China
The research is financed by the National “863” project of China. NO. 2008AA10Z145 and the National Basic Research Program of China. No.2005CB121000. (Sponsoring information)Abstract Sirtuin2 (Sirt2) is a kind of NAD+-dependent deacetylases ranging from bacteria to human and play an important role in many biological processes especially in lifespan. We performed genome analysis and protein prediction of Sirt2 of B.mori (BmSirt2). The cDNA sequence of BmSirt2 contains an ORF of 1164 bp encoding 387 amino acid residues with a
International Journal of Biology January, 2009
93
predicted molecular mass and isoelectric point of 43.37 kDa and 5.02, respectively. This protein shows high degrees of identity with other species. Phylogenetic relationship analysis showed that the BmSirt2 protein was in the same subgroup as the Sirt2 from invertebrate animals. RT-PCR analysis of gene expression in multiple tissues showed that Sirt2 gene was widely expressed in B. mori. BmSirt2 was successfully expressed in E. coli with a molecular mass of 48.0 kDa. The identification of the recombinant protein by MALDI-TOF-MS and western blotting showed this fusion protein was the correct one.Keywords: Bombyx mori, Sirtuin2, Bioinformatics, RT-PCR, Prokaryotic expression, Mass spectrographic 1. Introduction Sirt2 enzymes, also known as sirtuins, or silence information regulator (Sir), comprise an ancient family of NAD+-dependent deacetylases conserved from bacteria to human and play a role in a wide variety of important biological processes, including development, heterochromatin formation, transcriptional silencing, DNA recombination and repair, genome stability, apoptosis, axonal protection, fat mobilization, metabolic regulation, and longevity (Avalos, Bever, & Wolberger, 2005, p.855; Hoff et al., 2006, p.1231). Sirtuins link aging, cancer, and diet and thus are potential molecular targets for the development of pharmaceuticals to treat human metabolic and neurological diseases and malignancy (Schuetz et al., 2007, p.377). Sirt2 enzymes comprise a universally conserved family of NAD+-dependent deacetylases, which of the reaction can be thought of as occurring by a two-step mechanism. In the first step, two substrates, an acetylated protein and NAD, interact with the active site of the enzyme. The first reaction is reversible in the presence of excess nicotinamide: NAD + enzyme + acetyl-lysine nicotinamide + enzyme~ADP-ribose·acetyl-lysine. (1) In the second step the high-energy ADP-ribose intermediate reacts with the acetyl group on the e amino group of the lysine: Enzyme ~ ADP-ribose·acetyl-lysine lysine + enzyme + acetyl-ADP-ribose. (2) (Landry & Sternglanz, 2003, p.34). Sirtuins was first found in S. accharomyces cereviae and ranging from bacteria to humans. The hallmark of the family is a domain of approximately 260 amino acids that has a high degree of sequence similarity in all sirtuins. The family is divided into five classes (I-IV and U) on the basis of a phylogenetic analysis of 60 sirtuins from a wide array of organisms (Frye, 2000, p.793). Class I and class IV are further divided into three and two subgroups, respectively. The U-class sirtuins are found only in Gram-positive bacteria. The S. cerevisiae genome encodes five sirtuins, Sir2p and four additional proteins termed ‘homologs of sir two’ (Hst1p-Hst4p) (North & Verdin, 2004, p.224.1).The human genome encodes seven sirtuins, with representatives from classes I-IV (Frye, 2000, p.793). In this paper, Sirt2 of Bombyx mori (BmSirt2) was cloned and analyzed with bioinformatics tools, including its genomic organization and the deduced amino acid sequence. The gene was confirmed by RT-PCR and prokaryotic expression. The deduced protein sequence was compared with that of some homologous protein from other species. 2. Materials and methods 2.1 Animals and RNA extraction The silkworm, B. mori used in this study, was reared routinely on fresh mulberry leaves at 25 °C. Epidermis, midgut, fat body, silk gland, hemolymph, nerve knot, testis and ovary were dissected and washed in PBS (137 mM NaCl, 2.7 mM KCl, 4.3 mM Na2HPO4 and 1.4 mM KH2PO4), frozen immediately in liquid nitrogen and stored at 80 °C until extraction of RNA. Total RNA was isolated from 30 mg each of B. mori larvae tissues using the RNeasy® Mini Kit (Qiagen, Valencia, CA, USA). The extracted RNA was treated with RNase-free DNase (Promega, Madison, WI, USA), then was used to synthesize first strand cDNA using the SuperScript II™ reverse transcriptase (Promega) following the manufacturer's instructions (Wang et al., 2008, p.177). 2.2 Genome analysis for BmSirt2 A putative cDNA of BmSirt2 (AB194684) was obtained by the BLAST program using XP_001350011 from Plasmodium falciparum (Chakrabarty et al., 2008, p.140). The DNAstar software was used to find the open reading frame (ORF). TATA box and poly-A signal was predicted by Primer premier software. SIM4 (http://pbil.univ-lyon1.fr/sim4.php) was used to align the cDNA sequence with the genomic sequences to search potential introns. SilkMap of BGI (http://silkworm.genomics.org.cn/) was used to find the location of BmSirt2 on Chromosome. 2.3 Protein prediction and analysis The deduced amino acid sequence was analyzed by the Expert Protein Analysis System (http://www.expasy.org/). Homologues were explored by BLASTP searching tool in the updated GenBank/EMBL databases. Multiple sequence
Vol. 1, No. 1 International Journal of Biology
94
alignment was performed by Clustal W (http://www.ebi.ac.uk/clustalw/) and edited using GeneDoc software. Phylogenetic relationships were assessed and trees generated by the neighbour-joining method using MEGA 3.1 (http://www.megasoftware.net). 2.4 Cloning, sequencing and expression of BmSirt2 An ORF region of BmSirt2 was amplified by PCR using the forward primer 5’-AGGATCCATGTCGGCAAATTCGCCT-3’ and the reverse primer 5’-ACTCGAGTCATTCCGAGGCACTGGG-3’ containing BamHI and XhoI restriction sites (underlined) respectively. Actin A3 was amplified using the forward primer 5’-GCGCGGCTACTCGTTCACTACC-3’ and the reverse primer 5’-GGATGTCCACGTCGCACTTCA-3’. PCR reaction was carried out for 35 amplification cycles (94 /30 sec, 62 /30 sec, 72 /1 min). The PCR product was ligated into pMD19-T (TaKaRa, Dalian) vector using T4 DNA ligase (TaKaRa, Dalian) and then transformed into E. coli (TG1 strain). After digestion with BamHI and XhoI from the plasmid pMD19-T/BmSirt2, the purified DNA fragment was ligated into expression vector pET-30a (Novagen) and introduced into E. coli BL21 (DE3) by transformation. Sequencing was performed in Shanghai Sangon Bio-technology Corporation using the plasmid pMD19-T/BmSirt2. The expression of recombinant BmSirt2 tagged with histidine residues was induced overnight at 28 by the addition of isopropyl- -D-thiogalactopyranoside (IPTG) to a final concentration of 1.0 mM when the optical density of the culture at 600 nm reached 0.5. A 10% sodium dodecyl sulfate-polyacrylamide gel electrophoresis (SDS-PAGE) was performed to analyze the fusion protein. 2.5 Identification of BmSirt2 The band corresponding to our recombinant BmSirt2 was excised as circular plugs 2-3 mm in diameter, and transferred to 1.5 ml Eppendorf tubes. Coomassie blue-stained gel pieces were first destained with 50 ul of 50% 50 mM NH4HCO3and 50% acetonitrile for 10 min, followed by three washes with 50 ul of MilliQ water. The gel pieces were then dehydrated with 100% acetonitrile for 5 min, and dried in a SpeedVac (Thermo Sacant) for 30 minutes. The dried gel particles were rehydrated at 4°C for 30 min with 2.5 uL/well trypsin (sequencing grade; Promega, Madison, WI) in 50 mM NH4HCO3 (20 ug/mL), and then incubated at 37°C overnight. Peptide mixture (1 ul) was mixed with 1ul 10 mg/ml a-Cyano-4-hydroxycinnamic acid (Sigma) and pointed on the MTP Anchor Chip (Bruker) and analyzed by matrix-assisted laser desorption/ionization-time of flight mass spectrometry (MALDI-TOF-MS) (ultraflex tof/tof, Bruker, Germany). The mass spectra were interpreted using the Mascot peptide mass fingerprint engine available on the web site (http://www.matrixscience.com) for protein identification. To identify the fusion protein further, the western blotting was performed using anti-His-tag antibody (TIANGEN, Beijing). 3. Results 3.1 The analysis of the nucleotide and amino acid sequences The sequence of a 1586 bp B. mori cDNA was obtained from GenBank under accession no. AB194684, which contains an ORF of 1164 bp encoding 387 amino acid residues sequence with a predicted molecular mass and isoelectric point of 43.37 kDa and 5.02, respectively (Figure 1). The amino acid sequence had a conserved SIR2 domain, which contains 183 amino acid residues from the position 334 to 882. No TATA box was found but two poly-A signals existed, which showed as AATAAA (Figure 1). Blasting the cDNA to contigs of B. mori genome in GenBank revealed that contig19687, Ctg001400, contig176714, contig484962 and contig544692 having a high similarity. After analyzing these five contigs, we found that contig19687 contained Ctg001400, contig176714, contig484962 and contig544692. Using SIM4, seven exons were found in the relevant DNA sequence. The length of the exons was 34bp, 267bp, 207bp, 150bp, 193bp, 187bp and 126bp, respectively (Figure 2). Furthermore, we also found BmSirt2 gene was located on Chromosome 25. 3.2 Protein prediction and analysis The deduced amino acid sequence shared 62% identity to Apis mellifera, 61% identity to Tribolium castaneum and Nasonia vitripennis, 60% identity to Anopheles gambiae, 59% identity to Ciona intestinalis and Homo sapiens, and 56% identity to Mus musculus. Multiple sequence alignment (Figure 3) showed that the deduced amino acid sequence of Sirt2 from B. mori shared high level identity among these sequences in the conserved domain, SIR2 Domain. To investigate the evolutionary relationships between Sirt2 of B. mori and other organisms, phylogenetic analysis was performed by neighbour-joining (NJ) method using MEGA 3.1 software (Kumar, Tamura, & Nei, 2004, pp.150-161). Phylogenetic relationship analysis was showed in Figure 4. 3.3 Cloning, sequencing and gene distribution The DNA fragment was obtained through PCR (Figure 5A) and the expression plasmid pET-30a/Sirt2 was successfully constructed. (Figure 5B). The result of sequencing showed that there were two different nucleotide acids, which was pointed in Figure 1. But this mutation was a kind of nonsense mutation and their amino acid residuces didn’t change.
International Journal of Biology January, 2009
95
Through semi-quantitative RT-PCR, BmSirt2 gene was detected in multiple tissues, including epidermis, midgut, fat body, silk gland, hemolymph, nerve knot, testis and ovary. This gene was expressed in all these tissues (Figure 6), which suggested that BmSirt2 was a very important and widely expressed gene in B. mori.3.4 Expression of BmSirt2 BmSirt2 was successfully expressed in transformed E. coli BL21 with the pET-30a vector. After induction with IPTG over night at 28 , the E. coli cells were collected from LB medium. SDS-PAGE analysis revealed that the recombination protein was overexpressed in a soluble form. Since the fusion protein had a His-tag at the N-terminus, its molecular weight was 48.0 kDa (Figure 7) which was higher than that of the predicted mass of 43.37 kDa. 3.5 Identification of BmSirt2 Two methods were utilized to identify the recombination protein. After identification by MALDI-TOF-MS, the peptide fragments of the recombination protein matched with the deduced amino acid sequence of Sirt2 from B. mori was showed in Figure 8 and Table 1. It indicated that the recombination protein we got was proved to be the BmSirt2 protein. Simultaneity, the western blotting using anti-His-tag antibody revealed that the fusion protein was the one we wanted to get. 4. Discussion Silkworm (B. mori) is an important economic insect and is regarded as a model insect of Lepidoptera. Studies on structures and functions of certain related genes in B. mori have attracted more and more attention. In this study, we cloned and analyzed the nucleotide sequences of BmSirt2 gene and further predicted its conserved domain. The gene includes an ORF of 1164 bp encoding 387 amino acid residues and the ORF contains seven exons. BmSirt2 gene locates on Chromosome 25 and is showed as a single copy gene. The deduced amino acid sequences show high identity to many other organisms, including from protista to mammals, especially among the SIR2 domain, which indicated that Sirt2 gene is conserved from invertebrates to mammals. Phylogenetic relationship analysis showed that the BmSirt2 protein was in the same subgroup as the Sirt2 from invertebrate animals, such as Tribolium castaneum,Apis Mellifera, Aedes aegypti, Anopheles gambiae, and Drosophila melanogaster.BmSirt2 gene was widely expressed in B. mori, including epidermis, midgut, fat body, silk gland, hemolymph, nerve knot, testis and ovary. It indicated that BmSirt2 gene may play an important role in many biological processes in almost all the tissues in B. mori. BmSirt2 was successfully expressed and identified by MALDI-TOF-MS and western blotting. The results showed that the recombination protein we got was proved to be the BmSirt2 protein. BmSirt2 can be expressed in a soluble form in E.coli and its fusion protein can be purified using the Ni resin. Thus, further study like enzyme activity assay could be operated to indicate the function of BmSirt2. BmSirt2 gene is a kind of silence information regulator, which also has the NAD+-dependent deacetylase activity. Recently, many researches found that Sirt2 is a strong candidate to regulate calorie restriction (CR) in many model organisms, such as yeast, nematodes, fruitflies and even mammals (Guarente, 2005, p.923). Guarente and Picard (2005, pp.473-480) reported that limiting calories resulted in activation of the Sir2-family of protein deacetylases, and that this activation accounted for the reduced rate of aging and increased life span observed in response to CR (Masoro, 2004, pp.591-594; Guarente & Picard, 2005, pp.473-480). Therefore, we used silkworms to study BmSirt2 gene. We thought it was so significant that it would be used to explain the mechanism of longevity which is the eternal topic in life science.References Avalos, J. L., Bever, K. M. & Wolberger, C. (2005). Mechanism of sirtuin inhibition by nicotinamide: altering the NAD(+) cosubstrate specificity of a Sir2 enzyme. Molecular Cell, 17, 855-868. Chakrabarty, S. P., Saikumari, Y. K., Bopanna, M. P. & Balaram, H. (2008). Biochemical characterization of Plasmodium falciparum Sir2, a NAD+-dependent deacetylase. Molecular Biochemical Parasitology, 158, 139-151. Frye, R. A. (2000). Phylogenetic classification of prokaryotic and eukaryotic Sir2-like proteins. Biochemical and biophysical research communications, 273, 793-798. Guarente, L. (2005). Calorie restriction and SIR2 genes--towards a mechanism. Mechanisms of Ageing and Development, 126, 923-928. Guarente, L. & Picard, F. (2005). Calorie restriction--the SIR2 connection. Cell, 120, 473-482. Hoff, K. G., Avalos, J. L., Sens, K. & Wolberger, C. (2006). Insights into the Sirtuin Mechanism from Ternary Complexes Containing NAD+ and Acetylated Peptide. Structure, 14, 1231-1240. Kumar, S., Tamura, K. & Nei, M. (2004). MEGA3: Integrated software for Molecular Evolutionary Genetics Analysis and sequence alignment. Brief Bioinform, 5, 150-163. Landry, J. & Sternglanz, R. (2003). Enzymatic assays for NAD-dependent deacetylase activities. Methods, 31, 33-39.

Vol. 1, No. 1 International Journal of Biology
96
Masoro, E.J. (2004). Role of sirtuin proteins in life extension by caloric restriction. Mechanisms of Ageing and Development, 125, 591-594. North, B. J. & Verdin, E. (2004). Sirtuins: Sir2-related NAD-dependent protein deacetylases. Genome Biology, 5, 224. Schuetz, A., Min, J., Antoshenko, T., Wang, C.L., Allali-Hassani, A., Dong, A., Loppnau, P., Vedadi, M., Bochkarev, A., Sternglanz, R. & Plotnikov, A.N. (2007). Structural basis of inhibition of the human NAD+-dependent deacetylase SIRT5 by suramin. Structure, 15, 377-389. Wang, Q., Chen, K., Yao, Q., Zhao, Y., Li, Y., Shen, H. & Mu, R. (2008). Identification and characterization of a novel 1-Cys peroxiredoxin from silkworm, Bombyx mori. Comparative Biochemistry and Physiology Part B: Biochemistry Molecular Biology, 149, 176-182.
Table 1. Results of NCBInr Database Search for the Identification of BmSirt2
Start - End
Observed Mr(expt) Mr(calc) Delta Sequence
34-45 1494.8590 1493.8517 1493.6933 0.1585 R.NMFRDLDVDDVR.M
38-45 946.4945 945.4872 945.4404 0.0469 R.DLDVDDVR.M
52-68 1867.1019 1866.0947 1865.9411 0.1536 K.LGLFSPQDLEPAEPPEK.V
89-108 2004.2975 2003.2902 2003.1051 0.1851 K.KIITLSGAGISTSAGIPDFR.S
90-108 1876.19 1875.1884 1875.0102 0.1782 K.IITLSGAGISTSAGIPDFR.S
109-120 1386.8173 1385.8100 1385.6939 0.1161 R.SPETGLYHNLQK.Y
121-136 2012.2227 2011.2154 2011.0203 0.1951 K.YELPQPQAIFEINFFR.Q
137-147 1273.8038 1272.7966 1272.6867 0.1099 R.QNPKPFFTLAK.E Gln->pyro-Glu (N-term Q)
137-147 1290.8409 1289.8337 1289.7132 0.1205 R.QNPKPFFTLAK.E
148-164 2039.2980 2038.2907 2038.0676 0.2231 K.ELFPGSFKPTISHYFIR.L
175-185 1389.8080 1388.8007 1388.6684 0.1323 R.HYTQNIDTLER.G
194-210 2066.1602 2065.1529 2064.9146 0.2383 .LVEAHGTFYTSHCLDCR.K
194-211 2194.2659 2193.2586 2193.0096 0.2490 K.LVEAHGTFYTSHCLDCRK.E
211-219 1152.7128 1151.7055 1151.6226 0.0829 R.KEYPLEFVK.E
212-219 1024.6399 1023.6326 1023.5277 0.1049 K.EYPLEFVK.E
212-221 1309.8035 1308.7962 1308.6714 0.1248 K.EYPLEFVKER.I
297-307 1235.8621 1234.8548 1234.7510 0.1038 R.EKAGVRPPILR.I
299-307 978.7280 977.7207 977.6134 0.1073 K.AGVRPPILR.I
310-324 1655.9109 1654.9036 1654.7443 0.1593 R.GLMCGGLQLDEGSYR.D
310-328 2097.2471 2096.2398 2095.9779 0.2619 R.GLMCGGLQLDEGSYRDVAR.L
329-342 1623.7961 1622.7889 1622.6301 0.1588 R.LGDCDEGCQDLADR.L
343-350 945.5690 944.5618 944.4716 0.0902 R.LGWGDELR.A
There listed the start and end position of the matched peptide, the observed molecular mass, expective Mr, calculative Mr, the delta value between expective Mr and calculative Mr and the matched sequences.

International Journal of Biology January, 2009
97
Figure 1. The cDNA sequence and deduced amino acid sequence of BmSirt2. The start codon (ATG) and stop codon (TGA) are boxed. Two poly-A signals are underlined. In amino acid sequences, SIR2 domain is framed. Two nonsense mutation found in the sequencing are shaded.
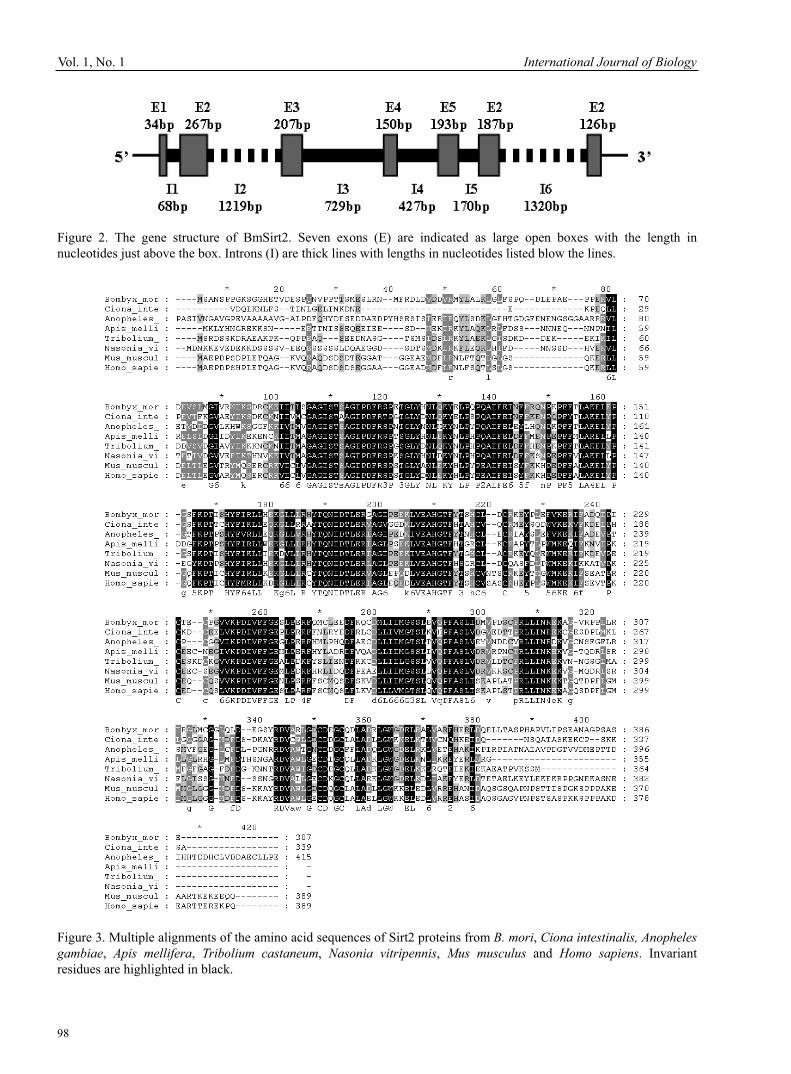
Vol. 1, No. 1 International Journal of Biology
98
Figure 2. The gene structure of BmSirt2. Seven exons (E) are indicated as large open boxes with the length in nucleotides just above the box. Introns (I) are thick lines with lengths in nucleotides listed blow the lines.
Figure 3. Multiple alignments of the amino acid sequences of Sirt2 proteins from B. mori, Ciona intestinalis, Anopheles gambiae, Apis mellifera, Tribolium castaneum, Nasonia vitripennis, Mus musculus and Homo sapiens. Invariant residues are highlighted in black.

International Journal of Biology January, 2009
99
Figure 4. Neighbour-joining phylogram showing the relationships between Sirt2 from B. mori and other organisms. The tree distances were generated according to the ClustalW algorithm, and the tree was constructed using MEGA 3.1.
Figure 5. (A) The result of PCR for BmSirt2. Lane M, DNA molecular mass maker; Lane 1, PCR product. (B) Identification of the recombinant plasmid pET-30a/BmSirt2 by digestion by BamHI and XhoI. Lane M, DNA molecular mass maker; Lane 1, digested pET-30a/BmSirt2
Figure 6. Distribution of BmSirt2 gene in multiple tissues. 1. epidermis; 2. midgut; 3. fat body; 4. silk gland; 5. hemolymph; 6. nerve knot; 7. testis; 8. ovary. B. mori Actin A3 gene was used as the control to show the normalization of the amount of templates in PCR reactions.

Vol. 1, No. 1 International Journal of Biology
100
Figure 7. Expression of BmSirt2 in E. coli. BL21 cells. Cell extracts were separated by SDS-PAGE and stained with Coomassie brilliant blue. Lane M: protein molecular weight markers. Lane 1: proteins from BL21 transformed with pET-30a plasmid. Lanes 2: proteins from BL21 cells transformed with plasmid containing BmSirt2 gene. Lane 3: the western blotting of fusion protein using anti-His-tag antibody.
Figure 8. Peptide mass fingerprints (PMF) for BmSirt2. MALDI-TOF-MS spectrometry was done with in-gel-digested peptides of the recombination protein.

International Journal of Biology January, 2009
101
Cutting Across Discipline Boundaries: Statistical Prospects in Disclosing and Handling the Workings of Natural Biodiversity
Crispin M. Mutshinda (Corresponding author) University of Helsinki
Department of Mathematics and Statistics P.O. Box 68 (Gustaf Hällströmin katu 2b)
FIN-00014 Helsinki, Finland Tel: 358-919-151-439 E-mail: [email protected]
The author acknowledges financial support from the Academy of Finland (project no. 205371). Abstract Ecologists have long sought to comprehend the mechanisms that generate, maintain and shape natural biodiversity. Such an attempt is inherently an interdisciplinary research project which involves a holistic understanding of biological systems, sound modeling, computational and analytical techniques, and high quality data collection. Along this interdisciplinary line, some degree of sophistication in statistical practice is necessary. This note points out a number of promising avenues in this respect. Keywords: Assembly rule, Environmental covariance matrix, Hierarchical Bayesian framework, Neutrality, Niche, Variable selection 1. On current assembly theories and surrounding controversies Understanding the mechanisms that generate, maintain, and structure natural biodiversity is an important research focus in ecology. An as yet unresolved debate concerns whether ecological communities are mere collections of species undergoing random drift in localities to which they happen to disperse, or whether they are structured assemblages emerging from interactions between species as they coexist. The latter view underlies “conventional” ecological wisdom which emphasizes niche partitioning as key to stable coexistence of ecologically similar species (e.g., Gause 1934, Hutchison 1957, Armstrong & McGehee 1980). However, the niche assembly perspective has been recently called into question for its alleged inability to explain many observed patterns in nature (e.g., Hubbell 2001, Zhou & Zhang 2006), and its failure to explicitly account for dispersal limitation and speciation (Hubbell 2001). On the other hand, the yet single trophic-limited neutral assembly theory of community structure and biodiversity (e.g., Bell 2000, Hubbell 2001) which considers stochastic demographic and dispersal processes as the leading forces behind biodiversity patterns has been extensively falsified (e.g., Engen et al. 2002; McGill 2003, Etienne & Olff 2004, Maurer & McGill 2004, Poulin 2004, Chase 2005, Turnbull et al. 2005, Williamson & Gaston 2005, Adler et al. 2007, Mutshinda et al. 2008). Most empirical assessments of the neutral theory have revealed that trophically defined communities often fluctuate more than the neutral theory would suggest (e.g., Dornelas et al. 2006, Mutshinda et al. 2008). This excess of variability over expectations of the neutral model results presumably from species differential responses to environmental variability and potential unbalance in competitive abilities across species. Ecologists increasingly admit that biotic interactions and abiotic random forcing typically act in concert with demographic stochasticity (drift) to shape natural communities. Put another way, coexistence mechanisms involve both neutral and non-neutral forces (e.g., Gravel et al. 2006, Adler et al. 2007). The interest for analysts is therefore to evaluate the relative importance of a range of prospective factors beyond the limits of the traditional dichotomous hypotheses of the form neutrality versus the niches (e.g., Turnbull et al. 2005) or compensatory dynamics versusenvironmental forcing (e.g., Houlahan et al. 2007). As eloquently put by Bjørnstad & Grenfell (2001), “the interplay between noise and determinism in ecological systems presents conceptual and methodological challenges distinctive from those in other dynamical systems”. Teasing out fluctuations in species abundances and diversity measures into

Vol. 1, No. 1 International Journal of Biology
102
contributions from demographic stochasticity, environmental forcing, and intra-/inter-specific interactions, turns out to be an interdisciplinary research project. It involves a holistic understanding of biological systems, elaborate modeling, computational, and analytical techniques, and high quality data collection. Some degree of sophistication in statistical practice is necessary, and a number of promising prospects in this respect can be identified. 2. Statistical prospects in disclosing and handling biodiversity processes In this section we identify a number of statistical prospects in connection with an interdisciplinary approach to disclosing and handling the workings of natural biodiversity. First, the increasingly popular hierarchical Bayesian (HB) framework (e.g., Gelman et al. 2003, McCarthy 2007) for statistical modeling and inference provides much flexibility for elucidating complex ecological relationships (e.g., Diez & Pullian 2007). Modern variable selection techniques in the vein of stochastic search variable selection (George & McCulloch 1993) have the potential to identify the relevant biotic interactions through Bayes factors of the odds probabilities of including versus not including a particular interaction into the model. It is worth emphasizing that the number of interaction coefficients increases drastically with the number of species involved. This may also induce identifiability problems since the number of fitted parameters may exceed the number of single data points. One way around the expanding model dimensionality is to take advantage of the HB approach to assign to the interaction coefficients identically distributed priors so that only hyperparameters (i.e., parameters of priors) appear as free parameters.Third, the variance decomposition required for identifying the forces that drive fluctuations in population abundances, when carried out within a Bayesian framework, permits full consideration of uncertainty about the fitted parameters. Fourth, assembly rules such as neutrality and niche segregation can be examined through the fitted parameters such as interaction coefficients and species-specific and shared responses to environmental perturbations. It goes without saying that the model fitting will typically require a resort to numerical methods such as Markov chain Monte Carlo (MCMC) (e.g., Gilks et al. 1999). MCMC can easily be implemented through existing software such as Win-/Open-BUGS (Spiegelhalther et al. 2003, Thomas et al. 2006). 3. Conclusion Teasing out the inherently complex workings of natural biodiversity requires broadly applicable frameworks cutting across discipline boundaries to combine a thourough understanding of biological systems with sound modeling, computational, and analytical methods and, just as important, the collection of high quality data. Along this interdisciplinary line, this note has identified a number of promising statistical prospects. References Adler, P. B., HilleRisLambers, J. & Levine, J. M. (2007). A niche for neutrality. Ecology Letters 10, 95-104. Alonso, D., Etienne, R.S. & McKane, A.J. (2006). The merits of the neutral theory. Trends in Ecology & Evolution 21, 451-457. Armstrong, R. A. & McGehee, R. (1980). Competitive exclusion. American Naturalist 115, 151-170. Bell, G. (2000). Distribution of Abundance in Neutral Communities. American Naturalist 155, 606-617. Bjørnstad, O. N. & Grenfell, B. T. (2001). Noisy clockworks: time-series analysis of population fluctuations in animals. Science 293, 638-643. Chase, J. M. (2005). Towards a really unified theory for metacommunities. Functional Ecolology19, 182-186. Diez, J. M. & Pullian, H.R. (2007). Hierarchical analysis of species distributions and abundance across environmental gradients. Ecology 88(12), 3144-3152. Dornelas, M., Connolly, S. R. & Hughes, T. P. (2006). Coral reef diversity refutes the neutral theory of biodiversity. Nature 440, 80-82. Engen, S., Lande, R., Walla, T. & Devries, P.J. (2002). Analyzing Spatial Structure of Communities Using the Two-Dimensional Poisson Lognormal Species Abundance Model American Naturalist 160, 60-73. Etienne, R. S. & Olff, H. (2004). A novel genealogical approach to neutral biodiversity theory Ecology Letters 7,170-175. Gause, G. F. (1934). The struggle for existence. Hafner Publishing Company, New York, USA. Gelman, A., Carlin, J.B., Stern, H.S. & Rubin, D.B. (2003). Bayesian Data Analysis (2nd ed.). Chapman& Hall. George, E. I. & McCulloch, R. E. (1993). Variable selection via Gibbs sampling. Journal of the American Statistical Association 88, 881-889. Gewin, V. (2006). Beyond Neutrality Ecology Finds Its Niche. PLoS Biology 4(8), e278.
International Journal of Biology January, 2009
103
Gilks, W. R., Richardson, S. & Spiegelhalter, D. J., Eds. (1996). Markov Chain Monte Carlo in practice Chapman and Hall, London, UK. Gravel, D., Canham, C. D., Beaudet, M., Messier, C. Reconciling niche and neutrality: the continuum hypothesis. Ecology Letters 9(4), 399-409. Houlahan, J. E., Currie, D. J., Cottenie, K., Cumming, J. S., Ernest, S. K. M., Findlay, C. S., Fuhlendorf, S. D., Gaedke, U., Legendre, P., Magnuson J. J., McArdle, B. H., Muldavin, E. H., Noble, D. Russel, R, Stevens, R. D., Willis, T. J., Woiwod, I. P., & Wondzell, S. M. (2007). Compensatory dynamics are rare in natural ecological communities Proc. Natl. Ac. Sci. 104: 3273-3277. Hubbell, S.P. (2001). The unified Neutral Theory of Biodiversity and Biogeography. Princeton University Press. Hutchison, G. E. (1957). Concluding remarks Cold Spring Harbor symposium on quantitative biology 22, 415-425. Maurer, B. A. & McGill, B.J. (2004). Neutral and non-neutral macroecology.– Basic & Appl. Ecol. 5: 413 – 422. McCarthy, M. (2007). Bayesian Methods in Ecology Cambridge University Press, New York. McGill, B. J. (2003). A test of the unified neutral theory. Nature 422, 881-885. Mutshinda, C. M., O’Hara, R. B. & Woiwod, I. P. (2008). Species abundance dynamics under neutral assumptions: a Bayesian approach to the controversy. Functional Ecology 22(2), 340-347. Poulin, R. (2004). Parasites and the neutral theory of biodiversity. Ecography 27(1), 119-123. Spiegelhalter, D., Thomas, A., Best, N. & Lunn, D. (2003). WinBugs version 1.4 User manual. http:// www.mrc-bsu.cam.ac.uk/bug. Thomas, A., O'Hara, R.B., Ligges, U. & Sturtz, S. (2006). Making BUGS Open. R News 6, 12-17. Turnbull, L.A., Manley, L. & Rees, M. (2005). Niches, rather than neutrality, structure a grassland pioneer guild. Proceedings of the Royal Society B: Biological Sciences, 272 (1570), 1357-1364. Williamson, M. & Gaston, K. J. (2005). The lognormal is not an appropriate null hypothesis for the species- abundance distribution. –J. An. Ecol.74: 409-422. Zhou, S. & Zhang, D. (2006). Neutral theory in community ecology. Front. of Biol. in China 30(1), 1-8.

Vol. 1, No. 1 International Journal of Biology
104
Characterization and Prokaryotic expression of Glucuronyltransferase-SGene in Silkworm Bombyx mori
Yukun Chen Institute of Life Sciences, Jiangsu University 301 Xuefu Road, Zhenjiang 212013, China
Tel: 86-511-88972522 E-mail: [email protected]
KePing Chen (Corresponding author), Fang Bao, Qin Yao Institute of Life Sciences, Jiangsu University 301 Xuefu Road, Zhenjiang 212013, China
Tel: 86-511-88791923 E-mail: [email protected]
This project financed is by the National Natural Science Fundation of China (NO.30871826) and the National “863” project of China (2008AA10Z145)
Abstract As genome of B. mori is available in GenBank, identification of novel genes of B. mori can be carried out. In this study, we used the in silico cloning method to obtain the Glucuronyltransferase-S (GlcAT-S) gene of B. mori and analysed with bioinformatics tools. The result was confirmed by RT-PCR,prokaryotic expression and western blot. The GlcAT-S cDNA contains a 843bp ORF and has three exons. The deduced protein has 280 amino acid residues, with the predicted molecular weight of 31842. 02 Da, isoelectric point of 9.16, and contains conserved GlcAT domains. The protein shows high degrees of identity with that of some homologous protein from other species. Keywords: GlcAT-S, Bombyx mori, Bioinformatics, RT-PCR, Prokaryotic expression 1. IntroductionGlycosylation is one of the major post-translational protein modifications that play important roles in a variety of cellular functions, including recognition and adhesion (Hideki, 2005, pp. 23876–23883). Glucuronyltransferases form a gene family and belong to Glysosyltransferase superfamily (Takashi, 1999, pp. 182–187). This enzyme accepts a wide range of substrates, including phenols, alcohols, amines, and fatty acids. The HNK-1 carbohydrate epitope is characteristically expressed on a series of cell adhesion molecules and also on some glycolipids in the nervous system over a wide range of species from insect to mammal and is postulated to be associate with neural crest cell migration, neuron-to-glial cell adhesion and preferential outgrowth of neurites from motor neurons (Koji, 1997, pp. 6093–6098). Researchers believe that Glucuronyltransferases are the key enzymes involved in the biosynthesis of this carbohydrate epitope. Glucuronyltransferase-P deficient mice exhibited reduced long-term potentiation (LTP) at the Schaffer collateral-CA1 synapses and defects in spatial memory formation (Shinako, 2004, pp. 111–119). The Drosophila melanogaster genome contains three glucuronyltransferases which are involved in the biosynthesis of the glycosaminoglycan-protein linkage region of proteoglycans(Byung, 2003,pp.9116–9124) .In variety of biological processes such cell proliferation, as cell-cell adhesion and tissue morphogenesis ,proteoglycans play an essential role. In the paper, we cloned the Glucuronyltransferase-S of B. mori using data-mining techniques and analysed with bioinformatics tools, including its genomic organization and the deduced amino acid sequence. The gene was confirmd by RT-PCR,prokaryotic expression and western blot. The deduced protein sequence was compared with that of some homologous protein from other species.
International Journal of Biology January, 2009
105
2. Materials and methods 2.1 MaterialsThe silkworm Bombyx mori and E. coli (strain TG1 and BL21) were inbred in our lab. Silkworm strain306 were used for this study. Restrictases, T4 DNA ligase, PCR reagents and pMD18-T were obtained from TaKaRa Company (Dalian); primer and other reagents were obtaind from Shanghai Sangon Bio-technology Corpotation. 2.2 Data extraction of cDNA sequence of B. mori GlcAT-S geneThe NCBI’s (http://www.ncbi.nlm.nih.gov/) EST database is a popular starting point for identifying expressed sequence tags (ESTs) of different species, and more than 110, 000 B. mori EST sequences are currently available in GenBank. We also used another silkworm cDNA database BGI (http://silkworm.genomics.org.cn/) in this study. Data-mining techniques and bioinformatics tools were applied to search for cDNA sequence of the B. mori GlcAT-S gene by repeated cycles of assembling and extending EST sequence. 2.3 Genome analysisIn order to establish the genomic organization, we blasted the cDNA sequence to the contigs of B. mori genome in GenBank. SIM4 (http://pbil.univ-lyon1.fr/sim4.php) was used to align the cDNA sequence with the genomic sequences to search potential introns. 2.4 Protein prediction and analysis We used the ExPASy Translate tool (http://au. expasy. org/tools/dna. html) to deduce the cDNA’s amino acid sequence, and similarity analysis was performed using the BLAST tool in GenBank. We used PLOC (http://www.genome.jp/SIT/plocdir/) to predict the subcellular location of B. mori GlcAT-S. Using InterPro Scan (http://www.ebi.ac.uk/InterProScan/) to analyse the deduced amino acid sequence. 2.5 RT-PCR A pair of specific primers was designed based on the sequence we obtained. The forward primer (5’-GGGGATCCATGATATATTACATCACGCCGACTT-3’) contained a BamHI restriction site (underlined), and the reverse primer (5’- CCCTCGAGTACCAAAGTGGGCAGAAGGCT-3’) contained a XholI restriction site (underlined). cDNA was prepared from midgut RNA with M-MLV reverse transcriptase and an oligodT primer. PCR reaction was carried out with Taq polymerase for 35 amplification cycles (94°C for 45 sec; 58°C for 45 sec; 72°C for 1min). PCR product was examined by electrophoresis in 1% agarose gel with the ethidium bromide staining. 2.6 Cloning and sequencing The PCR product was ligated into pMD18-T vector using T4 DNA ligase and then transformed into E. coli (TG1 strain). Plasmid was purified with MiniBEST Plasmid Purification Kit (Takara). The sequencing was performed using an automatic sequence: CEQ8000 (Beckman company). 2.7 Construction of expression plasmid The plasmid pMD18-T/GlcAT-S was digested with BamHI and XholI, and then purified. The purified fragment was ligated with the BamHI-XholI digested His-pET30a vector and transformed into E. coli (BL21 strain). The transformants harboring the recombinant plasmid were confirmed by restriction enzyme analysis. 2.8 Expression of fusion protein in E. coli and SDS-PAGEFor expression of recombinant protein, a positive clone was cultured in LB medium supplement with Kanamycin (50μg/ ml) overnight at 37 with shaking. This culture was added into fresh LB medium and cultured at 37 with vigorous shaking to A600 about 0.6. The culture was then induced with isopropyl-thio- -D-galactopyranosi (final concentration of 0. 2 mmol/ L) and further cultured for another 10 hours. 15% SDS polyacrylamide gel was used to analyze the recombinant protein. SDS-PAGE was performed in the Mini-Protein system (Bio-Rad, USA) . After electrophoresis, the gel was stained with Coomassie Brilliant Blue R250 to visualize the protein bands. 2.9 Western blot analysisWestern blot analysis of proteins was performed following the standard protocol as described previously (Kar, 2004,pp.387–399).3. Result 3.1 Nucleotide sequence analysis A 996 bp cDNA was obtained through data-mining techniques. The cDNA sequence included an open reading frame (ORF), beginning with the initiation codon ATG at position 1 and ending with a termination codon TAA at position 843 (Figure 1). The cDNA also included a TATA-box (Figure 1). BLASTing the cDNA to contigs of B. mori genome in GenBank revealed that contig049159 and contig022658 having a high similarity. Using SIM4, three extrons were found
Vol. 1, No. 1 International Journal of Biology
106
in the relevant DNA sequence. The length of the exons were 153bp, 270bp and 420bp (Figure 2). 3.2 Cloning and identification of GlcAT-S PCR amplification of the midgut cDNA was performed using the two specific primers. After electrphoresis in 1% agarose gel,we obtained a band about 840bp, which was consistent with the expected molecular mass. The PCR product was ligated into pMD18-T vector and confirmed by restriction endonuclease digestion and DNA sequencing. The GlcAT-S fragment could be isolated from the pMD18-T vector after the recombinant plasmid was digested with BamHIand XholI (Figure 3). 3.3 Analysis of deduced amino acid sequence The open reading frame encoded a protein of 280 amino acids, as deduced from the nucleotide sequence (Figure 1). The molecular weight of the encoded protein was predicted to be 31842.02Da with an isoelectric point of 9.16. The deduced amino acid sequence was analyzed using InterPro Scan software in the ExPASy website. The results indicated that the deduced amino acid sequence had a domain named Glycosyltransferase (IPR005027). The subcellular location of B. mori GlcAT-S was predicted in the cytoplasm. Hydropathy analysis showed that GlcAT-S is not a typical type transmembrane protein. Using BLAST software of NCBI, we obtained a Conserved GlcAT domain (Figure 4).Using BLAST software of NCBI to search for homology in the GenBank database, the deduced amino acid sequence showed an identity of 53%, 59%, 47%,42%, 44%, 44% to the corresponding genes of Aedes aegypti (EAT43602), Anopheles gambiae (EAA10323), Drosophila melanogaster (NP_723476), Homo sapiens (NP_001032391), Oryzias latipes (CAI68028), Rattus norvegicus (NP_072131) respectively (Figure 5). 3.4 Construction of expression plasmid The plasmid pMD18-T/GlcAT-S was digested with BamHI and XholI and ligated with His- pET30a which was also digested with the same restriction enzymes to generate His-GlcAT-S- pET30a. The GlcAT-S fragment could be isolated from the His-GlcAT-S-pET30a vector after the recombinant plasmid was digested with BamHI and XholI (Figure 6).The recombinant plasmid His-GlcAT-S-PET30a was successfully constructed (Figure 6). 3.5 SDS-PAGE and Western blotting analysis IPTG induced the E. coli BL21 transformed with the His-GlcAT-S-PET30a plasmid to express the His-GlcAT-S recombinant fusion protein. Recombinant His-GlcAT-S-pET30a include a 36kDa band that is absent from pET-30a (compared lanes 1 and 2). This corresponds to the size expected for the His-GlcAT-S fusion protein. Immunoblot analysis with antiserum specific for His confirmed that this band includes His and GlcAT-S (Figure 7).
4. Discussion Cell surface carbohydrate modulate a variety of cellular functions, including recognition and adhesion (Koji et al 1997). Glucuronyltransferases can transfer glucuronic acid from UDP glucuronic acid to the specific substrate and are involved in the biosynthesis of cell surface carbohydrate. In this study, we identified a novel B. mori GlcAT-S gene through bioinformatics approaches, then RT-PCR, sequencing , prokaryotic expression and western blot were used to confirm the result. The gene has a 843bp ORF encoding 280 amino acid with molecular weight of 31.8 kDa, isoelectric point of 9.16 and was predicted to locate in cytoplasm. Hydropathy analysis showed that GlcAT-S is not a typical type transmembrane protein which is different from other glycosyltransferases. Analysis of the deduced amnio acid indicated that B.mori GlcAT-S has a high homology with the GlcAT-S sequences of other species, suggesting that B. mori GlcAT-S might be a GlcAT-S ortholog in B.mori. A conserved catalytic domain GlcAT was also found. GlcAT-S were reported in many species, but not in B.mori. This is the first time this gene was cloned and analyzed in B.mori. As an economic and model insect of Lepidoptera, research for B.mori and related genes has attracted more and more attention. Specially, the GlcAT-S gene may has so many functions. The cloning and analysis can help us to do further study about this gene. ReferencesByung-T.K, K.T., John Lincecum, Hiroshi Kitagawa, K. S. & Merton Bernfield. (2003). Identification and Characterization of Three Drosophila melanogaster Glucuronyltransferases Responsible for the Synthesis of the Conserved Glycosaminoglycan-Protein Linkage Region of Proteoglycans. Biological Chemistry 11, 9116–9124. Hideki, T., Y. K., Tomoko Ikeda, Satsuki Itoh, Nana Kawasaki, M. L. O., Hidetake Kurihara , Akihiro Tojo & Tatsuo Sakai. (2005). A Non-sulfated Form of the HNK-1 Carbohydrate Is Expressed in Mouse Kidney. Biological Chemistry25, 23876–23883. Kar, A. K., M., Ghosh, & P. Roy. (2004). Mapping the assembly of Bluetongue virus scaffolding protein VP3. Virology324, 387–399.

International Journal of Biology January, 2009
107
Koji, T.Y., S. O., Takatal, Y.K. MIKI, A. N & A. T. K. (1997). Cloning and functional expression of a novel glucuronyltransferase involved in the biosynthesis of the carbohydrate epitope HNK-1. Biochemistry 94, 6093–6098. Shinako Kakuda ,S. O. & T. K. (2004). Purification and characterization of two recombinant human glucuronyltransferases involved in the biosynthesis of HNK-1 carbohydrate in Escherichia coli. Protein Expression and Purification 35 ,111–119. Takashi Seiki, S. O., Koji, Terayama, Kimiyuki Imiya. & Toshisuke Kawasaki. (1999). Molecular Cloning and Expression of a Second Glucuronyltransferase Involved in the Biosynthesis of the HNK-1 Carbohydrate Epitope. Biochemical and Biophysical Research Communications 255, 182–187.
Figure 1. Nucleotide sequence and deduced amino acid sequence. The predicted amino acid is represented by the one letter code designation below the nucleotide sequence. The initiate codes and the stop codes are framed. The TATA-box
is italic and underlined.
Figure 2. DNA sequence frame of the GlcAT-S gene. Extrons are black framed, and introns are white framed.

Vol. 1, No. 1 International Journal of Biology
108
Figure 3. Identification of the recombinant plasmid pMD18-T/GlcAT-S. Lane 1, pMD18-T/ GlcAT-S digested with BamHI and XholI generated two fragments: pMD18-T (2.6 Kbp) and GlcAT-S (840 bp); M, DNA molecular mass
maker.
Figure 4. The conserved superfamily domain in B.mori GlcAT
Figure 5. Multiple sequence alignment of B.mori GlcAT-S protein with the corresponding sequences from other six species, Aedes aegypti (EAT43602), Anopheles gambiae (EAA10323), Drosophila melanogaster (NP_723476), Homo
sapiens (NP_001032391), Oryzias latipes (CAI68028), Rattus norvegicus (NP_072131) using DNAstar MegAlign program.

International Journal of Biology January, 2009
109
Figure 6. Identification of the expression vector His-GlcAT-S-pET30a. Lane 1, His-GlcAT-S-pET30a digested with BamHI and XholI generated two fragments: His-pET30a (5.4Kbp) and GlcAT-S (840 bp); M, DNA molecular maker.
Figure 7. SDS-PAGE and Western blotting analysis. M, Protein marker; Lane 1, Protein of E. coli BL21 contained His-pET30a induced by IPTG; Lane 2, Protein of E. coli BL21 contained His-GlcAT-S-pET30a induced by IPTG; Lane
3, Western blot results of His-GlcAT-S fusion protein. The fusion protein bands were indicated by arrows.
Editorial Board Anne Brown Canadian Center of Science and Education, Canada
Billy Sinclair University of Cumbria, England
Da Jia UT Southwestern, USA
Mark Andrew Skidmore The University of Liverpool, UK
Mike Gormally National University of Ireland, Ireland
Mike Watson University of Southern Queensland, Australia
Naowarat Cheeptham Thompson Rivers University, Canada
Nikolas Zagris University of Patras, Greek
Olga Kukal Queen’s University, Canada
Olga Pantos University of Queensland, Australia
Patrick Marcel Schaeffer James Cook University, Australia
Peer Schenk The University of Queensland, Australia
Risto Penttinen University of Turku, Finland
S Craig Roberts University of Liverpool, UK
Salil Kumar Bose Nanyang Technological University, Singapore
Stuart Craig Smith Deakin University, Australia
Wenwu Zhao Macrothink Institute, USA
Zaini Mohd Zain University Technology MARA, Malaysia