
Master thesis submitted for the degree of Master of Science in International Economic Consulting A...
73
Master thesis submitted for the degree of Master of Science in International Economic Consulting A COST-BENEFIT ANALYSIS OF THE FIRST NUCLEAR POWER PLANT IN POLAND Author: Marta Rozylow MSc in International Economic Consulting Academic supervisor: Prof. Jan Bentzen Department of Economics Aarhus University, Business and Social Sciences January 2013
-
Upload
independent -
Category
Documents
-
view
0 -
download
0
Transcript of Master thesis submitted for the degree of Master of Science in International Economic Consulting A...
Master thesis submitted for the degree of
Master of Science in International Economic Consulting
A COST-BENEFIT ANALYSIS
OF THE FIRST NUCLEAR POWER PLANT IN
POLAND
Author: Marta Rozylow
MSc in International Economic Consulting
Academic supervisor: Prof. Jan Bentzen
Department of Economics
Aarhus University, Business and Social Sciences
January 2013
Abstract
In the last few years, Poland started facing some difficulties in its energy sector. The
situation has been caused by the growing demand for energy and the need for
sustainable development reducing greenhouse gas emissions. The main challenge is the
overdependence on coal- and lignite-fuel power plants as well as single-source oil, gas
and coal (despite its own resources) imports from Russia causing insecurity of supply.
In addition, Poland might face problems with the end of useful lifetime of the present
electricity generating plants. The government has already designed plans to build the
first nuclear power plant in order to cope with the existing problems.
Concerned with the situation in the Polish energy sector, the author of this thesis
performed a social cost-benefit analysis of the first nuclear power plant project as
opposition to the counter-factual of investing in a coal-fired electricity generation. Six
costs and three benefits were identified, monetized and used in the NPV calculation
with the levelised cost methodology. The results showed that the nuclear power plant
would be beneficial in most cases relative to the alternative and would result in
increasing welfare of the Polish society. Apart from the direct advantages (like lower
environmental impact or increased energy security), there would be also other positive
effects, like the development of research facilities or specific courses in higher
education institutions. Therefore, despite some opposition from the Polish society, the
nuclear project is justified under the socio-economic assessment.
However, the exact magnitude of the welfare gain is uncertain due to the long
timeframe applied. There are some disadvantages that must be taken into consideration.
The government should be aware of the accident risk, moral hazard and terrorism,
intergenerational issues or technological lock-in. Moreover, despite careful planning
there are still uncertainties regarding nuclear construction costs and time (meaning
falling behind schedule), as well as future uranium, coal or carbon prices. Also the
employment and education benefits should be considered with caution.
Table of contents
1. Introduction ............................................................................................1
1.1. Problem statement ...........................................................................2 1.2. Methodology....................................................................................2 1.3. Structure of the thesis ......................................................................3
2. Energy sector ..........................................................................................4 2.1. General characteristics.....................................................................4 2.2. Polish energy sector.........................................................................5 2.3. Characteristics of nuclear power energy .........................................9
3. Theoretical background........................................................................13 3.1. Steps in CBA .................................................................................13 3.2. Shadow price of capital .................................................................17 3.3. Levelised costs...............................................................................18 3.4. Social discount rate........................................................................19
4. Analysis ................................................................................................22 4.1. Project description .........................................................................22
4.1.1. Background.............................................................................22 4.1.2. Time horizon...........................................................................24 4.1.3. Site ..........................................................................................26 4.1.4. Reactor....................................................................................27
4.2. Alternative project .........................................................................29 4.3. Scope and standing ........................................................................30 4.4. Identification of costs and benefits................................................31
4.4.1. Costs .......................................................................................31 4.4.2. Benefits ...................................................................................35
4.5. Quantification and monetization of costs and benefits .................37 4.5.1. Costs .......................................................................................38 4.5.2. Benefits ...................................................................................43
4.6. NPV calculation.............................................................................45 4.7. Sensivity analysis ..........................................................................49 4.8. Recommendation...........................................................................55
5. Conclusion............................................................................................57 Bibliography................................................................................................60
List of figures
Figure 1. Energy production in Poland in 2009 .............................................................. 8 Figure 2. Energy production in Poland in 2030 .............................................................. 9 Figure 3. Nuclear fuel cycle ........................................................................................... 11 Figure 4. Steps in CBA ................................................................................................... 14 Figure 5. Polish Nuclear Energy Programme Phases ................................................... 25 Figure 6. Proportions of electricity generating costs..................................................... 30 Figure 7. NPV value with change of STPR .................................................................... 50 Figure 8. Histogram of 1 000 projected NPVs ............................................................... 51 Figure 9. Scatter plot of 1 000 projected NPVs ............................................................. 52 Figure 10. Environmental benefit variation in the worst case scenario ........................ 54
List of tables
Table 1. Comparison of potential reactors..................................................................... 28 Table 2. Costs and benefits of the nuclear power plant ................................................. 31 Table 3. Nuclear power plant costs estimation .............................................................. 39 Table 4. Coal-fuel power plant costs estimation ............................................................ 41 Table 5. Nuclear power plant benefits estimation.......................................................... 43 Table 6. STPR derivation ............................................................................................... 46 Table 7. Nuclear power plant levelised cost advantage ................................................. 47 Table 8. NPV calculation ............................................................................................... 49 Table 9. IRR calculation ................................................................................................. 50 Table 10. CO2 emission mitigation costs........................................................................ 53 Table 11. Security supply benefit variation .................................................................... 55
List of Acronyms and Abbreviations
BWR – Boiling Water Reactor
CBA – Cost-Benefit Analysis
CO2 – Carbon Dioxide
EPR – European Power Reactor
EU – European Union
GDP – Gross Domestic Product
GUS – Główny Urząd Statystyczny (Central Statistical Office of Poland)
GW – Gigawatt
IAEA – International Atomic Energy Agency
IEA – International Energy Agency
IRR – Internal Rate of Return
kV – kilovolt
kW – Kilowatt
kWh – Kilowatt hours
MRTP – Marginal Rate of Time Preference
MW – Megawatt
MWh – Megawatt hours
mSv – milisievert
NAEA – National Atomic Energy Agency
NEA – Nuclear Energy Agency
NPP – Nuclear Power Plant
NPV – Net Present Value
OECD – Organisation for Economic Co-operation and Development
O&M – Operation and Management
PAA – Polish Atomic Agency
SDR – Social Discount Rate
STPR – Social Time Preference Rate
TWh – Terawatt hours
WNA – World Nuclear Association
ZUOP – Zakład Uzdatniania Odpadów Przemysłowych (Industrial Waste Treatment
Plant)
zl – Polish zloty
1
1. Introduction
The primary objective of the energy policy is to ensure that energy needs of both
entrepreneurs and citizens are adequately met at competitive prices and in accordance
with the requirements of environmental protection. In Poland, implementation of this
goal will be determined by investment needs associated with the development of
productive infrastructure and participation in the European climate policy. As a result, it
will be necessary to change the structure of energy production power, seeking different
ways to move away from sources of high CO2 emissions to low-carbon technologies. In
2010, a report of a nuclear programme in Poland was provided to the public, picturing
nuclear power expansion as a necessity. A number of actions have already been taken in
order to make it a reality. New government bodies were formed, schedules were made,
the law was streamlined and documents prepared. Currently, Poland is at the milestone
of establishing the final location and negotiating contracts with the potential investors.
According to WNA (2005) in most industrialized countries today, new nuclear power
plants (NPPs) offer the most economical way to generate electricity, even without
consideration of the geopolitical and environmental advantages. This thesis aimed to
research and check if it is so in the Polish case as well. It was chosen to compare the
project with building a typical Polish coal-fuel power plant despite the requirements for
Poland to reduce greenhouse gas emissions.
In this thesis, a cost-benefit analysis of the first NPP in Poland was conducted. It was of
a particular interest to the author as she comes from Poland and is generally interested
in sustainability and environmental issues. The project of building the NPP has caused
heated debates as many people oppose to it, especially after the damage of the Japan’s
NPP after tsunami in 2011. It must be underlined that the author of this thesis does not
entirely believe the authenticity of the poll of public opinion which supposedly has
shown that the majority of Poles support nuclear power. As given by Swiadomie
o atomie (2012) in answer to the question “do you support building NPPs in order to
limit Polish dependence on oil and coal?” there were only 30% YES answers in 2006,
46% YES answers in 2008 and 60% YES answers in September 2009. She regrets that
there was no data about the frequency.
2
This paper differs from the existing literature, because nobody has made a cost-benefit
analysis of the NPP project in Poland so far, or at least the author could not find any that
would have been publicly available. This thesis assessed an extremely controversial
topic that Poland has to deal with. The author is positive that her Master thesis gives
some more insight to the topic of NPPs and building one in Poland as well as enriches
the existing literature in this area.
1.1. Problem statement
This analysis attempted to look at the range of costs and benefits associated with
investments in nuclear power. The main goal of the thesis was to conduct a social cost-
benefit analysis of the potential first NPP in Poland, which would show the impact of
the project, whether the investment would result in a net gain or loss to the Polish
society as a whole. It was realized based on the algorithm of following steps as given by
Boardman et al. (2006). The approach was economic rather than financial and thus
cannot be used as a basis for determining commercial interest. The analysis considered
costs associated with a NPP relative to the alternative of a coal-fired one. The
assumption was that in a do nothing scenario, investment would probably flow to coal-
fired generation. This provided the benchmark against which the nuclear investment
was compared. The relative cost of a NPP could be then regarded as a cost/benefit,
depending on whether the nuclear is more/less expensive than a coal-fired plant.
1.2. Methodology
The basic research method in the thesis was a cost-benefit analysis assessing effects on
the Polish society of building the first NPP in the country. First, the costs and benefits
from the project were identified and monetized, taking into account also environmental
externalities. Then, they were compared and the net present value was calculated.
Finally, there was conducted a sensivity analysis. The alternative project necessary for
comparison was building a coal-fired power plant.
A wide range of literature was used, such as books, articles, reports and web sources.
A valuable amount of information was derived from Boardman et al. (2006) as well as
European Commission (2008). These positions were both the basis for the third,
3
theoretical chapter, and a starting point for calculations made in the fourth, empirical
chapter. In description of the Polish energy sector, the most important source was the
report made by Pełnomocnik Rządu ds. Polskiej Energetyki Jądrowej (2010) and IEA
(2011). Kaplan (2008) and various web sources helped in understanding the specifics of
NPPs.
Data for the analysis was obtained from the GUS (Central Statistical Office of Poland),
e. g. the structure of energy resources, energy usage in Poland, consumption and
investment structure, GDP. Further figures were derived from the European Commision,
like the description of the energy market in Europe or the price of energy. Finally, the
approximate costs and benefits of the investment were assessed on the basis of the
figures provided by the Ministry of Economy of Poland, especially in Pełnomocnik
Rządu ds. Polskiej Energetyki Jądrowej (2010) and nuclear organisations (like IAEA,
IEA, WNC). The author of the thesis used also several internet sources to clarify some
uncertainties and broaden the knowledge about the nuclear energy and power plants,
besides the fact that the data from the organizations were obtained from their official
websites.
1.3. Structure of the thesis
The thesis has been organized into four major sections and a conclusion. The first part is
the introduction, which aimed to give the reader a broad idea about the contents of this
paper. The second provided the basics of the energy sector, also in Poland where stress
was put on its structure resulting from the past governmental decisions. Finally, it
outlined the fundamentals of nuclear power energy production. The third chapter
described theoretical foundations of CBA, how the whole deduction and calculation
process looks like, what approaches are used and which aspects are vital. In the fourth
chapter, the analysis of the first NPP was conducted. The steps were followed as
suggested by Boardman et al. (2006) consisting of identification and monetization of
costs and benefits, NPV calculation and sensivity analysis. In the last part of the thesis,
the conclusion, all findings and thoughts were summed up.
4
2. Energy sector
In this chapter the energy sector was briefly described. The first section dealt with the
general characteristics and trends in this area. The next section was dedicated to the
Polish energy sector which was crucial for understanding why the Polish government
wants to build NPPs. In the third part, the nuclear energy was described in an as non-
scientifically way as possible.
2.1. General characteristics
Most of today’s societies are extremely dependent on energy and electricity. There are
two primary energy sources: non-renewable fossil fuels and renewable. Climate change
concerns, high oil prices, fear of shortages of fossil fuels, large subsidies for fossil fuels
and increasing government support towards clean energy drive renewable energy
legislation and incentives. In this part of the paper, the stress was put on nuclear energy
and fossil fuels because both of them were relevant for the analysis.
Renewable sources come from natural resources which are easy to replenish such as sun,
wind, water, geothermal heat, and biomass. They are sustainable which means that the
needs of the current population are satisfied without endangering needs’ satisfaction of
the future society. Renewable energy is experiencing a continued to grow in all end-use
sectors (power, heat and transport). The share in final energy generation is currently
around 19% (16% comes from hydroelectricity). (European Commission, 2010).
Nuclear power is considered a clean energy because it does not pollute the environment
in the way fossil fuels do. However, the fuel (uranium in most cases or thorium) is not
renewable, extraction diminishes its deposits inside the Earts. The crucial problems with
NPPs are the breakdowns, leakages or meltdowns. In the most recent one, in 2011,
a magnitude 9.0 earthquake and the consequent tsunami triggered meltdowns in three
reactors at Tokyo Electric Power’s Fukushima Daiichi NPP (Pernick R., Wilder C.,
Winnie T., 2012). Although they were brought under control, the accident made an
impact on the nuclear energy future because people became even more unwilling
towards it. Currently, Japan is taking steps to change course toward renewable energy
production. In Europe, for example Germany or Belgium shut down their reactors.
5
European Commission (2010) predicts, based on power plants under construction or
under confirmed planning, a decrease in the number of nuclear power plants. Despite
these new trends, the Polish government is firm in its decision to build the NPP.
Fossil fuel sources are coal, lignite, petroleum or gas, which are the remains of the
decomposition of plants and animals millions years ago. The most important problem
with these energy sources is the greenhouse gas and other pollutant, like e.g. dust,
emission. One of the key characteristics of this sector is also unjustified in most cases
government subsidies. Fossil fuel industries have historically received, and continue
today, six times as many subsidies as the clean-energy industry (Pernick R., Wilder C.,
Winnie T., 2012). According to European Commission (2010), fossil fuels’ contribution
in energy generation until 2030 is going to decrease by 13% in comparison with 2009.
Generally regardless of the energy sources, the sector is characterized by significant
fluctuations in energy prices, growing demand for energy from developing countries,
striving for efficiency both in production and usage, major system failures, and rising
pollution of the environment. Due to these features, a new approach to energy policy
was required, so the EU set targets for environmental commitments. They are the so
called 3x20%, ie: reducing greenhouse gas emissions by 20% compared to 1990,
reducing energy consumption by 20% compared to projections for the EU in 2020,
increasing the share of renewable energy sources to 20% of total consumption energy in
the EU (the Polish goal is for 15% of the final consumption), including increased use of
renewable energy sources in transport of 10% (Pełnomocnik Rządu ds. Polskiej
Energetyki Jądrowej, 2010). There is the need to diversify energy sources and the need
for new investment replacing depreciated power system so that it will not be
environmentally harmful (meaning minimum emissions of CO2, NOx, SxOy, dust and
metal). Further, in this section the details of the Polish energy sector’s specifics were
given and some key characteristics of nuclear energy production.
2.2. Polish energy sector
In Poland, there is a dominance of coal and lignite in the power industry, which was
formed after World War II when the state had based production on domestic resources
due to deficit of foreign exchange for any fuel imports (Pełnomocnik Rządu ds. Polskiej
6
Energetyki Jądrowej, 2010). While coal’s dominance in the nation’s fuel mix has
weakened from a share of 76% in 1990 to 55% in 2009, the share of fossil fuels put
together fell only from 98% to 93%. It results in negative consequences for the
fulfillment of environment protection obligations, especially in terms of CO2 emissions.
To meet the requirements for Poland's 15% share of renewables in gross final energy
structure in 2020, there will be a high increase in the share clean energy sources despite
the high costs of production.
Poland’s energy market is based on free transactions, there are no government subsidies.
The country relies heavily on indigenous coal that accounts for 55% of its primary
energy supply and 90% of electricity generation. Poland’s coal resources are perceived
as a major guarantor of energy security. However, coal reserves accessible from
established mines are declining very fast. Hard coal production is likely to decrease by
2030. Lignite production will also fall sharply until 2030 as shortages can be expected
from 2015. In 2008, Poland became a net coal importer for the first time as coal
production was insufficient to meet demand. Imports from Russia have accounted for
70% of total coal imports in 2009. Moreover, Poland is dependent on imports for 95%
of its crude oil demand and for about two-thirds (68%) of its gas demand. Over 94% of
oil and over 80% of gas imports come from Russia (IEA, 2011). The government is thus
trying to diversify import sources and transport routes to decrease the over-dependence
on Russia.
For several years the Polish energy sector has been facing other serious challenges, such
as growing energy demand associated with economic development, ageing
manufacturing assets, inadequate level of infrastructure development. Although Poland
remains a net electricity exporter, it increased its electricity imports, which nearly
tripled between 2000 and 2009. According to IEA (2011) Polish demand for electricity
grew since the mid-1990s, closely following economic growth. In years 2000-2009,
demand for energy in services grew at the rate of 3.1% per year (services represent over
represent well over a third of Poland’s electricity demand), while consumer demand
increased by 3% per year and industrial demand – by 1.1%. Despite the growth in
electricity demand, in 2008 per capita electricity demand in the country was around
3 733 kWh, substantially lower than the OECD Europe average of 6 287 kWh.
According to Pełnomocnik Rządu ds. Polskiej Energetyki Jądrowej (2010) Poland has
7
the 24th place among EU countries in terms of electricity consumption per capita per
year. It is significantly below the EU average of approximately 7 500 kWh. It is
expected that the electricity consumption will grow in Poland, mainly due to its
relatively low level at present, which is impossible to maintain in the long run. The
forecast for fuel and energy to 2030 predicts an increase in gross energy demand from
141.0 TWh in 2010 to 217.4 TWh in 2030, so by 54% (Ministerstwo Gospodarki, 2009).
The Polish transmission grid is connected with Sweden, Germany, the Czech Republic,
the Slovak Republic, Ukraine and Belarus. However, connections to the last two
countries are not in operation. Construction of a 400 kV line to Lithuania, a new line to
Germany and network reinforcements at the connection points with the Czech and
Slovak Republics have been planned to expand capacity. The planned electricity bridge
between Poland and Lithuania is to be an important element of the so-called Baltic Ring,
comprising of electricity systems of the surrounding Baltic countries. It has been
a priority project under trans-European energy networks (TEN-E). The implementation
of this project will improve the energy security not only of Poland and Lithuania, but
also of the whole region.
Another aim is to improve and invest into the whole electricity grid, because nearly
80% of 400 kV lines and 99% of 220 kV lines are over 20 years old. Poland was able to
reduce network losses from 8%, although it remains higher than the 6% in the OECD
countries. Electricity consumption at power plants was also reduced to around 15%.
However, it is still high, twice as high as the OECD average (IEA, 2011).
The total installed capacity in the Polish power plants was 35.6 GW in 2009, of which
31.6 GW was coal-fired. The remaining capacity was split between hydropower (2.3
GW), gas (0.9 GW), biomass (0.6 GW), oil (0.5 GW) and wind (0.4 GW). Coal-fired
power plants produce around 10 GW of electricity and heat at the same time. It is worth
noting that Poland is one of few countries in the world to make such an extensive use of
combined heat and power (IEA, 2011).
To satisfy the growing needs of electricity consumption, it will be necessary to increase
its production. In addition to current coal-fired power plants it would required to
develop other sources, like nuclear or renewables. Despite increasingly stringent
environmental standards, coal will remain the most important energy source used to
8
produce electricity and heat in Poland. Over the next 20 years, until 2030, it is assumed
that the coal sector should ensure the supply of fuel, which will maintain production of
electricity (from hard coal and lignite together) at the same level of about 110 TWh, ie:
112.9 TWh in 2010, 102.7 TWh in 2020 and 114.1 TWh in 2030. Because the
dependence on it will not diminished, new mines will have to be opened or imports will
have to be increased. After 2020, the primary energy structure should be characterized
by increasing the share of nuclear energy, which will allow the reduction of CO2
emissions and ease the rise in electricity prices (Pełnomocnik Rządu ds. Polskiej
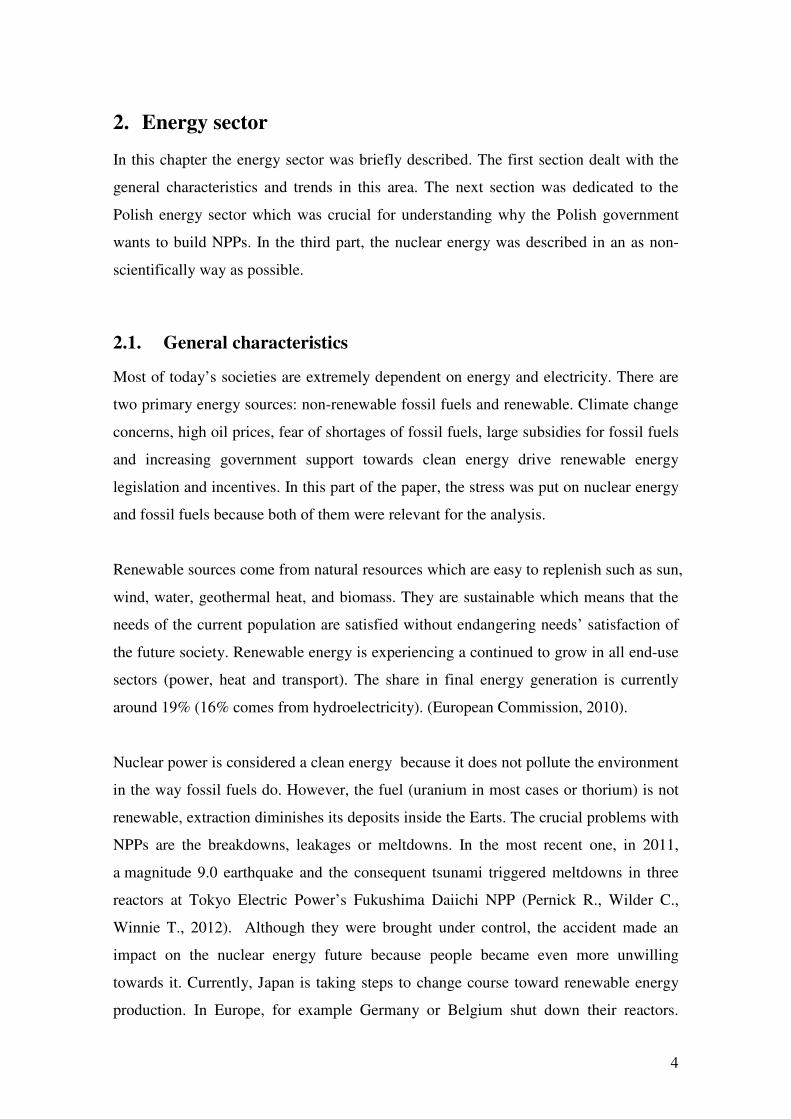
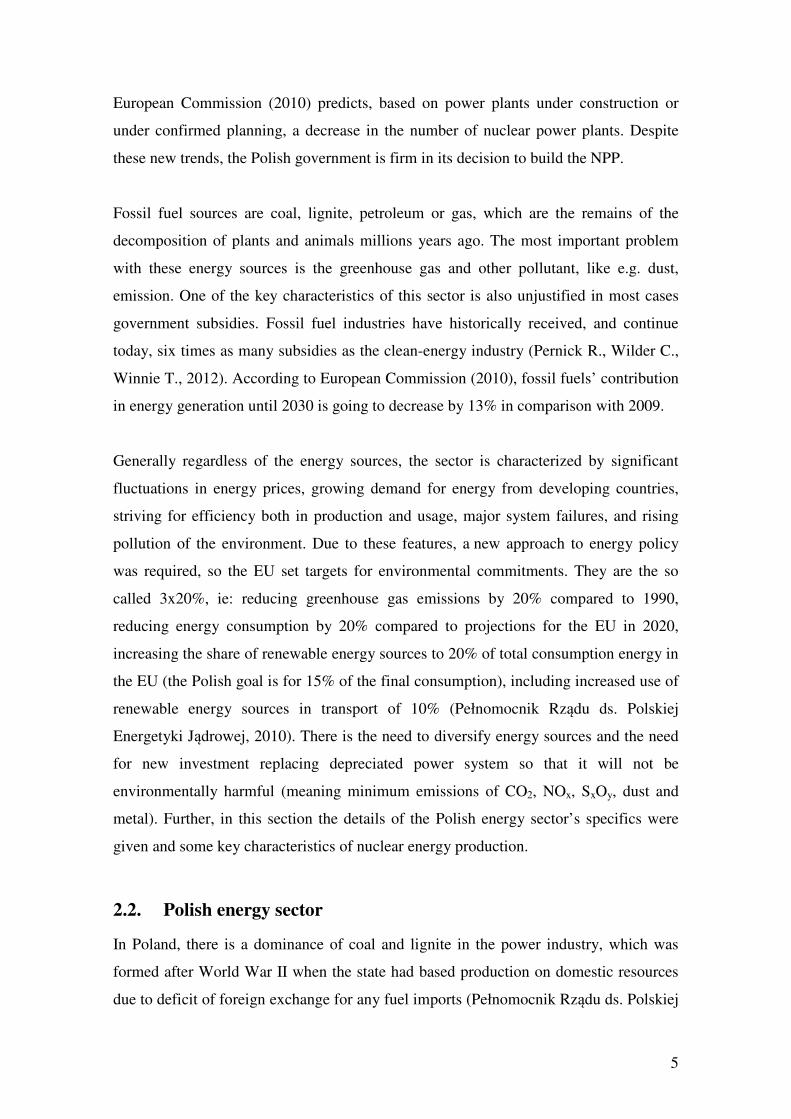
Energetyki Jądrowej, 2010). Figure 1 and Figure 2 presents the structure of energy
production in 2009 and 2030.
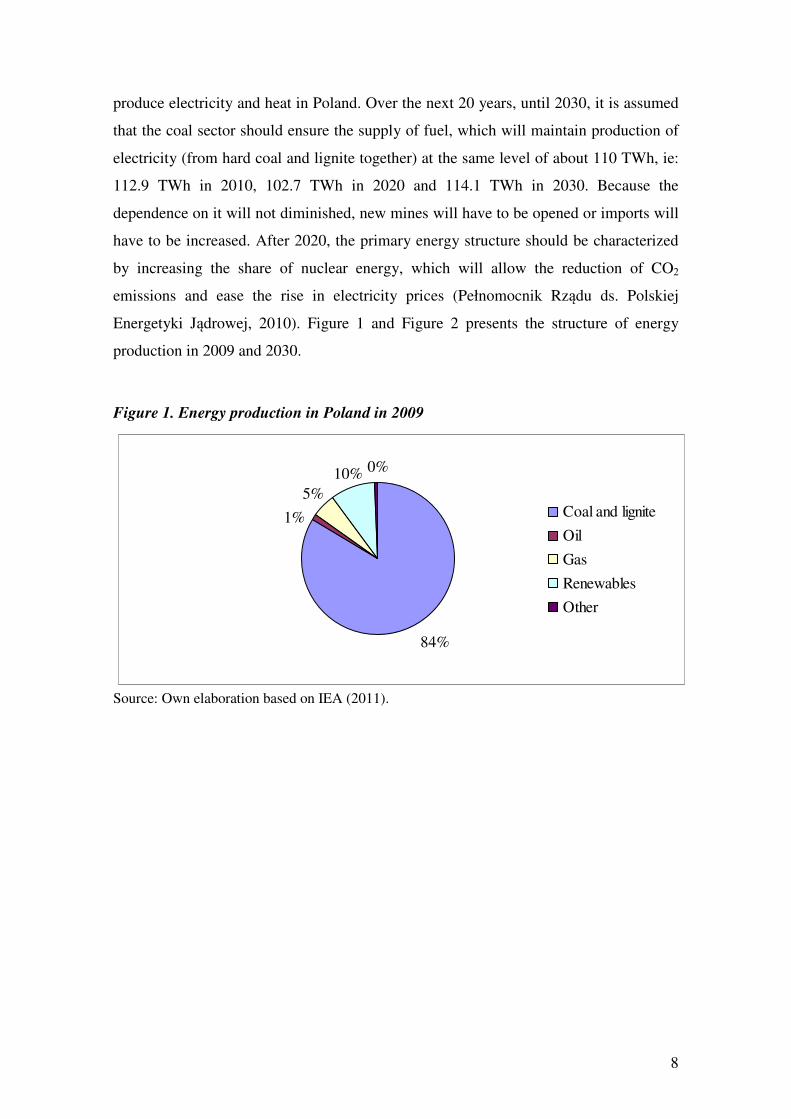
Figure 1. Energy production in Poland in 2009
84%
0%10%
5%
1% Coal and lignite
Oil
Gas
Renewables
Other
Source: Own elaboration based on IEA (2011).
9
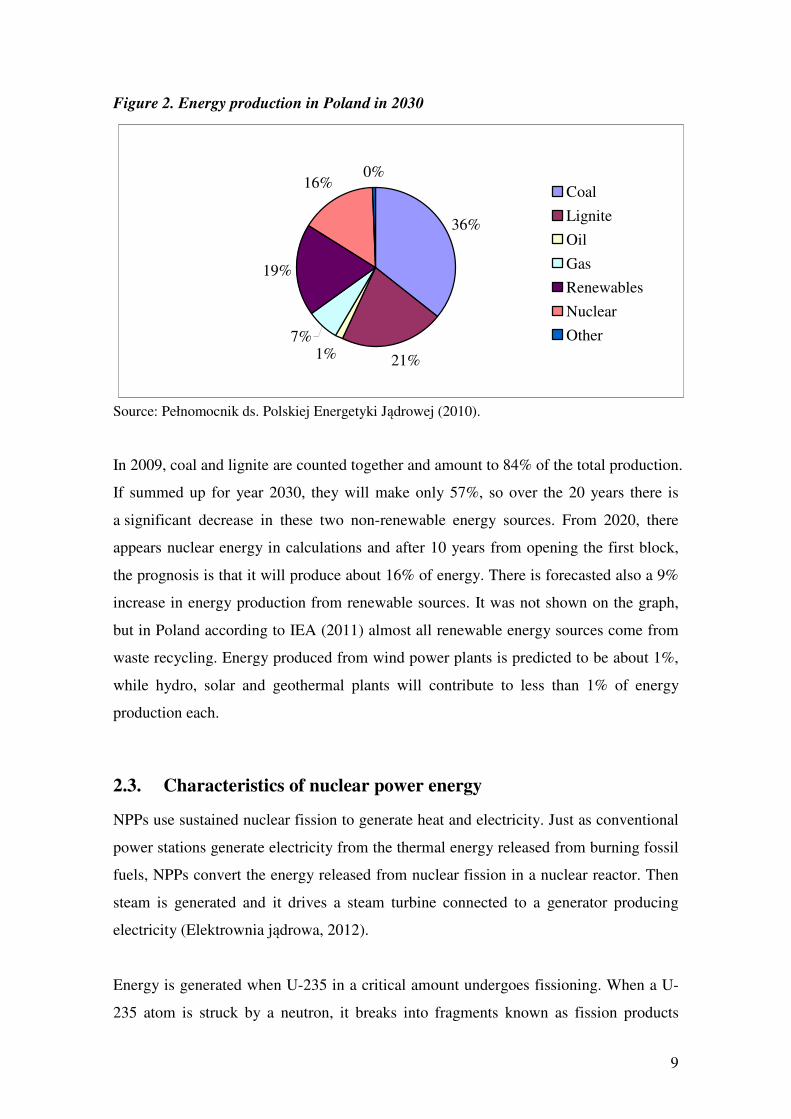
Figure 2. Energy production in Poland in 2030
36%
21%1%
19%
16%0%
7%
Coal
Lignite
Oil
Gas
Renewables
Nuclear
Other
Source: Pełnomocnik ds. Polskiej Energetyki Jądrowej (2010).
In 2009, coal and lignite are counted together and amount to 84% of the total production.
If summed up for year 2030, they will make only 57%, so over the 20 years there is
a significant decrease in these two non-renewable energy sources. From 2020, there
appears nuclear energy in calculations and after 10 years from opening the first block,
the prognosis is that it will produce about 16% of energy. There is forecasted also a 9%
increase in energy production from renewable sources. It was not shown on the graph,
but in Poland according to IEA (2011) almost all renewable energy sources come from
waste recycling. Energy produced from wind power plants is predicted to be about 1%,
while hydro, solar and geothermal plants will contribute to less than 1% of energy
production each.
2.3. Characteristics of nuclear power energy
NPPs use sustained nuclear fission to generate heat and electricity. Just as conventional
power stations generate electricity from the thermal energy released from burning fossil
fuels, NPPs convert the energy released from nuclear fission in a nuclear reactor. Then
steam is generated and it drives a steam turbine connected to a generator producing
electricity (Elektrownia jądrowa, 2012).
Energy is generated when U-235 in a critical amount undergoes fissioning. When a U-
235 atom is struck by a neutron, it breaks into fragments known as fission products
10
(consisting of other atoms near the middle of the table of atomic numbers) and also
releases neutrons which strike other U-235 atoms, thereby maintaining a chain reaction.
Every fission releases about 200-million electron volts of heat which can be used to
drive a steam power plant.
There are objections to the sole use of U-235 because of its scarcity and the large
amounts of energy required to separate it from U-238. Much importance is attached to
converting other materials, U-238 and Th-232, into fissionable materials by means of
the breeder reaction. In such a case, the neutrons from the fissioning of U-235 are used
to cause a radioactive transformation of U-238 or Th-232 to Pu-239 or U-233
respectively, which are then fissionable.
It is worth noting here that NPPs need much less fuel than the coal-fuel plants, one
pound of U-235 is equivalent to 1400 tons of coal in its energy production, the
fissioning of 1 gram of U-235 releases 2.28 x 10⁴ kWh of heat, which is equivalent to
the heat of combustion of 3 tons of coal (Hubbert, 2006).
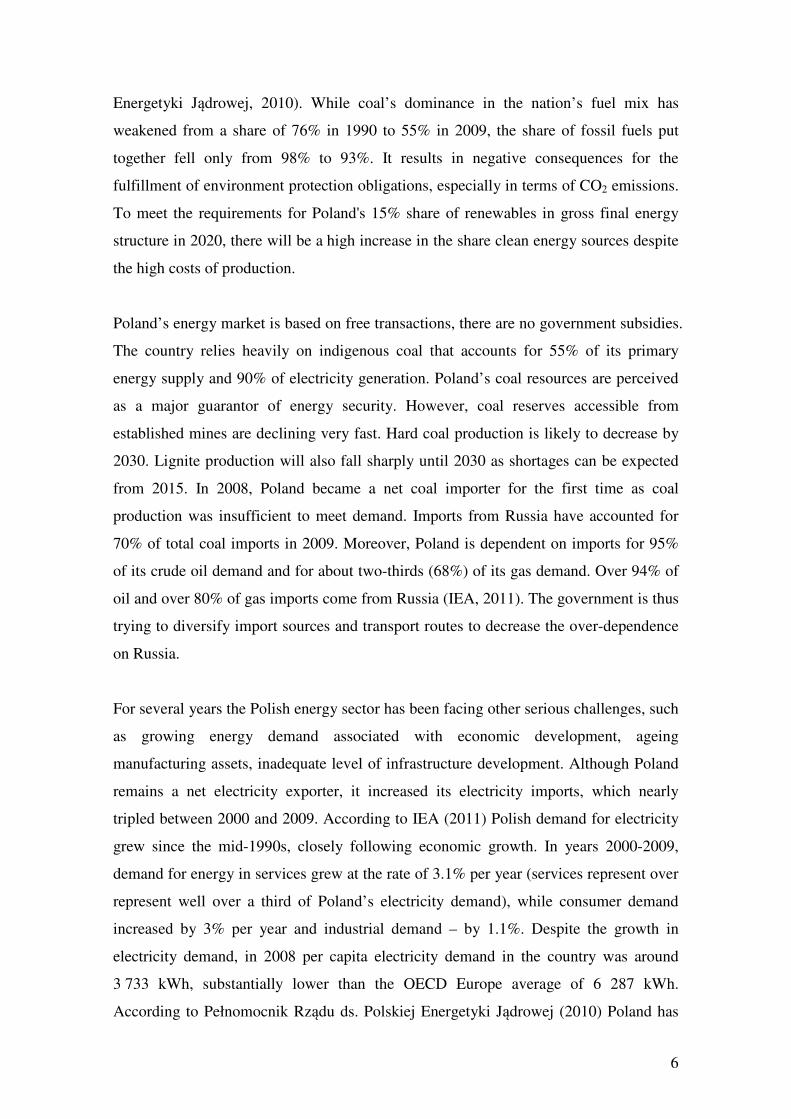
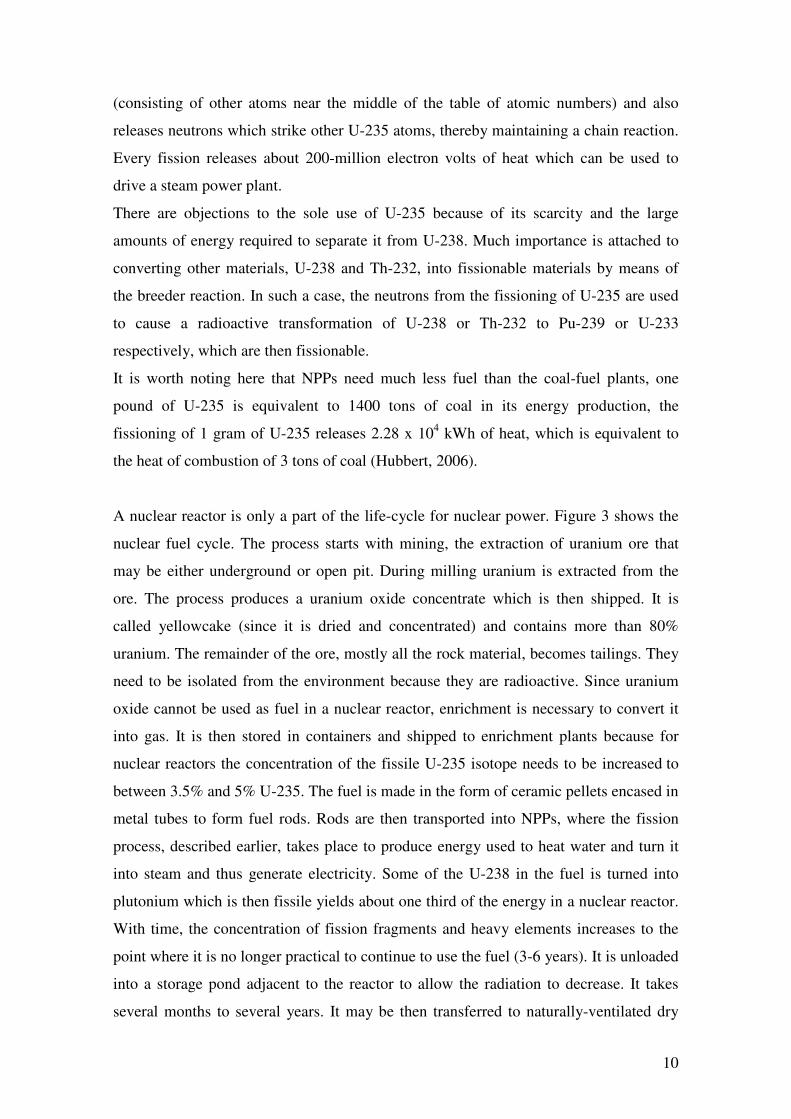
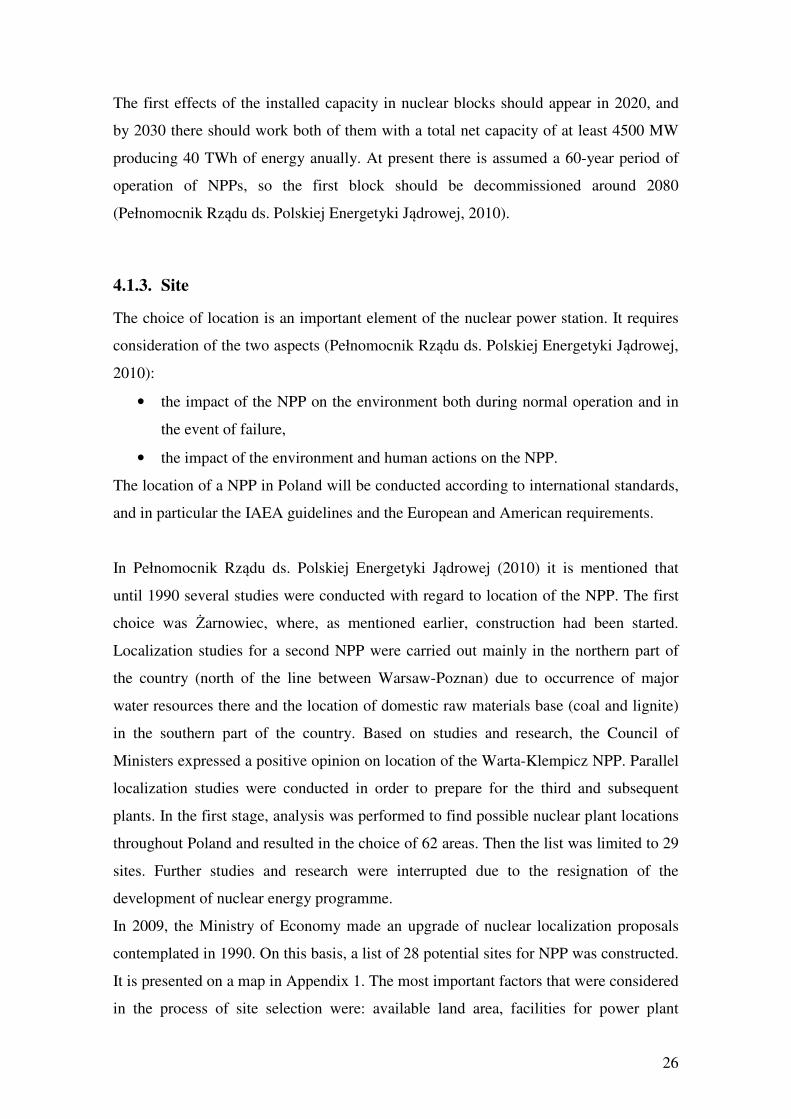
A nuclear reactor is only a part of the life-cycle for nuclear power. Figure 3 shows the
nuclear fuel cycle. The process starts with mining, the extraction of uranium ore that
may be either underground or open pit. During milling uranium is extracted from the
ore. The process produces a uranium oxide concentrate which is then shipped. It is
called yellowcake (since it is dried and concentrated) and contains more than 80%
uranium. The remainder of the ore, mostly all the rock material, becomes tailings. They
need to be isolated from the environment because they are radioactive. Since uranium
oxide cannot be used as fuel in a nuclear reactor, enrichment is necessary to convert it
into gas. It is then stored in containers and shipped to enrichment plants because for
nuclear reactors the concentration of the fissile U-235 isotope needs to be increased to
between 3.5% and 5% U-235. The fuel is made in the form of ceramic pellets encased in
metal tubes to form fuel rods. Rods are then transported into NPPs, where the fission
process, described earlier, takes place to produce energy used to heat water and turn it
into steam and thus generate electricity. Some of the U-238 in the fuel is turned into
plutonium which is then fissile yields about one third of the energy in a nuclear reactor.
With time, the concentration of fission fragments and heavy elements increases to the
point where it is no longer practical to continue to use the fuel (3-6 years). It is unloaded
into a storage pond adjacent to the reactor to allow the radiation to decrease. It takes
several months to several years. It may be then transferred to naturally-ventilated dry
11
storage on site or to central storage facilities. Finally, used fuel must be either
reprocessed or prepared for permanent disposal (by vitrification – transforming into
a glass to obtain a stable compound). During reprocessing the used fuel is separated
into components: uranium, plutonium and waste. This process enables recycling of
uranium and plutonium into fresh fuel and reduces amount of waste. Plutonium can be
made into mixed oxide (MOX) fuel, in which uranium and plutonium oxides are
combined. Plutonium then substitutes for the U-235 in normal uranium oxide fuel.
(Elektrownia jądrowa, 2012; WNA, 2012).
Figure 3. Nuclear fuel cycle
Source: WNA (2012).
Generally, the fissionable fuel used is uranium, although, as mentioned earlier, other
materials may be used as well. For many years the price of uranium was low, which
prevented exploration and extraction of new uranium deposits. As it increased in the
recent years, it caused a growth in the intensity of the search. This happens with all the
12
minerals and uranium is no exception. The size of the known deposits of uranium,
whose extraction is profitable at the current market price, is increasing with each year.
Progress in the technique of extraction and purification of uranium ore means that there
are highly profitable mines extracting poor uranium ore (IEA, 2011).
The uranium ore deposits in Poland examined so far contain from 250 to 1100 ppm
uranium, while very profitable ore mines use a content 300 ppm (Rossing in Namibia),
and even 126 ppm (Trekkopje in Namibia). Uranium deposits exploited in Poland in the
1950s typically contained about 2000 ppm. At present, uranium mining would be
uneconomic, because it can be bought cheaper abroad (Pełnomocnik Rządu ds. Polskiej
Energetyki Jądrowej, 2010).
All operations from mining uranium ore to producing fuel are carried out at a low level
of nuclear radiation. The operations of spent fuel from fuel discharge from reactor core
to radioactive waste disposal in landfills are conducted at a high nuclear radiation level.
In the case of high-active waste and spent fuel deep storage is envisaged. In the world
there are built deep repositories for this purpose. Practically all activities linked to
production or use of isotopes are accompanied by the formation of radioactive nuclear
waste. Due to the specific nature, radioactive waste requires special handling. This
applies to the collection, processing, solidification, transportation, temporary storage
and final disposal. The primary objective of all activities is the safety of radioactive
waste so that they create no danger to humans and the environment (Pełnomocnik
Rządu ds. Polskiej Energetyki Jądrowej, 2010).
In countries with nuclear power, radioactive waste comprises less than 1% of total
industrial toxic wastes, much of which remains hazardous indefinitely. Overall, nuclear
power produces far less waste by volume than fossil-fuel based power plants. Coal-
burning plants are particularly noted for producing large amounts of toxic and mildly
radioactive ash due to concentrating naturally occurring metals (Elektrownia jądrowa,
2012). According to Pełnomocnik Rządu ds. Polskiej Energetyki Jądrowej (2010)
emissions of radioactive substances in NPPs have steadily decreased. Data collected
systematically by the nuclear regulatory authorities in different countries indicate that
the annual dose of radiation at the border zone of the reactor is from 0.01 to 0.03
mSv/year. To compare, the dose from natural background in Poland is 2.5 mSv and in
Finland 7 mSv/year. This means that the additional radiation exposure from NPPs is
minimal and one hundred lower than the difference between Poland and Finland.
13
3. Theoretical background
In this chapter the theoretical background of a CBA was discussed. The first section
dealt with the foundations of a CBA where the procedure was described. Then the focus
was on shadow prices and levelised costs. Moreover, the concept of a social discount
rate was introduced.
3.1. Steps in CBA
This section dealt with the theoretical background necessary to understand the idea of
a cost-benefit analysis and the procedure that was used in the empirical part of the thesis.
Boardman et al. (2006) defines CBA as “a policy assessment method that quantifies in
monetary terms the value of all consequences of a policy to all members of society”
(Boardman et al., 2006, p. 2). It deals with all the costs and benefits to the society as
a whole. The results from the analysis are a tool for helping decision makers in
determining whether a project should be implemented and which allocation of resources
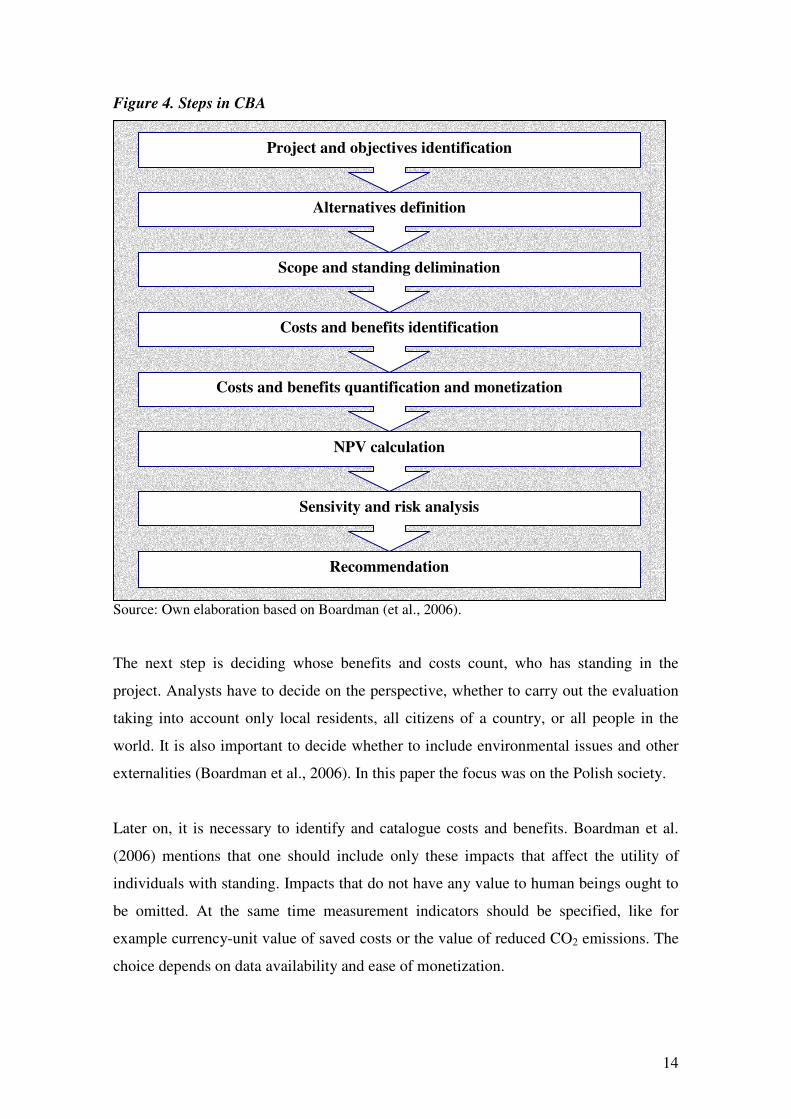
is optimal. There exists a fixed algorithm, a framework, to help analysts to perform
a CBA. It was presented in Figure 4. Consequently, in the analytical part of the thesis,
in Chapter 4, these steps were followed.
The first step involves identification of the project that is to be assessed. Clear and
feasible goals should be established. It would help analysts to concentrate on the right
issues and make the workload more precise and organised. It this case it was the
government’s project of the first NPP in Poland.
Having done that, the alternative projects should be found for comparison purposes. In
reality one can come up with a very large number of alternatives by imposing minor
changes in the main option. They might differ by e.g. contractors, locations, fees, the
outsourced services or the horizon of investment. To keep the analysis manageable one
has to be strict in choosing alternatives. Introducing more of them might cause focus
diversion and in turn make the analysis more superficial. Where no obvious alternatives
exist one has to compare the project with the counter-factual alternative that is often just
the status quo or the do-nothing baseline (Boardman et al., 2006). The alternative for the
NPP was chosen to be a coal-fuel power plant producing the same amount of energy.
14
Figure 4. Steps in CBA
Source: Own elaboration based on Boardman (et al., 2006).
The next step is deciding whose benefits and costs count, who has standing in the
project. Analysts have to decide on the perspective, whether to carry out the evaluation
taking into account only local residents, all citizens of a country, or all people in the
world. It is also important to decide whether to include environmental issues and other
externalities (Boardman et al., 2006). In this paper the focus was on the Polish society.
Later on, it is necessary to identify and catalogue costs and benefits. Boardman et al.
(2006) mentions that one should include only these impacts that affect the utility of
individuals with standing. Impacts that do not have any value to human beings ought to
be omitted. At the same time measurement indicators should be specified, like for
example currency-unit value of saved costs or the value of reduced CO2 emissions. The
choice depends on data availability and ease of monetization.
Project and objectives identification
Alternatives definition
Scope and standing delimination
Costs and benefits identification
Costs and benefits quantification and monetization
NPV calculation
Sensivity and risk analysis
Recommendation
15
Then, the impacts are predicted quantitatively over time. This part might be especially
difficult for projects that are unique, long-run and complex. Each of the impacts should
be monetized, that is expressed in currency units. Some impacts might be cumbersome
to assess, especially the environment-related ones. The value of output is typically
measured by willingness-to-pay, how much the society is ready to pay for the good.
Where markets do not exist or do not work well, one can use shadow prices or values
from guidelines and previous research (Boardman et al., 2006). Shadow prices are
mostly used when observable market prices are distorted in some way, are biased or not
accurately describe the true value to society (European Commission, 2008). They might
over- or underestimate the real social benefits or costs. The concept is also used in case
of externalities. The conversion factor, analogous market good, hedonic pricing,
averting costs or contingent evaluation method can be applied to appropriately reflect
the preferences of population.
In this CBA there were identified several costs and benefits, but only six and three of
them respectively were monetized. Shadow prices for the environmental benefit were
assessed on the basis of the CO2 equivalent price in the EU because it reflects society’s
willingness-to-pay to mitigate the impact of coal-fuel power plants.
The net present value (NPV) is probably the most widely known method for discounting
future costs and benefits into present values. It assumes that members of a particular
population give up present consumption to invest in a project that over time is expected
to yield a return. The impacts that occur in each year of the project need to be
aggregated. This step is necessary as there is an opportunity cost to resources and
people prefer current consumption (consumption today is worth more than future
consumption unless one is compensated for deferring it), so future money has a lower
value. By discounting it can be assessed if the project is likely to earn a greater return
than in case the resources had been alternatively used. Each cash flow that occurs in
year t is discounted to its present value by dividing it by (1 + s)t. It is given by the
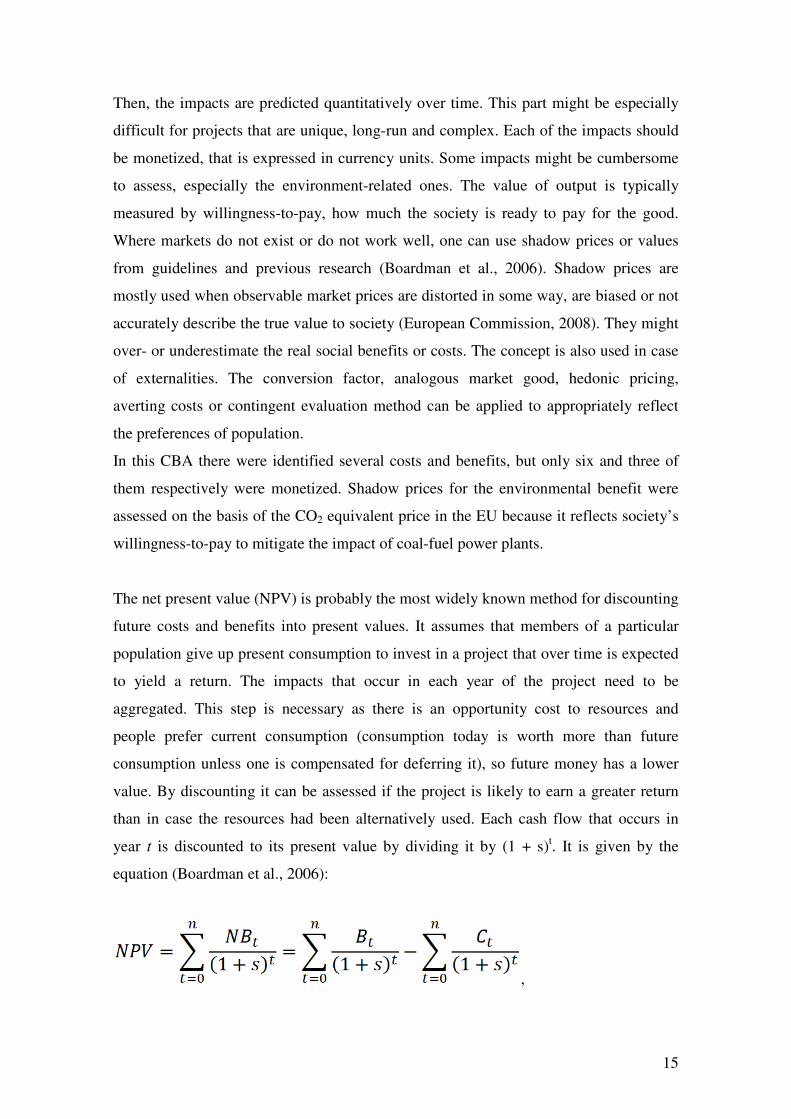
equation (Boardman et al., 2006):
,
16
where:
t – the time of the cash flow,
s – the social discount rate,
NBt – the net cash flow (the amount of cash, inflow minus outflow) at time t,
Bt – the benefits at time t,
Ct – the costs at time t.
Projects should be accepted if NPV > 0, then it adds value to the society. In case, where
there are several exclusive projects only the one with the highest NPV ought to be
chosen if there is no particular goal other than efficiency. If NPV is negative, the social
costs of the project exceed its benefits and therefore the project should be rejected
because it is not a feasible investment possibility. With intergenerational projects
Boardman et al. (2006) recommends to use time-declining discount rates. Such rates
were used in this thesis, because the NPP is a long-run investment.
Often along with NPV, internal rate of return (IRR) is calculated. Boardman et al. (2006,
p. 158) defines it as “the discount rate at which the NPV is zero”. If it is bigger than the
discount rate used for the NPV calculations, then the project should be implemented. It
means that the project gives the society higher return than could be earned by investing
these resources elsewhere.
Having calculated the NPV, sensivity analysis is required. It investigates robustness of
net benefit estimates, how sensitive the predictions are to change. It is essential in any
analysis because the longer life of the project, the more uncertain things become as
assumptions are projected further out in time. It should include for instance forecast of
demand dynamics, unexpected occurrences and shocks, variation in fees, taxes and
tariffs, forecasts of costs’ dynamics. In Boardman et al. (2006) it is suggested to conduct
a Monte Carlo analysis, the best and worse case scenario or a partial analysis.
The last step in CBA is the recommendation. As mentioned earlier, the project with the
highest NPV should be chosen. However, sometimes the sensivity analysis might
suggest that an alternative with a lower NPV is the best solution given the
circumstances as it reduces risks. It is worth noting that Boardman et al. (2006)
underlines that analysts do not take decisions, they only make recommendations. They
17
are not responsible for the actual resources allocation because they only attempt to help
decision-makers in a more efficient allocation. The recommended project does not
always succeed as the future is uncertain and the environment changeable.
3.2. Shadow price of capital
With calculating the NPV there is sometimes the so-called reinvestment problem that
arises when some of the benefits in the later years are reinvested while others are
consumed. As a result, different discount rates are used depending on whether the
consumption or the investments are crowded out. Boardman et al. (2006) suggests using
the shadow price of capital method, in which investment and consumption flows are
also treated differently. This method allows correcting the displaced investments, as
private-sector displacement is more costly to the society than consumption displacement
and increments to private-sector are more beneficial than increments to consumption.
Shadow price of capital can be ignored if a government project is financed from taxes
and there is only consumption displacement (investments are not displaced). Because it
is not the case with the NPP, it was necessary to briefly describe the method. It consists
of several steps. The first one is to define and divide costs and benefits in each period
into those that affect consumption and investment. Next, the flows affecting investments
are multiplied by the shadow price of capital and converted into consumption
equivalents. Finally, the changes in consumption and consumption equivalents are
added together and all flows are discounted with the relevant consumption discount rate.
Shadow price of capital is given by:
,
where:
δ – the depreciation rate of capital invested,
f – fraction of the gross return that is reinvested,
pz – social marginal rate of time preference,
rz – the net return on capital after depreciation.
18
It takes a value larger than one since, rz > pz, and can be interpreted as the present value
of consumption from investing 1 unit in the private sector. For instance, a θ value of 1.5
means that investments are 50% more costly than consumption and 1€ of private
investment would produce a flow of consumption benefits with a NPV equal to 1.50 €.
3.3. Levelised costs
To compare power plants, it is necessary to introduce the idea of levelised costs. This
method provides a good assessment on the cost of electricity (IEA, 2005). The formula
assumes that a power plant is continuously replaced to generate incremental power to
meet new increasing demand. The time series of expenditures are discounted to their
present values in a specified base year by applying a discount rate. The levelised
lifetime cost per kWh of electricity generated is the ratio of total lifetime expenses to
total expected outputs, expressed in present value. The formula provided by IEA (2005)
is as follows:
,
where:
EGC – average lifetime levelised electricity generation cost,
It – capital investment in year t,
Mt – operating and maintenance cost in the year t,
Ft – fuel cycle cost in the year t,
Et – electricity output in year t (in this case Et = plant capacity × load factor),
r – cost of capital (suggested by Kennedy (2007) to be 5 or 10%).
This cost is equivalent to the average price that consumers will have to pay for the plant
operators and investors to offset the expenditure and to repay a proper amount of return.
It varies according to country, depending on costs in the area, the regulatory regime and
consequent financial and other risks, as well as the availability and cost of financing. It
is also depend on geographic factors such as availability of cooling water, the likelihood
of earthquakes, or availability of suitable power grid connections.
19
It must be noted that the levelised costs exclude environmental and social costs.
However, in this CBA the environmental and social (employment) impact has been
dealt with in another way by classifying it into the advantage of the NPP over a coal-
fuel power plant.
3.4. Social discount rate
Choosing a social discount rate is of utmost importance while assessing a project
because it influences the NPV calculation and the final results. The level of the discount
rate reflects government’s propensity for a certain type of projects. A government
interested in long-term or back-end loaded projects (with a high return in the future)
should prescribe a low discount rate in which more weight is put weight on the impacts
occurring further out in time (Boardman et al., 2006).
There are two main approaches to derive the appropriate SDR (Boardman et al., 2006):
1) market-based rates:
- marginal rate of return on private investments,
- social marginal rate of time preference,
- government borrowing rate,
- weighted average rate of the above rates,
2) non-market-based rates:
- social time preference rate.
Only in perfectly competitive markets, where allocation is efficient, the above different
social discounting rates are equal. In real life, the decision makers have to choose the
second-best alternative, because there are distortions and imperfections in the markets
(such as taxes, subsidies, information asymmetries, externalities or others).
The marginal rate of return on private investments is based on the assumption that the
resources used by government will earn a greater return that would have been in the
case they had remained in the private sector. In Boardman et al. (2006) is evaluated to
be around 4.5%. However that might be too high for the social analysis; it is more
appropriate from the perspective of a purely financial analysis.
20
The next rate, the social marginal rate of time preference (MRTP) takes into account
people’s willingness to withhold current consumption in return for greater consumption
in the future. Boardman et al. (2006) suggest using it when a project is fully financed by
domestic taxes and displaces only consumption. It is around 1.5%.
The third option is the government borrowing rate that reflects the actual cost of
financing a project. It is calculated (using yield on Treasury bonds) to be approximately
2.7%. It should be used when projects are financed by public borrowing rather than
taxes (Boardman et al., 2006).
There is also the weighted average rate given by Boardman et al. (2006) to be around
2.5%. It deals with the imperfections of the three above discount rates. It is based on the
social opportunity cost of the different sources weighted by the relative contribution of
each source. However, it is not so often used by governments because of the difficulty
in using several discount rates.
The only rate not based on the market interest rates is the social time preference rate
(STPR). As its use is suggested by the European Commission (2008), a detailed insight
was given to it in the thesis. In HM Treasury (2003) the general formula is as follows:
r = ρ + µg,
where:
ρ – the rate at which individuals discount the future consumption over present
consumption assuming that there is no change in per capita consumption; it consists of
catastrophe risk (the likelihood that there will be some devastating event and all returns
from policies will be eliminated or altered) and pure time preference (reflecting
individuals’ preference for consumption now rather than in the future),
µ – the elasticity of marginal utility of consumption; it measures the speed with which
the social marginal utility of consumption falls as the per capita consumption increases,
g – the product of annual growth on per capita consumption.
STPR is defined as the value which society attaches to present consumption as opposed
to the future one. It takes into account people’s willingness to withhold current
21
consumption in return for greater consumption in the future. It compares the utility
across different points in time. The main argument for using this rate is that the market
is imperfect, consumers are inconsistent and irrational and there is information
asymmetry as well as other distortions, so the rate should not be based on the market
variables. Moreover, this rate takes into account future generations.
However, it is criticized because it is not easy to estimate the long-run growth rate g.
Furthermore, the national income used to measure the growth rate might not accurately
measure consumption. The parameters µ and g are based on the judgments about
intergenerational equality, which might be wrong (Boardman et al., 2006). There are
some instances of European countries that set SDR on the basis of STPR. For example,
France uses SDR of 4%, Germany – 3% and UK – 3.5% (Evans, 2006). European
Commission (2008) suggests using SDR in the range 3-5% (for mature European
countries 3.5% and for lag-behind countries – 5%). Higher discount rate may reflect the
need for worse-off regions to invest at a higher rate of return to achieve a rate of growth
higher than the average for the EU countries and catch up. Evans (2006) considers
different views on estimating this rate and concludes that an appropriate range should be
between 0-2%. However, he underlines that the safest option is to use 1%. In Chapter 4,
the STPR rate for Poland was calculated.
22
4. Analysis
In the following chapter the theory of CBA was used to evaluate the real project of
building the first NPP in Poland. In the first paragraph the project was described. Then
a list of costs and benefits was presented and discussed in detail. Some of them were not
monetized or considered further in the analysis. The calculations of NPV and sensivity
analysis were tackled in the penultimate part of this chapter. Finally, the
recommendation was drawn up.
4.1. Project description
4.1.1. Background
Currently, there are the following nuclear facilities in Poland (Pełnomocnik Rządu ds.
Polskiej Energetyki Jądrowej, 2010):
1) research reactor "Maria" along with a swimming pool technology, which is located at
the Institute Atomic Energy POLATOM (POLATOM IEA) in Otwock-Świerk,
2) research reactor "Ewa" (liquidated) in ZUOP in Otwock-Świerk,
3) two storage facilities for spent nuclear fuel in ZUOP in Otwock-Świerk.
There is not and there was not any isotopic enrichment plant, nuclear fuel fabrication
facility or a processing NPP. In the 1980s, there were plans of construction of a NPP in
Żarnowiec. However, they halted in 1989 by a resolution of the Council of Ministers
due to a failure in nuclear cooperation in the field of nuclear safety and radiological
protection.
Kennedy (2007) underlines that new investment in power plants should only take place
when there is a need for capacity, to replace existing capacity upon retirement and to
meet growth in demand. Due to the growing needs for energy and the European climate
policy Poland has to change its energy production sources. Diversification of electricity
production will be achieved mainly through the introduction of nuclear power
(Pełnomocnik Rządu ds. Polskiej Energetyki Jądrowej, 2010). The NPP will provide
stability and predictability in the long run, lower production costs of electricity
compared to other energy technologies and certainty of return on invested capital.
23
There are, however, certain basic conditions that should be complied with while
designing a NPP, e. g. in terms of nuclear safety and radiological protection, or safe
operation of technical equipment. Any project should take into account the need to
ensure safety protection during construction, commissioning, operation, including
repairs, upgrading and decommissioning of the facility as well as in the event of an
incident (Pełnomocnik Rządu ds. Polskiej Energetyki Jądrowej, 2010).
According to Pełnomocnik Rządu ds. Polskiej Energetyki Jądrowej (2010) the first
investor in nuclear power will be a company with direct or indirect majority of
shareholders from the Treasury. This will mean designation of the largest Polish energy
group, PGE Polish Group Energy S.A., the organizer of the first investment in NPPs in
Poland. Government ownership with a majority stakes makes it easier to raise debt
financing for the company. Operator actions in the first NPP will be conducted by the
company and its subsidiaries. Its main goal should be to achieve the position at least
comparable with the main competitors in the region. The selection of suppliers and
contractors of NPPs will be made on the principles of competitiveness and transparency
within European and national legislation.
In accordance with the recommendations of the IAEA, responsibility for the
administration and project management of nuclear power development should be
entrusted to a specially created for this purpose organizational unit. There has been
created among others the Polish Atomic Agency (PAA), the National Atomic Energy
Agency (NAEA) and the Nuclear Energy Department of the Ministry of Economy with
Government Commissioner for Nuclear Energy.
To finance construction of any NPP two methods can be used: guaranteed loans and
corporate financing (in case of non-state investor if he has sufficient credibility and
financial potential). Sources of financing the preparation and implementation of
investment may come either from the investor's own or with foreign capital external
sources (loans, credits, bonds), or a combination of both of them, taking into account
the amount of expected cost of capital and financing structure. The availability of
appropriate financing, domestic and foreign, is one of the most important factors
influencing the construction of the NPP investment. NEA (2009) points out that the
most popular is a mixture of debt and equity financing, with equity beeing more
expensive than debt, but differentiation leading to risk reduction is important. There are
24
also international financial institutions providing funding for major projects, such as
European Bank for Restruction and Development or European Investment Bank. Poland
has an agreement with OECD which is going to support building of the NPP. Because
of the scale, complexity and the high level of risk of the project investment, it may be
necessary for the state to have an active role in supporting investor’s action in the
provision of funding, using various tools of support, for example, by providing a state
guarantee (Pełnomocnik Rządu ds. Polskiej Energetyki Jądrowej, 2010). Kaplan (2008)
points out that private investments in power plants are characterized by lower financing
costs and generally they are built and run more effectively. In this thesis, similarly like
in the base case in Kaplan (2008), government incentives were excluded from
calculation. The reason behind this was that both are based on a case-by-case analysis of
individual projects and thus difficult to predict.
Building of the NPP in Poland would also require changes in the national energy
transmission system to ensure a reliable power outlet and a power reserve (Pełnomocnik
Rządu ds. Polskiej Energetyki Jądrowej, 2010). The national transmission network
includes voltage 110, 220 and 400 kV. The 220 kV network is well developed and
frequently used, and the 400 kV network is relatively well developed in the south, while
in the east and north lines are "radial" and particularly vulnerable to disturbance and
long-term exclusion. One of the major barriers to introduction of the new national
electricity system with generating units of a capacity over 1000 MW, including nuclear
units, is the lack of appropriate extensive grid of 400 kV. In parallel with the
development of nuclear power, there should be acceleration of the development of
network infrastructure. It is necessary to develop intensively the 400 kV network in the
northern part of Poland and gradually limit the role of the 220 kV network.
4.1.2. Time horizon
Polish Nuclear Energy Programme has to be implemented to ensure safe and efficient
operation of nuclear facilities, decommissioning after the end of operation and the
safety of used nuclear fuel and radioactive waste. Its duration covers the years 2011-
2030 (Pełnomocnik Rządu ds. Polskiej Energetyki Jądrowej, 2010). According to the
recommendations of the IAEA, the introduction of nuclear power requires from 10 to 15
years of preparatory work, including the first power plant construction. This time is
25
dependent on the level of development of a country. In the Polish case, the
implementation of nuclear power requires building almost the entire technical
infrastructure necessary from scrap (Pełnomocnik Rządu ds. Polskiej Energetyki
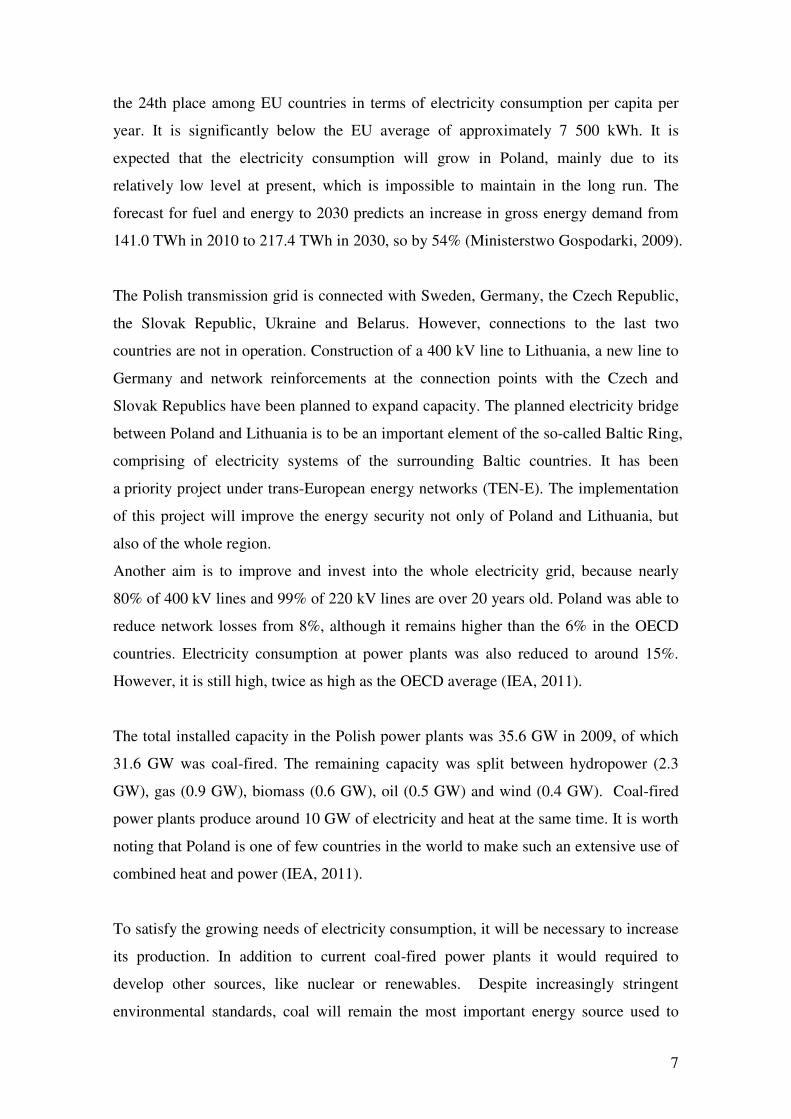
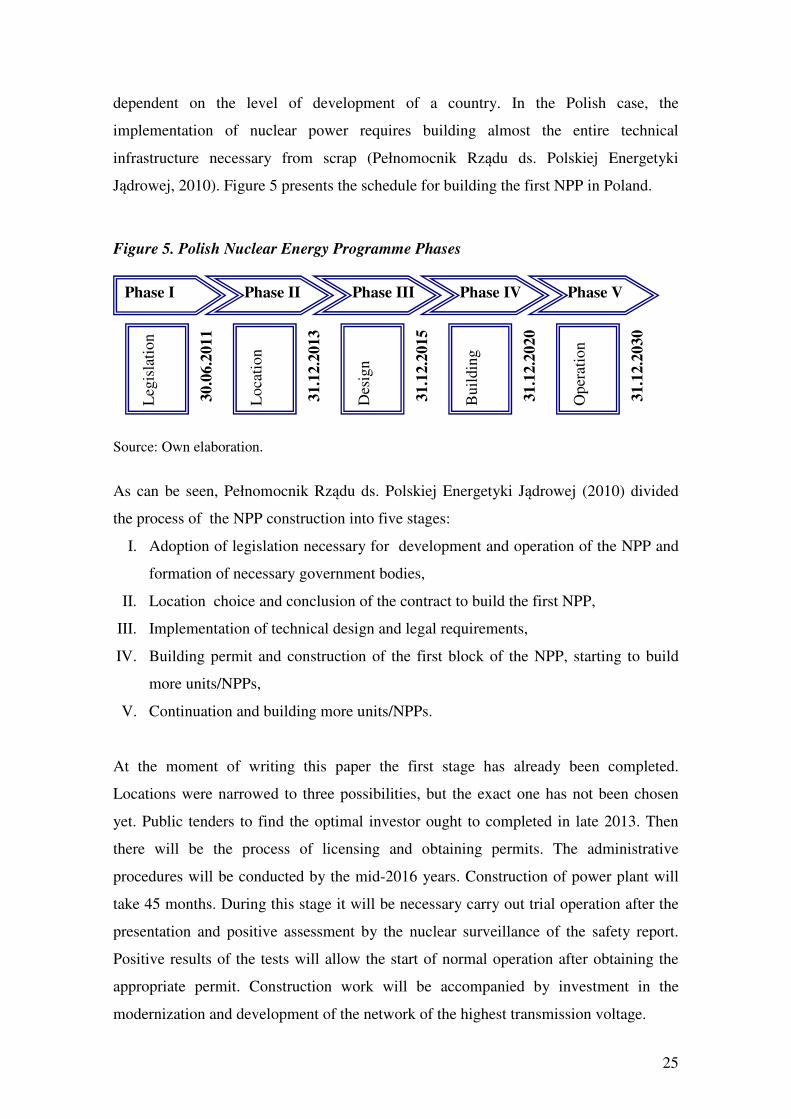
Jądrowej, 2010). Figure 5 presents the schedule for building the first NPP in Poland.
Figure 5. Polish Nuclear Energy Programme Phases
Source: Own elaboration.
As can be seen, Pełnomocnik Rządu ds. Polskiej Energetyki Jądrowej (2010) divided
the process of the NPP construction into five stages:
I. Adoption of legislation necessary for development and operation of the NPP and
formation of necessary government bodies,
II. Location choice and conclusion of the contract to build the first NPP,
III. Implementation of technical design and legal requirements,
IV. Building permit and construction of the first block of the NPP, starting to build
more units/NPPs,
V. Continuation and building more units/NPPs.
At the moment of writing this paper the first stage has already been completed.
Locations were narrowed to three possibilities, but the exact one has not been chosen
yet. Public tenders to find the optimal investor ought to completed in late 2013. Then
there will be the process of licensing and obtaining permits. The administrative
procedures will be conducted by the mid-2016 years. Construction of power plant will
take 45 months. During this stage it will be necessary carry out trial operation after the
presentation and positive assessment by the nuclear surveillance of the safety report.
Positive results of the tests will allow the start of normal operation after obtaining the
appropriate permit. Construction work will be accompanied by investment in the
modernization and development of the network of the highest transmission voltage.
Phase I Phase II Phase III Phase IV Phase V
30
.06
.20
11
31
.12
.20
13
31
.12
.20
20
31
.12
.20
30
Leg
isla
tio
n
Lo
cati
on
Des
ign
Bu
ild
ing
Op
erat
ion
31
.12
.20
15
26
The first effects of the installed capacity in nuclear blocks should appear in 2020, and
by 2030 there should work both of them with a total net capacity of at least 4500 MW
producing 40 TWh of energy anually. At present there is assumed a 60-year period of
operation of NPPs, so the first block should be decommissioned around 2080
(Pełnomocnik Rządu ds. Polskiej Energetyki Jądrowej, 2010).
4.1.3. Site
The choice of location is an important element of the nuclear power station. It requires
consideration of the two aspects (Pełnomocnik Rządu ds. Polskiej Energetyki Jądrowej,
2010):
• the impact of the NPP on the environment both during normal operation and in
the event of failure,
• the impact of the environment and human actions on the NPP.
The location of a NPP in Poland will be conducted according to international standards,
and in particular the IAEA guidelines and the European and American requirements.
In Pełnomocnik Rządu ds. Polskiej Energetyki Jądrowej (2010) it is mentioned that
until 1990 several studies were conducted with regard to location of the NPP. The first
choice was Żarnowiec, where, as mentioned earlier, construction had been started.
Localization studies for a second NPP were carried out mainly in the northern part of
the country (north of the line between Warsaw-Poznan) due to occurrence of major
water resources there and the location of domestic raw materials base (coal and lignite)
in the southern part of the country. Based on studies and research, the Council of
Ministers expressed a positive opinion on location of the Warta-Klempicz NPP. Parallel
localization studies were conducted in order to prepare for the third and subsequent
plants. In the first stage, analysis was performed to find possible nuclear plant locations
throughout Poland and resulted in the choice of 62 areas. Then the list was limited to 29
sites. Further studies and research were interrupted due to the resignation of the
development of nuclear energy programme.
In 2009, the Ministry of Economy made an upgrade of nuclear localization proposals
contemplated in 1990. On this basis, a list of 28 potential sites for NPP was constructed.
It is presented on a map in Appendix 1. The most important factors that were considered
in the process of site selection were: available land area, facilities for power plant
27
construction, water cooling possibilities, geological structure and stability of seismic
terrain, population density, distribution of surrounding plants, reducing the construction
and operation costs due to environmental conditions, environmental protection and land
use, access to transportation routes, the lack of threats from nature and human activities,
and appropriate wheather conditions (Pełnomocnik Rządu ds. Polskiej Energetyki
Jądrowej, 2010). Żarnowiec, Gąski and Choczewo are are the most probable locations,
all of them situated at the Polish coast, so they have a good water access. Żarnowiec
was chosen as the first one because of the benefits of some basic infrastructure that was
left after 1980s. It is situated on the banks of Żarnowieckie Lake and only 10 km from
the Baltic coast. Preliminary estimates suggest that the water resources of the lake will
allow cooling one large NPP (such as EPR or AP1000) at the use of a closed cooling
system with a wet cooling tower with natural draft.
4.1.4. Reactor
Poland is interested in nuclear technology from France, Japan, Korea and the United
States, and has signed or is negotiating co-operation agreements with these countries. In
Pełnomocnik Rządu ds. Polskiej Energetyki Jądrowej (2010) there is stated that the
chosen reactors will be of Generation III or III+ design, which complies with European
European Utilities Requirements and U.S. Utility Requirements Document. The EU
accepted 7 types of nuclaer reactors to be used in the Member States: EP 1000, EPR,
BWR 90/90+, ABWR, SWR 1000, AP 1000, WER AES92. Pełnomocnik Rządu ds.
Polskiej Energetyki Jądrowej (2010) informed that there are 3 types of potential reactors:
European Power Reactor (EPR), Simplified Boiling Water Reactor (BWR) or Advanced
Boiling Water Reactor (ABWR). In EPR, the coolant is water under a pressure of 15
MPa. These reactors are safe and the most common (about 65% of all). In Boiling
Water Reactors water is also the coolant, but in contrast it circulates in a loop
(Elektrownia jądrowa, 2012). The final choice of technology will be made by the
consortium building the plant. One of the potential manufacturers is Areva. It has 2
possible reactors: EPRTM and KERENATM. Table 1 presents some basic features of both
types.
28
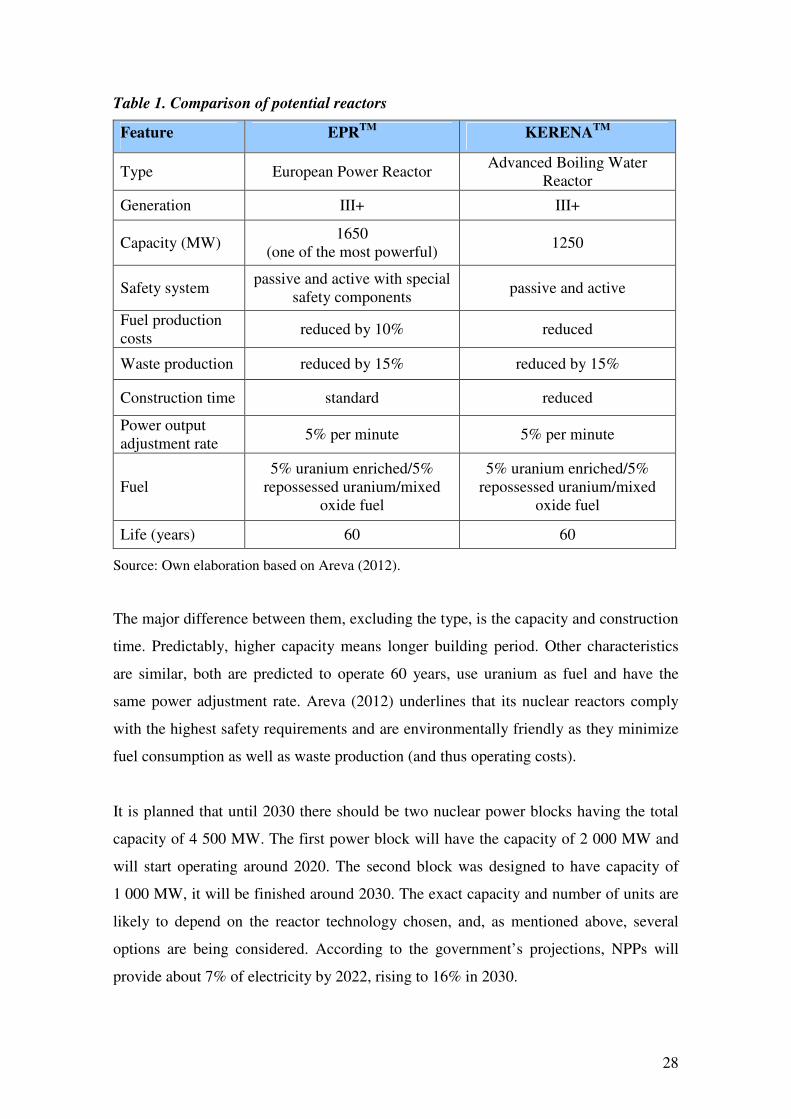
Table 1. Comparison of potential reactors
Feature EPRTM
KERENATM
Type European Power Reactor Advanced Boiling Water
Reactor
Generation III+ III+
Capacity (MW) 1650
(one of the most powerful) 1250
Safety system passive and active with special
safety components passive and active
Fuel production costs
reduced by 10% reduced
Waste production reduced by 15% reduced by 15%
Construction time standard reduced
Power output adjustment rate
5% per minute 5% per minute
Fuel 5% uranium enriched/5%
repossessed uranium/mixed oxide fuel
5% uranium enriched/5% repossessed uranium/mixed
oxide fuel
Life (years) 60 60
Source: Own elaboration based on Areva (2012).
The major difference between them, excluding the type, is the capacity and construction
time. Predictably, higher capacity means longer building period. Other characteristics
are similar, both are predicted to operate 60 years, use uranium as fuel and have the
same power adjustment rate. Areva (2012) underlines that its nuclear reactors comply
with the highest safety requirements and are environmentally friendly as they minimize
fuel consumption as well as waste production (and thus operating costs).
It is planned that until 2030 there should be two nuclear power blocks having the total
capacity of 4 500 MW. The first power block will have the capacity of 2 000 MW and
will start operating around 2020. The second block was designed to have capacity of
1 000 MW, it will be finished around 2030. The exact capacity and number of units are
likely to depend on the reactor technology chosen, and, as mentioned above, several
options are being considered. According to the government’s projections, NPPs will
provide about 7% of electricity by 2022, rising to 16% in 2030.
29
4.2. Alternative project
A CBA appraisal needs to identify the counter-factual, a project which would be
developed if a potential investment took place. It is used because CBA requires
comparing net benefits of a potential policy to the net benefits of the policy’s best
alternative (Boardman et al, 2006). For the purpose of the thesis, it was assumed that
there would be built a hypothetical new coal-fuel power plant with capacity of 4 700
MW, producing 40 TWh of energy annually (85% of operational performance, the so
called load factor). Most assumptions were based on the figures characteristic to the
Polish reality, where the old and inefficient blocks of coal-fired plants are being
replaced with new and more environmentally friendly ones.
Coal-fired power plants produce electricity by burning coal in a boiler to heat water to
produce steam. The steam, at tremendous pressure, flows into a turbine, which spins
a generator to produce electricity. The steam is cooled, condensed back into water, and
returned to the boiler to start the process over again (WNA, 2012). Presently, they have
the operational life of about 35-40 years and load factor at the level of 85-90% (IEA,
2005).
Based on the information in IEA (2005) the construction period would be 4 years and
about 90% of expenditure would be incurred in the last years. Investment costs for
a Polish coal-fuel power plant would be between 1 800 €/kW to 2 000 €/kW, so for
a plant of 4 700 MW, the total costs should reach between 37.7-41.9 billion zl
(Energetyka jądrowa, 2012). More costs connected with the coal-fuel plant and its
operation were given in Table 4 in part 4.5.1. Construction would start, as with the NPP,
in the middle of 2016.
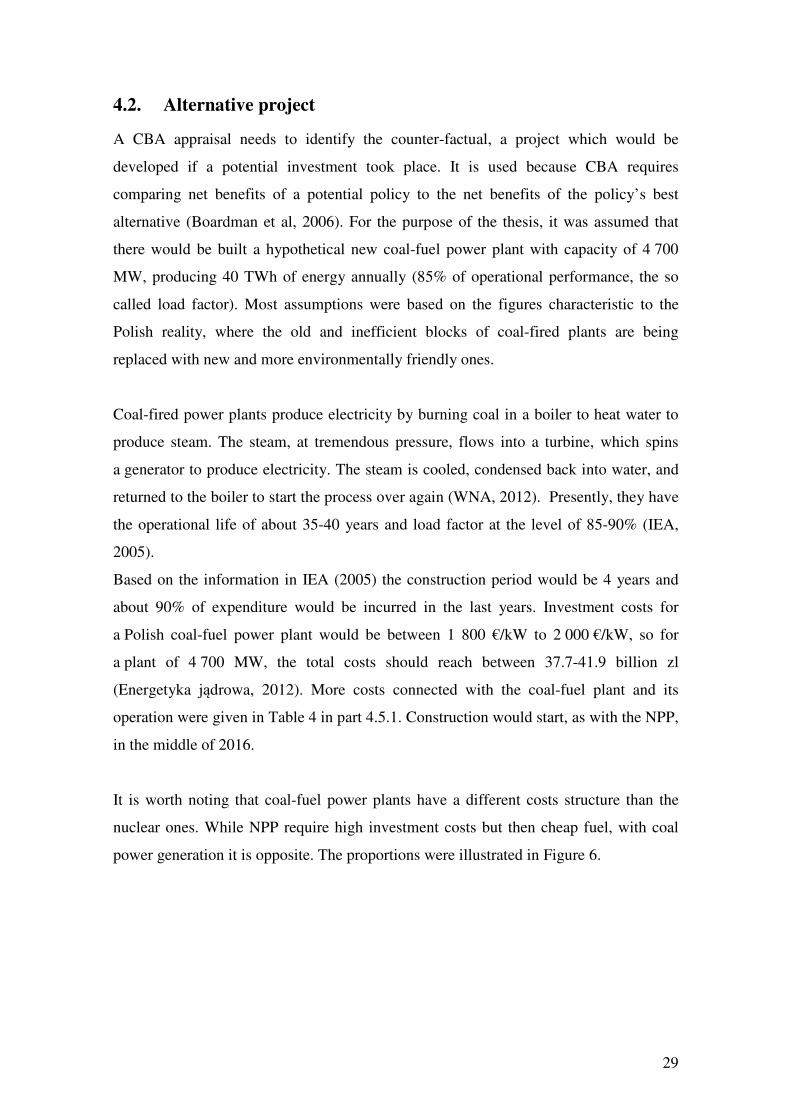
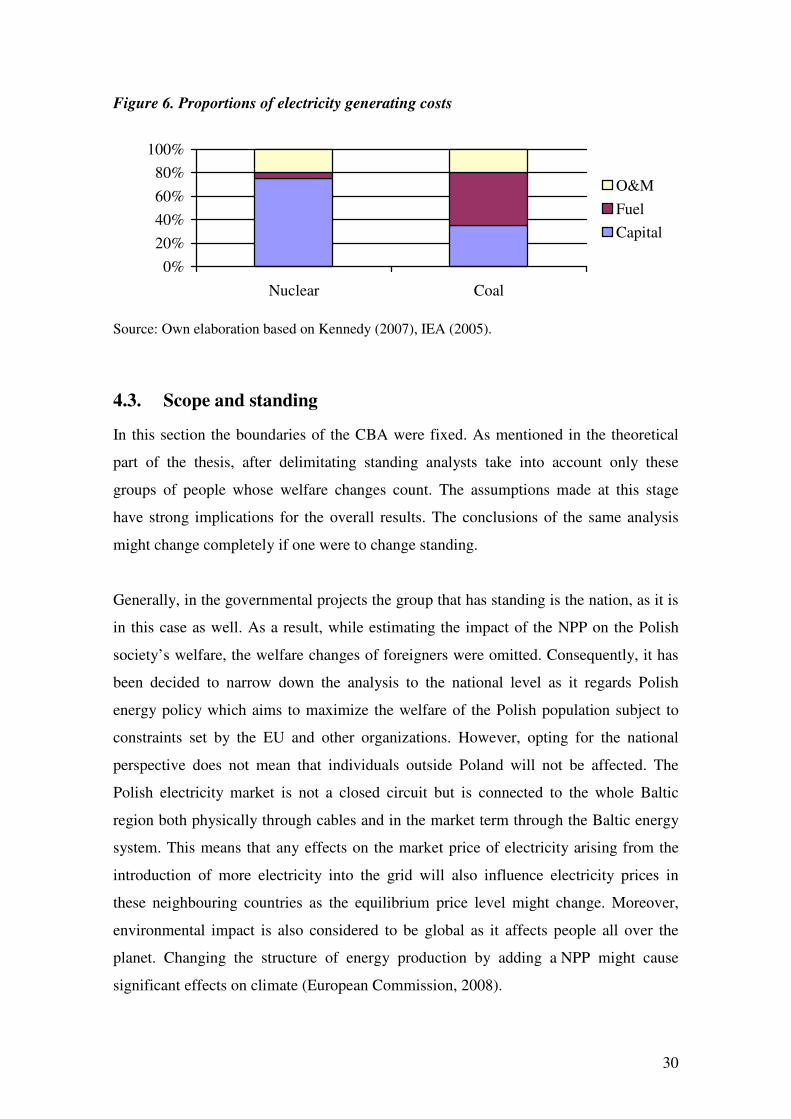
It is worth noting that coal-fuel power plants have a different costs structure than the
nuclear ones. While NPP require high investment costs but then cheap fuel, with coal
power generation it is opposite. The proportions were illustrated in Figure 6.
30
Figure 6. Proportions of electricity generating costs
0%
20%
40%
60%
80%
100%
Nuclear Coal
O&M
Fuel
Capital
Source: Own elaboration based on Kennedy (2007), IEA (2005).
4.3. Scope and standing
In this section the boundaries of the CBA were fixed. As mentioned in the theoretical
part of the thesis, after delimitating standing analysts take into account only these
groups of people whose welfare changes count. The assumptions made at this stage
have strong implications for the overall results. The conclusions of the same analysis
might change completely if one were to change standing.
Generally, in the governmental projects the group that has standing is the nation, as it is
in this case as well. As a result, while estimating the impact of the NPP on the Polish
society’s welfare, the welfare changes of foreigners were omitted. Consequently, it has
been decided to narrow down the analysis to the national level as it regards Polish
energy policy which aims to maximize the welfare of the Polish population subject to
constraints set by the EU and other organizations. However, opting for the national
perspective does not mean that individuals outside Poland will not be affected. The
Polish electricity market is not a closed circuit but is connected to the whole Baltic
region both physically through cables and in the market term through the Baltic energy
system. This means that any effects on the market price of electricity arising from the
introduction of more electricity into the grid will also influence electricity prices in
these neighbouring countries as the equilibrium price level might change. Moreover,
environmental impact is also considered to be global as it affects people all over the
planet. Changing the structure of energy production by adding a NPP might cause
significant effects on climate (European Commission, 2008).
31
4.4. Identification of costs and benefits
The next step in this thesis covered the identification of costs and benefits, specified the
measurement indicators and put the money value to them. Boardman et al. (2006)
underlines that while listing the impacts of a policy it is essential to take into account
only those which affect the welfare of people with standing and their utility. It must be
mentioned that the costs of grid balancing and improving the energy transmission
system were excluded from the analysis as they are not the direct expenditure.
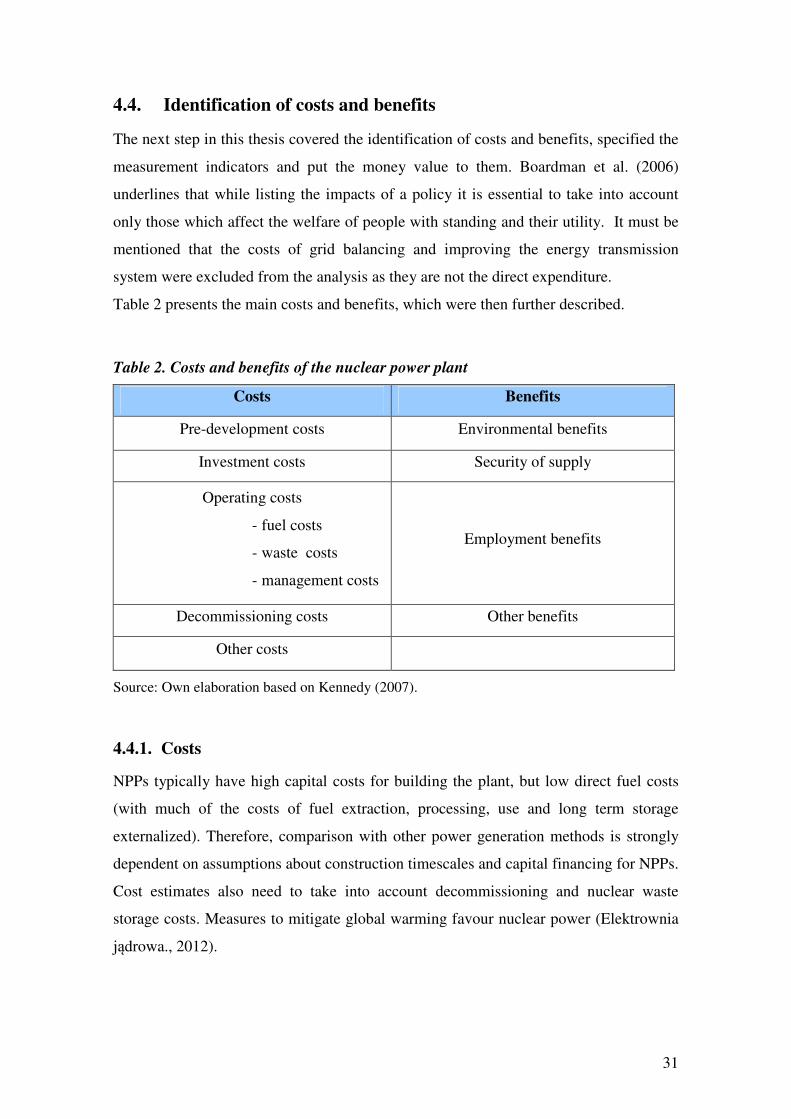
Table 2 presents the main costs and benefits, which were then further described.
Table 2. Costs and benefits of the nuclear power plant
Costs Benefits
Pre-development costs Environmental benefits
Investment costs Security of supply
Operating costs
- fuel costs
- waste costs
- management costs
Employment benefits
Decommissioning costs Other benefits
Other costs
Source: Own elaboration based on Kennedy (2007).
4.4.1. Costs
NPPs typically have high capital costs for building the plant, but low direct fuel costs
(with much of the costs of fuel extraction, processing, use and long term storage
externalized). Therefore, comparison with other power generation methods is strongly
dependent on assumptions about construction timescales and capital financing for NPPs.
Cost estimates also need to take into account decommissioning and nuclear waste
storage costs. Measures to mitigate global warming favour nuclear power (Elektrownia
jądrowa., 2012).
32
Pre-development costs
Pre-development costs are the expenditure previous to the building phase. They include,
e.g. R&D of the site, setting up necessary governmental bodies or streamlining the law.
They are crucial as they lay the foundations for any investment. In the Polish case, some
of these have already been incurred, some will be in the following years (Pełnomocnik
Rządu ds. Polskiej Energetyki Jądrowej, 2010).
Investment costs
According to WNA (2005) capital costs are incurred while the plant is under
construction and consist of expenditure on the necessary equipment, engineering and
labour. They are often called overnight costs, which are exclusive of interest accruing
during the construction period, and include engineer-procure-construct costs, owners’
costs and various contingencies. Once the plant is completed and electricity sales begin,
the plant owners begin to repay the sum of overnight costs and accrued interest charges.
The price charged must cover not only these costs, but also operating costs (annual fuel
costs and expenditure on operation and maintenance (O&M)).
One of the biggest problems with nuclear power is the enormous upfront cost. Reactors
are extremely expensive to build and while returns might be high, but they are also very
slow. A further difficulty is that due to the liberalized electricity market future income is
unpredictable. Because of the large capital costs for NPP, and the relatively long
construction period before revenue is returned, the investment can contribute about 70-
80% of the costs of electricity. The chosen discount rate is therefore the most sensitive
parameter to overall costs.
Modern NPPs are planned for construction in four years or less. Construction delays can
add significantly to the cost of a plant. Because a power plant does not earn income
during construction, longer construction period translates directly into higher finance
charges (Elektrownia jądrowa, 2012).
Operating costs
In general, coal and nuclear plants have the same type of operating costs (operations and
maintenance plus fuel costs). However, nuclear has lower fuel costs but higher
operating and maintenance costs. Operations and maintenance (O&M) costs are very
variable for NPPs, depending on such factors as plant size and age, but on average they
account for 20% of the total costs per year (WNA, 2005). Liberalization of electricity
33
markets has helped in introducing best practices in reducing O&M costs throughout the
industry, while maintaining or improving high safety standards.
Fuel
As stated in Pełnomocnik Rządu ds. Polskiej Energetyki Jądrowej (2010) the supply of
nuclear fuel, that is uranium, for the NPP planned in Poland will come from imports.
Two-thirds of the supply of uranium globally come from primary sources or from mines
in Canada, Australia, Kazakhstan and Niger. Security of supply of nuclear fuel depends
on the certainty of supply of uranium ore and concentrate uranium, access to fuel cycle
services, as well as a reliable and secure transport of finished nuclear fuel. According to
the EU requirements regarding uranium supply there should be: diversification of
supply, maintaining an appropriate level of its own uranium reserves, optimal use of the
uranium market opportunities, striving to cover the demand for uranium on
a contractual basis and meeting the needs of the fuel cycle services in the EU.
Poland at the beginning will not produce the fuel, but buy it from one of the several
global fuel suppliers. Purchase of fuel will be bound, at least in the first phase operation
of NPP, with the purchase of technology. The world practice is that the technology
provider also provides the fuel supply for the first 5-10 years operation. Due to the
developed market for the fuel, the introduction of the NPP will not cause Polish
addiction to foreign suppliers.
Waste
The problem of disposal of radioactive waste was made in Poland in 1958 at the start of
the Institute for Nuclear Research in Świerk and the first research nuclear reactor EWA.
Significant development of isotopic techniques and associated increasing usage of
radioactive isotopes in different areas of the economy in the early 1960's have caused an
urgent need to solve the problem of radioactive waste management. The solution was
found by the location of the nuclear waste treatment plant in Różana. Nowadays, the
main source of liquid and solid waste is the reactor MARIA and the manufacturing
plant of radioactive isotopes, such as the Institute POLATOM Atomic Energy
Radioisotope Centre. Other waste comes from located throughout the country hospitals,
clinics and different institutions using isotopic techniques. Due to the NPP project there
are plans to construct a deep, underground repository for high-radioactive waste and
spent fuel in the future. According to the experiences of other countries the necessity of
34
building such a repository will appear after 30-40 years since the release of first NPP,
this means the earliest around 2050 (Pełnomocnik Rządu ds. Polskiej Energetyki
Jądrowej, 2010).
Decommissioning
At the end of a NPP's lifetime the plant must be decommissioned. It begins immediately
after final and permanent closure and continues ideally to the point of leaving a clear
site where the facility had once stood. The process incorporates some or all of the
following activities: the safe management of nuclear materials held in the facility as
well as radioactive and other wastes, decontamination, plant dismantling, demolition
and site remediation. This entails dismantling, safe storage or entombment. Operators
are usually required to build up a fund to cover these costs while the plant is operating
to limit the financial risk from operator bankruptcy (Elektrownia jądrowa, 2012).
Provision for decommissioning costs is made by making financial contributions over the
economic life of the plant towards plant dismantling and eventual site restoration. Given
that plants are expected to have long lives, the contributions are not significant. WNA
(2005) states that they amount to less than 1% of the overall costs per year.
Other
There are also other costs connected with NPPs, however, these were excluded from
monetization. Unlike other power plants, NPPs must be carefully guarded against both
attempted sabotage and possible theft of nuclear material. Thus security costs of both
protecting the physical plant and the screening of workers must be considered. Since
nuclear reactors contain a core of highly radioactive fuel, NPP operators need to invest
considerable resources in keeping these structures intact and isolated from the
environment. Whereas a conventional power plant can break down without large
environmental effects, this has to be prevented at a NPP at all cost. Also insurance is
required (Elektrownia jądrowa, 2012). Rosenkranz, (2006, p.12) underlined that “There
is no other technology for which a single event can trigger the collapse of an entire
pillar of energy supply”. As evidence of the long-run repercussions of a break-down
Chernobyl can be used. The United Nations estimated the death toll at 4 000. In 2010,
newly released documents indicated that millions more were affected by the fallout and
cleanup than originally thought, which in turn led to tens of thousands of deaths as well
as hundreds of thousands of sick children born long after the initial meltdown. To make
35
matters more complex, the concrete entombing is now beginning to crack (Zehner,
2012). The costs are still rising after almost 30 years from the disaster.
4.4.2. Benefits
WNA (2005) enlisted the following benefits of developing nuclear energy:
- national: price stability and security of energy supply,
- global: positive environmental impact by near-zero greenhouse gas emissions.
However, there are also for instance employment advantages.
Environmental benefits
In practice it is difficult to assess, not to mention monetize, all environmental impacts.
Nuclear electricity generation is environmentally friendly as it does not release
greenhouse gases, such as carbon dioxide (CO2), methane (CH4), nitrous oxide (N2O),
hydro fluorocarbons (HFCs), perfluoro carbons (PFCs) or sulphur hexafluoride (SF6)
(NEA, 2011). There is also no dust or mercury production as in opposition to coal
electricity production. From the perspective of the full nuclear fuel lifecycle, a very
small amount of pollution is produced indirectly while mining, transporting or
processing uranium and during the construction phase of a NPP (Kennedy, 2007).
Based on Kennedy (2007) the environmental benefits of nuclear power were chosen to
be evaluated as a reduction of CO2 emission relative to the counter-factual case of
a coal-fired power plant. In this way the reduction was equalized to the level of
emissions that would have occurred if coal-fired plant were to be added rather than
nuclear. The CO2 equivalent was used, because nuclear power expansion would result in
the reduction of different pollutants, not only the CO2. Then carbon emissions
associated with the construction and operation of NPP, and with the mining, transport
and processing of uranium should be subtracted from the total emissions reduction
above to give a net value.
Security of supply
The amount of uranium needed to operate a NPP of 1 000 MW can easily bring in any
country, and can easily store a supply for a few years of running the plant. Fluctuations
in the price of uranium ore have very little impact on the cost of electricity production at
NPPs, due to the low share of fuel costs in the total costs of energy production.
36
According to data from Pełnomocnik Rządu ds. Polskiej Energetyki Jądrowej (2010)
the uranium price increase by 100% increases the cost of electricity production in NPP
by 5%. Once built NPP supplies electricity generated with a stable cost, almost
regardless of price fluctuations on the world market of raw materials. This helps to
maintain the stability of electricity prices on the market, which promotes sustainable
development. As mentioned earlier, energy security is the key priority of the Polish
energy policy. Diversification of energy sources through building a NPP will not only
ease the heavy reliance on imports from Russia and thus enhance energy security but
will also allow Poland to negotiate better prices thanks to competitive pressure on
suppliers (IEA, 2011).
In this analysis it has been chosen to model the security of supply benefit based on
Kennedy (2007) as the avoided cost related to mitigating the risk of a major supply
interruption. However, security of supply relating to avoided GDP losses is very
difficult to quantify accurately.
Employment benefits
Employment benefits are an important positive externality and are especially
emphasized by the politicians in cases of large-scale projects. Clearly, a NPP would
directly create various jobs related to the planning, construction, operation and
decommissioning of the plant. Strupczewski (2012) claims that there might be a demand
for 7 140 people to construct the plant and then permanently 2 400 to operate it.
Moreover, new jobs would be created across a range of industrial sectors.
However, despite these prospects, it must be remembered that the employment
opportunities also exist for the alternative plant. Furthermore, additional employment is
a social opportunity cost, because it uses labour resources that become unavailable for
alternative social purposes (Boardman, 2006).
To estimate the social benefit of additional employment accounting or shadow wages
should be used. It was chosen to calculate it in this paper as the number of workers
employed multiplied by the wage for which the workers would be employed. It was not
halved, as one of Boardman at el.’s (2006) approach suggests, because the salary in
Poland is rather low and not many workers would be willing to work for less than their
wage as it would not suffice for their basic needs.
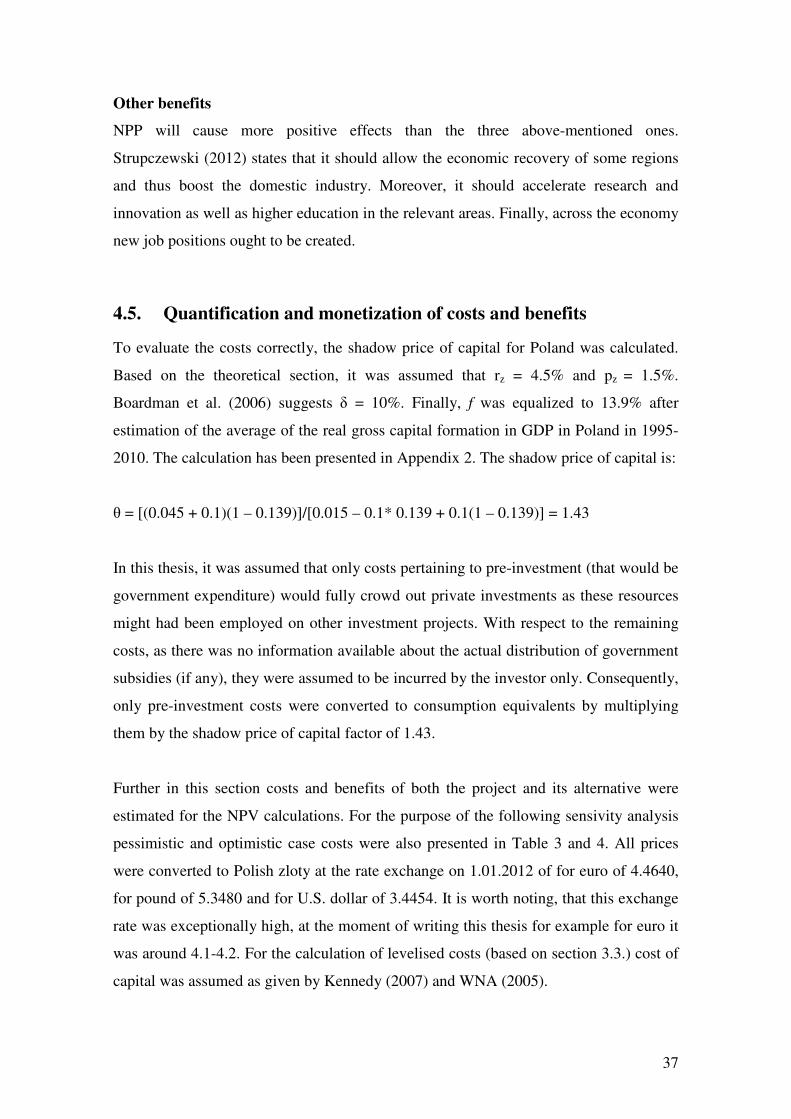
37
Other benefits
NPP will cause more positive effects than the three above-mentioned ones.
Strupczewski (2012) states that it should allow the economic recovery of some regions
and thus boost the domestic industry. Moreover, it should accelerate research and
innovation as well as higher education in the relevant areas. Finally, across the economy
new job positions ought to be created.
4.5. Quantification and monetization of costs and benefits
To evaluate the costs correctly, the shadow price of capital for Poland was calculated.
Based on the theoretical section, it was assumed that rz = 4.5% and pz = 1.5%.
Boardman et al. (2006) suggests δ = 10%. Finally, f was equalized to 13.9% after
estimation of the average of the real gross capital formation in GDP in Poland in 1995-
2010. The calculation has been presented in Appendix 2. The shadow price of capital is:
θ = [(0.045 + 0.1)(1 – 0.139)]/[0.015 – 0.1* 0.139 + 0.1(1 – 0.139)] = 1.43
In this thesis, it was assumed that only costs pertaining to pre-investment (that would be
government expenditure) would fully crowd out private investments as these resources
might had been employed on other investment projects. With respect to the remaining
costs, as there was no information available about the actual distribution of government
subsidies (if any), they were assumed to be incurred by the investor only. Consequently,
only pre-investment costs were converted to consumption equivalents by multiplying
them by the shadow price of capital factor of 1.43.
Further in this section costs and benefits of both the project and its alternative were
estimated for the NPV calculations. For the purpose of the following sensivity analysis
pessimistic and optimistic case costs were also presented in Table 3 and 4. All prices
were converted to Polish zloty at the rate exchange on 1.01.2012 of for euro of 4.4640,
for pound of 5.3480 and for U.S. dollar of 3.4454. It is worth noting, that this exchange
rate was exceptionally high, at the moment of writing this thesis for example for euro it
was around 4.1-4.2. For the calculation of levelised costs (based on section 3.3.) cost of
capital was assumed as given by Kennedy (2007) and WNA (2005).
38
It must be mentioned that the analysis does not attempt to monetize all costs and
benefits. In most projects, there are significant non-monetary impacts but they are
difficult to express in monetary terms (Boardman et al., 2006). All of them should be
listed as their magnitude could outweigh the monetary effects of the project. In this
thesis, the monetary value associated with potential accidents was not estimated.
Though accident risk should not be dismissed, the assumption was that this could be
managed through design of regulatory and corporate governance arrangements for the
nuclear industry.
4.5.1. Costs
At first, costs of the NPP were calculated, as shown in Table 3 on the next page. Further
on costs of the alternative were also estimated.
Pre-investment costs
These costs would be mostly incurred by the government. Expenditures that had
already been incurred in 2011 (listed in Annex 3) were added to 2012 costs. They
amounted to 139 840 thousands zloty. Costs from before 2011 were excluded from
calculations as there was no data available regarding the exact point in time when they
occurred. These are as follows:
- 11 million zl for the functioning of the Polish Atomic Agency (PAA),
- 47.4 million zl for research and core activities,
- 1.7 million zl for grants for investment in construction and assembly.
The rest of pre-investment costs was taken as given by Pełnomocnik Rządu ds. Polskiej
Energetyki Jądrowej (2010) and listed in Appendix 3 with a 5% sensivity range. Polish
government did not state any other costs than the investment expenditure. For the
purpose of the thesis, the operating costs were obtained from international reports.
Investment costs
Building a NPP is a long and costly process. According to Pełnomocnik Rządu ds.
Polskiej Energetyki Jądrowej (2010) construction costs of third-generation reactors
amount to 3-3.5 million euros per MW of capacity built. This means that the
construction of two power plants with a total capacity of 4 500 MW will cost 13.5-15.75
billion euros. In this thesis, it was assumed that these expenditure consist of overnight
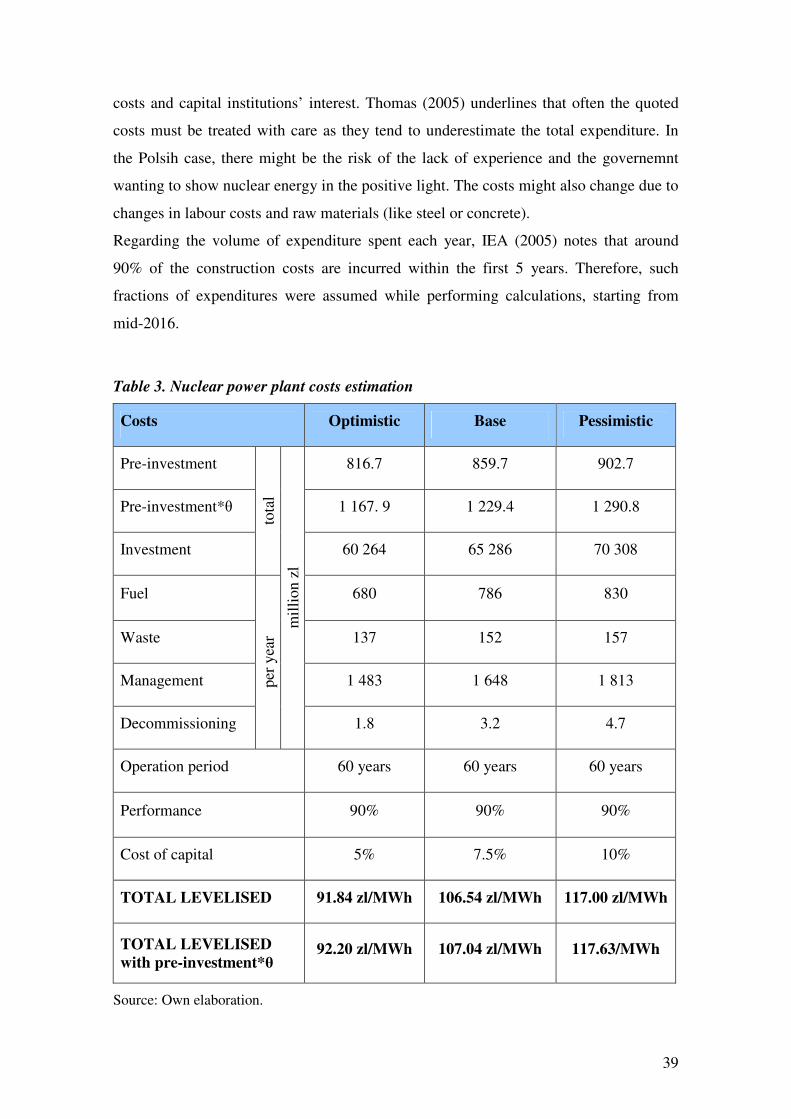
39
costs and capital institutions’ interest. Thomas (2005) underlines that often the quoted
costs must be treated with care as they tend to underestimate the total expenditure. In
the Polsih case, there might be the risk of the lack of experience and the governemnt
wanting to show nuclear energy in the positive light. The costs might also change due to
changes in labour costs and raw materials (like steel or concrete).
Regarding the volume of expenditure spent each year, IEA (2005) notes that around
90% of the construction costs are incurred within the first 5 years. Therefore, such
fractions of expenditures were assumed while performing calculations, starting from
mid-2016.
Table 3. Nuclear power plant costs estimation
Costs Optimistic Base Pessimistic
Pre-investment 816.7 859.7 902.7
Pre-investment*θ 1 167. 9 1 229.4 1 290.8
Investment
tota
l
60 264 65 286 70 308
Fuel 680 786 830
Waste 137 152 157
Management 1 483 1 648 1 813
Decommissioning
per
yea
r
mil
lio
n z
l
1.8 3.2 4.7
Operation period 60 years 60 years 60 years
Performance 90% 90% 90%
Cost of capital 5% 7.5% 10%
TOTAL LEVELISED 91.84 zl/MWh 106.54 zl/MWh 117.00 zl/MWh
TOTAL LEVELISED
with pre-investment*θ 92.20 zl/MWh 107.04 zl/MWh 117.63/MWh
Source: Own elaboration.
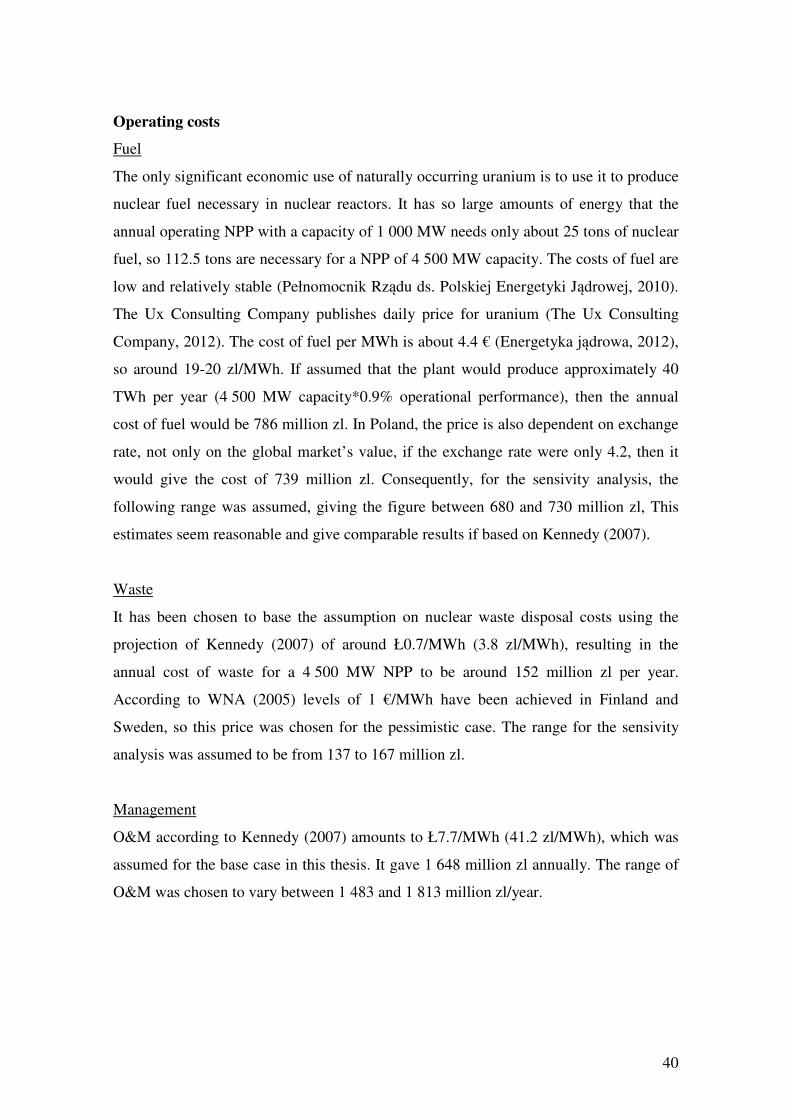
40
Operating costs
Fuel
The only significant economic use of naturally occurring uranium is to use it to produce
nuclear fuel necessary in nuclear reactors. It has so large amounts of energy that the
annual operating NPP with a capacity of 1 000 MW needs only about 25 tons of nuclear
fuel, so 112.5 tons are necessary for a NPP of 4 500 MW capacity. The costs of fuel are
low and relatively stable (Pełnomocnik Rządu ds. Polskiej Energetyki Jądrowej, 2010).
The Ux Consulting Company publishes daily price for uranium (The Ux Consulting
Company, 2012). The cost of fuel per MWh is about 4.4 € (Energetyka jądrowa, 2012),
so around 19-20 zl/MWh. If assumed that the plant would produce approximately 40
TWh per year (4 500 MW capacity*0.9% operational performance), then the annual
cost of fuel would be 786 million zl. In Poland, the price is also dependent on exchange
rate, not only on the global market’s value, if the exchange rate were only 4.2, then it
would give the cost of 739 million zl. Consequently, for the sensivity analysis, the
following range was assumed, giving the figure between 680 and 730 million zl, This
estimates seem reasonable and give comparable results if based on Kennedy (2007).
Waste
It has been chosen to base the assumption on nuclear waste disposal costs using the
projection of Kennedy (2007) of around Ł0.7/MWh (3.8 zl/MWh), resulting in the
annual cost of waste for a 4 500 MW NPP to be around 152 million zl per year.
According to WNA (2005) levels of 1 €/MWh have been achieved in Finland and
Sweden, so this price was chosen for the pessimistic case. The range for the sensivity
analysis was assumed to be from 137 to 167 million zl.
Management
O&M according to Kennedy (2007) amounts to Ł7.7/MWh (41.2 zl/MWh), which was
assumed for the base case in this thesis. It gave 1 648 million zl annually. The range of
O&M was chosen to vary between 1 483 and 1 813 million zl/year.
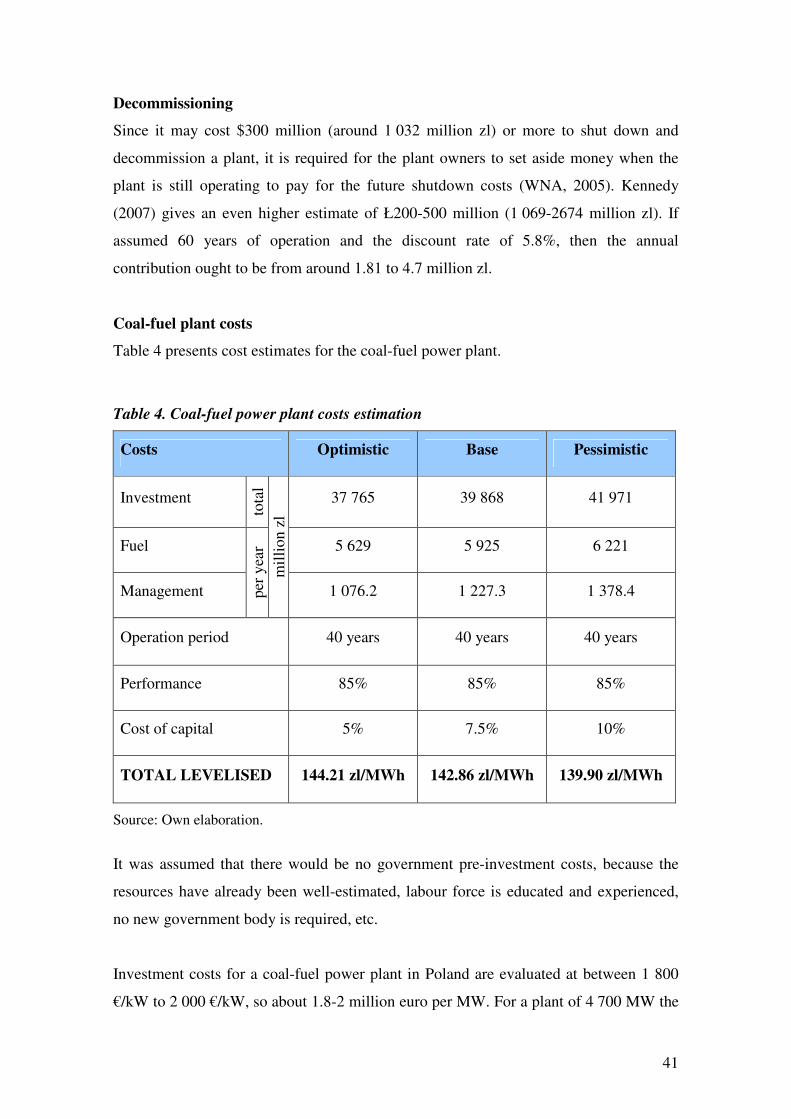
41
Decommissioning
Since it may cost $300 million (around 1 032 million zl) or more to shut down and
decommission a plant, it is required for the plant owners to set aside money when the
plant is still operating to pay for the future shutdown costs (WNA, 2005). Kennedy
(2007) gives an even higher estimate of Ł200-500 million (1 069-2674 million zl). If
assumed 60 years of operation and the discount rate of 5.8%, then the annual
contribution ought to be from around 1.81 to 4.7 million zl.
Coal-fuel plant costs
Table 4 presents cost estimates for the coal-fuel power plant.
Table 4. Coal-fuel power plant costs estimation
Costs Optimistic Base Pessimistic
Investment
tota
l
37 765 39 868 41 971
Fuel 5 629 5 925 6 221
Management per
yea
r
mil
lio
n z
l
1 076.2 1 227.3 1 378.4
Operation period 40 years 40 years 40 years
Performance 85% 85% 85%
Cost of capital 5% 7.5% 10%
TOTAL LEVELISED 144.21 zl/MWh 142.86 zl/MWh 139.90 zl/MWh
Source: Own elaboration.
It was assumed that there would be no government pre-investment costs, because the
resources have already been well-estimated, labour force is educated and experienced,
no new government body is required, etc.
Investment costs for a coal-fuel power plant in Poland are evaluated at between 1 800
€/kW to 2 000 €/kW, so about 1.8-2 million euro per MW. For a plant of 4 700 MW the
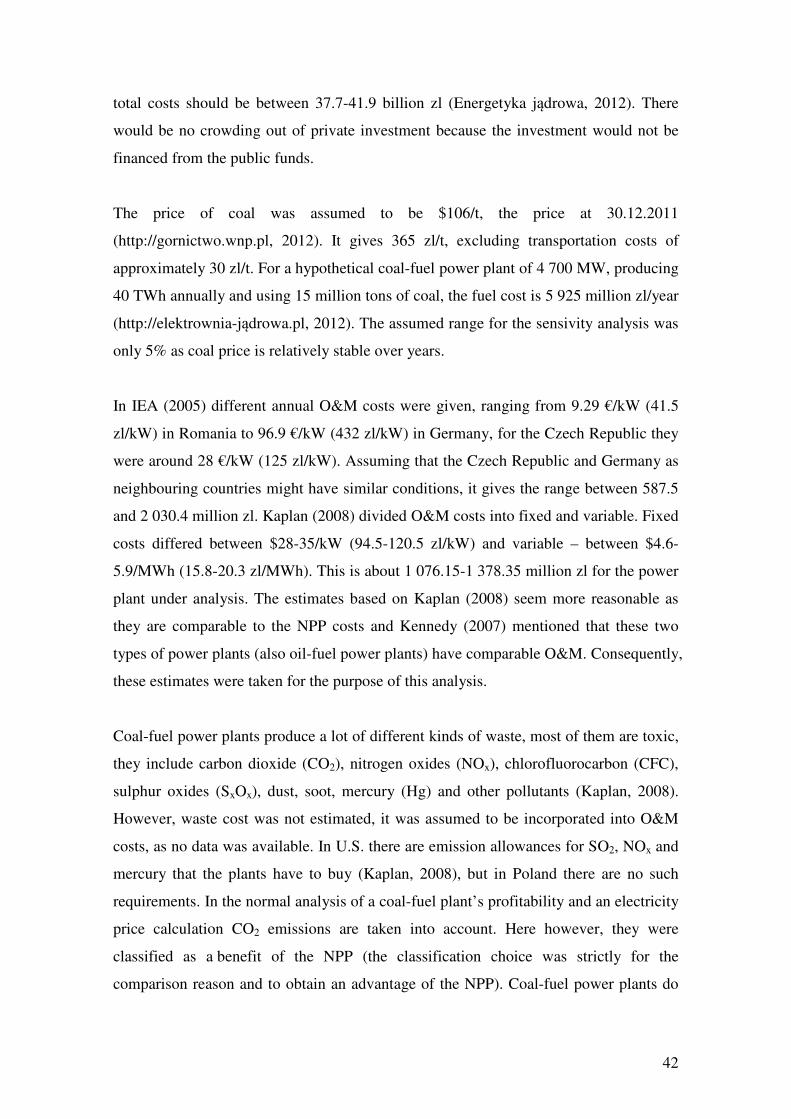
42
total costs should be between 37.7-41.9 billion zl (Energetyka jądrowa, 2012). There
would be no crowding out of private investment because the investment would not be
financed from the public funds.
The price of coal was assumed to be $106/t, the price at 30.12.2011
(http://gornictwo.wnp.pl, 2012). It gives 365 zl/t, excluding transportation costs of
approximately 30 zl/t. For a hypothetical coal-fuel power plant of 4 700 MW, producing
40 TWh annually and using 15 million tons of coal, the fuel cost is 5 925 million zl/year
(http://elektrownia-jądrowa.pl, 2012). The assumed range for the sensivity analysis was
only 5% as coal price is relatively stable over years.
In IEA (2005) different annual O&M costs were given, ranging from 9.29 €/kW (41.5
zl/kW) in Romania to 96.9 €/kW (432 zl/kW) in Germany, for the Czech Republic they
were around 28 €/kW (125 zl/kW). Assuming that the Czech Republic and Germany as
neighbouring countries might have similar conditions, it gives the range between 587.5
and 2 030.4 million zl. Kaplan (2008) divided O&M costs into fixed and variable. Fixed
costs differed between $28-35/kW (94.5-120.5 zl/kW) and variable – between $4.6-
5.9/MWh (15.8-20.3 zl/MWh). This is about 1 076.15-1 378.35 million zl for the power
plant under analysis. The estimates based on Kaplan (2008) seem more reasonable as
they are comparable to the NPP costs and Kennedy (2007) mentioned that these two
types of power plants (also oil-fuel power plants) have comparable O&M. Consequently,
these estimates were taken for the purpose of this analysis.
Coal-fuel power plants produce a lot of different kinds of waste, most of them are toxic,
they include carbon dioxide (CO2), nitrogen oxides (NOx), chlorofluorocarbon (CFC),
sulphur oxides (SxOx), dust, soot, mercury (Hg) and other pollutants (Kaplan, 2008).
However, waste cost was not estimated, it was assumed to be incorporated into O&M
costs, as no data was available. In U.S. there are emission allowances for SO2, NOx and
mercury that the plants have to buy (Kaplan, 2008), but in Poland there are no such
requirements. In the normal analysis of a coal-fuel plant’s profitability and an electricity
price calculation CO2 emissions are taken into account. Here however, they were
classified as a benefit of the NPP (the classification choice was strictly for the
comparison reason and to obtain an advantage of the NPP). Coal-fuel power plants do
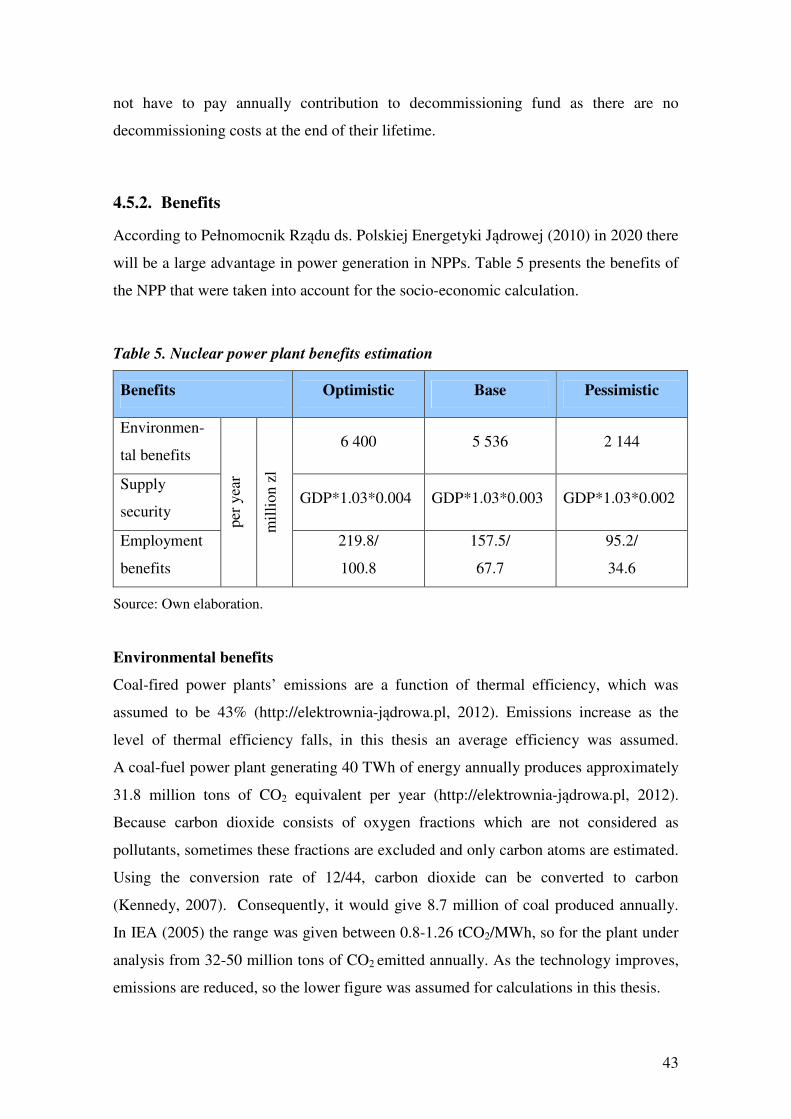
43
not have to pay annually contribution to decommissioning fund as there are no
decommissioning costs at the end of their lifetime.
4.5.2. Benefits
According to Pełnomocnik Rządu ds. Polskiej Energetyki Jądrowej (2010) in 2020 there
will be a large advantage in power generation in NPPs. Table 5 presents the benefits of
the NPP that were taken into account for the socio-economic calculation.
Table 5. Nuclear power plant benefits estimation
Benefits Optimistic Base Pessimistic
Environmen-
tal benefits 6 400 5 536 2 144
Supply
security GDP*1.03*0.004 GDP*1.03*0.003 GDP*1.03*0.002
Employment
benefits
per
yea
r
mil
lio
n z
l
219.8/
100.8
157.5/
67.7
95.2/
34.6
Source: Own elaboration.
Environmental benefits
Coal-fired power plants’ emissions are a function of thermal efficiency, which was
assumed to be 43% (http://elektrownia-jądrowa.pl, 2012). Emissions increase as the
level of thermal efficiency falls, in this thesis an average efficiency was assumed.
A coal-fuel power plant generating 40 TWh of energy annually produces approximately
31.8 million tons of CO2 equivalent per year (http://elektrownia-jądrowa.pl, 2012).
Because carbon dioxide consists of oxygen fractions which are not considered as
pollutants, sometimes these fractions are excluded and only carbon atoms are estimated.
Using the conversion rate of 12/44, carbon dioxide can be converted to carbon
(Kennedy, 2007). Consequently, it would give 8.7 million of coal produced annually.
In IEA (2005) the range was given between 0.8-1.26 tCO2/MWh, so for the plant under
analysis from 32-50 million tons of CO2 emitted annually. As the technology improves,
emissions are reduced, so the lower figure was assumed for calculations in this thesis.
44
Kennedy (2007) notes that CO2 emissions for a NPP range between 5 to 20 g/kWh. So
for production of 40 TWh, there are from 200 to 800 tons of CO2 emitted. In his study,
he takes the value of 10 g/kWh, consequently in this analysis it would give 400 tons of
CO2 emitted annually. This figure is negligible and thus not incorporated into
calculation.
After inclusion of CO2 mitigation costs of 39 €/tCO2 (173 zl/tCO2) and 32 million tons
of CO2 emitted (http://elektrownia-jądrowa.pl, 2012) the advantage of the NPP
increases by 5 536 million zl/year. If 50 million tons of CO2 were emitted, then the costs
rise to 86 500 million zl/year. According to Pełnomocnik Rządu ds. Polskiej Energetyki
Jądrowej (2010) nuclear reactors with light-water will be competitive at CO2 emission
cost of 15 €/tCO2 (67 zl/tCO2). Similar figures were given by NEA (2011).
For the purpose of the analysis it was assumed that the coal-fuel plant would emit 32
million tons of CO2 pe year. In the base case the price would be 39 €/tCO2. For the
optimistic and pessimistic scenario calculations it would reach the value of 15 and
45 €/tCO2 (200 zl/tCO2). The lower and middle figures are consistent with the prices
observed at the EU, with the higher value trying to represent the expected price for
2020-2030. It is worth noting that even higher allowance prices in the future should not
be excluded if climate negotiations are successful and more stringent targets are set
(Kennedy, 2007).
Security of supply
According to IEA (2005) the actual GDP losses associated with increasing coal prices
are estimated to be around 0.5% of GDP from a 10% increase in the price of coal. Coal
price is rather stable (WCA, 2012), so this effect would not have a huge impact. In IEA
(2005) different price rate growths were given based on the manufacturers’ prognoses.
When prices were assumed to increase, the average rate was of around 50% between
2010 and the end of the plant economic lifetime in 2050. Predicting a 75% increase in
60 years of the NPPs operation, the security supply benefit would reach 0.06% of GDP
each year, which for the year 2011 would give 849 million zl (Polish GDP was equal to
1 415 385 million zl as given by GUS, 2012). With 3% of GDP growth each year and
5.8% discount rate the average benefit would be around 145.13 million zl. However, if
coal price was stable, there would be no benefit at all. There are too many uncertainties
to assess this figure accurately. According to European Commission (2010) the average
GDP growth for the EU countries until 2030 will be only 2%. The author of this thesis
45
thus chose the range for the benefit at 3% growth in GDP to be from 75 to 25% increase
in coal price over 60 years. 3% growth in GDP was assumed as after 2030 the economy
might accelerate and recover from the 2008 financial crisis and moreover Poland has to
catch up to the EU 15.
Employment benefits
For calculating employment benefits it was assumed that there would be 7 140 new
people employed while building the plant and 2 400 permanently afterwards
(Strupczewski, 2012). The net salary was taken from GUS (2012) to be between the
legal minimum of 1 111 zl/month (13 332 zl/year) and the average of 2 562 zl/month
(30 780 zl/year) for years 2016-2030 and between 1 200 zl/month and 3 500 zl/month
afterwards. The reality in Poland is that most of the new employees get the lowest
required wage. For the later years wage increases were taken into account, both the legal
minimum as with tenure. The estimates were shown in Table 5, the lower figures are the
benefits from 2030, when the whole construction period would end. Employment
created in other industry sectors was excluded from calculations as it might be difficult
to estimate correctly all the connections.
4.6. NPV calculation
This section can be called the essence of the cost-benefit analysis as it deals with the
NPV establishment. At first, the STPR was assessed and the total levelised costs
compared to be followed by the NPV calculation.
Since the Polish government bodies have not published in any official guideline for
usage of social discount rate, for the purpose of this paper it was calculated by its author.
The assessment was based on the STPR methodology described in section 2.1.5.
The pure rate of time preference (ρ) and the elasticity of marginal utility of consumption
(µ) are affected by the social and individual preferences, so their estimation might be
difficult. In Boardman et al. (2006) it is recommended that ρ should be equalized to 1%.
For µ it is suggested to give it the value of 1.3, with sensivity analysis at 1.0 and 2.0.
Evans (2006) bases its estimate of µ on tax data and foreign aid contributions, because
the behavioural approach causes empirical problems. He concludes that the parameter
should be equalized to unity. If µ is equal to one, “the relative weight on society’s
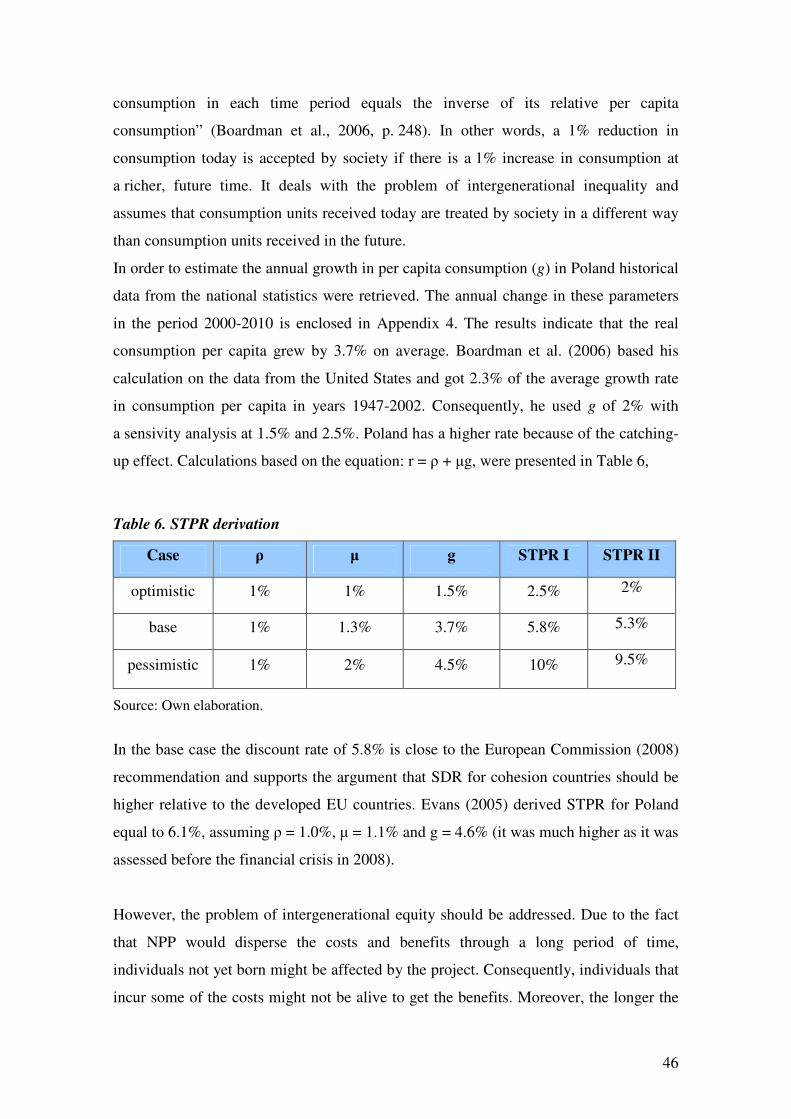
46
consumption in each time period equals the inverse of its relative per capita
consumption” (Boardman et al., 2006, p. 248). In other words, a 1% reduction in
consumption today is accepted by society if there is a 1% increase in consumption at
a richer, future time. It deals with the problem of intergenerational inequality and
assumes that consumption units received today are treated by society in a different way
than consumption units received in the future.
In order to estimate the annual growth in per capita consumption (g) in Poland historical
data from the national statistics were retrieved. The annual change in these parameters
in the period 2000-2010 is enclosed in Appendix 4. The results indicate that the real
consumption per capita grew by 3.7% on average. Boardman et al. (2006) based his
calculation on the data from the United States and got 2.3% of the average growth rate
in consumption per capita in years 1947-2002. Consequently, he used g of 2% with
a sensivity analysis at 1.5% and 2.5%. Poland has a higher rate because of the catching-
up effect. Calculations based on the equation: r = ρ + µg, were presented in Table 6,
Table 6. STPR derivation
Case ρ µ g STPR I STPR II
optimistic 1% 1% 1.5% 2.5% 2%
base 1% 1.3% 3.7% 5.8% 5.3%
pessimistic 1% 2% 4.5% 10% 9.5%
Source: Own elaboration.
In the base case the discount rate of 5.8% is close to the European Commission (2008)
recommendation and supports the argument that SDR for cohesion countries should be
higher relative to the developed EU countries. Evans (2005) derived STPR for Poland
equal to 6.1%, assuming ρ = 1.0%, µ = 1.1% and g = 4.6% (it was much higher as it was
assessed before the financial crisis in 2008).
However, the problem of intergenerational equity should be addressed. Due to the fact
that NPP would disperse the costs and benefits through a long period of time,
individuals not yet born might be affected by the project. Consequently, individuals that
incur some of the costs might not be alive to get the benefits. Moreover, the longer the
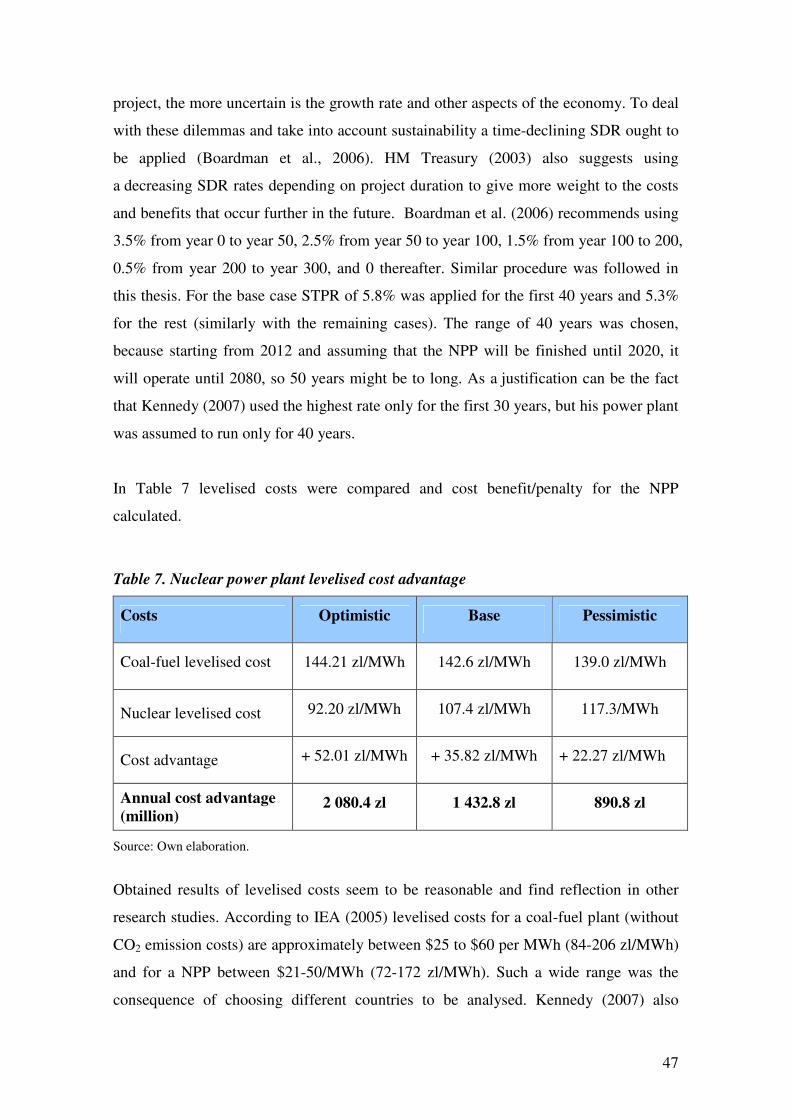
47
project, the more uncertain is the growth rate and other aspects of the economy. To deal
with these dilemmas and take into account sustainability a time-declining SDR ought to
be applied (Boardman et al., 2006). HM Treasury (2003) also suggests using
a decreasing SDR rates depending on project duration to give more weight to the costs
and benefits that occur further in the future. Boardman et al. (2006) recommends using
3.5% from year 0 to year 50, 2.5% from year 50 to year 100, 1.5% from year 100 to 200,
0.5% from year 200 to year 300, and 0 thereafter. Similar procedure was followed in
this thesis. For the base case STPR of 5.8% was applied for the first 40 years and 5.3%
for the rest (similarly with the remaining cases). The range of 40 years was chosen,
because starting from 2012 and assuming that the NPP will be finished until 2020, it
will operate until 2080, so 50 years might be to long. As a justification can be the fact
that Kennedy (2007) used the highest rate only for the first 30 years, but his power plant
was assumed to run only for 40 years.
In Table 7 levelised costs were compared and cost benefit/penalty for the NPP
calculated.
Table 7. Nuclear power plant levelised cost advantage
Costs Optimistic Base Pessimistic
Coal-fuel levelised cost 144.21 zl/MWh 142.6 zl/MWh 139.0 zl/MWh
Nuclear levelised cost 92.20 zl/MWh 107.4 zl/MWh 117.3/MWh
Cost advantage + 52.01 zl/MWh + 35.82 zl/MWh + 22.27 zl/MWh
Annual cost advantage
(million) 2 080.4 zl 1 432.8 zl 890.8 zl
Source: Own elaboration.
Obtained results of levelised costs seem to be reasonable and find reflection in other
research studies. According to IEA (2005) levelised costs for a coal-fuel plant (without
CO2 emission costs) are approximately between $25 to $60 per MWh (84-206 zl/MWh)
and for a NPP between $21-50/MWh (72-172 zl/MWh). Such a wide range was the
consequence of choosing different countries to be analysed. Kennedy (2007) also
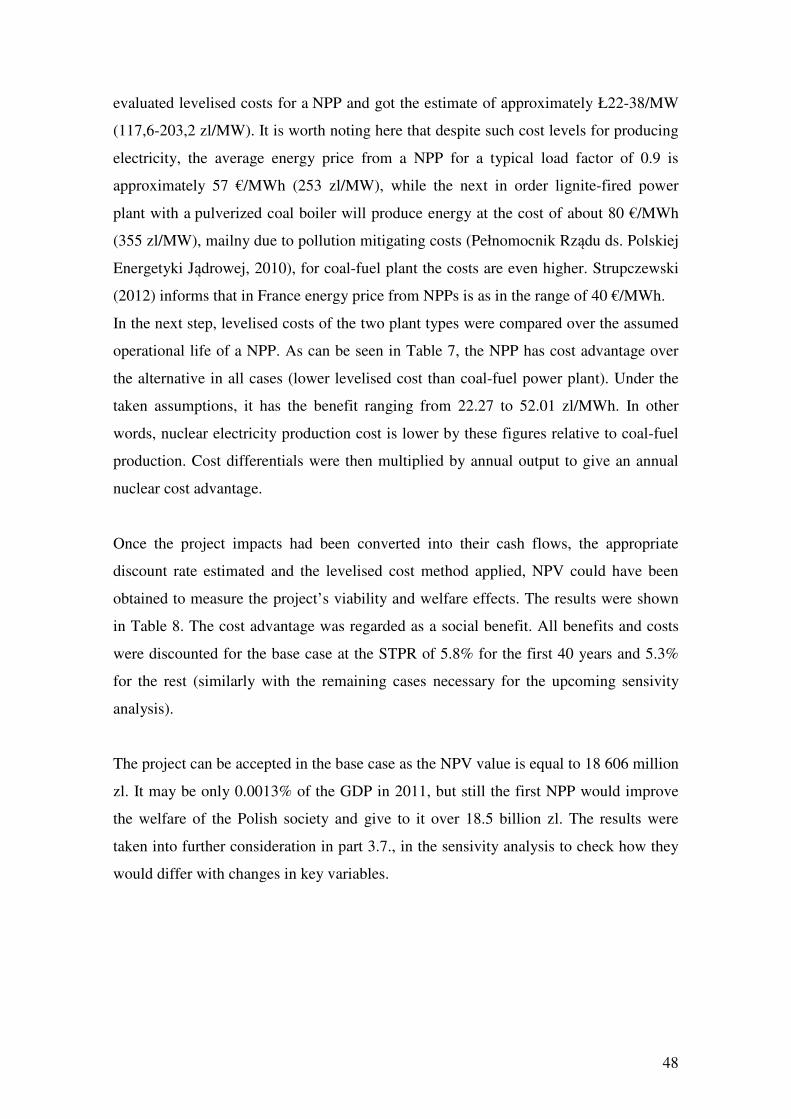
48
evaluated levelised costs for a NPP and got the estimate of approximately Ł22-38/MW
(117,6-203,2 zl/MW). It is worth noting here that despite such cost levels for producing
electricity, the average energy price from a NPP for a typical load factor of 0.9 is
approximately 57 €/MWh (253 zl/MW), while the next in order lignite-fired power
plant with a pulverized coal boiler will produce energy at the cost of about 80 €/MWh
(355 zl/MW), mailny due to pollution mitigating costs (Pełnomocnik Rządu ds. Polskiej
Energetyki Jądrowej, 2010), for coal-fuel plant the costs are even higher. Strupczewski
(2012) informs that in France energy price from NPPs is as in the range of 40 €/MWh.
In the next step, levelised costs of the two plant types were compared over the assumed
operational life of a NPP. As can be seen in Table 7, the NPP has cost advantage over
the alternative in all cases (lower levelised cost than coal-fuel power plant). Under the
taken assumptions, it has the benefit ranging from 22.27 to 52.01 zl/MWh. In other
words, nuclear electricity production cost is lower by these figures relative to coal-fuel
production. Cost differentials were then multiplied by annual output to give an annual
nuclear cost advantage.
Once the project impacts had been converted into their cash flows, the appropriate
discount rate estimated and the levelised cost method applied, NPV could have been
obtained to measure the project’s viability and welfare effects. The results were shown
in Table 8. The cost advantage was regarded as a social benefit. All benefits and costs
were discounted for the base case at the STPR of 5.8% for the first 40 years and 5.3%
for the rest (similarly with the remaining cases necessary for the upcoming sensivity
analysis).
The project can be accepted in the base case as the NPV value is equal to 18 606 million
zl. It may be only 0.0013% of the GDP in 2011, but still the first NPP would improve
the welfare of the Polish society and give to it over 18.5 billion zl. The results were
taken into further consideration in part 3.7., in the sensivity analysis to check how they
would differ with changes in key variables.
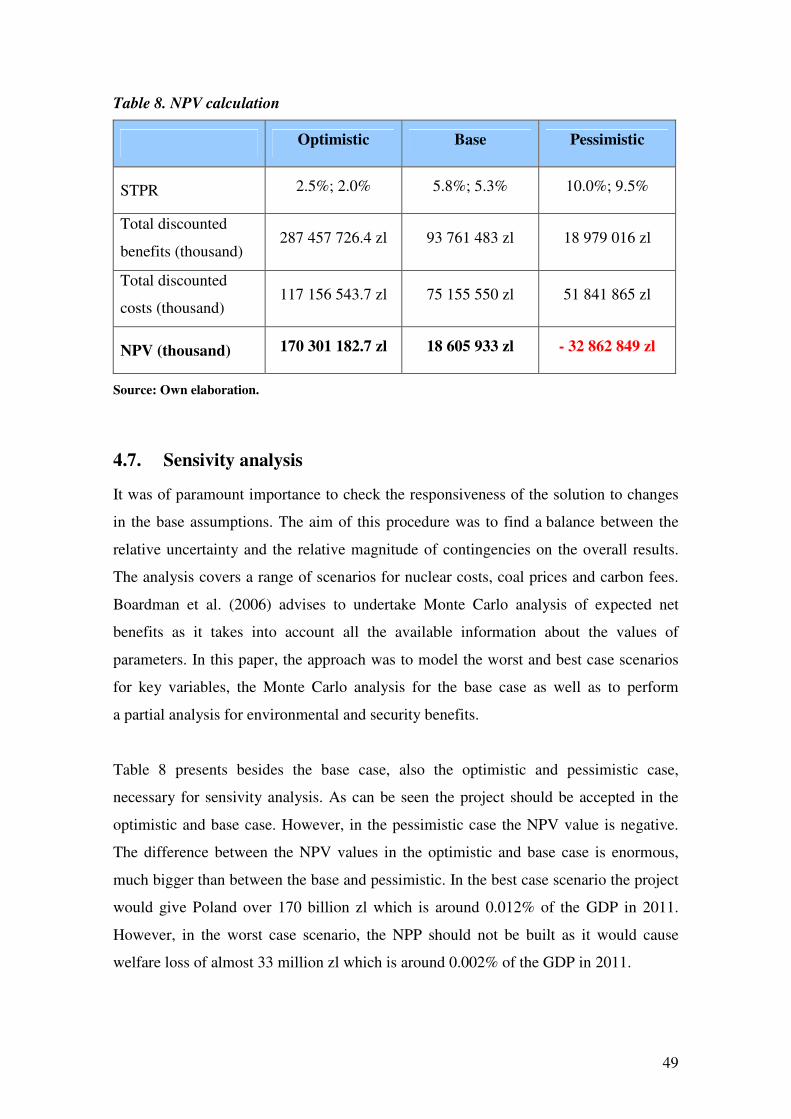
49
Table 8. NPV calculation
Optimistic Base Pessimistic
STPR 2.5%; 2.0% 5.8%; 5.3% 10.0%; 9.5%
Total discounted
benefits (thousand) 287 457 726.4 zl 93 761 483 zl 18 979 016 zl
Total discounted
costs (thousand) 117 156 543.7 zl 75 155 550 zl 51 841 865 zl
NPV (thousand) 170 301 182.7 zl 18 605 933 zl - 32 862 849 zl
Source: Own elaboration.
4.7. Sensivity analysis
It was of paramount importance to check the responsiveness of the solution to changes
in the base assumptions. The aim of this procedure was to find a balance between the
relative uncertainty and the relative magnitude of contingencies on the overall results.
The analysis covers a range of scenarios for nuclear costs, coal prices and carbon fees.
Boardman et al. (2006) advises to undertake Monte Carlo analysis of expected net
benefits as it takes into account all the available information about the values of
parameters. In this paper, the approach was to model the worst and best case scenarios
for key variables, the Monte Carlo analysis for the base case as well as to perform
a partial analysis for environmental and security benefits.
Table 8 presents besides the base case, also the optimistic and pessimistic case,
necessary for sensivity analysis. As can be seen the project should be accepted in the
optimistic and base case. However, in the pessimistic case the NPV value is negative.
The difference between the NPV values in the optimistic and base case is enormous,
much bigger than between the base and pessimistic. In the best case scenario the project
would give Poland over 170 billion zl which is around 0.012% of the GDP in 2011.
However, in the worst case scenario, the NPP should not be built as it would cause
welfare loss of almost 33 million zl which is around 0.002% of the GDP in 2011.
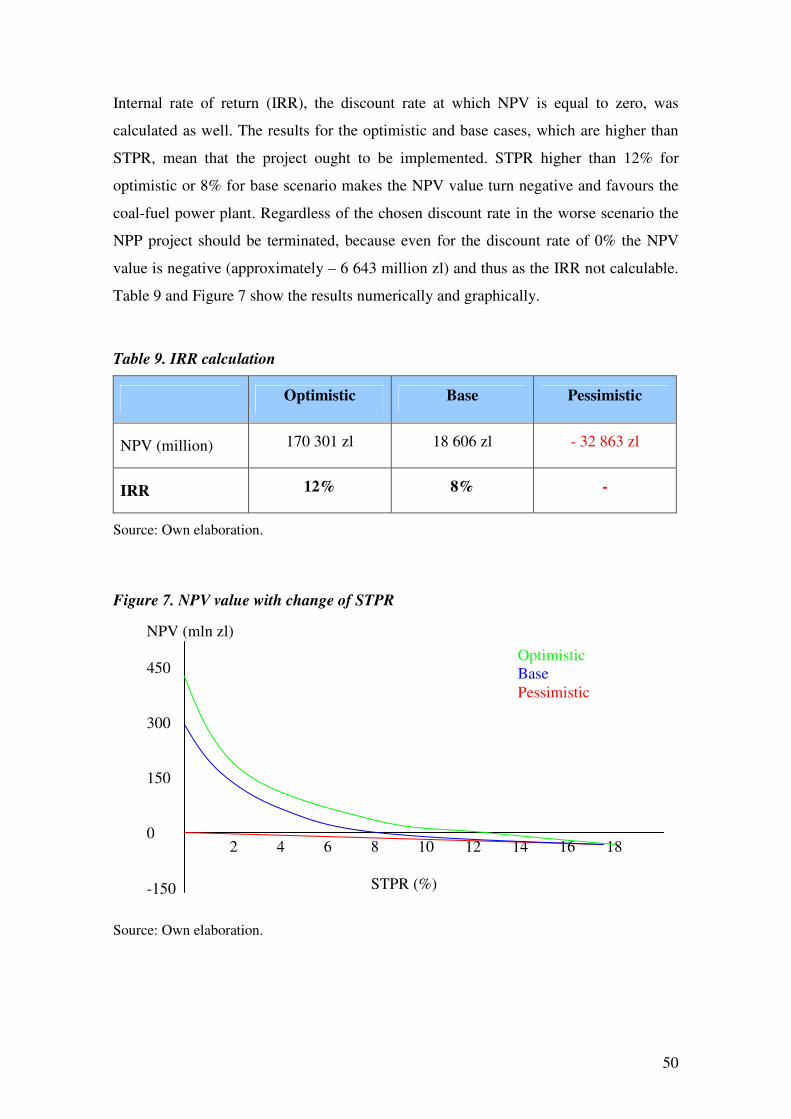
50
Internal rate of return (IRR), the discount rate at which NPV is equal to zero, was
calculated as well. The results for the optimistic and base cases, which are higher than
STPR, mean that the project ought to be implemented. STPR higher than 12% for
optimistic or 8% for base scenario makes the NPV value turn negative and favours the
coal-fuel power plant. Regardless of the chosen discount rate in the worse scenario the
NPP project should be terminated, because even for the discount rate of 0% the NPV
value is negative (approximately – 6 643 million zl) and thus as the IRR not calculable.
Table 9 and Figure 7 show the results numerically and graphically.
Table 9. IRR calculation
Optimistic Base Pessimistic
NPV (million) 170 301 zl 18 606 zl - 32 863 zl
IRR 12% 8% -
Source: Own elaboration.
Figure 7. NPV value with change of STPR
Source: Own elaboration.
NPV (mln zl) 450 300 150 0
-150
2 4 6 8 10 12 14 16 18
STPR (%)
Optimistic Base
Pessimistic
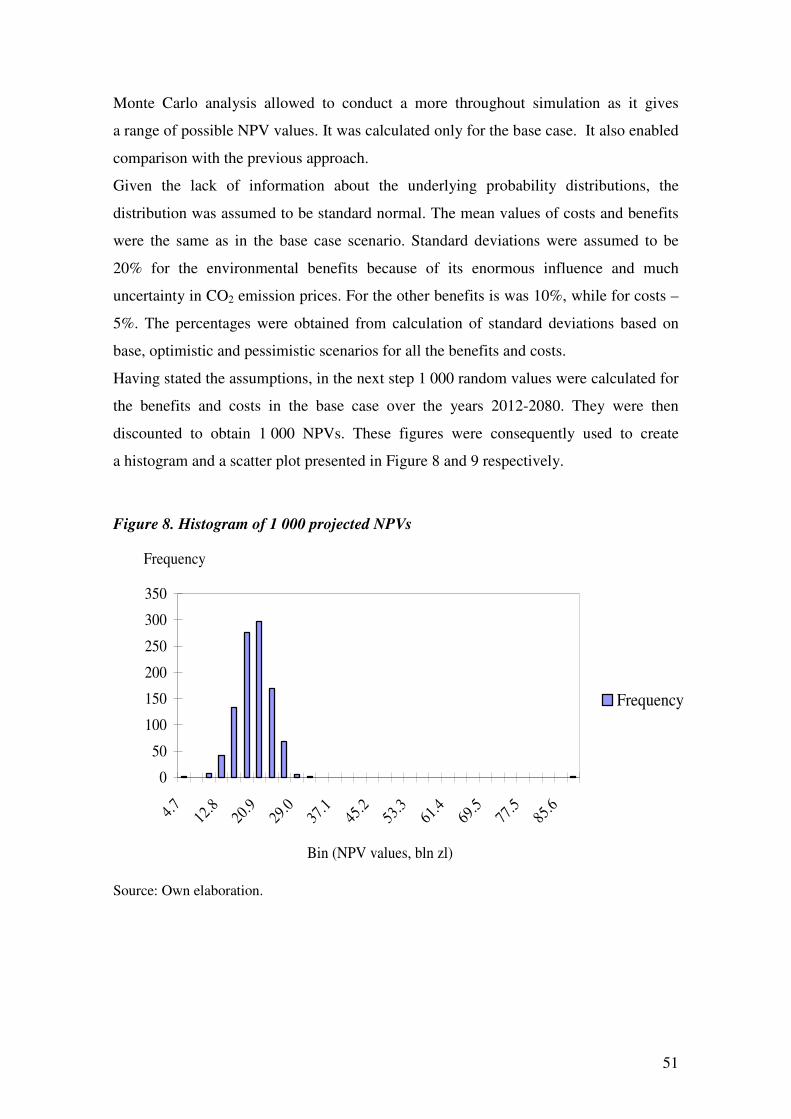
51
Monte Carlo analysis allowed to conduct a more throughout simulation as it gives
a range of possible NPV values. It was calculated only for the base case. It also enabled
comparison with the previous approach.
Given the lack of information about the underlying probability distributions, the
distribution was assumed to be standard normal. The mean values of costs and benefits
were the same as in the base case scenario. Standard deviations were assumed to be
20% for the environmental benefits because of its enormous influence and much
uncertainty in CO2 emission prices. For the other benefits is was 10%, while for costs –
5%. The percentages were obtained from calculation of standard deviations based on
base, optimistic and pessimistic scenarios for all the benefits and costs.
Having stated the assumptions, in the next step 1 000 random values were calculated for
the benefits and costs in the base case over the years 2012-2080. They were then
discounted to obtain 1 000 NPVs. These figures were consequently used to create
a histogram and a scatter plot presented in Figure 8 and 9 respectively.
Figure 8. Histogram of 1 000 projected NPVs
0
50
100
150
200
250
300
350
4.7
12.8
20.9
29.0
37.1
45.2
53.3
61.4
69.5
77.5
85.6
Bin (NPV values, bln zl)
Frequency
Frequency
Source: Own elaboration.
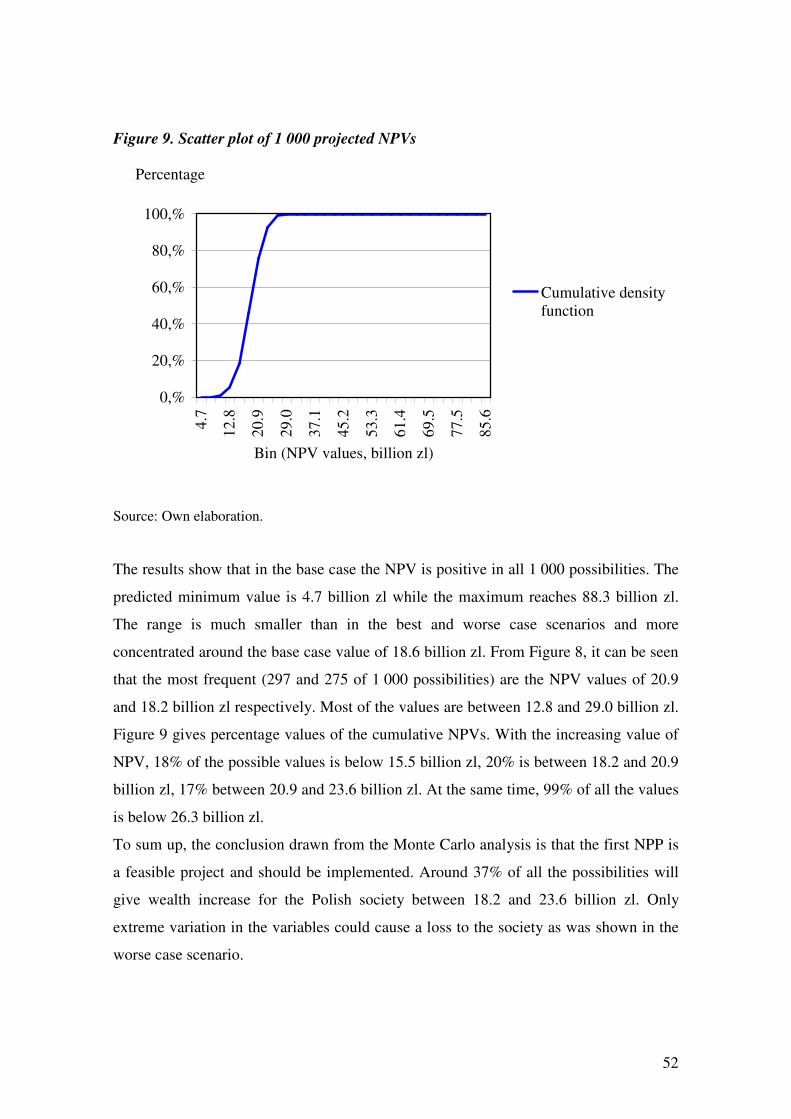
52
Figure 9. Scatter plot of 1 000 projected NPVs
0,%
20,%
40,%
60,%
80,%
100,%4
.7
12
.8
20
.9
29
.0
37
.1
45
.2
53
.3
61
.4
69
.5
77
.5
85
.6
Bin (NPV values, billion zl)
Percentage
Cumulative densityfunction
Source: Own elaboration.
The results show that in the base case the NPV is positive in all 1 000 possibilities. The
predicted minimum value is 4.7 billion zl while the maximum reaches 88.3 billion zl.
The range is much smaller than in the best and worse case scenarios and more
concentrated around the base case value of 18.6 billion zl. From Figure 8, it can be seen
that the most frequent (297 and 275 of 1 000 possibilities) are the NPV values of 20.9
and 18.2 billion zl respectively. Most of the values are between 12.8 and 29.0 billion zl.
Figure 9 gives percentage values of the cumulative NPVs. With the increasing value of
NPV, 18% of the possible values is below 15.5 billion zl, 20% is between 18.2 and 20.9
billion zl, 17% between 20.9 and 23.6 billion zl. At the same time, 99% of all the values
is below 26.3 billion zl.
To sum up, the conclusion drawn from the Monte Carlo analysis is that the first NPP is
a feasible project and should be implemented. Around 37% of all the possibilities will
give wealth increase for the Polish society between 18.2 and 23.6 billion zl. Only
extreme variation in the variables could cause a loss to the society as was shown in the
worse case scenario.
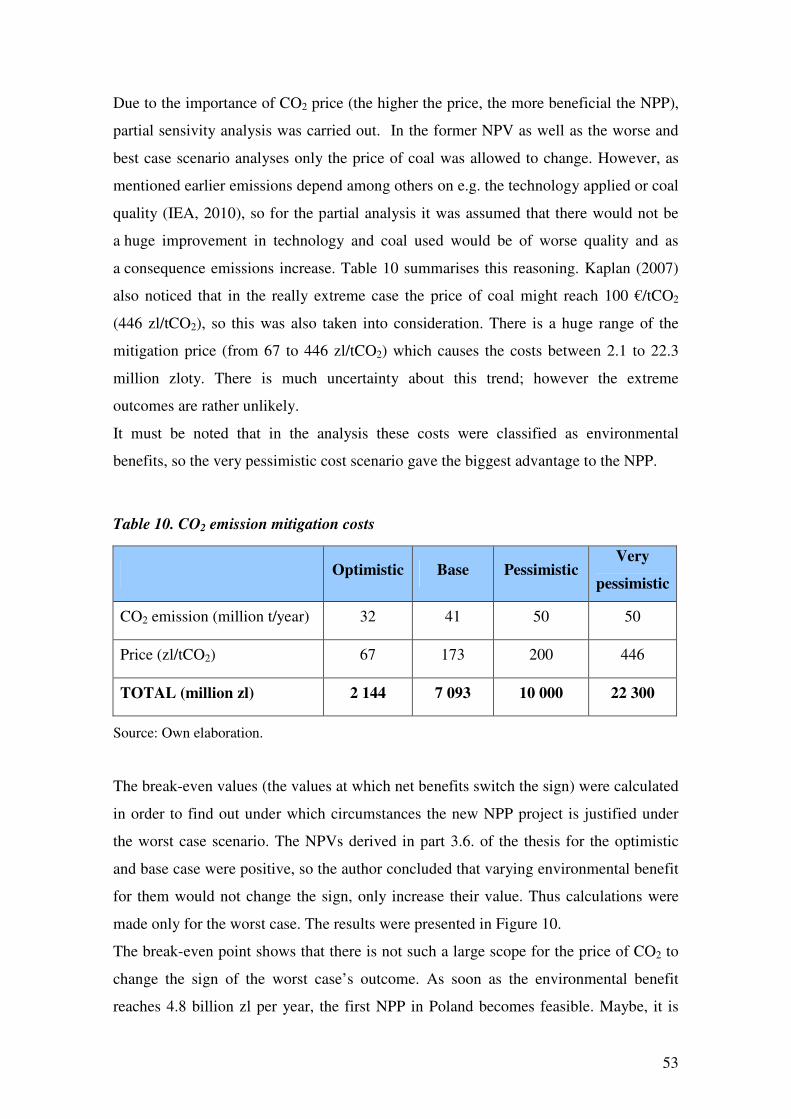
53
Due to the importance of CO2 price (the higher the price, the more beneficial the NPP),
partial sensivity analysis was carried out. In the former NPV as well as the worse and
best case scenario analyses only the price of coal was allowed to change. However, as
mentioned earlier emissions depend among others on e.g. the technology applied or coal
quality (IEA, 2010), so for the partial analysis it was assumed that there would not be
a huge improvement in technology and coal used would be of worse quality and as
a consequence emissions increase. Table 10 summarises this reasoning. Kaplan (2007)
also noticed that in the really extreme case the price of coal might reach 100 €/tCO2
(446 zl/tCO2), so this was also taken into consideration. There is a huge range of the
mitigation price (from 67 to 446 zl/tCO2) which causes the costs between 2.1 to 22.3
million zloty. There is much uncertainty about this trend; however the extreme
outcomes are rather unlikely.
It must be noted that in the analysis these costs were classified as environmental
benefits, so the very pessimistic cost scenario gave the biggest advantage to the NPP.
Table 10. CO2 emission mitigation costs
Source: Own elaboration.
The break-even values (the values at which net benefits switch the sign) were calculated
in order to find out under which circumstances the new NPP project is justified under
the worst case scenario. The NPVs derived in part 3.6. of the thesis for the optimistic
and base case were positive, so the author concluded that varying environmental benefit
for them would not change the sign, only increase their value. Thus calculations were
made only for the worst case. The results were presented in Figure 10.
The break-even point shows that there is not such a large scope for the price of CO2 to
change the sign of the worst case’s outcome. As soon as the environmental benefit
reaches 4.8 billion zl per year, the first NPP in Poland becomes feasible. Maybe, it is
Optimistic Base Pessimistic Very
pessimistic
CO2 emission (million t/year) 32 41 50 50
Price (zl/tCO2) 67 173 200 446
TOTAL (million zl) 2 144 7 093 10 000 22 300
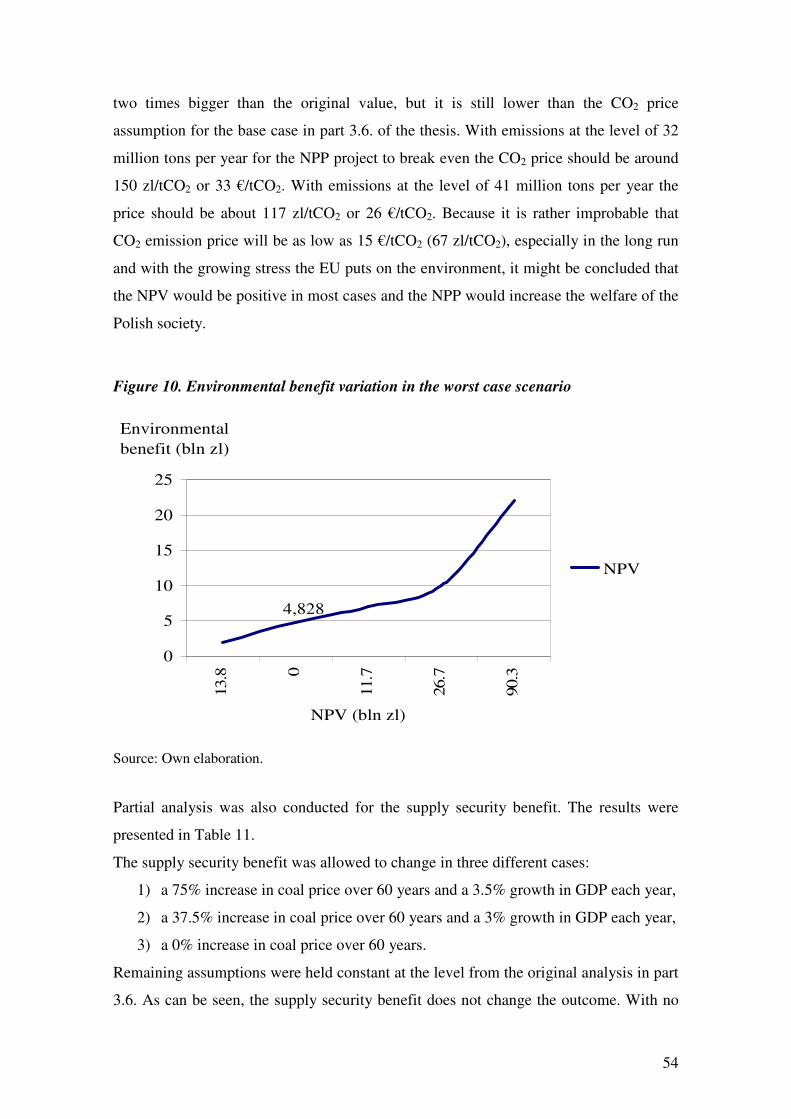
54
two times bigger than the original value, but it is still lower than the CO2 price
assumption for the base case in part 3.6. of the thesis. With emissions at the level of 32
million tons per year for the NPP project to break even the CO2 price should be around
150 zl/tCO2 or 33 €/tCO2. With emissions at the level of 41 million tons per year the
price should be about 117 zl/tCO2 or 26 €/tCO2. Because it is rather improbable that
CO2 emission price will be as low as 15 €/tCO2 (67 zl/tCO2), especially in the long run
and with the growing stress the EU puts on the environment, it might be concluded that
the NPV would be positive in most cases and the NPP would increase the welfare of the
Polish society.
Figure 10. Environmental benefit variation in the worst case scenario
4,828
0
5
10
15
20
25
13.8 0
11.7
26.7
90.3
NPV (bln zl)
Environmental
benefit (bln zl)
NPV
Source: Own elaboration.
Partial analysis was also conducted for the supply security benefit. The results were
presented in Table 11.
The supply security benefit was allowed to change in three different cases:
1) a 75% increase in coal price over 60 years and a 3.5% growth in GDP each year,
2) a 37.5% increase in coal price over 60 years and a 3% growth in GDP each year,
3) a 0% increase in coal price over 60 years.
Remaining assumptions were held constant at the level from the original analysis in part
3.6. As can be seen, the supply security benefit does not change the outcome. With no
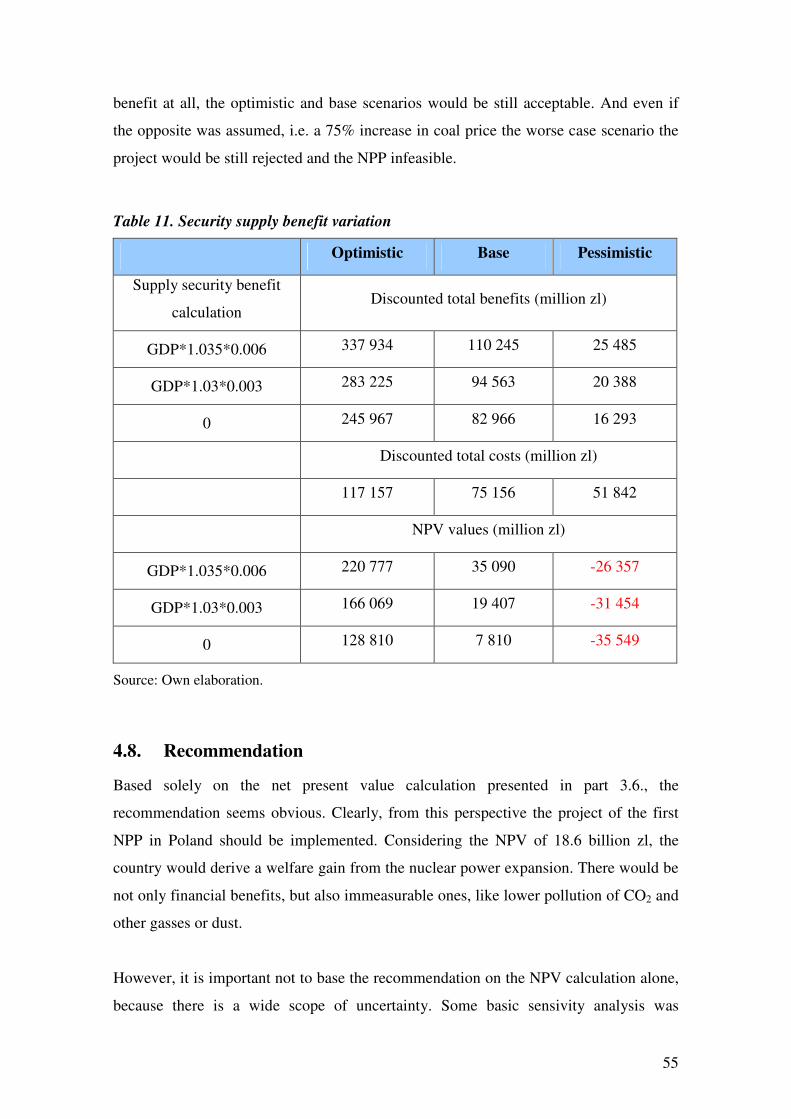
55
benefit at all, the optimistic and base scenarios would be still acceptable. And even if
the opposite was assumed, i.e. a 75% increase in coal price the worse case scenario the
project would be still rejected and the NPP infeasible.
Table 11. Security supply benefit variation
Optimistic Base Pessimistic
Supply security benefit
calculation Discounted total benefits (million zl)
GDP*1.035*0.006 337 934 110 245 25 485
GDP*1.03*0.003 283 225 94 563 20 388
0 245 967 82 966 16 293
Discounted total costs (million zl)
117 157 75 156 51 842
NPV values (million zl)
GDP*1.035*0.006 220 777 35 090 -26 357
GDP*1.03*0.003 166 069 19 407 -31 454
0 128 810 7 810 -35 549
Source: Own elaboration.
4.8. Recommendation
Based solely on the net present value calculation presented in part 3.6., the
recommendation seems obvious. Clearly, from this perspective the project of the first
NPP in Poland should be implemented. Considering the NPV of 18.6 billion zl, the
country would derive a welfare gain from the nuclear power expansion. There would be
not only financial benefits, but also immeasurable ones, like lower pollution of CO2 and
other gasses or dust.
However, it is important not to base the recommendation on the NPV calculation alone,
because there is a wide scope of uncertainty. Some basic sensivity analysis was
56
performed in part 3.7., but the paper volume and time restriction prevented a deeper
insight into it that might be valuable to perform in the future. The results showed that in
the worse case scenario, the NPP project would be infeasible and Poland should rather
go for the coal-fuel power plant. Moreover, it was shown that the different possibilities
for the base case in the Monte Carlo analysis indicate profitability of the NPP. It was
also discovered that CO2 emission prices change the sign in the worse case scenario at
the level of 150 zl/tCO2 if 32 million tons of the gas equivalent would be emitted per
year by the coal-fuel power plant. It must be noted that despite the size, it is still lower
than the CO2 price assumption for the base case in part 3.6. of the thesis. Because the
probability that CO2 emission price will be as low as originally assumed in the
pessimistic case (67 zl/tCO2) is scarce, especially in the long run and with the increasing
environmental requirements in the EU, it might be deducted that the NPV would be
positive in most cases and thus the first NPP would add to the welfare of the Polish
society (in European Commission (2010) the CO2 emission price was forecast to reach
173 zl/tCO2). Furthermore, the author of this thesis proved that the security benefit is
not a key variable changing the sign of the project as the environmental benefit is.
To sum up, the author recommends going for the implementation of the first NPP in
Poland. Overall, it is considered unlikely that the conclusions would change even if
some of the assumptions had proved too optimistic as the individual variables would
have to differ very drastically to be otherwise which was proved by the Monte Carlo
analysis.
57
5. Conclusion
As IEA (2011) points out, there are still some areas Poland has to improve. First, a more
integrated energy and climate policy is needed for a low-carbon path while enhancing
energy security. Secondly, energy policy should put more emphasis on promoting
competition to make the energy markets more efficient. Nuclear energy might provide
foundations for a clean and competitive energy future in Poland. Moreover, integration
of energy and climate strategies would facilitate the design of effective policies to
respect the obligations for sustainable development, ensuring the supply of electricity at
a reasonable cost and with the environment in mind. The thesis provided an assessment
of the socio-economic implications of investing in a new NPP in Poland. In order to
evaluate the project the CBA methodology was adopted as this seemed best suited to
answer the main research question.
After the introduction, the situation of the energy sector, especially in Poland, and
nuclear power energy generation were discussed. It allowed to give the readers a broad
idea about these aspects to better understand why the NPP project had been proposed by
the Polish government. The next chapter gave theoretical background about CBA
concentrating on the crucial aspects used further on in this paper. The fourth chapter
dealt with the CBA assessment. In the following order, project was described, then
scope was delimitated, costs and benefits identified and monetized, NPV was calculated
and sensivity analysis performed, finished with the recommendation.
Six costs and three benefits were identified as being the measurable factors influencing
the Polish society after implementation of the NPP programme. The major costs were
those pertaining to investments, operation and maintenance, fuel, waste and
decommissiong. However, there were also non-financial risks, excluded from the
analysis, like terrorism, equipment failures or leakage. They might cause lower outputs,
outages and increased costs because of additional repairs and maintenance. The three
benefits identified were avoided emissions of air pollutants, security benefit and
employment creation. There were also found non-financial advantages. It must be
underlined that nuclear energy would allow Poland to internalize external costs (CO2
emission allowances, health, etc.) and save resources of organic fossil fuels for the
future generation. Other benefits of investing in nuclear power would allow the
58
economic recovery of some regions and the possibility to boost the domestic industry.
Furthermore, it would give spark to research and innovation and thus education and new
jobs.
For the purpose of the analysis, the social time preference rate was evaluated for Poland
as well as the shadow price of capital. Costs were converted using the levelised cost
methodology. The calculations suggested that in the most cases, the project would be
feasible and Poland should invest in the NPP. Only in the worst case scenario with the
CO2 emission price as low as 15 €/tCO2, it would be better to build the coal-fuel power
plant. However, at the price level of 33 €/tCO2, the NPP started to increase the welfare
of the Polish society. Moreover, only very drastic changes in the assumed costs and
benefits in the base case are likely to make the project infeasible.
However, it must be mentioned that Zehner (2012) underlines that one clear welfare
impact cannot be assessed and wonders why governments want to spend money on
nuclear energy to avoid a single ton of CO2 when the same amount could be spent
elsewhere to mitigate five tons, or even more, without the risks. He finds that there is no
simple answer, there are too many pros and cons. He stresses that those in favour of
nuclear power should not underestimate its inescapable hazards and those against it
should not underestimate its inevitable advantages.
It must be noted that some other aspects were not considered in the thesis at all. As
NEA (2009) points out, there might be invented some new energy production
technology, especially with growing interest in nanotechnology and biotechnology.
Consequently, because NPPs are long-run investments they would become less viable.
On the other hand, due to learning and technology development costs of NPP might
decrease and thus improve the profitability of NPPs. Some new ways for energy
conversion, storage and production might be developed. Furthermore, there are
electricity market uncertainties, political and regulatory aspects (energy markets are
dependent on global national policy), public attitude (opposition often causes delays in
construction and thus higher costs), the risk of fuel scarcity (as a consequence of
embargos, political problems, transportation delays, etc.).
To sum up, surely the development of nuclear energy would be the biggest enterprise in
the history of the Polish energy market and the entire post-war economy. It would,
59
however, have repercussions not only on the Polish society, but on other countries as
well. The NPP would be most probably built as the government took the project very
seriously, even if not finished on time within the schedule. Right now, the road to
success for Poland is still long and a lot has to be done. To build the NPP, strong and
consistent government support is a prerequisite. It is very important to provide legal
framework (which has already been done) as well as independent, competent and
professional supervision. The quality of the technology, transparency of the whole
process of its implementation with reliable information should give rise to acceptance
and public support for the NPP at every stage. Cooperation with other countries and
relevant organizations is crucial in the Polish case, as the nation has no experience with
nuclear power and that might cause delays and cost overruns. The project cannot
therefore be properly implemented without support of international bodies who possess
knowledge and experience.
60
Bibliography
Boardman, A., Greenberg, D., Vining, A., & Weimer, D. (2006), Cost-Benefit Analysis:
Concepts and Practice, Prentice Hall.
Committee on Climate Change (2011), Costs of low-carbon generation technologies,
Manning House, London.
European Commission (2011a), Europe’s energy position, Annual report 2010,
Publications Office of the European Union, Luxembourg.
European Commission (2010), EU energy trends to 2030, Publications Office of the
European Union, Luxembourg.
European Commission (2008), Guide to Cost Benefit Analysis of Investment Projects,
DG Regional Policy, European Commission, Brussels.
European Commission (2011b), Market observatory for energy. Key figures, European
Commission, Brussels.
Evans, D. (2005), Social discount rates for the European Union, Journal of Economic
Studies Vol. 32 No. 1.
Evans, D. (2008), Social project appraisal and discounting for the very long term,
Economic Issues, Vol. 13, Part 1.
HM Treasury (2003), The Green Book: Appraisal and evaluation in Central
Government, HM Treasury, London.
Hubbert N. K. (2006), Nuclear Energy and The Fossil Fuels, Energy Bulletin, Available:
http://www.energybulletin.net [11.09.2012].
61
IEA (2011), Energy Policies of IEA Countries: Poland, OECD, Paris.
IEA (2010), Power generation from coal, OECD, Paris.
IEA (2005), Projected Costs of Generating Electricity, OECD, Paris.
Kaplan, S. (2008), Power Plants: Characteristics and Costs, Congressional Research
Service, Washington DC.
Kennedy, D. (2007), New nuclear power generation in the UK: Cost benefit analysis,
Department of Trade and Industry, Her Majesty’s Government, London. Energy Policy
35: 3701-3716.
Lester, R. K., Rosner, R. (2009), The growth of nuclear power: drivers & constraints,
Dædalus, No. 4: 19-30.
Ministerstwo Gospodarki (2009), Polityka Energetyczna Polski do 2030 roku,
Ministerstwo Gospodarki, Warszawa.
NEA (2009), The Financing of Nuclear Plants, OECD, Paris.
NEA (2011), Carbon Pricing, Power Markets and the Competitiveness of Nuclear
Power, OECD, Paris.
Pełnomocnik Rządu ds. Polskiej Energetyki Jądrowej (2010), Program Polskiej
Energetyki Jądrowej, Ministerstwo Gospodarki, Warszawa.
Pernick R., Wilder C., Winnie T. (2012), Clean Energy Trends, Clean Edge, Available:
http://www.cleanedge.com/reports/clean-energy-trends-2012 [11.09.2012]
Rosenkranz, G. (2006), Nuclear Power – Myth and Realisty, Nuclear Issues Paper No. 1.
Strupczewski A. (2012), Morski wiatr kontra atom, Ecoatom Nr 4/1 luty-marzec 2012.
62
Strupczewski A. (2010), Nie bójmy się atomu!, Stowarzyszenie Ekologów na Rzecz
Energii Nuklearnej SEREN, Warszawa.
Strupczewski A. (2005), Safety of nuclear power, NUKLEONIKA 2005;50
(Supplement 3): 59-66.
Thomas, S. (2005), The Economics of Nuclear Power, Nuclear Issues Paper No. 5.
WNA (2005), The New Economics of Nuclear Power, WNA, London.
Zehner, O. (2012), Nuclear Power’s Unsettled Future, World Future Society, Betsheda.
Web-references
Areva. Available: http://www.areva.com [8/11/2012].
Elektrownia jądrowa. Available: http://www.elektrownia-jądrowa.pl [2012, 20/10/2012].
Elektrownie atomowe. Available: http://atomowe.pl [2012, 1/11/2012].
Energetyka jądrowa. Available: http://www.atom.edu.pl [2012, 11/11/2012].
European Commission, Energy. Available: http://ec.europa.eu/energy [2012,
15/11/2012].
International Atomic Energy Agency. Available: http://www.iaea.org [2012,
11/11/2012].
International Energy Agency. Available: http://www.iea.org [2012, 20/11/2012].
Główny Urząd Statystyczny. Available: http://www.stat.gov.pl [2012, 23/09/2012].
Górnictwo Węglowe. Available: http://gornictwo.wnp.pl [2012, 10/10/2012].
63
Ministry of Economy of Poland. Available: http://www.mg.gov.pl [2012, 30/10/2012].
Świadomie o atomie. Available: http://www.swiadomieoatomie.pl [2012, 12/11/2012].
World Nuclear Association. Available: http://www.world-nuclear.org [2012,
12/11/2012].
World Coal Association. Available: http://www.worldcoal.org [2012, 10/10/2012].
The Ux Consulting Company. Available: http://www.uxc.com [2012, 5/10/2012].
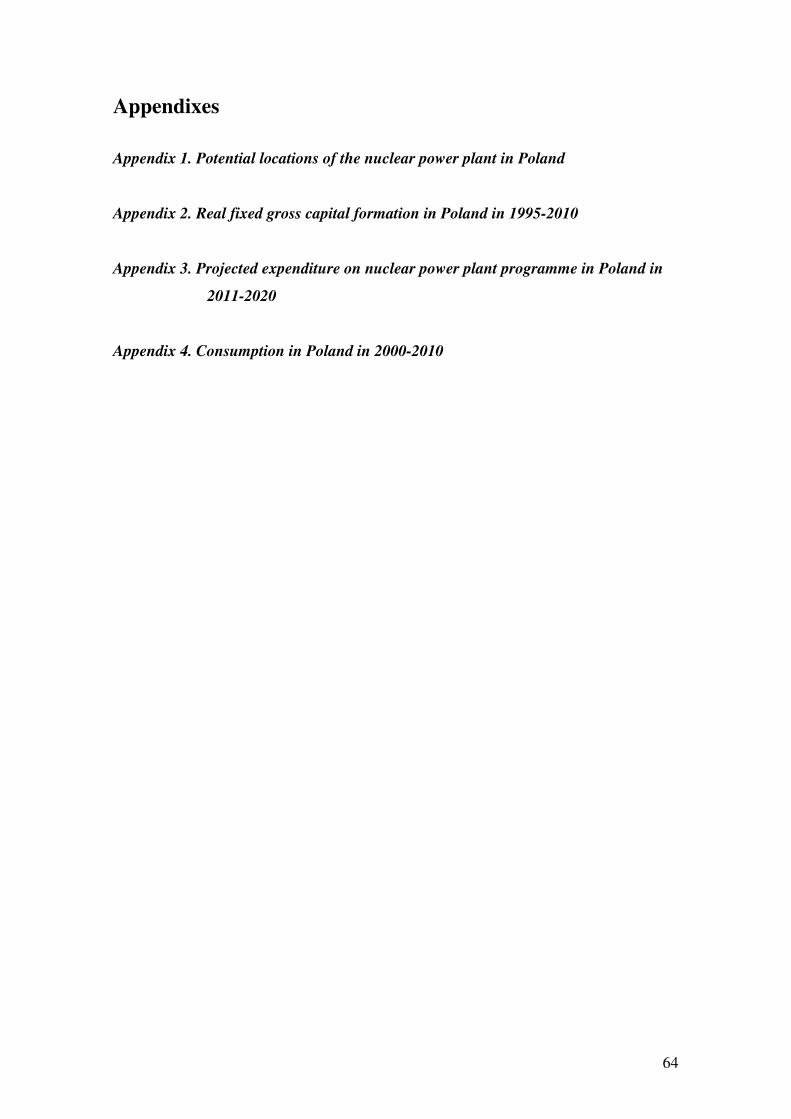
64
Appendixes
Appendix 1. Potential locations of the nuclear power plant in Poland
Appendix 2. Real fixed gross capital formation in Poland in 1995-2010
Appendix 3. Projected expenditure on nuclear power plant programme in Poland in
2011-2020
Appendix 4. Consumption in Poland in 2000-2010
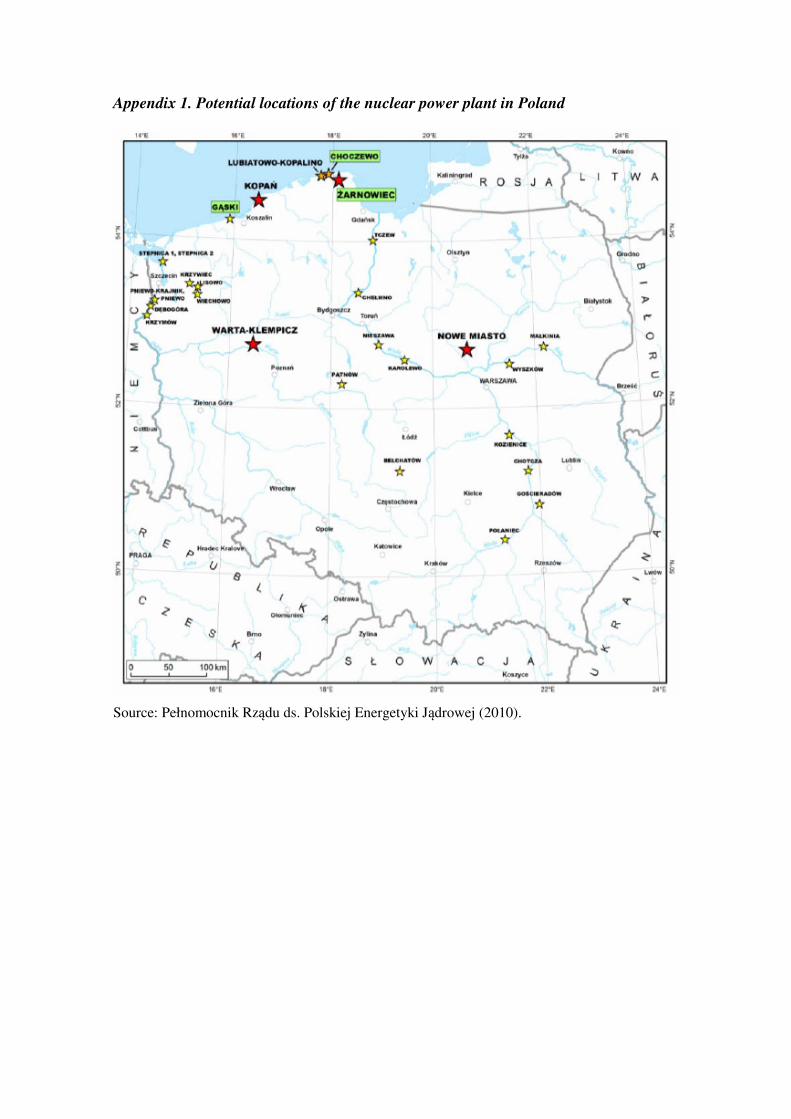
Appendix 1. Potential locations of the nuclear power plant in Poland
Source: Pełnomocnik Rządu ds. Polskiej Energetyki Jądrowej (2010).
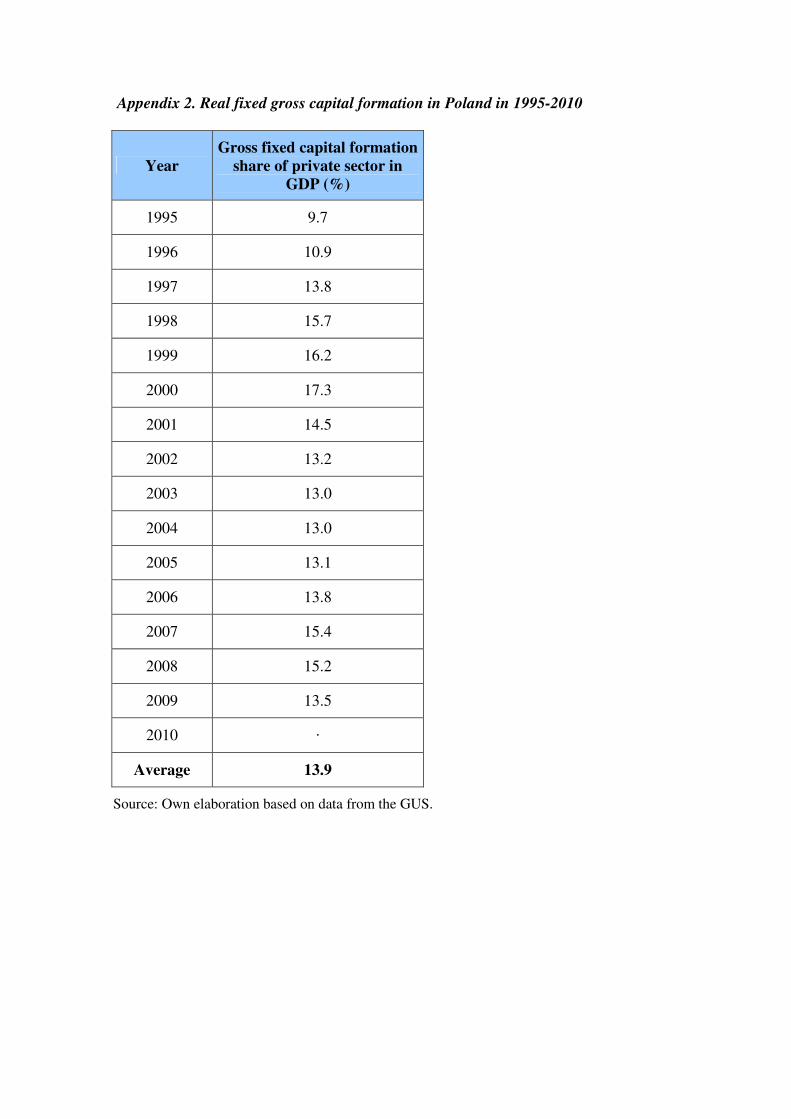
Appendix 2. Real fixed gross capital formation in Poland in 1995-2010
Year
Gross fixed capital formation
share of private sector in
GDP (%)
1995 9.7
1996 10.9
1997 13.8
1998 15.7
1999 16.2
2000 17.3
2001 14.5
2002 13.2
2003 13.0
2004 13.0
2005 13.1
2006 13.8
2007 15.4
2008 15.2
2009 13.5
2010 ·
Average 13.9
Source: Own elaboration based on data from the GUS.
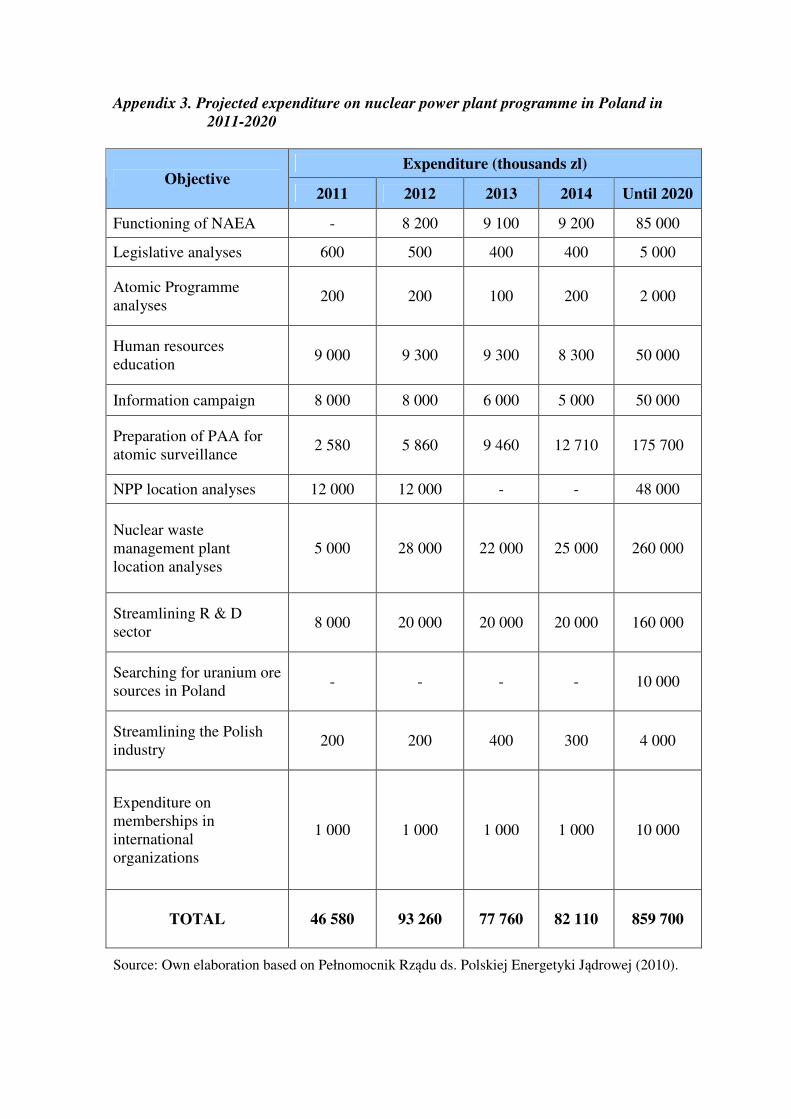
Appendix 3. Projected expenditure on nuclear power plant programme in Poland in
2011-2020
Expenditure (thousands zl) Objective
2011 2012 2013 2014 Until 2020
Functioning of NAEA - 8 200 9 100 9 200 85 000
Legislative analyses 600 500 400 400 5 000
Atomic Programme analyses
200 200 100 200 2 000
Human resources education
9 000 9 300 9 300 8 300 50 000
Information campaign 8 000 8 000 6 000 5 000 50 000
Preparation of PAA for atomic surveillance
2 580 5 860 9 460 12 710 175 700
NPP location analyses 12 000 12 000 - - 48 000
Nuclear waste management plant location analyses
5 000 28 000 22 000 25 000 260 000
Streamlining R & D sector
8 000 20 000 20 000 20 000 160 000
Searching for uranium ore sources in Poland
- - - - 10 000
Streamlining the Polish industry
200 200 400 300 4 000
Expenditure on memberships in international organizations
1 000 1 000 1 000 1 000 10 000
TOTAL 46 580 93 260 77 760 82 110 859 700
Source: Own elaboration based on Pełnomocnik Rządu ds. Polskiej Energetyki Jądrowej (2010).
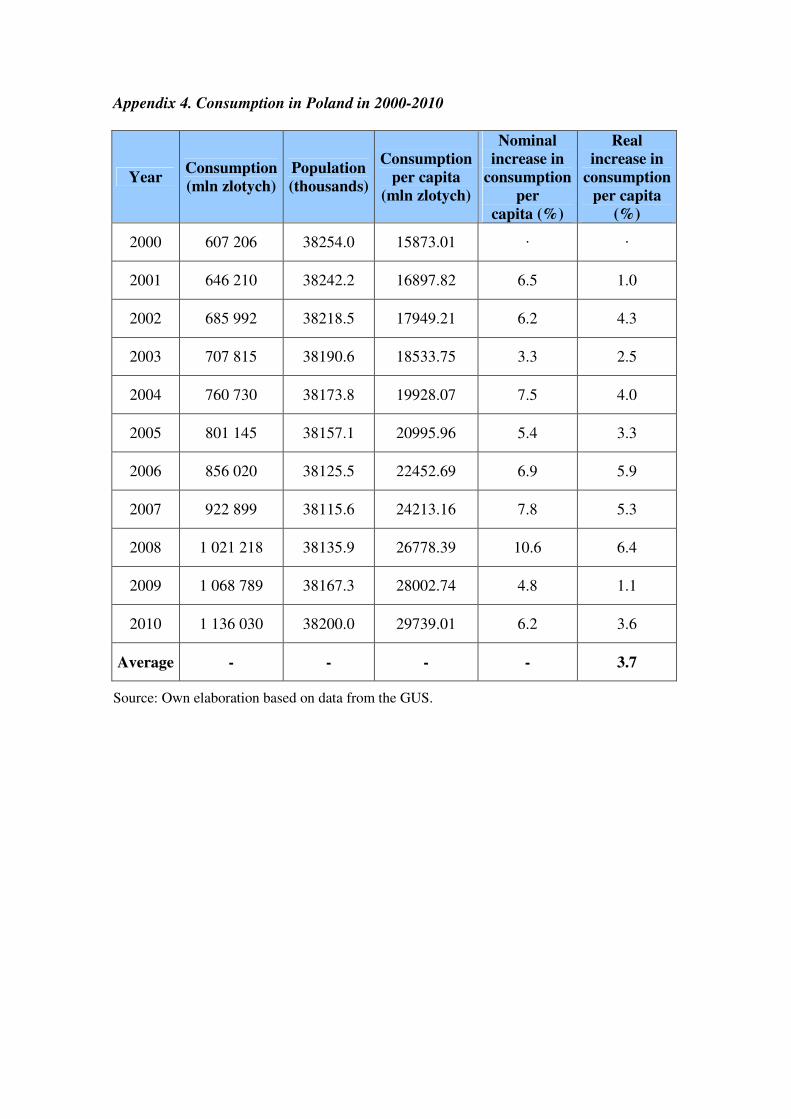
Appendix 4. Consumption in Poland in 2000-2010
Year Consumption
(mln zlotych)
Population
(thousands)
Consumption
per capita
(mln zlotych)
Nominal
increase in
consumption
per
capita (%)
Real
increase in
consumption
per capita
(%)
2000 607 206 38254.0 15873.01 · ·
2001 646 210 38242.2 16897.82 6.5 1.0
2002 685 992 38218.5 17949.21 6.2 4.3
2003 707 815 38190.6 18533.75 3.3 2.5
2004 760 730 38173.8 19928.07 7.5 4.0
2005 801 145 38157.1 20995.96 5.4 3.3
2006 856 020 38125.5 22452.69 6.9 5.9
2007 922 899 38115.6 24213.16 7.8 5.3
2008 1 021 218 38135.9 26778.39 10.6 6.4
2009 1 068 789 38167.3 28002.74 4.8 1.1
2010 1 136 030 38200.0 29739.01 6.2 3.6
Average - - - - 3.7
Source: Own elaboration based on data from the GUS.