MASTER FILE ON POLDER 43/2A BLUE GOLD PROGRAM ...
154
Page 0 MASTER FILE ON POLDER 43/2A BLUE GOLD PROGRAM PATUAKHALI Prepared By Md. Shaifullah Business Development Coordinator Blue Gold Program Patuakhali
-
Upload
khangminh22 -
Category
Documents
-
view
1 -
download
0
Transcript of MASTER FILE ON POLDER 43/2A BLUE GOLD PROGRAM ...

Page 0
MASTER FILE
ON
POLDER 43/2A
BLUE GOLD PROGRAM
PATUAKHALI
Prepared By Md. Shaifullah
Business Development Coordinator Blue Gold Program
Patuakhali

Page 1
Acknowledge
First I would like to acknowledge the WMGs’ members and community people who have provided lot information to prepare this master file. I would also get thanks to another key informants are Government line departments-DAE, DoF, DLS of Patuakhali Sadar upazila. I want to acknowledge to Union Parishad of polder 43/2A Chato bighai, Baro bighai, and Madarbunia union parishad who have assist to prepare this master file by providing various information. Next I would like to give thanks to various market actors and key persons who have provided necessary information that helped to prepare this document. Now, I would want to give a big thank to my colleagues who are working in different components Component-1, Component-2 and Component-3 of Blue Gold Program, Patuakhali who have assist me to prepare this master file by providing different information and documents. Finally, I want to acknowledge Karel T'Jonck, Component Leader, Business Development and Value Chain and Tanvir Islam Deputy Component Leader, Business Development and Value Chain Blue Gold Program who offer me to do such valuable work and inspired over the period.

Page 2
Preface
This is an internal document of Blue Gold Program for the Business Development Component. All information and data inserted here to understand current situation of the polder to develop Value Chain interventions.
Blue Gold Program is a partnership between Euroconsult Mott MacDonald, Femconsult, Socioconsult, iDE and BETS. The project is lead by Bangladesh Water Development Board (BWDB) and Department of Agriculture Extension (DAE) as technical partner and is jointly funded by the Government of the people’s republic of Bangladesh and the Government of the Netherlands. The project seeks to reduce poverty of the people in the coastal areas by enhanced productivity of crops, fisheries and livestock and increasing incomes by improved processing and marketing of agricultural products including value chain development.

Page 3
Table of content
1 Introduction and background 6 1.1 Overall objective of the Program 6 1.2 Specific Objectives 6 2.0 About the master file 2 2.1 Methodology or preparing master file 7 2.2 Data collection process 8 2.3 What is polder 8 2.4 Type of polder 8 2.5 Purpose of polder formation 9 2.6 Polder situation at a glance 10-11 3.0 Description of polder 43/2A 10-15 3.1 Geographical location 11 3.2 Climate 11 3.3 Administrative units 12 3.4 Area 12 3.5 Description of polder 12-13 3.6 Polder map (43/2A) 14 4.0 Human resource 15 4.1 WMGs and its potential members 15-16 4.2 Community Organizersand WNGs 16 4,3 FFS in the Polder 17 4.4 WMGs and their distance from Upazila Sadar 18 4.5 Institutional information 19 4.6 List of infrastructures 19 4.7 Working NGOs in the polder 20 4.8 Financial service in the polder 20-21 4.9 Mobile coverage to polder 21 5.0 Natural resource 22-26 5.1 Land 22 5.2 Soil 22-23 5.3 Water 23 5.4 Water management 24
5.5 Fisheries 25 5.6 Forestry 25
5.7 Homestead/community forestry 26 6.0 Livelihoods options in ploder 27 6.1 Agriculture 28-33 6.1.1 Cropping pattern/systems 29

Page 4
6.1.2 Technologies and management practices for crop cultivation 29
6.1.3 Land ownership 30 6.1.4 Major problems and prospects 30-31 6.1.5 Agricultural mechanization 31
6.1.6 Factor affecting agriculture production 31 6.1.7 Chart of factors affecting crop production 32
6.1.8 Crop calender 33 7.0 Fisheries 34 7.1 Wet land distribution of polder 34 7.2 Fry traders and nursery owners list 34-35 8.0 Livestock and poultry 35-36 8.1 Statistics of livestock and poultry at Patuakhali Sadar Upazilla 36-38 8.2 Input supply situation of duck 38 8.2.1 Source of inputs 55 8.2.2 Hacheries 38 8.2.3 Feed sellers 39 8.2.4 Medicine suppliers 39 8.2.5 Commpanies selling medicine 96 8.2.6 Women participation in durk rearing 39 8.2.6.1 Inputs collection 40 8.2.6.2 Feed collection 40 8.2.6.3 Feed preparation 40 8.2.6.4 Feeding 40 8.2.6.5 Taking ducklings 40 8.2.6.6 Egg collection 40 8.2.6.7 Egg trading 40 8.3 Marketing channels of egg 41-42 8.4 Egg collectors 42 8.5 Wholsalers 42 9.0 Gender perspective in the polder 43 10.0 Market infrastructure and information 44-51 10.1 Information of major traders of polder 43/2A 45-46 10.2 Market products 46 10.3 Output market situation analysis 47-48 10.4 Linkage between producers and intermediary 49 10.5 Linkage between rural producers and unban sellers 49 10.6 Linkage between rural homestead producers and urban
consumers 50
10.7 Linkage between rural producers and input sellers 50
10.8 Product wise market map/Value chain map 51

Page 5
11.0 Potential value chains of the polder 52 11.1 Mungbean Value chain 52-58 12. Tilapia Value chain 59-73 13. Native chicken (Poultry value chain 73-79 14. SOWT analysis 80-85 15. Product selection for value chain development 85-86 16. Scoring rationality/Explanation of value chain selection 87-99 17. Conclusion 99 18. Annexure 100-156
Acronyms
BADC Bangladesh Agriculture Development Cooperation BARI Bangladesh Agriculture Research Institute BINA Bangladesh Institute of Nuclear Agriculture BRRI Bangladesh Rice Research Institute BWDB Bangladesh Water Development Board DAE Department of Agriculture Extension DLS Department of Livestock Services DoF Department of Fisheries FAO Food and Agriculture Organization FFS Farmer Field School FGD Focus Group Discussion HYV High Yielding Variety IRRI International Rice Research Institute KII Key Informant Interview LCS Labor Contract Society MFI Micro Finance Institute NGO Non Government Organization CSISA Cereal Systems Initiative for South Asia WMA Water Management Association WMG Water Management Group
Page 6
1.0 Introduction and background Blue Gold Program is a partnership between Euroconsult Mott MacDonald, Femconsult, Socioconsult, BETS and iDE. The program is lead by Bangladesh Water Development Board (BWDB) and Department of Agriculture Extension (DAE) as technical partner and is jointly funded by the Government of the people’s republic of Bangladesh and the Government of the Netherlands. The project seeks to reduce poverty of the people in the coastal areas by enhanced productivity of crops, fisheries and livestock and increasing incomes by improved processing and marketing of agricultural products including value chain development.
1.1 Overall objective of the Program “To reduce poverty by creating a safe living environment and a sustainable socio-economic development for 150,000 household living on the 160,000 ha of polders.” 1.2 Specific objective
Prepare as a Source of information for polder 43/2A Assist to Polder development plan by providing necessary information Assess present situation (land use, market, production, constraint, and
scope) Identify potential logical intervention strategies for business
development component under Blue Gold program Potential value chain identification, analyze them and value chain
development Set-up specific and appropriate activities against each intervention.
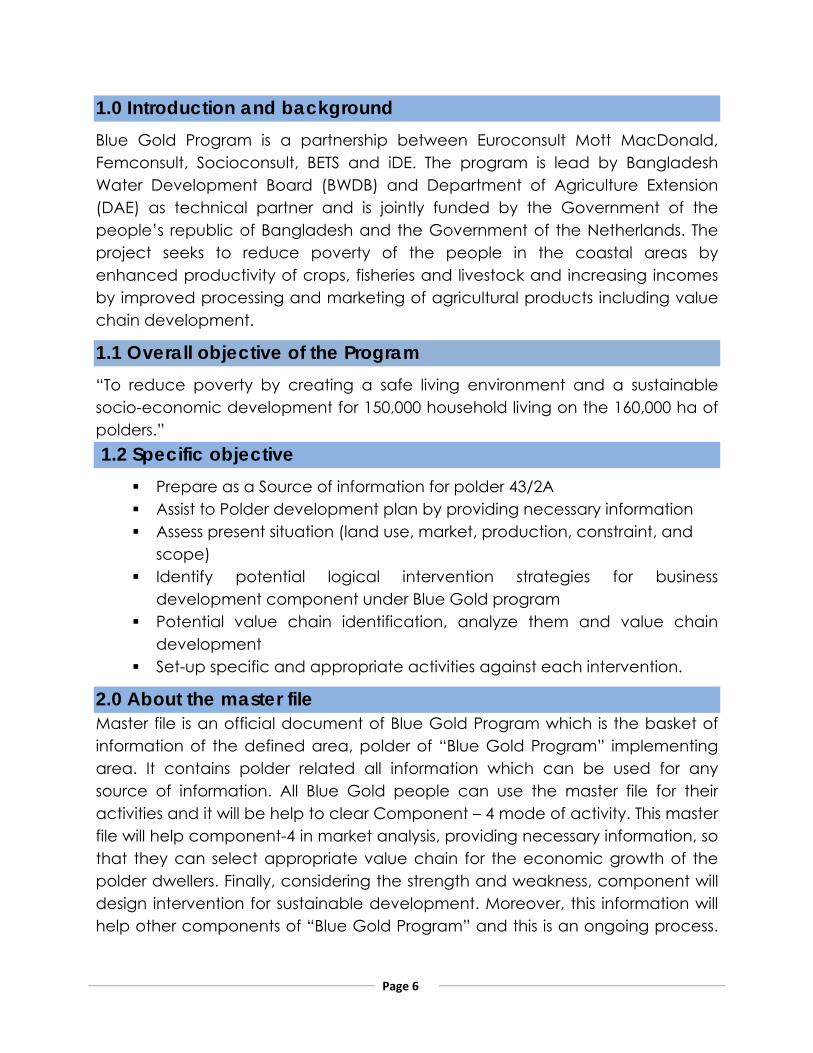
2.0 About the master file Master file is an official document of Blue Gold Program which is the basket of information of the defined area, polder of “Blue Gold Program” implementing area. It contains polder related all information which can be used for any source of information. All Blue Gold people can use the master file for their activities and it will be help to clear Component – 4 mode of activity. This master file will help component-4 in market analysis, providing necessary information, so that they can select appropriate value chain for the economic growth of the polder dwellers. Finally, considering the strength and weakness, component will design intervention for sustainable development. Moreover, this information will help other components of “Blue Gold Program” and this is an ongoing process.

Page 7
The purpose of this master file is to provide all the necessary information for the polder 43/2A to design component-04 strategy including polder development plan (PDP), Value chain identification, analysis and value chain development considering the local context. This master file provides a sound understanding the opportunities and existing practice of the producers, HHs present status, production system, input and output market situation, infrastructures, communications, geographical location, human resources, value chain actors and their function in practice, identify the weakness of the services., This master file may enable to assist component-04 to design a program in which an optimal combination of quick wins and longer term interventions are combined.
2.1 Methodology or preparing master file The master file has been prepared by use different methodology such as, primary data collection by conducting meeting, , face to face discussion, interview with key informant, focus group discussion with different level of stakeholder, and overall field observation. Secondly, different reports and documents review in order to cross check and validation of all field information. Finally, master file has been developed by accumulating all type of analytical data, put point specific explanation against field information and observation The diagram of used different tools for accomplished the task in bellow;
Primary data collection
Secondary assessment
Reporting
Meeting/ Interview
FGD with
Field observation
Documents review
Report review
KII with actor (DAE, DLS, DoF etc)
Data analysis Feedback & Validation
Articale/case story etc.
Research paper review

Page 8
2.2 Data collection process
Key Informant Interview (KII) Focus Group Discussion (FGD) Secondary data from DAE, DLS, DOF, Union Parishad etc Field observation and Market visit Validation of collected information from relevant sources.
2.3 What is Polder?
The polder is a Dutch term. The Netherland is frequently associated with polders. This is illustrated by the English saying; “God created the world but the Dutch created Holland”. The Dutch have a long history of reclamation of marshes and fenland, resulting in some 3000 polder in nationwide. Polder is an area of low-lying land that has been reclaimed from a body of water and is protected by dikes. Water enters the low-lying polder through water pressure of ground water, or rainfall, or transport of water by rivers and canals. This usually means that the polder has an excess of water, which is pumped out or drained by opening sluices at low tide.
A polder is a low-lying tract of land enclosed by embankments (barriers) known as dikes that forms an artificial hydrological entity, meaning it has no connection with outside water other than through manually operated devices.
Polders are man-made structures consisting of mud walls surrounding a hydrological unit. It is an infrastructure created in the coastal zones of Bangladesh in the 1960s to protect communities from flooding, inundation and salinity intrusion. Polder functions have changed over time and they now play a vital role in providing shelter from disasters and to increase food production. (Source: http://en.wikipedia.org/wiki/Polder and http://en.wikipedia.org/wiki/Polder#Polders and the Netherlands)
2.4 Type of Polder
There are three type polders;
1. Land reclaimed: from a body of water, such as a lake or the sea bed 2. Flood plains: separated from the sea or river by dike 3. Marshes: separated from the surrounding water by dike and subsequently
drained.

Page 9
2.5 Purpose of Polder:
Bangladesh is also ranked as being at “high-risk” of multiple devastating hazards. Bangladesh will be among the most affected countries in South Asia, with rising sea levels and more extreme heat and more intense cyclones threatening food production, livelihoods and infrastructure. Especially in the reason of agriculture development, they have also played a key role in mitigating the loss of life and damage during tidal surges.
In fact, in many areas, siltation has raised the river or other water channel -bottom to such levels that the polder region itself in fact lies below the water level. As a result, when sluice gates are opened for run out water, instead of water drain out from the polder lands, river’s water rushes in, resulting in long-lasting water logging and flooded the crop land.
More over that, many of the polders were created to increase the safety of the people living in-side the or near the sea and rivers. Due to built-up high raised dikes around the sea or river to protect them.
“Polders play a crucial role in avoiding water logging from tidal surges. The recent Cyclone Mahasen was low in intensity, but the damage could have been significant from the resultant tidal surges and flooding. But the polder networks allowed the water to run off, avoiding long-term flooding,” said Delwar Hossain, executive engineer of the Bangladesh Water and Development Board which maintains an extensive database of coastal polders, including their length, location, construction year and cost.
Overall, the potential of polders as a barrier to salinity greatly relies on a need for better management and maintenance anticipating future changes of climate, combined with policies ensuring controlled and sustainable management of shrimp farming," said Melody Braun, a climate change specialist of WorldFish Bangladesh.
“With the dikes surrounding the floodplains, the land is protected from the tides. One-way sluice gates regulate the water flow from the polder area out into the channel. Thus the land within the polder zone is free of water logging, salinity intrusion and can be used for farming and other agricultural work,” said Mohammad Emdad Hossain, a scientist and monitoring and evaluation specialist at the Consultative Group on International Agricultural Research. (Sources; http://www.irinnews.org/report/98292/bangladesh-polders-under-threat )

Page 10
2.6 Polder’s situation at a glance at Patuakhali In Patuakhali zone there are 14 Polders are in Blue Gold program most of them have been established in 1960-1970 by Water Development Board. Polders are man-made structures consisting of mud walls surrounding a hydrological unit. It is an infrastructure created in Patuakhali district as the coastal zones of Bangladesh to protect communities from flooding, inundation and salinity intrusion. Polder functions have changed over time and they now play a vital role in providing shelter from disasters and to increase food production.
Usually rainy season is the crisis period in this polder, like other area of Patuakhali upazila. In this period there is almost no work for unskilled labor and thus people have no or very limited cash in their hand.
The total communication system of this polder (43/2A) is rough as maximum roads are earthen road and in rainy season it is almost impossible to transport agricultural products from different parts of the polder. The communication situation is like below:
Polder Union Pacca road Herringbone road Kancha road
43/2A Chato bighai 5 km 10 km 120 km Baro bighai 11 km 2.25 km 98 km Madarbunia 25 km 7 km 118 km
Unlike flooding and tidal surge, recent cyclones including the most recent Sidr in 2007 and Aila in 2009 brought substantial damage to these embankments. In response, BWDB re-focused its strategy on protecting against cyclones and developing early warning systems. [source: Social management and resettlement policy framework (SMRPF), coastal embankment improvement project, phase-I (CEIP-I), April 11, 2013]
While these have contributed significantly in enhancing crop production in the initial decades, they are now grasped in second generation problems, both social and environmental. Major problems are
Siltation of river and Canals Weak Drainage systems and embankment Water logging Waterhyntch stagnant

Page 11
The polders listed below formed during IPSWAM period at Patuakhali Zone. “Blue Gold Program” is working in two districts, Patuakhali and Barguna under Patuakhali zonal office. There are 08 (eight) old polders of IPSWAM period of which Blue Gold will work on 06 (six) old polders and 08 (eight) new polders.
Polder no.
Upazila & District Gross Area (ha)
Net Area (ha)
No. of WMGs
No of WMA
No. of house-holds of local stakeholders)
43/2A Patuakhali Sadar 5,182 3,887 22 1 8,692
43/2E Patuakhali Sadar 1,650 1,300 12 1 2,997 43/2D Patuakhali Sadar 8,800 6,800 30 2 11801
43/2F Amtali, Barguna & Patuakhali Sadar
4,453 3,500 27 1 6639
43/1A Amtali, Barguna 2,675 2,200 14 1 5,105
43/2B Galachipa, Patuakhali Sadar & Amtali, Barguna
5,460 4,000 28 6 10,382
3.0 Description of polder 43/2A
3.1 Geographical location Polder 43/2A is located about 13kms far from the Patuakhali town and lies in between 22°13'30" - 22° 21'15" North and 90°12'15" - 90°17'45" East. The gross area of the polder is about 5,782 hectares, with a net cultivable area of 3,887 hectares. It is bounded by Payra river on the north, Gulishakhali Khal on the south, Gulishakhali Khal and Madarbunia Khal on the east and Payra river on the West. It is the boundary between patuakhali Sadar and Mirzaganj upazila on the North-East. The polder is under AEZ 13 & 18 Ganges tidal floodplain.

Page 12

Page 13
3. Weater Patuakhali has a tropical wet and dry climate. Maximum temperature of this district is 33.3°C and appears in the month of May, minimum 12.1°C appears usually in January. Annual rainfall is 2506 mm that maximum falls in June, July, August and September. Patuakhali district is is very near (78km) the sea of Bay of Bengal and it is known as Sagar Kanya. Thus Patuakhali faces frequently become victim of different cyclone and tidal bore.
3.3 Administrative Units Polder 43/2A consists with 15 villages under 10 mouzas of two unions-Baro Bighai and Chato Bighai, and one mouza of one union- Madarbunia under Patuakhali Sadar Upazila of Patuakhali district.
3.4 Area Gross benefited area of Polder 43/2A is 5,782 ha, net cultivable land is 3,887 ha, Embankment length is 39 km, Regulator number- 21, Flashing Inlet No.-03 and Drain Channel 37 Km. Polder 43/2A consists with 10 mouzas under 3 Unions (including one village of one Union (Madarbunia) of Patuakhali Upazila of Patuakhali district; the 3 unions are Chato bighai, Baro bighai, and Madarbunia (partly).
3.5 Description of Polder 43/2A The Polder 43/2A has been constructed in the year 1985-1987, it has total 39 kms embankment and benefited area is 5,782 hectars. It is bounded by pyra riverand Gulishakhali Khal and Madarbunia Khal. Polder 43/2A consists with two unions, 11 mouzas, 15 villages and 22 WMGs and 10,453 HHs are under Blue Gold Program at polder 43/2A. Polder 43/2A is enriched with natural ecosystem which consists of khals, canal, fisheries, community/private forest and other natural resources. The polder has a lot of opportunities as well as vulnerabilities also. The salinity rate and other natural hazards are increasing day by day as reported by the local people. The area is exposed to severe cyclone and storm surges that cause huge sufferings in human lives and loss of agricultural crops as well as other assets of the people.
Polder 43/2A is not so far away from Patuakhali town its one union Choto Bighai

Page 14
is about 20 Km, Baro bighai 24 km and Nandipara of Madarbunia union 11km away from Patuakhali Sadar upazila headquarter by road communication. The transport is by Rikhsa van, Autobyke or M otor cycle.
On the other hands, the polder has fertile agricultural lands and different natural water bodies, which are potential opportunities for income generating for the people.

Page 15
4.0 Human resource
Table-1: Demographic ifno
Polder Union Name Total HH no.
Population Education rate (%) Total Male Female
43/2A
Chato bighai 4658 22,092 11,532 10,560 40
Baro bighai 5020 19,333 9,518 9,882 57
Madarbunia (One village)
775 3,673 1,908 1,765 46
4.1 Table-2: List of WMG and potential member no. Name
of Polder
Name of Union
Name of WMG Name of Village
Distance from Upazila HQ
Km.
Potential WMG
Members
43/2A
Baro Beghai Dakshin Bighai (Dakshin)
Baro Beghai 24 924
Baro Beghai Dakshin Bighai Bighai (Uttar)
Baro Beghai 23 504
Baro Beghai Dakshin Titkata Titkata 26 630 Baro Beghai Pasaribunia Pasrbunia 23 370
Baro Beghai Paschim Bara Bighai
Baro Beghai 22 770
Baro Beghai Paschim Kewabunia
Kewabunia 27 482
Baro Beghai Paschim Titkata Titkata 25 442 Baro Beghai Patukhali Patukhali 23 278
Baro Beghai Purba Kewabunia
Kewabunia 22 976
Baro Beghai Purba Bara Bighai
Baro Beghai 24 778
Baro Beghai Purba Titkata Titkata 27 350 Chato Beghai Bhajna Bhajna 19 246 Chato Beghai Haritakibaria Hartakibaria 18 896 Chato Beghai Kumarkhali Kumarkhali 17 256
Chato Beghai Madhya Matibhanga
Matibhanga 20 392

Page 16
Chato Beghai Matibhanga-Chhota Bighai
Matibhanga 19 910
Chato Beghai Paschim Chato Bighai
Chato Beghai 18 574
Chato Beghai Paschim Matibhanga
Matibhanga 23 294
Chato Beghai Purba Matibhanga
Matibhanga 20 274
Chato Beghai Purba Chhota Bighai
Chato Beghai 20 478
Chato Beghai Tushkhali Tushkhali 17 700
Madarbunia Madarbunia Nandipara
Nandipara 11 1086
Source: Component-1, Blue Gold Program, Patuakhali
4.2 Table-3: List of Community Organizers and their WMGs:
Sl. # Name of Community Organizer
Name of Union Name of WMG
1. Anwar Hossain Suzom 01767495393
Madarbunia Madarbunia Nandipara
Chota Bighai
Purba Chhota Bighai Paschim Chato Bighai Tushkhali Matibhanga-Chhota Bighai
2. Serajul Islam 01716-344448
Baro Beghai
Paschim Titkata Purba Titkata Purba Kewabunia Pasaribunia Dakshin Titkata
Chota Bighai Bhajna
3. Lipy Akter 01736-141919
Chato Beghai
Haritakibaria Kumarkhali Madhya Matibhanga Paschim Chato Bighai Paschim Matibhanga Purba Matibhanga
4 Runa Nandi 01715-485317
Baro Bighai Dakshin Bighai (Dakshin) Dakshin Bighai Bighai (Uttar) Paschim Bara Bighai Paschim Kewabunia

Page 17
4.3 Table-4 List of FFS at Polder 43/2A
Sl # Name of FFS WMG Name of FO
Mobile no. of FO
1. Paschim Titkata FFS Paschim Titkata
Feroj Alam
01710618697 2. Purba Kewabunia FFS Purba Kewabunia
3. Dakhin Bighai dakhin FFS Dakhin Bighai dakhin
4. Patukhali FFS Patukhali
5. Purba Titkata FFS Purba Titkata
Rasel Miah
01727465316 6. Paschim Kewabunia FFS Paschim Kewabunia
7. Purba Baro Bighai FFS Purba Baro Bighai
8. Paschim Baro Bighai FFS Paschim Baro Bighai
9. Hartakibaria FFS Hartakibaria
Asma Akter
01771483550 10. Kumarkhali FFS Kumarkhali
11. Paschim Matibhanga FFS Paschim Matibhanga
12. Purba Chato Bighai FFS Purba Chato Bighai
13. Tushkhali FFS Tushkhali
Rohima Begum
01741411995
14. Madhya Matibhanga FFS Madhya Matibhanga
15. Purba Matibhanga FFS Purba Matibhanga FFS
16. Matibhanga Chato Bighai FFS
Matibhanga Chato Bighai

Page 18
4.4 Table-5 List of WMG and their distance from Upazila Sadar
Name of
Polder
Name of Union Name of WMG Name of Village
Distance from Upazila
HQ in Km.
43/2A
Baro Beghai Dakshin Bighai (Dakshin) Baro Beghai 24
Baro Beghai Dakshin Bighai (Uttar) Baro Beghai 23
Baro Beghai Dakshin Titkata Titkata 26 Baro Beghai Pasaribunia Pasrbunia 23 Baro Beghai Paschim Bara Bighai Baro Beghai 22 Baro Beghai Paschim Kewabunia Kewabunia 27 Baro Beghai Paschim Titkata Titkata 25 Baro Beghai Patukhali Patukhali 23 Baro Beghai Purba Kewabunia Kewabunia 22 Baro Beghai Purba Bara Bighai Baro Beghai 24 Baro Beghai Purba Titkata Titkata 27 Chato Beghai Bhajna Bhajna 19 Chato Beghai Haritakibaria Hartakibaria 18 Chato Beghai Kumarkhali Kumarkhali 17 Chato Beghai Madhya Matibhanga Matibhanga 20
Chato Beghai Matibhanga-Chhota Bighai
Matibhanga 19
Chato Beghai Paschim Chhota Bighai Coto Beghai 18
Chato Beghai Paschim Matibhanga Matibhanga 23
Chato Beghai Purba Matibhanga Matibhanga 20
Chato Beghai Purba Chhota Bighai Coto Beghai 20
Chato Beghai Tushkhali Tushkhali 17
Madarbunia Madarbunia Nandipara Nandipara 11

Page 19
4.5 Table-6 Institutional information
Public Institute DAE, DoF, DLS, , BWDB, LGED
Private Institute ACI, ACME, Lal teer, Syngenta, Bayer crop science, Metal agro, Squire have strong distribution and supply chain in the district headquarter and Upazilla level
Research institute Regional Horticultural Research Institute-BARI, Patuakhali, Science and Technological University (PSTU)
Private entrepreneurs (Beyond the polder)
M/S. Chanchal Hatchery, Bay of Bengal Hatchery
4.6 Table-7 List of educational institute
Polder Union Infrastructures
Remarks Name Number
43/2A
Barobighai
Primary School 17 Govt.-15 Secondary School 3 Private College 2 Madrasha 7 Cyclone shelter 4
Chatobighai
Primary School 15 Govt.-8 Secondary School 2 Private College 1 Private Madrasha 8 Private Cyclone shelter 3
Madarbunia
Primary School 57 Secondary School 19 College 3 Madrasha 19
4.7 Working NGOs in the polder It was mentioned earlier this polder is under Patuakhali District Sadar upazilla and there are some Non-governmental activities running at the polder area.Different projects have their activities here, who are involved in development work. But most of the formal organizations are involved in micro credit program.

Page 20
Table-8 Formal NGO working in Polder 43/2A:
SL Name of Organization Major Activity
1. BRAC Agriculture development and micro credit
2. Dhaka Ahasania mission Disaster and Livelihood 3. Save the Children (Nobo
Jibon) For improving of mother and child nutrition
4. iDE & CYMMIT (CSISA – MI) Agricultural Mechanization 5. iDE-PROOFS Livelihood and Market development 6. Susilon, Max Foundation working for water and sanitation 7. Grameen Sakti, Karania, RDF Solar Energy 8. Islamic Relief Disaster and livelihood 9. Uddipon Livelihood program 10. ASA Micro Credit 11. Grameen Bank Micro Credit 12. Codec Micro Credit and Livelihood program 13. Padakhep Micro credit 14. Muslim Aid Micro credit and Loan for SME 15. BDS Micro credit 4.8 Financial Services in the polder
About 60-70% HHs are involved with borrowing money from micro finance institutions like: BRAC, ASA, Padakhep, CODEC, Uddipon, Muslim Aid provide loan for agriculture, micro and small enterprise. Agriculture loan range Tk 5,000-49,000 with weekly installment, Micro-enterprise loan range Tk 5,000-150,000 weekly/monthly repayment installment, small size enterprise loan range Tk 100,000-1,000,000 weekly/monthly repayment installment.
There is also existence of non-formal credit services. Usually traders or local Bapari get credit from upper tires, like- large Baparies, Arothders, whole sellers, processers or millers. For borrowing from a person/local investor; sometime borrower has not to pay interest against the loan or sometime they may have to pay 100 taka interest against 1,000 taka for one month, i.e. - 120% interest rate.
Page 21
The socio-economic survey of “Blue Gold” shows that about 30% HHs have the membership in cooperative at this polder and 70% HH have no membership. The main relationship is credit. Female membership is rather higher than man.
4.9 Mobile Coverage
This polder is under all mobile operator coverage in Bangladesh, like:
Grameen phone Banglalink Teletalk Airtel Robi Citycell
Among all the operators Grameen phone and Banglalink network coverage is fair at Polder 43/2A. Around 80-90% HHs use mobile for call through incoming and outgoing. At HHs level internet operation through mobile is an unknown feature. Maximum mobile operators are providing agriculture information (Mainly focused on production) through mobile taking a charge which could be a good source of production and market information by facilitating them to make understand how to use.
5.0 Natural Resources
Polder 43/2A is reach in various natural resources. In this section describe only agricultural production related resources.
5.1 Land characteristics of the polder
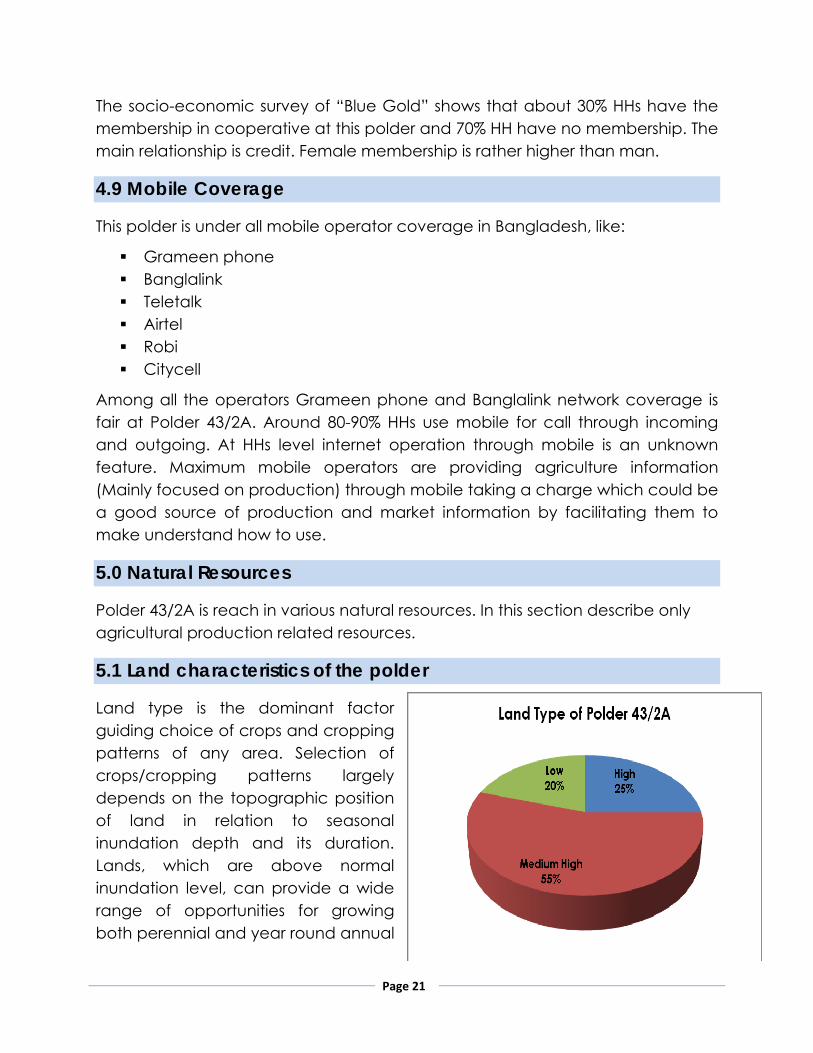
Land type is the dominant factor guiding choice of crops and cropping patterns of any area. Selection of crops/cropping patterns largely depends on the topographic position of land in relation to seasonal inundation depth and its duration. Lands, which are above normal inundation level, can provide a wide range of opportunities for growing both perennial and year round annual
Page 22
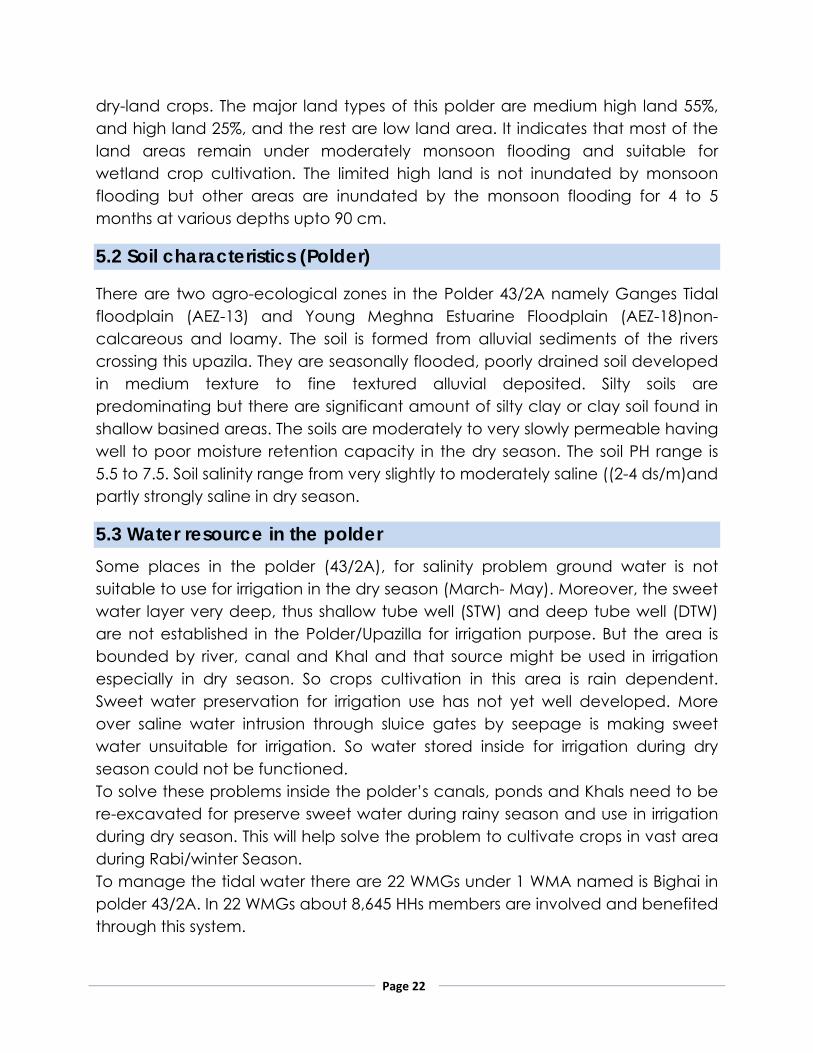
dry-land crops. The major land types of this polder are medium high land 55%, and high land 25%, and the rest are low land area. It indicates that most of the land areas remain under moderately monsoon flooding and suitable for wetland crop cultivation. The limited high land is not inundated by monsoon flooding but other areas are inundated by the monsoon flooding for 4 to 5 months at various depths upto 90 cm.
5.2 Soil characteristics (Polder)
There are two agro-ecological zones in the Polder 43/2A namely Ganges Tidal floodplain (AEZ-13) and Young Meghna Estuarine Floodplain (AEZ-18)non-calcareous and loamy. The soil is formed from alluvial sediments of the rivers crossing this upazila. They are seasonally flooded, poorly drained soil developed in medium texture to fine textured alluvial deposited. Silty soils are predominating but there are significant amount of silty clay or clay soil found in shallow basined areas. The soils are moderately to very slowly permeable having well to poor moisture retention capacity in the dry season. The soil PH range is 5.5 to 7.5. Soil salinity range from very slightly to moderately saline ((2-4 ds/m)and partly strongly saline in dry season.
5.3 Water resource in the polder Some places in the polder (43/2A), for salinity problem ground water is not suitable to use for irrigation in the dry season (March- May). Moreover, the sweet water layer very deep, thus shallow tube well (STW) and deep tube well (DTW) are not established in the Polder/Upazilla for irrigation purpose. But the area is bounded by river, canal and Khal and that source might be used in irrigation especially in dry season. So crops cultivation in this area is rain dependent. Sweet water preservation for irrigation use has not yet well developed. More over saline water intrusion through sluice gates by seepage is making sweet water unsuitable for irrigation. So water stored inside for irrigation during dry season could not be functioned. To solve these problems inside the polder’s canals, ponds and Khals need to be re-excavated for preserve sweet water during rainy season and use in irrigation during dry season. This will help solve the problem to cultivate crops in vast area during Rabi/winter Season. To manage the tidal water there are 22 WMGs under 1 WMA named is Bighai in polder 43/2A. In 22 WMGs about 8,645 HHs members are involved and benefited through this system.
Page 23
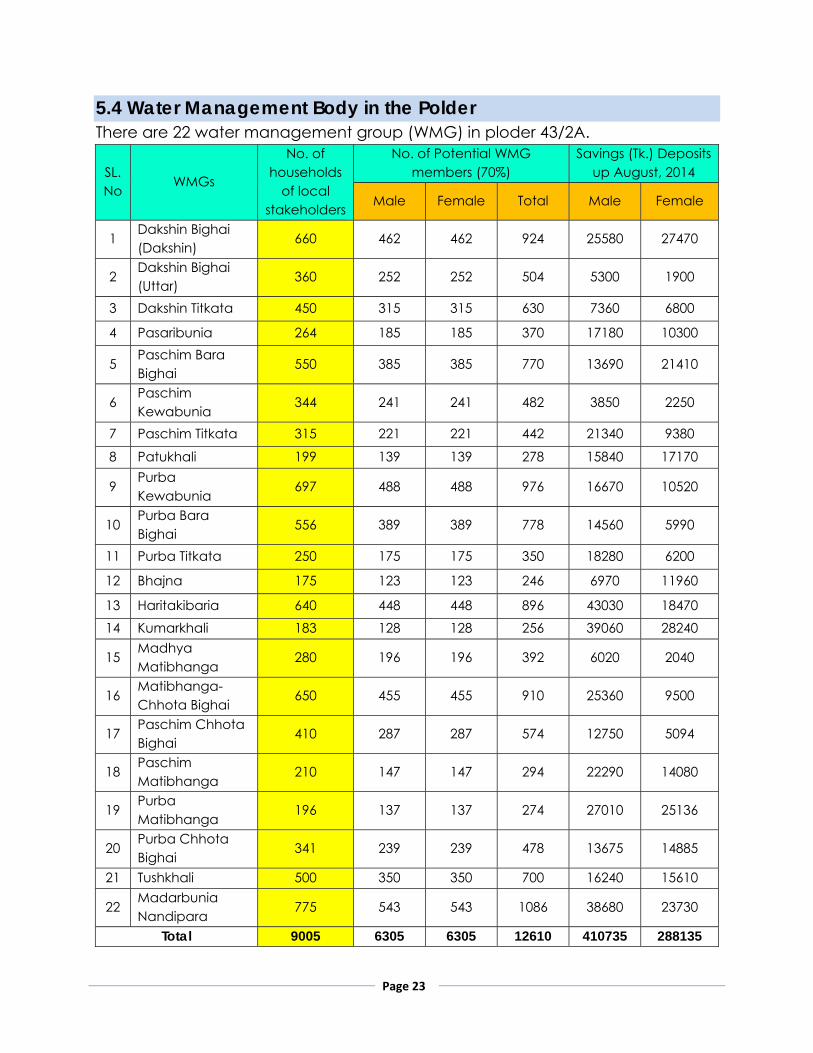
5.4 Water Management Body in the Polder There are 22 water management group (WMG) in ploder 43/2A.
SL. No
WMGs
No. of households
of local stakeholders
No. of Potential WMG members (70%)
Savings (Tk.) Deposits up August, 2014
Male Female Total Male Female
1 Dakshin Bighai (Dakshin)
660 462 462 924 25580 27470
2 Dakshin Bighai (Uttar)
360 252 252 504 5300 1900
3 Dakshin Titkata 450 315 315 630 7360 6800
4 Pasaribunia 264 185 185 370 17180 10300
5 Paschim Bara Bighai
550 385 385 770 13690 21410
6 Paschim Kewabunia
344 241 241 482 3850 2250
7 Paschim Titkata 315 221 221 442 21340 9380
8 Patukhali 199 139 139 278 15840 17170
9 Purba Kewabunia
697 488 488 976 16670 10520
10 Purba Bara Bighai
556 389 389 778 14560 5990
11 Purba Titkata 250 175 175 350 18280 6200
12 Bhajna 175 123 123 246 6970 11960
13 Haritakibaria 640 448 448 896 43030 18470 14 Kumarkhali 183 128 128 256 39060 28240
15 Madhya Matibhanga
280 196 196 392 6020 2040
16 Matibhanga-Chhota Bighai
650 455 455 910 25360 9500
17 Paschim Chhota Bighai
410 287 287 574 12750 5094
18 Paschim Matibhanga
210 147 147 294 22290 14080
19 Purba Matibhanga
196 137 137 274 27010 25136
20 Purba Chhota Bighai
341 239 239 478 13675 14885
21 Tushkhali 500 350 350 700 16240 15610
22 Madarbunia Nandipara
775 543 543 1086 38680 23730
Total 9005 6305 6305 12610 410735 288135

Page 24
5.5 Fisheries
In Bangladesh fisheries provides 60% of the national animal protein and this sub-sector contributes about 5% of the GDP and about 9% to the foreign exchange earnings. Nearly, 1.2 million people directly employed in this sector and another 11 million are indirectly engaged in activities related to this sector.
Wet land distribution:
The Polder has a total wet land area of 1,276 hectares which 240 hectares are under aquaculture. Aquaculture comprises of homestead pond fish culture, prawn culture and commercial aquaculture. The open water fisheries are consists of river, canal and floodplain.
Table-9: Wetland distribution at polder 43/2A
Union Total area (ha.)
Pond culture (ha.)
Fish culture (ha.)
Prawn culture (ha.)
Total culture (ha.)
Total capture
(ha.)
Total wet land (ha.)
Chato Bighai
2,975 105
(3.53%) 09
(0.3%) 01
(0.03%) 115
(3.87%) 577
(19.39%) 692
(23.26%) Baro Bighai
3,444 115
(3.34%) 04
(0.12%) 06
(0.17%) 125
(3.63%) 458
(13.3%) 583
(16.93%) Madar bunia
2809 128
(4.56%) 4
(0.14%) 1 (0.04%)
133 (4.73%)
95 (3.38%)
228 (8.12%)
5.6 Homestead/community forestry
Homestead forest is a forest for the people and by the people, grown on marginal and fallow land of homestead area, beside roads, railway, embankment, river, khal and on fallow highlands characterized by a combination of annual and perennial forest species. The homestead forestry is a promising sector in this area which accounts for 48% of the total supply of saw and veneer logs, 70% of fuel wood in the rural areas,.
In polder 43/2A raintree occupies highest number among timber species, which is about 45.5% of the total planned forest. The next is Mahogany 24.50%, Betel nut 3.50%, mango 8.00%, jackfruit 3.50%, Khajur 3.00%, coconut 4.00%, Bamboo 3.00% and others are 5.00%.

Page 25
Raintree
45.5%
Mahogany
24.5%
Betel nut
3.5%
Mango
8.0%
Jack fruit
3.5%
Khajur
3.0%
Coconut
4.0%
Bamboo
3.0%
Others
5.0%
Raintree Mahogany Betel nut Mango Jack fruit Khajur Coconut Bamboo Others
The land use in polder 43/2A is mainly with profuse homestead forest, water bodies, fisheries and agricultural land. Settlements with community/homestead forestry possess mainly the highland areas above normal flood level which are about 25% of the total area of this polder.
6.0 Livelihoods Options of the polder Livelihoods options of the people largely depend on the resources available at the locality and household level in terms of ownership and access. Land is being considered as a major determining factor of the socio-economic condition of rural households, though there are some other factors that also contribute to define their social classes. Occupations and relation of production characterize social groups like agriculture labor, farmer, fishermen, traders, Rickshaw van puller and landless etc. Livelihoods of different social groups are affected if the land and other natural resources are not properly managed and restricted to access. The number of landless people is increasing day by day in this polder due to the lack of employment creation opportunities. As a result, most of the people are shifting their traditional professions with day laborers, rickshaw pullers etc.
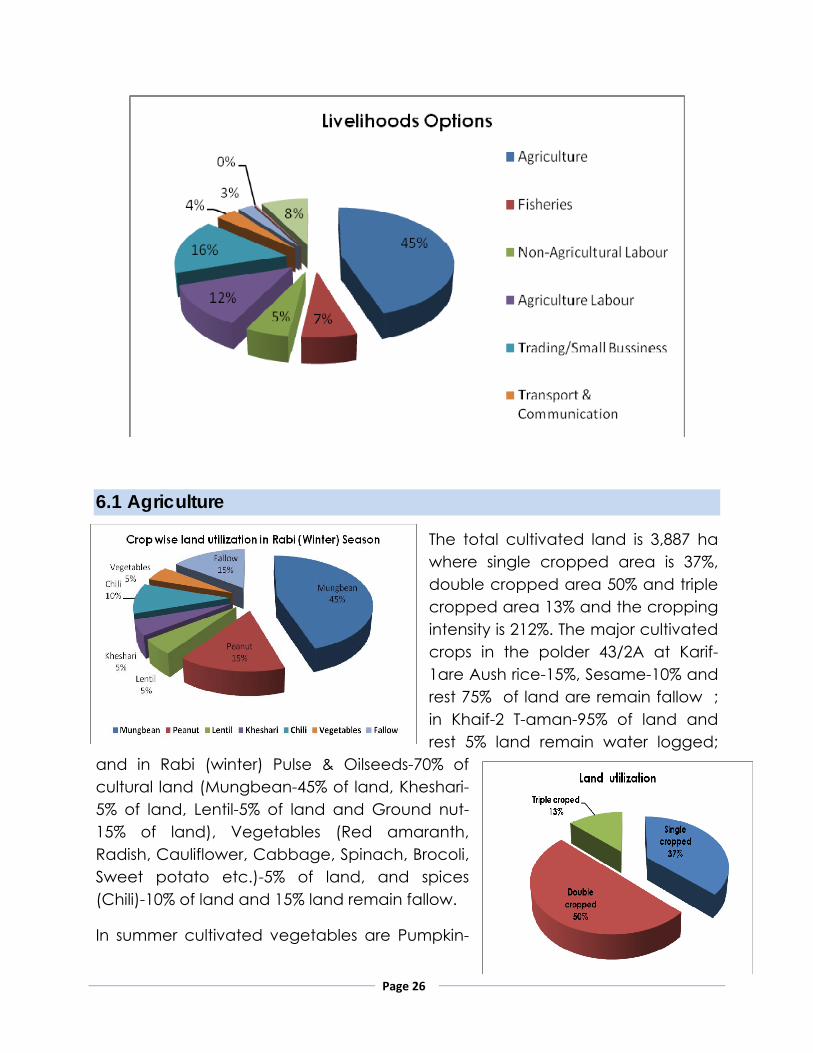
The main livelihoods sources of the polder are about Agriculture 45.00%, fisheries 6.5%, non-agricultural laborer 5.50%, agricultural laborer 12.50%, commerce/business (including small business) 16.00%, transport and communication 3.50%, service 2.50%, religious service 0.30%, rent and remittance 0.50% and others 7.70% of the people.
Page 26
6.1 Agriculture
The total cultivated land is 3,887 ha where single cropped area is 37%, double cropped area 50% and triple cropped area 13% and the cropping intensity is 212%. The major cultivated crops in the polder 43/2A at Karif-1are Aush rice-15%, Sesame-10% and rest 75% of land are remain fallow ; in Khaif-2 T-aman-95% of land and rest 5% land remain water logged;
and in Rabi (winter) Pulse & Oilseeds-70% of cultural land (Mungbean-45% of land, Kheshari-5% of land, Lentil-5% of land and Ground nut-15% of land), Vegetables (Red amaranth, Radish, Cauliflower, Cabbage, Spinach, Brocoli, Sweet potato etc.)-5% of land, and spices (Chili)-10% of land and 15% land remain fallow.
In summer cultivated vegetables are Pumpkin-

Page 27
7%, Bitter gourd-25%, Ash gourd-2%, Ridge gourd-7%, cucumber-5% and Snake gourd-4% and in winter Bottle gourd-25% and country bean-25% are grown as dyke crops. The homestead are predominantly by forest plant including vegetables like-Danta (Amanath), Okra, Cucumber, Ridge gourd, Red amaranth, Spinach, Cabbage, Brocoli, Radish, Tomato and Country bean etc.
In polder 43/2A the most promising crops are mungbean, groundnut/and chili. Kakrol and pointed gourd (Patal) not cultivated as new crop sunflower is may be the emerging crop to this polder.
6.1.1 Cropping Pattern/Systems:
The land of this polder is dominated by agricultural crop cultivation, which cultivated mainly under rainfed condition. The agricultural practices are mainly depending on favorable natural environment. The present cropping intensity is 212% and the major cropping patterns/systems are as below:
i. T-Aman Rice — Mungbean — Fallow ii. T-Aman Rice — Mungbean/ground nut — Fallow iii. T-Aman Rice — Vegetables — Fallow iv. T-Aman Rice — Chili — Fallow v. T-Aman Rice — Fallow — Aush Rice vi. T-Aman Rice — Pulse/Oilseeds/Chili — Aush Rice vii. Betel leaf/Banana (Year round)
6.1.2 Technologies and Management practices for crop cultivation
In the polder 43/2A agriculture has been practiced as improved traditional technologies as well as management practices. Farmers mainly used their own seeds except ground nut and potato. Farmers are not using modern high yielding quality seeds, and not follow the recommended dose of fertilizers and also seed rate. Farmers follow the traditional post harvest activities and processing. The crop production is mainly rainfed only about 1,500 ha of total 3,887 ha land are in under irrigation during dry season. Drainage systems are not well developed thus a remarkable area of land remains under water lagging. So, there is a big scope to improve the agriculture crop production through ensure quality improved seeds, follow recommended management practices and reduce postharvest loses and improve dreainage and irrigation systems.

Page 28
6.1.3 Land Ownership
Land is one of the most important resources for livelihood of rural people. Agriculture land is most valued to the poorer section of the population. Land ownership plays a vital role to land use and crop production. About total of Farm HHs where 8,000 where 50% cultivate their own land, 30% share croppers, and about 20% lease.
In polder 43/2A land ownership category is 3% HHs owned ≥ 7-10 ha, 25% HHs owned ≥ 4-7 ha, 35% HHs owned ≥1.5-4 ha, 20% HHs owned ≤ 1.5 ha of land and 17% are landless HHs.
6.1.4 Major problems and Prospects
Water stagnation/drainage congestion Low organic contents in the soil Irrigation water scarcity during the dry months
Risk of tidal flood, river erosion and saline water intrusion Essential plant nutrient deficiency Poor quality and high price of inputs Recommended/modern technologies not used Poor post harvest practices and loses is high
If could overcome or interments to the problems then there are many scope to improve in agriculture. Glue Gold may take initiative to improve the irrigation systems through improve management of cannels and reexcavate the cannels

Page 29
and preserve fresh water in that cannels; facilitate to establish good quality/improved seeds supply to the communities and make responsive the service providers to demonstrate modern technologies for crop cultivation.
6.1.5 Agricultural Mechanization
There is a trend for agricultural mechanization in this region. Polder 43/2-A usually uses agri-machineries for tillage, processing, spray of pesticide etc. There are different service providers who are within and outside the polder. Sometime, service come other districts, like Jesore or Khulna (for Hamza). There is a project, namly “Cereal Systems Initiative for South Asia Mechanization and Irrigation (CSISA-MI)” working in this region for agricultural mechanization.
CSISA-MI is working in the southern coastal region and started from 2013. This project is being be implemented in Patuakhali upazila by a partnership between CIMMYT and International Development Enterprises (iDE).
The CSISA-MI initiative will unlock the agricultural productivity of southern Bangladesh by increasing the availability and adoption of resource conserving irrigation equipment, Conservation Agriculture (CA) based crop management practices and the use of scale-appropriate farm machineries.
6.1.6 Factor affecting Agricultural Production
Drainage overcrowding has been reported in all the WMGs of the polder almost same. Diverse problems are shown as a consequent of this poor drainage system. Drainage congestion affects T. Aus at different stages in various degrees. When there is heavy rain in the pre-monsoon period, T. Aus seed-beds are submerged and seedlings are damaged. At its different growing stages also T. Aus is submerged and damaged – fully in medium lowlands and partially in medium/high land.
Shortage of water in most cases means deficiency of irrigation water and that mainly during the dry months of the year. However, it can also occur at other times of the year. Shortage of irrigation water was reported in all most all the WMGs of this polder.

Page 30
6.1.7 Factors Affecting Crop Production through the year
Item Jan Feb Mar Apr May Jun Jul Aug Sep Oct Nov Dec
Rainfall
Draught
Tidal surge
Cold injury
Source: FGD

Crop growing season: Rabi (16Oct-15 March) Kharif-1(16 March-30 June) Kharif-2(1 july-15 Oct)
Month Jan Feb Mar Apr May Jun Jul Aug Sep Oct Nov Dec
Crop Season Rabi (Winter) Kharif-1 (Summer) Kharif-2 (Rainy) Rabi
1 T Aman ( HYV)
2 Mungbean
3 Groundnut
4 Sesame
5 Cowpea
6 Vegetables
7 Fish (Tilapia & Common Carp)
8 Chili
Land preparation &Sowing Vegetative stage Riping/Harvesting
6.1.8 Crop Calendar

7.0 Fisheries
The Polder has union has a total wet land area of 1276 hectares (Baro Bighai-583 ha and Chato Bighai- 693 ha) of which 240 hectares are under aquaculture (Baro Bighai-125 ha and Chato Bighai- 115 ha). In this polder aquaculture comprises of homestead pond fish culture, commercial fish culture. The open water fisheries consist of river, canal and flood plain areas.
7.2 Table-11 List of fry traders and nursery owner at Polder 43/2A
Sl # Name of VC Actors Address/Village Designation Mobile no.
1 Shahid Hartohibaria, Chatobighai Nursery owner cum fry seller
01720691073
2 Abdul Haque Gharami
Hartohibaria, Chatobighai Nursery owner cum fry seller
3 Basir Pada Chatobigha, Chatobighai Nursery owner cum fry seller
4 Chan Mian Majhi Chatobigha, Chatobighai Nursery owner cum fry seller
5 Mamun Sharif MatiBhanga, Chatobighai Nursery owner cum fry seller
6 Chitta Ranjan Hawlader
Chatobighai, Chatobighai Nursery owner cum fry seller
7 Nasir Pada Chatobighai, Chatobighai Nursery owner cum fry seller
8 Alam Gazi Purba Matighanga, Chatobighai
Nursery owner cum fry seller
9 Halim Etabarhia, Chatobighai Nursery owner cum fry seller
10 Wahed Kha Hartokibaria, Chatobighai Nursery owner cum fry seller
11 Wasim Mirza Hartokibaria, Chatobighai Nursery owner cum fry seller
12 Abul Matbar Purba Matibhanga, Chatobighai
Fry trader
13 Alomgir Munshi Purba Matibhanga, Chatobighai
Fry trader
14 Ruzu Kha Purba Matibhanga, Chatobighai
Fry trader
15 Jahangir Sarder Hartokibaria, Chatobighai Fry trader 16 Adil Ahmmed Purba Titkata Nursery owner 01733165023

Habib 17 Wahab Tahsilder Purba Titkata Nursery owner 18 Altaf Khalifa Purba Titkata Nursery owner 01747977814 19 Rafik Hawlader Dakhin Bighai Nursery owner 20 Rarim Bapery Dakhin Bighai Nursery owner
21 Abdul Maded Pada
Purba Titkata Nursery owner
22 Jalil Fakir Paschim Titkata Fry trader 23 Anwar Hossen Dakhin Bighai Fry trader 24 Habib Khandaker Madhya Titkata Fry trader
8.0 Livestock and Poultry Traditionally, men consider ‘heads of households’, and in charge of crop production, rearing animals, and ultimately responsible for selling their produce at market. Men control profits and responsible for buying the family’s food. Women stay at home, their agricultural and caring work is largely invisible, and they do not have the opportunity or support to realize their aspirations. Women have little access to education especially in poor families and are given a subsidiary status as economic dependents. Women are among the poorest of the rural poor, especially when they are the heads of their households, such as widows or wives of men who migrate in search of employment. They suffer discrimination because of their gender, they have scarce income-earning opportunities and their nutritional intake is often inadequate.
In the coastal parts, duck rearing is a common household level activity of farmers. This is primarily due to easy access to water bodies by the duck farmers which encourage them to go for large scale farming.
There is a possibility of improvement in rural income distribution with an increase in investment for indigenous livestock and poultry development particularly in duck rearing. In polder 43/2A it was observed HHs rear duck more or less. Natural resources like rivers, canals, ponds and water bodies are supportive this regard with natural feeds. The majority of households at this polder rear ducks. Almost all the households hatch eggs and rear chicks of marketable size, i.e. 0.8-1.2 kg. Market opportunities in polder 43/2A (Patuakhali sadar). There are about 100 paikers (traders) in Patuakhali sadar who buy poultry birds and eggs from farmers at Tk. 165 (on average) and sell to two arotdars (big traders) in Patuakhali at Tk. 180. The three main problems facing poultry producers are unavailability of medicine, the absence of vaccinators, and cold-related diseases.
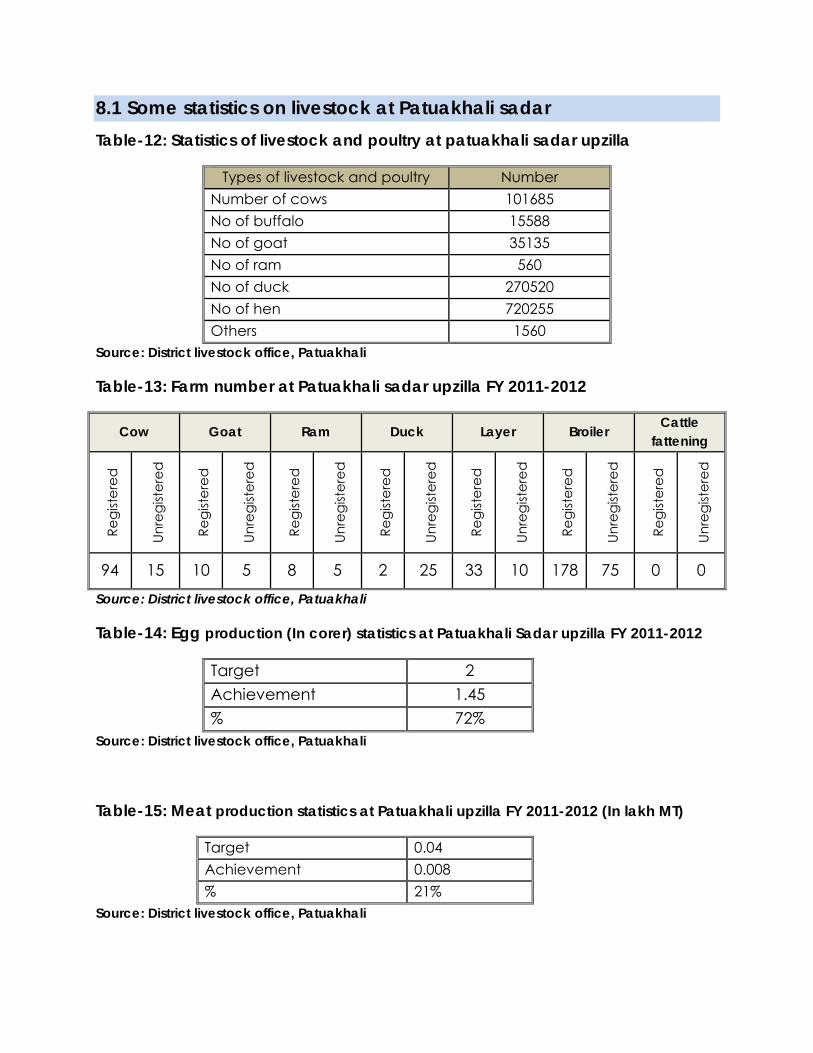
8.1 Some statistics on livestock at Patuakhali sadar Table-12: Statistics of livestock and poultry at patuakhali sadar upzilla
Types of livestock and poultry Number Number of cows 101685 No of buffalo 15588 No of goat 35135 No of ram 560 No of duck 270520 No of hen 720255 Others 1560
Source: District livestock office, Patuakhali
Table-13: Farm number at Patuakhali sadar upzilla FY 2011-2012
Cow Goat Ram Duck Layer Broiler Cattle fattening
Regi
ster
ed
Unre
gist
ered
Regi
ster
ed
Unre
gist
ered
Regi
ster
ed
Unre
gist
ered
Regi
ster
ed
Unre
gist
ered
Regi
ster
ed
Unre
gist
ered
Regi
ster
ed
Unre
gist
ered
Regi
ster
ed
Unre
gist
ered
94 15 10 5 8 5 2 25 33 10 178 75 0 0
Source: District livestock office, Patuakhali
Table-14: Egg production (In corer) statistics at Patuakhali Sadar upzilla FY 2011-2012
Target 2 Achievement 1.45 % 72%
Source: District livestock office, Patuakhali
Table-15: Meat production statistics at Patuakhali upzilla FY 2011-2012 (In lakh MT)
Target 0.04 Achievement 0.008 % 21%
Source: District livestock office, Patuakhali

Table-16: Vaccination of cattle at Patuakhali Sadar upzilla FY 2011-2012
Target 45000 Achievement 20424 % 45%
Source: District livestock office, Patuakhali
Table-17: Vaccination of poultry at Patuakhali Sadar upzilla FY 2011-2012
Target 1300000 Achievement 494900 % 38%
Source: District livestock office, Patuakhali
Table-18: Treatment of cattle at Patuakhali Sadar upzilla FY 2011-2012
Target 13125 Achievement 13885 % 105%
Source: District livestock office, Patuakhali
Table-19: Treatment of poultry at Patuakhali Sadar upzilla FY 2011-2012
Target 70000 Achievement 74515 % 106%
Source: District livestock office, Patuakhali
Table-20: Establishment of farm at Patuakhali sadar upzilla
Cow Goat Ram Poultry Duck Permanent
fodder nurtury campus
Seasonal fodder nurtury
campus Target 15 32 6 20 40 0.03 Acre 1.1o Acre
Achievement 12 38 6 18 23 0.10 Acre 0.05 Acre % 80 118.75 100 90 57 333 4%
Source: District livestock office, Patuakhali

Table-21: HHs having livestock and poultry at polder 43/2A
Livestock/Poultry Average number HH (%)of the community Cattle 3-4 70
Goat/Sheep 3 22 Poultry birds (Hen) 10 90
Duck 10 80 Source: FGD at community
8.2 Inputs supply situation of duck
The inputs supply situation has been discussed in this section. There are many actors involved with this supply system. They are discussed in below.
8.2.1 Source of inputs
Duck farmers in this area mainly source eggs for duck farming. This is due to lack of hatcheries and duckling traders in the areas.
8.2.2 Hatcheries
It was found that total absence of hatchery operation in Patuakhali and Barguna District. If sourced, traders need to go to Khulna, Dhaka, Netrokona to collect ducklings. This results in higher operational cost discouraging to procure ducklings.
8.2.3 Feed Sellers
There are no formal feed sellers inside the polder. The number of informal feed sellers is also fewer in polder area. There are 12 number of feed sellers at Patuakhali sadar upazilla. If requirement for large amount of feed like NGSo subsidies to HHs, GOs relief/distribution activities then they outsource from different markets like: Barisal, Khulna, Jessore and Dhaka. Number of feed sellers at surroundings of polder 43/2A and 43/2F has given table below:
Table-22: No of feed sellers at surroundings of polder 43/2A
Patuakhali sadar No of feed sellers 12 Monthly trading volume 182,000 BDT
N.B: Business volumes are shown for 3 months January, February and March
8.2.4 Medicine Suppliers
Private pharmaceutical companies have supply operations in District and Upzailla headquarters level. These companies selling their products to their authorized distributors and retailers, company representatives also working at District and upzilla headquarter level which does not cater the need for duck famers at the inside villages of polder.
8.2.5 List of Companies selling medicine at the District and upzilla level:
Renata limited. Novarties Ltd., ACI godrej, Square, Techno, Globe agro products, FnF, Popular, and ACME
8.2.6 Women participation in Duck rearing
8.2.6.1 Input purchase
Women are generally forbidden to go markets for purchasing inputs for ducks rather the task is mostly carried out by the male members of the family. Exception is found in two cases – 1) women who do not have males in their households move to market place and 2) husbands are engaged in other labor works encourage female households to occupy inputs for ducks.
8.2.6.2 Feed collection
Involvement in duck value chain for women starts with feed collection – majorly snail collection.
8.2.6.3 Feed preparation
Household women take more or less 1 hour 20 minutes from 24 hours to prepare feed for the ducks. This timetable is applicable if the ducks are being fed four times a day; means women spend thereabouts 20 minutes in duck feed preparation.
8.2.6.4 Feeding
Feeding on the other hand takes 30 minutes each time. During feeding, female households ensure proper feeding of duck observing from a nearest place. A total two hours is spent to feed ducks four times a day.

8.2.6.5 Taking ducklings to water bodies
Women take ducklings to water bodies twice a day in summer and once in winter. This is to make them familiar with semi-scavenging feeding system and also to ensure that ducklings do not get lost from the site. The task takes more or less 15 minutes to be completed.
8.2.6.6 Egg Collection
It is the household women who also take care of collecting the eggs every morning, cleaning the eggs and setting the eggs in a basket or bowl filled with rice to keep them safe (unbroken) and fresh for later sales. The process of egg collection and storing takes by females each time.
8.2.6.7 Egg Trading
It was mentioned earlier, women are discouraged to go to market places for trading of eggs or even the ducks. In the polder area, egg collectors are the immediate sales contact for women who visit door to door, collect eggs, and pay the price accordingly. Trading of sales takes place at duck producers’ end where women take the lead in maximum time to make the transaction.
8.3 Marketing channels of eggs The egg marketing system inside polder is traditional and is done mainly by the different intermediaries. The principal sources of eggs in the polder are the local producers. Eggs are generally sold in the weekly rural and peri-urban markets from stocks intended for urban consumption. They are handled by a number of middlemen before reaching the consumers. Different marketing channels are present in the process of egg marketing in the polder as well as the District. These channels are shown in Figure below.

On the basis of figure the following channels can be identified.
Channel-1: Farmer Aratdar-cum-wholesalers Retailer Consumers
Channel-2: Farmer Aratdar-cum-wholesalers Supplier Institutional buyer (Hotel, restaurant) Channel-3: Farmer Aratdar-cum-wholesalers Institutional buyer (Hotel, restaurant)
Channel-4: Farmer Aratdar-cum-wholesalers Retailer Institutional buyer (Hotel, restaurant) Channel-5: Farmer Institutional buyer (Hotel, restaurant)
Channel-6: Farmer Hawker Aratdar Retailer Consumers
Channel-7: Farmer Consumers
Farmer/Rearer Farmer/Rearer
Hawker/ Collector
Aratdar-cum-wholeseller
Retailer
Consumer
Supplier Institutional buyer
Farmer/Rearer
Fig: Marketing Channel of native eggs

Photo: FGD with Female group
8.4 Egg collectors
Egg collectors in southern coastal areas enjoy limited return on investment than that of the other part of Bangladesh like Haor area (Sunamgonj, Kishoregonj etc) collectors. Farmer’s selling price of an egg is between BDT 7.50 and 8.00 which is sold at BDT 9.00 at the local markets (to retailers or in grocery shops or to large traders).
GMark Consulting limited conducted a study in 2013 on Duck value chain analysis in Haor and coastal areas of Bangladesh and they are showing egg collectors scenario in coastal area table below:
Patuakhali No. of egg collectors 30 Monthly trading volume (Unit) 800,000 Monthly trading volume (BDT) 640,000
8.5 Wholesalers
Wholesalers procure eggs only from the collectors to sell at retailers’ end. The number of wholesalers is limited in the Southern coastal belt and most of them bring eggs from outside of the region as its production is lower than the demand.
9.0 Gender Perspective of the Polder 43/2A
The polder 43/2A is a moderately conservative and paternal social structure and institutes. In this situation women are not allowed to work in outside of their houses all the cases. Thus the women participation in the economic activities is limited but they are actively participated in domestic work of the household like poultry rearing, homestead vegetables gardening, goat/cattle rearing, and other home based IGAs also. Moreover that woman actively involves with post harvest activities of agricultural crop. Overall gender situation is women have poor access to knowledge, resources, finance and participating economical activities.

In general, the involvement of women in outside activities is quite limited. Destitute women regularly sell their labour whereas among the women of small farmer households, selling labour is more of an occasional activity. Destitute women earn money by carryingout different activities outside the home, including agriculture, craft making, petty business, and earth work and as housemaids.
10.0 Market infrastructures and Information
There are about 9 local markets/hats in the polder 43/2A and where the dwellers of this polder generally do their marketing and shopping activities. Market information is in below:
Table-23: List market in polder 43/2A
Polder Union Name of Market Market/Hat day Remarks
43/2A
Chato bighai
Chato bighai officer hat
Friday
Matighanga hat Every day Morning Kazirhat Monday Bhutumiar Bazaar Every day Evening Tuskhali Bazaar Saturday
Baro Bighai Khatasia Bazaar Wednesday Titkata bazaar Every day evening Baro Bighai offiser hat Thursday
Madarbunia Nandipara Brizghat Sunday

10.1 Table-24: Information of some major Input traders of those markets (Agricultural related)
SL #
Nam
e of
Tr
ader
s
Mob
ile
No.
Plac
e of
Bu
sines
s
Inpu
ts
Col
lect
in
puts
fro
m
Year
ly
Turn
over
(T
k.)
Peak
se
ason
Dull
seas
on
1. Md. Jahangir Howlader
01711219875 Coto beghai Officer hat
Urea, T.S.P, M.P, Pesticides
Patuakhali About 6 lac
July to Sep.
April to June
2. Abdul Hai 01754017195 Kazir hat Urea, T.S.P, pesticides Patuakhali About
4 lac Do Do
3. Md. Jakir Matber 01726861018 Bhuutumia
hat Urea, T.S.P, pesticides Patuakhali About
3 lac Do Do
4. Md. Belayet Hossain
01735521131 Mativanga hat Do Do About
2 lac Do Do
5. Md. Salim Pahloan 01726453231 Khatasia
hat
Urea, T.S.P, M.P, pesticides, oil cake, fish meal, wheat bran
Do About 40 lac Do Do
6. Abu Taleb mia 01735628488
Bara Behgai Officer hat
Urea, T.S.P Pesticides, Oil cake, wheat bran
Do About 6 lac Do Do
7. Md. Satter how 01713357693 Puler hat do Do About
5 lac Do Do
8. Md. Babul how. 01713962897
Coto beghai officer hat
Fish meal, oil cake, wheat bran, poultry feed
Do About 6 lac Do Do
9.
Md. Lal mia how. 01721597865 Officer hat
Poultry feed, Fish meal, oil cake, wheat bran
Do About 4 lac Do Do
10. Md. Amzad Palowan
01720987136 Bara Behgai Officer hat
Fertilizers & Pesticides Dealer
Do About12 lac Do Do

Kazirhat of Chato bighai union and Khatasia bazaar is the largest bazaar in this polder considering transaction and market infrastructure. Bazaar day is Monday for Kazir hat and Wednesday for Khatasia Bazaar.
10. 2 Market products
Mug bean, Sesame, groundnut, Keshari, chili, and rice are the main market products of this polder
Sesame and Keshari usually goes to North-west of Bangladesh where these are being processed. Off course the informants don’t know the actual flow chart of the products
Different private sector companies (PRAN) buy peanut and Mug bean but the Companies don’t buy directly from the farmers or local hat. Generally Bapari collect groundnut and Mug bean from local Bazaar or from the farm gate. When they get a bulk volume of peanut/mungbean to Track capacity then they marketing this directly in Barisal where stay some agents who collect this and then Agents or Agency supply it to the company. Farmers have no idea about the rate of the company or any required specification. Sometime Bapari directly supply to the company.
Photo: KII to the market actor

Flow diagram-1: Market flow Chart of grpundnut and Mungbean/Kheshari
Fig: Flow chart of Mungbean
10-3 : Output market situation analysis
Usually farmers bring their produces as small quantity to the local market (hat) for selling at hat day for selling. Sometimes local foria or bepari goes to the farm gate but they offer low prices than the hat/market i.e. Foria mainly come in the polder mainly to buy paddy, mung bean, peanut, kheshari. But poor road communication especially during monsoon there is no transport to go to market and this why farmers have to carry goods by human heads or shoulders roughly from 2/3 Km, and then onwards to Patuakhali by riskshaw/Auto. Bepari and whole seller are mostly doing their business from Patuakhali and khatashia hat
Large Arothder of Barisal
Local arothder of Patuakhali
Processing company of Barisal
Dealer/wholesaler
Bepari (Local or Outsider)
Processing company of Dhaka or other district
Agency/Agent
Farmer of 43/2A polder/ outside local
farmers
Consumers throughout the country
Retailer for processed
food
Export

(Joy bangle bazaar). Sometimes farmers sell their product in credit to the local bapari in title bit higher price but they do not fall in any harassment to get payment. A small number of farmers store their produces in their own facilities for short time. Besides this most of the farmers have to sellout their produces just after their harvesting due to repay the loans, meet up the family expenditure and inputs bought on credits.
The simplest link between production and consumption is during when farmers sell their own products directly in a market. The relationships among market actors like -producers, traders, wholesalers, and retailers play an important role in the marketing of products. Such linkages can create mutual trust amongst different functionaries in the marketing system. However this may also cause a dependency relationship between parties and make it difficult for newcomers to enter the marketing process. Linkages are often based on village proximity (area based) or on social relationships build over many years. In terms of linking producers with consumers, market intermediaries play of crucial role. The most common intermediaries in the Blue Gold working areas are:
Intermediaries Functions
Arotder
Arotder is one kind of wholesaler or commissioning agent or like as piker who buy product from the farias and sell to Mukam in Dhaka or Godi Businessmen in locality and some of them started to sell their product directly to the processing center
Bepari
Bepari is located in the second tier of the local business chains. Bepari buy product from the faria and farmers. Most of the products they buy from the faria. They give cash to the faria for buy product from the grassroots level. Locally they are called big businessmen; they sell their products to the piker
Piker They are small scale wholesalers who collect products from small markets and send them to big markets, or sell in or through nearby arot.
Faria
These are small traders or commissioning agents who are localized and whose mobility is limited up to 1 or 2 Upazilla. They buy directly from farmers and sell to other traders to the local markets. Sometimes they act as the commissioning agent for other larger traders to procure the products. They are mostly small-scale seasonal floating traders and some also combine farming with trading.
Dadonder Dadonder is the person who provides credit to the smallholders in the rural area with high interest.
Dealer Dealers are licensed agent of seller of seed or fertilizer. Retailer They sell inputs to the farmers

10.4 Linkage between Producers and Intermediary
Some large producers are simultaneously selling produces directly in Patuakhali and Khatasia wholesale market and to the Paikar/Foria at their farm gate. In case of vegetables Paikar/Foria is not interested to receive at the farm gate due unavailability of expected volume of vegetables from the producers on time; primarily due to inadequate production volume and limited number of commercial producers.
The farmers who produce commercially are linked with the OMAs as well as market due to the large volume of production
Producer/paikar can sell their products directly to the consumers in local markets. There are no barriers from the existing sellers and MMC for selling their produce.
Small producers who do not produce commercially are not linked with the OMAs as their volume of production is less and maximum producers are this type that’s why wholesale market is not available and local paika/bepari/vegetable sellers buy (mostly) directly from outside of the polder and sell to local consumers
Rural producers do not have many options as IMAs are not selling different products or from different companies, hence limiting diversity.
10.5 Linkage between Rural Producers and Urban Sellers
Commercial producers, although their number is small are effectively linked with the rural and urban sellers because they work intensively for vegetables production. Their intension is to sell produced products quickly and get back to their farm activities. Due to poor production volume huge numbers of farmers are not linked with urban sellers and are generally selling by self in the local market.
Urban sellers are buying vegetables from existing marketing channel/supply chain i.e. wholesale market (upazilla wholesale market). As the urban sellers buy products through different channels, they are investing a huge amount of time and paying more for transportation cost. Less volume of vegetables aggregation at certain place is the main reason for the urban sellers’ low interest for buying vegetable from rural producers. Most transactions are occurred in cash but credit transaction also prevails depending upon the relation with customers.

10.6 Linkage between Rural Homestead Producers and Urban Consumers
Rural homestead producers, closer to urban periphery especially in polder 43/2A are linked with the Patuakhali sadar consumers directly. After self-consumption, they travel to nearer urban or rural markets and sell their produced products directly to the consumers. Homestead producers generally fulfill their consumption demand on their own unlike urban consumers who depend on the market for their consumption.
10.7 Linkage between Rural Producers and Input Sellers
Input sellers in rural areas do not sell products from many companies and different verities of vegetable seeds. So, producers have less option to choose; rather they buy available ones whatever may be its quality. IMAs provide credit to their trusted customers (producer) to maintain business relation. There appears a monopoly of input suppliers due to limited number, hence there is a need to strengthen input supply and ensure availability of quality inputs at retailer level as per producers’ demand.

Arotder
End Market
Farmers/On Farm
District level
Fertilizer sellers
Local Retailers
Faria
District/Regional markets
BADC Dealer
Consumers
Retailers Companies
Paiker
Mukam
Local wholesale
Market
Grassroots Market
Producers
Input Seller
10.8 Product wise market map/value chain map
Fig: General Value chain mapof Agricultural products at Polder 43/2A

Photo: KII to the experienced Farmer
11.0 Potential Value Chain In this section discussed some potential value chain for the polder 43/2A.
11.1 Mung bean Value Chain About 70 percent of mung bean production is concentrated in the four southern districts of Patuakhali, Barisal, Bhola, and Noakhali. Patuakhali alone accounts for 30 percent of the area in which mung bean is grown.
11.1.1 Production The area and production of most pulses have continuously declined over the last ten years in Bangladesh. The total area under pulses reduced from 728 thousand ha in 1990-91 to 604 thousand ha in 2004-2005, but production remained static, around 525 thousand tons due to increase in productivity. The main reasons for decline is the expansion of irrigation facilities and crop competition in winter season (mainly rice, wheat, maize, potato, vegetables) as well as instability of pulses yield due to various biotic and biotic stresses.
Bangladesh farmers produce nearly a dozen of pulse crops; but their yield and potential production vary enormously between species and across locations. All pulse crops suffer due to increasingly extensive culture of rice, wheat and maize crop. Crop like lentil and chickpea registered steady growth last few years. With the increase of cereal production, mungbean production showed a promise and increasing trend due to availability of improved variety suitable for incorporation in the existing cropping pattern without any major change in the system.
11.1.2 Low productivity Productivity of pulses in Bangladesh is low and unstable compared to that of wheat or rice. Traditional farmer’s varieties or local varieties are inherently low yielding types, susceptible to disease and insect pest, less branching, low podding intensity, very small seed size. The average production of rice is 4.0 t/ha, wheat 5.0 t/ha. Whereas production of Lentil 0.8 t/ha, mungbean 1.2 t/ha.

Table-25: Comparative productivity of pulses and cereal crops
Rice Wheat Lentil Mungbean 4.0 t/ ha 5.0 t/ha 0.8 t/ ha 1.2 t/ ha
The major constraints on productivity are that pulses in general have genetically low yield potential—particularly the indigenous varieties of pulses due to the following:
The indigenous varieties of pulses are sensitive to too much water and fertilizer and often show negative response to these factors
These varieties have more disease and pest problems than cereals do The varieties are more sensitive to climatic factors such as excess soil
moisture, humidity and rainfall, terminal heat stress, and soil factors, when compared with cereals; and
Pulse crops receive little attention from farmers with respect to adequate land preparation, fertilization, timely sowing, weeding, and plant protection.
11.1.3 Inappropriate management
It is built in farmer’s mind that the pulse crops including mung bean can be grown with less care. So they put more effort on major crops like rice, wheat, vegetable and give little effort on pulse cultivation.
On the other hand, farmers suffer from lack of access to appropriate seed production and post- harvest technologies, marketing systems, and credit facilities. Also, research and extension are poorly linked.
11.1.4 Improper cropping pattern Winter duration in Bangladesh is very short (100-110 days). Farmers do not sow mungbean at optimum time. Therefore, this crop have even shorter period for vegetative growth resulting in poor yield. Farmers usually sow Mungbean after harvesting of Wheat, Potato, Lentil, Oilseed, vegetables etc. Late harvesting of these crops causes late sowing of Mungbean.
11.1.5 Production trend increasing of Mung bean
Cultivation of mung bean is more prominent and production is very strong in Patuakhali. In case of late Aman farmers are better off producing mung as it is short duration and the season is appropriate for marketing mung beans. Given this, cultivation of mung has spurred in this area as farmers have increasingly shifted from producing kheshari to producing mung.

Photo: FGD with the experienced farmers
11.1.6 Opportunity to increase productivity and profitability A farmer usually receives 3-4 kg of mung per decimal while they reported that the maximum production that can achieve is 8 kg per decimal. Productivity has gone down significantly due to increasing pest attack and use of low yielding varieties. Pest attack has increased in recent times mostly due to erratic rain fall. But the major reason is that the farmers are not aware of proper pest management techniques. BARI mung supposedly yields higher and is pest resistant. But the seeds are not available in the local market.
Table-26: Cost of Production: Mung (1 ac land)
Cost Item Amount Cost (in BDT) Ploughing 3 ploughs 2000 Seed 27 kg 2160 Fertilizer 30 kg 1500 Medicine & Insecticide 7 bottles 3000 Labor 20 labor days 2000 Total Production cost 10660
Table-27: Productivity of Mung- Current and Potential (in1decimal land)
Current (kg/ decimal) Potential (with intervention) (kg/ decimal) 3-4 8
11.1.7 Production of better varieties BARI Mung 2, 3 and 4 are better yielding and pest resistant. However, only 30-40% of the mung bean farmers in the polder are cultivating BARI varieties. It has been noted that the varieties are not widely available. Since the distribution of pulse seeds are taken care of by government agencies partnership with DAE is solicited to ensure supply and availability of the seeds in the project region.

11.1. 8 Grading/ Processing Properly cleaned, graded dried mung bean yield TK 70-80 more per kg than semi dried ones.
11.1.9 Bulk sales and direct access to processor Farmers mostly sell of mung bean harvested in two to three cycles. Therefore, farmers hardly can access directly to the processor and there are significant numbers of processors in the middle. Following table summarizes the prices at different levels:
Table: Comparative Price at Different Levels (TK/ kg)
Crop Price at farm gate Faria Arot Mung Bean TK 55/-60 TK 62-65 TK 65/70
11.1.10 Problems with the forward linkages (Access to market)
Presence of a strong number of middlemen reduces price at the farm gate
The pulse and oil crops value chains have presence of a strong number of middlemen. This erodes the price at the farm gate as has been shown in Table. The growth in number of middlemen can be attributed to the following:
Weak local transportation network
Transportation is a huge challenge in the whole project region. The wholesale markets are disconnected from the producers by river channels and poor roads. This increases transportation cost and increases risk of wastage during transportation. The middlemen transfer value to the farmers by reducing transportation cost and creating access to the market or the customers.
Absence of farmer’s cooperatives
Until recently farmer’s cooperatives exclusively for bulk production and marketing were not present in the project area. RFLDC-DANIDA had created community based organizations (CBOs) which has the potential to work as farmer’s cooperatives. But till now organized marketing from the farmer’s end is not an initiative that could be traced. Currently DANIDA funded project named integrated farm management component (IFMC) implementing piloting “Farmers business school (FBS)” at polder 43/2A in Auliapur Union and Marichbunia Union.

11.1.11 Lack of local processing facilities
There are only two large scale pulse crushing mills in Barisal. Pulses and oil crops produced in the project region are sold to arots in Patuakhali Puran Bazar, Kalapara and bulking volume then transported to kathpatti in Munshiganj, Narayanganj and chandpur. This is mostly due to the fact that the arots in these districts act as the link between the buyers at national level and the producers around the country. The feasibility for crushing pulses at local level and marketing across the country is not tested. There are a few small scale poultry and fish feed manufacturer in Patuakhali and Barisal but the number is not large enough to increase scope for local value addition. Lack of local processing facilities has weakened the scope of value addition at local level.
11.1.12 Problems with the backward linkages (Access to inputs)
Weak seed distribution and marketing operations
Farmers’ in the project area uses retain seeds and have the perception that the seeds used by them are of good quality. However, high yielding varieties like BARI Mung are not available in the polder area. Not all farmers have even heard of such varieties. Given that mung bean seeds are supplied by the government it is important that a functional network for seeds distribution is in operations in collaboration between the department of agricultural extension, seeds retailers and NGOs active in the project region.
Weak promotion of information on pesticide and insecticide management
Pulses crops, particularly mung bean and soyabean are highly susceptible to diseases. Farmers are found using insecticide and pesticide violently without any formal knowledge or training. For instance, farmers are found using pesticide after flowering when the recommendation is to use pesticide before flowering. Moreover, farmers are found using pesticide in the noon but the recommendation is to use pesticide in the early morning and evening when the pests are out. IPM practices are not found by the farmers. Seed companies have active marketing and sales forces in the district headquarter and Upazilla level, their distribution networks at union and village level is not significant and are not found active in promoting appropriate methods of pest and insect management.

11.1.12 Flow chart: Pulse (Mung bean) Value Chain
Note: The heavier arrows represent the strongest links. The dashed arrows represent links that require intervention.
Farmer’s Retained Seeds
Insecticides and Pesticides
Seeds supplied by government
agencies
Stockiests
Processed food companies (PRAN,
Square etc.)
Small and Medium Scale Farmer (30-100) decimal land) (around 45% of the
total number of HHs at polder
Large Scale Farmer (more than 100 decimal land)
(27% of the total number of HHs)
Farias
Local Arots (Patuakhali, Amtoli, Barisal)
Arots in Dhaka
Processing Mills in Dhaka
National Retailers
Consumers
Arots in Choumuhoni
Arots in Chandpur
Local processing Mill (M/S Haroon daal mill at Barisal)
Local Retailers
Consumers at project area
District Level Distributors

11.1.13 Service market
Transacted Business Development Services
There are no transacted services subscribed to by the farmers. Information is also thought to be public goods by the farmers. There is no scope to promote transacted extension services to the farmers. However, farmers are looking for information on current market price which can help them decide on which market to sell to. Since, most of the farmers have access to mobile phones and community information centers (CIC) by Grameen Phone, Call center by Bangla Link are being widely marketed by the mobile phone operators.
Embedded business services
Pulse crops are vulnerable to pests and insects. Most of the insecticide and pesticide manufacturing and marketing companies like Bayer crop science, Syngenta and ACI have their operations in the project area. Given the market demand for insecticide and pesticides collaboration could be done with these companies to promote appropriate insecticide and pesticide management techniques and with BARI, BADC, Department for agricultural Extensions (DAE) and such other government agencies to promote better yielding and pest resistant varieties.
Processed food companies like PRAN, Square and BD should be approached to determine the potential for contract farming for mung beans and plain daals from the project region. This will lead to significant growth and development of the crops in the project region.
Local poultry and fish feed manufacturers should also be approached to promote better yielding and pest resistant varieties in the project region.
11.1.14 Some recommendation to increase production of mung bean at polder 43/2A
Creating access to BARI MUNG 5, 6 through collaboration with BADC, input marketing companies
Improved knowledge and promotion of IPM through insecticide and pesticide marketing companies
Organizing demonstration plots under FFS. Organizing demonstration plots through insecticide and pesticide
marketing companies.

12.0 Tilapia-Value Chain
Tilapia was introduced to Bangladesh from Thailand in 1954. In spite of long history, tilapia culture has become widespread in Bangladesh in recent years. Tilapia is ranked 6th in terms of pond fish production which contributes 8.1% of total aquaculture production. A total of around 201,000 farmers are involved in tilapia culture. It is projected that the number of tilapia farmers would be around 330,000 in 2016-17. As tilapia culture is possible in a wide range of freshwater and salinity conditions, thus the total tilapia producing area has been increased from 52,694 ha in 2008-09 to 130,057 ha in 2010-11. It is projected that the tilapia culture area will reach at around 330,000 ha in 2016-17 including ponds, ghers and floodplains. Tilapia is produced in a wide range of culture systems, including small-scale, low-input, rural ponds, semi-intensive, intensive and commercial operations. Most farmers (70%) produce tilapia under polyculture while the remainder (30%) practice in monoculture. Around 30% of farmers are involved in extensive/improved-extensive farming, while 50% and 20% of farmers practice semi-extensive and intensive farming, respectively. The total annual tilapia production in Bangladesh was estimated at 177,682 tonnes in 2011-12. It is projected that the total production of tilapia will be reached at around 311,000 tonnes in 2016-17.
With increasing popularity among consumers, tilapia has become the world’s second most important cultured fish after carp (ADB, 2005b). There is a long history of tilapia farming in Bangladesh. The Mozambique tilapia (Oreochromismossambicus) was introduced to Bangladesh from Thailand in 1954 (Rahman, 1985). However, this species was not widely accepted for aquaculture because of its early maturation and prolific breeding leading to overcrowded ponds. To overcome this problem the Chitralada strain of Nile tilapia (O. niloticus) was introduced to Bangladesh from Thailand by UNICEF (United Nations International Children’s Emergency Fund) in 1974 (ADB, 2005a). Nevertheless, Nile tilapia farming was slow to develop as most farmers remained more interested in carp. Gradually, the red tilapia (hybrid of O. mossambicus x O. niloticus) was imported to Bangladesh from Thailand. The Bangladesh Fisheries Research Institute (BFRI) reintroduced Nile tilapia and Red tilapia from Thailand in 1987 and 1988, respectively (Gupta et al., 1992). Thereafter, Genetically Improved Farmed Tilapia (GIFT) was introduced to Bangladesh by ICLARM (International Centre for Living Aquatic Resources Management, now known as the WorldFish Centre) and BFRI in 1994 (Hussainet al., 2004; Ponzoni et al., 2010). The performance of the GIFT strain was found to be significantly

superior to that of other tilapia in many respects (Hussain et al., 2000; Hussain, 2009). Technology was developed to produce sex-reversed male tilapia (i.e. monosex tilapia), to avoid the unwanted reproduction and benefit from the faster growth rate of males compared to females. Since 2000, interest in tilapia farming has grown because of its observed success in other Asian producers and increasing consumer acceptance both within Bangladesh and internationally (Ahmed, 2009b). In recent years, the culture of tilapia has been progressing well because of consumer acceptance as tilapia is often treated as ‘aquatic chicken’ in Asia. In respect to different tilapia species, the following sections describe tilapia (Oreochromissp) culture with its production, distribution and marketing activities.
12.1 Production analysis
According to the DoF, tilapia (including nilotica) production in pond of Bangladesh was estimated at 98,758 tonnes in 2010-11 which was 8.1% of total pond production (FRSS, 2012). Nevertheless, considerable variation in production data between DoF and Extension Department was found. According to the Extension Department, the total annual production of tilapia in Bangladesh was estimated at 177,682 tonnes in 2010-11 whereas FRSS data estimated 98,750 tonnes production for the same period. After series of discussions with the Key informants and Industry experts it was concluded that in terms of culture area and productivity per hectare, total tilapia production data by Extension Department is reliable. Over the last three years, total tilapia production in Bangladesh has increased more than twice, from 88,210 tonnes in 2008-09 to 177,682 tonnes in 2010-11 (Table 10). In 2010-11, the highest tilapia production was found in Khunla division (76,686 tonnes), followed by Chittagong (52,163 tonnes) and Dhaka (25,731 tonnes). Over the last three years, tilapia production in Khulna division has increased four times from 18,411 tonnes in 2008-09 to 76,686 tonnes in 2010-11. Nevertheless, the comparative growth rate of tilapia production is slow in other divisions. In 2010-11, the lowest tilapia production was found in Rangpur division (2,182 tonnes), followed by Sylhet (6,211 tonnes), Barisal (7,135 tonnes) and Rajshahi (7,574 tonnes).

12.3 Productivity
The productivity of tilapia per hectare farm is low due to extensive culture. It is also found that the productivity of tilapia is low due to polyculture with other fish which is not considered. The average productivity of tilapia in Bangladesh was estimated at 1.37 tonnes/ha in 2010-11.
The productivity rate (tonne/ha) per hectare farm of tilapia has been gradually increasing in Dhaka, Chittagong, Khulna and Rajshahi divisions. These divisions belong to major tilapia producing areas such as Mymensingh, Comilla, Khulna and Bogra. As tilapia is becoming popular among farmers, it is expected that production rate per hectare will increase over the next few years.
12.4 Culture area
Although 371,309 ha of freshwater ponds in Bangladesh are used for inland aquaculture, there is no accurate data about tilapia culture area (DoF, 2012). Nevertheless, Extension Department has gathered tilapia culture area in Bangladesh. As tilapia culture is possible in a range of freshwater and salinity conditions, thus the total tilapia culture area in Patuakhali region has been increased three times from last thre years past.
Table-28: Division wise tilapia culture area in Bangladesh over the last three years
Division
Culture area (ha)
2008-09 2009-10 Annual expansion rate (%) 2010–11
Annual expansion rate
(%) Dhaka 3,376 3,655 8 4,093 12 Chittagong 13,790 14,350 4 14,314 -0.25 Khulna 31,384 38,418 22 105,484 175 Rajshahi 1,051 1,368 30 1,643 20 Sylhet 997 1,214 22 1,326 9 Barisal 1,248 1,397 12 2,026 45 Rangpur 848 268 -68 1,171 337 Total 52,694 60,670 15 130,057 114 Source: DoF, Extension Data (2012)

12.5 Culture practice
The main season for tilapia farming is from April to November/December with many farmers beginning the four months production cycle in April/May. Farmers stock their ponds from as early as April/May and harvest tilapia after four months intervals. Due to scarcity of water and cold weather, most farmers usually complete tilapia harvest at the beginning of dry season in November/December. Fish farming in Bangladesh is largely season based where rain water is trapped during monsoon in ponds for aquaculture. Tilapia culture is fully dependent on hatchery produced fry with home-made feed and/or industrially manufactured pellet feed.
Tilapia can be produced in a wide range of culture systems, including small-scale, low-input, rural ponds, semi-intensive, intensive and commercial operations. Tilapia culture is classified as: (1) polyculture and (2) monoculture. Polyculture has long been traditional practiced by fish farmers in rural Bangladesh. Polyculture involves raising two or more species in one pond so that they do not compete for feed and may complement each other’s ecological habits. The concept of polyculture is to efficient utilisation of trophic niches of a pond in order to obtain maximum fish production per unit area. On the other hand, monoculture deals only single species aquaculture. According to key informants, a number of entrepreneurs first started tilapia monoculture in the early 2000s. The advantage of monoculture is that it allows high stocking density and thus high production. Although monoculture is a non-diversified farming system, the productivity of fish is often higher than polyculture due to intensive farming. It seems that there is a recent trend from polyculture to monoculture due to increase tilapia productivity.
Comparatively, extensive farmers typically use low level of feed application. Semi-intensive farmers use intermediate level of feed, while intensive farmers use high level of feed input. In general, extensive farmers mainly use supplementary diet consisting of a mixture of locally available feed ingredients as rice bran, wheat bran, oil cake and fish meal. In contrast, farm-made aquafeedsand industrially manufactured pellet feeds are used by farmers in semi-intensive and intensive farming. Nevertheless, there is considerable overlap to use feed in different farming systems.

Table-29: Tilapia farming system Farming intensity Description
Extensive
Small farm size (usually less than 0.3 ha) Usually practice polyculture Use low level of inputs (seed, feed, fertiliser and labour) Irregular feeding of fish or feed application once per day Mainly use organic fertiliser (cow dung), depends on natural feed Mostly one production cycle Low fish productivity Farmers typically face financial constraints (i.e. resource-poor
farmers)
Semi-intensive
Medium farm size (typically 0.3–0.7 ha) Farming practice either monoculture or polyculture Use intermediate level of inputs (seed, feed, fertiliser and labour) Regular feeding of fish, usually feed application more than once
daily Apply organic (cow dung) and inorganic (urea and TSP) fertilisers Involve more than one production cycle Medium level of fish productivity Farmers are not resource-poor or have access to financial capital
Intensive
Comparatively large farm size (above 0.7 ha) Usually practice monoculture Use high level of inputs (seed, feed, fertiliser and labour) Regular feeding of fish, usually feed application 2-3 times per day Mainly use inorganic fertilisers Involve 2 or 3 production cycles High level of fish productivity Better-off farmers, use own financial capital or loan
12.6 Cost-Benefit Structure of Different Culture Practices
The costs of tilapia production relate to the level of inputs, the price of inputs and the culture systems. Production costs are grouped into: (1) variable costs and (2) fixed costs. Variable costs are directly related to the scale of farm operations at any given time. Variable costs in tilapia farming are cost of seed, feed, fertiliser, labour, harvesting and marketing, and miscellaneous costs (e.g. electricity, vitamin premix, medicine and lime). On the other hand, fixed costs include: (1) depreciation cost of water pump, net and feed machine, (2) interest on operating capital or loan and (3) land use cost or lease money.

It was found that the costs of production in all items were higher for intensive farms, compared with semi-intensive and extensive farms.
Table-30: Production cost and return for tilapia farming by culture intensity in 2012
Cost and return item Cost and return in farming system (Tk/ha/yr)
Extensive Semi-intensive Intensive
Variable cost (VC) Seed 6,000 10,000 15,000 Feed 48,000 110,000 210,000 Fertiliser 3,000 5,000 7,000 Labour (family and hired) 15,000 25,000 48,000 Harvesting and marketing 2,000 3,000 5,000 Miscellaneous 2,000 3,000 5,000 Sub-total 76,000 156,000 290,000 Fixed cost (FC) Depreciation 2,000 3,000 6,000 Interest on operating capital/loan 9,000 12,000 15,000 Land use cost or lease 5,000 5,000 5,000 Sub-total 16,000 20,000 26,000 Total cost (TC = VC + FC) 92,000 176,000 316,000 Average productivity (kg/ha/yr) (P) 1,200 2,500 5,000 Average farm-gate price (Tk/kg) (FP) 100 100 100
Gross revenue (GR = P x FP) 120,000 250,000 500,000 Net return (NR = GR - TC) 28,000 74,000 184,000
Benefit-cost ratio (BCR = GR/TC) 1.30 1.42 1.58
12.7 Actors involved in Tilapia Value Chain
In tilapia production, distribution and marketing, a number of actors involve in value chain those are playing key roles in different aspects of value addition.
Table-31: Key actors and their roles in tilapia production, distribution and marketing
Actors Functions Roles
Hatchery operators
Brood collection and management
Commercial brood supplier is absent in Bangladesh. Hatcheries collect broods from abroad through the connection of development projects. In addition, some

hatcheries have personal connection with other efficient Tilapia producing countries because of their involvement in ownership of the hatchery. BFRI supplies limited amount of broods to the hatcheries. From the Key informant interview, it was identified that around 2 crore broods are needed every year.
Hatching Hatching eggs from brood and keeping it in the tanks to complete initial nursing of newly born fry.
Fry traders Fry trading
Buying fry from hatcheries and small farmers and sell to the farmers; fry traders include traditional patilwala. In addition to selling fry, they also provide embedded information of farming knowledge for their own business incentive.
Hatchery Agent Trading Fries
Hatchery Agents are the distribution channel of some brand hatcheries like CP, Mega, Quality, Paragon and Fishtech. Usually, they get a certain commission from the hatcheries for selling fry to the farmers.
Input suppliers Input retailing
Work as an intermediaries for the feed and other aqua-chemical companies; farmers buy feed and other inputs from the retailers.
Farmers Production of tilapia
Farmers stock fry in their ponds and produce marketable size (roughly above 125 g) tilapia; later they sell tilapia to the paikers and retailers through arotdars.
Arot (or Arotdars) Wholesale facilitation
Mainly commissioning agents; collecting Tilapia from farmers, and trades to both urban and rural farmers; takes 2-3% commission from the selling price.
Rural Paiker Trading Paikers are the buyers in arots and sell it in bulk (usually in maunds) to the retailers; sometimes, rural paikers sell to the urban paikers.
Urban Trading Buy fish from both arots and rural paikers; trade directly to the urban retailers and wholesale

paikers buyers like hostels, Military and Hospitals.
Urban retailers Retailing
Collect Tilapia from different urban paikers and sell to the urban consumers.
Rural Retailers Retailing
Retailers sell to the consumers; usually, they have specific location in the markets and consumers buy in kg from them.
Rural consumers Consumption Consumers located mostly in the rural areas.
Urban consumers Consumption
Consumers located mostly in the district headquarters and megacities.

Flow chart: Value chain Map of Tilapia
Input Retailer (Feed, Fertilizer
& Chemical Retailer)
Extensive Culture
Urban Paikar
Rural Paiker
Urban Retailer
Arotdar or Commission Agent
Rural Consumer
Rural Retailer
Semi intensive culture
Intensive Culture
Hatchery Agent
Urban Consumer
Who
lesa
ling
Re
tailin
g
Rural Consumer
Rural Retailer
Urban Consumer
Brood Supply
Hatchery
Fry Trader
Input Company (Feed, Fertilizer &
Chemical)
Inpu
t Sup
ply
Prod
uctio
n
Extensive Culture
Urban Paikar
Rural Paiker
Urban Retailer
Semi intensive culture
Intensive Culture
Who
lesa
ling
Re
tailin
g
Rural Consumer
Rural Retailer
Urban Consumer

12.8 Feed Management
Now-a-days a variety of feeds are used for aquaculture including supplementary feed, farm-made feeds and industrially manufactured pellet feeds. In general, extensive farmers mainly use supplementary feed. The average price of supplementary feed was estimated to be Tk 20 per kg.Mash type homemade feed is usually prepared by rice bran, wheat bran, oil cake and occasionally incorporating soybean meal and fish meal. They apply the feed by making feed balls or as they purchase from the market. In contrast, farm-made feeds and industrially manufactured pellet feeds are used by farmers in semi-intensive and intensive farms. The farm-made feed ingredients are mainly rice bran, wheat bran, oilcake, fishmeal, flour, maize, oyster shell, salt, antibiotics, vitamin premix and additives. A significant number of farmers use mixture machines to produce farm-made feed. Normally two types of farmers make their own feeds; firstly those who need huge amount of feeds for their aquaculture operation, secondly farmers who do not rely upon commercial feed due to quality concern and high price. The average price of farm-made feed was calculated at Tk 25 per kg, which is 20-25% lower than industrially manufactured pellet feeds.Farmers who use their own feed, believe that the performance of farm-made feed is often better that the commercial feed.
The feed industries are located throughout the country. Although the main aim of feed business is profit making, many feed industries provide technical assistance through their technical staff.
The price of tilapia feed varied between Tk 25.45 and Tk 50.25 per kg, depending on feed types, quality, culture species, season, supply and demand. In general, floating feeds are expansive than sinking feed, on average 20% higher price.
12.9 Fertilizers and additives Fish farmers mainly use fertilisers for grow-out operation. Fertilisers stimulate the growth of natural feeds, thereby increasing fish yields. Farmers mainly use organic and inorganic fertilisers. The most widely used organic fertiliser is cow dung, which is relatively cheap and readily available in rural areas at every HHs. The use of inorganic fertiliser is not widespread, and only better-off farmers can afford them. Semi-intensive farmers often use a mixture of chemical fertilisers

including urea and triple super phosphate (TSP), which are usually used in combination with cow dung.There is a considerable variation between the application of fertilization rates and different farming systems.
In addition to fertilizers, lime is used in ponds for maintaining water quality and natural productivity. Farmers are often induced to use various feed additives, growth hormones, enzymes, antibiotics and probiotics and other aqua products, such as aquaclean, zeofresh, oxylife, aquamix, gastrap, cevit-aqua, panvit-aqua, antivirus, etc. Mainly intensive and semi-intensive farmers are used these additives for higher production, environmental management, maintaining water quality and disease control.
12.10 Fish Marketing
Harvesting of tilapia starts as soon as fish reach marketable size. Most small-scale farmers harvest tilapia by themselves although a few large farmers depend on commercial harvesters. Vans and rickshaws are commonly used to transport tilapia from remote villages to the assembling centres near the main roadside. A wide range of poor people are involved in the tilapia marketing chain as traders, intermediaries, transporters and day labourers. The tilapia marketing system is traditional and less competitive but plays a vital role in connecting farmers and consumers, thus creating potential for adding value. With a few exceptions, farmers seldom communicate with consumers. Instead the marketing channel from farmers to consumers intertwine primary, wholesale and retail markets, involving local agents, suppliers, wholesalers and retailers from whom consumers make most purchases. The demand for tilapia is high in markets but supply is limited, and a strong multifunctional network has developed with intermediaries and traders intervening between farmers and consumers. The tilapia marketing system is traditional and less competitive but plays a vital role in connecting the farmers and consumers, thus contributing significantly in the value adding process. Tilapia marketing is almost entirely managed, financed and controlled by a group of intermediaries.
12.11 Margin and value addition
A total of BDT 35 value added to Tilapia from farm gate to the retailers. The highest value addition (54%) is done by the Farmers, while second & third place is taken by the Ratailers (27%) and Paikers (15%) respectively. Since Tilapia has the bigger market in the urban areas so, there is more scope for value addition / price increase in the retailing stage. At the same time, Paikers are key actors in

delivering the products to a larger perimeter, which gives them the leverage of increasing the price as per their costing. Arots, generally acting as a commissioning agent has the lowest value addition (4.1%), as the bargaining between the Arotdars and Paikers are mostly dominated by the Paikers.
Table-32: Value Addition in different stages of production
Farmer Arot Paikar Retailer
Price 115 119 130 150
Marketing Cost 3 1 8 5
Value Addition 40 3 11 20
Value Addition % 54.1 4.1 14.9 27.0
Flow chart of Tilapia fish Market:
Distance fish aratdar
Smallholder pond fisheries
Local fish aratdar
Local fish retailers
Local consumption
National markets
Distance fish retailers
National consumption
Fingerlings Nurseries
Fingerlings traders
Feed suppliers
Commercial
fisheries
Ice Suppliers

12.3 Constraints, Market Based Solutions, and Potential Facilitation Activities
A number of constraints due to vulnerabilities were identified in the pond fisheries value chain. For each constraint, potential market-based solutions to the constraint and potential facilitation activities that development organizations may use to support market actors to develop and implement these market-based solutions. Constraints, market-based, solutions and potential facilitation activities can be found in the table below.
Sl Constrains Based Solutions Potential Facilitation Activities
1.
Pond fisheries are vulnerable to tidal surges and floods which reduce interest in farmers to invest in commercial fish cultivation
Access to suitable fish species for fish cultivators to increase growth rapidly (Quick growing, over wintering fingerlings, etc.) Awareness of safe production and harvesting times for fish cultivators
Develop new local nursery men and support existing nursery men to promote good quality fingerlings and appropriate production technologies (quick growing fish species, over wintering/large size fish fingerlings, use of safe cultivation season etc.) Support fish feed and chemical marketing companies to promote improved feed and water purifying chemicals Support lead farmers to promote quick growing fish species Support aratdars to disseminate information to farmers on ideal times for production and harvesting and the benefits incurred by year round and strategic partial harvest.
2.
Lack of knowledge of modern fish cultivation techniques inhibits optimum benefit from pond fish
Access to modern fish cultivation technologies for farmers
See #1 above

cultivation, and decreases profitabilityof fish cultivators.
3.
Lack of cultivation for suitable quick growing fish species, which compensate for the loss endured due to cyclones, reduce chances for increased profitability of farmers from fish cultivation.
See #1 above See #1 above
4.
Post disaster, there is a limited supply/stock of quality, sizeable fingerlings for pond producers to purchase, resulting in diminished benefit from pond fish cultivation.
Access to sufficient quality stock/supply of fish fingerlings for producers
Support nursery men to develop networks and maintain quality stock/supply of fish fingerlings
5.
Limited access to capital inhibits fish cultivators from collecting fingerlings, to restart their fish cultivation post cyclone and tidal surges.
Access to credit (in cash or in kind) for producers
Support fingerling suppliers to extend credit in-kind to farmers Support financial institutions (e.g. MFIs) to develop loans for growers
6.
Due to heavy rainfall, and impact from tidal surges, water logging occurs which destroys potential
Access to improved drainage system for stakeholders Access to improved pond management for
Support interested stakeholders to motivate local governmental bodies to improve drainage systems to diminish water logging

for fish cultivation. Damage to ponds is exacerbated by farmers’ poor pond management resulting in total or decreased loss for farmers.
producers
Train farmers in technical methods to improve pond management such as remedies for polluted water, saline water management, sourcing fingerlings, pond preparedness (utilization of durable netting, raised dikes).
12.14 A set of potential facilitation activities for the pond fisheries value chain include supporting:
Development of new nursery men and capacity building of existing nursery men to promote good quality fingerlings and appropriate production technologies (quick growing fish species, over wintering/large size fish fingerlings, use of safe cultivation season etc.)
Fish feed and chemical marketing companies to promote improved feed and water purifying chemicals in the areas
Aratdars to disseminate information farmers on safe production and harvesting times, as well as methods to reduce risk to disaster through year round cultivation and strategic partial harvest pre cyclone seasons.
Lead farmers to promote quick growing fish species cultivation during the safe production season
Nursery men to develop a network with other nursery men to maintain a quality stock/supply of fish fingerlings (over wintering fingerlings) in the region for cultivation in the safe season
Ice millers to produce ice with special arrangement during time of disaster and assist traders, fish farmers etc. to organize storage facilities for their fish on rental basis
Nursery men and other input suppliers to extend credit in-kind to pond fish farmers
Financial institutions (e.g. MFIs) to develop loans for pond fish farmers
Stakeholders to motivate local governmental bodies, lead farmers, etc. to raised/repair embankments

13.0 Native chicken (Poultry value chain)
Poultry (e.g. native chickens, ducks) rearing at the household level plays an important role in income generation and poverty reduction, particularly for poor rural women or where people lack land for crop cultivation or formal skills to participate in income-earning activities. Poultry scavenge in and around farmers' homesteads, meeting most of their feed requirements in this way. Poultry contributes to household nutrition and provides income to buy food. Moreover, backyard poultry is mostly owned and managed, and sometime traded, by women, and therefore has high potential to advance women’s socioeconomic empowerment.
Backyard poultry production is at the subsistence level of farming. Birds live free range and hatch their own eggs. Their diet is supplemented with crop waste or food leftovers. The labour involved in backyard poultry production is part-time.
In general, rural bock yard poultry is a low-input and low output system managed by women and children of the households. Sourcing feed from scavenging and auto-regeneration are the two important aspects of backyard poultry. The generic features of this system are:
Typical flock size ranges between 5 – 25 birds
Birds are raised under a scavenging system without special inputs in terms of feeding, housing or labor.
Mainly local birds are reared although there are specific/ specialized indigenous breeds in some geographical areas.
These breeds represent a rich source of disease resistant germplasm.
The system auto-regenerates as the chicks are usually obtained by hatching locally.
In most of the cases, eggs produced are for home consumption or for limited trade within the village.
The production performance of these birds is about 40-60 eggs per annum and about 1-1.5 Kg meat at the end of the production cycle. It is a sustainable system with low dependency on external agencies.
Poultry value chains describe the processes through which birds and other inputs pass during the production process, including information on the place each process occurs and on the people involved.

The value or marketing chain for indigenous chickens in polder 43/2A is simple and under developed with no infrastructure at all save for some market stalls in the urban trading centres in Patuakhali city new market and other major markets inside the polder. The main actors along this value chain are smallholder farmers, primary collectors and live bird traders and agents, wholesalers and retailers. The main marketing channels are from farmer to trader or consumer (informal marketing). The other marketing channel is from farmer to retailer and then to consumer (primary marketing). Some farmers sell directly to restaurants/Hotels those who are located in who live in adjacent to Patuakhali district headquarter while others sell to traders (middlemen) who take their chickens either to secondary markets and urban markets (wholesalers). The final, end market of indigenous chickens is domestic consumption through retailers. Figure 13.1 shows the backyard poultry value chain map.
It was found that the majority of the indigenous chickens are moved from the producers to consumers through middlemen. The middlemen buy the chickens from neighboring farmers for sale at nearby markets within the districts or sell to assemblers for a markup. The second most important channel was the roadside. This was mostly used by those households that are located near the main highways and the targeted markets are the motorists.

13.1 Value Chain Map of Native Poultry
Fig: Backyard poultry value chain map at polder 43/2A
Feed Vaccine Medicine Input suppliers
Consumers
Retailers
Producers
Mobile retailers
Urban retailers
Production
Market intermediaries
End market
Neighbors
Roadside
Urban
Rural retailers
Middlemen
Whole seller

13.2 Production at farm level Semi-intensive smallholder chicken raring is a common type of poultry production in the rural areas of polder 43/2A. Indigenous or village chickens freely wander around homesteads and scavenge for food with very little supplementary feeding being provided. The indigenous chickens cause minimal destruction to the environment and require minimal external inputs. Reasons for keeping indigenous chicken are varied and include food security, trading, barter or for quick cash when a domestic need arise as well as fulfilling customary obligations. In polder 43/2A almost all the households (66 percent) owned chickens.
At the production level, usage of improved technologies for producing indigenous chicken is very low. Most producers have not been exposed to any modern technologies that could raise productivity. Basic poultry housing among HHs in the polder found was generally absent. Some of the HHs shared accommodation with chickens except in some cases where they have built separate housing for the chickens. The food resources of indigenous chickens consisted of herbs or cereal seeds, insects which the birds scavenge with very little supplementary feeding provided by the owners.
There is a general lack of extension and veterinary services in most rural areas and consequently producer knowledge of methods of disease prevention and breeding practices is quite low. Farmers are still using traditional herbs for prevention of diseases while chickens are housed in unconventional houses that expose them to adverse weather elements such as rainfall and cold leading to high mortality and seasonality of production. Despite this, most of rural population lives in areas where the indigenous chicken is best adapted to the harsh living conditions.
13.3 Marketing at Farm Gate
As mentioned above, most households rear indigenous chickens as part of their livelihood strategy. The main reasons for keeping chickens included selling; home consumption. There is no HHs found inside polder keeping and selling chickens sorely for business purposes. For those that reported selling chickens, the main reasons for selling included the need to pay for children’s school fees and the need to pay medical bills. The majority of the households found having sold an indigenous chicken. However, although most of the households selling

chickens, sales were quite low. Even among those who sold, the levels of sales were low. Similarly, consumption of chickens was quite low among these households.
The marketing system for indigenous poultry is a simple one, involving a number of marketintermediaries who take possession of the poultry before passing on the birds to the retailers or consumers. The prices obtained for the chickens by the farm household were also dependent on the channel used.
13.4 Retailing
Retailers are another important component of the indigenous chicken value chain. It is through them that the majority of the chickens get to the final consumers, the households. These are usually found in the markets which are scattered around the suburbs and procure the chickens either directly from the farms or from wholesalers at wholesale prices. The costs involved in procuring chickens from the wholesalers to the retail markets include the cost of purchasing the chickens, transportation, market fees, storage costs as well as losses in transit and during storage. The retailer sells the birds to the consumer through wet markets. In the wet market the consumer inspects the live bird and in the case of broilers the bird is weighed and then sold on live weight. The Sonali the weight is estimated and no formal weighing is involved. The birds are then de-feathered and processed at the market and the consumer returns home with the carcass. The reported margin at the retail is in excess and this represents the largest margin in the value chain.
13.5 Processing
Although restaurants only accounted for a small proportion of indigenous chicken marketed, they are an important segment of the value chain as they are the only ones adding value through processing. No packaging or frozen activities were observed inside polder or Patuakhali city new markets. But there is a service at the retail level for broiler and sonali birds they provides poultry slaughtering of birds as embedded services and for native birds they charge Tk 5-10 depending upon size of the birds.

13.6 Consumers
Demand for indigenous chicken, especially among the affluent, is very high because of its low fat content compared to broiler chicken. The demand for indigenous poultry in Patuakhali as well as polder 43/2A can be divided into two major segments, urban and rural. The urban segment of the indigenous chicken market comprises of adjacent to Patuakhali sadar upazilla like Kalikapur. There are several segments that can be identified within this urban market. These include (i) the high income groups, (ii) medium income groups, (iii) low income groups, and (iv) restaurants.
The majority of the households were found consuming more broiler chicken than indigenous chicken (2 times per month). On average, indigenous chicken was more expensive compared to broiler chicken.
In terms of preferences at household level, indigenous chicken was more preferred compared to broiler chicken for its taste, but for its higher prices consumers at poor HHs level consumption level is low. Demand of native chicken increases for family, social and religious program. On the other hand broiler chickens are available with a lower price than native chicken.

14.0 SWOT analysis of polder 43/2A
14.1 Strength
Natural Resource 3887 ha of cultivable land
55% medium high land
Enough or sufficient fresh water surrounding the polder which facilitate crop production
Out fall rivers are active and blessed by river Payra and Lohalia
Good number of canals and khash land
Canal length is 39 km
Infrastructure Embankment is fairly good condition, structures are also fairly good
As main two roads have gone through southern part, this part is economically strong than northern.
School, Madrasha, College, cyclone center, UP office.
Production Farmers are involved in modern technologies
FFS & FLS are facilitating agriculture production
Agricultural machineries are available
About 100% farmers produce T. Aman and mungbean
Human resources Different service providers are present (Poultry workers, Fish traders,
mechanics)

Social and Gender
Women participation in meeting and different economic activities is encouraging
There is no major social or religious conflict
Institutional There are 22 WMGs, 1 WMAs.
There are different trained members in the WMGs (organizational management, leadership)
There are different MFIs (ASA, BRAC, Grameen Bank, Padakhep, etc.)
The whole polder including 3 Union Parishad and adjacent to the Patuakhali District town.
Economic & Commercial WMGs have savings to invest.
90% HH are in mobile coverage.
Presence of different programs for economic development of this area.
Some market products- mung bean, chili, betel leaf.
WMGs have experience on different IGAs (agri-inputs)
Presence of different market actors (e.g. Bapari, wholesaler)
14.2 Weakness
Natural Resource River erosion at certain points.
Siltation of some khals.
Salinity intrusion.

Infrastructure Lack of proper O&M.
Few cyclone shelters.
Lack of Killa (Shelter for Livestock usually made by earth.
Poor condition of some sluice gates (leads to water logging)
Some inlets are not working properly.
Shortage of outlets.
Production Lack of quality agricultural inputs
Shortage of irrigation water during dry season
High price of inputs and low price of production
Insufficient agricultural extension services
Lack of knowledge on improved technology
Non availability of HYV seed
Early drainage limit fish production
Lack of knowledge about CPM
Social and Gender 44% of HH fall under marginal & vulnerable group
Infrastructures are controlled by influential people
Due to social dilemma, women have less access to market
Institutional Not all the WMGs are registered
Weakness in record keeping
Some WMG EC committees are not interested in WMG activities
Majority of the WMGs are in lack of O&M fund
Elections have not been held after expiry of their tenure

BWDB is not maintaining regular O&M
Economic & Commercial Lack of institutional credit facilities
Lack of capital for IGA
Weak marketing channel
Small producers are forced to sell at farm gate
Lack of commercial/lead farmer
14.3 Opportunities
Natural resources Possibility to increase cropping intensity through using modern production
technology
Available fresh water for cultivation in the munsoon
Infrastructure Irrigation channel development
Khal re-excavation for irrigation and drainage
Advocate BWDB design cell to design more environment friendly (ie. for fish cultures etc.) structures.
Production Unused and backyard land can be used for agricultural production.
Water body can be used for case and pen culture for fishery
Fodder crop cultivation
Demonstration of some new technologies such as axial flow pumps (AFP) to cultivate distant fields
Establish livestock vaccine cold chain for vaccination services at WMG/WMA level
Introduction of production related activities through FFS
Khal re excavation for irrigation and drainage to increase cropping intensity

Social and Gender Willingness of women to participate in WMG Awareness building on social and gender sensitization Awareness building for male & female to increase crop intensity. Women access to market More LCS involvement in Khal re excavation and repair embankments
Institutional Willingness of women to participate in WMGs
Linkage between WMG and FFS to Private sector actors, GOs and NGOs
Linking research institutions with FFS/WMGs
Resource person from GOs and NGOs
Economic and commercial Road connectivity between Barisal and Barguna district Existence of Barga Chashi Unnyan prokolpo (BCUP) Create opportunity for skill development for women Use NGOs for micro credit Nursery & hatchery for Fish Introduce IGA for women
14.4 Threats
Natural Resource Cyclone, Siltation, Excessive rainfall, Drought and salinity intrusion
Infrastructure Lack of river ghat Bad road communication increasing cost of production Limitations of budget for construction work
Technical Production Sudden outbreak of disease and pest
Malpractice of adulteration

Low quality of inputs and services
Social and Gender Conservativeness and religious influences/misinterpretation of religious thought.
Out migration
Institutional Sudden change in Govt. Policy (BWBD gazette)
Different relief and asset transfer project or program
Political unrest
Economic & Commercial Limitations of budget
Syndicates control the market
Market distortion
15. Product Selection for Value Chain Development:
In polder 43/2F we found some potential crops considering HH involvements, volume of production and money earning scopes. The products are T. Aman, T.Aus, Vegetable, betel leaf, till, Tilapia, native poultry, chili, Mung bean, Sesame,groundnut, keshari, and sweet potato. People involve with different type of vegetable production but bitter gourd, bottle gourd, sweet gourd, country been are the main considering HHs involve and volume of production. For easy explanation we termed bitter gourd, bottle gourd, sweet gourd, country been as “vegetable”.
Among the products we have primarily selected three crops for Value chain development through a matrix. The matrix and its rational of scoring under each area has been discussed below.

Criteria → Collective Action(4)
Risk
Crop↓
Market
Size
Unmet
market
demand
Potential
productivi
ty
improvem
ent
Expansion
of area /
capacity
Value
adding to
raw
materials
Current
productio
n
Number of
household
s involved
Contributi
on to HH
income
and
wealth
Short or
longer
productio
n/harvesti
ng season
Food
Security
Nutrition Forward /
backward
linkages
conducive
to market
based
approach
Existence
of service
providers
Favourabl
e business
environme
nt
Other
programm
e interests
Involveme
nt of
women
Employme
nt
generation
Collective Action
Oppor‐tunities
Major risks
(No,High,Med
ium, Low)
green,
yellow, red
Weight → 7% 6% 6% 7% 6% 5% 5% 6% 5% 6% 5% 5% 4% 4% 2% 9% 8% 4% 100%
Food
T Aman National 5 1 1 0 1 5 5 1 3 1 1 1 3 5 0 1 1 0 1.89 7th
T Aus National 5 1 1 0 1 3 3 1 3 1 1 1 3 5 0 1 1 0 1.69 11th
Betel leaf 3 1 1 1 1 3 3 3 5 0 0 0 1 1 0 0 0 1 1.31 13th
Til (Sesame) 3 3 3 3 1 1 1 3 3 1 5 5 1 3 1 1 1 3 2.3 5th
Mung beanNational/Internat
ional 3 5 5 5 3 3 3 5 3 0 3 5 3 5 3 3 5 3 3.66 2nd
Chill i National 3 1 3 3 1 1 3 3 1 1 3 3 3 3 3 3 5 3 2.6 4th
Bittergourd District 3 1 3 1 1 1 1 3 0 3 5 3 1 1 3 1 1 5 1.95 6th
Peanut National 1 1 3 3 1 1 1 3 3 1 3 1 1 1 3 1 3 3 1.86 8th
Bottolegourd District 3 1 1 1 1 1 1 3 0 3 5 3 1 1 3 1 1 5 1.83 10th
Sweetgourd District 3 1 3 1 1 1 1 3 0 3 5 3 1 1 3 1 1 5 1.95 6th
Countrybeen District 3 1 1 1 1 1 1 3 0 3 5 3 1 1 3 1 1 5 1.83 10th
Sweet Potato District 1 1 3 3 0 1 1 3 3 3 1 0 1 1 1 0 1 3 1.48 12th
Khesari/Cowpea Regional 1 1 3 3 1 1 3 3 3 0 1 1 1 3 1 1 3 3 1.84 9th
Aquaculture 0
Tilapia National 3 3 5 3 5 1 1 5 3 5 5 5 3 5 5 0 1 5 3.25 3rd
Livestock 0
Native poultry Regional 3 5 5 5 1 5 5 5 5 3 5 3 3 5 5 5 5 5 4.32 1st
0
Total Weighted
ValueRank
Blue Gold Program
Matrix for Value Chain Selection
Component‐04
Indicate market
level (Local,
District, Regional,
National,
International)
Structure of the Industry (15)Gender & Employment
(17)Growth Potential (32) Impact (32)

16.0 Scoring rationality/Explanation of Value Chain selection
A. Growth Potential (32)
1. Present Market size (7) 2. Unmet market demand (6) 3. Productivity Improvement (6) 4. Expansion of areas/capacity (7) 5. Value Addition (6)
1. Present Market Size 7
Weight level maintain criteria (0-5)
Local, regional, national, or international level of envisaged end-market has been defined,
Consider volume, or value of the market to compare, cereals are usually large volumes & values = 5,
But scavenging eggs are low volume & value in comparison = 1
Score 5 Score 3 Score 1 Score 0 T. Aman, T.Aus, Vegetable, betel
leaf, till, Tilapia, native poultry, chili, Mung bean
Groundnut, keshari, sweet potato
Key information against the criteria: Cereal is consumed by 100% of people. It has both a national and international
market. Moreover, the value of rice is also high 35-55 Tk/kg. So, it has been scored “5”.
Compared to cereal, vegetable consumption is low. It is not consumed on a regular basis and amount of consumption depends on price. Demand of vegetables is higher to the well-off families, and mainly in the district market. Price fluctuation is very common although retail price is attractive. Little amount of vegetable is exporting. So, it will score “3”.
Till has demand in poultry industry. Some also extract oil which is consumed by a little portion of the people. The value of Till is very high. Market size of betel leaf, Tilapia, chili is comparatively low although value of these products is high.
Although the local market size is small for Mung bean it has an international market. The value of mung bean is very high, 80 Tk/kg. Considering this it has been scored “3”.
The market size of groundnut, khesari and sweet potato is very small and the value is comparatively low.

2. Unmet market demand (6)
Weight level maintain criteria (0-5)
Is the demand trend increasing, does the market growth by a high %,
Do you recognize any potential for quick expansion, do buyers clearly seek more than the supply available, than we score this 5,
Markets who only grow on the basis of population growth get 1, and
Market demand that is decreasing, some products get out of our diet or are replaced by substitutes =0
Score 5 Score 3 Score 1 Score 0 Mung bean, native poultry
Till, Tilapia, T. Aman, T.Aus, betel leaf, Vegetable, chili, Groundnut, keshari, sweet potato
Key information against the criteria: The demand for both Mung bean and native poultry is increasing. If present
production increased by 300%, even then the market will not be saturated. The local industry and international market have a great demand for mung bean. Buyers are contracting and even giving advance to ensure the supply of mung bean.
Due to health consciousness, the demand for native poultry is very high. Market price of native poultry is almost double than commercial poultry.
Till (Sesame) and Tilapia have also scope for more expansion. Due to low price, fish has a great demand from the poor. The side product of till oil extraction is a good source of protein in poultry industry and aquaculture. So, these can score “3” compare to mung bean and native poultry.
But in case of other products the gap between demand and supply is very low. Usually demand is high rather than supply. But if supply increase by even 25% it may be excess to demand and price may fall down.
3. Productivity Improvement (6)
Weight level maintain criteria (0-5)
Do we know of accessible technological (broad sense) improvements?
If no potential to improve productivity, score =0, Very limited potential (<10%)=1, Medium potential(10-19%) = 3, High potential to increase productivity (≥20% )=5
Score 5 Score 3 Score 1 Score 0 Mung bean, native poultry, Tilapia,
Vegetable, chili, Till, keshari, sweet potato, Groundnut
T. Aman, T.Aus, betel leaf

Key information against the criteria: Considering present productivity of different products in the polder 43/2F this scoring
has been done. Productivity of Mung bean, native poultry and Tilapia can be increased by double or even triple considering present production technologies. Introducing new Variety, technological improvement and ensuring service will help this process. HYV, irrigation and disease control in case of mung bean; improve management practice and vaccination in case of poultry; improve management and introducing mono-sex in case of Tilapia will make it possible.
Utilization rate of HYV in case of Vegetables, chilli, Till, keshari, sweet potato and groundnuts in the polder 43/2F is very low. Improving input utilization will increase production. So, it has been scored “3” to this group, except for vegetables as it has in comparison somewhat less improvement potential.
T. Aman, T.Aus and betel leaf has limited scope for production increase.
4. Expansion of areas/capacity (7)
Weight level maintain criteria (0-5)
If no scope to expand, e.g. T. Amman rice score =0, very limited scope (<10%) =1 Medium scope (10-20%)= 3 High potential (≥20% ) e.g. winter crops where cropping
intensity is still very low due to infrastructure constraints=5 Score 5 Score 3 Score 1 Score 0 Mung bean, native poultry
Tilapia, chili, Till, keshari, sweet potato, Groundnut
Vegetable, betel leaf
T. Aman, T.Aus
Key information against the criteria: Just due to irrigation facilities, tillage facilities and capital a huge amount of land
remains bare in winter season. There is a scope for area expansion even more than 100% for those who already cultivate Mung bean. In their present capacity it is possible to increase poultry population even more than 200% as it requires a very limited area. Even HHs just having homesteads can rear poultry.
Considering the present involvement of HHs, the scope for expansion for Tilapia, chilli, Till, keshari, sweet potato, and groundnutsis little lower than Mung bean, native poultry.
For both Vegetable, betel leaf high land is required which is very limited in the polder. So, scope for area expansion is very limited.
As almost 100% land is under cultivation of T. Aman and T.Aus, there is no scope for area expansion.

5. Value Addition (6) Weight level maintain criteria (0-5)
The potential for farmers or small or micro enterprises to add value and increase earnings locally would score 5,
If it requires a much larger investment by a processor at regional level =3 or even 1
When technically there is no value addition possible =0 If no value addition possible, score =0, very limited
chance =1 (<10%), Medium potential (10-19%)= 3, High potential (≥20%)=5
Score 5 Score 3 Score 1 Score 0 Tilapia Mung bean Native poultry,
chili, Till, keshari, sweet potato, Groundnut, Vegetable, betel leaf, T. Aman, T.Aus
Key information against the criteria: In case of Tilapia local level value adding scope is much higher. The price of Mung bean differs upon its pod size and moisture content. So, local
level value adding is possible. In case of native poultry, chili, Til, keshari, sweet potato, Groundnut, Vegetable,
betel leaf, T. Aman, T.Aus there is little scope for value addition at farmer level or regional level only limited to harvest to marketing of products like indigenous packaging to protect from damage during transportation.
B. Impact(32)
1. Current production(5) 2. No. of HH Involved (5) 3. Contribution to HH income(6) 4. Seasonality-Short or long harvesting season(5) 5. Food Security (6) 6. Nutrition -potential of increasing Nutrition intake (5)
1. Current production(5)
Weight level maintain criteria (0-5)
The % of the land presently under cultivation of this crop, or
The present scale (scavenging versus large broiler farms) or volume of production sets the foundation for the level of impact that can be expected.
T. Aman is produced on nearly 100% of the area available =5

A crop that only commands a very small percentage of the area =1 and
A crop that still needs to be introduced =0, If a crop is produced on say around 50% of land then score=3
Score 5 Score 3 Score 1 Score 0 T. Aman, native poultry Mung bean, betel
leaf,T.Aus Tilapia, chili, Till, keshari, sweet potato, Groundnut, Vegetable
Key information against the criteria: T. Aman covers almost 100% of cultivable land and there are about 132,000 (5280
HH X 25 bird) birds in the polder. So, here the impact would be at highest level. Land covered by Mung bean, betel leaf, T.Aus is moderate and low compared to
the T.Aman. But Tilapia, chili, Til, keshari, sweet potato, Groundnut, Vegetable is cultivated in
smaller area compared to other two categories.
2. Number of households involved(5) Weight level maintain criteria (0-5)
If less than <5% HH Involved, score =0 Involvement by (5-20%) =1 By (20-60%)= 3 High potential (>60% )=5 (explanations are similar as
above) Score 5 Score 3 Score 1 Score 0 Native poultry, T. Aman Betel leaf, Mung
bean, chili, keshari, T.Aus
Tilapia, Till, sweet potato, Groundnut, Vegetable
Key information against the criteria: About 100% HHs involved with T. Aman cultivation and 75% with poultry rearing. Betel leaf, Mung bean, chili, keshari and T.Aus cultivated by 30-50% HHs. Tilapia, Til, sweet potato, Groundnut, Vegetable is covered by below 20% HHs.
3. Contribution to HH income and wealth(6)
Weight level maintain criteria (0-5)
Consider the present versus potential contribution to HH income (contribution to yearly income as %)
Score =0 (only loss making produce) Very limited potential to contribution (>5%) =1 (a
produce which will always be low in volume, and value despite productivity improvements)
Medium potential (6-25%)= 3 High potential (>25%)=5
Score 5 Score 3 Score 1 Score 0 Mung bean, Native Betel leaf, Til, T. Aman, T.Aus

poultry, Tilapia Groundnut, chili,keshari, sweet potato, Vegetable
Key information against the criteria: T. Aman and T.Aus have very limited scope to contribute in increasing HHs income
considering to present status. Utilizing of quality inputs and service will increase productivity but considering costing, net income increase will also be very low.
In case of betel leaf, Till, Groundnut, chili, keshari, sweet potato, Vegetable, there is medium potential to increase production. Moreover, ensuring better service and market linkage there is a possibility to increase income moderately.
In case of commercial production and good marketing a HH income may increase by more than 25%.
4. Short or longer production/harvesting season(5) Weight level maintain criteria (0-5)
Short peak harvesting window, in combination or not of being perishable or yearlong production with regular income makes a big difference to HH financial situation. A product with a short critical harvesting window, moreover being a perishable product having to be sold rapidly score =0, if short harvesting period but not perishable =1, while a crop with a lengthy harvesting period say milk =3, while the permanent production like betel leaf =5
Score 5 Score 3 Score 1 Score 0 Native poultry, Betel leaf
Mung bean, keshari, sweet potato, Groundnut, T. Aman, T.Aus, Til
chili, Tilapia Vegetable
Key information against the criteria: Native poultry and betel leaf have year round production with regular income.
Moreover, poultry is not perishable, whereas betel leaf is slightly perishable. Considering the both criteria we score them “5”.
Mung bean, keshari, sweet potato, Groundnut, T. Aman, T.Aus and Til have short harvesting period but they are not perishable. Considering these points score for these three products will get “3”.
Harvesting period of Tilapia and green Chilli is short and they are also perishable. In this case they will get “1”.
Harvesting period of vegetables is short and it they are more perishable than others. Compare to other it will score “0”.

5. Food Security(6) Weight level maintain criteria (0-5)
If no impact on food security as non-food product score =0,
A food product already being produced locally in surplus has very limited impact opportunity =1
Medium potential for impact= 3 A food crop which regularly has to be imported to
maintain food security in the area, has high potential to impact=5
Score 5 Score 3 Score 1 Score 0 Tilapia Native poultry,
Vegetable Chili, Til, keshari, sweet potato, T. Aman, T.Aus, Groundnut
Betel leaf, Mung bean,
Key information against the criteria: Betel leaf is a nonfood item. Mung bean is a food item but people do not eat it
locally and 100% sell. These products have no impact on food security. T. Aman and T.Aus are the main food items of the people but it is a surplus product
in this area. So, it will result in very little impact. On the other hand chili, Til, keshari and sweet potato required volumes are low but there is a shortage of these products as only 20-30% of HHs produce these products.There is a remarkable shortage of poultry, egg and vegetable in this polder. The requirements are rather higher than the previous one. Increase of its production will have a good impact over the HHs. Moreover, these can be substitutes of other food items.
Compared to other food products Tilapia has great market demand in the polder and at present almost 100% comes from outside on a regular basis.
6. Nutrition-Potential of increasing Nutrition intake (5) Weight level maintain criteria (0-5)
Some product which is needed to ensure proper nutritional food intake, e.g. some micro elements usually in shortage should score high; If no impact possible on nutritional intake (e.g. no food crop) , score =0, very limited potential =1, Medium potential = 3, High potential =5 e.g. moringa with recognized high nutritional value.
Score 5 Score 3 Score 1 Score 0 Til, Vegetable, native poultry, Tilapia
Groundnut, Mung bean, chili
Keshari, sweet potato, T. Aman, T.Aus
Betel leaf
Key information against the criteria: Betel leaf is a nonfood item. Sweet potato, T. Aman and T.Aus are carbohydrate sources of which there is usually
no short fall among the people. Even people take more than required. Although keshari is a protein source which has a great short fall among the people it contains

a poisonous element (Lathyrism) which causes health hazard to child and pregnant mother.
Groundnut and Mung bean are protein sources which have a clear shortfall. But these are low grade protein compared to animal protein. Moreover, people are not habituated to take these items frequently. Chili contains vitamin C which is very essential and one needs a regular supply as the body can’t store the excess Vit-C.
Til, native poultry, Tilapia are good sources of protein and people usually take or like to take these. Vegetables contain many micro elements essential for the body. These items should be taken regularly and there is a substantial shortage of vegetables in the polder.
C. Structure of the Industry (15)
1. Forward/backward linkage and MD Approach (5) 2. Existence of Service Providers (4) 3. Favorable Business Environment(4) 4. Other program Interest(2)
1. Forward / backward linkages market development approach(5)
Weight level maintain criteria (0-5)
Consider existence of lead firms, in either input, processing or marketing, the suitability of these actors and ease of getting them involved, will determine potential. If no potential for Market linkage or development approach, e.g.
Due to complete absence score =0 Very limited potential =1 Medium potential = 3 High potential =5
Score 5 Score 3 Score 1 Score 0 Mung bean, Tilapia, Til Native poultry,
chii, Vegetable keshari, Groundnut, T. Aman, T.Aus
Betel leaf, sweet potato
Key information against the criteria: There is processing industry that processes and trades Mungbeans at Barisal. Market
actors are available and proactive. BARI has developed different HYV and DAE is disseminating the technology. All inputs are available and service quality is fairly good. Only problem is accessibility where there is scope for development.
There are Tilapia hatcheries and fish processing centers in this region. Til has great demand in poultry feed industry. There are also local processing centers which extract oil from till. Forward and backward market actors are available in the surrounding area with moderate linkages. Considering these issues it will score “5”.
For native poultry, chili and Vegetable there is no or very limited scope for processing regionally. Although quality inputs are available in the surrounding area but still drawing low demand. Market actors are at the district and upazila level but low volume and sporadic production do not attract them.

For keshari, Groundnut, T. Aman and T.Aus, there is no scope for industrial linkage regionally although there is scope for processing. Quality inputs for these products are not available. The quality and quantity of market actors is poor.
For betel leaf and sweet potato there is no industrial linkage, nor input traders. There are also few market traders,their linkage is weak and service is almostnill.
2. Existence of service providers(4) Weight level maintain criteria (0-5)
Similar to above, existence and performance of public and private service providers to the value chain actors. If no existence for SP, score =0
Very limited presence (1/2) =1 Medium presence (2-5)= 3 High existence (>5) =5
Score 5 Score 3 Score 1 Score 0 Tilapia, Mung
bean, native poultry, T. Aman, T.Aus, chili
Betel leaf, Till, keshari, sweet potato, Groundnut, Vegetable
Key information against the criteria: For Tilapia, Mung bean, native poultry, T. Aman, T.Aus and chili govt. provide
technical and extension services. But due to manpower shortages the service is weak. Quality of the service providers is moderate and barely available where poor HHshas limited access. Private sector has quality service but presently has limited access. Considering there we score these “3”.
Comparing with the above products Govt. has less interest in Betel leaf, Til, keshari, sweet potato, Groundnut and Vegetable. Existence and performance of private service is also weak compared to the above one.
3. Favorable business environment(4) Weight level maintain criteria (0-5)
Consider relevant issues in the BEE. Absence of constraints or existence of support measures to doing business scores high, the extent of government involvement distorting the market could be negative.
If business environment is obstructive in several ways score =0,
Score higher in accordance with the business environment being more developed (e.g. aquaculture standards are available) and supportive (any subsidies, high on government policy priorities) or not.
Score 5 Score 3 Score 1 Score 0 T. Aman, T.Aus, Mung bean, Native poultry, Tilapia
Chili, Til, keshari Groundnut, sweet potato, Vegetable, Betel leaf

Key information against the criteria: Paddy is of the highest concern for the government. To increase its production govt.
is providing subsidies for diesel and fertilizer, prior also electricity supply, bank loans. After harvesting govt. purchase paddy from the farmers and fix a minimum rate.
DAE has different program for Mungbean extension. Research institute has research program.
Government is providing a subsidy on vaccines for poultry development. For poultry sector development have specific policy. Avian influenza cell is active to prevent and eradicate this disease.
DoF and FRI is working for Tilapia extension and improvement. Government is providing tax exemption/reduction in total aquaculture sector. Beside world fish is working for Tilapia hatchary improvement through skill development. All these initiatives are providing a better BEE for these products and thus can score “5”.
Government has different program for support in Variety development and extension of chili, Til and keshari.
But for Groundnut, sweet potato, Vegetable and betel leaf there is no special program of emphasis or subsidy.
4. Other program interests(2) Weight level maintain criteria (0-5)
The extent there is opportunities for coordination, complementary action and synergy with other local program.
If no NGO/Org working in the same sector, score =0 Very limited presence (1-2) =1 Medium presence (3-5)= 3 High presence (>5)=5
Score 5 Score 3 Score 1 Score 0 Native poultry, Tilapia Mung bean, Chili,
Groundnut, Vegetable
Til, keshari, sweet potato
T. Aman, T.Aus, Betel leaf
Key information against the criteria: In almost every development program in this polder there is a space for poultry.
Even microcredit program is providing support for poultry. In our FFS we have a poultry module. World fish is working specifically on Tilapia extension and sector development. In other market development programs they are working in Tilapia Value chain, like: AFE.
Other programs are not exclusively with Mung bean, chili, Groundnut, or Vegetable. Rather they are working for homestead or agricultural development where these products are a part. So, interest is moderate compared to the previous ones.
Only government has an extension program for Til, keshari, and sweet potato. For paddy and betel leaf there is no known such type of programs.

D. Gender and Employment (17) 1. Involvement of women (9) 2. Employment Generation (8)
1. Involvement of women(9)
Weight level maintain criteria (0-5)
Focus is on the contribution to women empowerment, not just more work while they are already overburdened and only would be to the detriment of the family. Aim is to give them for example an opportunity to retain income. If no women involvement potential, score =0, very limited potential =1, Medium potential = 3, High potential =5
Score 5 Score 3 Score 1 Score 0 Native poultry Mung bean, chili Til, keshari, sweet
potato, Groundnut, Vegetable, T. Aman, T.Aus
Tilapia, Betel leaf
Key information against the criteria: Native poultry is solely undertaken by women.Women are responsible for rearing,
management, and treatment, marketing. Moreover,they have control over this income with some are exceptions. So it will score “5”.
Women are fully involved in harvesting of Mung bean and chili. These create employment opportunity for women. But this opportunity is for a short time, only in harvesting period and constitutes little more than extra work.
Women are involved in one or more stages of Til, keshari, sweet potato, Pea nut, Vegetable and paddy from cultivation to harvesting. But the service is generally unpaid family labor.
In case of Tilapia and betel leaf, women have no involvement.
2. Employment generation(8) Weight level maintain criteria (0-5)
Labor intensity of the envisaged intervention (could be area expansion, adding value, productivity increase). Number of employment creation, the type (quality) of employment and opportune timing thereof. If no potential for employment generation, score =0, very limited potential (<5%)=1, Medium potential (5-10%)= 3, High potential (>10%)=5
Score 5 Score 3 Score 1 Score 0 Native poultry, Mung bean, chili
Groundnut & Sweet potato
keshari, Tilapia, Til, Vegetable, T. Aman, T.Aus
Betel leaf
Key information against the criteria: If number of poultry increases and farmer consider it as a business, than it will create
an opportunity for a good number of poultry vaccinators where income and employment status is good. There is a possibility to create an opportunity for at least

10 vaccinators. Mung bean, chili has potential for area and productivity increase. In that case it will facilitate extra 50-70% labor during harvesting.
Groundnut & sweet potato also require labor during harvesting. Considering possibility of expansion and production increase there is a possibility to increase labor and employment generation may increase up to 10%.
Considering the possibility of production increase keshari, Tilapia, Til, Vegetable, T. Aman and T.Aus may create an opportunity for mainly labor employment at a minimum level.
For betel leaf there is no such type of opportunity.
E.Collective action opportunities (4) 1. Collective action opportunities(4)
Weight level maintain criteria (0-5)
Does this product lend itself to Business ideas for cooperatives, on the input or market side, and producer groups benefitting of doing these collectively.
If no opportunities for collective action (working in collaboration/ as cooperatives), score =0
Very limited potential =1 Medium potential = 3 High potential =5
Score 5 Score 3 Score 1 Score 0 Native poultry, Tilapia, Vegetable,
Mung bean, chili, Til, keshari, sweet potato, Groundnut
Betel leaf T. Aman, T.Aus
Key information against the criteria: In case of poultry there is a possibility for collective action for inputs (feed, medicine,
vaccine) and marketing, as per household production is very low. Farmer can also develop producer group which will attract market actors and service providers. This is also possible for Tilapia and vegetables as most farmers are small producers. Considering these possibilities there are better opportunities for collective action.
In case of Mung bean, chili, Til, keshari, sweet potato and Groundnut, farmers can purchase inputs collectively. As harvesting period is very short and individual production is relatively high scope for collective marketing is comparatively low. There are possibilities for producer group formation.
In case of betel leaf, the scope for collective action in both input and marketing is very limited. But the possibility for producer group formation to attract services is real.
Paddy has almost no opportunity for collective action as collective effort will not provide any remarkable benefit.

F. Risks
Major risks (No, High,Medium, Low) Weight level maintain criteria (0-5)
Consider major risks for this product (the absence of risks will score green, general prevalence of risks orange, but risks with high certainty of occurrence and extremely damaging to the produce should be give red.
Level of risk Native poultry,
Tilapia Mung bean, Chili, Bitter gourd, Groundnut, Sweet gourd, Country bean
Key information against the criteria: Susceptible to diseases of native poultry is comparatively low. High opportunity to collective action of backyard poultry (Input collection, egg
selling, Poultry meat selling). Farmers usually sales their egg at farm gate level to local egg collectors. High opportunity to collect or purchase Tilapia inputs collectively. Also opportunity to sale Tilapia collectively which has unmet market demand at
local and regional markets. Medium opportunity to collective action. Farmers generally sales their Mung bean
at Khasherhat bazaar or farm gate, some farmers at Patuakhali, Amtoli and Barisal. Also opportunity to sale Mung bean, Chili collectively.
17. Conclusions
By overall consideration It could be said that there is significant scope to apply market-oriented approaches to the Polder 43/2A for some economic crops like Mungbean, Peanut, Sesame, Tilapia etc. These approaches have the potential to generate a number of improvements over traditional DRR and relief approaches currently being implementing. Utilizing these approaches will undoubtedly generate additional benefits for the poor including increased sustainability of economic gains. As determined by the various market based solutions, the implementation of ‘potential facilitation activities’ will address the specific constraints of market actors specific to Polder 43/2A.

Information collection from union parishad
18 Annexure
18.1 Information of Chatobighai Union of polder 43/2A
Choto Bighai Union
General Discription:
Choto Bighai union is comprised of an area of 2,776 ha. (BBS, 2001) of land of which the total cultivable land is 1,465 ha. (53%). The number of farmers family is 4,144 where 22% are share croppers. The area under irrigation is only 7%, which is due to surface water salinity in the dry season. The salinity rate and other natural hazards are increasing day by day as reported by the local people. The area is exposed to
severe cyclone and strom surges that cause huge sufferings in human lives and loss of agricultural crops as well as other assets of the people.
Agriculture
Land Type Classification:
Land type is the dominant factor guiding choice of crops and cropping patterns of any area. Selection of crops/cropping patterns largely depends on the topographic position of land in relation to seasonal inundation depth and its duration. Lands, which are above normal inundation level, can provide a wide range of opportunities for growing both perennial and year round annual dry-crops. The major land type of this union are medium high land (75%), and high land (25%), which indicates that most of the land areas remains under moderately monsoon flooding and suitable for wetland crop cultivation. The limited high land is not inundated by monsoon flooding but other areas are inundated by the monsoon flooding for 4 to 5 months at various depths upto 90 cm.
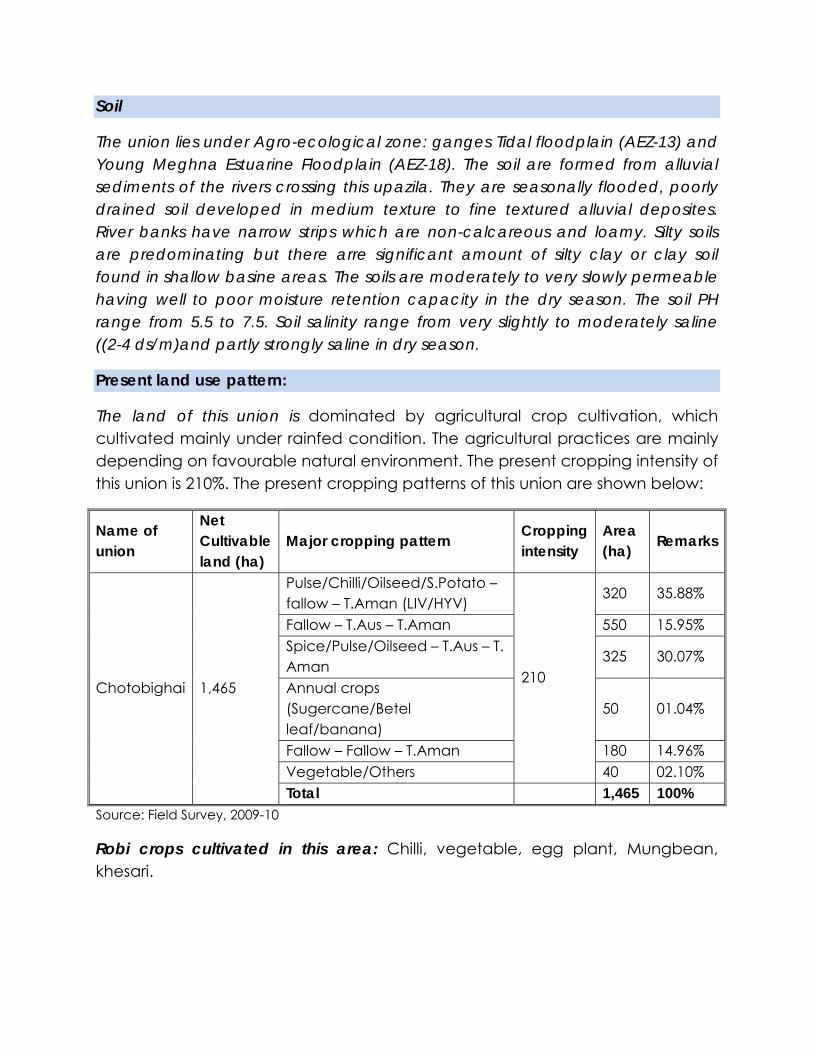
Soil
The union lies under Agro-ecological zone: ganges Tidal floodplain (AEZ-13) and Young Meghna Estuarine Floodplain (AEZ-18). The soil are formed from alluvial sediments of the rivers crossing this upazila. They are seasonally flooded, poorly drained soil developed in medium texture to fine textured alluvial deposites. River banks have narrow strips which are non-calcareous and loamy. Silty soils are predominating but there arre significant amount of silty clay or clay soil found in shallow basine areas. The soils are moderately to very slowly permeable having well to poor moisture retention capacity in the dry season. The soil PH range from 5.5 to 7.5. Soil salinity range from very slightly to moderately saline ((2-4 ds/m)and partly strongly saline in dry season.
Present land use pattern:
The land of this union is dominated by agricultural crop cultivation, which cultivated mainly under rainfed condition. The agricultural practices are mainly depending on favourable natural environment. The present cropping intensity of this union is 210%. The present cropping patterns of this union are shown below:
Name of union
Net Cultivable land (ha)
Major cropping pattern Cropping intensity
Area (ha) Remarks
Chotobighai 1,465
Pulse/Chilli/Oilseed/S.Potato – fallow – T.Aman (LIV/HYV)
210
320 35.88%
Fallow – T.Aus – T.Aman 550 15.95% Spice/Pulse/Oilseed – T.Aus – T. Aman
325 30.07%
Annual crops (Sugercane/Betel leaf/banana)
50 01.04%
Fallow – Fallow – T.Aman 180 14.96% Vegetable/Others 40 02.10% Total 1,465 100%
Source: Field Survey, 2009-10
Robi crops cultivated in this area: Chilli, vegetable, egg plant, Mungbean, khesari.

Agricultural land suitability:
For crop production we must know the suitability of the land so that we can get better production with comparatively low cost. For determining the physical suitability of land we have to know the nutrients of the land, groundwater salinity, physical structure of the land, level compare to sea level etc. Here, we have presented the features in a table below.
Major Problem and Impacts:
Water stagnation/drainage congestion
Low organic matter contents in soil
Soil moisture deficit during the dry months
Essential plant nutrient deficiency
Risk of tidal flood, river erosion and saline water intrusion
Management practices for improving crop cultivation:
Drainage congestion can be removed by excavating new canals and re-excavating old once making connection to the adjacent rivers which might accommodate excess water of flood and thus would help to reduce the damage caused by flood. Most of the old canals of the union have been diverted or closed due to unplanned construction of housing, markets, infrastructures which are creating barriers to normal water flow and making drainage congestion. So, appropriate measures with motivation and awareness building should bee taken immediately where our WMGs (water management Committee) can take initiative. Besides, messages can be disseminated through FFS.
Development of irrigation facilities by preserving sweet surface water in the khals, introducing of low lift pumps (LLP) and other inputs in the local markets, well planned uses of lands ass per its criteria could help to increase higher yields of agricultural crops.
To increase the organic matter in the soil, leguminous crop cultivation could be suggested in the present cropping pattern. Besides, application of organic manures and bio- fertilizers can improve deficiency of soil nutrients.
Union Name Land type Topsoil texture Soil PH Soil salinity Land suitability
ChotoBighai HL-25% MHL-55%, LW-20% Cl-clay 5-7 2-6 Mostly S2 & S3

Institutional arrangements suggested in this report would help to ensure the participation of stakeholders for sustainable management of land resources through proper implementation preventive and improving measures.
Fisheries
In Bangladesh fisheries provides 60% of the national animal protein and this sub-sector contributes about 5% of the GDP and about 9% to the foreign exchange earnings. Nearly, 1.2 million people directly employed in this sector and another 11 million are indirectly engaged in activities related to this sector.
Wet land distribution:
The union has a total wet land area of 693 ha. of which 115 ha. Is under aquaculture. Aquaculture comprises of homestead pond fish culture in 9 ha. And prawn culture in 1 hacter. The open water fisharies consists of river, canal and floodplain with a area of 577 hacter.
Wetland distribution at Chotobighai union:
Total area (ha.)
Pond culture (ha.)
Fish culture (ha.)
Prawn culture (ha.)
Total culture (ha.)
Total capture
(ha.)
Total wet land (ha.)
2,975 105
(3.53%) 09 (0.3%) 01 (0.03%)
115 (3.87%)
577 (19.39%)
692 (23.26%)
Forestry:
Forestry isa long term production system, has manifold contribution towards the welfare of mand kind, biodiversity and environmental conservation. The multiple uses of forest resources have been recognized from the advent of civilization. The forestry sector contributes 1.86% to the total GDP of Bangladesh (Forest department, 2006).
General forest information:
The unions under Patuakhali Sadar upazila are unique in its natural vegetation, homestead/community forest, road side plantation and in wetland floral species.

Homestead/community forestry:
Homestead forest is a forest for the people and by te people, grown on marginal and fallow landof homestead area, beside roads, railway, embankment, river, khal and on fallow highlands characterized by a combination of annual and perennial forest species. The homestead forestry is a promising sector in this area which accounts for 48% of the total supply of saw and veneer logs, 70% of fuel wood in the rural areas,.
In the studied area rain tree occupies highest number among timber species, which is about 45.59%of the total planned forest. The next is Mehogony 24.60%, Betel nut 3.50%, mango 8.5%, jackfruit 3.60%, Khajur 3.80%, coconut 3.40% and other are 7.20%.
The adverse effect of the rain tree as reported by the local people were that it create shado in the nearby crop field as its brunches occupied a huge area and hamper agricultural crop cultivation. It has also negative impact on soil fertility and water quality when poisonous ingredients of decomposed leaves and limbs of rain tree are mixed in nearby agricultural fields, water bodies and ponds. Inspite of these issues it has demand to the villagers as it grow very fast and can sustain under any adverse natural condition.
Raintree, 40.00%
Mahogony, 25.00%
Betel nut, 2.00%
Mango, 8.00%
Jackfruit, 5.00%
Khajur, 5.00%
Coconut, 3.00%
Bamboo, 3.00%
Palmyra Palm, 4.00%
Jam, 2.00% Other, 6.00%Raintre
Mahog
Betel n
Mango
Jackfru
Khajur
Coconu
Bambo
Palmyr
Jam
The land use of Chotobighai union consists mainly of settlements with profuse homestead forest, water bodies, fisheries and agricultural land. Settlements with

community/homestead forestry possess mainly the highland areas above normal flood level which are about 27.85% of the total area of this union.
Chpto Bghi Union at a Glance
1. Establish: 1973 2. Distance from Patuakhali Sadar Upazila through road is about 15 KM. 3. Area: 14.4 Square Kilometer or 37.0 square Kilometer 4. Boundary: Pyara River is at West-North, Guabaria River at east, Boro Bighai
Khal is at South, at West Kalikapur and Patuakhali pouroshova. 5. Name of chairman: Mrs. Suily Begum, Mobile- 01725-005839 6. Secretary: Md. Omor Faruk. Mobile- 01714-598027 7. There are 6 (six) Mouja, namely- Tushkhali, Vhagna, Fultola, Mativhanga,
Hortokibaria, Chotobighai. 8. No. of Villages: 9 (nine) villages, namely- Tushkhali, Vhagna, Fultola,
Mativhanga, Hortokibaria, Chotobighai, katakhali, east Matibhanga and Kumurkhali.
9. Population: 22,092 (Male- 11,532 female- 10,560) 10. Voter (age above 18 years): 12,707 11. Total Agricultural Land: 8,010 Acars (single cropped- 2560 acar, double
cropped- 5450 acar) 12. Tuble: Deep- 141, shallow- nill 13. Education rate: 40% 14. Primary school: public 08, private 07 15. Secondary school: 02 private only 16. College: 01 private only 17. Madrasha: 06 Alia & 02 koumi 18. Road length: 05 km paka, 10 Km HBB, 120 km kacha. 19. Number of HH: 4658 20. No. of Market: 05 21. No. of Cyclone centre: 03 22. Govt Sattelment: 02 (220 member) 23. No of Bank: 04 (Krishi bank, grameen bank, Brac bank, ASA)

Population
SL No. Mouja Male Female Total
01 Jushkhali 2,018 2,054 4,072
02 Mativhanga 2,368 2,437 4,805
03 Choto Bighai 1,476 1,540 3,016
04 Vagna 1,171 1,250 2,421
05 Hortokobaria 3,045 1,587 4,632
Total = 18,946
Source: 20/03/2011 Sensus & HouseHold Survey- 2011.
Communication System
Choto Bighai Union is not so far away from Patuakhali district town. It is about 15 Km away. It is possible to go by Rikhsa, Auto or Motor cycle. Easiest way is to go to “Hatalia Badh Ghat” first and cheapest transport is auto, cost only 10 taka. From “Hatalia Badh Ghat” to Choto Bighai union through Auto or Motorcycle per person cost is 50-60 taka.
VGD
VGD Cycle 2013-14, Union – Choto Bighai
Total listed and supported: 186

18.2 Bara Bighai union General description:
Total land area is 2,854 ha (BBS,2011) of land of which the total cultivable land is 1,912 ha (67%). The number of farmers family is 3,940 where 15% are share croppers. The area under irrigation is only 10%, which is due to surface water salinity in the dry season.
Agriculture
Land Type classification:
Land type is the dominant factors guiding chiece of crops and cropping patterns of any area. Selection of crop or cropping patterns largely depends on the topographic position of land in relation to seasonal inundation depth and its duration. Lands which are above normal inundation level, can provide a wide range of opportunities for growing both perrinial and year round annual dry-land crops.
The major land types of this union are medium high land (75%), and high land (25%), which indicates that most of the land areas remain under moderately monsoon flooding and suitable for wetland crop cultivation.
Cropping Pattern:
The land of tthis area is dominated byy agricultural crop cultivation, which cultivated mainly under rainfed condition. The agricultural practices are mainly depending on favourable natural environment. The present cropping intensity of this union is 214%. The present cropping patterns of this union are shown below:
Name of
union
Net Cultivable land (ha)
Major cropping pattern Cropping intensity
Area (ha) Remarks
Bara Bighai 1,912
Pulse/Chilli/Oilseed/S.Potato – fallow – T.Aman (LIV/HYV)
214
686 35.88%
Fallow – T.Aus – T.Aman 305 15.95% Spice/Pulse/Oilseed – T.Aus – T. Aman 575 30.07%
Annual crops (Sugercane/Betel leaf/banana) 20 01.04%
Fallow – Fallow – T.Aman 286 14.96% Vegetable/Others 40 02.10%
Source: Field Survey, 2009-10

Rabi crop cultivated in this area: Chilli, Vegetable, Egg plant, Mungbean, peanut, and Khesari etc.
Major problems:
Water stagnation/congestion, Low organic contents in the soil, Soil moisture deficite during the dry months, Risk of tidal flood, River erosion and saline intrusion.
Fisheries:
The union has a total wet land area of 583 hectars, of which 125 hectars are under aquaculture. Aquaculture compraises of homestead pond fish culture in 115 hectars, commercial fish culture 4 hectars and prawn culture was 6 hectars. The open water fisheries consist of river, canal and flood plain with a water area of 558 hectares.
Wet Land Distribution of Polder 43/2A
Union Total Area (ha)
Pond Culture
Fish Culture
Prawn Culture
Total Culture
Total capture
Total Wetland Remarks
Boro Bighai
3,444 115
(3.34%) 04
(0.12%) 06
(0.17%) 125
(3.63%) 458
(13.3%) 583
(16.93%)
Homstead/ Community Foresty:
Settlement with homestead is being used for combined vegetable and plantation with timber wood fruit, fodder and other cottage industry raw material yielding tree. Raintree occupies a major portion,which is about 45% of total homestead vagitation, the next are roughly mahar 20%, mango 9%, Khajur 4%, jackfruit 3%, bamboo 3%, coconut 4%, palmayra palm 2%, betel leaf 3%, jam 1%, and other are 6% of the total vagitation.

Boro Bighai Union
Established: 1963
Communication
20 km away from Patuakhali Sadar upazila headquarterthrough road
Total road length: 111 Km where 11 km pacca, 2.25 km HBB and 98 km kacha.
Area: 29.75 square Kilometer
Boundary: North- Choto Bighai Union, West- Ayla River, South- gulishakhali River, east- Barunbaria River & Morichbunia union.
No of Mouja: 05 Mouja, namely- Boro Bighai, South Bighai, Posharibunia, West kawabunia and Titkata.
No. of Village: 11 Villages, namelt- Borobighai, Jorkhali, South Bighai, Poykka, Patukhali, Saichabunia, Posaribunia, West kawabunia, East kawabunia north Titkata, South Titkata.
Post Office: 04, Placed- Khatashia Bazar, Boro Bighai, saichabunia, Titkata

Market: 05, namely- Khatashia Bazar, Boro Bighai officer hat, Bighair Hat, Titkata, Middle Titkata.
Population: 19,333 ( Male- 9,518, Female- 9,881)
Voter: 11,050 (over 18 years of age)
Total Household: 5,020
Cyclone shelter: 04
Housing facilities for poor: 02 Adersho Gram, 01 ashrayan (150 HH)
Agricultural land: 7,023 Acar ( single cropped- 3,000 acar, 2,000 acar)
Rate of education: 57%
No. of primary School: public 15, community- 02.
Secondary School: Private - 03
College: Private- 02
Madresha- No public, Private- 07 (01 Alim, 02 Dakhil, 02 Koumi, other 02)
Village wise Population
Sl No Name of Village Population 1 Boro Bighai 2076 2 Jorakhali 2071 3 Patukhali 1051 4 Pokhya 838 5 South Bighai 1505 6 Shaichabunia 819 7 Posaribunia 1646 8 East Kawabunia 2487 9 West Kawabunia 2417 10 North Titkata 2409 11 South Titkata 2080
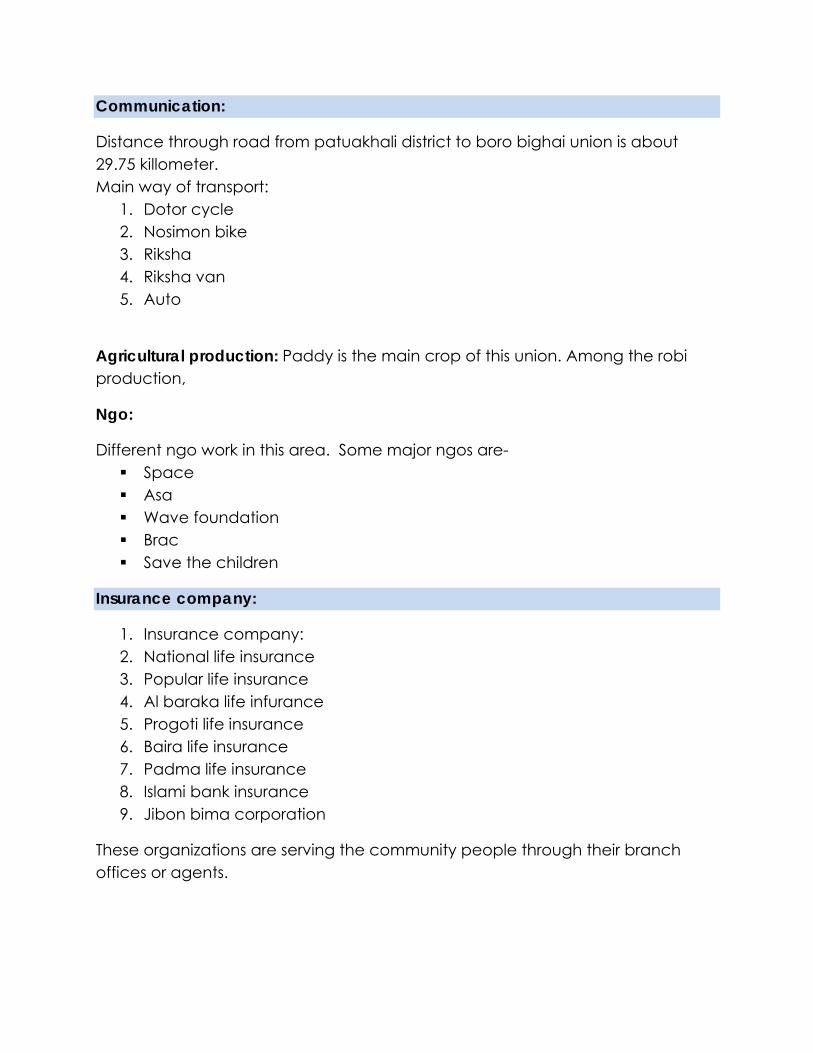
Communication:
Distance through road from patuakhali district to boro bighai union is about 29.75 killometer. Main way of transport:
1. Dotor cycle 2. Nosimon bike 3. Riksha 4. Riksha van 5. Auto
Agricultural production: Paddy is the main crop of this union. Among the robi production,
Ngo:
Different ngo work in this area. Some major ngos are- Space Asa Wave foundation Brac Save the children
Insurance company:
1. Insurance company: 2. National life insurance 3. Popular life insurance 4. Al baraka life infurance 5. Progoti life insurance 6. Baira life insurance 7. Padma life insurance 8. Islami bank insurance 9. Jibon bima corporation
These organizations are serving the community people through their branch offices or agents.

Social safety net program:
Employment generation program for hardcore poor (2012-13)- 310 persons were enlisted in the 2nd phase.
There are 280 listed fishermen who are not getting VGF support in this Union. They have got Hilsha net as input support from gonernment.
VGD (2013-14): for the year 2013-14, 173 women have been listed and getting support from vgd program in boro bighai union.
Aged allounce:
430 old aged people are getting this support under social safetynet program of the government from boro bighai union.
Otist allounce:
46 otist have been listed in this Union and are getting support from government.
List of Market:
1. Khatasia bazaar 2. Titkata Bazar 3. Boro Bighai Officer hat 4. Boro Bighai hat 5. Middle Kawabunia Bazar 6. Middle Titkata Bazar

18.3 Madarbunia Union
General description
Madarbunia union is comprised of an area of 3098 ha of land, of which the total cultivable land is 2040 ha (67%). The number of farmer’s family is 3047 where 40% are share croppers. The area under irrigation is only 5%, which is due to surface water salinity in the dry season. The salinity rate and other natural hazards are increasing day by day. The area is exposed to severe cyclone and storm surges that cause huge suffering in human lives and loss of agricultural crops as well as other assets of the people.
Fig: Land utilization in Madarbunia Union
66%
34%
% of Land utilization in Madarbunia Union
Under cultivation
Non-cultivation
Land type classification
The major land types of this union are medium high land (75%) and high land (25%), which indicates that most of the land areas remain under moderately monsoon flooding and suitable for wetland crop cultivation. The limited high land is not inundated by monsoon flooding but other areas are inundated by the monsoon flooding for 4 to 5 months at various depths up to 90 cm.
Soils
The soils are moderately to very slow permeable having well to poor moisture retention capacity in the dry season. The soil pH ranges from 5.5-7.5. Soil salinity level ranges from very slightly to moderately saline (2-4 dS/m) and partly strongly saline in dry season.

Cropping pattern
The land of this union is dominated by agricultural crop cultivation, which is cultivated mainly under rainfed condition. The agricultural practices are mainly depending on favorable natural environment. The present cropping intensity of this union is 213% and major cropping patterns of this union are shown below
Table: Cropping pattern of Madarbunia Union
Major cropping pattern Area (Ha)
% of NCA
Cropping intensity (%)
Pulse/Chilli/Oilseed/S.Potato-Fallow-T.aman (LIV/HYV)
685 34
176
Fallow-T.aus((LIV/HYV)-T.aman (LIV/HYV)
780 38
Spices/Pulses/oilseed-T.aus(LIV/HYV)-T.aman(LIV/HYV)
384 19
Annual crops (Sugarcane/Betel leaf/Banana)
45 2
Fallow-Fallow-T.aman(LIV/HYV) 58 3 Vegetables/Others 88 4
Rabi crops cultivated in this union are: Chilli, Vegetables, Eggplant, Mungbean, Kheshari.
Major problems and its impact
The major problems of this union are:
Water stagnation/drainage congestion Low organic matter content in soil Soil moisture deficit during the dry months Essential plant nutrient deficiency Risk of tidal flood River erosion Saline water intrusion Flood occurred frequently and causes degradation of natural vegetation
and loss of agricultural crops

18.4 Questionnaire for FGD and KII
Blue Gold Program
Business Development Component (C‐4)
Questionnaire for interviews of Input sellers
Polder Number: ____________________________
Date of interview: ________________________
GENERAL INFORMATION OF THE RESPONDENT
Name of Respondent :
Designation :
Name of Enterprise :
Contract Number :
Address :
1. Agriculture Inputs Seller (Seeds)
a. What types seeds (Major) you sell?
Name of crop ___________, Variety _____________, _____________, ______________, ________
Name of crop ___________, Variety _____________, _____________, ______________, ________
Name of crop ___________, Variety _____________, _____________, ______________, ________
Name of crop ___________, Variety _____________, _____________, ______________, ________
Name of crop ___________, Variety _____________, _____________, ______________, ________
Name of crop ___________, Variety _____________, _____________, ______________, ________ _

Name of crop ___________, Variety _____________, _____________, ______________, ________
Name of crop ___________, Variety _____________, _____________, ______________, ________
Name of crop ___________, Variety _____________, _____________, ______________, ________
Name of crop ___________, Variety _____________, _____________, ______________, ________
b. Where do you get/collect seeds?
Company’s seeds/ Own produced seeds/ Collect from Farmers/ Other Sources
Name of Companies _____________, ___________, ___________, ___________ , ______________ c.
Which crops/Seeds have more demand (Seed demand of major crops)?
Name of seeds________________, Variety _______________, Demand _____________ Kg
Name of seeds________________, Variety _______________, Demand _____________ Kg
Name of seeds________________, Variety _______________, Demand _____________ Kg
Name of seeds________________, Variety _______________, Demand _____________ Kg
Name of seeds________________, Variety _______________, Demand _____________ Kg
Name of seeds________________, Variety _______________, Demand _____________ Kg
Name of seeds________________, Variety _______________, Demand _____________ Kg
Name of seeds________________, Variety _______________, Demand _____________ Kg
d. How much you meet the demand of major seeds?
Name of crop ________________ Sold _______kg, Name of crop ______________ _ Sold ________kg,
Name of crop ________________ Sold _______kg, Name of crop ______________ _ Sold ________kg,

Name of crop ________________ Sold _______kg, Name of crop ______________ _ Sold ________kg,
Name of crop ________________ Sold _______kg, Name of crop ______________ _ Sold ________kg,
Name of crop ________________ Sold _______kg, Name of crop ______________ _ Sold ________kg
Name of crop ________________ Sold _______kg, Name of crop ______________ _ Sold ________kg
e. How much yearly turnover of you? About BDT ______________________/ year
f. How much Farmers buy seeds from you?
g. What is your concern and recommendation about the quality of seeds?
h. How do you conform about the quality of seeds?
i. When is the pick period for seeds business?
Period: ___________ to ___________ ; _____________ to ___________ & _________ to __________
Transaction amount in the pick season:
j. Is there any complain of about seeds’ quality?

K. What types of complain you get about seed’s quality?
l. How do you manage the raised complain?
m. What will be the good solution (as your consideration)? How ensure the good quality seeds?
3. Finance and Income
a. Where do you usually get financial support?
Govt. Bank/Private Bank/ NGO/ Local Money investor/ Relatives/Others

b. Is their interest rate rational?
c. Is there any others way to get financial support to run the business?
d. Is there any scope to expand the present business/ increase market share and how?
e. Overall comments about seeds business:
4. Agriculture Inputs Seller (Fertilizer & Pesticides)
a. What type fertilizers (Major) you sell?
b. What type pesticides (Major) you sell?
Insecticides:

Fungicides:
Herbicide:
b. Where do you get/collect pesticides?
Name of Company:
Name of Distributor:
Whole sellers/Dealer:
d. How much you meet the demand of pesticides?
e. How much yearly turnover of you? About BDT ______________________/ year
f. How much Farmers buy pesticides from you?
g. What is your concern and recommendation about the quality of fertilizers?

h. How do you conform about the quality of fertilizers?
i. When is the pick period for pesticides business?
Period: ___________ to ___________ ; _____________ to ___________ & _________ to __________
Transaction amount in the pick season:
j. Is there any complain of about fertilizers’ quality?
K. What types of complain you get about fertilizer’s quality?
l. How do you manage the raised complain?
m. What will be the good solution (as your consideration)? How ensure the good quality seeds?

5. Finance and Income
a. Where do you usually get financial support?
Govt. Bank/Private Bank/ NGO/ Local Money investor/ Relatives/Others
b. Is their interest rate rational?
c. Is there any others way to get financial support to run the business?
d. Is there any scope to expand the present business/ increase market share and how?
e. Overall comments about seeds business:

6. Fish Inputs Seller (Feed & Medicine)
a. What type feeds (Major) you sell?
Name of Brand and company:
Name of Brand and company:
Name of Brand and company:
Name of Brand and company:
Name of Brand and company:
Name of Brand and company:
b. What type medicine (Major) you sell?
Name of Brand and company:
Name of Brand and company:

Name of Brand and company:
Name of Brand and company:
Name of Brand and company:
Name of Brand and company:
b. Where do you get/collect feed and medicines?
Name of Company:
Name of Distributor:
Whole sellers/Dealer:
c. How much you meet the demand of fish feed?
d. How much yearly turnover of you? About BDT ______________________/ year
e. How much Farmers buy fish feed from you?
f. What is your concern and recommendation about the quality of fish feed and medicine?

g. How do you conform about the quality of fish feed?
h. When is the pick period for fish feed business?
Period: ___________ to ___________ ; _____________ to ___________ & _________ to __________
Transaction amount in the pick season:
i. Is there any complain of about quality of fish feed?
j. What types of complain you get about feed’s quality?
k. How do you manage the raised complain?
l. What will be the good solution (as your consideration)? How ensure the good quality seeds?

5. Finance and Income
a. Where do you usually get financial support?
Govt. Bank/Private Bank/ NGO/ Local Money investor/ Relatives/Others
b. Is their interest rate rational?
c. Is there any others way/means to get financial support to run the business?
d. Is there any scope to expand the present business/ increase market share and how?
e. Overall comments about fish feed business:
Blue Gold Program
Business Development Component (C‐4)
Questionnaire for interviews of Hat/Bazar Toll collector
Polder Number: ____________________________
Date of interview: ________________________
GENERAL INFORMATION OF THE RESPONDENT
Name of Respondent :
Designation :
Name of Enterprise :

Contract Number :
Address :
1. What day held the hat/bazaar?
2. How much outside buyers come for Mung bean purchase?
3. How much local buyers for Mung bean purchase?
4. How much amount (mt) of Mung bean transacted at the market day?
5. What is the Price of Mung bean? BDT _________/mt.
6. What is the toll rate for mung bean?
7. Where go the Commodity (Mung bean)?

Blue Gold Program
Business Development Component (C‐4)
Questionnaire for interviews of Service providers/SAAO
Polder Number: ____________________________
Date of interview: ________________________
GENERAL INFORMATION OF SERVICE PRODUCERS/ SAAO
Name of Service provider : :
Designation :
Contact Number :
Address :
1. Geographical Location of the Polder
North: South:
West: East:
List of Villages:
2. Source of Water for Irrigation
a. How many hectare of land under irrigation?

b. What are the main sources of water for irrigation?
c. Have any problem about irrigation?
d. What is the quality of underground water?
e. What are the problems of irrigation water?
f. What will be the solutions?
3. Agriculture Land Information
a. What is the land topography?
High land ‐‐‐‐‐‐‐‐‐‐‐‐‐‐‐‐‐ ha, Medium high land ‐‐‐‐‐‐‐‐‐‐‐‐‐‐‐‐‐‐ ha, Low land‐‐‐‐‐‐‐‐‐‐‐‐‐‐‐ ha, Very low land ‐‐
‐‐‐‐‐‐‐‐‐‐‐‐‐‐‐‐‐‐ ha
b. What are the land types?
Clay ‐‐‐‐‐‐‐‐‐‐‐‐‐ ha, Clay loom‐‐‐‐‐‐‐‐‐‐‐‐‐‐‐ ha, Loom ‐‐‐‐‐‐‐‐‐‐‐‐‐‐ ha, Slit loom ‐‐‐‐‐‐‐‐‐‐‐‐‐‐‐ ha, Sandy loom ‐‐‐
‐‐‐‐‐‐‐‐‐‐‐‐‐ ha, Sandy ‐‐‐‐‐‐‐‐‐‐‐‐ ha
4. Land utilization
Single crop land ‐‐‐‐‐‐‐‐‐‐‐‐‐‐‐‐‐‐‐ ha, Double crop land ‐‐‐‐‐‐‐‐‐‐‐‐ ha, Triple crop land ‐‐‐‐‐‐‐‐‐‐‐‐‐‐‐‐‐ ha
a. What about major crop wise land distribution?
i. T‐Aman Rice: _________ ha, ii. Boro Rice _______ ha, iii, Pulse (Mung bean, Lentil, ‐‐‐‐‐‐‐‐‐‐‐‐‐‐‐‐‐‐‐‐‐‐
‐‐‐‐‐‐‐‐‐‐‐‐‐‐‐‐‐‐‐‐‐‐‐‐‐‐‐‐‐‐) ____________ ha, Oil seed (_‐‐‐‐‐‐‐‐‐‐‐‐‐‐‐‐‐‐‐‐‐‐‐‐‐‐‐‐‐‐‐‐‐‐‐‐‐‐‐‐‐‐‐‐‐‐‐‐‐‐‐)

____________ ha, Vegetables (‐‐‐‐‐‐‐‐‐‐‐‐‐‐‐‐‐‐‐‐‐‐‐‐‐‐‐‐‐‐‐‐‐‐‐‐‐‐‐‐‐‐‐‐‐‐‐‐‐‐‐‐‐‐‐‐‐‐‐‐‐‐‐‐‐‐‐‐‐‐‐‐‐‐‐‐‐‐‐‐‐‐‐‐)
____________ ha, Others __________________________________________________________
______________________________________________________________________________
ii. What about Homestead Land?
a. Total Area _____________ ha, Maximum (individual) area _____________ dec., Minimum
(individual) area_____________ dec., Average area _______________ dec.
5. Land Ownership and Farm size
a. What are the ownership types of cultivated land?
Own ownership _____________ ha, Lease (>1year)___________ha, Lease (for 1year)___________ha,
Share cropped ______________ ha, Others_____________________________________________
b. What is the classification of HHs based on their farm size?
Large/big farmer no.____________ land size __________ __________, Medium no. _________
land size ___________ ______________, Small farmer no. ___________ land size _____________
______________, Marginal farmer no. __________ land size _____________ _______________,
Landless farmer no. ___________ land size ____________ ________________, and Other (local
classification) land size _____________________ ___________________
6. Homestead related information
a. Total homestead area? ____________ ha

b. What types of major crops are produced at homestead and their amount?
c. What types of input required for homestead productions?
d. How much seeds required for homestead productions?
e. How much fertilizers required for homestead agri. productions?
7. Agriculture production (Field crop)
a. What are the major cropping patterns (Systems)?
i.
ii.
iii.
iv.
v.
b. What is the production of Major crops?

Name of crop_________________, Total Production ____________ mt, Production share ________ %
Name of crop_________________, Total Production ____________ mt, Production share ________ %
Name of crop_________________, Total Production ____________ mt, Production share ________ %
Name of crop_________________, Total Production ____________ mt, Production share ________ %
Name of crop_________________, Total Production ____________ mt, Production share ________ %
Name of crop_________________, Total Production ____________ mt, Production share ________ %
c. What is the supply chain facilities/backward linkages?
Where do farmers get seeds?
How do farmers know the quality seeds?
Where do farmers get fertilizers?
How do farmers know the quality fertilizers?
How much Seed Dealers in this polder (43/2A, 2D, 2F)?
d. What are the demands of major seeds?
Name of seeds _____________, Demand ___________ kg, Name of seeds___________, Demand
___________ kg, Name of seeds __________________, Demand ___________ kg,
Name of seeds___________, Demand ___________ kg, Name of seeds __________________, Demand
___________ kg, Name of seeds __________________, Demand ___________ kg,
Name of seeds __________________, Demand ___________ kg,

e. How do meet‐up the major seeds’ demands?
Name of crop _________________, Total demand __________kg, Own sources______________,
Purchase from market_____________; Name of crop _________________, Total demand
__________kg, Own sources______________, Purchase from market_____________ ; Name of crop
_________________, Total demand __________kg, Own sources______________, Purchase from
market_____________; Name of crop _________________, Total demand __________kg, Own
sources______________, Purchase from market_____________
f. What is your concern and recommendation about quality of presently used seeds?
g. How may available quality seeds in the locality (as consideration)?
h. What is your concern and recommendation about the quality of presently used fertilizers?
i. What are the main challenges/problems do you think on crop cultivation at polder 43/2A, 2D, 2F?

j. How overcome the above stated challenges/problems?
8. Information regarding Labor distribution
Total labor forces ______________, Agriculture __________, Fish culture/fishing____________,
Livestock rearing ____________, Wage sells in non‐agri. work_____________, others ____________
___________ ______________ ___________________ ___________________ ____________
a. Where (in which sector) do needed major labor required?
9. Market/Business related information
a. How much selling spots/market (Hat, Bazar) in Polder 43/2A, 2D, 2F?

b. How much amount of major commodities is transitioned in each market day at selling point?
Name of commodity___________________, amount ___________ mt; Name of commodity
___________________, amount _______________ mt; Name of commodity___________________,
amount _______________ mt; Name of commodity___________________, amount _______________
mt; Name of commodity___________________, amount _______________ mt
c. Who are the main buyers (selected 2‐3 commodities) and what no. of them?
d. What is the procurement system? Credit sale ___________, Cash___________, Other _________
e. Do you think that producers/farmers are getting fair price?
f. If not, then why?
g. What may be done for getting fair price?
h. Have any processer (formal market) and who, where?
g. Is there any barriers for farmers to access in these markets (Tax, toll, levies, syndicate etc.)?
h. Have any distance market and farmers get access in that market?
i. Do you think market is saturated or demand not fulfills (some selected commodity)?
10. Gender related Information
a. Do the Women involve with agriculture production? Yes No
b. Which activities are performed by women?
c. Is there any problem to do their jobs?

d. Is there any scope of women to involve with business activities?
e. If yes. What types of problems/issues may arise?
f. How may solve the raised problems/issues?
11. Consumption related information
a. How much amount consumed of production by the HH members?
Rice____________; Pulse______________; Oil seeds ___________; Vegetables ____________
Specially Mung bean _____________
12. Further improvement of Mung bean
a. What are the existing used varieties of Mung bean? Local □ Gorjon □ HYV □
BARI □ others …………………………………..
b. Is the present used seeds enough for quality?

c. Is there any gap in cultivation practices?
d. How overcome the gaps?
13. Finance and Income
a. Where usually farmers get financial support?
b. Is their interest rate rational?
c. Is there any others way to give financial support to the producers/farmers?
d. Do the Mung bean cultivation is profitable?
e. Do you have any idea to improve mung bean cultivation for making profitable?

Blue Gold Program
Business Development Component (C‐4)
Questionnaire for interviews of Fish Service providers/DOF
Polder Number: ____________________________
Date of interview: ________________________
GENERAL INFORMATION OF FIDH SERVICE PRODUCERS/ DOF
Name of Service provider : :
Designation :
Contact Number :
Address :
1.Aquaculture Resources
A. Water body and farmers
Ponds no. ________ Water body/area __________ ha; Khal/Cannel no. ________, area _________ ha,
Gher no. _______, area _________ ha; Fish farmers total no. _________, Tilapia farmers no. _______,
Cultured area _________ ha, Pangas farmers no. __________, cultured area________ ha, Carps’
farmers no. ________, Cultured area _________ ha, others farmers no. ________, area _________ ha
B. Fish Seeds/Fry/Fingerlings Sources
Hatchery no. ______________, Production capacity _____________________ _________________
Nursery no. __________ , Production/Capacity ______________________ ____________________

Ice factory no. ___________, Capacity ________________, Fish selling points no. _____________
Fish market no. _____________, Processing plant no. _________, Capacity __________________ No.
of Fry traders__________, No. of Fish feed sellers ________, No. of Fish medicine sellers ______ , others
inputs (Lime, fertilizers, oil cake etc.) sellers no. _____________
2. Input supply chain related information
a. where do farmers get fish fry/fingerlings/seeds?
How much no. of Fry/fingerlings sellers?
How much they sell?
b. Is the available fish fry/fingerlings/seeds are good quality?
c. What do you think fish fry/fingerlings/seeds price? Is it fair or not?
d. What are the problems to get the good quality fish seed/fry/fingerlings?
e. How may overcome the mentioned problems?

f. Where does farmer get fish feeds?
How much no. of feed sellers?
What amount they sell?
g. Do the available fish feeds are good quality?
h. How do farmers know the good quality feed?
g. Does the price of fish feed is fair?
3. Production related information
a. What types of fish are cultured in Polder 43/2A, 2D, 2F?
b. Information about major species
Total cultured area _________ha, total fish production ___________ mt, Yield _________ mt/ha
Tilapia: area___________ ha, Yield (mt/ha) ____________, Total production ___________ mt
Pangus: area___________ ha, Yield (mt/ha) ____________, Total production ___________ mt

Common Carp: area___________ ha, Yield (mt/ha) ____________, Total production ___________ mt
Indigenous species: area___________ ha, Yield (mt/ha) _________, Total production __________ mt
Prawn/shrimp: area___________ ha, Yield (mt/ha) __________, Total production ___________ mt.
Others (___________________ ): area______ ha, Yield (mt/ha) _______, Total production ______ mt.
c. What’s amount demand of Tiliapia fry?
d. How much amount feed demand in this polder?
5 Ownership types and Farm size
a. What are the ownership types of cultivated land?
Own pond _____________ ha, Lease (>1year)___________ha, Lease (for 1year)___________ha,
Others_____________________________________________
b. What is the pond size?
Large/big pond no.________ pond size _________ to _________ dec., Medium pond no. _______
pond size ________ _________dec., Small pond no. ________ pond size ________ _______ dec.,
very small pond no. ________ pond size ________ __________ dec. and Other classification
(_______________ )pond no. _________, pond size ________ _________ dec.
6. Output related information
a. Where do farmers sell their fish? No. of markets/selling points ____________, names
_____________________________________________________________________________________

_____________________________________________________________________________________
_______________________________________________________________________________
b. What is the transaction volume of fish in each market day? ___________ mt/market day
c. How much buyers are present in the market?
Local buyers/Bapary no. ________, Out sider buyers/Bapary no. _______, Retailers no. ________
d. Do you think Farmers (Producers) get fair price?
e. If not. What may be the causes for not getting fair price?
f. How do farmers could get fair price (as your consideration)?
d. What is the procurement/payment system? Credit sale ________, Cash sale________,
Other________
6. Challenges/ problems in Tilapia culture
a. What are the major challenges/problems in Tilapia culture?

b. How can be overcome the above mentioned problems/challenges?
c. What may be the opportunity in Tilapia culture?
11. Consumption related information
a. How much amount consumed of produced fish (%) by the HH members?
b.
13. Finance and Income
a. Where usually farmers get financial support for fish culture?

b. Is there any problem to get financial support from IMF?
c. Do you think that NGO’s loan is higher interest?
d. Do you think Tilapia cultivation is profitable?
e. Do you have any idea to improve Tilapia culture for making profit?

Blue Gold Program
Business Development Component (C-4)
Questionnaire- for interviews of Fish farmers
Polder Number: ____________________________
Date of interview: ________________________
GENERAL BACKGROUND OF THE FISH FARMERS
Farmer's Name :
Father's Name :
Contact Number :
Village :
Union :
WMG Name :

Upazilla :
District :
1. Identification of Respondent
a. Female □ Male □ Youth □ Adult □ Age_________________________
b. Woman (single) □ Woman married □ Man single □ Man married □
c. Main income sources of household? _______________________________________________________
d. Landowning household: Yes □ No □ if yes, how much land (Decimal)?
____________________ If yes, who in your household owns the land? _______________________________________________
2. Production

g. In how many decimal of pond do you culture/rear fish/fingerling? __________________________________________________________
h. What are the main challenges/problems do you face in Fish culture? ________________ ____________________________________________________________________________________
____________________________________________________________________________________
__________________________________________________________________________________
____________________________________________________________________________________
i. What type of seed/fingerling/fry/spawn do you generally use?
Local □ Mono sex □ GIFT □ BFRI □ others …………………………………..
Why or why not? ______________________________________________________________________________
j. Do you change water? Yes □ No □
why or why not ? _____________________________________________________________ ________________________________________________________________________________________________________________________________________________________________________

k. Do you provide slary/fertilizer/other input? Yes □ No □
Why or why not?
No money to pay □ too expensive □ not available □ Don’t know what is good □
Others (explain):______________________________________________________________________
____________________________________________________________________________________
l. What is your Tilapia/fish production per year? Per Decimal? ______________________________________________________
m. Where can you get information about better cultivation practice? Television □ Radio □
Leaflet □ Posters □ Religious Leader □ Newspaper □ Seed seller □ SAAO □ Schools □ Friends/Neighbors □ NGO □ Bepari/Faria/Agent □ Other:
_______________ ____________________________________________________________________________________
n. Do you have preserve/storage facility for Tilapia/fish? Yes□ No□
o. Who take the decision regarding Tilapia/fish sales? How?

p. How do you determine the right Price for Tilapia/fish?
3. Support Service regarding Production Technology/Use of proper inputs related Questions
a. Are support services (regarding production/input) available? Yes□ No□ b. Where you find them? DAE □ NGO□ Others□
c. What services? (explain) _______________________________________ ____________________________________________________________________________________
d. Do you have to pay for services? __________________ __________________________________________________________________________
__________
e. What do you think about the quality of the services __________________________________________ __________________________________________________________________________
__________
4. Selling / Consumption Questions
a. Do you sell Tilapia/fish? Yes □ No □ Occasionally □
If occasionally, selling season(s):

If yes, how much quantity (kg): ______________ Sales price (per kg, Last year) (Tk.): _____________
____________________________________________________________________________________
b. To whom do you sell the Tilapia/fish/fingerling (could be to multiple buyers)? Other
Households □ Traders/Bepari/Paiker/Agent/Faria/Collector □ Cooperative □ Collection Centre/Aroth □ Candy maker □ Processor □ Others
(explain)________ ____________________________________________________________________________________
c. Have you built any relationship with your buyer (any verbal/written contract)? _____________________ ________________________________________________________________________________________________________________________________________________________________________
d. If you sell Tilapia/fish/fingerling/fry/spawn to outside market, how far is the selling place? ________________________________________ ____________________________________________________________________________________
e. How do you go to that market place (means of transport)? And required time and cost for it: _______________ ________________________________________________________________________________________________________________________________________________________________________

f. Who determines the price of your Tilapia/fish/fingerling/fry and How (if he knows how)? _____________________________ ________________________________________________________________________________________________________________________________________________________________________
g. Is there any price fluctuation occurs? Yes □ No □
If yes, why and when? _________________________________________________________________
____________________________________________________________________________________
h. Are you satisfied with your Tilapia/fish/fingerling/fry/spawn selling price? Yes □ No □ reason_______________________________________________________________________________
________________________________________________________________________________________________________________________________________________________________________
i. What problems do you face in selling your Tilapia/fish/fingerling/fry/spawn?
Low price □ No buyers □ No appropriate grading □ Fish is poor quality □ Moisture
content/foreign material □ No transportation □ Long distance to market □ Other
(explain): _____________________

____________________________________________________________________________________
j. Do you sell Tilapia/fish/fingerling/fry/spawn year round? Yes □ No □ If no, then why? ______________________________________________________________________ ____________________________________________________________________________________
k. If you consume Tilapia/fish, at how much quantity do you keep for it? _________________________________
l. How do you make this decision? __________________________________________________________ ____________________________________________________________________________________
m. Who sells the Tilapia/fish/fingerling/fry?
Husband □ Wife □ Female household head □ Other
(explain) ______________
____________________________________________________________________________________
5. Ownership / Income /Finance Questions

a. Who are the owners of the income from Tilapia/fish/fingerling/fry/spawn? _______________________________________________________
b. Who controls the income coming from sale? Husband □ Wife □ Jointly (husband
and wife both) □Other (explain) ___________________________________
c. Do any other family member can play role for decision making in spending the income coming from sale?
Yes □ No □ If yes, who
__________________________________________________________
d. Do you know about any money lending/micro-credit organization in your area? Yes □
No □
If yes, who are they? __________________________________________________________________
________________________________________________________________________________________________________________________________________________________________________
e. Do you need credit? Yes □ No □ If yes, do you have access to that credit service?
Yes □ No □
If no, then why? ______________________________________________________________________
________________________________________________________________________________________________________________________________________________________________________
f. If you have had the credit/loan, what is the interest rate? _____________________________________

For what purpose you use the lend money? _________________________________________________
Do you face any problem in getting loan (explain): ___________________________________________
____________________________________________________________________________________
g. Who make the decision on taking and spending of credit/loan?
Husband □ Wife □ Others
______________________________________________
6. Environmental Questions
a. What do you do with the residue of fish (plant/Seed)? ______________________________________________________ ____________________________________________________________________________________
b. What are the main weather shocks/natural disasters in this polder that you experienced during Tilapia/fish/fingerling/fry/spawn culture period? ____________________________________________________________________________________ ____________________________________________________________________________________
c. Do you think salinity is a problem for Tilapia/fish culture?
7. General Questions
a. Do you face any other problem(s) regarding your Tilapia/fish production/sales? __________________________________ __________________________________________________________________________
__________Is there any producer groups/cooperatives? Yes □ No □
b. Are you a member of those groups/cooperatives? Yes □ No □ If yes, what type of service do you get from that? ________________________________________________________________________________________________________________________________________________________________________
c. Please comment on Tilapia/fish/fingerling/fry/spawn?
Interviewer Name: __________________ Signature :-------------------------: Date:


![Crítica à Execução Penal [2a edição]](https://static.fdokumen.com/doc/165x107/631ae641d43f4e176304a750/critica-a-execucao-penal-2a-edicao.jpg)