Massachusetts Electric Company and Nantucket ... - MA EEAC
65
June 8, 2018 Via Hand Delivery and E-mail Mark D. Marini, Secretary Department of Public Utilities One South Station, 5 th Floor Boston, MA 02110 Re: Massachusetts Electric Company and Nantucket Electric Company each d/b/a National Grid, D.P.U. 18-51; 2017 Plan Year Report Dear Secretary Marini: On behalf of Massachusetts Electric Company and Nantucket Electric Company each d/b/a National Grid (the “Company”), enclosed is the Company’s 2017 Energy Efficiency Plan-Year Report for filing with the Department of Public Utilities (the “Department”). 1 Plan Year 2017 was the second year of implementation under the 2016-2018 Massachusetts Joint Statewide Three-Year Electric and Gas Energy Efficiency Plan, as reviewed and approved by the Department in D.P.U. 15-160 through D.P.U. 15-169. In 2017, the Massachusetts Energy Efficiency Program Administrators 2 (the “Program Administrators”) successfully delivered on very ambitious energy savings goals for the year. Statewide, the electric Program Administrators achieved 107 percent of the lifetime electric savings goal, and 100 percent of planned total benefits in 2017. The gas Program Administrators achieved 98 percent of the lifetime gas savings goal, and 99 percent of planned total benefits statewide in 2017. The Program Administrators achieved these aggressive savings goals and 1 This report is being submitted pursuant to the Hearing Officer’s Memorandum dated May 2, 2014 adopting the Energy Efficiency Plan-Year Report Template in D.P.U. 11-120-A, Phase II. 2 The Massachusetts Program Administrators are: Bay State Gas Company, d/b/a Columbia Gas of Massachusetts; The Berkshire Gas Company; Boston Gas Company, Colonial Gas Company, Massachusetts Electric Company and Nantucket Electric Company each d/b/a National Grid; Cape Light Compact JPE; Fitchburg Gas and Electric Light Company d/b/a Unitil; NSTAR Electric Company and NSTAR Gas Company, each d/b/a Eversource Energy; and Liberty Utilities (New England Natural Gas Company) Corp. d/b/a Liberty Utilities. 40 Sylvan Road, Waltham, MA 02451 T: 781.907.1833 F: 781.296.8091 [email protected] www.nationalgrid.com Stacey M. Donnelly Senior Counsel
-
Upload
khangminh22 -
Category
Documents
-
view
1 -
download
0
Transcript of Massachusetts Electric Company and Nantucket ... - MA EEAC
June 8, 2018
Via Hand Delivery and E-mail
Mark D. Marini, Secretary
Department of Public Utilities
One South Station, 5th
Floor
Boston, MA 02110
Re: Massachusetts Electric Company and Nantucket Electric Company each d/b/a
National Grid, D.P.U. 18-51; 2017 Plan Year Report
Dear Secretary Marini:
On behalf of Massachusetts Electric Company and Nantucket Electric Company each d/b/a
National Grid (the “Company”), enclosed is the Company’s 2017 Energy Efficiency Plan-Year
Report for filing with the Department of Public Utilities (the “Department”).1 Plan Year 2017 was
the second year of implementation under the 2016-2018 Massachusetts Joint Statewide Three-Year
Electric and Gas Energy Efficiency Plan, as reviewed and approved by the Department in D.P.U.
15-160 through D.P.U. 15-169.
In 2017, the Massachusetts Energy Efficiency Program Administrators2 (the “Program
Administrators”) successfully delivered on very ambitious energy savings goals for the year.
Statewide, the electric Program Administrators achieved 107 percent of the lifetime electric
savings goal, and 100 percent of planned total benefits in 2017. The gas Program Administrators
achieved 98 percent of the lifetime gas savings goal, and 99 percent of planned total benefits
statewide in 2017. The Program Administrators achieved these aggressive savings goals and
1 This report is being submitted pursuant to the Hearing Officer’s Memorandum dated May 2, 2014 adopting
the Energy Efficiency Plan-Year Report Template in D.P.U. 11-120-A, Phase II.
2 The Massachusetts Program Administrators are: Bay State Gas Company, d/b/a Columbia Gas of
Massachusetts; The Berkshire Gas Company; Boston Gas Company, Colonial Gas Company, Massachusetts
Electric Company and Nantucket Electric Company each d/b/a National Grid; Cape Light Compact JPE;
Fitchburg Gas and Electric Light Company d/b/a Unitil; NSTAR Electric Company and NSTAR Gas
Company, each d/b/a Eversource Energy; and Liberty Utilities (New England Natural Gas Company) Corp.
d/b/a Liberty Utilities.
40 Sylvan Road, Waltham, MA 02451
T: 781.907.1833F: [email protected] www.nationalgrid.com
Stacey M. Donnelly
Senior Counsel

Mark D. Marini, Secretary
June 8, 2018
Page 2
benefits while maintaining budgetary control and complying with the directive of the Green
Communities Act to seek all available cost-effective energy efficiency opportunities. Additionally,
the Program Administrators achieved great success in their low-income programs. By working
with the Low-Income Energy Affordability Network and increasing targeted marketing, all
statewide electric and gas savings, benefits, and participation targets for this important sector were
exceeded in 2017.
The Program Administrators took many actions in 2017 to serve customers and achieve
energy efficiency goals. Program Administrators provided optimized offerings to renters and
moderate income customers to continue seeking ways to meet the needs of all customers. In order
ensure consistency in offerings statewide, the Program Administrators established a consistent
statewide approach to small and mid-size Commercial and Industrial (“C&I”) new construction
projects. Program Administrators also concluded a review of small business turnkey delivery
programs across North America in order to ensure that they are using the most successful delivery
models. Additionally, the MassSave.com website was revamped in 2017 to provide Massachusetts
residents and businesses with a modern, personalized resource that encourages participation in the
Program Administrators’ energy efficiency programs, and puts ease-of-use, speed, and reliability
front and center. Other efforts to encourage customer adoption of energy efficiency included the
Program Administrators undertaking many promotions, such as a promotion for communicating
thermostats. The Program Administrators also received the ENERGY STAR® Partner of the Year
Award for excellence in energy efficiency program delivery for the Residential Lighting &
Products core initiative. This is the fourth consecutive year the Program Administrators have been
honored with the Environmental Protection Agency’s most prestigious award that recognizes the
success and innovativeness of the Program Administrators’ efforts to increase the adoption of
energy efficient products in Massachusetts.
To support innovation, the Program Administrators launched an online rebate application
platform that provides C&I customers with a fully digital means to search for offers and apply for
incentives, replacing the former paper-based system. The intuitive design allows customers to
browse through offers and guides them through the application process while connecting them to
additional recommended energy efficiency measures. Additionally, the Program Administrators’
Massachusetts Technology Assessment Committee reviewed over 30 new technologies, adding
seven new technologies as eligible custom measures. The Program Administrators also continued
to implement their Demand Response Demonstration Projects in 2017, and worked with various
demand response consultants, equipment vendors, installers, and other vendors.
These accomplishments demonstrate the Program Administrators’ continued commitment
throughout 2017 to achieving sustainable cost-effective energy efficiency, as well as the Program
Administrators’ commitment to leveraging relationships with customers, contractors, and other
vendors and stakeholders to coordinate efforts, share ideas and best practices, and serve customers.
Mark D. Marini, Secretary
June 8, 2018
Page 3
The Program Administrators look forward to continuing these efforts and achieving
additional successes going forward.
Very truly yours,
Stacey M. Donnelly
Enclosures
cc: Jeffrey Leupold, Department of Public Utilities
Donald Boecke, Office of the Attorney General
Rachel Graham Evans, Department of Energy Resources
Jerrold Oppenheim, Low-Income Energy Affordability Network
Members of the Energy Efficiency Advisory Council (via email only)
Massachusetts Electric Company and
Nantucket Electric Company
d/b/a National Grid
2017
Energy Efficiency Plan-Year Report
D.P.U. 18-51
June 8, 2018

Massachusetts Electric Company and Nantucket Electric Company
d/b/a National Grid
2017 Energy Efficiency Plan-Year Report
D.P.U. 18-51
June 8, 2018
Table of Contents
2017 PLAN YEAR REPORT DATA TABLES
Appendix 1: Significant Core Initiative Variances & Cost-Effectiveness
Appendix 2: Benefit-Cost Ratio Screening Tool
Appendix 3: Technical Reference Manual – 2017 Report Version
Appendix 4: Statewide Evaluation Studies Summary
Appendix 4A - Table of Evaluation Studies
Appendix 4B - Summary of the Studies with the Most Significant Effects
Appendix 4C - Evaluation Study Summaries
Appendix 4D - 2017 Plan-Year Report Evaluation Studies
Appendix 5: Performance Incentives
Appendix 6: Demand Reduction Update
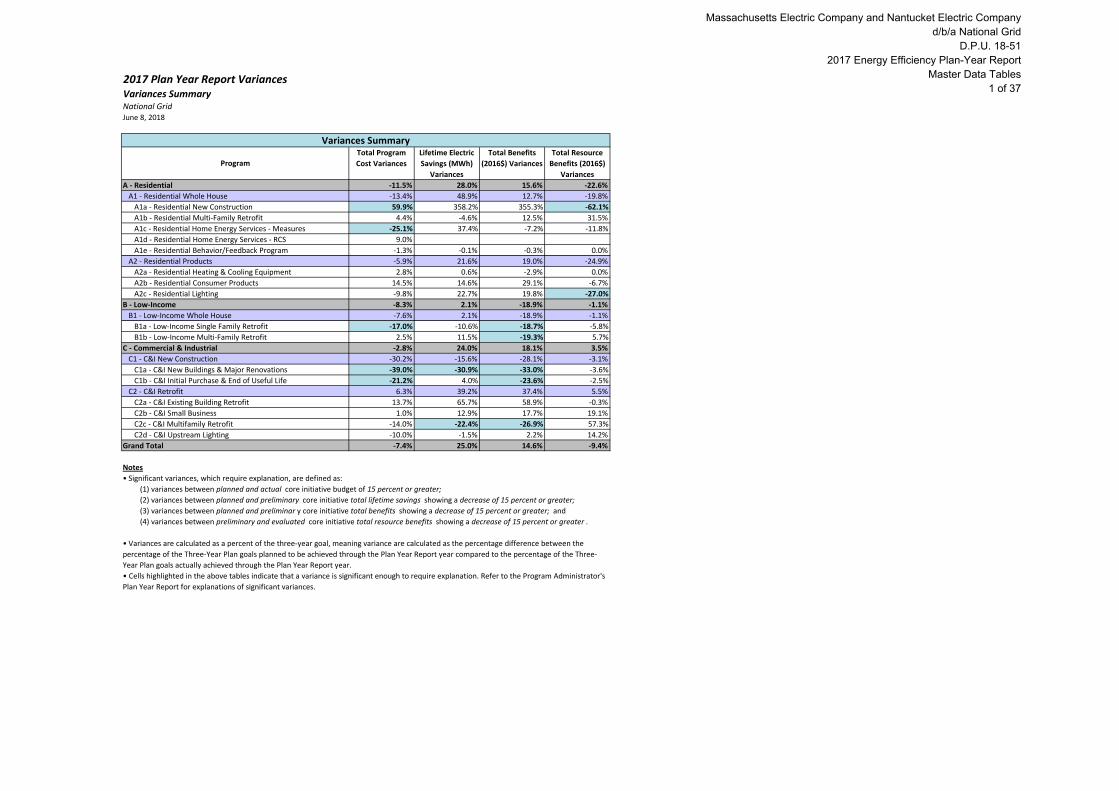
2017 Plan Year Report VariancesVariances SummaryNational GridJune 8, 2018
A - Residential -11.5% 28.0% 15.6% -22.6%
A1 - Residential Whole House -13.4% 48.9% 12.7% -19.8%
A1a - Residential New Construction 59.9% 358.2% 355.3% -62.1%
A1b - Residential Multi-Family Retrofit 4.4% -4.6% 12.5% 31.5%
A1c - Residential Home Energy Services - Measures -25.1% 37.4% -7.2% -11.8%
A1d - Residential Home Energy Services - RCS 9.0%
A1e - Residential Behavior/Feedback Program -1.3% -0.1% -0.3% 0.0%
A2 - Residential Products -5.9% 21.6% 19.0% -24.9%
A2a - Residential Heating & Cooling Equipment 2.8% 0.6% -2.9% 0.0%
A2b - Residential Consumer Products 14.5% 14.6% 29.1% -6.7%
A2c - Residential Lighting -9.8% 22.7% 19.8% -27.0%
B - Low-Income -8.3% 2.1% -18.9% -1.1%
B1 - Low-Income Whole House -7.6% 2.1% -18.9% -1.1%
B1a - Low-Income Single Family Retrofit -17.0% -10.6% -18.7% -5.8%
B1b - Low-Income Multi-Family Retrofit 2.5% 11.5% -19.3% 5.7%
C - Commercial & Industrial -2.8% 24.0% 18.1% 3.5%
C1 - C&I New Construction -30.2% -15.6% -28.1% -3.1%
C1a - C&I New Buildings & Major Renovations -39.0% -30.9% -33.0% -3.6%
C1b - C&I Initial Purchase & End of Useful Life -21.2% 4.0% -23.6% -2.5%
C2 - C&I Retrofit 6.3% 39.2% 37.4% 5.5%
C2a - C&I Existing Building Retrofit 13.7% 65.7% 58.9% -0.3%
C2b - C&I Small Business 1.0% 12.9% 17.7% 19.1%
C2c - C&I Multifamily Retrofit -14.0% -22.4% -26.9% 57.3%
C2d - C&I Upstream Lighting -10.0% -1.5% 2.2% 14.2%
Grand Total -7.4% 25.0% 14.6% -9.4%
Notes
• Significant variances, which require explanation, are defined as:
(1) variances between planned and actual core initiative budget of 15 percent or greater;
(2) variances between planned and preliminary core initiative total lifetime savings showing a decrease of 15 percent or greater;
(3) variances between planned and preliminar y core initiative total benefits showing a decrease of 15 percent or greater; and
(4) variances between preliminary and evaluated core initiative total resource benefits showing a decrease of 15 percent or greater .
Variances Summary
Program
Total Resource
Benefits (2016$)
Variances
Total Program
Cost Variances
Lifetime Electric
Savings (MWh)
Variances
Total Benefits
(2016$) Variances
• Cells highlighted in the above tables indicate that a variance is significant enough to require explanation. Refer to the Program Administrator's
Plan Year Report for explanations of significant variances.
• Variances are calculated as a percent of the three-year goal, meaning variance are calculated as the percentage difference between the
percentage of the Three-Year Plan goals planned to be achieved through the Plan Year Report year compared to the percentage of the Three-
Year Plan goals actually achieved through the Plan Year Report year.
Massachusetts Electric Company and Nantucket Electric Company d/b/a National Grid
D.P.U. 18-512017 Energy Efficiency Plan-Year Report
Master Data Tables1 of 37

2017 Plan Year Report VariancesTotal Program Cost VariancesNational GridJune 8, 2018
2016 2017 2018 2016-2018 2016 2017Planned 2016 +
2017 % Total
Preliminary 2016 +
2017 % Total Plan
Planned v
Preliminary (%)
A - Residential 125,228,251 132,022,746 134,819,235 392,070,232 111,228,657 116,456,980 66% 58% -11.5%
A1 - Residential Whole House 76,754,143 80,419,177 83,449,430 240,622,750 71,929,116 64,157,032 65% 57% -13.4%
A1a - Residential New Construction 3,041,588 3,045,779 3,174,364 9,261,730 4,995,982 4,736,225 66% 105% 59.9%
A1b - Residential Multi-Family Retrofit 10,218,336 10,550,506 10,925,042 31,693,884 13,251,051 8,440,353 66% 68% 4.4%
A1c - Residential Home Energy Services - Measures 51,463,519 54,567,058 56,992,030 163,022,607 41,173,069 38,286,883 65% 49% -25.1%
A1d - Residential Home Energy Services - RCS 5,872,408 6,107,534 6,201,602 18,181,544 6,392,254 6,667,936 66% 72% 9.0%
A1e - Residential Behavior/Feedback Program 6,158,293 6,148,300 6,156,392 18,462,985 6,116,760 6,025,634 67% 66% -1.3%
A2 - Residential Products 36,866,184 39,626,904 39,753,854 116,246,943 29,803,434 42,167,431 66% 62% -5.9%
A2a - Residential Heating & Cooling Equipment 5,202,345 5,444,032 5,664,988 16,311,365 4,944,865 6,000,100 65% 67% 2.8%
A2b - Residential Consumer Products 3,325,564 3,378,864 3,427,697 10,132,126 2,993,837 4,680,253 66% 76% 14.5%
A2c - Residential Lighting 28,338,276 30,804,008 30,661,169 89,803,452 21,864,732 31,487,078 66% 59% -9.8%
B - Low-Income 32,544,343 32,875,646 32,952,695 98,372,684 27,202,456 32,788,448 67% 61% -8.3%
B1 - Low-Income Whole House 31,795,953 32,122,697 32,194,924 96,113,574 26,739,202 32,300,468 67% 61% -7.6%
B1a - Low-Income Single Family Retrofit 16,455,939 16,818,896 16,886,911 50,161,746 14,178,197 13,452,514 66% 55% -17.0%
B1b - Low-Income Multi-Family Retrofit 15,340,014 15,303,801 15,308,013 45,951,828 12,561,005 18,847,955 67% 68% 2.5%
C - Commercial & Industrial 118,663,272 119,855,549 121,031,056 359,549,877 125,683,867 106,246,086 66% 65% -2.8%
C1 - C&I New Construction 25,658,942 28,379,373 31,457,040 85,495,355 18,774,253 18,968,189 63% 44% -30.2%
C1a - C&I New Buildings & Major Renovations 12,869,915 14,270,528 16,044,826 43,185,270 7,054,146 9,500,298 63% 38% -39.0%
C1b - C&I Initial Purchase & End of Useful Life 12,789,027 14,108,844 15,412,214 42,310,085 11,720,107 9,467,892 64% 50% -21.2%
C2 - C&I Retrofit 90,733,262 89,212,271 87,380,211 267,325,744 105,579,369 85,640,213 67% 72% 6.3%
C2a - C&I Existing Building Retrofit 53,845,425 53,559,832 51,305,390 158,710,647 66,298,636 55,783,132 68% 77% 13.7%
C2b - C&I Small Business 19,855,505 20,385,760 20,883,240 61,124,505 22,370,569 18,262,916 66% 66% 1.0%
C2c - C&I Multifamily Retrofit 6,884,791 7,074,225 7,253,611 21,212,627 7,608,977 4,398,415 66% 57% -14.0%
C2d - C&I Upstream Lighting 10,147,541 8,192,454 7,937,969 26,277,964 9,301,188 7,195,751 70% 63% -10.0%
Grand Total 276,435,867 284,753,940 288,802,986 849,992,793 264,114,980 255,491,514 66% 61% -7.4%
Notes
Plan year core initiative significant variance explanations are required for: (1) variances between planned and actual core initiative budget of 15 percent or greater.
Actual Planned v. Preliminary (%)
Total Program Cost Variances
Program
Planned
Massachusetts Electric Company and Nantucket Electric Company d/b/a National Grid
D.P.U. 18-512017 Energy Efficiency Plan-Year Report
Master Data Tables2 of 37
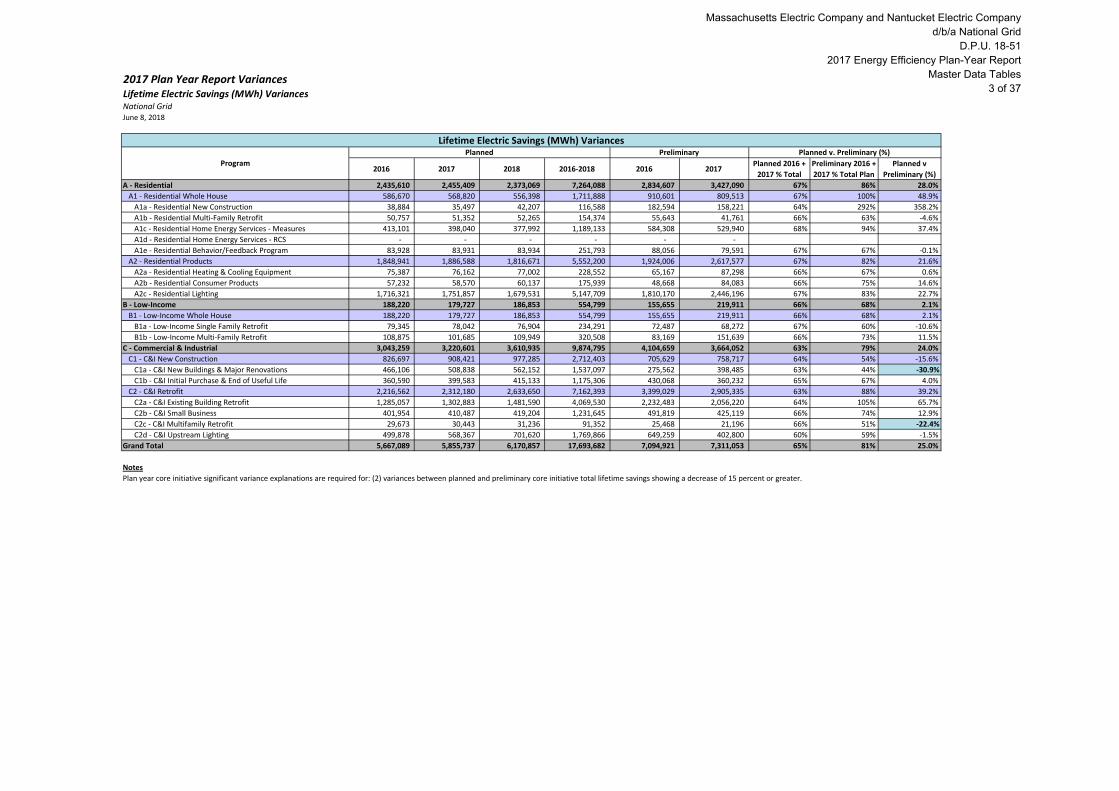
2017 Plan Year Report VariancesLifetime Electric Savings (MWh) VariancesNational GridJune 8, 2018
2016 2017 2018 2016-2018 2016 2017Planned 2016 +
2017 % Total
Preliminary 2016 +
2017 % Total Plan
Planned v
Preliminary (%)
A - Residential 2,435,610 2,455,409 2,373,069 7,264,088 2,834,607 3,427,090 67% 86% 28.0%
A1 - Residential Whole House 586,670 568,820 556,398 1,711,888 910,601 809,513 67% 100% 48.9%
A1a - Residential New Construction 38,884 35,497 42,207 116,588 182,594 158,221 64% 292% 358.2%
A1b - Residential Multi-Family Retrofit 50,757 51,352 52,265 154,374 55,643 41,761 66% 63% -4.6%
A1c - Residential Home Energy Services - Measures 413,101 398,040 377,992 1,189,133 584,308 529,940 68% 94% 37.4%
A1d - Residential Home Energy Services - RCS - - - - - -
A1e - Residential Behavior/Feedback Program 83,928 83,931 83,934 251,793 88,056 79,591 67% 67% -0.1%
A2 - Residential Products 1,848,941 1,886,588 1,816,671 5,552,200 1,924,006 2,617,577 67% 82% 21.6%
A2a - Residential Heating & Cooling Equipment 75,387 76,162 77,002 228,552 65,167 87,298 66% 67% 0.6%
A2b - Residential Consumer Products 57,232 58,570 60,137 175,939 48,668 84,083 66% 75% 14.6%
A2c - Residential Lighting 1,716,321 1,751,857 1,679,531 5,147,709 1,810,170 2,446,196 67% 83% 22.7%
B - Low-Income 188,220 179,727 186,853 554,799 155,655 219,911 66% 68% 2.1%
B1 - Low-Income Whole House 188,220 179,727 186,853 554,799 155,655 219,911 66% 68% 2.1%
B1a - Low-Income Single Family Retrofit 79,345 78,042 76,904 234,291 72,487 68,272 67% 60% -10.6%
B1b - Low-Income Multi-Family Retrofit 108,875 101,685 109,949 320,508 83,169 151,639 66% 73% 11.5%
C - Commercial & Industrial 3,043,259 3,220,601 3,610,935 9,874,795 4,104,659 3,664,052 63% 79% 24.0%
C1 - C&I New Construction 826,697 908,421 977,285 2,712,403 705,629 758,717 64% 54% -15.6%
C1a - C&I New Buildings & Major Renovations 466,106 508,838 562,152 1,537,097 275,562 398,485 63% 44% -30.9%
C1b - C&I Initial Purchase & End of Useful Life 360,590 399,583 415,133 1,175,306 430,068 360,232 65% 67% 4.0%
C2 - C&I Retrofit 2,216,562 2,312,180 2,633,650 7,162,393 3,399,029 2,905,335 63% 88% 39.2%
C2a - C&I Existing Building Retrofit 1,285,057 1,302,883 1,481,590 4,069,530 2,232,483 2,056,220 64% 105% 65.7%
C2b - C&I Small Business 401,954 410,487 419,204 1,231,645 491,819 425,119 66% 74% 12.9%
C2c - C&I Multifamily Retrofit 29,673 30,443 31,236 91,352 25,468 21,196 66% 51% -22.4%
C2d - C&I Upstream Lighting 499,878 568,367 701,620 1,769,866 649,259 402,800 60% 59% -1.5%
Grand Total 5,667,089 5,855,737 6,170,857 17,693,682 7,094,921 7,311,053 65% 81% 25.0%
Notes
Lifetime Electric Savings (MWh) Variances
Program
Planned Preliminary Planned v. Preliminary (%)
Plan year core initiative significant variance explanations are required for: (2) variances between planned and preliminary core initiative total lifetime savings showing a decrease of 15 percent or greater.
Massachusetts Electric Company and Nantucket Electric Company d/b/a National Grid
D.P.U. 18-512017 Energy Efficiency Plan-Year Report
Master Data Tables3 of 37
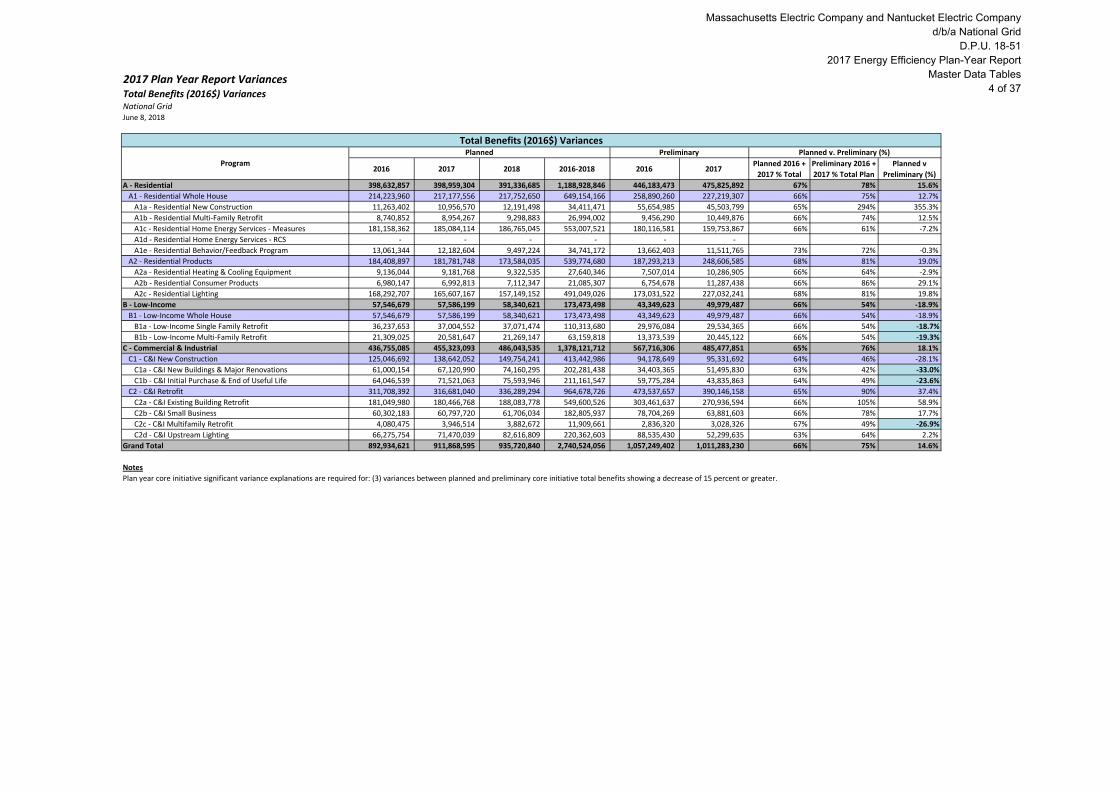
2017 Plan Year Report VariancesTotal Benefits (2016$) VariancesNational GridJune 8, 2018
2016 2017 2018 2016-2018 2016 2017Planned 2016 +
2017 % Total
Preliminary 2016 +
2017 % Total Plan
Planned v
Preliminary (%)
A - Residential 398,632,857 398,959,304 391,336,685 1,188,928,846 446,183,473 475,825,892 67% 78% 15.6%
A1 - Residential Whole House 214,223,960 217,177,556 217,752,650 649,154,166 258,890,260 227,219,307 66% 75% 12.7%
A1a - Residential New Construction 11,263,402 10,956,570 12,191,498 34,411,471 55,654,985 45,503,799 65% 294% 355.3%
A1b - Residential Multi-Family Retrofit 8,740,852 8,954,267 9,298,883 26,994,002 9,456,290 10,449,876 66% 74% 12.5%
A1c - Residential Home Energy Services - Measures 181,158,362 185,084,114 186,765,045 553,007,521 180,116,581 159,753,867 66% 61% -7.2%
A1d - Residential Home Energy Services - RCS - - - - - -
A1e - Residential Behavior/Feedback Program 13,061,344 12,182,604 9,497,224 34,741,172 13,662,403 11,511,765 73% 72% -0.3%
A2 - Residential Products 184,408,897 181,781,748 173,584,035 539,774,680 187,293,213 248,606,585 68% 81% 19.0%
A2a - Residential Heating & Cooling Equipment 9,136,044 9,181,768 9,322,535 27,640,346 7,507,014 10,286,905 66% 64% -2.9%
A2b - Residential Consumer Products 6,980,147 6,992,813 7,112,347 21,085,307 6,754,678 11,287,438 66% 86% 29.1%
A2c - Residential Lighting 168,292,707 165,607,167 157,149,152 491,049,026 173,031,522 227,032,241 68% 81% 19.8%
B - Low-Income 57,546,679 57,586,199 58,340,621 173,473,498 43,349,623 49,979,487 66% 54% -18.9%
B1 - Low-Income Whole House 57,546,679 57,586,199 58,340,621 173,473,498 43,349,623 49,979,487 66% 54% -18.9%
B1a - Low-Income Single Family Retrofit 36,237,653 37,004,552 37,071,474 110,313,680 29,976,084 29,534,365 66% 54% -18.7%
B1b - Low-Income Multi-Family Retrofit 21,309,025 20,581,647 21,269,147 63,159,818 13,373,539 20,445,122 66% 54% -19.3%
C - Commercial & Industrial 436,755,085 455,323,093 486,043,535 1,378,121,712 567,716,306 485,477,851 65% 76% 18.1%
C1 - C&I New Construction 125,046,692 138,642,052 149,754,241 413,442,986 94,178,649 95,331,692 64% 46% -28.1%
C1a - C&I New Buildings & Major Renovations 61,000,154 67,120,990 74,160,295 202,281,438 34,403,365 51,495,830 63% 42% -33.0%
C1b - C&I Initial Purchase & End of Useful Life 64,046,539 71,521,063 75,593,946 211,161,547 59,775,284 43,835,863 64% 49% -23.6%
C2 - C&I Retrofit 311,708,392 316,681,040 336,289,294 964,678,726 473,537,657 390,146,158 65% 90% 37.4%
C2a - C&I Existing Building Retrofit 181,049,980 180,466,768 188,083,778 549,600,526 303,461,637 270,936,594 66% 105% 58.9%
C2b - C&I Small Business 60,302,183 60,797,720 61,706,034 182,805,937 78,704,269 63,881,603 66% 78% 17.7%
C2c - C&I Multifamily Retrofit 4,080,475 3,946,514 3,882,672 11,909,661 2,836,320 3,028,326 67% 49% -26.9%
C2d - C&I Upstream Lighting 66,275,754 71,470,039 82,616,809 220,362,603 88,535,430 52,299,635 63% 64% 2.2%
Grand Total 892,934,621 911,868,595 935,720,840 2,740,524,056 1,057,249,402 1,011,283,230 66% 75% 14.6%
Notes
Plan year core initiative significant variance explanations are required for: (3) variances between planned and preliminary core initiative total benefits showing a decrease of 15 percent or greater.
Total Benefits (2016$) Variances
Program
Planned Preliminary Planned v. Preliminary (%)
Massachusetts Electric Company and Nantucket Electric Company d/b/a National Grid
D.P.U. 18-512017 Energy Efficiency Plan-Year Report
Master Data Tables4 of 37
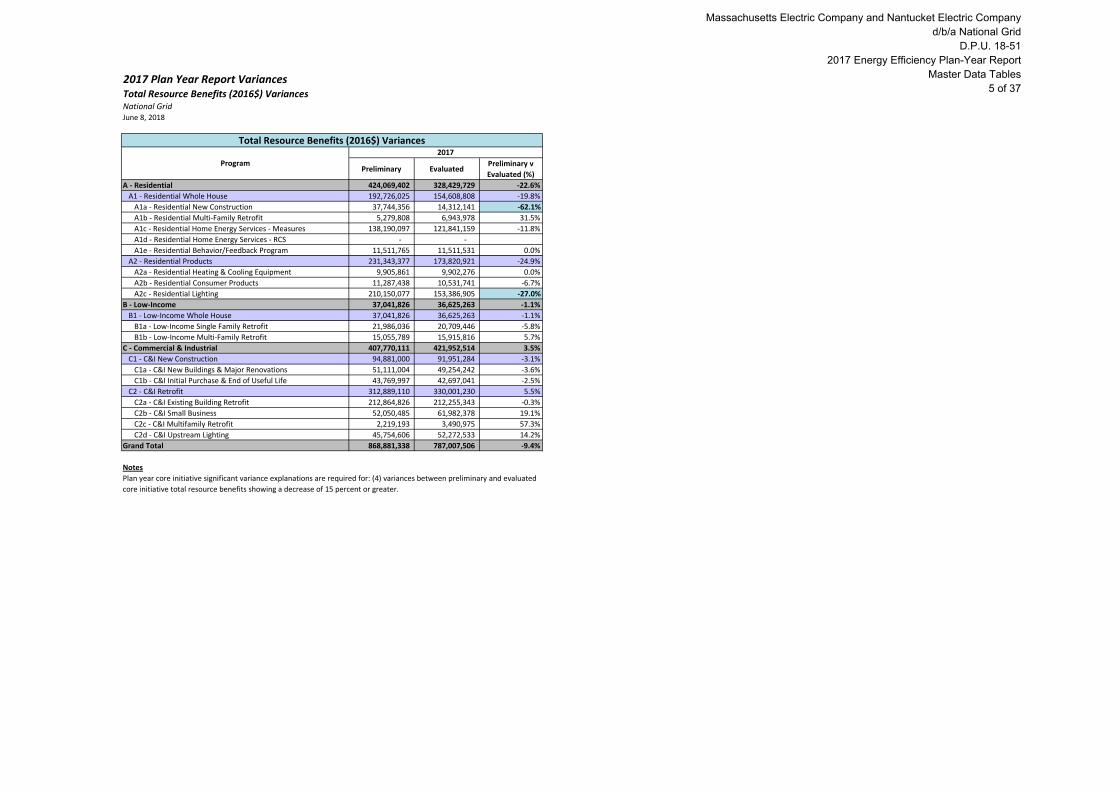
2017 Plan Year Report VariancesTotal Resource Benefits (2016$) VariancesNational GridJune 8, 2018
Preliminary EvaluatedPreliminary v
Evaluated (%)
A - Residential 424,069,402 328,429,729 -22.6%
A1 - Residential Whole House 192,726,025 154,608,808 -19.8%
A1a - Residential New Construction 37,744,356 14,312,141 -62.1%
A1b - Residential Multi-Family Retrofit 5,279,808 6,943,978 31.5%
A1c - Residential Home Energy Services - Measures 138,190,097 121,841,159 -11.8%
A1d - Residential Home Energy Services - RCS - -
A1e - Residential Behavior/Feedback Program 11,511,765 11,511,531 0.0%
A2 - Residential Products 231,343,377 173,820,921 -24.9%
A2a - Residential Heating & Cooling Equipment 9,905,861 9,902,276 0.0%
A2b - Residential Consumer Products 11,287,438 10,531,741 -6.7%
A2c - Residential Lighting 210,150,077 153,386,905 -27.0%
B - Low-Income 37,041,826 36,625,263 -1.1%
B1 - Low-Income Whole House 37,041,826 36,625,263 -1.1%
B1a - Low-Income Single Family Retrofit 21,986,036 20,709,446 -5.8%
B1b - Low-Income Multi-Family Retrofit 15,055,789 15,915,816 5.7%
C - Commercial & Industrial 407,770,111 421,952,514 3.5%
C1 - C&I New Construction 94,881,000 91,951,284 -3.1%
C1a - C&I New Buildings & Major Renovations 51,111,004 49,254,242 -3.6%
C1b - C&I Initial Purchase & End of Useful Life 43,769,997 42,697,041 -2.5%
C2 - C&I Retrofit 312,889,110 330,001,230 5.5%
C2a - C&I Existing Building Retrofit 212,864,826 212,255,343 -0.3%
C2b - C&I Small Business 52,050,485 61,982,378 19.1%
C2c - C&I Multifamily Retrofit 2,219,193 3,490,975 57.3%
C2d - C&I Upstream Lighting 45,754,606 52,272,533 14.2%
Grand Total 868,881,338 787,007,506 -9.4%
Notes
Plan year core initiative significant variance explanations are required for: (4) variances between preliminary and evaluated
core initiative total resource benefits showing a decrease of 15 percent or greater.
Total Resource Benefits (2016$) Variances
Program
2017
Massachusetts Electric Company and Nantucket Electric Company d/b/a National Grid
D.P.U. 18-512017 Energy Efficiency Plan-Year Report
Master Data Tables5 of 37
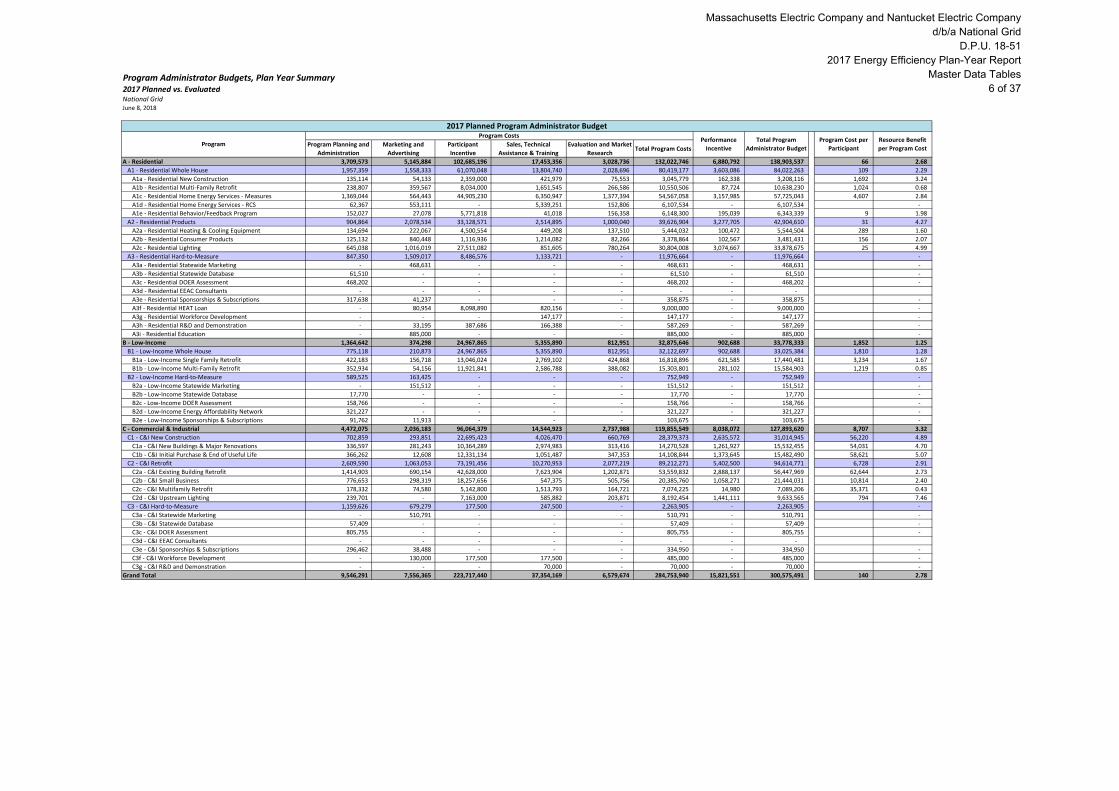
Program Administrator Budgets, Plan Year Summary2017 Planned vs. EvaluatedNational GridJune 8, 2018
Program Planning and
Administration
Marketing and
Advertising
Participant
Incentive
Sales, Technical
Assistance & Training
Evaluation and Market
ResearchTotal Program Costs
A - Residential 3,709,573 5,145,884 102,685,196 17,453,356 3,028,736 132,022,746 6,880,792 138,903,537 66 2.68
A1 - Residential Whole House 1,957,359 1,558,333 61,070,048 13,804,740 2,028,696 80,419,177 3,603,086 84,022,263 109 2.29
A1a - Residential New Construction 135,114 54,133 2,359,000 421,979 75,553 3,045,779 162,338 3,208,116 1,692 3.24
A1b - Residential Multi-Family Retrofit 238,807 359,567 8,034,000 1,651,545 266,586 10,550,506 87,724 10,638,230 1,024 0.68
A1c - Residential Home Energy Services - Measures 1,369,044 564,443 44,905,230 6,350,947 1,377,394 54,567,058 3,157,985 57,725,043 4,607 2.84
A1d - Residential Home Energy Services - RCS 62,367 553,111 - 5,339,251 152,806 6,107,534 - 6,107,534 -
A1e - Residential Behavior/Feedback Program 152,027 27,078 5,771,818 41,018 156,358 6,148,300 195,039 6,343,339 9 1.98
A2 - Residential Products 904,864 2,078,534 33,128,571 2,514,895 1,000,040 39,626,904 3,277,705 42,904,610 31 4.27
A2a - Residential Heating & Cooling Equipment 134,694 222,067 4,500,554 449,208 137,510 5,444,032 100,472 5,544,504 289 1.60
A2b - Residential Consumer Products 125,132 840,448 1,116,936 1,214,082 82,266 3,378,864 102,567 3,481,431 156 2.07
A2c - Residential Lighting 645,038 1,016,019 27,511,082 851,605 780,264 30,804,008 3,074,667 33,878,675 25 4.99
A3 - Residential Hard-to-Measure 847,350 1,509,017 8,486,576 1,133,721 - 11,976,664 - 11,976,664 -
A3a - Residential Statewide Marketing - 468,631 - - - 468,631 - 468,631 -
A3b - Residential Statewide Database 61,510 - - - - 61,510 - 61,510 -
A3c - Residential DOER Assessment 468,202 - - - - 468,202 - 468,202 -
A3d - Residential EEAC Consultants - - - - - - - -
A3e - Residential Sponsorships & Subscriptions 317,638 41,237 - - - 358,875 - 358,875 -
A3f - Residential HEAT Loan - 80,954 8,098,890 820,156 - 9,000,000 - 9,000,000 -
A3g - Residential Workforce Development - - - 147,177 - 147,177 - 147,177 -
A3h - Residential R&D and Demonstration - 33,195 387,686 166,388 - 587,269 - 587,269 -
A3i - Residential Education - 885,000 - - - 885,000 - 885,000 -
B - Low-Income 1,364,642 374,298 24,967,865 5,355,890 812,951 32,875,646 902,688 33,778,333 1,852 1.25
B1 - Low-Income Whole House 775,118 210,873 24,967,865 5,355,890 812,951 32,122,697 902,688 33,025,384 1,810 1.28
B1a - Low-Income Single Family Retrofit 422,183 156,718 13,046,024 2,769,102 424,868 16,818,896 621,585 17,440,481 3,234 1.67
B1b - Low-Income Multi-Family Retrofit 352,934 54,156 11,921,841 2,586,788 388,082 15,303,801 281,102 15,584,903 1,219 0.85
B2 - Low-Income Hard-to-Measure 589,525 163,425 - - - 752,949 - 752,949 -
B2a - Low-Income Statewide Marketing - 151,512 - - - 151,512 - 151,512 -
B2b - Low-Income Statewide Database 17,770 - - - - 17,770 - 17,770 -
B2c - Low-Income DOER Assessment 158,766 - - - - 158,766 - 158,766 -
B2d - Low-Income Energy Affordability Network 321,227 - - - - 321,227 - 321,227 -
B2e - Low-Income Sponsorships & Subscriptions 91,762 11,913 - - - 103,675 - 103,675 -
C - Commercial & Industrial 4,472,075 2,036,183 96,064,379 14,544,923 2,737,988 119,855,549 8,038,072 127,893,620 8,707 3.32
C1 - C&I New Construction 702,859 293,851 22,695,423 4,026,470 660,769 28,379,373 2,635,572 31,014,945 56,220 4.89
C1a - C&I New Buildings & Major Renovations 336,597 281,243 10,364,289 2,974,983 313,416 14,270,528 1,261,927 15,532,455 54,031 4.70
C1b - C&I Initial Purchase & End of Useful Life 366,262 12,608 12,331,134 1,051,487 347,353 14,108,844 1,373,645 15,482,490 58,621 5.07
C2 - C&I Retrofit 2,609,590 1,063,053 73,191,456 10,270,953 2,077,219 89,212,271 5,402,500 94,614,771 6,728 2.91
C2a - C&I Existing Building Retrofit 1,414,903 690,154 42,628,000 7,623,904 1,202,871 53,559,832 2,888,137 56,447,969 62,644 2.73
C2b - C&I Small Business 776,653 298,319 18,257,656 547,375 505,756 20,385,760 1,058,271 21,444,031 10,814 2.40
C2c - C&I Multifamily Retrofit 178,332 74,580 5,142,800 1,513,793 164,721 7,074,225 14,980 7,089,206 35,371 0.43
C2d - C&I Upstream Lighting 239,701 - 7,163,000 585,882 203,871 8,192,454 1,441,111 9,633,565 794 7.46
C3 - C&I Hard-to-Measure 1,159,626 679,279 177,500 247,500 - 2,263,905 - 2,263,905 -
C3a - C&I Statewide Marketing - 510,791 - - - 510,791 - 510,791 -
C3b - C&I Statewide Database 57,409 - - - - 57,409 - 57,409 -
C3c - C&I DOER Assessment 805,755 - - - - 805,755 - 805,755 -
C3d - C&I EEAC Consultants - - - - - - - -
C3e - C&I Sponsorships & Subscriptions 296,462 38,488 - - - 334,950 - 334,950 -
C3f - C&I Workforce Development - 130,000 177,500 177,500 - 485,000 - 485,000 -
C3g - C&I R&D and Demonstration - - - 70,000 - 70,000 - 70,000 -
Grand Total 9,546,291 7,556,365 223,717,440 37,354,169 6,579,674 284,753,940 15,821,551 300,575,491 140 2.78
2017 Planned Program Administrator Budget
Program
Program CostsPerformance
Incentive
Total Program
Administrator Budget
Program Cost per
Participant
Resource Benefit
per Program Cost
Massachusetts Electric Company and Nantucket Electric Company d/b/a National Grid
D.P.U. 18-512017 Energy Efficiency Plan-Year Report
Master Data Tables6 of 37
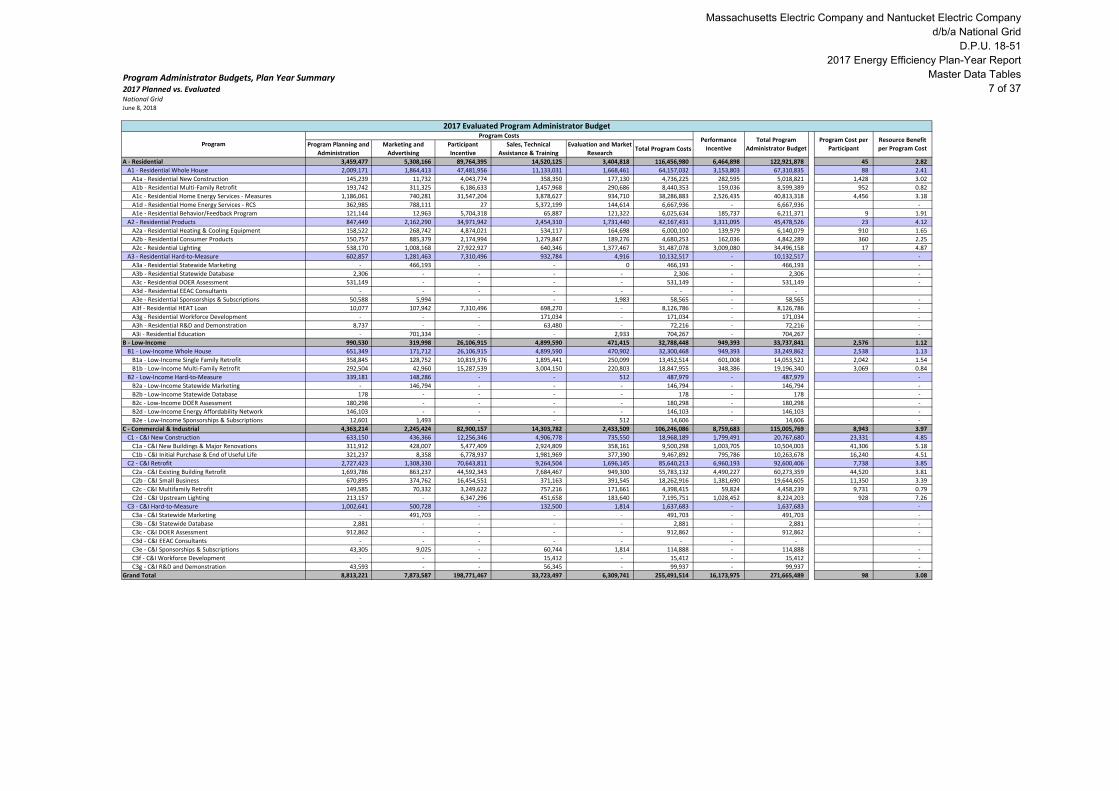
Program Administrator Budgets, Plan Year Summary2017 Planned vs. EvaluatedNational GridJune 8, 2018
Program Planning and
Administration
Marketing and
Advertising
Participant
Incentive
Sales, Technical
Assistance & Training
Evaluation and Market
ResearchTotal Program Costs
A - Residential 3,459,477 5,308,166 89,764,395 14,520,125 3,404,818 116,456,980 6,464,898 122,921,878 45 2.82
A1 - Residential Whole House 2,009,171 1,864,413 47,481,956 11,133,031 1,668,461 64,157,032 3,153,803 67,310,835 88 2.41
A1a - Residential New Construction 145,239 11,732 4,043,774 358,350 177,130 4,736,225 282,595 5,018,821 1,428 3.02
A1b - Residential Multi-Family Retrofit 193,742 311,325 6,186,633 1,457,968 290,686 8,440,353 159,036 8,599,389 952 0.82
A1c - Residential Home Energy Services - Measures 1,186,061 740,281 31,547,204 3,878,627 934,710 38,286,883 2,526,435 40,813,318 4,456 3.18
A1d - Residential Home Energy Services - RCS 362,985 788,111 27 5,372,199 144,614 6,667,936 - 6,667,936 -
A1e - Residential Behavior/Feedback Program 121,144 12,963 5,704,318 65,887 121,322 6,025,634 185,737 6,211,371 9 1.91
A2 - Residential Products 847,449 2,162,290 34,971,942 2,454,310 1,731,440 42,167,431 3,311,095 45,478,526 23 4.12
A2a - Residential Heating & Cooling Equipment 158,522 268,742 4,874,021 534,117 164,698 6,000,100 139,979 6,140,079 910 1.65
A2b - Residential Consumer Products 150,757 885,379 2,174,994 1,279,847 189,276 4,680,253 162,036 4,842,289 360 2.25
A2c - Residential Lighting 538,170 1,008,168 27,922,927 640,346 1,377,467 31,487,078 3,009,080 34,496,158 17 4.87
A3 - Residential Hard-to-Measure 602,857 1,281,463 7,310,496 932,784 4,916 10,132,517 - 10,132,517 -
A3a - Residential Statewide Marketing - 466,193 - - 0 466,193 - 466,193 -
A3b - Residential Statewide Database 2,306 - - - - 2,306 - 2,306 -
A3c - Residential DOER Assessment 531,149 - - - - 531,149 - 531,149 -
A3d - Residential EEAC Consultants - - - - - - - -
A3e - Residential Sponsorships & Subscriptions 50,588 5,994 - - 1,983 58,565 - 58,565 -
A3f - Residential HEAT Loan 10,077 107,942 7,310,496 698,270 - 8,126,786 - 8,126,786 -
A3g - Residential Workforce Development - - - 171,034 - 171,034 - 171,034 -
A3h - Residential R&D and Demonstration 8,737 - - 63,480 - 72,216 - 72,216 -
A3i - Residential Education - 701,334 - - 2,933 704,267 - 704,267 -
B - Low-Income 990,530 319,998 26,106,915 4,899,590 471,415 32,788,448 949,393 33,737,841 2,576 1.12
B1 - Low-Income Whole House 651,349 171,712 26,106,915 4,899,590 470,902 32,300,468 949,393 33,249,862 2,538 1.13
B1a - Low-Income Single Family Retrofit 358,845 128,752 10,819,376 1,895,441 250,099 13,452,514 601,008 14,053,521 2,042 1.54
B1b - Low-Income Multi-Family Retrofit 292,504 42,960 15,287,539 3,004,150 220,803 18,847,955 348,386 19,196,340 3,069 0.84
B2 - Low-Income Hard-to-Measure 339,181 148,286 - - 512 487,979 - 487,979 -
B2a - Low-Income Statewide Marketing - 146,794 - - - 146,794 - 146,794 -
B2b - Low-Income Statewide Database 178 - - - - 178 - 178 -
B2c - Low-Income DOER Assessment 180,298 - - - - 180,298 - 180,298 -
B2d - Low-Income Energy Affordability Network 146,103 - - - - 146,103 - 146,103 -
B2e - Low-Income Sponsorships & Subscriptions 12,601 1,493 - - 512 14,606 - 14,606 -
C - Commercial & Industrial 4,363,214 2,245,424 82,900,157 14,303,782 2,433,509 106,246,086 8,759,683 115,005,769 8,943 3.97
C1 - C&I New Construction 633,150 436,366 12,256,346 4,906,778 735,550 18,968,189 1,799,491 20,767,680 23,331 4.85
C1a - C&I New Buildings & Major Renovations 311,912 428,007 5,477,409 2,924,809 358,161 9,500,298 1,003,705 10,504,003 41,306 5.18
C1b - C&I Initial Purchase & End of Useful Life 321,237 8,358 6,778,937 1,981,969 377,390 9,467,892 795,786 10,263,678 16,240 4.51
C2 - C&I Retrofit 2,727,423 1,308,330 70,643,811 9,264,504 1,696,145 85,640,213 6,960,193 92,600,406 7,738 3.85
C2a - C&I Existing Building Retrofit 1,693,786 863,237 44,592,343 7,684,467 949,300 55,783,132 4,490,227 60,273,359 44,520 3.81
C2b - C&I Small Business 670,895 374,762 16,454,551 371,163 391,545 18,262,916 1,381,690 19,644,605 11,350 3.39
C2c - C&I Multifamily Retrofit 149,585 70,332 3,249,622 757,216 171,661 4,398,415 59,824 4,458,239 9,731 0.79
C2d - C&I Upstream Lighting 213,157 - 6,347,296 451,658 183,640 7,195,751 1,028,452 8,224,203 928 7.26
C3 - C&I Hard-to-Measure 1,002,641 500,728 - 132,500 1,814 1,637,683 - 1,637,683 -
C3a - C&I Statewide Marketing - 491,703 - - - 491,703 - 491,703 -
C3b - C&I Statewide Database 2,881 - - - - 2,881 - 2,881 -
C3c - C&I DOER Assessment 912,862 - - - - 912,862 - 912,862 -
C3d - C&I EEAC Consultants - - - - - - - -
C3e - C&I Sponsorships & Subscriptions 43,305 9,025 - 60,744 1,814 114,888 - 114,888 -
C3f - C&I Workforce Development - - - 15,412 - 15,412 - 15,412 -
C3g - C&I R&D and Demonstration 43,593 - - 56,345 - 99,937 - 99,937 -
Grand Total 8,813,221 7,873,587 198,771,467 33,723,497 6,309,741 255,491,514 16,173,975 271,665,489 98 3.08
2017 Evaluated Program Administrator Budget
Program
Program CostsPerformance
Incentive
Total Program
Administrator Budget
Program Cost per
Participant
Resource Benefit
per Program Cost
Massachusetts Electric Company and Nantucket Electric Company d/b/a National Grid
D.P.U. 18-512017 Energy Efficiency Plan-Year Report
Master Data Tables7 of 37
Program Administrator Budgets, Plan Year Summary2017 Planned vs. EvaluatedNational GridJune 8, 2018
Program Planning and
Administration
Marketing and
Advertising
Participant
Incentive
Sales, Technical
Assistance & Training
Evaluation and Market
ResearchTotal Program Costs
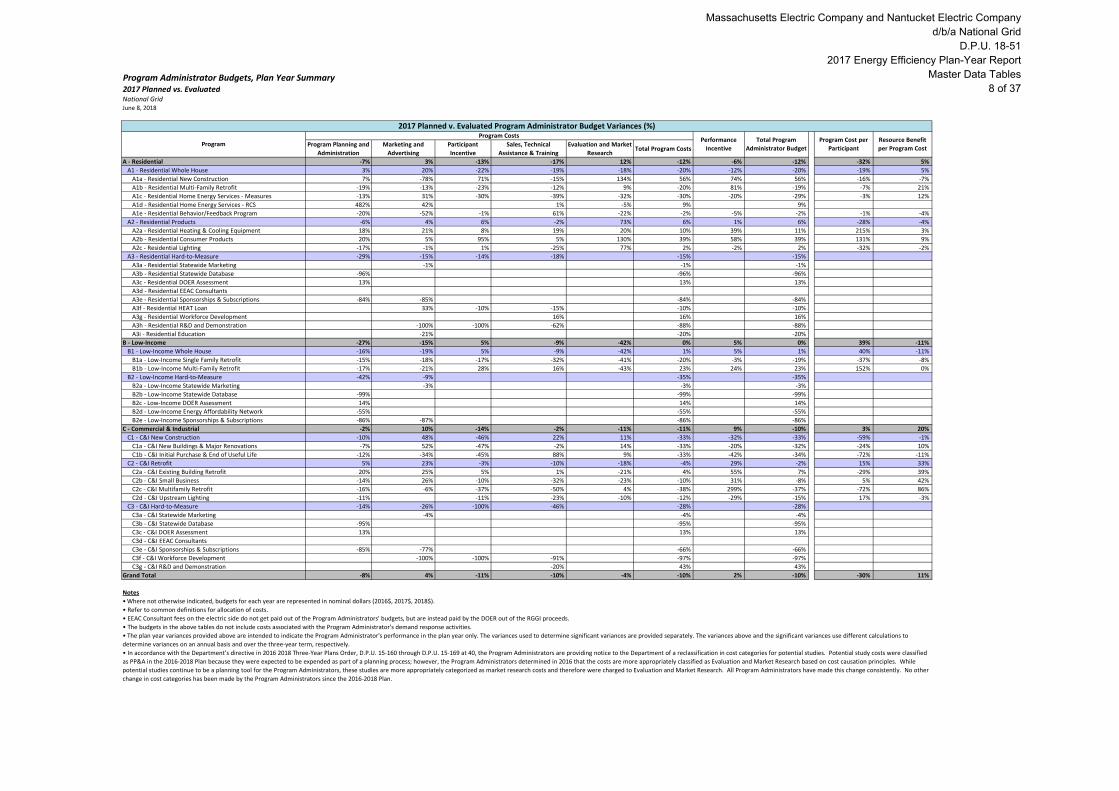
A - Residential -7% 3% -13% -17% 12% -12% -6% -12% -32% 5%
A1 - Residential Whole House 3% 20% -22% -19% -18% -20% -12% -20% -19% 5%
A1a - Residential New Construction 7% -78% 71% -15% 134% 56% 74% 56% -16% -7%
A1b - Residential Multi-Family Retrofit -19% -13% -23% -12% 9% -20% 81% -19% -7% 21%
A1c - Residential Home Energy Services - Measures -13% 31% -30% -39% -32% -30% -20% -29% -3% 12%
A1d - Residential Home Energy Services - RCS 482% 42% 1% -5% 9% 9%
A1e - Residential Behavior/Feedback Program -20% -52% -1% 61% -22% -2% -5% -2% -1% -4%
A2 - Residential Products -6% 4% 6% -2% 73% 6% 1% 6% -28% -4%
A2a - Residential Heating & Cooling Equipment 18% 21% 8% 19% 20% 10% 39% 11% 215% 3%
A2b - Residential Consumer Products 20% 5% 95% 5% 130% 39% 58% 39% 131% 9%
A2c - Residential Lighting -17% -1% 1% -25% 77% 2% -2% 2% -32% -2%
A3 - Residential Hard-to-Measure -29% -15% -14% -18% -15% -15%
A3a - Residential Statewide Marketing -1% -1% -1%
A3b - Residential Statewide Database -96% -96% -96%
A3c - Residential DOER Assessment 13% 13% 13%
A3d - Residential EEAC Consultants
A3e - Residential Sponsorships & Subscriptions -84% -85% -84% -84%
A3f - Residential HEAT Loan 33% -10% -15% -10% -10%
A3g - Residential Workforce Development 16% 16% 16%
A3h - Residential R&D and Demonstration -100% -100% -62% -88% -88%
A3i - Residential Education -21% -20% -20%
B - Low-Income -27% -15% 5% -9% -42% 0% 5% 0% 39% -11%
B1 - Low-Income Whole House -16% -19% 5% -9% -42% 1% 5% 1% 40% -11%
B1a - Low-Income Single Family Retrofit -15% -18% -17% -32% -41% -20% -3% -19% -37% -8%
B1b - Low-Income Multi-Family Retrofit -17% -21% 28% 16% -43% 23% 24% 23% 152% 0%
B2 - Low-Income Hard-to-Measure -42% -9% -35% -35%
B2a - Low-Income Statewide Marketing -3% -3% -3%
B2b - Low-Income Statewide Database -99% -99% -99%
B2c - Low-Income DOER Assessment 14% 14% 14%
B2d - Low-Income Energy Affordability Network -55% -55% -55%
B2e - Low-Income Sponsorships & Subscriptions -86% -87% -86% -86%
C - Commercial & Industrial -2% 10% -14% -2% -11% -11% 9% -10% 3% 20%
C1 - C&I New Construction -10% 48% -46% 22% 11% -33% -32% -33% -59% -1%
C1a - C&I New Buildings & Major Renovations -7% 52% -47% -2% 14% -33% -20% -32% -24% 10%
C1b - C&I Initial Purchase & End of Useful Life -12% -34% -45% 88% 9% -33% -42% -34% -72% -11%
C2 - C&I Retrofit 5% 23% -3% -10% -18% -4% 29% -2% 15% 33%
C2a - C&I Existing Building Retrofit 20% 25% 5% 1% -21% 4% 55% 7% -29% 39%
C2b - C&I Small Business -14% 26% -10% -32% -23% -10% 31% -8% 5% 42%
C2c - C&I Multifamily Retrofit -16% -6% -37% -50% 4% -38% 299% -37% -72% 86%
C2d - C&I Upstream Lighting -11% -11% -23% -10% -12% -29% -15% 17% -3%
C3 - C&I Hard-to-Measure -14% -26% -100% -46% -28% -28%
C3a - C&I Statewide Marketing -4% -4% -4%
C3b - C&I Statewide Database -95% -95% -95%
C3c - C&I DOER Assessment 13% 13% 13%
C3d - C&I EEAC Consultants
C3e - C&I Sponsorships & Subscriptions -85% -77% -66% -66%
C3f - C&I Workforce Development -100% -100% -91% -97% -97%
C3g - C&I R&D and Demonstration -20% 43% 43%
Grand Total -8% 4% -11% -10% -4% -10% 2% -10% -30% 11%
Notes
• Where not otherwise indicated, budgets for each year are represented in nominal dollars (2016$, 2017$, 2018$).
• Refer to common definitions for allocation of costs.
• EEAC Consultant fees on the electric side do not get paid out of the Program Administrators' budgets, but are instead paid by the DOER out of the RGGI proceeds.
• The budgets in the above tables do not include costs associated with the Program Administrator's demand response activities.
• In accordance with the Department’s directive in 2016 2018 Three-Year Plans Order, D.P.U. 15-160 through D.P.U. 15-169 at 40, the Program Administrators are providing notice to the Department of a reclassification in cost categories for potential studies. Potential study costs were classified
as PP&A in the 2016-2018 Plan because they were expected to be expended as part of a planning process; however, the Program Administrators determined in 2016 that the costs are more appropriately classified as Evaluation and Market Research based on cost causation principles. While
potential studies continue to be a planning tool for the Program Administrators, these studies are more appropriately categorized as market research costs and therefore were charged to Evaluation and Market Research. All Program Administrators have made this change consistently. No other
change in cost categories has been made by the Program Administrators since the 2016-2018 Plan.
• The plan year variances provided above are intended to indicate the Program Administrator's performance in the plan year only. The variances used to determine significant variances are provided separately. The variances above and the significant variances use different calculations to
determine variances on an annual basis and over the three-year term, respectively.
2017 Planned v. Evaluated Program Administrator Budget Variances (%)
Program
Program CostsPerformance
Incentive
Total Program
Administrator Budget
Program Cost per
Participant
Resource Benefit
per Program Cost
Massachusetts Electric Company and Nantucket Electric Company d/b/a National Grid
D.P.U. 18-512017 Energy Efficiency Plan-Year Report
Master Data Tables8 of 37

Program Administrator Budgets, Three-Year Total2016-2018 Program Administrator BudgetNational GridJune 8, 2018
Program Planning and
Administration
Marketing and
Advertising
Participant
Incentive
Sales, Technical
Assistance & Training
Evaluation and Market
ResearchTotal Program Costs
A - Residential 3,177,730 4,888,288 85,092,182 15,463,318 2,607,138 111,228,657 6,118,799 117,347,456 53 2.82
A1 - Residential Whole House 1,717,537 1,764,912 54,884,429 12,678,628 883,610 71,929,116 3,909,603 75,838,719 98 2.67
A1a - Residential New Construction 108,735 9,494 4,110,545 536,703 230,505 4,995,982 339,617 5,335,599 1,286 3.76
A1b - Residential Multi-Family Retrofit 200,168 365,152 10,317,476 2,241,667 126,588 13,251,051 112,703 13,363,755 745 0.62
A1c - Residential Home Energy Services - Measures 1,035,145 636,451 34,617,291 4,476,525 407,656 41,173,069 3,233,713 44,406,782 3,975 3.67
A1d - Residential Home Energy Services - RCS 223,919 642,733 67,078 5,415,255 43,269 6,392,254 - 6,392,254 -
A1e - Residential Behavior/Feedback Program 149,569 111,082 5,772,038 8,479 75,591 6,116,760 223,570 6,340,330 9 2.23
A2 - Residential Products 738,814 1,807,973 23,680,596 1,879,160 1,696,890 29,803,434 2,209,196 32,012,630 22 4.10
A2a - Residential Heating & Cooling Equipment 129,535 178,265 3,809,258 463,807 363,999 4,944,865 76,835 5,021,700 823 1.40
A2b - Residential Consumer Products 144,151 749,793 1,318,328 753,701 27,865 2,993,837 127,393 3,121,230 241 2.56
A2c - Residential Lighting 465,128 879,915 18,553,010 661,652 1,305,027 21,864,732 2,004,968 23,869,700 16 4.92
A3 - Residential Hard-to-Measure 721,378 1,315,403 6,527,158 905,529 26,638 9,496,107 - 9,496,107 -
A3a - Residential Statewide Marketing - 488,440 - - 6,957 495,397 - 495,397 -
A3b - Residential Statewide Database 11,665 - - - - 11,665 - 11,665 -
A3c - Residential DOER Assessment 694,126 - - - - 694,126 - 694,126 -
A3d - Residential EEAC Consultants - - - - - - - -
A3e - Residential Sponsorships & Subscriptions 5,560 - - - - 5,560 - 5,560 -
A3f - Residential HEAT Loan 8,403 129,285 6,521,354 803,624 - 7,462,665 - 7,462,665 -
A3g - Residential Workforce Development - - - 36,247 - 36,247 - 36,247 -
A3h - Residential R&D and Demonstration 1,625 - 5,804 65,658 19,681 92,768 - 92,768 -
A3i - Residential Education (0) 697,679 - - - 697,679 - 697,679 -
B - Low-Income 979,568 301,401 21,542,505 4,131,589 247,393 27,202,456 802,565 28,005,021 1,965 1.13
B1 - Low-Income Whole House 661,461 156,253 21,542,505 4,131,589 247,393 26,739,202 802,565 27,541,767 1,932 1.15
B1a - Low-Income Single Family Retrofit 352,691 119,165 11,541,614 2,036,343 128,383 14,178,197 663,846 14,842,043 2,299 1.53
B1b - Low-Income Multi-Family Retrofit 308,771 37,088 10,000,891 2,095,246 119,010 12,561,005 138,719 12,699,724 1,637 0.72
B2 - Low-Income Hard-to-Measure 318,107 145,148 - - - 463,254 - 463,254 -
B2a - Low-Income Statewide Marketing - 145,148 - - - 145,148 - 145,148 -
B2b - Low-Income Statewide Database 901 - - - - 901 - 901 -
B2c - Low-Income DOER Assessment 176,329 - - - - 176,329 - 176,329 -
B2d - Low-Income Energy Affordability Network 139,991 - - - - 139,991 - 139,991 -
B2e - Low-Income Sponsorships & Subscriptions 885 - - - - 885 - 885 -
C - Commercial & Industrial 3,758,519 2,067,909 103,564,863 14,553,203 1,739,374 125,683,867 9,835,413 135,519,281 8,845 3.85
C1 - C&I New Construction 575,986 425,675 13,317,343 3,967,581 487,669 18,774,253 1,749,641 20,523,894 19,721 4.69
C1a - C&I New Buildings & Major Renovations 302,900 356,488 3,804,436 2,275,848 314,473 7,054,146 687,216 7,741,362 27,663 4.85
C1b - C&I Initial Purchase & End of Useful Life 273,085 69,187 9,512,907 1,691,733 173,196 11,720,107 1,062,425 12,782,532 16,815 4.60
C2 - C&I Retrofit 2,512,396 1,146,766 90,247,520 10,420,982 1,251,705 105,579,369 8,085,773 113,665,142 7,964 3.75
C2a - C&I Existing Building Retrofit 1,499,274 735,061 54,738,432 8,705,398 620,471 66,298,636 4,968,667 71,267,303 49,999 3.82
C2b - C&I Small Business 652,869 345,575 20,846,210 274,578 251,337 22,370,569 1,355,213 23,725,781 13,436 2.89
C2c - C&I Multifamily Retrofit 151,293 66,129 6,150,053 1,162,875 78,627 7,608,977 39,767 7,648,743 12,040 0.47
C2d - C&I Upstream Lighting 208,961 - 8,512,825 278,132 301,270 9,301,188 1,722,126 11,023,315 965 8.02
C3 - C&I Hard-to-Measure 670,137 495,468 - 164,640 - 1,330,245 - 1,330,245 -
C3a - C&I Statewide Marketing - 495,468 - - - 495,468 - 495,468 -
C3b - C&I Statewide Database 14,575 - - - - 14,575 - 14,575 -
C3c - C&I DOER Assessment 648,410 - - - - 648,410 - 648,410 -
C3d - C&I EEAC Consultants - - - - - - - -
C3e - C&I Sponsorships & Subscriptions 5,881 - - 60,826 - 66,707 - 66,707 -
C3f - C&I Workforce Development - - - 65,599 - 65,599 - 65,599 -
C3g - C&I R&D and Demonstration 1,271 - - 38,215 - 39,486 - 39,486 -
Grand Total 7,915,817 7,257,598 210,199,550 34,148,110 4,593,905 264,114,980 16,756,778 280,871,758 124 3.14
2016 Evaluated Program Administrator Budget
Program
Program CostsPerformance
Incentive
Total Program
Administrator Budget
Program Cost per
Participant
Resource Benefit
per Program Cost
Massachusetts Electric Company and Nantucket Electric Company d/b/a National Grid
D.P.U. 18-512017 Energy Efficiency Plan-Year Report
Master Data Tables9 of 37
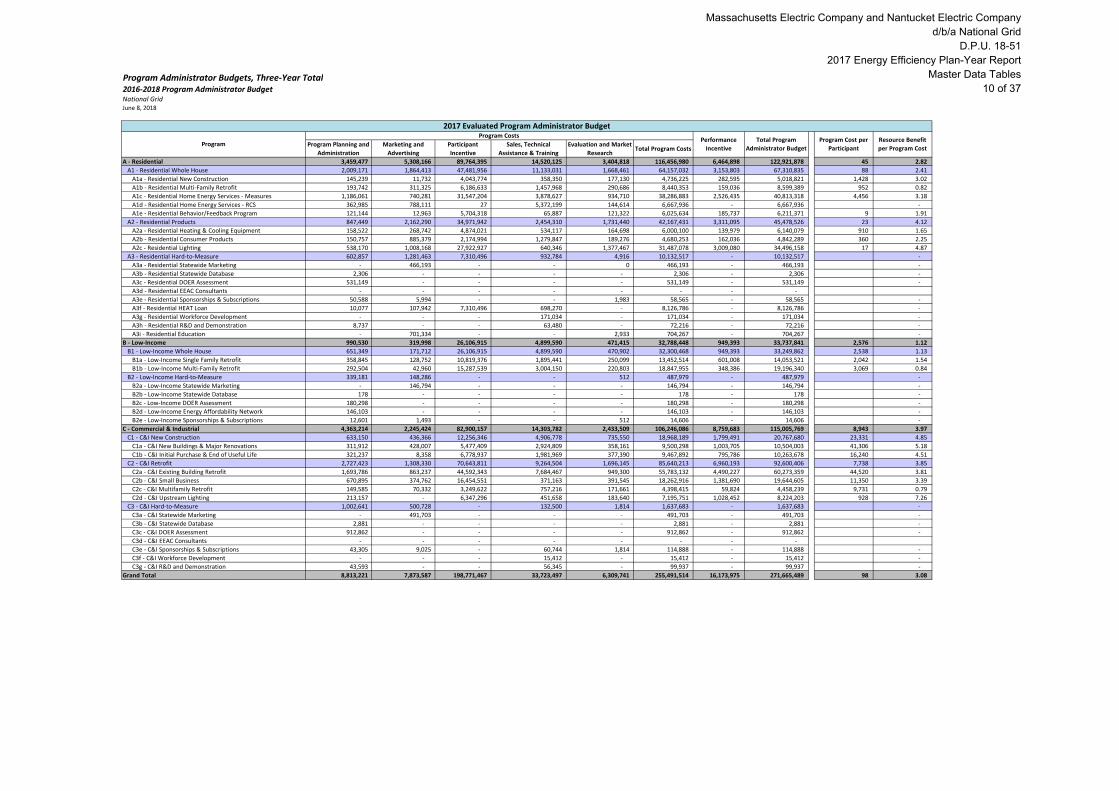
Program Administrator Budgets, Three-Year Total2016-2018 Program Administrator BudgetNational GridJune 8, 2018
Program Planning and
Administration
Marketing and
Advertising
Participant
Incentive
Sales, Technical
Assistance & Training
Evaluation and Market
ResearchTotal Program Costs
A - Residential 3,459,477 5,308,166 89,764,395 14,520,125 3,404,818 116,456,980 6,464,898 122,921,878 45 2.82
A1 - Residential Whole House 2,009,171 1,864,413 47,481,956 11,133,031 1,668,461 64,157,032 3,153,803 67,310,835 88 2.41
A1a - Residential New Construction 145,239 11,732 4,043,774 358,350 177,130 4,736,225 282,595 5,018,821 1,428 3.02
A1b - Residential Multi-Family Retrofit 193,742 311,325 6,186,633 1,457,968 290,686 8,440,353 159,036 8,599,389 952 0.82
A1c - Residential Home Energy Services - Measures 1,186,061 740,281 31,547,204 3,878,627 934,710 38,286,883 2,526,435 40,813,318 4,456 3.18
A1d - Residential Home Energy Services - RCS 362,985 788,111 27 5,372,199 144,614 6,667,936 - 6,667,936 -
A1e - Residential Behavior/Feedback Program 121,144 12,963 5,704,318 65,887 121,322 6,025,634 185,737 6,211,371 9 1.91
A2 - Residential Products 847,449 2,162,290 34,971,942 2,454,310 1,731,440 42,167,431 3,311,095 45,478,526 23 4.12
A2a - Residential Heating & Cooling Equipment 158,522 268,742 4,874,021 534,117 164,698 6,000,100 139,979 6,140,079 910 1.65
A2b - Residential Consumer Products 150,757 885,379 2,174,994 1,279,847 189,276 4,680,253 162,036 4,842,289 360 2.25
A2c - Residential Lighting 538,170 1,008,168 27,922,927 640,346 1,377,467 31,487,078 3,009,080 34,496,158 17 4.87
A3 - Residential Hard-to-Measure 602,857 1,281,463 7,310,496 932,784 4,916 10,132,517 - 10,132,517 -
A3a - Residential Statewide Marketing - 466,193 - - 0 466,193 - 466,193 -
A3b - Residential Statewide Database 2,306 - - - - 2,306 - 2,306 -
A3c - Residential DOER Assessment 531,149 - - - - 531,149 - 531,149 -
A3d - Residential EEAC Consultants - - - - - - - -
A3e - Residential Sponsorships & Subscriptions 50,588 5,994 - - 1,983 58,565 - 58,565 -
A3f - Residential HEAT Loan 10,077 107,942 7,310,496 698,270 - 8,126,786 - 8,126,786 -
A3g - Residential Workforce Development - - - 171,034 - 171,034 - 171,034 -
A3h - Residential R&D and Demonstration 8,737 - - 63,480 - 72,216 - 72,216 -
A3i - Residential Education - 701,334 - - 2,933 704,267 - 704,267 -
B - Low-Income 990,530 319,998 26,106,915 4,899,590 471,415 32,788,448 949,393 33,737,841 2,576 1.12
B1 - Low-Income Whole House 651,349 171,712 26,106,915 4,899,590 470,902 32,300,468 949,393 33,249,862 2,538 1.13
B1a - Low-Income Single Family Retrofit 358,845 128,752 10,819,376 1,895,441 250,099 13,452,514 601,008 14,053,521 2,042 1.54
B1b - Low-Income Multi-Family Retrofit 292,504 42,960 15,287,539 3,004,150 220,803 18,847,955 348,386 19,196,340 3,069 0.84
B2 - Low-Income Hard-to-Measure 339,181 148,286 - - 512 487,979 - 487,979 -
B2a - Low-Income Statewide Marketing - 146,794 - - - 146,794 - 146,794 -
B2b - Low-Income Statewide Database 178 - - - - 178 - 178 -
B2c - Low-Income DOER Assessment 180,298 - - - - 180,298 - 180,298 -
B2d - Low-Income Energy Affordability Network 146,103 - - - - 146,103 - 146,103 -
B2e - Low-Income Sponsorships & Subscriptions 12,601 1,493 - - 512 14,606 - 14,606 -
C - Commercial & Industrial 4,363,214 2,245,424 82,900,157 14,303,782 2,433,509 106,246,086 8,759,683 115,005,769 8,943 3.97
C1 - C&I New Construction 633,150 436,366 12,256,346 4,906,778 735,550 18,968,189 1,799,491 20,767,680 23,331 4.85
C1a - C&I New Buildings & Major Renovations 311,912 428,007 5,477,409 2,924,809 358,161 9,500,298 1,003,705 10,504,003 41,306 5.18
C1b - C&I Initial Purchase & End of Useful Life 321,237 8,358 6,778,937 1,981,969 377,390 9,467,892 795,786 10,263,678 16,240 4.51
C2 - C&I Retrofit 2,727,423 1,308,330 70,643,811 9,264,504 1,696,145 85,640,213 6,960,193 92,600,406 7,738 3.85
C2a - C&I Existing Building Retrofit 1,693,786 863,237 44,592,343 7,684,467 949,300 55,783,132 4,490,227 60,273,359 44,520 3.81
C2b - C&I Small Business 670,895 374,762 16,454,551 371,163 391,545 18,262,916 1,381,690 19,644,605 11,350 3.39
C2c - C&I Multifamily Retrofit 149,585 70,332 3,249,622 757,216 171,661 4,398,415 59,824 4,458,239 9,731 0.79
C2d - C&I Upstream Lighting 213,157 - 6,347,296 451,658 183,640 7,195,751 1,028,452 8,224,203 928 7.26
C3 - C&I Hard-to-Measure 1,002,641 500,728 - 132,500 1,814 1,637,683 - 1,637,683 -
C3a - C&I Statewide Marketing - 491,703 - - - 491,703 - 491,703 -
C3b - C&I Statewide Database 2,881 - - - - 2,881 - 2,881 -
C3c - C&I DOER Assessment 912,862 - - - - 912,862 - 912,862 -
C3d - C&I EEAC Consultants - - - - - - - -
C3e - C&I Sponsorships & Subscriptions 43,305 9,025 - 60,744 1,814 114,888 - 114,888 -
C3f - C&I Workforce Development - - - 15,412 - 15,412 - 15,412 -
C3g - C&I R&D and Demonstration 43,593 - - 56,345 - 99,937 - 99,937 -
Grand Total 8,813,221 7,873,587 198,771,467 33,723,497 6,309,741 255,491,514 16,173,975 271,665,489 98 3.08
2017 Evaluated Program Administrator Budget
Program
Program CostsPerformance
Incentive
Total Program
Administrator Budget
Program Cost per
Participant
Resource Benefit
per Program Cost
Massachusetts Electric Company and Nantucket Electric Company d/b/a National Grid
D.P.U. 18-512017 Energy Efficiency Plan-Year Report
Master Data Tables10 of 37
Program Administrator Budgets, Three-Year Total2016-2018 Program Administrator BudgetNational GridJune 8, 2018
Program Planning and
Administration
Marketing and
Advertising
Participant
Incentive
Sales, Technical
Assistance & Training
Evaluation and Market
ResearchTotal Program Costs
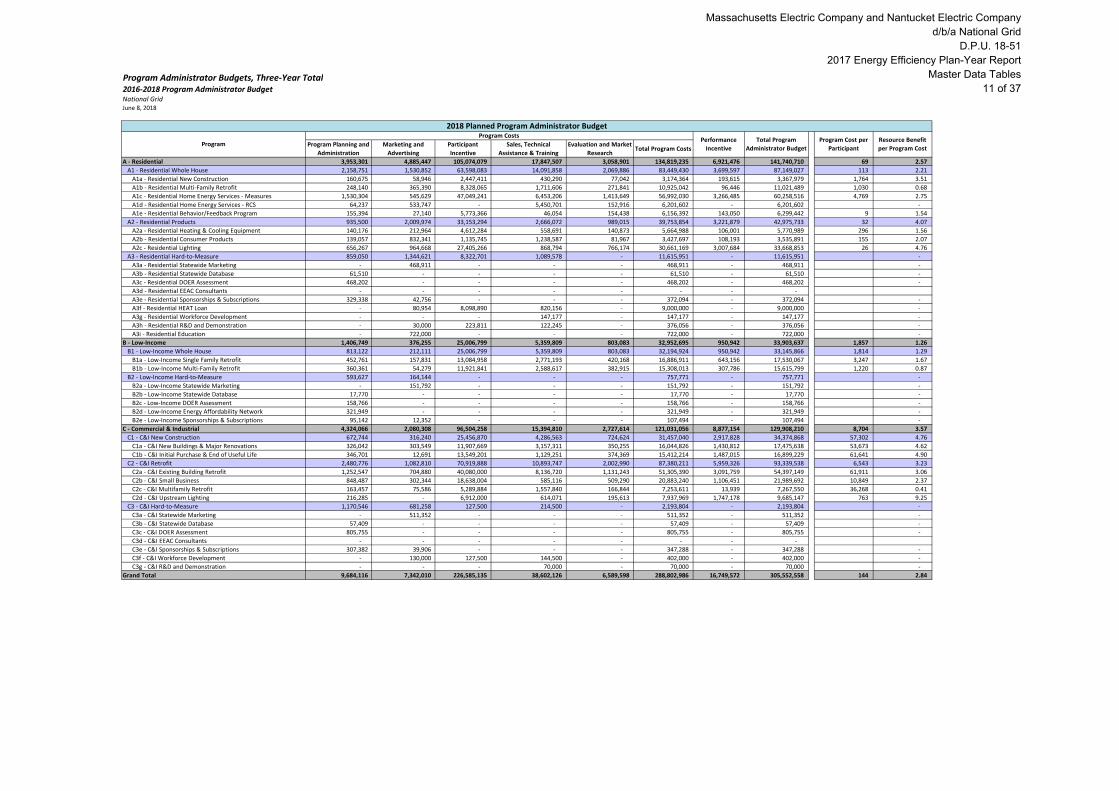
A - Residential 3,953,301 4,885,447 105,074,079 17,847,507 3,058,901 134,819,235 6,921,476 141,740,710 69 2.57
A1 - Residential Whole House 2,158,751 1,530,852 63,598,083 14,091,858 2,069,886 83,449,430 3,699,597 87,149,027 113 2.21
A1a - Residential New Construction 160,675 58,946 2,447,411 430,290 77,042 3,174,364 193,615 3,367,979 1,764 3.51
A1b - Residential Multi-Family Retrofit 248,140 365,390 8,328,065 1,711,606 271,841 10,925,042 96,446 11,021,489 1,030 0.68
A1c - Residential Home Energy Services - Measures 1,530,304 545,629 47,049,241 6,453,206 1,413,649 56,992,030 3,266,485 60,258,516 4,769 2.75
A1d - Residential Home Energy Services - RCS 64,237 533,747 - 5,450,701 152,916 6,201,602 - 6,201,602 -
A1e - Residential Behavior/Feedback Program 155,394 27,140 5,773,366 46,054 154,438 6,156,392 143,050 6,299,442 9 1.54
A2 - Residential Products 935,500 2,009,974 33,153,294 2,666,072 989,015 39,753,854 3,221,879 42,975,733 32 4.07
A2a - Residential Heating & Cooling Equipment 140,176 212,964 4,612,284 558,691 140,873 5,664,988 106,001 5,770,989 296 1.56
A2b - Residential Consumer Products 139,057 832,341 1,135,745 1,238,587 81,967 3,427,697 108,193 3,535,891 155 2.07
A2c - Residential Lighting 656,267 964,668 27,405,266 868,794 766,174 30,661,169 3,007,684 33,668,853 26 4.76
A3 - Residential Hard-to-Measure 859,050 1,344,621 8,322,701 1,089,578 - 11,615,951 - 11,615,951 -
A3a - Residential Statewide Marketing - 468,911 - - - 468,911 - 468,911 -
A3b - Residential Statewide Database 61,510 - - - - 61,510 - 61,510 -
A3c - Residential DOER Assessment 468,202 - - - - 468,202 - 468,202 -
A3d - Residential EEAC Consultants - - - - - - - -
A3e - Residential Sponsorships & Subscriptions 329,338 42,756 - - - 372,094 - 372,094 -
A3f - Residential HEAT Loan - 80,954 8,098,890 820,156 - 9,000,000 - 9,000,000 -
A3g - Residential Workforce Development - - - 147,177 - 147,177 - 147,177 -
A3h - Residential R&D and Demonstration - 30,000 223,811 122,245 - 376,056 - 376,056 -
A3i - Residential Education - 722,000 - - - 722,000 - 722,000 -
B - Low-Income 1,406,749 376,255 25,006,799 5,359,809 803,083 32,952,695 950,942 33,903,637 1,857 1.26
B1 - Low-Income Whole House 813,122 212,111 25,006,799 5,359,809 803,083 32,194,924 950,942 33,145,866 1,814 1.29
B1a - Low-Income Single Family Retrofit 452,761 157,831 13,084,958 2,771,193 420,168 16,886,911 643,156 17,530,067 3,247 1.67
B1b - Low-Income Multi-Family Retrofit 360,361 54,279 11,921,841 2,588,617 382,915 15,308,013 307,786 15,615,799 1,220 0.87
B2 - Low-Income Hard-to-Measure 593,627 164,144 - - - 757,771 - 757,771 -
B2a - Low-Income Statewide Marketing - 151,792 - - - 151,792 - 151,792 -
B2b - Low-Income Statewide Database 17,770 - - - - 17,770 - 17,770 -
B2c - Low-Income DOER Assessment 158,766 - - - - 158,766 - 158,766 -
B2d - Low-Income Energy Affordability Network 321,949 - - - - 321,949 - 321,949 -
B2e - Low-Income Sponsorships & Subscriptions 95,142 12,352 - - - 107,494 - 107,494 -
C - Commercial & Industrial 4,324,066 2,080,308 96,504,258 15,394,810 2,727,614 121,031,056 8,877,154 129,908,210 8,704 3.57
C1 - C&I New Construction 672,744 316,240 25,456,870 4,286,563 724,624 31,457,040 2,917,828 34,374,868 57,302 4.76
C1a - C&I New Buildings & Major Renovations 326,042 303,549 11,907,669 3,157,311 350,255 16,044,826 1,430,812 17,475,638 53,673 4.62
C1b - C&I Initial Purchase & End of Useful Life 346,701 12,691 13,549,201 1,129,251 374,369 15,412,214 1,487,015 16,899,229 61,641 4.90
C2 - C&I Retrofit 2,480,776 1,082,810 70,919,888 10,893,747 2,002,990 87,380,211 5,959,326 93,339,538 6,543 3.23
C2a - C&I Existing Building Retrofit 1,252,547 704,880 40,080,000 8,136,720 1,131,243 51,305,390 3,091,759 54,397,149 61,911 3.06
C2b - C&I Small Business 848,487 302,344 18,638,004 585,116 509,290 20,883,240 1,106,451 21,989,692 10,849 2.37
C2c - C&I Multifamily Retrofit 163,457 75,586 5,289,884 1,557,840 166,844 7,253,611 13,939 7,267,550 36,268 0.41
C2d - C&I Upstream Lighting 216,285 - 6,912,000 614,071 195,613 7,937,969 1,747,178 9,685,147 763 9.25
C3 - C&I Hard-to-Measure 1,170,546 681,258 127,500 214,500 - 2,193,804 - 2,193,804 -
C3a - C&I Statewide Marketing - 511,352 - - - 511,352 - 511,352 -
C3b - C&I Statewide Database 57,409 - - - - 57,409 - 57,409 -
C3c - C&I DOER Assessment 805,755 - - - - 805,755 - 805,755 -
C3d - C&I EEAC Consultants - - - - - - - -
C3e - C&I Sponsorships & Subscriptions 307,382 39,906 - - - 347,288 - 347,288 -
C3f - C&I Workforce Development - 130,000 127,500 144,500 - 402,000 - 402,000 -
C3g - C&I R&D and Demonstration - - - 70,000 - 70,000 - 70,000 -
Grand Total 9,684,116 7,342,010 226,585,135 38,602,126 6,589,598 288,802,986 16,749,572 305,552,558 144 2.84
2018 Planned Program Administrator Budget
Program
Program CostsPerformance
Incentive
Total Program
Administrator Budget
Program Cost per
Participant
Resource Benefit
per Program Cost
Massachusetts Electric Company and Nantucket Electric Company d/b/a National Grid
D.P.U. 18-512017 Energy Efficiency Plan-Year Report
Master Data Tables11 of 37

Program Administrator Budgets, Three-Year Total2016-2018 Program Administrator BudgetNational GridJune 8, 2018
Program Planning and
Administration
Marketing and
Advertising
Participant
Incentive
Sales, Technical
Assistance & Training
Evaluation and Market
ResearchTotal Program Costs
A - Residential 10,590,508 15,081,901 279,930,656 47,830,950 9,070,857 362,504,872 19,505,173 382,010,045 54 2.73
A1 - Residential Whole House 5,885,460 5,160,176 165,964,468 37,903,517 4,621,958 219,535,579 10,763,003 230,298,582 100 2.42
A1a - Residential New Construction 414,649 80,172 10,601,730 1,325,343 484,677 12,906,571 815,827 13,722,398 1,434 3.43
A1b - Residential Multi-Family Retrofit 642,050 1,041,867 24,832,174 5,411,241 689,115 32,616,447 368,186 32,984,633 875 0.69
A1c - Residential Home Energy Services - Measures 3,751,511 1,922,362 113,213,737 14,808,358 2,756,015 136,451,983 9,026,633 145,478,616 4,416 3.15
A1d - Residential Home Energy Services - RCS 651,142 1,964,591 67,105 16,238,155 340,799 19,261,792 - 19,261,792 -
A1e - Residential Behavior/Feedback Program 426,107 151,184 17,249,722 120,420 351,352 18,298,786 552,357 18,851,143 9 1.89
A2 - Residential Products 2,521,763 5,980,237 91,805,833 6,999,542 4,417,345 111,724,719 8,742,170 120,466,889 25 4.10
A2a - Residential Heating & Cooling Equipment 428,233 659,971 13,295,563 1,556,615 669,570 16,609,953 322,816 16,932,768 524 1.54
A2b - Residential Consumer Products 433,964 2,467,514 4,629,067 3,272,135 299,108 11,101,788 397,622 11,499,410 233 2.28
A2c - Residential Lighting 1,659,565 2,852,752 73,881,203 2,170,792 3,448,667 84,012,979 8,021,732 92,034,711 19 4.84
A3 - Residential Hard-to-Measure 2,183,286 3,941,488 22,160,355 2,927,891 31,554 31,244,574 - 31,244,574 -
A3a - Residential Statewide Marketing - 1,423,544 - - 6,957 1,430,501 - 1,430,501 -
A3b - Residential Statewide Database 75,481 - - - - 75,481 - 75,481 -
A3c - Residential DOER Assessment 1,693,477 - - - - 1,693,477 - 1,693,477 -
A3d - Residential EEAC Consultants - - - - - - - -
A3e - Residential Sponsorships & Subscriptions 385,486 48,750 - - 1,983 436,219 - 436,219 -
A3f - Residential HEAT Loan 18,480 318,181 21,930,740 2,322,050 - 24,589,451 - 24,589,451 -
A3g - Residential Workforce Development - - - 354,459 - 354,459 - 354,459 -
A3h - Residential R&D and Demonstration 10,362 30,000 229,615 251,383 19,681 541,041 - 541,041 -
A3i - Residential Education (0) 2,121,013 - - 2,933 2,123,946 - 2,123,946 -
B - Low-Income 3,376,847 997,653 72,656,219 14,390,989 1,521,891 92,943,599 2,702,901 95,646,500 2,097 1.17
B1 - Low-Income Whole House 2,125,933 540,075 72,656,219 14,390,989 1,521,378 91,234,594 2,702,901 93,937,495 2,059 1.19
B1a - Low-Income Single Family Retrofit 1,164,297 405,749 35,445,949 6,702,977 798,650 44,517,622 1,908,010 46,425,632 2,479 1.59
B1b - Low-Income Multi-Family Retrofit 961,636 134,327 37,210,270 7,688,012 722,728 46,716,973 794,891 47,511,863 1,772 0.82
B2 - Low-Income Hard-to-Measure 1,250,914 457,578 - - 512 1,709,004 - 1,709,004 -
B2a - Low-Income Statewide Marketing - 443,734 - - - 443,734 - 443,734 -
B2b - Low-Income Statewide Database 18,849 - - - - 18,849 - 18,849 -
B2c - Low-Income DOER Assessment 515,394 - - - - 515,394 - 515,394 -
B2d - Low-Income Energy Affordability Network 608,044 - - - - 608,044 - 608,044 -
B2e - Low-Income Sponsorships & Subscriptions 108,628 13,844 - - 512 122,984 - 122,984 -
C - Commercial & Industrial 12,445,798 6,393,641 282,969,278 44,251,796 6,900,496 352,961,009 27,472,251 380,433,260 8,825 3.79
C1 - C&I New Construction 1,881,879 1,178,280 51,030,559 13,160,921 1,947,843 69,199,483 6,466,959 75,666,442 29,905 4.77
C1a - C&I New Buildings & Major Renovations 940,855 1,088,044 21,189,514 8,357,968 1,022,889 32,599,270 3,121,733 35,721,003 41,584 4.84
C1b - C&I Initial Purchase & End of Useful Life 941,024 90,236 29,841,045 4,802,953 924,954 36,600,212 3,345,226 39,945,439 23,921 4.70
C2 - C&I Retrofit 7,720,595 3,537,907 231,811,219 30,579,234 4,950,839 278,599,794 21,005,292 299,605,086 7,394 3.62
C2a - C&I Existing Building Retrofit 4,445,607 2,303,178 139,410,775 24,526,585 2,701,013 173,387,158 12,550,653 185,937,811 50,881 3.59
C2b - C&I Small Business 2,172,250 1,022,682 55,938,764 1,230,857 1,152,171 61,516,724 3,843,353 65,360,078 11,832 2.86
C2c - C&I Multifamily Retrofit 464,334 212,047 14,689,559 3,477,931 417,132 19,261,003 113,529 19,374,532 15,001 0.52
C2d - C&I Upstream Lighting 638,404 - 21,772,121 1,343,861 680,523 24,434,908 4,497,757 28,932,665 879 8.20
C3 - C&I Hard-to-Measure 2,843,325 1,677,454 127,500 511,640 1,814 5,161,732 - 5,161,732 -
C3a - C&I Statewide Marketing - 1,498,523 - - - 1,498,523 - 1,498,523 -
C3b - C&I Statewide Database 74,866 - - - - 74,866 - 74,866 -
C3c - C&I DOER Assessment 2,367,027 - - - - 2,367,027 - 2,367,027 -
C3d - C&I EEAC Consultants - - - - - - - -
C3e - C&I Sponsorships & Subscriptions 356,569 48,930 - 121,570 1,814 528,883 - 528,883 -
C3f - C&I Workforce Development - 130,000 127,500 225,511 - 483,011 - 483,011 -
C3g - C&I R&D and Demonstration 44,864 - - 164,559 - 209,423 - 209,423 -
Grand Total 26,413,153 22,473,195 635,556,153 106,473,734 17,493,244 808,409,479 49,680,325 858,089,804 120 3.01
Notes
• Where not otherwise indicated, budgets for each year are represented in nominal dollars (2016$, 2017$, 2018$).
• Refer to common definitions for allocation of costs.
• EEAC Consultant fees on the electric side do not get paid out of the Program Administrators' budgets, but are instead paid by the DOER out of the RGGI proceeds.
• The budgets in the above tables do not include costs associated with the Program Administrator's demand response activities.
• In accordance with the Department’s directive in 2016 2018 Three-Year Plans Order, D.P.U. 15-160 through D.P.U. 15-169 at 40, the Program Administrators are providing notice to the Department of a reclassification in cost categories for potential studies. Potential study costs were classified
as PP&A in the 2016-2018 Plan because they were expected to be expended as part of a planning process; however, the Program Administrators determined in 2016 that the costs are more appropriately classified as Evaluation and Market Research based on cost causation principles. While
potential studies continue to be a planning tool for the Program Administrators, these studies are more appropriately categorized as market research costs and therefore were charged to Evaluation and Market Research. All Program Administrators have made this change consistently. No other
change in cost categories has been made by the Program Administrators since the 2016-2018 Plan.
2016-2018 Program Administrator Budget
Program
Program CostsPerformance
Incentive
Total Program
Administrator Budget
Program Cost per
Participant
Resource Benefit
per Program Cost
Massachusetts Electric Company and Nantucket Electric Company d/b/a National Grid
D.P.U. 18-512017 Energy Efficiency Plan-Year Report
Master Data Tables12 of 37
Program Administrator Budgets, Plan Year SummaryDemand Response
National Grid
June 8, 2018
SectorProgram Planning and
Administration
Marketing and
Advertising
Participant
Incentive
Sales, Technical
Assistance & Training
Evaluation and Market
ResearchTotal Program Costs
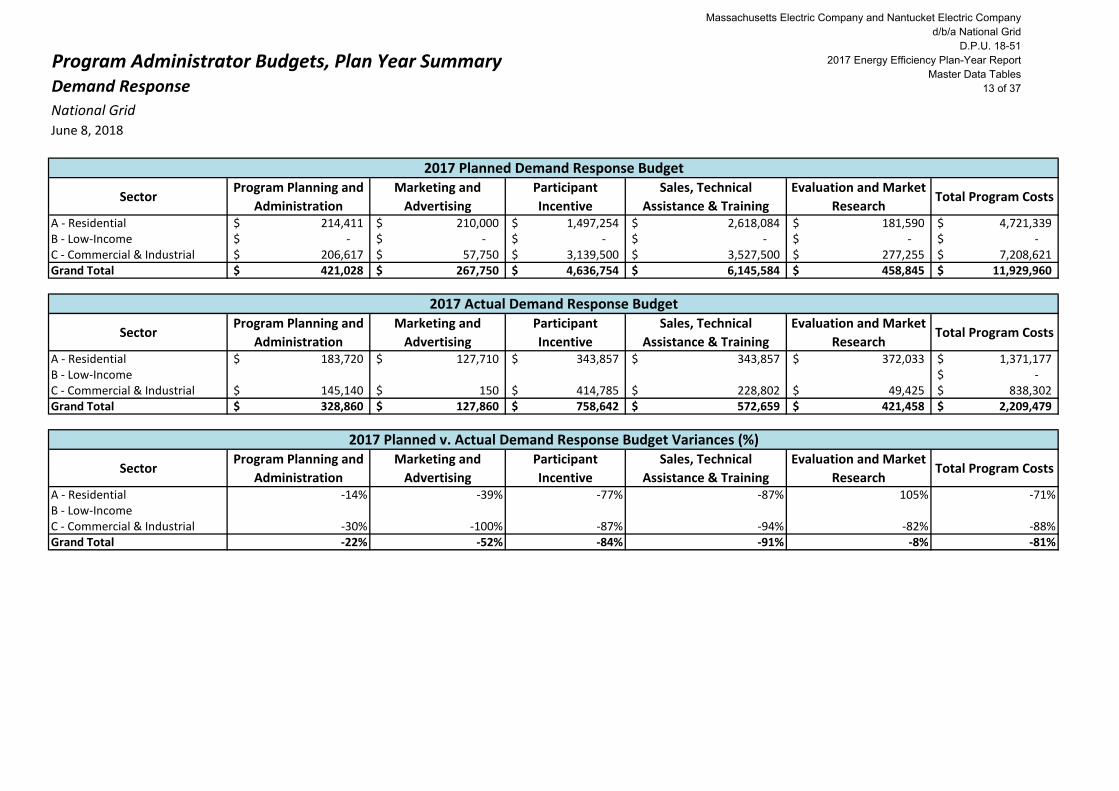
A - Residential 214,411$ 210,000$ 1,497,254$ 2,618,084$ 181,590$ 4,721,339$B - Low-Income -$ -$ -$ -$ -$ -$C - Commercial & Industrial 206,617$ 57,750$ 3,139,500$ 3,527,500$ 277,255$ 7,208,621$Grand Total 421,028$ 267,750$ 4,636,754$ 6,145,584$ 458,845$ 11,929,960$
SectorProgram Planning and
Administration
Marketing and
Advertising
Participant
Incentive
Sales, Technical
Assistance & Training
Evaluation and Market
ResearchTotal Program Costs
A - Residential 183,720$ 127,710$ 343,857$ 343,857$ 372,033$ 1,371,177$B - Low-Income -$C - Commercial & Industrial 145,140$ 150$ 414,785$ 228,802$ 49,425$ 838,302$Grand Total 328,860$ 127,860$ 758,642$ 572,659$ 421,458$ 2,209,479$
SectorProgram Planning and
Administration
Marketing and
Advertising
Participant
Incentive
Sales, Technical
Assistance & Training
Evaluation and Market
ResearchTotal Program Costs
A - Residential -14% -39% -77% -87% 105% -71%B - Low-IncomeC - Commercial & Industrial -30% -100% -87% -94% -82% -88%Grand Total -22% -52% -84% -91% -8% -81%
2017 Planned Demand Response Budget
2017 Actual Demand Response Budget
2017 Planned v. Actual Demand Response Budget Variances (%)
Massachusetts Electric Company and Nantucket Electric Company d/b/a National Grid
D.P.U. 18-512017 Energy Efficiency Plan-Year Report
Master Data Tables13 of 37

Program Savings, Plan Year Summary2017 Planned vs. EvaluatedNational GridJune 8, 2018
Summer Winter Annual Lifetime Annual Lifetime Annual Lifetime Annual Lifetime Annual Lifetime
A - Residential 2,004,068 44,064 57,886 331,603 2,455,409 (2,060,912) (19,745,180) 128,079 3,365,282 (15,320) 21,143 43,717,060 372,870,746
A1 - Residential Whole House 738,105 21,016 28,443 135,288 568,820 1,536 23,040 253,263 4,560,049 16,767 327,939 42,387,303 363,562,447
A1a - Residential New Construction 1,800 749 398 2,575 35,497 1,536 23,040 186 4,618 4,982 123,216 - -
A1b - Residential Multi-Family Retrofit 10,300 444 1,472 5,363 51,352 - - 5,308 86,563 - - 2,174,927 15,224,487
A1c - Residential Home Energy Services - Measures 11,846 6,730 8,637 43,418 398,040 - - 247,768 4,468,868 11,784 204,723 40,212,377 348,337,960
A1d - Residential Home Energy Services - RCS - - - - - - - - - - - - -
A1e - Residential Behavior/Feedback Program 714,159 13,094 17,936 83,931 83,931 - - - - - - - -
A2 - Residential Products 1,265,963 23,048 29,442 196,315 1,886,588 (2,062,448) (19,768,220) (125,184) (1,194,767) (32,087) (306,796) 1,329,757 9,308,300
A2a - Residential Heating & Cooling Equipment 18,829 686 1,192 5,783 76,162 (8,322) (149,805) - - - - - -
A2b - Residential Consumer Products 21,689 1,028 820 6,979 58,570 5,346 37,422 - - 219 1,531 1,329,757 9,308,300
A2c - Residential Lighting 1,225,445 21,335 27,430 183,554 1,751,857 (2,059,472) (19,655,838) (125,184) (1,194,767) (32,305) (308,327) - -
B - Low-Income 17,749 2,356 4,373 20,608 179,727 317 2,220 47,853 944,933 19 135 3,202,818 22,419,724
B1 - Low-Income Whole House 17,749 2,356 4,373 20,608 179,727 317 2,220 47,853 944,933 19 135 3,202,818 22,419,724
B1a - Low-Income Single Family Retrofit 5,200 1,339 1,375 8,146 78,042 317 2,220 42,914 850,118 19 135 803,143 5,621,998
B1b - Low-Income Multi-Family Retrofit 12,549 1,016 2,998 12,462 101,685 - - 4,939 94,815 - - 2,399,675 16,797,726
C - Commercial & Industrial 13,765 49,723 43,007 298,147 3,220,601 (822,616) (10,685,443) (75,354) (470,126) - - 7,266,628 95,756,613
C1 - C&I New Construction 505 13,112 11,095 57,157 908,421 168,804 2,933,435 (2,760) (40,414) - - - -
C1a - C&I New Buildings & Major Renovations 264 5,239 3,972 31,457 508,838 84,039 1,478,825 (3,023) (44,887) - - - -
C1b - C&I Initial Purchase & End of Useful Life 241 7,873 7,123 25,700 399,583 84,765 1,454,610 263 4,473 - - - -
C2 - C&I Retrofit 13,260 36,611 31,912 240,989 2,312,180 (991,420) (13,618,879) (72,594) (429,713) - - 7,266,628 95,756,613
C2a - C&I Existing Building Retrofit 855 13,784 12,483 102,491 1,302,883 (452,243) (9,702,890) 85 (9,906) - - 7,266,628 95,756,613
C2b - C&I Small Business 1,885 6,680 6,403 40,525 410,487 (166,773) (1,667,728) (1,886) (18,862) - - - -
C2c - C&I Multifamily Retrofit 200 247 1,343 4,572 30,443 (21,525) (132,162) (2,489) 10,879 - - - -
C2d - C&I Upstream Lighting 10,320 15,900 11,682 93,401 568,367 (350,879) (2,116,098) (68,303) (411,824) - - - -
Grand Total 2,035,582 96,143 105,266 650,358 5,855,737 (2,883,211) (30,428,403) 100,578 3,840,089 (15,301) 21,278 54,186,506 491,047,083
Summer Winter Annual Lifetime Annual Lifetime Annual Lifetime Annual Lifetime Annual Lifetime
A - Residential 2,589,515 58,693 64,743 411,208 2,503,263 (2,675,243) (18,577,066) 8,770 2,030,824 (22,246) 204,381 37,098,375 270,437,449
A1 - Residential Whole House 729,501 21,060 28,138 140,973 570,688 10,778 189,277 193,935 3,319,988 29,510 566,318 34,646,833 253,276,658
A1a - Residential New Construction 3,317 991 778 4,789 57,255 720 11,034 96 2,255 11,280 262,567 - -
A1b - Residential Multi-Family Retrofit 8,867 644 1,346 4,858 47,845 - - 2,001 32,343 351 4,253 3,935,136 27,545,953
A1c - Residential Home Energy Services - Measures 8,593 7,224 9,301 51,735 385,997 10,058 178,243 191,838 3,285,389 17,879 299,498 30,711,697 225,730,705
A1d - Residential Home Energy Services - RCS - - - - - - - - - - - - -
A1e - Residential Behavior/Feedback Program 708,724 12,201 16,714 79,591 79,591 - - - - - - - -
A2 - Residential Products 1,860,014 37,634 36,605 270,235 1,932,575 (2,686,021) (18,766,343) (185,165) (1,289,164) (51,756) (361,937) 2,451,542 17,160,791
A2a - Residential Heating & Cooling Equipment 6,590 1,144 893 6,290 86,331 (7,891) (135,226) (426) (4,260) (60) (596) - -
A2b - Residential Consumer Products 13,001 1,965 1,302 10,212 78,537 4,280 29,959 696 4,872 613 4,292 2,451,542 17,160,791
A2c - Residential Lighting 1,840,423 34,525 34,410 253,732 1,767,706 (2,682,410) (18,661,076) (185,435) (1,289,776) (52,310) (365,632) - -
B - Low-Income 12,728 1,826 9,489 18,939 216,732 641 5,868 31,197 617,298 867 15,777 2,237,393 16,947,632
B1 - Low-Income Whole House 12,728 1,826 9,489 18,939 216,732 641 5,868 31,197 617,298 867 15,777 2,237,393 16,947,632
B1a - Low-Income Single Family Retrofit 6,587 1,327 1,067 6,383 55,662 641 5,868 29,612 585,988 867 15,777 400,055 4,086,266
B1b - Low-Income Multi-Family Retrofit 6,141 499 8,422 12,556 161,070 - - 1,585 31,311 - - 1,837,338 12,861,366
C - Commercial & Industrial 11,881 43,821 43,719 294,124 3,774,261 (1,861,058) (32,041,628) (63,043) (704,986) 28 198 (14,617,014) (260,556,106)
C1 - C&I New Construction 813 7,236 7,523 47,465 747,126 35,760 764,914 (7,605) (109,356) - - (9,582,191) (191,643,828)
C1a - C&I New Buildings & Major Renovations 230 4,189 3,631 25,080 384,245 66,266 1,373,702 (6,084) (86,668) - - - -
C1b - C&I Initial Purchase & End of Useful Life 583 3,047 3,892 22,386 362,881 (30,506) (608,788) (1,521) (22,688) - - (9,582,191) (191,643,828)
C2 - C&I Retrofit 11,068 36,585 36,196 246,659 3,027,134 (1,896,819) (32,806,541) (55,438) (595,630) 28 198 (5,034,822) (68,912,278)
C2a - C&I Existing Building Retrofit 1,253 19,664 21,938 153,993 2,055,776 (1,444,022) (27,816,683) (21,694) (293,025) - - (5,426,346) (71,652,943)
C2b - C&I Small Business 1,609 7,536 6,189 39,950 495,780 (292,893) (3,590,050) (3,260) (39,941) - - - -
C2c - C&I Multifamily Retrofit 452 225 1,376 4,652 35,406 - - 624 10,914 28 198 391,524 2,740,665
C2d - C&I Upstream Lighting 7,754 9,159 6,693 48,064 440,173 (159,904) (1,399,808) (31,107) (273,578) - - - -
Grand Total 2,614,124 104,340 117,950 724,272 6,494,255 (4,535,660) (50,612,826) (23,076) 1,943,137 (21,351) 220,356 24,718,754 26,828,975
Energy (MWh) (Therms) Oil (MMBTU)
2017 Evaluated Net Savings
Propane (MMBTU) Water (Gallons)Program # of ParticipantsElectric Savings Natural Gas Savings Deliverable Fuel Savings
Other Savings
Propane (MMBTU) Water (Gallons)
2017 Planned Net Savings
Other Savings
Program # of ParticipantsElectric Savings Natural Gas Savings
Annual Capacity (kW) Energy (MWh) (Therms) Oil (MMBTU)
Deliverable Fuel Savings
Annual Capacity (kW)
Massachusetts Electric Company and Nantucket Electric Company d/b/a National Grid
D.P.U. 18-512017 Energy Efficiency Plan-Year Report
Master Data Tables14 of 37
Program Savings, Plan Year Summary2017 Planned vs. EvaluatedNational GridJune 8, 2018
Summer Winter Annual Lifetime Annual Lifetime Annual Lifetime Annual Lifetime Annual Lifetime
A - Residential 29% 33% 12% 24% 2% 30% -6% -93% -40% 45% 867% -15% -27%
A1 - Residential Whole House -1% 0% -1% 4% 0% 602% 722% -23% -27% 76% 73% -18% -30%
A1a - Residential New Construction 84% 32% 95% 86% 61% -53% -52% -48% -51% 126% 113%
A1b - Residential Multi-Family Retrofit -14% 45% -9% -9% -7% -62% -63% 81% 81%
A1c - Residential Home Energy Services - Measures -27% 7% 8% 19% -3% -23% -26% 52% 46% -24% -35%
A1d - Residential Home Energy Services - RCS
A1e - Residential Behavior/Feedback Program -1% -7% -7% -5% -5%
A2 - Residential Products 47% 63% 24% 38% 2% 30% -5% 48% 8% 61% 18% 84% 84%
A2a - Residential Heating & Cooling Equipment -65% 67% -25% 9% 13% -5% -10%
A2b - Residential Consumer Products -40% 91% 59% 46% 34% -20% -20% 180% 180% 84% 84%
A2c - Residential Lighting 50% 62% 25% 38% 1% 30% -5% 48% 8% 62% 19%
B - Low-Income -28% -23% 117% -8% 21% 102% 164% -35% -35% 4405% 11615% -30% -24%
B1 - Low-Income Whole House -28% -23% 117% -8% 21% 102% 164% -35% -35% 4405% 11615% -30% -24%
B1a - Low-Income Single Family Retrofit 27% -1% -22% -22% -29% 102% 164% -31% -31% 4405% 11615% -50% -27%
B1b - Low-Income Multi-Family Retrofit -51% -51% 181% 1% 58% -68% -67% -23% -23%
C - Commercial & Industrial -14% -12% 2% -1% 17% 126% 200% -16% 50% -301% -372%
C1 - C&I New Construction 61% -45% -32% -17% -18% -79% -74% 176% 171%
C1a - C&I New Buildings & Major Renovations -13% -20% -9% -20% -24% -21% -7% 101% 93%
C1b - C&I Initial Purchase & End of Useful Life 142% -61% -45% -13% -9% -136% -142% -678% -607%
C2 - C&I Retrofit -17% 0% 13% 2% 31% 91% 141% -24% 39% -169% -172%
C2a - C&I Existing Building Retrofit 47% 43% 76% 50% 58% 219% 187% -25618% 2858% -175% -175%
C2b - C&I Small Business -15% 13% -3% -1% 21% 76% 115% 73% 112%
C2c - C&I Multifamily Retrofit 126% -9% 2% 2% 16% -100% -100% -125% 0%
C2d - C&I Upstream Lighting -25% -42% -43% -49% -23% -54% -34% -54% -34%
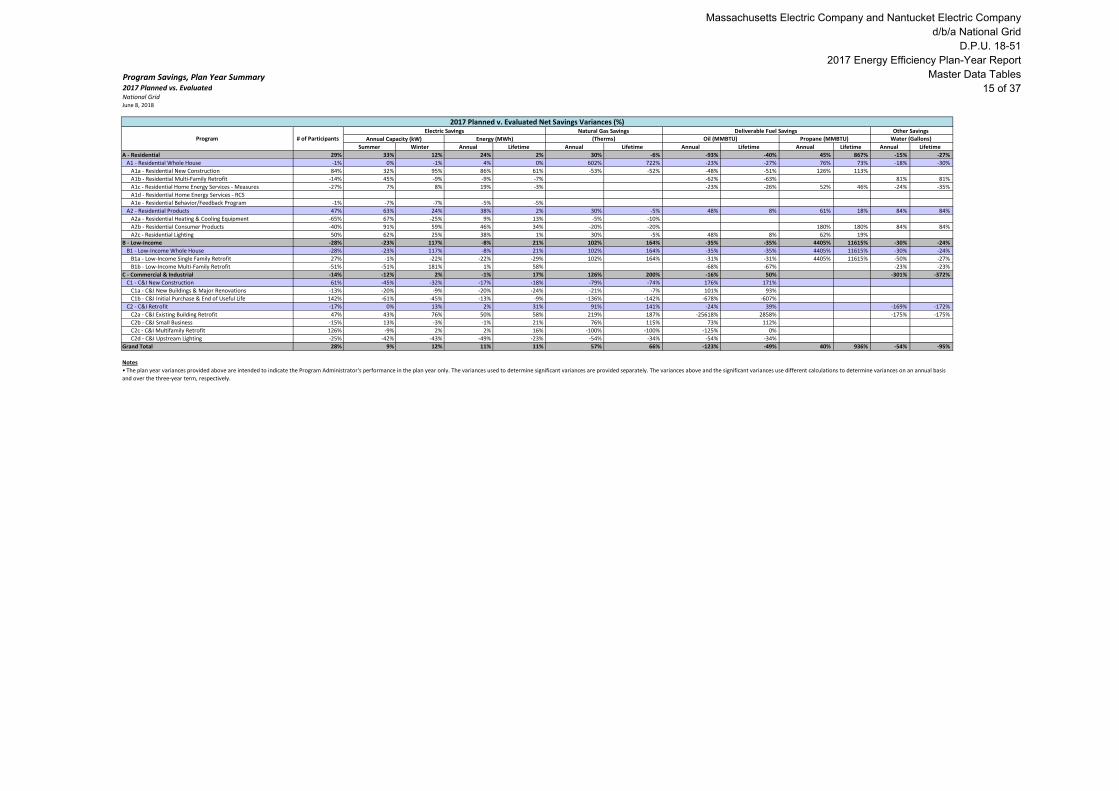
Grand Total 28% 9% 12% 11% 11% 57% 66% -123% -49% 40% 936% -54% -95%
Notes
2017 Planned v. Evaluated Net Savings Variances (%)
Program # of ParticipantsElectric Savings Natural Gas Savings Deliverable Fuel Savings Other Savings
Annual Capacity (kW) Energy (MWh) (Therms) Oil (MMBTU) Propane (MMBTU) Water (Gallons)
• The plan year variances provided above are intended to indicate the Program Administrator's performance in the plan year only. The variances used to determine significant variances are provided separately. The variances above and the significant variances use different calculations to determine variances on an annual basis
and over the three-year term, respectively.
Massachusetts Electric Company and Nantucket Electric Company d/b/a National Grid
D.P.U. 18-512017 Energy Efficiency Plan-Year Report
Master Data Tables15 of 37
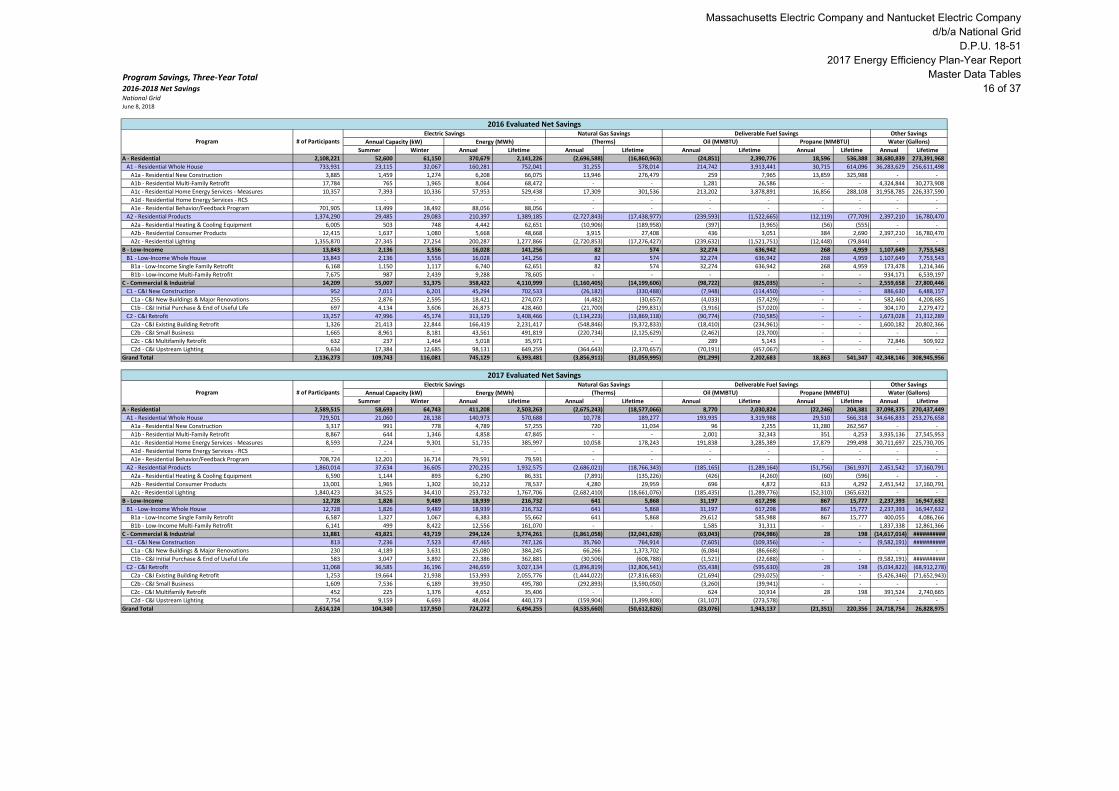
Program Savings, Three-Year Total2016-2018 Net SavingsNational GridJune 8, 2018
Summer Winter Annual Lifetime Annual Lifetime Annual Lifetime Annual Lifetime Annual Lifetime
A - Residential 2,108,221 52,600 61,150 370,679 2,141,226 (2,696,588) (16,860,963) (24,851) 2,390,776 18,596 536,388 38,680,839 273,391,968
A1 - Residential Whole House 733,931 23,115 32,067 160,281 752,041 31,255 578,014 214,742 3,913,441 30,715 614,096 36,283,629 256,611,498
A1a - Residential New Construction 3,885 1,459 1,274 6,208 66,075 13,946 276,479 259 7,965 13,859 325,988 - -
A1b - Residential Multi-Family Retrofit 17,784 765 1,965 8,064 68,472 - - 1,281 26,586 - - 4,324,844 30,273,908
A1c - Residential Home Energy Services - Measures 10,357 7,393 10,336 57,953 529,438 17,309 301,536 213,202 3,878,891 16,856 288,108 31,958,785 226,337,590
A1d - Residential Home Energy Services - RCS - - - - - - - - - - - - -
A1e - Residential Behavior/Feedback Program 701,905 13,499 18,492 88,056 88,056 - - - - - - - -
A2 - Residential Products 1,374,290 29,485 29,083 210,397 1,389,185 (2,727,843) (17,438,977) (239,593) (1,522,665) (12,119) (77,709) 2,397,210 16,780,470
A2a - Residential Heating & Cooling Equipment 6,005 503 748 4,442 62,651 (10,906) (189,958) (397) (3,965) (56) (555) - -
A2b - Residential Consumer Products 12,415 1,637 1,080 5,668 48,668 3,915 27,408 436 3,051 384 2,690 2,397,210 16,780,470
A2c - Residential Lighting 1,355,870 27,345 27,254 200,287 1,277,866 (2,720,853) (17,276,427) (239,632) (1,521,751) (12,448) (79,844) - -
B - Low-Income 13,843 2,136 3,556 16,028 141,256 82 574 32,274 636,942 268 4,959 1,107,649 7,753,543
B1 - Low-Income Whole House 13,843 2,136 3,556 16,028 141,256 82 574 32,274 636,942 268 4,959 1,107,649 7,753,543
B1a - Low-Income Single Family Retrofit 6,168 1,150 1,117 6,740 62,651 82 574 32,274 636,942 268 4,959 173,478 1,214,346
B1b - Low-Income Multi-Family Retrofit 7,675 987 2,439 9,288 78,605 - - - - - - 934,171 6,539,197
C - Commercial & Industrial 14,209 55,007 51,375 358,422 4,110,999 (1,160,405) (14,199,606) (98,722) (825,035) - - 2,559,658 27,800,446
C1 - C&I New Construction 952 7,011 6,201 45,294 702,533 (26,182) (330,488) (7,948) (114,450) - - 886,630 6,488,157
C1a - C&I New Buildings & Major Renovations 255 2,876 2,595 18,421 274,073 (4,482) (30,657) (4,033) (57,429) - - 582,460 4,208,685
C1b - C&I Initial Purchase & End of Useful Life 697 4,134 3,606 26,873 428,460 (21,700) (299,831) (3,916) (57,020) - - 304,170 2,279,472
C2 - C&I Retrofit 13,257 47,996 45,174 313,129 3,408,466 (1,134,223) (13,869,118) (90,774) (710,585) - - 1,673,028 21,312,289
C2a - C&I Existing Building Retrofit 1,326 21,413 22,844 166,419 2,231,417 (548,846) (9,372,833) (18,410) (234,961) - - 1,600,182 20,802,366
C2b - C&I Small Business 1,665 8,961 8,181 43,561 491,819 (220,734) (2,125,629) (2,462) (23,700) - - - -
C2c - C&I Multifamily Retrofit 632 237 1,464 5,018 35,971 - - 289 5,143 - - 72,846 509,922
C2d - C&I Upstream Lighting 9,634 17,384 12,685 98,131 649,259 (364,643) (2,370,657) (70,191) (457,067) - - - -
Grand Total 2,136,273 109,743 116,081 745,129 6,393,481 (3,856,911) (31,059,995) (91,299) 2,202,683 18,863 541,347 42,348,146 308,945,956
Summer Winter Annual Lifetime Annual Lifetime Annual Lifetime Annual Lifetime Annual Lifetime
A - Residential 2,589,515 58,693 64,743 411,208 2,503,263 (2,675,243) (18,577,066) 8,770 2,030,824 (22,246) 204,381 37,098,375 270,437,449
A1 - Residential Whole House 729,501 21,060 28,138 140,973 570,688 10,778 189,277 193,935 3,319,988 29,510 566,318 34,646,833 253,276,658
A1a - Residential New Construction 3,317 991 778 4,789 57,255 720 11,034 96 2,255 11,280 262,567 - -
A1b - Residential Multi-Family Retrofit 8,867 644 1,346 4,858 47,845 - - 2,001 32,343 351 4,253 3,935,136 27,545,953
A1c - Residential Home Energy Services - Measures 8,593 7,224 9,301 51,735 385,997 10,058 178,243 191,838 3,285,389 17,879 299,498 30,711,697 225,730,705
A1d - Residential Home Energy Services - RCS - - - - - - - - - - - - -
A1e - Residential Behavior/Feedback Program 708,724 12,201 16,714 79,591 79,591 - - - - - - - -
A2 - Residential Products 1,860,014 37,634 36,605 270,235 1,932,575 (2,686,021) (18,766,343) (185,165) (1,289,164) (51,756) (361,937) 2,451,542 17,160,791
A2a - Residential Heating & Cooling Equipment 6,590 1,144 893 6,290 86,331 (7,891) (135,226) (426) (4,260) (60) (596) - -
A2b - Residential Consumer Products 13,001 1,965 1,302 10,212 78,537 4,280 29,959 696 4,872 613 4,292 2,451,542 17,160,791
A2c - Residential Lighting 1,840,423 34,525 34,410 253,732 1,767,706 (2,682,410) (18,661,076) (185,435) (1,289,776) (52,310) (365,632) - -
B - Low-Income 12,728 1,826 9,489 18,939 216,732 641 5,868 31,197 617,298 867 15,777 2,237,393 16,947,632
B1 - Low-Income Whole House 12,728 1,826 9,489 18,939 216,732 641 5,868 31,197 617,298 867 15,777 2,237,393 16,947,632
B1a - Low-Income Single Family Retrofit 6,587 1,327 1,067 6,383 55,662 641 5,868 29,612 585,988 867 15,777 400,055 4,086,266
B1b - Low-Income Multi-Family Retrofit 6,141 499 8,422 12,556 161,070 - - 1,585 31,311 - - 1,837,338 12,861,366
C - Commercial & Industrial 11,881 43,821 43,719 294,124 3,774,261 (1,861,058) (32,041,628) (63,043) (704,986) 28 198 (14,617,014) ##########
C1 - C&I New Construction 813 7,236 7,523 47,465 747,126 35,760 764,914 (7,605) (109,356) - - (9,582,191) ##########
C1a - C&I New Buildings & Major Renovations 230 4,189 3,631 25,080 384,245 66,266 1,373,702 (6,084) (86,668) - - - -
C1b - C&I Initial Purchase & End of Useful Life 583 3,047 3,892 22,386 362,881 (30,506) (608,788) (1,521) (22,688) - - (9,582,191) ##########
C2 - C&I Retrofit 11,068 36,585 36,196 246,659 3,027,134 (1,896,819) (32,806,541) (55,438) (595,630) 28 198 (5,034,822) (68,912,278)
C2a - C&I Existing Building Retrofit 1,253 19,664 21,938 153,993 2,055,776 (1,444,022) (27,816,683) (21,694) (293,025) - - (5,426,346) (71,652,943)
C2b - C&I Small Business 1,609 7,536 6,189 39,950 495,780 (292,893) (3,590,050) (3,260) (39,941) - - - -
C2c - C&I Multifamily Retrofit 452 225 1,376 4,652 35,406 - - 624 10,914 28 198 391,524 2,740,665
C2d - C&I Upstream Lighting 7,754 9,159 6,693 48,064 440,173 (159,904) (1,399,808) (31,107) (273,578) - - - -
Grand Total 2,614,124 104,340 117,950 724,272 6,494,255 (4,535,660) (50,612,826) (23,076) 1,943,137 (21,351) 220,356 24,718,754 26,828,975
2017 Evaluated Net SavingsNatural Gas SavingsElectric Savings Other SavingsDeliverable Fuel Savings
Propane (MMBTU) Water (Gallons)# of ParticipantsProgram Annual Capacity (kW) Energy (MWh) (Therms) Oil (MMBTU)
Oil (MMBTU) Propane (MMBTU) Water (Gallons)
2016 Evaluated Net Savings
Program # of ParticipantsElectric Savings Natural Gas Savings Deliverable Fuel Savings Other Savings
Annual Capacity (kW) Energy (MWh) (Therms)
Massachusetts Electric Company and Nantucket Electric Company d/b/a National Grid
D.P.U. 18-512017 Energy Efficiency Plan-Year Report
Master Data Tables16 of 37
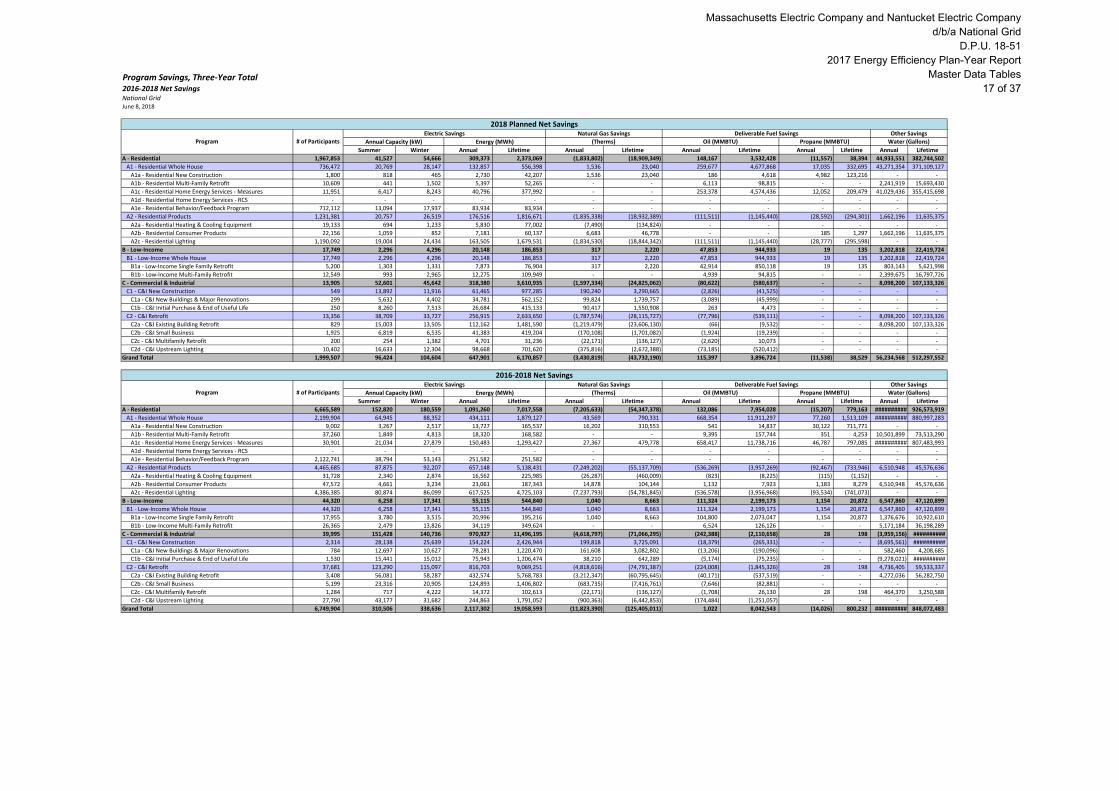
Program Savings, Three-Year Total2016-2018 Net SavingsNational GridJune 8, 2018
Summer Winter Annual Lifetime Annual Lifetime Annual Lifetime Annual Lifetime Annual Lifetime
A - Residential 1,967,853 41,527 54,666 309,373 2,373,069 (1,833,802) (18,909,349) 148,167 3,532,428 (11,557) 38,394 44,933,551 382,744,502
A1 - Residential Whole House 736,472 20,769 28,147 132,857 556,398 1,536 23,040 259,677 4,677,868 17,035 332,695 43,271,354 371,109,127
A1a - Residential New Construction 1,800 818 465 2,730 42,207 1,536 23,040 186 4,618 4,982 123,216 - -
A1b - Residential Multi-Family Retrofit 10,609 441 1,502 5,397 52,265 - - 6,113 98,815 - - 2,241,919 15,693,430
A1c - Residential Home Energy Services - Measures 11,951 6,417 8,243 40,796 377,992 - - 253,378 4,574,436 12,052 209,479 41,029,436 355,415,698
A1d - Residential Home Energy Services - RCS - - - - - - - - - - - - -
A1e - Residential Behavior/Feedback Program 712,112 13,094 17,937 83,934 83,934 - - - - - - - -
A2 - Residential Products 1,231,381 20,757 26,519 176,516 1,816,671 (1,835,338) (18,932,389) (111,511) (1,145,440) (28,592) (294,301) 1,662,196 11,635,375
A2a - Residential Heating & Cooling Equipment 19,133 694 1,233 5,830 77,002 (7,490) (134,824) - - - - - -
A2b - Residential Consumer Products 22,156 1,059 852 7,181 60,137 6,683 46,778 - - 185 1,297 1,662,196 11,635,375
A2c - Residential Lighting 1,190,092 19,004 24,434 163,505 1,679,531 (1,834,530) (18,844,342) (111,511) (1,145,440) (28,777) (295,598) - -
B - Low-Income 17,749 2,296 4,296 20,148 186,853 317 2,220 47,853 944,933 19 135 3,202,818 22,419,724
B1 - Low-Income Whole House 17,749 2,296 4,296 20,148 186,853 317 2,220 47,853 944,933 19 135 3,202,818 22,419,724
B1a - Low-Income Single Family Retrofit 5,200 1,303 1,331 7,873 76,904 317 2,220 42,914 850,118 19 135 803,143 5,621,998
B1b - Low-Income Multi-Family Retrofit 12,549 993 2,965 12,275 109,949 - - 4,939 94,815 - - 2,399,675 16,797,726
C - Commercial & Industrial 13,905 52,601 45,642 318,380 3,610,935 (1,597,334) (24,825,062) (80,622) (580,637) - - 8,098,200 107,133,326
C1 - C&I New Construction 549 13,892 11,916 61,465 977,285 190,240 3,290,665 (2,826) (41,525) - - - -
C1a - C&I New Buildings & Major Renovations 299 5,632 4,402 34,781 562,152 99,824 1,739,757 (3,089) (45,999) - - - -
C1b - C&I Initial Purchase & End of Useful Life 250 8,260 7,513 26,684 415,133 90,417 1,550,908 263 4,473 - - - -
C2 - C&I Retrofit 13,356 38,709 33,727 256,915 2,633,650 (1,787,574) (28,115,727) (77,796) (539,111) - - 8,098,200 107,133,326
C2a - C&I Existing Building Retrofit 829 15,003 13,505 112,162 1,481,590 (1,219,479) (23,606,130) (66) (9,532) - - 8,098,200 107,133,326
C2b - C&I Small Business 1,925 6,819 6,535 41,383 419,204 (170,108) (1,701,082) (1,924) (19,239) - - - -
C2c - C&I Multifamily Retrofit 200 254 1,382 4,701 31,236 (22,171) (136,127) (2,620) 10,073 - - - -
C2d - C&I Upstream Lighting 10,402 16,633 12,304 98,668 701,620 (375,816) (2,672,388) (73,185) (520,412) - - - -
Grand Total 1,999,507 96,424 104,604 647,901 6,170,857 (3,430,819) (43,732,190) 115,397 3,896,724 (11,538) 38,529 56,234,568 512,297,552
Summer Winter Annual Lifetime Annual Lifetime Annual Lifetime Annual Lifetime Annual Lifetime
A - Residential 6,665,589 152,820 180,559 1,091,260 7,017,558 (7,205,633) (54,347,378) 132,086 7,954,028 (15,207) 779,163 ########## 926,573,919
A1 - Residential Whole House 2,199,904 64,945 88,352 434,111 1,879,127 43,569 790,331 668,354 11,911,297 77,260 1,513,109 ########## 880,997,283
A1a - Residential New Construction 9,002 3,267 2,517 13,727 165,537 16,202 310,553 541 14,837 30,122 711,771 - -
A1b - Residential Multi-Family Retrofit 37,260 1,849 4,813 18,320 168,582 - - 9,395 157,744 351 4,253 10,501,899 73,513,290
A1c - Residential Home Energy Services - Measures 30,901 21,034 27,879 150,483 1,293,427 27,367 479,778 658,417 11,738,716 46,787 797,085 ########## 807,483,993
A1d - Residential Home Energy Services - RCS - - - - - - - - - - - - -
A1e - Residential Behavior/Feedback Program 2,122,741 38,794 53,143 251,582 251,582 - - - - - - - -
A2 - Residential Products 4,465,685 87,875 92,207 657,148 5,138,431 (7,249,202) (55,137,709) (536,269) (3,957,269) (92,467) (733,946) 6,510,948 45,576,636
A2a - Residential Heating & Cooling Equipment 31,728 2,340 2,874 16,562 225,985 (26,287) (460,009) (823) (8,225) (115) (1,152) - -
A2b - Residential Consumer Products 47,572 4,661 3,234 23,061 187,343 14,878 104,144 1,132 7,923 1,183 8,279 6,510,948 45,576,636
A2c - Residential Lighting 4,386,385 80,874 86,099 617,525 4,725,103 (7,237,793) (54,781,845) (536,578) (3,956,968) (93,534) (741,073) - -
B - Low-Income 44,320 6,258 17,341 55,115 544,840 1,040 8,663 111,324 2,199,173 1,154 20,872 6,547,860 47,120,899
B1 - Low-Income Whole House 44,320 6,258 17,341 55,115 544,840 1,040 8,663 111,324 2,199,173 1,154 20,872 6,547,860 47,120,899
B1a - Low-Income Single Family Retrofit 17,955 3,780 3,515 20,996 195,216 1,040 8,663 104,800 2,073,047 1,154 20,872 1,376,676 10,922,610
B1b - Low-Income Multi-Family Retrofit 26,365 2,479 13,826 34,119 349,624 - - 6,524 126,126 - - 5,171,184 36,198,289
C - Commercial & Industrial 39,995 151,428 140,736 970,927 11,496,195 (4,618,797) (71,066,295) (242,388) (2,110,658) 28 198 (3,959,156) ##########
C1 - C&I New Construction 2,314 28,138 25,639 154,224 2,426,944 199,818 3,725,091 (18,379) (265,331) - - (8,695,561) ##########
C1a - C&I New Buildings & Major Renovations 784 12,697 10,627 78,281 1,220,470 161,608 3,082,802 (13,206) (190,096) - - 582,460 4,208,685
C1b - C&I Initial Purchase & End of Useful Life 1,530 15,441 15,012 75,943 1,206,474 38,210 642,289 (5,174) (75,235) - - (9,278,021) ##########
C2 - C&I Retrofit 37,681 123,290 115,097 816,703 9,069,251 (4,818,616) (74,791,387) (224,008) (1,845,326) 28 198 4,736,405 59,533,337
C2a - C&I Existing Building Retrofit 3,408 56,081 58,287 432,574 5,768,783 (3,212,347) (60,795,645) (40,171) (537,519) - - 4,272,036 56,282,750
C2b - C&I Small Business 5,199 23,316 20,905 124,893 1,406,802 (683,735) (7,416,761) (7,646) (82,881) - - - -
C2c - C&I Multifamily Retrofit 1,284 717 4,222 14,372 102,613 (22,171) (136,127) (1,708) 26,130 28 198 464,370 3,250,588
C2d - C&I Upstream Lighting 27,790 43,177 31,682 244,863 1,791,052 (900,363) (6,442,853) (174,484) (1,251,057) - - - -
Grand Total 6,749,904 310,506 338,636 2,117,302 19,058,593 (11,823,390) (125,405,011) 1,022 8,042,543 (14,026) 800,232 ########## 848,072,483
(Therms) Oil (MMBTU) Propane (MMBTU) Water (Gallons)
2018 Planned Net Savings
Program # of ParticipantsElectric Savings Natural Gas Savings Deliverable Fuel Savings Other Savings
Annual Capacity (kW) Energy (MWh)
Oil (MMBTU) Propane (MMBTU) Water (Gallons)
2016-2018 Net Savings
Program # of ParticipantsElectric Savings Natural Gas Savings Deliverable Fuel Savings Other Savings
Annual Capacity (kW) Energy (MWh) (Therms)
Massachusetts Electric Company and Nantucket Electric Company d/b/a National Grid
D.P.U. 18-512017 Energy Efficiency Plan-Year Report
Master Data Tables17 of 37

Program Benefits, Plan Year Summary2017 Planned vs. EvaluatedNational GridJune 8, 2018
Summer Generation Trans. Distrib.Electric Capacity
DRIPETotal Capacity Benefits Electric
Electric Energy
DRIPETotal Energy Benefits
A - Residential 52,608,966$ 3,852,140$ 30,234,909$ -$ 86,696,015$ 186,383,932$ 23,385,817$ 209,769,750$
A1 - Residential Whole House 17,278,347$ 1,274,881$ 10,006,361$ -$ 28,559,589$ 43,078,750$ 7,598,991$ 50,677,741$
A1a - Residential New Construction 2,709,341$ 174,050$ 1,366,095$ -$ 4,249,486$ 2,911,035$ 215,574$ 3,126,608$
A1b - Residential Multi-Family Retrofit 549,457$ 42,210$ 331,297$ -$ 922,963$ 3,895,045$ 429,678$ 4,324,722$
A1c - Residential Home Energy Services - Measures 12,901,656$ 902,590$ 7,084,299$ -$ 20,888,544$ 30,080,778$ 3,461,622$ 33,542,401$
A1d - Residential Home Energy Services - RCS -$ -$ -$ -$ -$ -$ -$ -$
A1e - Residential Behavior/Feedback Program 1,117,894$ 156,032$ 1,224,669$ -$ 2,498,595$ 6,191,892$ 3,492,117$ 9,684,010$
A2 - Residential Products 35,330,619$ 2,577,260$ 20,228,548$ -$ 58,136,426$ 143,305,182$ 15,786,827$ 159,092,009$
A2a - Residential Heating & Cooling Equipment 1,553,821$ 106,046$ 832,341$ -$ 2,492,208$ 5,862,531$ 482,834$ 6,345,365$
A2b - Residential Consumer Products 1,357,483$ 102,968$ 808,178$ -$ 2,268,629$ 4,040,437$ 521,054$ 4,561,491$
A2c - Residential Lighting 32,419,315$ 2,368,246$ 18,588,028$ -$ 53,375,589$ 133,402,215$ 14,782,939$ 148,185,154$
B - Low-Income 3,925,064$ 282,403$ 2,216,539$ -$ 6,424,006$ 13,147,124$ 1,585,033$ 14,732,157$
B1 - Low-Income Whole House 3,925,064$ 282,403$ 2,216,539$ -$ 6,424,006$ 13,147,124$ 1,585,033$ 14,732,157$
B1a - Low-Income Single Family Retrofit 2,479,955$ 175,061$ 1,374,026$ -$ 4,029,042$ 5,705,477$ 645,565$ 6,351,043$
B1b - Low-Income Multi-Family Retrofit 1,445,109$ 107,342$ 842,514$ -$ 2,394,964$ 7,441,646$ 939,467$ 8,381,114$
C - Commercial & Industrial 91,893,431$ 6,481,353$ 50,871,227$ -$ 149,246,012$ 241,851,776$ 24,071,009$ 265,922,785$
C1 - C&I New Construction 37,364,132$ 2,467,637$ 19,368,135$ -$ 59,199,904$ 72,696,092$ 4,999,497$ 77,695,589$
C1a - C&I New Buildings & Major Renovations 14,371,589$ 953,861$ 7,486,721$ -$ 22,812,171$ 41,106,679$ 2,779,992$ 43,886,671$
C1b - C&I Initial Purchase & End of Useful Life 22,992,543$ 1,513,776$ 11,881,413$ -$ 36,387,733$ 31,589,413$ 2,219,505$ 33,808,918$
C2 - C&I Retrofit 54,529,299$ 4,013,716$ 31,503,093$ -$ 90,046,108$ 169,155,684$ 19,071,512$ 188,227,196$
C2a - C&I Existing Building Retrofit 29,820,024$ 2,057,848$ 16,151,757$ -$ 48,029,628$ 98,022,861$ 8,476,944$ 106,499,805$
C2b - C&I Small Business 10,871,194$ 790,530$ 6,204,761$ -$ 17,866,486$ 29,506,692$ 3,227,982$ 32,734,674$
C2c - C&I Multifamily Retrofit 257,647$ 20,559$ 161,363$ -$ 439,569$ 2,106,973$ 342,250$ 2,449,223$
C2d - C&I Upstream Lighting 13,580,434$ 1,144,779$ 8,985,212$ -$ 23,710,425$ 39,519,158$ 7,024,336$ 46,543,495$
Grand Total 148,427,461$ 10,615,896$ 83,322,675$ -$ 242,366,032$ 441,382,832$ 49,041,860$ 490,424,691$
Summer Generation Trans. Distrib.Electric Capacity
DRIPETotal Capacity Benefits Electric
Electric Energy
DRIPETotal Energy Benefits
A - Residential 52,003,372$ 4,172,864$ 32,752,219$ -$ 88,928,455$ 176,800,403$ 29,021,440$ 205,821,844$
A1 - Residential Whole House 12,870,034$ 1,035,666$ 8,128,796$ -$ 22,034,495$ 41,795,824$ 8,114,078$ 49,909,902$
A1a - Residential New Construction 2,571,125$ 171,660$ 1,347,333$ -$ 4,090,118$ 4,704,060$ 391,744$ 5,095,804$
A1b - Residential Multi-Family Retrofit 1,113,034$ 79,327$ 622,627$ -$ 1,814,988$ 3,699,093$ 387,831$ 4,086,925$
A1c - Residential Home Energy Services - Measures 8,144,162$ 639,281$ 5,017,624$ -$ 13,801,066$ 27,525,245$ 4,018,721$ 31,543,966$
A1d - Residential Home Energy Services - RCS -$ -$ -$ -$ -$ -$ -$ -$
A1e - Residential Behavior/Feedback Program 1,041,713$ 145,398$ 1,141,212$ -$ 2,328,323$ 5,867,426$ 3,315,781$ 9,183,207$
A2 - Residential Products 39,133,339$ 3,137,198$ 24,623,423$ -$ 66,893,959$ 135,004,579$ 20,907,363$ 155,911,941$
A2a - Residential Heating & Cooling Equipment 1,758,465$ 122,273$ 959,705$ -$ 2,840,444$ 6,753,266$ 527,459$ 7,280,725$
A2b - Residential Consumer Products 2,406,013$ 185,448$ 1,455,558$ -$ 4,047,019$ 5,352,063$ 748,476$ 6,100,540$
A2c - Residential Lighting 34,968,861$ 2,829,476$ 22,208,160$ -$ 60,006,496$ 122,899,249$ 19,631,428$ 142,530,677$
B - Low-Income 2,965,047$ 214,206$ 1,681,273$ -$ 4,860,526$ 16,860,719$ 1,545,637$ 18,406,357$
B1 - Low-Income Whole House 2,965,047$ 214,206$ 1,681,273$ -$ 4,860,526$ 16,860,719$ 1,545,637$ 18,406,357$
B1a - Low-Income Single Family Retrofit 2,212,461$ 159,093$ 1,248,697$ -$ 3,620,250$ 4,028,278$ 498,003$ 4,526,281$
B1b - Low-Income Multi-Family Retrofit 752,586$ 55,113$ 432,576$ -$ 1,240,276$ 12,832,441$ 1,047,634$ 13,880,075$
C - Commercial & Industrial 93,400,027$ 6,441,669$ 50,559,756$ -$ 150,401,452$ 288,089,489$ 24,529,704$ 312,619,193$
C1 - C&I New Construction 19,348,763$ 1,288,435$ 10,112,745$ -$ 30,749,944$ 59,447,744$ 4,107,584$ 63,555,328$
C1a - C&I New Buildings & Major Renovations 10,864,264$ 726,518$ 5,702,339$ -$ 17,293,121$ 30,372,674$ 2,168,967$ 32,541,641$
C1b - C&I Initial Purchase & End of Useful Life 8,484,499$ 561,917$ 4,410,407$ -$ 13,456,822$ 29,075,070$ 1,938,617$ 31,013,687$
C2 - C&I Retrofit 74,051,263$ 5,153,234$ 40,447,011$ -$ 119,651,509$ 228,641,744$ 20,422,121$ 249,063,865$
C2a - C&I Existing Building Retrofit 45,266,665$ 3,087,158$ 24,230,670$ -$ 72,584,494$ 155,958,647$ 12,735,960$ 168,694,607$
C2b - C&I Small Business 15,528,488$ 1,078,568$ 8,465,528$ -$ 25,072,584$ 37,341,509$ 3,347,843$ 40,689,352$
C2c - C&I Multifamily Retrofit 238,547$ 18,983$ 148,993$ -$ 406,523$ 2,474,778$ 350,283$ 2,825,061$
C2d - C&I Upstream Lighting 13,017,563$ 968,525$ 7,601,820$ -$ 21,587,908$ 32,866,810$ 3,988,035$ 36,854,845$
Grand Total 148,368,446$ 10,828,739$ 84,993,248$ -$ 244,190,433$ 481,750,611$ 55,096,782$ 536,847,393$
Capacity Energy
2017 Planned Benefits
2017 Evaluated Benefits
Capacity Energy
Electric Benefits
Program
Program
Electric Benefits
Massachusetts Electric Company and Nantucket Electric Company d/b/a National Grid
D.P.U. 18-512017 Energy Efficiency Plan-Year Report
Master Data Tables18 of 37
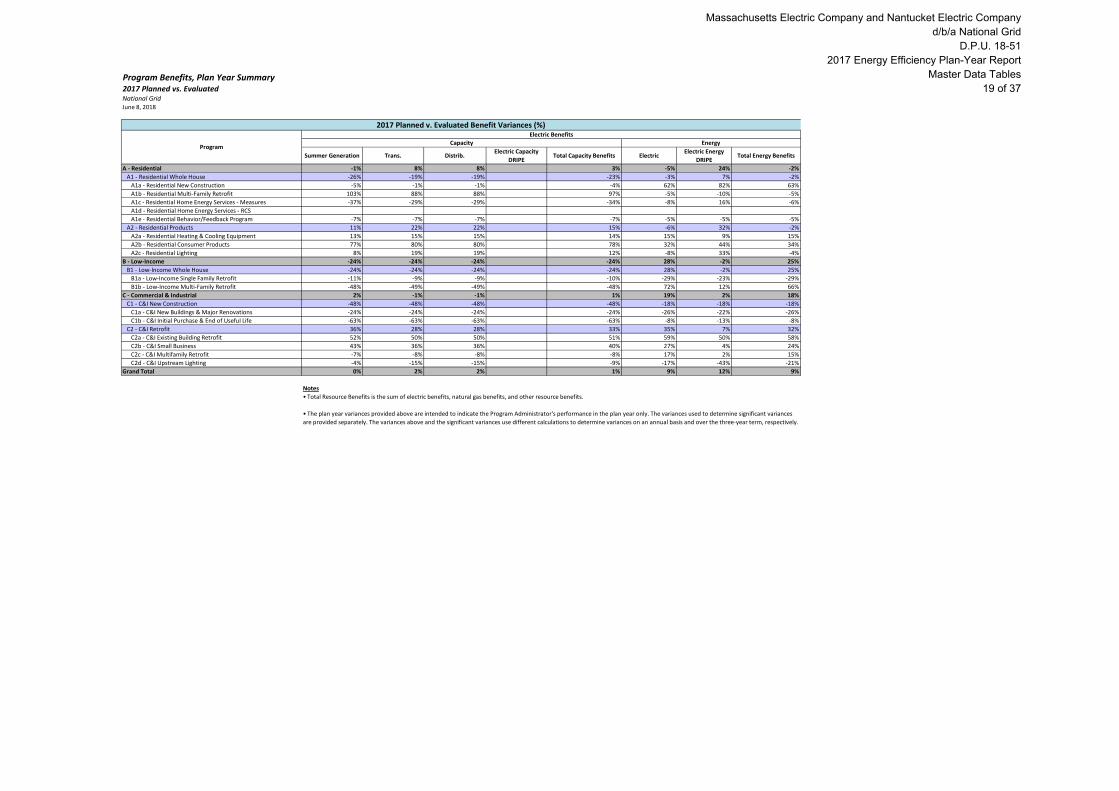
Program Benefits, Plan Year Summary2017 Planned vs. EvaluatedNational GridJune 8, 2018
Summer Generation Trans. Distrib.Electric Capacity
DRIPETotal Capacity Benefits Electric
Electric Energy
DRIPETotal Energy Benefits
A - Residential -1% 8% 8% 3% -5% 24% -2%
A1 - Residential Whole House -26% -19% -19% -23% -3% 7% -2%
A1a - Residential New Construction -5% -1% -1% -4% 62% 82% 63%
A1b - Residential Multi-Family Retrofit 103% 88% 88% 97% -5% -10% -5%
A1c - Residential Home Energy Services - Measures -37% -29% -29% -34% -8% 16% -6%
A1d - Residential Home Energy Services - RCS
A1e - Residential Behavior/Feedback Program -7% -7% -7% -7% -5% -5% -5%
A2 - Residential Products 11% 22% 22% 15% -6% 32% -2%
A2a - Residential Heating & Cooling Equipment 13% 15% 15% 14% 15% 9% 15%
A2b - Residential Consumer Products 77% 80% 80% 78% 32% 44% 34%
A2c - Residential Lighting 8% 19% 19% 12% -8% 33% -4%
B - Low-Income -24% -24% -24% -24% 28% -2% 25%
B1 - Low-Income Whole House -24% -24% -24% -24% 28% -2% 25%
B1a - Low-Income Single Family Retrofit -11% -9% -9% -10% -29% -23% -29%
B1b - Low-Income Multi-Family Retrofit -48% -49% -49% -48% 72% 12% 66%
C - Commercial & Industrial 2% -1% -1% 1% 19% 2% 18%
C1 - C&I New Construction -48% -48% -48% -48% -18% -18% -18%
C1a - C&I New Buildings & Major Renovations -24% -24% -24% -24% -26% -22% -26%
C1b - C&I Initial Purchase & End of Useful Life -63% -63% -63% -63% -8% -13% -8%
C2 - C&I Retrofit 36% 28% 28% 33% 35% 7% 32%
C2a - C&I Existing Building Retrofit 52% 50% 50% 51% 59% 50% 58%
C2b - C&I Small Business 43% 36% 36% 40% 27% 4% 24%
C2c - C&I Multifamily Retrofit -7% -8% -8% -8% 17% 2% 15%
C2d - C&I Upstream Lighting -4% -15% -15% -9% -17% -43% -21%
Grand Total 0% 2% 2% 1% 9% 12% 9%
Notes
• Total Resource Benefits is the sum of electric benefits, natural gas benefits, and other resource benefits.
• The plan year variances provided above are intended to indicate the Program Administrator's performance in the plan year only. The variances used to determine significant variances
are provided separately. The variances above and the significant variances use different calculations to determine variances on an annual basis and over the three-year term, respectively.
2017 Planned v. Evaluated Benefit Variances (%)
Program
Electric Benefits
Capacity Energy
Massachusetts Electric Company and Nantucket Electric Company d/b/a National Grid
D.P.U. 18-512017 Energy Efficiency Plan-Year Report
Master Data Tables19 of 37
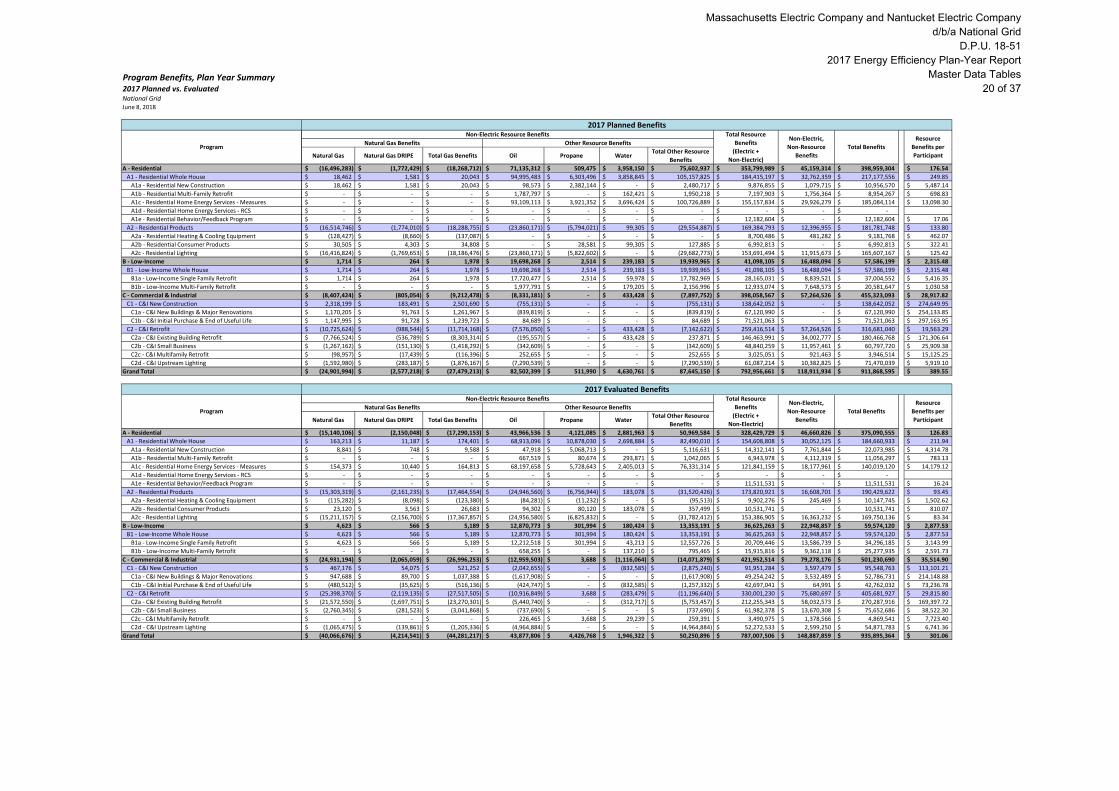
Program Benefits, Plan Year Summary2017 Planned vs. EvaluatedNational GridJune 8, 2018
A - Residential
A1 - Residential Whole House
A1a - Residential New Construction
A1b - Residential Multi-Family Retrofit
A1c - Residential Home Energy Services - Measures
A1d - Residential Home Energy Services - RCS
A1e - Residential Behavior/Feedback Program
A2 - Residential Products
A2a - Residential Heating & Cooling Equipment
A2b - Residential Consumer Products
A2c - Residential Lighting
B - Low-Income
B1 - Low-Income Whole House
B1a - Low-Income Single Family Retrofit
B1b - Low-Income Multi-Family Retrofit
C - Commercial & Industrial
C1 - C&I New Construction
C1a - C&I New Buildings & Major Renovations
C1b - C&I Initial Purchase & End of Useful Life
C2 - C&I Retrofit
C2a - C&I Existing Building Retrofit
C2b - C&I Small Business
C2c - C&I Multifamily Retrofit
C2d - C&I Upstream Lighting
Grand Total
Program
Program
Natural Gas Natural Gas DRIPE Total Gas Benefits Oil Propane WaterTotal Other Resource
Benefits
(16,496,283)$ (1,772,429)$ (18,268,712)$ 71,135,312$ 509,475$ 3,958,150$ 75,602,937$ 353,799,989$ 45,159,314$ 398,959,304$ 176.54$
18,462$ 1,581$ 20,043$ 94,995,483$ 6,303,496$ 3,858,845$ 105,157,825$ 184,415,197$ 32,762,359$ 217,177,556$ 249.85$
18,462$ 1,581$ 20,043$ 98,573$ 2,382,144$ -$ 2,480,717$ 9,876,855$ 1,079,715$ 10,956,570$ 5,487.14$
-$ -$ -$ 1,787,797$ -$ 162,421$ 1,950,218$ 7,197,903$ 1,756,364$ 8,954,267$ 698.83$
-$ -$ -$ 93,109,113$ 3,921,352$ 3,696,424$ 100,726,889$ 155,157,834$ 29,926,279$ 185,084,114$ 13,098.30$
-$ -$ -$ -$ -$ -$ -$ -$ -$ -$
-$ -$ -$ -$ -$ -$ -$ 12,182,604$ -$ 12,182,604$ 17.06$
(16,514,746)$ (1,774,010)$ (18,288,755)$ (23,860,171)$ (5,794,021)$ 99,305$ (29,554,887)$ 169,384,793$ 12,396,955$ 181,781,748$ 133.80$
(128,427)$ (8,660)$ (137,087)$ -$ -$ -$ -$ 8,700,486$ 481,282$ 9,181,768$ 462.07$
30,505$ 4,303$ 34,808$ -$ 28,581$ 99,305$ 127,885$ 6,992,813$ -$ 6,992,813$ 322.41$
(16,416,824)$ (1,769,653)$ (18,186,476)$ (23,860,171)$ (5,822,602)$ -$ (29,682,773)$ 153,691,494$ 11,915,673$ 165,607,167$ 125.42$
1,714$ 264$ 1,978$ 19,698,268$ 2,514$ 239,183$ 19,939,965$ 41,098,105$ 16,488,094$ 57,586,199$ 2,315.48$
1,714$ 264$ 1,978$ 19,698,268$ 2,514$ 239,183$ 19,939,965$ 41,098,105$ 16,488,094$ 57,586,199$ 2,315.48$
1,714$ 264$ 1,978$ 17,720,477$ 2,514$ 59,978$ 17,782,969$ 28,165,031$ 8,839,521$ 37,004,552$ 5,416.35$
-$ -$ -$ 1,977,791$ -$ 179,205$ 2,156,996$ 12,933,074$ 7,648,573$ 20,581,647$ 1,030.58$
(8,407,424)$ (805,054)$ (9,212,478)$ (8,331,181)$ -$ 433,428$ (7,897,752)$ 398,058,567$ 57,264,526$ 455,323,093$ 28,917.82$
2,318,199$ 183,491$ 2,501,690$ (755,131)$ -$ -$ (755,131)$ 138,642,052$ -$ 138,642,052$ 274,649.95$
1,170,205$ 91,763$ 1,261,967$ (839,819)$ -$ -$ (839,819)$ 67,120,990$ -$ 67,120,990$ 254,133.85$
1,147,995$ 91,728$ 1,239,723$ 84,689$ -$ -$ 84,689$ 71,521,063$ -$ 71,521,063$ 297,163.95$
(10,725,624)$ (988,544)$ (11,714,168)$ (7,576,050)$ -$ 433,428$ (7,142,622)$ 259,416,514$ 57,264,526$ 316,681,040$ 19,563.29$
(7,766,524)$ (536,789)$ (8,303,314)$ (195,557)$ -$ 433,428$ 237,871$ 146,463,991$ 34,002,777$ 180,466,768$ 171,306.64$
(1,267,162)$ (151,130)$ (1,418,292)$ (342,609)$ -$ -$ (342,609)$ 48,840,259$ 11,957,461$ 60,797,720$ 25,909.38$
(98,957)$ (17,439)$ (116,396)$ 252,655$ -$ -$ 252,655$ 3,025,051$ 921,463$ 3,946,514$ 15,125.25$
(1,592,980)$ (283,187)$ (1,876,167)$ (7,290,539)$ -$ -$ (7,290,539)$ 61,087,214$ 10,382,825$ 71,470,039$ 5,919.10$
(24,901,994)$ (2,577,218)$ (27,479,213)$ 82,502,399$ 511,990$ 4,630,761$ 87,645,150$ 792,956,661$ 118,911,934$ 911,868,595$ 389.55$
Natural Gas Natural Gas DRIPE Total Gas Benefits Oil Propane WaterTotal Other Resource
Benefits
(15,140,106)$ (2,150,048)$ (17,290,153)$ 43,966,536$ 4,121,085$ 2,881,963$ 50,969,584$ 328,429,729$ 46,660,826$ 375,090,555$ 126.83$
163,213$ 11,187$ 174,401$ 68,913,096$ 10,878,030$ 2,698,884$ 82,490,010$ 154,608,808$ 30,052,125$ 184,660,933$ 211.94$
8,841$ 748$ 9,588$ 47,918$ 5,068,713$ -$ 5,116,631$ 14,312,141$ 7,761,844$ 22,073,985$ 4,314.78$
-$ -$ -$ 667,519$ 80,674$ 293,871$ 1,042,065$ 6,943,978$ 4,112,319$ 11,056,297$ 783.13$
154,373$ 10,440$ 164,813$ 68,197,658$ 5,728,643$ 2,405,013$ 76,331,314$ 121,841,159$ 18,177,961$ 140,019,120$ 14,179.12$
-$ -$ -$ -$ -$ -$ -$ -$ -$ -$
-$ -$ -$ -$ -$ -$ -$ 11,511,531$ -$ 11,511,531$ 16.24$
(15,303,319)$ (2,161,235)$ (17,464,554)$ (24,946,560)$ (6,756,944)$ 183,078$ (31,520,426)$ 173,820,921$ 16,608,701$ 190,429,622$ 93.45$
(115,282)$ (8,098)$ (123,380)$ (84,281)$ (11,232)$ -$ (95,513)$ 9,902,276$ 245,469$ 10,147,745$ 1,502.62$
23,120$ 3,563$ 26,683$ 94,302$ 80,120$ 183,078$ 357,499$ 10,531,741$ -$ 10,531,741$ 810.07$
(15,211,157)$ (2,156,700)$ (17,367,857)$ (24,956,580)$ (6,825,832)$ -$ (31,782,412)$ 153,386,905$ 16,363,232$ 169,750,136$ 83.34$
4,623$ 566$ 5,189$ 12,870,773$ 301,994$ 180,424$ 13,353,191$ 36,625,263$ 22,948,857$ 59,574,120$ 2,877.53$
4,623$ 566$ 5,189$ 12,870,773$ 301,994$ 180,424$ 13,353,191$ 36,625,263$ 22,948,857$ 59,574,120$ 2,877.53$
4,623$ 566$ 5,189$ 12,212,518$ 301,994$ 43,213$ 12,557,726$ 20,709,446$ 13,586,739$ 34,296,185$ 3,143.99$
-$ -$ -$ 658,255$ -$ 137,210$ 795,465$ 15,915,816$ 9,362,118$ 25,277,935$ 2,591.73$
(24,931,194)$ (2,065,059)$ (26,996,253)$ (12,959,503)$ 3,688$ (1,116,064)$ (14,071,879)$ 421,952,514$ 79,278,176$ 501,230,690$ 35,514.90$
467,176$ 54,075$ 521,252$ (2,042,655)$ -$ (832,585)$ (2,875,240)$ 91,951,284$ 3,597,479$ 95,548,763$ 113,101.21$
947,688$ 89,700$ 1,037,388$ (1,617,908)$ -$ -$ (1,617,908)$ 49,254,242$ 3,532,489$ 52,786,731$ 214,148.88$
(480,512)$ (35,625)$ (516,136)$ (424,747)$ -$ (832,585)$ (1,257,332)$ 42,697,041$ 64,991$ 42,762,032$ 73,236.78$
(25,398,370)$ (2,119,135)$ (27,517,505)$ (10,916,849)$ 3,688$ (283,479)$ (11,196,640)$ 330,001,230$ 75,680,697$ 405,681,927$ 29,815.80$
(21,572,550)$ (1,697,751)$ (23,270,301)$ (5,440,740)$ -$ (312,717)$ (5,753,457)$ 212,255,343$ 58,032,573$ 270,287,916$ 169,397.72$
(2,760,345)$ (281,523)$ (3,041,868)$ (737,690)$ -$ -$ (737,690)$ 61,982,378$ 13,670,308$ 75,652,686$ 38,522.30$
-$ -$ -$ 226,465$ 3,688$ 29,239$ 259,391$ 3,490,975$ 1,378,566$ 4,869,541$ 7,723.40$
(1,065,475)$ (139,861)$ (1,205,336)$ (4,964,884)$ -$ -$ (4,964,884)$ 52,272,533$ 2,599,250$ 54,871,783$ 6,741.36$
(40,066,676)$ (4,214,541)$ (44,281,217)$ 43,877,806$ 4,426,768$ 1,946,322$ 50,250,896$ 787,007,506$ 148,887,859$ 935,895,364$ 301.06$
Total Resource
Benefits
(Electric +
Non-Electric)
Non-Electric,
Non-Resource
Benefits
Total Benefits
Resource
Benefits per
Participant
Natural Gas Benefits Other Resource Benefits
Resource
Benefits per
Participant
2017 Planned Benefits
2017 Evaluated Benefits
Total Resource
Benefits
(Electric +
Non-Electric)
Non-Electric,
Non-Resource
Benefits
Total BenefitsNatural Gas Benefits Other Resource Benefits
Non-Electric Resource Benefits
Non-Electric Resource Benefits
Massachusetts Electric Company and Nantucket Electric Company d/b/a National Grid
D.P.U. 18-512017 Energy Efficiency Plan-Year Report
Master Data Tables20 of 37
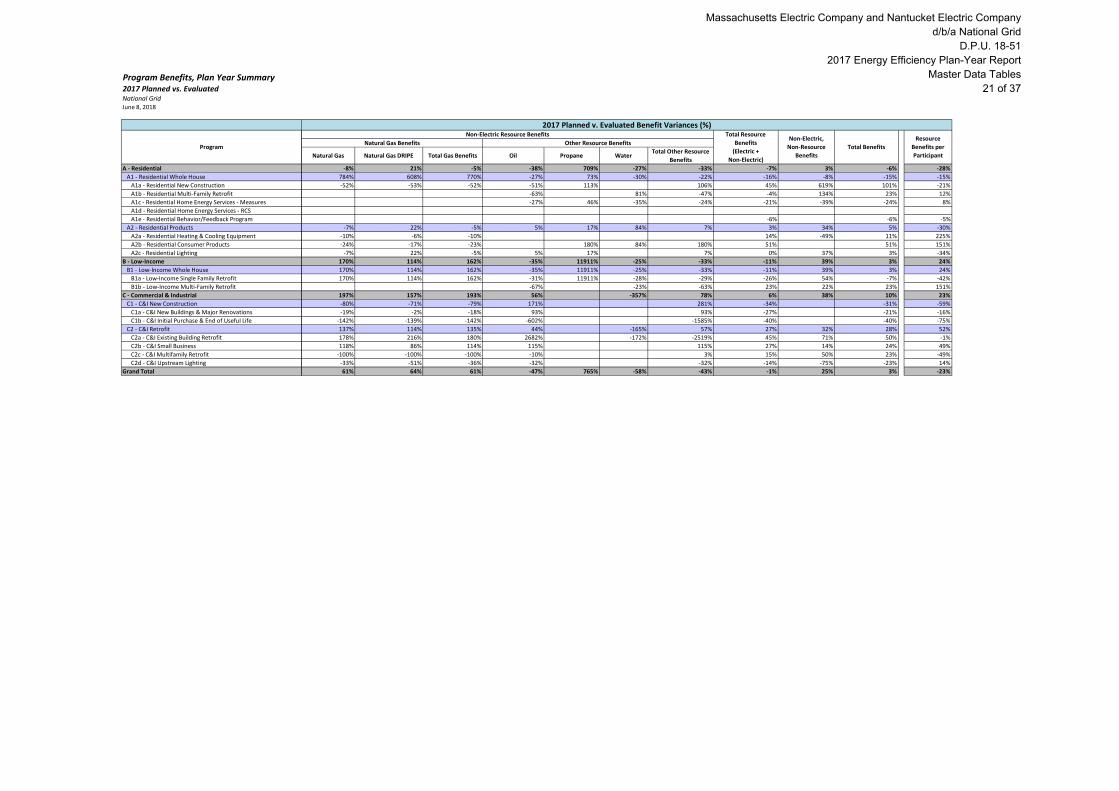
Program Benefits, Plan Year Summary2017 Planned vs. EvaluatedNational GridJune 8, 2018
A - Residential
A1 - Residential Whole House
A1a - Residential New Construction
A1b - Residential Multi-Family Retrofit
A1c - Residential Home Energy Services - Measures
A1d - Residential Home Energy Services - RCS
A1e - Residential Behavior/Feedback Program
A2 - Residential Products
A2a - Residential Heating & Cooling Equipment
A2b - Residential Consumer Products
A2c - Residential Lighting
B - Low-Income
B1 - Low-Income Whole House
B1a - Low-Income Single Family Retrofit
B1b - Low-Income Multi-Family Retrofit
C - Commercial & Industrial
C1 - C&I New Construction
C1a - C&I New Buildings & Major Renovations
C1b - C&I Initial Purchase & End of Useful Life
C2 - C&I Retrofit
C2a - C&I Existing Building Retrofit
C2b - C&I Small Business
C2c - C&I Multifamily Retrofit
C2d - C&I Upstream Lighting
Grand Total
Program
Natural Gas Natural Gas DRIPE Total Gas Benefits Oil Propane WaterTotal Other Resource
Benefits
-8% 21% -5% -38% 709% -27% -33% -7% 3% -6% -28%
784% 608% 770% -27% 73% -30% -22% -16% -8% -15% -15%
-52% -53% -52% -51% 113% 106% 45% 619% 101% -21%
-63% 81% -47% -4% 134% 23% 12%
-27% 46% -35% -24% -21% -39% -24% 8%
-6% -6% -5%
-7% 22% -5% 5% 17% 84% 7% 3% 34% 5% -30%
-10% -6% -10% 14% -49% 11% 225%
-24% -17% -23% 180% 84% 180% 51% 51% 151%
-7% 22% -5% 5% 17% 7% 0% 37% 3% -34%
170% 114% 162% -35% 11911% -25% -33% -11% 39% 3% 24%
170% 114% 162% -35% 11911% -25% -33% -11% 39% 3% 24%
170% 114% 162% -31% 11911% -28% -29% -26% 54% -7% -42%
-67% -23% -63% 23% 22% 23% 151%
197% 157% 193% 56% -357% 78% 6% 38% 10% 23%
-80% -71% -79% 171% 281% -34% -31% -59%
-19% -2% -18% 93% 93% -27% -21% -16%
-142% -139% -142% -602% -1585% -40% -40% -75%
137% 114% 135% 44% -165% 57% 27% 32% 28% 52%
178% 216% 180% 2682% -172% -2519% 45% 71% 50% -1%
118% 86% 114% 115% 115% 27% 14% 24% 49%
-100% -100% -100% -10% 3% 15% 50% 23% -49%
-33% -51% -36% -32% -32% -14% -75% -23% 14%
61% 64% 61% -47% 765% -58% -43% -1% 25% 3% -23%
Natural Gas Benefits Other Resource Benefits
2017 Planned v. Evaluated Benefit Variances (%)Non-Electric Resource Benefits Total Resource
Benefits
(Electric +
Non-Electric)
Non-Electric,
Non-Resource
Benefits
Total Benefits
Resource
Benefits per
Participant
Massachusetts Electric Company and Nantucket Electric Company d/b/a National Grid
D.P.U. 18-512017 Energy Efficiency Plan-Year Report
Master Data Tables21 of 37

Program Benefits, Three-Year Total2016-2018 BenefitsNational GridJune 8, 2018
Summer Generation Trans. Distrib.Electric Capacity
DRIPETotal Capacity Benefits Electric
Electric Energy
DRIPETotal Energy Benefits
A - Residential 38,283,737$ 3,583,240$ 28,124,348$ -$ 69,991,325$ 153,056,365$ 43,214,753$ 196,271,118$
A1 - Residential Whole House 14,521,404$ 1,273,403$ 9,994,762$ -$ 25,789,569$ 56,030,627$ 14,952,483$ 70,983,110$
A1a - Residential New Construction 3,689,473$ 259,781$ 2,038,984$ -$ 5,988,238$ 5,300,628$ 857,388$ 6,158,016$
A1b - Residential Multi-Family Retrofit 621,582$ 60,082$ 471,574$ -$ 1,153,237$ 5,069,470$ 1,089,054$ 6,158,524$
A1c - Residential Home Energy Services - Measures 9,606,507$ 792,677$ 6,221,611$ -$ 16,620,795$ 39,079,157$ 7,952,308$ 47,031,465$
A1d - Residential Home Energy Services - RCS -$ -$ -$ -$ -$ -$ -$ -$
A1e - Residential Behavior/Feedback Program 603,842$ 160,863$ 1,262,593$ -$ 2,027,298$ 6,581,371$ 5,053,733$ 11,635,105$
A2 - Residential Products 23,762,334$ 2,309,837$ 18,129,586$ -$ 44,201,756$ 97,025,738$ 28,262,269$ 125,288,008$
A2a - Residential Heating & Cooling Equipment 1,081,183$ 78,924$ 619,465$ -$ 1,779,572$ 4,788,511$ 625,802$ 5,414,313$
A2b - Residential Consumer Products 1,914,288$ 164,218$ 1,288,925$ -$ 3,367,431$ 3,271,911$ 720,454$ 3,992,364$
A2c - Residential Lighting 20,766,862$ 2,066,695$ 16,221,196$ -$ 39,054,753$ 88,965,317$ 26,916,014$ 115,881,331$
B - Low-Income 3,020,633$ 243,097$ 1,908,032$ -$ 5,171,762$ 10,222,627$ 2,141,776$ 12,364,403$
B1 - Low-Income Whole House 3,020,633$ 243,097$ 1,908,032$ -$ 5,171,762$ 10,222,627$ 2,141,776$ 12,364,403$
B1a - Low-Income Single Family Retrofit 1,775,539$ 139,635$ 1,095,977$ -$ 3,011,152$ 4,602,252$ 913,232$ 5,515,484$
B1b - Low-Income Multi-Family Retrofit 1,245,093$ 103,462$ 812,055$ -$ 2,160,610$ 5,620,375$ 1,228,544$ 6,848,918$
C - Commercial & Industrial 92,983,803$ 7,181,403$ 56,365,822$ -$ 156,531,028$ 305,207,107$ 49,554,491$ 354,761,597$
C1 - C&I New Construction 18,157,478$ 1,279,380$ 10,041,671$ -$ 29,478,529$ 54,491,543$ 6,458,444$ 60,949,987$
C1a - C&I New Buildings & Major Renovations 7,033,031$ 500,949$ 3,931,880$ -$ 11,465,861$ 21,161,178$ 2,638,458$ 23,799,637$
C1b - C&I Initial Purchase & End of Useful Life 11,124,447$ 778,430$ 6,109,790$ -$ 18,012,668$ 33,330,365$ 3,819,985$ 37,150,350$
C2 - C&I Retrofit 74,826,325$ 5,902,023$ 46,324,151$ -$ 127,052,499$ 250,715,563$ 43,096,047$ 293,811,611$
C2a - C&I Existing Building Retrofit 45,486,157$ 3,347,036$ 26,270,411$ -$ 75,103,603$ 167,406,740$ 23,322,637$ 190,729,378$
C2b - C&I Small Business 15,005,961$ 1,167,140$ 9,160,717$ -$ 25,333,818$ 35,577,472$ 6,023,009$ 41,600,481$
C2c - C&I Multifamily Retrofit 174,254$ 17,458$ 137,027$ -$ 328,739$ 2,493,768$ 648,451$ 3,142,219$
C2d - C&I Upstream Lighting 14,159,954$ 1,370,390$ 10,755,996$ -$ 26,286,340$ 45,237,583$ 13,101,950$ 58,339,533$
Grand Total 134,288,173$ 11,007,740$ 86,398,202$ -$ 231,694,114$ 468,486,099$ 94,911,019$ 563,397,118$
Summer Generation Trans. Distrib.Electric Capacity
DRIPETotal Capacity Benefits Electric
Electric Energy
DRIPETotal Energy Benefits
A - Residential 52,003,372$ 4,172,864$ 32,752,219$ -$ 88,928,455$ 176,800,403$ 29,021,440$ 205,821,844$
A1 - Residential Whole House 12,870,034$ 1,035,666$ 8,128,796$ -$ 22,034,495$ 41,795,824$ 8,114,078$ 49,909,902$
A1a - Residential New Construction 2,571,125$ 171,660$ 1,347,333$ -$ 4,090,118$ 4,704,060$ 391,744$ 5,095,804$
A1b - Residential Multi-Family Retrofit 1,113,034$ 79,327$ 622,627$ -$ 1,814,988$ 3,699,093$ 387,831$ 4,086,925$
A1c - Residential Home Energy Services - Measures 8,144,162$ 639,281$ 5,017,624$ -$ 13,801,066$ 27,525,245$ 4,018,721$ 31,543,966$
A1d - Residential Home Energy Services - RCS -$ -$ -$ -$ -$ -$ -$ -$
A1e - Residential Behavior/Feedback Program 1,041,713$ 145,398$ 1,141,212$ -$ 2,328,323$ 5,867,426$ 3,315,781$ 9,183,207$
A2 - Residential Products 39,133,339$ 3,137,198$ 24,623,423$ -$ 66,893,959$ 135,004,579$ 20,907,363$ 155,911,941$
A2a - Residential Heating & Cooling Equipment 1,758,465$ 122,273$ 959,705$ -$ 2,840,444$ 6,753,266$ 527,459$ 7,280,725$
A2b - Residential Consumer Products 2,406,013$ 185,448$ 1,455,558$ -$ 4,047,019$ 5,352,063$ 748,476$ 6,100,540$
A2c - Residential Lighting 34,968,861$ 2,829,476$ 22,208,160$ -$ 60,006,496$ 122,899,249$ 19,631,428$ 142,530,677$
B - Low-Income 2,965,047$ 214,206$ 1,681,273$ -$ 4,860,526$ 16,860,719$ 1,545,637$ 18,406,357$
B1 - Low-Income Whole House 2,965,047$ 214,206$ 1,681,273$ -$ 4,860,526$ 16,860,719$ 1,545,637$ 18,406,357$
B1a - Low-Income Single Family Retrofit 2,212,461$ 159,093$ 1,248,697$ -$ 3,620,250$ 4,028,278$ 498,003$ 4,526,281$
B1b - Low-Income Multi-Family Retrofit 752,586$ 55,113$ 432,576$ -$ 1,240,276$ 12,832,441$ 1,047,634$ 13,880,075$
C - Commercial & Industrial 93,400,027$ 6,441,669$ 50,559,756$ -$ 150,401,452$ 288,089,489$ 24,529,704$ 312,619,193$
C1 - C&I New Construction 19,348,763$ 1,288,435$ 10,112,745$ -$ 30,749,944$ 59,447,744$ 4,107,584$ 63,555,328$
C1a - C&I New Buildings & Major Renovations 10,864,264$ 726,518$ 5,702,339$ -$ 17,293,121$ 30,372,674$ 2,168,967$ 32,541,641$
C1b - C&I Initial Purchase & End of Useful Life 8,484,499$ 561,917$ 4,410,407$ -$ 13,456,822$ 29,075,070$ 1,938,617$ 31,013,687$
C2 - C&I Retrofit 74,051,263$ 5,153,234$ 40,447,011$ -$ 119,651,509$ 228,641,744$ 20,422,121$ 249,063,865$
C2a - C&I Existing Building Retrofit 45,266,665$ 3,087,158$ 24,230,670$ -$ 72,584,494$ 155,958,647$ 12,735,960$ 168,694,607$
C2b - C&I Small Business 15,528,488$ 1,078,568$ 8,465,528$ -$ 25,072,584$ 37,341,509$ 3,347,843$ 40,689,352$
C2c - C&I Multifamily Retrofit 238,547$ 18,983$ 148,993$ -$ 406,523$ 2,474,778$ 350,283$ 2,825,061$
C2d - C&I Upstream Lighting 13,017,563$ 968,525$ 7,601,820$ -$ 21,587,908$ 32,866,810$ 3,988,035$ 36,854,845$
Grand Total 148,368,446$ 10,828,739$ 84,993,248$ -$ 244,190,433$ 481,750,611$ 55,096,782$ 536,847,393$
2017 Evaluated Benefits
Capacity EnergyProgram
Electric Benefits
2016 Evaluated Benefits
Program
Electric Benefits
Capacity Energy
Massachusetts Electric Company and Nantucket Electric Company d/b/a National Grid
D.P.U. 18-512017 Energy Efficiency Plan-Year Report
Master Data Tables22 of 37
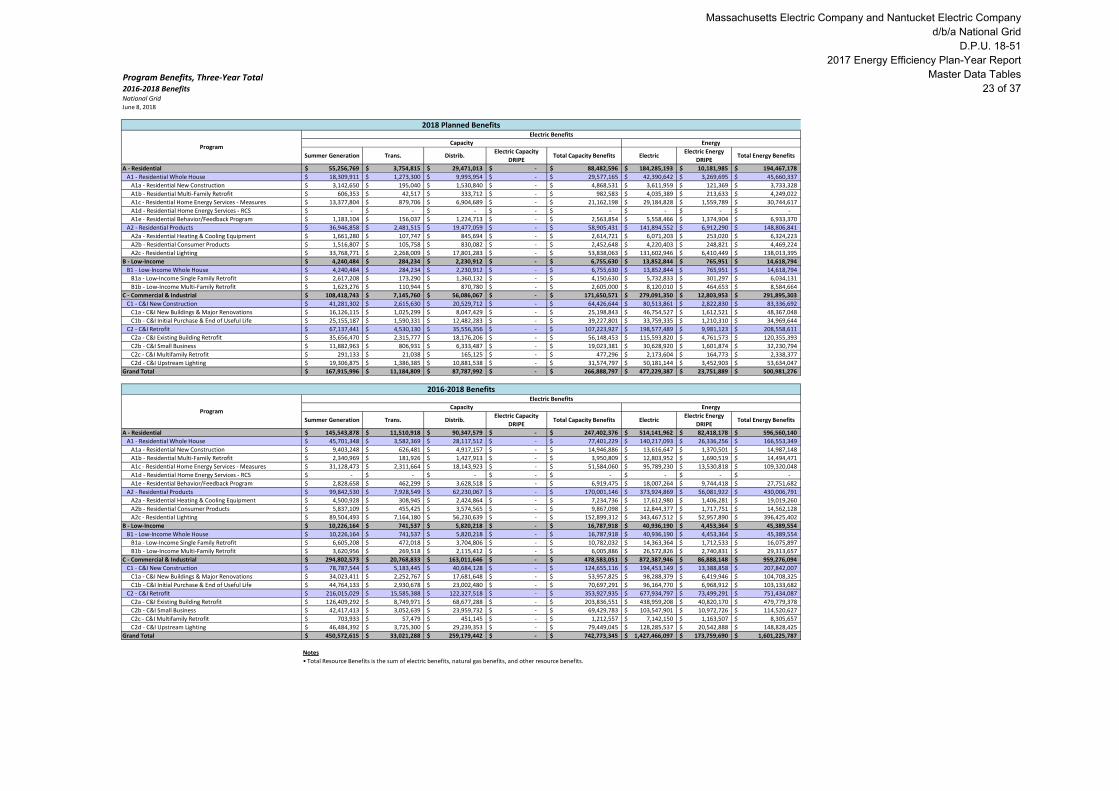
Program Benefits, Three-Year Total2016-2018 BenefitsNational GridJune 8, 2018
Summer Generation Trans. Distrib.Electric Capacity
DRIPETotal Capacity Benefits Electric
Electric Energy
DRIPETotal Energy Benefits
A - Residential 55,256,769$ 3,754,815$ 29,471,013$ -$ 88,482,596$ 184,285,193$ 10,181,985$ 194,467,178$
A1 - Residential Whole House 18,309,911$ 1,273,300$ 9,993,954$ -$ 29,577,165$ 42,390,642$ 3,269,695$ 45,660,337$
A1a - Residential New Construction 3,142,650$ 195,040$ 1,530,840$ -$ 4,868,531$ 3,611,959$ 121,369$ 3,733,328$
A1b - Residential Multi-Family Retrofit 606,353$ 42,517$ 333,712$ -$ 982,583$ 4,035,389$ 213,633$ 4,249,022$
A1c - Residential Home Energy Services - Measures 13,377,804$ 879,706$ 6,904,689$ -$ 21,162,198$ 29,184,828$ 1,559,789$ 30,744,617$
A1d - Residential Home Energy Services - RCS -$ -$ -$ -$ -$ -$ -$ -$
A1e - Residential Behavior/Feedback Program 1,183,104$ 156,037$ 1,224,713$ -$ 2,563,854$ 5,558,466$ 1,374,904$ 6,933,370$
A2 - Residential Products 36,946,858$ 2,481,515$ 19,477,059$ -$ 58,905,431$ 141,894,552$ 6,912,290$ 148,806,841$
A2a - Residential Heating & Cooling Equipment 1,661,280$ 107,747$ 845,694$ -$ 2,614,721$ 6,071,203$ 253,020$ 6,324,223$
A2b - Residential Consumer Products 1,516,807$ 105,758$ 830,082$ -$ 2,452,648$ 4,220,403$ 248,821$ 4,469,224$
A2c - Residential Lighting 33,768,771$ 2,268,009$ 17,801,283$ -$ 53,838,063$ 131,602,946$ 6,410,449$ 138,013,395$
B - Low-Income 4,240,484$ 284,234$ 2,230,912$ -$ 6,755,630$ 13,852,844$ 765,951$ 14,618,794$
B1 - Low-Income Whole House 4,240,484$ 284,234$ 2,230,912$ -$ 6,755,630$ 13,852,844$ 765,951$ 14,618,794$
B1a - Low-Income Single Family Retrofit 2,617,208$ 173,290$ 1,360,132$ -$ 4,150,630$ 5,732,833$ 301,297$ 6,034,131$
B1b - Low-Income Multi-Family Retrofit 1,623,276$ 110,944$ 870,780$ -$ 2,605,000$ 8,120,010$ 464,653$ 8,584,664$
C - Commercial & Industrial 108,418,743$ 7,145,760$ 56,086,067$ -$ 171,650,571$ 279,091,350$ 12,803,953$ 291,895,303$
C1 - C&I New Construction 41,281,302$ 2,615,630$ 20,529,712$ -$ 64,426,644$ 80,513,861$ 2,822,830$ 83,336,692$
C1a - C&I New Buildings & Major Renovations 16,126,115$ 1,025,299$ 8,047,429$ -$ 25,198,843$ 46,754,527$ 1,612,521$ 48,367,048$
C1b - C&I Initial Purchase & End of Useful Life 25,155,187$ 1,590,331$ 12,482,283$ -$ 39,227,801$ 33,759,335$ 1,210,310$ 34,969,644$
C2 - C&I Retrofit 67,137,441$ 4,530,130$ 35,556,356$ -$ 107,223,927$ 198,577,489$ 9,981,123$ 208,558,611$
C2a - C&I Existing Building Retrofit 35,656,470$ 2,315,777$ 18,176,206$ -$ 56,148,453$ 115,593,820$ 4,761,573$ 120,355,393$
C2b - C&I Small Business 11,882,963$ 806,931$ 6,333,487$ -$ 19,023,381$ 30,628,920$ 1,601,874$ 32,230,794$
C2c - C&I Multifamily Retrofit 291,133$ 21,038$ 165,125$ -$ 477,296$ 2,173,604$ 164,773$ 2,338,377$
C2d - C&I Upstream Lighting 19,306,875$ 1,386,385$ 10,881,538$ -$ 31,574,797$ 50,181,144$ 3,452,903$ 53,634,047$
Grand Total 167,915,996$ 11,184,809$ 87,787,992$ -$ 266,888,797$ 477,229,387$ 23,751,889$ 500,981,276$
Summer Generation Trans. Distrib.Electric Capacity
DRIPETotal Capacity Benefits Electric
Electric Energy
DRIPETotal Energy Benefits
A - Residential 145,543,878$ 11,510,918$ 90,347,579$ -$ 247,402,376$ 514,141,962$ 82,418,178$ 596,560,140$
A1 - Residential Whole House 45,701,348$ 3,582,369$ 28,117,512$ -$ 77,401,229$ 140,217,093$ 26,336,256$ 166,553,349$
A1a - Residential New Construction 9,403,248$ 626,481$ 4,917,157$ -$ 14,946,886$ 13,616,647$ 1,370,501$ 14,987,148$
A1b - Residential Multi-Family Retrofit 2,340,969$ 181,926$ 1,427,913$ -$ 3,950,809$ 12,803,952$ 1,690,519$ 14,494,471$
A1c - Residential Home Energy Services - Measures 31,128,473$ 2,311,664$ 18,143,923$ -$ 51,584,060$ 95,789,230$ 13,530,818$ 109,320,048$
A1d - Residential Home Energy Services - RCS -$ -$ -$ -$ -$ -$ -$ -$
A1e - Residential Behavior/Feedback Program 2,828,658$ 462,299$ 3,628,518$ -$ 6,919,475$ 18,007,264$ 9,744,418$ 27,751,682$
A2 - Residential Products 99,842,530$ 7,928,549$ 62,230,067$ -$ 170,001,146$ 373,924,869$ 56,081,922$ 430,006,791$
A2a - Residential Heating & Cooling Equipment 4,500,928$ 308,945$ 2,424,864$ -$ 7,234,736$ 17,612,980$ 1,406,281$ 19,019,260$
A2b - Residential Consumer Products 5,837,109$ 455,425$ 3,574,565$ -$ 9,867,098$ 12,844,377$ 1,717,751$ 14,562,128$
A2c - Residential Lighting 89,504,493$ 7,164,180$ 56,230,639$ -$ 152,899,312$ 343,467,512$ 52,957,890$ 396,425,402$
B - Low-Income 10,226,164$ 741,537$ 5,820,218$ -$ 16,787,918$ 40,936,190$ 4,453,364$ 45,389,554$
B1 - Low-Income Whole House 10,226,164$ 741,537$ 5,820,218$ -$ 16,787,918$ 40,936,190$ 4,453,364$ 45,389,554$
B1a - Low-Income Single Family Retrofit 6,605,208$ 472,018$ 3,704,806$ -$ 10,782,032$ 14,363,364$ 1,712,533$ 16,075,897$
B1b - Low-Income Multi-Family Retrofit 3,620,956$ 269,518$ 2,115,412$ -$ 6,005,886$ 26,572,826$ 2,740,831$ 29,313,657$
C - Commercial & Industrial 294,802,573$ 20,768,833$ 163,011,646$ -$ 478,583,051$ 872,387,946$ 86,888,148$ 959,276,094$
C1 - C&I New Construction 78,787,544$ 5,183,445$ 40,684,128$ -$ 124,655,116$ 194,453,149$ 13,388,858$ 207,842,007$
C1a - C&I New Buildings & Major Renovations 34,023,411$ 2,252,767$ 17,681,648$ -$ 53,957,825$ 98,288,379$ 6,419,946$ 104,708,325$
C1b - C&I Initial Purchase & End of Useful Life 44,764,133$ 2,930,678$ 23,002,480$ -$ 70,697,291$ 96,164,770$ 6,968,912$ 103,133,682$
C2 - C&I Retrofit 216,015,029$ 15,585,388$ 122,327,518$ -$ 353,927,935$ 677,934,797$ 73,499,291$ 751,434,087$
C2a - C&I Existing Building Retrofit 126,409,292$ 8,749,971$ 68,677,288$ -$ 203,836,551$ 438,959,208$ 40,820,170$ 479,779,378$
C2b - C&I Small Business 42,417,413$ 3,052,639$ 23,959,732$ -$ 69,429,783$ 103,547,901$ 10,972,726$ 114,520,627$
C2c - C&I Multifamily Retrofit 703,933$ 57,479$ 451,145$ -$ 1,212,557$ 7,142,150$ 1,163,507$ 8,305,657$
C2d - C&I Upstream Lighting 46,484,392$ 3,725,300$ 29,239,353$ -$ 79,449,045$ 128,285,537$ 20,542,888$ 148,828,425$
Grand Total 450,572,615$ 33,021,288$ 259,179,442$ -$ 742,773,345$ 1,427,466,097$ 173,759,690$ 1,601,225,787$
Notes
• Total Resource Benefits is the sum of electric benefits, natural gas benefits, and other resource benefits.
2016-2018 Benefits
Program
Electric Benefits
Program
Electric Benefits
Capacity Energy
Capacity Energy
2018 Planned Benefits
Massachusetts Electric Company and Nantucket Electric Company d/b/a National Grid
D.P.U. 18-512017 Energy Efficiency Plan-Year Report
Master Data Tables23 of 37

Program Benefits, Three-Year Total2016-2018 BenefitsNational GridJune 8, 2018
A - Residential
A1 - Residential Whole House
A1a - Residential New Construction
A1b - Residential Multi-Family Retrofit
A1c - Residential Home Energy Services - Measures
A1d - Residential Home Energy Services - RCS
A1e - Residential Behavior/Feedback Program
A2 - Residential Products
A2a - Residential Heating & Cooling Equipment
A2b - Residential Consumer Products
A2c - Residential Lighting
B - Low-Income
B1 - Low-Income Whole House
B1a - Low-Income Single Family Retrofit
B1b - Low-Income Multi-Family Retrofit
C - Commercial & Industrial
C1 - C&I New Construction
C1a - C&I New Buildings & Major Renovations
C1b - C&I Initial Purchase & End of Useful Life
C2 - C&I Retrofit
C2a - C&I Existing Building Retrofit
C2b - C&I Small Business
C2c - C&I Multifamily Retrofit
C2d - C&I Upstream Lighting
Grand Total
Program
Program
Natural Gas Natural Gas DRIPE Total Gas Benefits Oil Propane WaterTotal Other Resource
Benefits
(13,385,735)$ (3,685,485)$ (17,071,220)$ 51,637,673$ 10,230,992$ 2,915,921$ 64,784,586$ 313,975,809$ 47,587,824$ 361,563,633$ 148.93$
483,154$ 51,609$ 534,763$ 80,015,419$ 11,632,301$ 2,736,898$ 94,384,618$ 191,692,060$ 35,510,941$ 227,203,000$ 261.19$
227,721$ 23,735$ 251,456$ 167,137$ 6,207,858$ -$ 6,374,995$ 18,772,706$ 6,123,993$ 24,896,699$ 4,832.10$
-$ -$ -$ 549,315$ -$ 322,979$ 872,294$ 8,184,056$ 2,496,881$ 10,680,937$ 460.19$
255,433$ 27,873$ 283,306$ 79,298,967$ 5,424,444$ 2,413,918$ 87,137,329$ 151,072,895$ 26,890,066$ 177,962,961$ 14,586.55$
-$ -$ -$ -$ -$ -$ -$ -$ -$ -$
-$ -$ -$ -$ -$ -$ -$ 13,662,403$ -$ 13,662,403$ 19.46$
(13,868,889)$ (3,737,094)$ (17,605,983)$ (28,377,746)$ (1,401,310)$ 179,024$ (29,600,032)$ 122,283,749$ 12,076,884$ 134,360,633$ 88.98$
(159,490)$ (17,524)$ (177,014)$ (76,356)$ (10,207)$ -$ (86,564)$ 6,930,307$ 351,399$ 7,281,706$ 1,154.09$
20,620$ 5,544$ 26,164$ 57,158$ 48,701$ 179,024$ 284,882$ 7,670,841$ -$ 7,670,841$ 617.87$
(13,730,018)$ (3,725,114)$ (17,455,132)$ (28,358,547)$ (1,439,803)$ -$ (29,798,350)$ 107,682,601$ 11,725,485$ 119,408,086$ 79.42$
432$ 116$ 548$ 13,015,116$ 93,486$ 82,719$ 13,191,322$ 30,728,034$ 20,713,309$ 51,441,343$ 2,219.75$
432$ 116$ 548$ 13,015,116$ 93,486$ 82,719$ 13,191,322$ 30,728,034$ 20,713,309$ 51,441,343$ 2,219.75$
432$ 116$ 548$ 13,015,116$ 93,486$ 12,955$ 13,121,558$ 21,648,742$ 16,920,517$ 38,569,259$ 3,509.85$
-$ -$ -$ -$ -$ 69,764$ 69,764$ 9,079,292$ 3,792,792$ 12,872,084$ 1,182.97$
(11,097,249)$ (1,774,764)$ (12,872,013)$ (14,455,980)$ -$ 165,053$ (14,290,927)$ 484,129,685$ 83,912,464$ 568,042,149$ 34,072.04$
(282,348)$ (37,637)$ (319,985)$ (2,088,759)$ -$ 67,858$ (2,020,901)$ 88,087,629$ 6,912,197$ 94,999,827$ 92,529.02$
(44,820)$ (4,230)$ (49,050)$ (1,047,255)$ -$ 44,042$ (1,003,212)$ 34,213,235$ 2,961,330$ 37,174,565$ 134,169.55$
(237,528)$ (33,408)$ (270,935)$ (1,041,505)$ -$ 23,816$ (1,017,689)$ 53,874,394$ 3,950,867$ 57,825,261$ 77,294.68$
(10,814,901)$ (1,737,127)$ (12,552,028)$ (12,367,220)$ -$ 97,195$ (12,270,026)$ 396,042,056$ 77,000,266$ 473,042,322$ 29,874.18$
(7,507,536)$ (898,895)$ (8,406,431)$ (4,238,266)$ -$ 91,754$ (4,146,512)$ 253,280,039$ 48,753,886$ 302,033,925$ 191,010.59$
(1,575,105)$ (326,857)$ (1,901,962)$ (417,414)$ -$ -$ (417,414)$ 64,614,922$ 14,089,347$ 78,704,269$ 38,807.76$
-$ -$ -$ 104,866$ -$ 5,440$ 110,306$ 3,581,264$ 187,434$ 3,768,698$ 5,666.56$
(1,732,261)$ (511,374)$ (2,243,635)$ (7,816,406)$ -$ -$ (7,816,406)$ 74,565,831$ 13,969,599$ 88,535,430$ 7,739.86$
(24,482,552)$ (5,460,133)$ (29,942,685)$ 50,196,809$ 10,324,478$ 3,163,693$ 63,684,980$ 828,833,528$ 152,213,597$ 981,047,125$ 387.98$
Natural Gas Natural Gas DRIPE Total Gas Benefits Oil Propane WaterTotal Other Resource
Benefits
(15,140,106)$ (2,150,048)$ (17,290,153)$ 43,966,536$ 4,121,085$ 2,881,963$ 50,969,584$ 328,429,729$ 46,660,826$ 375,090,555$ 126.83$
163,213$ 11,187$ 174,401$ 68,913,096$ 10,878,030$ 2,698,884$ 82,490,010$ 154,608,808$ 30,052,125$ 184,660,933$ 211.94$
8,841$ 748$ 9,588$ 47,918$ 5,068,713$ -$ 5,116,631$ 14,312,141$ 7,761,844$ 22,073,985$ 4,314.78$
-$ -$ -$ 667,519$ 80,674$ 293,871$ 1,042,065$ 6,943,978$ 4,112,319$ 11,056,297$ 783.13$
154,373$ 10,440$ 164,813$ 68,197,658$ 5,728,643$ 2,405,013$ 76,331,314$ 121,841,159$ 18,177,961$ 140,019,120$ 14,179.12$
-$ -$ -$ -$ -$ -$ -$ -$ -$ -$
-$ -$ -$ -$ -$ -$ -$ 11,511,531$ -$ 11,511,531$ 16.24$
(15,303,319)$ (2,161,235)$ (17,464,554)$ (24,946,560)$ (6,756,944)$ 183,078$ (31,520,426)$ 173,820,921$ 16,608,701$ 190,429,622$ 93.45$
(115,282)$ (8,098)$ (123,380)$ (84,281)$ (11,232)$ -$ (95,513)$ 9,902,276$ 245,469$ 10,147,745$ 1,502.62$
23,120$ 3,563$ 26,683$ 94,302$ 80,120$ 183,078$ 357,499$ 10,531,741$ -$ 10,531,741$ 810.07$
(15,211,157)$ (2,156,700)$ (17,367,857)$ (24,956,580)$ (6,825,832)$ -$ (31,782,412)$ 153,386,905$ 16,363,232$ 169,750,136$ 83.34$
4,623$ 566$ 5,189$ 12,870,773$ 301,994$ 180,424$ 13,353,191$ 36,625,263$ 22,948,857$ 59,574,120$ 2,877.53$
4,623$ 566$ 5,189$ 12,870,773$ 301,994$ 180,424$ 13,353,191$ 36,625,263$ 22,948,857$ 59,574,120$ 2,877.53$
4,623$ 566$ 5,189$ 12,212,518$ 301,994$ 43,213$ 12,557,726$ 20,709,446$ 13,586,739$ 34,296,185$ 3,143.99$
-$ -$ -$ 658,255$ -$ 137,210$ 795,465$ 15,915,816$ 9,362,118$ 25,277,935$ 2,591.73$
(24,931,194)$ (2,065,059)$ (26,996,253)$ (12,959,503)$ 3,688$ (1,116,064)$ (14,071,879)$ 421,952,514$ 79,278,176$ 501,230,690$ 35,514.90$
467,176$ 54,075$ 521,252$ (2,042,655)$ -$ (832,585)$ (2,875,240)$ 91,951,284$ 3,597,479$ 95,548,763$ 113,101.21$
947,688$ 89,700$ 1,037,388$ (1,617,908)$ -$ -$ (1,617,908)$ 49,254,242$ 3,532,489$ 52,786,731$ 214,148.88$
(480,512)$ (35,625)$ (516,136)$ (424,747)$ -$ (832,585)$ (1,257,332)$ 42,697,041$ 64,991$ 42,762,032$ 73,236.78$
(25,398,370)$ (2,119,135)$ (27,517,505)$ (10,916,849)$ 3,688$ (283,479)$ (11,196,640)$ 330,001,230$ 75,680,697$ 405,681,927$ 29,815.80$
(21,572,550)$ (1,697,751)$ (23,270,301)$ (5,440,740)$ -$ (312,717)$ (5,753,457)$ 212,255,343$ 58,032,573$ 270,287,916$ 169,397.72$
(2,760,345)$ (281,523)$ (3,041,868)$ (737,690)$ -$ -$ (737,690)$ 61,982,378$ 13,670,308$ 75,652,686$ 38,522.30$
-$ -$ -$ 226,465$ 3,688$ 29,239$ 259,391$ 3,490,975$ 1,378,566$ 4,869,541$ 7,723.40$
(1,065,475)$ (139,861)$ (1,205,336)$ (4,964,884)$ -$ -$ (4,964,884)$ 52,272,533$ 2,599,250$ 54,871,783$ 6,741.36$
(40,066,676)$ (4,214,541)$ (44,281,217)$ 43,877,806$ 4,426,768$ 1,946,322$ 50,250,896$ 787,007,506$ 148,887,859$ 935,895,364$ 301.06$
2017 Evaluated Benefits
Total Benefits
Resource
Benefits per
Participant
Natural Gas Benefits Other Resource Benefits
Non-Electric Resource Benefits Total Resource
Benefits
(Electric +
Non-Electric)
Non-Electric,
Non-Resource
Benefits
2016 Evaluated BenefitsNon-Electric Resource Benefits Total Resource
Benefits
(Electric +
Non-Electric)
Non-Electric,
Non-Resource
Benefits
Total Benefits
Resource
Benefits per
Participant
Natural Gas Benefits Other Resource Benefits
Massachusetts Electric Company and Nantucket Electric Company d/b/a National Grid
D.P.U. 18-512017 Energy Efficiency Plan-Year Report
Master Data Tables24 of 37
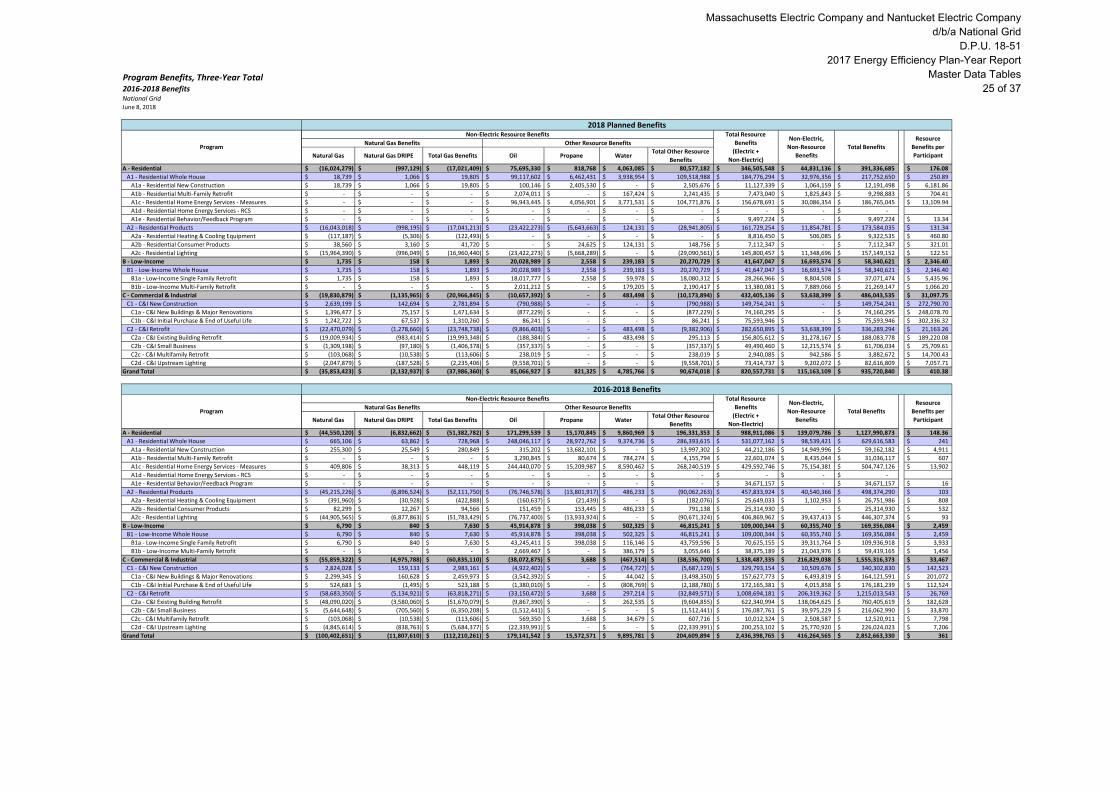
Program Benefits, Three-Year Total2016-2018 BenefitsNational GridJune 8, 2018
A - Residential
A1 - Residential Whole House
A1a - Residential New Construction
A1b - Residential Multi-Family Retrofit
A1c - Residential Home Energy Services - Measures
A1d - Residential Home Energy Services - RCS
A1e - Residential Behavior/Feedback Program
A2 - Residential Products
A2a - Residential Heating & Cooling Equipment
A2b - Residential Consumer Products
A2c - Residential Lighting
B - Low-Income
B1 - Low-Income Whole House
B1a - Low-Income Single Family Retrofit
B1b - Low-Income Multi-Family Retrofit
C - Commercial & Industrial
C1 - C&I New Construction
C1a - C&I New Buildings & Major Renovations
C1b - C&I Initial Purchase & End of Useful Life
C2 - C&I Retrofit
C2a - C&I Existing Building Retrofit
C2b - C&I Small Business
C2c - C&I Multifamily Retrofit
C2d - C&I Upstream Lighting
Grand Total
A - Residential
A1 - Residential Whole House
A1a - Residential New Construction
A1b - Residential Multi-Family Retrofit
A1c - Residential Home Energy Services - Measures
A1d - Residential Home Energy Services - RCS
A1e - Residential Behavior/Feedback Program
A2 - Residential Products
A2a - Residential Heating & Cooling Equipment
A2b - Residential Consumer Products
A2c - Residential Lighting
B - Low-Income
B1 - Low-Income Whole House
B1a - Low-Income Single Family Retrofit
B1b - Low-Income Multi-Family Retrofit
C - Commercial & Industrial
C1 - C&I New Construction
C1a - C&I New Buildings & Major Renovations
C1b - C&I Initial Purchase & End of Useful Life
C2 - C&I Retrofit
C2a - C&I Existing Building Retrofit
C2b - C&I Small Business
C2c - C&I Multifamily Retrofit
C2d - C&I Upstream Lighting
Grand Total
Program
Program
Natural Gas Natural Gas DRIPE Total Gas Benefits Oil Propane WaterTotal Other Resource
Benefits
(16,024,279)$ (997,129)$ (17,021,409)$ 75,695,330$ 818,768$ 4,063,085$ 80,577,182$ 346,505,548$ 44,831,136$ 391,336,685$ 176.08$
18,739$ 1,066$ 19,805$ 99,117,602$ 6,462,431$ 3,938,954$ 109,518,988$ 184,776,294$ 32,976,356$ 217,752,650$ 250.89$
18,739$ 1,066$ 19,805$ 100,146$ 2,405,530$ -$ 2,505,676$ 11,127,339$ 1,064,159$ 12,191,498$ 6,181.86$
-$ -$ -$ 2,074,011$ -$ 167,424$ 2,241,435$ 7,473,040$ 1,825,843$ 9,298,883$ 704.41$
-$ -$ -$ 96,943,445$ 4,056,901$ 3,771,531$ 104,771,876$ 156,678,691$ 30,086,354$ 186,765,045$ 13,109.94$
-$ -$ -$ -$ -$ -$ -$ -$ -$ -$
-$ -$ -$ -$ -$ -$ -$ 9,497,224$ -$ 9,497,224$ 13.34$
(16,043,018)$ (998,195)$ (17,041,213)$ (23,422,273)$ (5,643,663)$ 124,131$ (28,941,805)$ 161,729,254$ 11,854,781$ 173,584,035$ 131.34$
(117,187)$ (5,306)$ (122,493)$ -$ -$ -$ -$ 8,816,450$ 506,085$ 9,322,535$ 460.80$
38,560$ 3,160$ 41,720$ -$ 24,625$ 124,131$ 148,756$ 7,112,347$ -$ 7,112,347$ 321.01$
(15,964,390)$ (996,049)$ (16,960,440)$ (23,422,273)$ (5,668,289)$ -$ (29,090,561)$ 145,800,457$ 11,348,696$ 157,149,152$ 122.51$
1,735$ 158$ 1,893$ 20,028,989$ 2,558$ 239,183$ 20,270,729$ 41,647,047$ 16,693,574$ 58,340,621$ 2,346.40$
1,735$ 158$ 1,893$ 20,028,989$ 2,558$ 239,183$ 20,270,729$ 41,647,047$ 16,693,574$ 58,340,621$ 2,346.40$
1,735$ 158$ 1,893$ 18,017,777$ 2,558$ 59,978$ 18,080,312$ 28,266,966$ 8,804,508$ 37,071,474$ 5,435.96$
-$ -$ -$ 2,011,212$ -$ 179,205$ 2,190,417$ 13,380,081$ 7,889,066$ 21,269,147$ 1,066.20$
(19,830,879)$ (1,135,965)$ (20,966,845)$ (10,657,392)$ -$ 483,498$ (10,173,894)$ 432,405,136$ 53,638,399$ 486,043,535$ 31,097.75$
2,639,199$ 142,694$ 2,781,894$ (790,988)$ -$ -$ (790,988)$ 149,754,241$ -$ 149,754,241$ 272,790.70$
1,396,477$ 75,157$ 1,471,634$ (877,229)$ -$ -$ (877,229)$ 74,160,295$ -$ 74,160,295$ 248,078.70$
1,242,722$ 67,537$ 1,310,260$ 86,241$ -$ -$ 86,241$ 75,593,946$ -$ 75,593,946$ 302,336.32$
(22,470,079)$ (1,278,660)$ (23,748,738)$ (9,866,403)$ -$ 483,498$ (9,382,906)$ 282,650,895$ 53,638,399$ 336,289,294$ 21,163.26$
(19,009,934)$ (983,414)$ (19,993,348)$ (188,384)$ -$ 483,498$ 295,113$ 156,805,612$ 31,278,167$ 188,083,778$ 189,220.08$
(1,309,198)$ (97,180)$ (1,406,378)$ (357,337)$ -$ -$ (357,337)$ 49,490,460$ 12,215,574$ 61,706,034$ 25,709.61$
(103,068)$ (10,538)$ (113,606)$ 238,019$ -$ -$ 238,019$ 2,940,085$ 942,586$ 3,882,672$ 14,700.43$
(2,047,879)$ (187,528)$ (2,235,406)$ (9,558,701)$ -$ -$ (9,558,701)$ 73,414,737$ 9,202,072$ 82,616,809$ 7,057.71$
(35,853,423)$ (2,132,937)$ (37,986,360)$ 85,066,927$ 821,325$ 4,785,766$ 90,674,018$ 820,557,731$ 115,163,109$ 935,720,840$ 410.38$
Natural Gas Natural Gas DRIPE Total Gas Benefits Oil Propane WaterTotal Other Resource
Benefits
(44,550,120)$ (6,832,662)$ (51,382,782)$ 171,299,539$ 15,170,845$ 9,860,969$ 196,331,353$ 988,911,086$ 139,079,786$ 1,127,990,873$ 148.36$
665,106$ 63,862$ 728,968$ 248,046,117$ 28,972,762$ 9,374,736$ 286,393,615$ 531,077,162$ 98,539,421$ 629,616,583$ 241$
255,300$ 25,549$ 280,849$ 315,202$ 13,682,101$ -$ 13,997,302$ 44,212,186$ 14,949,996$ 59,162,182$ 4,911$
-$ -$ -$ 3,290,845$ 80,674$ 784,274$ 4,155,794$ 22,601,074$ 8,435,044$ 31,036,117$ 607$
409,806$ 38,313$ 448,119$ 244,440,070$ 15,209,987$ 8,590,462$ 268,240,519$ 429,592,746$ 75,154,381$ 504,747,126$ 13,902$
-$ -$ -$ -$ -$ -$ -$ -$ -$ -$
-$ -$ -$ -$ -$ -$ -$ 34,671,157$ -$ 34,671,157$ 16$
(45,215,226)$ (6,896,524)$ (52,111,750)$ (76,746,578)$ (13,801,917)$ 486,233$ (90,062,263)$ 457,833,924$ 40,540,366$ 498,374,290$ 103$
(391,960)$ (30,928)$ (422,888)$ (160,637)$ (21,439)$ -$ (182,076)$ 25,649,033$ 1,102,953$ 26,751,986$ 808$
82,299$ 12,267$ 94,566$ 151,459$ 153,445$ 486,233$ 791,138$ 25,314,930$ -$ 25,314,930$ 532$
(44,905,565)$ (6,877,863)$ (51,783,429)$ (76,737,400)$ (13,933,924)$ -$ (90,671,324)$ 406,869,962$ 39,437,413$ 446,307,374$ 93$
6,790$ 840$ 7,630$ 45,914,878$ 398,038$ 502,325$ 46,815,241$ 109,000,344$ 60,355,740$ 169,356,084$ 2,459$
6,790$ 840$ 7,630$ 45,914,878$ 398,038$ 502,325$ 46,815,241$ 109,000,344$ 60,355,740$ 169,356,084$ 2,459$
6,790$ 840$ 7,630$ 43,245,411$ 398,038$ 116,146$ 43,759,596$ 70,625,155$ 39,311,764$ 109,936,918$ 3,933$
-$ -$ -$ 2,669,467$ -$ 386,179$ 3,055,646$ 38,375,189$ 21,043,976$ 59,419,165$ 1,456$
(55,859,322)$ (4,975,788)$ (60,835,110)$ (38,072,875)$ 3,688$ (467,514)$ (38,536,700)$ 1,338,487,335$ 216,829,038$ 1,555,316,373$ 33,467$
2,824,028$ 159,133$ 2,983,161$ (4,922,402)$ -$ (764,727)$ (5,687,129)$ 329,793,154$ 10,509,676$ 340,302,830$ 142,523$
2,299,345$ 160,628$ 2,459,973$ (3,542,392)$ -$ 44,042$ (3,498,350)$ 157,627,773$ 6,493,819$ 164,121,591$ 201,072$
524,683$ (1,495)$ 523,188$ (1,380,010)$ -$ (808,769)$ (2,188,780)$ 172,165,381$ 4,015,858$ 176,181,239$ 112,524$
(58,683,350)$ (5,134,921)$ (63,818,271)$ (33,150,472)$ 3,688$ 297,214$ (32,849,571)$ 1,008,694,181$ 206,319,362$ 1,215,013,543$ 26,769$
(48,090,020)$ (3,580,060)$ (51,670,079)$ (9,867,390)$ -$ 262,535$ (9,604,855)$ 622,340,994$ 138,064,625$ 760,405,619$ 182,628$
(5,644,648)$ (705,560)$ (6,350,208)$ (1,512,441)$ -$ -$ (1,512,441)$ 176,087,761$ 39,975,229$ 216,062,990$ 33,870$
(103,068)$ (10,538)$ (113,606)$ 569,350$ 3,688$ 34,679$ 607,716$ 10,012,324$ 2,508,587$ 12,520,911$ 7,798$
(4,845,614)$ (838,763)$ (5,684,377)$ (22,339,991)$ -$ -$ (22,339,991)$ 200,253,102$ 25,770,920$ 226,024,023$ 7,206$
(100,402,651)$ (11,807,610)$ (112,210,261)$ 179,141,542$ 15,572,571$ 9,895,781$ 204,609,894$ 2,436,398,765$ 416,264,565$ 2,852,663,330$ 361$
2016-2018 BenefitsNon-Electric Resource Benefits Total Resource
Benefits
(Electric +
Non-Electric)
2018 Planned BenefitsNon-Electric Resource Benefits Total Resource
Benefits
(Electric +
Non-Electric)
Non-Electric,
Non-Resource
Benefits
Total Benefits
Resource
Benefits per
Participant
Natural Gas Benefits Other Resource Benefits
Non-Electric,
Non-Resource
Benefits
Total Benefits
Resource
Benefits per
Participant
Natural Gas Benefits Other Resource Benefits
Massachusetts Electric Company and Nantucket Electric Company d/b/a National Grid
D.P.U. 18-512017 Energy Efficiency Plan-Year Report
Master Data Tables25 of 37
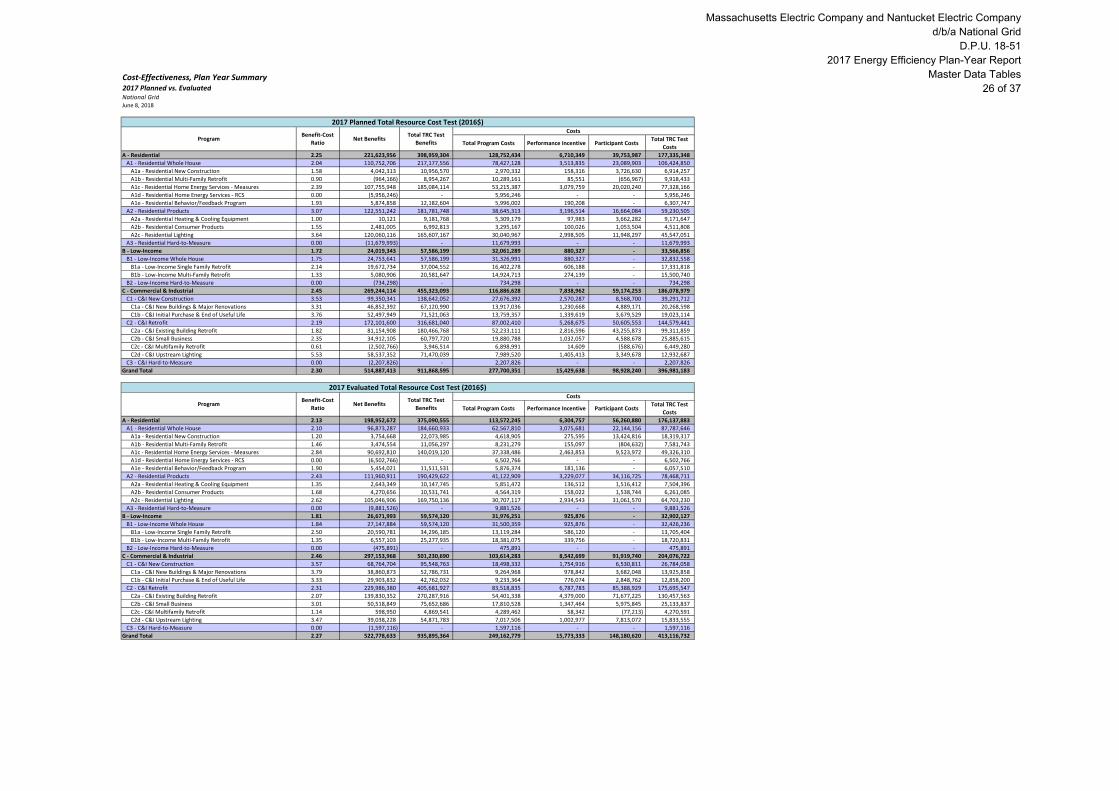
Cost-Effectiveness, Plan Year Summary2017 Planned vs. EvaluatedNational GridJune 8, 2018
Total Program Costs Performance Incentive Participant CostsTotal TRC Test
Costs
A - Residential 2.25 221,623,956 398,959,304 128,752,434 6,710,349 39,753,987 177,335,348
A1 - Residential Whole House 2.04 110,752,706 217,177,556 78,427,128 3,513,835 23,089,903 106,424,850
A1a - Residential New Construction 1.58 4,042,313 10,956,570 2,970,332 158,316 3,726,630 6,914,257
A1b - Residential Multi-Family Retrofit 0.90 (964,166) 8,954,267 10,289,161 85,551 (656,967) 9,918,433
A1c - Residential Home Energy Services - Measures 2.39 107,755,948 185,084,114 53,215,387 3,079,759 20,020,240 77,328,166
A1d - Residential Home Energy Services - RCS 0.00 (5,956,246) - 5,956,246 - - 5,956,246
A1e - Residential Behavior/Feedback Program 1.93 5,874,858 12,182,604 5,996,002 190,208 - 6,307,747
A2 - Residential Products 3.07 122,551,242 181,781,748 38,645,313 3,196,514 16,664,084 59,230,505
A2a - Residential Heating & Cooling Equipment 1.00 10,121 9,181,768 5,309,179 97,983 3,662,282 9,171,647
A2b - Residential Consumer Products 1.55 2,481,005 6,992,813 3,295,167 100,026 1,053,504 4,511,808
A2c - Residential Lighting 3.64 120,060,116 165,607,167 30,040,967 2,998,505 11,948,297 45,547,051
A3 - Residential Hard-to-Measure 0.00 (11,679,993) - 11,679,993 - - 11,679,993
B - Low-Income 1.72 24,019,343 57,586,199 32,061,289 880,327 - 33,566,856
B1 - Low-Income Whole House 1.75 24,753,641 57,586,199 31,326,991 880,327 - 32,832,558
B1a - Low-Income Single Family Retrofit 2.14 19,672,734 37,004,552 16,402,278 606,188 - 17,331,818
B1b - Low-Income Multi-Family Retrofit 1.33 5,080,906 20,581,647 14,924,713 274,139 - 15,500,740
B2 - Low-Income Hard-to-Measure 0.00 (734,298) - 734,298 - - 734,298
C - Commercial & Industrial 2.45 269,244,114 455,323,093 116,886,628 7,838,962 59,174,253 186,078,979
C1 - C&I New Construction 3.53 99,350,341 138,642,052 27,676,392 2,570,287 8,568,700 39,291,712
C1a - C&I New Buildings & Major Renovations 3.31 46,852,392 67,120,990 13,917,036 1,230,668 4,889,171 20,268,598
C1b - C&I Initial Purchase & End of Useful Life 3.76 52,497,949 71,521,063 13,759,357 1,339,619 3,679,529 19,023,114
C2 - C&I Retrofit 2.19 172,101,600 316,681,040 87,002,410 5,268,675 50,605,553 144,579,441
C2a - C&I Existing Building Retrofit 1.82 81,154,908 180,466,768 52,233,111 2,816,596 43,255,873 99,311,859
C2b - C&I Small Business 2.35 34,912,105 60,797,720 19,880,788 1,032,057 4,588,678 25,885,615
C2c - C&I Multifamily Retrofit 0.61 (2,502,766) 3,946,514 6,898,991 14,609 (588,676) 6,449,280
C2d - C&I Upstream Lighting 5.53 58,537,352 71,470,039 7,989,520 1,405,413 3,349,678 12,932,687
C3 - C&I Hard-to-Measure 0.00 (2,207,826) - 2,207,826 - - 2,207,826
Grand Total 2.30 514,887,413 911,868,595 277,700,351 15,429,638 98,928,240 396,981,183
Total Program Costs Performance Incentive Participant CostsTotal TRC Test
Costs
A - Residential 2.13 198,952,672 375,090,555 113,572,245 6,304,757 56,260,880 176,137,883
A1 - Residential Whole House 2.10 96,873,287 184,660,933 62,567,810 3,075,681 22,144,156 87,787,646
A1a - Residential New Construction 1.20 3,754,668 22,073,985 4,618,905 275,595 13,424,816 18,319,317
A1b - Residential Multi-Family Retrofit 1.46 3,474,554 11,056,297 8,231,279 155,097 (804,632) 7,581,743
A1c - Residential Home Energy Services - Measures 2.84 90,692,810 140,019,120 37,338,486 2,463,853 9,523,972 49,326,310
A1d - Residential Home Energy Services - RCS 0.00 (6,502,766) - 6,502,766 - - 6,502,766
A1e - Residential Behavior/Feedback Program 1.90 5,454,021 11,511,531 5,876,374 181,136 - 6,057,510
A2 - Residential Products 2.43 111,960,911 190,429,622 41,122,909 3,229,077 34,116,725 78,468,711
A2a - Residential Heating & Cooling Equipment 1.35 2,643,349 10,147,745 5,851,472 136,512 1,516,412 7,504,396
A2b - Residential Consumer Products 1.68 4,270,656 10,531,741 4,564,319 158,022 1,538,744 6,261,085
A2c - Residential Lighting 2.62 105,046,906 169,750,136 30,707,117 2,934,543 31,061,570 64,703,230
A3 - Residential Hard-to-Measure 0.00 (9,881,526) - 9,881,526 - - 9,881,526
B - Low-Income 1.81 26,671,993 59,574,120 31,976,251 925,876 - 32,902,127
B1 - Low-Income Whole House 1.84 27,147,884 59,574,120 31,500,359 925,876 - 32,426,236
B1a - Low-Income Single Family Retrofit 2.50 20,590,781 34,296,185 13,119,284 586,120 - 13,705,404
B1b - Low-Income Multi-Family Retrofit 1.35 6,557,103 25,277,935 18,381,075 339,756 - 18,720,831
B2 - Low-Income Hard-to-Measure 0.00 (475,891) - 475,891 - - 475,891
C - Commercial & Industrial 2.46 297,153,968 501,230,690 103,614,283 8,542,699 91,919,740 204,076,722
C1 - C&I New Construction 3.57 68,764,704 95,548,763 18,498,332 1,754,916 6,530,811 26,784,058
C1a - C&I New Buildings & Major Renovations 3.79 38,860,873 52,786,731 9,264,968 978,842 3,682,048 13,925,858
C1b - C&I Initial Purchase & End of Useful Life 3.33 29,903,832 42,762,032 9,233,364 776,074 2,848,762 12,858,200
C2 - C&I Retrofit 2.31 229,986,380 405,681,927 83,518,835 6,787,783 85,388,929 175,695,547
C2a - C&I Existing Building Retrofit 2.07 139,830,352 270,287,916 54,401,338 4,379,000 71,677,225 130,457,563
C2b - C&I Small Business 3.01 50,518,849 75,652,686 17,810,528 1,347,464 5,975,845 25,133,837
C2c - C&I Multifamily Retrofit 1.14 598,950 4,869,541 4,289,462 58,342 (77,213) 4,270,591
C2d - C&I Upstream Lighting 3.47 39,038,228 54,871,783 7,017,506 1,002,977 7,813,072 15,833,555
C3 - C&I Hard-to-Measure 0.00 (1,597,116) - 1,597,116 - - 1,597,116
Grand Total 2.27 522,778,633 935,895,364 249,162,779 15,773,333 148,180,620 413,116,732
2017 Planned Total Resource Cost Test (2016$)
ProgramBenefit-Cost
RatioNet Benefits
Total TRC Test
Benefits
Costs
2017 Evaluated Total Resource Cost Test (2016$)
Benefit-Cost
RatioNet Benefits
Total TRC Test
Benefits
Costs
Program
Massachusetts Electric Company and Nantucket Electric Company d/b/a National Grid
D.P.U. 18-512017 Energy Efficiency Plan-Year Report
Master Data Tables26 of 37

Cost-Effectiveness, Plan Year Summary2017 Planned vs. EvaluatedNational GridJune 8, 2018
Total Program Costs Performance Incentive Participant CostsTotal TRC Test
Costs
A - Residential -5% -10% -6% -12% -6% 42% -1%
A1 - Residential Whole House 3% -13% -15% -20% -12% -4% -18%
A1a - Residential New Construction -24% -7% 101% 56% 74% 260% 165%
A1b - Residential Multi-Family Retrofit 62% -460% 23% -20% 81% 22% -24%
A1c - Residential Home Energy Services - Measures 19% -16% -24% -30% -20% -52% -36%
A1d - Residential Home Energy Services - RCS 9% 9% 9%
A1e - Residential Behavior/Feedback Program -2% -7% -6% -2% -5% -4%
A2 - Residential Products -21% -9% 5% 6% 1% 105% 32%
A2a - Residential Heating & Cooling Equipment 35% 26017% 11% 10% 39% -59% -18%
A2b - Residential Consumer Products 9% 72% 51% 39% 58% 46% 39%
A2c - Residential Lighting -28% -13% 3% 2% -2% 160% 42%
A3 - Residential Hard-to-Measure -15% -15% -15%
B - Low-Income 6% 11% 3% 0% 5% -2%
B1 - Low-Income Whole House 5% 10% 3% 1% 5% -1%
B1a - Low-Income Single Family Retrofit 17% 5% -7% -20% -3% -21%
B1b - Low-Income Multi-Family Retrofit 2% 29% 23% 23% 24% 21%
B2 - Low-Income Hard-to-Measure -35% -35% -35%
C - Commercial & Industrial 0% 10% 10% -11% 9% 55% 10%
C1 - C&I New Construction 1% -31% -31% -33% -32% -24% -32%
C1a - C&I New Buildings & Major Renovations 14% -17% -21% -33% -20% -25% -31%
C1b - C&I Initial Purchase & End of Useful Life -12% -43% -40% -33% -42% -23% -32%
C2 - C&I Retrofit 5% 34% 28% -4% 29% 69% 22%
C2a - C&I Existing Building Retrofit 14% 72% 50% 4% 55% 66% 31%
C2b - C&I Small Business 28% 45% 24% -10% 31% 30% -3%
C2c - C&I Multifamily Retrofit 86% -124% 23% -38% 299% -87% -34%
C2d - C&I Upstream Lighting -37% -33% -23% -12% -29% 133% 22%
C3 - C&I Hard-to-Measure -28% -28% -28%
Grand Total -1% 2% 3% -10% 2% 50% 4%
Notes
• The Green Communities Act requires that energy efficiency programs be cost-effective. G.L. c. 25, §§ 21(a), 21(b)(3). If a core initiative is not cost-effective, the Program Administrator has provided an explanation in its report
filing.
• The plan year variances provided above are intended to indicate the Program Administrator's performance in the plan year only. The variances used to determine significant variances are provided separately. The variances
above and the significant variances use different calculations to determine variances on an annual basis and over the three-year term, respectively.
Total TRC Test
Benefits
Costs
Program
2017 Planned v. Evaluated Total Resource Cost Test (2016$) Variances (%)
Benefit-Cost
RatioNet Benefits
Massachusetts Electric Company and Nantucket Electric Company d/b/a National Grid
D.P.U. 18-512017 Energy Efficiency Plan-Year Report
Master Data Tables27 of 37
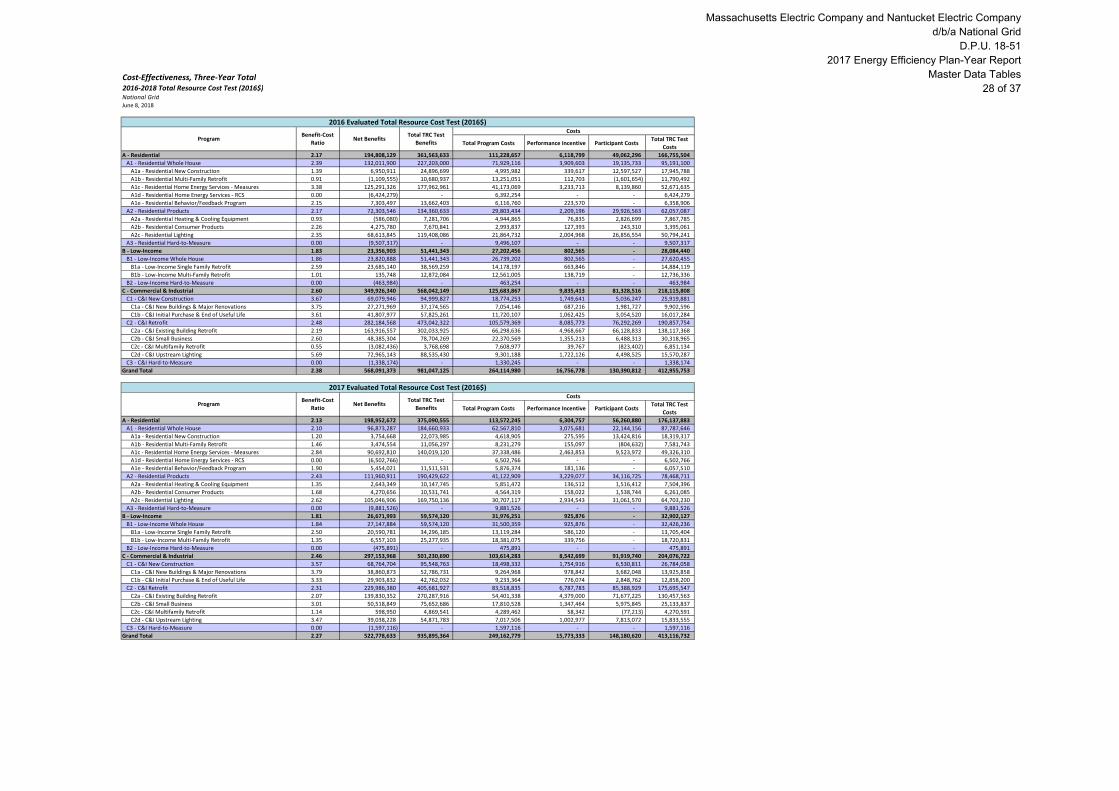
Cost-Effectiveness, Three-Year Total2016-2018 Total Resource Cost Test (2016$)National GridJune 8, 2018
Total Program Costs Performance Incentive Participant CostsTotal TRC Test
Costs
A - Residential 2.17 194,808,129 361,563,633 111,228,657 6,118,799 49,062,296 166,755,504
A1 - Residential Whole House 2.39 132,011,900 227,203,000 71,929,116 3,909,603 19,135,733 95,191,100
A1a - Residential New Construction 1.39 6,950,911 24,896,699 4,995,982 339,617 12,597,527 17,945,788
A1b - Residential Multi-Family Retrofit 0.91 (1,109,555) 10,680,937 13,251,051 112,703 (1,601,654) 11,790,492
A1c - Residential Home Energy Services - Measures 3.38 125,291,326 177,962,961 41,173,069 3,233,713 8,139,860 52,671,635
A1d - Residential Home Energy Services - RCS 0.00 (6,424,279) - 6,392,254 - - 6,424,279
A1e - Residential Behavior/Feedback Program 2.15 7,303,497 13,662,403 6,116,760 223,570 - 6,358,906
A2 - Residential Products 2.17 72,303,546 134,360,633 29,803,434 2,209,196 29,926,563 62,057,087
A2a - Residential Heating & Cooling Equipment 0.93 (586,080) 7,281,706 4,944,865 76,835 2,826,699 7,867,785
A2b - Residential Consumer Products 2.26 4,275,780 7,670,841 2,993,837 127,393 243,310 3,395,061
A2c - Residential Lighting 2.35 68,613,845 119,408,086 21,864,732 2,004,968 26,856,554 50,794,241
A3 - Residential Hard-to-Measure 0.00 (9,507,317) - 9,496,107 - - 9,507,317
B - Low-Income 1.83 23,356,903 51,441,343 27,202,456 802,565 - 28,084,440
B1 - Low-Income Whole House 1.86 23,820,888 51,441,343 26,739,202 802,565 - 27,620,455
B1a - Low-Income Single Family Retrofit 2.59 23,685,140 38,569,259 14,178,197 663,846 - 14,884,119
B1b - Low-Income Multi-Family Retrofit 1.01 135,748 12,872,084 12,561,005 138,719 - 12,736,336
B2 - Low-Income Hard-to-Measure 0.00 (463,984) - 463,254 - - 463,984
C - Commercial & Industrial 2.60 349,926,340 568,042,149 125,683,867 9,835,413 81,328,516 218,115,808
C1 - C&I New Construction 3.67 69,079,946 94,999,827 18,774,253 1,749,641 5,036,247 25,919,881
C1a - C&I New Buildings & Major Renovations 3.75 27,271,969 37,174,565 7,054,146 687,216 1,981,727 9,902,596
C1b - C&I Initial Purchase & End of Useful Life 3.61 41,807,977 57,825,261 11,720,107 1,062,425 3,054,520 16,017,284
C2 - C&I Retrofit 2.48 282,184,568 473,042,322 105,579,369 8,085,773 76,292,269 190,857,754
C2a - C&I Existing Building Retrofit 2.19 163,916,557 302,033,925 66,298,636 4,968,667 66,128,833 138,117,368
C2b - C&I Small Business 2.60 48,385,304 78,704,269 22,370,569 1,355,213 6,488,313 30,318,965
C2c - C&I Multifamily Retrofit 0.55 (3,082,436) 3,768,698 7,608,977 39,767 (823,402) 6,851,134
C2d - C&I Upstream Lighting 5.69 72,965,143 88,535,430 9,301,188 1,722,126 4,498,525 15,570,287
C3 - C&I Hard-to-Measure 0.00 (1,338,174) - 1,330,245 - - 1,338,174
Grand Total 2.38 568,091,373 981,047,125 264,114,980 16,756,778 130,390,812 412,955,753
Total Program Costs Performance Incentive Participant CostsTotal TRC Test
Costs
A - Residential 2.13 198,952,672 375,090,555 113,572,245 6,304,757 56,260,880 176,137,883
A1 - Residential Whole House 2.10 96,873,287 184,660,933 62,567,810 3,075,681 22,144,156 87,787,646
A1a - Residential New Construction 1.20 3,754,668 22,073,985 4,618,905 275,595 13,424,816 18,319,317
A1b - Residential Multi-Family Retrofit 1.46 3,474,554 11,056,297 8,231,279 155,097 (804,632) 7,581,743
A1c - Residential Home Energy Services - Measures 2.84 90,692,810 140,019,120 37,338,486 2,463,853 9,523,972 49,326,310
A1d - Residential Home Energy Services - RCS 0.00 (6,502,766) - 6,502,766 - - 6,502,766
A1e - Residential Behavior/Feedback Program 1.90 5,454,021 11,511,531 5,876,374 181,136 - 6,057,510
A2 - Residential Products 2.43 111,960,911 190,429,622 41,122,909 3,229,077 34,116,725 78,468,711
A2a - Residential Heating & Cooling Equipment 1.35 2,643,349 10,147,745 5,851,472 136,512 1,516,412 7,504,396
A2b - Residential Consumer Products 1.68 4,270,656 10,531,741 4,564,319 158,022 1,538,744 6,261,085
A2c - Residential Lighting 2.62 105,046,906 169,750,136 30,707,117 2,934,543 31,061,570 64,703,230
A3 - Residential Hard-to-Measure 0.00 (9,881,526) - 9,881,526 - - 9,881,526
B - Low-Income 1.81 26,671,993 59,574,120 31,976,251 925,876 - 32,902,127
B1 - Low-Income Whole House 1.84 27,147,884 59,574,120 31,500,359 925,876 - 32,426,236
B1a - Low-Income Single Family Retrofit 2.50 20,590,781 34,296,185 13,119,284 586,120 - 13,705,404
B1b - Low-Income Multi-Family Retrofit 1.35 6,557,103 25,277,935 18,381,075 339,756 - 18,720,831
B2 - Low-Income Hard-to-Measure 0.00 (475,891) - 475,891 - - 475,891
C - Commercial & Industrial 2.46 297,153,968 501,230,690 103,614,283 8,542,699 91,919,740 204,076,722
C1 - C&I New Construction 3.57 68,764,704 95,548,763 18,498,332 1,754,916 6,530,811 26,784,058
C1a - C&I New Buildings & Major Renovations 3.79 38,860,873 52,786,731 9,264,968 978,842 3,682,048 13,925,858
C1b - C&I Initial Purchase & End of Useful Life 3.33 29,903,832 42,762,032 9,233,364 776,074 2,848,762 12,858,200
C2 - C&I Retrofit 2.31 229,986,380 405,681,927 83,518,835 6,787,783 85,388,929 175,695,547
C2a - C&I Existing Building Retrofit 2.07 139,830,352 270,287,916 54,401,338 4,379,000 71,677,225 130,457,563
C2b - C&I Small Business 3.01 50,518,849 75,652,686 17,810,528 1,347,464 5,975,845 25,133,837
C2c - C&I Multifamily Retrofit 1.14 598,950 4,869,541 4,289,462 58,342 (77,213) 4,270,591
C2d - C&I Upstream Lighting 3.47 39,038,228 54,871,783 7,017,506 1,002,977 7,813,072 15,833,555
C3 - C&I Hard-to-Measure 0.00 (1,597,116) - 1,597,116 - - 1,597,116
Grand Total 2.27 522,778,633 935,895,364 249,162,779 15,773,333 148,180,620 413,116,732
2016 Evaluated Total Resource Cost Test (2016$)
ProgramBenefit-Cost
RatioNet Benefits
Total TRC Test
Benefits
Costs
2017 Evaluated Total Resource Cost Test (2016$)
ProgramBenefit-Cost
RatioNet Benefits
Total TRC Test
Benefits
Costs
Massachusetts Electric Company and Nantucket Electric Company d/b/a National Grid
D.P.U. 18-512017 Energy Efficiency Plan-Year Report
Master Data Tables28 of 37

Cost-Effectiveness, Three-Year Total2016-2018 Total Resource Cost Test (2016$)National GridJune 8, 2018
Total Program Costs Performance Incentive Participant CostsTotal TRC Test
Costs
A - Residential 2.25 217,451,193 391,336,685 128,222,793 6,582,822 36,951,795 173,885,491
A1 - Residential Whole House 2.03 110,497,886 217,752,650 79,366,412 3,518,583 22,969,531 107,254,764
A1a - Residential New Construction 1.76 5,266,928 12,191,498 3,019,048 184,142 3,662,137 6,924,570
A1b - Residential Multi-Family Retrofit 0.93 (719,571) 9,298,883 10,390,501 91,728 (665,364) 10,018,453
A1c - Residential Home Energy Services - Measures 2.39 108,464,780 186,765,045 54,203,522 3,106,662 19,972,759 78,300,265
A1d - Residential Home Energy Services - RCS 0.00 (5,898,170) - 5,898,170 - - 5,898,170
A1e - Residential Behavior/Feedback Program 1.55 3,383,919 9,497,224 5,855,171 136,051 - 6,113,305
A2 - Residential Products 3.12 118,000,912 173,584,035 37,808,775 3,064,239 13,982,264 55,583,122
A2a - Residential Heating & Cooling Equipment 1.02 139,376 9,322,535 5,387,811 100,815 3,591,872 9,183,159
A2b - Residential Consumer Products 1.59 2,632,639 7,112,347 3,259,987 102,900 1,053,428 4,479,708
A2c - Residential Lighting 3.75 115,228,897 157,149,152 29,160,978 2,860,524 9,336,963 41,920,255
A3 - Residential Hard-to-Measure 0.00 (11,047,605) - 11,047,605 - - 11,047,605
B - Low-Income 1.77 25,467,778 58,340,621 31,340,384 904,414 - 32,872,843
B1 - Low-Income Whole House 1.81 26,188,472 58,340,621 30,619,689 904,414 - 32,152,148
B1a - Low-Income Single Family Retrofit 2.18 20,074,316 37,071,474 16,060,667 611,688 - 16,997,158
B1b - Low-Income Multi-Family Retrofit 1.40 6,114,156 21,269,147 14,559,022 292,726 - 15,154,990
B2 - Low-Income Hard-to-Measure 0.00 (720,695) - 720,695 - - 720,695
C - Commercial & Industrial 2.53 294,179,553 486,043,535 115,109,242 8,442,812 66,123,016 191,863,982
C1 - C&I New Construction 3.51 107,084,036 149,754,241 29,917,909 2,775,064 9,498,763 42,670,205
C1a - C&I New Buildings & Major Renovations 3.32 51,806,901 74,160,295 15,259,784 1,360,805 5,500,041 22,353,394
C1b - C&I Initial Purchase & End of Useful Life 3.72 55,277,135 75,593,946 14,658,124 1,414,259 3,998,722 20,316,811
C2 - C&I Retrofit 2.29 189,181,983 336,289,294 83,104,868 5,667,748 56,624,253 147,107,311
C2a - C&I Existing Building Retrofit 1.82 84,942,518 188,083,778 48,795,118 2,940,485 50,394,864 103,141,261
C2b - C&I Small Business 2.39 35,834,869 61,706,034 19,861,464 1,052,315 4,571,571 25,871,165
C2c - C&I Multifamily Retrofit 0.60 (2,561,178) 3,882,672 6,898,706 13,257 (593,027) 6,443,849
C2d - C&I Upstream Lighting 7.09 70,965,774 82,616,809 7,549,580 1,661,692 2,250,845 11,651,036
C3 - C&I Hard-to-Measure 0.00 (2,086,466) - 2,086,466 - - 2,086,466
Grand Total 2.35 537,098,524 935,720,840 274,672,419 15,930,048 103,074,811 398,622,316
Total Program Costs Performance Incentive Participant CostsTotal TRC Test
Costs
A - Residential 2.18 611,211,994 1,127,990,873 353,023,694 19,006,378 142,274,972 516,778,878
A1 - Residential Whole House 2.17 339,383,073 629,616,583 213,863,338 10,503,867 64,249,420 290,233,510
A1a - Residential New Construction 1.37 15,972,507 59,162,182 12,633,935 799,354 29,684,481 43,189,675
A1b - Residential Multi-Family Retrofit 1.06 1,645,429 31,036,117 31,872,831 359,527 (3,071,650) 29,390,688
A1c - Residential Home Energy Services - Measures 2.80 324,448,915 504,747,126 132,715,077 8,804,228 37,636,590 180,298,211
A1d - Residential Home Energy Services - RCS 0.00 (18,825,215) - 18,793,190 - - 18,825,215
A1e - Residential Behavior/Feedback Program 1.87 16,141,437 34,671,157 17,848,305 540,757 - 18,529,721
A2 - Residential Products 2.54 302,265,369 498,374,290 108,735,119 8,502,511 78,025,552 196,108,921
A2a - Residential Heating & Cooling Equipment 1.09 2,196,646 26,751,986 16,184,148 314,162 7,934,982 24,555,340
A2b - Residential Consumer Products 1.79 11,179,075 25,314,930 10,818,143 388,315 2,835,482 14,135,855
A2c - Residential Lighting 2.84 288,889,649 446,307,374 81,732,827 7,800,035 67,255,087 157,417,726
A3 - Residential Hard-to-Measure 0.00 (30,436,448) - 30,425,237 - - 30,436,448
B - Low-Income 1.80 75,496,674 169,356,084 90,519,091 2,632,856 - 93,859,410
B1 - Low-Income Whole House 1.84 77,157,245 169,356,084 88,859,250 2,632,856 - 92,198,839
B1a - Low-Income Single Family Retrofit 2.41 64,350,237 109,936,918 43,358,148 1,861,655 - 45,586,682
B1b - Low-Income Multi-Family Retrofit 1.27 12,807,008 59,419,165 45,501,102 771,201 - 46,612,157
B2 - Low-Income Hard-to-Measure 0.00 (1,660,571) - 1,659,841 - - 1,660,571
C - Commercial & Industrial 2.53 941,259,861 1,555,316,373 344,407,393 26,820,924 239,371,271 614,056,512
C1 - C&I New Construction 3.57 244,928,686 340,302,830 67,190,494 6,279,620 21,065,820 95,374,144
C1a - C&I New Buildings & Major Renovations 3.55 117,939,743 164,121,591 31,578,898 3,026,863 11,163,817 46,181,848
C1b - C&I Initial Purchase & End of Useful Life 3.58 126,988,944 176,181,239 35,611,595 3,252,757 9,902,004 49,192,296
C2 - C&I Retrofit 2.37 701,352,931 1,215,013,543 272,203,072 20,541,304 218,305,451 513,660,612
C2a - C&I Existing Building Retrofit 2.05 388,689,427 760,405,619 169,495,091 12,288,152 188,200,922 371,716,192
C2b - C&I Small Business 2.66 134,739,023 216,062,990 60,042,561 3,754,991 17,035,729 81,323,968
C2c - C&I Multifamily Retrofit 0.71 (5,044,664) 12,520,911 18,797,145 111,365 (1,493,643) 17,565,575
C2d - C&I Upstream Lighting 5.25 182,969,145 226,024,023 23,868,274 4,386,795 14,562,442 43,054,878
C3 - C&I Hard-to-Measure 0.00 (5,021,756) - 5,013,827 - - 5,021,756
Grand Total 2.33 1,627,968,529 2,852,663,330 787,950,178 48,460,158 381,646,243 1,224,694,800
Notes
• The Green Communities Act requires that energy efficiency programs be cost-effective. G.L. c. 25, §§ 21(a), 21(b)(3). If a core initiative is not cost-effective, the Program Administrator has provided an explanation in its report
filing.
2018 Planned Total Resource Cost Test (2016$)
ProgramBenefit-Cost
RatioNet Benefits
Total TRC Test
Benefits
Costs
2016-2018 Total Resource Cost Test (2016$)
ProgramBenefit-Cost
RatioNet Benefits
Total TRC Test
Benefits
Costs
Massachusetts Electric Company and Nantucket Electric Company d/b/a National Grid
D.P.U. 18-512017 Energy Efficiency Plan-Year Report
Master Data Tables29 of 37
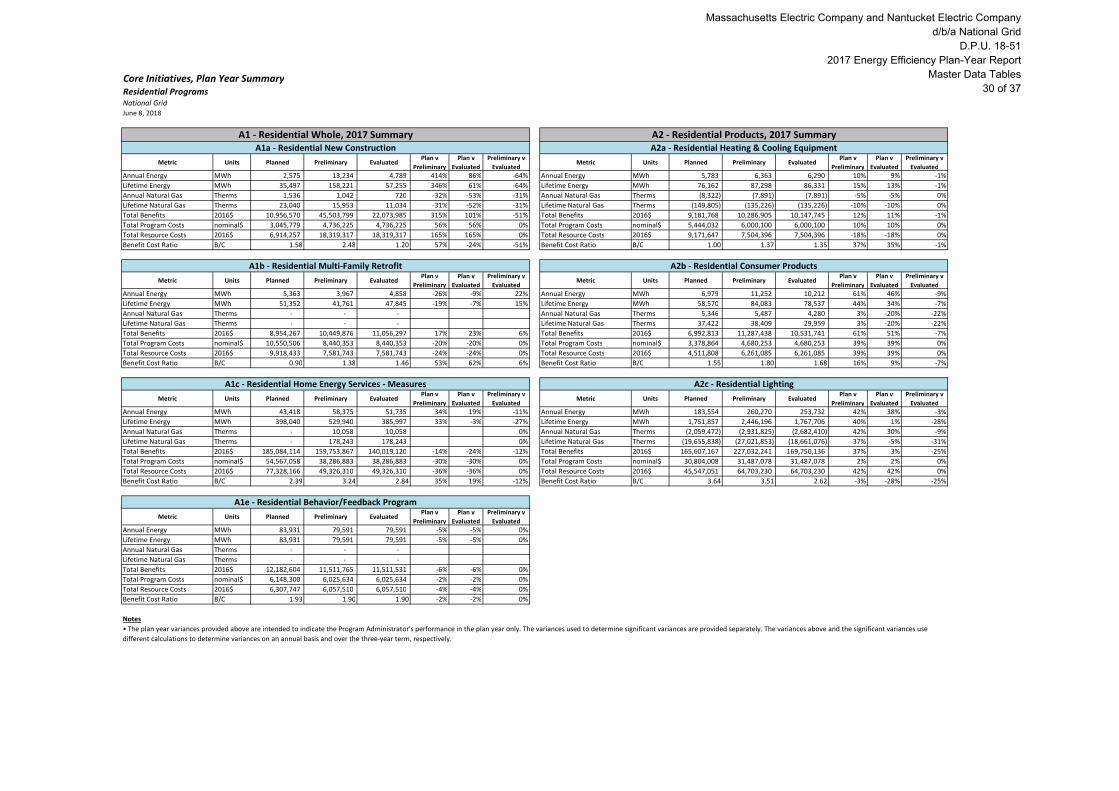
Core Initiatives, Plan Year SummaryResidential ProgramsNational GridJune 8, 2018
Metric Units Planned Preliminary EvaluatedPlan v
Preliminary
Plan v
Evaluated
Preliminary v
EvaluatedMetric Units Planned Preliminary Evaluated
Plan v
Preliminary
Plan v
Evaluated
Preliminary v
Evaluated
Annual Energy MWh 2,575 13,234 4,789 414% 86% -64% Annual Energy MWh 5,783 6,363 6,290 10% 9% -1%
Lifetime Energy MWh 35,497 158,221 57,255 346% 61% -64% Lifetime Energy MWh 76,162 87,298 86,331 15% 13% -1%
Annual Natural Gas Therms 1,536 1,042 720 -32% -53% -31% Annual Natural Gas Therms (8,322) (7,891) (7,891) -5% -5% 0%
Lifetime Natural Gas Therms 23,040 15,953 11,034 -31% -52% -31% Lifetime Natural Gas Therms (149,805) (135,226) (135,226) -10% -10% 0%
Total Benefits 2016$ 10,956,570 45,503,799 22,073,985 315% 101% -51% Total Benefits 2016$ 9,181,768 10,286,905 10,147,745 12% 11% -1%
Total Program Costs nominal$ 3,045,779 4,736,225 4,736,225 56% 56% 0% Total Program Costs nominal$ 5,444,032 6,000,100 6,000,100 10% 10% 0%
Total Resource Costs 2016$ 6,914,257 18,319,317 18,319,317 165% 165% 0% Total Resource Costs 2016$ 9,171,647 7,504,396 7,504,396 -18% -18% 0%
Benefit Cost Ratio B/C 1.58 2.48 1.20 57% -24% -51% Benefit Cost Ratio B/C 1.00 1.37 1.35 37% 35% -1%
Metric Units Planned Preliminary EvaluatedPlan v
Preliminary
Plan v
Evaluated
Preliminary v
EvaluatedMetric Units Planned Preliminary Evaluated
Plan v
Preliminary
Plan v
Evaluated
Preliminary v
Evaluated
Annual Energy MWh 5,363 3,967 4,858 -26% -9% 22% Annual Energy MWh 6,979 11,252 10,212 61% 46% -9%
Lifetime Energy MWh 51,352 41,761 47,845 -19% -7% 15% Lifetime Energy MWh 58,570 84,083 78,537 44% 34% -7%
Annual Natural Gas Therms - - - Annual Natural Gas Therms 5,346 5,487 4,280 3% -20% -22%
Lifetime Natural Gas Therms - - - Lifetime Natural Gas Therms 37,422 38,409 29,959 3% -20% -22%
Total Benefits 2016$ 8,954,267 10,449,876 11,056,297 17% 23% 6% Total Benefits 2016$ 6,992,813 11,287,438 10,531,741 61% 51% -7%
Total Program Costs nominal$ 10,550,506 8,440,353 8,440,353 -20% -20% 0% Total Program Costs nominal$ 3,378,864 4,680,253 4,680,253 39% 39% 0%
Total Resource Costs 2016$ 9,918,433 7,581,743 7,581,743 -24% -24% 0% Total Resource Costs 2016$ 4,511,808 6,261,085 6,261,085 39% 39% 0%
Benefit Cost Ratio B/C 0.90 1.38 1.46 53% 62% 6% Benefit Cost Ratio B/C 1.55 1.80 1.68 16% 9% -7%
Metric Units Planned Preliminary EvaluatedPlan v
Preliminary
Plan v
Evaluated
Preliminary v
EvaluatedMetric Units Planned Preliminary Evaluated
Plan v
Preliminary
Plan v
Evaluated
Preliminary v
Evaluated
Annual Energy MWh 43,418 58,375 51,735 34% 19% -11% Annual Energy MWh 183,554 260,270 253,732 42% 38% -3%
Lifetime Energy MWh 398,040 529,940 385,997 33% -3% -27% Lifetime Energy MWh 1,751,857 2,446,196 1,767,706 40% 1% -28%
Annual Natural Gas Therms - 10,058 10,058 0% Annual Natural Gas Therms (2,059,472) (2,931,825) (2,682,410) 42% 30% -9%
Lifetime Natural Gas Therms - 178,243 178,243 0% Lifetime Natural Gas Therms (19,655,838) (27,021,853) (18,661,076) 37% -5% -31%
Total Benefits 2016$ 185,084,114 159,753,867 140,019,120 -14% -24% -12% Total Benefits 2016$ 165,607,167 227,032,241 169,750,136 37% 3% -25%
Total Program Costs nominal$ 54,567,058 38,286,883 38,286,883 -30% -30% 0% Total Program Costs nominal$ 30,804,008 31,487,078 31,487,078 2% 2% 0%
Total Resource Costs 2016$ 77,328,166 49,326,310 49,326,310 -36% -36% 0% Total Resource Costs 2016$ 45,547,051 64,703,230 64,703,230 42% 42% 0%
Benefit Cost Ratio B/C 2.39 3.24 2.84 35% 19% -12% Benefit Cost Ratio B/C 3.64 3.51 2.62 -3% -28% -25%
Metric Units Planned Preliminary EvaluatedPlan v
Preliminary
Plan v
Evaluated
Preliminary v
Evaluated
Annual Energy MWh 83,931 79,591 79,591 -5% -5% 0%
Lifetime Energy MWh 83,931 79,591 79,591 -5% -5% 0%
Annual Natural Gas Therms - - -
Lifetime Natural Gas Therms - - -
Total Benefits 2016$ 12,182,604 11,511,765 11,511,531 -6% -6% 0%
Total Program Costs nominal$ 6,148,300 6,025,634 6,025,634 -2% -2% 0%
Total Resource Costs 2016$ 6,307,747 6,057,510 6,057,510 -4% -4% 0%
Benefit Cost Ratio B/C 1.93 1.90 1.90 -2% -2% 0%
Notes
A2b - Residential Consumer Products
A2c - Residential Lighting
A2 - Residential Products, 2017 Summary
• The plan year variances provided above are intended to indicate the Program Administrator's performance in the plan year only. The variances used to determine significant variances are provided separately. The variances above and the significant variances use
different calculations to determine variances on an annual basis and over the three-year term, respectively.
A1e - Residential Behavior/Feedback Program
A1 - Residential Whole, 2017 SummaryA1a - Residential New Construction
A1b - Residential Multi-Family Retrofit
A1c - Residential Home Energy Services - Measures
A2a - Residential Heating & Cooling Equipment
Massachusetts Electric Company and Nantucket Electric Company d/b/a National Grid
D.P.U. 18-512017 Energy Efficiency Plan-Year Report
Master Data Tables30 of 37

Core Initiatives, Plan Year SummaryLow-Income ProgramsNational GridJune 8, 2018
Metric Units Planned Preliminary EvaluatedPlan v
Preliminary
Plan v
Evaluated
Preliminary v
Evaluated
Annual Energy MWh 8,146 7,001 6,383 -14% -22% -9%
Lifetime Energy MWh 78,042 68,272 55,662 -13% -29% -18%
Annual Natural Gas Therms 317 641 641 102% 102% 0%
Lifetime Natural Gas Therms 2,220 5,868 5,868 164% 164% 0%
Total Benefits 2016$ 37,004,552 29,534,365 34,296,185 -20% -7% 16%
Total Program Costs nominal$ 16,818,896 13,452,514 13,452,514 -20% -20% 0%
Total Resource Costs 2016$ 17,331,818 13,705,404 13,705,404 -21% -21% 0%
Benefit Cost Ratio B/C 2.14 2.15 2.50 1% 17% 16%
Metric Units Planned Preliminary EvaluatedPlan v
Preliminary
Plan v
Evaluated
Preliminary v
Evaluated
Annual Energy MWh 12,462 12,546 12,556 1% 1% 0%
Lifetime Energy MWh 101,685 151,639 161,070 49% 58% 6%
Annual Natural Gas Therms - - -
Lifetime Natural Gas Therms - - -
Total Benefits 2016$ 20,581,647 20,445,122 25,277,935 -1% 23% 24%
Total Program Costs nominal$ 15,303,801 18,847,955 18,847,955 23% 23% 0%
Total Resource Costs 2016$ 15,500,740 18,720,831 18,720,831 21% 21% 0%
Benefit Cost Ratio B/C 1.33 1.09 1.35 -18% 2% 24%
Notes
B1a - Low-Income Single Family Retrofit
B1b - Low-Income Multi-Family Retrofit
B1 - Low-Income Whole House, 2017 Summary
• The plan year variances provided above are intended to indicate the Program Administrator's performance in the plan year only.
The variances used to determine significant variances are provided separately. The variances above and the significant variances use
different calculations to determine variances on an annual basis and over the three-year term, respectively.
Massachusetts Electric Company and Nantucket Electric Company d/b/a National Grid
D.P.U. 18-512017 Energy Efficiency Plan-Year Report
Master Data Tables31 of 37
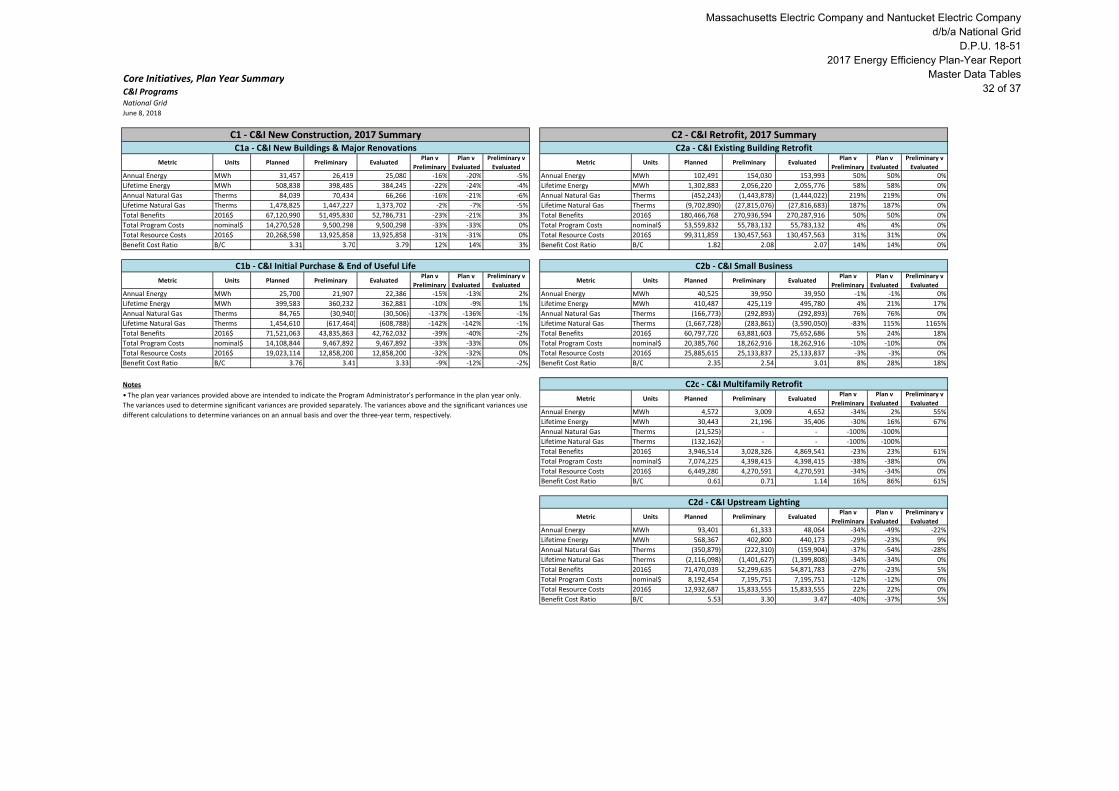
Core Initiatives, Plan Year SummaryC&I ProgramsNational GridJune 8, 2018
Metric Units Planned Preliminary EvaluatedPlan v
Preliminary
Plan v
Evaluated
Preliminary v
EvaluatedMetric Units Planned Preliminary Evaluated
Plan v
Preliminary
Plan v
Evaluated
Preliminary v
Evaluated
Annual Energy MWh 31,457 26,419 25,080 -16% -20% -5% Annual Energy MWh 102,491 154,030 153,993 50% 50% 0%
Lifetime Energy MWh 508,838 398,485 384,245 -22% -24% -4% Lifetime Energy MWh 1,302,883 2,056,220 2,055,776 58% 58% 0%
Annual Natural Gas Therms 84,039 70,434 66,266 -16% -21% -6% Annual Natural Gas Therms (452,243) (1,443,878) (1,444,022) 219% 219% 0%
Lifetime Natural Gas Therms 1,478,825 1,447,227 1,373,702 -2% -7% -5% Lifetime Natural Gas Therms (9,702,890) (27,815,076) (27,816,683) 187% 187% 0%
Total Benefits 2016$ 67,120,990 51,495,830 52,786,731 -23% -21% 3% Total Benefits 2016$ 180,466,768 270,936,594 270,287,916 50% 50% 0%
Total Program Costs nominal$ 14,270,528 9,500,298 9,500,298 -33% -33% 0% Total Program Costs nominal$ 53,559,832 55,783,132 55,783,132 4% 4% 0%
Total Resource Costs 2016$ 20,268,598 13,925,858 13,925,858 -31% -31% 0% Total Resource Costs 2016$ 99,311,859 130,457,563 130,457,563 31% 31% 0%
Benefit Cost Ratio B/C 3.31 3.70 3.79 12% 14% 3% Benefit Cost Ratio B/C 1.82 2.08 2.07 14% 14% 0%
Metric Units Planned Preliminary EvaluatedPlan v
Preliminary
Plan v
Evaluated
Preliminary v
EvaluatedMetric Units Planned Preliminary Evaluated
Plan v
Preliminary
Plan v
Evaluated
Preliminary v
Evaluated
Annual Energy MWh 25,700 21,907 22,386 -15% -13% 2% Annual Energy MWh 40,525 39,950 39,950 -1% -1% 0%
Lifetime Energy MWh 399,583 360,232 362,881 -10% -9% 1% Lifetime Energy MWh 410,487 425,119 495,780 4% 21% 17%
Annual Natural Gas Therms 84,765 (30,940) (30,506) -137% -136% -1% Annual Natural Gas Therms (166,773) (292,893) (292,893) 76% 76% 0%
Lifetime Natural Gas Therms 1,454,610 (617,464) (608,788) -142% -142% -1% Lifetime Natural Gas Therms (1,667,728) (283,861) (3,590,050) -83% 115% 1165%
Total Benefits 2016$ 71,521,063 43,835,863 42,762,032 -39% -40% -2% Total Benefits 2016$ 60,797,720 63,881,603 75,652,686 5% 24% 18%
Total Program Costs nominal$ 14,108,844 9,467,892 9,467,892 -33% -33% 0% Total Program Costs nominal$ 20,385,760 18,262,916 18,262,916 -10% -10% 0%
Total Resource Costs 2016$ 19,023,114 12,858,200 12,858,200 -32% -32% 0% Total Resource Costs 2016$ 25,885,615 25,133,837 25,133,837 -3% -3% 0%
Benefit Cost Ratio B/C 3.76 3.41 3.33 -9% -12% -2% Benefit Cost Ratio B/C 2.35 2.54 3.01 8% 28% 18%
Notes
Metric Units Planned Preliminary EvaluatedPlan v
Preliminary
Plan v
Evaluated
Preliminary v
Evaluated
Annual Energy MWh 4,572 3,009 4,652 -34% 2% 55%
Lifetime Energy MWh 30,443 21,196 35,406 -30% 16% 67%
Annual Natural Gas Therms (21,525) - - -100% -100%
Lifetime Natural Gas Therms (132,162) - - -100% -100%
Total Benefits 2016$ 3,946,514 3,028,326 4,869,541 -23% 23% 61%
Total Program Costs nominal$ 7,074,225 4,398,415 4,398,415 -38% -38% 0%
Total Resource Costs 2016$ 6,449,280 4,270,591 4,270,591 -34% -34% 0%
Benefit Cost Ratio B/C 0.61 0.71 1.14 16% 86% 61%
Metric Units Planned Preliminary EvaluatedPlan v
Preliminary
Plan v
Evaluated
Preliminary v
Evaluated
Annual Energy MWh 93,401 61,333 48,064 -34% -49% -22%
Lifetime Energy MWh 568,367 402,800 440,173 -29% -23% 9%
Annual Natural Gas Therms (350,879) (222,310) (159,904) -37% -54% -28%
Lifetime Natural Gas Therms (2,116,098) (1,401,627) (1,399,808) -34% -34% 0%
Total Benefits 2016$ 71,470,039 52,299,635 54,871,783 -27% -23% 5%
Total Program Costs nominal$ 8,192,454 7,195,751 7,195,751 -12% -12% 0%
Total Resource Costs 2016$ 12,932,687 15,833,555 15,833,555 22% 22% 0%
Benefit Cost Ratio B/C 5.53 3.30 3.47 -40% -37% 5%
C1 - C&I New Construction, 2017 Summary C2 - C&I Retrofit, 2017 SummaryC1a - C&I New Buildings & Major Renovations
• The plan year variances provided above are intended to indicate the Program Administrator's performance in the plan year only.
The variances used to determine significant variances are provided separately. The variances above and the significant variances use
different calculations to determine variances on an annual basis and over the three-year term, respectively.
C2a - C&I Existing Building Retrofit
C2b - C&I Small Business
C2c - C&I Multifamily Retrofit
C2d - C&I Upstream Lighting
C1b - C&I Initial Purchase & End of Useful Life
Massachusetts Electric Company and Nantucket Electric Company d/b/a National Grid
D.P.U. 18-512017 Energy Efficiency Plan-Year Report
Master Data Tables32 of 37
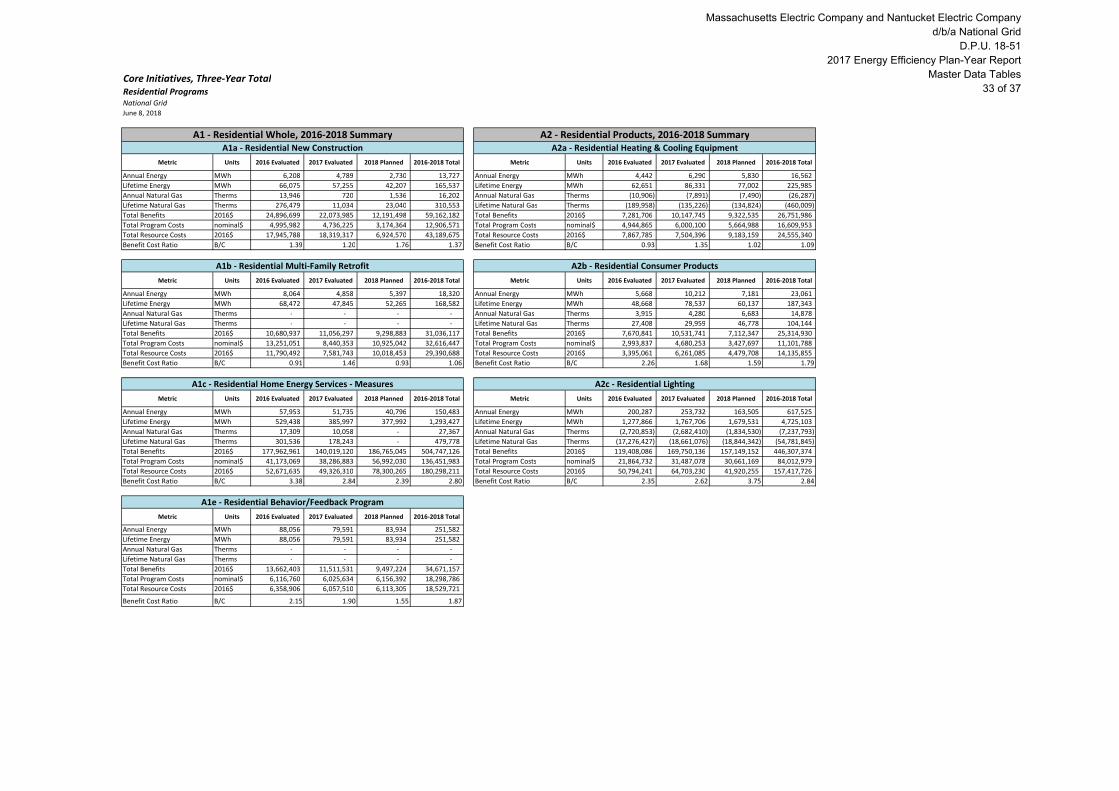
Core Initiatives, Three-Year TotalResidential ProgramsNational GridJune 8, 2018
Metric Units 2016 Evaluated 2017 Evaluated 2018 Planned 2016-2018 Total Metric Units 2016 Evaluated 2017 Evaluated 2018 Planned 2016-2018 Total
Annual Energy MWh 6,208 4,789 2,730 13,727 Annual Energy MWh 4,442 6,290 5,830 16,562
Lifetime Energy MWh 66,075 57,255 42,207 165,537 Lifetime Energy MWh 62,651 86,331 77,002 225,985
Annual Natural Gas Therms 13,946 720 1,536 16,202 Annual Natural Gas Therms (10,906) (7,891) (7,490) (26,287)
Lifetime Natural Gas Therms 276,479 11,034 23,040 310,553 Lifetime Natural Gas Therms (189,958) (135,226) (134,824) (460,009)
Total Benefits 2016$ 24,896,699 22,073,985 12,191,498 59,162,182 Total Benefits 2016$ 7,281,706 10,147,745 9,322,535 26,751,986
Total Program Costs nominal$ 4,995,982 4,736,225 3,174,364 12,906,571 Total Program Costs nominal$ 4,944,865 6,000,100 5,664,988 16,609,953
Total Resource Costs 2016$ 17,945,788 18,319,317 6,924,570 43,189,675 Total Resource Costs 2016$ 7,867,785 7,504,396 9,183,159 24,555,340
Benefit Cost Ratio B/C 1.39 1.20 1.76 1.37 Benefit Cost Ratio B/C 0.93 1.35 1.02 1.09
Metric Units 2016 Evaluated 2017 Evaluated 2018 Planned 2016-2018 Total Metric Units 2016 Evaluated 2017 Evaluated 2018 Planned 2016-2018 Total
Annual Energy MWh 8,064 4,858 5,397 18,320 Annual Energy MWh 5,668 10,212 7,181 23,061
Lifetime Energy MWh 68,472 47,845 52,265 168,582 Lifetime Energy MWh 48,668 78,537 60,137 187,343
Annual Natural Gas Therms - - - - Annual Natural Gas Therms 3,915 4,280 6,683 14,878
Lifetime Natural Gas Therms - - - - Lifetime Natural Gas Therms 27,408 29,959 46,778 104,144
Total Benefits 2016$ 10,680,937 11,056,297 9,298,883 31,036,117 Total Benefits 2016$ 7,670,841 10,531,741 7,112,347 25,314,930
Total Program Costs nominal$ 13,251,051 8,440,353 10,925,042 32,616,447 Total Program Costs nominal$ 2,993,837 4,680,253 3,427,697 11,101,788
Total Resource Costs 2016$ 11,790,492 7,581,743 10,018,453 29,390,688 Total Resource Costs 2016$ 3,395,061 6,261,085 4,479,708 14,135,855
Benefit Cost Ratio B/C 0.91 1.46 0.93 1.06 Benefit Cost Ratio B/C 2.26 1.68 1.59 1.79
Metric Units 2016 Evaluated 2017 Evaluated 2018 Planned 2016-2018 Total Metric Units 2016 Evaluated 2017 Evaluated 2018 Planned 2016-2018 Total
Annual Energy MWh 57,953 51,735 40,796 150,483 Annual Energy MWh 200,287 253,732 163,505 617,525
Lifetime Energy MWh 529,438 385,997 377,992 1,293,427 Lifetime Energy MWh 1,277,866 1,767,706 1,679,531 4,725,103
Annual Natural Gas Therms 17,309 10,058 - 27,367 Annual Natural Gas Therms (2,720,853) (2,682,410) (1,834,530) (7,237,793)
Lifetime Natural Gas Therms 301,536 178,243 - 479,778 Lifetime Natural Gas Therms (17,276,427) (18,661,076) (18,844,342) (54,781,845)
Total Benefits 2016$ 177,962,961 140,019,120 186,765,045 504,747,126 Total Benefits 2016$ 119,408,086 169,750,136 157,149,152 446,307,374
Total Program Costs nominal$ 41,173,069 38,286,883 56,992,030 136,451,983 Total Program Costs nominal$ 21,864,732 31,487,078 30,661,169 84,012,979
Total Resource Costs 2016$ 52,671,635 49,326,310 78,300,265 180,298,211 Total Resource Costs 2016$ 50,794,241 64,703,230 41,920,255 157,417,726
Benefit Cost Ratio B/C 3.38 2.84 2.39 2.80 Benefit Cost Ratio B/C 2.35 2.62 3.75 2.84
Metric Units 2016 Evaluated 2017 Evaluated 2018 Planned 2016-2018 Total
Annual Energy MWh 88,056 79,591 83,934 251,582
Lifetime Energy MWh 88,056 79,591 83,934 251,582
Annual Natural Gas Therms - - - -
Lifetime Natural Gas Therms - - - -
Total Benefits 2016$ 13,662,403 11,511,531 9,497,224 34,671,157
Total Program Costs nominal$ 6,116,760 6,025,634 6,156,392 18,298,786
Total Resource Costs 2016$ 6,358,906 6,057,510 6,113,305 18,529,721
Benefit Cost Ratio B/C 2.15 1.90 1.55 1.87
A2c - Residential Lighting
A1b - Residential Multi-Family Retrofit
A1c - Residential Home Energy Services - Measures
A1e - Residential Behavior/Feedback Program
A1 - Residential Whole, 2016-2018 SummaryA1a - Residential New Construction
A2 - Residential Products, 2016-2018 SummaryA2a - Residential Heating & Cooling Equipment
A2b - Residential Consumer Products
Massachusetts Electric Company and Nantucket Electric Company d/b/a National Grid
D.P.U. 18-512017 Energy Efficiency Plan-Year Report
Master Data Tables33 of 37
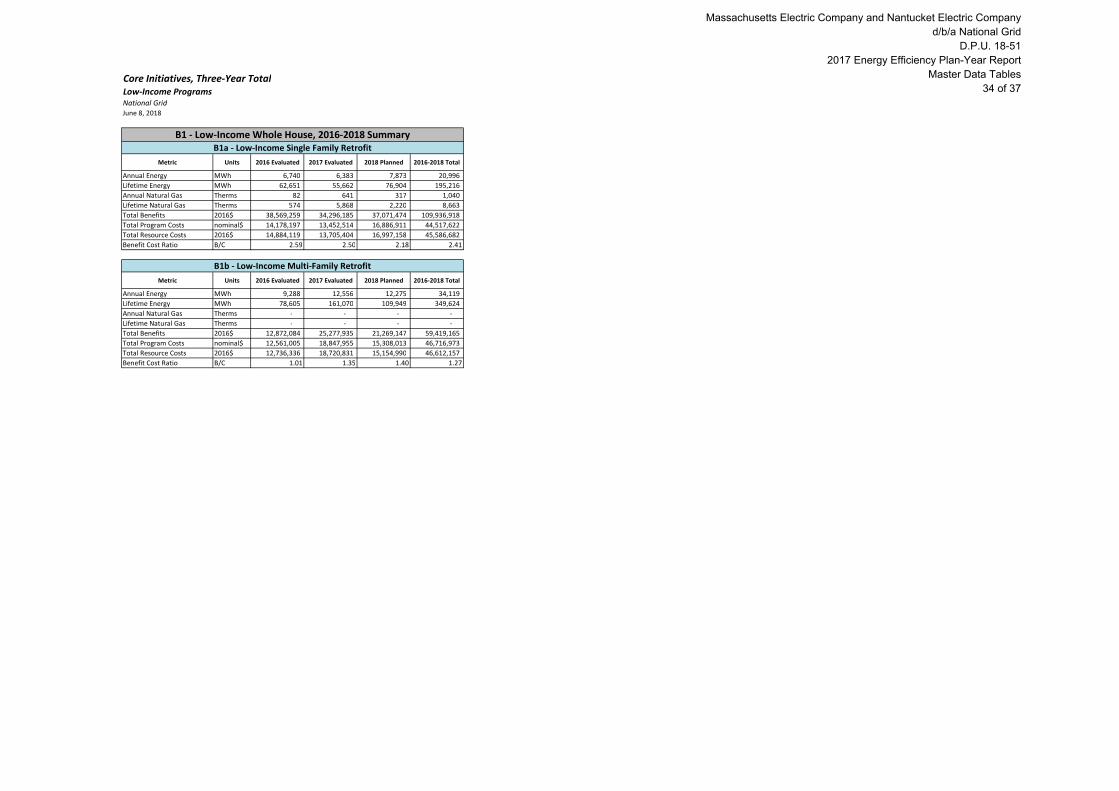
Core Initiatives, Three-Year TotalLow-Income ProgramsNational GridJune 8, 2018
Metric Units 2016 Evaluated 2017 Evaluated 2018 Planned 2016-2018 Total
Annual Energy MWh 6,740 6,383 7,873 20,996
Lifetime Energy MWh 62,651 55,662 76,904 195,216
Annual Natural Gas Therms 82 641 317 1,040
Lifetime Natural Gas Therms 574 5,868 2,220 8,663
Total Benefits 2016$ 38,569,259 34,296,185 37,071,474 109,936,918
Total Program Costs nominal$ 14,178,197 13,452,514 16,886,911 44,517,622
Total Resource Costs 2016$ 14,884,119 13,705,404 16,997,158 45,586,682
Benefit Cost Ratio B/C 2.59 2.50 2.18 2.41
Metric Units 2016 Evaluated 2017 Evaluated 2018 Planned 2016-2018 Total
Annual Energy MWh 9,288 12,556 12,275 34,119
Lifetime Energy MWh 78,605 161,070 109,949 349,624
Annual Natural Gas Therms - - - -
Lifetime Natural Gas Therms - - - -
Total Benefits 2016$ 12,872,084 25,277,935 21,269,147 59,419,165
Total Program Costs nominal$ 12,561,005 18,847,955 15,308,013 46,716,973
Total Resource Costs 2016$ 12,736,336 18,720,831 15,154,990 46,612,157
Benefit Cost Ratio B/C 1.01 1.35 1.40 1.27
B1 - Low-Income Whole House, 2016-2018 SummaryB1a - Low-Income Single Family Retrofit
B1b - Low-Income Multi-Family Retrofit
Massachusetts Electric Company and Nantucket Electric Company d/b/a National Grid
D.P.U. 18-512017 Energy Efficiency Plan-Year Report
Master Data Tables34 of 37
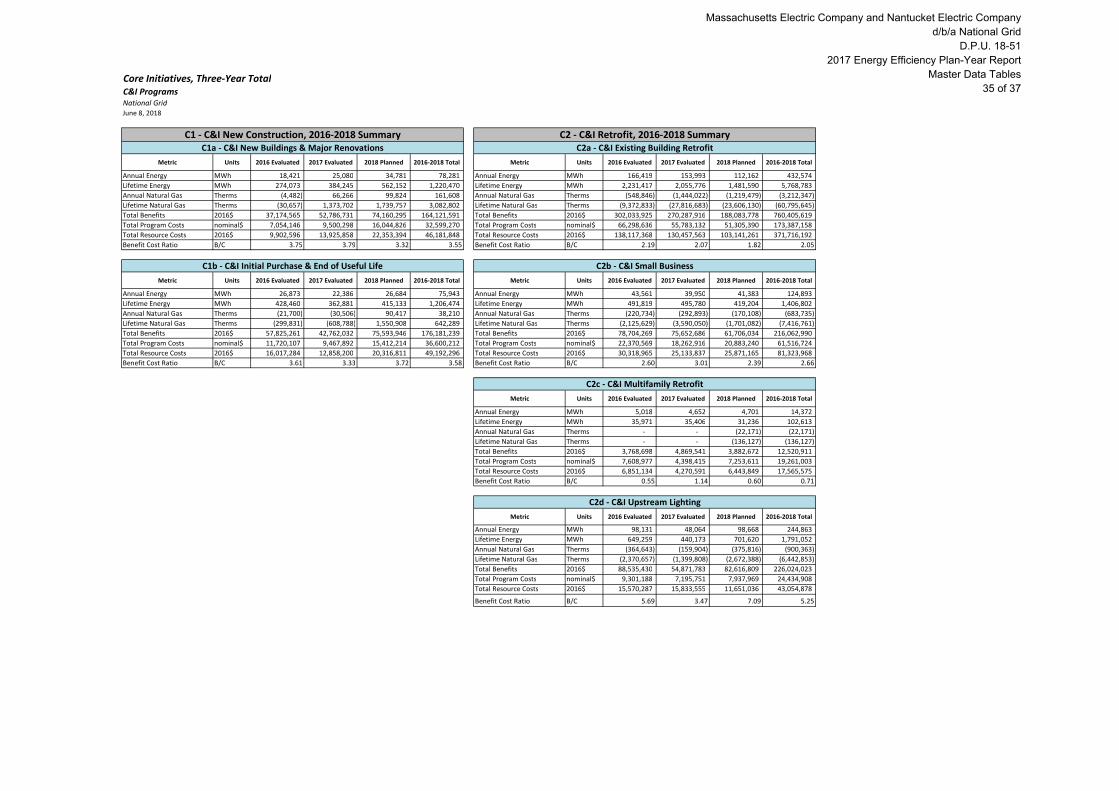
Core Initiatives, Three-Year TotalC&I ProgramsNational GridJune 8, 2018
Metric Units 2016 Evaluated 2017 Evaluated 2018 Planned 2016-2018 Total Metric Units 2016 Evaluated 2017 Evaluated 2018 Planned 2016-2018 Total
Annual Energy MWh 18,421 25,080 34,781 78,281 Annual Energy MWh 166,419 153,993 112,162 432,574
Lifetime Energy MWh 274,073 384,245 562,152 1,220,470 Lifetime Energy MWh 2,231,417 2,055,776 1,481,590 5,768,783
Annual Natural Gas Therms (4,482) 66,266 99,824 161,608 Annual Natural Gas Therms (548,846) (1,444,022) (1,219,479) (3,212,347)
Lifetime Natural Gas Therms (30,657) 1,373,702 1,739,757 3,082,802 Lifetime Natural Gas Therms (9,372,833) (27,816,683) (23,606,130) (60,795,645)
Total Benefits 2016$ 37,174,565 52,786,731 74,160,295 164,121,591 Total Benefits 2016$ 302,033,925 270,287,916 188,083,778 760,405,619
Total Program Costs nominal$ 7,054,146 9,500,298 16,044,826 32,599,270 Total Program Costs nominal$ 66,298,636 55,783,132 51,305,390 173,387,158
Total Resource Costs 2016$ 9,902,596 13,925,858 22,353,394 46,181,848 Total Resource Costs 2016$ 138,117,368 130,457,563 103,141,261 371,716,192
Benefit Cost Ratio B/C 3.75 3.79 3.32 3.55 Benefit Cost Ratio B/C 2.19 2.07 1.82 2.05
Metric Units 2016 Evaluated 2017 Evaluated 2018 Planned 2016-2018 Total Metric Units 2016 Evaluated 2017 Evaluated 2018 Planned 2016-2018 Total
Annual Energy MWh 26,873 22,386 26,684 75,943 Annual Energy MWh 43,561 39,950 41,383 124,893
Lifetime Energy MWh 428,460 362,881 415,133 1,206,474 Lifetime Energy MWh 491,819 495,780 419,204 1,406,802
Annual Natural Gas Therms (21,700) (30,506) 90,417 38,210 Annual Natural Gas Therms (220,734) (292,893) (170,108) (683,735)
Lifetime Natural Gas Therms (299,831) (608,788) 1,550,908 642,289 Lifetime Natural Gas Therms (2,125,629) (3,590,050) (1,701,082) (7,416,761)
Total Benefits 2016$ 57,825,261 42,762,032 75,593,946 176,181,239 Total Benefits 2016$ 78,704,269 75,652,686 61,706,034 216,062,990
Total Program Costs nominal$ 11,720,107 9,467,892 15,412,214 36,600,212 Total Program Costs nominal$ 22,370,569 18,262,916 20,883,240 61,516,724
Total Resource Costs 2016$ 16,017,284 12,858,200 20,316,811 49,192,296 Total Resource Costs 2016$ 30,318,965 25,133,837 25,871,165 81,323,968
Benefit Cost Ratio B/C 3.61 3.33 3.72 3.58 Benefit Cost Ratio B/C 2.60 3.01 2.39 2.66
Metric Units 2016 Evaluated 2017 Evaluated 2018 Planned 2016-2018 Total
Annual Energy MWh 5,018 4,652 4,701 14,372
Lifetime Energy MWh 35,971 35,406 31,236 102,613
Annual Natural Gas Therms - - (22,171) (22,171)
Lifetime Natural Gas Therms - - (136,127) (136,127)
Total Benefits 2016$ 3,768,698 4,869,541 3,882,672 12,520,911
Total Program Costs nominal$ 7,608,977 4,398,415 7,253,611 19,261,003
Total Resource Costs 2016$ 6,851,134 4,270,591 6,443,849 17,565,575
Benefit Cost Ratio B/C 0.55 1.14 0.60 0.71
Metric Units 2016 Evaluated 2017 Evaluated 2018 Planned 2016-2018 Total
Annual Energy MWh 98,131 48,064 98,668 244,863
Lifetime Energy MWh 649,259 440,173 701,620 1,791,052
Annual Natural Gas Therms (364,643) (159,904) (375,816) (900,363)
Lifetime Natural Gas Therms (2,370,657) (1,399,808) (2,672,388) (6,442,853)
Total Benefits 2016$ 88,535,430 54,871,783 82,616,809 226,024,023
Total Program Costs nominal$ 9,301,188 7,195,751 7,937,969 24,434,908
Total Resource Costs 2016$ 15,570,287 15,833,555 11,651,036 43,054,878
Benefit Cost Ratio B/C 5.69 3.47 7.09 5.25
C2c - C&I Multifamily Retrofit
C2d - C&I Upstream Lighting
C1 - C&I New Construction, 2016-2018 SummaryC1a - C&I New Buildings & Major Renovations
C1b - C&I Initial Purchase & End of Useful Life
C2 - C&I Retrofit, 2016-2018 SummaryC2a - C&I Existing Building Retrofit
C2b - C&I Small Business
Massachusetts Electric Company and Nantucket Electric Company d/b/a National Grid
D.P.U. 18-512017 Energy Efficiency Plan-Year Report
Master Data Tables35 of 37
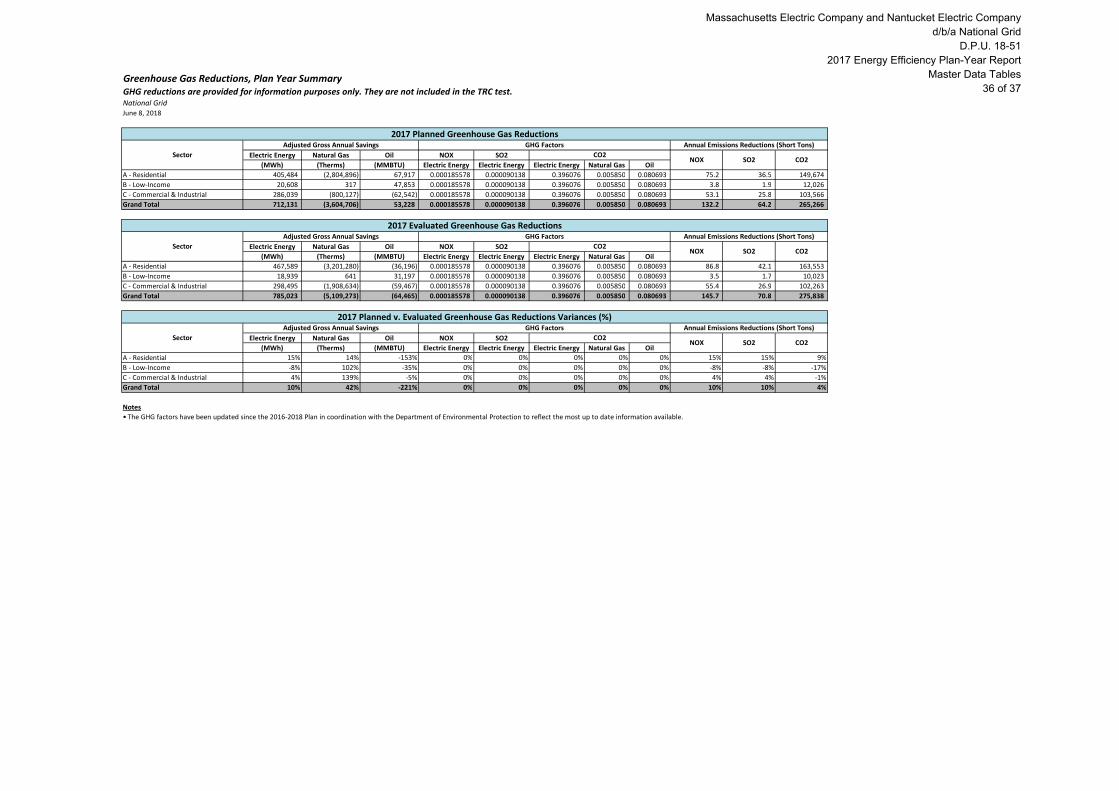
Greenhouse Gas Reductions, Plan Year SummaryGHG reductions are provided for information purposes only. They are not included in the TRC test.National GridJune 8, 2018
Electric Energy Natural Gas Oil NOX SO2
(MWh) (Therms) (MMBTU) Electric Energy Electric Energy Electric Energy Natural Gas Oil
A - Residential 405,484 (2,804,896) 67,917 0.000185578 0.000090138 0.396076 0.005850 0.080693 75.2 36.5 149,674
B - Low-Income 20,608 317 47,853 0.000185578 0.000090138 0.396076 0.005850 0.080693 3.8 1.9 12,026
C - Commercial & Industrial 286,039 (800,127) (62,542) 0.000185578 0.000090138 0.396076 0.005850 0.080693 53.1 25.8 103,566
Grand Total 712,131 (3,604,706) 53,228 0.000185578 0.000090138 0.396076 0.005850 0.080693 132.2 64.2 265,266
Electric Energy Natural Gas Oil NOX SO2
(MWh) (Therms) (MMBTU) Electric Energy Electric Energy Electric Energy Natural Gas Oil
A - Residential 467,589 (3,201,280) (36,196) 0.000185578 0.000090138 0.396076 0.005850 0.080693 86.8 42.1 163,553
B - Low-Income 18,939 641 31,197 0.000185578 0.000090138 0.396076 0.005850 0.080693 3.5 1.7 10,023
C - Commercial & Industrial 298,495 (1,908,634) (59,467) 0.000185578 0.000090138 0.396076 0.005850 0.080693 55.4 26.9 102,263
Grand Total 785,023 (5,109,273) (64,465) 0.000185578 0.000090138 0.396076 0.005850 0.080693 145.7 70.8 275,838
Electric Energy Natural Gas Oil NOX SO2
(MWh) (Therms) (MMBTU) Electric Energy Electric Energy Electric Energy Natural Gas Oil
A - Residential 15% 14% -153% 0% 0% 0% 0% 0% 15% 15% 9%
B - Low-Income -8% 102% -35% 0% 0% 0% 0% 0% -8% -8% -17%
C - Commercial & Industrial 4% 139% -5% 0% 0% 0% 0% 0% 4% 4% -1%
Grand Total 10% 42% -221% 0% 0% 0% 0% 0% 10% 10% 4%
Notes
• The GHG factors have been updated since the 2016-2018 Plan in coordination with the Department of Environmental Protection to reflect the most up to date information available.
2017 Planned Greenhouse Gas Reductions
Sector
Adjusted Gross Annual Savings GHG Factors Annual Emissions Reductions (Short Tons)
CO2NOX SO2 CO2
2017 Evaluated Greenhouse Gas Reductions
Sector
Adjusted Gross Annual Savings GHG Factors Annual Emissions Reductions (Short Tons)
CO2NOX SO2 CO2
2017 Planned v. Evaluated Greenhouse Gas Reductions Variances (%)
Sector
Adjusted Gross Annual Savings GHG Factors Annual Emissions Reductions (Short Tons)
CO2NOX SO2 CO2
Massachusetts Electric Company and Nantucket Electric Company d/b/a National Grid
D.P.U. 18-512017 Energy Efficiency Plan-Year Report
Master Data Tables36 of 37
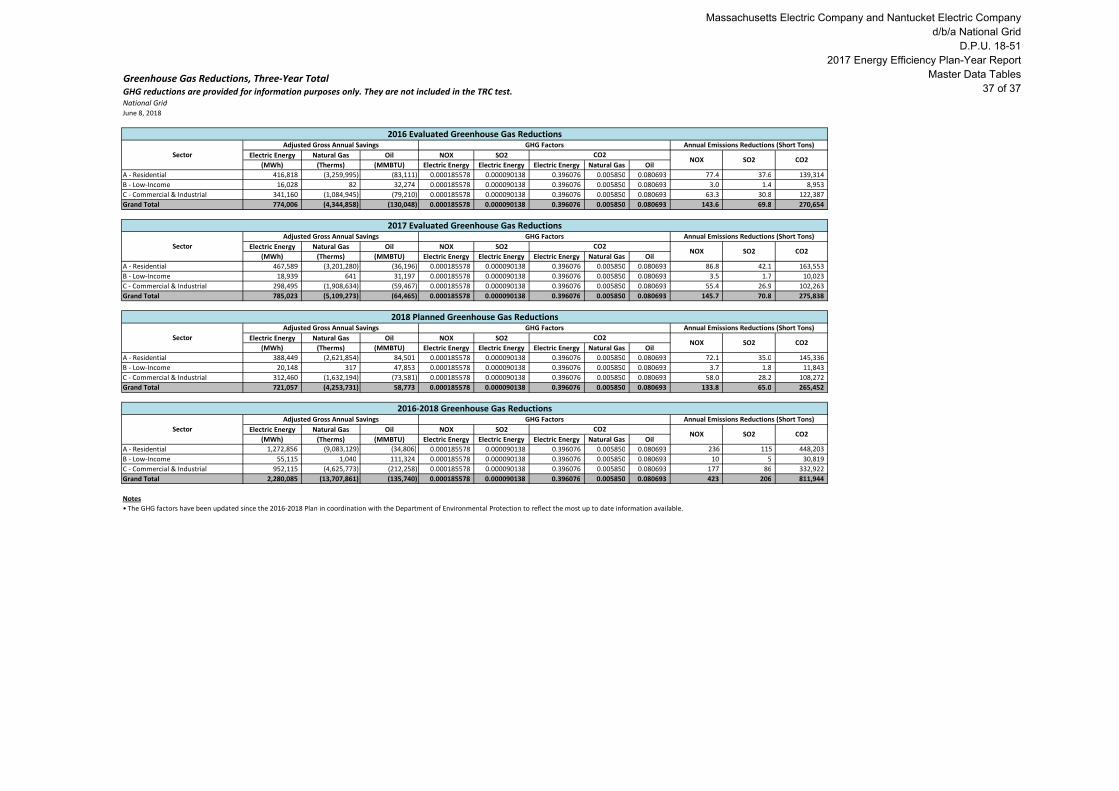
Greenhouse Gas Reductions, Three-Year TotalGHG reductions are provided for information purposes only. They are not included in the TRC test.National GridJune 8, 2018
Electric Energy Natural Gas Oil NOX SO2
(MWh) (Therms) (MMBTU) Electric Energy Electric Energy Electric Energy Natural Gas Oil
A - Residential 416,818 (3,259,995) (83,111) 0.000185578 0.000090138 0.396076 0.005850 0.080693 77.4 37.6 139,314
B - Low-Income 16,028 82 32,274 0.000185578 0.000090138 0.396076 0.005850 0.080693 3.0 1.4 8,953
C - Commercial & Industrial 341,160 (1,084,945) (79,210) 0.000185578 0.000090138 0.396076 0.005850 0.080693 63.3 30.8 122,387
Grand Total 774,006 (4,344,858) (130,048) 0.000185578 0.000090138 0.396076 0.005850 0.080693 143.6 69.8 270,654
Electric Energy Natural Gas Oil NOX SO2
(MWh) (Therms) (MMBTU) Electric Energy Electric Energy Electric Energy Natural Gas Oil
A - Residential 467,589 (3,201,280) (36,196) 0.000185578 0.000090138 0.396076 0.005850 0.080693 86.8 42.1 163,553
B - Low-Income 18,939 641 31,197 0.000185578 0.000090138 0.396076 0.005850 0.080693 3.5 1.7 10,023
C - Commercial & Industrial 298,495 (1,908,634) (59,467) 0.000185578 0.000090138 0.396076 0.005850 0.080693 55.4 26.9 102,263
Grand Total 785,023 (5,109,273) (64,465) 0.000185578 0.000090138 0.396076 0.005850 0.080693 145.7 70.8 275,838
Electric Energy Natural Gas Oil NOX SO2
(MWh) (Therms) (MMBTU) Electric Energy Electric Energy Electric Energy Natural Gas Oil
A - Residential 388,449 (2,621,854) 84,501 0.000185578 0.000090138 0.396076 0.005850 0.080693 72.1 35.0 145,336
B - Low-Income 20,148 317 47,853 0.000185578 0.000090138 0.396076 0.005850 0.080693 3.7 1.8 11,843
C - Commercial & Industrial 312,460 (1,632,194) (73,581) 0.000185578 0.000090138 0.396076 0.005850 0.080693 58.0 28.2 108,272
Grand Total 721,057 (4,253,731) 58,773 0.000185578 0.000090138 0.396076 0.005850 0.080693 133.8 65.0 265,452
Electric Energy Natural Gas Oil NOX SO2
(MWh) (Therms) (MMBTU) Electric Energy Electric Energy Electric Energy Natural Gas Oil
A - Residential 1,272,856 (9,083,129) (34,806) 0.000185578 0.000090138 0.396076 0.005850 0.080693 236 115 448,203
B - Low-Income 55,115 1,040 111,324 0.000185578 0.000090138 0.396076 0.005850 0.080693 10 5 30,819
C - Commercial & Industrial 952,115 (4,625,773) (212,258) 0.000185578 0.000090138 0.396076 0.005850 0.080693 177 86 332,922
Grand Total 2,280,085 (13,707,861) (135,740) 0.000185578 0.000090138 0.396076 0.005850 0.080693 423 206 811,944
Notes
• The GHG factors have been updated since the 2016-2018 Plan in coordination with the Department of Environmental Protection to reflect the most up to date information available.
2016 Evaluated Greenhouse Gas Reductions
Sector
Adjusted Gross Annual Savings GHG Factors Annual Emissions Reductions (Short Tons)
CO2NOX SO2 CO2
2017 Evaluated Greenhouse Gas Reductions
Sector
Adjusted Gross Annual Savings GHG Factors Annual Emissions Reductions (Short Tons)
CO2NOX SO2 CO2
2016-2018 Greenhouse Gas Reductions
Sector
Adjusted Gross Annual Savings GHG Factors Annual Emissions Reductions (Short Tons)
CO2NOX SO2 CO2
2018 Planned Greenhouse Gas Reductions
Sector
Adjusted Gross Annual Savings GHG Factors Annual Emissions Reductions (Short Tons)
CO2NOX SO2 CO2
Massachusetts Electric Company and Nantucket Electric Company d/b/a National Grid
D.P.U. 18-512017 Energy Efficiency Plan-Year Report
Master Data Tables37 of 37
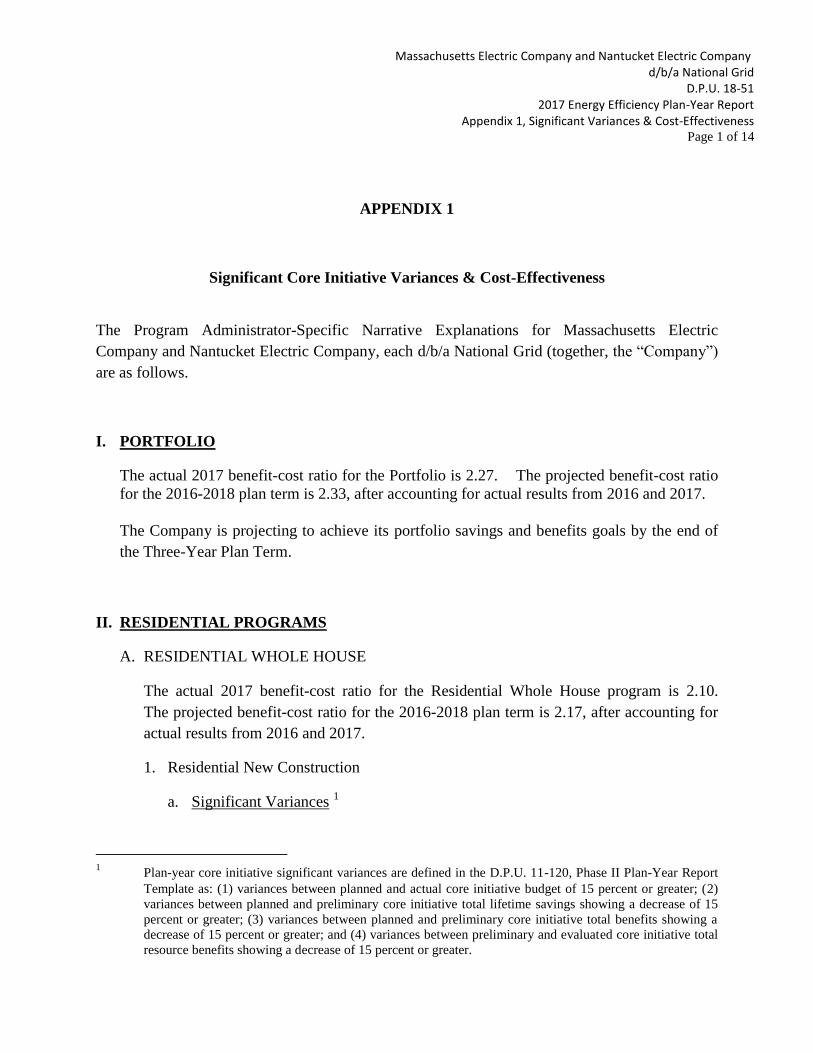
Massachusetts Electric Company and Nantucket Electric Company d/b/a National Grid
D.P.U. 18-51 2017 Energy Efficiency Plan-Year Report
Appendix 1, Significant Variances & Cost-Effectiveness Page 1 of 14
APPENDIX 1
Significant Core Initiative Variances & Cost-Effectiveness
The Program Administrator-Specific Narrative Explanations for Massachusetts Electric
Company and Nantucket Electric Company, each d/b/a National Grid (together, the “Company”)
are as follows.
I. PORTFOLIO
The actual 2017 benefit-cost ratio for the Portfolio is 2.27. The projected benefit-cost ratio
for the 2016-2018 plan term is 2.33, after accounting for actual results from 2016 and 2017.
The Company is projecting to achieve its portfolio savings and benefits goals by the end of
the Three-Year Plan Term.
II. RESIDENTIAL PROGRAMS
A. RESIDENTIAL WHOLE HOUSE
The actual 2017 benefit-cost ratio for the Residential Whole House program is 2.10.
The projected benefit-cost ratio for the 2016-2018 plan term is 2.17, after accounting for
actual results from 2016 and 2017.
Residential New Construction 1.
a. Significant Variances 1
1 Plan-year core initiative significant variances are defined in the D.P.U. 11-120, Phase II Plan-Year Report
Template as: (1) variances between planned and actual core initiative budget of 15 percent or greater; (2)
variances between planned and preliminary core initiative total lifetime savings showing a decrease of 15
percent or greater; (3) variances between planned and preliminary core initiative total benefits showing a
decrease of 15 percent or greater; and (4) variances between preliminary and evaluated core initiative total
resource benefits showing a decrease of 15 percent or greater.
Massachusetts Electric Company and Nantucket Electric Company d/b/a National Grid
D.P.U. 18-51 2017 Energy Efficiency Plan-Year Report
Appendix 1, Significant Variances & Cost-Effectiveness Page 2 of 14
Significant variance for the 2016 and 2017 plan-years exists between: (1) planned and
actual budget and (2) preliminary and evaluated total resource benefits.
Actual expenditures for Residential New Construction & Major Renovation core
initiative were 59.9 percent higher than the planned budget. The primary reason was
that actual expenditures in the participant incentive cost category were 72 percent
higher than planned due to customer participation being 85 percent higher than
planned. A larger percent gain in savings has accompanied the higher spending with
the two-year lifetime electric savings coming in at 222 percent of goal.
Evaluated total resource benefits were lower than preliminary total resource benefits
due to a reduction in attributable energy savings as a result of the 2015-2016
Massachusetts Single-Family Code Compliance Baseline Study. This study updated
the User Defined Reference Home (“UDRH”) to reflect current common installation
practices for non-participating homes, and found significant increases in energy
efficiency for several measures in non-participating homes. Some of these measures
included duct leakage, air leakage and ceiling insulation. These updates significantly
decreased the total claimable benefits for the non-lighting low-rise portion of the
residential new construction initiative.
In addition, a decrease in measure lives for lighting measures (Appendix 4C, Study
17-6 Lighting Market Adoption Model Findings and the Technical Reference
Library) created lifetime MWh savings losses, which directly affect total resource
benefits.
In response to the above variance, the Company does not plan to make any significant
changes to the core initiative design at this time The Company will monitor this core
initiative’s activity for the remainder of the plan term.
The Company is projecting to achieve its savings and benefits goals by the end of the
Three-Year Plan term for this core initiative.
b. Program Cost-Effectiveness
The actual 2017 benefit-cost ratio for the Residential New Construction core initiative
is 1.20. The projected benefit-cost ratio for the 2016-2018 plan term is 1.37, after
accounting for actual results from 2016 and 2017.
Residential Multi-Family 2.
a. Significant Variances
Massachusetts Electric Company and Nantucket Electric Company d/b/a National Grid
D.P.U. 18-51 2017 Energy Efficiency Plan-Year Report
Appendix 1, Significant Variances & Cost-Effectiveness Page 3 of 14
There are no significant variances to report for this core initiative.
The Company is projecting to achieve its savings and benefits goals by the end of the
Three-Year Plan term for this core initiative.
b. Program Cost-Effectiveness
The actual 2017 benefit-cost ratio for the Residential Multi-Family core initiative is
1.46. The projected benefit-cost ratio for the 2016-2018 plan term is 1.06, after
accounting for actual results from 2016 and 2017.
Residential Home Energy Services - Measures 3.
a. Significant Variances
A significant variance for the combined 2016 and 2017 plan-years exists between
planned budget and actual expenditures.
Actual expenditures for the Home Energy Services – Measures core initiative were
25.1 percent lower than planned. There are several reasons for these variances, many
of which carry over from 2016 into 2017. First, this core initiative budget includes
anticipated costs to meet new code requirements for installing attic insulation. This
code requirement added significantly to the Home Energy Services – Measures core
initiative budget. After filing the final Three-Year Plan was filed, the Board of
Building Regulations and Standards ruled that this core initiative was exempt from
these new requirements, which meant the budgeted money was not spent. The second
reason contributing to the underspending is that the Company planned on installing
more Wi-Fi thermostats in the direct install delivery channel than in the mail-in rebate
delivery channel while actual participation showed a greater than expected amount of
mail-in delivery participation. The mail-in rebate delivery channel costs less, and
therefore, the Company spent less than planned on this measure. Third, the Company
faced challenges in achieving the planned level of duct weatherization, a new
measure in the initiative. Finally, the lower than planned participation contributed to
the underspending in this core initiative. The lower participation rates are due to
relatively mild winters in 2016 and 2017 in addition to the sudden closure of the core
initiative’s largest Home Performance Contractor (“HPC”), as reported in the 2016
Massachusetts Electric Company and Nantucket Electric Company d/b/a National Grid
D.P.U. 18-51 2017 Energy Efficiency Plan-Year Report
Appendix 1, Significant Variances & Cost-Effectiveness Page 4 of 14
plan year report. This HPC drove close to 25 percent of the participants through its
proprietary marketing and outreach prior to closing.
In response to the above variances, the Company made the following change in the
program design/implementation:
The Company has increased marketing efforts and restructured contractor incentives
to fill the void left by the closure of the largest HPC. Since the closure of the HPC
noted above, growth in participants served by HPCs has been significant, helping to
increase participation. Further, colder weather during the 2017/2018 winter season
helped drive increase demand. The Company has also increased trainings and made
adjustments to the specification and installation process for duct weatherization. The
Company is projecting to achieve its savings and benefits goals by the end of the
Three-Year Plan term for this core initiative.
The Company will monitor this core initiative’s activity for the remainder of the plan
term.
b. Program Cost-Effectiveness
The actual 2017 benefit-cost ratio for the Residential Home Energy Services core
initiative is 2.84. The projected benefit-cost ratio for the 2016-2018 plan term is 2.80,
after accounting for actual results from 2016 and 2017.
Residential Behavior/Feedback 4.
a. Significant Variances
There are no significant variances to report for this core initiative.
The Company is projecting to achieve its savings and benefits goals by the end of the
Three-Year Plan term for this core initiative.
b. Program Cost-Effectiveness
The actual 2017 benefit-cost ratio for the Residential Behavior/Feedback core
initiative is 1.90. The projected benefit-cost ratio for the 2016-2018 plan term is 1.87,
after accounting for actual results from 2016 and 2017.
Massachusetts Electric Company and Nantucket Electric Company d/b/a National Grid
D.P.U. 18-51 2017 Energy Efficiency Plan-Year Report
Appendix 1, Significant Variances & Cost-Effectiveness Page 5 of 14
B. RESIDENTIAL PRODUCTS
The actual 2017 benefit-cost ratio for the Residential Products Program is 2.43. The
projected benefit-cost ratio for the 2016-2018 plan term is 2.54, after accounting for
actual results from 2016 and 2017.
Residential Heating & Cooling Equipment 1.
a. Significant Variances
There are no significant variances to report for this core initiative.
The Company is projecting to achieve its savings and benefits goals by the end of the
Three-Year Plan term for this core initiative.
b. Program Cost-Effectiveness
The actual 2017 benefit-cost ratio for the Residential Heating & Cooling core
initiative is 1.35. The projected benefit-cost ratio for the 2016-2018 plan term is 1.09,
after accounting for actual results from 2016 and 2017.
Last year the core initiative was not cost effective. The Company increased
engagement with the contractor community to increase production and encourage
participation in service measures. Changes were made mid-2016 to the core initiative
to decrease STAT costs, including developing an online portion of AC Check training
designed to reduce the cost of in-person training and streamlining the AC Check
reporting process. Results of these changes were evident in 2017. STAT costs will
continue to be monitored. Evaluation spending in 2016 was high due to large-scale
study, The Ductless Mini-Split Heat Pump Impact Evaluation included in the 2016
Plan Year Report as Attachment 4D, Study 16-15. There were no large-scale
evaluations of this core initiative in 2017.
Residential Consumer Products 2.
a. Significant Variances
There are no significant variances to report for this core initiative.

Massachusetts Electric Company and Nantucket Electric Company d/b/a National Grid
D.P.U. 18-51 2017 Energy Efficiency Plan-Year Report
Appendix 1, Significant Variances & Cost-Effectiveness Page 6 of 14
The Company is projecting to achieve its savings and benefits goals by the end of the
Three-Year Plan term for this core initiative.
b. Program Cost-Effectiveness
The actual 2017 benefit-cost ratio for the Residential Consumer Products core
initiative is 1.68. The projected benefit-cost ratio for the 2016-2018 plan term is 1.79,
after accounting for actual results from 2016 and 2017.
Residential Lighting 3.
a. Significant Variances
A significant variance for the combined 2016 and 2017 plan-years exists between the
preliminary and evaluated total resource benefits.
Evaluated total resource benefits are 30.2 percent lower than preliminary total
resource benefits due to evaluation results. The method that the PAs use to calculate
an adjusted measure life (see Appendix 4C, Study 17-6 Lighting Market Adoption
Model Findings and the Technical Reference Library) for residential lighting
measures takes into account both regulatory and market conditions, both of which
changed substantially from the time the final Plan was filed. Evaluated measure lives
are much shorter than planned, and create a corresponding decrease in benefits.
In response to the above variances, the Company made the following change in the
program design/implementation:
PAs increased efforts in this initiative and the Company is currently well over its
annual and lifetime savings goals.
The Company is projecting to achieve its savings and benefits goals by the end of the
Three-Year Plan term for this core initiative.
b. Program Cost-Effectiveness
Massachusetts Electric Company and Nantucket Electric Company d/b/a National Grid
D.P.U. 18-51 2017 Energy Efficiency Plan-Year Report
Appendix 1, Significant Variances & Cost-Effectiveness Page 7 of 14
The actual 2017 benefit-cost ratio for the Residential Lighting core initiative is 2.62.
The projected benefit-cost ratio for the 2016-2018 plan term is 2.84 after accounting
for actual results from 2016 and 2017.
III. LOW-INCOME PROGRAMS
A. LOW-INCOME WHOLE HOUSE
The actual 2017 benefit-cost ratio for the Low-Income Whole House program is 1.84.
The projected benefit-cost ratio for the 2016-2018 plan term is 1.84, after accounting for
actual results from 2016 and 2017.
Low-Income Single Family Retrofit 1.
a. Significant Variances
A significant variance exists for the 2016 and 2017 plan-years between (1) planned
and actual budget and (2) planned and preliminary total benefits.
Actual expenditures for Low Income Single-Family Retrofit were 17 percent lower
than planned budget. The primary reason is that actual expenditures in the participant
incentive cost category were lower than planned due to customer participation being
42 percent lower than planned. Preliminary total benefits were 19 percent lower than
planned. Lower than planned participation contributed to the variance between
planned and preliminary total benefits. As a result of lower than planned
participation, the Company completed fewer than expected insulation jobs and
heating system (boiler) replacements in oil heated homes, which contributed
significantly to the variance in benefits.
In response to the above variances, the Company made the following changes in
program design/implementation:
The Company is working with its lead vendor and marketing department on single
family customer outreach to increase program participation, including outreach to oil
heated homes.
The Company will monitor this core initiative’s activity for the remainder of the plan
term.
Massachusetts Electric Company and Nantucket Electric Company d/b/a National Grid
D.P.U. 18-51 2017 Energy Efficiency Plan-Year Report
Appendix 1, Significant Variances & Cost-Effectiveness Page 8 of 14
The Company is not expecting to meet its savings and benefits goals by the end of the
Three-Year Plan term for this core initiative. The Company expects its savings and
benefits goals will both be approximately 10 percent lower than goal. There has been
a strong response to the Company’s customer outreach in the Low Income Multi-
Family Retrofit core initiative. The Company expects its Low Income Single Family
and Multi-Family retrofit core initiatives combined will meet the savings and benefits
goals for the Low Income Sector by the end of the Three-Year Plan term.
Overall, the portfolio is cost effective and despite any variances in the core initiatives,
The Company expects to meet three-year portfolio savings and benefits goals.
b. Program Cost-Effectiveness
The actual 2017 benefit-cost ratio for the Low-Income Single Family core initiative is
2.50. The projected benefit-cost ratio for the 2016-2018 plan term is 2.41, after
accounting for actual results from 2016 and 2017.
Low-Income Multi-Family Retrofit 2.
a. Significant Variances
A significant variance exists for the 2016 and 2017 plan-years between the planned
and preliminary total benefits.
Preliminary total benefits were 16 percent lower than planned because of differences
in the actual measure mix installed. In particular, the Company did not complete any
projects in oil heated properties, which resulted in a significant impact in total
benefits.
In response to the above variances, the Company made the following change in the
program design/implementation:
The Company is working with its lead vendor to increase outreach to oil heated
properties.
The Company is projecting to achieve its savings and benefits goals by the end of the
Three-Year Plan term for this core initiative.
Massachusetts Electric Company and Nantucket Electric Company d/b/a National Grid
D.P.U. 18-51 2017 Energy Efficiency Plan-Year Report
Appendix 1, Significant Variances & Cost-Effectiveness Page 9 of 14
b. Program Cost-Effectiveness
The actual 2017 benefit-cost ratio for the Low-Income Multi-Family core initiative is
1.35. The projected benefit-cost ratio for the 2016-2018 plan term is 1.27, after
accounting for actual results from 2016 and 2017.
IV. COMMERCIAL & INDUSTRIAL PROGRAMS
A. C&I NEW CONSTRUCTION
The actual 2017 benefit-cost ratio for the C&I New Construction program is 3.57. The
projected benefit-cost ratio for the 2016-2018 plan term is 3.57, after accounting for
actual results from 2016 and 2017.
C&I New Buildings and Major Renovations 1.
a. Significant Variances
A significant variance for the combined 2016 and 2017 plan-years exists between the
(1) planned and actual budget, (2) planned and preliminary lifetime savings, and (3)
planned and preliminary total benefits.
Actual spending was 39 percent below planned, preliminary lifetime savings were 30
percent below planned, and preliminary total benefits were 22 percent below planned.
These variances are due to a number of factors, including some modest strengthening
of the new construction market in the Company’s electric service area, and an increase
in customers looking to install new equipment and replace failed equipment in their
facilities.
The 2016-2018 term is the first time new construction activity has been its own core
initiative. The Company is learning the market’s needs and where to set the expected
volume of whole building approach projects. The number of projects in the
Company’s electric service area is less than planned and, as a result, the New
Buildings & Major Renovation core initiative did not grow as anticipated causing
lifetime savings to fall short of expectations. Whole building approach projects are
typically the second largest component, after lighting, of New Buildings and Major
Renovation core initiative market activity. In 2016 there was low project volume.
Massachusetts Electric Company and Nantucket Electric Company d/b/a National Grid
D.P.U. 18-51 2017 Energy Efficiency Plan-Year Report
Appendix 1, Significant Variances & Cost-Effectiveness Page 10 of 14
2017 participation improved but was enough to eliminate lifetime savings and total
benefits variances across the two years. Overall, combined 2016 and 2017 plan-year
variances resulted in 30 percent lower lifetime savings and 22 percent lower total
benefits than planned.
For the new construction and major renovation projects in 2017, baseline changes
decreased claimable savings after January 1, 2017 due to the enactment of
International Energy Conservation Code 2015.
Spending in the New Buildings and Major Renovations core initiative was 39 percent
below planned levels. Most spending is directly correlated with the number of projects
closed. Incentives make up the vast majority of program spending, and at the end of
2016-2017, only 48 percent of planned incentive budget was spent.
In response to the above variances, the Company made the following changes in
program design/implementation:
The Company has made improvements to streamline offerings and communications to
market actors have been and continue to promote and coordinate the whole building
approach to new construction solutions on a statewide basis. These changes should
positively impact participation, specifically in the whole building approach for large
complex buildings, in the New Buildings and Major Renovations core initiative.
Improved targeting and communication of information based on advanced analytics,
cross-program selling, increased outreach through associations, industry groups and
events, and segment-specific messaging to improve response rates and build
awareness amongst market actors.
The Company has made efforts make new construction more transparent and
accessible to market actors for ground up, major renovation, as well as tenant fit-out
projects.
The Company is projecting to meet its savings and benefits goals by the end of the
Three-Year Plan term for this core initiative.
b. Program Cost-Effectiveness
Massachusetts Electric Company and Nantucket Electric Company d/b/a National Grid
D.P.U. 18-51 2017 Energy Efficiency Plan-Year Report
Appendix 1, Significant Variances & Cost-Effectiveness Page 11 of 14
The actual 2017 benefit-cost ratio for the C&I New Buildings & Major Renovations
core initiative is 3.79. The projected benefit-cost ratio for the 2016-2018 plan term is
3.55, after accounting for actual results from 2016 and 2017.
C&I Initial Purchase & End of Useful Life 2.
a. Significant Variances
Significant variances for the combined 2016 and 2017 plan years exist between: (1)
planned budget and actual expenditures and (2) planned to preliminary total benefits.
The primary reason(s) for these variances are:
Actual expenditures were 21 percent below planned for the C&I Initial Purchase &
End of Useful Life core initiative. Despite the lower than expected spending, lifetime
electric savings exceeded planned savings by 4 percent. The Company has increased
its focus on proactively managing the cost of savings achieved through, among other
means, incentive level adjustments. In addition, there has been a minor shift in the
mix of savings for this initiative from relatively more expensive areas such as HVAC
toward lighting products, systems and controls where market forces are driving down
equipment costs and, thus, incentive levels.
Preliminary total benefits were 24 percent below planned. The variance in benefits is
driven almost entirely by the measure mix achieved. In its plan, the Company
anticipated more capacity savings, particularly for custom HVAC projects, than was
realized.
In response to the above variances, the Company made the following changes in
program design/implementation:
The Company continues to monitor market forces impacting equipment costs and
determine whether to adjust incentive levels further to enable continued reductions in
the cost of savings for the remainder of the plan term.
The Company is projecting to meet its savings and benefits goals by the end of the
Three-Year Plan term for this core initiative.
b. Program Cost-Effectiveness
Massachusetts Electric Company and Nantucket Electric Company d/b/a National Grid
D.P.U. 18-51 2017 Energy Efficiency Plan-Year Report
Appendix 1, Significant Variances & Cost-Effectiveness Page 12 of 14
The actual 2017 benefit-cost ratio for the C&I Initial Purchase & End of Useful Life
core initiative is 3.33. The projected benefit-cost ratio for the 2016-2018 plan term is
3.58, after accounting for actual results from 2016 and 2017.
B. C&I RETROFIT
The actual 2017 benefit-cost ratio for the C&I Retrofit program is 2.31. The projected
benefit-cost ratio for the 2016-2018 plan term is 2.37, after accounting for actual results
from 2016 and 2017.
C&I Existing Building Retrofit 1.
a. Significant Variances
There are no significant variances to report for this core initiative.
The Company is projecting to achieve its savings and benefits goals by the end of the
Three-Year Plan term for this core initiative.
b. Program Cost-Effectiveness
The actual 2017 benefit-cost ratio for the C&I Existing Building Retrofit core
initiative is 2.07. The projected benefit-cost ratio for the 2016-2018 plan term is 2.05,
after accounting for actual results from 2016 and 2017.
C&I Small Business 2.
a. Significant Variances
There are no significant variances to report for this core initiative.
The Company is projecting to achieve its savings and benefits goals by the end of the
Three-Year Plan term for this core initiative.
b. Program Cost-Effectiveness
Massachusetts Electric Company and Nantucket Electric Company d/b/a National Grid
D.P.U. 18-51 2017 Energy Efficiency Plan-Year Report
Appendix 1, Significant Variances & Cost-Effectiveness Page 13 of 14
The actual 2017 benefit-cost ratio for the C&I Small Business core initiative is 3.01.
The projected benefit-cost ratio for the 2016-2018 plan term is 2.66, after accounting
for actual results from 2016 and 2017.
C&I Multi-Family Retrofit 3.
a. Significant Variances
A significant variance exists for the 2016 and 2017 plan-years between (1) planned
and preliminary total lifetime savings and (2) planned and preliminary total benefits.
Preliminary lifetime savings were 22 percent lower than planned lifetime savings.
The 2016 through 2018 plan term was the first plan term in which the C&I Multi-
Family Retrofit core initiative was planned separately from the C&I Retrofit core
initiative. The 2016 through 2018 plan term was also the first plan term of an
enhanced multi-family program model that better integrates the delivery of residential
and C&I measures to multi-family facilities. Historical data proved to be unreliable
for accurate planning because in the past, the Company did not track information in
the manner that is required for reporting the new core initiative. The result was that
the Company planned for fewer participants with more lifetime savings from non-
lighting measures per participant than was realized in implementation.
A significant variance exists between planned and preliminary total benefits.
Preliminary total benefits were 27 percent lower than planned because of the
difference in way the Company calculated planned and actual non-resource benefits.
The Company planned with custom non-resource benefits for all measures; however,
the PA Common Assumptions working group decided that because the core initiative
is implemented in the same way as the Residential Multi-Family Retrofit core
initiative, the residential non-resource benefits should be applied to the majority of
measure types (with the exception of any custom measures). Since residential non-
resource benefits are lower than custom non-resource benefits, the total benefits for
this initiative were lower than planned.
In response to the above variances, the Company plans made the following change in
the program design/implementation:

Massachusetts Electric Company and Nantucket Electric Company d/b/a National Grid
D.P.U. 18-51 2017 Energy Efficiency Plan-Year Report
Appendix 1, Significant Variances & Cost-Effectiveness Page 14 of 14
The Company is working with its vendors to ensure it is pursuing all energy
efficiency opportunities while increasing the diversity of measures installed to
maximize savings and benefits within budget.
The Company will monitor this core initiative’s activity for the remainder of the plan
term.
The Company is projecting to achieve 80percent of savings and 95percent of benefits
goals by the end of the Three-Year Plan term for this core initiative.
b. Program Cost-Effectiveness
The actual 2017 benefit-cost ratio for the C&I Multi-Family core initiative is 1.14.
The projected benefit-cost ratio for the 2016-2018 plan term is 0.71, after accounting
for actual results from 2016 and 2017. Results from the 2018 Multi-Family Program
Impact and Net-to-Gross Evaluation, Appendix 4D, Study 17-21 supported changes to
impact factors that positively affected claimable savings. The core initiative is
expected to remain cost effective in 2018. The core initiative is not expected to be
cost effective over the 2016-2018 Plan Term because of 2016 results, with a final
anticipated benefit-cost ratio of approximately 0.71.
C&I Upstream Lighting 4.
a. Significant Variances
There are no significant variances to report for this core initiative.
The Company is projecting to achieve its savings and benefits goals by the end of the
Three-Year Plan term for this core initiative.
b. Program Cost-Effectiveness
The actual 2017 benefit-cost ratio for the C&I Upstream Lighting core initiative is
3.47. The projected benefit-cost ratio for the 2016-2018 plan term is 5.25, after
accounting for actual results from 2016 and 2017.

Massachusetts Electric Company and Nantucket
Electric Company d/b/a National Grid
2017 Energy Efficiency Plan-Year Report
D.P.U. 18-51
June 8, 2018
Appendix 2, Benefit-Cost Ratio Screening Tool
Page 1 of 1
APPENDIX 2
Benefit-Cost Ratio Screening Tool
Please see the CD-ROM accompanying this report for the Benefit-Cost Ratio Screening Tool in
Microsoft Excel format.

Massachusetts Electric Company and Nantucket
Electric Company d/b/a National Grid
2017 Energy Efficiency Plan-Year Report
D.P.U. 18-51
June 8, 2018
Appendix 3, Technical Reference Manual
Page 1 of 1
APPENDIX 3
Statewide Technical Reference Manual – 2017 Report Version
Please see Statewide Appendix 3: Technical Reference Manual – 2017 Report Version, filed
under separate cover. The electronic version, the Technical Reference Library, is available at:
http://www.masssavedata.com/Public/TechnicalReferenceLibrary.

Massachusetts Electric Company and Nantucket
Electric Company d/b/a National Grid
2017 Energy Efficiency Plan-Year Report
D.P.U. 18-51
June 8, 2018
Appendix 4, Statewide Evaluation Studies Summary
Page 1 of 1
APPENDIX 4
Statewide Evaluation Studies Summary
Please see Statewide Evaluation Studies Summary, filed under separate cover.
Massachusetts Electric Company and Nantucket
Electric Company d/b/a National Grid
2017 Energy Efficiency Plan-Year Report
D.P.U. 18-51
June 8, 2018
Appendix 5, Performance Incentives
Page 1 of 1
APPENDIX 5
Performance Incentives
Please see the attached Performance Incentive tables for calculations of performance incentives
based on 2017 achievement.
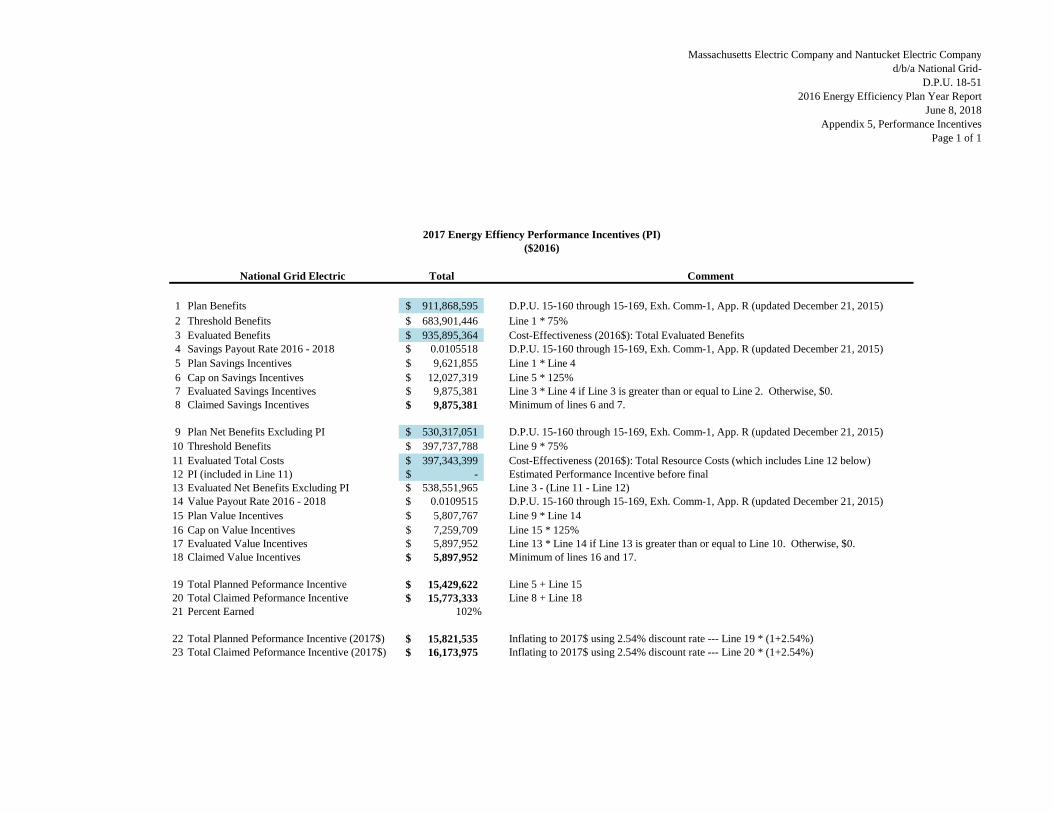
Massachusetts Electric Company and Nantucket Electric Company d/b/a National Grid-
D.P.U. 18-512016 Energy Efficiency Plan Year Report
June 8, 2018Appendix 5, Performance Incentives
Page 1 of 1
National Grid Electric Total Comment
1 Plan Benefits 911,868,595$ D.P.U. 15-160 through 15-169, Exh. Comm-1, App. R (updated December 21, 2015)2 Threshold Benefits 683,901,446$ Line 1 * 75%3 Evaluated Benefits 935,895,364$ Cost-Effectiveness (2016$): Total Evaluated Benefits4 Savings Payout Rate 2016 - 2018 0.0105518$ D.P.U. 15-160 through 15-169, Exh. Comm-1, App. R (updated December 21, 2015)5 Plan Savings Incentives 9,621,855$ Line 1 * Line 46 Cap on Savings Incentives 12,027,319$ Line 5 * 125%7 Evaluated Savings Incentives 9,875,381$ Line 3 * Line 4 if Line 3 is greater than or equal to Line 2. Otherwise, $0.8 Claimed Savings Incentives 9,875,381$ Minimum of lines 6 and 7.
9 Plan Net Benefits Excluding PI 530,317,051$ D.P.U. 15-160 through 15-169, Exh. Comm-1, App. R (updated December 21, 2015)10 Threshold Benefits 397,737,788$ Line 9 * 75%11 Evaluated Total Costs 397,343,399$ Cost-Effectiveness (2016$): Total Resource Costs (which includes Line 12 below)12 PI (included in Line 11) -$ Estimated Performance Incentive before final 13 Evaluated Net Benefits Excluding PI 538,551,965$ Line 3 - (Line 11 - Line 12)14 Value Payout Rate 2016 - 2018 0.0109515$ D.P.U. 15-160 through 15-169, Exh. Comm-1, App. R (updated December 21, 2015)15 Plan Value Incentives 5,807,767$ Line 9 * Line 1416 Cap on Value Incentives 7,259,709$ Line 15 * 125%17 Evaluated Value Incentives 5,897,952$ Line 13 * Line 14 if Line 13 is greater than or equal to Line 10. Otherwise, $0.18 Claimed Value Incentives 5,897,952$ Minimum of lines 16 and 17.
19 Total Planned Peformance Incentive 15,429,622$ Line 5 + Line 1520 Total Claimed Peformance Incentive 15,773,333$ Line 8 + Line 1821 Percent Earned 102%
22 Total Planned Peformance Incentive (2017$) 15,821,535$ Inflating to 2017$ using 2.54% discount rate --- Line 19 * (1+2.54%)23 Total Claimed Peformance Incentive (2017$) 16,173,975$ Inflating to 2017$ using 2.54% discount rate --- Line 20 * (1+2.54%)
2017 Energy Effiency Performance Incentives (PI)($2016)

Massachusetts Electric Company and Nantucket
Electric Company d/b/a National Grid
2017 Energy Efficiency Plan-Year Report
D.P.U. 18-51
June 8, 2018
Appendix 6, Demand Reduction
Page 1 of 4
APPENDIX 6
Demand Reduction Update
A. Statewide Summary
In the 2016-2018 Massachusetts Joint Statewide Three-Year Electric and Gas Energy Efficiency
Plan (“Plan”) the Program Administrators committed to exploring creative new approaches to
cost-effective demand reduction. These potential innovative approaches are in addition to the
significant amount of demand savings planned to be achieved through energy efficiency
programs in the 2016-2018 Three-Year Plan. See Plan at 19 (577 MW summer demand savings
and 618 MW winter demand savings). Consistent with the Plan, in 2016 the Program
Administrators assembled a Demand Savings Group (“DSG”) consisting of a small group of
interested and qualified experts, to research potential electric and gas demand reduction efforts.
Through this highly collaborative and expert driven process, the Program Administrators have
considered various approaches to demand demonstration projects, and coordinated with each
other to examine various innovative technologies and approaches that could potentially be
successfully deployed to address unique opportunities in the Commonwealth. Below is a brief
summary of the efforts undertaken by the Program Administrators and DSG since the 2016 Plan-
Year Report to investigate potential cost-effective approaches to achieve active demand
reduction.
In 2016 and early 2017, the Program Administrators through the DSG and the Council’s Demand
Reduction Subcommittee engaged in a highly collaborative process to investigate and analyze
potential demand opportunities. As explained in the 2016 Plan Year Report, this work
contributed to the development of several additional demonstration projects and the refinement
of approved demonstrations. As such, the Program Administrators’ primary efforts throughout
2017 and the beginning of 2018 were implementing and reviewing the results of approved
demonstration projects, as well on obtaining approval of new demonstration projects that will
test a variety of technologies and strategies.
In the summer of 2017, some Program Administrators implemented approved demonstrations in
both the Residential and Commercial & Industrial (“C&I”) sectors. National Grid and Cape
Light Compact (the “Compact”) ran a second summer of residential direct load control, targeting
connected thermostats controlling cooling loads. Additionally, National Grid implemented the
first summer of a C&I load curtailment demonstration offering.
In October 2017, the Department approved most of the proposed Eversource and Unitil
demonstration projects (D.P.U. 16-178 and D.P.U. 16-184). The Compact is also awaiting a
decision on its proposed demonstration projects (D.P.U. 17-84). The Program Administrators
also continued to refine a methodology for assessing the cost-effectiveness of demand reduction
programs.
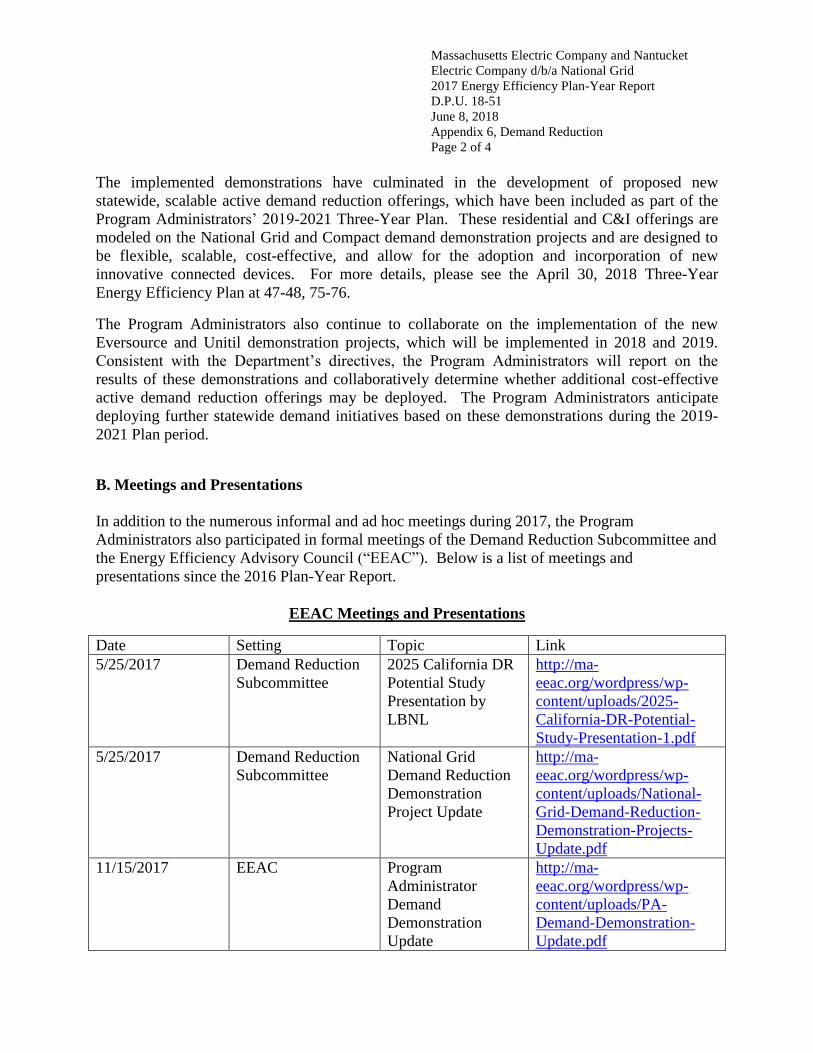
Massachusetts Electric Company and Nantucket
Electric Company d/b/a National Grid
2017 Energy Efficiency Plan-Year Report
D.P.U. 18-51
June 8, 2018
Appendix 6, Demand Reduction
Page 2 of 4
The implemented demonstrations have culminated in the development of proposed new
statewide, scalable active demand reduction offerings, which have been included as part of the
Program Administrators’ 2019-2021 Three-Year Plan. These residential and C&I offerings are
modeled on the National Grid and Compact demand demonstration projects and are designed to
be flexible, scalable, cost-effective, and allow for the adoption and incorporation of new
innovative connected devices. For more details, please see the April 30, 2018 Three-Year
Energy Efficiency Plan at 47-48, 75-76.
The Program Administrators also continue to collaborate on the implementation of the new
Eversource and Unitil demonstration projects, which will be implemented in 2018 and 2019.
Consistent with the Department’s directives, the Program Administrators will report on the
results of these demonstrations and collaboratively determine whether additional cost-effective
active demand reduction offerings may be deployed. The Program Administrators anticipate
deploying further statewide demand initiatives based on these demonstrations during the 2019-
2021 Plan period.
B. Meetings and Presentations
In addition to the numerous informal and ad hoc meetings during 2017, the Program
Administrators also participated in formal meetings of the Demand Reduction Subcommittee and
the Energy Efficiency Advisory Council (“EEAC”). Below is a list of meetings and
presentations since the 2016 Plan-Year Report.
EEAC Meetings and Presentations
Date Setting Topic Link
5/25/2017 Demand Reduction
Subcommittee
2025 California DR
Potential Study
Presentation by
LBNL
http://ma-
eeac.org/wordpress/wp-
content/uploads/2025-
California-DR-Potential-
Study-Presentation-1.pdf
5/25/2017 Demand Reduction
Subcommittee
National Grid
Demand Reduction
Demonstration
Project Update
http://ma-
eeac.org/wordpress/wp-
content/uploads/National-
Grid-Demand-Reduction-
Demonstration-Projects-
Update.pdf
11/15/2017 EEAC Program
Administrator
Demand
Demonstration
Update
http://ma-
eeac.org/wordpress/wp-
content/uploads/PA-
Demand-Demonstration-
Update.pdf
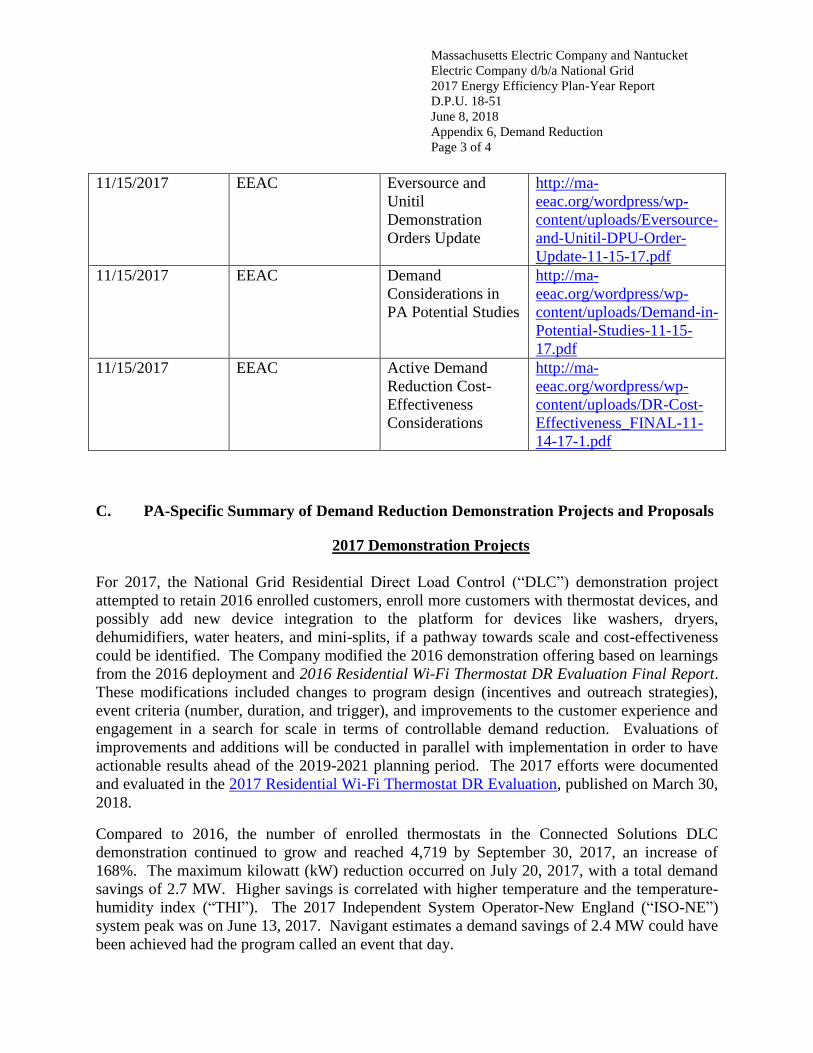
Massachusetts Electric Company and Nantucket
Electric Company d/b/a National Grid
2017 Energy Efficiency Plan-Year Report
D.P.U. 18-51
June 8, 2018
Appendix 6, Demand Reduction
Page 3 of 4
11/15/2017 EEAC Eversource and
Unitil
Demonstration
Orders Update
http://ma-
eeac.org/wordpress/wp-
content/uploads/Eversource-
and-Unitil-DPU-Order-
Update-11-15-17.pdf
11/15/2017 EEAC Demand
Considerations in
PA Potential Studies
http://ma-
eeac.org/wordpress/wp-
content/uploads/Demand-in-
Potential-Studies-11-15-
17.pdf
11/15/2017 EEAC Active Demand
Reduction Cost-
Effectiveness
Considerations
http://ma-
eeac.org/wordpress/wp-
content/uploads/DR-Cost-
Effectiveness_FINAL-11-
14-17-1.pdf
C. PA-Specific Summary of Demand Reduction Demonstration Projects and Proposals
2017 Demonstration Projects
For 2017, the National Grid Residential Direct Load Control (“DLC”) demonstration project
attempted to retain 2016 enrolled customers, enroll more customers with thermostat devices, and
possibly add new device integration to the platform for devices like washers, dryers,
dehumidifiers, water heaters, and mini-splits, if a pathway towards scale and cost-effectiveness
could be identified. The Company modified the 2016 demonstration offering based on learnings
from the 2016 deployment and 2016 Residential Wi-Fi Thermostat DR Evaluation Final Report.
These modifications included changes to program design (incentives and outreach strategies),
event criteria (number, duration, and trigger), and improvements to the customer experience and
engagement in a search for scale in terms of controllable demand reduction. Evaluations of
improvements and additions will be conducted in parallel with implementation in order to have
actionable results ahead of the 2019-2021 planning period. The 2017 efforts were documented
and evaluated in the 2017 Residential Wi-Fi Thermostat DR Evaluation, published on March 30,
2018.
Compared to 2016, the number of enrolled thermostats in the Connected Solutions DLC
demonstration continued to grow and reached 4,719 by September 30, 2017, an increase of
168%. The maximum kilowatt (kW) reduction occurred on July 20, 2017, with a total demand
savings of 2.7 MW. Higher savings is correlated with higher temperature and the temperature-
humidity index (“THI”). The 2017 Independent System Operator-New England (“ISO-NE”)
system peak was on June 13, 2017. Navigant estimates a demand savings of 2.4 MW could have
been achieved had the program called an event that day.
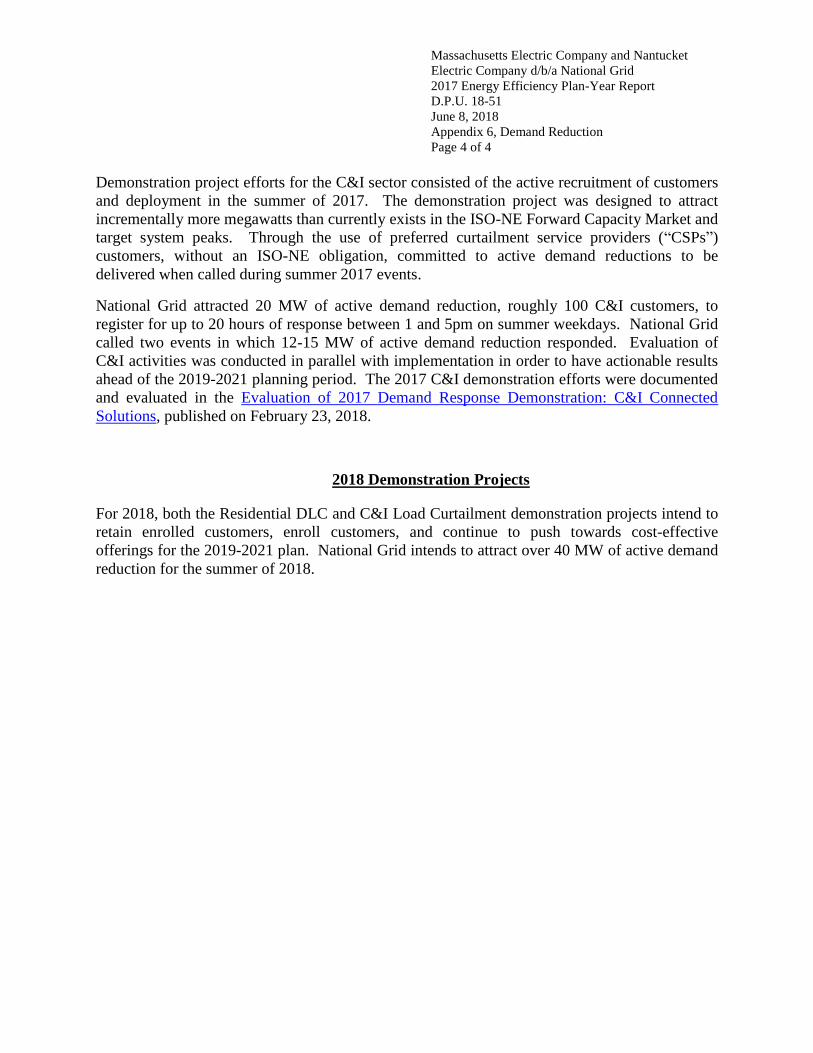
Massachusetts Electric Company and Nantucket
Electric Company d/b/a National Grid
2017 Energy Efficiency Plan-Year Report
D.P.U. 18-51
June 8, 2018
Appendix 6, Demand Reduction
Page 4 of 4
Demonstration project efforts for the C&I sector consisted of the active recruitment of customers
and deployment in the summer of 2017. The demonstration project was designed to attract
incrementally more megawatts than currently exists in the ISO-NE Forward Capacity Market and
target system peaks. Through the use of preferred curtailment service providers (“CSPs”)
customers, without an ISO-NE obligation, committed to active demand reductions to be
delivered when called during summer 2017 events.
National Grid attracted 20 MW of active demand reduction, roughly 100 C&I customers, to
register for up to 20 hours of response between 1 and 5pm on summer weekdays. National Grid
called two events in which 12-15 MW of active demand reduction responded. Evaluation of
C&I activities was conducted in parallel with implementation in order to have actionable results
ahead of the 2019-2021 planning period. The 2017 C&I demonstration efforts were documented
and evaluated in the Evaluation of 2017 Demand Response Demonstration: C&I Connected
Solutions, published on February 23, 2018.
2018 Demonstration Projects
For 2018, both the Residential DLC and C&I Load Curtailment demonstration projects intend to
retain enrolled customers, enroll customers, and continue to push towards cost-effective
offerings for the 2019-2021 plan. National Grid intends to attract over 40 MW of active demand
reduction for the summer of 2018.