marketing strategies and sales performance in the commercial
114
MARKETING STRATEGIES AND SALES PERFORMANCE IN THE COMMERCIAL BANKS IN BUJUMBURA, BURUNDI BY GATEKA ELLA SANDRA 1164-05026-09394 A THESIS SUBMITTED TO THE COLLEGE OF ECONOMICS AND MANAGEMENT SCIENCE IN PARTIAL FULFILMENT OF THE REQUIREMENTS FOR THE AWARD OF THE MASTER’S DEGREE IN BUSINESS ADMINISTRATION OF KAMPALA INTERNATIONAL UNIVERSITY MARCH, 2019
-
Upload
khangminh22 -
Category
Documents
-
view
1 -
download
0
Transcript of marketing strategies and sales performance in the commercial

i
MARKETING STRATEGIES AND SALES PERFORMANCE IN THE COMMERCIAL
BANKS IN BUJUMBURA, BURUNDI
BY
GATEKA ELLA SANDRA
1164-05026-09394
A THESIS SUBMITTED TO THE COLLEGE OF ECONOMICS AND
MANAGEMENT SCIENCE IN PARTIAL FULFILMENT OF THE
REQUIREMENTS FOR THE AWARD OF THE MASTER’S
DEGREE IN BUSINESS ADMINISTRATION OF
KAMPALA INTERNATIONAL
UNIVERSITY
MARCH, 2019

ii
DECLARATION
I declare that this thesis is my own effort and has not been submitted to any institution of higher
learning for award of any degree except where due reference has been made.
______________________________ ______________________________
Gateka Ella Sandra Date
iii
APPROVAL
I declare that the work in this thesis was done by the student under my guidance as the
University supervisor and is ready for further examination.
_____________________________ ________________________
Dr. Olutayo, K. Osunsan Date

iv
DEDICATION
I dedicate this work to my father, Mr. Nishireko Cassien and my mother Ms. Bizimana Marie for
their boundless love for me and for taking me to school.

v
ACKNOWLEDGEMENT
My profound gratitude goes to the Almighty God for the gift of life and wisdom that He gave me
throughout my studies.
My warm appreciation goes to my parents who supported me throughout my life most
importantly academic life, May God reward them.
I would like to acknowledge and extend my sincere and hearty gratitude to my supportive
supervisors, Dr. Emenike O. Kalu, Dr. Olutayo, K. Osunsan, and Dr. Joseph B.K. Kirabo, Dr.
Augustine Wandiba for their critical reviews, expert advice, and regular availability to me
throughout the course of my research work.
I cannot forget my exemplary lecturers at the College of Economics and Management, especially
for their great assistance and excellent academic pieces of advice. I owe a special debt of
gratitude to all of them. Furthermore, I acknowledge the authors whose works have been cited in
this study.
I acknowledge with gratitude the contributions and co-operation made by the respondents from
the commercial banks that were surveyed for their willingness to provide the necessary
information when I visited their offices during the research process. Without their cooperation,
this study would have been impossible to accomplish.
Finally, my great appreciation goes to my sisters, Mugisha Ange Gynelle, Kaneza Erica Laura
and Nishimwe Nancy Kelly, and my friends, for their unconditional support. It is through them
that I successfully completed this piece of work.
vi
LIST OF ACRONYMS
BANCOBU Banque Commerciale du Burundi
BBCI Burundi Bank of Commerce and Investment
BCB Burundi Bank of Credit
BIF Burundian franc
CRDB Cooperative Rural Development Bank
CVI Content Validity Index
IBB Interbank Burundi
MNCs Multinational Corporations
PBT Profits Before Tax
ROA Return-on-Asset (ROA)
ROE Return-on-Equity
SMEs Small and Medium Enterprises
SPSS Statistical Package for Social Sciences
US United States

vii
TABLE OF CONTENTS
DECLARATION .......................................................................................................................................... ii
APPROVAL ................................................................................................................................................ iii
DEDICATION ............................................................................................................................................. iv
ACKNOWLEDGEMENT ............................................................................................................................ v
LIST OF ACRONYMS ............................................................................................................................... vi
LIST OF TABLES ....................................................................................................................................... xi
LIST OF FIGURES .................................................................................................................................... xii
ABSTRACT ................................................................................................................................................xiii
CHAPTER ONE ........................................................................................................................................... 1
INTRODUCTION ........................................................................................................................................ 1
1.0 Introduction ............................................................................................................................................. 1
1.1 Background to the Study ......................................................................................................................... 1
1.1.1 Historical Perspective .......................................................................................................................... 1
1.1.2 Theoretical Perspective ........................................................................................................................ 3
1.1.3 Conceptual Perspective ........................................................................................................................ 4
1.1.4 Contextual Perspective ......................................................................................................................... 4
1.2 Problem Statement .................................................................................................................................. 6
1.3 Purpose of the Study ............................................................................................................................... 6
1.4 Objectives of the Study ........................................................................................................................... 7
1.5 Research Questions ................................................................................................................................. 7
1.6 Hypotheses .............................................................................................................................................. 7
1.7 Scope of the Study .................................................................................................................................. 7
1.7.1 Geographical Scope ............................................................................................................................. 7
1.7.2 Content Scope ...................................................................................................................................... 8
1.7.3 Times Scope ......................................................................................................................................... 8
1.8 Significance of the Study ........................................................................................................................ 8
1.9 Operational definition of key terms ........................................................................................................ 9
CHAPTER TWO ........................................................................................................................................ 11
LITERATURE REVIEW ........................................................................................................................... 11
2.0 Introduction ........................................................................................................................................... 11

viii
2.1 Theoretical Review ............................................................................................................................... 11
2.2 Conceptual Review ............................................................................................................................... 13
2.3 Review of Related Literature ................................................................................................................ 14
2.3.1 Marketing Strategy ............................................................................................................................. 14
2.3.1.1 The Effect of Product on Sales Performance .................................................................................. 14
2.3.1.2 The Effect of Price on Sales Performance ...................................................................................... 18
2.3.1.3 The Effect of Place on Sales Performance ...................................................................................... 20
2.3.1.4 The Effect of Promotion on Sales Performance .............................................................................. 23
2.3.2 Sales Performance .............................................................................................................................. 27
2.3.2.1 Sales volume ................................................................................................................................... 28
2.3.2.3 Profitability ..................................................................................................................................... 29
2.4 Empirical Studies .................................................................................................................................. 31
2.5 Literature Gap ....................................................................................................................................... 33
CHAPTER THREE .................................................................................................................................... 34
METHODOLOGY ..................................................................................................................................... 34
3.0 Introduction ........................................................................................................................................... 34
3.1 Research Design .................................................................................................................................... 34
3.2 Target Population .................................................................................................................................. 34
3.3 Sample Size ........................................................................................................................................... 35
3.3.1 Quantitative Sample Size ................................................................................................................... 35
3.3.2 Qualitative Sample Size ..................................................................................................................... 36
3.4 Sampling Technique ............................................................................................................................. 36
3.5 Data Source ........................................................................................................................................... 37
3.5.1 Primary Source ................................................................................................................................... 37
3.6 Data Collection Methods ...................................................................................................................... 37
3.6.1 Surveys ............................................................................................................................................... 37
3.6.2 Interviews ........................................................................................................................................... 37
3.7 Research Instruments ............................................................................................................................ 37
3.7.1 Questionnaires .................................................................................................................................... 38
3.7.2 Key Informant Interviews .................................................................................................................. 38
3.8 Validity and Reliability ......................................................................................................................... 38
3.8.1 Validity .............................................................................................................................................. 38

ix
3.8.2 Reliability ........................................................................................................................................... 39
3.9 Data Gathering Procedure ..................................................................................................................... 41
3.10 Data Analysis ...................................................................................................................................... 42
3.11 Ethical Consideration .......................................................................................................................... 44
CHAPTER FOUR ....................................................................................................................................... 45
DATA PRESENTATION, ANALYSIS AND INTERPRETATION ........................................................ 45
4.0 Introduction ........................................................................................................................................... 45
4.1 Response Rate ....................................................................................................................................... 45
4.2 Demographic Characteristics of the Respondents................................................................................. 45
4.3 The Descriptive Statistics for Marketing Strategy ................................................................................ 47
4.4 The Descriptive Statistics for Sales Performance ................................................................................. 53
4.5 The Effect of Product on Sales Performance in the Commercial Banks in Bujumbura ....................... 57
4.6 The Effect of Price on Sales Performance in the Commercial Banks in Bujumbura ............................ 58
4.7 The Effect of Place on Sales Performance in the Commercial Banks in Bujumbura ........................... 59
4.8 The Effect of Promotion on Sales Performance in the Commercial Banks in Bujumbura ................... 59
CHAPTER FIVE ........................................................................................................................................ 63
DISCUSSION OF FINDINGS, CONCLUSIONS AND RECOMMENDATIONS .................................. 63
5.0 Introduction ........................................................................................................................................... 63
5.1 Summary of Major Findings ................................................................................................................. 63
5.2 The Discussions of the Major Results ................................................................................................... 63
5.2.1 The Effect of Product on Sales Performance in the Commercial Banks in Bujumbura .................... 63
5.2.2 The Effect of Price on Sales Performance in the Commercial Banks in Bujumbura ......................... 64
5.2.3 The Effect of Place on Sales Performance in the Commercial Banks in Bujumbura ........................ 65
5.2.4 The Effect of Promotion on Sales Performance in the Commercial Banks, Bujumbura ................... 66
5.2.5 The Effect of Marketing Strategy on Sales Performance among Commercial Banks in Bujumbura,
Burundi ....................................................................................................................................................... 67
5.3 Conclusions ........................................................................................................................................... 67
5.4 Recommendations ................................................................................................................................. 69
5.4.1 The Effect of Product on Sales Performance in the Commercial Banks in Bujumbura .................... 69
5.4.2 The Effect of Price on Sales Performance in the Commercial Banks in Bujumbura ......................... 69
5.4.3 The Effect of Place on Sales Performance in the Commercial Banks in Bujumbura ........................ 69
5.4.4 The Effect of Promotion on Sales Performance in the Commercial Banks, Bujumbura ................... 70

x
5.5 Contribution to New Knowledge .......................................................................................................... 70
5.6 Areas of further Research ..................................................................................................................... 71
5.7 Limitations of the Study ........................................................................................................................ 71
References ................................................................................................................................................... 72
APPENDIX I: TRANSMITTAL LETTER ................................................................................................ 91
APPENDIC II: INFORMED CONSENT ................................................................................................... 92
APPENDIX III: QUESTIONNAIRES ....................................................................................................... 93
APPENDIX IV: KEY INFORMANT INTERVIEWS ............................................................................... 97
APPENDIX V: MAP SHOWING LOCATION OF COMMERCIAL BANKS IN BURUNDI ................ 98
APPENDIX VI: EXTRACTED DATA ...................................................................................................... 99
xi
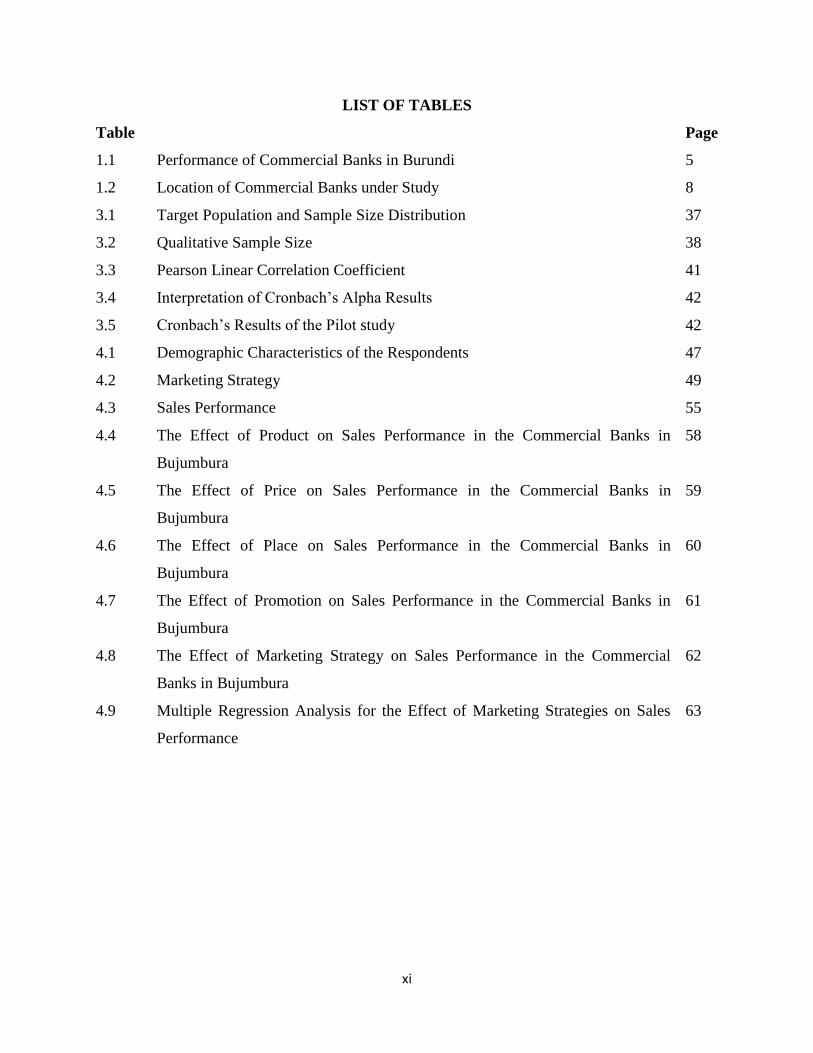
LIST OF TABLES
Table Page
1.1 Performance of Commercial Banks in Burundi 5
1.2 Location of Commercial Banks under Study 8
3.1 Target Population and Sample Size Distribution 37
3.2 Qualitative Sample Size 38
3.3 Pearson Linear Correlation Coefficient 41
3.4 Interpretation of Cronbach‟s Alpha Results 42
3.5 Cronbach‟s Results of the Pilot study 42
4.1 Demographic Characteristics of the Respondents 47
4.2 Marketing Strategy 49
4.3 Sales Performance 55
4.4 The Effect of Product on Sales Performance in the Commercial Banks in
Bujumbura
58
4.5 The Effect of Price on Sales Performance in the Commercial Banks in
Bujumbura
59
4.6 The Effect of Place on Sales Performance in the Commercial Banks in
Bujumbura
60
4.7 The Effect of Promotion on Sales Performance in the Commercial Banks in
Bujumbura
61
4.8 The Effect of Marketing Strategy on Sales Performance in the Commercial
Banks in Bujumbura
62
4.9 Multiple Regression Analysis for the Effect of Marketing Strategies on Sales
Performance
63

xii
LIST OF FIGURES
Figure Page
2.1 Showing the Conceptual framework 13
xiii
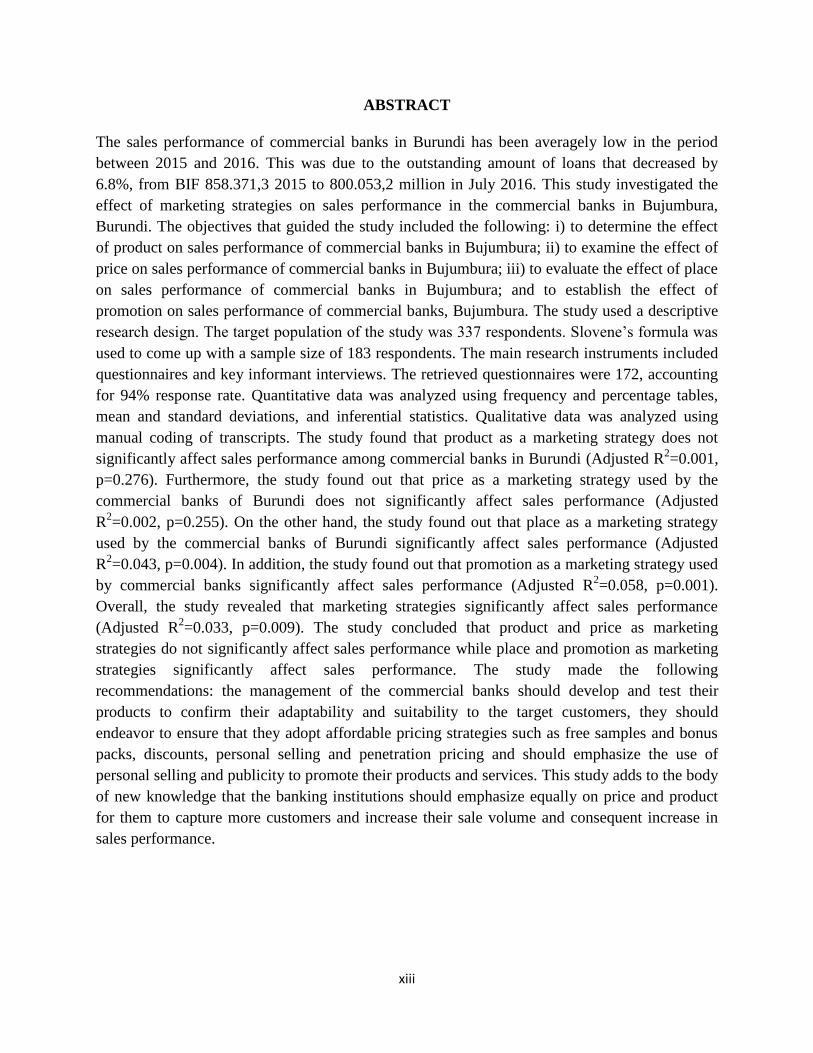
ABSTRACT
The sales performance of commercial banks in Burundi has been averagely low in the period
between 2015 and 2016. This was due to the outstanding amount of loans that decreased by
6.8%, from BIF 858.371,3 2015 to 800.053,2 million in July 2016. This study investigated the
effect of marketing strategies on sales performance in the commercial banks in Bujumbura,
Burundi. The objectives that guided the study included the following: i) to determine the effect
of product on sales performance of commercial banks in Bujumbura; ii) to examine the effect of
price on sales performance of commercial banks in Bujumbura; iii) to evaluate the effect of place
on sales performance of commercial banks in Bujumbura; and to establish the effect of
promotion on sales performance of commercial banks, Bujumbura. The study used a descriptive
research design. The target population of the study was 337 respondents. Slovene‟s formula was
used to come up with a sample size of 183 respondents. The main research instruments included
questionnaires and key informant interviews. The retrieved questionnaires were 172, accounting
for 94% response rate. Quantitative data was analyzed using frequency and percentage tables,
mean and standard deviations, and inferential statistics. Qualitative data was analyzed using
manual coding of transcripts. The study found that product as a marketing strategy does not
significantly affect sales performance among commercial banks in Burundi (Adjusted R2=0.001,
p=0.276). Furthermore, the study found out that price as a marketing strategy used by the
commercial banks of Burundi does not significantly affect sales performance (Adjusted
R2=0.002, p=0.255). On the other hand, the study found out that place as a marketing strategy
used by the commercial banks of Burundi significantly affect sales performance (Adjusted
R2=0.043, p=0.004). In addition, the study found out that promotion as a marketing strategy used
by commercial banks significantly affect sales performance (Adjusted R2=0.058, p=0.001).
Overall, the study revealed that marketing strategies significantly affect sales performance
(Adjusted R2=0.033, p=0.009). The study concluded that product and price as marketing
strategies do not significantly affect sales performance while place and promotion as marketing
strategies significantly affect sales performance. The study made the following
recommendations: the management of the commercial banks should develop and test their
products to confirm their adaptability and suitability to the target customers, they should
endeavor to ensure that they adopt affordable pricing strategies such as free samples and bonus
packs, discounts, personal selling and penetration pricing and should emphasize the use of
personal selling and publicity to promote their products and services. This study adds to the body
of new knowledge that the banking institutions should emphasize equally on price and product
for them to capture more customers and increase their sale volume and consequent increase in
sales performance.

1
CHAPTER ONE
INTRODUCTION
1.0 Introduction
This chapter covered the background of the study, problem statement, purpose of the study,
research objectives and questions, hypotheses, scope of the study, significance of the study and
operational definition of key terms.
1.1 Background to the Study
This section of the chapter looked at the historical perspective, theoretical perspective,
conceptual perspective and contextual perspective.
1.1.1 Historical Perspective
The practice of marketing goes back thousands of years, however, the academic discipline of
marketing emerged much more recently, starting around the turn of the twentieth century in the
United States (US) (Shaw, 2012). In the years of 2001, 2002, 2003, 2004, companies across
Europe and US embraced marketing strategies such as internet marketing, coherent marketing
approach which aimed at specific national and international markets, intensive store marketing
strategy, operational excellence, customer intimacy, and product leadership as employed by
WalMart, team marketing as was employed by The Atlanta Group, Compare & Contrast strategy
as employed by Ford Motor Co, and dominating single market as employed by Samsung Group
(Nanda & Khanna, 2011).
Indeed the current globalization market has made companies to see the internationalization of
their activities as a way to remain competitive. Therefore, marketing strategy has become an
important tool globally for any banking institution to remain in competitive market environment
(Ojo, 2012). With the growing importance of the financial sector, pressures are escalating for
more effective marketing management of the financial services. Effective marketing strategies
are the key to frontline sales performance. Financial institutions typically use a variety of sales
tools and processes to achieve their sales goals. Among the best practices of those with highly
successful sales programs is having the marketing strategies provided to management and front
line staff at all branches that describes tools and processes in detail, helping to ensure that

2
everyone involved in sales, no matter how remotely, operates on a coordinated basis (Ishola et
al., 2017).
In sub-Saharan Africa, and in this twenty first century, marketing is playing a vital role in the
banking industry. This is because the banking sector is an integral part of the economy. It
therefore implies that a weak banking sector not only jeopardizes the long-term sustainability of
an economy, but also be a trigger for a financial crisis which can lead to economic crises
(Papadopoulos & Hamzaoui-Essousi, 2015). Because of the importance of the banking sector to
the economy, majority of the banking institutions in the continent are now putting emphasis on
marketing to make customers aware about the services and benefits offered by them (Dadzie et
al., 2018). There has been observed a tendency of opening one window for Islamic banking in
already running conventional banks in order to meet the requirements of the consumers and to
retain the customers (Bhatt & Gor, 2012). Marketing strategies must be analyzed and tackled
carefully for any growing industry in order to get sustainable development. Marketing strategy is
one of the most important issues that must be examined carefully in order to improve
performance and ensure sustainable growth of banks as competition in the banking industry
intensifies (Mwania, 2017).
For instance in Kenya, the banking industry has been faced with stiff competition of late and
many local banks have been forced to wind up. The main reasons being failure to embrace
effective marketing strategies that could have enabled it operate optimally in the volatile banking
sector (Adefulu, 2015). For years, defined business has proved to be a hindrance to the growth
and development of the banking industry. In essence, competition has effortlessly brought down
several economies to their knees. For many businesses, marketing strategies has been the way to
approach the volatile banking business while to some, customer satisfaction, a sound customer
relationship and effective communication has been their main marketing strategic tool (Muchina
& Okello, 2016). Leadership in contemporary organizations has been left to ponder for what they
should do in order to be at a competitive edge and be a benchmark to other banks in the banking
industry (Tangus & Omar, 2017). For other banks such as those in Rwanda, diversification has
been the way to approach the volatile banking business but legislation on banking business has
often negatively affected venturing into other business other than the banking business hence
greatly affecting their sales performance and sustainability (Ngango et al., 2015).

3
In Burundi, due to high competition among commercial banks, banks have tried to come up with
new strategies so as to improve their sales performances (Nkurunziza et al., 2012). The Burundi
Banking sector has been undergoing a lot of challenges in its growth over the past 5 years
because of political turmoil and interference. However, the industry continues to offer significant
profit opportunities for the major participants and has attracted international banks such as
Kenya Commercial Bank, Access Bank and CRDB Bank Burundi. These international banks
together with the local banks expanded financial services to millions of poor households
especially via mobile phones. Because majority of the Burundi bankable population is unbanked,
it has compelled banks to adopt new marketing strategies so as to diversify the bank products and
services to reach these millions of people. As a way of expanding the market share and need to
reach the unbanked in the local set up, banks in Burundi have adopted agency banking as one of
the diversification strategies (Ndikumana, 2014).
Furthermore, through the continuous modification and rectification in banking and
implementation of financial sector reforms as per the recommendation of the Committee on
Financial System, the functioning of banks in Burundi has undergone dramatic changes. Starting
from very conservative traditional banking where the service of banks was confined to a few in
the society, now due to liberalization and privatization, a 'U' turn has taken place in Burundian
banking (Gwatizo, 2013). The hallmark of the changed concept is aimed at having a full view of
customers' needs and increasing sales performance.
1.1.2 Theoretical Perspective
This study was anchored on Marketing Mix Theory founded by Borden (1965) and extended by
(Kotler & Keller, 2006). The theory is premised on the assumption that all aspects of the
marketing plan are organized around the habits, desires and psychology of the target market. The
theory is still used today to make important decisions that lead to the execution of a
marketing plan. Marketing Mix Theory combines a number of components in order to
strengthen and solidify a product‟s brand and to help sell the product or service. The
components combined by this are products, price, promotion and place forming the Four P‟s.
These four P‟s are the parameters that the marketing manager can control, subject to the internal
and external constraints of the marketing environment. The goal is to make decisions that centers

4
the four P's on the customers in the target market in order to create perceived value and
generate a positive response.
1.1.3 Conceptual Perspective
A marketing strategy is a business's overall game plan for reaching people and turning them into
customers of the product or service that the business provides (Minchin & Alpert, 2017).
Furthermore, Chan (2018) defined marketing strategy as a long-term, forward-looking approach
to planning with the fundamental goal achieving a sustainable competitive advantage. In
addition, marketing strategy is a process or model to allow a company or organization to focus
limited resources on the best opportunities to increase sales and thereby achieve a sustainable
competitive advantage (Kudyrko & Sevruk, 2016). On the other hand, West et al., (2010) defined
marketing strategy as the comprehensive plan formulated particularly for achieving the
marketing objectives of the organization. According to Kotler (2015), marketing strategies;
product, price, place and promotion are strategies that organizations use to react to market and
internal forces that will enable an organization achieve their objective. In this study, marketing
strategies were operationalized using Kotler‟s (2015) model of product, price, place and
promotion.
Sales performance is a combination of sales effectiveness - the ability of a company‟s sales
professionals to “win” at each stage of the customer‟s buying process, and ultimately earn the
business on the right terms and in the right timeframe and sales efficiency - the speed at which
each task in the sales process is performed (Rogers, 2014). According to Zhang and Tang (2010),
sales performance is a direct inducement that offers an extra value or incentive for the product to
the sales force distributors or consumer with the primary objective of creating an immediate sale.
According to Dean (2015), sales performance indicates the rate of customer loyalty to the
business or a specific employee. In this study, sales performance was operationalized using: sales
volume, and profitability.
1.1.4 Contextual Perspective
Commercial banks in Burundi offer a wide range of banking products and services to small and
medium size customers such as mortgage finance, loans, corporate, retail and commercial
banking services (Ndikumana, 2014). The banking sector of Burundi comprises ten commercial
banks, including Diamond Trust Bank which opened in 2009. The banking sector is highly

5
concentrated with the three largest banks, the Banque de Crédit de Bujumbura (BCB), Banque
Commerciale du Burundi (BANCOBU), and Interbank Burundi (IBB) accounting for a
commanding share of the market 65 percent, 69 percent of deposits, 76 percent of total assets as
indicated in the table blow.
Table 1.1: Performance of Commercial Banks in Burundi
Bank Name Year of creation Branches Total assets
(million BIF)
Deposits
(million BIF)
Banque Commerciale du
Burundi (BANCOBU)
1964 14 187.627 124.261
Burundi Bank of Credit
(BCB)
1964 21 324.334 238.865
Burundi Bank of
Commerce and
Investment (BBCI)
1988 10 84.310 45.918
Interbank Burundi (IBB) 1992 24 316.036 227.527
Source: (Rutumwako & Kaneza, 2018)
However, even with the dominance of the above mentioned three banks, the banking industry in
Burundi faces the challenges of fluctuating demand and stiff competition. The competitive
environment in the banking industry is widely recognized as being complex, dynamic, and
highly segmented which makes customers acquisition an uphill task. Increasingly banking
companies are competing directly with one another in the same locations (Rutumwako &
Kaneza, 2018).
The banking industry in Burundi is characterized by price competition, customer sophistication,
and perceived product equality. Changing market growth rates and shifting market shares are key
determinants of the competitive environment in Burundi (Gwatizo, 2013). Due to intense market
competition, bank profitability on average has been inconsistent. In the period 2008-2013,
increases in Profits before Tax (PBT) has been below 20% on average terms. In the year 2014
PBT of the Burundian commercial banks increased by 16.6% and again dropped to 16.2% in
2015 (Dridi, 2016).

6
1.2 Problem Statement
The sales performance of commercial banks in Burundi has been averagely low in the period
between 2015 and 2016. Banking sector assets largely consists of loans and Treasury securities
with shares of 45.5 and 22.2% of total assets respectively (Bank of the Republic of Burundi,
2016). However, the outstanding amount of loans decreased by 6.8%, from BIF 858.371,3 in
2015 to 800.053,2 million in July 2016. Compared to the same period of the previous year, the
banking sector‟s profitability decreased due to the increase of the impaired loans. Indeed, the
sectoral net profit decreased by 7%, falling from BIF 17,364.1 to 16,142.7 million in July 2016.
Additionally, the banking sector profitability as measured by the return-on-Asset (ROA) and the
return-on-equity (ROE) ratios also slightly decreased from 1.4 to 1.2% and from 9.5% to 8.0%
respectively from July 2015 to July 2016 (Bank of the Republic of Burundi, 2016).
The above illustrated poor sales performance of the banking sector could be attributed to factors
such as limited access to credit and banking services, political pressure, mismanagement, and
undercapitalization which limits banks‟ lending capacity to large clients (Nkurunziza, et al.,
2011). In addition, the banks have over the same period (2015-2016) used different methods such
as employee training and upgrade of technology in order to enhance their sales performance but
this effort registered limited success.
However, given the importance of marketing strategies in promoting and realizing better sales
performance among the banking institutions, it was imperative that a study be done to investigate
the effect of marketing strategies in terms of products, price, place and promotions on the sales
performance of the commercial banks in Bujumbura, Burundi.
1.3 Purpose of the Study
To determine the effect of marketing strategies on sales performance in the commercial banks in
Bujumbura, Burundi.

7
1.4 Objectives of the Study
i. To determine the effect of product on sales performance of commercial banks in
Bujumbura.
ii. To examine the effect of price on sales performance of commercial banks in Bujumbura.
iii. To evaluate the effect of place on sales performance of commercial banks in Bujumbura.
iv. To establish the effect of promotion on sales performance of commercial banks,
Bujumbura.
1.5 Research Questions
i. What is the effect of product on sales performance of commercial banks in Bujumbura?
ii. What is the effect of price on sales performance of commercial banks in Bujumbura?
iii. What is the effect of place on sales performance of commercial banks in Bujumbura?
iv. What is the effect of promotion on sales performance of commercial banks, Bujumbura?
1.6 Hypotheses
i. Ho1: There is no significant effect of product on sales performance of commercial banks
in Bujumbura.
ii. Ho2: There is no significant effect of price on sales performance of commercial banks in
Bujumbura.
iii. Ho3: There is no significant effect of place on sales performance of commercial banks in
Bujumbura.
iv. Ho4: There is no significant effect of promotion on sales performance of commercial
banks, Bujumbura.
1.7 Scope of the Study
1.7.1 Geographical Scope
This study was conducted in Bujumbura which is the capital city of Burundi. Bujumbura has ten
(10) commercial banks; however, the study was conducted in only four (4) commercial banks
because they are the largest and most dominant in the banking sector of Burundi. The banks are
listed in the table below.

8
Table 1.2: Location of Commercial Banks under Study
Bank Name Location/address
Interbank Burundi Located on Plot 15 Avenue de l‟Industrie
P.O. Box 2970
Bujumbura, Burundi
Banque Commerciale du Burundi (BANCOBU) Located on Plot 84, Chaussée P.L.
Rwagasore
P.O. Box 990
Bujumbura, Burundi
Burundi Bank of Commerce and Investment
(BBCI)
Located on Avenue du Peuple Murundi
P.O. Box 2320
Bujumbura, Burundi
Burundi Bank of Credit (BCB) Located on Avenue Patrice Lumumba
P.O. Box 300
Bujumbura, Burundi
1.7.2 Content Scope
The study was confined to marketing strategies (independent variable), which was measured
using product, price, place, and promotion. On the other hand, sales performance (dependent
variable) was measured using sales volume and profitability.
1.7.3 Times Scope
This study took a period of one (1) year, that is, from October, 2017 to October, 2018. This
period comprised of writing concept note, proposal, field data collection, data analysis and thesis
write up.
1.8 Significance of the Study
It is hoped that the findings of this study will be significant to policy makers because they will
have the capacity of being used to formulate positive fiscal policies which are relevant and
sensitive to the forces influencing the banking sector performance and penetration in Burundi.
In addition, the findings of this study will be instrumental to the government and particularly the
Ministry of Finance for making policy decisions whose overall objectives are to reduce
bottlenecks in distribution of banking services and at the same time accelerate the rate of growth

9
in the banking industry sector and take advantage of the improved economy thus more lending to
individuals and institutions.
Similarly, the results of this study will help the firms in the banking industry in formulating
marketing strategies that improve their effectiveness at national and international levels. The
stakeholders and employees in Burundi‟s banking sector would appreciate and prioritize
appropriate marketing strategies as tools of marketing positioning in local and international
markets.
Furthermore, this study will help in the management of commercial banks to evaluate how
effective they have been in adopting appropriate distribution channel strategies of their services
and products. This may enable them identify gaps in their strategies which may enhance their
strategic response as a result move to effectively manage the existing strategies which will
improve their sales performance.
Last but not least, the results of this study will help the academicians, scholars, and future
researchers to reference it as a source since it will contribute to the existing literature in the field
of marketing and sales performance.
1.9 Operational definition of key terms
Marketing Strategy: refers to the set of marketing tools used by an enterprise to achieve the
objectives of the adapted marketing in the particular marketing segment using product, price,
place and promotion strategies.
Product: refers to the ability of the commercial banks to offer a broad product line, offer
products with a broad market appeal, use of good packaging to influence perceived product
quality and the use of good product‟s brand image to influence profitability.
Price: refers to price strategies such as lower prices, discounts, and bonus packages used by
commercial banks to increase sales volumes subsequent increase in sales performance.
Place: refers to bank location, physical features, and product availability that influence customer
loyalty.

10
Promotion: refers to when banks use advertisements on various media platforms, and direct
marketing intended at attracting customers.
Sales volume: refers to the number of products or services sold by the commercial banks within
a given reporting period.
Profitability: refers to the ability of a commercial bank to use its resources and generate
revenues in excess of its expenses.

11
CHAPTER TWO
LITERATURE REVIEW
2.0 Introduction
This chapter looked at the literature regarding the study constructs reviewed from different
scholars and publications. The chapter will be subdivided into theoretical review, conceptual
review and empirical studies.
2.1 Theoretical Review
This study was anchored on the theory of Marketing Mix founded by Borden (1965) and
extended by (Kotler & Keller, 2006). The theory is premised on the assumption that all aspects
of the marketing plan are organized around the habits, desires and psychology of the target
market. The theory is still used today to make important decisions that lead to the
execution of a marketing plan. Marketing Mix Theory combines a number of components
in order to strengthen and solidify a product‟s brand and to help sell the product or service.
The components combined by this are products, price, promotion and place forming the Four
P‟s. These four P‟s are the parameters that the marketing manager can control, subject to the
internal and external constraints of the marketing environment. The goal is to make decisions
that centers the four P's on the customers in the target market in order to create perceived
value and generate a positive response.
The marketing mix framework was particularly useful in the early days of the marketing concept
when physical products represented a larger portion of the economy (Gronroos, 1994). Today,
with marketing more integrated into organizations and with a wider variety of products and
markets, some authors have attempted to extend its usefulness by proposing a fifth P, such as
packaging, people, process, etc. Today however, the marketing mix most commonly remains
based on the 4 P's. Despite its limitations and perhaps because of its simplicity, the use
of this framework remains strong and many marketing textbooks have been organized around
it.
This orientation considers marketing as it applies to the theory of the "4 Ps." The first P is
product, and takes into account its design, features and competitors. The second P, price, is a
factor that can be adjusted to manage demand, to determine profit margin, and to drive market

12
share. Promotion is the third P. It seeks to find which media to engage in order to make the right
people aware of the product's benefits, and which slogans, tag lines and logos will resonate with
the target market. Placement, the fourth P, determines where and how potential customers can
access the product. Young people may want to browse, buy and pay online. Others may prefer
the personal service of a trained salesperson (Išoraitė, 2016).
Later Robert (2000), proposed a four Cs classification in which is a more consumer-oriented
version of the four Ps that attempts to better fit the movement from mass marketing to niche
marketing. The Cs represents; Consumer, cost, communication and convenience. Firstly, a
company will only sell what the consumer specifically wants to buy. So, marketers should study
consumer wants and needs in order to attract them one by one with something he/she wants to
purchase. Secondly, Price is only a part of the total cost to satisfy a want or a need.
The total cost will consider for example the cost of time in acquiring a good or a service, a cost
of conscience by consuming that or even a cost of guilt "for not treating the kids. It reflects the
total cost of ownership. Many factors affect cost, including but not limited to the customer's cost
to change or implement the new product or service and the customer's cost for not selecting a
competitor's product or service (Richard, 2009). Thirdly, while promotion is manipulative and
from the seller, communication is cooperative and from the buyer with the aim to create a
dialogue with the potential customers based on their needs and lifestyles; it represents a broader
focus. Communications can include advertising, public relations, personal selling, viral
advertising, and any form of communication between the organization and the consumer.

13
2.2 Conceptual Review
The relationship between marketing strategies and sales performance among in the
commercial banks in Bujumbura, Burundi
Independent Variable
Source: Adapted from Gituma (2017), Kasiso (2017), and Muthengi (2017)
Fig 2.1: Showing the Conceptual framework
The independent variable of this study is the marketing strategies which are measured using the
4Ps that is, product, price, place and promotion. The dependent variable is sales performance
which has been measured using sales volume and profitability. The relationship between the two
variables is that when a customer uses the 4Ps as its marketing strategies, for instance, if a
banking institution provides products that are of good quality, unique and satisfactory to the
customers, there will be increase in sales volume and subsequent increase in profitability. In
addition, if a banking institution provides prices that are affordable for their products and
services, the customers will prefer to buy such products hence causing increase in sales volume
and high level of profits. In addition, if a banking institution is located in a place that is
accessible and secure for the customers to do their transactions, they will easily be satisfied with
the services and this will cause them to prefer buying such a service or product hence causing
increase in sales volume and subsequent increase in profitability. Lastly, if a banking institution
does promotion on different media platforms, it will increase customer awareness of the
availability of a given product or service, hence prefer to purchase it. This will cause increase in
sales volume. In the event that the customers are satisfied with the product or the service, they
will purchase more hence causing increase in the level of profitability for the banking institution.
Marketing Strategies
Product
Price
Place
Promotion
Sales Performance
Sales volume
Profitability
Dependent Variable

14
2.3 Review of Related Literature
2.3.1 Marketing Strategy
Marketing strategy is the fundamental goal of increasing sales and achieving a sustainable
competitive advantage (Silva, 2016). Marketing strategy includes all basic, short-term, and long-
term activities in the field of marketing that deal with the analysis of the strategic initial situation
of a company and the formulation, evaluation and selection of market-oriented strategies and
therefore contributing to the goals of the company and its marketing objectives (Gituma, 2017).
Marketing strategy allows firms to develop a plan that enables them to offer the right product to
the right market with the intention of gaining competitive advantage. A marketing strategy
provides an overall vision of how to correctly position products in the market place while
accounting for both internal and external constraints (Heiner & Muhlbacher, 2010).
According to Muthengi (2017), marketing strategy is a method of focusing an organization's
energies and resources on a course of action which can lead to increased sales and dominance of
a targeted market niche. A marketing strategy combines product development, promotion,
distribution, pricing, relationship management and other elements; identifies the firm's marketing
goals, and explains how they will be achieved, ideally within a stated timeframe. Furthermore,
Kasiso (2017) argues that marketing strategy determines the choice of target market segments,
positioning, marketing mix, and allocation of resources. It is most effective when it is an integral
component of overall firm strategy, defining how the organization will successfully engage
customers, prospects, and competitors in the market arena of corporate strategies, corporate
missions, and corporate goals. As the customer constitutes the source of a company's revenue,
marketing strategy is closely linked with sales. A key component of marketing strategy is often
to keep marketing in line with a company's overarching mission statement (Pembi et al., 2017).
2.3.1.1 The Effect of Product on Sales Performance
Product is defined as a physical product or service to the consumer for which he is willing to
pay. It includes half of the material goods, such as furniture, clothing and grocery items and
intangible products, such as services, which users buy (Cui & Tingjui, 2016). According to Bintu
(2017), a product is the first and one of the key marketing elements. Kotler and Armstrong
(2013) noted that product is anything that can be offered to a market for attention, acquisition,
use, or consumption hence satisfying customer‟s want or need. Ferri (2017) assert that product is

15
a marketing mix strategy in which organizations offers consumers symbolic and experiential
attributes to differentiate products from competitors. Gbolagade et al., (2018) researched on the
impact of marketing strategy on business performance in Nigeria and established a significant
influence between product and business performance. Similarly, Owomoyela et al., (2017)
researched on the impact of marketing mix elements on consumer loyalty. The findings revealed
that product had an influence on customer loyalty hence increase in performance.
Kiprotich (2018) noted that quality is an important element in the design and manufacture of
products which are considered superior to those of competitors. According to Ardjouman and
Asma (2015), customers increasingly expect products to be of high quality. Hence, product
quality is often considered to contribute to the development of a firm‟s competitive advantage.
Product quality is extent to which a product succeeds to meet the needs of its customer (Cavusgil
& Zou, 2014). Ebitu (2016) state that perceived quality refers to customer‟s evaluation of a
product or a brand that meet an individual‟s expectation.
According to Kisaka (2019), product quality, efficiency and business results affect firm
performance measures. Mahmood and Fatimah Hajjat (2014) researched on the effect of product
quality on business performance in some Arab Companies. A model was developed to illustrate
the product development stages from conception to distribution. The research analyzed data
using structural equation modeling techniques. Findings revealed that product extrinsic value
influences external performance and product intrinsic value influences internal performance.
Nirusa (2017) conducted a research on the mediating role of perceived product quality. Survey
was used on 105 firms. It was revealed that a relationship between organizational capability and
perceived product quality exists.
According to Onyango (2016), product package contains visual and sensual attributes which
communicate to consumers. A product package is a container that has a direct contact with the
product, protects, preserves and identifies the product. Good package design requires knowledge
of materials, their properties, manufacturing methods and conversion process (Njoroge, 2015).
Package design not only increases the visibility of the product it also helps in easy recognition of
the product. Furthermore, improvements in product packaging revitalize brands leading to
increase in sales (Immonen, 2010). Package designs has an effect on consumer belief about the

16
products and consumption beliefs leading to higher purchase decision and increase in sales
volume (Horsky & Honea, 2012).
According to Kotler (2015), product packaging is used to attract attention, describe the product
and clutter on retailer shelves hence motivates customers to purchase a product. Keramati (2015)
suggested that packages should be exciting and safe and of high quality. In addition, colors used
on the package should be perceived and associated with quality attributes. Edward (2013)
conducted a research on the influence of visual packaging design on perceived food product
quality, value, and brand preference. It was established that attitudes toward visual packaging
directly influence consumer-perceived food product quality and brand preference.
Holmes and Paswan (2012) conducted a research on consumer reaction to new package design.
Based on their study, it was suggested that a combination of product quality and price influences
customers purchase intention. Packaged goods that were priced low received less attention than
products that were highly priced. In addition, studies had also suggested that customer attitude
towards product package and quality influences their purchase decision to buy products that have
low prices (Holmes & Paswan, 2012).
Kamotho (2017) conducted a research on influence of packaging and labeling on consumer
perception of hair care products quality. The study used descriptive research design. Sixty hair
dressers and sixty salon customers were sampled. It was established that icon, symbols, font size
and patterns, usage instructions, country of origin and information were example of package
label attributes that customers looked for when buying a product. It was suggested that hair care
companies should put more emphasis on the product, package appearance and colors they use on
their package. Through this, hair care companies would be able to attract customer‟s attention
and influence purchase intention.
Rizwan et al., (2014) researched on the impact of product packaging on consumer‟s buying
behavior. The study found out that product packaging influenced consumer purchase decision. It
was concluded that packaging elements such as color, design of wrapper, packaging material
were factors consumers considered before purchasing a product. In a similar study, Saeed et al,
(2013) conducted an investigation on the effect of labeling on customer buying behavior in
Sahiwal, Pakistan. Quantitative research was used. Data was collected through survey. The study

17
sampled 100 customers. It was established that product labeling influenced consumer buying
behavior.
Apart from product packaging, Yi (2015) revealed that brand identity also influences band equity
thus creating customer appeal and visual image about a particular brand. Deborah (2016)
conducted a research on the effect of branding on organizational performance in the retailing of
pharmaceutical products and the mediating role of customers. It was revealed that branding had a
positive significant effect on organizational performance. Kim et al., (2003) conducted a research
on the effect of consumer-based brand equity on firm‟s financial performance. It was established
that brand loyalty, awareness and image had a significant positive effect on profitability whereas
brand quality had a negative effect on financial performance.
Similarly, Musibau et al, (2014) conducted a study on the effect of sales promotion and product
branding on company performance. The study sampled 60 employees. Data was collected using
survey questionnaires. Data was analyzed using chi-square. It was revealed that product branding
and sales promotion affect organizational growth. In addition, Kalemb (2015) investigated on the
contribution of branding in enhancing performance of tourism sector in Rwanda. Findings
revealed that there was a relationship between branding and tourism performance in Rwanda.
Wed (2016) carried out a study on the influence of brand identity on customer loyalty and sales
performance in local companies. It was revealed that brand identity had an influence on the
customers‟ loyalty and the sales performance.
Furthermore, Omotayo and Adegbuyi (2015) carried out a study strategic roles of branding on
organization sales performance. The study used a survey method. Structured questionnaires were
used to collect data from150 respondents. The results revealed that branding had a significant
influence on sales performance. Additionally, Christian et al., (2019) carried out a study on brand
awareness in business markets and effect on company performance. The results revealed that
brand awareness significantly affected market performance. Likewise, Wang et al., (2018)
investigated on the effect of knowledge management and brand equity on marketing
performance. Convenience sampling was used to select sample of 291 respondents. The study
revealed that brand equity had a significant effect on marketing performance.

18
Koh et al., (2019) carried out a study on the effect of brand recognition and brand reputation on
firm performance at U.S. based multinational restaurant companies. It was recognized that brand
reputation had a significant effect on a firm‟s value performance. Park et al., (2018) carried out a
similar study on the role of brand logos on firm performance. It was discovered that brand logo
significantly affected firm‟s performance. In the same way, Tsai et al., (2010) carried out a study
on the association between customer-based casino brand equity and firm performance. It was
shown that customer-based casino brand equity had influenced firm performance significantly.
However, a study done by Mei (2013) on brand identity, brand equity, and Performance showed
that brand equity; brand loyalty, perceived quality, and brand awareness did not have a positive
influence on an organization‟s performance.
2.3.1.2 The Effect of Price on Sales Performance
According to Kotler (2007), price is a cost of producing, delivering and promoting the product
charged. On the other hand, According pricing is understood as the process where an
organization determines what it will receive in exchange for its product after factoring in
manufacturing costs, market place, competition, market condition and quality of product.
According to Anderson et al., (2013), companies use pricing strategies such as; premium pricing,
value pricing, penetration pricing, cost plus pricing, competitive pricing, price skimming, going
rate pricing, geographical pricing, segmented pricing, product mix pricing, psychological pricing
and discriminatory pricing. Odhiambo (2013) researched on effect of pricing as a competitive
strategy on sales performance of pharmaceutical companies. It was established that pricing
strategy and decision has a significant effect on sales performance.
According to Nagle and Singlton (2017), value-based pricing is the process of setting price based
on customer perceived value of a product or service. Piercy et al., (2019) in their study found that
value-based pricing is the most profitable pricing strategy. This is because value-based pricing is
the price of a customer‟s next best alternative plus the value of differentiating features. Value-
based pricing is product driven and price is based on perceived product value (Nahring, 2011).
Value-based pricing is set by considering the value a product or service has on its target
customers. In other words, it is setting a price in relation to an offering‟s value (Nahring, 2011).
Deonir et al., (2017) conducted a research on pricing strategies and their impact on corporate
profitability. It was revealed that value-based pricing had a positive effect on profitability of an

19
organization. Liozu (2013) conducted a research on pricing orientation, pricing capabilities, and
firm performance. It was established that there was a positive relationship between value-based
pricing and firm performance. Andreas (2018) conducted a research on customer value-based
pricing strategies and why companies resist it by adopting a two-stage empirical approach. It was
revealed that deficits in value assessment; deficits in value communication; lack of effective
market segmentation; deficits in sales force management; and lack of support from senior
management are obstacles that hinder implementation of value-based pricing strategy. Füreder et
al., (2014) conducted a research on value-based pricing in Austrian medium-sized companies. It
was revealed that use of value based pricing enables a affirm generate more returns and create a
competitive advantage.
Similarly, Sije and Oloko (2013), explain that penetration pricing strategy is the process of
charging a low price to product or services hence penetrate the market. Sije and Oloko (2013)
noted that penetration pricing is used to support the launch of a new product, and when a product
enters a market with relatively little product differentiation and where demand is price elastic.
Spann et al., (2014) further expounds that penetration pricing is a technique of setting a low price
on a new product hence attracting customers to try company‟s products and services. Penetration
pricing is used when price of demanded product is at a level that will enable an organization
increase sales volume (Spann et al., 2014). For instance, De Toni et al., (2017) in their study
found out that higher sales volume leads to low unit costs and higher profits in the long run. The
study concluded that organizations price their products at a lower price assuming that the market
is price sensitive and that many companies price their products higher to “skim” the market.
Perminus and Wilson (2017) researched on effect of penetration pricing strategy on the
profitability of insurance firms in Kenya and found out that there was a positive relationship
between penetration pricing and firm profitability. According to Harmon and Raffo (2017),
penetration pricing is used by firms to increase their market share or sales volume. Firms also
use penetration pricing to speed up product adoption and as a competitive pricing strategy to
increase sales and reach a wider market share. For example, Njomo and Margaret (2016) carried
out a study on market penetration strategies and organizational growth among soft drink
companies and found out a significant and positive relationship between the variables. The study
concluded that penetration pricing leads to increase in sales volume and market share.

20
According to Matan (2016), organizations use penetration pricing strategy to price their products
or services lower than its normal price. Through this, an organization is able to gain market
acceptance, increase its market shares or discourage new competitors from entering the market.
Marn et al., (2003), postulated that use of very low price will make companies forego the
potential revenues and give customers a perception that the product is of low quality hence
making it difficult for companies to increase price of a product. In addition, products or services
charged very low makes it difficult for products to takeoff in the market (Golder & Tellis, 2004).
Mwaawaaru (2019) opines that price promotions include money-off coupons, pence-off flashes,
buy one get one free and extra fill packs. In addition, nowadays, price sensitive customers are
more aware of promotional activities and more active in searching for price promotional offers.
According to Zoellner and Schaefers (2015), price promotions have a strong effect towards
customers. It influences customers to buy one particular brand instead of another and to also
purchase it in greater quantities. On the other hand, Wang‟ondu (2016) speaks out that price
discount is the process of offering customer products at a reduced price from regular price of a
product. The author points out that price discount is used by organizations to induce product trial
and repeat purchases by new and current customers.
In order to substantiate the effect of price promotion strategies on sales performance, Bingqun et
al., (2016) carried out a study and found out that price promotion strategies affect sales
performance. Furthermore, Ajan (2015) conducted a research on effects of sales promotion on
purchasing decision of customer in Baskin Robbins Ice Cream Franchise in Thailand. The study
targeted customers in Bngkok and greater Bangkok area. The results revealed that price discount,
free sample and in store display influence product trial. Additionally, Burkow (2014) carried out
a study on evaluating temporary retail price discounts on sales performance, the results revealed
that price discounts increases sales performance.
2.3.1.3 The Effect of Place on Sales Performance
Place refers to distribution or the methods and location you use for your products or services to
be easily accessible to the target customers (Dang, 2014). Place strategy in marketing
incorporates the distribution by which a company puts its products and services in front of the
consumers. According to Harsono (2017), place strategy plays a fundamental role in the
marketing mix of a product or service. Place strategy outlines how and where a company will

21
place its products and services in an attempt to gain market share and consumer purchases. This
component of the 4Ps is sometimes referred to as the distribution strategy and may include
stores, both physical and online, and any other means by which the company can reach
customers (Harsono, 2017).
In addition, distribution channel is defined as a set of interdependent organizations involved in
the process of making a product or service available for consumption or use (Gorchels et al.,
2004). Distribution channel can also include physical movement, warehousing, ownership of the
product, presale transaction, post-sale activities; order processing, credit and collections; and
other different types of support activities (Ndungu'u, 2012). Distribution is the process of making
a product or service available for use or consumption by a consumer or business user, using
direct means, or using indirect means with intermediaries. Schoviah (2018) carried out a study on
the effect of marketing distribution channel strategies on a firm‟s performance among
Commercial Banks in Kenya. The study found out that marketing distribution strategies
increased sales, market share and profits.
Furthermore, Nashwan (2015) investigated on how marketing strategy influence firm
performance. The results indicated that distribution, promotion, pricing, and product
standardization and adaptation have an impact on sales, customer and financial performance of
firms. Similarly, Revino et al., (2015) in their study on the effect of distribution channel on sales
volume in Pt.Varia Indah Paramitha Manado found out that distribution channels had a positive
and significant impact on sales volume. Likewise, Ferri et al, (2017) made an investigation on
the effect of distribution channel innovation on the performance of Small and Medium
Enterprises. The results revealed that innovation in assortment; information sharing and
transportation coordination had positive and significant relationships with firm performance.
Additionally, Laswai (2017) carried out a study on the effectiveness of channels of distribution
models in the sales performance of an organization. The results indicated that distribution
channel had a positive influence on sales performance. Moreover, Chege et al., (2014)
investigated the effect of marketing capabilities and distribution strategy on sales performance of
MSP intermediary organizations‟ in Nairobi County, Kenya. The results of the study showed that
marketing capabilities and choice of distribution strategy significantly influences sales
performance.

22
In addition, Afzal (2019) investigated the distribution strategy and business performance in
emerging markets of Pakistan and found out that distribution strategy has an effect on business
performance. Also, Oladun (2012) carried out a study on innovative distribution strategies and
performance of multinational corporations (MNCs) and domestic manufacturing firms in
Nigeria. The results of the study showed that innovative distribution strategies have a significant
effect on performance.
According to Schiele (2018), geographic location has a significant influence on firm‟s profit
margin and success. This might be due to availability and proximity of raw materials and labor,
proximity to customers and competitors, infrastructure and transportation costs. Nguyen,
Morrison et al., (2011) conducted a research on geographic location, ownership and profitability
of Washington log trucking companies. The research used data from an extensive 2007 log
trucking survey. The study found out that ownership and geographic location has a positive
effect on profitability of the log trucking firm. In addition, firms anchored in clusters to form
focal points can achieve, on average, higher productivity than isolated business organizations and
consequently they can be more profitable (Nguyen et al., 2011).
According to Taylor (2018), businesses located in urban areas generate greater returns than those
located in rural areas. Paulin et al., (2018) noted that geographic location plays a big role in
survival of an organization. Edidijus and Per Von (2015) researched on the role of clusters in
innovation and performance of Small and Medium sized Technology Enterprises in Europe. It
was established that there was a positive relationship between geographical proximity between
firms and performance. Eze et al., (2015) conducted a research on the correlation between
business location and consumers patronage. The study used a survey design. 100 respondents
were sampled. Data was collected using structured questionnaire. The results indicated that
business location has a significant effect on business performance. The study concluded that
proximity of the business to customers influences repeat purchase.
According to Kotler and Armstrong (2012), retailers should be located near their target
customers thus ensuring accessibility. Retail stores located far away from their customers have a
negative effect on their purchase intention. It reduces frequency of customers visiting a store.
Krüger et al., (2011) conducted a research on location decision strategies for improving SME
business performance. The study targeted SMEs in the Nelson Mandela Metropole. The results
23
of the study indicated that there was a positive relationship between location and business
performance.
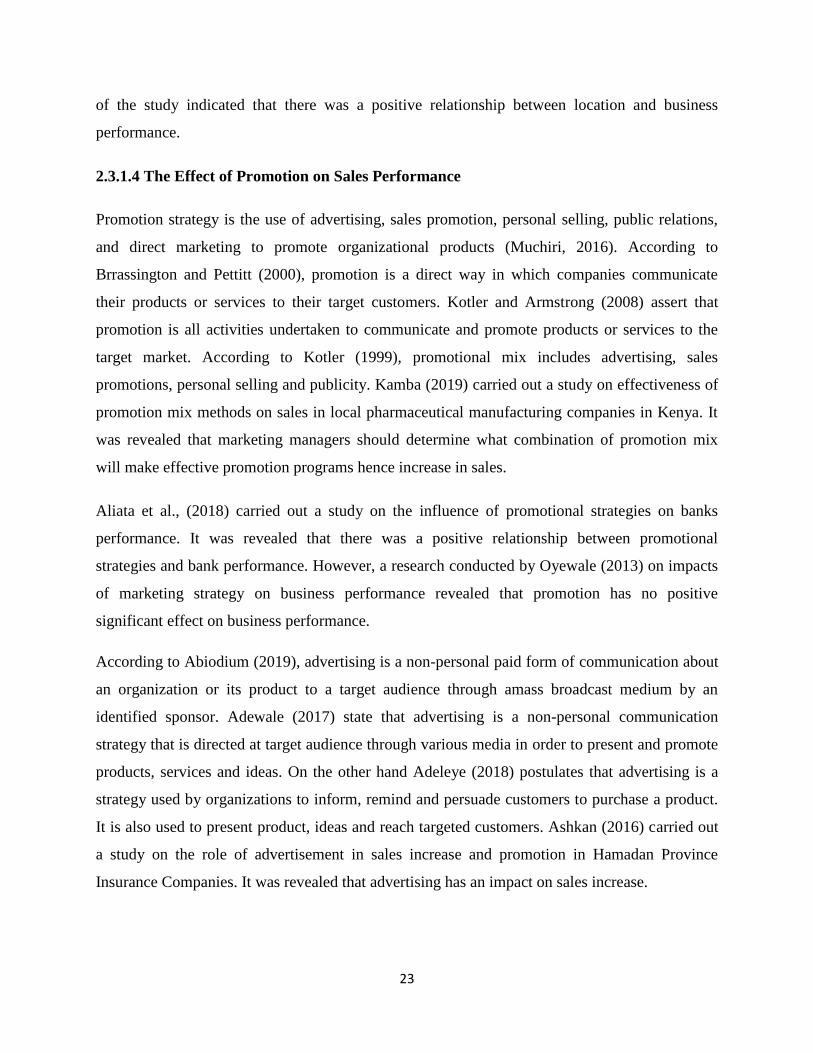
2.3.1.4 The Effect of Promotion on Sales Performance
Promotion strategy is the use of advertising, sales promotion, personal selling, public relations,
and direct marketing to promote organizational products (Muchiri, 2016). According to
Brrassington and Pettitt (2000), promotion is a direct way in which companies communicate
their products or services to their target customers. Kotler and Armstrong (2008) assert that
promotion is all activities undertaken to communicate and promote products or services to the
target market. According to Kotler (1999), promotional mix includes advertising, sales
promotions, personal selling and publicity. Kamba (2019) carried out a study on effectiveness of
promotion mix methods on sales in local pharmaceutical manufacturing companies in Kenya. It
was revealed that marketing managers should determine what combination of promotion mix
will make effective promotion programs hence increase in sales.
Aliata et al., (2018) carried out a study on the influence of promotional strategies on banks
performance. It was revealed that there was a positive relationship between promotional
strategies and bank performance. However, a research conducted by Oyewale (2013) on impacts
of marketing strategy on business performance revealed that promotion has no positive
significant effect on business performance.
According to Abiodium (2019), advertising is a non-personal paid form of communication about
an organization or its product to a target audience through amass broadcast medium by an
identified sponsor. Adewale (2017) state that advertising is a non-personal communication
strategy that is directed at target audience through various media in order to present and promote
products, services and ideas. On the other hand Adeleye (2018) postulates that advertising is a
strategy used by organizations to inform, remind and persuade customers to purchase a product.
It is also used to present product, ideas and reach targeted customers. Ashkan (2016) carried out
a study on the role of advertisement in sales increase and promotion in Hamadan Province
Insurance Companies. It was revealed that advertising has an impact on sales increase.

24
According to Olusegun (2016), advertising is used to inform customers about an existing product
or new product, maintain sales, attract new customers, introduce new packages and achieve a
competitive advantage. Akanbi and Adeyeye (2018) carried out a study on the association
between advertising and sales volume in Nigerian Bottling Company Plc Akanbi. It was found
out that a positive and significant correlation existed between advertising and the sales of the
company. In the same way, Agbeja et al., (2015) investigated on the effect of advertising on sales
and profitability of company. The study revealed that there was a significant effect between
advertising and profitability. Gan (2019) carried out a study on advertising effects on firm
performance in the Malaysian consumer products sector. It was established that there was a
positive relationship between advertising and firm performance.
Njawa (2015) conducted an investigation on the effects of advertising on organizational
performance in Tigo telecommunication network junior. The results indicated that advertising
has a significant influence on organizational performance. Dauda (2015) carried out a study on
the effect of advertising on the sales revenue and profitability of selected food and beverages
firms in Nigeria. It was fund out that there was a positive and significant relationship between
advertising and firm profitability. However, that study also revealed that there was no positive
significant relationship between advertising expenses and sales revenue of the companies. It was
recommended that the organization should not only concentrate on advertising to increase sales
revenue and firm profitability but that they should also use sales promotion, personal selling,
publicity.
Furthermore, Liban (2015) researched on the impact of advertisement on sales in
telecommunication companies in Somalia and found that advertising had a significant impact on
the sales volume. In addition Joshi et al., (2016) researched on the impact of advertising and
sales performance of Indian Telecommunication Companies. It was revealed that there exists a
significant positive relationship between advertising and sales performance. Nana et al., (2011)
conducted a research on the effect of marketing communications on the sales performance of
Ghana Telecom (Vodafone, Ghana). The study indicated that there was a strong relationship
between sales promotion, advertising budgets and total sales.
Kotler and Armstrong (2013) posit that another way of using promotion marketing strategy is by
the use of direct marketing. According to Magunga (2010) direct marketing is a direct
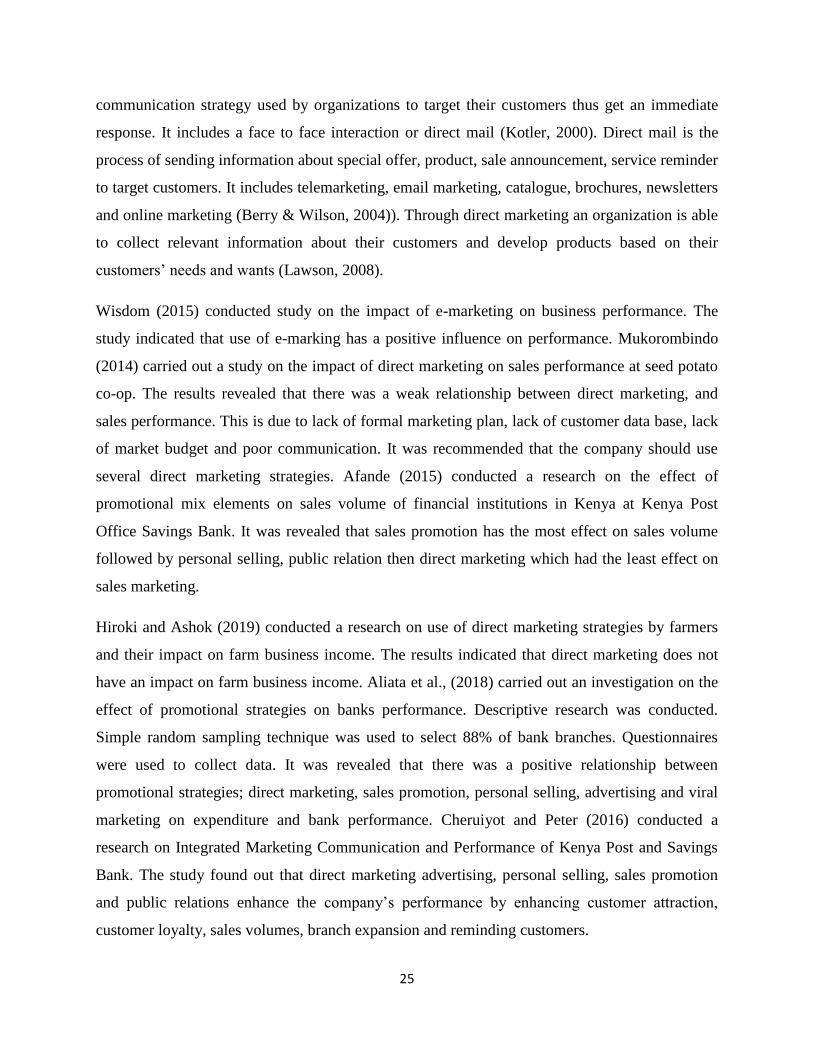
25
communication strategy used by organizations to target their customers thus get an immediate
response. It includes a face to face interaction or direct mail (Kotler, 2000). Direct mail is the
process of sending information about special offer, product, sale announcement, service reminder
to target customers. It includes telemarketing, email marketing, catalogue, brochures, newsletters
and online marketing (Berry & Wilson, 2004)). Through direct marketing an organization is able
to collect relevant information about their customers and develop products based on their
customers‟ needs and wants (Lawson, 2008).
Wisdom (2015) conducted study on the impact of e-marketing on business performance. The
study indicated that use of e-marking has a positive influence on performance. Mukorombindo
(2014) carried out a study on the impact of direct marketing on sales performance at seed potato
co-op. The results revealed that there was a weak relationship between direct marketing, and
sales performance. This is due to lack of formal marketing plan, lack of customer data base, lack
of market budget and poor communication. It was recommended that the company should use
several direct marketing strategies. Afande (2015) conducted a research on the effect of
promotional mix elements on sales volume of financial institutions in Kenya at Kenya Post
Office Savings Bank. It was revealed that sales promotion has the most effect on sales volume
followed by personal selling, public relation then direct marketing which had the least effect on
sales marketing.
Hiroki and Ashok (2019) conducted a research on use of direct marketing strategies by farmers
and their impact on farm business income. The results indicated that direct marketing does not
have an impact on farm business income. Aliata et al., (2018) carried out an investigation on the
effect of promotional strategies on banks performance. Descriptive research was conducted.
Simple random sampling technique was used to select 88% of bank branches. Questionnaires
were used to collect data. It was revealed that there was a positive relationship between
promotional strategies; direct marketing, sales promotion, personal selling, advertising and viral
marketing on expenditure and bank performance. Cheruiyot and Peter (2016) conducted a
research on Integrated Marketing Communication and Performance of Kenya Post and Savings
Bank. The study found out that direct marketing advertising, personal selling, sales promotion
and public relations enhance the company‟s performance by enhancing customer attraction,
customer loyalty, sales volumes, branch expansion and reminding customers.

26
Furthermore, Sales promotion is a strategy that is used by companies to promote sales, usage or
trial of a product or service. Organizations use sales promotion along with advertising, public
relations, and personal selling (Schiffman & Kanuk, 2004). Sales promotion is also used by
organizations to achieve a competitive advantage and influence their target customers to
purchase their products (Aderemi, 2003). Sales promotion is a media or non-media marketing
strategy used by organizational for a specific period of time to increase demand, productivity and
influence product trial. Oyedepo et al (2012) noted that sales promotion is an uninterrupted
incentive that offers an extra value or incentive for the product to the sales force, distributor, or
the final consumer with main objective of creating an immediate sale.
According to Mullin (2010), sales promotion is used by organizations to increase sales volume,
induce trial, increase repeat purchase, increase customer loyalty, increase product usage, create
interest, create awareness and create brand awareness. According to American Marketing
Association (2010), sales promotions is a media and non-media marketing pressures applied for a
predetermined time frame to different target audience, thus consumers, retailers and wholesalers
in order to stimulate trial, increase consumer demand and improve product viability. According
to Kotler (2003), sales promotion is a key ingredient in marketing campaigns and consists of a
diverse collection of incentive tools such as; coupons, rebates, samples and sweepstakes. It is a
short term strategy designed to stimulate quicker or greater purchase particular products or
services by consumers. According to research done by De Run and Jee, (2008), it was revealed
that use of sales promotion strategies will enable retailers and manufactures to attract more
customers and encourage them to try their products and services hence achieve their objectives.
Furthermore, Festus (2016) conducted a study on the impact of sales promotion on
organizational performance in Ghana Breweries Limited. It was revealed that there was a
positive and significant relationship between sales promotion and performance. Similarly,
Tandoh and Sarpong (2015) carried out an investigation on the impact of sales promotions on the
performance of Auto-Mobile Industries in Ghana. It was established that sales promotion has a
positive effect on organizational performance. Additionally, Dangaiso (2014) conducted a study
on the effects of sales promotion strategies on company performance of Auto-Mobile Industries
in Ghana, it was revealed that the use of sales promotional activities such; as bonuses, price and
contest sweepstakes has a positive influence on company performance.

27
Ibojo and Ogunsiji (2019) conducted a study on the effect of sales promotion as a tool on
organizational performance and found out that sales promotion has a positive effect on
organizational performance and sales volume of the organization. Syeda et al., (2018) conducted
a study on the impact of sales promotion on organizations‟ profitability and consumer‟s
perception in Pakistan. The study found out that sales promotion has a positive effect on brand
loyalty hence increase in organizational profitability. Furthermore, Adeniran (2016) carried out a
study on the effect of sales promotions on sales turnover in airlines industry in Nigeria. It was
established that sales promotions incentives has a positive impact on sales turnover in the airlines
industry. Osogbo (2014) conducted a research on effects of advertising on organizational
profitability. The study revealed that advertising has an effect on organizational profitability.
2.3.2 Sales Performance
As businesses grow more optimistic about opportunities for growth, the pressure is on for sales
organizations to meet ever-higher revenue targets. For these reasons, optimizing sales
performance in economy calls for a more rigorous and data-driven approach to foundational
sales processes, including strategic planning, territory allocation, resource planning and
compensation programming. Performance can be defined as the extent of actual work performed
by an individual or to what extent the actual work is shown by an individual (Richard, 2009). In
an era of intensifying competition and fierce negotiations with buyers, tactical selling approaches
simply don‟t work. The key to sales success is creating value the buyer is not currently
considering in their decision making.
Sales performance has been conceptualized to include both the outcome and behavioral
dimensions. Sales outcomes have always been seen by performance oriented sales people as
evidence to their behavioral performance and consequently a positive relationship has been
found to exist between job involvement component of commitment and sales performance. In
other words, committed sales people are expected to extend greater efforts on the job there by
having a direct effect on job performance (Silva, 2016). Richard (2009) defines performance
measures as the vital signs of the organization, which “quantify how well the activities within a
process or the outputs of a process achieve a specified goal”.
Performance measures help us understand, manage and improve what our organizations do.
Effective performance measures can let us know, how well we are doing, if we are meeting our

28
goals, if our customers are satisfied, if our processes are in statistical control, and if and where
improvements are necessary
2.3.2.1 Sales volume
Sales volume is the number of units sold within a reporting period (Ajagbe et al., 2015). This
figure is monitored by investors to see if a business is expanding or contracting. Within a
commercial bank, sales volume may be monitored at the level of the product, product line,
customer, subsidiary, or sales region. This information may be used to alter the investments
targeted at any of these areas. According to Adekoya (2011), a business may also monitor its
break even sales volume, which is the number of units it must sell in order to earn a profit of
zero. The concept is useful when sales are contracting, so that management can determine when
it should implement cost reductions. This can be a difficult concept to employ when there are
many different products, and especially when each product has a different contribution margin
(Iqbal et al., 2013).
According to Guesh (2010), the sales volume concept can be applied to services. For example,
the sales volume of a consulting firm may be considered the total number of hours billed in a
month. On the other hand, Soltani and Davanloo (2016) uphold that sales volume equals the
quantity of items a business sells during a given period, such as a year or fiscal quarter. Abah and
Olohiliye (2015) stress that sales volume indicate the quantity of different stock keeping units
sold or the number of customers who have sought for the services offered by a firm in a given
time period such a year or a fiscal quarter. Sales volume measurement is a vital part of the
performance evaluation of the sales force who are responsible for selling the products of the firm
(Abah & Olohiliye, 2015). Generally, sales representatives are incentivized on the basis of their
ability to meet their target. Since, a major part of the variable pay component depends on
achieving the target, sales volume is an important metric in sales and marketing among
commercial banks (Abah & Olohiliye, 2015).
According to Quarshie (2010), increased sales volume helps company to acquire healthy
revenue. Increased quantity sales mean increased production hence that also helps in increased
contribution margin. Moreover, increased sales volume helps to reach break-even earlier which
helps the company gain profits from their operation as early as possible (Quarshie, 2010). The

29
marketing relationship of costs and sales volume as profits helps a business to examine selling
prices, sales, production volumes, expenses, costs and profits. This analysis provides the
business with useful information that it can use for decision-making processes. According to
Frimpong (2016), the demand for a product will greatly influence the sales volume of the
product. The basic pricing strategy for a product attempts to maximize sales volume and profit.
This requires that a commercial bank must find the right price that will allow the product to sell
while allowing it to adequately profit from the sale (Pembi et al., 2017). Under a basic pricing
strategy, if the sales volume of a product is too low, the business will generally lower the price
point to increase sales. This will, however, also result in a reduced profit on the item for the
business. In many cases, lowering the price of a product will result in a higher sales volume
(Ajagbe et al., 2015).
2.3.2.3 Profitability
Profitability is the ability of a business to earn a profit (Wahlberg, 2017). Profitability is ability
of a company to use its resources to generate revenues in excess of its expenses. In other words,
this is a company‟s capability of generating profits from its operations (Pustelnik & Hallberg,
2013). Profitability is the primary goal of all business ventures. Asimakopoulos et al., (2013)
explains that without profitability a banking institution will not survive in the long run. So
measuring current and past profitability and projecting future profitability is very important.
Stierwald (2010) contends that profitability is one of the four building blocks for
analyzing financial statements and company performance as a whole. The other three are
efficiency, solvency, and market prospects. Investors, creditors, and managers use these key
concepts to analyze how well a company is doing and the future potential it could have if
operations were managed properly (Stierwald, 2010).
According to Gituma (2017), the two key aspects of profitability are revenues and expenses.
Revenues are the business income. This is the amount of money earned from customers by
selling products or providing services. Generating income is not free, however Gituma (2017)
maintains that businesses must use their resources in order to produce these products and provide
these services. Al-Nimer and Yousef (2015) reason that resources, like cash, are used to pay for
expenses like employee payroll, rent, utilities, and other necessities in the production process.
Therefore profitability looks at the relationship between the revenues and expenses to see how

30
well a company is performing and the future potential growth a company might have (Al-Nimer
& Yousef, 2015).
Profitability is measured by an income statement that maintains a record of income and expenses
over an interval of time (Adefulu, 2015). Businesses cannot survive without profitability, and a
highly profitable business rewards its owners with a considerable return on their investment.
According to Adefulu (2015), business managers are responsible for increasing a firm‟s
profitability, by subjecting each process under scrutiny, the aim is to point out changes that
improve profitability. These changes can be examined with pro forma income statement, also
referred to as, Partial Budget, allowing one to analyze the impact of these modifications on
profitability, before implementing it (Asimakopoulos et al., 2013).
According to Fitzsimmons et al., (2015), different decision tools or profitability ratios can be
employed to evaluate a bank‟s profitability. The tools include among others, profit margin, return
on assets and return on equity. According to Meriläinen (2015) profit margin is expressed in
percentage and can be assessed by dividing net income by revenue. Net income or net profit is
the remaining amount after subtracting company expenses from total revenue. Gross profit
margin, pre-tax profit margin, net margin, operating margin are different kinds of profit margins
commonly used during evaluation. Andersson and Wachtmeister (2016) claim that though it is
quite helpful in comparing the profitability of two different companies, it is necessary that both
these organizations have to be from the same industry, containing similar business models and
demonstrating the same revenue. A comparison otherwise would be inaccurate, and therefore,
redundant. In the case of companies that are losing money, the profit margin is inconsequential
as they are not generating any profit (Alharthi, 2016).
According to Baten and Kamil (2017), return on assets (ROA), also known as return on
investment (ROI), acts as an indicator of company profitability in relation to its total assets. It
reveals how efficient the management is in employing resources to its full potential, to generate
profit. ROA is denoted as a percentage and is calculated by dividing an organization‟s annual
earnings by its total assets (Akhmedjonov & Balci, 2015). In the case of public companies, ROA
varies significantly as they are quite dependent on the industry. Therefore, ROA, when used to
compare company profitability should be evaluated against past ROA numbers or ROA of an

31
analogous company. Higher ROA is the preferable result as it denotes that the business is
generating more revenue on less investment (Chavarin, 2016).
On the other hand, Return on Equity (ROE) is the ratio that assesses revenue generated by a
company in relation to investments made by equity holders (Alarcon & Sanchez, 2013). It is also
denoted as a percentage and measures a company‟s efficiency, indicating its capacity to generate
profit without much investment (Mungal, 2015). A higher ROE is a measurement of
management efficiency when utilizing investment. One should be aware that decrease in value of
shareholder‟s equity, for instance, write-downs or share buy-backs, boosts ROE number
mechanically. The same thing can be observed in cases of high debt. Therefore, to get accurate
ROE, comparisons should be made within the same industry, and evaluation (high or low) should
be achieved under the same context (Cardesjo & Lind, 2011).
2.4 Empirical Studies
A study by Gituma (2017) determined the effects of marketing mix on sales performance.
Descriptive and inferential statistics was used to analyze data. The study revealed that product
quality has a positive impact on sales performance, brand awareness influences organizational
performance, packaging is used to describe the product, brand image, and loyalty influences
company‟s profitability and pricing strategy increases sales volume. In addition, store design and
use of attractive stimuli such as music has an influence has a positive effect on consumer
purchase and sales volume, and geographic location and has a significant influence on
profitability, advertising, direct marketing and increases sales volume.
Muthengi (2017) conducted a study on the effects of marketing strategies on sales performance
of commercial banks in Kenya. The target population was the 43 commercial banks registered by
the Central Bank of Kenya. The researcher collected data using semi structured questionnaires.
The findings in this study showed an overall significance of the marketing variables adopted,
although not much effect was seen when a marketing variable was compared with bank
performance in isolation of other variables. This helped to conclude that the marketing strategies
techniques must be adequately combined in order to bring about improved performance. For
example, if a bank should engage in promotional activities without adequate knowledge of the
market, the aim of marketing will be defeated.

32
Kasiso (2017) conducted a study sought to establish the effects of marketing strategies on sales
performance of small and medium enterprises in Kenya. The study adopted a descriptive
research survey design. The study collected primary data using questionnaires. Data analysis
was done using Statistical Package for Social Sciences (SPSS version 21.0). The study
found out that considerable number of SMEs in Nairobi had adopted product development
strategies which resulted to a positive significant effect on the sales performance of small and
medium enterprises in Kenya. Pricing strategies too had a positive significant effect on the sales
performance of small and medium enterprises in Kenya. Similarly, promotional strategies had a
positive significant effect on the sales performance of small and medium enterprises in Kenya.
Furthermore, place strategies had a positive significant effect on the sales performance of small
and medium enterprises in Kenya. The study recommended that SMEs in Kenya should
continually embrace produce development strategy as this strategy provided a framework for
creating new products or improving the performance, cost or quality of existing products.
Ardjouman and Asma (2015) explored marketing management strategies adopted by small and
medium enterprises in Cote d‟Ivoire to improve their performances and established that
there is a high level of awareness of the significant roles played by marketing management
strategies in the performance of small and medium enterprises.
Pourhosseini and Zohre (2013) conducted a study to identify performance implications of
marketing strategy and moderating effects of transformational leadership, demand uncertainty
and competitive intensity on sales performance. The study was a mixed research that combined
qualitative and quantitative methods. The population entailed sales and marketing managers of
companies in food industries that were members of Tehran stock exchange. The sample size in
qualitative and quantitative study was 23 and 66 respectively. Analyses of survey and secondary
data provided evidence that marketing strategy had a positive and meaningful relationship on
sales performance while transformational leadership and competitive intensity were found to
exert moderating effects on this relationship.
Kiprotich (2018) did a study on effects of 4ps marketing mix on sales performance of automotive
fuels of selected service stations in Nakuru town. The research employed the research design
called questionnaire design. The oil marketers‟ performance is significantly influenced by the 4

33
ps. Each of the elements however carries a unique contribution to sales performance of
automotive fuels in the selected stations in Nakuru town.
Farshid (2011) looked at the influence of export marketing strategy determinants on firm export
performance between 1993-2010. They used the questionnaire research design. They discovered
that it is possible to design export marketing strategy determinants of export performance model,
which may help firm to focus on export marketing strategy elements as one of important
elements to enhance export performance in global markets.
On the other hand, Heiner and Mühlbacher (2010) studied Strategic marketing and business
performance in three European „engineering countries, they used the survey research design.
They found out that the key contradiction of the study is the low impact of market orientation on
financial performance, which is not assumed, as several previous studies propose the link to be
strongly positive. Also, this result is surprising in light of a recent, general development of
increased customer focus. Nevertheless, it is characteristic to market orientation that it also
contributes to the accumulation of other organizational resources and increases their value.
2.5 Literature Gap
A study by Gituma (2017) determined the effects of marketing mix on sales performance.
Marketing mix was measured using product quality, brand awareness, packaging, and brand
image, and sales performance was measured using profitability, hence presenting a content gap.
The current study closed the above gap by measuring marketing strategies using product, price,
place, and promotions; and sales promotions using sales volume and profitability.
Furthermore, Heiner and Mühlbacher (2010) studied strategic marketing and business
performance in three European „engineering countries. The above study presents a geographical
gap since the current study will be carried out in Burundi among the banking employees, and not
engineers.
Other studies by Muthengi (2017) and Kasiso (2017) have been done on the effects of marketing
strategies on sales performance of commercial banks in Kenya. The current study will look at the
commercial banks in Burundi hence closing a contextual gap.

34
CHAPTER THREE
METHODOLOGY
3.0 Introduction
This chapter comprises of the research design, target population, sample size, sampling
technique, data sources, data collection methods, data collection instruments, validity and
reliability, data collection procedure, data analysis, ethical considerations, limitations of the
study.
3.1 Research Design
Research design is a framework that is used by researchers to conduct research. This research
framework includes the procedures as well as the procedural framework necessary for obtaining
the data and information needed to structure and solve a research problem (Zikmund, 2012). This
study employed a cross-sectional study design. A cross-sectional study involves looking at
people who differ on one key characteristic at one specific point in time. The data is collected at
the same time from people who are similar in other characteristics but different in a key factor of
interest such as age, income levels, or geographic location (Sekaran & Bougie 2013). This
method is often used to make inferences about possible relationships or to gather preliminary
data to support further research. This study preferred cross-sectional design because it is usually
relatively inexpensive and allow researchers to collect a great deal of information quite quickly.
Data is often obtained using self-report surveys and researchers are then able to amass large
amounts of information from a large pool of participants (Shajahan, 2008). Furthermore, the
study used quantitative approach to gain better knowledge and understanding of the results.
Quantitative research relies on deductive reasoning with the help of questionnaires (Sekaran &
Bougie, 2010). In addition, the study supplemented quantitative approach using qualitative
approach where the use of key informant interviews was employed.
3.2 Target Population
The study targeted employees from the sales and marketing departments of the selected banks
because they were considered more informed of the study topic (i.e. marketing strategies and
sales performance). The researcher used systematic sampling to select target population of 337

35
staff from the selected commercial banks (Human Resource Annual Reports (2017) for IBB,
BANCOBU, BBCI and BCB). The sampled employees included departmental
managers/supervisors, and operational staff.
3.3 Sample Size
3.3.1 Quantitative Sample Size
Sample size is a smaller set of the larger population (Cooper & Schindler, 2014). The authors
argued that if well in the, a sample of between 10-30% of the population is adequate for
generalization of findings to the whole population. In the study, sample was determined using
Slovene‟s formula.
Where n=sample size; N=target population; α=level of significance at 0.05.
Table 3.1 gives the summary of the target population and sample size distribution as indicated
below.

36
Table: 3.1: Target Population and Sample Size Distribution
Bank Name Target
population
Sample size
Category of respondents Operational staff
Interbank Burundi (IBB) 93 51
Banque Commerciale du Burundi
(BANCOBU)
85 46
Burundi Bank of Commerce and
Investment (BBCI)
72 39
Burundi Bank of Credit (BCB) 87 47
Total 337 183
Source: Human Resource Annual Reports (2017) for IBB, BANCOBU, BBCI, and BCB
3.3.2 Qualitative Sample Size
This was derived from the managerial staff from the ten the commercial banks in Bujumbura.
Table: 3.2: Qualitative Sample Size
Banks Sample Size
Category of informants Department
manager
Interbank Burundi (IBB) 1
Banque Commerciale du Burundi (BANCOBU) 1
Burundi Bank of Commerce and Investment (BBCI) 1
Burundi Bank of Credit (BCB) 1
Total 4
Source: Human Resource Annual Reports (2017)
3.4 Sampling Technique
The researcher used simple random sampling to select the middle level staff. The entire process
of sampling was done in a single step with each subject in the independently of the other
members of the population. The researcher achieved this by writing the names of all the
respondents obtained from human resource departments in different pieces of papers. The names
of the respondents were then put in a big dish and shaken to ensure random mixture. The names
were randomly in the one at a time until a complete number of respondents were arrived at. This

37
method was preferred because of its non-biasness and inclusiveness. It gives every respondent
equal opportunity to participate in the study without any special considerations.
The purposive technique was used to select the managerial staff. This is because this category of
participants is considered more informed about the research topic and therefore would provide
relevant and in-depth information. Saunders, et al., (2012) posits that purposive sampling permits
the selection of a sample with bias to warrant inclusion of those informants who are most
suitable in providing important information to the study.
3.5 Data Source
This study was based on only primary source of data collection. This is because primary data are
likely to be more up-to-date than data obtained from published source.
3.5.1 Primary Source
The primary source was collected using questionnaires and Interviews.
3.6 Data Collection Methods
The study adopted survey questionnaires and interviews as the data collection methods.
3.6.1 Surveys
The study used survey method of data collection. The researcher preferred to use survey method
because it is good for gathering descriptive data, relatively easy to administer, cost effective and
time saving. This method was used to get information about marketing strategy and sales
performance departmental managers of the selected commercial banks in Bujumbura.
3.6.2 Interviews
The study also used key informant interviews where interview guides were distributed to the
managerial staff. The interview guide included the following main themes: marketing strategy
and sales performance. In the social sciences, interviews allow interviewers to study people in a
more natural setting than questionnaires (Mugenda & Mugenda, 2003).
3.7 Research Instruments
This study used questionnaires as its main research instrument and key informant interviews as
supplementary instrument.

38
3.7.1 Questionnaires
The researcher used closed ended questionnaires to collect data from the operational level staff
of the selected commercial banks in Bujumbura. The researcher preferred to use questionnaires
because large amounts of information can be collected from a large number of people in a short
period of time and in a relatively cost effective way. A five Likert scale was used to assess the
extent to which a respondent agree or disagree with a statement of an attitude, belief or
judgment; where 5=strongly agree, and 1=strongly disagree. The questionnaire was structured
into three sections; the first section captured information regarding the demographic
characteristics of the respondents in terms of gender, age, education level and work experience;
the second section captured information about marketing strategy which was measured using:
product (5 items), price (5 items), place (5 items), and promotion (7 items). The section captured
information regarding sales performance which was measured using sales volume (5 items) and
profitability (5 items)
3.7.2 Key Informant Interviews
This study employed structured face to face interviews to capture information about the
marketing strategy and sales performance from the departmental managers/supervisors of each of
the selected commercial banks in Bujumbura. The study employed interview guides which were
distributed during five working days of the week and the results were manually recorded using
pen and paper. The researcher preferred to use interview guides because they are useful for
obtaining detailed information about feelings, perceptions and opinions and respondents words
are recorded.
3.8 Validity and Reliability
This section contains information on how validity and reliability of the instrument were ensured.
3.8.1 Validity
Quantitative Data: This study used Content Validity Index (CVI) so as to establish the degree
to which a sample of items, taken together, constitutes an adequate operational definition of a
construct. According to Beck and Gable (2001), to examine the content validity, professional
subjective judgment is required to determine the extent to which the scale was designed to
measure a trait of interest. This is because content validity is a subjective judgment of experts
about the degree of relevant construct in an assessment instrument. However, inclusion of at least

39
five experts (mostly senior lecturers, associate professors, and professors) in that field or five to
ten experts would be useful to judge the content domains of a scale through use of rating scales
(Mugenda & Mugenda, 2003). The researcher achieved this by involving experts in the field of
human resource, specifically two (2) human resource managers from two commercial banks in
Kampala City. Their suggestions, expert opinions and recommendations were adjusted
accordingly and the following formula was used to substantiate it.
Where CVI=Content Validity Index
According to Amin (2005) if the CVI is ≥0.70, the items are considered valid; therefore, the
results of 0.91 index shows that the instrument was valid.
Qualitative Data: Validity under the qualitative model is exhaustively theorized into five
dimensions, that is, descriptive, interpretive, theoretical, generalizability and evaluative validity
although other dimensions are identified (Maxwell, 1992). However this study employed
interpretive validity. In order to ensure interpretive validity which resultantly enhances
trustfulness of the data, measure was taken to ensure that the interpretations reflect the
participants‟ perspectives, not the researcher‟s. The intention was to ensure that the participants‟
words and actions were interpreted rightly and without bias. To realize this, the data analysis was
exposed to an expert reviewer who was adequately knowledgeable about the subject matter and
context. This, in view of Saunders, et al., (2012), safeguards against a situation of "holistic
fallacy" where data or results have a habit of looking more patterned, consistent or similar than
they were and the tendency of the researcher to selectively note and record certain data at the
expense of other data.
3.8.2 Reliability
In order to ensure that the research instrument is reliable and can consistently produce reliable
data when administered, the researcher determined its reliability by measuring the internal
consistency of the instrument. This reliability analysis was conducted on the piloted survey

40
instruments prior to official data collection so as to ensure that the instruments provide reliable
data for the study. Test retest method of measuring reliability was used to conduct the pilot study
by the researcher to ensure that the instruments can provide consistent measurements. Five (5)
different samples (the middle level staff) from one commercial bank in Kampala City were in the
and the instruments were administered on them twice with a two weeks‟ interval, and the
obtained results were correlated using Pearson Linear Correlation Coefficient (PLCC).
According to Onen (2015), if the results of the pilot study are found to be consistent, the
instruments are assumed as reliable, otherwise not. Table 3.3 gives the summary of the pilot
study findings.
Table 3.3: Pearson Linear Correlation Coefficient
Variables correlated First pilot study Second pilot study
r-value Sig r-value Sig
Marketing Strategy Vs
Sales performance
0.71* 0.000 0.73* 0.001
*. Correlation is significant at the 0.05 level (2-tailed).
The results in table 3.2 shows that the r-value in the first pilot study was significant at 0.000 and
in the second study, it was significant at 0.001, hence a conclusion that there is consistency,
implying that the results are reliable
Furthermore, Cronbach‟s alpha was used in the actual study to determine the reliability of the
instruments. Cronbach‟s alpha measures the internal consistency that is, how closely related a set
of items are as a group. The higher the α-value, the more reliable the instruments were
considered. A commonly accepted rule for describing internal consistency using Cronbach‟s
alpha is as follows (Kline, 2000): table 3.4 gives the summary.

41
Table 3.4: Interpretation of Cronbach’s Alpha Results
Cronbach’s alpha Internal consistency
0.9 Excellent
0.9 > 0.8 Good
0.8 > 0.7 Acceptable
0.7 > 0.6 Questionable
0.6 > 0.5 Poor
0.5 > α Unacceptable
Table 3.5: Cronbach’s Results of the Pilot study
Variables tested Number of Items Cronbach’s alpha Interpretation
Marketing strategy 22 0.887 Good
Sales performance 10 0.857 Good
Overall 32 0.881 Good
The results of the findings from table 3.5 revealed Good and Acceptable reliability of the
instruments in the variables of marketing strategy and sales performance. It implies that majority
of the participants understood the questions and were able to interpret and answer it accordingly.
3.9 Data Gathering Procedure
An introduction letter was obtained from the College of Economics and Management of
Kampala International University, Uganda for the researcher to solicit approval to conduct the
study from the in the commercial banks in Bujumbura. During the administration of the research
instruments to the in the respondents; they were properly and adequately oriented on the study
and why it was being carried out. The respondents were requested to sign consent form. They
were also guided on how to fill the questionnaires, and the importance of answering every item
of the questionnaire without leaving any part unanswered. The respondents were requested to
kindly respond to the questionnaire on time. After retrieving them back, they were thoroughly
checked to ensure that all items were adequately answered by the respondents.

42
3.10 Data Analysis
Data analysis is the process where collected data is reduced to a more controllable and
convenient size, and a researcher can start to identify trends or patterns, apply statistical
techniques and give a summary of the data (Cooper & Schindler, 2006). Collected data was
sorted and coded. Statistical Package for Social Sciences (SPSS Vs, 22) was used to analyze
data. Descriptive and inferential research was used to analyze data. The researcher used
frequencies, mean, and standard deviations to analyze descriptive research. Infеrеntiаl statistics
is а technique used by researchers to study samples and make gеnеrаlizаtions about the
population (Zulfigar & Bala, 2016). The study analyzed inferential statistics using regression
analysis in order to determine the effect of product on sales performance; the effect of price on
sales performance; the effect of place on sales performance; and the effect of promotion on sales
performance. Multiple regression analysis was done to determine the variance of the predictor
variables on the dependent variable.
At a very basic level, the relationship between a continuous response variable (Y) and a
continuous explanatory variable (X) may be represented using a line of best-fit, where Y is
predicted, at least to some extent, by X. If this relationship is linear, it may be appropriately
represented mathematically using the straight line equation 'Y = α + βX'. In our study, sales
performance (SP) was predicted by marketing strategy (MS);
= α + + ………………………………………………. (I)
Objective one: To determine the effect of product on sales performance of in the commercial
banks in Bujumbura.
= α + + ………………………………………………. (II)
Objective two: To examine the effect of price on sales performance of in the commercial banks
in Bujumbura.
= α + + ………………………………………………. (III)
Objective three: To evaluate the effect of place on sales performance of in the commercial
banks in Bujumbura.

43
= α + + ………………………………………………. (IV)
Objective Four: To establish the effect of promotion on sales performance of in the commercial
banks, Bujumbura.
= α + + ………………………………………………. (IV)
Where; α=the value of SP when MS is equal to zero (also known as the intercept)
β= the slope of the line (also known as the regression coefficient)
The regression coefficient β describes the change in SP that is associated with a unit change in
MS.
Ɛ=Error Term [this is the error or disturbance term of an observed value which is a surrogate for
all the omitted variables in the regression model].
SP: Sale Performance
MS: Marketing Strategy
Pt: Product
Pr: Price
Pl: Place
Pm: Promotion
Decision Rule: The p-value was set at 0.05. If the p<0.05, the null hypothesis was rejected,
otherwise it was accepted. Furthermore, if the p<0.05, the effect of the IV on the DV was
considered significant, otherwise not.
Qualitative data was manually done by identification and transcription of recorded data into the
qualitative findings. There after analysis was conducted to identify categories and themes that
emerged from the data. The themes on each of the variables were coded and conceptually
organized, analyzed, evaluated and aligned to the researcher‟s objectives from which
interpretations was drawn, whereas the analysis of data was done concurrently with data

44
collection and the findings were used for further sampling, data collection, processing and
analysis (Mugenda & Mugenda, 2003).
3.11 Ethical Consideration
This study observed the following ethical considerations:
The researcher ensured quality and integrity by reporting only what she found in the field and
following a scientific and generalized report writing for academic research.
The researcher sought for informed consent from the respondents. This was done by requesting
the researcher to sign the informed consent form before participating in the study.
The researcher respected the confidentiality and anonymity of the research respondents by
involving them in the study in their own terms and place of convenience and coding their names
in the final report of the study.
The researcher ensured that participating in the study was voluntary. No one was coerced, forced
or bribed in order to be part of the study. The researcher also ensured voluntary withdrawal from
the study in case of change of mind by the respondent.
The researcher ensured that there was no harm to the participants in anyway. The study was done
in secure and well furnished rooms.
Last but not least, the researcher ensured that the final reporting was impartial and independent
of her personal opinion rather it was the opinion of the respondents that were used in the final
analysis of the research.
45
CHAPTER FOUR
DATA PRESENTATION, ANALYSIS AND INTERPRETATION
4.0 Introduction
This chapter presents the analysis of the data gathered and interpretation thereof. It gives the
demographic characteristics of the respondents and variables used.
4.1 Response Rate
The researcher had 183 respondents in total, however, 172 respondents participated successfully;
hence a participation rate of 94%. Amin (2004) believes that if the response rate is more than
70%, it signifies that the turn up of participants was good hence the data can be generalizable.
4.2 Demographic Characteristics of the Respondents
This section determines the demographic characteristics of the respondents. To achieve it,
questionnaires were distributed to capture these responses. Frequencies and percentage
distribution table was employed to summarize the demographic characteristics of the respondents
in terms of gender, age, education level, and work experience. Table 4.1 gives the summary of
the findings.

46
Table 4.1: Demographic Characteristics of the Respondents
Gender Frequency Percent (%)
Female 57 33.1
Male 115 66.9
Total 172 100.0
Age
20-29 21 12.2
30-39 48 27.9
40-49 99 57.6
50 years and above 4 2.3
Total 172 100.0
Education Level
Diploma 52 30.2
Degree 99 57.6
Masters 21 12.2
PhD 00 00.0
Total 172 100.0
Work Experience
1-5 years 22 12.8
6-10 years 62 36.0
More than 10 years 88 51.2
Total 172 100.0
Source: Primary data, 2018
The results presented in table 4.1 revealed that majority, 66.9% of the respondents were male,
while 33.1% were female. The dominance of the male respondents was attributed to the fact that
commercial banks prefer recruitment of men in technical jobs compared to the women.
Furthermore, majority, 57.6% of the respondents were within the age group of 40-49 years,
followed by 27.9% who were within the age group of 30-39 years, while the respondents within
the age group of 20-29 years and 50 years and above were represented by 12.2% and 2.3%
respectively. The dominance of the respondents within the age group of 40-49 years implies that
they are mature enough to stay and work for the company and reduce work turnover which
would imply seeking for better means of improving sales performance.

47
In addition, the results revealed that majority, 57.6% of the respondents were Bachelor Degree
holders, followed by 30.2% who were Diploma holders and 12.2% who were Masters Holders.
None of the respondents had a PhD. The dominance of the respondents with the Bachelor Degree
signifies that the banking institutions prefer to employ educated employees who understand the
importance of marketing strategy in scaling up sales performance.
Similarly, the study revealed that majority, 51.2% of the respondents had more than 10 years of
working experience, 36% of them had 6-10 years of experience while 12.8% had 1-5 years of
working experience. The dominance of the respondents with the working experience of more
than 10 years imply that the banking institutions prefer to recruit employees with high level of
experience in the industry for purposes of competitive advantage.
4.3 The Descriptive Statistics for Marketing Strategy
The independent variable which is marketing strategy was measured using product, price, place,
and promotions. The mean values were determined using the scores provided in the table below.
Furthermore, table 4.2 gives the summary of the mean values for marketing strategy.
Scale Mean Range Response Interpretation
5 4.21-5.00 Strongly agree Very Satisfactory
4 3.41-4.20 Agree Satisfactory
3 2.61-3.40 Not sure Fairly satisfactory
2 1.81-2.60 Disagree Unsatisfactory
1 1.00-1.80 Strongly disagree Very unsatisfactory

48
Table 4.2: Marketing Strategy
Marketing strategy Mean Std. Deviation Interpretation
Product
This bank‟s brand image has an influence on profitability. 3.96 .939 Satisfactory
This bank offers a broad product line. 3.92 .981 Satisfactory
This bank has products with a broad market appeal. 3.84 1.062 Satisfactory
This bank uses packaging strategy that influences consumer-
perceived product quality.
3.80 1.008 Satisfactory
This bank develops and tests its products to confirm their
adaptability and suitability to target customers.
3.23 1.121 Fairly
satisfactory
Average mean 3.75 1.022 Satisfactory
Price
This bank uses free samples and bonus packs to increase its
sales performance.
4.10 .953 Satisfactory
This bank uses pricing strategy to increase its sales volume. 4.09 .913 Satisfactory
This bank offers products which are lower in prices
compared to market segments.
3.94 1.058 Satisfactory
This bank uses penetration pricing to increase product
adoption.
3.93 1.046 Satisfactory
This bank uses price discount to influence its sales
performance.
3.88 1.002 Satisfactory
Average mean 3.99 0.994 Satisfactory
Place
This bank‟s exterior and interior appearance is appealing to
customers.
3.68 .822 Satisfactory
This bank uses attractive stimuli such as music to influence
its customers.
3.66 .833 Satisfactory
This bank is located in an area that increases its chance for
sales performance.
3.63 .780 Satisfactory
This bank‟s distribution channels influence its product
availability.
3.48 .827 Satisfactory
This bank is located in an area that is accessible to customers. 3.45 .951 Satisfactory
Average mean 3.58 0.843 Satisfactory
Promotion
This bank offers price discounts and coupons. 3.99 1.071 Satisfactory
This bank uses advertising to present its product and ideas. 3.69 1.137 Satisfactory
The use of direct marketing at this bank has led to an increase
in profit.
3.67 1.029 Satisfactory
Advertising has increased sales at this bank. 3.65 1.149 Satisfactory
The use of sales promotion has increased brand loyalty of
this bank.
3.20 1.144 Fairly
satisfactory
This bank advertises its products through various media
platforms.
3.15 1.289 Fairly
satisfactory
This bank uses personal selling and publicity to promote their
products
2.82 1.405 Fairly
satisfactory
Average mean 3.45 1.175 Satisfactory
Overall average mean 3.63 1.016 Satisfactory
Source: Primary data, 2018

49
The results presented in table 4.2 revealed that respondents assessed product which is a
determinant of marketing strategy as satisfactory (Average mean=3.75, Std=1.022). This was
attributed to the fact that majority of the respondents agreed that their banks‟ brand image have
influence on profitability (mean=3.96, Std=0.939). The respondents also agreed that their banks
offer a broad product line (mean=3.92, Std=0.981). In addition, respondents agreed that their
banks have products with a broad market appeal (mean=3.84, Std=1.062). Furthermore,
respondents agreed that their banks use packaging strategy that influence consumer-perceived
product quality (mean=3.80, Std=1.008). However, respondents were not in full agreement that
their banks develop and test their products to confirm their adaptability and suitability to target
customers (mean=3.23, Std=1.121).
The above responses imply that a commercial bank‟s product strategy is the way a firm competes
in the market and improve its total performance. This is because product strategy is the single
most important component of marketing strategy and is regarded as a blueprint for marketing
resources allocation toward realizing the objectives of the firm, which is sales, financial and
customer performance. To keep consistent performance, commercial banks must therefore
regularly adjust their marketing strategies to conform to changes in the markets with the aim of
enduring responsiveness to their operating marketplace. Thus far, product adaptation is a suitable
strategy toward market responsiveness as it offers the development of new products that meet the
needs of a changing marketplace.
Furthermore, table 4.2 revealed that price as a determinant of marketing strategy was assessed by
the respondents as satisfactory (average mean=3.99, Std=0.994). This was attributed to the fact
that majority of the respondents agreed that their banks use free samples and bonus packs to
increase their sales performance (mean=4.10, Std=0.953). Additionally, the respondents agreed
that their banks use pricing strategy to increase their sales volume (mean=4.09, Std=0.913).
Accordingly respondents agreed that their banks offer products which are lower in prices
compared to market segments (mean=3.94, Std=1.058). Similarly, respondents agreed that their
banks use penetration pricing to increase product adoption (mean=3.93, Std=1.046) and price
discount to influence their sales performance (mean=3.88, Std=1.002).
The above responses imply that the commercial banks do their best to promote their services and
products. They employ notably free samples, bonus packs, discounts, and penetration pricing so

50
as to be competitive in the market and increase the chances of improvement in sales
performance. Indeed an acceptable price change is determined by the buyer‟s willingness and
ability to purchase a product, and the bank‟s cost of producing and distributing the product. Over
the years, banks have also incorporated price discrimination in their services to attract different
classes of customers and accommodate all types of clients with their numerous products and
services so as to increase their sales performance.
Furthermore, the findings in table 4.2 revealed that place as a determinant of marketing strategy
was assessed by the respondents as satisfactory (average mean=3.58, Std=0.843). This was
attributed to the fact that majority of the respondents agreed that their banks‟ exterior and interior
appearance is appealing to customers (mean=3.68, Std=0.822). Other respondents agreed that
their banks use attractive stimuli such as music to influence their customers (mean=3.66,
Std=0.833). In addition, respondents agreed that their banks are located in areas that increase
their chance for sales performance (mean=3.63, Std=0.780). Similarly, respondents agreed that
their banks‟ distribution channels influence their product availability (mean=3.48, Std=0.827).
Additionally, respondents agreed that their banks are located in areas that are accessible to
customers (mean=3.45, Std=0.951).
The above responses signify the importance of the location of a bank so as to be attractive,
appealing and accessible to the customers. This is why most of the commercial banks in Burundi
have their headquarters located in the capital city of Bujumbura where the population is big and
many people are able to access their banks‟ services. This is because the location of a firm in
relation to its target market will influence the performance of the firm because of the cost of
delivering the goods and services to consumers. It is very critical that commercial banks
select a location that will serve the customers in a cost-effective manner to reduce on the
overheads.
Furthermore, the findings in table 4.2 revealed that promotion as a determinant of marketing
strategy was assessed by the respondents as satisfactory (average mean=3.45, std=1.175). This
was attributed to the fact that majority of the respondents agreed that their banks offer price
discounts and coupons (mean=3.99, Std=1.071). In addition, respondents agreed that their banks
use advertising to present their products and ideas (mean=3.69, Std=1.137), and use direct

51
marketing to increase profits (mean=3.67, Std=1.029). Similarly respondents agreed that due to
advertising, there has been an increase in the sales at their banks (mean=3.65, Std=1.149).
However, respondents were not in full agreement that the use of sales promotion led to increased
brand loyalty of their banks (mean=3.20, Std=1.144). Furthermore, respondents were not in full
agreement that their banks advertise their products through various media platforms (mean=3.15,
Std=1.289) and also use personal selling and publicity to promote their products (mean=2.82,
Std=1.405).
The above responses imply that most of the commercial banks have understood the relevance of
promotions as a marketing strategy since it enables them to reach as many customers as possible.
One of the most profound methods used by commercial banks have been advertising. This is
because, this method is a means in which commercial banks employ to differentiate themselves
from other competitors. They relay information about their different products and services and
the different benefits one gets if they did business with them. Indeed promotion is important
because, after developing a product, setting the best market price and identifying an
appropriate channel for distribution, a commercial bank must promote it to potential
buyers. This is because it is essential for commercial banks to notify the potential customers
about the product‟s obtainability or to inform the consumer, using promotion media such as
radio, print, or television. However, commercial banks must cautiously survey each and every
substitute medium and assess not only the costs but also the effectiveness of the medium in
meeting the set objectives.
All in all, the results in table 4.2 revealed that marketing strategy was assessed by the
respondents as satisfactory (overall average mean=3.63, Std=1.016). This was attributed to the
fact that all the determinants of marketing strategy which were assessed in this study were all
found to be satisfactory. In other words, price, product, place and promotion, were all found to
be satisfactory. This implies that commercial banks have appreciated the value of employing
marketing strategies in their businesses so as to promote sales performance through customer
attraction and retention and eventual loyalty.
Furthermore, the researcher also asked the key informant interviews (i.e. department
managers/supervisors) of the most common marketing strategies they have been using in their

52
banks which is different from the ones captured in the quantitative results, and why the
preference for such strategies. Their responses were summarized as below:
As a bank, we are offering a feature that no other competitors have. We are doing this
using the new technology equipment that we secured last year. The equipment makes it
much easier for our customers to handle their financial transactions online using their
smartphones. It is through this tool that we create a marketing campaign intended to
meet their needs (Bank C, Manger, 13th
August, 2018).
Over the past five years, we have been sending our employees abroad to further their
studies and be able to come back with knowledge and ideas that set us apart from our
competitors. So far we have more than 70 employees well trained and knowledgeable of
the banking industry and how to handle customers. They have been able to come up with
good customer care services that are quick, timely and quality. This has so far increased
the number of customers that we have compared to the beginning years of establishment
(Bank A, Manager, 17th
August, 2018).
This bank is currently providing different packages for farmers, widows, youths, school
fees, teacher loans, and business loans to diversify the market segment. The bank is also
doing its corporate social responsibility by drilling boreholes for the communities,
digging pit latrines for the local masses in the rural areas, renovating dilapidated
schools and hospitals to make such social services affordable and nearer to the people
while at the same time educating the population about the importance of banking (Bank
B, Manager, 15th
August, 2018).
We have embarked on promotional activities in partnership with telecommunication
companies and mainstream media. We are offering competition prices where any person
who banks with us and has a minimum of BIF 50,000 stands a chance of winning a jack
pot price of BIF 100,000,000million. I can assure you, before, this campaign, very few
customers used to have a minimum of BIF50,000 in their account, but currently we have
more than 10,000 customers with a minimum of BIF100,000 in their accounts (Bank D,
Manager, 16th
August, 2018).

53
The above responses indicate that commercial banks have been using different marketing
strategies to remain afloat in the business. This is because the benefits of setting a clear
marketing target are evident to the sales performance of a financial institution. First, it aims at
giving the staff a clear sense of direction in terms of where the business is going and what is
expected of them. Secondly, it‟s useful when evaluating the success of the business. The third
benefit is that it will ensure that all the efforts and actions are focused on obtaining the set
objectives and lastly, it will help motivate the staff both leaders and their team and also help
reward them when the project is completed. Therefore, given the relevance of marketing
strategies to the survival of the banking institutions, they must as a result set aside a significant
portion of their budgets on marketing to ensure that the company experiences an exponential
growth in the sales.
4.4 The Descriptive Statistics for Sales Performance
The dependent variable which is sales performance was measured using sales volume and
profitability. The mean values were determined using the scores provided in the table below.
Furthermore, table 4.3 gives the summary of the mean values for sales performance.
Scale Mean Range Response Interpretation
5 4.21-5.00 Strongly agree Very Satisfactory
4 3.41-4.20 Agree Satisfactory
3 2.61-3.40 Not sure Fairly satisfactory
2 1.81-2.60 Disagree Unsatisfactory
1 1.00-1.80 Strongly disagree Very unsatisfactory

54
Table 4.3: Sales Performance
(n=172)
Sales Performance Mean Std. Deviation Interpretation
Sales Volume
The sales volume of this bank‟s products increased
because of good marketing strategies.
3.94 1.069 Satisfactory
The sales volume of this bank‟s services increased
because of employee responsiveness to customer
complaints.
3.88 1.093 Satisfactory
The sales volume of this bank‟s products increased
because of quality.
3.76 1.122 Satisfactory
The sales volume of this bank‟s products increased
because of customer satisfaction.
3.73 1.190 Satisfactory
The sales volume of this bank‟s products has been
increasing in the past 5 years.
3.03 1.335 Fairly
satisfactory
Average mean 3.67 1.162 Satisfactory
Profitability
The sales of this bank‟s products have been increasing in
the past 5 years.
4.09 .904 Satisfactory
The return on investment of this bank has been
increasing in the past 5 years.
3.68 1.203 Satisfactory
The return on equity of this bank has been increasing in
the past 5 years.
3.66 1.093 Satisfactory
The profit margin of this bank has been increasing in the
past 5 years.
3.42 1.270 Satisfactory
The return on assets of this bank has been increasing in
the past 5 years.
3.35 1.127 Fairly
satisfactory
Average mean 3.64 1.119 Satisfactory
Overall Average Mean 3.66 1.141 Satisfactory
Source: Primary Data, 2018
The results indicated in table 4.3 revealed that majority of the respondents assessed sales volume
of the commercial banks in Burundi as satisfactory (average mean=3.67, Std=1.162). This was
attributed to the fact that majority of the respondents agreed that the sales volume of their banks‟
products increased because of good marketing strategies (mean=3.94, Std=1.069), increased
because of employee responsiveness to customer complaints (mean=3.88, Std=1.093), increased
because of quality (mean=3.76, Std=1.122) and because of customer satisfaction (mean=3.73,
Std=1.190). However, the respondents were not in full agreement that the sales volume of their
banks‟ products has been increasing in the past 5 years (mean=3.03, Std=1.335)

55
Furthermore, the study revealed that majority of the respondents assessed the profitability of the
surveyed commercial banks as satisfactory (average mean=3.64, Std=1.119). This was attributed
to the fact that majority of the respondents agreed that the sales of their banks‟ products
(mean=4.09, Std=0.904), the return on investment of their banks‟ products (mean=3.68,
Std=1.203), the return on equity of their banks‟ products (mean=3.66, Std=1.093) and the profit
margin of their banks have been increasing in the past 5 years (mean=3.42, Std=1.270).
However, they were not in full agreement that the return on assets of their banks have been
increasing in the past 5 years (mean=3.35, Std=1.127).
Generally the study revealed that sales performance was assessed by the respondents as
satisfactory (overall average mean=3.74, Std=1.072). This was attributed to the fact that all the
determinants of sales performance as indicated in table 4.6 were all assessed as satisfactory. This
implies that the sales performance of the surveyed commercial banks in Burundi is explicit
because of the good marketing strategies being employed.
Furthermore, the researcher asked the key interview informants of what had been their sales
performance in the past five years and what could have been the contributing factors. Their
responses were summarized as below:
The bank has been gradually increasing its sales performance mostly in profitability.
However, given the tough economy in the country and interference from the central bank,
return on investment has been slow (Bank B, Manager, 15th
August, 2018).
We have been realizing some good sales in terms of sales volumes for our different
products. We injected a lot in promotional activities that is why there has been a good
improvement in our sales in the past five years (Bank A, Manager, 17th
August, 2018).
The institution has been dragging in some areas of its sales performance. The
competition is rough and the economy is weak, so much of the return on assets has been
low including poor recovery of loans. But nonetheless we are expecting better
performance with time (Bank C, Manger, 13th
August, 2018).

56
Yea, what can I say, there have been good and bad times in the past five years. The good
times made us realize good sales performance because we introduced a promotional
strategy that attracted most customers and caused customer satisfaction and loyalty.
However, some of the bad times was when we lost some of our key performing employees
in a tragic accident (Bank D, Manager, 16th
August, 2018).
Additionally, the researcher asked the key interview informants of what they expect to achieve in
their sales performance in the next five years. Their responses were summarized as below:
We have started to open new branches across the country including rural areas to trap
and attract the unbanked rural masses. We believe this move will help us achieve better
sales performance in the next five years (Bank C, Manger, 13th
August, 2018).
The institution has opened a new department for research, innovation and development.
This is intended to create services and products that meet the needs and demands of
different customer segments in the country. This will help capture as many customers as
possible hence we are sure that the next five years will be good in terms of sales
performance (Bank D, Manager, 16th
August, 2018).
The institution intends to diversity its investments in agriculture, real estates, and gold
products. This in turn is expected to provide alternative sources of income to the bank
and also increase its sales in terms of return on investments. The next five years must be
bright indeed for our bank (Bank A, Manager, 17th
August, 2018).
We are working on coming ways to partner with other institutions in the private sector so
as to bank and transact with us. So far we have up to 120 institutions but we have a
target of working with at least 350 institutions in the next five years. If this is achieved,
we expect our sales performance to drastically improve (Bank B, Manager, 15th
August,
2018).

57
4.5 The Effect of Product on Sales Performance in the Commercial Banks in Bujumbura
The first objective of this study was to determine the effect of product on sales performance in
the commercial banks in Bujumbura. Table 4.4 gives the summary of the findings.
Table 4.4: The Effect of Product on Sales Performance in the Commercial Banks in
Bujumbura
Product Standardized Coefficients
Beta (β)
Significance
(p)
Adjusted R2=0.001 0.084 0.276
F=1.195, p=0.276
Dependent Variable: Sales Performance
The results in table 4.4 revealed that product as a marketing strategy does not significantly affect
sales performance among commercial banks in Burundi (Adjusted R2=0.001, p=0.276).
Testing the Hypothesis (Ho1): the level of significance (p-value) is tested at 0.05. If the p-value
is ≤ 0.05, the null hypothesis is rejected; otherwise if the p-value is ≥ 0.05, the null hypothesis is
accepted. As in the case of this study, the p-value was > 0.05, thus upholding the null hypothesis
that there is no significant effect of product on sales performance of commercial banks in
Bujumbura. This implies that the commercial banks have not put much effort into setting their
products in such a way that are attractive and appealing to the customers. This is because
products and services such as deposits, checking account services, business, personal and
mortgage loans, certificates of deposit (CDs) and savings accounts to individuals and small
businesses if well packaged and branded can influence the profitability of a commercial banking
institution.
Furthermore, the study found that the regression model was not the best fit for predicting the
effect of product on sales performance (F=1.195, p=0.276). Similarly, the study revealed that
every unit change in a product would cause a variance of 8.4% in sales performance
(Beta=0.084, p=0.276). However, this change is so small and negligible since it does not
contribute significantly to the changes in sales performance.

58
4.6 The Effect of Price on Sales Performance in the Commercial Banks in Bujumbura
The second objective of this study was to examine the effect of price on sales performance in the
commercial banks in Bujumbura. Table 4.5 gives the summary of the findings.
Table 4.5: The Effect of Price on Sales Performance in the Commercial Banks in
Bujumbura
Price Standardized Coefficients
Beta (β)
Significance
(p)
Adjusted R2=0.002 0.087 0.255
F=1.304, p=0.255
Dependent Variable: Sales Performance
The results presented in table 4.5 revealed that price as a marketing strategy used by the
commercial banks of Burundi does not significantly affect sales performance (Adjusted
R2=0.002, p=0.255).
Testing the Hypothesis (Ho2): the level of significance (p-value) is tested at 0.05. If the p-value
is ≤ 0.05, the null hypothesis is rejected; otherwise if the p-value is ≥ 0.05, the null hypothesis is
accepted. As in the case of this study, the p-value was > 0.05, thus upholding the null hypothesis
there is no significant effect of price on sales performance of commercial banks in Bujumbura.
This implies that the commercial banks have not adequately exploited the relevance of price in
their businesses. They may not be giving into price strategies such as providing bonus packs to
customers, lowering prices where necessary and when necessary, or offering discounts to
potential customers, thus the inability to realize any improvement in sales performance.
Additionally, the study found that the regression model was not the best fit for predicting the
effect of price on sales performance (F=1.304, p=0.255). In the same way, the study revealed
that every unit change in a price would cause a variance of 8.7% in sales performance
(Beta=0.087, p=0.255). However, this change is so insignificant that it does not contribute to the
changes in sales performance.

59
4.7 The Effect of Place on Sales Performance in the Commercial Banks in Bujumbura
The third objective of this study was to evaluate the effect of place on sales performance in the
commercial banks in Bujumbura. Table 4.6 gives the summary of the findings.
Table 4.6: The Effect of Place on Sales Performance in the Commercial Banks in
Bujumbura
Place Standardized Coefficients
Beta (β)
Significance
(p)
Adjusted R2=0.043 0.220 0.004
F=8.608, p=0.004
Dependent Variable: Sales Performance
The results in table 4.6 revealed that place as a marketing strategy used by the commercial banks
of Burundi significantly affect the variance in sales performance by 4.3% (Adjusted R2=0.043,
p=0.004).
Testing the Hypothesis (Ho3): the level of significance (p-value) is tested at 0.05. If the p-value
is ≤ 0.05, the null hypothesis is rejected; otherwise if the p-value is ≥ 0.05, the null hypothesis is
accepted. As in the case of this study, the p-value was < 0.05, thus rejecting the null hypothesis
that there is no significant effect of place on sales performance of commercial banks in
Bujumbura and therefore upholds the alternative hypothesis. This is because when the banks use
the marketing strategy of beautifying the exterior and interior appearance of the bank, being in an
accessible location, and having a distribution channel that is often available, then sales
performance will highly likely be realized. Moreover, the study found that the regression model
was the best fit for predicting the effect of place on sales performance (F=8.608, p=0.004). In the
same way, the study revealed that every unit change in a place would cause a significant variance
of 22% on sales performance (Beta=0.220, p=0.004).
4.8 The Effect of Promotion on Sales Performance in the Commercial Banks in Bujumbura
The fourth objective of this study was to establish the effect of promotion on sales performance
in the commercial banks in Bujumbura. Table 4.7 gives the summary of the findings.

60
Table 4.7: The Effect of Promotion on Sales Performance in the Commercial Banks in
Bujumbura
Promotion Standardized Coefficients
Beta (β)
Significance
(p)
Adjusted R2=0.058 0.253 0.001
F=11.622, p=0.001
Dependent Variable: Sales Performance
The results presented in table 4.7 revealed that promotion as a marketing strategy used by
commercial banks significantly affect sales performance by a variance of 5.8% (Adjusted
R2=0.058, p=0.001).
Testing the Hypothesis (Ho4): the level of significance (p-value) is tested at 0.05. If the p-value
is ≤ 0.05, the null hypothesis is rejected; otherwise if the p-value is ≥ 0.05, the null hypothesis is
accepted. As in the case of this study, the p-value was > 0.05, thus rejecting the null hypothesis
that there is no significant effect of promotion on sales performance of commercial banks in
Bujumbura. This implies that if the banks provide price discount for their services and products,
use advertising through different media platforms, and sell their products and services directly to
the public, then there will be a high chance for them to improve in their sales performance.
Besides, the study found that the regression model was the best fit for predicting the effect of
promotion on sales performance (F=11.6228, p=0.001). Additionally, the study revealed that
every unit change in a promotion strategy would cause a significant variance of 25.3% on sales
performance (Beta=0.253, p=0.001).
Table 4.8: The Effect of Marketing Strategy on Sales Performance in the Commercial
Banks in Bujumbura
Marketing strategy Standardized Coefficients
Beta (β)
Significance
(p)
Adjusted R2=0.033 0.197 0.009
F=6.900 p=0.009
Dependent Variable: Sales Performance

61
The results in table 4.8 revealed that marketing strategies significantly affect the variance in sales
performance by 3.3% (Adjusted R2=0.033, p=0.009). This implies that proper distribution
channel, location and promotional efforts of the banks such as advertising and price discounts
increases the chances for sales performance. In addition, the study found that the regression
model was the best fit for predicting the effect of marketing strategies on sales performance
(F=6.900, p=0.009). Additionally, the study revealed that every unit change in a promotion
strategy would cause a significant variance of 19.7% on sales performance (Beta=0.197,
p=0.001).

62
Table 4.9: Multiple Regression Analysis for the Effect of Marketing Strategies on Sales
Performance
Marketing Strategy Standardized Coefficients
Beta (β)
Significance (p)
Product 0.071 0.488
Price 0.139 0.231
Place 0.146 0.269
Promotion 0.271 0.036
Adjusted R2=0.061
F=55.059, p=0.000
a. Dependent Variable: Sales Performance
The results presented in table 4.9 revealed that marketing strategy significantly affects sales
performance by a variance of 6.1% (Adjusted R2=0.061, p=0.006). This implies that
improvement of marketing strategy such as product, price, place or promotion can cause a
significant effect on sales performance. In addition, the study found that the regression model
was the best fit for predicting the effect of marketing strategies on sales performance (F=3.759,
p=0.006). Furthermore, promotion as a marketing strategy is the only strategy that significantly
predicts the variance in sales performance among commercial banks in Burundi. This is because
for every unit change in promotion, a prediction of 27.1% variance will be realized in sales
performance (Beta=0.271, p=0.036).

63
CHAPTER FIVE
DISCUSSION OF FINDINGS, CONCLUSIONS AND RECOMMENDATIONS
5.0 Introduction
This chapter presents the discussion of the study guided by the study objectives. The discussion
of this study findings were done by reviewing related literature, and comparing and contrasting
with other previous studies. The study was later concluded and appropriate recommendations
accruing from the findings were made.
5.1 Summary of Major Findings
The study found that product as a marketing strategy does not significantly affect sales
performance among commercial banks in Burundi (Adjusted R2=0.001, p=0.276). Furthermore,
the study found out that price as a marketing strategy used by the commercial banks of Burundi
does not significantly affect sales performance (Adjusted R2=0.002, p=0.255). On the other hand,
the study found out that place as a marketing strategy used by the commercial banks of Burundi
significantly affect sales performance (Adjusted R2=0.043, p=0.004). In addition, the study
found out that promotion as a marketing strategy used by commercial banks significantly affect
sales performance (Adjusted R2=0.058, p=0.001). Overall, the study revealed that marketing
strategies significantly affect sales performance (Adjusted R2=0.033, p=0.009).
5.2 The Discussions of the Major Results
5.2.1 The Effect of Product on Sales Performance in the Commercial Banks in Bujumbura
The first objective of this study was to determine the effect of product on sales performance of in
the commercial banks in Bujumbura. The study revealed that product as a marketing strategy
does not significantly affect sales performance among commercial banks in Burundi. This is
attributed to the fact that the surveyed commercial banks have not yet known and understood the
relevance of product marketing. This is the reason why the product marketing strategy being
used is having no significant effect on their sales performance. In addition, due to poor product
marketing strategy, a lot of potential customers remain unbanked in Burundi. And yet if product
marketing was focused on knowing customers‟ needs and the problems the company or product
could solve, the sales performance of the commercial banks would greatly improve. This is
because by identifying the right product and getting it to the right customers, product marketing

64
drives sales and profits. Furthermore, if the commercial banks of Burundi could use customer
data wisely so as to develop new products, as well as create smarter overall marketing strategies,
they would be able to realize bumper improvement in sales performance.
Though the current study in the context of commercial banks in Burundi did not find product
marketing strategy to affect sales performance, other studies by Kisaka (2019), Mahmood and
Fatimah Hajjat (2014), Kiprotich (2013), Ardjouman and Asma (2015), and Ebitu (2016) found
that product marketing affects sales performance. The above authors contend that product
marketing strategy contribute to the development of a firm‟s competitive advantage which
consequently leads to improvement in sales performance. This is because product marketing
strategy displays quality products which meet the needs of its customers and their individual
expectations.
Indeed good product marketing should focus solely on existing customers and keeping them
happy. To succeed, the commercial banks in Burundi need deep knowledge of who their
customers are, what they want, what influences their decisions, what problems they need to
solve, and how they perceive that the banks can provide a solution. Banks should equally know
that as customers keep buying the products or the services, they are actually buying solutions to
their problem. So, knowing their problem enables the bank to build and market the best solution
to that problem. Having this expertise gives a commercial ban an influential voice in shaping the
goods and services it provides.
5.2.2 The Effect of Price on Sales Performance in the Commercial Banks in Bujumbura
The second objective of this study was to examine the effect of price on sales performance in the
commercial banks in Bujumbura. The study revealed that price as a marketing strategy used by
the commercial banks of Burundi does not significantly affect sales performance. This was
attributed to the fact that the marketing system used by the commercial banks did not
comprehensively use free samples and bonus packs, pricing strategy, price discounts and
penetration pricing.
However, studies by Nelson and Chiew (2005) and Osman et al (2011) on price discounts, free
samples, bonus packs, and in-store display revealed that they are associated with product trial
and increase in sales performance. Furthermore, a study by Odhiambo (2013) on pricing strategy
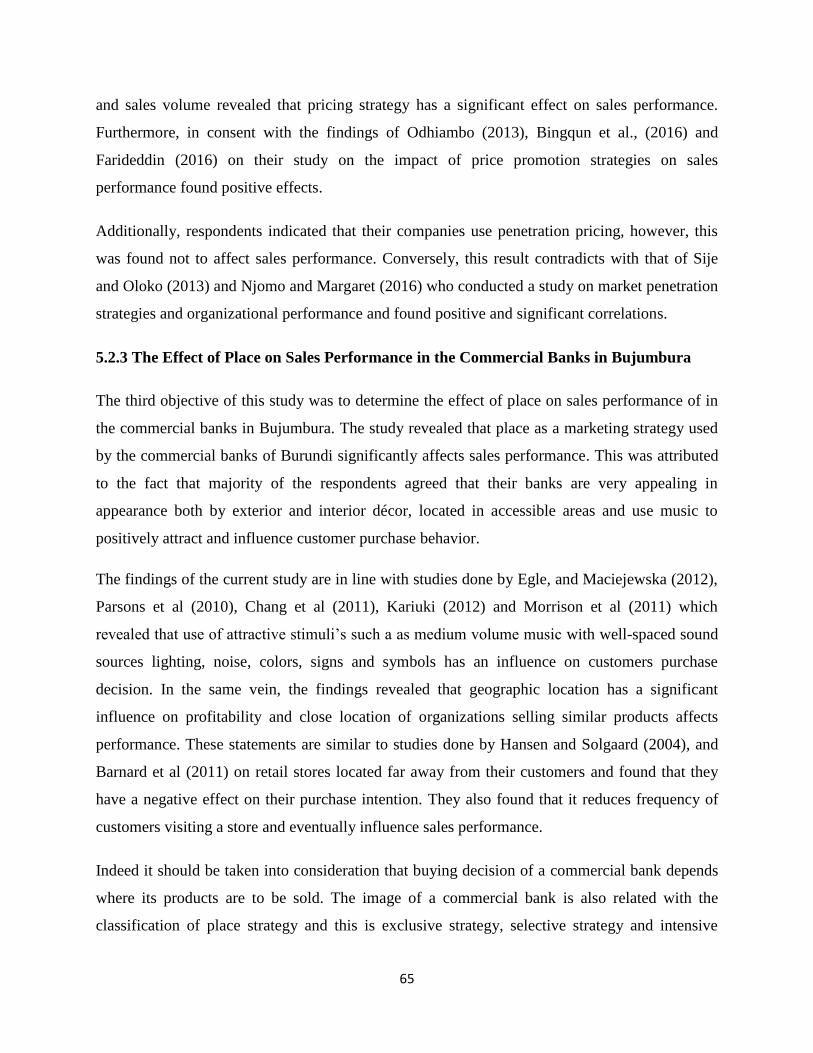
65
and sales volume revealed that pricing strategy has a significant effect on sales performance.
Furthermore, in consent with the findings of Odhiambo (2013), Bingqun et al., (2016) and
Farideddin (2016) on their study on the impact of price promotion strategies on sales
performance found positive effects.
Additionally, respondents indicated that their companies use penetration pricing, however, this
was found not to affect sales performance. Conversely, this result contradicts with that of Sije
and Oloko (2013) and Njomo and Margaret (2016) who conducted a study on market penetration
strategies and organizational performance and found positive and significant correlations.
5.2.3 The Effect of Place on Sales Performance in the Commercial Banks in Bujumbura
The third objective of this study was to determine the effect of place on sales performance of in
the commercial banks in Bujumbura. The study revealed that place as a marketing strategy used
by the commercial banks of Burundi significantly affects sales performance. This was attributed
to the fact that majority of the respondents agreed that their banks are very appealing in
appearance both by exterior and interior décor, located in accessible areas and use music to
positively attract and influence customer purchase behavior.
The findings of the current study are in line with studies done by Egle, and Maciejewska (2012),
Parsons et al (2010), Chang et al (2011), Kariuki (2012) and Morrison et al (2011) which
revealed that use of attractive stimuli‟s such a as medium volume music with well-spaced sound
sources lighting, noise, colors, signs and symbols has an influence on customers purchase
decision. In the same vein, the findings revealed that geographic location has a significant
influence on profitability and close location of organizations selling similar products affects
performance. These statements are similar to studies done by Hansen and Solgaard (2004), and
Barnard et al (2011) on retail stores located far away from their customers and found that they
have a negative effect on their purchase intention. They also found that it reduces frequency of
customers visiting a store and eventually influence sales performance.
Indeed it should be taken into consideration that buying decision of a commercial bank depends
where its products are to be sold. The image of a commercial bank is also related with the
classification of place strategy and this is exclusive strategy, selective strategy and intensive

66
strategy. Exclusive place strategy is understood when only one brand is sold and it is sold in few
places. High price range is involved in this strategy. Secondly, selective place strategy is
concerned when products are sold at selected places and this transaction may occur outside of the
company but with collaboration must retain between buyers and sellers. Lastly, intensive place
strategy is used most of time which is focused for low price and high volume strategy. This
strategy is convenient for consumers when certain factors are fulfilled like channels, locations,
inventory and availability of these factors affect consumers in order to establish their purchasing
decision.
5.2.4 The Effect of Promotion on Sales Performance in the Commercial Banks, Bujumbura
The fourth objective of this study was to establish the effect of promotion on sales performance
of in the commercial banks, Bujumbura. The study revealed that promotion as a marketing
strategy used by commercial banks significantly affects sales performance. This was attributed to
the fact that majority of the respondents agreed that their banks offer price discounts and
coupons, and uses adverts to promote its products and services. This is in line with the findings
of Ashkan (2016) and Akanbi and Adeyeye (2011) which revealed that advertising has an impact
on sales performance.
However, this study indicated that sales promotions and personal selling of bank products and
services fairly affects sales performance. Contrary to the findings of this study is that of Mullin
(2010) and Syeda et al., (2018) who found that sales promotion strongly and significantly affect
sales performance by increasing sales volume, increasing repeat purchase, increasing customer
loyalty, increasing product usage, creating interest, creating awareness and creating brand
awareness.
The study also indicated that personal selling and publicity was fairly used by the commercial
banks to promote products and services through offers of price discounts and coupons. This is in
line with the findings of Cheruiyot and Peter (2016) who found that direct marketing advertising,
such as personal selling, sales promotion and public relations enhance the company‟s
performance by enhancing customer attraction, customer loyalty, sales volumes, and branch
expansion. Agreeing with Cheriyot and Peter (2016), Amusat and Ajiboye (2013) in their study

67
found out that sales promotion activities such as bonus, coupons, free samples, price promotion
and premiums affects sales volume.
5.2.5 The Effect of Marketing Strategy on Sales Performance among Commercial Banks in
Bujumbura, Burundi
The purpose of this study was to determine the effect of marketing strategies on sales
performance in the commercial banks in Bujumbura, Burundi. The study revealed that marketing
strategies significantly affect sales performance. This was attributed to the fact that the
commercial banks in Burundi emphasized place and promotion strategies in their marketing
hence attracting customers and consequent increase in sales performance.
The current study is in agreement with the findings of Kasiso (2017) and Muthengi (2017) who
carried out a study on the effects of marketing strategies on sales performance of commercial
banks in Kenya and found significant and positive effects between the variables. In a similar
manner, Gituma (2017) in his study also consents with the findings of the present study when he
conducted a study on the effects of marketing mix on sales performance and found a positive and
significant effect. However, contrary to the above findings was that of Heiner and Mühlbacher
(2010) on strategic marketing and business performance who found low impact of strategic
marketing on financial performance, in conflict with several previous studies which proposed the
link to be strongly positive.
Furthermore, studies by Kiprotich (2018), Pourhosseini and Zohre (2013), Ardjouman and Asma
(2015) explored the effect of marketing strategies on sales performance and found out that there
was a significant effect. For instance, Ardjouman and Asma (2015) that there is a high level of
awareness of the significant roles played by marketing management strategies in the performance
of small and medium enterprises. Pourhosseini and Zohre (2013) found out that marketing
strategy had a positive and meaningful relationship on sales performance, while Kiprotich (2018)
found out that sales performance is significantly influenced by the 4 ps.
5.3 Conclusions
Objective one: product as a marketing strategy does not significantly affect sales performance
among commercial banks in Burundi. This is because most of the commercial banks in Burundi
68
do not put in enough efforts to understand their customers, communicate with them and
understand what is being demanded in the market. Due to the problem of laxity on the side of the
commercial banks to understand what is suitable and needed by their customers, their products
end up being unattractive hence causing a lot of people preferring not to do business with the
banks consequently affecting the banks sales performance.
Objective two: the study revealed that price as a marketing strategy used by the commercial
banks of Burundi does not significantly affect sales performance. This is because the banks have
not adequately embraced the importance of using free samples and bonus packs to increase its
sales performance, and the use of pricing strategy, penetration pricing, and price discount to
influence sales performance.
Objective three: place as a marketing strategy used by commercial banks in Burundi has a
positive and significant effect on sales performance. This is because location of most banks in
Bujumbura makes them more accessible and generates more returns than those in rural areas. In
addition, bank‟s interior and exterior décor and use of attractive stimuli such as music has an
influence on consumer purchase behavior and subsequent increase sales volume.
Objective four: promotion as a marketing strategy used by the commercial banks in Burundi has
a positive and significant effect on sales performance. This is because commercial banks use
advertising to present product and ideas hence increasing sales performance. In addition, the
commercial banks use sales promotion to create interest, brand awareness and increase brand
loyal, as well as personal selling and publicity, and price discounts and coupons for the same
purpose of promoting sales performance.
Overall conclusion
The study revealed that marketing has become a major function in the banking industry as a
result of increased competition brought about by bank consolidation and reforms. Indeed,
marketing strategies affect sales performance among commercial banks in Burundi. Irrespective
of the duration of existence, or the number of branches they have, all banks shared the same
sentiments that marketing has an impact on the sales volumes realized. All banks agree on the
opinion that marketing strategies have an immense contribution on the sales volumes realized.

69
Irrespective of the number of employees, all banks agree on the opinion that marketing strategies
have an immense contribution on the sales performance experienced by the different banks.
5.4 Recommendations
5.4.1 The Effect of Product on Sales Performance in the Commercial Banks in Bujumbura
This study revealed that product does not significantly affect sales performance. However, this
was due to the fact that commercial banks did not put in more efforts in understanding their
customer segments and their different needs. It is therefore imperative that the management of
the commercial banks develop and test their products to confirm their adaptability and suitability
to the target customers. This can be achieved by frequently carrying out market research and
customer satisfaction surveys.
The study also found a weak use of packaging strategy among commercial banks. This therefore
implies that the management of the commercial banks should embrace good and quality
packaging strategies of their products and services so as to increase recognition and subsequent
improvement in sales performance. This can be achieved by building attractive and interactive
website that provides informative and feedback oriented platform for customer enquiries and the
use of better communication strategies such as mobile phone messages and emails to inform
customers of more attractive products and services.
5.4.2 The Effect of Price on Sales Performance in the Commercial Banks in Bujumbura
The study found that price strategy did not significantly affect sales performance of commercial
banks. Therefore the management of the commercial banks should endeavor to ensure that they
adopt affordable pricing strategies such as free samples and bonus packs, discounts, personal
selling and penetration pricing. This is because Burundi is a small country with a weak economy
and majority of the people are unbanked due to poverty hence using the right price strategy can
help attract the unbanked masses.
5.4.3 The Effect of Place on Sales Performance in the Commercial Banks in Bujumbura
The study found that place strategy significantly affected sales performance among commercial
banks. However, due to the high level of competition and bank concentration in one town area
(i.e. Bujumbura), the management of commercial banks need to embrace more innovative and
ingenious ways of attracting and retaining their customers. This can be achieved by providing

70
better lighting, coloring, and smartness of the interior décor of the bank, and cleaning, trimming,
sculpturing and beautifying the exterior décor. This can also be supplemented by installing an
aquarium in the interior section of the banking hall, installing DSTv to ease customers as they
wait to receive services or use of music stimuli to attract a given section of the market segment,
e.g. the youth.
5.4.4 The Effect of Promotion on Sales Performance in the Commercial Banks, Bujumbura
The study found that promotion strategy significantly affected sales performance. Therefore the
management of commercial banks should emphasize the use of personal selling and publicity to
promote their products and services. Through this, they will be able to have a direct interaction
with their customer hence know what their customers need and want.
In addition, price discounts, sales promotions and advertising on different media platforms such
as print, radio, television, online should be used to target different segments of customers to buy
the products and services. This can be achieved by involving public personalities such as
musicians, comedians, DJs, footballers and athletes in their advertising campaigns. In addition,
the bank should have attractive social media pages that display information about their products
and services including their benefits.
5.5 Contribution to New Knowledge
Several proponents such as Gituma (2017), Heiner and Mühlbacher (2010), Muthengi (2017) and
Kasiso (2017) have found strong and positive influence of marketing strategies on sales
performance. However, the current study found that only place and promotion strategy affect
sales performance. This study adds to the body of new knowledge that the banking institutions
should emphasize equally on price and product for them to capture more customers and increase
their sale volume and consequent increase in sales performance.
Furthermore, the Marketing Mix Theory was also found to be a perfect theory for this study
since it explains very well the components of products, price, place and promotion strategies that
were used in the current study. It is therefore helpful in solidifying and strengthening the
products and services of the commercial banks so as to create avenue for improvement in sales
performance.

71
5.6 Areas of further Research
The study looked at only four commercial banks hence limiting geographical coverage. Future
related studies should be done to include all the commercial banks in Bujumbura so as to provide
generalizable results.
Furthermore, future studies should include the use of secondary data so as to substantiate the
extent of sales performance in terms of profitability influenced by marketing strategies for a
period of at least 10 years.
5.7 Limitations of the Study
The reliability of the results (test-retest) was not adequate enough to provide a better explanation
for the consistency of the results of this study instruments. There was need to set up a control
group as to substantiate the reliability of the study. Indeed the researcher addressed this
weakness using Cronbach‟s alpha that measured the internal consistency of the items, with the
intent of finding out how closely related a set of items were as a group.
This study was limited by unresponsive respondents and those who withdrew after the study
process had kick-started. The researcher however, mitigated this by consulting other eligible
respondents within the in the commercial banks for voluntary participation and somehow some
employees were able to participate.
Furthermore, the study was limited by the use of perception scale/Likert scale. However, the use
of qualitative data/key informant interviews helped to mitigate the limitations.

72
References
Abah, A. D., & Olohiliye, A. P. (2015). Analysis of the effect of advertising on sales volume of
an agro-allied company: a case of benue brewery limited, makurdi, benue state,
nigeria. American Journal of Economics, Finance, and Management, 1(5), 473-481.
Abiodium, A, & Paul, M Adeyeye, T. (2019). Sales relationship between advertising for selected
companies operating in Nigeria. Journal of administration, university of Nigeria, Nsukka,
4 (3).
Adefulu, A. D. (2015). Promotional strategy impacts on organizational market share and
profitability. Acta Universitatis Danubius. Œconomica, 11(6).
Adekoya, O. A. (2011). The Impact of Advertising on Sales Volume of a Product: A case of
Starcomms Plc, Nigeria. Retrieved October 6, 2018 from
https://www.theseus.fi/bitstream/handle/10024/34928/Adekoya_Olusola.pdf.pdf
Adeleye, A. S. (2018). Principles and Marketing Practices, Revised Ed. Concepts publication,
Lagos.
Adeniran, A., James, Egwuonwu, K. Thomas & Egwuonwu, Clara O. K. (2016). The Impact of
Sales Promotions on Sales Turnover in Airlines Industry in Nigeria. International
Journal of Marketing Studies, 8(3), 99-110.
Aderemi S. A (2003). Marketing Principles and Practice. Mushin: concept Publication Limited.
Adewale, G., Adesola, M. A., & Oyewale, I. O. (2017). Impact of marketing strategy on business
performance: A study of selected small and medium enterprises (SME‟s) in Oluyle local
government Idadan, Nigeria. J. Bus. Manager, 11(4), 59-66.
Afande, F., O. (2015). Effect of Promotional Mix Elements on Sales Volume of Financial
Institutions in Kenya: Case Study of Kenya Post Office Savings Bank. Journal of
Marketing and Consumer Research.11, pp64

73
Afzal, S., & Afzal, Sarwat. (2019). Marketing Capability, Strategy and Business Performance in
Emerging Markets of Pakistan. Journal of Social Sciences and Humanities, 7(2), 88-102.
Agbeja, O., Adelakun, O. J., & Akinyemi, D., (2015). Analysis of the Effect of Advertising on
Sales and Profitability of Company. International Journal of Novel Research in
Marketing Management and Economics, 2(3), 81-90.
Ajagbe, A. M., Olujobi, J. O., Worlu, R. E., & Uduimoh, A. A. (2015). Consumer Personality
and Increase in Sales Volume. International Journal of Academic Research in Economics
and Management Sciences, 4(4), 29-39.
Ajan, S, (2015). Effects of Sales Promotion on Purchasing Decision of Customer: A Case Study
of Baskin Robbins Ice–Cream Franchise Thailand. Unpublished Thesis Submitted to
Bangkok University.
Akanbi, P., A. & Adeyeye, T., C. (2018). The Association between Advertising and Sales
Volume: A Case Study of Nigerian Bottling Company PlcAkanbi. Journal of Emerging
Trends in Economics and Management Sciences, 2(2), 117-123.
Akhmedjonov, A., & Balci Izgi, B. (2015). If bank capital matters, then how? The effect of bank
capital on profitability of Turkish banks during the recent financial
crisis. Macroeconomics and Finance in Emerging Market Economies, 8(1-2), 160-166.
Alarcón, S., & Sánchez, M. (2013). Business strategies, profitability and efficiency of
production. Spanish journal of agricultural research, 11(1), 19-31.
Alharthi, M. (2016). The determinants of efficiency, profitability and stability in the banking
sector: a comparative study of Islamic, conventional and socially responsible banks.
Retrieved October 6, 2018 from https://pearl.plymouth.ac.uk/handle/10026.1/5324
Aliata, V., L., Odondo, A., J., Aila, F., O., Ojera, P., B., Abongo, B., E., & Odera, O. (2018).
Influence of Promotional Strategies on Banks Performance. International Journal of
Business, Humanities and Technology, 2(5), 169 - 178.

74
Al-Nimer, M., & Yousef, A. A. (2015). The impact of marketing strategy on profitability in
medical Jordanian corporations. International Business Research, 8(11), 61.
American Marketing Association (2010). Brand. Retrieved October 12, 2018 from
http://www.marketingpower.com/_layout/dictiomary.aspx?dlema
Anderson, M. A., Schaefer, K. C., & Smith, S. L. (2013). Can price dispersion reveal distance-
related trade costs? Evidence from the United States. Global Economy Journal, 13(2),
151-173.
Andersson, G., & Wachtmeister, A. (2016). Management strategies for profitability and growth.
Retrieved October 6, 2018 from https://stud.epsilon.slu.se/8802/
Andreas, H. (2018). Customer value-based pricing strategies: why companies resist. Journal of
Business Strategy, 29(4), 41-50.
Ardjouman, D., & Asma, B. (2015). Marketing Management Strategies Affecting Performance
of Enterprises (SMEs) in Cote d'Ivoire. International Journal of Business and Social
Science, 6(4).
Ashkan, Y., (2016). The Role of Advertisement in Sales Increase and Promotion: A Case Study
of Hamadan Province Insurance Companies. International Journal of Innovative
Research in Science, Engineering and Technology, 5(4), 6319- 6326.
Asimakopoulos, I., Samitas, A., & Papadogonas, T. (2009). Firm-specific and economy wide
determinants of firm profitability: Greek evidence using panel data. Managerial
Finance, 35(11), 930-939.
Baten, M. A., & Kamil, A. A. (2010). Measuring online Bank profit efficiency: A stochastic
Frontier Analysis. In Proceedings of the 6th IMT-GT Conference on Mathematics,
Statistics and its Applications (ICMSA2010), University Tunku Abdul Rahman, Kuala
Lumpur, Malaysia. Retrieved October 6, 2018 from
https://s3.amazonaws.com/academia.edu.documents/22994303/st-baten.pdf

75
Beck, C.T., & Gable, R.K. (2001). Ensuring content validity: An illustration of the process.
Journal of Nursing Measurement, 9 (1): 201–215.
Belás, J., & Lenka, G. (2016). The relationship among customer satisfaction, loyalty and
financial performance of commercial banks. Retrieved October 6, 2018 from
http://dspace.tul.cz/handle/15240/13611.
Berry, T. & Wilson, D. (2004). US SBA and Palo Alto Software. On Target: The Book on
Marketing Plans. 2nd
Ed. USA, USA: Palo Alto Software Inc.
Bingqun, C., Kejia, Y., & Tingjui, C. (2016). Analyzing the impact of price promotion strategies
on manufacturer sales performance. Journal of Service Science and Management, 9, 182-
187.
Bintu, M., (2017). Effects of Marketing Mix Strategy on Performance of Small Scale Businesses
in Maiduguri Metropolitan, Borno State Nigeria. Journal of Marketing and Consumer
Research.31.
Borden, N. H. (1965). The Concept of the Marketing Mix; In Schwartz, George; Science in
marketing; Wiley marketing series; Wiley: 286ff.
Brassington, F., & Pettitt, S. (2000). Principles of Marketing. 2nd Ed. Harlow Pearson Education
Limited.
Burkow, E. (2014). Kystens Mathus-An exploratory study of innovation potential and marketing
strategy in food retailing (Master's thesis, UiT Norges arktiske universitet).
Cardesjö, M., & Lind, J. (2011). Business Modeling for Increased Profitability. Retrieved
October 6, 2018 from http://publications.lib.chalmers.se/records/fulltext/147045.pdf
Cavusgil, S. T., & Zou, S. (2014). Marketing strategy-performance relationship: an investigation
of the empirical link in export market ventures. The Journal of Marketing, 1-21.
Chan, A. (2018). Marketing Strategy of a Creative Industry Company in Bandung City. Review
of Integrative Business and Economics Research, 7, 232-240.

76
Chavarín, R. (2016). Profitability in banks affiliated to a business group: Evidence from
Mexico. Emerging Markets Finance and Trade, 52(8), 1892-1909.
Chege, S., K., Muathe S., M., A, & Thuo. J., K. (2014). The effect of marketing capabilities and
distribution strategy on performance of MSP intermediary organizations‟ in Nairobi
County, Kenya.
Cheruiyot, R., J., & Peter P., W. (2016). Integrated Marketing Communication and Performance
of Kenya Post and Savings Bank. Social Sciences; 5(3): 37-49
Christian, H., Martin, K., & Jens, S. (2019). Brand awareness in business markets: When is it
related to firm performance? International Journal of Research in Marketing, 27, 201-
212
Cooper, D. R., & Schindler, P. S. (2014). Business Research Methods.12th Ed. New York, NY:
McGraw-Hill education.
Cui, K., Y., & Tingjui C. (2016). Analyzing the Impact of Price Promotion Strategies on
Manufacturer Sales Performance. Journal of Service Science and Management, 9(2),
182-187.
Dadzie, S. A., Owusu, R. A., Amoako, K., & Aklamanu, A. (2018). Do strategic motives affect
ownership mode of foreign direct investments (FDIs) in emerging African markets?
Evidence from Ghana. Thunderbird International Business Review, 60(3), 279-294.
Dang, T. (2014). The success of applying marketing mix 4Ps in Vietnamese dairy industry:
Vinamilk–a typical case. Retrieved October 10, 2018 from
https://www.theseus.fi/handle/10024/85926
Dangaiso, P., T. (2014). The effects of sales promotion strategies on company performance: a
case of Telone Zimbabwe. Unpublished Thesis Submitted to Midland State University.
Dangaiso, P., T. (2014). The effects of sales promotion strategies on company performance: a
case of Telone Zimbabwe. Unpublished Thesis Submitted to Midland State University.

77
Dauda, A. (2015). Effect of advertising on the sales revenue and profitability of selected food
and beverages firms in Nigeria. Unpublished Thesis Submitted to Ahmadu Bello
University, Zaria.
De Run, E., C., & Jee, T., W. (2008). Sales promotion preferences: techniques by product type,
paper presented at the 3rd International Borneo Business Conference, University of
Malaysia Sabah (UMS), Malaysia.
De Toni, D., Milan, G. S., Saciloto, E. B., & Larentis, F. (2017). Pricing strategies and levels and
their impact on corporate profitability. Revista de Administração (São Paulo), 52(2), 120-
133.
Dean, J., H. (2015). 10 Tips to Improve Your Sales Performance. Retrieved, October 1, 2018,
from http://www.sellingpower.com/content/article/?a=10089/10-tips-to-improve-your-
sales-performance.
Deborah, I., L. (2016). The effect of branding on organizational performance in the retailing of
pharmaceutical products, the mediating role of customer Service. Kwame Nkrumah
University.
Ebitu, T. M. (2016). Marketing strategies and the performance of enterprises in Akwa-Ibom
State, Nigeria. British Journal of Marketing Studies, 4(5), 51-62.
Edidijus, S., & Per Von E., C. (2015). The role of clusters in innovation and performance of
Small and Medium sized Technology Enterprises in Europe. Unpublished thesis
Submitted to Blekinge Institute of Technology.
Edward, S., T., W. (2013). The influence of visual packaging design on perceived food product
quality, value, and brand preference, International Journal of Retail & Distribution
Management, 41(10), 805-816.
Eze, F., J., Odigo, Benedict E., & Ufot, J., A. (2015). The correlation between business location
and consumers patronage: Implications for business policy decisions. British Journal of
Economics, Management and Trade, 8(4), 294-304.

78
Farshid, J.K. (2011). The influence of export marketing strategy determinants on firm export
performance: a review of empirical literatures between 1993-2010. International Journal
of fundamental Psychology and social sciences, 1(2): 26-34.
Ferri, K., Mohd, R., Radiah, A., & Hamidreza, G., (2017). Impact of distribution channel
innovation on the performance of Small and Medium Enterprises. International Business
and Management, 5 (1), 52-61.
Festus, W., (2016). The impact of sales promotion on organizational performance case study of
Guinness Ghana Breweries Limited. Unpublished Thesis Submitted To Kwame Nkrumah
University of Science.
Fitzsimmons, J., Steffens, P., & Douglas, E. (2005). Growth and profitability in small and
medium sized Australian firms. Retrieved October 6, 2018 from
https://papers.ssrn.com/sol3/papers.cfm?abstract_id=1263734
Frimpong, A. J. (2016). The effects of sales promotions on customer growth in the Ghanaian
mobile Telecommunication industry; the case of Millicom Ghana_ Tigo (Doctoral
dissertation).
Füreder, R., Maier, Y., & Yaramova, A. (2014). Value-based pricing in Austrian médium-sized
companies. Strategic Management, 19(10), 13-19.
Gan, K., S. (2010). An Empirical Analysis: Advertising effects on firm performance in the
Malaysian consumer products sector. Unpunished Thesis Submitted to University of
Malaysia Sarawak.
Gbolagade, A., Adesol, M., A., & Oyewale, I., O. (2018). Impact of Marketing Strategy on
Business Performance. A Study of In the Small and Medium Enterprises (SME‟s) In
OluyoleLocal Government, Ibadan, Nigeria. Journal of Business and Management, 11(9),
59-66.
Gituma, M. M. (2017). Effects of Marketing Mix on Sales Performance: A Case of Unga Feeds
Limited (Doctoral dissertation, United States International University-Africa). Retrieved
October from http://erepo.usiu.ac.ke/handle/11732/3664

79
Grönroos, C. (1994). From marketing mix to relationship marketing: towards a paradigm shift in
marketing. Management decision, 32(2), 4-20.
Guesh, B. (2010). Assessment of Factors Affecting Sales Volume: A Case Study of Mesfin
Industrial Engineering PLC (Doctoral dissertation, Mekelle University). Retrieved
October 6, 2018 from https://opendocs.ids.ac.uk/opendocs/handle/123456789/5157
Gwatidzo, T., Hope, C. J., & Ntuli, M. (2013). Investigating the effect of bank competition on
financial stability in Ten African countries. The International Business & Economics
Research Journal (Online), 12(7), 755.
Harmon, R., & Raffo, D. (2017). Value-Based pricing for new software products: strategy
insights for developers.
Harsono, R. (2017). The Impact of Marketing Mix (4p's) on Customer Loyalty Towards Toyota
Avanza. Retrieved October 10, 2018 from
http://publication.petra.ac.id/index.php/ibm/article/view/5329
Heiner, R. S., & Mühlbacher, N. (2007). Modern Marketing. Revised Edition. New Delhi: S. C
Hand and Company Ltd.
Hiroki, U., & Ashok, K., M. (2019). Use of Direct Marketing Strategies by Farmers and Their
Impact on Farm Business Income. Agricultural and Resource Economics Review 40(1),
pp.1–19.
Horsky, S., & Honea, H., (2012). The power of plain: intensifying product experience with
neutral aesthetic context, Marketing Letters, 23(1), 223-235.
Ibojo., B., O., & Ogunsiji, A., (2019). Effect of Sales Promotion as a Tool on Organizational
Performance: A case Study of Sunshine Plastic Company. Journal of Emerging Trends in
Economics and Management Sciences, 2(1), 9-13.
Immonen, L., (2010). Package Cues and Their Influence on the Perception of Premium Quality
of Premium Private Label Products. Unpublished Thesis Submitted to Aalto University.

80
Iqbal, N., Ahmad, N., Ateeq, M., & Javaid, K. (2013). Role Of Sales Promotion On Sales
Volume In The Context Of Fast Moving Consuming Goods Industry In Dera Ghazi
Khan. International Journal of Accounting Research, 1(4), 21-28.
Ishola, J.A., Adedoyin, I.S., Adeoye, O. A., & Dangana K. A. (2017). Impact Of Marketing
Strategies And Performance Of Banks And Its Ffects On Nigeria Economy. International
Journal of Engineering and Applied Sciences (IJEAS), 4(6), 55-58.
Išoraitė, M. (2016). Marketing mix theoretical aspects. International Journal of Research-
Granthaalayah, 4(6); 25-37.
Joshi, S., Prabhu, S., & Chirputkar, A., (2016). Impact of Advertising and Sales Promotion
Expenses on the Sales Performance of Indian Telecommunication Companies. Indian
Journal of Science and Technology, 9(46).
Kalemb. A. (2015). Contribution of branding in enhancing performance of tourism sector in
Rwanda. Unpublished Thesis Submitted to Jomo Kenyatta University of Agriculture and
Technology.
Kamotho, J., W. (2017). Influence of packaging and labeling on consumer perception of hair
care products quality. Unpublished Thesis Submitted to University of Nairobi.
Kasiso, M.C. (2017). The Effects of Marketing Strategies on Sales Performance of Small and
Medium Enterprises in Kenya. Master‟s Thesis, University Of Nairobi.
Keramati, A., Ardalan, A., & Ashtiani, P. G. (2012). Relationship between marketing mix and
sales performance in the context of the Iranian Steel private firms. International Journal
of Arts and Commerce, 1(6), 195-199.
Khadka, K., & Maharjan, S. (2017). Customer satisfaction and customer loyalty: Case trivsel
städtjänster (trivsel siivouspalvelut). Retrieved October 6, 2018 from
https://www.theseus.fi/handle/10024/139650
Kim, H. B., Kim, W., G., & Jeong, A. (2003). The Effect of consumer-based brand equity on
firm‟s financial performance. Journal of Consumer Marketing, 20(4), 335-351.

81
Kiprotich, L. K. (2018). Effects of 4ps Marketing Mix on Sales Performance of Automotive Fuels
of Selected Service Stations in Nakuru Town (Doctoral dissertation).
Kisaka, L. M. (2019). The relationship between marketing strategies and the performance of
savings and credit societies in Mombasa district (Doctoral dissertation).
Kline, P. (2000). The handbook of psychological testing (2nd
ed.). London: Routledge.
Koh, Y, Lee, S, & Boo, S (2019). Impact of brand recognition and brand reputation on firm
performance: U.S. based multinational restaurant companies‟ perspective, International
Journal of Hospitality Management, 28, 620-63.
Kotler, P. (2015). Marketing Management. 15th
ed. NJ, PH: Pearson Education.
Kotler, P., & Keller, K. (2006). Marketing and Management, Pearson Prentice Hall, Upper
Saddle River, NJ, USA.
Kotler, P., (2000). Marketing Management. Millennium Edition.. New Jersey, New Jersey:
Prentice Hall.
Kotler. P., & Armstrong. G (2012). Principles of Marketing.14th
Ed. USA, USA: Pearson Hall.
Kotler. P., & Armstrong. G. (2008). Principles of Marketing. International Edition. New York,
USA: Pearson Hall.
Kotler. P., & Armstrong.G (2013). Principles of Marketing.15th
Ed. USA, USA: Pearson Hall.
Krüger, J., Barnard, S., & Kritzinger, B. (2011). Location decision strategies for improving
SMME business performance. ActaCommercii.
Kudyrko, L., & Sevruk, I. (2016). Marketing strategies of the European retail chains in
Ukraine. Economic Annals-XXI, 158(3-4), 43-47.
Laswai, M., E. (2017). Assessment of the effectiveness of channels of distribution models in the
sales performance of an organization: The Case of Coca-Cola Morogoro Region.
Unpublished Thesis Submitted to Mzumbe University.

82
Lawson, J. (2008). The search for the SCV, Database Marketing, 13‐ 14.
Liban. O., S. (2015). The Impact of Advertisement on Sales: Case Study in Some Selected
Telecommunication Companies in Somalia. European Journal of Business and
Management, 7, (36), 49-55.
Liozu, S., M., & Hinterhuber, A. (2013). Pricing orientation, pricing capabilities, and firm
performance. Management Decision, .51(3), 594-614.
Magunga. A., K. (2010). Effects of marketing strategies on the performance of insurance
companies in Kenya. Unpublished Thesis Submitted to University of Nairobi.
Mahmood, M., H., & Fatimah, H., (2014). The Effect of Product Quality on Business
Performance in Some Arab Companies. Journal of Emerging Trends in Economics and
Management Sciences, 5(5):498-508.
Mei, T., G. (2013). Brand Identity, Brand Equity and Performance. World Review of Business
Research, 3(4), 53 –60.
Meriläinen, V. (2015). Profitability analysis of the Finnish banking sector in 2010-2014.
Retrieved October 6, 2018 from
https://www.theseus.fi/bitstream/handle/10024/100974/Merilainen_Ville.pdf?sequence=2
Minchin, C., & Alpert, F. (2017). Realising Drucker and Kotler's Vision for a Strategic
Marketing Department. Retrieved October 9, 2018 from
https://papers.ssrn.com/sol3/papers.cfm?abstract_id=3069972
Morrison, M., G., Dubelaar, C., & Oppewal, H. (2011). In-store music and aroma influences on
shopper behavior and satisfaction. Journal of Business Research, 558-564.
Muchina, C. M., & Okello, B. (2016). Influence of personal selling on brand performance of
retail shoe companies in Nairobi Central business district. International Journal of
Academic Research and in Business and Social Sciences, 6(5).

83
Muchiri, M., N. (2016). The Effectiveness of Marketing Mix Strategies on performance of Kenol
Kobil Limited. Unpublished Thesis Submitted to University of Nairobi.
Mugenda, O., & Mugenda, G. (2003). Research Methods: Qualitative and Quantitative
Approaches. Nairobi: Acts Press.
Mukorombindo, B. R. (2014). The impact of direct marketing on sales performance: The case of
seed potato co-op. Unpublished Thesis Submitted to University of Zimbabwe.
Mullin, R. (2010). „Sales promotion’. 5th
Ed. Britain, Britain, Britain: KoganPage.
Mungal, A. (2015). The impact of cash management on profitability and sustainability of small
retail businesses in the Tongaat area, KwaZulu-Natal (Doctoral dissertation). Retrieved
October 6, 2018 from http://openscholar.dut.ac.za/handle/10321/1183.
Musibau, A., Choi, S., L., & Oluyinka, S., (2014). The impact of sales promotion and product
branding on company performance: A case study of AIICO Insurance Nigerian PLC.
International Conference on Innovation, Management and Technology Research, 129,
164-171.
Muthengi, W.K. (2017). The Effects of Marketing Strategies on Sales Performance of
Commercial Banks in Kenya. Master‟s thesis, University of Nairobi.
Mwaawaaru, S. (2019). Marketing Strategy in Terms of Promotion and Communication for
Energy Drinks in Ghana. Case Company: Sinebrychoff Brewery. Retrieved October 10,
2018 from https://www.theseus.fi/handle/10024/5985
Mwania, W. N. (2017). The Relationship Between Growth Strategy And Performance Of
Commercial Banks In Kenya Q (Doctoral Dissertation, School Of Business, University
Of Nairobi). Retrieved October 10, 2018 from
http://erepository.uonbi.ac.ke/bitstream/handle/
Nagel, S., Singlton., J., & Kenneth (2011). Estimation and Evaluation of Conditional Asset
Pricing Models. Journal of Finance, 66(3), 873-909.

84
Nahring, P. (2011). Value-based pricing: The perception of value. Retrieved October 10, 2018
from http://www.diva-portal.org/smash/record.jsf?pid=diva2%3A427806&dswid=-1407
Nana. Y., Dufie O., Gloria K., Q, Kwamena, M., N. (2011). The Effect of Marketing
Communications on the Sales Performance of Ghana Telecom (Vodafone,
Ghana).International Journal of Marketing Studies, 3(4).
Nanda, R., & Khanna, P. (2011). A Historical Overview of Marketing Strategies. International
Journal of Multidisciplinary Research, 1(7), 356-368.
Nashwan, M., A., S. (2015). How does Marketing Strategy Influence Firm Performance?
Implementation of Marketing Strategy for Firm Success. International Journal of
Innovation and Economic Development, 1(3), 7- 15.
Nchake, M. A. (2013). Product market price integration in developing countries. Diss.
University of Cape Town. Retrieved from https://open.uct.ac.za/handle/11427/5724
Ndikumana, L. (2014). Implications of monetary policy for credit and investment in sub-Saharan
African countries. Retrieved October 9, 2018 from http://www.jadafea.com/wp-
content/uploads/2017/01/00_Ndikumana_rev2.pdf
Ndung‟u, C. W. (2012). Distribution strategies and competitive advantage in Kenya commercial
bank limited. Retrieved October 10, 2018 from
http://erepository.uonbi.ac.ke/bitstream/handle/11295/14591/
Ngango, A., Mbabazize, M., & Shukla, J. (2015). e-banking and performance of commercial
banks in Rwanda a case of bank of Kigali. European Journal of Accounting Auditing and
Finance Research, 3(4), 25-57.
Nguru , F.W., Ombui, K.A., & Iravo, M. (2016). Effects of Marketing Strategies on the
Performance of Equity Bank, International Journal of Scientific and Research
Publications, 6(10), 569-576.

85
Nguyen, D., McCracken, V., Casavant, K. & Jessup, E. (2011). Geographic location, ownership
and profitability of Washington log trucking companies. Regional Science Policy &
Practice, 3 (2) 115–125.
Nirusa, S. (2017). The mediating role of perceived product quality: The analysis of relationship
between organizational capability and customer value. International Journal of
Management and Applied Science, 3(1), 131-134.
Njawa, J. (2015). The effects of advertising on organizational performance: A case Study of
TIGO Telecommunication Network Junior. Unpublished Thesis Submitted to Mzumbe
University.
Njomo G., W., & Margaret O. (2016). Market Penetration Strategies and Organizational Growth:
A Case of Soft Drink. International Journal of Management and Commerce Innovations
3(2), 219-227.
Njoroge, P. M. (2015). Marketing strategies and the performance of enterprises in Matuu
town, Machakos county, Kenya (Doctoral dissertation, University of Nairobi).
Nkurunziza, J.D., Ndikumana, L., & Nyamoya, P. (2011). The Financial Sector in Burundi. An
Investigation of its Efficiency in Resource Mobilization and Allocation. NBER AFRICA
PROJECT.
Odhiambo, M. (2013). Effect of pricing as a Competitive Strategy on Sales Performance of
Selected Pharmaceutical Companies. Unpublished Thesis Submitted to University of
Nairobi.
Ojo, O.M. (2012). Marketing Strategies and Bank Performance in Nigeria: A Post Consolidation
Analysis. Research Journal of Finance and Accounting, 3(5), 93-102.
Oladun, M., M. (2012). Innovative distribution strategies and performance of selected
multinational corporations (MNCs) and domestic manufacturingfirms In Nigeria.
Unpublished Thesis Submitted to Covenant University, Ota, and Ogun State, Nigeria.
86
Olusegun, O. A. (2016). Branding and Advertising. Journal of Public Relations and Marketing,
8 (2), pg.37.
Omotayo, A., & Adegbuyi, A., (2015). Strategic roles of branding on organization sales
performance. International Journal of Current Research, 7 (12), pp.23835-23841.
Onyango, K. (2016). Influence of Digital Marketing Strategies on Performance of Cut flowers
Exporting Firms in Kenya (Doctoral dissertation, University of Nairobi).
Osogbo, R. (2014). Effects of Advertising on Organizational Profitability, Journal of
Management and Social Sciences, 3(1), 67-7.
Owomoyela S., K, Oyeniyi K., O., & Ola, O., S., (2017). Investigating the impact of marketing
mix elements on consumer loyalty: An empirical study on Nigerian Breweries Plc.
Interdisciplinary Journal of Contemporary Research in Business, 4(11), 485 –496.
Oyedepo, T. Okorie, N., & Akhidenor, G. (2012). The dysfunctional and functional effect of
celebrity endorsement on brand patronage. Online Journal of Communication and Media
Technologies 2 (2).
Oyewale, V. (2013). Impacts of marketing strategy on business performance, a study of selected
small and medium enterprises (SMES) in Oluyede local government, Ibadan, Kenya.
Journal of Business and Management, 11(4), 59-66.
Papadopoulos, N., & Hamzaoui-Essoussi, L. (2015). Place images and nation branding in the
African context: Challenges, opportunities, and questions for policy and research. Africa
Journal of Management, 1(1), 54-77.
Park, C., W, Eisingerich, A., Pol, G, B., & Park, J.W. (2018). The role of brand logos in firm
performance. Journal of Business Research, 5(2), 1-23.
Paulin, A., Nadeau, J., & Dech, J. P. (2018). Place and certification cue usage with Canadian
forest products. The International Review of Retail, Distribution and Consumer
Research, 28(2), 190-205.
87
Pembi, S., Fudamu, A. U., & Adamu, I. (2017). Impact Of Sales Promotional Strategies On
Organizational Performance In Nigeria. European Journal of Research and Reflection in
Management Sciences Vol, 5(4).
Perminus, K., N., & Wilson. M., (2017). Effect of penetration pricing strategy on the profitability
of insurance firms in Kenya. International Journal of Finance and Accounting, 2(6), 93 –
106.
Piercy, N., F., Cravens, D., W., & Lane, N. (2019). Thinking strategically about pricing
decisions. Journal of Business Strategy, 31(5), 38-48.
Pourhosseini, A., & Zohre, D. S. (2013). The Effect of Marketing Strategy on Sales
Performance: The Moderating Effects of Internal and External Environment. World
Applied Sciences Journal, 26 (1), 28-33.
Pustelnik, C., & Hallberg, V. (2013). How to increase sales performance in a sustainable way?:
A research study based on a practical example of Eniro. Retrieved October 6, 2018 from
http://www.diva-portal.org/smash/get/diva2:636942/FULLTEXT01.pdf
Quarshie, E. (2010). Role of sales promotion in increasing revenue: the case study of the
telephony industry in Kumasi Metropolis (Doctoral dissertation, institute of distance
learning, Kwame Nkrumah University of Science and Technology). Retrieved October 6,
2018 from http://dspace.knust.edu.gh/bitstream/123456789/4397/1/Eric%20Quarshie.pdf
Rekilä, T. (2013). A study of the factors influencing customer satisfaction and efficiency in
contact centers: the combined effect. Retrieved October 6, 2018 from
https://aaltodoc.aalto.fi/handle/123456789/10866
Revino E. W., Silvya, L., M., & Christoffel, K, (2015). The effect of distribution channel sales
volume in Pt.Varia Indah Paramitha Manado. Retrieved on 15the
Octoberfromhttps://media.neliti.com/media/publications/2610-ID-the-effect-of-
distributiochannel-sales-volume-in-ptvaria-indah-paramitha-manad.pdf.
Richard, P.K. (2009). Measuring Organizational Performance: Towards Methodological Best
Practice. Journal of Management, 2(3), 292-304.

88
Rizwan, R., A., Vishnu. P., & Muhammad, A., A. (2014). Impact of Product Packaging on
Consumer‟s Buying Behavior. European Journal of Scientific Research, 120(2), 145-157.
Robert, P. (2000). Marketing Management. Pearson Education: 25.
Rogers, W. (2014). 12 Tips to Improve Sales Performance. Retrieved, October 1, 2018, from
https://www.salesforce.com/blog/2014/11/12-tips-to-improve-sales-performance-gp.html
Saeed, R., Lodhi, R., N., Rauf, A., Rana, M., I., Mahmood, Z., & Ahmed, N., (2013). Impact of
Labeling on Customer Buying Behavior in Sahiwal, Pakistan. World Applied Sciences
Journal, 24(9), 1250-1254.
Saunders, M. Lewis, P., & Thornhill, A. (2012). Research Methods for Business Students (6th
ed.). Harlow: Pearson Education Limited.
Schiele, H. (2018). Location, location: The geography of industry clusters. Journal of Business
Strategy 29: 29–36.
Schiffman, L., G., & Kanuk, L., L (2004). Consumer Behavior. 8th Ed. New Delhi, India:
Pearson Education.
Schoviah, A. (2018). The Effect of Marketing Distribution Channel Strategies on A Firm‟s
Performance Among Commercial. Retrieved October 10, 2018 from
http://erepository.uonbi.ac.ke/bitstream/handle/11295/8029/Abstract.pdf?sequence=1
Sekaran, U., & Bougie, R. (2010). Research Methods for Business: A Skill-Building Approach.
5thEd. London, UK: John Wiley and Sons.
Sekaran, U., & Bougie, R. (2013). Research Methods for Business: A Skill-Building Approach.
6thEd. London, UK: John Wiley and Sons.
Shajahan, S. (2008). Marketing Research Concepts & Practices in India, Macmillan.
Shaw, E.H. (2012). Marketing strategy: From the origin of the concept to the development
of a conceptual framework, Journal of Historical Research in Marketing, 4(1), 30-
55, https://doi.org/10.1108/17557501211195055
89
Sije, A., & Oloko, M. (2013). Penetration pricing strategy and performance of small and medium
enterprises in Kenya. European Journal of Business and Social Sciences, 2(9), 114-123.
Soltani, S., & Davanloo, K. G. (2016). Understanding Sales Volume Antecedents: Measuring the
Role of Consumer-oriented Selling and Sales Promotion in Iran FMCG Industry. Journal
of Creating Value, 2(2), 287-304.
Spann, M., Fischer, M., & Tellis, G. J. (2014). Skimming or penetration? Strategic dynamic
pricing for new products. Marketing Science, 34(2), 235-249.
Stierwald, A. (2010). The causes of profit heterogeneity in large Australian firms. Retrieved
October 6, 2018 from https://papers.ssrn.com/sol3/papers.cfm?abstract_id=1632803
Syeda, N., Zehra, R., & Sadia, M. (2018). Impact of Sales Promotion on Organizations‟
Profitability and Consumer‟s Perception in Pakistan. Interdisciplinary Journal of
Contemporary Research in Business 3, (5), 296-310.
Tandoh. I., & Sarpong, L. (2015). The Impact of Sales Promotions on the Performance of Auto-
Mobile Industries in Ghana: A Case Study of PHC Motors (Accra- Ghana).European
Journal of Business and Management, 7(11), 170-194.
Tangus, D., & Omar, N. (2017). Effects of Market Expansion Strategies on Performance of
Commercial Banks in Mombasa County. International Journal of Economics, Business
and Management Research, 1(2), 39-50.
Taylor Jr, S. (2018). Building Consumer Place Loyalty and Brand Loyalty: An Assessment of the
Microbrewery Taproom Experience (Doctoral dissertation, University of South Carolina).
Tsai, H, Cheung, C., & Lo, A. (2010). An exploratory study of the relationship between
customer-based casino brand equity and firm performance. International Journal of
Hospitality Management, 29, 754-757.
Vershinina, O. (2017). Customer Satisfaction In The Banking Sector: A Study Of Russian Bank
PAO Sberbank. Retrieved October 6, 2018 from
https://www.theseus.fi/bitstream/handle/10024/136415/Vershinina_Olga.pdf?sequence=1

90
Wahlberg, J. (2017). The impact of sales performance measurement in day-to-day sales work.
Retrieved October 6, 2018 from:
https://www.theseus.fi/bitstream/handle/10024/139545/Wahlberg-
Jarvenkyla_Jessica.pdf?sequence=1
Wang, G., L., Yu-Je., W., M., & Chang, L., Y. (2018). The influence of knowledge management
and brand equity on marketing performance: A case study of a Japanese automaker‟s
branch in Taiwan. Journal of Business Research, 4(2), 30-51.
Wang‟ondu, A. W. (2016). Marketing Strategies and Customer Satisfaction: A Case Study of the
Institute Of Executive Coaches–East Africa (Doctoral dissertation, United States
International University-Africa).
West, D., Ford, J., & Ibrahim, E. (2010). Strategic Marketing: Creating Competitive
Advantage, Oxford, Oxford University Press.
Wisdom, E., (2015). The impact of e-marketing on business performance: A case study of the
Midlands Meander Association members. Unpublished Thesis Submitted to Durban
University of Technology.
Yi, Z. (2015). The Impact of Brand Image on Consumer Behavior: A Literature Review. Open
Journal of Business and Management, Jinan University, China.
Zhang, C., & Pan, F. (2009). The impacts of customer satisfaction on profitability: a study of
state-owned enterprises in China. Service Science, 1(1), 22-30.
Zikmund, W., & Babin, B. (2012). Business Research Methods: London, UK: Cengage Learning.
Zoellner, F., & Schaefers, T. (2015). The impact of price promotion types on sales and brand
perception of premium products. In Ideas in marketing: Finding the new and polishing
the old (pp. 528-528). Springer, Cham.
Zulfiqar, A., & Bala, B. (2016). Basic statistical tools in research and data analysis. Indian
Journal of Anaesthesia, 60(9): 662–669.

91
APPENDIX I: TRANSMITTAL LETTER
I am a Masters candidate for Business Administration at Kampala International University
undertaking a dissertation on “Marketing Strategies and Sales Performance of In the
Commercial Banks in Bujumbura, Burundi”. In view of this, I request you to participate in
this study. Kindly answer this questionnaire without leaving any question unanswered. Please be
assured that the information you give will be treated with utmost confidentiality and will be used
for academic purpose only.
Before answering this questionnaire kindly read and sign the attached informed consent.
Thank you very much in advance.
Yours faithfully
…………………………….
Gateka Ella Sandra

92
APPENDIC II: INFORMED CONSENT
I am giving my consent to be part of the research study of Ms. Gateka Ella Sandra on
“Marketing Strategies and Sales Performance of In the Commercial Banks in Bujumbura,
Burundi”. I have been assured of privacy, anonymity and confidentiality and that I will be given
an option to refuse participation and right to withdraw my participation any time. I have been
informed that the research is voluntary and that the result will be given to me if ask for it.
Initial ……………………………………………Date ……………………………………….

93
APPENDIX III: QUESTIONNAIRES
Please kindly spare some of your valuable time and respond to the following questions. The
questionnaire items are about a study on “Marketing Strategies and Sales Performance of in
the Commercial Banks in Bujumbura, Burundi”. The researcher has purposely selected you
to participate in this study because you work in National Insurance Corporation. The results of
this study will confidentially be treated and only used for academic purposes. Your participation
is voluntary, and indeed your name may not be required.
Thank you
Section A: Profile of the Respondents
Instruction: please tick the option that best describes you
1. Sex
1) Male 2) Female
2. Age
1) 20-29 2) 30-39
3) 40-49 4) 50 and above
3. Highest Level of Education
1) Certificate 2) Diploma
3) Bachelor 4) Masters
5) PhD
4. Work Experience
(1) 1-5 years 2) 6-10 years
3) More than 10 years

94
Section B: Marketing Strategy
This section is intended to capture information about marketing strategy used by commercial
banks in Bujumbura, Burundi. Answer it to the best of your knowledge by ticking the responses
indicated in the table below that corresponds with your level of agreement or disagreement. Use
the scale below to rate your agreement or disagreement with the statements in the table below.
Strongly disagree Disagree Uncertain Agree Strongly agree
1 2 3 4 5
# Marketing Strategies 1 2 3 4 5
A Product
1 This bank offers a broad product line.
2 This bank has products with a broad market appeal.
3 This bank develops and tests its products to confirm their adaptability
and suitability to target customers.
4 This bank uses packaging strategy that influences consumer-perceived
product quality.
5 This bank‟s brand image has an influence on profitability.
B Price
1 This bank uses pricing strategy to increase its sales volume.
2 This bank uses price discount to influence its sales performance.
3 This bank offers products which are lower in prices compared to market
segments.
4 This bank uses penetration pricing to increase product adoption.
5 This bank uses free samples and bonus packs to increase its sales
performance.
C Place
1 This bank is located in an area that increases its chance for sales
performance.
2 This bank‟s exterior and interior appearance is appealing to customers.

95
3 This bank is located in an area that is accessible to customers.
4 This bank‟s distribution channels influence its product availability.
5 This bank uses attractive stimuli such as music to influence its customers.
D Promotion
1 This bank advertises its products through various media platforms.
2 The use of sales promotion has increased brand loyalty of this bank.
3 Advertising has increased sales at this bank.
4 The use of direct marketing at this bank has led to an increase in profit.
5 This bank offers price discounts and coupons.
6 This bank uses personal selling and publicity to promote their products
7 This bank uses advertising to present its product and ideas.

96
Section C: Sales Performance
This section is intended to capture information about sales performance of the commercial banks
in Bujumbura, Burundi. Answer it to the best of your knowledge by ticking the responses
indicated in the table below that corresponds with your level of agreement or disagreement. Use
the scale below to rate your agreement or disagreement with the statements in the table below.
Strongly disagree Disagree Uncertain Agree Strongly agree
1 2 3 4 5
# Sales Performance 1 2 3 4 5
A Sales Volume
1 The sales volume of this bank‟s products has been increasing in the past
5 years.
2 The sales volume of this bank‟s products increased because of quality.
3 The sales volume of this bank‟s products increased because of good
marketing strategies.
4 The sales volume of this bank‟s products increased because of customer
satisfaction.
5 The sales volume of this bank‟s services increased because of employee
responsiveness to customer complaints.
B Profitability
1 The profit margin of this bank has been increasing in the past 5 years.
2 The return on assets of this bank has been increasing in the past 5 years.
3 The return on investment of this bank has been increasing in the past 5
years.
4 The return on equity of this bank has been increasing in the past 5 years.
5 The sales of this bank‟s products have been increasing in the past 5 years.
THE END

97
APPENDIX IV: KEY INFORMANT INTERVIEWS
For management of the sales and marketing departments only
1. What have been the most common marketing strategies you have been using in this bank?
2. Why did you prefer the marketing strategies mentioned above (Qn.1)?
3. How has the sales performance of this bank been in the past five years?
4. What have been the contributing factors to the good or bad sales performance of this
bank over the past five years?
5. How do you see the sales performance of this bank in the next five years?
The End

98
APPENDIX V: MAP SHOWING LOCATION OF COMMERCIAL BANKS IN
BURUNDI

99
APPENDIX VI: EXTRACTED DATA
The Effect of Product on Sales Performance in the Commercial Banks in Bujumbura
Model R
R
Square
Adjusted
R Square
Std. Error
of the
Estimate
Change Statistics
R Square
Change
F
Change df1 df2
Sig. F
Change
1 .084a .007 .001 .62426 .007 1.195 1 170 .276
Model Sum of Squares df Mean Square F Sig.
1 Regression .466 1 .466 1.195 .276b
Residual 66.248 170 .390
Total 66.714 171
Model
Unstandardized Coefficients
Standardized
Coefficients
t Sig. B Std. Error Beta
1 (Constant) 3.437 .277 12.391 .000
Product .080 .073 .084 1.093 .276
a. Dependent Variable: Sales Performance
The Effect of Price on Sales Performance in the Commercial Banks in Bujumbura
Model R
R
Square
Adjusted
R Square
Std. Error
of the
Estimate
Change Statistics
R Square
Change
F
Change df1 df2
Sig. F
Change
1 .087a .008 .002 .62406 .008 1.304 1 170 .255
Model
Sum of
Squares df Mean Square F Sig.
1 Regression .508 1 .508 1.304 .255b
Residual 66.207 170 .389
Total 66.714 171
Model
Unstandardized
Coefficients
Standardized
Coefficients
t Sig. B Std. Error Beta
1 (Constant) 3.424 .278 12.329 .000
Price .078 .069 .087 1.142 .255
a. Dependent Variable: Sales Performance

100
The Effect of Place on Sales Performance in the Commercial Banks in Bujumbura
Model R
R
Square
Adjusted
R Square
Std. Error
of the
Estimate
Change Statistics
R Square
Change
F
Change df1 df2
Sig. F
Change
1 .220a .048 .043 .61117 .048 8.608 1 170 .004
Model Sum of Squares df Mean Square F Sig.
1 Regression 3.215 1 3.215 8.608 .004b
Residual 63.499 170 .374
Total 66.714 171
Model
Unstandardized Coefficients
Standardized
Coefficients
t Sig. B Std. Error Beta
1 (Constant) 2.892 .291 9.929 .000
Place .236 .080 .220 2.934 .004
a. Dependent Variable: Sales Performance
The Effect of Promotion on Sales Performance in the Commercial Banks in Bujumbura
Model R
R
Squar
e
Adjusted
R Square
Std. Error
of the
Estimate
Change Statistics
R Square
Change
F
Change df1 df2
Sig. F
Change
1 .253a .064 .058 .60607 .064 11.622 1 170 .001
Model Sum of Squares df Mean Square F Sig.
1 Regression 4.269 1 4.269 11.622 .001b
Residual 62.445 170 .367
Total 66.714 171
Model
Unstandardized Coefficients
Standardized
Coefficients
t Sig. B Std. Error Beta
1 (Constant) 2.949 .235 12.531 .000
Promotion .227 .067 .253 3.409 .001
a. Dependent Variable: Sales Performance

101
The Effect of Marketing Strategy on Sales Performance in the Commercial Banks in
Bujumbura
Model R
R
Square
Adjusted
R Square
Std. Error
of the
Estimate
Change Statistics
R Square
Change
F
Change df1 df2
Sig. F
Change
1 .197a .039 .033 .61411 .039 6.900 1 170 .009
Model Sum of Squares df Mean Square F Sig.
1 Regression 2.602 1 2.602 6.900 .009b
Residual 64.112 170 .377
Total 66.714 171
Model
Unstandardized Coefficients
Standardized
Coefficients
t Sig. B Std. Error Beta
1 (Constant) 2.931 .310 9.453 .000
Marketing Strategy .219 .083 .197 2.627 .009
a. Dependent Variable: Sales Performance
Multiple Regression Analysis for the Effect of Marketing Strategies on Sales Performance
Model R
R
Square
Adjusted
R Square
Std. Error
of the
Estimate
Change Statistics
R Square
Change
F
Change df1 df2
Sig. F
Change
1 .287a .083 .061 .60538 .083 3.759 4 167 .006
Model Sum of Squares df Mean Square F Sig.
1 Regression 5.511 4 1.378 3.759 .006b
Residual 61.204 167 .366
Total 66.714 171
Model
Unstandardized Coefficients
Standardized
Coefficients
t Sig. B Std. Error Beta
1 (Constant) 3.084 .330 9.333 .000
Product .068 .098 .071 .694 .488
Price .125 .104 .139 1.203 .231
Place .157 .141 .146 1.109 .269
Promotion .244 .115 .271 2.119 .036
a. Dependent Variable: Sales Performance