Market information about our Visitors and our Active Considerers
10
Franz Josef Glacier newzealand.com vis itor experience Market information about our Visitors and our Active Considerers
-
Upload
khangminh22 -
Category
Documents
-
view
0 -
download
0
Transcript of Market information about our Visitors and our Active Considerers

Franz Josef Glacier
newzealand.com
visitor experienceMarket information about our Visitors and our Active Considerers

PAST VISITORSHISTORIC VIEW
3
Past Visitor ResearchThis is information collected about those who have visited New Zealand. This is the source for the visitor snapshot infographics. It is primarily sourced from Statistics New Zealand (International Travel and Migration), and the Ministry of Business, Innovation and Employment. (International Visitor Survey).
Throughout this document, any pages that refer to past visitor research will have a black background like this one.
ACTIVE CONSIDERERSFUTURE VIEW
AUS 1,467K
40%
GERMAN 104K
3%
CHINA 408K
11%
JAPAN 102K
3%UK 246K
7%
USA 320K
9%REST OF WORLD
28%
TOTAL ARRIVALSYE SEPTEMBER 2017
Active Considerer ResearchAn Active Considerer is someone who is considering coming to New Zealand for their next holiday, and New Zealand is one of their top five destinations they would most like to visit. Tourism New Zealand commissions ongoing research (Kantar TNS), to understand who these people are, and what their motivations and barriers are; this research is the key information source for understanding our future visitors.
Throughout this document, any pages that refer to Active Considerer research will have a white background like this one.
UK
6.8MGERMANY
6.4M
CHINA
30.9MJAPAN
6.5MAUSTRALIA
3.3M
USA
27.9M
newzealand.com
Waitomo Caves, Waikato
visitor experienceInternational Tourism’s contribution to New Zealand is significant; visitors spend on average around $40million every day.

5 6
VISITOR EX
PERIENCE
65
VISITOR EXPERIENCEInternational tourism’s contribution to New Zealand is significant.
Every day, visitors to your community are spending locally: it might be on a bed for the night, a rental car, petrol or maybe a bus ticket; buying meals, snacks and a coffee; visiting a museum or trying a round of golf; maybe hiring a bike for the cycle trails or skis for the slopes. All up, international visitors spend $40million every day – that’s around $3,000 for every New Zealander every year. All the while they are sharing their experiences with friends and family. New Zealand’s unique brand of welcome, our manaakitanga, sets us apart from the rest of the world and delivers an unforgettable experience. That’s why our international visitors give us a 9 out of 10 for satisfaction.
International tourism contributes $40m per day to the New Zealand
economy, roughly $3k for every New Zealander, every year
More than one in ten jobs is directly or indirectly generated by tourism
One in five export dollars is generated by international tourism
TOTAL VISITORS BY MARKETVISITOR PROFILE
The international visitor experience in New Zealand is overwhelmingly positive across a range of measures.
1,442K 399K 323K 229K 105K 102K
NET PROMOTER SCORE EXPECTATIONS OF NATURAL ENVIRONMENT MET OR EXCEEDED
EXPECTATIONS OF NEW ZEALAND EXPERIENCE MET OR EXCEEDED
9/10 94%
76%LIKELY TO RECOMMEND
NEW ZEALAND AS A DESTINATION 98%
OVERALL SATISFACTION OF NEW ZEALAND
EXPERIENCE
Visitors are highly satisfied with their New Zealand experience
Many visitors are likely to become advocates and recommend New Zealand
as a destination to others
Natural landscapes and scenery are the reason that make people want to come to New Zealand, so it’s important we meet or exceed expectations
And we are meeting or exceeding the expectations of New Zealand experience that visitors have
SOURCES: MBIE INTERNATIONAL VISITOR SURVEY MARCH 2017, STATS NZ TOURISM SATELLITE ACCOUNT MARCH 2016, STATS NZ INTERNATIONAL TRAVEL AND MIGRATION MAY 2017
3.6M 1.9M
TOTAL VISITORS
HOLIDAY VISITORS

7 8
VISITOR EX
PERIENCE
87
USA
95%
UK
98%GERMANY
91% CHINA
88% JAPAN
91%
AUS
96%
VISITOR EXPERIENCEOVERALL SATISFACTION
Strong visitor satisfaction is achieved across key markets.
OVERALL EXPECTATIONS
In all major markets expectations are largely met or exceeded.
9/10
OVERALL SATISFACTION OF NEW ZEALAND EXPERIENCE
FOR ALL MARKETS
USA
9.5
UK
9.4GERMANY
8.9 CHINA
8.9JAPAN
8.8
AUS
9.0
EXPECTATIONS OF NZ EXPERIENCE MET OR EXCEEDED IN ALL MARKETS
THERE IS AN OPPORTUNITY IN MARKETS WHERE ENGLISH IS NOT A FIRST LANGUAGE TO LIFT SATISFACTION AND MEET OR EXCEED EXPECTATIONS IN LINE WITH THAT OF ENGLISH
SPEAKING MARKETS
VISITORS FROM THE USA AND UK HAVE THE HIGHEST LEVELS OF SATISFACTION
94%
WORSE THAN
4%
WHEN EXPECTATIONSARE EXCEEDEDSATISFACTION CLIMBSTO 9.5 OUT OF 10
WHEN EXPECTATIONSARE MET SATISFACTIONIS STILL STRONG AT8.9 OUT OF 10
MET
55%
NOT SURE
2%EXCEEDED
39%

9 10
VISITOR EX
PERIENCE
109
POTENTIAL VISITORS CARE A LOT ABOUT PERSONAL RECOMMENDATION
Ensuring positive experiences helps create positive word of mouth and sharing,
increasing the likelihood that past visitors will recommend New Zealand to others
NET PROMOTER SCORE(LIKELIHOOD TO RECOMMEND NEW ZEALAND)
Likely to recommend NZ to others score out of 10
Promoters 9-10
Passives 7-8
Detractors 1-6
NPS = Promoters - Detractors
PROMOTERS
PASSIVES
DETRACTORS
1. Spectacular landscapes/ 1. Natural scenery 46%
2. Always wanted to visit 29%
3. Visit friends/family 28%
4. Friends, family or colleague 4. recommendation 27%
5. Somewhere new/never been 4. there before 25%
6. Environmentally friendly image 21%
7. Walking and hiking 16%
8. The Hobbit trilogy movies 14%
76%
80%
86%
70%
69%
88%
60%
visitor experienceNET PROMOTER SCORE
A high net promoter score indicates strong advocacy from past visitors helping to influence potential future visitors.
Visitors from the UK, USA and Australia are our biggest advocates.
AUSTRALIA
USA
GERMANY
CHINA
UK
JAPAN
PROMOTERS PASSIVES DETRACTORS
SPECTACULAR LANDSCAPES/
NATURAL SCENERY
TOP FACTORS INFLUENCING CONSIDERATION OF NEW ZEALAND
#1

11 12
VISITOR EX
PERIENCE
1211
67%
WI-FI
73% 50%
TECHNOLOGY USED WHILE IN NEW ZEALAND
SATISFACTION OF NEW ZEALAND EXPERIENCE - DETAIL (AVERAGE SCORE/10)
VISITORS INCREASINGLY USING INSTAGRAM TO SHARE THEIR #NZMUSTDO EXPERIENCE
SOCIAL MEDIA
SMARTPHONE LAPTOP OR TABLET
NZ’S NATURAL AND BUILT ENVIRONMENT
SENSE OF SAFETY
9.2
9.1
8.8
8.6
8.6
8.6
8.5
8.4
8.3
8.1
8.1
8.0
ACTIVITIES
CUSTOMER SERVICE
SHOPPING
EXPERIENCE AT ISITE
MĀORI ACTIVITIES
ALL ACCOMMODATION
FOOD & BEVERAGE
TOUR GUIDE
COMMERCIAL TRANSPORTATION
PRIMARY ACCOMMODATION
GLOBAL FOLLOWERS OF @PURENEWZEALAND SOCIAL
MEDIA ACCOUNTS
3.8m
Sep 15
Nov 15
Jan 16
Mar 16
May 16
Jul 1
6
Sep 16
Nov 16
Jan 17
Mar 17
May 17
VISITOR EXPERIENCETECHNOLOGY
Sharing experiences with friends, family and social networks plays a big role in word of mouth and advocacy of New Zealand as a destination.
SATISFACTION
Satisfaction is strong across all elements of the New Zealand experience.
13 14
VISITOR EX
PERIENCE
1413
9.2/10
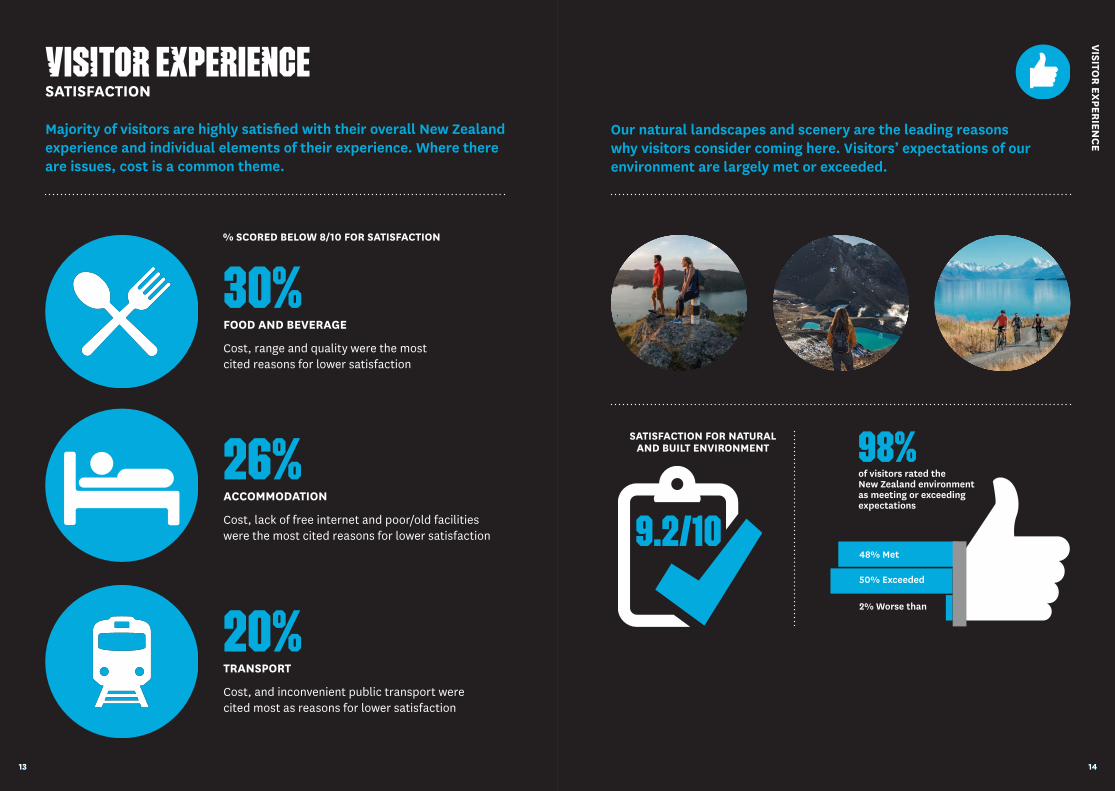
VISITOR EXPERIENCESATISFACTION
Majority of visitors are highly satisfied with their overall New Zealand experience and individual elements of their experience. Where there are issues, cost is a common theme.
Our natural landscapes and scenery are the leading reasons why visitors consider coming here. Visitors’ expectations of our environment are largely met or exceeded.
30%FOOD AND BEVERAGE
Cost, range and quality were the most cited reasons for lower satisfaction
26%ACCOMMODATION
Cost, lack of free internet and poor/old facilities were the most cited reasons for lower satisfaction
20%TRANSPORT
Cost, and inconvenient public transport were cited most as reasons for lower satisfaction
SATISFACTION FOR NATURAL AND BUILT ENVIRONMENT
of visitors rated the New Zealand environment as meeting or exceeding expectations
98%
48% Met
50% Exceeded
2% Worse than
% SCORED BELOW 8/10 FOR SATISFACTION

15 16
VISITOR EX
PERIENCE
1615
VISITOR EXPERIENCEENVIRONMENT
Visitors rate New Zealand highly for environmental management.
rate New Zealand’s environmental management among the best or ahead of other countries64%
26% Among the best
38% Ahead of most
18% On average
4% Behind others
15% Don’t know
37%COMMERCIAL ACCOMMODATION
63%ACTIVITY AND ATTRACTIONS
39%VISITOR TRANSPORT
53%PUBLIC INFRASTRUCTURE
Visitors rate individual sectors well on environmental management but there remain opportunities to improve and learn from industry best practice.
AMONG THE BEST OR AHEAD OF MOST

17 181817
VISITOR EX
PERIENCE
VISITOR EXPERIENCEMĀORI CULTURE
Māori culture is an integral part of a New Zealand experience for many.
of all holiday visitors claim to have participated in, or experienced an element of Māori culture54%
VISITORS FROM THE UK, GERMANY, CHINA AND THE USA WERE MORE LIKELY TO HAVE A MĀORI CULTURE
EXPERIENCE
See Māori artefacts, art/crafts 31%
Visit a Māori marae 24%
Other Māori culture activity 18%
See Māori art/crafts being created 16%
Eat Māori traditional food 16%
Māori performance 15%
Experience a Māori tradition 12%
notes