Market chain analysis of baobab (Adansonia digitata L.) and ...
316
FACULTEIT BIO-INGENIEURSWETENSCHAPPEN 2011 ir. Emmy De Caluwé ISBN 978-90-5989-436-5 Global food security and economic growth depend on a declining number of plant species. This has raised the interest in underutilised species as they allow to improve livelihoods by generating income, supporting food secu- rity and improving nutrition. People in Mali and Benin depend on the multi- ple goods and services supplied by underutilised indigenous tree species, such as baobab (Adansonia digitata L.) and tamarind (Tamarindus indica L.). The overall objective of the research presented here is to obtain insight in the structure and functioning of the markets of baobab and tamarind products in Mali and Benin. The present study first identified all chain actors involved in the markets of baobab and tamarind products in Benin and Mali, namely gatherers, traders, processors and consumers, and described their characteristics, activities, problems and linkages. Secondly, the markets of six different baobab and tamarind products traded in Mali and Benin were mapped. Then, the different market chains and their characteristics were analysed on local and national level. Finally, recommendations were formu- lated on how local chain development should build linkages and enhance trust between actors in the market chain. Once the major domestic limitati- ons have been tackled, commercialisation of baobab and tamarind products on regional and international level could be developed and expanded. Most aspects of the market chains of baobab and tamarind products in Mali and Benin studied in the present research have not yet been studied and published elsewhere. Therefore, this PhD should be considered as a pilot case study in obtaining insight in the commercialisation of baobab and tamarind products in Mali and Benin. ir. Emmy De Caluwé Market chain analysis of baobab (Adansonia digitata L.) and tamarind (Tamarindus indica L.) products in Mali and Benin Market chain analysis of baobab (Adansonia digitata L.) and tamarind (Tamarindus indica L.) products in Mali and Benin C M Y CM MY CY CMY K Cover_Emmy_De_Caluwé.pdf 1 29/04/11 07:12
-
Upload
khangminh22 -
Category
Documents
-
view
0 -
download
0
Transcript of Market chain analysis of baobab (Adansonia digitata L.) and ...
FACULTEIT BIO-INGENIEURSWETENSCHAPPEN
20
11
ir. Emm
y De C
aluw
é
ISBN 978-90-5989-436-5
Global food security and economic growth depend on a declining number of plant species. This has raised the interest in underutilised species as they allow to improve livelihoods by generating income, supporting food secu-rity and improving nutrition. People in Mali and Benin depend on the multi-ple goods and services supplied by underutilised indigenous tree species, such as baobab (Adansonia digitata L.) and tamarind (Tamarindus indica L.). The overall objective of the research presented here is to obtain insight in the structure and functioning of the markets of baobab and tamarind products in Mali and Benin. The present study �rst identi�ed all chain actors involved in the markets of baobab and tamarind products in Benin and Mali, namely gatherers, traders, processors and consumers, and described their characteristics, activities, problems and linkages. Secondly, the markets of six di�erent baobab and tamarind products traded in Mali and Benin were mapped. Then, the di�erent market chains and their characteristics were analysed on local and national level. Finally, recommendations were formu-lated on how local chain development should build linkages and enhance trust between actors in the market chain. Once the major domestic limitati-ons have been tackled, commercialisation of baobab and tamarind products on regional and international level could be developed and expanded.
Most aspects of the market chains of baobab and tamarind products in Mali and Benin studied in the present research have not yet been studied and published elsewhere. Therefore, this PhD should be considered as a pilot case study in obtaining insight in the commercialisation of baobab and tamarind products in Mali and Benin.
ir. Emmy De Caluwé
Market chain analysis ofbaobab (Adansonia digitata L.) and
tamarind (Tamarindus indica L.)products in Mali and Benin
Market chain analysis of baobab (A
da
nso
nia
dig
itata L.) and
tamarind (Ta
ma
rind
us in
dica L.) products in M
ali and Benin
C
M
Y
CM
MY
CY
CMY
K
Cover_Emmy_De_Caluwé.pdf 1 29/04/11 07:12


If many people,in many little places
do many little things,they can change the face of the earth
African Proverb

SupervisorProf. Dr. ir. Patrick Van Damme, Department of Plant Production,Faculty of Bioscience Engineering, Ghent University, Belgium
Board of examinersDr. ir. Achille Assogbadjo, Faculty of Agronomic Sciences,University of Abomey-Calavi, Benin
Ben Bennett, Natural Resources Institute, University of Greenwich,United Kingdom
Dr. Steven Franzel, World Agroforestry Centre, Kenya
em. Prof. Dr. ir. Francois Malaisse, Unite Biodiversite et Paysage,Gembloux Agro-Bio Tech, Universite de Liege
Dr. ir. Stijn Speelman, Department of Agricultural Economics,Faculty of Bioscience Engineering, Ghent University, Belgium
Prof. Dr. ir. John Van Camp, Department of Food Safety andFood Quality, Faculty of Bioscience Engineering, Ghent University,Belgium
Prof. Dr. ir. Guido Van Huylenbroeck, Department of AgriculturalEconomics, Faculty of Bioscience Engineering, Ghent University,Belgium
ChairmanProf. Dr. ir. Marc Van Meirvenne, Department of SoilManagement, Faculty of Bioscience Engineering, Ghent University,Belgium
DeanProf. Dr. ir. Guido Van Huylenbroeck
RectorProf. Dr. Paul Van Cauwenberge

ir. Emmy De Caluwe
Market chain analysis ofbaobab (Adansonia digitata L.) and
tamarind (Tamarindus indica L.)products in Mali and Benin
Thesis submitted in fulfilment of the requirements for the degree ofDoctor (PhD) in Applied Biological Sciences: Agronomy

Dutch translation of the titleMarktketen analyse van baobab (Adansonia digitata L.) en tamarinde(Tamarindus indica L.) producten in Mali en Benin
Illustrations on the cover by Emmy De CaluwePrinted by University Press, Zelzate, Belgium
De Caluwe E. (2011). Market chain analysis of baobab ( Adansoniadigitata L.) and tamarind ( Tamarindus indica L.) products in Mali andBenin. Ph.D. thesis, Faculty of Bioscience Engineering, Ghent University,Ghent, Belgium.
ISBN 978-90-5989-436-5
The author and the promoter give the authorisation to consult and tocopy parts of this work for personal use only. Every other use is subjectto the copyright laws. Permission to reproduce any material contained inthis work should be obtained from the author.
Table of contents
Table of contents i
List of figures v
List of tables ix
List of boxes xi
List of acronyms and abbreviations xiii
Acknowledgements xvii
Summary - Resume - Samenvatting xix
1 Introduction 11.1 Context . . . . . . . . . . . . . . . . . . . . . . . . . . . 21.2 State of the art . . . . . . . . . . . . . . . . . . . . . . . 101.3 Justification and problem statement . . . . . . . . . . . 111.4 Objectives . . . . . . . . . . . . . . . . . . . . . . . . . . 151.5 PhD thesis outline . . . . . . . . . . . . . . . . . . . . . 15
2 Literature review 172.1 Baobab (Adansonia digitata L.) . . . . . . . . . . . . . . 18
2.1.1 Distribution . . . . . . . . . . . . . . . . . . . . . 182.1.2 Botanical description . . . . . . . . . . . . . . . . 192.1.3 Utilisation . . . . . . . . . . . . . . . . . . . . . . 192.1.4 Nutritional value . . . . . . . . . . . . . . . . . . 24
2.2 Tamarind (Tamarindus indica L.) . . . . . . . . . . . . 282.2.1 Distribution . . . . . . . . . . . . . . . . . . . . . 282.2.2 Botanical description . . . . . . . . . . . . . . . . 292.2.3 Utilisation . . . . . . . . . . . . . . . . . . . . . . 29
ii Table of contents
2.2.4 Nutritional value . . . . . . . . . . . . . . . . . . 342.3 Food markets in sub-Saharan Africa . . . . . . . . . . . 36
2.3.1 Market types . . . . . . . . . . . . . . . . . . . . 402.3.2 Marketing and marketing functions . . . . . . . . 422.3.3 Intermediaries or traders . . . . . . . . . . . . . . 442.3.4 Marketing costs . . . . . . . . . . . . . . . . . . . 46
2.4 Marketing underutilised plant species . . . . . . . . . . . 472.5 Market chains . . . . . . . . . . . . . . . . . . . . . . . . 50
2.5.1 Definition, principles and evolution . . . . . . . . 502.5.2 Market chain analysis . . . . . . . . . . . . . . . 51
3 Methodology 613.1 Study area . . . . . . . . . . . . . . . . . . . . . . . . . . 62
3.1.1 Mali . . . . . . . . . . . . . . . . . . . . . . . . . 623.1.2 Benin . . . . . . . . . . . . . . . . . . . . . . . . 653.1.3 Comparison of Mali and Benin . . . . . . . . . . 683.1.4 Study sites . . . . . . . . . . . . . . . . . . . . . 72
3.2 Material and methods . . . . . . . . . . . . . . . . . . . 733.2.1 Data collection . . . . . . . . . . . . . . . . . . . 763.2.2 Data analysis . . . . . . . . . . . . . . . . . . . . 84
4 Results 914.1 Chain actors . . . . . . . . . . . . . . . . . . . . . . . . 92
4.1.1 Gatherers . . . . . . . . . . . . . . . . . . . . . . 924.1.2 Traders . . . . . . . . . . . . . . . . . . . . . . . 1004.1.3 Processors . . . . . . . . . . . . . . . . . . . . . . 1044.1.4 Consumers . . . . . . . . . . . . . . . . . . . . . 106
4.2 Market chains . . . . . . . . . . . . . . . . . . . . . . . . 1074.2.1 Baobab fruits . . . . . . . . . . . . . . . . . . . . 1074.2.2 Baobab leaves . . . . . . . . . . . . . . . . . . . . 1104.2.3 Tamarind fruits . . . . . . . . . . . . . . . . . . . 1134.2.4 Tamarind leaves . . . . . . . . . . . . . . . . . . 114
4.3 Market chain analysis . . . . . . . . . . . . . . . . . . . 1154.3.1 Quantities and prices . . . . . . . . . . . . . . . . 1154.3.2 Added value . . . . . . . . . . . . . . . . . . . . 1284.3.3 Harvesting techniques . . . . . . . . . . . . . . . 1284.3.4 Buying and selling periods . . . . . . . . . . . . . 1284.3.5 Storage practices . . . . . . . . . . . . . . . . . . 1344.3.6 Uses and consumption trends . . . . . . . . . . . 1374.3.7 Processing practices . . . . . . . . . . . . . . . . 140

Table of contents iii
4.3.8 Trade centres . . . . . . . . . . . . . . . . . . . . 1474.3.9 Quality criteria . . . . . . . . . . . . . . . . . . . 1504.3.10 Information flow . . . . . . . . . . . . . . . . . . 1524.3.11 Problems . . . . . . . . . . . . . . . . . . . . . . 154
5 Discussion and recommendations 1575.1 Discussion of results . . . . . . . . . . . . . . . . . . . . 158
5.1.1 Chain actors and activities . . . . . . . . . . . . 1585.1.2 Market chains . . . . . . . . . . . . . . . . . . . . 1695.1.3 Market chain analysis . . . . . . . . . . . . . . . 176
5.2 SWOT and impact analysis . . . . . . . . . . . . . . . . 1865.2.1 SWOT analysis . . . . . . . . . . . . . . . . . . . 1865.2.2 Impact analysis . . . . . . . . . . . . . . . . . . . 193
5.3 Recommendations and scenarios for intervention . . . . 1995.3.1 Framework to develop marketing chains . . . . . 1995.3.2 Local chain development: building linkages and
enhancing trust . . . . . . . . . . . . . . . . . . . 1995.3.3 ... and beyond? . . . . . . . . . . . . . . . . . . . 207
6 General conclusions 2096.1 Main results per objective . . . . . . . . . . . . . . . . . 210
6.1.1 Chain actors and their activities . . . . . . . . . 2106.1.2 Market chains . . . . . . . . . . . . . . . . . . . . 2136.1.3 Market chain analysis . . . . . . . . . . . . . . . 2146.1.4 Recommendations and scenarios for intervention 217
6.2 Limitations and directions for future research . . . . . . 218
Bibliography 221
About the author 265

List of figures
2.1 Baobab tree and its products . . . . . . . . . . . . . . . 202.2 Different baobab products . . . . . . . . . . . . . . . . . 232.3 Tamarind tree and its products . . . . . . . . . . . . . . 302.4 Different tamarind products . . . . . . . . . . . . . . . . 322.5 Market map . . . . . . . . . . . . . . . . . . . . . . . . . 57
3.1 Map of Mali . . . . . . . . . . . . . . . . . . . . . . . . . 633.2 Map of Benin . . . . . . . . . . . . . . . . . . . . . . . . 663.3 Research sites in Mali and number of respondents . . . . 743.4 Research sites in Benin and number of respondents . . . 75
4.1 Age and gender composition of rural households in Maliand Benin . . . . . . . . . . . . . . . . . . . . . . . . . . 93
4.2 Total annual cash income per household and portion ofcash income of baobab and tamarind divided per cashincome quintiles in Mali and Benin . . . . . . . . . . . . 98
4.3 Retailer at marketplace selling a great variety of products 1024.4 Market map of baobab fruit pulp and tamarind fruit pods
in Mali . . . . . . . . . . . . . . . . . . . . . . . . . . . . 1084.5 Market map of baobab fruit pulp in Benin . . . . . . . . 1094.6 Market map of fresh baobab leaves in Mali and Benin . 1114.7 Market map of dry baobab leaves in Mali . . . . . . . . 1114.8 Market map of baobab leaf powder in Mali . . . . . . . 1124.9 Market map of baobab leaf powder in Benin . . . . . . . 1134.10 Market map of tamarind fruit pods in Benin . . . . . . . 1144.11 Market map of tamarind leaves in Mali . . . . . . . . . . 1154.12 Baobab leaves drying in the sun and sold at the marketplace 1204.13 Added value of baobab and tamarind products for
different chain actors in Mali and Benin . . . . . . . . . 1294.14 Local harvesting technique of baobab fruits with a dole 130
vi List of figures
4.15 Buying and selling periods of baobab and tamarindproducts reported by different chain actors in Mali andBenin . . . . . . . . . . . . . . . . . . . . . . . . . . . . 132
4.16 Storage place and material for baobab and tamarindproducts in Mali and Benin . . . . . . . . . . . . . . . . 135
4.17 Kiosk and storage function of processor . . . . . . . . . 1364.18 Preparation of baobab fruit pulp porridge . . . . . . . . 1384.19 Primary processing of baobab fruits into baobab fruit pulp 1404.20 Processing methods of baobab fruit pulp for obtaining
millet cream, syrup and juice . . . . . . . . . . . . . . . 1414.21 Tamarind fruits sold at market place . . . . . . . . . . . 1424.22 Processing method of tamarind fruit pulp into instant
juice powder, syrup, juice and jam . . . . . . . . . . . . 1434.23 Cumulative distribution of processors in function of
efficiency . . . . . . . . . . . . . . . . . . . . . . . . . . . 1444.24 Relative importance of different processing costs on net
income of efficient and inefficient processors of baobaband tamarind products in Mali and Benin . . . . . . . . 145
4.25 Low quality of local sealing practice of processed materials 1474.26 Trade centres of baobab leaf powder, baobab fruit pulp
and tamarind fruit pods in Mali . . . . . . . . . . . . . . 1484.27 Trade centres of baobab leaf powder, baobab fruit pulp
and tamarind fruit pods in Benin . . . . . . . . . . . . . 1494.28 Quality criteria of baobab and tamarind products
adopted by different chain actors in Mali and Benin . . 1514.29 Availability of information and overall satisfaction of
access to information according to different chain actorsin Mali and Benin . . . . . . . . . . . . . . . . . . . . . 153
5.1 Baobab tree, which bears only fruits in the highest partsof the crown . . . . . . . . . . . . . . . . . . . . . . . . . 163
5.2 Different forms of chain participation by smallholdersand how smallholders can improve their position in thechain . . . . . . . . . . . . . . . . . . . . . . . . . . . . . 201
5.3 Market interactions matrix . . . . . . . . . . . . . . . . 203
List of figures vii
Credits of photos
Sali Bourou: Figures 2.3 (middle).Emmy De Caluwe: Figures cover, 2.1 (except bottom left), 2.2, 2.3
(except middle), 2.4, 4.3, 4.12 (bottom left), 4.17,4.18, 4.25.
Camile De Moor: Figures 2.1 (bottom left), 4.12 (except bottomleft), 4.21 (left).
Elie Padonou: Figures 4.14, 4.19.Christine van der Stege: Figures 4.21 (right), 5.1.

List of tables
3.1 Country profiles of Mali and Benin . . . . . . . . . . . . 693.2 Number of interviewed (individual) respondents for each
market chain actor of baobab and tamarind products inMali and Benin . . . . . . . . . . . . . . . . . . . . . . 77
3.3 Overview of topics covered by the different semi-structured questionnaires designed for each chain actorinvolved in the market chain of baobab and tamarindproducts . . . . . . . . . . . . . . . . . . . . . . . . . . 79
3.4 Composition of arbitrary category ‘large’ traders . . . . 81
4.1 Livestock distribution per household in Mali and Benin 944.2 Mean annual cash income-related data for rural
households involved in gathering baobab and tamarindfood products in Mali and Benin . . . . . . . . . . . . . 96
4.3 Demographic data on baobab and tamarind productgatherers in Mali and Benin . . . . . . . . . . . . . . . . 99
4.4 Demographic data on baobab and tamarind productwholesalers and petty traders in Mali and Benin . . . . 101
4.5 Actors from which different traders buy their productsin Mali and Benin . . . . . . . . . . . . . . . . . . . . . 103
4.6 Demographic data on baobab and tamarind productprocessors in Mali and Benin . . . . . . . . . . . . . . . 104
4.7 Actors from which processors buy their products in Maliand Benin . . . . . . . . . . . . . . . . . . . . . . . . . . 105
4.8 Demographic data on baobab and tamarind productconsumers in Mali and Benin . . . . . . . . . . . . . . . 106
4.9 Mean annual quantities of baobab fruit pulp bought (orharvested in the case of gatherers), sold and stored by alldifferent chain actors in Mali and Benin, together withthe mean buying and selling prices, and added value . . 117
x List of tables
4.10 Mean annual quantities of baobab leaf powder bought(or harvested in the case of gatherers), sold and storedby all different chain actors in Mali and Benin, togetherwith the mean buying and selling prices, and added value 122
4.11 Mean annual quantities of tamarind fruit pods bought(or harvested in the case of gatherers), sold and storedby all different chain actors in Mali and Benin, togetherwith the mean buying and selling prices, and added value 125
4.12 Substitution products for baobab and tamarind products 1394.13 Mean annual net income, revenue and processing costs
for (in)efficient processors in Mali and Benin . . . . . . 1464.14 Problems mentioned by the different actors in the market
chain of baobab and tamarind products in Mali andBenin . . . . . . . . . . . . . . . . . . . . . . . . . . . . 155
5.1 Occurence of different actors, in the market chain ofbaobab and tamarind products in Mali and Benin, indifferent market types . . . . . . . . . . . . . . . . . . . 171
5.2 Export and import of baobab and tamarind products inMali in the period 2006-07 . . . . . . . . . . . . . . . . . 183
List of boxes
1.1 Definition of underutilised species . . . . . . . . . . . . . . . 31.2 Definition of non-timber forest products . . . . . . . . . . . 51.3 Definition of agroforestry, agroforestry parklands and
agroforestry tree products . . . . . . . . . . . . . . . . . . . 71.4 Domestication And Development Of Baobab And Tamarind 92.1 African food markets are efficient but poor . . . . . . . . . 382.2 History of the value chain concept . . . . . . . . . . . . . . 525.1 Baobab market gardens . . . . . . . . . . . . . . . . . . . . 1805.2 Novel food regulation . . . . . . . . . . . . . . . . . . . . . 1905.3 Niche markets . . . . . . . . . . . . . . . . . . . . . . . . . . 1985.4 Chain participation . . . . . . . . . . . . . . . . . . . . . . . 2005.5 Trading up . . . . . . . . . . . . . . . . . . . . . . . . . . . 202

List of acronyms and abbreviations
aeu adult equivalent unit
AFTPs Agroforestry Tree Products
APG Angiosperm Phylogeny Group
AVRDC Asian Vegetable Research and DevelopmentCentre (now World Vegetable Centre)
BFCS Baobab Fruit Company Senegal
CBI Centre for the Promotion of Imports fromDeveloping Countries
CGIAR Consultative Group on International AgriculturalResearch
CIA Central Intelligence Agency
CIRAD Centre de Coorperation Internationale enRecherche Agronomique pour le Developpement
DADOBAT Domestication And Development Of Baobab AndTamarind
DEA Data Envelopment Analysis
EC European Commission
ECOWAS Economic Community of West African States
EU European Union
FAO Food and Agriculture Organisation of the UnitedNations
FCFA Federation des Communautes Francophones etAcadienne

xiv List of acronyms and abbreviations
FIAS Multi-donor Investment Climate Programme ofthe World Bank Group
GDP Gross Domestic Product
GFAR Global Forum on Agricultural Research
GFU Global Forum for Underutilised Species
HDI Human Development Index
ICRAF International Centre for Research in Agroforestry(now World Agroforestry Centre)
ICRISAT International Crops Research Institute for theSemi-Arid Tropics
ICUC International Centre for Underutilised Crops
IDRC International Development Research Centre
IFC International Finance Corporation of the WorldBank Group
IIRR International Institute of Rural Reconstruction
IMF International Monetary Fund
INRA Institut National de la Recherche Agronomique
IPGRI International Plant Genetic Resources Institute(now Bioversity International)
IUNC International Union for the Conservation ofNature
KIT Royal Tropical Institute
MDGs Millennium Development Goals
NGOs Non-Governmental Organisations
NTFPs Non-Timber Forest Products
NWFPs Non-Wood Forest Products
OECD Organisation for Economic Co-operation andDevelopment
PMCA Participatory Market Chain Analysis
PPP Purchasing Power Parity

xv
PRSP Poverty Reduction Strategy Papers
RMA Rapid Market Analysis
SAGORGEN Sub-Saharan Africa Forest Genetic ResourcesProgramme
SAFRUIT Sahelian Fruit Trees Project
SPSS Statistical Package for the Social Sciences
SSA Sub-Saharan Africa
SUN Tools for Management and Sustainable Use ofNatural Vegetation in West Africa
SWAC Sahel and West Africa Club
SWOT Strengths, Weaknesses, Opportunities andThreats
UK United Kingdom
UNDP United Nations Development Programme
UNICEF United Nations Children’s Fund
WHO World Health Organisation


Acknowledgements
De verwezenlijking van dit doctoraat was niet mogelijk geweest zonder dehulp en de steun van heel wat mensen.
Vooreerst wil ik mijn promotor Prof. Dr. ir. Patrick Van Dammebedanken voor de kansen en uitdagingen die hij me de voorbije jarengegeven heeft en het vertrouwen dat hij in mij stelde om allerhandeopdrachten tot een goed einde te brengen. Bedankt Patrick!
I would like to express my gratitude to Dr. ir. Achille Assogbadjo, BenBennett, Dr. Steven Franzel, em. Prof. Dr. ir. Francois Malaisse, Dr. ir.Stijn Speelman, Prof. Dr. ir. John Van Camp, Prof. Dr. ir. Guido VanHuylenbroeck and Prof. Dr. ir. Marc Van Meirvenne for being part of myexamination committee, and for their valuable comments and suggestionswhich improved the scientific value of this doctoral thesis.
I am grateful to the European Commission for financial support within theINCO-CT-2006-032217-DADOBAT project. Thanks to all partners of theDADOBAT project for the fruitful collaborations, inspiring discussionsand warm collegiality. In particular, I want to say a special word ofthank to my PhD companions. Some of them already obtained the titleof Doctor, congratulations! Others are still on their way, good luck andperseverance!
Un mot de remerciement special pour Dr. ir. Achille Assogbadjo, Dr. ir.Amadou M. Kouyate et Prof. Dr. ir. Brice Sinsin qui m’ont conduit dansune experience inoubliable et riche en Afrique de l’Ouest. Merci Achille,Amadou et Brice!
Camille, Elke, Kim en Tomas wil ik bedanken voor hun enthousiasme enhulp bij het veldwerk. Merci Amina, Elie, Hamady, Hamidou, Ismaılaet Yaya pour votre support et aide sur le terrain. Je veux egalementmontrer ma reconnaissance pour la population locale au Mali et au Benin,
xviii Acknowledgements
et surtout les informants qui ont fourni les informations de base de cetteetude.
Mijn oprechte dank gaat uit naar Dr. ir. Jeroen Buysse die megenavigeerd heeft doorheen de statistische wereld van SPSS en een DEA-initiatie gegeven heeft. Bedankt Jeroen! Dominique, bedankt om depuntjes op de i te zetten in mijn Franse samenvatting.
Een woord van dank wil ik richten aan al mijn collega’s en ex-collega’s. Erheerste steeds een gezellige en behulpzame sfeer op het labo en naast hetwerk is het altijd ontspannend geweest om met jullie te vertoeven. Dankje wel! Thanks to all my colleagues at the lab, I have always appreciatedand enjoyed the hearty collegiality between all of us. In het bijzonder wilik Sitske bedanken. Sits, ook al vormden we een tandem van jewelste, wehebben de kans niet gekregen om het project samen in schoonheid af tesluiten. Ik hoop van harte dat je in de nabije toekomst terug voldoendeenergie hebt om de draad terug op te pakken!
Aan alle vrienden en familie wil ik een speciaal woord van dankrichten. Het is fantastisch hoe jullie me de voorbije jaren gesteund enaangemoedigd hebben. Een schouderklopje, een knuffel, een babbel, eenetentje, een weekendje, een koffietje, ... ik kon steeds bij jullie terecht.Bovendien toonden jullie oprechte interesse in mijn onderzoek wat mij denodige energie gaf om door te zetten. Jullie zijn fantastisch!
Lieve mama en papa, zonder jullie steun had ik deze mijlpaal in mijn levennooit kunnen bereiken. Weten dat jullie er steeds voor me zijn, geeft mede nodige stimulans om mijn levensweg te bewandelen. Lieve Jan, samenkunnen we de wereld aan ...
Bedankt! Thanks! Merci!
Summary - Resume - Samenvatting
Summary
Global food security and economic growth depend on a declining numberof plant species. This has placed the future supply of food and ruralincomes at risk. Recently, there has been an increasing interest inunderutilised species as they allow to improve the livelihoods of therural poor by generating income, supporting food security and improvingnutrition.
Mali and Benin are both characterised by high rates of rural poverty,low basic health services, problematic and unstable food security, andunsustainable use of natural resources. In addition, rural and urbanpeople remain very dependent on the multiple goods and services suppliedby indigenous trees and woody plants. Any attempt to find sustainablesolutions to the problems listed for Mali and Benin should take intoaccount locally known, used and available natural resources.
In West Africa, baobab (Adansonia digitata L.) and tamarind(Tamarindus indica L.) form part and parcel of traditional farmingsystems or agroforestry parklands, and both species have been identifiedby local people as priority species to domesticate. Notwithstandingthe great agronomic, ecological, nutritional, cultural and economicimportance of baobab and tamarind products, very little informationis available on the basic market functioning and structures, such asstakeholders involved, trade channels and/or patterns of value addingalong the market chain. The present PhD thesis thus is the first studythat attempts to fill this information gap.
The overall objective of the research presented here is to obtain insightin the structure and functioning of the markets of baobab and tamarindproducts in Mali and Benin. To achieve this goal, the following specific

xx Summary - Resume - Samenvatting
research objectives are set: (i) identify all chain actors involved inthe market(s) of baobab and tamarind products in Mali and Benin,and describe their characteristics, activities and linkages; (ii) map themarket(s) of baobab and tamarind products in Mali and Benin; (iii)analyse the market chain of baobab and tamarind products in Mali andBenin; and (iv) formulate possible scenarios on how to add more valueto baobab and tamarind products in Mali and Benin, and how to betterorganise their market chains.
To formulate an answer on the objectives set for the present study, anin-depth analysis of the market chain for selected baobab and tamarindproducts is required. During field research, in total, 507 individualstakeholders in the market chain of baobab and tamarind products wereinterviewed in Mali between July and October 2007, whereas in Benin weinterviewed 221 informants during the period January – April 2010.
Gatherers of baobab and tamarind products are categorised assmallholders. After harvesting, they transform fresh baobab leaves intodry baobab leaves and/or baobab leaf powder, baobab fruits are processedinto baobab fruit pulp, tamarind leaves are dried, and tamarind fruitpods are stripped from their shell. In the present study, the portion ofcash income obtained from baobab and tamarind products is about 4 %for the poorest and 5 % for the richer households in Mali, whereas, inBenin, a contribution of up to 11 % is reported for the poorest group ofsmallholders. These figures show that baobab and tamarind products fallinto the gap-filling income category. The majority of surveyed gatherersin Mali and Benin reported to sell their baobab and tamarind products atthe farmgate. Baobab and tamarind fruits and leaves are harvested usingtraditional harvesting techniques, which only require manual labour andlow-cost tools. Leaf harvesting practices, in the case of baobab, maynegatively impact on fruit production. Therefore, in general, sustainableharvesting practices need to be developed and proposed to promotethe species’ conservation and avoid overexploitation. At last, surveyedgatherers in Mali and Benin mentioned dangerous harvesting techniques,seasonality and limited availability of baobab and tamarind products,time-consuming processing practices, product quality and a lack of marketinformation as their major problems.
Traders of baobab and tamarind products are mainly women. Theyfulfil different and varying functions, which points to a lack of functionalspecialisation. Findings in the present study revealed three possible price

xxi
setting processes: (i) fair negotiation, usually when the produce is soldat the market place; (ii) traders have more bargaining power, especiallywhen the produce is sold at the farmgate; and (iii) collecting gatherers inBenin have more influence in the price setting than traders. The lattershows the beneficial impact of collective action strategies in increasingthe bargaining power of smallholders. Additionally, the present studyidentified distinct trade centres for baobab leaf powder, baobab fruit pulpand tamarind fruit pods in Mali and Benin. The surveyed traders reportedthe following principal problems: variable product quality, limited storagespace, transport difficulties due to poor roads, lack of market informationand no access to formal financial services.
Processors in Benin reported to make juice from baobab and tamarindfruit pulp, whereas in Mali, processors use baobab and tamarind fruitsin the preparation of juice, syrup, jam and instant juice powder.Additionally, baobab fruit pulp is used in Mali for mixing with millet flourto prepare millet cream (locally called degue). Processing is generally notreported as a one-man’s business and processing (family) enterprises werefound to transform a whole range of different products. Notwithstandingmanual processing techniques and simplicity of equipment used, theportion of efficient processors identified by means of a data envelopmentanalysis is 63 % in Mali and 49 % in Benin. Thus, processors appearto be efficient under the given circumstances in Mali and Benin. Themajor cost that processors in both countries face is the cost of packagingmaterial. Moreover, surveyed processors in Mali and Benin reportedinappropriate and expensive packaging material, limited availabilityof adequate processing equipment, bad transport due to poor roadinfrastructure, lack of financial means and limited market informationas main constraints.
Both rural and urban consumers buy and use baobab and tamarindproducts on a regular basis. Baobab fruit pulp is reported to be usedin porridges and/or juices, whereas baobab leaves are used in saucepreparations. Most surveyed consumers use tamarind leaves and fruits inthe preparation of juices and/or for souring meals. Substitution productsfor all baobab and tamarind products are reported in the present studyand confirmed by literature. The main problems recorded by consumersare seasonality of supply, price fluctuations and unreliable product quality.
In total, six different baobab and tamarind products are reported inthis study to be traded in Mali and Benin. Based on the market maps

xxii Summary - Resume - Samenvatting
drawn for these products, three different market chains were identified:(i) market chain of fresh baobab leaves and tamarind leaves, characterisedas locally important with a domestic potential; (ii) market chain of drybaobab leaves and baobab leaf powder, characterised as important ondomestic level with a regional potential; and (iii) market chain of baobaband tamarind fruits, characterised by its domestic and regional importancewith international potential.
The present study is the first that has recorded quantities bought andsold, and purchasing and selling prices for different actors involved in thecommercialisation of baobab and tamarind products in Mali and Benin.Based on the quantities and prices recorded, baobab fruit pulp is tradedin larger quantities in Benin than in Mali, whereas baobab leaf powderand tamarind fruit pods are marketed in larger quantities in Mali than inBenin. Prices are lower in Benin for baobab fruit pulp and baobab leafpowder than in Mali, while tamarind fruit pods are cheaper in Mali whencompared to Benin. Moreover, commercialisation of baobab and tamarindproducts was evidenced to create a lot of employment opportunities. Inaddition, we calculated added values for baobab and tamarind productsand showed that processors and gatherers tend to have the highest addedvalues. This trend is found to be more pronounced in Mali than in Benin.As added value does not take into account any costs, it is impossible toprove which actor has the highest margins.
Harvesting of baobab and tamarind fruits, and baobab leaves is highlyseasonal. This is further reflected in the commercialisation of baobab andtamarind products which is found to occur chiefly during the dry season inBenin. In Mali, marketing of baobab and tamarind products is observedto be less seasonal. However, no seasonal storage has been evidenced inMali and Benin due to a lack of storage infrastructure, space and financialmeans. Most surveyed chain actors typically purchase a certain volume ofproduce, which is stored until it is sold, after which they replenish theirstock. As a result, storage duration is observed to be very variable. Inthe present study, dry baobab and tamarind products are mainly storedin recycled rice bags which are kept in the house or in a storehouse orgranary, in respectively Benin and Mali. Even though humidity and bug,mice and fungi attacks were reported as main problems during storage,the informants rated overall storage conditions as good.
None of the baobab and tamarind products were reported to be gradedor standardised. Direct inspection is the only method reported by which
xxiii
quality is assessed. Moreover, it has been observed that different actorsuse different quality criteria. All chain actors in Mali and Benin attachgreat importance to processing and storage techniques for baobab andtamarind products, and expect a well-dried or finely ground productwithout impurities, which has not been exposed to humidity. Additionally,colour and taste are important quality parameters in Mali, whereas tasteis only a criterion in Benin for baobab and tamarind fruits. Maturity,freshness and size, together with the absence of insects or insect lesionsare important quality criteria used to assess quality of tamarind fruits andleaves in Mali. The same criteria are used in Benin to assess the qualityof fresh baobab leaves.
Lack of market information is recognised by all chain actors as a majorconstraint in the commercialisation of baobab and tamarind products inMali and Benin. Information is particularly lacking about harvesting andprocessing techniques, price, quality and demand. Chain actors in Maliparticularly need more information about demand and they reported notto be satisfied with the access to information. In contrast, surveyed actorsin Benin especially need information about quality and say to be rathersatisfied with overall information flow.
Local chain development should build linkages and enhance trust betweenactors in the market chain. Recommended interventions are formulatedin many fields: (i) parallel domestication and commercialisation ofbaobab and tamarind; (ii) training of smallholders to improve theirproduction and management skills; (iii) supporting smallholders toassociate, collaborate and coordinate to achieve economies of scale intheir transactions with buyers; (iv) making channels of information andmarket intelligence accessible to all chain actors;(v) enabling chain actorsto understand and better satisfy product, process or delivery standardsrequired by buyers; and (vi) improving market institutions. Oncethe major domestic limitations have been tackled, commercialisation ofbaobab and tamarind products on regional and international level shouldbe developed and expanded.
In conclusion, most aspects of the market chains of baobab and tamarindproducts in Mali and Benin studied in the present research have –according to the author’s knowledge – not yet been studied and publishedelsewhere. Therefore, this research should be considered as a pilot casestudy in obtaining insight in the structure and functioning of the marketsof baobab and tamarind products.

xxv
Resume
La securite alimentaire mondiale et la croissance economique dependentdu nombre decroissant des especes vegetales. Cette situation a mis laprovision future des produits alimentaires et des revenus ruraux en danger.Il ya eu recemment un interet croissant dans les especes sous-utilisees quipermettent d’ameliorer la subsistance de la population rurale en generantdes revenus, en entretenant la securite alimentaire et en ameliorant lanutrition.
Le Mali et le Benin sont tous deux caracterises par des taux eleves depauvrete rurale, par de faibles services de la sante de base, par une scuritealimentaire problematique et instable ainsi que par une utilisation nondurable des ressources naturelles. En outre, les populations rurales eturbaines demeurent tres dependantes des produits et services multiplesfournis par des arbres et des plantes ligneuses indigenes. Tout effort visanta trouver des solutions durables aux problemes enumeres pour le Mali etle Benin devrait prendre en compte des ressources naturelles localementconnues, utilisees et disponibles.
En Afrique de l’Ouest, le baobab (Adansonia digitata L.) et le tamarinier(Tamarindus indica L.) font partie des systemes agricoles traditionnelsou des parcs agroforestiers, et les deux especes ont ete identifiees par lapopulation locale comme une espece prioritaire a domestiquer. Malgrela grande importance agronomique, ecologique, alimentaire, culturelleet economique des produits du baobab et du tamarinier, tres peud’information est disponible sur le fonctionnement et sur les structures dumarche, tels que les acteurs impliques, les circuits de commercialisationet/ou les modeles qui ajoutent de la valeur le long de la chaıne decommercialisation. Cette these de doctorat est donc la premiere etudequi tente de combler cette lacune.
L’objectif global de la recherche presentee ici est d’obtenir un apercu dela structure et du fonctionnement des marches de produits du baobab etdu tamarinier au Mali et au Benin. Pour atteindre ce but, les objectifsde recherche specifiques sont: (i) identifier tous les acteurs impliquesdans le(s) marche(s) des produits du baobab et du tamarinier au Maliet au Benin, et de decrire leurs caracteristiques, les activites et lesliens; (ii) dresser le(s) circuit(s) de commercialisation des produits dubaobab et du tamarinier au Mali et au Benin; (iii) analyser la chaıne decommercialisation des produits du baobab et du tamarinier au Mali et au
xxvi Summary - Resume - Samenvatting
Benin; et (iv) formuler des scenarios possibles pour augmenter la valeurdes produits du baobab et du tamarinier au Mali et au Benin, ainsi quemieux organiser leurs filieres.
Afin de formuler une reponse aux objectifs de la presente etude, uneanalyse profonde de la filiere des produits du baobab et du tamarinierest indispensable. Lors des visites sur le terrain, au total, 507 personnesimpliquees dans la chaıne de commercialisation des produits du baobabet du tamarinier ont ete interrogees au Mali entre juillet et octobre 2007,alors qu’au Benin nous avons interroge 221 informants durant la periodejanvier - avril 2010.
Les producteurs des produits du baobab et du tamarinier sont categorisescomme petits exploitants agricoles. Apres la recolte, ils transforment lesfeuilles fraıches de baobab en feuilles seches et/ou en poudre, les fruits dubaobab sont transformes en poudre, les feuilles de tamarinier sont sechees,et les fruits du tamarinier sont decortiques. Dans la presente etude, la partde revenu obtenu par la vente des produits du baobab et du tamariniers’eleve a 4 % pour les paysans les plus pauvres et 5 % pour les paysansriches du Mali. Alors qu’au Benin la contribution s’eleve a 11 % pourles petits exploitants agricoles les plus pauvres. Ces resultats demontrentque les produits du baobab et du tamarinier entrent dans la categoriede revenu ‘gap-filling ’. La majorite des producteurs interroges au Maliet au Benin declare vendre leurs produits du baobab et du tamarinier al’exploitation agricole. Les fruits et les feuilles du baobab et du tamariniersont recoltes en utilisant des techniques de recolte traditionnelles, qui nenecessitent que des mains-d’uvre et des outils pas chers. Dans le casdu baobab, les pratiques pour recolter les feuilles peuvent influencer laproduction des fruits de facon negative. Par consequent, les pratiques derecolte durables en general, doivent etre developpees et proposees pourpromouvoir la conservation de l’espece et eviter ainsi la surexploitation.Enfin, les enquetes au Mali et au Benin ont mentionne comme problemesprincipaux, des techniques de recolte dangereuses, la saisonnalite et ladisponibilite limitees des produits, les pratiques de transformations quiprennent du temps, la qualite des produits et l’information du marcheinsuffisante.
Les commercants des produits du baobab et du tamarinier sontprincipalement des femmes. Ils remplissent des fonctions differentes etvariees, ce qui denote un manque de specialisation fonctionnelle. Lesconclusions de la presente etude ont revele trois manieres possibles pour
xxvii
fixer les prix: (i) negociation equitable, principalement lorsque le produitest vendu au marche, (ii) les commercants ont plus de pouvoir denegociation, en particulier lorsque le produit est vendu a l’exploitationagricole, et (iii) les producteurs qui recoltent au Benin ont plus d’influencedans la fixation des prix que les commercants. Ce dernier montre leseffets benefiques des strategies d’action collective dans l’augmentationdu pouvoir de negociation des petits exploitants. En outre, la presenteetude a identifie des centres commerciaux distincts pour la poudre defeuille de baobab, la poudre de fruit de baobab et les fruits de tamarinierau Mali et au Benin. Les commercants interroges ont declare commeproblemes principaux: la qualite variable du produit, l’espace de stockagelimite, les difficultes de transport causees par le mauvais etat des routes,le manque d’information du marche et l’absence d’acces aux servicesfinanciers formels.
Les transformateurs au Benin disent de preparer du jus a base des fruitsdu baobab et du tamarinier, alors qu’au Mali, les transformateurs utilisentles fruits du baobab et du tamarinier dans la preparation du jus, dusirop, de la confiture et de la poudre instantanee de jus. En outre, lapoudre des fruits du baobab est utilisee au Mali pour melanger avecde la farine du mil pour preparer la creme de mil (appelee localementdegue). La transformation n’est generalement pas reconnue commeune entreprise unipersonnelle et les entreprises (familiales) transformenttoute une gamme des produits differents. Nonobstant des techniques detransformation manuelle et la simplicite du materiel utilise, la part destransformateurs identifies comme efficaces par la methode d’enveloppedes donnees est de 63 % au Mali et de 49 % au Benin. Ainsi, lestransformateurs semblent efficaces malgre les circonstances au Mali etau Benin. Le cout le plus important auquel les transformateurs dans lesdeux pays sont confrontes est celui des materiaux d’emballage. En outre,les transformateurs interroges au Mali et au Benin ont signale commecontraintes principales les materiaux d’emballage inappropries et couteux,la disponibilite limitee des equipements de transformation adequats, letransport difficile cause par une infrastructure routiere faible, le manquede moyens financiers et l’information du marche limitee.
Les consommateurs ruraux et urbains achetent et utilisent tresregulierement les produits du baobab et du tamarinier. La poudre dufruit du baobab est utilisee dans les bouillies et/ou dans des jus, tandisque les feuilles de baobab sont utilisees dans la preparation des sauces.
xxviii Summary - Resume - Samenvatting
La plupart des consommateurs interroges utilise les feuilles et les fruitsdu tamarinier dans la preparation des jus et/ou pour acidifier des repas.Des produits de substitution pour tous les produits du baobab et dutamarinier ont ete reveles dans la presente etude et confirmes par lalitterature. Les principaux problemes mentionnes par les consommateurssont la saisonnalite de l’approvisionnement, les fluctuations de prix et laqualite fiable des produits.
Au total, les six differents produits du baobab et du tamarinier traitesdans cette etude seront commercialises au Mali et au Benin. Basesur les cartes du marche, etablies pour ces produits, trois chaınesde commercialisation differentes ont ete identifiees: (i) la chaıne decommercialisation des feuilles fraıches du baobab et des feuilles dutamarinier, caracterisee par son importance locale et possedant unpotentiel national; (ii) la chaıne de commercialisation des feuilles sechesdu baobab et de la poudre des feuilles du baobab, caracterisee par sonimportance nationale ayant un potentiel regional; et (iii) la chaıne decommercialisation des fruits du baobab et du tamarinier, caracterisee parson importance nationale et regionale ayant un potentiel international.
La presente etude est la premiere qui a enregistre les quantites acheteeset vendues ainsi que les prix d’achat et de vente des differents acteursimpliques dans la commercialisation des produits du baobab et dutamarinier au Mali et au Benin. Base sur ces quantites et ces prix, lapoudre des fruits du baobab est commercialisee en plus grandes quantitesau Benin qu’au Mali, alors que la poudre des feuilles du baobab et lesfruits du tamarinier sont commercialises en quantites plus importantesau Mali qu’au Benin. Les prix de la poudre des fruits du baobab et dela poudre des feuilles du baobab sont moins eleves au Benin qu’au Mali,tandis que les fruits du tamarinier sont moins chers au Mali par rapportau Benin. En outre, la commercialisation des produits du baobab et dutamarinier cree des opportunites d’emploi. En plus, nous avons calculeles valeurs ajoutees pour les produits du baobab et du tamarinier et nousavons montre que les transformateurs et les producteurs ont tendance aavoir les plus hautes valeurs ajoutees. Cette tendance est plus prononceeau Mali qu’au Benin. Comme la valeur ajoutee ne prend aucuns couts encompte, il est impossible de prouver l’acteur qui a les marges beneficiairesles plus elevees.
La recolte des fruits du baobab et du tamarinier et des feuilles du baobabest tres saisonniere. Ceci se reflete egalement dans la commercialisation

xxix
des produits du baobab et du tamarinier qui a lieu principalementpendant la saison seche au Benin. Au Mali, la commercialisation desproduits du baobab et du tamarinier est identifiee comme etant moinssaisonniere. Cependant aucun stockage saisonnier n’a ete mis en evidenceau Mali et au Benin ceci est du au manque d’infrastructures de stockage,au manque d’espace et de moyens financiers. La plupart des acteursinterroges achete generalement une certaine quantite de produits, quiest stockee jusqu’a ce qu’elle soit vendue, apres quoi ils renouvelentleur stock. Par consequent, la duree de stockage observee est tresvariable. Dans la presente etude, respectivement au Benin et au Mali,les produits secs du baobab et du tamarinier sont principalement stockesdans des sacs de riz recycles qui sont gardes dans la maison ou dans unentrepot/grenier. Neanmoins l’humidite et l’assaut d’ insectes, de souriset de champignons sont signales comme principaux problemes pendant lestockage, les informateurs considerent les conditions generales de stockagecomme etant correctes
Aucuns produits du baobab et du tamarinier ont ete observes comme etanttries ou standardises. L’inspection directe est la seule methode utiliseepour evaluer la qualite. En outre, on remarque que les differents acteursutilisent differents criteres de qualite. Tous les acteurs de la chaıne auMali et au Benin pretent attention aux techniques de transformation etde stockage pour les produits du baobab et du tamarinier. Ils s’attendenta un produit bien seche ou finement ecrase sans impuretes et qui n’a pasete expose a l’humidite. En plus, la couleur et le gout sont d’importantsparametres de qualite au Mali, alors que le gout est seulement un critereau Benin pour juger la qualite des fruits du baobab et du tamarinier.La maturite, la fraıcheur et la taille, ainsi que l’absence d’insectes oude lesions d’insectes sont des criteres de qualite importants utilises pourevaluer la qualite des fruits et des feuilles du tamarinier au Mali. Lesmemes criteres sont utilises au Benin pour apprecier la qualite des feuillesfraıches du baobab.
Le manque d’information du marche est reconnu par tous les acteurs dela chaıne comme une contrainte majeure dans la commercialisation desproduits du baobab et du tamarinier au Mali et au Benin. L’informationfait defaut particulierement au niveau des techniques de recolte et detransformation, du prix, de la qualite et de la demande. Les acteurs auMali ont particulierement besoin de plus d’informations sur la demandeet ils ont declare ne pas etre satisfaits de l’acces a l’information.
xxx Summary - Resume - Samenvatting
Contrairement, aux acteurs interroges au Benin qui ont essentiellementbesoin d’informations sur la qualite et disent etre plutot satisfaits de lapropagation de l’information.
Le developpement des chaınes locales devraient etablir des liens etrenforcer la confiance entre les acteurs de la chaıne de commercialisation.Les interventions recommandees sont formulees dans de nombreuxdomaines: (i) la domestication et la commercialisation parallele du baobabet du tamarinier; (ii) la formation des petits exploitants afin d’ameliorerleur production et leurs competences en gestion, (iii) l’appui aux petitsexploitants de s’associer, de collaborer et de coordonner afin de realiser deseconomies d’echelle dans leurs transactions avec les acheteurs; (iv) l’accespour tous les acteurs de la chaıne a la propagation de l’information etd’intelligence du marche; (v) permettre aux acteurs de la chaıne de mieuxcomprendre et d’ameliorer les normes des produits, des processus ou de lalivraison exigees par les acheteurs, et (vi) l’amelioration des institutionsdu marche. Une fois les principales limites nationales appliquees, lacommercialisation des produits du baobab et du tamarinier au niveauregional et international devrait etre developpee et etendue.
En conclusion, la plupart des aspects des chaınes de commercialisation desproduits du baobab et du tamarinier au Mali et au Benin, etudies dansla presente recherche, n’ont – selon les connaissances de l’auteur – pasencore ete examines et publies ailleurs. Par consequent, cette recherchedevrait etre consideree comme une etude de cas pilote a obtenir un apercude la structure et du fonctionnement des marches des produits du baobabet du tamarinier.
xxxi
Samenvatting
De wereldwijde voedselzekerheid en economische groei hangen af vaneen afnemend aantal plantensoorten. Dit brengt, voornamelijk ophet platteland, de toekomstige voedselvoorziening en inkomenszekerheidin gevaar. Recentelijk is er een toenemende interesse voor weiniggekende plantaardige nutssoorten omdat deze het mogelijk maken debestaanszekerheid van de arme plattelandsbevolking te verbeteren doorinkomsten te genereren, voedselzekerheid te ondersteunen en voeding teverbeteren.
Zowel Mali en Benin worden gekenmerkt door een hoge graad vanarmoede op het platteland, zwakke basisgezondheidszorg, problematischeen instabiele voedselzekerheid, en niet-duurzaam gebruik van natuurlijkehulpbronnen. Bovendien blijft de plattelands- en stedelijke bevolking ergafhankelijk van de diverse goederen en diensten geleverd door inheemsebomen en houtige gewassen. Elke poging om duurzame oplossingen tevinden voor de genoemde problemen voor Mali en Benin moet rekeninghouden met de lokaal gekende, gebruikte en beschikbare natuurlijkehulpbronnen.
In West-Afrika vormen baobab (Adansonia digitata L.) en tamarinde(Tamarindus indica L.) een essentieel onderdeel van de traditionelelandbouwsystemen of agroforestry parklandschappen en beide soortenwerden door de lokale bevolking geıdentificeerd als prioritairesoorten om te domesticeren. Ondanks het grote agronomische,ecologische, nutritionele, culturele en economische belang van baobaben tamarinde producten, is zeer weinig informatie beschikbaar overde basis marktwerking en -structuren, zoals de betrokken actoren, dehandelskanalen en/of manieren om toegevoegde waarde in de keten tegenereren. Het huidige doctoraatsproefschrift is dan ook de eerste studiedie deze informatiekloof probeert te dichten.
De algemene doelstelling van het hier voorgestelde onderzoek is, inzichtkrijgen in de structuur en de werking van de markten van baobab entamarinde producten in Mali en Benin. Om dit doel te bereiken, werdende volgende specifieke onderzoeksdoelstellingen geformuleerd: (i) alleactoren identificeren die in Mali en Benin betrokken zijn bij de markt(en)van baobab en tamarinde producten, en hun kenmerken, activiteiten enrelaties beschrijven, (ii) de markt(en) van baobab en tamarinde productenin kaart brengen in Mali en Benin, (iii) de marktketen van baobab en
xxxii Summary - Resume - Samenvatting
tamarinde producten analyseren in Mali en Benin, en (iv) mogelijkescenario’s formuleren hoe baobab en tamarinde producten meer waardekunnen krijgen in Mali en Benin, en hoe hun marktketens beter kunnengeorganiseerd worden.
Om een antwoord te kunnen formuleren op de doelstellingen van dehuidige studie, is een grondige analyse van de marktketen van baobaben tamarinde producten nodig. Tijdens het veldonderzoek werden intotaal 507 actoren in de marktketen van baobab en tamarinde productengeınterviewd in Mali tussen juli en oktober 2007, terwijl we in Benin 221informanten geınterviewd hebben tijdens de periode januari - april 2010.
Verzamelaars van baobab en tamarinde producten worden gecategoriseerdals kleine boeren. Na de oogst verwerken ze verse baobab bladerentot droge bladeren en/of bladpoeder, worden baobab vruchten verwerkttot vruchtpoeder, tamarinde bladeren gedroogd, en tamarinde vruchtenontdaan van hun harde schil. In de voorliggende studie komt hetgedeelte van het beschikbaar inkomen, verkregen via de verkoop vanbaobab en tamarinde producten, op ongeveer 4 % voor de armste en5 % voot de rijkere ondervraagde kleine boeren in Mali, terwijl inBenin een bijdrage van om en bij de 11 % voor de armste groep kleineboeren werd gevonden. Deze cijfers tonen aan dat baobab en tamarindeproducten tot de zogenaamde ‘gap-filling ’ inkomenscategorie behoren.De meerderheid van de ondervraagde verzamelaars in Mali en Beninblijkt hun baobab en tamarinde producten te verkopen op de boerderij.Baobab en tamarinde vruchten en bladeren worden geoogst met behulpvan traditionele oogsttechnieken, die alleen handenarbeid en goedkoopgereedschap vereisen. De oogst van baobab bladeren heeft in vele gevalleneen negatieve invloed op de vruchtontwikkeling. Dit toont aan datduurzame oogsttechnieken moeten ontwikkeld en voorgesteld worden omplantensoorten te behouden en overexploitatie te vermijden. Tot slotvermeldden de ondervraagde verzamelaars in Mali en Benin gevaarlijkeoogsttechnieken, seizoensgebondenheid en beperkte beschikbaarheid vanbaobab en tamarinde producten, tijdrovende verwerkingsmethoden,productkwaliteit en een gebrek aan marktinformatie als hun belangrijksteproblemen.
Handelaars in baobab en tamarinde producten zijn voornamelijk vrouwen.Zij hebben diverse en uiteenlopende functies, wat wijst op een gebrek aanfunctionele specialisatie. Bevindingen in de onderhavige studie toondenhet bestaan van drie mogelijke prijszettingsprocessen aan: (i) eerlijke

xxxiii
onderhandeling, komt meestal voor wanneer het product op de marktwordt verkocht; (ii) handelaars hebben meer onderhandelingskracht,komt vooral voor wanneer het product op de boerderij wordt verkocht;en (iii) verzamelende producenten in Benin hebben meer invloed opprijsvorming dan handelaars. Het laatste geval toont aan dat collectieveactie een gunstig effect heeft op de onderhandelingsmacht van kleineboeren. Verder heeft de studie verschillende handelscentra geıdentificeerdvoor de handel in baobab bladpoeder, baobab vruchtpoeder entamarinde vruchten in Mali en Benin. De ondervraagde handelaarsmeldden als belangrijke problemen: variabele productkwaliteit, beperkteopslagruimte, transportmoeilijkheden als gevolg van slechte wegen, gebrekaan marktinformatie en geen toegang tot formele financiele diensten.
Baobab en tamarinde vruchten worden in Benin verwerkt tot vruchtensap,terwijl ze in Mali gebruikt worden in de bereiding van vruchtensap, siroop,confituur en instant poeder. Daarnaast wordt baobab vruchtpoederin Mali gemengd met gierstbloem om een creme te bereiden (lokaalgekend als degue). Verwerkingseenheden zijn over het algemeen geeneenmanszaken en de (familiale) verwerkingsbedrijven zijn betrokken bij deverwerking van een hele reeks verschillende producten. Niettegenstaandede handmatige verwerkingstechnieken en de eenvoud van de gebruikteapparatuur werd 63 en 49 % van de verwerkingseenheden, respectievelijkin Mali en Benin, efficient bevonden door middel van een data envelopmentanalyse. Dus, onder de gegeven omstandigheden in Mali en Benin blijkenverwerkingsbedrijven efficient te werken. De grootste kost voor verwerkersin beide landen is de kost van het verpakkingsmateriaal. Daarnaastzijn de voornaamste beperkingen van ondervraagde verwerkingsbedrijvenin Mali en Benin ongeschikt en duur verpakkingsmateriaal, beperktebeschikbaarheid van adequate verwerkingsapparatuur, slecht transport alsgevolg van een slechte wegeninfrastructuur, tekort aan financiele middelenen beperkte toegang tot marktinformatie.
Zowel landelijke als stedelijke consumenten kopen en gebruiken regelmatigbaobab en tamarinde producten. Baobab vruchtpoeder wordt gebruiktin de bereiding van pap en/of sap, terwijl baobab bladeren gebruiktworden in de bereiding van sauzen. De meerderheid van de ondervraagdeconsumenten gebruikt tamarinde bladeren en vruchten in de bereiding vansappen en/of om maaltijden een zure toets te geven. Substitutieproductenvoor alle baobab en tamarinde producten werden in de voorliggendestudie gerapporteerd en bevestigd door de literatuur. De voornaamste

xxxiv Summary - Resume - Samenvatting
problemen vermeld door consumenten zijn seizoensgebondenheid van hetaanbod, prijsschommelingen en onbetrouwbare productkwaliteit.
In totaal werden zes verschillende baobab en tamarinde producten in dezestudie vermeld als zijnde verhandeld in Mali en Benin. Gebaseerd op demarktketens die in kaart gebracht werden voor deze producten, kunnendrie verschillende ketens onderscheiden worden: (i) de marktketen vanverse baobab en tamarinde bladeren, gekenmerkt door hun lokaal belangen nationaal potentieel; (ii) de marktketen van droge baobab bladerenen baobab bladpoeder, gekarakteriseerd door hun belang op nationaalniveau en hun regionale potentieel; en (iii) de marktketen van baobab entamarinde vruchten, gekenmerkt door hun nationaal en regionaal belangen internationaal potentieel.
De voorliggende studie is de eerste die gekochte en verkochtehoeveelheden, en inkoop- en verkoopprijzen geregistreerd heeft voor dediverse actoren betrokken in de marktketen van baobab en tamarindeproducten in Mali en Benin. Gebaseerd op deze hoeveelheden en prijzenkan afgeleid worden dat baobab vruchtpoeder in grotere hoeveelhedenverhandeld wordt in Benin dan in Mali, terwijl baobab bladpoeder entamarinde vruchten in grotere hoeveelheden verkocht worden in Malidan in Benin. Prijzen zijn lager in Benin dan in Mali voor baobabvruchtpoeder en bladpoeder, terwijl tamarinde vruchten goedkoper zijn inMali in vergelijking met Benin. Bovendien geeft de commercialisering vanbaobab en tamarinde producten de mogelijkheid om veel werkgelegenheidte creeren. Daarnaast berekenden we de toegevoegde waarde van baobaben tamarinde producten en toonde aan dat verwerkers en verzamelaars dehoogst toegevoegde waarden voor hun rekening nemen. Deze trend blijktmeer uitgesproken te zijn in Mali dan in Benin. Gezien de toegevoegdewaarde echter geen rekening houdt met eventuele kosten, is het onmogelijkom uitspraken te doen over welke actor de hoogste marges heeft.
De oogst van baobab en tamarinde vruchten en baobab bladerenis sterk seizoensgebonden. Dit weerspiegelt zich verder ook in decommercialisering van baobab en tamarinde producten die vooral tijdenshet droge seizoen plaats vindt in Benin. In Mali is de waargenomen handelin baobab en tamarinde producten minder seizoensgebonden. Er is echtergeen seizoensgebonden opslag aangetoond in Mali noch in Benin wat tewijten is aan een gebrek aan opslaginfrastructuur, ruimte en financielemiddelen. Het merendeel van de ondervraagde actoren in de ketenkoopt een bepaalde hoeveelheid van een product aan, die dan opgeslagen

xxxv
wordt totdat alles verkocht is, waarna de voorraad opnieuw aangevuldwordt. Als gevolg hiervan is de waargenomen opslagduur zeer variabel.Gedroogde baobab en tamarinde producten worden hoofdzakelijk bewaardin gerecycleerd rijstzakken die opgeslagen worden in het huis of ineen magazijn/graanschuur, in respectievelijk Benin en Mali. Hoewelvochtigheid en schade door insecten, muizen en schimmels gemeld werdenals de belangrijkste problemen tijdens de opslag, scoorden de informantende globale bewaarcondities als goed.
Geen enkel baobab en tamarinde product wordt gesorteerd ofgestandaardiseerd. Directe inspectie is de enige gerapporteerde methodeom productkwaliteit te beoordelen. Bovendien werd waargenomendat verschillende actoren verschillende kwaliteitscriteria gebruiken.Alle actoren in Mali en Benin hechten groot belang aan deverwerkingstechnieken en opslagmethoden van baobab en tamarindeproducten, en verwachten een goed gedroogd of fijn gemalen productzonder onzuiverheden dat niet werd blootgesteld aan vochtigheid.Daarenboven vormen kleur en smaak belangrijke kwaliteitsparametersin Mali, terwijl enkel smaak een criterium is in Benin voor dekwaliteitscontrole van baobab en tamarinde vruchten. Rijpheid, versheiden grootte, samen met de afwezigheid van insecten of beschadigingen zijnbelangrijke kwaliteitscriteria bij de beoordeling van tamarinde vruchtenen bladeren in Mali. Dezelfde criteria worden gebruikt in Benin om dekwaliteit van verse baobab bladeren evalueren.
Een gebrek aan marktinformatie wordt erkend door alle actoren als eenbelangrijke beperking in de commercialisering van baobab en tamarindeproducten in Mali en Benin. Informatie ontbreekt in het bijzonder overoogstmethoden, verwerkingstechnieken, prijs, kwaliteit en vraag. Actorenin Mali hebben voornamelijk nood aan meer informatie over de vraagnaar baobab en tamarinde producten en vermelden dat ze niet tevredente zijn met de toegang tot marktinformatie. Daarentegen hebben deondervraagde actoren in Benin nood aan informatie over kwaliteit enzeggen ze tevreden te zijn met de algemene informatievoorziening.
Lokale ketenontwikkeling moet relaties uitbouwen en vertrouwenversterken tussen de verschillende actoren in de marktketen. Aanbevoleninterventies kunnen geformuleerd worden op verscheidene vlakken:(i) parallelle domesticatie en commercialisering van baobab entamarinde; (ii) opleiding van kleine boeren om hun productieniveau enmanagementvaardigheden te verbeteren; (iii) ondersteuning van kleine

xxxvi Summary - Resume - Samenvatting
boeren om zich te associren, samen te werken en te coordineren met hetoog op het behalen van schaalvoordelen in hun transacties met kopers;(iv) informatiekanalen en marketinzichten toegankelijk maken voor alleactoren; (v) mogelijkheid bieden aan actoren om inzicht te krijgen inproduct, proces of leveringsnormen van kopers en hieraan tegemoette komen; en (vi) verbetering van marktinstellingen. Zodra de grotebeperkingen op nationaal vlak zijn aangepakt, kan de commercialiseringvan baobab en tamarinde producten op regionaal en internationaal niveauworden ontwikkeld en uitgebreid.
Tot slot kan vermeld worden dat de meeste aspecten, bestudeerd in hetvoorliggende onderzoek, van de marktketens van baobab en tamarindeproducten in Mali en Benin – volgens de auteur – nog niet eerderonderzocht of elders gepubliceerd werden. Daarom moet dit onderzoekbeschouwd worden als een pilootstudie die als doel heeft inzicht teverwerven in de marktstructuur en -werking van de markten van baobaben tamarinde producten.
1Introduction
2 Chapter 1. Introduction
The present chapter presents the context, state of the art, justification andproblem statement of this PhD research, together with the objectives andoutline.
1.1 Context
Today, only 30 plant species are used to meet 95 % of the world’sfood energy needs, whereas more than half of the needs for energy andproteins are being met by only three crops, i.e. maize, wheat andrice (Prescott-Allen & Prescott-Allen, 1990; FAO, 1997, 2010e). Thesecrops are widely and intensively cultivated and have been selected froma large agrobiodiversity basket containing more than 7000 food species,which is approximately one tenth of the estimated number of ediblespecies present in nature (Prescott-Allen & Prescott-Allen, 1990; FAO,1997; IPGRI, 2002; Williams & Haq, 2002; FAO, 2010e). In contrast,ethnobotanical surveys, particularly in the marginal environments ofdeveloping agricultural economies, have evidenced that many lesser knownor underutilised species continue to be cultivated or harvested (FAO,1996; Gebauer et al., 2002a; IPGRI, 2002) (see Box 1.1 for a definition ofunderutilised species). Many authors (FAO, 1996; Padulosi et al., 1999;Lockett & Grivetti, 2000; Gebauer et al., 2002a; IPGRI, 2002; Padulosiet al., 2002; Williams & Haq, 2002; Hughes & Haq, 2003; Giuliani &Padulosi, 2005; Giuliani et al., 2007; Giuliani, 2007; Akinnifesi et al., 2005;Kazembe-Phiri, 2005; Gruere et al., 2006; Dawson et al., 2007; Nevenimoet al., 2007; Will, 2008) recognised that embedding these underutilisedspecies into traditional household systems holds significant potential for:
• improving food security and achieving more balanced nutrition forthe rural and urban poor (i.e. social benefits);
• conserving biodiversity and stabilising agro-ecosystems (i.e.environmental benefits); as well as
• generating income for the rural poor and creating employment alongthe value chain (i.e. economic benefits).
Agricultural biodiversity and its potential as a driver of economic growth,food security and natural resource conservation has gathered an increasingamount of interest within the scientific community (Neumann & Hirsch,2000; Arnold & Ruiz Perez, 2001; Marshall et al., 2003; Belcher, 2005;Belcher et al., 2005; Belcher & Schreckenberg, 2007) since the Convention
1.1. Context 3
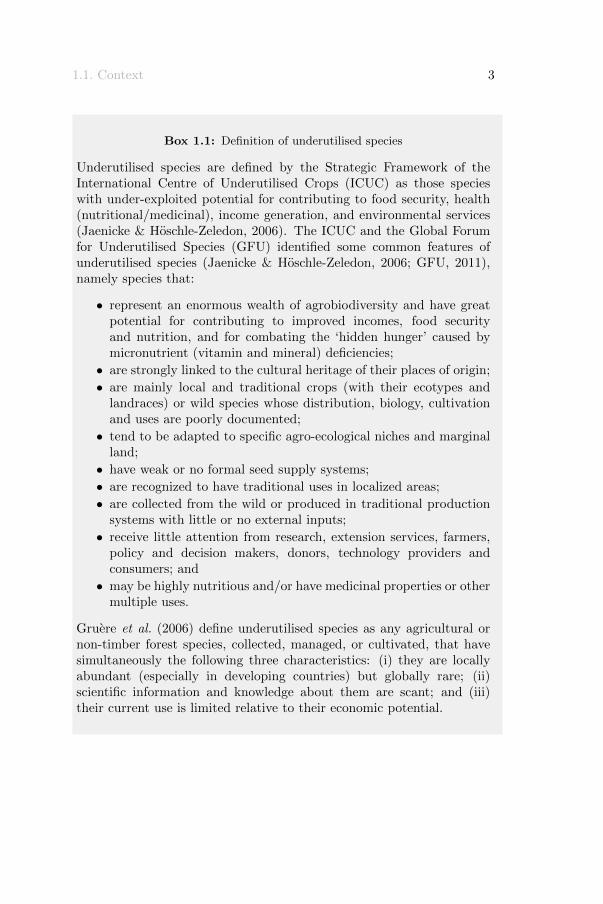
Box 1.1: Definition of underutilised species
Underutilised species are defined by the Strategic Framework of theInternational Centre of Underutilised Crops (ICUC) as those specieswith under-exploited potential for contributing to food security, health(nutritional/medicinal), income generation, and environmental services(Jaenicke & Hoschle-Zeledon, 2006). The ICUC and the Global Forumfor Underutilised Species (GFU) identified some common features ofunderutilised species (Jaenicke & Hoschle-Zeledon, 2006; GFU, 2011),namely species that:
• represent an enormous wealth of agrobiodiversity and have greatpotential for contributing to improved incomes, food securityand nutrition, and for combating the ‘hidden hunger’ caused bymicronutrient (vitamin and mineral) deficiencies;
• are strongly linked to the cultural heritage of their places of origin;
• are mainly local and traditional crops (with their ecotypes andlandraces) or wild species whose distribution, biology, cultivationand uses are poorly documented;
• tend to be adapted to specific agro-ecological niches and marginalland;
• have weak or no formal seed supply systems;
• are recognized to have traditional uses in localized areas;
• are collected from the wild or produced in traditional productionsystems with little or no external inputs;
• receive little attention from research, extension services, farmers,policy and decision makers, donors, technology providers andconsumers; and
• may be highly nutritious and/or have medicinal properties or othermultiple uses.
Gruere et al. (2006) define underutilised species as any agricultural ornon-timber forest species, collected, managed, or cultivated, that havesimultaneously the following three characteristics: (i) they are locallyabundant (especially in developing countries) but globally rare; (ii)scientific information and knowledge about them are scant; and (iii)their current use is limited relative to their economic potential.
4 Chapter 1. Introduction
on Biological Diversity (Rio, 1992) and the Global Plan of Action forthe Conservation and Sustainable Utilization of Plant Genetic Resourcesfor Food and Agriculture (FAO, 1996; Padulosi et al., 2002; Belcher &Schreckenberg, 2007; Giuliani, 2007; Irungu, 2007; FAO, 2010e). The Foodand Agriculture Organisation of the United Nations (FAO) was one of thefirst agencies to promote non-timber forest products (NTFPs) through itsprogramme on non-wood forest products (NWFPs) (FAO, 1999b) (seeBox 1.2 for a definition of NTFPs). In addition, the Consultative Groupon International Agricultural Research (CGIAR) recently expanded itsresearch agenda to include also underutilised species (CGIAR ScienceCouncil, 2005). Bioversity International, for example, recognises the needof urgent action to promote a more diverse portfolio of species to be used inagriculture (IPGRI, 2002). Over the past years, many other internationalagencies such as the World Bank, International Development ResearchCentre (IDRC) and International Union for the Conservation of Nature(IUCN), among others, have incorporated the concepts of underutilisedspecies and/or NTFPs into their research and development programmes(Ahenkan & Boon, 2011).
Within the context of emerging new international commitments toaddress rural poverty, such as the Millennium Development Goals(MDGs), commercialisation of NTFPs has been promoted by researchers,conservation and development organisations, and, more recently, bygovernments, as a means to achieve rural livelihood improvement inan environmentally sound way (FAO, 1995a; Pimentel et al., 1997;Wollenberg & Ingles, 1998; Leakey, 1999; Neumann & Hirsch, 2000; Ros-Tonen, 2000; Arnold & Ruiz Perez, 2001; Marshall et al., 2003; Angelsen& Wunder, 2003; Garrity, 2004; Sunderland & Ndoye, 2004; Belcher,2005; Belcher et al., 2005; Kruijssen et al., 2009). In sub-Saharan Africa(SSA), too, there is an increased emphasis on the need to integratelocal development concerns, including the extraction of NTFPs, intoconservation projects (Neumann, 1996). Global harvest of NTFPs iseconomically very significant. An estimated 80 % of the population ofthe developing world uses NTFPs for its daily needs (Bennett, 2002), andthe value of global trade in NTFPs has been estimated at 18.5 billion $ US(FAO, 2011b).
Research on NTFPs has mainly focused on the humid tropics(Schreckenberg, 1999). However, it is recognised that not all NTFPsoriginate from pure forests (see definition in Box 1.2), but also from the
1.1. Context 5
Box 1.2: Definition of non-timber forest products
The term non-timber forest products (NTFPs), encompassing allbiological materials other than timber extracted from forests for humanuse, was first coined by de Beer & McDermott (1989). With ‘forest’the latter authors referred to a natural ecosystem in which trees area significant component. However, forest products are derived notonly from trees, but from all plants, fungi and animals (including fish)for which the forest ecosystem provides a habitat (Ros-Tonen, 1999;Neumann & Hirsch, 2000; Belcher, 2003; Ahenkan & Boon, 2011).
Literally, NTFPs include all products that are derived from forests withthe exception of timber. In practice, and due to the fact that NTFPs aremostly defined by what they are not (Belcher, 2003), various productsand production environments are included or excluded depending on theobjectives of the author (Belcher, 2005; Ahenkan & Boon, 2011). Due toan overabundance of terminologies which has been used interchangeablyby various authors and organisations, a lot of confusion is associatedwith NTFPs semantics and terminologies (Ros-Tonen, 2000; Belcher,2003; Vantomme, 2003a; Quang & Anh, 2006; Rajchal, 2006; Belcher &Schreckenberg, 2007; Ahenkan & Boon, 2011). NTFPs have proved tobe difficult to clearly define because of the blurred boundaries betweentimber and non-timber products and the underlying difficulty in defininga forest (Ahenkan & Boon, 2011). Consequently, the meaning of NTFPshas generated a lot of controversy and there is no universally acceptedoperational definition of NTFPs (Belcher, 2003; Ahenkan & Boon, 2011).However, there are five main elements to the interpretation of the NTFPconcept that seem to matter most to users, namely the (i) nature ofthe product/service, (ii) source of the product/source, (iii) productionsystem, (iv) scale of production, and (v) ownership and distribution ofbenefits (Rajchal, 2006).
The Food and Agriculture Organisation of the United Nations (FAO)has been a strong proponent of a clear and consistent definition andelected to use the term non-wood forest products (NWFPs) (Belcher,2003). NWFPs are defined to consist of goods of biological origin otherthan wood, derived from forests, other wooded land and trees outsideforests (FAO, 1999b).
6 Chapter 1. Introduction
many other environments used by people, including intensively managedfields, fallows and savannah vegetations (Lintu, 1995; Schreckenberg,1999, 2000). The majority of species yielding important NTFPs inWest Africa are located in fields and fallows, and form an integral andoften characteristic part of local and regional landscapes, also knownas agroforestry parklands (Schreckenberg, 1999, 2000) (see Box 1.3 fora definition of agroforestry parklands). Therefore, an alternative termhas been suggested for NTFPs from managed agroforestry systems, suchas parklands, namely agroforestry tree products (AFTPs) (Simons &Leakey, 2004) (see Box 1.3). Leakey & Simons (1998) and Leakey et al.(2005) referred to agroforestry trees as ‘Cinderella’ tree species since theirpotential is yet to be unveiled. These traditionally important indigenousspecies have long been overlooked by science. However, if carefullypromoted and marketed, they may alleviate rural poverty and increase thesustainability of agroecosystems (Simons, 1996; Leakey & Simons, 1998;Leakey et al., 2005). Up till now, farmers typically do not plant theseindigenous trees but protect specimens of interest that grow naturally fortheir own use (Jama et al., 2008).
Many rural households rely on indigenous trees as sources of cash andsubsistence, but until recently there has been little effort to cultivate,improve or add value to these species (Akinnifesi et al., 2006). Since1994, the International Centre for Research in Agroforestry (ICRAF,now the World Agroforestry Centre) initiated a worldwide programmeto domesticate the species identified by local people as their priorityfor cultivation in agroforestry systems (Leakey & Simons, 1998; Leakey,1999; Leakey et al., 2005; Tchoundjeu et al., 2010). The priority speciesfor the semi-arid lowlands of West Africa are (i) Adansonia digitata orbaobab tree, (ii) Vitellaria paradoxa or shea tree (karite), (iii) Parkiabiglobosa or African locust bean tree (nere), (iv) Tamarindus indicaor tamarind tree, and (v) Zizyphus mauritiana or ber tree (jujubier)(Franzel et al., 1996). Tree domestication is conceived as a farmer-driven and market-led process (Simons & Leakey, 2004; Leakey et al.,2005). It aims to significantly increase and stabilise the income, food andhealth situation of rural households and their extended families throughimprovement of AFTPs (Gebauer et al., 2002b; Garrity, 2004; Simons& Leakey, 2004; Leakey et al., 2005; Tchoundjeu et al., 2006, 2007;Kalinganire et al., 2007; Nevenimo et al., 2007; Tchoundjeu et al., 2010).Discussion of the role of domestication cannot, however, be divorced fromthat of commercialisation, since without an expanded or a new market the
1.1. Context 7
Box 1.3: Definition of agroforestry, agroforestry parklands and agroforestrytree products
Agroforestry is a collective term for land use systems and practices inwhich woody perennials are deliberately integrated with crops and/oranimals on the same land management unit, either in a spatial mixtureor a temporal sequence (Leakey & Izac, 1996).
Agroforestry parklands are characterized by well-grown scatteredtrees on cultivated and recently fallowed land (Verheij, 2003) andare thus mixtures of trees and shrubs that farmers select for certainfunctions and cultivate together with staple food crops (Kalinganireet al., 2007). In the Sahel, agroforestry parklands are the principalagricultural system used by subsistence farmers (Boffa, 1999; Verheij,2003). In Mali, for example, parklands occupy approximately 90 % ofthe agricultural land. As agroforestry parklands are managed to fitenvironmental conditions and to fulfil multiple functions (Verheij, 2003;Kalinganire et al., 2007; Stoate & Jarju, 2008), they vary in speciescomposition and density within and among countries in any region dueto farmers’ attitudes toward trees in cultivated fields (Verheij, 2003;Kalinganire et al., 2007). In West Africa, indigenous trees species such asVitellaria paradoxa, Parkia biglobosa, Adansonia digitata, Tamarindusindica, Borassus aethiopium, Faidherbia albida, Balanites aegyptiaca andAcacia spp. have been recorded in parklands (Boffa, 1999; Verheij,2003).
The term agroforestry tree products (AFTPs) has been introducedby Simons & Leakey (2004) to refer to NTFPs that are sourced from treesin farming systems, thus from trees cultivated outside forests (Leakeyet al., 2005; Nevenimo et al., 2007). The aim of introducing this term wasto avoid some of the confusion occurring in the current NTFP literature(Belcher, 2003; Leakey et al., 2005) (see Box 1.2).
8 Chapter 1. Introduction
incentives to domesticate intensively for self-use are insufficient (Leakey &Simons, 1998; Akinnifesi et al., 2006; Tchoundjeu et al., 2007). Nowadays,throughout the tropics most products of indigenous trees are marketedlocally on a small scale, as a means of generating cash to supplement asubsistence lifestyle (Arnold, 1995; Lamien et al., 1996). However, thereis great potential for indigenous fruit tree species in regional and evenworld markets, and it is hoped that research and development towardsbetter understanding and utilization of these species will be stimulated inthe near future (Gruere et al., 2006).
Recently, several regional and international projects in West Africa havefocused on biodiversity and the sustainable use of natural resources.The SSA forest genetic resources programme (SAFORGEN) of BioversityInternational (formerly known as the International Plant GeneticResources Institute (IPGRI)) aims at enabling people and institutionsin SSA to maintain and make the best use of forest biodiversity bydeveloping an effective networking platform (Bioversity International,2011). Other examples are the EU-funded projects SAFRUIT, SUN andDADOBAT. The Sahelian fruit trees project (SAFRUIT) has as objectivethe contribution to increased food security and sustainable livelihoodfor people living in the sorghum and millet-based production systems inBurkina Faso, Mali and Niger, through facilitating access to knowledgeand germplasm of underutilised fruit tree species (A. digitata, P. biglobosa,T. indica and Z. mauritiana) (SAFRUIT, 2004). The acronym of theSUN project stands for tools for management and sustainable use ofnatural vegetation in West Africa. This project aims at developingnew, practical management tools and concrete management actions forimproved sustainable use of natural vegetation by combining scientificvegetation data, remote sensing and socio-economic information with localpeople’s knowledge and needs (SUN, 2005). At last, the DADOBATproject stands for domestication and development of baobab and tamarindand its overall objective is to develop sustainable production systems ofboth baobab and tamarind in the West African countries Benin, Mali andSenegal (DADOBAT, 2006). The latter project, and in particular thesixth work package dealing with the market chain of baobab and tamarindproducts, forms the framework of the present doctoral study (see Box 1.4for more details about the DADOBAT project).

1.1. Context 9
Box 1.4: Domestication And Development Of Baobab And Tamarind
The INCO-CT-2006-032217-DADOBAT project, or shortly DADOBAT,was funded during the 2006-2010 period by the European Commissionunder the Sixth Framework Programme. The acronym DADOBATstands for Domestication And Development Of Baobab And Tamarind.Six partners were involved: (i) Laboratory of Tropical and SubtropicalAgronomy and Ethnobotany, Ghent University, Belgium (coordinator);(ii) Centre for Underutilised Crops, University of Southampton, UnitedKingdom; (iii) Institute of Organic Farming, University of NaturalResources and Life Sciences, Austria; (iv) Laboratory of AppliedEcology, University of Abomey-Calavi, Benin; (v) Institute of RuralEconomy, Mali; and (vi) Regional Centre for Studies on the Improvementof Plant Adaptation to Drought, Senegal.
The overall strategic objective of the DADOBAT project is to developsustainable production systems for baobab (Adansonia digitata L.) andtamarind (Tamarindus indica L.) in West Africa (more specificallyin Benin, Mali and Senegal) based on characterisation, conservationand use of local genetic resources (http://www.dadobat.soton.ac.uk).This is expected to have a positive impact on food security andincome generation in the south countries involved in the project. Sixresearch-oriented work packages were defined in order to meet theproject’s overall objective: (i) field characterisation of plant material;(ii) eco-physiological characterisation of plant material for understandingdrought stress tolerance and resistance; (iii) domestication; (iv)development of improved cropping techniques; (v) characterisation ofnutritional and medicinal properties of primary and secondary products;and (vi) production and marketing chain analysis.
10 Chapter 1. Introduction
1.2 State of the art
Up till now, many studies have been carried out on ethnobotanicalknowledge and the multiple uses of baobab and tamarind in (West) Africa(Burkill, 1985; Wickens, 1982; Sidibe & Williams, 2002; Diop et al., 2005;Assogbadjo, 2006; Assogbadjo et al., 2006a; El-Siddig et al., 2006; Wickens& Lowe, 2008; Assogbadjo et al., 2008; Kumar & Bhattacharya, 2008;Assogbadjo et al., 2009b; De Caluwe et al., 2009a; Buchmann et al., 2010;van der Stege, 2010; van der Stege et al., 2011), as well as their processing(Sidibe & Williams, 2002; El-Siddig et al., 2006; Chadare et al., 2008;Kumar & Bhattacharya, 2008; Chadare, 2010), and biochemical properties(Ishola et al., 1990; Saka & Msonthi, 1994; Yazzie et al., 1994; Siddhurajuet al., 1995; Nordeide et al., 1996; Sidibe et al., 1996; Smith et al., 1996;Glew et al., 1997; Igboeli et al., 1997; Barminas et al., 1998; Sena et al.,1998; Lockett et al., 2000; Sidibe & Williams, 2002; Osman, 2004; Solovievet al., 2004; Diop et al., 2005; Glew et al., 2005; Assogbadjo, 2006; El-Siddig et al., 2006; Chadare et al., 2009; De Caluwe et al., 2009b,c;Chadare, 2010; De Caluwe et al., 2010a,b).
In addition, several works have focused on botanical description,distribution, ecology and ecological diversity of both species in West Africa(Fenner, 1980; Wickens, 1982; Morton, 1987; Baum et al., 1998; Sidibe &Williams, 2002; Assogbadjo et al., 2005a; Diop et al., 2005; Assogbadjo,2006; El-Siddig et al., 2006; Wickens & Lowe, 2008; Assogbadjo et al.,2009b; Bourou et al., 2010; Fandohan et al., 2011c), whereas other authorsinvestigated several aspects concerning their reproductive biology, such asphenology, pollination and natural regeneration (Baum, 1995a; Sidibe &Williams, 2002; Assogbadjo et al., 2005a; Diop et al., 2005; Assogbadjo,2006; El-Siddig et al., 2006; Diallo et al., 2008), and agronomy, includinggerminative and vegetative propagation, productivity, management, andpests and diseases (Danthu et al., 1995; Sidibe & Williams, 2002; Dhillion& Gustad, 2004; Assogbadjo et al., 2005a,b; Diop et al., 2005; Assogbadjo,2006; El-Siddig et al., 2006; Diallo et al., 2008; Wickens & Lowe, 2008;Assogbadjo et al., 2009b; Fandohan et al., 2010b; Assogbadjo et al., 2011;Fandohan et al., 2011c).
Recently there has been a growing interest in morphological variabilityof baobab and tamarind trees (Sidibe & Williams, 2002; Assogbadjoet al., 2005b; Assogbadjo, 2006; Assogbadjo et al., 2006b; El-Siddiget al., 2006; Assogbadjo et al., 2009a; Cuni Sanchez et al., 2010; Diallo

1.3. Justification and problem statement 11
et al., 2010; Fandohan et al., 2010b; Assogbadjo et al., 2011; Fandohanet al., 2011a; Kouyate et al., 2011) and the implications for conservation,genetic variation and selection (Sidibe & Williams, 2002; Assogbadjo,2006; Assogbadjo et al., 2006b; El-Siddig et al., 2006; Diallo et al., 2007,2008; Wickens & Lowe, 2008; Assogbadjo et al., 2009a,b; Kyndt et al.,2009; Assogbadjo et al., 2010; Fandohan et al., 2010c, 2011b).
Finally, several authors (Lamien et al., 1996; Ambe, 2001; Codjia et al.,2001; Eyog Matig et al., 2002; Sidibe & Williams, 2002; Codjia et al.,2003; Assogbadjo, 2006; El-Siddig et al., 2006; Chadare et al., 2008;Teklehaimanot, 2008) agreed on the socio-economic importance of baobaband tamarind in West Africa and reported on the existence of domestic –and even sub-regional – markets for both species’ products.
1.3 Justification and problem statement
In 2009, 1,023 million people in the world were undernourished (FAO,2010f), particularly people living in developing countries. The proportionof undernourished people remains highest in SSA, at about 30 % (FAO,2010f). In addition, at least two billion people, mostly in developingcountries, suffer from ‘hidden hunger’, i.e. mineral and vitamindeficiencies, especially iron and vitamin A (Micronutrient Initiative, 2004,2009). FAO (2010a,c) reported respectively that 12 % of the totalpopulation in both Mali and Benin was undernourished in the period2005-07 with high levels of vitamin A and iron deficiency (FAO, 1999a,2003). Indeed, in Mali and Benin, the Micronutrient Initiative (2004)reports an estimated prevalence of iron deficiency anaemia in childrenunder five years of age of 77 and 82 %, respectively, whereas estimatedpercentage of children under six with sub-clinical vitamin A deficiency is70 and 47 %, respectively.
Although general poverty rate in developing countries dropped from 46 %in 1999 to 27 % in 2005 (United Nations, 2010), SSA is still facing extremepoverty. In 2005, 51 % of the population in SSA was estimated to liveon less than 1.25 $ a day (United Nations, 2010), which is considered asthe international poverty line (Ravallion et al., 2009). Mali and Beninare among the poorest countries in the world (UNDP, 2010c), with,in the 2005-07 period, an estimated poverty incidence at national levelof 63.8 and 39.0 %, respectively (FAO, 2010b,d). Based on the humandevelopment index (HDI), Mali and Benin occupy respectively place 160
12 Chapter 1. Introduction
and 134 on 169 countries (UNDP, 2010c).
In general, Mali and Benin are both characterised by high rates of ruralpoverty, low basic health services, problematic and unstable food security,and unsustainable use of natural resources (Ministere du DeveloppementSocial de la Solidarite et des Personnes Agees & UNDP, 2005; UNDP,2008; UNDP & Ministere du Developpement Social, de la Solidarite etdes Personnes Agees, 2008). Both countries are not considered to be inprotracted crisis 1 according to FAO (2010f), and rural and urban peopleremain very dependent on the multiple goods and services supplied byindigenous trees and woody plants (FAO, 2001).
Any attempt to find sustainable solutions to the problems listed for Maliand Benin should take into account locally known, used and availablenatural resources (Chadare, 2010). Governments in both countries haverecognised that, for poverty reduction, small-scale farmers can profitfrom the sustainable utilisation and valorisation of agroforestry systems(IMF, 2008a,b), thus including AFTPs. Bioversity International expectsthat AFTPs have the potential to play a major role in future cropdevelopment programmes and in the development of agroforestry systemsin Mali and Benin (Eyog Matig et al., 2002). Within the scope ofthe SAFORGEN programme of Bioversity International, each countryselected ten agroforestry tree species as priority species to domesticate,valorise and conserve. The species were selected by local communitiesbased on their social, cultural, nutritional and economical importance,their processing potential, their availability on the local market, theirease of access, their present use and their risks of extinction. Among theselected species are both baobab (Adansonia digitata L.) and tamarind(Tamarindus indica L.). Not only Bioversity International (Eyog Matiget al., 2002) has accorded high priority to enhance research on anddevelopment of baobab and tamarind, also the International Centre forUnderutilised Crops (ICUC) (Sidibe & Williams, 2002; El-Siddig et al.,2006), the World Agroforestry Centre (Franzel et al., 1996; Kalinganireet al., 2007; Franzel et al., 2008; Jama et al., 2008) and the FAO (FAO,2001) have classified baobab and tamarind among the top agroforestrytree species to be conserved and domesticated in West Africa.
Baobab and tamarind are both multi-purpose agroforestry tree species
1Protracted crisis situations are characterized by recurrent natural disasters and/orconflict, longevity of food crises, breakdown of livelihoods and insufficient institutionalcapacity to react to the crises (FAO, 2010f).
1.3. Justification and problem statement 13
which are daily used by local populations in West Africa (Assogbadjoet al., 2006a). Research in Benin has found 38 and 26 different uses forrespectively baobab and tamarind products (De Caluwe et al., 2009a;Fandohan et al., 2010a). Throughout West Africa, baobab and tamarindproducts are reported to be used by local people forming a significant partof their daily diet and pharmacopoeia (Sidibe & Williams, 2002; El-Siddiget al., 2006), and to generate income via local trade (Leakey & Simons,1998; Eyog Matig et al., 2002; Diop et al., 2005; Teklehaimanot, 2008;Jama et al., 2008; Fandohan et al., 2010a). Both baobab and tamarindproducts are reported to be rich in carbohydrates, proteins (includingessential amino acids), several minerals such as calcium and iron, and/orvitamins A and C (Sidibe & Williams, 2002; El-Siddig et al., 2006).Despite their priority to research and development, and their widelyaccepted potentialities and importance, both species remain underutilised(Sidibe & Williams, 2002; El-Siddig et al., 2006; GFU, 2011).
As mentioned before, to be successful, tree domestication has to be linkedto commercialisation and market expansion (Tchoundjeu et al., 2007).However, Lombard & Leakey (2010) documented that, up till now and ingeneral, developments in agroforestry tree domestication have not beenadequately linked to commercialisation processes. In addition, on theone hand, baobab and tamarind are identified by local communities inMali and Benin as priority species for domestication (Franzel et al., 1996;FAO, 2001; Eyog Matig et al., 2002), and, on the other hand, accordingto recent information, participative domestication programmes of baobaband tamarind are getting started in West Africa (personal communicationby Ann Degrande and Antoine Kalinganire, World Agroforestry Centre).Therefore, market information of baobab and tamarind products in WestAfrica is needed.
Notwithstanding the great agronomic, ecological, nutritional, cultural andeconomic importance of baobab and tamarind products in West Africaand particularly in Mali and Benin, as demonstrated above, very littleinformation is – to the author’s knowledge – available on the basic marketfunctioning and structures, such as stakeholders involved, trade channelsand/or patterns of value adding along the market chain. This informationgap has also been recognised by Walter (2001) and Jaenicke (2006).Moreover, Sidibe & Williams (2002) and El-Siddig et al. (2006) concludedthat there is a total lack of socio-economic research at all levels along theproduction-to-consumption chain.
14 Chapter 1. Introduction
The present PhD thesis thus is the first study that attempts to fillthis information gap, and aims at contributing to a better knowledgeof the market chain(s) of baobab and tamarind products in Mali andBenin. Therefore, market surveys have been conducted to identify pricesand quantities of baobab and tamarind products in rural and urbanmarkets in Mali and Benin. In addition, exploratory research has beenperformed by applying a market chain analysis to map market chain(s)of the different products, identify stakeholders, and analyse harvesting,processing, storage and trading practices. Local market surveys arenecessary to identify potential markets for various products of baobaband tamarind.
As a result, the following research questions were formulated.
• Who is participating in the production-to-consumption chain(s) ofbaobab and tamarind products in Mali and Benin, what are theirroles and which challenges do they face?
• What are the linkages and interactions between the stakeholders inthe market chain(s) of the different baobab and tamarind productsin Mali and Benin?
• Which quantities of baobab and tamarind products are traded inMali and Benin, and at which prices?
• How can harvesting, processing, storage and trading practices ofbaobab and tamarind products in Mali and Benin be characterised,who is involved and what are their constraints?
• What are strengths, weaknesses, opportunities and threats ofproduction-to-consumption chain(s) of baobab and tamarindproducts in Mali and Benin, and which are their food security, socio-economic, economic and environmental impacts?
• How can local market chain(s) of baobab and tamarind products inMali and Benin be developed in order to better valorise the products,and which interventions can be recommended to this end?
Answers on these questions will help on the one hand to improve theorganisation of the market chain(s) of baobab and tamarind products inMali and Benin, and on the other hand to better valorise their products.
1.4. Objectives 15
1.4 Objectives
The overall objective of the present PhD research is to obtain insightin the structure and functioning of the markets of baobab and tamarindproducts in Mali and Benin. To achieve this goal, the following specificresearch objectives are set:
1. identify all chain actors involved in the market(s) of baobaband tamarind products in Mali and Benin, and describe theircharacteristics, activities and linkages;
2. map the market(s) of baobab and tamarind products in Mali andBenin;
3. analyse and compare the market chain of baobab and tamarindproducts in Mali and Benin; and
4. formulate possible scenarios on how to add more value to baobab andtamarind products in Mali and Benin, and how to better organisetheir market chains.
1.5 PhD thesis outline
The present chapter, chapter one, presents the context of this PhD thesisand state of the art, together with its justification and problem statement,objectives and outline.
In chapter two, a brief literature review about the distribution,botany, uses and nutritional value of baobab and tamarind is given.Characteristics, functions and actors of food markets in sub-SaharanAfrica found in literature are described, marketing of underutilisedplant species is documented,and principles and methods of market chainanalysis explained.
Subsequently, the methodology of the present research is given in chapterthree by explaining the data collection, and quantitative and qualitativeanalyses methods used in this study. In addition, the study area is brieflypresented and a comparison between Mali and Benin is given.
In chapter four, the results of the baobab and tamarind market chainanalysis in Mali and Benin are presented. First, the roles and interestsof the different market chain actors are presented. Secondly, the marketmaps of different baobab and tamarind products are drawn to show the
16 Chapter 1. Introduction
linkages between chain actors involved in transferring the products fromgatherer to consumer. Finally, data on quantities, prices, added value,gathering techniques, buying and selling period, storage and processingpractices, uses and consumption trends, trade centres, quality criteria,information flow and problems are presented to analyse the market chainsof baobab and tamarind products in Mali and Benin.
Furthermore, in chapter five, the results are discussed and confrontedwith findings of other authors. A SWOT and impact analysis ofmarket chains of baobab and tamarind products in Mali and Benin arepresented. Additionally, possible scenarios for intervention are formulatedand substantiated with references on how to add more value to baobab andtamarind products and how to improve the organisation of their marketchains.
Finally, chapter six gives the overall conclusions of this PhD researchbased on the objectives and formulates directions for future research.
2Literature review
18 Chapter 2. Literature review
This chapter starts with a brief literature review about the distribution,botany, uses and nutritional value of baobab and tamarind. Then,characteristics, functions and actors of food markets in sub-SaharanAfrica found in literature are described and marketing of underutilisedplant species is documented. Finally principles and methods of marketchain analysis are explained.
2.1 Baobab (Adansonia digitata L.)
Based on:
De Caluwe E., Halamova K. & Van Damme P. (2010). Adansonia digitata L.– A review of traditional uses, phytochemistry and pharmacology. AfrikaFocus, 23:11-51.
De Caluwe E., Halamova K. & Van Damme P. (2009). Adansonia digitataL. – A review of traditional uses, phytochemistry and pharmacology. InJuliani H., Simon J. and Ho C., editors, African Natural Plant Products:Discoveries and Challenges in Quality Control, chapter 4, pp. 51–84.American Chemical Society, Washington DC, USA.
2.1.1 Distribution
The baobabs comprise eight species in the genus Adansonia: six endemicto Madagascar, one to north-western Australia and one originally comingfrom continental Africa (Wickens, 1982; Baum et al., 1998). The Africanbaobab or Adansonia digitata is native to (semi-)arid sub-Saharan Africa(Wickens, 1982; Sidibe & Williams, 2002; Yazzie et al., 1994), and becameiconic for Sudano-Sahelian savannahs (Sidibe & Williams, 2002; Diopet al., 2005) and Sahelian tropical grasslands (Diop et al., 2005). Itsdistribution area is large and this species can be found in most of sub-Sahara Africa’s semi-arid and sub-humid regions as well as in westernMadagascar (Diop et al., 2005). However, baobab populations in WestAfrica are isolated from those in East Africa by a major and not fullyexplained gap which includes the Central African Republic (Wickens,1982). It has been introduced to tropical and subtropical areas outsideAfrica and can be grown successfully there (Sidibe & Williams, 2002;Bosch et al., 2004). The baobab tree is resistant to fire, termitesand drought, and prefers a high watertable, but is very sensitive towaterlogging and frost (Wickens, 1982; Baum, 1995b; Gebauer et al.,2002a; Sidibe & Williams, 2002; Bosch et al., 2004; ICRAF, 2007a). Quite

2.1. Baobab (Adansonia digitata L.) 19
often, and especially in western Africa, its distribution is associated withhuman settlements (Wickens, 1982; Wickens & Lowe, 2008), but whetherit is humans who favour baobab establishment or baobab trees that attracthumans is a question still under debate.
2.1.2 Botanical description
Adansonia digitata L. belongs to the Malvaceae family (APG II, 2003).The African baobab tree (Figure 2.1) is deciduous and characterised by itsmassive size (reaching a height of 18-25 m) round canopy, stout branchesand swollen trunk (that can grow up to more than 10 m in diameter)(Wickens, 1982; Baum, 1995b; Sidibe & Williams, 2002; Bosch et al.,2004; ICRAF, 2007a). Although seedlings produce a strong prominenttaproot, the mature tree is anchored by an extensive lateral root systemwhich almost never penetrates beyond a depth of 2 m (Bosch et al., 2004;ICRAF, 2007a). The wood is light and spongy with a high moisturecontent (Wickens, 1982; Burkill, 1985). Baobab bark is smooth, reddishbrown to grey, soft and fibrous (Wickens, 1982; Baum, 1995b; Sidibe &Williams, 2002). Fruits are usually globose to ovoid, 12 cm or more inlength, indehiscent, with a hard, woody shell and covered with yellowish-grey velvety hairs (Wickens, 1982; Baum, 1995b; Sidibe & Williams, 2002;Bosch et al., 2004; ICRAF, 2007a). The shell can be up to 1 cm thick andencloses a dry mealy, whitish pulp in which dark brown, kidney-shapedseeds with a thick seedcoat are embedded (Wickens, 1982; Baum, 1995b;Sidibe & Williams, 2002; Bosch et al., 2004; ICRAF, 2007a). Leavesare digitately compound with three to nine leaflets and occur alternatelyat the end of branches or on short spurs on the trunk (Wickens, 1982;Baum, 1995b; Sidibe & Williams, 2002; Bosch et al., 2004; ICRAF, 2007a).Flowers are waxy white, pendulous and solitary with a large number ofstamens on a large central staminal tube. Flowers are bat-pollinated(Wickens, 1982; Baum, 1995a,b; Sidibe & Williams, 2002; Bosch et al.,2004; ICRAF, 2007a).
2.1.3 Utilisation
Baobab is a widely-used and multi-purpose species. Practically all parts ofthe tree can be utilised (Wickens, 1979, 1982; Wickens & Lowe, 2008). Thedifferent plant parts have numerous food uses and medicinal properties,whereas bark fibres are also used for a variety of purposes (Nicol, 1957;Watt & Breyer-Brandwijk, 1962; Wickens, 1979, 1982; Burkill, 1985;
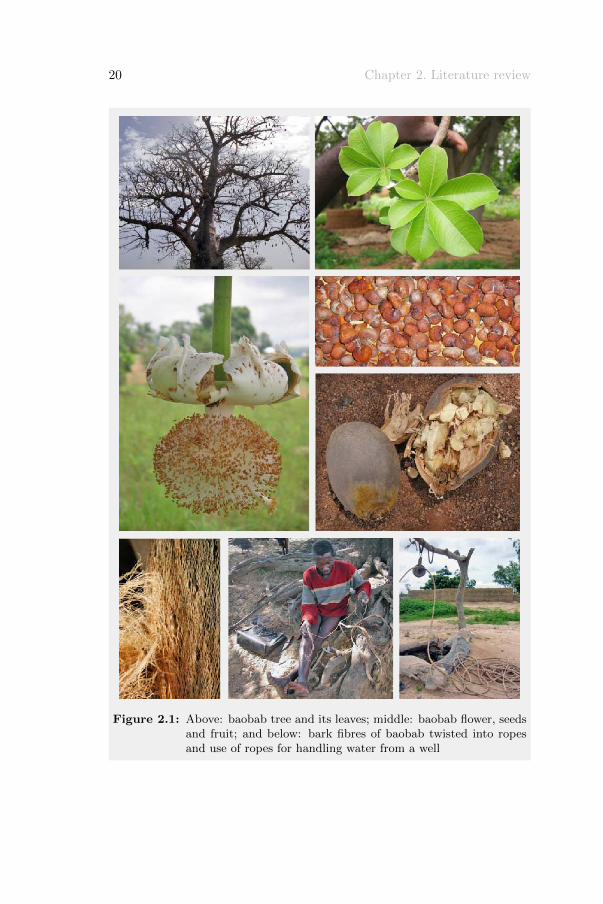
20 Chapter 2. Literature review
Figure 2.1: Above: baobab tree and its leaves; middle: baobab flower, seedsand fruit; and below: bark fibres of baobab twisted into ropesand use of ropes for handling water from a well
2.1. Baobab (Adansonia digitata L.) 21
Ramadan et al., 1994; Lamien et al., 1996; Sidibe et al., 1996; Lockett& Grivetti, 2000; Ambe, 2001; Codjia et al., 2001; Shukla et al., 2001;Gebauer et al., 2002a; Lykke et al., 2002; Sidibe & Williams, 2002; Boschet al., 2004; Gustad et al., 2004; Diop et al., 2005; Gruenwald & Galizia,2005; Assogbadjo, 2006; ICRAF, 2007a; Chadare et al., 2008; Wickens &Lowe, 2008; De Caluwe et al., 2009a; Vogl et al., 2009; Buchmann et al.,2010; Fandohan et al., 2010a).
Many authors recorded the daily use of baobab food products in thediet of rural communities in West Africa (Nordeide et al., 1996; Lockettet al., 2000; Lockett & Grivetti, 2000; Ambe, 2001; Codjia et al., 2001;Walter, 2001; Sidibe & Williams, 2002; Codjia et al., 2003; Diop et al.,2005; Assogbadjo, 2006; Hell et al., 2009; Buchmann et al., 2010). Inaddition, several plant parts are reported to have interesting anti-oxidant(Sidibe et al., 1996; Lamien-Meda et al., 2008; Vertuani et al., 2002; Bescoet al., 2007; Cisse et al., 2009), anti-inflammatory (Ramadan et al., 1994;Vimalanathan & Hudson, 2009), anti-pyretic (Ramadan et al., 1994),antimicrobial (Anani et al., 2000; Afolabi & Popoola, 2005; Masola et al.,2009) and antiviral (Anani et al., 2000; Hudson et al., 2000; Vimalanathan& Hudson, 2009) properties. Worth mentioning is also that throughoutAfrica the extraordinarily shaped baobab tree is surrounded by a wealth oflegends, superstitions, folk tales and anecdotal references (Watt & Breyer-Brandwijk, 1962; Wickens, 1982; Codjia et al., 2001; Bosch et al., 2004;Gustad et al., 2004; Diop et al., 2005; Assogbadjo, 2006; Wickens & Lowe,2008; Buchmann et al., 2010).
Food uses
Baobab fruit pulp is probably the most important food produced by thetree. It can be eaten fresh or dissolved in water or milk. This liquid isthen used as a refreshing drink (Bosch et al., 2004), a sauce for food, afermenting agent in local beer brewing, or as a substitute for cream oftartar in baking (Wickens, 1982; Sidibe & Williams, 2002; Bosch et al.,2004). When the pulp is soaked in water, it produces a milky solution,which can be consumed as a milk substitute (Becker, 1983; Ajayi et al.,2003) or used to make porridge (Burkill, 1985; Obizoba & Anyika, 1994;Bosch et al., 2004). Baobab fruit pulp is also important in local diets asa seasoning component and appetizer (Burkill, 1985; Ajayi et al., 2003).Nowadays, the pulp has also become a popular ingredient in ice productsin urban areas (Scheuring et al., 1999; Sidibe et al., 1998b; Bosch et al.,

22 Chapter 2. Literature review
2004; Diop et al., 2005), and in different kinds of juices and jams (Figure2.2).
Baobab seeds can be eaten fresh or roasted as snacks (Bosch et al., 2004).Seeds may also be dried and ground into a flour which can either be addedto soups and stews as a thickener, or roasted and ground into a paste, orboiled for a long time, and then fermented and subsequently dried for use(Sidibe & Williams, 2002). In addition, an oil can be extracted from seedkernels by boiling and distillation. Baobab seed oil is semi-fluid, goldenyellow, gently scented and has a long shelf life (Figure 2.2). It is used forcooking and in the cosmetics industry (Bosch et al., 2004).
The leaves of the baobab tree are an important component in the localdiet of many populations in Africa, especially in the Sahel (Yazzie et al.,1994). Young fresh leaves are widely used, cooked as spinach, andfrequently dried or powdered and used for sauces to be added to porridges,thick cereal gruels, or boiled rice (Wickens, 1982; Burkill, 1985; Sidibe &Williams, 2002; Bosch et al., 2004).
Medicinal uses
Baobab fruit pulp is used in folk medicine as an antipyretic or febrifuge toovercome fevers (Watt & Breyer-Brandwijk, 1962; Wickens, 1982; Burkill,1985; Ramadan et al., 1994; Sidibe & Williams, 2002; Bosch et al., 2004),in cases of dysentery, to promote perspiration (i.e. a diaphoretic) andin the treatment of smallpox and measles (Wickens, 1982; Burkill, 1985;Sidibe & Williams, 2002; Bosch et al., 2004). Moreover, baobab fruit pulphas been reported as anti-inflammatory, analgesic and astringent in thetreatment of diarrhoea (Ramadan et al., 1994).
Baobab seeds are used in cases of diarrhoea and hiccough (Sidibe &Williams, 2002). Oil extracted from the seeds is used for inflamed gums,to ease toothache (Burkill, 1985; Sidibe & Williams, 2002; Bosch et al.,2004) and treat skin problems (Sidibe & Williams, 2002; Bosch et al.,2004).
Baobab leaves are medicinally used as diaphoretic, expectorant,prophylactic against fever and astringent (Watt & Breyer-Brandwijk,1962; Wickens, 1982; Burkill, 1985; Bosch et al., 2004). In addition, leavesare used as anti-asthmatic, and are known to have antihistamine andanti-tension properties (Wickens, 1982; Burkill, 1985; Sidibe & Williams,

2.1. Baobab (Adansonia digitata L.) 23
Figure 2.2: Above, from left to right: baobab nectar and two different kindsof baobab syrup; and below, from left to right: two differentkinds of baobab jam and two different bottles of baobab seed oil
24 Chapter 2. Literature review
2002; Bosch et al., 2004). Leaves are further reported to treat kidneyand bladder diseases, general fatigue, diarrhoea, inflammations (Wickens,1982; Burkill, 1985; Bosch et al., 2004), insect bites and guinea worm(Wickens, 1982; Burkill, 1985).
Baobab bark is widely used in traditional medicine. The bark is mainlyused as a substitute for quinine for curing fever, in particular whencaused by malaria (Wickens, 1982). The activity of baobab bark as afebrifuge, however, has not (yet) been detected in experimental malariatreatments, although it is both diaphoretic and antiperiodic (Burkill,1985). Moreover, a bark decoction is used to bathe rickety children(Wickens, 1979, 1982; Burkill, 1985; Lockett & Grivetti, 2000; Boschet al., 2004) and as a mouthwash for toothache (Wickens, 1982; Burkill,1985; Bosch et al., 2004). The bark also contains a white, semi-fluid gumthat is used for cleansing sores (Wickens, 1982; Burkill, 1985). Further,Watt & Breyer-Brandwijk (1962), Wickens (1982) and Burkill (1985)reported that the bark contains an alkaloid, called ‘adansonin’, whichhas a strophanthus-like action. This explains the use of the bark asan antidote to strophanthus poisoning (Watt & Breyer-Brandwijk, 1962;Wickens, 1982; Burkill, 1985; Bosch et al., 2004).
2.1.4 Nutritional value
Fruit pulp
The fruit pulp contains a high amount of carbohydrates, is low in proteins,and has an extremely low fat content (Nour et al., 1980; Becker, 1983;Arnold et al., 1985; Obizoba & Amaechi, 1993; Saka & Msonthi, 1994;Odetokun, 1996; Lockett et al., 2000; Murray et al., 2001; Shukla et al.,2001; Osman, 2004). Moreover, the pulp is characterized by a low watercontent, a strong acidity and high contents of sugars (Nour et al., 1980;Diop et al., 2005; Cisse et al., 2009), whereas it is also rich in pectin(Nour et al., 1980). According to Murray et al. (2001), simple sugars,such as fructose, saccharose and glucose, account for about one third oftotal carbohydrate content in baobab pulp. This explains the noticeablesweet taste of its pulp. The pulp is also acidic, due to the presence oforganic acids, i.e. citric, tartaric, malic, succinic and ascorbic acid (Nouret al., 1980; Diop et al., 2005). Baobab fruit pulp is rich in most essentialamino acids and can thus be considered a good source of amino acids(Sena et al., 1998). However, when compared to baobab leaves, baobabfruit pulp is inferior in terms of overall protein quality (Sena et al., 1998).
2.1. Baobab (Adansonia digitata L.) 25
Most fatty acids in the pulp do not reach detectable levels. However, Senaet al. (1998) point baobab fruit pulp out as a rich source of linoleic acid,which is an essential fatty acid for human nutrition.
Baobab fruit pulp is rich in minerals (Nour et al., 1980; Becker, 1983;Arnold et al., 1985; Obizoba & Amaechi, 1993; Prentice et al., 1993;Saka & Msonthi, 1994; Smith et al., 1996; Glew et al., 1997; Sena et al.,1998; Lockett et al., 2000; Osman, 2004). In particular, it is reported tohave a high calcium content (Becker, 1983; Saka & Msonthi, 1994; Senaet al., 1998; Osman, 2004; Diop et al., 2005), which makes baobab fruitsattractive as a natural source of calcium supplementation for pregnantand lactating women, as well as for children and older people (Osman,2004; Prentice et al., 1993). Arnold et al. (1985) and Diop et al. (2005)also reported a high potassium content. Furthermore, baobab fruit pulp isrich in magnesium (Osman, 2004; Diop et al., 2005), potassium (Osman,2004) and phosphorous (Saka & Msonthi, 1994; Diop et al., 2005).
Baobab fruit pulp is in particular rich in vitamin C or ascorbic acid (Carr,1955; Nicol, 1957; Nour et al., 1980; Becker, 1983; Sidibe et al., 1996;Gebauer et al., 2002a; Vertuani et al., 2002; Diop et al., 2005; Bescoet al., 2007; Chadare et al., 2009; Cisse et al., 2009). With a vitaminC content of ten times the level of vitamin C in citrus fruits (Gebaueret al., 2002a), baobab fruits can be classified among the richest fruitsin vitamin C, after camu-camu (Myrciaria dubia (H.B.K.) McVaugh),acerola (Malpighia glabra L.), sweet detar (Detarium senegalense Gmel.)and blackcurrant (Ribes nigrum L.) (Cisse et al., 2009). Additionally,Sidibe et al. (1996), Sidibe et al. (1998a) and Scheuring et al. (1999)revealed a remarkable tree-to-tree variability for vitamin C content in thefruit pulp but also reported that it was quite stable from one year tothe next. The exact vitamin C content of any fruit thus depends on theindividual tree it comes from (Sidibe et al., 1996). Noteworthy is that toassure vitamin C activity, it is important not to boil baobab fruit pulpduring food preparation. It is thus recommended to add pulp to drinkswhile they are cold or to hot drinks after they have been removed fromthe heat source (Sidibe et al., 1996). Next to vitamin C, baobab fruitcontains detectable levels of α and β-carotene, and lutein (Sena et al.,1998), whereas Becker (1983) and Arnold et al. (1985) reported somethiamine, riboflavin, and niacin contents.
26 Chapter 2. Literature review
Seeds
Baobab seeds contain relatively high amounts of protein, fat and crudefibre (Arnold et al., 1985; Obizoba & Amaechi, 1993; Odetokun, 1996;Igboeli et al., 1997; Proll et al., 1998; Lockett et al., 2000; Murray et al.,2001; Shukla et al., 2001; Ajayi et al., 2003; Nnam & Obiakor, 2003;Osman, 2004). Baobab seeds are rich in most essential amino acids(Glew et al., 1997), including lysine. Because lysine is limited in mostcereal plants, it may be possible to use baobab seed proteins to improvecereal protein quality, especially in arid and semi-arid areas where thepopulation depends heavily on sorghum for food (Proll et al., 1998;Osman, 2004). Baobab seed oil contains high proportions of linoleic(Engelter & Wehmeyer, 1970; Glew et al., 1997; Ezeagu et al., 1998;Osman, 2004) and oleic acid (Ezeagu et al., 1998; Ajayi et al., 2003;Osman, 2004), as well as palmitic and α-linolenic acid (Ezeagu et al.,1998; Osman, 2004). Baobab seeds are thus rich in the two essential fattyacids, namely linoleic (18:2n-6) and α-linolenic acid (18:3n-3). Accordingto Ajayi et al. (2003) and Osman (2004), baobab seed oil is an excellentsource of mono-and polyunsaturated fatty acids. As a result, baobab seedshave been classified as both protein- and oil-rich, whereby they thus area rich source of energy (Igboeli et al., 1997; Murray et al., 2001; Osman,2004).
The mineral content of baobab seeds has been documented by manyauthors (Arnold et al., 1985; Obizoba & Amaechi, 1993; Glew et al., 1997;Lockett et al., 2000; Ajayi et al., 2003; Nnam & Obiakor, 2003; Osman,2004; Nkafamiya et al., 2007). Several authors reported phosphorus(Lockett et al., 2000; Diop et al., 2005), calcium, magnesium (Lockettet al., 2000; Osman, 2004; Diop et al., 2005) and potassium (Osman, 2004;Diop et al., 2005; Nkafamiya et al., 2007) as the major mineral elementspresent in the seeds. At the same time, the seeds are a fair source of ironand zinc (Glew et al., 1997; Lockett et al., 2000; Osman, 2004; Nkafamiyaet al., 2007).
Leaves
Baobab leaves are a rich source of carbohydrate and have a low fat content(Becker, 1983; Nordeide et al., 1996; Lockett et al., 2000; Shukla et al.,2001). Watt & Breyer-Brandwijk (1962), Gaiwe et al. (1989) and Diopet al. (2005) reported that baobab leaves contain an important amountof mucilage. In addition, Woolfe et al. (1977) found that the mucilage is

2.1. Baobab (Adansonia digitata L.) 27
an acidic polysaccharide with associated proteins and minerals. Baobableaves contain fair amounts of proteins (Becker, 1983; Nordeide et al.,1996; Lockett et al., 2000) and significant amounts of all essential aminoacids (Yazzie et al., 1994; Nordeide et al., 1996; Glew et al., 1997; Senaet al., 1998; Chadare et al., 2009). Therefore, and on a qualitative andquantitative basis, baobab leaves are a good source of proteins for thosepopulations for whom this plant material is one of the main componentsof their diet (Yazzie et al., 1994; Nordeide et al., 1996; Gebauer et al.,2002a). Moreover, since part of the niacin requirement in humans canbe satisfied through the conversion of tryptophan to niacin or vitaminB3 (Satyanaryana & Rao, 1983) and the fact that baobab leaves containsignificant amounts of the essential amino acid tryptophan, baobab leavesmay also serve as a niacin source (Yazzie et al., 1994).
Many authors reported that baobab leaves are significant sources ofminerals (Becker, 1983; Prentice et al., 1993; Yazzie et al., 1994; Nordeideet al., 1996; Smith et al., 1996; Glew et al., 1997; Barminas et al., 1998;Sena et al., 1998; Lockett et al., 2000; Boukari et al., 2001). Several studies(Becker, 1983; Yazzie et al., 1994; Glew et al., 1997; Barminas et al., 1998;Lockett et al., 2000) recorded higher contents of iron for baobab leavescompared to numerous other wild-gathered foods. Since iron deficiencyanaemia is common in regions of Africa were baobabs grow, the leavesmay represent an important source of iron (Yazzie et al., 1994). Moreover,baobab leaves are also a rich source of calcium (Gaiwe et al., 1989; Prenticeet al., 1993; Yazzie et al., 1994; Glew et al., 1997; Barminas et al., 1998;Sena et al., 1998; Lockett et al., 2000; Boukari et al., 2001; Diop et al.,2005; Maranz et al., 2008; Chadare et al., 2009), and contain significantamounts of zinc, phosphorous (Yazzie et al., 1994; Barminas et al., 1998),potassium (Yazzie et al., 1994; Diop et al., 2005; Maranz et al., 2008) andmagnesium (Yazzie et al., 1994; Smith et al., 1996; Glew et al., 1997; Diopet al., 2005; Maranz et al., 2008).
Although baobab leaves contain an interesting level of vitamin A(Nordeide et al., 1996; Sidibe et al., 1996, 1998b), only a few authorshave actually investigated their vitamin A content (Chadare et al., 2009).The amount of carotenoids in baobab leaves depends on the tree and themethod of leaf drying. The simple practice of drying leaves in the shadedoubles the provitamin A content of the leaf powder (Sidibe et al., 1996,1998b; Scheuring et al., 1999). Moreover, small leaves, which are tree-specific, further increases provitamin A by twenty percent (Sidibe et al.,

28 Chapter 2. Literature review
1996; Scheuring et al., 1999). The use of leaves harvested from old oryoung trees does not seem to have any effect on the level of pro-vitaminA. The combination of small leaves and shade-drying allows to obtainleaves with the highest provitamin A contents (Sidibe et al., 1996, 1998b;Scheuring et al., 1999). In addition, Becker (1983) reported baobab leavesas sources of thiamine, riboflavin and niacin in baobab leaves. Sena et al.(1998) also showed a high content of lutein.
In general, baobab leaves are nutritionally superior to the fruit of thetree (Sena et al., 1998). When compared to baobab fruits, leaves containmore essential amino acids, minerals and vitamin A which make themmore interesting as a food source because they cover a broader range ofnutritional factors. However, the ability of baobab fruits to contributesignificant quantities of trace minerals and also α-linolenic acid shouldnot be overlooked (Sena et al., 1998).
2.2 Tamarind (Tamarindus indica L.)
Based on:
De Caluwe E., Halamova K. & Van Damme P. (2010). Tamarindus indica L.– A review of traditional uses, phytochemistry and pharmacology. AfrikaFocus, 23:53-83.
De Caluwe E., Halamova K. & Van Damme P. (2009). Tamarindus indicaL. – A review of traditional uses, phytochemistry and pharmacology. InJuliani H., Simon J. and Ho C., editors, African Natural Plant Products:Discoveries and Challenges in Quality Control, chapter 5, pp. 85–110.American Chemical Society, Washington DC, USA.
2.2.1 Distribution
The origin of tamarind is believed to be in western Africa, from whereit spread to other parts in sub-Saharan Africa, and to Asia, and Centraland South America (Burkill, 1985; Morton, 1987; Teklehaimanot, 2008).Worldwide, tamarind is now introduced, naturalized and cultivated inover 50 countries (Morton, 1987; El-Siddig et al., 2006; ICRAF, 2007b;Teklehaimanot, 2008). The major production areas are in Asia, inThailand and India in particular. In America, Mexico and Costa Rica arethe biggest producers. Africa on the whole does not produce tamarindon a commercial scale, though it is widely used by local communities (El-Siddig et al., 2006). The two most common varieties are a sweet and a
2.2. Tamarind (Tamarindus indica L.) 29
sour variety. Sweet tamarind is produced mainly in Thailand, where it isgrown on a commercial scale and is exported in fresh and processed forms(Teklehaimanot, 2008). Tamarind grows well over a wide range of soil andclimatic conditions but prefers semi-arid areas and wooded grassland, andis often associated with termite hills (Burkill, 1985; El-Siddig et al., 2006;ICRAF, 2007b). A long, well-marked dry season is necessary for fruiting.Thanks to an extensive root system, tamarind is resistant to drought andwind (Burkill, 1985; El-Siddig et al., 2006; ICRAF, 2007b).
2.2.2 Botanical description
Tamarind or Tamarindus indica L. of the Fabaceae, subfamilyCaesalpinioideae (Figure 2.3), is an evergreen tree up to 30 m tall witha short bole (usually 1-2 m), a dense, widely spreading and roundedcrown and drooping branches. The bark is brownish-grey, rough andscaly. Tamarind produces a deep tap root and an extensive lateralroot system (Morton, 1987; El-Siddig et al., 1999, 2006; ICRAF, 2007b;Teklehaimanot, 2008). In addition, tamarind produces valuable timber(Burkill, 1985; Kalinganire et al., 2007). Fruits are curved or straightoblong pods, measuring 5-10 x 2 cm. Fruit pods are constricted andindehiscent. The shell is light grey, or pale brown and brittle. Theseeds are embedded in a firm, sticky and blackish brown pulp. Each podcontains one to twelve seeds which are flattened or rhomboid, irregularlyshaped, glossy and smooth. Seeds are joined to each other with toughfibres running through the pulp. Seed coats are hard and red to purplebrown in colour (Morton, 1987; El-Siddig et al., 1999, 2006; ICRAF,2007b). Leaves are alternate 7-15 cm long and pinnate with 10-20 pairs ofopposite leaflets. These leaflets are narrowly oblong, 12-32 x 3-11 mm witha rounded to almost square and slightly notched apex (Morton, 1987; El-Siddig et al., 1999, 2006; ICRAF, 2007b). Inflorescences are small terminaldrooping racemes containing up to 18 flowers. Flowers are zygomorphicand pale yellow-, gold- or pinkish-coloured with red veins. Flowers areprobably insect-pollinated (Morton, 1987; El-Siddig et al., 1999, 2006;ICRAF, 2007b).
2.2.3 Utilisation
Tamarind is a multi-purpose species with numerous food and non-fooduses (Morton, 1987; Lamien et al., 1996; Nordeide et al., 1996; El-Siddiget al., 1999; Lockett & Grivetti, 2000; Lykke et al., 2002; Codjia et al.,
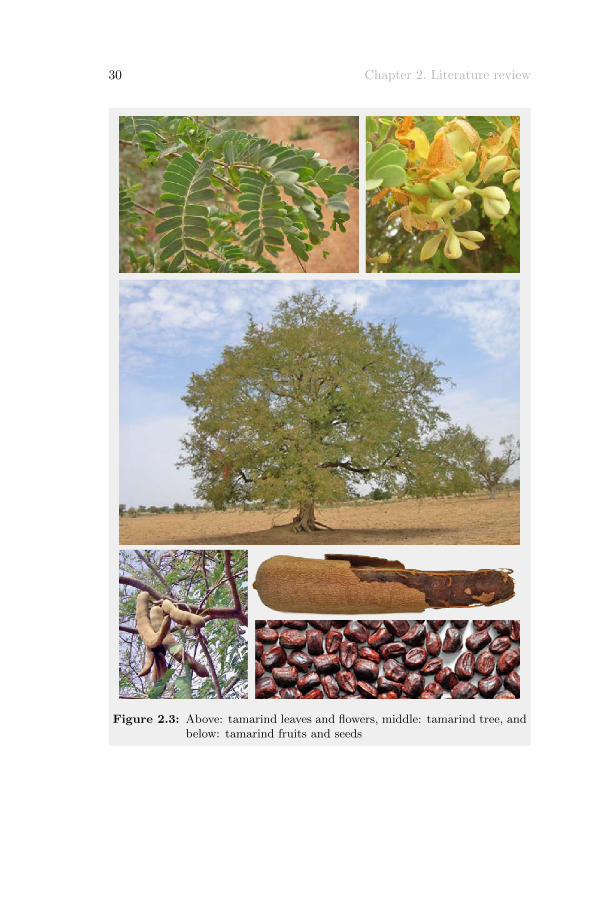
30 Chapter 2. Literature review
Figure 2.3: Above: tamarind leaves and flowers, middle: tamarind tree, andbelow: tamarind fruits and seeds
2.2. Tamarind (Tamarindus indica L.) 31
2003; El-Siddig et al., 2006; ICRAF, 2007b; Kumar & Bhattacharya,2008; Vogl et al., 2009; Havinga et al., 2010; van der Stege et al., 2011).Moreover, several plant parts are reported to have interesting anti-oxidant(Tsuda et al., 1994; Komutarin et al., 2004; Soong & Barlow, 2004;Sudjaroen et al., 2005; Martinello et al., 2006; Al-Fatimi et al., 2007;Siddhuraju, 2007; Lamien-Meda et al., 2008), anti-inflammatory (Rimbauet al., 1999; Fook et al., 2005), antibacterial (Melendez & Capriles, 2006;Al-Fatimi et al., 2007), antiviral and anti-fungal (El-Siddig et al., 2006)activities. Morton (1987) reported also several superstitions around thetamarind tree.
Food uses
Fruit pulp Tamarind is highly valued for its fruits, especially thepulp which is used for a wide variety of domestic and industrialpurposes (El-Siddig et al., 2006). Tamarind pulp forms the raw materialfor manufacturing several industrial products, such as tamarind juiceconcentrate and pulp powder, tartaric acid and pectin (El-Siddig et al.,2006). In addition, Zablocki & Pecore (1996) reported tamarind extractas a replacement for phosphoric and citric acid, and other acids that areadded to soft drinks. The latter authors claim that beverages containingtamarind extract have an improved shelf life, as a result of a lower pH,and a flavour profile equivalent to or better than beverages sweetened withaspartame. Tamarind pulp can be eaten fresh as a snack and is often usedto prepare juice, syrup, jam and candies (Figure 2.4) (El-Siddig et al.,1999, 2006; ICRAF, 2007b). The juice is an ingredient of Worcestershiresauce (ICRAF, 2007b). Moreover, tamarind pulp is used for seasoningand as an ingredient in curries, chutneys, sauces and ice cream (El-Siddiget al., 1999, 2006; ICRAF, 2007b). Although there are many uses fortamarind fruit pulp (Kalinganire et al., 2007), few are known or practisedin the Sahel. In the Sahel, fruit pulp is used primarily for sauces, porridgeand juice. Additionally, it should be noted that local tamarind varietieshave generally a strong acidic taste compared to the sweet cultivars inThailand (Kalinganire et al., 2007).
Although tamarind seeds are considered a by-product of the tamarindfruit pulp industry, the seeds have several uses (El-Siddig et al., 2006;Kumar & Bhattacharya, 2008). The presence of tannins and otherdyeing compounds in the testa makes the whole seed unsuitable for directconsumption (Kumar & Bhattacharya, 2008). However, the seeds become
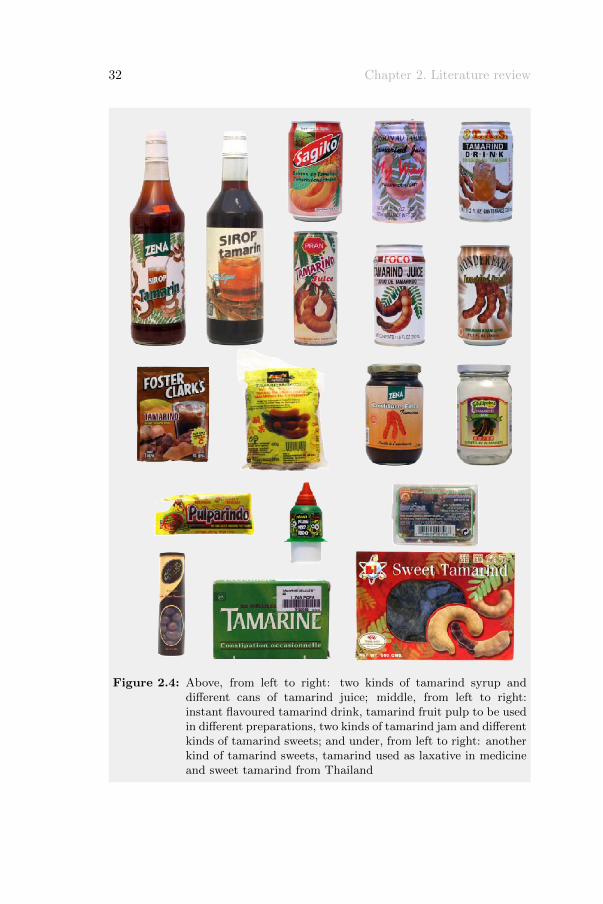
32 Chapter 2. Literature review
Figure 2.4: Above, from left to right: two kinds of tamarind syrup anddifferent cans of tamarind juice; middle, from left to right:instant flavoured tamarind drink, tamarind fruit pulp to be usedin different preparations, two kinds of tamarind jam and differentkinds of tamarind sweets; and under, from left to right: anotherkind of tamarind sweets, tamarind used as laxative in medicineand sweet tamarind from Thailand
2.2. Tamarind (Tamarindus indica L.) 33
edible after soaking and boiling in water, which removes the seed coat (El-Siddig et al., 2006). Locally, seeds have been reported as soup thickener(Ajayi et al., 2006) and seed flour may be made into cake and bread(ICRAF, 2007b). Roasted seeds are claimed to be superior in flavour togroundnuts (ICRAF, 2007b). In India, the major industrial product oftamarind seed is the tamarind kernel powder which is an important sizingmaterial used in the textile, paper, and jute industries (Burkill, 1985;Kumar & Bhattacharya, 2008). Tamarind seed is also a raw materialused in the manufacture of polysaccharides, adhesives and tannins. Thispolysaccharide (pectin) with carbohydrate character and gelly-formingproperties, named ‘jellose’ (Rao, 1948; El-Siddig et al., 2006), has beenrecommended for use as a stabiliser in ice cream, mayonnaise and cheese,and as an ingredient or agent in a number of pharmaceutical products(Morton, 1987; El-Siddig et al., 2006).
Tamarind leaves are mainly used as vegetable or souring component insoups, sauces and cereal porridge (Burkill, 1985; Lamien et al., 1996;Nordeide et al., 1996; Vogl et al., 2009). Also, tamarind flowers can beeaten as vegetables and – together with leaves – prepared in a variety ofdishes (Burkill, 1985; ICRAF, 2007b), such as curries, salads, stews andsoups (Burkill, 1985; El-Siddig et al., 2006).
Medicinal uses
Tamarind fruit is regarded as a digestive, carminative, laxative,expectorant and blood tonic (Burkill, 1985; Morton, 1987; El-Siddiget al., 2006; Komutarin et al., 2004). In addition, pulp is recognisedas refrigerant for fevers and considered to be effective as a remedy forbiliousness and bile disorders, and an antiscorbutic (Burkill, 1985; Morton,1987; El-Siddig et al., 1999, 2006). In traditional practice, the pulp is alsoapplied on inflammations, used in a gargle for sore throat and, mixed withsalt, as a cream for rheumatism (Burkill, 1985; Morton, 1987; El-Siddiget al., 2006). It is, further, administered to alleviate sunstroke, Daturapoisoning, and alcoholic intoxication (Morton, 1987; El-Siddig et al.,2006). The laxative properties of tamarind pulp have been confirmedby modern medical science (El-Siddig et al., 2006) (Figure 2.4). Thepharmaceutical industry uses the pulp also as an ingredient in cardiacand blood sugar-reducing medicines (Teklehaimanot, 2008).
Powdered tamarind seeds are made into a paste to treat furuncles andprescribed for chronic diarrhoea and dysentery. Burkill (1985), Morton

34 Chapter 2. Literature review
(1987) and El-Siddig et al. (2006) also reported the use of tamarind seedsto cure eye diseases, ulcers, bladder stones and to prevent the formationof pimples. In addition, Morton (1987) recorded the use of the seed coatas astringent.
Tamarind leaves and flowers are used as poultices for swollen joints,sprains and boils. Lotions and extracts made from leaves and flowersare used to treat conjunctivitis, dysentery, jaundice, erysipelas andhaemorrhoids, and as antiseptics and vermifuges (Burkill, 1985; Morton,1987). Additionally, the leaves are used to treat throat infections, coughs,fevers, intestinal worms, urinary troubles, liver ailments, in cardiacand blood sugar reducing medicines, and applied to boils to preventsuppuration and inflammatory swellings, ulcers, eye infections, sprains,wounds and conjunctivitis (Burkill, 1985; Morton, 1987; El-Siddig et al.,2006). Moreover, leaves can act as a laxative and are often used in treatingliver congestion, constipation and haemorrhoids (Burkill, 1985; Morton,1987; El-Siddig et al., 2006).
The bark of the tamarind tree is regarded as an effective astringent, tonicand febrifuge (Burkill, 1985; Morton, 1987; El-Siddig et al., 2006). It isalso used in lotions or poultices to relieve sores, ulcers, boils and rashes(Burkill, 1985; Morton, 1987; El-Siddig et al., 2006). A decoction is used incases of gingivitis, asthma and eye inflammations (Burkill, 1985; Morton,1987).
2.2.4 Nutritional value
Fruit pulp
Tamarind pulp is rich in carbohydrates, low in proteins and has anextremely low fat content (Ishola et al., 1990; Saka & Msonthi, 1994;Nordeide et al., 1996). Tamarind is reported to be the richest naturalsource of tartaric acid, which is found in leaves as well as in fruits (Daniel& Dudhade, 2007). Tartaric acid is synthesised in tamarind leaves inthe light and subsequently translocated to flowers and fruits. It is anunusual plant acid formed from the primary carbohydrate products ofphotosynthesis, and once formed, it is not metabolically used by theplant (El-Siddig et al., 2006). Thus, the content of tartaric acid does notdecrease during fruit ripening (Daniel & Dudhade, 2007). In contrast,at the time of fruit maturing, reducing sugar levels increase and give thesour fruit a sweeter taste (El-Siddig et al., 2006). As a result, tamarind
2.2. Tamarind (Tamarindus indica L.) 35
is known to be simultaneously the most acidic and sweetest fruit (El-Siddig et al., 2006; ICRAF, 2007b). Additionally, as mentioned earlier,sweet and sour varieties of tamarind exist. Sweet tamarind is grownon a commercial scale in Thailand and exported in fresh and processedforms (Teklehaimanot, 2008) (Figure 2.4). Although tamarind fruit pulpis relatively poor in protein, the pulp contains significant amounts of mostessential amino acids (Glew et al., 2005). Tamarind fruit pulp is poor infat and contains only very little amounts of linoleic acid and even loweramounts of α-linolenic acid (Glew et al., 2005).
Tamarind fruit pulp is a rich source of minerals (Ishola et al., 1990; Saka& Msonthi, 1994; Nordeide et al., 1996; Glew et al., 2005; Almeida et al.,2009). In particular, tamarind pulp is reported to be rich in magnesium,potassium (Saka & Msonthi, 1994; Glew et al., 2005; Almeida et al., 2009)and copper (Glew et al., 2005; Almeida et al., 2009). In addition, it is alsoa good source of calcium (Ishola et al., 1990; Glew et al., 2005; Almeidaet al., 2009), phosphorous, iron (Almeida et al., 2009) and selenium (Glewet al., 2005; Almeida et al., 2009).
The ascorbic acid content in tamarind fruit pulp is very low (El-Siddiget al., 2006). On the one hand, tamarind pulp was reported to have ahigh content of vitamin B (thiamine, riboflavin and niacin) as well as asmall amount of carotene (El-Siddig et al., 1999; ICRAF, 2007b). On theother hand, Nordeide et al. (1996) did not detect α or β-carotene.
Seeds
In general, tamarind seeds are rich sources of protein, lipid, crude fibreand carbohydrate (Ishola et al., 1990; Siddhuraju et al., 1995; Lockettet al., 2000; Ajayi et al., 2006). According to Ishola et al. (1990)and Glew et al. (1997), tamarind seeds are a good source of protein.Amino acid profiles of tamarind seeds, reported by Siddhuraju et al.(1995) and Glew et al. (1997), reveal that the proteins contain fairlybalanced essential amino acid levels. Tamarind seeds could, therefore,be used as a cheap alternative protein source to help alleviate proteinmalnutrition in developing countries (Siddhuraju et al., 1995). Tamarindseed kernels contain polysaccharides. When mixed with water, thesepolysaccharides form mucilaginous dispersions and possess the propertyof forming gels with sugar concentrates, like fruit pectins. However, unlikeother fruit pectins, tamarind polysaccharides can form gels over a widepH range, including neutral and basic conditions, and are not affected
36 Chapter 2. Literature review
by boiling in neutral aqueous solutions, even if boiled for long periodsof time. Therefore, tamarind polysaccharides can be useful as a gelformation agent and as a substitute for fruit pectins (El-Siddig et al.,2006). However, tamarind polysaccharides do not contain galacturonicacid nor methyluronate, and are therefore not regarded as a true pectin,thus called ‘jellose’ (Rao, 1948). Tamarind seeds are a good source offatty acids (Siddhuraju et al., 1995; Glew et al., 1997; Ajayi et al., 2006).Tamarind seeds have a higher percentage of unsaturated fatty acids thanof saturated fatty acids (Ajayi et al., 2006). The dominant fatty acids areoleic and linoleic acid (Glew et al., 1997; Siddhuraju et al., 1995; Ajayiet al., 2006). The presence of one essential fatty acid in seed oil makes itnutritionally valuable (Ajayi et al., 2006).
Tamarind seeds appear to be a good source of different mineral elements(Ishola et al., 1990; Siddhuraju et al., 1995; Smith et al., 1996; Glewet al., 1997; Lockett et al., 2000; Ajayi et al., 2006). A high contentof potassium (Ishola et al., 1990; Siddhuraju et al., 1995; Ajayi et al.,2006) and magnesium (Ishola et al., 1990; Smith et al., 1996; Glew et al.,1997; Ajayi et al., 2006) is reported in tamarind seeds, together withsignificant concentrations of iron (Smith et al., 1996; Glew et al., 1997;Siddhuraju et al., 1995; Ajayi et al., 2006) and zinc (Smith et al., 1996;Glew et al., 1997; Lockett et al., 2000). Ishola et al. (1990) and Siddhurajuet al. (1995) also reported that tamarind seeds are rich in calcium andphosphorous.
Leaves
To our knowledge, only one group of authors, i.e. Nordeide et al. (1996),reported on the nutritional composition of tamarind leaves. Based on theamino acid profile of tamarind leaves, they suggested that the leaves arepotentially acceptable protein sources that could improve protein qualityof local diets. Compared to tamarind fruit pulp, tamarind leaves scorebetter for the minerals calcium, iron and zinc (Nordeide et al., 1996).
2.3 Food markets in sub-Saharan Africa
A market is created whenever potential sellers of a good or serviceare brought into contact with potential buyers, and means of exchangeand communication are available (FAO, 1995b; Veeman, 2002). In sub-Saharan Africa (SSA), the medium of exchange may be money (through
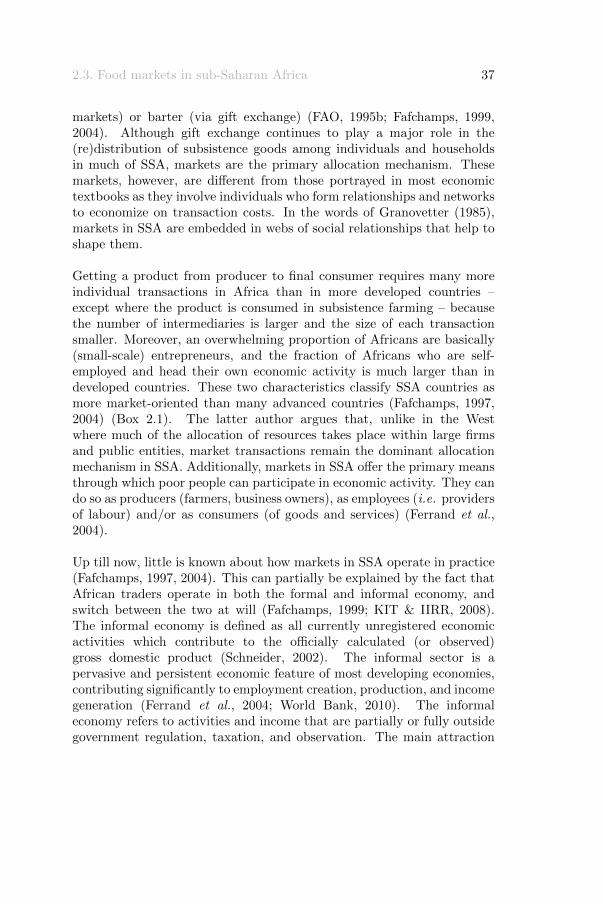
2.3. Food markets in sub-Saharan Africa 37
markets) or barter (via gift exchange) (FAO, 1995b; Fafchamps, 1999,2004). Although gift exchange continues to play a major role in the(re)distribution of subsistence goods among individuals and householdsin much of SSA, markets are the primary allocation mechanism. Thesemarkets, however, are different from those portrayed in most economictextbooks as they involve individuals who form relationships and networksto economize on transaction costs. In the words of Granovetter (1985),markets in SSA are embedded in webs of social relationships that help toshape them.
Getting a product from producer to final consumer requires many moreindividual transactions in Africa than in more developed countries –except where the product is consumed in subsistence farming – becausethe number of intermediaries is larger and the size of each transactionsmaller. Moreover, an overwhelming proportion of Africans are basically(small-scale) entrepreneurs, and the fraction of Africans who are self-employed and head their own economic activity is much larger than indeveloped countries. These two characteristics classify SSA countries asmore market-oriented than many advanced countries (Fafchamps, 1997,2004) (Box 2.1). The latter author argues that, unlike in the Westwhere much of the allocation of resources takes place within large firmsand public entities, market transactions remain the dominant allocationmechanism in SSA. Additionally, markets in SSA offer the primary meansthrough which poor people can participate in economic activity. They cando so as producers (farmers, business owners), as employees (i.e. providersof labour) and/or as consumers (of goods and services) (Ferrand et al.,2004).
Up till now, little is known about how markets in SSA operate in practice(Fafchamps, 1997, 2004). This can partially be explained by the fact thatAfrican traders operate in both the formal and informal economy, andswitch between the two at will (Fafchamps, 1999; KIT & IIRR, 2008).The informal economy is defined as all currently unregistered economicactivities which contribute to the officially calculated (or observed)gross domestic product (Schneider, 2002). The informal sector is apervasive and persistent economic feature of most developing economies,contributing significantly to employment creation, production, and incomegeneration (Ferrand et al., 2004; World Bank, 2010). The informaleconomy refers to activities and income that are partially or fully outsidegovernment regulation, taxation, and observation. The main attraction
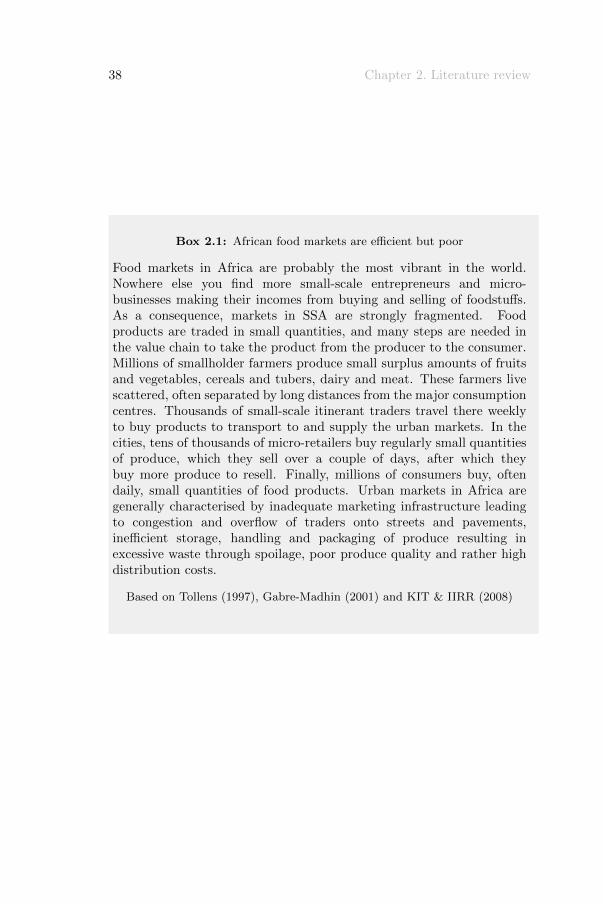
38 Chapter 2. Literature review
Box 2.1: African food markets are efficient but poor
Food markets in Africa are probably the most vibrant in the world.Nowhere else you find more small-scale entrepreneurs and micro-businesses making their incomes from buying and selling of foodstuffs.As a consequence, markets in SSA are strongly fragmented. Foodproducts are traded in small quantities, and many steps are needed inthe value chain to take the product from the producer to the consumer.Millions of smallholder farmers produce small surplus amounts of fruitsand vegetables, cereals and tubers, dairy and meat. These farmers livescattered, often separated by long distances from the major consumptioncentres. Thousands of small-scale itinerant traders travel there weeklyto buy products to transport to and supply the urban markets. In thecities, tens of thousands of micro-retailers buy regularly small quantitiesof produce, which they sell over a couple of days, after which theybuy more produce to resell. Finally, millions of consumers buy, oftendaily, small quantities of food products. Urban markets in Africa aregenerally characterised by inadequate marketing infrastructure leadingto congestion and overflow of traders onto streets and pavements,inefficient storage, handling and packaging of produce resulting inexcessive waste through spoilage, poor produce quality and rather highdistribution costs.
Based on Tollens (1997), Gabre-Madhin (2001) and KIT & IIRR (2008)
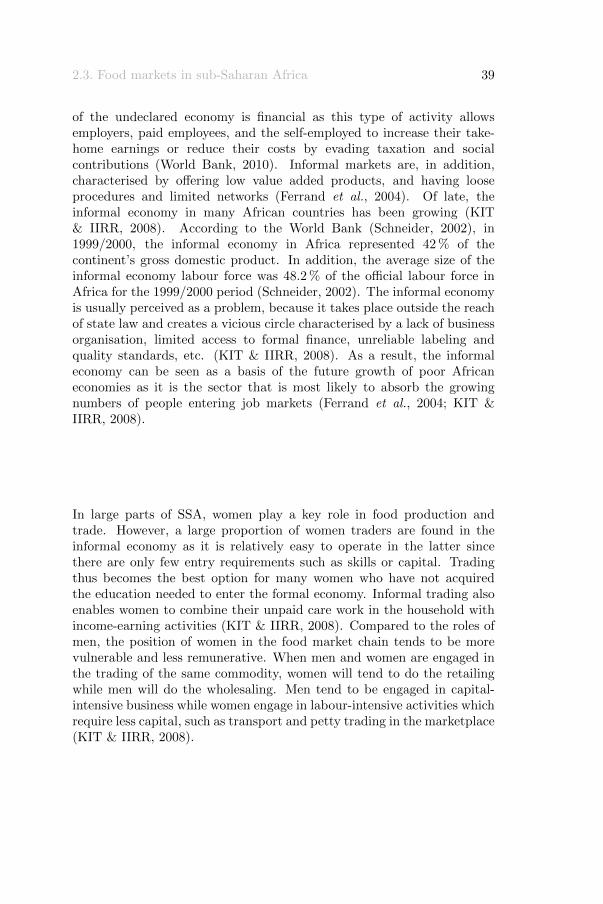
2.3. Food markets in sub-Saharan Africa 39
of the undeclared economy is financial as this type of activity allowsemployers, paid employees, and the self-employed to increase their take-home earnings or reduce their costs by evading taxation and socialcontributions (World Bank, 2010). Informal markets are, in addition,characterised by offering low value added products, and having looseprocedures and limited networks (Ferrand et al., 2004). Of late, theinformal economy in many African countries has been growing (KIT& IIRR, 2008). According to the World Bank (Schneider, 2002), in1999/2000, the informal economy in Africa represented 42 % of thecontinent’s gross domestic product. In addition, the average size of theinformal economy labour force was 48.2 % of the official labour force inAfrica for the 1999/2000 period (Schneider, 2002). The informal economyis usually perceived as a problem, because it takes place outside the reachof state law and creates a vicious circle characterised by a lack of businessorganisation, limited access to formal finance, unreliable labeling andquality standards, etc. (KIT & IIRR, 2008). As a result, the informaleconomy can be seen as a basis of the future growth of poor Africaneconomies as it is the sector that is most likely to absorb the growingnumbers of people entering job markets (Ferrand et al., 2004; KIT &IIRR, 2008).
In large parts of SSA, women play a key role in food production andtrade. However, a large proportion of women traders are found in theinformal economy as it is relatively easy to operate in the latter sincethere are only few entry requirements such as skills or capital. Tradingthus becomes the best option for many women who have not acquiredthe education needed to enter the formal economy. Informal trading alsoenables women to combine their unpaid care work in the household withincome-earning activities (KIT & IIRR, 2008). Compared to the roles ofmen, the position of women in the food market chain tends to be morevulnerable and less remunerative. When men and women are engaged inthe trading of the same commodity, women will tend to do the retailingwhile men will do the wholesaling. Men tend to be engaged in capital-intensive business while women engage in labour-intensive activities whichrequire less capital, such as transport and petty trading in the marketplace(KIT & IIRR, 2008).
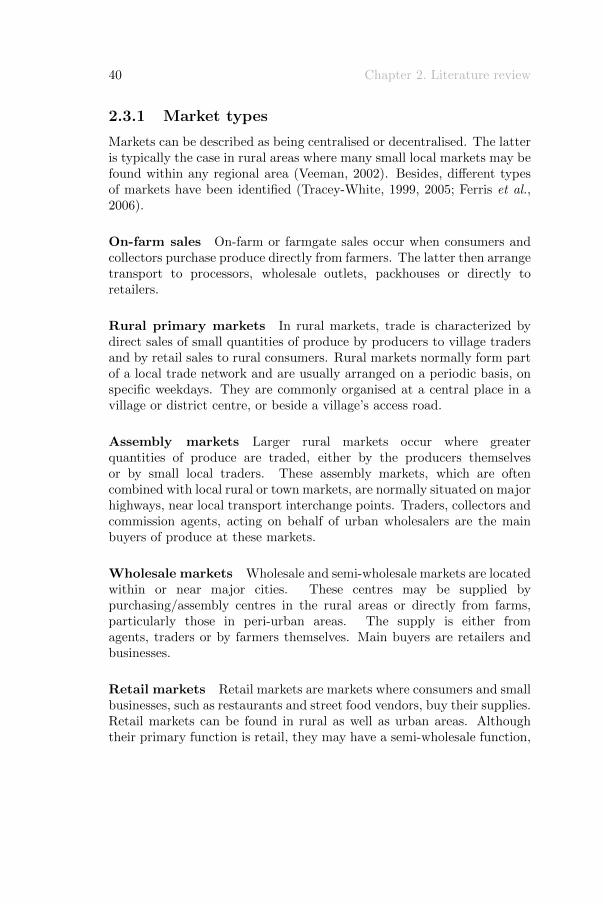
40 Chapter 2. Literature review
2.3.1 Market types
Markets can be described as being centralised or decentralised. The latteris typically the case in rural areas where many small local markets may befound within any regional area (Veeman, 2002). Besides, different typesof markets have been identified (Tracey-White, 1999, 2005; Ferris et al.,2006).
On-farm sales On-farm or farmgate sales occur when consumers andcollectors purchase produce directly from farmers. The latter then arrangetransport to processors, wholesale outlets, packhouses or directly toretailers.
Rural primary markets In rural markets, trade is characterized bydirect sales of small quantities of produce by producers to village tradersand by retail sales to rural consumers. Rural markets normally form partof a local trade network and are usually arranged on a periodic basis, onspecific weekdays. They are commonly organised at a central place in avillage or district centre, or beside a village’s access road.
Assembly markets Larger rural markets occur where greaterquantities of produce are traded, either by the producers themselvesor by small local traders. These assembly markets, which are oftencombined with local rural or town markets, are normally situated on majorhighways, near local transport interchange points. Traders, collectors andcommission agents, acting on behalf of urban wholesalers are the mainbuyers of produce at these markets.
Wholesale markets Wholesale and semi-wholesale markets are locatedwithin or near major cities. These centres may be supplied bypurchasing/assembly centres in the rural areas or directly from farms,particularly those in peri-urban areas. The supply is either fromagents, traders or by farmers themselves. Main buyers are retailers andbusinesses.
Retail markets Retail markets are markets where consumers and smallbusinesses, such as restaurants and street food vendors, buy their supplies.Retail markets can be found in rural as well as urban areas. Althoughtheir primary function is retail, they may have a semi-wholesale function,

2.3. Food markets in sub-Saharan Africa 41
particularly when they allow farmers to trade in them. In the lattercase, they are often called farmers’ markets, which is a typical featurefor developing countries. Small retail shops, often termed corner shops orroadside stands provide produce close to consumers’ homes.
Supermarkets In Latin America and Asia, supermarkets dominatethe trade in fresh produce (estimated to represent between 40 and 70 %of total retail sales), but this is less evident in SSA (10-25 %), wheresupplies from traditional markets continue to be very important (Reardon,2006). The rapid growth of supermarkets in developing countries is havinga significant impact on shopping habits and is increasingly controllingdownstream segments of the chain through contracts, private standardsand sourcing networks (Reardon, 2006; Abrahams, 2010).
Most major African cities lack specialised and efficient wholesale markets(Tollens, 1997). In SSA, it is often difficult to distinguish betweenwholesale and retail operations. Food wholesalers usually trade in awide range of items, only rarely specializing, and often combine wholesaleand retail functions. Retailing is, especially in cities, characterized byan inordinately large number of micro-retailers competing for sales tolow-income consumers (Tollens, 1997). However, wholesale markets playa crucial role in the vertical coordination of food markets, equilibratingsupply with demand and facilitating price formation (Tollens, 1997).
Moreover, in SSA, the different types of markets are often not easilydistinguished. A trader can be collector, transporter and distributor atthe same time and thus simultaneously operate in assembly, wholesaleand retail markets (Ndoye et al., 1998). Other traders may have retailingfunctions for some products, while acting as wholesaler for other products.In addition, traders can perform different market functions depending onthe season. Therefore, many authors (Poulton & Poole, 2001; Lintu, 1995;Ahmad & Ahmad, 2007; Narrod et al., 2007) distinguish only local (rural),national (urban) and international (export) markets. Poulton & Poole(2001) and Jaenicke & Lengkeek (2008) add a fourth category, namely theregional markets. These markets differ in several organisational aspectsbut, most importantly, in their demand for food safety (Narrod et al.,2007). Local markets are supply-driven and characterised by small-scaleactors, short market chains and high seasonality. Besides, transactionsare often informal, margins are generally low and there is little emphasison quality. In contrast, demand-driven export markets are characterised
42 Chapter 2. Literature review
by more complex value chains, high added value, and a high food safetyawareness. Consequently, quality, flexibility and innovation determinecompetitiveness. National (and regional) markets show intermediatecharacteristics (Poulton & Poole, 2001; Narrod et al., 2007; Jaenicke &Lengkeek, 2008). Similarly, Ruiz Perez et al. (2000) identified four typesof NTFP markets on the basis of their size and degree of self-sufficiency(as a percentage of supply from the same area). Type I markets consistof small, local markets with a high level of self-sufficiency that act aslocal exchange places as well as suppliers of the regional and nationalmarkets. Products are gathered and/or produced by sellers, while buyersare directly the products’ consumers. Type II markets consist of a groupof medium-sized markets of regional importance, with a medium level ofself-sufficiency, acting as secondary nodes for the small local markets andas intermediate assembly points for the larger urban markets. Type IIImarkets are large urban markets whose size and spread of linkages givethem a national projection and which are characterized by a weak degreeof self-sufficiency, having to rely on more distant supply areas. Finally,type IV are frontier markets with small to medium value of transactionsand very high dependency for their supply on other areas due to thespecialisation for only a few products.
2.3.2 Marketing and marketing functions
Marketing can be defined as the performance of all activities necessary totransform a raw product from its point of production, harvest, gatheringor collection, to the point of final consumption, whether as food, medicinalor household item (Veeman, 2002). Besides, Crawford (1997) adds thatmarketing is about establishing and maintaining long-term relationshipswith customers. In other words, the goal of marketing is to attract newcustomers by promising superior value, and to keep current customersby providing satisfaction (Kotler et al., 2005). The basic components ofmarketing are referred to as marketing variables, marketing mix or thefour P’s, i.e. product, price, place and promotion (FAO, 1995b; Kotleret al., 2005; Ferris et al., 2006).
Recently, more and more importance has been attached to socialmarketing. Social marketing identifies human needs in non-competitiveeconomies and/or sectors of society, and defines the means of deliveringproducts and services to meet these needs (Crawford, 1997). Themarketing mix of social marketing strategies is evaluated using quite
2.3. Food markets in sub-Saharan Africa 43
different criteria from those employed in assessing purely commercialmarketing strategies. Criteria such as percentage of target populationreached with the technology, products, processes or services, quantitiesproduced and distributed, and uptake of the product, service ortechnology are used to evaluate performance. Benefits are measured interms of development goals, such as improved nutritional status or higherrural incomes (Crawford, 1997). Criteria used to evaluate commercialmarketing strategies should, however, not be dismissed, because theseimprove the efficiency of some aspects of social marketing withoutpreventing the attainment of social objectives (Crawford, 1997).
Three alternative approaches have been shown to be useful in studyingagricultural marketing (van der Laan, 1999): (i) the commodity approachwhich takes individual crops or groups of crops as its starting point; (ii)the institutional approach which concentrates on institutions and actors;and (iii) the functional approach which focuses on the activities of theactors.
A marketing system has three sets of marketing functions. These arephysical functions required for distribution (transportation, storage andprocessing), the functions that are directly associated with exchange(buying, selling and price establishment), and the facilitating functionswhich enable the exchange process to take place (market intelligence,financing, risk-bearing, grading and standardisation, good governance)(Whetham, 1972; Crawford, 1997; van der Laan, 1999; Veeman, 2002;Ferris et al., 2006). All marketing functions are individually detailedbelow.
• Transportation: making a product available where it is needed or,in other words, adding utility of place to the product.
• Storage: balancing supply and demand or, in other words, addingutility of time to the product.
• Processing: physical transformation whereby the product isconverted into forms more suitable for the next stage in thedistribution process or for the final buyer.
• Buying: obtaining a product or service in exchange for money orgoods.
• Selling: offering a product or service for people to buy or exchange.
• Price establishment: price levels reflect the nature of supply anddemand, in which supply is the quantity of products offered for saleand demand is the quantity of products that consumers can buy.
44 Chapter 2. Literature review
• Market intelligence: process of collecting, interpreting anddisseminating information relevant to taking marketing decisions.
• Financing: related firstly to the value of the product, secondly tothe time and distance between its first and final sale, and thirdly tothe degree of risk involved.
• Risk-bearing: risk of physical deterioration or loss, and risk ofunexpected changes in prices and costs.
• Grading and standardisation: can be achieved if the producthas readily measurable characteristics that are relevant to usersor consumers, and if the distribution of these characteristics issuch that products can be categorised into well-defined groupingsof fairly homogeneous products, based on relevant characteristics(e.g. variety, size, colour, shape, degree of impurity andripeness). Standardisation has three dimensions: quality, weightand packaging.
• Good governance: provision of a social environment that leads toenforceable contracts and the absence of theft.
Specific characteristics of agricultural and their effect on marketingactivities where documented by van der Laan (1999). Specific locationcalls for collection followed by distribution, while small-scale activity needsassembling, collecting and bulking. Seasonality implies seasonal storage,perishability asks for on-farm or nearby off-farm preservation whereasnatural variation calls for product sorting and standardisation.
2.3.3 Intermediaries or traders
There are many kinds of traders, who operate in different segments ofthe food market chain. Each of these traders has specific functions, e.g.collection, transport and distribution. Normally, several types of tradersare involved in getting a product from farm to consumer. The differenttraders all have a specific role in the value chain (Dijkstra, 1997; KIT &IIRR, 2008). However, not all value chains involve all kinds of traders(KIT & IIRR, 2008).
Several types of intermediaries or traders have been distinguished anddescribed by a number of authors (Dijkstra, 1997; Tracey-White, 2005;Ferris et al., 2006; KIT & IIRR, 2008).
2.3. Food markets in sub-Saharan Africa 45
Collectors and commission agents Collectors operate over shortdistances and trade small volumes at a time, using limited amounts ofmoney and simple means of transport. They take possession of producefrom an individual or group of farmers and then sell the produce toa wholesaler, market trader or other middleman. For providing theseservices, the collector or commission agent normally charges a percentageof the final sales price.
Assemblers Assemblers buy from collectors or farmers, at the farmgateor local market, for selling to other traders, wholesalers and retailers.Their main function is to gather produce for sale to large traders who donot have the time to carry out small purchases from scattered producersand collectors. They may own or rent small, motorised transport vehiclesand small storage facilities.
Wholesalers Wholesalers sometimes buy produce from farmers andcollectors, but tend to rely on assembly traders and other wholesalersas their main sources of supplies. They vary in size, but deal withlarger volumes than collectors and assemblers, and often store goods.They normally own or rent medium to large vehicles for transportingagricultural products which they may also grade and store for a while.Wholesalers cater for the needs of larger urban markets and sell inbulk to other wholesalers, processors, industries, institutional buyers andretailers.
Processors Processors can be small household enterprises or fairly largeformal firms.
Retailers Retailers buy either directly from farmers, traders orwholesale markets. The larger retailers buy in wholesale units fromestablished wholesalers. Small-scale retailers often buy in smaller amountsfrom these larger retailers. Retailers are thus very diverse in size: fromsmall kiosks and hawkers or roadside sellers, who sell small volumes ofa limited number of goods to shops, and supermarket chains that dealwith a vast range of agricultural products. Retailers have as main rolethe distribution of products to consumers. Their function is to obtainsupplies and display them in forms and at times convenient to consumers.
Intermediaries or traders are undoubtedly the most criticised actorsin the value chain since they are often accused of exploiting farmers
46 Chapter 2. Literature review
(Schreckenberg, 2003). Nevertheless, some studies suggest that the roleof middlemen has been underestimated (Padoch, 1992) and that it is amistake to try to ignore or bypass them (Corry, 1993). Consequently,there is a need to recognize that traders carry out many useful marketingfunctions and that they bear substantial risks from thin and uncertainmarkets, while carrying out costly distribution functions (Ndoye et al.,1998; KIT & IIRR, 2008).
2.3.4 Marketing costs
Traders perform their collecting, travelling and distributive function(s)in the food chain in return for a certain share of the consumer price.Agricultural trading in SSA is in general a high-risk business, becausethere is no support from formal institutions such as those providing qualitystandards, market information and mechanisms for contract enforcement.All in all, the marketing margins of traders should thus be interpretedin relation to the costs and risks they face (KIT & IIRR, 2008). Themajor marketing costs faced by traders are listed below (Fafchamps &Gabre-Madhin, 2001; Gabre-Madhin, 2001; Fafchamps, 2004; Shepherd,2007; KIT & IIRR, 2008).
• Transport: physical transport of produce depends on the distanceand the state of the roads, and can account for 40-60 % of themarketing margin.
• Handling: handling costs include the costs of loading the produceat the time of purchase and off-loading at the time of sale, the costsof packing the produce, and of the packaging material. These costscan represent 20-30 % of the marketing margin.
• Search: in SSA there is often no public market information available,so traders may spend a long time looking for goods to buy. Thesecosts vary significantly from one situation to another, but they canrepresent up to 15-20 % of the marketing margin.
• (In)formal taxes: these include taxes from the government, tolls formarket stalls, fees, and tips at road blockades. These costs canaccount for 10-15 % of the marketing margin.
• Product losses: traders inevitably lose some of the produce they buy.Among the many causes are delays in transport, theft, improperhandling, lack of storage space and refrigeration, post-harvest pestand disease attacks (for stored produce), selection and grading,inadequate packaging, and unsold produce.
2.4. Marketing underutilised plant species 47
• Processing: processing costs depend on the efficiency of theprocessing unit, the available infrastructure, the capacity and thefrequency of operation. Besides, there are two other importantaspects of processing costs. Firstly, one kilogram of productpurchased from the farmer cannot be compared to one kilogramof processed product sold to the consumer. Secondly, processingmay yield a by-product which can often be sold.
African traders have few capital costs, as they make little use of loansfrom banks and have few capital assets such as vehicles or warehouses.They also have low storage costs, which implies that they tend to sellthe produce as quickly as possible and thus achieve high capital turnover,rather than to store the produce and speculate on price increases. Finally,traders have few personnel costs as most are self-employed entrepreneurswith nobody assisting them (KIT & IIRR, 2008).
Marketing costs are the total costs for bringing produce from the farmto the ultimate consumer. Margins are the costs that are added bytransporters and traders to cover their expenses and to provide a profit fortheir services (Tracey-White, 2005). In other words, a marketing marginis the percentage of the final weighted average selling price taken by eachstage of the market chain (Shepherd, 2007). Total margins will depend onthe length of the market chain, the extent to which the product is storedor processed, and the level of post-harvest losses. thus, to know whethermargins are reasonable you need to understand the costs (Shepherd, 2007).
2.4 Marketing underutilised plant species
Gruere et al. (2006) present a conceptual framework to support theeffective commercialisation of underutilised plant species. The authorsfirst identify the economic factors that cause these plants to be‘underutilised’. Based on this analysis, they propose a classification ofunderutilised plant species based on the relationship of the observed tothe potential economic value of the species, and the presence or absenceof and constraints to output markets. Finally, focusing on a subset ofunderutilized plant species with market potential, Gruere et al. (2006)identify three necessary conditions for the successful commercialisationof underutilized plant species for the benefit of the poor. Hereafter, theframework of Gruere et al. (2006) is briefly presented.
48 Chapter 2. Literature review
Underutilised plant species are referred to as agricultural or non-timberforest species, collected, managed, or cultivated, that have simultaneouslythe following three characteristics:
• they are locally abundant but globally rare;
• scientific information and knowledge about them is lacking; and
• their current use is limited relative to their economic potential.
‘Underutilisation’ translates thus into undervaluation in economic terms.This means that these crops have a lower observed (or expressed) valuerelative to their economic potential. In other words, their current publicand/or private value is below its potential. The private value of anunderutilised crop is its propensity to generate an income, ability toabsorb production shocks and nutritional, medicinal or food diversifyingpotential as a livelihood strategy. The public value is its contributionto agricultural biodiversity (e.g. ecosystem services), opportunity forfuture generations to generate an income or proper nutrition, and themaintenance of tradition and culture. The latter value is generated bypositive externalities or by the mere existence of the species.
Underutilised plant species are also characterised by the temporaldimension of their potential economic value and three basic cases canbe identified:
1. the observed value of a plant species was equal to its potential valuein the past, but its observed value declined;
2. very limited past value (observed and potential) but recentknowledge has increased its economic potential; and
3. underutilised plant species that have always been undervalueddespite the knowledge of its potential.
Differences among these three cases are important because they mayhelp define the appropriate policy response to support underutilised plantspecies. The multi-purpose baobab tree is an example of the third case.Despite its wide distribution in semi-arid Africa, the commercial potentialfor its numerous products has never been realized because of the lack ofplanting material, management techniques, processing technologies, andorganized market chains (ICUC, 2004).
Additionally, underutilised plant species may be characterised by thespatial distribution of their potential economic value. There are twopossibilities. First, the observed value may be limited to a certain area

2.4. Marketing underutilised plant species 49
where the species is produced and consumed. Secondly, the observed valuemay be dispersed among multiple areas, and either the plant species isunderutilised in each of these areas, or it is only underutilised in certainareas and not others.
In a perfectly competitive market, no species would be consideredunderutilised. Thus, plant species are underutilised as a consequence ofmarket imperfections. Perfect competition and full appropriation of theproduct value in a commercial market implies that all economic actorshave complete information, and both private and public sources of valuesare reflected in market price. There are three major economic factorsexplaining why these market conditions, i.e. full information and fullappropriation, are not met for underutilised plant species.
Missing output market When primary producers do not or cannotaccess a market for underutilised plant species, the output marketis ‘missing’. This may be due to exogenous and endogenousconstraints, e.g. capers (Capparis spinosa) are underutilised inSyria due to high transactions costs caused by a lack of informationand trust among market chain actors (Giuliani et al., 2007), whereasAfrican garden egg (Solanum aethiopicum) is underutilised inGhana due to its short shelf life (Horna et al., 2007).
Suboptimal market equilibrium In a market economy, the situationof underutilised plant species with a potential value that is not fullyrealized can be interpreted as a suboptimal market equilibrium. Thelatter is the direct consequence of one or more market imperfections.The market price does not reveal the full value of the product orconsumer willingness-to-pay and the quantity produced does notrepresent the optimal scale of production or production capacity.There are three possible explanations, namely weak market demand,inefficient supply and a combination of the two. An example of amarket imperfection is the need for processing infrastructure andorganisation causing a lack of caper supply in Syrian consumermarkets (Giuliani et al., 2007).
Market failures Some underutilised species are not only underutilisedfrom a market perspective but their limited use also fails to reflecttheir public value. The lack of economic information and thelack of product knowledge can contribute to market failures. Forexample, local populations may be ignorant of the nutritional
50 Chapter 2. Literature review
benefits of consuming products from underutilised species. Thislack of knowledge can be a market constraint, resulting in a lowerdemand than what it would be under full information.
Based on the above-mentioned, underutilised plant species can beclassified according to four economic criteria: (i) observed and potentialvalue characterization, (ii) output market, (iii) market imperfections,and (iv) market failures. This classification scheme forms in turn thebasis for the formulation of three necessary conditions for the successfulcommercialisation of underutilised plant species:
1. expansion of demand;
2. improved efficiency of production and marketing channels; and
3. supply control mechanism or capacity to differentiate from productsthat are close substitutes.
2.5 Market chains
2.5.1 Definition, principles and evolution
In SSA, marketing channels are mostly characterised as conventionalmarketing channels instead of vertical channels (Dijkstra, 1997). Aconventional marketing channel consists of isolated and autonomous unitsor stages of which each performs a defined set of marketing functions.Coordination among channel members is primarily achieved throughbargaining and negotiation at spot markets (Dijkstra, 1997; Kotler et al.,2005). Moreover, no channel member has much control over the othermembers and no formal means exist for assigning roles and resolvingchannel conflicts (Kotler et al., 2005). In contrast, a vertical marketingsystem consists of stakeholders as a unified system. one channel memberowns the others, has contracts with them, or has so much power that theymust all cooperate (Kotler et al., 2005).
The use of the term channel or chain suggests a focus on relationshipsbetween buyers and suppliers, and the movement of a good or servicefrom producer to consumer (Gibbon & Ponte, 2005). This entails ananalysis centred on flows of material resources, finance, knowledge, andinformation between buyers and suppliers (Gibbon & Ponte, 2005).
A market chain describes the numerous links that connect all actors andtransactions involved in the movement of a product from the field to the
2.5. Market chains 51
end user or consumer (Lundy et al., 2004b; Ferris et al., 2006; Lundy et al.,2007). The term ‘market chain’ is often used interchangeably with theterms production chain, supply chain, market channel, marketing chainor value chain (Ferris et al., 2006; Lundy et al., 2004a, 2007) and will beused by the author in the present study.
Value chain analysis is emerging as a useful tool that has already led tonew practical insights in the markets for textiles and clothing (Gereffi,1999), fresh fruits and vegetables (Dolan et al., 1999), commodities suchas tea and coffee, and wooden furniture in the case of the forestry sector(Kaplinsky et al., 2003). Moreover, value chain analysis has also beenadded to the research agenda for NTFPs (Jensen, 2009). Box 2.2 showsbriefly the history of the value chain concept.
A value chain describes the full range of activities which are required tobring a product or service from conception, through the different phasesof production (involving a combination of physical transformation andthe input of various producer services) and delivery, to end consumers,and final disposal after use (Kaplinsky & Morris, 2001). This definitionhas been widely accepted by researchers and scientists (Roduner, 2005).Value chains are as strong as their weakest link. In other words, when e.g.the midstream segment of the chain (trading) does not work properly, ithas negative repercussions upstream in the chain (production) as well asdownstream (consumers) (KIT & IIRR, 2008).
Value chains aim at optimising the chain, are demand-driven andcharacterised by differentiated products, interdependent actors, extensiveinformation flows, and a focus on quality and value (Hobbs et al., 2000).In contrast, production or traditional chains strive for self optimisation,are supply-driven and characterised by basic (primary and secondary)products, independent actors, little or no information flow, and a focus onprice and costs (Hobbs et al., 2000). Based on the findings in the presentstudy, the chain of baobab and tamarind products can be characterisedas a traditional chain rather than a value chain. Therefore, the authorprefers to use the term market chain instead of value chain.
2.5.2 Market chain analysis
At the most basic level, value chain analysis can be seen as amethodological tool to plot the flow of goods and services up and downthe chain, and between different chains (Kaplinsky & Morris, 2001), thus
52 Chapter 2. Literature review
Box 2.2: History of the value chain concept
The value chain concept has evolved through time across variousdisciplinary fields, areas of application and levels of analyticalaggregation. Three main research streams in the value chain literatureare distinguished: (i) the filiere approach; (ii) the conceptual frameworkelaborated by Porter; and (iii) the global approach. The evolutiontime line and content change in the concept value chain is given below(Porter, 1998; Gereffi, 1999; Raikes et al., 2000; Kaplinsky & Morris,2001; Stamm, 2004; Roduner, 2005; da Silva & de Souza Filho, 2007;van den Berg et al., 2007).
’50s The first realization of the importance of a vertical dimension in theanalysis of agrifood sectors has been attributed to two researchersfrom Harvard University, Davis and Goldberg, who coined theterm agribusiness to represent the aggregate of operations thattake place between farm and consumer.
’60s and ’70s Agricultural economists in the United States developedthe general framework that became known as the commoditysystems approach, which offered a logical structure to performagrifood sector analysis, taking into account both horizontal andvertical dimensions. A parallel development with a similar focuswas the filiere (chain) approach developed by a number of Frenchresearchers. The French filiere concept, developed by researchersat the Institute National de la Recherche Agronomique (INRA)and the Centre de Cooperation Internationale en RechercheAgronomique pour le Developpement (CIRAD), encompasses astatic model with non-changing actors and national boundaries,describing the linear flow of physical inputs and services in theproduction of a final product. Initially, the approach was used asa tool to analyse the ways in which agricultural production systemswere organised in developing countries under the French colonialsystem.
2.5. Market chains 53
Box 2.2: History of the value chain concept (Continued)
’80s Porter proposed the chain concept to relate the activitiesperformed by an organisation with its competitive position(system thinking). Porter’s value chain is an instrument foridentifying the value created at each step in the production,and how a firm should position itself in the market and inrelationship with suppliers, buyers and competitors. Firmscan be organized according to their primary activities thatinclude inbound and outbound logistics, operations, marketing andsales, and service. Support activities, also performed by firms,include procurement, technology development, human resourcemanagement and infrastructure. It is the systematic arrangementof these activities that creates value and influences the competitiveposition of the firm. Systems principles are also present in supplychain management, which is primarily concerned with the wayfirms organize the flow of inputs and production resources fromprocurement through product manufacturing and distribution.
’90s Other uses of the chain concept were promoted by researchersinterested in globalisation and international trade issues. Globalcommodity chains, introduced into literature by Gereffi, cover aconcept that is mainly focusing on the power relations in thecoordination of dispersed, but linked, production systems. Thisconcept is used to examine the ways in which firms and countriesare globally integrated and to assess the determinants of globalincome distribution.
54 Chapter 2. Literature review
to describe markets (te Velde et al., 2006). By focusing on the whole rangeof activities and relations, the value chain approach is simultaneously adescriptive tool and an analytical instrument (Kaplinsky & Morris, 2001;Jensen, 2009).
Because each value chain is different and has particular characteristics,Kaplinsky & Morris (2001) stress that there is no unique correct way toconduct a value chain analysis. Therefore, it is the research question thatfundamentally determines the followed approach (van den Berg et al.,2007). A methodology for undertaking value chain research may contain,among others, following issues: point of entry for value chain analysis,mapping value chains, product segments and critical success factors infinal markets, benchmarking production efficiency, governance of valuechains and upgrading in value chains (Kaplinsky & Morris, 2001). Hereby,governance in a value chain refers the structure of relationships andcoordination mechanisms that exist between actors in the chain, whereasupgrading can involve improvements in quality (i.e. process upgrading)and product design (i.e. product upgrading) that enable actors to gainhigher value or through diversification in the product lines served (i.e.functional upgrading) (Kaplinsky & Morris, 2001; van den Berg et al.,2007).
The objectives of value chain analysis are according to Marshall et al.(2006a):
• identify the main actors or organisations in the commercialisationchain from the input provider to the collector right through to thefinal consumer, and identify their specific activities;
• identify the different routes to commercialise the product, whichcould be what currently exists and what potentially is available orcould be developed; and
• assess how well the market chain is working.
How to carry out a value chain analysis is split into three sections(Marshall et al., 2006a): (i) description of the value chain; (ii)identification of important routes and actors in the chain; and (iii)assessing the profitability, power and institutional environment of thekey actors. A value chain analysis typically includes the following keyelements or steps (Roduner, 2005; FIAS, 2007; Will, 2008):
2.5. Market chains 55
• choose the sub-sector(s) 1 to assess;
• analyse the market;
• map the value chain;
• measure the performance of the chain and establish benchmarks (i.e.comparing similar value chains in different regions or countries);
• analyse performance gaps (e.g. market failures); and
• establish recommendations and develop an upgrading strategy.
Once the sector(s) to assess has been chosen, a point of entry into thechain needs to be selected prior to the start of the analysis, in order toensure an effective and targeted study (Kaplinsky & Morris, 2001). Dueto the high degree of complexity of most chains and their overlap withother chains, the selection of the point of entry is critical to the study asit often determines the actual chain (or chains) that will be investigated(Kaplinsky & Morris, 2001). The focus of this study and point of entry wasthe small-scale rural producer (hereafter referred to as gatherer) of baobaband tamarind products in Mali and Benin. Further links and functionswere then investigated by departing from the smallholder’s respectiveposition, moving up or down the chain as necessary. A value chain analysisshould be carried out with the following groups (Marshall et al., 2006a):
• the initial stages of the analysis take place in the communityto identify the important traders and markets and develop anunderstanding of how familiar the community is with the chainbeyond this initial market point of contact;
• subsequent stages of the analysis should be undertaken with thetraders and at markets identified with the community to determinewhat happens to the product next and who is involved. The researchshould then move to the next actor along the chain, continuing untilthe end consumer is reached;
• once a chain has been developed from producer to consumer, datagaps should be identified and filled with either primary or secondarydata. The latter will involve contacting people and organisations
1A sub-sector refers to all the actors and services that are financially andsocially linked as products, information and finances flow from producers throughintermediaries to consumers for a particular commodity. Usually a sub-sector analysisis undertaken at national level (Best et al., 2005). A market chain has a similardefinition, but may be undertaken at more local level and provide a partial view of thetotal commodity sub-sector (Best et al., 2005).
56 Chapter 2. Literature review
who have previously collected and documented important data andinformation; and
• the initial value chain analysis should be presented and discussedwith the community, and where necessary modified. The final resultsshould be retained within the community. Where appropriate, theresults from the value chain analysis should be disseminated to localauthorities and policy decision makers.
Mapping the market
The term market map has been developed by Practical Action based onthe believe that markets matter to the rural poor. Factors that influencehow markets operate, including access to information, market institutions,linkages and trade rules, have a powerful influence on the earnings ofsmallholders (Albu & Griffith, 2005, 2006). Failure to address these factorscan mean that the benefits of economic growth, innovative technologiesand better infrastructure, simply by-pass the poor (Albu & Griffith, 2005,2006). Therefore, Albu & Griffith (2005, 2006) are convinced that effortsto secure and improve the income of poor rural smallholders are bestpursued through concentrating on the improved overall performance ofspecific economic channels or market chains. Market chains comprisethe economic actors who produce and transact a particular product asit moves from primary producer to final consumer, such as smallholders,processors, transporters, wholesalers and retailers (Albu & Griffith, 2005,2006).
The market map is a framework that describes the overall market systemfor any given market chain (Albu & Griffith, 2005, 2006). The marketmap serves two purposes: (i) it is a framework for conceptualizing theentire commercial and institutional environment in which rural producersoperate, and (ii) it is a practical tool for market facilitators to develop,visually represent and briefly communicate this knowledge among differentstakeholders (Albu & Griffith, 2005; Hellin et al., 2005; Albu & Griffith,2006). Therefore, the market map plays an important role in encouragingmarket literacy. The latter is defined as a better understanding of theinstitutions, competencies and relationships necessary for specific marketsystems to work for poor producers (Albu & Griffith, 2005; Hellin et al.,2005; Albu & Griffith, 2006).
The market map as shown in Figure 2.5 is made up of three interlinkedelements (Ferrand et al., 2004; Albu & Griffith, 2005, 2006; Hellin &
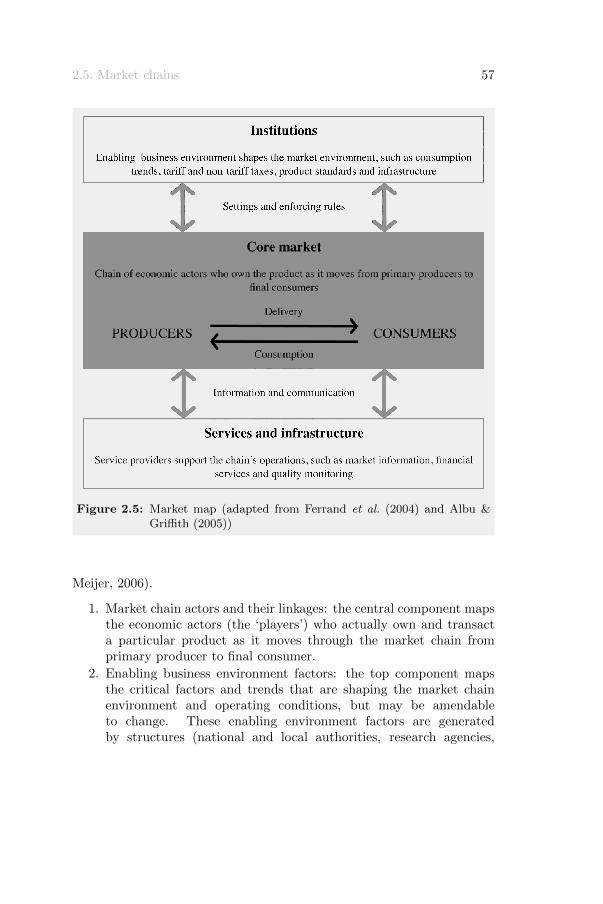
2.5. Market chains 57
Figure 2.5: Market map (adapted from Ferrand et al. (2004) and Albu &Griffith (2005))
Meijer, 2006).
1. Market chain actors and their linkages: the central component mapsthe economic actors (the ‘players’) who actually own and transacta particular product as it moves through the market chain fromprimary producer to final consumer.
2. Enabling business environment factors: the top component mapsthe critical factors and trends that are shaping the market chainenvironment and operating conditions, but may be amendableto change. These enabling environment factors are generatedby structures (national and local authorities, research agencies,
58 Chapter 2. Literature review
etc.) and institutions (policies, regulations and practices) (the‘influencers’), that are beyond the direct control of economic actorsin the market chain.
3. Business and extension service providers: the bottom componentmaps the services that support (the ‘supporters’), or couldpotentially support, the market chain’s overall efficiency.
The players operate at micro-level, whereas the supporters and influencesor enablers intervene respectively at meso- and macro-level (Will, 2008).Additionally, these three interlinked components and structures are allembedded into a fourth category, namely the attitudes, which encompassthe socio-economic and socio-cultural conditions at meta-level (Will,2008).
The process of mapping the market, if conducted in participation withthe market chain actors themselves, can be a powerful way to buildunderstanding and trust between stakeholders (Albu & Griffith, 2005;Hellin et al., 2005; Albu & Griffith, 2006). There is, however, no singleblueprint for this participatory approach (Albu & Griffith, 2005, 2006).While Practical Action was evolving the market map, the InternationalPotato Centre (CIP) in Peru has been developing a similar participatorymarket chain analysis (PMCA) (Bernet et al., 2005). These two sets ofideas came together initially at a seminar in February 2005 (Almond &Hainsworth, 2005) and PMCA was identified as a key approach to put themarket map into practice (Albu & Griffith, 2005, 2006).
Participatory market chain analysis
Participatory market chain analysis (PMCA) is an instrument forfacilitating change in market chains that lack coordination, so creating anenvironment that fosters interaction among market chain actors, promotesmutual learning and trust and stimulates shared innovations (Bernetet al., 2006). In other words, PMCA is a participatory process thatgradually stimulates interest, trust and collaboration among members ofthe market chain (Bernet et al., 2005).
PMCA is a flexible method to be applied in different marketing chaincontexts. The only fixed element of this approach are its three phases(Bernet et al., 2005, 2006): (i) get to know the different market chainactors with their activities, interests, ideas and problems; (ii) analyse ina participatory manner potential joint business opportunities; and (iii)
2.5. Market chains 59
implement joint market innovations (new products, new technologies,new institutions). For more details the reader is referred to themanuals developed for participatory market chain analysis by Lundy et al.(2004b,a, 2007) and Bernet et al. (2006).
Rapid market analysis
Rapid market analysis (RMA), used in the present study, is often thefirst step in the first phase of a PMCA. RMA is a method that relies onsemi-structured informal interviews with key informants and a minimumnumber participants at different stages of the market chain or sub-sector(Ferris et al., 2006). Hereby, a minimum of three to five interviews ofactors conducted at each stage in the market chain is used as a rule ofthumb (Ferris et al., 2006). The RMA is a way of: (i) getting to know thevarious key actors in the chain; (ii) understanding the circumstances andpractices of the actors involved in the market; (iii) identifying bottlenecksand opportunities associated with the various links in the chain, i.e.production, commercialisation, processing, use and consumption; and (iv)prescribing interventions in the organisation, technology and managementof the chain (Bernet et al., 2006; Ferris et al., 2006).

3Methodology
62 Chapter 3. Methodology
This chapter starts with a brief overview of the study area and continuesby explaining the data collection, and quantitative and qualitative analysismethods used in the present PhD study.
3.1 Study area
This study was conducted in two west African countries, namely Maliand Benin, to obtain a holistic picture of the market chain of baobaband tamarind products. Hereafter, the geographic situation is given, andpopulation data and development indicators of both countries are listed.To conclude, a comparison is presented between Mali and Benin.
3.1.1 Mali
The Sudanese Republic and Senegal became independent of France on 22September 1960 forming the Mali Federation. When Senegal withdrewafter only a few months, what formerly made up the Sudanese Republicwas renamed as the Republic of Mali (CIA, 2011c).
Geographical situation
Mali is a landlocked country situated between Mauritania and Senegal inthe west, Guinea and Ivory Coast in the south, Burkina Faso and Nigerin the east, and Algeria in the north (Figure 3.1). The capital is Bamako.In total, Mali has an area of 1,240,192 km2 of which 1,220,190 km2 is land;about two thirds is desert or semi-desert (CIA, 2011c). Mali is subdividedin eight regions: Kayes, Koulikoro, Sikasso, Segou, Mopti, Gao, Kidal andTombouctou, and one capital district Bamako.
Population data
Total population is estimated at approximately 13,800,000 in 2010 (CIA,2011c). About 47.50 % of the population are under 14 years, 49.50 %are between 15-64 years of age whereas only three percent are abovethe age of 65. Life expectancy at birth is 52.17 years according tothe Central Intelligence Agency (CIA, 2011c), while the United NationsDevelopment Programme (UNDP, 2010c) reports 49.20 years. Annualpopulation growth rate is currently estimated at 2.61 %. CIA (2011c)reports a literacy rate of 46.40 %, whereas UNDP (2010c) estimates therate of literacy at 26.20 %. Albeit the official language is French, many
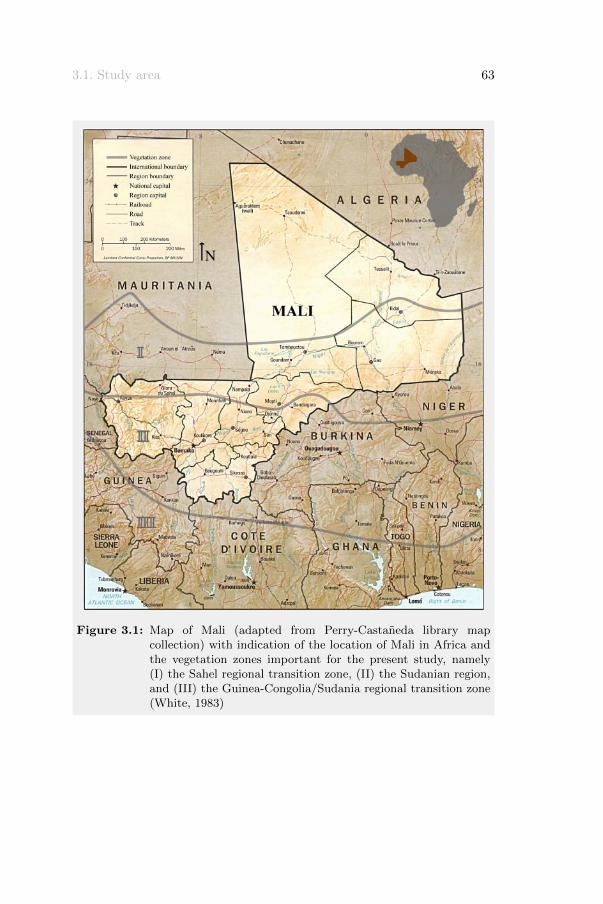
3.1. Study area 63
Figure 3.1: Map of Mali (adapted from Perry-Castaneda library mapcollection) with indication of the location of Mali in Africa andthe vegetation zones important for the present study, namely(I) the Sahel regional transition zone, (II) the Sudanian region,and (III) the Guinea-Congolia/Sudania regional transition zone(White, 1983)
64 Chapter 3. Methodology
tribal languages are spoken, of which Bambara is the most commonly used(CIA, 2011c).
Development and economic indicators
Mali is among the poorest countries in the world with a highly unequalincome distribution or Gini coefficient of 0.39 (UNDP, 2010c) or 0.40(CIA, 2011c). About 36.10 % of the population lives below the nationalpoverty line 1 in a country where annual gross domestic product (GDP)is estimated at 16.74 $ billion (CIA, 2011c). GDP per capita (purchasingpower parity or PPP) amounts to 1,171 $ according to UNDP (2010c),whereas CIA (2011c) reports 1,200 $. The informal economy in Mali isestimated at 41.0 % of GDP in the 1999-2000 period (Schneider, 2002).In the 2005-07 period, poverty incidence 2 at national level was estimatedto be 63.8 %, with 75.9 % in rural areas and 30.1 % for urban areas. Thelevel of poverty in Mali is thus a marked rural phenomenon (FAO, 2010d).In addition, 12 % of Mali’s population was undernourished in the period2005-07 (FAO, 2010c) with high levels of vitamin A and iron deficiency(FAO, 1999a).
Economic activity is largely confined to the riverine area irrigated bythe Niger. About 80 % of the labour force is engaged in farmingand fishing. Industrial activity is concentrated on processing farmcommodities. Annual growth in real output was estimated at 2.70 % in2009. Inflation was 2.50 % in 2007 (CIA, 2011c). Since 1 January 1999,the West African CFA franc or FCFA (XOF) has been pegged to the Euroat a fixed rate of 655.957 FCFA per Euro.
Main agricultural commodities are rice, millet, groundnut, cotton,sorghum, maize, tomato, watermelon, sweet potato, shea nut, banana,
1National estimates of the percentage of the population falling below the povertyline are based on surveys of sub-groups, with the results weighted by the number ofpeople in each group (CIA, 2011a). Definitions of poverty vary considerably amongnations and are not comparable among countries.
2Poverty incidence is expressed in poverty headcount (FAO, 2011a), which is theproportion of the population who are multidimensionally poor (UNDP, 2010c). Themultidimensional poverty index (MPI) identifies multiple deprivations at the individuallevel in health, education and standard of living. The MPI value is the product oftwo measures: the multidimensional headcount ratio and the intensity (or breadth)of poverty (UNDP, 2010c). The MPI complements income poverty measures (FAO,2011a). In practice, although there is a clear overall relationship between MPI and1.25 $ / day poverty, the estimates do differ for many countries which can be explainedby the fact that they measure different conceptions of poverty (FAO, 2011a).
3.1. Study area 65
yam and cowpea; main export commodities are cotton, groundnut oil andgroundnut, mango and livestock products (FAO Stat, 2010).
Mali is heavily dependent on foreign aid. The government implementsa recommended structural adjustment program of the InternationalMonetary Fund (IMF) that is helping the economy to grow, diversify,and attract foreign investment (CIA, 2011c). National poverty reductionstrategy papers (PRSPs) are one of the main tools by which individualcountries first define, and then articulate and monitor their plans toaddress the millennium development goals (MDGs) (Garrity, 2004).The PRSP of Mali (IMF, 2008b) mentions three strategic orientations:development of infrastructures and the productive sector, pursuance andconsolidation of structural reforms, and strengthening of the social sector.
3.1.2 Benin
Present-day Benin once was the site of Dahomey, a prominent WestAfrican kingdom that was founded in the 15th century. The territorybecame a French colony in 1872 and achieved independence on 1 August1960, as the Republic of Benin (CIA, 2011b).
Geographic situation
Benin is located between Togo and Nigeria, and is bordered by BurkinaFaso and Niger in the north, and the Bight of Benin in the south (Figure3.2). Although and de facto the administrative capital is Porto Novo,Cotonou is the economic capital. Benin has a total area of 112,622 km2
of which 110,622 km2 is land. Benin is subdivided in 12 departments:Alibori, Atacora, Atlantique, Borgou, Collines, Kouffo, Donga, Littoral,Mono, Oueme, Plateau and Zou.
Population data
Total population is estimated at approximately 9,100,000 in 2010 (CIA,2011b). About 45.30 % of all Beninese are under 14 years, 52.10 % arebetween 15-64 years of age and only 2.60 % are above the age of 65. Lifeexpectancy at birth is 59.42 years according to CIA (2011b), while UNDP(2010c) reports 62.3 years. Annual population growth rate is estimatedat 2.94 %. CIA (2011b) reports a literacy rate of 34.70 %, whereas UNDP(2010c) estimates the rate of literacy at 43.00 %. Even though the officiallanguage is French, many tribal languages exist, among which Fon and
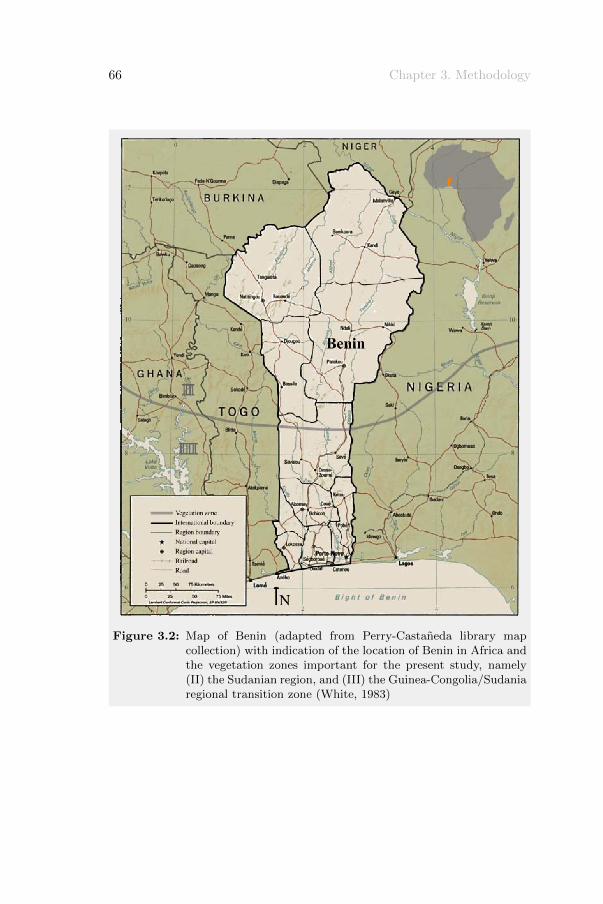
66 Chapter 3. Methodology
Figure 3.2: Map of Benin (adapted from Perry-Castaneda library mapcollection) with indication of the location of Benin in Africa andthe vegetation zones important for the present study, namely(II) the Sudanian region, and (III) the Guinea-Congolia/Sudaniaregional transition zone (White, 1983)
3.1. Study area 67
Yoruba are the most commonly used (CIA, 2011b). Each ethnic grouphas its own language.
Development and economic indicators
Benin is a poor country with a highly unequal income distribution or Ginicoefficient of 0.39 (UNDP, 2010c) or 0.37 (CIA, 2011c). About 37.40 %of the population lives below the national poverty line in a country whereannual GDP is estimated to be 14.20 $ billion (CIA, 2011b). GDP percapita (PPP) amounts to 1,499 $ according to UNDP (2010c) and 1,500 $according to CIA (2011b). The informal economy is estimated to be45.2 % of GDP in the 1999-2000 period (Schneider, 2002). In the 2005-07period, the incidence of poverty (poverty headcount) at national level wasestimated to be 39.0 %, with 46.0 % in rural areas and 29.0 % for urbanareas. The level of poverty in Benin is thus basically a rural phenomenon(FAO, 2010b). According to FAO (2010a), 12 % of Benin’s populationwas undernourished in the period 2005-07 with high levels of vitamin Aand iron deficiency (FAO, 2003).
The economy of Benin remains underdeveloped and dependent onsubsistence agriculture, cotton production, and regional trade inagricultural commodities. Annual growth in real output has averagedaround four percent over the past three years, but rapid population growthhas offset much of this increase. Inflation has dropped over the past years,from 7.90 % in 2008 to 1.60 % in 2010 (CIA, 2011b). Since 1 January 1999,the West African CFA franc or FCFA (XOF) has a fixed exchange rateto the Euro, namely 1 Euro = 655.957 FCFA.
Main agricultural commodities in terms of production are yam, cassava,cotton, maize, bean, groundnut, cashew nut, pineapple, tomato, chilli andpepper; main export commodities are cotton lint, cashew nut, palm oiland pineapple (FAO Stat, 2010). CIA (2011b) reports also shea butter asexport product.
In order to raise growth, Benin plans to attract more foreign investment,place more emphasis on tourism, facilitate the development of newfood processing infrastructure and agricultural products, and encouragenew information and communication technology (CIA, 2011b). ThePRSP of Benin (Anonymous, 2007; IMF, 2008a) states four priorityareas of intervention to raise growth: stabilisation of the macroeconomicframework, stimulation of the private sector, diversification of the
68 Chapter 3. Methodology
economy, and promotion of regional integration. In addition, otherinterventions concern development of infrastructures (including energyand water), reinforcement of human capital (including education,health services and social security), promotion of good governance andsustainable use of natural resources (Anonymous, 2007).
3.1.3 Comparison of Mali and Benin
Based on the country profiles described above and the figures presentedin Table 3.1, the first obvious difference between Mali and Benin is thegeographical situation: Mali is a landlocked country, whereas Benin hasa coastline. Therefore, Mali has no maritime harbour. The port ofCotonou is, however, an important – and at the same time potential –gateway to landlocked West African countries, such as Niger, BurkinaFaso and Mali. Till now, high shipping costs, low efficiency, and poorlogistical facilities have kept it from becoming a key trade route (IFC,2009). Besides the port of Cotonou, there are also other ports in the Gulfof Guinea which are suitably linked to the Sahelian capitals Bamako,Ouagadougou and Niamey. These north-south axes are facing growingcompetition from east-west corridors, notably from Dakar, Nouakchott,Banjul and Conakry (ECOWAS-SWAC/OECD, 2006).
In Mali, the navigable Niger river has an important transport function.The Niger river, the principal river of western Africa, has its source insouth-eastern Guinea, runs in a crescent through Mali, Niger – on theborder with Benin – and then through Nigeria, discharging through amassive delta, known as the Niger Delta, into the Gulf of Guinea in theAtlantic Ocean.
The road network in both Mali and Benin depends largely on developmentaid which finances several projects per year, and has been doingso for several decades. These investment efforts have led to thecurrent regional system, which, while imperfect, shows considerableimprovements. However, the quality of the network varies significantlybecause of a lack of maintenance. If railways had continued to developafter independence, today they could have eased the road from the heavyloads carried over long distances by trucks (ECOWAS-SWAC/OECD,2006).
Mali is more than ten times the area of Benin, but Benin has a higherpercentage of arable land. Arable land includes land defined by the FAO
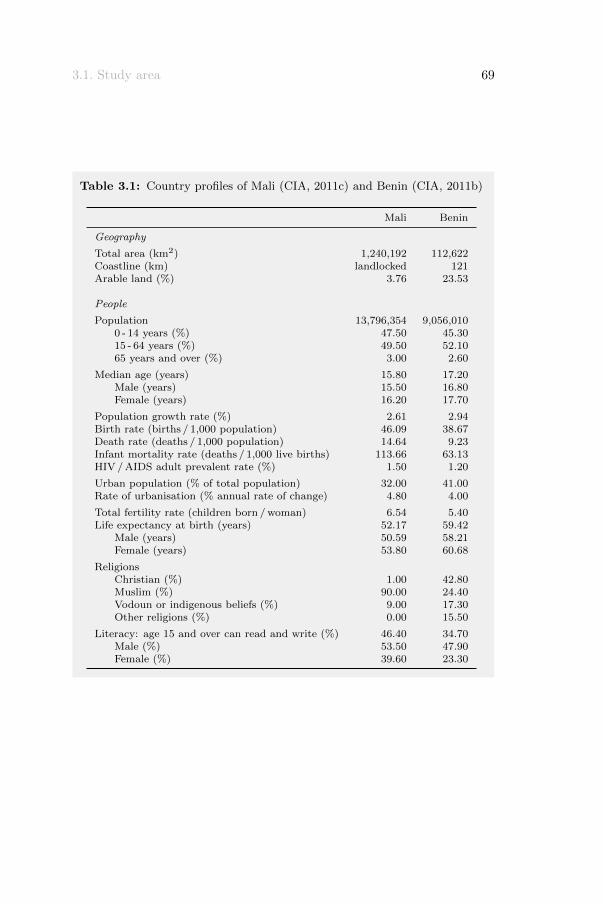
3.1. Study area 69
Table 3.1: Country profiles of Mali (CIA, 2011c) and Benin (CIA, 2011b)
Mali Benin
Geography
Total area (km2) 1,240,192 112,622Coastline (km) landlocked 121Arable land (%) 3.76 23.53
People
Population 13,796,354 9,056,0100 - 14 years (%) 47.50 45.3015 - 64 years (%) 49.50 52.1065 years and over (%) 3.00 2.60
Median age (years) 15.80 17.20Male (years) 15.50 16.80Female (years) 16.20 17.70
Population growth rate (%) 2.61 2.94Birth rate (births / 1,000 population) 46.09 38.67Death rate (deaths / 1,000 population) 14.64 9.23Infant mortality rate (deaths / 1,000 live births) 113.66 63.13HIV / AIDS adult prevalent rate (%) 1.50 1.20
Urban population (% of total population) 32.00 41.00Rate of urbanisation (% annual rate of change) 4.80 4.00
Total fertility rate (children born / woman) 6.54 5.40Life expectancy at birth (years) 52.17 59.42
Male (years) 50.59 58.21Female (years) 53.80 60.68
ReligionsChristian (%) 1.00 42.80Muslim (%) 90.00 24.40Vodoun or indigenous beliefs (%) 9.00 17.30Other religions (%) 0.00 15.50
Literacy: age 15 and over can read and write (%) 46.40 34.70Male (%) 53.50 47.90Female (%) 39.60 23.30
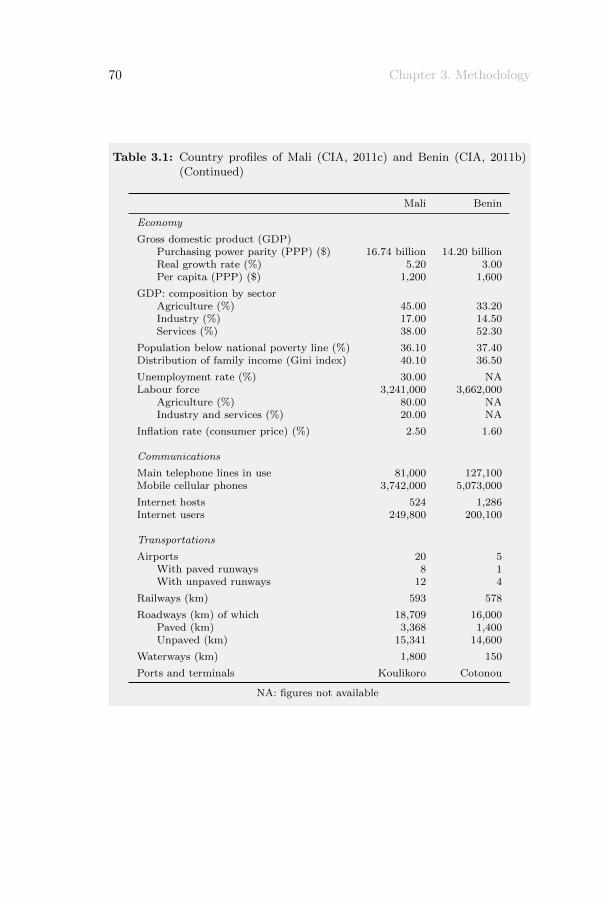
70 Chapter 3. Methodology
Table 3.1: Country profiles of Mali (CIA, 2011c) and Benin (CIA, 2011b)(Continued)
Mali Benin
Economy
Gross domestic product (GDP)Purchasing power parity (PPP) ($) 16.74 billion 14.20 billionReal growth rate (%) 5.20 3.00Per capita (PPP) ($) 1,200 1,600
GDP: composition by sectorAgriculture (%) 45.00 33.20Industry (%) 17.00 14.50Services (%) 38.00 52.30
Population below national poverty line (%) 36.10 37.40Distribution of family income (Gini index) 40.10 36.50
Unemployment rate (%) 30.00 NALabour force 3,241,000 3,662,000
Agriculture (%) 80.00 NAIndustry and services (%) 20.00 NA
Inflation rate (consumer price) (%) 2.50 1.60
Communications
Main telephone lines in use 81,000 127,100Mobile cellular phones 3,742,000 5,073,000
Internet hosts 524 1,286Internet users 249,800 200,100
Transportations
Airports 20 5With paved runways 8 1With unpaved runways 12 4
Railways (km) 593 578
Roadways (km) of which 18,709 16,000Paved (km) 3,368 1,400Unpaved (km) 15,341 14,600
Waterways (km) 1,800 150
Ports and terminals Koulikoro Cotonou
NA: figures not available
3.1. Study area 71
as land under temporary crops (double-cropped areas are counted once),temporary meadows for mowing or for pasture, land under market orkitchen gardens, and land under temporarily fallow. Land abandoned asa result of shifting cultivation is excluded (World Bank, 2011).
Population data of both countries are roughly speaking comparable. E.g.population growth rates in Mali and Benin are at first sight comparable.However, in Benin the growth rate decreased over the past years, whereasin Mali it has increased. Moreover, median age and life expectancy arehigher in Benin than in Mali, and can be linked to a lower death ratein Benin compared to that in Mali. The majority of the population inMali is Muslim, whereas in Benin there is a mix of Christian, Muslim,indigenous beliefs and other religions. Literacy rate is evaluated betterin Mali than in Benin. A similar urbanisation rate has been reported forboth countries.
With a human development index (HDI) of 0.309 Mali occupies place160 on 169 countries, whereas Benin with a HDI of 0.435 is ranked asnumber 134 (UNDP, 2010c). The HDI provides a composite measure ofthree basic dimensions of human development: living a long and healthylife (measured by life expectancy), being educated (measured by adultliteracy and gross enrolment in education) and having a decent standardof living (measured by PPP) (UNDP, 2010c). Between 1980 and 2010,Mali’s HDI rose by 2.10 % annually from 0.165 to 0.309 today (UNDP,2010b). In comparison, during the same period, Benin’s HDI rose by1.70 % annually from 0.264 to 0.435 today (UNDP, 2010a).
Furthermore, Table 3.1 reports a similar percentage of population belowthe national poverty line in Mali and Benin. The common internationalpoverty line has in the past been roughly 1.00 $ a day as proposed in the1990 World Development Report ‘Poverty for measuring absolute povertyby the standards of the world’s poorest countries’. In 2009, the WorldBank revised the international poverty line and proposed 1.25 $/ day(PPP) as new poverty line at (Ravallion et al., 2009). Thus, populationbelow 1.25 $ a day is the percentage of the population living on less than1.25 $ a day at 2005 international prices (World Bank, 2011). In Mali,the population below the international poverty line is 51.40 %, whereas inBenin 47,30 % of the population lives below 1.25 $ a day (UNDP, 2010c).Also the Gini indices in both countries studied are similar and evidence ahighly unequal income distribution. The Gini coefficient is a measure ofthe inequality of income distribution: a value of 0 expresses total equality

72 Chapter 3. Methodology
and a value of 1 (or 100) maximal inequality.
To conclude, the agricultural sector in Mali contributes the most to GDP,which is the value of all final goods and services produced within a nationin a given year, when compared to services and the industrial sector (CIA,2011a). In Benin, the tertiary sector or services are the main contributorto GDP, followed by the agricultural and industry sector.
3.1.4 Study sites
The present field research was conducted in three different vegetationzones, namely the Sahel regional transition zone, the Sudanian regionand the Guinea-Congolia/Sudania regional transition zone (White, 1983).The occurrence of these different bio-climatic zones in Mali and Beninis shown in Figures 3.1 and 3.2. Only the Sudanian region occurs inboth countries and can be found in southern Mali and northern Benin.The Sahel regional transition zone occurs within the central part of Mali,while the Guinea-Congolia/Sudania regional transition zone is located insouthern Benin.
In the Sahel regional transition zone, rainfall is unimodal and rangesbetween 300 and 650 mm per year, whereas the rainy season has amaximal duration of 60 days. In the Sudanian region, annual rainfallis also unimodal and varies between 650 and 1000 mm, whereas rainfall isbimodal with a mean annual of 1200 mm in the Guinea-Congolia/Sudaniaregional transition zone.
In the scope of the DADOBAT project, field research areas in Mali andBenin were defined to coincide with the agro-ecological zones defined byWhite (1983). Within these zones, and based on previous surveys bythe project’s local partner institutes, i.e. University of Abomey-Calaviin Benin and Institute of Rural Economy in Mali, sites with abundantbaobab and tamarind tree populations were chosen and respondents wereidentified there. Figure 3.3 shows that in the Sahel regional transition zoneof Mali, the region of Mopti was selected. In the Sudanian region of Maliregions Segou, Sikasso and Kayes were selected together with the capitaldistrict Bamako. For Benin, Figure 3.4 shows that in the Sudanian regionplaces in departments Alibori, Atacora, Borgou, Donga and Collines weresampled, whereas in the Guinea-Congolia/Sudania regional transitionzone departments Mono, Littoral, Atlantique and Oueme were selected.The research sites within each region or department in respectively Mali
3.2. Material and methods 73
and Benin are shown in Figures 3.3 and 3.4. As the objective of thepresent study was not to identify regional differences in market chains,data gathered in each site were bulked per country. However, the authordoes not exclude that there might be significant regional differences.
3.2 Material and methods
To be able to formulate an answer on the objectives set for this study, anin-depth analysis of the market chain for selected baobab and tamarindproducts is required, through which specific actors are identified andcharacterised, relationships among actors are understood, bottlenecks areidentified and actions proposed for overcoming them. Data for marketanalysis can be divided into, on the one hand, primary data collected bythe investigator during field research, and, on the other hand, secondarydata that have been documented by other people and organisations, andgathered during desk research (Marshall et al., 2006a).
As already mentioned in the literature review, value chains (hereaftercalled market chains) can be mapped and analysed using value chainanalysis (hereafter referred to as market chain analysis). Tools to map themarket are participatory market chain analysis (PMCA) and rapid marketanalysis (RMA). The present study followed the principles of RMA as afirst step of PMCA. Both qualitative and quantitative tools can be usedfor market chain research (Hellin & Meijer, 2006). There are no fixedrules on which research approach is better but there are strong groundsfor recommending that a qualitative approach is used first, followed bya quantitative study (Hellin & Meijer, 2006). Tools to be used duringa participatory market chain analysis include (Hellin & Meijer, 2006;Bammann, 2007):
• participant observation is fundamental to much qualitative researchand leads to a better understanding of the characteristics of thesituation being studied;
• semi-structured interviews are guided conversations in which topicsare predetermined and during which new questions and insights ariseas a result of the discussion; and
• questionnaires are essential to obtain quantitative data which areneeded to permit a more objective assessment and facilitate anassessment of trends and relationships among different value chainactors.
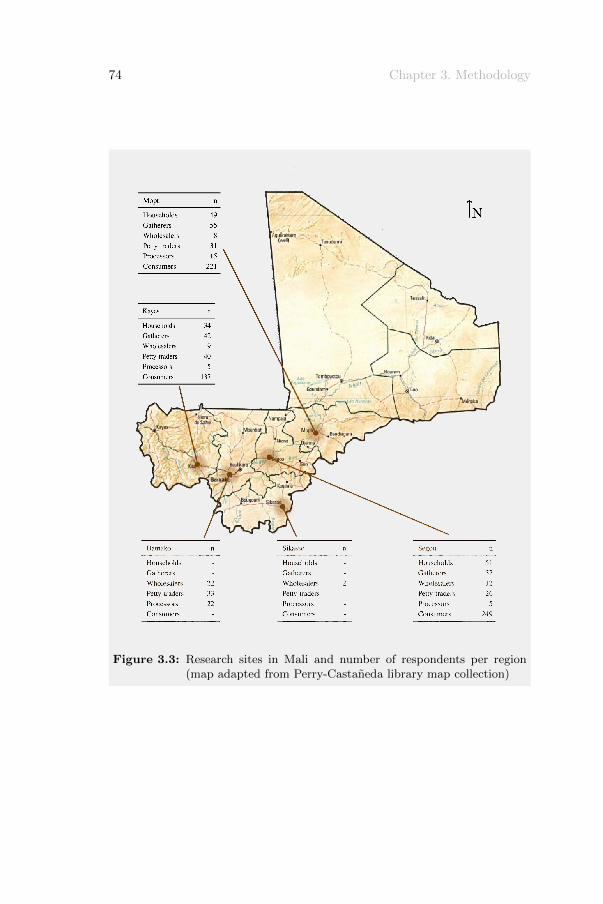
74 Chapter 3. Methodology
Figure 3.3: Research sites in Mali and number of respondents per region(map adapted from Perry-Castaneda library map collection)
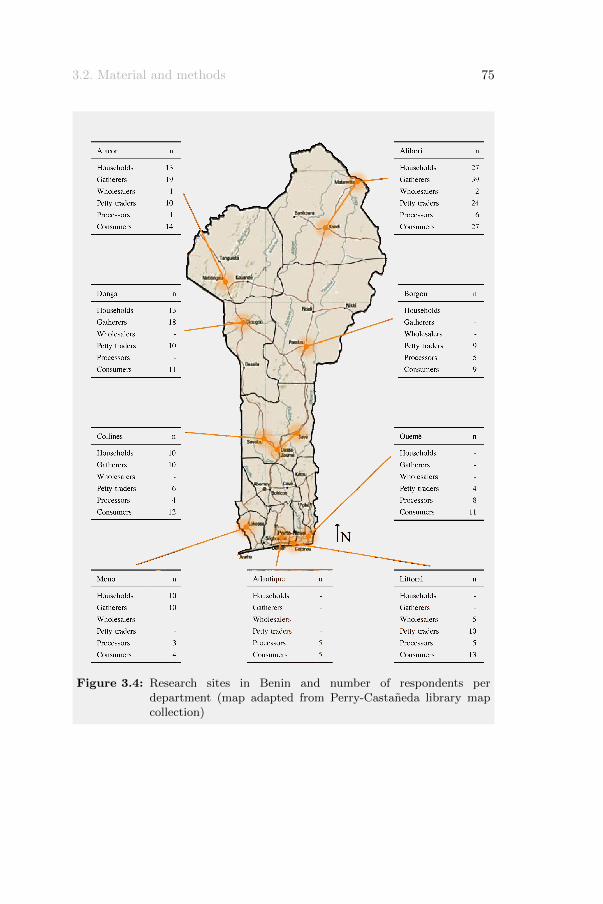
3.2. Material and methods 75
Figure 3.4: Research sites in Benin and number of respondents perdepartment (map adapted from Perry-Castaneda library mapcollection)
76 Chapter 3. Methodology
Hereby, questionnaires focus on what market chain actors are doing,whereas qualitative research tools not only provide a means to check thereliability of data from questionnaires, but also give more insight into whyactors are doing what they do and how they formulate their decisions(Hellin & Meijer, 2006).
The present research is set out as a case study, following an embeddedmultiple-case design according to Yin (2003). The term multiple-caserefers to four cases: the leaf and fruit products of both baobab (Adansoniadigitata L.) and tamarind (Tamarindus indica L.). For each case, two – so-called – embedded units of research can be identified, namely the differentmarket chains in Benin and Mali, and their analysis.
3.2.1 Data collection
During field research, in total, 507 individual stakeholders in the marketchain of baobab and tamarind products were interviewed in Mali betweenJuly and October 2007, whereas in Benin we interviewed 221 informantsduring the period January – April 2010. Table 3.2 shows both thenumber of individual respondents and the number of respondents foreach market chain actor of baobab and tamarind products in Mali andBenin. Additionally, Figures 3.3 and 3.4 not only show the researchsites in both countries (as discussed above), but also the numberof respondents interviewed per chain actor of baobab and tamarindproducts in the different study sites. To increase the likelihood thatheterogeneity of viewpoints is properly captured in the interviews, da Silva& de Souza Filho (2007) suggested as a rule of thumb to consider atleast five informants per chain segment and keep adding to this numberif essential divergence becomes apparent.
By stakeholders the author means all actors that are involved in themarket chain of baobab and tamarind products, such as gatherers,traders, processors and consumers who harvest, buy, sell, process and/oruse baobab and/or tamarind products. Different baobab and tamarindproducts should be understood as fresh baobab leaves, dry baobab leaves,baobab leaf powder, baobab fruit pulp, tamarind leaves and/or tamarindfruit pods. Because there are several baobab and tamarind products, anindividual actor may be considered as a respondent for up to six differentbaobab and tamarind products. Consequently, depending on the numberof different baobab and tamarind products mentioned, one individual
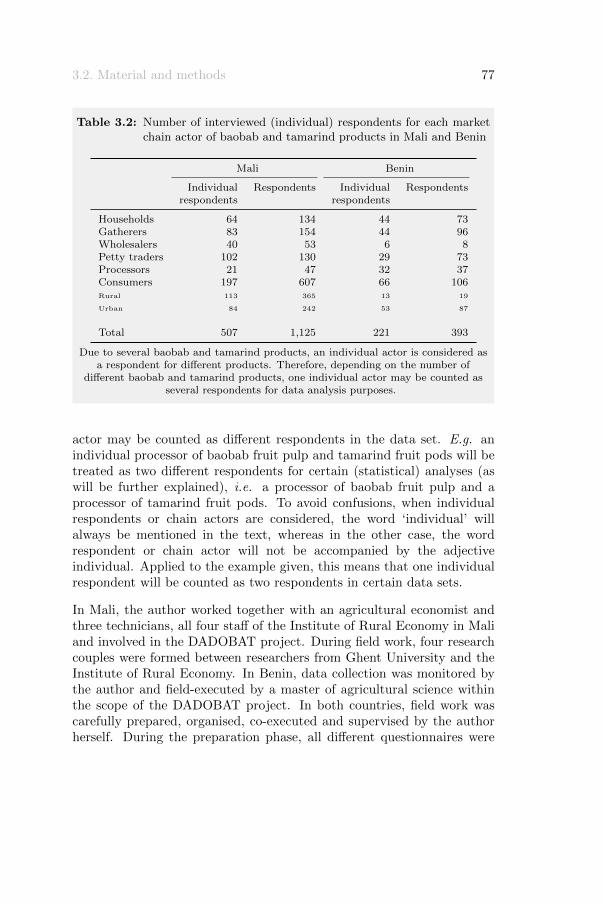
3.2. Material and methods 77
Table 3.2: Number of interviewed (individual) respondents for each marketchain actor of baobab and tamarind products in Mali and Benin
Mali Benin
Individual Respondents Individual Respondentsrespondents respondents
Households 64 134 44 73Gatherers 83 154 44 96Wholesalers 40 53 6 8Petty traders 102 130 29 73Processors 21 47 32 37Consumers 197 607 66 106Rural 113 365 13 19
Urban 84 242 53 87
Total 507 1,125 221 393
Due to several baobab and tamarind products, an individual actor is considered asa respondent for different products. Therefore, depending on the number of
different baobab and tamarind products, one individual actor may be counted asseveral respondents for data analysis purposes.
actor may be counted as different respondents in the data set. E.g. anindividual processor of baobab fruit pulp and tamarind fruit pods will betreated as two different respondents for certain (statistical) analyses (aswill be further explained), i.e. a processor of baobab fruit pulp and aprocessor of tamarind fruit pods. To avoid confusions, when individualrespondents or chain actors are considered, the word ‘individual’ willalways be mentioned in the text, whereas in the other case, the wordrespondent or chain actor will not be accompanied by the adjectiveindividual. Applied to the example given, this means that one individualrespondent will be counted as two respondents in certain data sets.
In Mali, the author worked together with an agricultural economist andthree technicians, all four staff of the Institute of Rural Economy in Maliand involved in the DADOBAT project. During field work, four researchcouples were formed between researchers from Ghent University and theInstitute of Rural Economy. In Benin, data collection was monitored bythe author and field-executed by a master of agricultural science withinthe scope of the DADOBAT project. In both countries, field work wascarefully prepared, organised, co-executed and supervised by the authorherself. During the preparation phase, all different questionnaires were
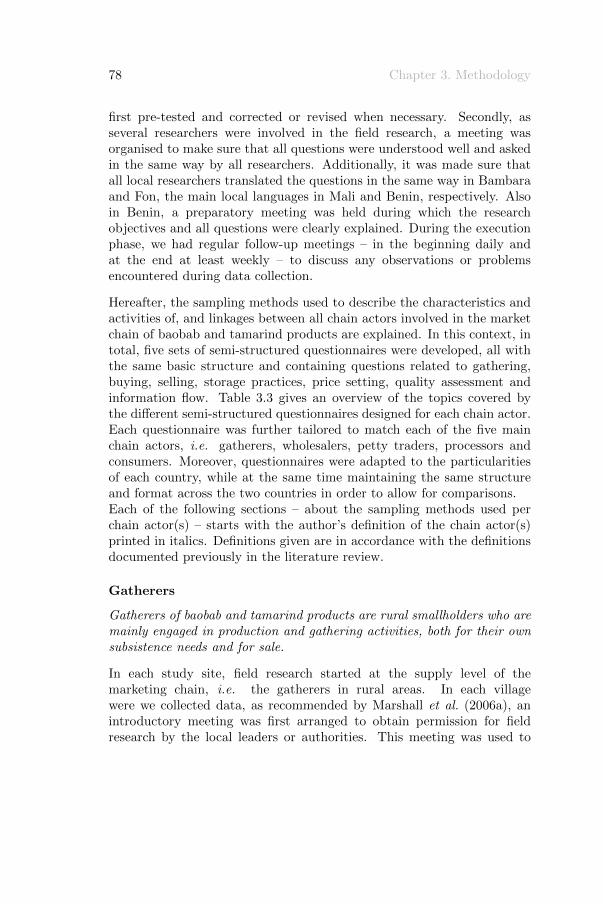
78 Chapter 3. Methodology
first pre-tested and corrected or revised when necessary. Secondly, asseveral researchers were involved in the field research, a meeting wasorganised to make sure that all questions were understood well and askedin the same way by all researchers. Additionally, it was made sure thatall local researchers translated the questions in the same way in Bambaraand Fon, the main local languages in Mali and Benin, respectively. Alsoin Benin, a preparatory meeting was held during which the researchobjectives and all questions were clearly explained. During the executionphase, we had regular follow-up meetings – in the beginning daily andat the end at least weekly – to discuss any observations or problemsencountered during data collection.
Hereafter, the sampling methods used to describe the characteristics andactivities of, and linkages between all chain actors involved in the marketchain of baobab and tamarind products are explained. In this context, intotal, five sets of semi-structured questionnaires were developed, all withthe same basic structure and containing questions related to gathering,buying, selling, storage practices, price setting, quality assessment andinformation flow. Table 3.3 gives an overview of the topics covered bythe different semi-structured questionnaires designed for each chain actor.Each questionnaire was further tailored to match each of the five mainchain actors, i.e. gatherers, wholesalers, petty traders, processors andconsumers. Moreover, questionnaires were adapted to the particularitiesof each country, while at the same time maintaining the same structureand format across the two countries in order to allow for comparisons.Each of the following sections – about the sampling methods used perchain actor(s) – starts with the author’s definition of the chain actor(s)printed in italics. Definitions given are in accordance with the definitionsdocumented previously in the literature review.
Gatherers
Gatherers of baobab and tamarind products are rural smallholders who aremainly engaged in production and gathering activities, both for their ownsubsistence needs and for sale.
In each study site, field research started at the supply level of themarketing chain, i.e. the gatherers in rural areas. In each villagewere we collected data, as recommended by Marshall et al. (2006a), anintroductory meeting was first arranged to obtain permission for fieldresearch by the local leaders or authorities. This meeting was used to
3.2. Material and methods 79
Table 3.3: Overview of topics covered by the different semi-structuredquestionnaires designed for each chain actor involved in themarket chain of baobab and tamarind products
Gath
erer
s
Wh
ole
sale
rs
Pet
tytr
ad
ers
Pro
cess
ors
Con
sum
ers
Socio-economic data x x x x xBusiness specifications – x – x –Quantities and prices x x x x xBuying and selling period x x x x xPrice determination x x x – –Origin / destination x x – x xWho buys from whom x x – x –Quality criteria x x x – xStorage practices x x x x xTransport – x – x –Processing practices x – – x –Uses – – – – xConsumption trends – – – – xInformation flow x x – x –Problems encountered x x x x x
x: covered by questionnaire; –: not covered by questionnaire
80 Chapter 3. Methodology
introduce the project to the local community and to get to know thevillage. In total, ten introductory meetings were held, three in Maliand seven in Benin. In particular, the villages Mandoli, Sorobougouand Kolna were chosen in Mali situated within a radius of 50 km tothe urban centres of Mopti, Segou and Kita, respectively (Figure 3.3).In Benin, introductory meetings were held in the villages of Koffaıssa,Banite, Kpabiegou, Banite, Tchanka, Sodo and Hounontin, and situatedrespectively within a radius of 50 km to the urban centre of Kandi,Malanville, Natitingou, Djougou, Dassa, Lokossa and Lokossa (Figure3.4).
Another purpose of the introductory meetings was to identify adequaterespondents, in this case gatherers of baobab and tamarind products. Asthe present research is about the market chain of baobab and tamarindproducts, a prerequisite for a gatherer to participate in this study wasto harvest the products of at least one of the two species. In addition,gatherers had – of course – to be willing to participate in the research. Thegatherers appointed during the introductory meetings as knowledgeablewould then lead the researchers further to other gatherers they consideredknowledgeable and so on. This method is known as snowball sampling(Barry, 2007).
Because individual gatherers are all part of a family or household, wealso incorporated the household as a unit of analysis in the presentstudy. A household is hereby defined as a group of persons livingtogether who make common provision for food or other essentials forliving (United Nations, 2007). Once a gatherer – and thus a household –was chosen, two semi-structured questionnaires were presented during theinterviews, one evaluating the household assets and different cash incomesources, the second dealing with aspects related to the gathering practicesof baobab and/or tamarind products. The purpose of the householdquestionnaire was to provide a more holistic and complete understandingof the household’s composition, activities and cash incomes. The topicscovered by the questionnaire about gathering practices of baobab andtamarind products are presented in Table 3.3.
The interviews with gatherers usually lasted for about one hour and tookplace at the respondents’ homes, which made it possible to observe dailylife and to ask questions about actions or situations observed.
3.2. Material and methods 81
Traders
Collectors and assemblers buy baobab and tamarind products fromgatherers at the farmgate and resell the products to other traders ona marketplace. Wholesalers sometimes buy produce from gatherers, buttend to rely on collectors and assemblers as their main source of supplies.Wholesalers often cater for the needs of larger urban markets and sell toother wholesalers, processors and retailers. Retailers are very diverse insize. The larger retailers buy either directly from gatherers or wholesalers,while the smaller retailers or petty traders often buy in small amounts fromthe larger retailers. Retailers have as main role the distribution of baobaband tamarind products to consumers.
Due to a lack of functional specialisation, it is difficult to categorisetraders or intermediaries by their function(s) in the market chain ofbaobab and tamarind products. Therefore, during field research, anarbitrary distinction was made between on the one hand ‘large’ traders,including collectors and assemblers, wholesalers and large retailers, andon the other hand ‘small’ traders, regrouping only small-scale retailers.The composition of the arbitrary category ‘large’ traders, hereafter calledwholesalers, is shown in Table 3.4. The other category of small-scaleretailers is hereafter referred as petty traders. If both wholesalers andpetty traders are considered, traders will be used as a grouping name.
Table 3.4: Composition of arbitrary category ‘large’ traders (%)
Mali Benin
Collector / Assembler 4 37Wholesaler 26 63Large retailer 70 0
At each urban and rural market in the study sites (Figures 3.3 and 3.4),wholesalers and petty traders of baobab and tamarind products wereinterviewed. Traders were selected by an informal random approach andonly included in the sample if they met the following criteria: handlingin baobab and/or tamarind products, regular presence in the market, inbusiness for at least one year, and willing to work with us.
The topics covered by the semi-structured questionnaires about trading
82 Chapter 3. Methodology
practices of baobab and tamarind products for wholesalers and pettytraders are presented in Table 3.3.
As one can derive from the table, the questionnaire for petty traderswas much shorter than the questionnaire for wholesalers. This is dueto several factors. The first reason has a practical nature. Most pettytraders have limited space on the often crowded marketplace. As aresult there is almost no space for the researcher(s) to sit or stand nextto the petty trader in order to perform the interview. Moreover, dueto narrow corridors between market stands and a lot of passage, theresearcher(s) risk(s) to stand in the way of passer-bys. The second reasonis that petty traders often do not have much time to answer questionsas there are almost constantly customers buying things. This meansthat the interview is interrupted each time a new customer arrives. Asa consequence, the petty trader loses his/her concentration and eitherforgets the question or will not answer to the question. The final reasonis that petty traders become impatient and unwilling to answer when aninterview takes too long. Therefore, the petty trade questionnaire wasrestricted to 15 minutes.
For the interviews with wholesalers, an appointment was made prior tothe interview in order to be sure about the availability of the respondentsduring the whole duration of the interview which was approximately onehour.
A special type of retailers, hereafter called caterers and encompassingbar, restaurant and/or hotel holders, has frequently been observed duringfield research in Mali and Benin. Caterers in particular offer locallyproduced juices to their clients, the consumers. In the present study,no interviews have been performed with caterers, which implies that allresults – and thus their implication in market chain – are solely based onobservations and informal conversations.
Processors
Processors are either small household enterprises or groupings ofprocessors. Their task is to process primary and/or secondary productsinto tertiary aiming to increase the value of a product or to make it moreconvenient for the end user.
A product is defined by Ferris et al. (2006) as a basic unit being traded
3.2. Material and methods 83
and the same authors make a distinction between primary, secondaryand tertiary products. Primary products are the basic units harvestedor gathered, secondary products are sub-products derived from primaryproducts, whereas tertiary products are a further differentiation orprocessing of secondary products. When a primary product is turnedinto a secondary, this is called primary processing, whereas secondaryprocessing transforms a secondary product into a tertiary product.
Figures 3.3 and 3.4 show the study areas where processors have beeninterviewed. Similar selection criteria as for traders were adoptedto withhold processors, namely processing of baobab and/or tamarindproducts, in business for at least one year, and willing to work with us.The topics covered by the semi-structured questionnaires about processingpractices of baobab and tamarind products are presented in Table 3.3. Inaccordance with the interviews with wholesalers, an appointment was alsomade prior to an interview with a processor in order to make sure thathe/she was available during the whole duration of the interview whichwas approximately one hour.
Consumers
Consumers are the end users of baobab and tamarind products.
The sites where consumers of baobab and tamarind products have beensampled are shown in Figures 3.3 and 3.4. Selection criteria for the choiceof consumers were their use of baobab and/or tamarind products andtheir willingness to participate in the study. In rural areas, consumersof baobab and tamarind products were selected by an informal randomapproach by going from door to door, whereas in urban areas, consumersof baobab and tamarind products were selected at random by accostingthem on the marketplace. The interviews with rural consumers usuallylasted for about one hour as they took place at the respondents’ homes,which made it possible to observe daily life and to ask questions aboutobserved actions or situations. An interview with a consumer in urbanareas lasted for about half an hour.
Topics covered by the semi-structured questionnaires for consumersare presented in Table 3.3. One of the questions included in theconsumer questionnaire is about the existence of substitution productsof respectively baobab and tamarind products. The reader should herebyknow that according to Will (2008), a product is called a substitute for
84 Chapter 3. Methodology
another product when it can be either used or consumed instead of theother without major differences in the degree of satisfaction obtained bythe user or consumer.
3.2.2 Data analysis
Quantitative data analysis
Household income The calculation of total household income iscomplex and consists according to Cavendish (2002) of four major sub-categories: (i) the value of cash income; (ii) the (net) value of gifts; (iii)the value of the use of own-produced/subsistence goods; and (iv) the valueof environmental resource uses. In short, this means that:
total income = cash income +value of all non-purchasedgoods and services
The importance of subsistence consumption, gifts and environmentalresource use becomes obvious when individual households may not be ableto produce more than they can use, resulting in no surplus production tobe sold in the marketplace. When surpluses occur, these are often barteredrather than sold (Boxall & Beckley, 2002). In the present study, only arough estimate was made of the household’s income whereby only cashincome was taken into account.
According to Cavendish (2002) cash income can be derived fromdifferent household activities such as crop and livestock production, off-farm activities (e.g. casual wages, formal employment and small-scaleindustries) and activities based on selling of agroforestry tree products(AFTPs) (e.g. foods and medicines). In this study, cash income wascalculated as the sum of revenues from crop production, off-farm andATFP gathering. It should be noted however that revenue from livestockproduction was not taken into account due to missing data.
Calculating total cash income involves summing up the cost of all inputsused in an income-generating activity and deducting these from the valueof cash income gained in that activity. In order to be more specific, KIT& IIRR (2008) made a distinction between
gross income = revenues - variable costs
and
3.2. Material and methods 85
net income = revenues - variable costs - fixed costs,
whereby revenue is defined as the selling price of the produce (KIT &IIRR, 2008) and calculated as price times quantity. In this study, anattempt was made to calculate gross income. However, several authors(Cavendish, 2002; KIT & IIRR, 2008) report some problems which arecommon when calculating costs and revenues. In this respect, it shouldbe mentioned that costs of agricultural products and services vary widelyfrom place to place, from season to season, from day to day, and evenwithin a single day. Moreover, due to the multi-field and/or multi-cropnature of most crop production activities and the sometimes low levelsof commercialisation, local respondents are not always able to assign(correct) input values to individual crops. In the present study, it shouldbe noted that low variable costs were recorded as informants reportedonly limited use of inputs, such as artificial fertilisers and pesticides. Asa consequence, gross income is mainly determined by revenues.
In the present study a ‘snapshot’ was made to gather information tocalculate the gross income. This implies that, on the one hand, datawere collected during a single field research (thus without repetitions intime) and, on the other hand, that mean quantities and prices were usedin the calculations. In addition, it should be noted that, although mosthouseholds used their own (unpaid) labour in household production (e.g.harvesting), the input ‘labour’ was not taken into account in this studydue to limited data.
According to Cavendish (2002), inter-household adjustments need to bemade by using an equivalence scale, which converts households of differentsizes and compositions to a common scale, in order to be able to calculateaverage annual cash income per household member. A simple method,described by Cavendish (2002), was used to adjust for age/gender ofhousehold members, economies of scale based on total household size,and length of residence or different household members. Based on thesethree coefficients, average annual cash income per household member wascalculated in the present study as household income per adjusted adultequivalent unit (aeu).
Calculations As observed during field research, gatherers harvest fresh(i.e. primary) products, but mostly sell secondary products to traders,processors and/or directly to consumers. This means that, in general,gatherers are responsible for primary processing which is often coupled
86 Chapter 3. Methodology
with weight losses. Weight loss from fresh baobab leaves to dry baobableaves was found to be 73.70 %, and increased even to 84.20 % for baobableaf powder. Comparable losses of 83.00 % from baobab fresh biomassto dry leaves were reported by Dhillion & Gustad (2004). Based onAssogbadjo (2006), weight loss from whole baobab fruits to baobab fruitpulp was calculated as 82.20 %. These conversion factors were used toconvert the quantity of a primary product into the corresponding quantityof a secondary product. By doing so, the quantity harvested can becompared to the quantity sold because it are both quantities of a sameproduct. E.g. when a gatherer harvests 100 kg fresh baobab leaves andsells it as baobab leaf powder, the quantity of fresh leaves is convertedinto the corresponding quantity of leaf powder, i.e. 15.80 kg. According toBurkill (1985), tamarind fruit pods contain about 55 % pulp, 35 % seeds,and 10 % shell (pod) and fibres. As gatherers only remove shells andfibres, total weight loss only amounts to 10 %. For tamarind leaves, noconversion factor was needed as all gatherers reported quantities in drymatter.
Field observation learned that only a few traders, particularly wholesalers,have proper weighing equipment, and that most trade of baobab andtamarind products takes place by volume in Mali and Benin. This hasalso been observed by Fafchamps & Gabre-Madhin (2001) and Shackletonet al. (2002). Therefore, local units – mostly units of volume – were asmuch as possible expressed in kilogramme after weighing or measuringthe dimensions.
Based on buying and selling prices, the added value or spread can becalculated. KIT & IIRR (2008) define added value for a particular actoras the price received by the actor minus the price paid by the actor. Thus,
added value = selling price - buying price.
In the results, on the one hand, percentages, quantities and prices in Euroare rounded off to the nearest whole number. However, an exception ismade when numbers are very small, e.g. 0.08 % is maintained as 0.08 %instead of becoming 0 %. On the other hand, prices expressed in FCFAare rounded off to the nearest whole number, which is divisible by five.The reason for the latter calculation is that the smallest currency unit inFCFA is 5 FCFA.
3.2. Material and methods 87
Statistical data analysis After editing and codifying, data werestatistically analysed using the Statistical Package for Social sciences(SPSS 15.0) following the principles and procedures described in Janssenset al. (2008). For all analyses, a 95 % level of confidence (p< 0.05)was used as threshold for significance. Frequency and multiple responsetables were used as means for the descriptive statistics. As all datawere not normally distributed, non-parametric Wilcoxon-Mann-Whitneyand Kruskal-Wallis tests were used to compare, respectively, two ork independent samples (comparison of means). The Wilcoxon-Mann-Whitney test may be used with ordinal, interval and ratio variables todecide whether two independent groups have been drawn from the samepopulation. This is one of the most powerful non-parametric tests andis therefore a very useful alternative to the parametric t-test (Siegel &Castellan, 1988). Kruskal-Wallis one-way analysis of variance by ranksrequires at least ordinal measurement of the studied variables and is anextremely useful test for deciding whether k independent samples comefrom different populations (Siegel & Castellan, 1988).
Data envelopment analysis The objective of using data envelopmentanalysis (DEA) is to determine the relative efficiency for each processor. Inthis context, the term efficiency is used to describe the level of performancethat can be reached by an economic unit in accordance with its productionpossibilities (Guzman et al., 2009).
The performance of a firm can be evaluated based on different efficiencymeasures, namely technical, allocative and economic efficiency (Dhunganaet al., 2004; Chavas et al., 2005; Speelman et al., 2008; Guzman et al.,2009). This study is, however, limited to the calculation of pure technicalefficiencies. Technical efficiency relates to the degree to which a firm usesthe minimum feasible amount of inputs to produce a given level of output,or produces the maximum feasible output from a given set of inputs.These two definitions of technical efficiency lead to what are knownas input-oriented and output-oriented efficiency measures, respectively(Coelli et al., 2002; Dhungana et al., 2004; Dimara et al., 2005). In thisstudy an input-oriented efficiency measure was used.
Over time, two major approaches to measure efficiency have evolved:parametric and non-parametric approaches. The non-parametricapproach constructs a linear piecewise function from empiricalobservations on inputs and outputs without assuming any a priori
88 Chapter 3. Methodology
functional relationship between them (Dhungana et al., 2004). In thepresent study, the data envelopment analysis or DEA methodology, whichis the most popular non-parametric technique (Speelman et al., 2008), isused to measure technical efficiency. The DEA technique, developed byCharnes et al. (1978) and Banker et al. (1984), is based on the notionthat a production unit employing less input than another to producethe same amount of output can be considered more efficient. DEA isa linear programming technique which calculates the relative efficiency offirms with the presence of multiple inputs and multiple outputs (Coelliet al., 2005; Guzman et al., 2009). Simultaneously an efficient frontier,determined by the most efficient decision-making units according to theproductive technology applied, is constructed and efficiency measures areobtained (Speelman et al., 2008; Guzman et al., 2009). The aim of a DEAis not to define the best level of efficiency but to identify which decision-making units are efficient and, therefore, belong to the frontier, and whichare not (Guzman et al., 2009).
In the present study, the DEA model was made up of one output and seveninput variables. The output variable is annual revenue, i.e. the annualincome obtained by selling tertiary baobab and tamarind products. Theseven input variables – and how they are calculated – are listed below.
• Cost of raw material. This cost encompasses the annual costof purchasing primary and/or secondary baobab and tamarindproducts. It should be noted that other ingredients, such as sugaror flavourings, were not taken into account in this study.
• Cost of employees. As most processors work with employees whichare often paid a wage, the annual cost of all these wages is called thecost of employees. Hereby, it should be noted that family workersare not paid, and thus not include in this cost.
• Cost of packaging material. Processors were asked to estimateper processing cycle how much packaging material was used andat which price they bought it. Given also the total number ofprocessing cycles per year, the annual cost of packaging materialused by the respondents was calculated.
• Cost of utensils. All utensils, such as tubs, pots, ladles, sieves andfunnels, necessary during the processing of baobab and tamarindproducts were listed, together with their cost price and their lifespan. Based on this information, an estimation was made of theannual cost of utensils.
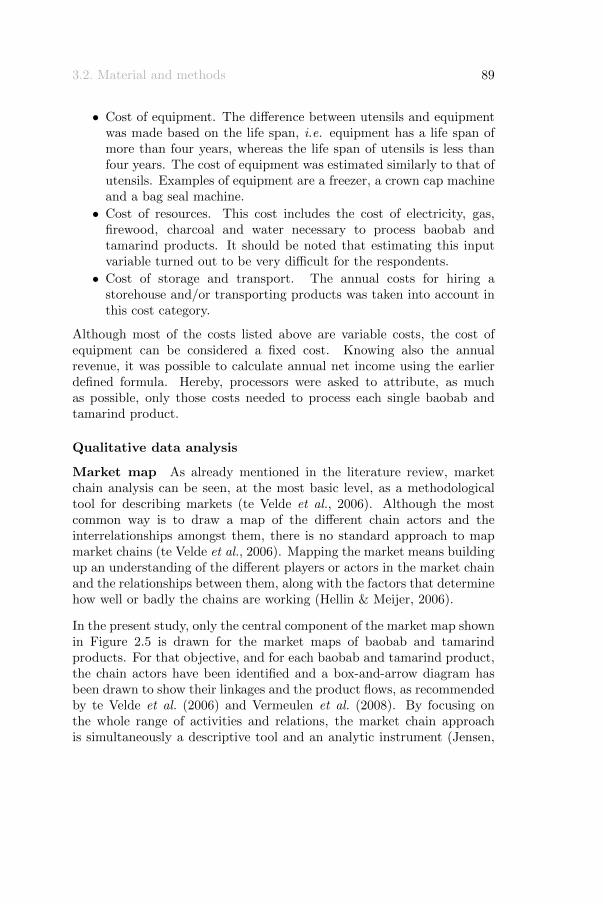
3.2. Material and methods 89
• Cost of equipment. The difference between utensils and equipmentwas made based on the life span, i.e. equipment has a life span ofmore than four years, whereas the life span of utensils is less thanfour years. The cost of equipment was estimated similarly to that ofutensils. Examples of equipment are a freezer, a crown cap machineand a bag seal machine.
• Cost of resources. This cost includes the cost of electricity, gas,firewood, charcoal and water necessary to process baobab andtamarind products. It should be noted that estimating this inputvariable turned out to be very difficult for the respondents.
• Cost of storage and transport. The annual costs for hiring astorehouse and/or transporting products was taken into account inthis cost category.
Although most of the costs listed above are variable costs, the cost ofequipment can be considered a fixed cost. Knowing also the annualrevenue, it was possible to calculate annual net income using the earlierdefined formula. Hereby, processors were asked to attribute, as muchas possible, only those costs needed to process each single baobab andtamarind product.
Qualitative data analysis
Market map As already mentioned in the literature review, marketchain analysis can be seen, at the most basic level, as a methodologicaltool for describing markets (te Velde et al., 2006). Although the mostcommon way is to draw a map of the different chain actors and theinterrelationships amongst them, there is no standard approach to mapmarket chains (te Velde et al., 2006). Mapping the market means buildingup an understanding of the different players or actors in the market chainand the relationships between them, along with the factors that determinehow well or badly the chains are working (Hellin & Meijer, 2006).
In the present study, only the central component of the market map shownin Figure 2.5 is drawn for the market maps of baobab and tamarindproducts. For that objective, and for each baobab and tamarind product,the chain actors have been identified and a box-and-arrow diagram hasbeen drawn to show their linkages and the product flows, as recommendedby te Velde et al. (2006) and Vermeulen et al. (2008). By focusing onthe whole range of activities and relations, the market chain approachis simultaneously a descriptive tool and an analytic instrument (Jensen,
90 Chapter 3. Methodology
2009). As a result, mapping the market includes not only mappingcore processes and main actors involved in these processes, together withtheir relationships and linkages, and flows of products; but also mappingquantities and prices of products, geographical flow of products, valueat different levels of the chain, flows of information and knowledge, andbusiness services that feed into the chain (van den Berg et al., 2007).
SWOT analysis The SWOT acronym stands for strengths, weaknesses,opportunities and threats. This study uses a SWOT approach toidentify the major factors affecting the performance of the market chainas suggested by da Silva & de Souza Filho (2007). From this pointof view, the role of SWOT analysis is to take information from themarket chain analysis and separate it into current influences (strengthsand weaknesses) and potential future developments (opportunities andthreats). The SWOT analysis determines thus whether the informationindicates something that will assist a market chain in being successful in acertain environment, or if it indicates obstacles that must be overcome orminimized (da Silva & de Souza Filho, 2007). The intention is to providean information base to support policy recommendations in a scenario ofopportunities and threats (da Silva & de Souza Filho, 2007).
When the SWOT approach is linked the market map concept,opportunities and threats – which arise from factors external to thesubject of analysis – would be issues primarily associated with the enablingenvironment and service providers, whereas strengths and weaknesses –associated with elements internal to the object of analysis – would ofteninclude items related to the core market (da Silva & de Souza Filho, 2007).In the present study, the author used a SWOT logic to identify and listmajor strengths and weaknesses on domestic level, and opportunities andthreats on domestic, regional and international level, based on, on the onehand, results and observations presented in the present study and, on theother hand, findings reported in literature.

4Results

92 Chapter 4. Results
In this chapter, the results of the baobab and tamarind market chainanalysis in Benin and Mali are presented. First, functions and interestsof the different market chain actors are presented. Secondly, market mapsof different baobab and tamarind products are drawn to show the sequenceof chain actors involved in transferring the products from gatherer toconsumer. Finally, data on quantities, prices, added value, gatheringtechniques, buying and selling period, storage and processing practices,uses and consumption trends, trade centres, quality criteria, informationflows and problems are presented to analyse the market chains of baobaband tamarind products in Benin and Mali. Hereby it should be notedthat when Benin and Mali are used in the text the author means the studyareas in both countries, and, similarly, with chain actors the author alwaysrefers to surveyed informants.
4.1 Chain actors
The different actors participating in the baobab and tamarind marketchains in Benin and Mali are gatherers, traders, processors and consumers.In this section, these actors are described in relation to their activities,roles and interests.
4.1.1 Gatherers
Individual gatherers are part of a family or household. Therefore, itis essential to start this section with an overview of the households’composition, activities and cash income, before turning to a descriptionand identification of gatherers as being the first actor in the market chain.
Household composition
In the present study, 64 and 44 rural households have been interviewedrespectively in Mali and Benin. The age and gender composition of thesampled household population is given in Figure 4.1 and corresponds wellwith the national age structure for both countries (Table 3.1). In Mali,an average rural household consists of 25.07± 18.42 persons, of which62 % are active in household and/or subsistence tasks (8.13 men and 7.38women). In Benin, an average rural household is significantly smaller(Mann-Whitney test, p< 0.01) than in Mali, and consists of 14.88± 9.84persons, of which 71 % are active in household and/or subsistence tasks(5.67 men and 4.96 women).
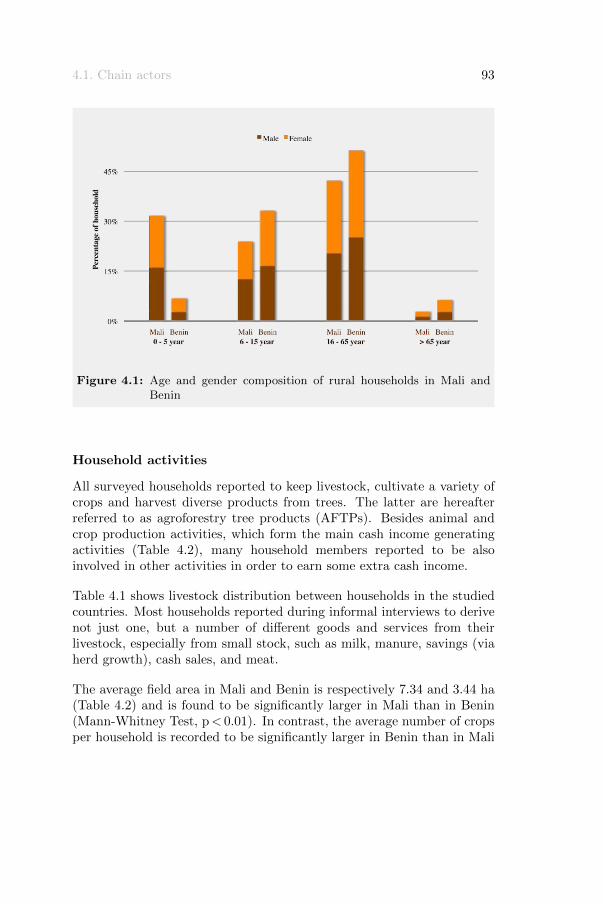
4.1. Chain actors 93
Figure 4.1: Age and gender composition of rural households in Mali andBenin
Household activities
All surveyed households reported to keep livestock, cultivate a variety ofcrops and harvest diverse products from trees. The latter are hereafterreferred to as agroforestry tree products (AFTPs). Besides animal andcrop production activities, which form the main cash income generatingactivities (Table 4.2), many household members reported to be alsoinvolved in other activities in order to earn some extra cash income.
Table 4.1 shows livestock distribution between households in the studiedcountries. Most households reported during informal interviews to derivenot just one, but a number of different goods and services from theirlivestock, especially from small stock, such as milk, manure, savings (viaherd growth), cash sales, and meat.
The average field area in Mali and Benin is respectively 7.34 and 3.44 ha(Table 4.2) and is found to be significantly larger in Mali than in Benin(Mann-Whitney Test, p< 0.01). In contrast, the average number of cropsper household is recorded to be significantly larger in Benin than in Mali
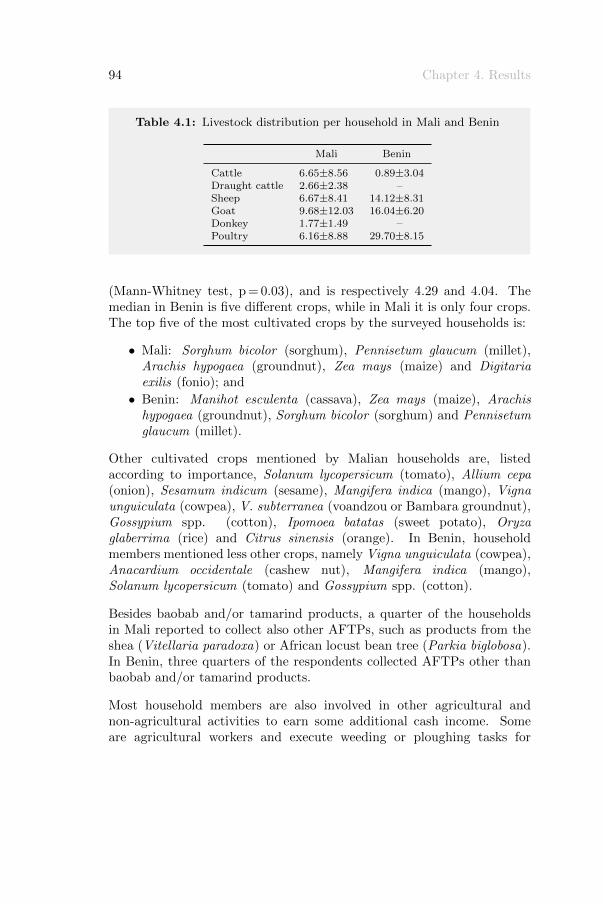
94 Chapter 4. Results
Table 4.1: Livestock distribution per household in Mali and Benin
Mali Benin
Cattle 6.65±8.56 0.89±3.04Draught cattle 2.66±2.38 –Sheep 6.67±8.41 14.12±8.31Goat 9.68±12.03 16.04±6.20Donkey 1.77±1.49 –Poultry 6.16±8.88 29.70±8.15
(Mann-Whitney test, p = 0.03), and is respectively 4.29 and 4.04. Themedian in Benin is five different crops, while in Mali it is only four crops.The top five of the most cultivated crops by the surveyed households is:
• Mali: Sorghum bicolor (sorghum), Pennisetum glaucum (millet),Arachis hypogaea (groundnut), Zea mays (maize) and Digitariaexilis (fonio); and
• Benin: Manihot esculenta (cassava), Zea mays (maize), Arachishypogaea (groundnut), Sorghum bicolor (sorghum) and Pennisetumglaucum (millet).
Other cultivated crops mentioned by Malian households are, listedaccording to importance, Solanum lycopersicum (tomato), Allium cepa(onion), Sesamum indicum (sesame), Mangifera indica (mango), Vignaunguiculata (cowpea), V. subterranea (voandzou or Bambara groundnut),Gossypium spp. (cotton), Ipomoea batatas (sweet potato), Oryzaglaberrima (rice) and Citrus sinensis (orange). In Benin, householdmembers mentioned less other crops, namely Vigna unguiculata (cowpea),Anacardium occidentale (cashew nut), Mangifera indica (mango),Solanum lycopersicum (tomato) and Gossypium spp. (cotton).
Besides baobab and/or tamarind products, a quarter of the householdsin Mali reported to collect also other AFTPs, such as products from theshea (Vitellaria paradoxa) or African locust bean tree (Parkia biglobosa).In Benin, three quarters of the respondents collected AFTPs other thanbaobab and/or tamarind products.
Most household members are also involved in other agricultural andnon-agricultural activities to earn some additional cash income. Someare agricultural workers and execute weeding or ploughing tasks for
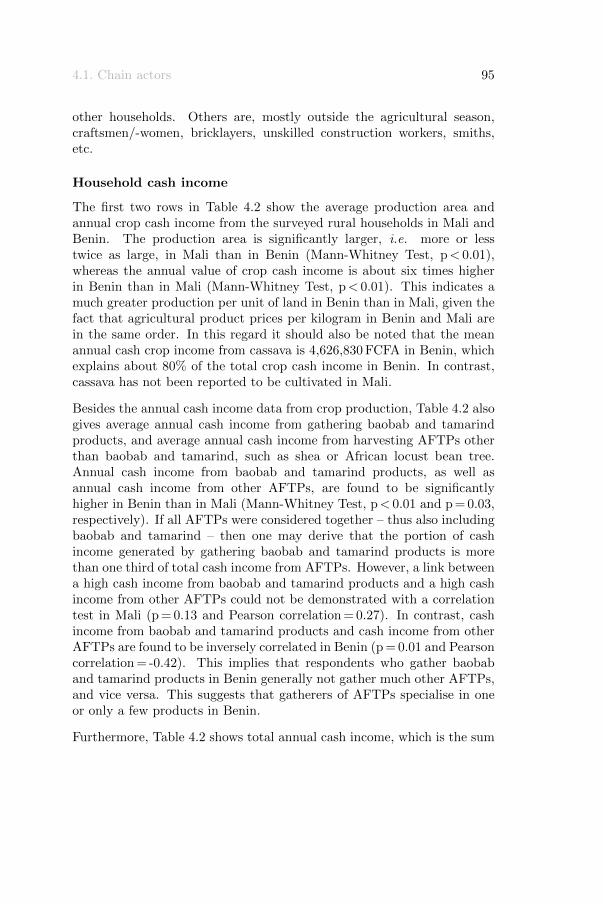
4.1. Chain actors 95
other households. Others are, mostly outside the agricultural season,craftsmen/-women, bricklayers, unskilled construction workers, smiths,etc.
Household cash income
The first two rows in Table 4.2 show the average production area andannual crop cash income from the surveyed rural households in Mali andBenin. The production area is significantly larger, i.e. more or lesstwice as large, in Mali than in Benin (Mann-Whitney Test, p< 0.01),whereas the annual value of crop cash income is about six times higherin Benin than in Mali (Mann-Whitney Test, p< 0.01). This indicates amuch greater production per unit of land in Benin than in Mali, given thefact that agricultural product prices per kilogram in Benin and Mali arein the same order. In this regard it should also be noted that the meanannual cash crop income from cassava is 4,626,830 FCFA in Benin, whichexplains about 80% of the total crop cash income in Benin. In contrast,cassava has not been reported to be cultivated in Mali.
Besides the annual cash income data from crop production, Table 4.2 alsogives average annual cash income from gathering baobab and tamarindproducts, and average annual cash income from harvesting AFTPs otherthan baobab and tamarind, such as shea or African locust bean tree.Annual cash income from baobab and tamarind products, as well asannual cash income from other AFTPs, are found to be significantlyhigher in Benin than in Mali (Mann-Whitney Test, p< 0.01 and p = 0.03,respectively). If all AFTPs were considered together – thus also includingbaobab and tamarind – then one may derive that the portion of cashincome generated by gathering baobab and tamarind products is morethan one third of total cash income from AFTPs. However, a link betweena high cash income from baobab and tamarind products and a high cashincome from other AFTPs could not be demonstrated with a correlationtest in Mali (p = 0.13 and Pearson correlation = 0.27). In contrast, cashincome from baobab and tamarind products and cash income from otherAFTPs are found to be inversely correlated in Benin (p = 0.01 and Pearsoncorrelation = -0.42). This implies that respondents who gather baobaband tamarind products in Benin generally not gather much other AFTPs,and vice versa. This suggests that gatherers of AFTPs specialise in oneor only a few products in Benin.
Furthermore, Table 4.2 shows total annual cash income, which is the sum

96 Chapter 4. Results
Table 4.2: Mean annual cash income-related data for rural householdsinvolved in gathering baobab and tamarind food products in Maliand Benin
Mali Benin p-value
Production area ha 6.92a 3.86b < 0.01median 5.75 3.00
std. dev. 6.03 2.63
Crop income FCFA/y 998,910a 5,656,020b < 0.01median 515,060 5,931,250
std. dev. 1,174,100 3,812,650
e/y 1,523 8,623
AFTPs income (excl. FCFA/y 38,450a 52,400b 0.03baobab and tamarind) median 30,000 50,000
std. dev. 27,250 19,640
e/y 59 80
Baobab and tamarind FCFA/y 21,030a 43,780b < 0.01income median 3,350 33,775
std. dev. 70,375 34,035
e/y 32 67
Total income FCFA/y 1,108,865a 5,742,375b < 0.01median 655,685 6,073,750
std. dev. 1,232,585 3,821,185
e/y 1,690 8,754
Income per household FCFA/y 94,090a 746,330b < 0.01member (aeu) median 66,470 560,910
std. dev. 84,530 619,395
e/y 143 1,138
Portion of income of % 2.77a 3.32a 0.12baobab and tamarind median 0.41 0.51
std. dev. 5.62 6.97
Baobab leaves 0.30a 0.20a 0.18
Baobab fruit 0.08a 4.36b 0.04
Tamarind fruit 5.25a 0.05b < 0.01
Means with a different superscript are significantly different based onMann-Whitney Test (p-value< 0.05); std. dev. stands for standard deviation
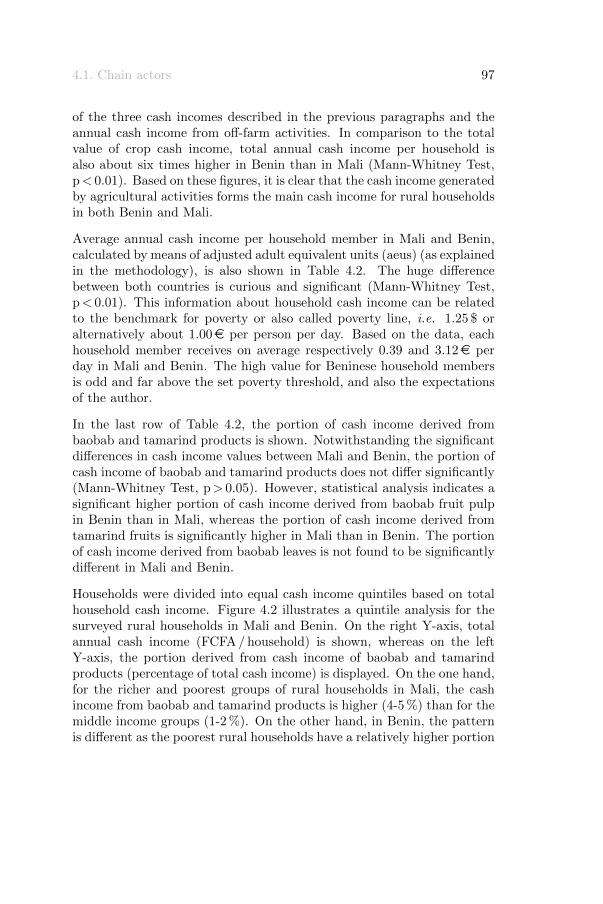
4.1. Chain actors 97
of the three cash incomes described in the previous paragraphs and theannual cash income from off-farm activities. In comparison to the totalvalue of crop cash income, total annual cash income per household isalso about six times higher in Benin than in Mali (Mann-Whitney Test,p< 0.01). Based on these figures, it is clear that the cash income generatedby agricultural activities forms the main cash income for rural householdsin both Benin and Mali.
Average annual cash income per household member in Mali and Benin,calculated by means of adjusted adult equivalent units (aeus) (as explainedin the methodology), is also shown in Table 4.2. The huge differencebetween both countries is curious and significant (Mann-Whitney Test,p< 0.01). This information about household cash income can be relatedto the benchmark for poverty or also called poverty line, i.e. 1.25 $ oralternatively about 1.00e per person per day. Based on the data, eachhousehold member receives on average respectively 0.39 and 3.12e perday in Mali and Benin. The high value for Beninese household membersis odd and far above the set poverty threshold, and also the expectationsof the author.
In the last row of Table 4.2, the portion of cash income derived frombaobab and tamarind products is shown. Notwithstanding the significantdifferences in cash income values between Mali and Benin, the portion ofcash income of baobab and tamarind products does not differ significantly(Mann-Whitney Test, p> 0.05). However, statistical analysis indicates asignificant higher portion of cash income derived from baobab fruit pulpin Benin than in Mali, whereas the portion of cash income derived fromtamarind fruits is significantly higher in Mali than in Benin. The portionof cash income derived from baobab leaves is not found to be significantlydifferent in Mali and Benin.
Households were divided into equal cash income quintiles based on totalhousehold cash income. Figure 4.2 illustrates a quintile analysis for thesurveyed rural households in Mali and Benin. On the right Y-axis, totalannual cash income (FCFA / household) is shown, whereas on the leftY-axis, the portion derived from cash income of baobab and tamarindproducts (percentage of total cash income) is displayed. On the one hand,for the richer and poorest groups of rural households in Mali, the cashincome from baobab and tamarind products is higher (4-5 %) than for themiddle income groups (1-2 %). On the other hand, in Benin, the patternis different as the poorest rural households have a relatively higher portion
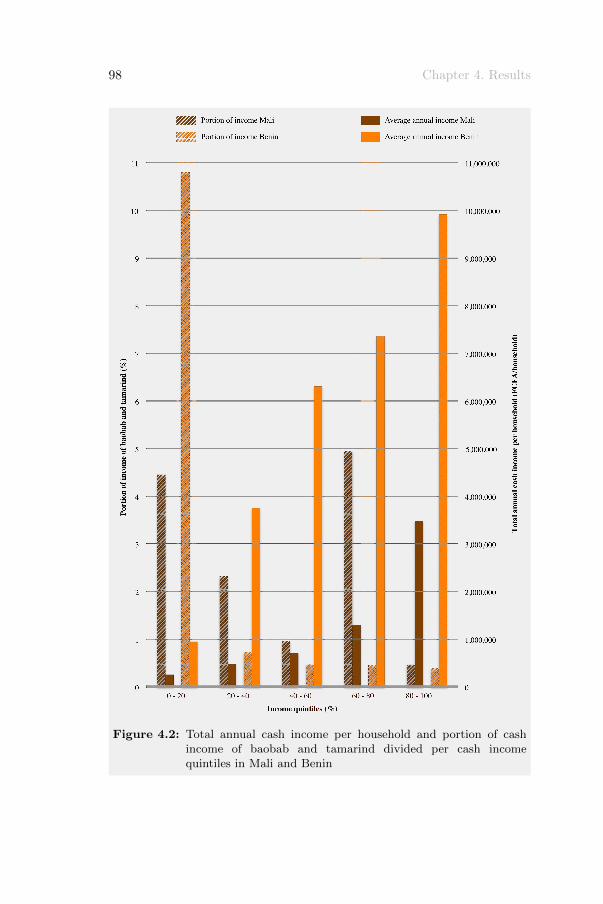
98 Chapter 4. Results
Figure 4.2: Total annual cash income per household and portion of cashincome of baobab and tamarind divided per cash incomequintiles in Mali and Benin
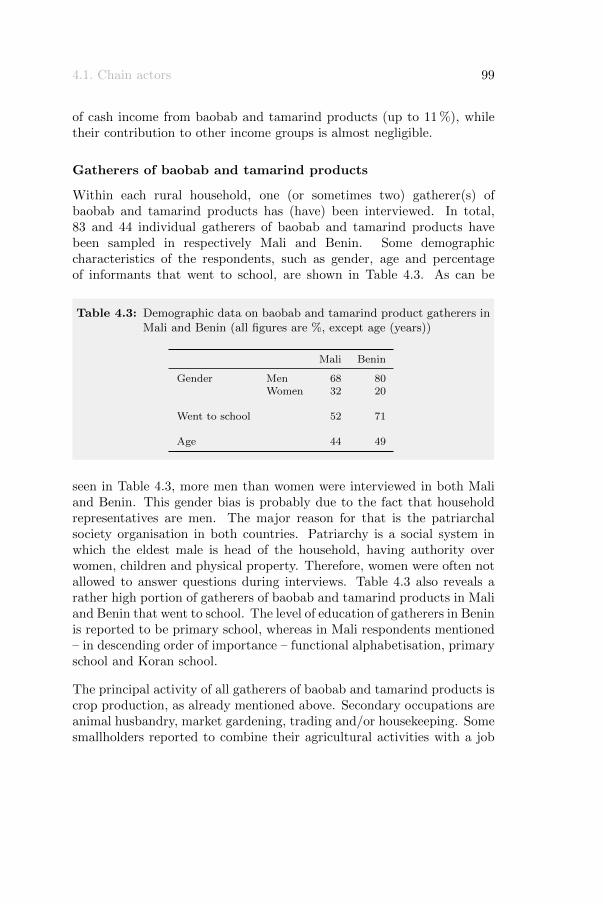
4.1. Chain actors 99
of cash income from baobab and tamarind products (up to 11 %), whiletheir contribution to other income groups is almost negligible.
Gatherers of baobab and tamarind products
Within each rural household, one (or sometimes two) gatherer(s) ofbaobab and tamarind products has (have) been interviewed. In total,83 and 44 individual gatherers of baobab and tamarind products havebeen sampled in respectively Mali and Benin. Some demographiccharacteristics of the respondents, such as gender, age and percentageof informants that went to school, are shown in Table 4.3. As can be
Table 4.3: Demographic data on baobab and tamarind product gatherers inMali and Benin (all figures are %, except age (years))
Mali Benin
Gender Men 68 80Women 32 20
Went to school 52 71
Age 44 49
seen in Table 4.3, more men than women were interviewed in both Maliand Benin. This gender bias is probably due to the fact that householdrepresentatives are men. The major reason for that is the patriarchalsociety organisation in both countries. Patriarchy is a social system inwhich the eldest male is head of the household, having authority overwomen, children and physical property. Therefore, women were often notallowed to answer questions during interviews. Table 4.3 also reveals arather high portion of gatherers of baobab and tamarind products in Maliand Benin that went to school. The level of education of gatherers in Beninis reported to be primary school, whereas in Mali respondents mentioned– in descending order of importance – functional alphabetisation, primaryschool and Koran school.
The principal activity of all gatherers of baobab and tamarind products iscrop production, as already mentioned above. Secondary occupations areanimal husbandry, market gardening, trading and/or housekeeping. Somesmallholders reported to combine their agricultural activities with a job
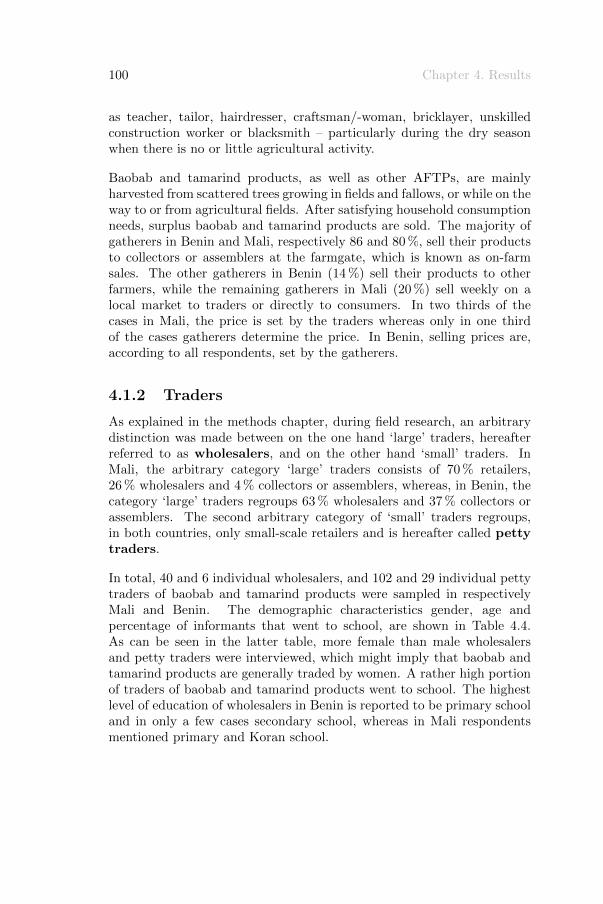
100 Chapter 4. Results
as teacher, tailor, hairdresser, craftsman/-woman, bricklayer, unskilledconstruction worker or blacksmith – particularly during the dry seasonwhen there is no or little agricultural activity.
Baobab and tamarind products, as well as other AFTPs, are mainlyharvested from scattered trees growing in fields and fallows, or while on theway to or from agricultural fields. After satisfying household consumptionneeds, surplus baobab and tamarind products are sold. The majority ofgatherers in Benin and Mali, respectively 86 and 80 %, sell their productsto collectors or assemblers at the farmgate, which is known as on-farmsales. The other gatherers in Benin (14 %) sell their products to otherfarmers, while the remaining gatherers in Mali (20 %) sell weekly on alocal market to traders or directly to consumers. In two thirds of thecases in Mali, the price is set by the traders whereas only in one thirdof the cases gatherers determine the price. In Benin, selling prices are,according to all respondents, set by the gatherers.
4.1.2 Traders
As explained in the methods chapter, during field research, an arbitrarydistinction was made between on the one hand ‘large’ traders, hereafterreferred to as wholesalers, and on the other hand ‘small’ traders. InMali, the arbitrary category ‘large’ traders consists of 70 % retailers,26 % wholesalers and 4 % collectors or assemblers, whereas, in Benin, thecategory ‘large’ traders regroups 63 % wholesalers and 37 % collectors orassemblers. The second arbitrary category of ‘small’ traders regroups,in both countries, only small-scale retailers and is hereafter called pettytraders.
In total, 40 and 6 individual wholesalers, and 102 and 29 individual pettytraders of baobab and tamarind products were sampled in respectivelyMali and Benin. The demographic characteristics gender, age andpercentage of informants that went to school, are shown in Table 4.4.As can be seen in the latter table, more female than male wholesalersand petty traders were interviewed, which might imply that baobab andtamarind products are generally traded by women. A rather high portionof traders of baobab and tamarind products went to school. The highestlevel of education of wholesalers in Benin is reported to be primary schooland in only a few cases secondary school, whereas in Mali respondentsmentioned primary and Koran school.
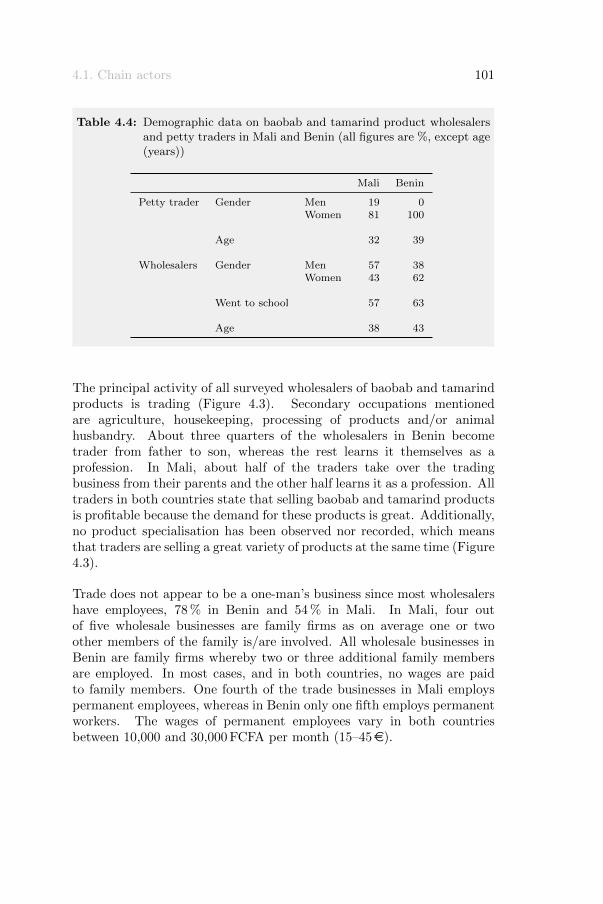
4.1. Chain actors 101
Table 4.4: Demographic data on baobab and tamarind product wholesalersand petty traders in Mali and Benin (all figures are %, except age(years))
Mali Benin
Petty trader Gender Men 19 0Women 81 100
Age 32 39
Wholesalers Gender Men 57 38Women 43 62
Went to school 57 63
Age 38 43
The principal activity of all surveyed wholesalers of baobab and tamarindproducts is trading (Figure 4.3). Secondary occupations mentionedare agriculture, housekeeping, processing of products and/or animalhusbandry. About three quarters of the wholesalers in Benin becometrader from father to son, whereas the rest learns it themselves as aprofession. In Mali, about half of the traders take over the tradingbusiness from their parents and the other half learns it as a profession. Alltraders in both countries state that selling baobab and tamarind productsis profitable because the demand for these products is great. Additionally,no product specialisation has been observed nor recorded, which meansthat traders are selling a great variety of products at the same time (Figure4.3).
Trade does not appear to be a one-man’s business since most wholesalershave employees, 78 % in Benin and 54 % in Mali. In Mali, four outof five wholesale businesses are family firms as on average one or twoother members of the family is/are involved. All wholesale businesses inBenin are family firms whereby two or three additional family membersare employed. In most cases, and in both countries, no wages are paidto family members. One fourth of the trade businesses in Mali employspermanent employees, whereas in Benin only one fifth employs permanentworkers. The wages of permanent employees vary in both countriesbetween 10,000 and 30,000 FCFA per month (15–45e).
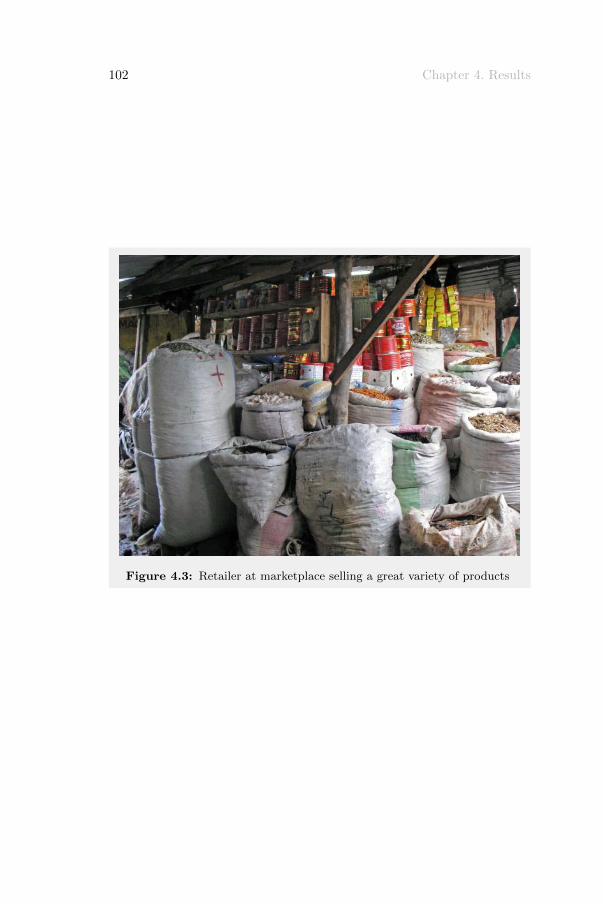
102 Chapter 4. Results
Figure 4.3: Retailer at marketplace selling a great variety of products
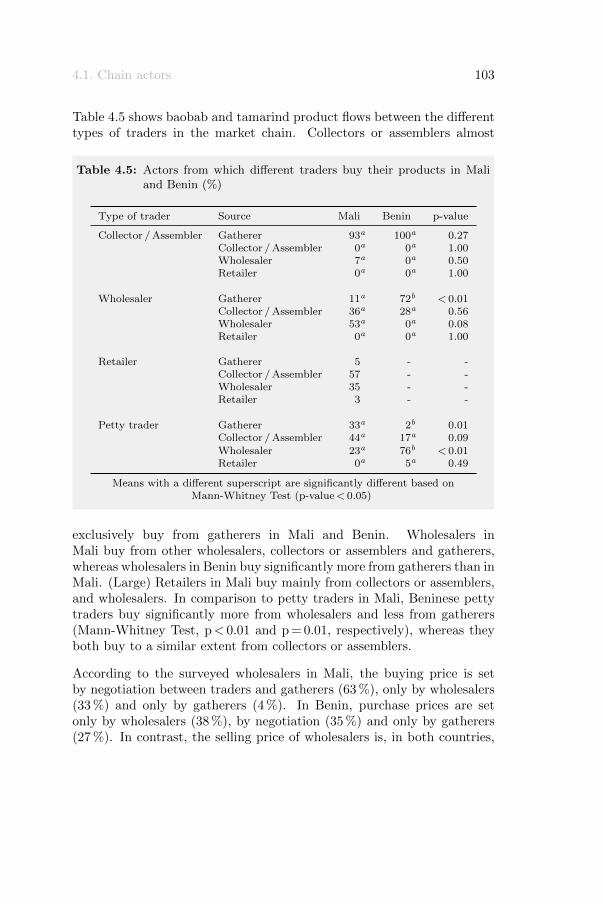
4.1. Chain actors 103
Table 4.5 shows baobab and tamarind product flows between the differenttypes of traders in the market chain. Collectors or assemblers almost
Table 4.5: Actors from which different traders buy their products in Maliand Benin (%)
Type of trader Source Mali Benin p-value
Collector / Assembler Gatherer 93a 100a 0.27Collector / Assembler 0a 0a 1.00Wholesaler 7a 0a 0.50Retailer 0a 0a 1.00
Wholesaler Gatherer 11a 72b < 0.01Collector / Assembler 36a 28a 0.56Wholesaler 53a 0a 0.08Retailer 0a 0a 1.00
Retailer Gatherer 5 - -Collector / Assembler 57 - -Wholesaler 35 - -Retailer 3 - -
Petty trader Gatherer 33a 2b 0.01Collector / Assembler 44a 17a 0.09Wholesaler 23a 76b < 0.01Retailer 0a 5a 0.49
Means with a different superscript are significantly different based onMann-Whitney Test (p-value< 0.05)
exclusively buy from gatherers in Mali and Benin. Wholesalers inMali buy from other wholesalers, collectors or assemblers and gatherers,whereas wholesalers in Benin buy significantly more from gatherers than inMali. (Large) Retailers in Mali buy mainly from collectors or assemblers,and wholesalers. In comparison to petty traders in Mali, Beninese pettytraders buy significantly more from wholesalers and less from gatherers(Mann-Whitney Test, p< 0.01 and p = 0.01, respectively), whereas theyboth buy to a similar extent from collectors or assemblers.
According to the surveyed wholesalers in Mali, the buying price is setby negotiation between traders and gatherers (63 %), only by wholesalers(33 %) and only by gatherers (4 %). In Benin, purchase prices are setonly by wholesalers (38 %), by negotiation (35 %) and only by gatherers(27 %). In contrast, the selling price of wholesalers is, in both countries,

104 Chapter 4. Results
reported to be determined by wholesalers in two thirds of cases, or bynegotiation with the buyers in one third of the cases. The major pricedetermining factors listed by Malian wholesalers are supply, demand andtransport. In addition to these three factors, profit and seasonality arealso mentioned by wholesalers in Benin as price determining factors. Ontop of these factors, petty traders in both countries listed quality, buyingprice, availability and price of substitution products as price determiningfactors.
4.1.3 Processors
In Mali and Benin, 21 and 32 individual processors of baobab andtamarind products were sampled, respectively. Processors categorisethemselves as local (72 % in Mali and 62 % in Benin) or semi-industrialprocessors (28 % and 38 %, respectively). Processors reported to processa wide variety of products, which means that processors have no productspecialisation. Gender, age and percentage of surveyed processors thatwent to school are shown in Table 4.6. More female than male processors
Table 4.6: Demographic data on baobab and tamarind product processorsin Mali and Benin (all figures are %, except age (years))
Mali Benin
Gender Men 11 30Women 89 70
Went to school 43 78
Age 46 34
were recorded. Besides, a rather high portion of processors of baobaband tamarind products went to school, especially in Benin. The highestlevel of education in Benin is equally reported to be primary school andsecondary school, whereas in Mali respondents mentioned secondary andKoran school.
The principal activity of all surveyed processors of baobab and tamarindproducts is processing. Secondary occupations reported are trading,agriculture, teaching, housekeeping and/or hairdressing. In Mali andBenin, most respondents stated to have learned processing as a profession
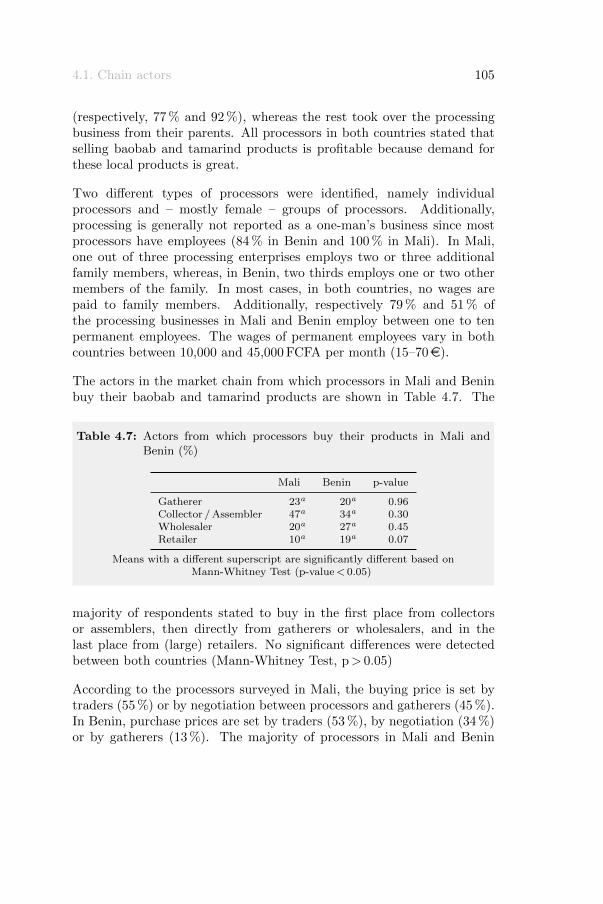
4.1. Chain actors 105
(respectively, 77 % and 92 %), whereas the rest took over the processingbusiness from their parents. All processors in both countries stated thatselling baobab and tamarind products is profitable because demand forthese local products is great.
Two different types of processors were identified, namely individualprocessors and – mostly female – groups of processors. Additionally,processing is generally not reported as a one-man’s business since mostprocessors have employees (84 % in Benin and 100 % in Mali). In Mali,one out of three processing enterprises employs two or three additionalfamily members, whereas, in Benin, two thirds employs one or two othermembers of the family. In most cases, in both countries, no wages arepaid to family members. Additionally, respectively 79 % and 51 % ofthe processing businesses in Mali and Benin employ between one to tenpermanent employees. The wages of permanent employees vary in bothcountries between 10,000 and 45,000 FCFA per month (15–70e).
The actors in the market chain from which processors in Mali and Beninbuy their baobab and tamarind products are shown in Table 4.7. The
Table 4.7: Actors from which processors buy their products in Mali andBenin (%)
Mali Benin p-value
Gatherer 23a 20a 0.96Collector / Assembler 47a 34a 0.30Wholesaler 20a 27a 0.45Retailer 10a 19a 0.07
Means with a different superscript are significantly different based onMann-Whitney Test (p-value< 0.05)
majority of respondents stated to buy in the first place from collectorsor assemblers, then directly from gatherers or wholesalers, and in thelast place from (large) retailers. No significant differences were detectedbetween both countries (Mann-Whitney Test, p> 0.05)
According to the processors surveyed in Mali, the buying price is set bytraders (55 %) or by negotiation between processors and gatherers (45 %).In Benin, purchase prices are set by traders (53 %), by negotiation (34 %)or by gatherers (13 %). The majority of processors in Mali and Benin
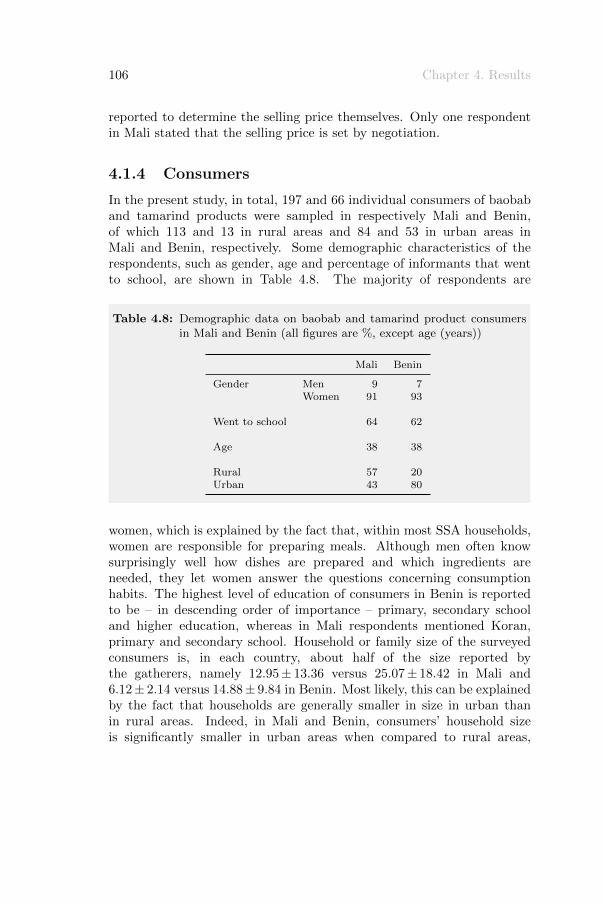
106 Chapter 4. Results
reported to determine the selling price themselves. Only one respondentin Mali stated that the selling price is set by negotiation.
4.1.4 Consumers
In the present study, in total, 197 and 66 individual consumers of baobaband tamarind products were sampled in respectively Mali and Benin,of which 113 and 13 in rural areas and 84 and 53 in urban areas inMali and Benin, respectively. Some demographic characteristics of therespondents, such as gender, age and percentage of informants that wentto school, are shown in Table 4.8. The majority of respondents are
Table 4.8: Demographic data on baobab and tamarind product consumersin Mali and Benin (all figures are %, except age (years))
Mali Benin
Gender Men 9 7Women 91 93
Went to school 64 62
Age 38 38
Rural 57 20Urban 43 80
women, which is explained by the fact that, within most SSA households,women are responsible for preparing meals. Although men often knowsurprisingly well how dishes are prepared and which ingredients areneeded, they let women answer the questions concerning consumptionhabits. The highest level of education of consumers in Benin is reportedto be – in descending order of importance – primary, secondary schooland higher education, whereas in Mali respondents mentioned Koran,primary and secondary school. Household or family size of the surveyedconsumers is, in each country, about half of the size reported bythe gatherers, namely 12.95± 13.36 versus 25.07± 18.42 in Mali and6.12± 2.14 versus 14.88± 9.84 in Benin. Most likely, this can be explainedby the fact that households are generally smaller in size in urban thanin rural areas. Indeed, in Mali and Benin, consumers’ household sizeis significantly smaller in urban areas when compared to rural areas,
4.2. Market chains 107
i.e. 5.67± 1.33 versus 15.20± 15.88 and 6.21± 2.27 versus 9.57± 7.00,respectively (Mann-Whitney Test, p< 0.01). The principal activities ofconsumers of baobab and tamarind products are trade, agriculture andhousekeeping. Other occupations recorded are teacher, student, tailor,taxi driver or worker. Malian consumers go to the marketplace mainlyon foot and to a lesser extent by cart, car/taxi or (motor)bike. In Benin,besides going on foot, the means of transport used by consumers to go tothe marketplace are (motor)bike and car/taxi.
4.2 Market chains
Based on the recorded trade relationships between the different chainactors, market maps of different baobab and tamarind products arepresented in this section in order to show the sequence of actors involvedin transferring a specific product from gatherer to consumer. It shouldbe noted that the arrows in the market maps represent the product flowin the chain and the more important the product flow is, the thicker thelines are drawn.
4.2.1 Baobab fruits
The market map for baobab fruit pulp in Mali and Benin differs quite a lotin chain actors involved, linkages between actors and product flow. Themarket map for baobab fruit pulp in Mali is shown in Figure 4.4, whereasthe map for baobab fruit pulp in Benin is presented in Figure 4.5. Itshould be noted that the market chain for baobab fruit pulp in Mali isexactly the same as the one observed for tamarind fruit pods in Mali.Gatherers of baobab fruit pulp in Mali have as main buyers wholesalersor collectors, or petty traders, but sell also in a few cases to retailers,processors or even directly to consumers. Wholesalers or collectors sellthe produce to processors, retailers or petty traders. Petty traders, alsosupplied by retailers, sell baobab fruit pulp to rural and urban consumers.In addition, retailers may also sell fruit pulp to consumers. Processorswho are supplied by wholesalers or collectors, but also by gatherers andsometimes even by retailers, may use baobab fruit pulp in the processingof millet cream or baobab juice, syrup, jam and instant juice powder.These products are then generally sold directly to consumers, however,sometimes retailers or caterers, such as bars, restaurants and hotels, actas middlemen.
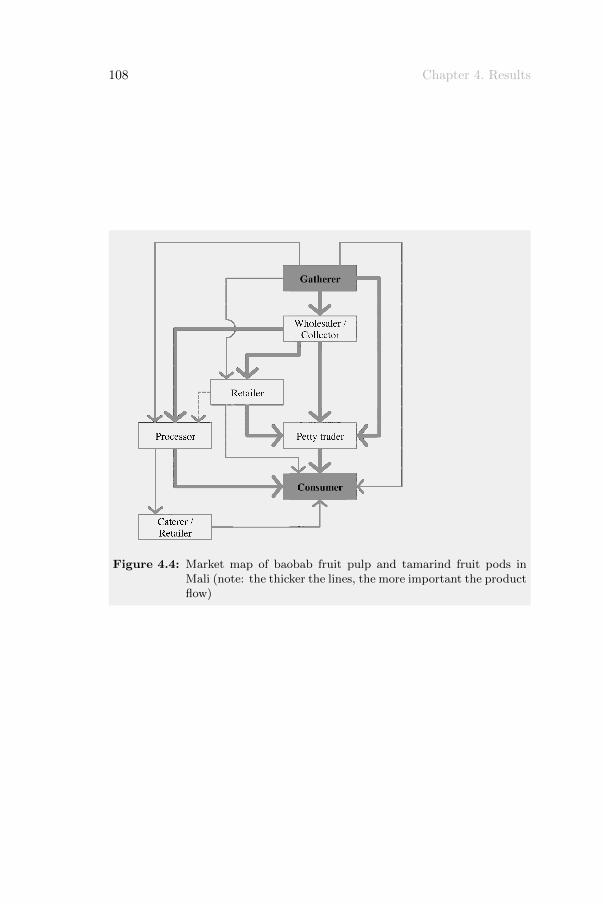
108 Chapter 4. Results
Figure 4.4: Market map of baobab fruit pulp and tamarind fruit pods inMali (note: the thicker the lines, the more important the productflow)
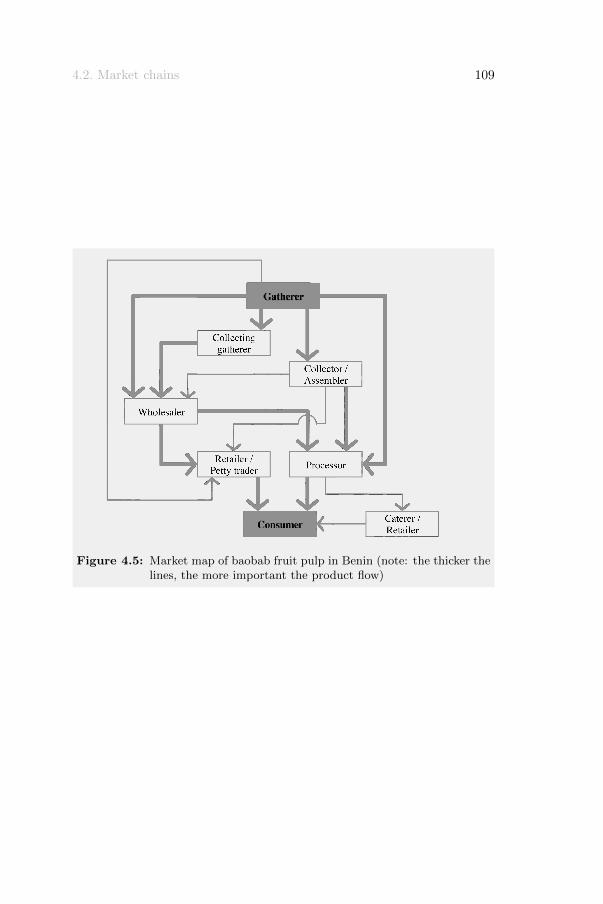
4.2. Market chains 109
Figure 4.5: Market map of baobab fruit pulp in Benin (note: the thicker thelines, the more important the product flow)
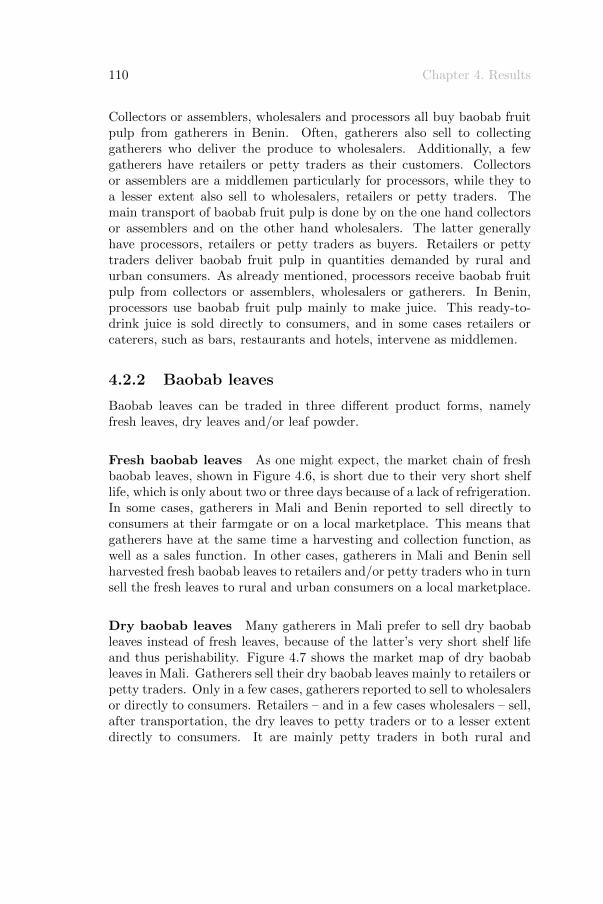
110 Chapter 4. Results
Collectors or assemblers, wholesalers and processors all buy baobab fruitpulp from gatherers in Benin. Often, gatherers also sell to collectinggatherers who deliver the produce to wholesalers. Additionally, a fewgatherers have retailers or petty traders as their customers. Collectorsor assemblers are a middlemen particularly for processors, while they toa lesser extent also sell to wholesalers, retailers or petty traders. Themain transport of baobab fruit pulp is done by on the one hand collectorsor assemblers and on the other hand wholesalers. The latter generallyhave processors, retailers or petty traders as buyers. Retailers or pettytraders deliver baobab fruit pulp in quantities demanded by rural andurban consumers. As already mentioned, processors receive baobab fruitpulp from collectors or assemblers, wholesalers or gatherers. In Benin,processors use baobab fruit pulp mainly to make juice. This ready-to-drink juice is sold directly to consumers, and in some cases retailers orcaterers, such as bars, restaurants and hotels, intervene as middlemen.
4.2.2 Baobab leaves
Baobab leaves can be traded in three different product forms, namelyfresh leaves, dry leaves and/or leaf powder.
Fresh baobab leaves As one might expect, the market chain of freshbaobab leaves, shown in Figure 4.6, is short due to their very short shelflife, which is only about two or three days because of a lack of refrigeration.In some cases, gatherers in Mali and Benin reported to sell directly toconsumers at their farmgate or on a local marketplace. This means thatgatherers have at the same time a harvesting and collection function, aswell as a sales function. In other cases, gatherers in Mali and Benin sellharvested fresh baobab leaves to retailers and/or petty traders who in turnsell the fresh leaves to rural and urban consumers on a local marketplace.
Dry baobab leaves Many gatherers in Mali prefer to sell dry baobableaves instead of fresh leaves, because of the latter’s very short shelf lifeand thus perishability. Figure 4.7 shows the market map of dry baobableaves in Mali. Gatherers sell their dry baobab leaves mainly to retailers orpetty traders. Only in a few cases, gatherers reported to sell to wholesalersor directly to consumers. Retailers – and in a few cases wholesalers – sell,after transportation, the dry leaves to petty traders or to a lesser extentdirectly to consumers. It are mainly petty traders in both rural and
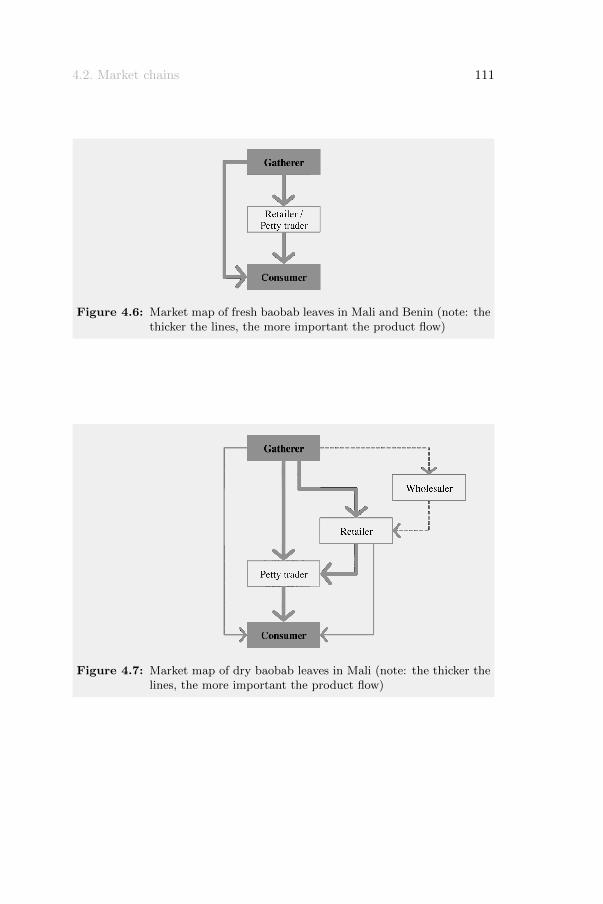
4.2. Market chains 111
Figure 4.6: Market map of fresh baobab leaves in Mali and Benin (note: thethicker the lines, the more important the product flow)
Figure 4.7: Market map of dry baobab leaves in Mali (note: the thicker thelines, the more important the product flow)

112 Chapter 4. Results
Figure 4.8: Market map of baobab leaf powder in Mali (note: the thickerthe lines, the more important the product flow)
urban areas who are responsible to deliver the produce to the end usersor consumers.
Baobab leaf powder The market map of baobab leaf powder is morecomplex in Mali than in Benin (Figure 4.8 and Figure 4.9, respectively).Gatherers in Mali have different outlets for baobab leaf powder. Generally,they sell their produce to collectors or assemblers, wholesalers or pettytraders. In a few cases, gatherers also reported to sell to retailers ordirectly to consumers. Collectors or assemblers may sell baobab leafpowder further to wholesalers, retailers or petty traders. Wholesalerson their turn, sell the produce to retailers. It was observed thatcollectors or assemblers and/or wholesalers are the traders responsible fortransportation of baobab leaf powder from rural areas to urban. Retailersmainly sell to petty traders, but sometimes they sell directly to consumers,which is also the main function of petty traders.In Benin, gatherers sell baobab leaf powder mainly to collecting gatherersor retailers, or to a lesser extent to petty traders. Collecting gathererssell large quantities leaf powder to retailers. The latter mostly sell theproduce – after transportation – to petty traders, whereas in a few cases
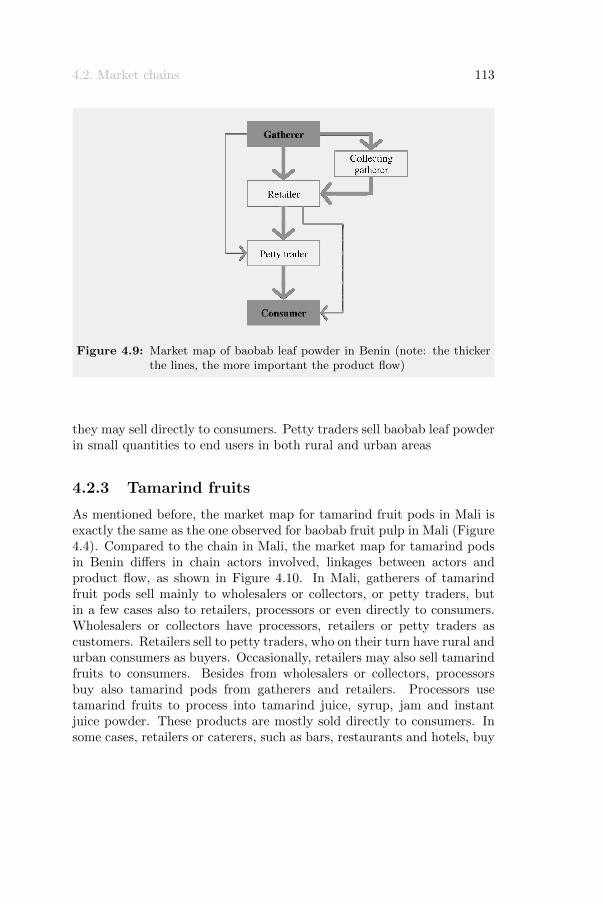
4.2. Market chains 113
Figure 4.9: Market map of baobab leaf powder in Benin (note: the thickerthe lines, the more important the product flow)
they may sell directly to consumers. Petty traders sell baobab leaf powderin small quantities to end users in both rural and urban areas
4.2.3 Tamarind fruits
As mentioned before, the market map for tamarind fruit pods in Mali isexactly the same as the one observed for baobab fruit pulp in Mali (Figure4.4). Compared to the chain in Mali, the market map for tamarind podsin Benin differs in chain actors involved, linkages between actors andproduct flow, as shown in Figure 4.10. In Mali, gatherers of tamarindfruit pods sell mainly to wholesalers or collectors, or petty traders, butin a few cases also to retailers, processors or even directly to consumers.Wholesalers or collectors have processors, retailers or petty traders ascustomers. Retailers sell to petty traders, who on their turn have rural andurban consumers as buyers. Occasionally, retailers may also sell tamarindfruits to consumers. Besides from wholesalers or collectors, processorsbuy also tamarind pods from gatherers and retailers. Processors usetamarind fruits to process into tamarind juice, syrup, jam and instantjuice powder. These products are mostly sold directly to consumers. Insome cases, retailers or caterers, such as bars, restaurants and hotels, buy
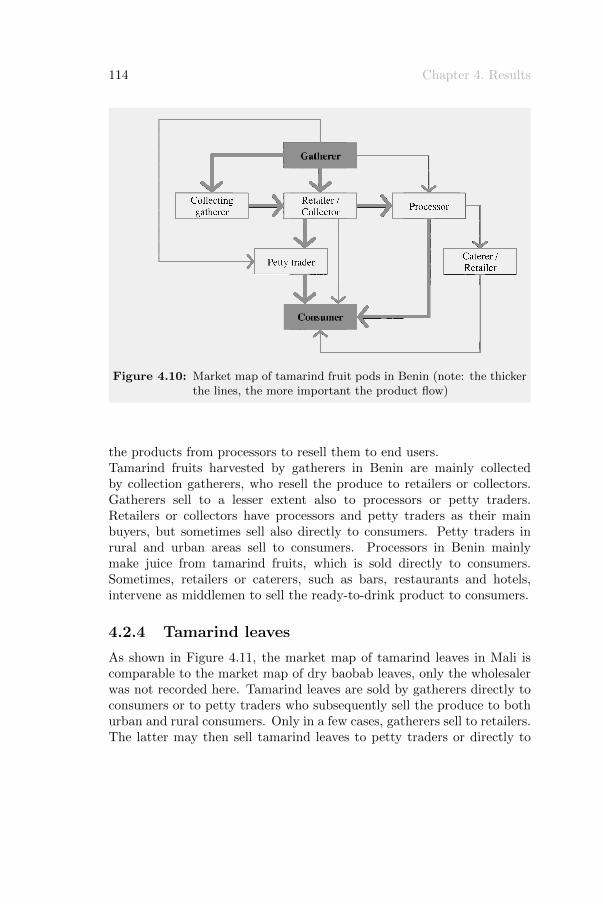
114 Chapter 4. Results
Figure 4.10: Market map of tamarind fruit pods in Benin (note: the thickerthe lines, the more important the product flow)
the products from processors to resell them to end users.Tamarind fruits harvested by gatherers in Benin are mainly collectedby collection gatherers, who resell the produce to retailers or collectors.Gatherers sell to a lesser extent also to processors or petty traders.Retailers or collectors have processors and petty traders as their mainbuyers, but sometimes sell also directly to consumers. Petty traders inrural and urban areas sell to consumers. Processors in Benin mainlymake juice from tamarind fruits, which is sold directly to consumers.Sometimes, retailers or caterers, such as bars, restaurants and hotels,intervene as middlemen to sell the ready-to-drink product to consumers.
4.2.4 Tamarind leaves
As shown in Figure 4.11, the market map of tamarind leaves in Mali iscomparable to the market map of dry baobab leaves, only the wholesalerwas not recorded here. Tamarind leaves are sold by gatherers directly toconsumers or to petty traders who subsequently sell the produce to bothurban and rural consumers. Only in a few cases, gatherers sell to retailers.The latter may then sell tamarind leaves to petty traders or directly to
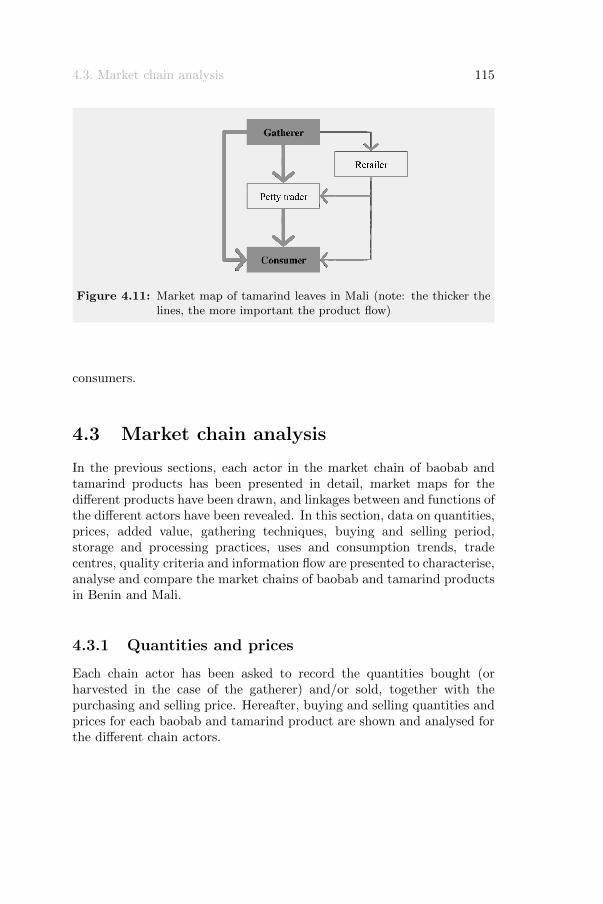
4.3. Market chain analysis 115
Figure 4.11: Market map of tamarind leaves in Mali (note: the thicker thelines, the more important the product flow)
consumers.
4.3 Market chain analysis
In the previous sections, each actor in the market chain of baobab andtamarind products has been presented in detail, market maps for thedifferent products have been drawn, and linkages between and functions ofthe different actors have been revealed. In this section, data on quantities,prices, added value, gathering techniques, buying and selling period,storage and processing practices, uses and consumption trends, tradecentres, quality criteria and information flow are presented to characterise,analyse and compare the market chains of baobab and tamarind productsin Benin and Mali.
4.3.1 Quantities and prices
Each chain actor has been asked to record the quantities bought (orharvested in the case of the gatherer) and/or sold, together with thepurchasing and selling price. Hereafter, buying and selling quantities andprices for each baobab and tamarind product are shown and analysed forthe different chain actors.

116 Chapter 4. Results
Baobab fruits
Baobab fruit pulp is harvested, sold and consumed by many respondentsin Mali and Benin as shown in Table 4.9, which summarises the meanquantities of baobab fruit pulp bought (or harvested in the case ofgatherers), sold and stored by all different chain actors in Mali and Benin,together with the mean buying and selling prices.
Gatherers in Mali harvest about 20 times less baobab fruit pulp thangatherers in Benin, whereas the latter receive a significantly lower pricefor their produce than their counterparts in Mali. It should be remarkedthat almost no gatherers in Mali stated to sell baobab fruit pulp. Asa consequence, the majority of baobab fruits gathered in Mali are usedfor home consumption, whereas this figure only amounts to 4 % in Benin(Mann-Whitney Test, p< 0.01).
The average quantities bought and sold by wholesalers and petty tradersin Mali and Benin do not differ significantly within wholesalers andpetty traders, respectively. In contrast, significant differences were foundbetween these two types of traders, whereby wholesale quantities arefound to be almost three times larger compared to retail quantities. Inaddition, purchasing and selling prices are found to differ significantlywithin wholesalers and petty traders in both countries. However, thepurchasing price is not significant different for wholesalers and pettytraders in Mali. Also selling prices for wholesalers and petty traders inthe same country are not significantly different. Hereby, one should notethat mean buying and selling prices for traders in Mali are almost doublethe corresponding prices in Benin.
Consumers in Benin buy significantly higher quantities of baobab fruitpulp than their colleagues in Mali. Although no significant differencesare found when rural and urban consumers are compared for quantitybought in respectively Mali and Benin, the differences are significant whenthis comparison is made between respectively rural and urban consumersin both countries. No significant price differences could be reported forconsumers, nor between rural and urban consumers. When purchasingprices of consumers are compared with selling prices of petty traders inboth countries, similar prices are reported for Benin, i.e. 335 FCFA / kgversus 330 FCFA / kg, whereas in Mali consumers recorded a cheaperpurchasing price than the selling price of petty traders, i.e. 410 FCFA / kgversus 630 FCFA / kg.

4.3. Market chain analysis 117
Table 4.9: Mean annual quantities of baobab fruit pulp bought (or harvestedin the case of gatherers), sold and stored by all different chainactors in Mali and Benin, together with the mean buying andselling prices, and added value
Mali Benin
Quantity gathered / Gatherer mean 11a 228b
bought (kg) (nMali = 14) median 4 208
(nBenin =44) std. dev. 14 124
Wholesaler mean 28,711e 19,750e
(nMali = 7) median 30,000 14,250
(nBenin =6) std. dev. 22,159 14,794
Petty trader mean 944c,d 766c,d
(nMali = 12) median 550 400
(nBenin =35) std. dev. 1,309 1,062
Processor mean 347b,d 712c
(nMali = 18) median 175 500
(nBenin =27) std. dev. 430 784
Consumer mean 78f 726b,c,d
(nMali = 30) median 13 600
(nBenin =51) std. dev. 226 868
Price bought Gatherer mean - -(FCFA / kg) (nMali = 0) median - -
(nBenin =0) std. dev. - -
Wholesaler mean 430a,b 130c
(nMali = 7) median 375 125
(nBenin =6) std. dev. 170 25
Petty trader mean 470a 250d
(nMali = 12) median 400 250
(nBenin =35) std. dev. 215 1,310
Processor mean 560a 325b,f
(nMali = 18) median 500 325
(nBenin =27) std. dev. 205 90
Consumer mean 410a,b 335f
(nMali = 10) median 400 250
(nBenin =50) std. dev. 215 180
Quantity sold Gatherer mean 1.00a,c,e 227b
(kg) (nMali = 1) median 1 202
(nBenin =43) std. dev. - 125
Wholesaler mean 28,711e 19,750e
(nMali = 7) median 30,000 14,250
(nBenin =6) std. dev. 22,159 14,794
Petty trader mean 944a,d 766d
(nMali = 12) median 550 400
(nBenin =35) std. dev. 1,309 1,062
For each quantity or price, means with a different superscript are significantlydifferent between different chain actors based on Mann-Whitney Test
(p-value< 0.05); std. dev. stands for standard deviation
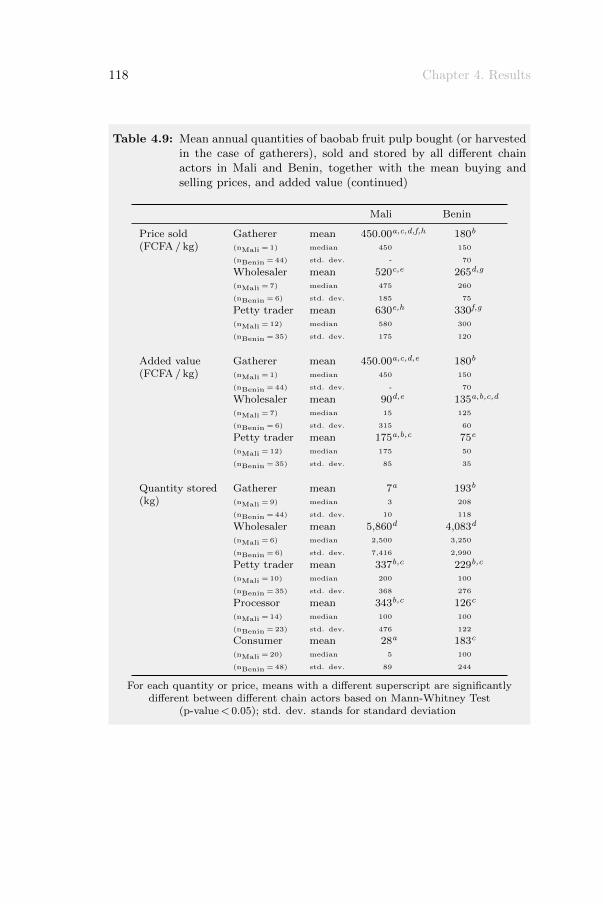
118 Chapter 4. Results
Table 4.9: Mean annual quantities of baobab fruit pulp bought (or harvestedin the case of gatherers), sold and stored by all different chainactors in Mali and Benin, together with the mean buying andselling prices, and added value (continued)
Mali Benin
Price sold Gatherer mean 450.00a,c,d,f,h 180b
(FCFA / kg) (nMali = 1) median 450 150
(nBenin =44) std. dev. - 70
Wholesaler mean 520c,e 265d,g
(nMali = 7) median 475 260
(nBenin =6) std. dev. 185 75
Petty trader mean 630e,h 330f,g
(nMali = 12) median 580 300
(nBenin =35) std. dev. 175 120
Added value Gatherer mean 450.00a,c,d,e 180b
(FCFA / kg) (nMali = 1) median 450 150
(nBenin =44) std. dev. - 70
Wholesaler mean 90d,e 135a,b,c,d
(nMali = 7) median 15 125
(nBenin =6) std. dev. 315 60
Petty trader mean 175a,b,c 75e
(nMali = 12) median 175 50
(nBenin =35) std. dev. 85 35
Quantity stored Gatherer mean 7a 193b
(kg) (nMali = 9) median 3 208
(nBenin =44) std. dev. 10 118
Wholesaler mean 5,860d 4,083d
(nMali = 6) median 2,500 3,250
(nBenin =6) std. dev. 7,416 2,990
Petty trader mean 337b,c 229b,c
(nMali = 10) median 200 100
(nBenin =35) std. dev. 368 276
Processor mean 343b,c 126c
(nMali = 14) median 100 100
(nBenin =23) std. dev. 476 122
Consumer mean 28a 183c
(nMali = 20) median 5 100
(nBenin =48) std. dev. 89 244
For each quantity or price, means with a different superscript are significantlydifferent between different chain actors based on Mann-Whitney Test
(p-value< 0.05); std. dev. stands for standard deviation
4.3. Market chain analysis 119
Baobab leaves
As mentioned before, baobab leaves can be traded in the form of threedifferent products, namely fresh leaves, dry leaves and/or leaf powder(Figure 4.12).
Fresh baobab leaves Fresh baobab leaves are only reported to beharvested in Benin, whereas only petty traders in Mali mentioned to sellfresh baobab leaves. On average, gatherers (n = 23) in Benin annuallyharvested 15 kg fresh baobab leaves of which 14 kg were sold at a meanprice of 220 FCFA / kg. Petty traders in Mali annually buy about 2,297 kg(n = 4) fresh baobab leaves at a price of 80 FCFA / kg (n = 3), whereasthey sell the whole quantity bought at a price of 90 FCFA / kg (n = 4).Rural consumers in Mali recorded to buy annually about 79 kg (n = 34)fresh baobab leaves at a mean price of 90 FCFA / kg (n = 10), whereasurban consumers reported to buy 11 kg (n = 13) at a price of 80 FCFA / kg(n = 3). The single urban consumer in Benin could not remember howmuch fresh baobab leaves she bought, but reported a mean price of250 FCFA / kg. Due to a rather small sample size, in particular for thepetty traders, tests for statistical significances are meaningless. However,it can be noticed that consistently a higher price for fresh baobab leaveshas been reported in Benin than in Mali.
Dry baobab leaves Only chain actors in Mali reported to trade drybaobab leaves. Gatherers annually harvested 459 kg (n = 4) fresh leaveswhich they processed into 121 kg dry baobab leaves. On average, 76 kg(n = 3) dry leaves were sold at a price of 165 FCFA / kg (n = 3). Twowholesalers recorded to buy annually about 18,000 kg dry baobab leaves ata price of 150 FCFA / kg, whereas they sold the whole quantity bought ata price of 225 FCFA / kg. Petty traders annually buy 1,337 kg (n = 15) drybaobab leaves at a price of 95 FCFA / kg (n = 7), while they sell the wholequantity bought at a price of 310 FCFA / kg (n = 15). Rural consumersrecorded to buy annually about 24 kg (n = 18) dry baobab leaves at amean price of 225 FCFA / kg (n = 4), whereas urban consumers reportedto buy 43 kg (n = 6) at a price of 165 FCFA / kg (n = 1). Due to a rathersmall sample size, especially for the gatherers and wholesalers, tests forstatistical significances are meaningless. However, it seems that urbanconsumers buy more dry baobab leaves in comparison to rural consumers,whereas in the previous paragraph we could conclude that fresh baobableaves are in larger quantities bought by rural consumers than by urban.
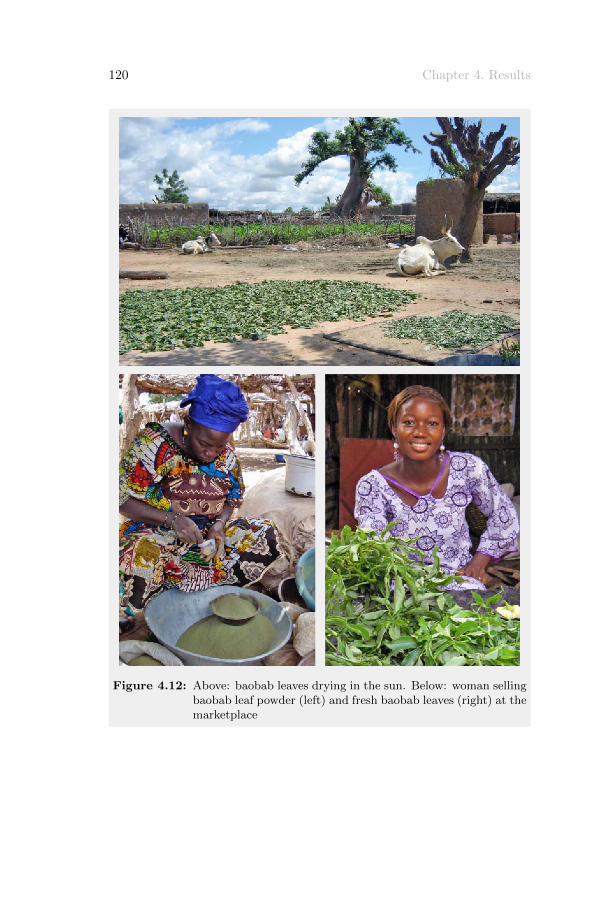
120 Chapter 4. Results
Figure 4.12: Above: baobab leaves drying in the sun. Below: woman sellingbaobab leaf powder (left) and fresh baobab leaves (right) at themarketplace
4.3. Market chain analysis 121
Baobab leaf powder Baobab leaf powder is harvested, sold andconsumed by many respondents in Mali and Benin as shown in Table4.10, which summarises the mean quantities of baobab leaves bought (orharvested in the case of gatherers), sold and stored by all different chainactors in Mali and Benin, together with the mean buying and sellingprices.
Gatherers in Mali and Benin harvest on an annual basis about 216 kgand 166 kg fresh leaves, respectively, which they process into 34 kg and26 kg baobab leaf powder, respectively. On average, they sell respectively51 kg and 24 kg leaf powder at a price of 90 FCFA / kg and 150 FCFA / kg,respectively. All quantities reported by gatherers in Mali were found tobe significantly higher than those quantities recorded in Benin. The meanselling price is significantly lower in Mali than in Benin.One may remark that the mean quantity sold is higher than the quantityharvested for gatherers in Mali. At first sight, this seems a statisticalartefact. But, when we go back to the datafile of individual respondents,none of them reported a higher quantity sold than harvested. It couldbe observed, based on the datafile, that gatherers who recorded a highquantity harvested did sell the majority of this quantity, whereas othergatherers who recorded only a small quantity harvested did not sell theirproduce. This explains a higher mean quantity sold than gathered forgatherers in Mali. Besides, it should also be noted that on average, only13 % of the leaf powder is sold in Mali, whereas this figure amounts upto 91 % in Benin (Mann-Whitney Test, p< 0.01). In other words, 81 % ofharvested baobab leaves in Mali is used for home consumption, whereasonly 9 % is used as such in Benin (Mann-Whitney Test, p< 0.01). Thepart that is not sold nor consumed is donated to family or neighboursin Mali. Therefore, gatherers who did not sell baobab leaf powder (i.e.zero values) were not taken into account to calculate mean values to avoiddistortions in the results.
As shown in Table 4.10, the average quantities bought and sold by Malianwholesalers are significantly higher compared to the quantities bought andsold by petty traders in Mali and Benin. In addition, also the quantitiesbought and sold by petty traders are significantly different for pettytraders in Mali and Benin and both quantities are about ten times higherin Mali as in Benin. Purchasing and selling prices are not significantlydifferent between on the one hand wholesalers in Mali and on the otherpetty traders in Mali and Benin, respectively. However, purchasing and
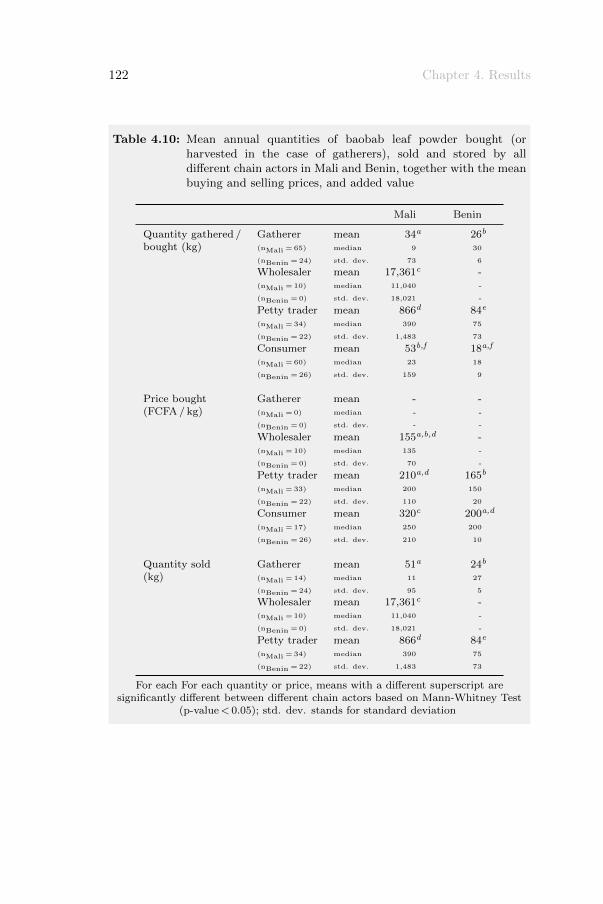
122 Chapter 4. Results
Table 4.10: Mean annual quantities of baobab leaf powder bought (orharvested in the case of gatherers), sold and stored by alldifferent chain actors in Mali and Benin, together with the meanbuying and selling prices, and added value
Mali Benin
Quantity gathered / Gatherer mean 34a 26b
bought (kg) (nMali = 65) median 9 30
(nBenin =24) std. dev. 73 6
Wholesaler mean 17,361c -(nMali = 10) median 11,040 -
(nBenin =0) std. dev. 18,021 -
Petty trader mean 866d 84e
(nMali = 34) median 390 75
(nBenin =22) std. dev. 1,483 73
Consumer mean 53b,f 18a,f
(nMali = 60) median 23 18
(nBenin =26) std. dev. 159 9
Price bought Gatherer mean - -(FCFA / kg) (nMali = 0) median - -
(nBenin =0) std. dev. - -
Wholesaler mean 155a,b,d -(nMali = 10) median 135 -
(nBenin =0) std. dev. 70 -
Petty trader mean 210a,d 165b
(nMali = 33) median 200 150
(nBenin =22) std. dev. 110 20
Consumer mean 320c 200a,d
(nMali = 17) median 250 200
(nBenin =26) std. dev. 210 10
Quantity sold Gatherer mean 51a 24b
(kg) (nMali = 14) median 11 27
(nBenin =24) std. dev. 95 5
Wholesaler mean 17,361c -(nMali = 10) median 11,040 -
(nBenin =0) std. dev. 18,021 -
Petty trader mean 866d 84e
(nMali = 34) median 390 75
(nBenin =22) std. dev. 1,483 73
For each For each quantity or price, means with a different superscript aresignificantly different between different chain actors based on Mann-Whitney Test
(p-value< 0.05); std. dev. stands for standard deviation
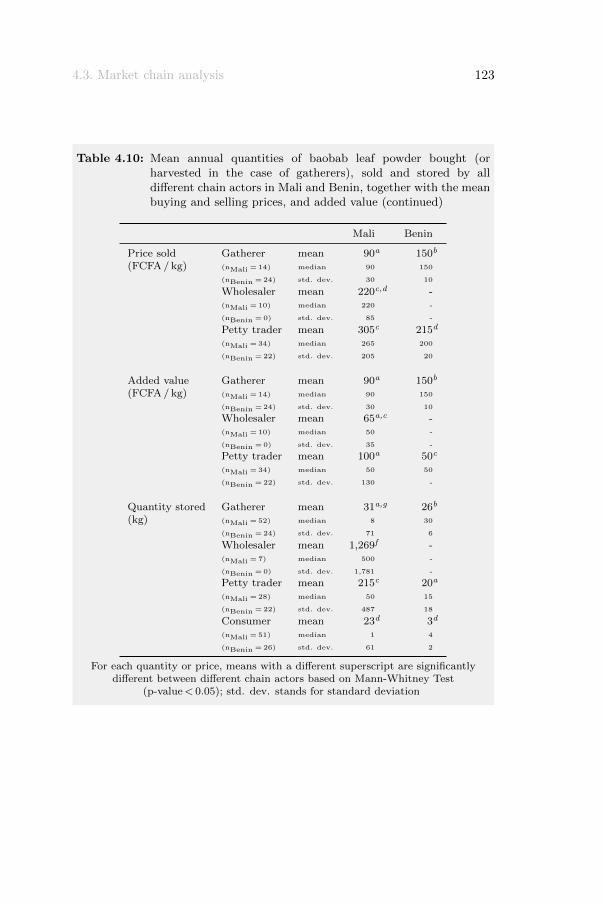
4.3. Market chain analysis 123
Table 4.10: Mean annual quantities of baobab leaf powder bought (orharvested in the case of gatherers), sold and stored by alldifferent chain actors in Mali and Benin, together with the meanbuying and selling prices, and added value (continued)
Mali Benin
Price sold Gatherer mean 90a 150b
(FCFA / kg) (nMali = 14) median 90 150
(nBenin =24) std. dev. 30 10
Wholesaler mean 220c,d -(nMali = 10) median 220 -
(nBenin =0) std. dev. 85 -
Petty trader mean 305c 215d
(nMali = 34) median 265 200
(nBenin =22) std. dev. 205 20
Added value Gatherer mean 90a 150b
(FCFA / kg) (nMali = 14) median 90 150
(nBenin =24) std. dev. 30 10
Wholesaler mean 65a,c -(nMali = 10) median 50 -
(nBenin =0) std. dev. 35 -
Petty trader mean 100a 50c
(nMali = 34) median 50 50
(nBenin =22) std. dev. 130 -
Quantity stored Gatherer mean 31a,g 26b
(kg) (nMali = 52) median 8 30
(nBenin =24) std. dev. 71 6
Wholesaler mean 1,269f -(nMali = 7) median 500 -
(nBenin =0) std. dev. 1,781 -
Petty trader mean 215c 20a
(nMali = 28) median 50 15
(nBenin =22) std. dev. 487 18
Consumer mean 23d 3d
(nMali = 51) median 1 4
(nBenin =26) std. dev. 61 2
For each quantity or price, means with a different superscript are significantlydifferent between different chain actors based on Mann-Whitney Test
(p-value< 0.05); std. dev. stands for standard deviation
124 Chapter 4. Results
selling prices are found to be significantly lower for petty traders in Beninthan in Mali.
Consumers in both countries buy similar quantities of baobab leaf powder.Additionally, no significant difference is found when rural and urbanconsumers are compared in and between Mali and Benin. However,the price consumers in Mali pay for baobab leaf powder is reportedto be significantly higher compared to the purchasing price in Benin.This difference in buying price was not found when rural and urbanconsumers in both countries were compared, also not between ruralconsumers in Mali. But the significant difference in purchasing price wasconfirmed between urban consumers in Mali and Benin, meaning thaturban consumers in Mali purchase baobab leaf powder for a higher pricethan urban consumers in Benin. Finally, it should be noted that whenpurchasing prices of consumers in Mali and Benin, i.e. 320 FCFA / kgand 200 FCFA / kg, respectively, are compared with selling prices of pettytraders, i.e. 305 FCFA / kg and 215 FCFA / kg, respectively, they seemvery similar, as was expected.
Tamarind fruits
Tamarind fruit pods are harvested, sold and consumed by manyrespondents in Mali and Benin as shown in Table 4.11, which summarisesthe mean quantities of tamarind fruit pods bought (or harvested in thecase of gatherers), sold and stored by all different chain actors in Maliand Benin, together with the mean buying and selling prices.
Gatherers in Mali harvest about ten times more tamarind fruit pods andreceive a lower price for their produce than gatherers in Benin. As thereare only a few gatherers in Benin, tests for statistical significances betweengatherers are pointless and should be treated with care. Additionally, itshould be noted that on average only 28 % of the harvested tamarind fruitsare sold in Mali, whereas 92 % in Benin (Mann-Whitney Test, p< 0.01).The majority (65 %) of harvested tamarind pods in Mali is thus used forhome consumption, compared to only 8 % in Benin (Mann-Whitney Test,p< 0.01). The part of the harvest that is not sold nor consumed is donatedto family or neighbours in Mali.
Quantities bought and sold, as well as purchasing and selling prices, arenot found to be significantly different between wholesalers in Mali andBenin. In contrast, significant differences were reported in quantities
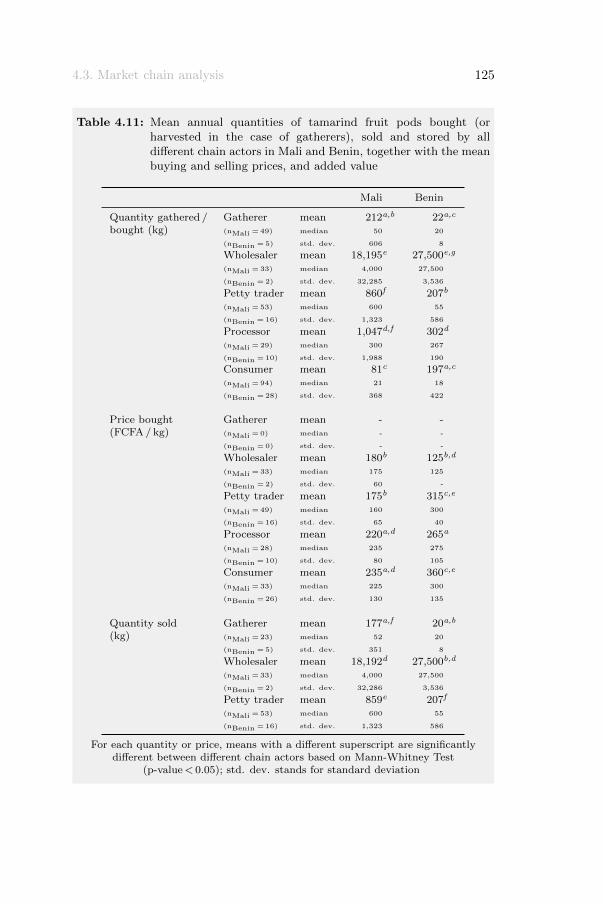
4.3. Market chain analysis 125
Table 4.11: Mean annual quantities of tamarind fruit pods bought (orharvested in the case of gatherers), sold and stored by alldifferent chain actors in Mali and Benin, together with the meanbuying and selling prices, and added value
Mali Benin
Quantity gathered / Gatherer mean 212a,b 22a,c
bought (kg) (nMali = 49) median 50 20
(nBenin =5) std. dev. 606 8
Wholesaler mean 18,195e 27,500e,g
(nMali = 33) median 4,000 27,500
(nBenin =2) std. dev. 32,285 3,536
Petty trader mean 860f 207b
(nMali = 53) median 600 55
(nBenin =16) std. dev. 1,323 586
Processor mean 1,047d,f 302d
(nMali = 29) median 300 267
(nBenin =10) std. dev. 1,988 190
Consumer mean 81c 197a,c
(nMali = 94) median 21 18
(nBenin =28) std. dev. 368 422
Price bought Gatherer mean - -(FCFA / kg) (nMali = 0) median - -
(nBenin =0) std. dev. - -
Wholesaler mean 180b 125b,d
(nMali = 33) median 175 125
(nBenin =2) std. dev. 60 -
Petty trader mean 175b 315c,e
(nMali = 49) median 160 300
(nBenin =16) std. dev. 65 40
Processor mean 220a,d 265a
(nMali = 28) median 235 275
(nBenin =10) std. dev. 80 105
Consumer mean 235a,d 360c,e
(nMali = 33) median 225 300
(nBenin =26) std. dev. 130 135
Quantity sold Gatherer mean 177a,f 20a,b
(kg) (nMali = 23) median 52 20
(nBenin =5) std. dev. 351 8
Wholesaler mean 18,192d 27,500b,d
(nMali = 33) median 4,000 27,500
(nBenin =2) std. dev. 32,286 3,536
Petty trader mean 859e 207f
(nMali = 53) median 600 55
(nBenin =16) std. dev. 1,323 586
For each quantity or price, means with a different superscript are significantlydifferent between different chain actors based on Mann-Whitney Test
(p-value< 0.05); std. dev. stands for standard deviation
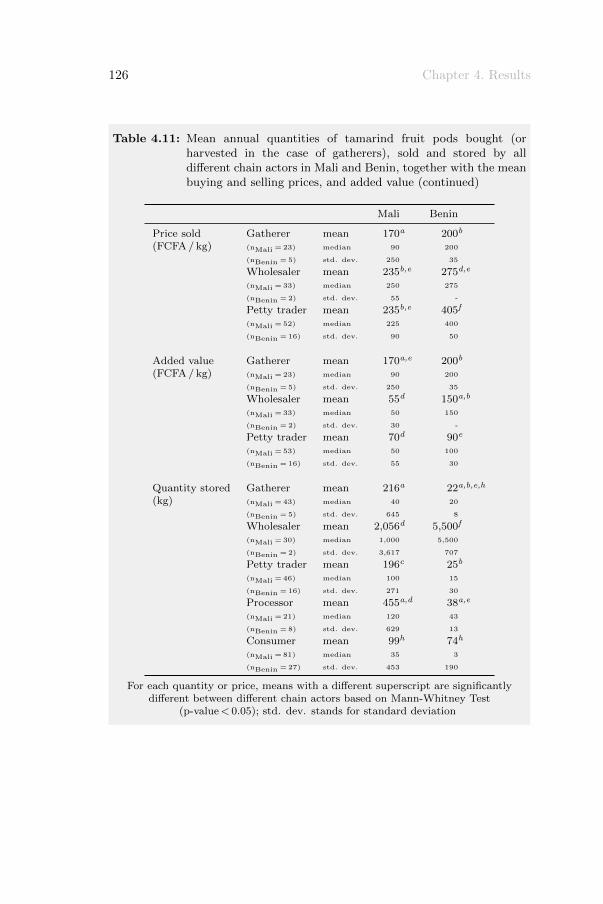
126 Chapter 4. Results
Table 4.11: Mean annual quantities of tamarind fruit pods bought (orharvested in the case of gatherers), sold and stored by alldifferent chain actors in Mali and Benin, together with the meanbuying and selling prices, and added value (continued)
Mali Benin
Price sold Gatherer mean 170a 200b
(FCFA / kg) (nMali = 23) median 90 200
(nBenin =5) std. dev. 250 35
Wholesaler mean 235b,e 275d,e
(nMali = 33) median 250 275
(nBenin =2) std. dev. 55 -
Petty trader mean 235b,e 405f
(nMali = 52) median 225 400
(nBenin =16) std. dev. 90 50
Added value Gatherer mean 170a,e 200b
(FCFA / kg) (nMali = 23) median 90 200
(nBenin =5) std. dev. 250 35
Wholesaler mean 55d 150a,b
(nMali = 33) median 50 150
(nBenin =2) std. dev. 30 -
Petty trader mean 70d 90e
(nMali = 53) median 50 100
(nBenin =16) std. dev. 55 30
Quantity stored Gatherer mean 216a 22a,b,e,h
(kg) (nMali = 43) median 40 20
(nBenin =5) std. dev. 645 8
Wholesaler mean 2,056d 5,500f
(nMali = 30) median 1,000 5,500
(nBenin =2) std. dev. 3,617 707
Petty trader mean 196c 25b
(nMali = 46) median 100 15
(nBenin =16) std. dev. 271 30
Processor mean 455a,d 38a,e
(nMali = 21) median 120 43
(nBenin =8) std. dev. 629 13
Consumer mean 99h 74h
(nMali = 81) median 35 3
(nBenin =27) std. dev. 453 190
For each quantity or price, means with a different superscript are significantlydifferent between different chain actors based on Mann-Whitney Test
(p-value< 0.05); std. dev. stands for standard deviation

4.3. Market chain analysis 127
bought and sold, and in purchasing and selling prices for petty tradersin both countries. Again, as there are only two wholesalers in Benin,tests for statistical significances between traders should be treated withcare. Quantities of tamarind pods bought and sold are significantly biggerfor wholesalers than for petty traders. Wholesale prices are found to besimilar to prices for Malian petty traders, whereas significantly higherprices were observed for petty traders in Benin.
Consumers in Mali and Benin buy similar quantities of tamarind fruits.In addition, no significant differences in quantity bought are found forrespectively rural and urban consumers in both countries, nor whenrural and urban consumers are compared in Benin. The only significantdifference for quantity bought was found between rural and urbanconsumers in Mali: rural consumers buy about twice the quantity astheir urban colleagues. Consumers in Benin pay significantly more fortamarind fruit pods than consumers in Mali. This is probably due to asignificantly higher price reported by urban consumers in Benin, comparedto rural and urban consumers in Mali and urban consumers in Benin.When purchasing prices of consumers are compared with selling pricesof petty traders in both countries, similar prices are reported for Mali,i.e. 235 FCFA / kg versus 235 FCFA / kg, whereas in Benin consumersrecorded a slightly cheaper purchasing price than the selling price of pettytraders, i.e. 360 FCFA / kg versus 405 FCFA / kg.
Tamarind leaves
As for the dry baobab leaves, only chain actors in Mali reported totrade tamarind leaves. Gatherers (n = 22) annually harvested 26 kgtamarind leaves, but none of the gatherers reported to sell tamarindleaves. However, one wholesaler and 12 petty traders reported the saleof tamarind leaves. Hereby, it should be noted that some petty tradersreported to harvest themselves tamarind leaves for selling purposes. Thewholesaler recorded to buy annually about 240 kg tamarind leaves at aprice of 125 FCFA / kg, whereas she sells the whole quantity bought ata price of 250 FCFA / kg. Petty traders annually buy 152 kg (n = 12)tamarind leaves at a price of 160 FCFA / kg (n = 7), while they sell thewhole quantity bought at a price of 200 FCFA / kg (n = 12). Ruralconsumers recorded to buy annually about 53 kg (n = 14) tamarind leavesat a mean price of 105 FCFA / kg (n = 3), whereas urban consumers (n = 5)reported to buy 6 kg, but they could not remember the purchasing price.
128 Chapter 4. Results
Although it seems that rural consumers buy more dry baobab leaves incomparison to rural consumers, no significant difference was observed forthe quantity bought between rural and urban consumers in Mali. Becausethere is only one wholesaler, tests for statistical significances between thiswholesaler and the petty traders are meaningless.
4.3.2 Added value
Added values, defined as the price received by each actor minus theprice paid by that actor, for baobab leaf powder, baobab fruit pulp andtamarind fruit pods are reported in Tables 4.9, 4.10 and 4.11 and showngraphically in Figure 4.13. For baobab leaf powder, the added value forgatherers in Benin is significantly the highest. Subsequently, added valuesfor petty traders and gatherers in Mali are higher compared to wholesalersin Mali and petty traders in Benin. Concerning baobab fruit pulp, theadded values for gatherers and processors in Mali, gatherers in Benin andpetty traders in Mali are higher than the added values for wholesalers andprocessors in Benin, wholesalers in Mali and petty traders in Benin. Theadded value for Malian processors stands out for tamarind fruit pods incomparison to all other chain actors. In general, added values for the threeproducts concerned tend to be the highest for processors and gatherers.
4.3.3 Harvesting techniques
Baobab and tamarind leaves can be harvested by climbing in trees or not.In the first case, leaves are picked by hand or whole branches are cutusing sickles or axes. In the latter case, branches are cut by using a doleor coupe-coupe as tool. A dole is a sickle mounted on a long stick, whereasa coupe-coupe is a long stick with a fixed knife blade.
There are many different baobab and tamarind fruit harvestingtechniques, such as shaking branches, using sticks to knock the fruitsto the ground, throwing objects to dislodge fruit and climbing up trees.Moreover, baobab and tamarind fruits can be harvested with a dole orcoupe-coupe (Figure 4.14).
4.3.4 Buying and selling periods
Each chain actor was asked to record the buying (or harvesting in thecase of the gatherer) and/or selling period during which he/she buys
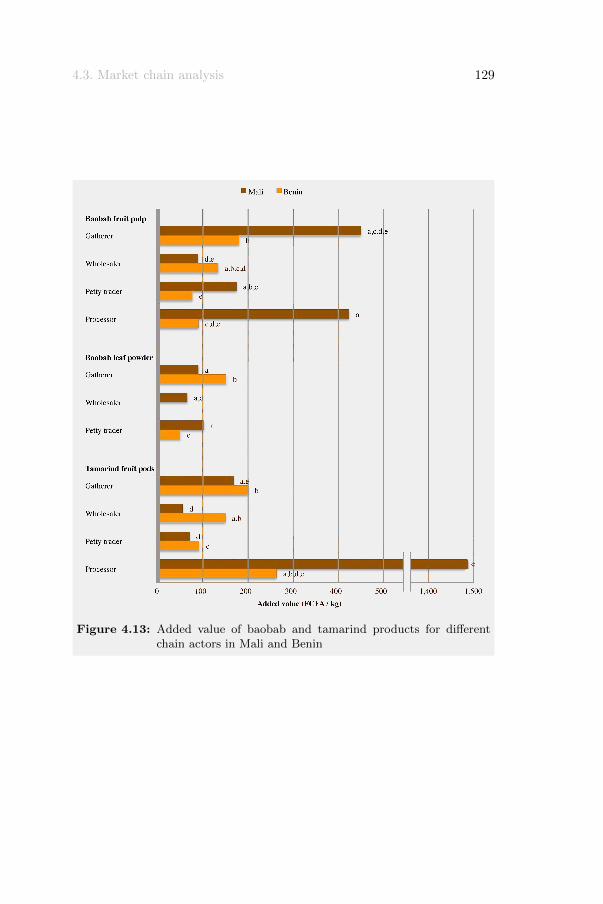
4.3. Market chain analysis 129
Figure 4.13: Added value of baobab and tamarind products for differentchain actors in Mali and Benin
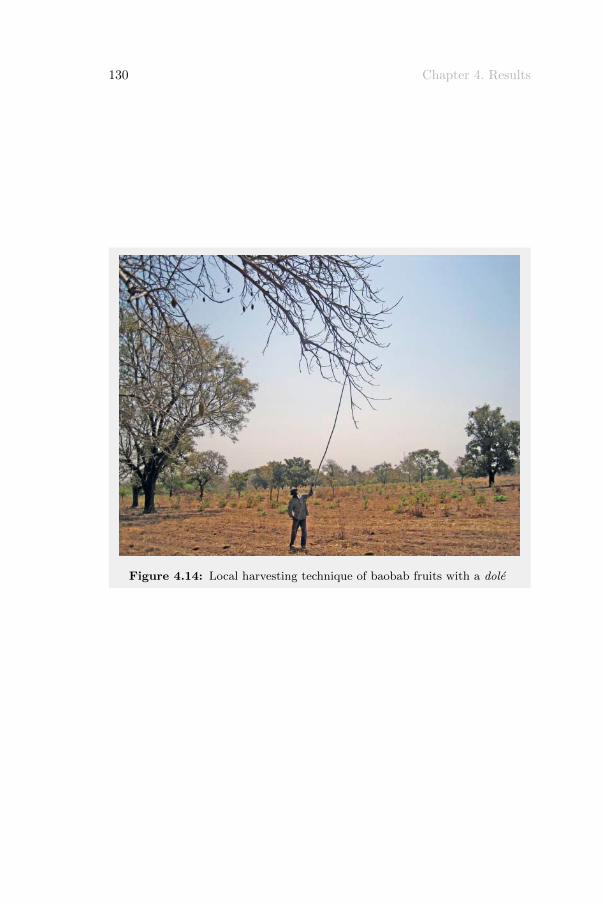
130 Chapter 4. Results
Figure 4.14: Local harvesting technique of baobab fruits with a dole
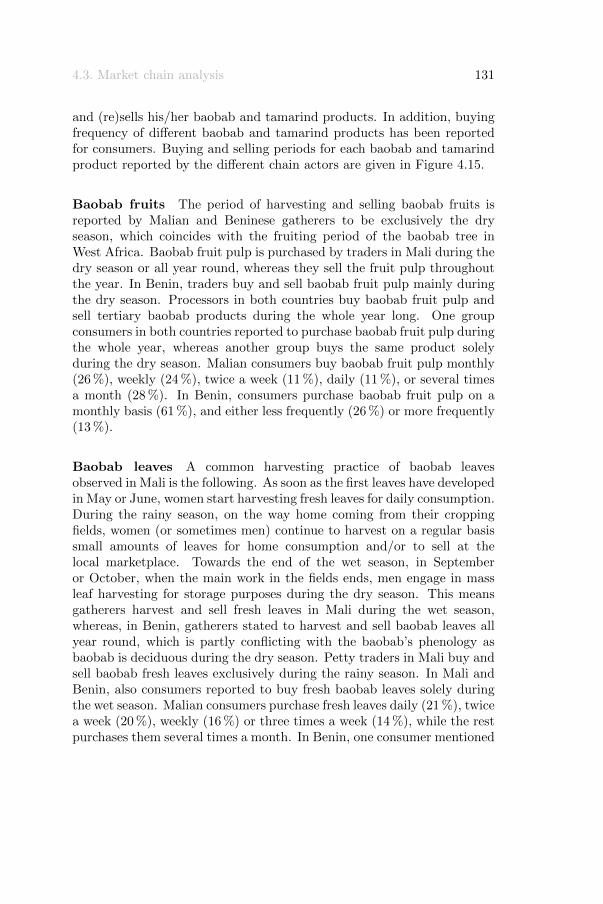
4.3. Market chain analysis 131
and (re)sells his/her baobab and tamarind products. In addition, buyingfrequency of different baobab and tamarind products has been reportedfor consumers. Buying and selling periods for each baobab and tamarindproduct reported by the different chain actors are given in Figure 4.15.
Baobab fruits The period of harvesting and selling baobab fruits isreported by Malian and Beninese gatherers to be exclusively the dryseason, which coincides with the fruiting period of the baobab tree inWest Africa. Baobab fruit pulp is purchased by traders in Mali during thedry season or all year round, whereas they sell the fruit pulp throughoutthe year. In Benin, traders buy and sell baobab fruit pulp mainly duringthe dry season. Processors in both countries buy baobab fruit pulp andsell tertiary baobab products during the whole year long. One groupconsumers in both countries reported to purchase baobab fruit pulp duringthe whole year, whereas another group buys the same product solelyduring the dry season. Malian consumers buy baobab fruit pulp monthly(26 %), weekly (24 %), twice a week (11 %), daily (11 %), or several timesa month (28 %). In Benin, consumers purchase baobab fruit pulp on amonthly basis (61 %), and either less frequently (26 %) or more frequently(13 %).
Baobab leaves A common harvesting practice of baobab leavesobserved in Mali is the following. As soon as the first leaves have developedin May or June, women start harvesting fresh leaves for daily consumption.During the rainy season, on the way home coming from their croppingfields, women (or sometimes men) continue to harvest on a regular basissmall amounts of leaves for home consumption and/or to sell at thelocal marketplace. Towards the end of the wet season, in Septemberor October, when the main work in the fields ends, men engage in massleaf harvesting for storage purposes during the dry season. This meansgatherers harvest and sell fresh leaves in Mali during the wet season,whereas, in Benin, gatherers stated to harvest and sell baobab leaves allyear round, which is partly conflicting with the baobab’s phenology asbaobab is deciduous during the dry season. Petty traders in Mali buy andsell baobab fresh leaves exclusively during the rainy season. In Mali andBenin, also consumers reported to buy fresh baobab leaves solely duringthe wet season. Malian consumers purchase fresh leaves daily (21 %), twicea week (20 %), weekly (16 %) or three times a week (14 %), while the restpurchases them several times a month. In Benin, one consumer mentioned
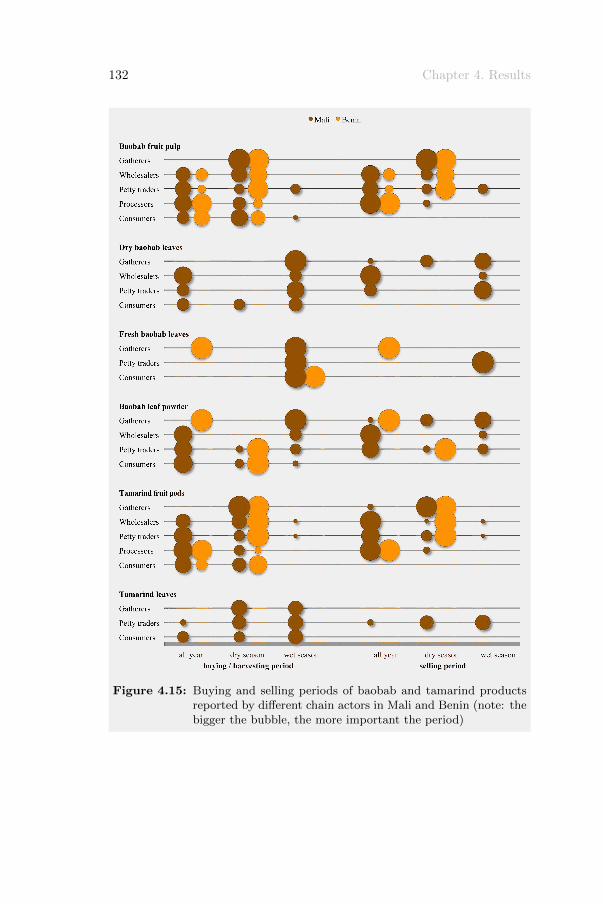
132 Chapter 4. Results
Figure 4.15: Buying and selling periods of baobab and tamarind productsreported by different chain actors in Mali and Benin (note: thebigger the bubble, the more important the period)
4.3. Market chain analysis 133
to purchases fresh baobab leaves on a monthly basis. Only chain actors inMali reported to trade dry baobab leaves. Gatherers harvest fresh leavesduring the rainy season and sell the dried leaves during both the wet anddry season. Traders buy and sell the produce all through the year orsolely during the rainy season. Consumers reported to buy dry baobableaves during the wet or dry season, or all year round on a weekly basis(78 %) or more frequently. Concerning baobab leaf powder, gatherers inMali harvest fresh leaves during the rainy season and sell leaf powderduring either the wet or dry season, whereas gatherers in Benin reportedto harvest and sell all through the year. Traders in Mali purchase andsell baobab leaf power all year round while petty traders in Benin tradethe produce during the dry season. According to Beninese consumers,baobab leaf powder is uniquely purchased during the dry season, whereas,in Mali, baobab leaf powder is mainly purchased throughout the year.Malian consumers buy baobab leaf powder weekly (36 %), daily (22 %),twice a week (14 %) or several times a month (28 %). In Benin, consumerspurchase baobab leaf powder on a monthly basis (89 %) or more frequently(11 %).
Tamarind fruits All gatherers in Mali and Benin reported to harvestand sell tamarind fruits during the dry season, which corresponds withthe fruiting period of the tamarind tree in West Africa. In Benin, tradersbuy and sell tamarind fruits exclusively during the dry season, whereasonly about half of Malian traders buy tamarind pods during this season;the other half purchases tamarind fruits all year round. Tamarind fruitsin Mali are mainly sold all year round. Processors in Mali and Benin buytamarind fruit pods throughout the year and sell their tertiary tamarindproducts as well all over the year. According to consumers in bothcountries, tamarind fruit pods are either purchased solely during the dryseason or throughout the year. In Mali, tamarind fruit pods are boughtweekly (35 %), daily (33 %) or several times a month (32 %). Consumersin Benin purchase tamarind fruit pods on a monthly basis (80 %) or morefrequently (20 %).
Tamarind leaves Half of the gatherers in Mali harvests tamarind leavesduring the wet season and the other half during the dry season, whichagrees with the fact that tamarind is an evergreen tree. Petty traders buyor sell tamarind leaves either during the dry season or the wet season.Malian consumers reported to buy tamarind leaves during the wet season,
134 Chapter 4. Results
throughout the year or during the dry season and they buy tamarind leaveson a daily (40 %), weekly (26 %) or monthly (11 %) basis, while the restpurchases tamarind leaves on an intermediary frequency.
4.3.5 Storage practices
The quantity stored, which is the maximum total quantity of a baobab ortamarind product that is annually stored in Mali and Benin, is given inTables 4.9, 4.10 and 4.11. In Figure 4.16, on the left hand side, storageplaces used by the different chain actors for different baobab and tamarindproducts are given, whereas, on the right hand side, the importance of theused storage material is shown. Based on this figure, storage practices willhereafter be described for each baobab and tamarind product.
Baobab fruit pulp In Table 4.9, the average quantities of baobab fruitpulp stored by all chain actors are given. Wholesalers, petty traders andprocessors in Mali and Benin reported similar quantities stored. Moreover,the storage duration is not found to differ significantly between the chainactors and ranges between one month and a half and almost nine months.All chain actors in Mali, except consumers, and wholesalers in Beninreported to store baobab fruit pulp in a storehouse; all other actors inBenin and Malian consumers store fruit pulp in their house. Baobab fruitpulp is mainly kept in recycled rice bags. In addition, traders in Malikeep fruit pulp in plastic bags, whereas gatherers and consumers in Malikeep it in plastic tubs. Processors of baobab fruit pulp in Mali and Beninalso reported to store tertiary products, such as baobab juice and milletcream or degue. Small plastic bags containing baobab juice are mainlykept in a fridge or freezer, while plastic bottles with juice are reportedto be stored also in the store or storehouse. Plastic bags with degue arekept in the store or storehouse (Figure 4.17). On a 5-point scale (1 = verybad, 5 = very good), storage conditions for baobab fruit pulp are scoredbetween 3.70 and 4.78. All actors in both countries reported humidityand bug, mice and fungi attacks as the major problems during storage.The major problem reported by processors during storage of baobab juiceis the risk of fermentation.
Baobab leaf powder The mean quantities of baobab leaf powderstored by the different chain actors are presented in Table 4.10. Pettytraders in Benin store significantly less compared to petty traders in
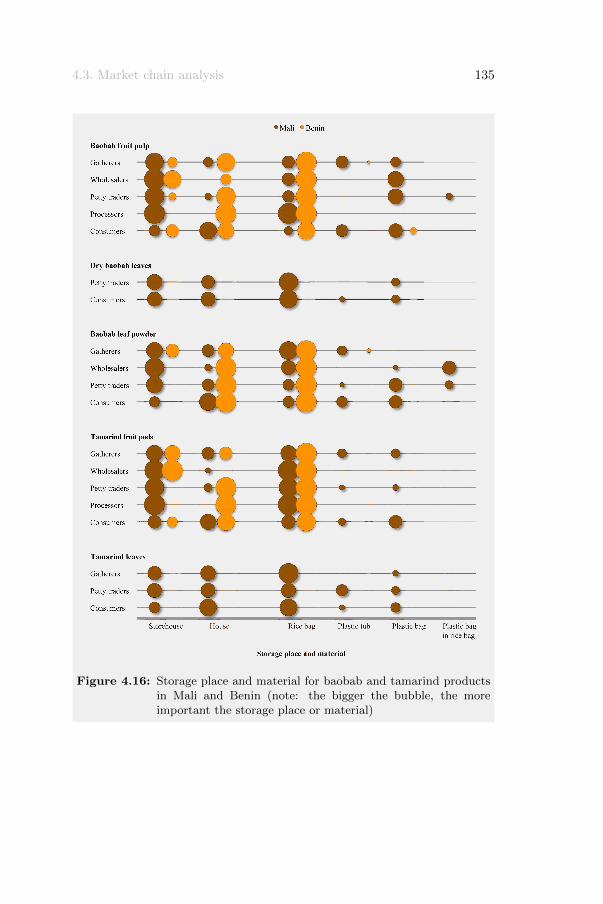
4.3. Market chain analysis 135
Figure 4.16: Storage place and material for baobab and tamarind productsin Mali and Benin (note: the bigger the bubble, the moreimportant the storage place or material)
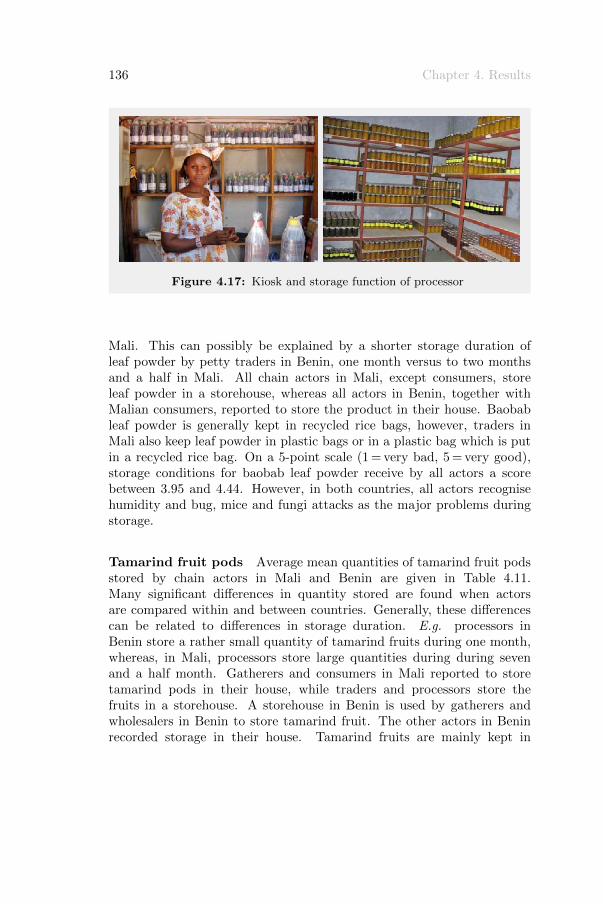
136 Chapter 4. Results
Figure 4.17: Kiosk and storage function of processor
Mali. This can possibly be explained by a shorter storage duration ofleaf powder by petty traders in Benin, one month versus to two monthsand a half in Mali. All chain actors in Mali, except consumers, storeleaf powder in a storehouse, whereas all actors in Benin, together withMalian consumers, reported to store the product in their house. Baobableaf powder is generally kept in recycled rice bags, however, traders inMali also keep leaf powder in plastic bags or in a plastic bag which is putin a recycled rice bag. On a 5-point scale (1 = very bad, 5 = very good),storage conditions for baobab leaf powder receive by all actors a scorebetween 3.95 and 4.44. However, in both countries, all actors recognisehumidity and bug, mice and fungi attacks as the major problems duringstorage.
Tamarind fruit pods Average mean quantities of tamarind fruit podsstored by chain actors in Mali and Benin are given in Table 4.11.Many significant differences in quantity stored are found when actorsare compared within and between countries. Generally, these differencescan be related to differences in storage duration. E.g. processors inBenin store a rather small quantity of tamarind fruits during one month,whereas, in Mali, processors store large quantities during during sevenand a half month. Gatherers and consumers in Mali reported to storetamarind pods in their house, while traders and processors store thefruits in a storehouse. A storehouse in Benin is used by gatherers andwholesalers in Benin to store tamarind fruit. The other actors in Beninrecorded storage in their house. Tamarind fruits are mainly kept in
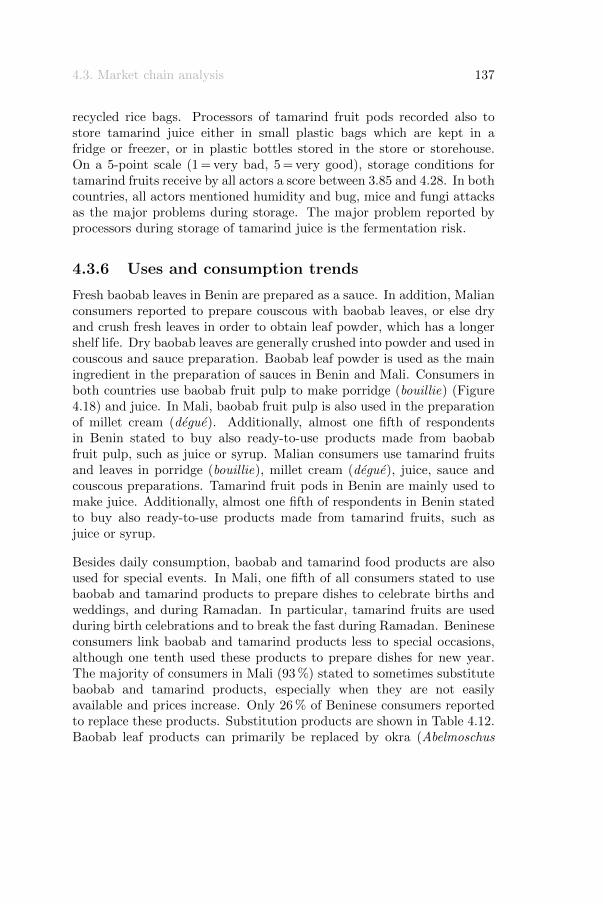
4.3. Market chain analysis 137
recycled rice bags. Processors of tamarind fruit pods recorded also tostore tamarind juice either in small plastic bags which are kept in afridge or freezer, or in plastic bottles stored in the store or storehouse.On a 5-point scale (1 = very bad, 5 = very good), storage conditions fortamarind fruits receive by all actors a score between 3.85 and 4.28. In bothcountries, all actors mentioned humidity and bug, mice and fungi attacksas the major problems during storage. The major problem reported byprocessors during storage of tamarind juice is the fermentation risk.
4.3.6 Uses and consumption trends
Fresh baobab leaves in Benin are prepared as a sauce. In addition, Malianconsumers reported to prepare couscous with baobab leaves, or else dryand crush fresh leaves in order to obtain leaf powder, which has a longershelf life. Dry baobab leaves are generally crushed into powder and used incouscous and sauce preparation. Baobab leaf powder is used as the mainingredient in the preparation of sauces in Benin and Mali. Consumers inboth countries use baobab fruit pulp to make porridge (bouillie) (Figure4.18) and juice. In Mali, baobab fruit pulp is also used in the preparationof millet cream (degue). Additionally, almost one fifth of respondentsin Benin stated to buy also ready-to-use products made from baobabfruit pulp, such as juice or syrup. Malian consumers use tamarind fruitsand leaves in porridge (bouillie), millet cream (degue), juice, sauce andcouscous preparations. Tamarind fruit pods in Benin are mainly used tomake juice. Additionally, almost one fifth of respondents in Benin statedto buy also ready-to-use products made from tamarind fruits, such asjuice or syrup.
Besides daily consumption, baobab and tamarind food products are alsoused for special events. In Mali, one fifth of all consumers stated to usebaobab and tamarind products to prepare dishes to celebrate births andweddings, and during Ramadan. In particular, tamarind fruits are usedduring birth celebrations and to break the fast during Ramadan. Benineseconsumers link baobab and tamarind products less to special occasions,although one tenth used these products to prepare dishes for new year.The majority of consumers in Mali (93 %) stated to sometimes substitutebaobab and tamarind products, especially when they are not easilyavailable and prices increase. Only 26 % of Beninese consumers reportedto replace these products. Substitution products are shown in Table 4.12.Baobab leaf products can primarily be replaced by okra (Abelmoschus

138 Chapter 4. Results
Figure 4.18: Preparation of baobab fruit pulp porridge. Above: pulp, seedsand fibres are diluted in water. Middle: seeds and fibres areremoved and dissolved pulp remains. Below: at the same time,water is added to e.g. maize flour, boiled and thickened to aporridge which is mixed with the dissolved baobab pulp
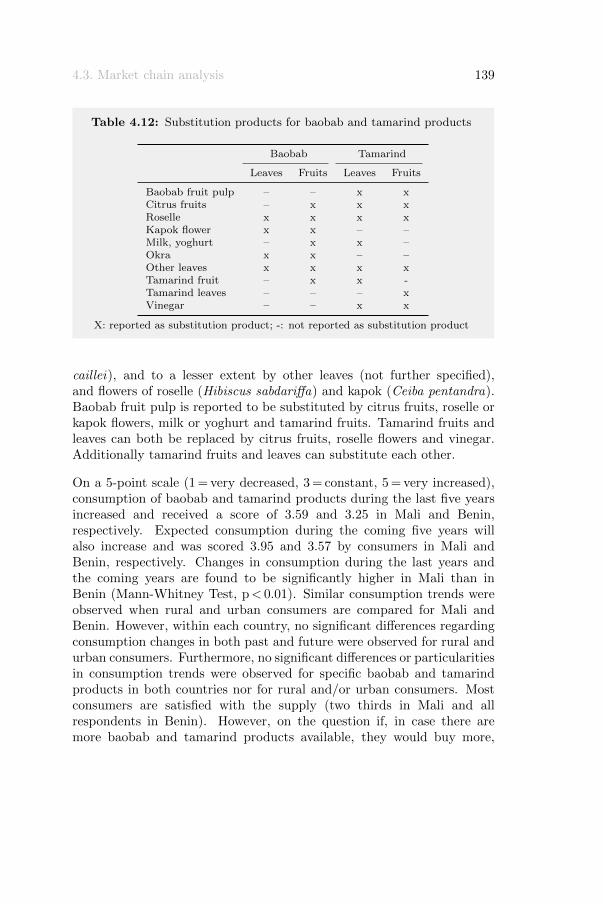
4.3. Market chain analysis 139
Table 4.12: Substitution products for baobab and tamarind products
Baobab Tamarind
Leaves Fruits Leaves Fruits
Baobab fruit pulp – – x xCitrus fruits – x x xRoselle x x x xKapok flower x x – –Milk, yoghurt – x x –Okra x x – –Other leaves x x x xTamarind fruit – x x -Tamarind leaves – – – xVinegar – – x x
X: reported as substitution product; -: not reported as substitution product
caillei), and to a lesser extent by other leaves (not further specified),and flowers of roselle (Hibiscus sabdariffa) and kapok (Ceiba pentandra).Baobab fruit pulp is reported to be substituted by citrus fruits, roselle orkapok flowers, milk or yoghurt and tamarind fruits. Tamarind fruits andleaves can both be replaced by citrus fruits, roselle flowers and vinegar.Additionally tamarind fruits and leaves can substitute each other.
On a 5-point scale (1 = very decreased, 3 = constant, 5 = very increased),consumption of baobab and tamarind products during the last five yearsincreased and received a score of 3.59 and 3.25 in Mali and Benin,respectively. Expected consumption during the coming five years willalso increase and was scored 3.95 and 3.57 by consumers in Mali andBenin, respectively. Changes in consumption during the last years andthe coming years are found to be significantly higher in Mali than inBenin (Mann-Whitney Test, p< 0.01). Similar consumption trends wereobserved when rural and urban consumers are compared for Mali andBenin. However, within each country, no significant differences regardingconsumption changes in both past and future were observed for rural andurban consumers. Furthermore, no significant differences or particularitiesin consumption trends were observed for specific baobab and tamarindproducts in both countries nor for rural and/or urban consumers. Mostconsumers are satisfied with the supply (two thirds in Mali and allrespondents in Benin). However, on the question if, in case there aremore baobab and tamarind products available, they would buy more,
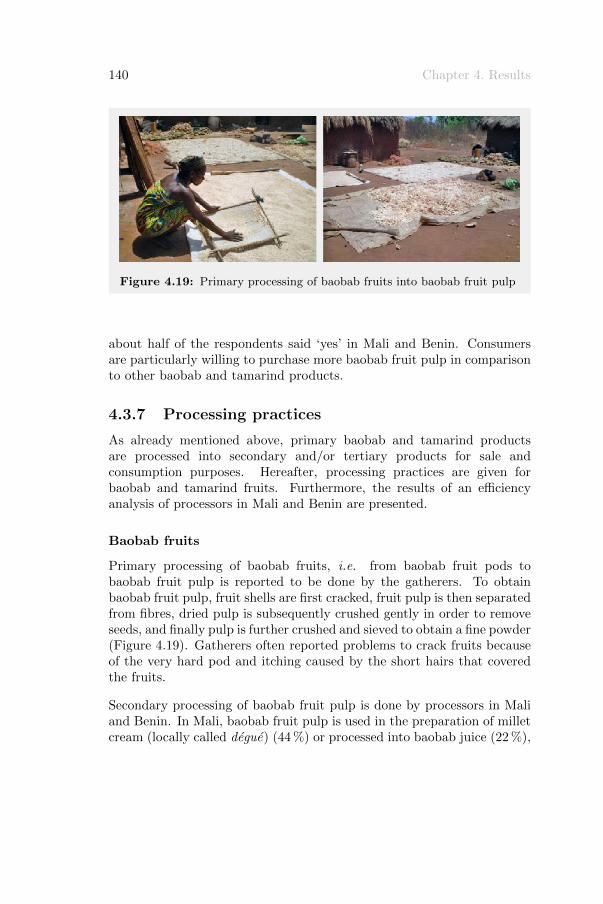
140 Chapter 4. Results
Figure 4.19: Primary processing of baobab fruits into baobab fruit pulp
about half of the respondents said ‘yes’ in Mali and Benin. Consumersare particularly willing to purchase more baobab fruit pulp in comparisonto other baobab and tamarind products.
4.3.7 Processing practices
As already mentioned above, primary baobab and tamarind productsare processed into secondary and/or tertiary products for sale andconsumption purposes. Hereafter, processing practices are given forbaobab and tamarind fruits. Furthermore, the results of an efficiencyanalysis of processors in Mali and Benin are presented.
Baobab fruits
Primary processing of baobab fruits, i.e. from baobab fruit pods tobaobab fruit pulp is reported to be done by the gatherers. To obtainbaobab fruit pulp, fruit shells are first cracked, fruit pulp is then separatedfrom fibres, dried pulp is subsequently crushed gently in order to removeseeds, and finally pulp is further crushed and sieved to obtain a fine powder(Figure 4.19). Gatherers often reported problems to crack fruits becauseof the very hard pod and itching caused by the short hairs that coveredthe fruits.
Secondary processing of baobab fruit pulp is done by processors in Maliand Benin. In Mali, baobab fruit pulp is used in the preparation of milletcream (locally called degue) (44 %) or processed into baobab juice (22 %),

4.3. Market chain analysis 141
Figure 4.20: Processing methods of baobab fruit pulp for obtaining milletcream, syrup and juice
syrup (17 %), jam (11 %) and instant juice powder (6 %). Processors inBenin solely reported to make juice from baobab fruit pulp. Figure 4.20shows the processing of baobab fruit pulp into the tertiary products juice(or syrup) and millet cream. It should be noted that not all respondentswere willing to share their recipes for the preparation of tertiary baobabfruit products. For that reason, the processing method of baobab jamand instant juice powder could not be described in the present study.Moreover, processors were even less keen to share quantities of ingredientsused during processing. The processes described in Figure 4.20 are thusa generalisation of all processes mentioned by the processors in Mali andBenin.
As presented in Table 4.9, processors in Mali (n = 18) buy annually about347 kg baobab fruit pulp at a mean price of 560 FCFA / kg. In Benin,
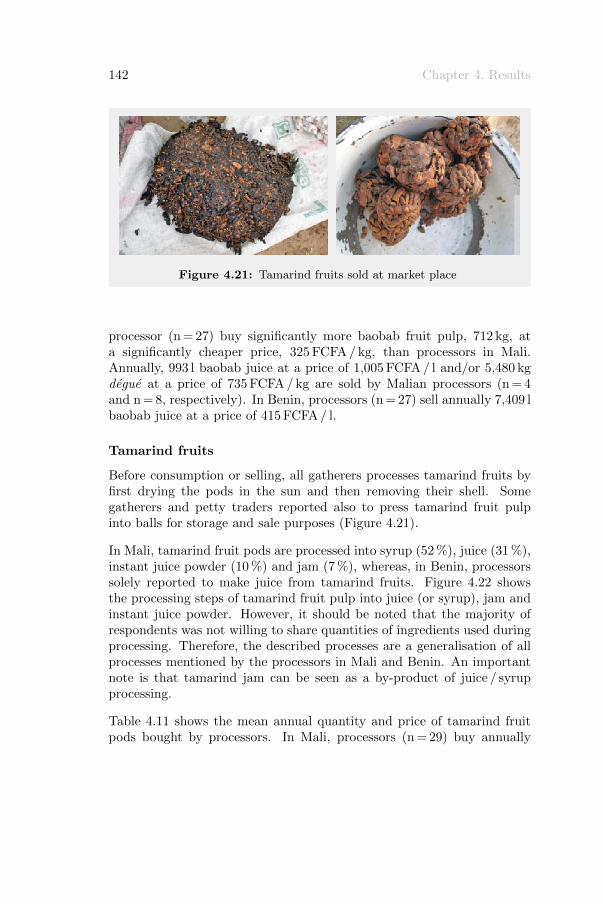
142 Chapter 4. Results
Figure 4.21: Tamarind fruits sold at market place
processor (n = 27) buy significantly more baobab fruit pulp, 712 kg, ata significantly cheaper price, 325 FCFA / kg, than processors in Mali.Annually, 993 l baobab juice at a price of 1,005 FCFA / l and/or 5,480 kgdegue at a price of 735 FCFA / kg are sold by Malian processors (n = 4and n = 8, respectively). In Benin, processors (n = 27) sell annually 7,409 lbaobab juice at a price of 415 FCFA / l.
Tamarind fruits
Before consumption or selling, all gatherers processes tamarind fruits byfirst drying the pods in the sun and then removing their shell. Somegatherers and petty traders reported also to press tamarind fruit pulpinto balls for storage and sale purposes (Figure 4.21).
In Mali, tamarind fruit pods are processed into syrup (52 %), juice (31 %),instant juice powder (10 %) and jam (7 %), whereas, in Benin, processorssolely reported to make juice from tamarind fruits. Figure 4.22 showsthe processing steps of tamarind fruit pulp into juice (or syrup), jam andinstant juice powder. However, it should be noted that the majority ofrespondents was not willing to share quantities of ingredients used duringprocessing. Therefore, the described processes are a generalisation of allprocesses mentioned by the processors in Mali and Benin. An importantnote is that tamarind jam can be seen as a by-product of juice / syrupprocessing.
Table 4.11 shows the mean annual quantity and price of tamarind fruitpods bought by processors. In Mali, processors (n = 29) buy annually

4.3. Market chain analysis 143
Figure 4.22: Processing method of tamarind fruit pulp into instant juicepowder, syrup, juice and jam
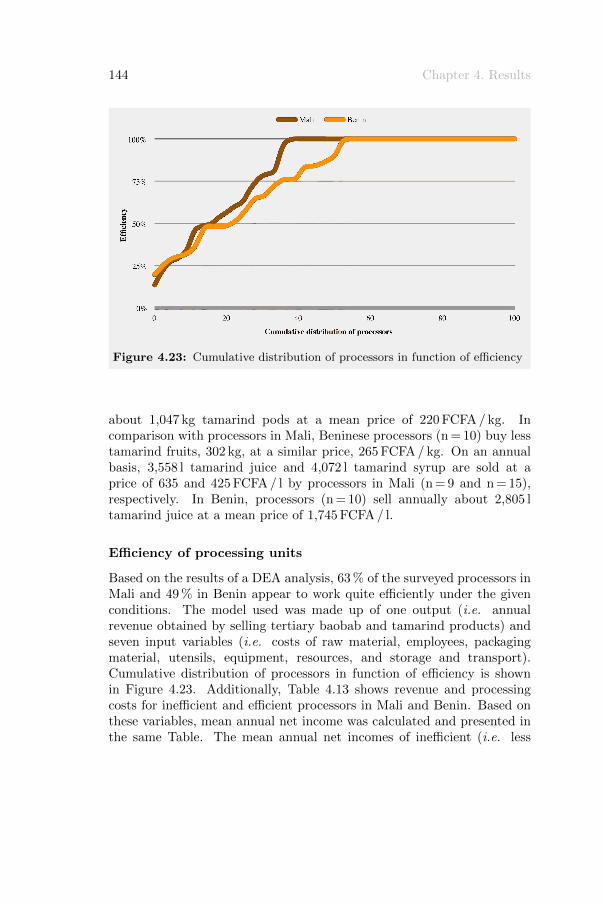
144 Chapter 4. Results
Figure 4.23: Cumulative distribution of processors in function of efficiency
about 1,047 kg tamarind pods at a mean price of 220 FCFA / kg. Incomparison with processors in Mali, Beninese processors (n = 10) buy lesstamarind fruits, 302 kg, at a similar price, 265 FCFA / kg. On an annualbasis, 3,558 l tamarind juice and 4,072 l tamarind syrup are sold at aprice of 635 and 425 FCFA / l by processors in Mali (n = 9 and n = 15),respectively. In Benin, processors (n = 10) sell annually about 2,805 ltamarind juice at a mean price of 1,745 FCFA / l.
Efficiency of processing units
Based on the results of a DEA analysis, 63 % of the surveyed processors inMali and 49 % in Benin appear to work quite efficiently under the givenconditions. The model used was made up of one output (i.e. annualrevenue obtained by selling tertiary baobab and tamarind products) andseven input variables (i.e. costs of raw material, employees, packagingmaterial, utensils, equipment, resources, and storage and transport).Cumulative distribution of processors in function of efficiency is shownin Figure 4.23. Additionally, Table 4.13 shows revenue and processingcosts for inefficient and efficient processors in Mali and Benin. Based onthese variables, mean annual net income was calculated and presented inthe same Table. The mean annual net incomes of inefficient (i.e. less
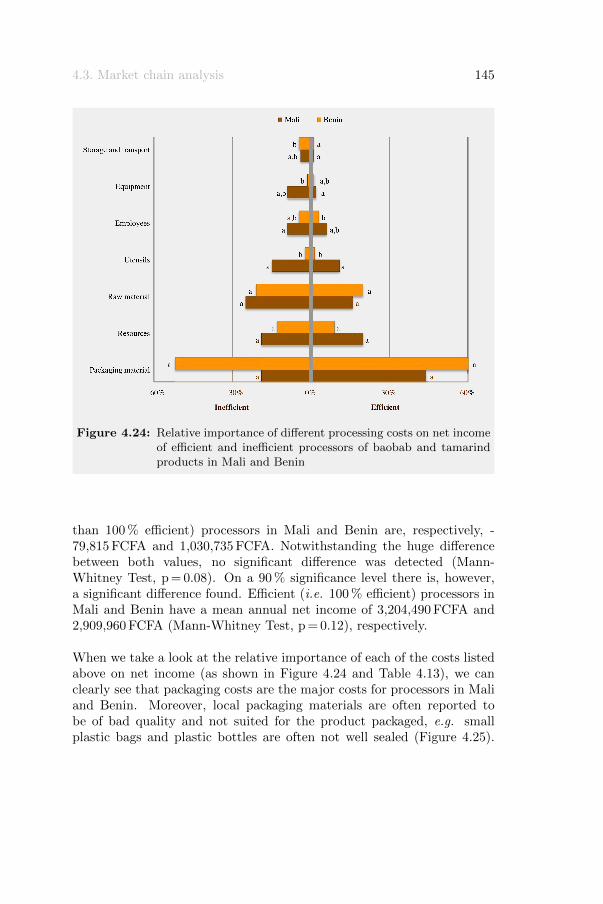
4.3. Market chain analysis 145
Figure 4.24: Relative importance of different processing costs on net incomeof efficient and inefficient processors of baobab and tamarindproducts in Mali and Benin
than 100 % efficient) processors in Mali and Benin are, respectively, -79,815 FCFA and 1,030,735 FCFA. Notwithstanding the huge differencebetween both values, no significant difference was detected (Mann-Whitney Test, p = 0.08). On a 90 % significance level there is, however,a significant difference found. Efficient (i.e. 100 % efficient) processors inMali and Benin have a mean annual net income of 3,204,490 FCFA and2,909,960 FCFA (Mann-Whitney Test, p = 0.12), respectively.
When we take a look at the relative importance of each of the costs listedabove on net income (as shown in Figure 4.24 and Table 4.13), we canclearly see that packaging costs are the major costs for processors in Maliand Benin. Moreover, local packaging materials are often reported tobe of bad quality and not suited for the product packaged, e.g. smallplastic bags and plastic bottles are often not well sealed (Figure 4.25).
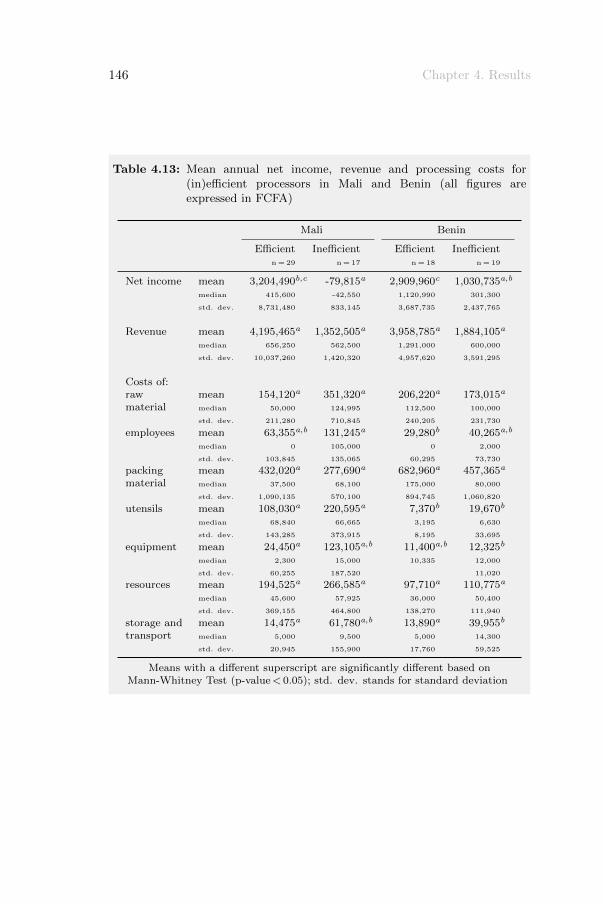
146 Chapter 4. Results
Table 4.13: Mean annual net income, revenue and processing costs for(in)efficient processors in Mali and Benin (all figures areexpressed in FCFA)
Mali Benin
Efficient Inefficient Efficient Inefficientn=29 n=17 n=18 n=19
Net income mean 3,204,490b,c -79,815a 2,909,960c 1,030,735a,b
median 415,600 -42,550 1,120,990 301,300
std. dev. 8,731,480 833,145 3,687,735 2,437,765
Revenue mean 4,195,465a 1,352,505a 3,958,785a 1,884,105a
median 656,250 562,500 1,291,000 600,000
std. dev. 10,037,260 1,420,320 4,957,620 3,591,295
Costs of:raw mean 154,120a 351,320a 206,220a 173,015a
material median 50,000 124,995 112,500 100,000
std. dev. 211,280 710,845 240,205 231,730
employees mean 63,355a,b 131,245a 29,280b 40,265a,b
median 0 105,000 0 2,000
std. dev. 103,845 135,065 60,295 73,730
packing mean 432,020a 277,690a 682,960a 457,365a
material median 37,500 68,100 175,000 80,000
std. dev. 1,090,135 570,100 894,745 1,060,820
utensils mean 108,030a 220,595a 7,370b 19,670b
median 68,840 66,665 3,195 6,630
std. dev. 143,285 373,915 8,195 33,695
equipment mean 24,450a 123,105a,b 11,400a,b 12,325b
median 2,300 15,000 10,335 12,000
std. dev. 60,255 187,520 11,020
resources mean 194,525a 266,585a 97,710a 110,775a
median 45,600 57,925 36,000 50,400
std. dev. 369,155 464,800 138,270 111,940
storage and mean 14,475a 61,780a,b 13,890a 39,955b
transport median 5,000 9,500 5,000 14,300
std. dev. 20,945 155,900 17,760 59,525
Means with a different superscript are significantly different based onMann-Whitney Test (p-value< 0.05); std. dev. stands for standard deviation
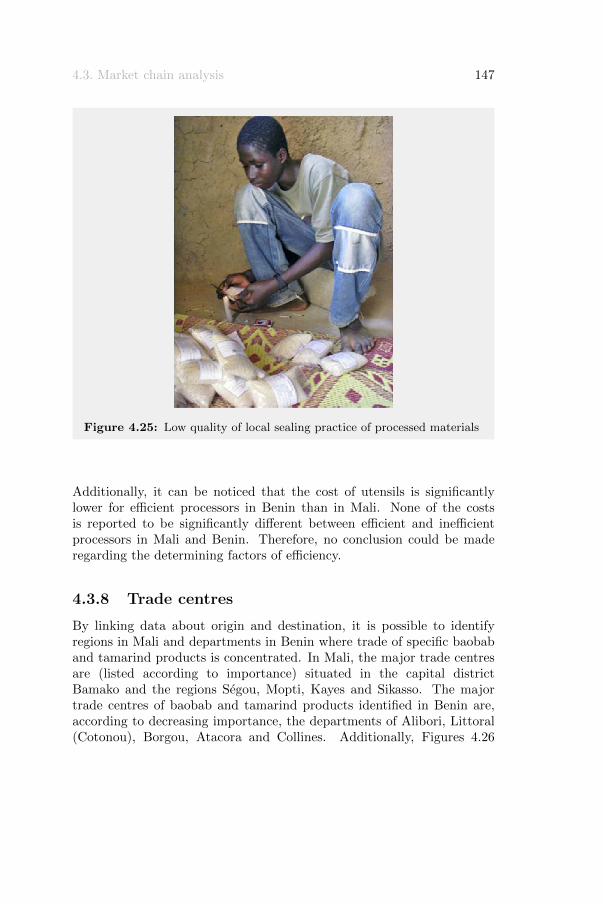
4.3. Market chain analysis 147
Figure 4.25: Low quality of local sealing practice of processed materials
Additionally, it can be noticed that the cost of utensils is significantlylower for efficient processors in Benin than in Mali. None of the costsis reported to be significantly different between efficient and inefficientprocessors in Mali and Benin. Therefore, no conclusion could be maderegarding the determining factors of efficiency.
4.3.8 Trade centres
By linking data about origin and destination, it is possible to identifyregions in Mali and departments in Benin where trade of specific baobaband tamarind products is concentrated. In Mali, the major trade centresare (listed according to importance) situated in the capital districtBamako and the regions Segou, Mopti, Kayes and Sikasso. The majortrade centres of baobab and tamarind products identified in Benin are,according to decreasing importance, the departments of Alibori, Littoral(Cotonou), Borgou, Atacora and Collines. Additionally, Figures 4.26

148 Chapter 4. Results
Figure 4.26: Trade centres of baobab leaf powder, baobab fruit pulp andtamarind fruit pods in Mali (note: the axes in the radar chartrepresent percentage of product traded in given region)
and 4.27 shows the trade centres per main traded baobab and tamarindproduct.
Baobab leaf powder Baobab leaf powder has both in Mali and Benina marked trade centre, namely the region of Segou in Mali and thedepartment Borgou in Benin, respectively.
Baobab fruit pulp The trade centre of baobab fruit pulp in Mali issituated in the capital district Bamako. Additionally, the regions of Kayesand Mopti are also important for trade of baobab fruit pulp. In Benin,the main trade centre of baobab fruit pulp is situated in the departmentCollines, whereas also Cotonou, in the department Littoral, plays a majorrole in trading baobab pulp.
Tamarind fruit pods In Mali, tamarind fruit pods are mainly sold inSikasso. However, the regions of Kayes and Mopti may not be neglectedas trade centres for tamarind fruits. The most important trade centre inBenin is found to be the department of Atacora and to a lesser degree also

4.3. Market chain analysis 149
Figure 4.27: Trade centres of baobab leaf powder, baobab fruit pulp andtamarind fruit pods in Benin (note: the axes in the radar chartrepresent percentage of product traded in given department)
the Alibori department. In Mali and Benin, traded baobab and tamarindproducts are by wholesalers reported to be mainly and respectively fromMalian and Beninese origin. Nevertheless, a small portion of the productsin Mali and Benin are reported to be from Burkinabe origin, whichis particularly the case for tamarind fruit pods and baobab fruit pulp.In Mali, also export of baobab and tamarind products to Senegal andMauritania is reported, whereas, in Benin, some traders reported to exportbaobab fruit pulp to Niger and Nigeria.
Curiously, only a few consumers in the present study are interested in theorigin of products. About two thirds of Malian consumers is not at allinterested in the origin of the purchased products, while one third statedto be interested in the origin (mean score of 1.99 on a 5-point scale with1 = not at all interested and 5 = very interested). In Benin, consumers aregenerally only limitedly interested in the origin of these products (2.53 ona 5-point scale). The interest in origin is significantly different betweenboth countries (Mann-Whitney Test, p< 0.01). In addition, consumerswho are interested in the origin of the products are convinced that the

150 Chapter 4. Results
origin determines the quality of the latter products.
4.3.9 Quality criteria
In Figure 4.28, quality criteria adopted by surveyed chain actors areshown per baobab or tamarind product. However, in the present study, itshould be noted that traders surveyed in the present study trade in non-standardised products, and direct inspection is the only reported methodby which quality is assessed. Hereafter, quality criteria used by differentchain actors are discussed for each baobab and tamarind product.
Baobab fruit pulp All chain actors in Mali and Benin attach greatimportance to processing and storage techniques, so that a dry and finepowder without impurities is obtained. Moreover, in Mali, all chain actorsuse colour as an important quality parameter, whereas in Benin taste isadopted as criterion – with the exception of consumers, who use colour asparameter.
Fresh baobab leaves In Benin, gatherers consider the absence ofinsect lesions on the leaves, maturity, freshness, size, and processingand storage techniques important to judge the quality of fresh baobableaves. Petty traders in Mali use processing and storage techniques as themain quality parameter for fresh baobab leaves, whereas consumers adoptseveral criteria. When consumers in Mali and Benin are compared, it isobvious that Beninese consumers attach greater importance to absence ofinsects and product freshness than Malian consumers.
Dry baobab leaves In Mali, gatherers, petty traders and consumersadopt a number of quality criteria to distinguish good and bad quality ofdry baobab leaves. Colour, and processing and storage techniques are themain parameters to assess quality of dry baobab leaves.
Baobab leaf powder For baobab leaf powder, Figure 4.28 showsclearly that chain actors in Mali use colour as an important qualitycriterion, whereas in Benin processing and storage techniques are ofprimary importance.
Tamarind fruit pods Important quality criteria for tamarind pods areprocessing and storage techniques, absence of insects, maturity, freshness
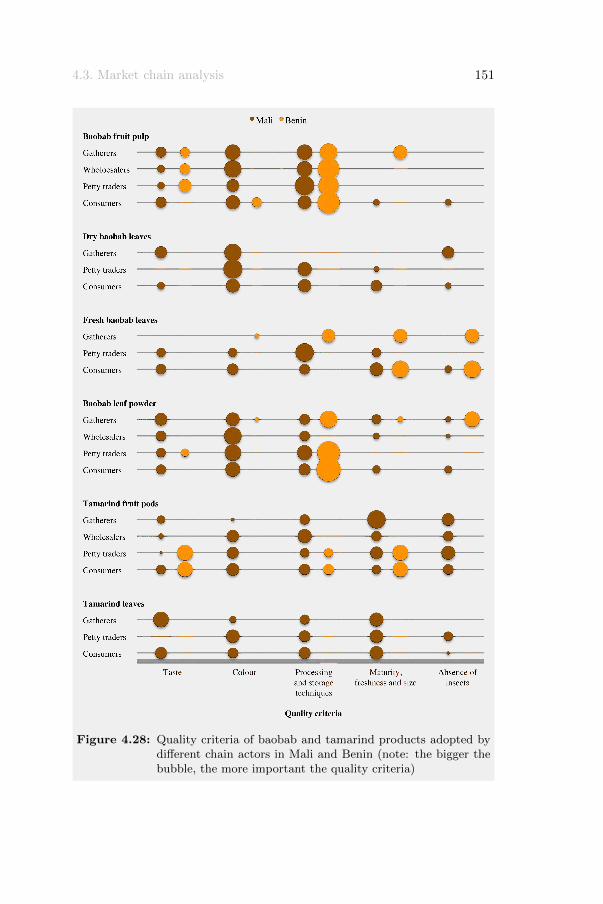
4.3. Market chain analysis 151
Figure 4.28: Quality criteria of baobab and tamarind products adopted bydifferent chain actors in Mali and Benin (note: the bigger thebubble, the more important the quality criteria)
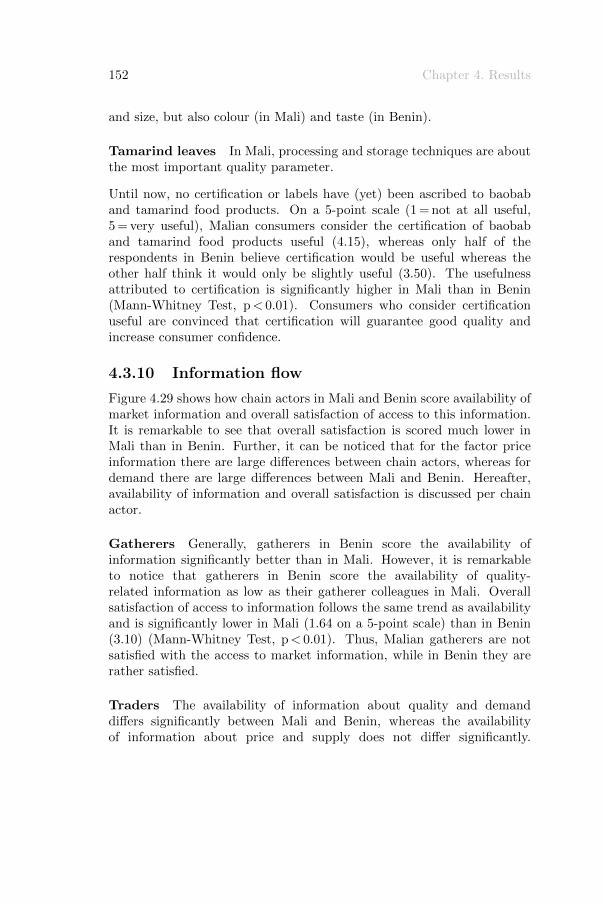
152 Chapter 4. Results
and size, but also colour (in Mali) and taste (in Benin).
Tamarind leaves In Mali, processing and storage techniques are aboutthe most important quality parameter.
Until now, no certification or labels have (yet) been ascribed to baobaband tamarind food products. On a 5-point scale (1 = not at all useful,5 = very useful), Malian consumers consider the certification of baobaband tamarind food products useful (4.15), whereas only half of therespondents in Benin believe certification would be useful whereas theother half think it would only be slightly useful (3.50). The usefulnessattributed to certification is significantly higher in Mali than in Benin(Mann-Whitney Test, p< 0.01). Consumers who consider certificationuseful are convinced that certification will guarantee good quality andincrease consumer confidence.
4.3.10 Information flow
Figure 4.29 shows how chain actors in Mali and Benin score availability ofmarket information and overall satisfaction of access to this information.It is remarkable to see that overall satisfaction is scored much lower inMali than in Benin. Further, it can be noticed that for the factor priceinformation there are large differences between chain actors, whereas fordemand there are large differences between Mali and Benin. Hereafter,availability of information and overall satisfaction is discussed per chainactor.
Gatherers Generally, gatherers in Benin score the availability ofinformation significantly better than in Mali. However, it is remarkableto notice that gatherers in Benin score the availability of quality-related information as low as their gatherer colleagues in Mali. Overallsatisfaction of access to information follows the same trend as availabilityand is significantly lower in Mali (1.64 on a 5-point scale) than in Benin(3.10) (Mann-Whitney Test, p< 0.01). Thus, Malian gatherers are notsatisfied with the access to market information, while in Benin they arerather satisfied.
Traders The availability of information about quality and demanddiffers significantly between Mali and Benin, whereas the availabilityof information about price and supply does not differ significantly.
4.3. Market chain analysis 153
Figure 4.29: Availability of information and overall satisfaction of accessto information according to different chain actors in Mali andBenin
154 Chapter 4. Results
In comparison to wholesalers in Mali, Beninese wholesalers scorethe availability of information about quality and demand respectivelysignificantly lower and higher. In addition, it is remarkable that there is afair degree of dispersion in the scores of individual Malian wholesalers. Bycontrast, in Benin, wholesalers are rather unanimous about the availabilityof information. Overall satisfaction of access to information is comparableand thus not significantly different in Mali and Benin (respectively 2.89and 3.72 on a 5-point scale) (Mann-Whitney Test, p = 0.11).
Processors In comparison to processors in Mali, Beninese processorsscore the availability of information about quality and demandsignificantly lower and higher, respectively. The availability of informationabout price, supply and processing techniques does not differ significantlybetween both countries. Overall satisfaction of access to information issignificantly higher in Benin than in Mali (respectively 3.44 and 2.04on a 5-point scale) (Mann-Whitney Test, p< 0.01). Additionally, inMali, many processors (82 %) stated to be willing to pay for information,whereas, in Benin, only 38 % of respondents reported to be willing topay for market information. On average, processors in both countries arewilling to pay annually about 2,000 FCFA.
4.3.11 Problems
Each chain actor in Mali and Benin has been informally asked to identifythe problems encountered regarding the commercialisation of baobaband tamarind products. Table 4.14 shows the compiled results for bothcountries as no country specific problems were recorded. Lack of marketinformation is a common problem for all actors, and none of the traderswas well informed about the conditions that need to be fulfilled to accessthe market. Based on the latter, the author assumes that most baobaband tamarind products are traded on the informal market in Mali andBenin.
Gatherers Gatherers mention as harvesting problems the risk ofaccidents while climbing trees, the long distance between the trees andtheir home to carry the produce, and the itchy and irritating hairs thatcover baobab fruits. Some gatherers mentioned also a limited number ofbaobab and tamarind trees in their region which causes a low availabilityof fruits and leaves. The seasonality of most baobab and tamarind
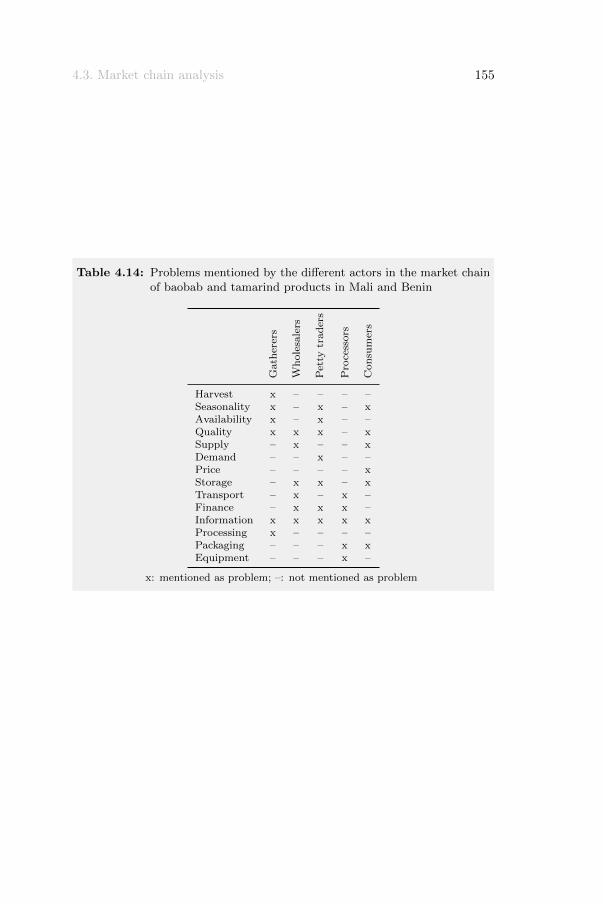
4.3. Market chain analysis 155
Table 4.14: Problems mentioned by the different actors in the market chainof baobab and tamarind products in Mali and Benin
Gath
erer
s
Wh
ole
sale
rs
Pet
tytr
ad
ers
Pro
cess
ors
Con
sum
ers
Harvest x – – – –Seasonality x – x – xAvailability x – x – –Quality x x x – xSupply – x – – xDemand – – x – –Price – – – – xStorage – x x – xTransport – x – x –Finance – x x x –Information x x x x xProcessing x – – – –Packaging – – – x xEquipment – – – x –
x: mentioned as problem; –: not mentioned as problem

156 Chapter 4. Results
products influences the availability too. Furthermore, fruits and leavesare sometimes attacked by insects which influences the product quality.Processing is generally seen as a time-consuming task and drying ofparticularly baobab leaves is considered difficult as it mostly takes placeduring the rainy season.
Traders Wholesalers identify product quality as a major problem asbaobab and tamarind products are not graded. Storage space is oftenlimited, which may hamper the supply further down the market chain,thus towards the end users. Transport is severely hampered due topoor roads and lack of infrastructure, which raises the costs and risksof transport. Moreover, there is no access to formal financial servicessuch as loans and insurance. Petty traders face problems due to theseasonality and thus availability of products. Also varying quality isseen as a constraint in the marketing of baobab and tamarind products.Furthermore, petty traders have no access to financial services, havelimited storage possibilities and complain about a lack of demand.
Processors Processors of baobab and tamarind products mention badtransport and lack of financial means as constraints. In addition, theyhave limited equipment and difficulties to find appropriate packagingmaterials. Additionally, printing of labels is very expensive.
Consumers Consumers complain about limited supply and high pricesdue to the seasonality of the products. Quality is mostly judged asunreliable, as good and bad quality products are mixed. Packagingmaterials are considered to be inappropriate which may limit storage life.

5Discussion and recommendations
158 Chapter 5. Discussion and recommendations
In this chapter the results are discussed and confronted with findings ofother authors. Subsequently, a SWOT and impact analysis of marketchains of baobab and tamarind products in Mali and Benin are presented.To conclude, possible scenarios for intervention are formulated andsubstantiated with references on how to add more value to baobab andtamarind products and how to improve the organisation of their marketchains.
5.1 Discussion of results
5.1.1 Chain actors and activities
Whenever a product moves along a market chain, i.e. from production orgathering to final use or consumption, various stakeholders are involved.These actors have different functions – such as gathering, collecting,processing, storing, packaging, marketing and selling of the products –and add value to the product at each stage in the chain. Each actor thusplays a role that is important in the successful commercialisation of theproduct, and each actor has different incentives and abilities to influencethe chain (Marshall et al., 2006a).
Gatherers and harvesting practices
According to Davis (2006), small-scale farmers derive their livelihoodsfrom a holding smaller than 5 ha and around 10 to 20 heads of livestock.Moreover, smallholders practice a mix of commercial and subsistenceproduction (in crops or livestock), whereby the family provides themajority of labour and the farm provides the principle source of income.Based on this broad definition, the surveyed households in Mali andBenin can be categorised as smallholders. Because individual gatherersof baobab and tamarind products in Mali and Benin are part of a familyor household, households were incorporated as a unit of analysis in thepresent study.
Household activities Informal interviews and observation in thepresent study showed that, irrespective of the primary reasons for cattleand livestock ownership – such as ploughing, milk and/or savings –, mostsurveyed households derive not just one, but a number of different goodsand services from their livestock, especially from small stock. This has
5.1. Discussion of results 159
also been confirmed by Dovie et al. (2006) who added that, for cattle,the largest contributors to the total gross value were savings, milk andmanure. Goats provide less goods and services, with savings, meat andcash sales being the main benefits (Dovie et al., 2006).
Four out of the five most cultivated crops by the informants in Maliand Benin are staple food crops, which are prepares into gruels and/orthick porridges for daily consumption. The FAO defines a staple foodas one that is eaten regularly and in such quantities as to constitutethe dominant part of the diet and supply a major proportion of energyand nutrient needs (Loftas, 1995). However, FAO adds that in order tomeet a population’s total nutritional needs, a variety of foods is required.In Mali, cereal crops, such as millet, sorghum, maize, rice and fonio,constitute the main component of each meal and are accompanied byor alternated with cowpea, groundnut and/or voandzou (FAO, 1999a).The main components of daily meals in Benin are cassava, yam, maize,millet, sorghum and rice (FAO, 2003). The legume Arachis hypogaea(groundnut or peanut) is cultivated mainly by small-scale farmers bothas a subsistence and cash crop (Stoate & Jarju, 2008; ICRISAT, 2010).Groundnuts are often used as a snack or in sauce and stew preparationin SSA, and can also be processed into a nutritious and commonly usededible oil, which makes it an important ingredient of the local diet.
The annual cash income per household obtained from AFTPs otherthan baobab and tamarind – i.e. mainly shea and African locust beantree products – ranges between 10,000 and 100,000 FCFA in Mali and25,000 and 100,000 FCFA in Benin, with as mean values respectively42,775 and 53,520 FCFA. These values seem higher as those reported bySchreckenberg (2004). In 1993, the latter author found that the annualcash income obtained solely from shea kernel sales varied from 2,000 to10,000 FCFA in Benin. This difference might be explained by, on the onehand, the sharp devaluation of the CFA franc in the period 1994-1998that doubled prices in order to help stimulating African exports (van denBoogaerde & Tsangarides, 2005), and, on the other hand, annual inflationrates.
Household cash income In Mali, the portion of cash income obtainedfrom baobab and tamarind products is about 4 % for the poorest and5 % for the richer households, whereas, in Benin, contributions of upto 11 % are reported for the poorest smallholders. As the results in
160 Chapter 5. Discussion and recommendations
the present study show that poor households – particularly in Benin –earn a relatively high proportion of their cash income from baobab andtamarind, interventions in these two products have a high potential toimprove livelihoods of the poor. However, in a similar study, Ambrose-Oji (2003) found that the middle income groups derive the greatest benefitfrom NTFP collection, use and sale. The lower contribution of cashincome obtained from baobab and tamarind products in Mali can possiblybe explained by the fact that home consumption of these products isreported to be more important than in Benin. Moreover, Fandohan et al.(2010a) reported contributions to cash income ranging from 8.76 % to56.40 % for tamarind fruits by several ethnic groups in Benin. Theseresults indicate that the potential baobab and tamarind products haveto contribute to household cash income might be underestimated in thepresent study. However, our results show that baobab and tamarind cashincome is considered additional to the cash income derived from sellingcrops. Therefore, it can be said that baobab and tamarind products – aswell as other AFTPs – fall into the so-called gap-filling income category(Marshall et al., 2006b). This means that even products contributing arelatively small share of a households total income may be perceived toplay a valuable role in a household’s livelihood strategy. The major reasonthat even small amounts of income derived from NTPFs can becomeimportant is that they may come at times of the year when householdshave no other income generating activities. Therefore, income from mostNTFP activities is often complementary to the highly seasonal incomefrom agricultural activities, providing the household with a combinedincome flow (Marshall et al., 2006b), which has been confirmed in thepresent study.
Gatherers of baobab and tamarind products Due to thepatriarchal society organisation in Mali and Benin, more men than womenhave been asked about their harvesting practices of baobab and tamarindproducts. Notwithstanding this gender inequality, the author believesthat this had no significant influence on the results of the study. AlsoVogl et al. (2009), Buchmann et al. (2010) and van der Stege et al. (2011)reported that the majority of respondents in their ethnobotanical surveysdid not identify any specific gender issue related with gathering and/orharvesting baobab and tamarind products.
In the present study, the majority of gatherers in Mali reported to harvestbaobab and tamarind food products chiefly for their own consumption,

5.1. Discussion of results 161
whereas in Benin only a limited percentage of the produce seems to be usedfor home consumption. Similarly, Akinnifesi et al. (2008a) reported that,in the Miombo woodlands of southern Africa, more than half of baobabfruits harvested were often retained for home consumption. However, ingeneral and after satisfying household consumption needs, gatherers ofbaobab and tamarind products in Mali and Benin reported to sell theirsurplus products directly to consumers or to middlemen at the farmgate,which is also known as on-farm sales, or on the local market. Thisconfirms the findings of Agea et al. (2005) and Fafchamps & Hill (2005).The latter authors stated that most farmers in SSA produce on a smallscale and are geographically isolated – and thus often outside the reachof formal market institutions. Although farmgate selling appears to beless remunerative, it may be the only alternative open to smallholderswho cannot afford carrying their products to the market, which is usuallylocated at many kilometres from the homestead. When deciding whetherto sell at the farmgate or to travel to the nearest market, a farmer mustthus choose between receiving a lower price on-farm, or receiving a higherprice but incurring transaction costs (Fafchamps & Hill, 2005). The latterauthors found that the likelihood of selling at the marketplace increaseswith quantity sold and proximity to the market. In addition to the twoearlier mentioned marketing channels, namely on-farm sales and selling ata marketplace, which are reported to be used by the surveyed gatherersof baobab and tamarind products in Mali and Benin, a third channel hasbeen recorded. Indeed, in Benin, some surveyed gatherers reported to selltheir produce via collecting gatherers which is a form of group marketing.
Harvesting techniques There are many different fruit harvestingtechniques observed and recorded, such as shaking branches, using sticksto knock the fruits to the ground, throwing objects to dislodge fruit andclimbing up trees. These traditional harvesting methods, together withpicking fruit up from the ground once they have fallen, have also beenreported in literature (Hughes & Haq, 2003; Dhillion & Gustad, 2004;Assogbadjo, 2006; Kadzere et al., 2006; Akinnifesi et al., 2008a; Hamet al., 2008; Haq et al., 2008; Wickens & Lowe, 2008; Kalaba et al., 2009;Vogl et al., 2009). Also the use of a dole or coupe-coupe (machete) toharvest fruits as observed in the present study has been confirmed byseveral authors (Dhillion & Gustad, 2004; Assogbadjo, 2006; Vogl et al.,2009).
Similarly to the practice of baobab leaf harvesting reported in Mali in the

162 Chapter 5. Discussion and recommendations
present study, Sidibe et al. (1998b) and Dhillion & Gustad (2004) recordedthat fresh baobab leaves are on a regular basis harvested in the courseof the wet season, whereas, during the last month of the rainy season,leaves are harvested in great quantities, dried and stored for domestic useand/or for selling during the dry season. Baobab and tamarind leavesare reported to be harvested by either climbing in trees or not. In thefirst case, leaves are picked by hand or else whole branches are cut usingsickles or axes. In the latter case, branches are cut by using a dole orcoup-coup as tool. The same harvesting techniques for leaves and the useof both tools have been reported by Dhillion & Gustad (2004), Assogbadjo(2006), Vogl et al. (2009), Buchmann et al. (2010), van der Stege (2010)and van der Stege et al. (2011). As complete branches are often cut inorder to harvest baobab leaves, Buchmann et al. (2010) reported thatsuch technique reduces the number of flower buds, and consequently fruitnumbers. This phenomenon has been observed during field work and mayresult in a strange picture of a baobab tree, which bears only fruits in thehighest parts of the crown where people cannot reach (Figure 5.1).
Generally, local harvesting of fruits and leaves of both baobab andtamarind in Mali and Benin is carried out in a non-destructive wayusing manual labour and low-cost tools. The latter has been confirmedby Buchmann et al. (2010) who reported that traditional harvestingrequires virtually no cash investment, as equipment is generally confinedto inexpensive hand tools. In addition, Schreckenberg (1999) and Belcher& Schreckenberg (2007) stated that harvesting of fruits, seeds or leaves oflong-lived species is generally managed in a sustainable way. Harvesting offruits and leaves can be difficult according to gatherers in Mali and Beninas climbing can sometimes cause accidents, due to the trees’ height, or tearone’s clothes. Although traditional harvesting methods have often beenreported to result in heavy losses in quantity (Hughes & Haq, 2003; Haqet al., 2008), this was not confirmed in this study. In addition, Odetokun(1996) and Tiisekwa et al. (2005) mentioned that a lot of fruits remainuncollected and therefore left to rot. Despite their high nutritional valueand taste, more than 92 % of baobab fruits remain unprocessed in Nigeriaeach year (Odetokun, 1996).
Traders and trading practices
Due to a lack of functional specialisation observed during field research,traders of baobab and tamarind products in Mali and Benin were found
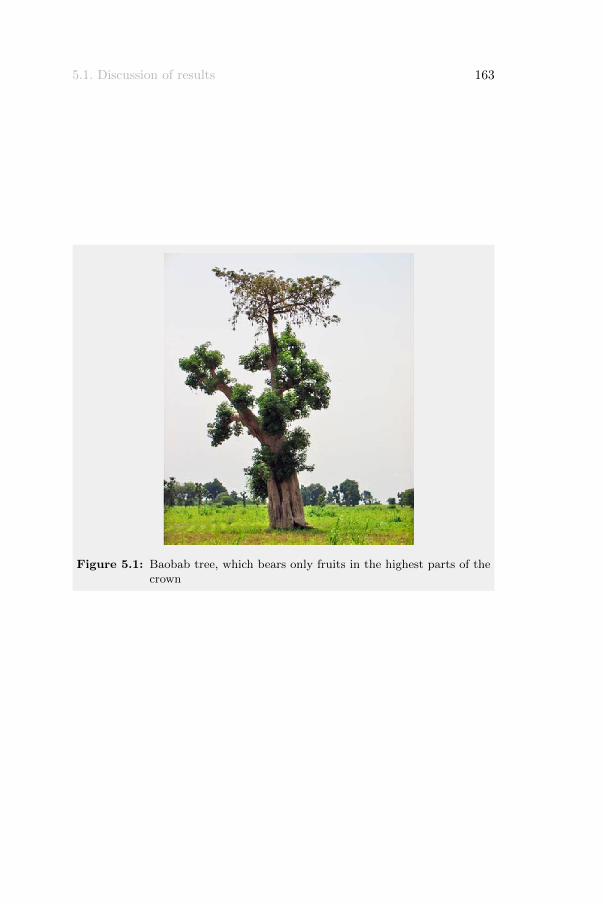
5.1. Discussion of results 163
Figure 5.1: Baobab tree, which bears only fruits in the highest parts of thecrown
164 Chapter 5. Discussion and recommendations
to have different and varying functions, such as collecting, transporting,distributing and selling. Moreover, observation showed that manycollectors and assemblers were at the same time also wholesalers orretailers of the same products, whereas some traders were simultaneouslywholesalers for some products and retailers for other products. Thisfinding justifies the arbitrary distinction that has been made betweenon the one hand ‘wholesalers’ – including collectors and assemblers,wholesalers and large retailers – and on the other ‘petty traders’ –regrouping all small-scale retailers (see methodology). Additionally, it isworth mentioning that traders are not specialised in baobab and tamarindproducts (or other AFTPs), and thus sell a great variety of products.
Traders of baobab and tamarind products are found to be mostly women.This confirms earlier findings by Ndoye et al. (1998) and Ahenkan &Boon (2010). The first authors suggest that the main reason that NTFPsare generally traded by women, may be attributed to the fact thatNTFP trade is traditionally considered a marginal activity. Furthermore,Fafchamps & Gabre-Madhin (2001) stated that the fact that womendominate trade in Benin, reflects a long tradition of female involvement intrade along the West African coast. Other authors reported that womendominate the retail trade, while men concentrate on wholesale (Awonoet al., 2002; Marshall et al., 2006b; Akinnifesi et al., 2008a). Women’sinvolvement in trade activities depends usually on whether or not theactivity takes place far from the community, as distance tends to presentan obstacle to women. In contrast, men tend to be involved in decision-making and income generating activities (Marshall et al., 2006b).
Previous research about food crop traders in Benin by Fafchamps &Gabre-Madhin (2001) confirmed that, apart from the trader him/herself,surveyed enterprises did not employ a lot of manpower. Average totalmanpower of surveyed firms was two individuals, with most employeesbeing family members. Wages paid were very low and the majorityof family workers received no wage. Non-family workers nearly alwaysreceived a wage and remuneration level was around 4,200 FCFA per month(Fafchamps & Gabre-Madhin, 2001). This figure is lower than the in thepresent study reported monthly wages of permanent employees rangingbetween 10,000 and 30,000 FCFA. This increase in wages is most likelyassociated with inflation.
Prices of baobab and tamarind products were found to depend mainlyon supply, demand and transport conditions. Supply is determined by
5.1. Discussion of results 165
amount of product gathered as well as quantity stored, whereas demandis determined by the quantities traders are willing and able to purchase.The process of price setting between seller and buyer involves bargainingto reach an equilibrium price somewhere between the lowest price theseller is willing to accept and the highest price the buyer is willing topay (Ndoye et al., 1998). The latter authors added that the bargainingpower of sellers and buyers depends primarily on whether sellers bringthe products to the market or whether buyers buy the produce at thefarmgate. For products sold at the market, the bargaining power of sellersdepends on the type of products they are selling, the quantity of theseproducts available at the market, their own financial needs, the numberof traders present at the market, prices that prevailed during previousmarket days, the number of farmers selling these products, and overalltransparency of the market (Ndoye et al., 1998). In the other case, thebargaining power of buyers depends to a large extent on the prevailingprices in urban and/or border markets (i.e. expected prices), the quantityof these products available at the market, the number of traders present atthe market, and the actual marketing costs and expected margins (Ndoyeet al., 1998). When this theory is applied to the findings in the presentstudy, the following price setting processes can be detected. Two thirds ofthe traders in Mali and one third in Benin agree that price setting is doneby fair negotiation between buyers and sellers. The rest of the traders inMali, together with another third of the traders in Benin, believe that thebuyers, i.e. wholesalers, have more influence on the price than the sellers,which is probably the case for on-farm sales. Finally, about one third ofthe traders in Benin are convinced that sellers, i.e. gatherers, have moreinfluence in price setting of baobab and tamarind products than buyers.The latter case can possibly be related to the fact that, in Benin, somegatherers reported to sell their produce to collecting gatherers, who thensell large quantities to wholesalers.
The price determining factors recorded in this research for wholesalers aresupply, demand, transport, profit and seasonality, whereas petty tradersreported – in addition to the aforementioned factors – also quality, buyingprice, availability and price of substitution products. Most of these pricedetermining factors have also been found by other authors. Lamien &Traore (2003) reported availability, buying price and transport as majorprice determining factors. Others reported that prices vary with timeof the season (availability) and location (Lamien et al., 1996; Akinnifesiet al., 2005). Generally, higher prices are observed in the beginning and
166 Chapter 5. Discussion and recommendations
at the end of the fruiting season. As is to be expected, prices also increaseconsiderably as the specific market outlet moves from rural areas to semi-urban and urban areas (Akinnifesi et al., 2005).
Processors and processing practices
The present study confirmed that, in Mali and Benin, many local peoplehave traditional ways of processing baobab and tamarind products forauto-consumption, marketing and preservation (Assogbadjo et al., 2006a).Processors are generally involved in secondary processing, whereasgatherers apply primary processing techniques. Although unprocessedfruits and fresh leaves are directly marketable, value is generally addedthrough processing and packaging. This has been confirmed in the presentstudy for the processing of fresh baobab leaves into dry baobab leaves ofbaobab leaf powder in Mali, as prices increased from 80-90 FCFA / kg forfresh leaves to 95-310 FCFA / kg for dry leaves or 90-320 FCFA / kg forleaf powder. Processed products, such as dried leaf powder and fruit pulppowder are sold on local and regional markets in West Africa (Sidibe &Williams, 2002; Chadare et al., 2008). Petty traders usually pack smallquantities – convenient to consumers – of their products up in small plasticbags for sales purposes.
Gatherers transform fresh baobab leaves into dry baobab leaves and/orbaobab leaf powder, baobab fruits are processed into baobab fruit pulp,tamarind leaves are dried, and tamarind fruit pods are stripped fromtheir shell. Drying of food products is commonly practised in Africa tomake the products more durable and in order to preserve them for foodinsecure periods (Hell et al., 2009). However, during processing, productscan become infected with fungi and other contaminants. According to Hellet al. (2009), high fungal levels were recorded in ground baobab leaves, themost prevalent fungi being Aspergillus spp. Crushing has been identifiedby the same authors as the step, in the processing method of makingdry leaf powder, that can lead to a higher risk of fungal contamination,i.e. the critical control point. Additionally, it should be noted that theleaves are typically sun-dried which is reported to be unfavourable tomaintain vitamin A levels. As mentioned in the literature review, thesimple practice of drying leaves in the shade doubles the provitamin Acontent of the leaf powder (Sidibe et al., 1996, 1998b; Scheuring et al.,1999).
In some cases, gatherers and petty traders press tamarind fruit pulp
5.1. Discussion of results 167
into balls for storage and sales purposes. In the present study, about20 % of Malian petty traders reported to sell mainly tamarind fruit balls.The latter has also been reported by Fandohan (2007) and Vogl et al.(2009). The most common process of making tamarind balls observed andrecorded in this study has been described by Fandohan (2007). Dehuskedpods are placed in the sun and wetted every now and then. After sometime the fruits are pressed into balls and dried thoroughly in order topreserve them well. Tamarind balls are always sold for a fixed price(generally 25 or 50 FCFA per ball), but their size, and consequentlyweight, vary between seasons, and range between 80 and 250 g in Mali.When tamarind fruits are well-available during the dry season balls willbe big, whereas during the rainy season when tamarind fruits are notavailable, balls will be small. Similarly, Schreckenberg (2004) reportedthe same for shea butter pats in Benin. These butter pats are always soldat 25 FCFA, but their weight varies from 110 g just before harvest periodto 266 g a few months later.
Some processors reported to add boiling water to baobab fruit pulp whenmaking juice or syrup. This traditional practice is, however, reportedto decreases the level of vitamin C. To maintain vitamin C content,Sidibe et al. (1996) recommend not to boil baobab fruit pulp during foodpreparation. It is thus advisable to add pulp to drinks while they are coldor to hot drinks after they have been removed from the heat source.
In the present study, all processors reported manual processing techniquesfor baobab and tamarind fruits. The processing of primary productsinto secondary, such as pulp and leaf powder, faces several problems.It requires several repetitions of crushing (with mortar and pestle) andsieving to remove impurities, fibres and/or seeds. Besides contaminationrisks (Hell et al., 2009), these operations are made difficult by air currentsthat take away part of the product (Chadare et al., 2008). Baobab FruitCompany in Senegal (BFCS, 2011) developed a mechanical process forpulp extraction. Extension of this mechanical process may be beneficial, ifadapted to local realities; otherwise, it would be interesting to investigatehow this operation can best be improved for rural local populations(Chadare et al., 2008). Additionally, Kazembe-Phiri (2005) reportedthe development of two simple hand-operated fruit juice extractors.A horizontal and vertical extractor were developed to increase fruitutilization and minimize post-harvest losses in Malawi.
Notwithstanding the manual processing techniques and simplicity of
168 Chapter 5. Discussion and recommendations
equipment used, the number of efficient processors found in both countriesis rather high. A first possible explanation is that processors are efficientunder the given circumstances in Mali and Benin. Secondly, this canprobably be explained by the fact that many technical efficiencies arepossible due to several input variables used in the DEA model, which wasmade up of one output and seven input variables. In addition, Jordaanet al. (2008) documented, based on a feasibility analysis, that benefits ofsmall-scale indigenous fruit processing enterprises in southern Africa arepotentially significant in terms of improved livelihoods. Also Kazembe-Phiri (2005) found that it is possible and remunerative to extract fruitjuice for small-scale fruit juice production under both rural and urbanconditions. The present study has not been able to reveal the explanationbehind being efficient or not as none of the (major) processing costs diddiffer significantly between efficient and inefficient processors.
Cost of packaging material is found to be the highest cost that processorsin Mali and Benin face. Handling costs, including the cost of packagingmaterial, were reported elsewhere to represent 20-30 % of the marketingmargin of processors (Fafchamps & Gabre-Madhin, 2001; Gabre-Madhin,2001; Fafchamps, 2004; Shepherd, 2007). Also, Abeyrathne & Jaenicke(2006) mentioned that the cost of packaging materials was one of themajor bottlenecks that small-scale processors are facing. Moreover, asshown in the results of the present study and reported earlier by Chadareet al. (2008) packaging techniques are very poor and thus need to bestudied and improved to increase shelf life of products. Next to packaging,other constraints reported by processors of baobab and tamarind productsin Mali and Benin are a lack of equipment or infrastructure, transport,finances, and information about processing techniques and marketingpossibilities. Ham et al. (2008) added difficulties in provision of rawmaterials, a lack of training in processing practices, insufficient legislation,and limited storage space as constraints for processors.
Consumers and uses
In West Africa, fruits and leaves of baobab trees are consumed daily andall year round (Lamien et al., 1996; Mertz et al., 2001; Lykke et al., 2002;Assogbadjo et al., 2008; Maranz et al., 2008; Buchmann et al., 2010).Baobab fruit pulp is mainly used in porridges and/or juices, whereas leaves– eaten fresh in the rainy season and dried for consumption during thedry season – are used in sauce preparations. Dhillion & Gustad (2004)

5.1. Discussion of results 169
estimated that 11.1 g of baobab dried leaf powder is daily consumed inWest Africa per person. On a larger scale, several thousands of tons ofbaobab leaves are consumed in the Sahel per year (Gebauer, 2003). Inaddition, leaf and fruit products of the tamarind tree are reported to bethe most commonly used products for souring meals, such as porridgeand bouillie (Lamien et al., 1996; Lykke et al., 2002). The methodsused for home-processing are likely to be those that have been in usefor generations and are based on trial and error rather than on scientificresearch (Akinnifesi et al., 2006).
Substitution of baobab leaves with okra (Abelmoschus caillei) has alsobeen reported by Schreckenberg (2000). Although their flavours differ,the sauces of baobab leaves and okra are substitutable because of themucilaginous texture they share. Lamien et al. (1996) confirmed thepossibility to replace tamarind products by citrus fruits. Further, Secket al. (1999) reported the substitution of tamarind leaves with roselleflowers (Hibiscus sabdariffa). If tamarind fruits are not available, Voglet al. (2009) and van der Stege et al. (2011) reported that tamarind leavesare widely used as substitute product. The fact that tamarind leaves,and not other fruits, are used in case of unavailability of tamarind fruitsindicates a high local appreciation of the typical sour taste of tamarindproducts (van der Stege et al., 2011).
5.1.2 Market chains
The market maps presented in the results chapter show the different chainactors involved in bringing a specific baobab and/or tamarind productfrom gatherer to end user or consumer, and the linkages between them.Hereby, products flow up the chain while money flows down the chain.Each transfer involves marketing activities, such as harvesting, collection,processing, storage, transport and sales. The sequence and importanceof each activity differs from product to product mainly due to productcharacteristics. All these activities involve costs, called transaction ormarketing costs. Regretfully, the data collected for this study did notallow to calculate any transaction costs.
In the literature review, different types of markets were identified anddocumented by Tracey-White (1999), Tracey-White (2005) and Ferriset al. (2006), namely on-farm sales, rural primary markets, assemblymarkets, wholesale markets, retail markets and supermarkets. As
170 Chapter 5. Discussion and recommendations
reported in the present study and also concluded by Ndoye et al. (1998),a trader can simultaneously act as collector/assembler, wholesaler and/orretailer. Due to this lack in specialisation it has been difficult todistinguish different types of traders and thus to recognise the differenttypes of markets. Moreover, for certain products, assembly and wholesalemarkets were not encountered. This observation matches the findingsof Tollens (1997) that, on the one hand, most major African cities lackspecialized and efficient wholesale markets and, on the other hand, it isoften difficult to distinguish between wholesale and retail operations. Inaddition, the author also observed that supermarkets are not (yet) a playerin the trade of baobab and tamarind products in Mali and Benin. Basedon these findings and interpretations, four market types were consideredto be important in the trade of baobab and tamarind products:
• on-farm sales,
• rural primary markets,
• assembly/(semi-)wholesale markets, and
• rural and urban retail markets.
In Table 5.1, these market types are linked with the results of the presentstudy about the different actors and their linkages in the market chainsof baobab and tamarind products in Mali and Benin, and will be used inthe discussion below.
In the present study, six different baobab and tamarind products werereported to be commercialised in Mali and Benin. Based on the marketmaps drawn for each of these products in the results chapter, threedifferent market chains can be identified which have all another level ofimportance and potential for further development.
Market chain of fresh baobab leaves and tamarind leaves
To start with, the market maps for fresh baobab leaves in Mali and Beninand tamarind leaves in Mali, presented in respectively Figures 4.6 and4.11, show short and comparable chains. Between two and four differentchain actors can be identified, namely gatherers, retailers, petty tradersand consumers. The possible linkages between the different actors are thefollowing.
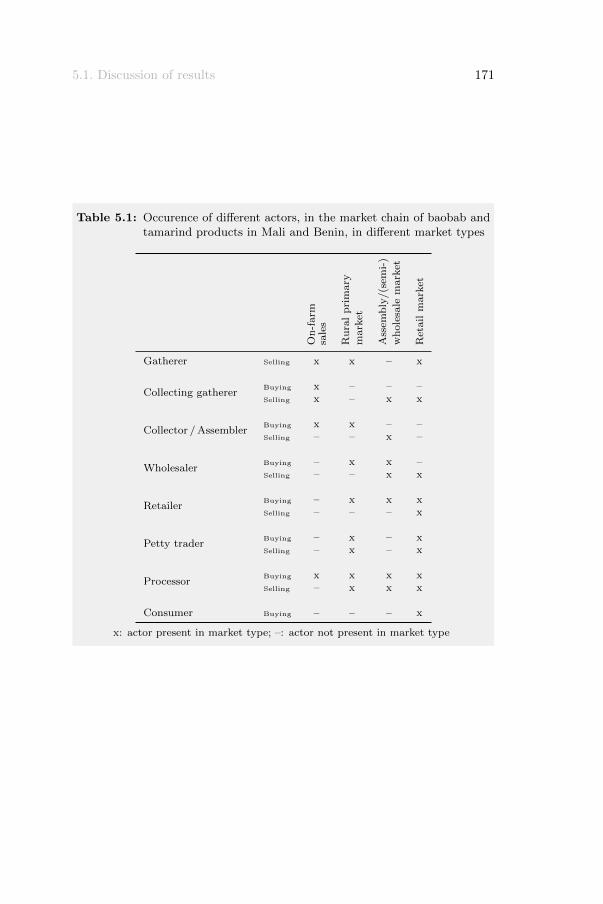
5.1. Discussion of results 171
Table 5.1: Occurence of different actors, in the market chain of baobab andtamarind products in Mali and Benin, in different market types
On
-farm
sale
s
Ru
ral
pri
mary
mark
et
Ass
emb
ly/(s
emi-
)
wh
ole
sale
mark
et
Ret
ail
mark
et
Gatherer Selling x x – x
Collecting gathererBuying x – – –Selling x – x x
Collector / AssemblerBuying x x – –Selling – – x –
WholesalerBuying – x x –Selling – – x x
RetailerBuying – x x xSelling – – – x
Petty traderBuying – x – xSelling – x – x
ProcessorBuying x x x xSelling – x x x
Consumer Buying – – – x
x: actor present in market type; –: actor not present in market type
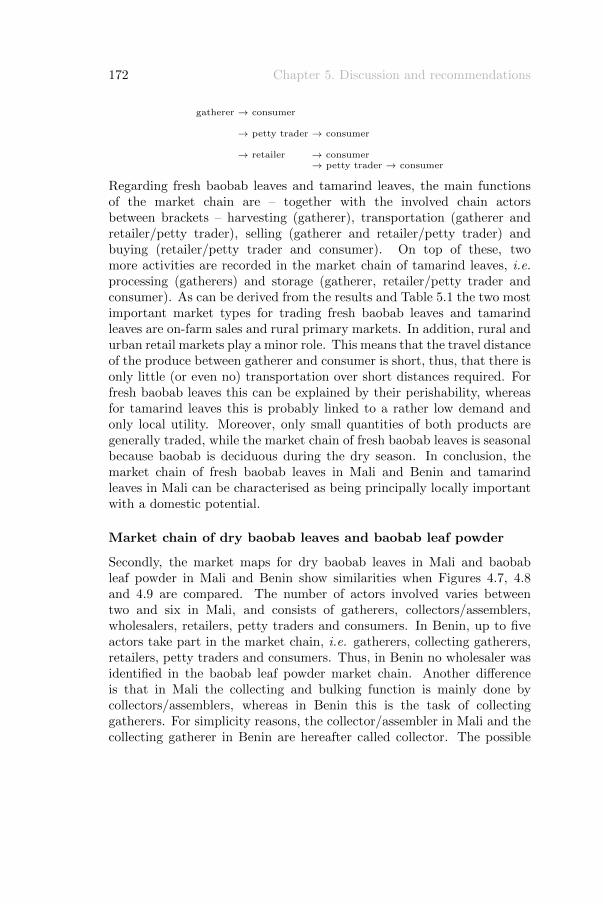
172 Chapter 5. Discussion and recommendations
gatherer → consumer
→ petty trader → consumer
→ retailer → consumer→ petty trader → consumer
Regarding fresh baobab leaves and tamarind leaves, the main functionsof the market chain are – together with the involved chain actorsbetween brackets – harvesting (gatherer), transportation (gatherer andretailer/petty trader), selling (gatherer and retailer/petty trader) andbuying (retailer/petty trader and consumer). On top of these, twomore activities are recorded in the market chain of tamarind leaves, i.e.processing (gatherers) and storage (gatherer, retailer/petty trader andconsumer). As can be derived from the results and Table 5.1 the two mostimportant market types for trading fresh baobab leaves and tamarindleaves are on-farm sales and rural primary markets. In addition, rural andurban retail markets play a minor role. This means that the travel distanceof the produce between gatherer and consumer is short, thus, that there isonly little (or even no) transportation over short distances required. Forfresh baobab leaves this can be explained by their perishability, whereasfor tamarind leaves this is probably linked to a rather low demand andonly local utility. Moreover, only small quantities of both products aregenerally traded, while the market chain of fresh baobab leaves is seasonalbecause baobab is deciduous during the dry season. In conclusion, themarket chain of fresh baobab leaves in Mali and Benin and tamarindleaves in Mali can be characterised as being principally locally importantwith a domestic potential.
Market chain of dry baobab leaves and baobab leaf powder
Secondly, the market maps for dry baobab leaves in Mali and baobableaf powder in Mali and Benin show similarities when Figures 4.7, 4.8and 4.9 are compared. The number of actors involved varies betweentwo and six in Mali, and consists of gatherers, collectors/assemblers,wholesalers, retailers, petty traders and consumers. In Benin, up to fiveactors take part in the market chain, i.e. gatherers, collecting gatherers,retailers, petty traders and consumers. Thus, in Benin no wholesaler wasidentified in the baobab leaf powder market chain. Another differenceis that in Mali the collecting and bulking function is mainly done bycollectors/assemblers, whereas in Benin this is the task of collectinggatherers. For simplicity reasons, the collector/assembler in Mali and thecollecting gatherer in Benin are hereafter called collector. The possible
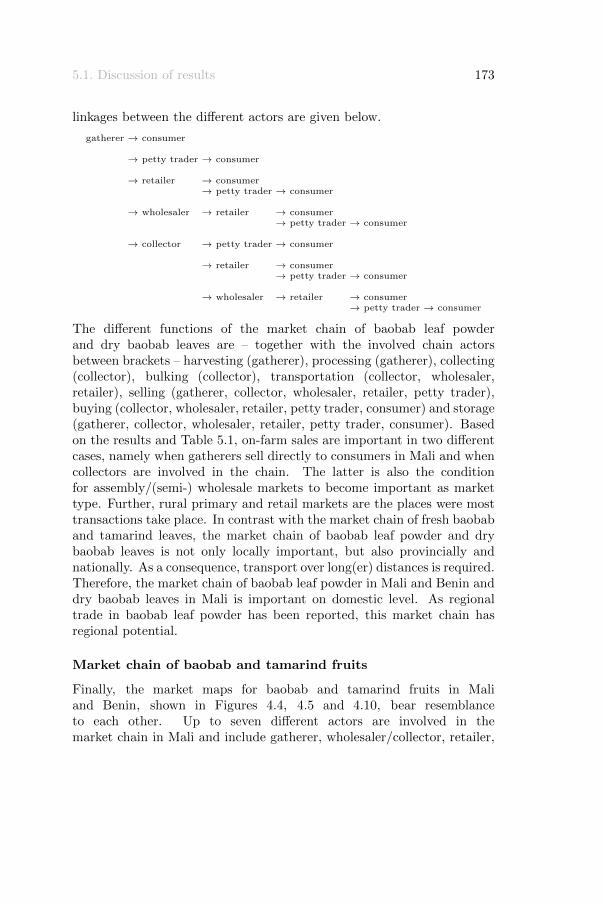
5.1. Discussion of results 173
linkages between the different actors are given below.
gatherer → consumer
→ petty trader → consumer
→ retailer → consumer→ petty trader → consumer
→ wholesaler → retailer → consumer→ petty trader → consumer
→ collector → petty trader → consumer
→ retailer → consumer→ petty trader → consumer
→ wholesaler → retailer → consumer→ petty trader → consumer
The different functions of the market chain of baobab leaf powderand dry baobab leaves are – together with the involved chain actorsbetween brackets – harvesting (gatherer), processing (gatherer), collecting(collector), bulking (collector), transportation (collector, wholesaler,retailer), selling (gatherer, collector, wholesaler, retailer, petty trader),buying (collector, wholesaler, retailer, petty trader, consumer) and storage(gatherer, collector, wholesaler, retailer, petty trader, consumer). Basedon the results and Table 5.1, on-farm sales are important in two differentcases, namely when gatherers sell directly to consumers in Mali and whencollectors are involved in the chain. The latter is also the conditionfor assembly/(semi-) wholesale markets to become important as markettype. Further, rural primary and retail markets are the places were mosttransactions take place. In contrast with the market chain of fresh baobaband tamarind leaves, the market chain of baobab leaf powder and drybaobab leaves is not only locally important, but also provincially andnationally. As a consequence, transport over long(er) distances is required.Therefore, the market chain of baobab leaf powder in Mali and Benin anddry baobab leaves in Mali is important on domestic level. As regionaltrade in baobab leaf powder has been reported, this market chain hasregional potential.
Market chain of baobab and tamarind fruits
Finally, the market maps for baobab and tamarind fruits in Maliand Benin, shown in Figures 4.4, 4.5 and 4.10, bear resemblanceto each other. Up to seven different actors are involved in themarket chain in Mali and include gatherer, wholesaler/collector, retailer,
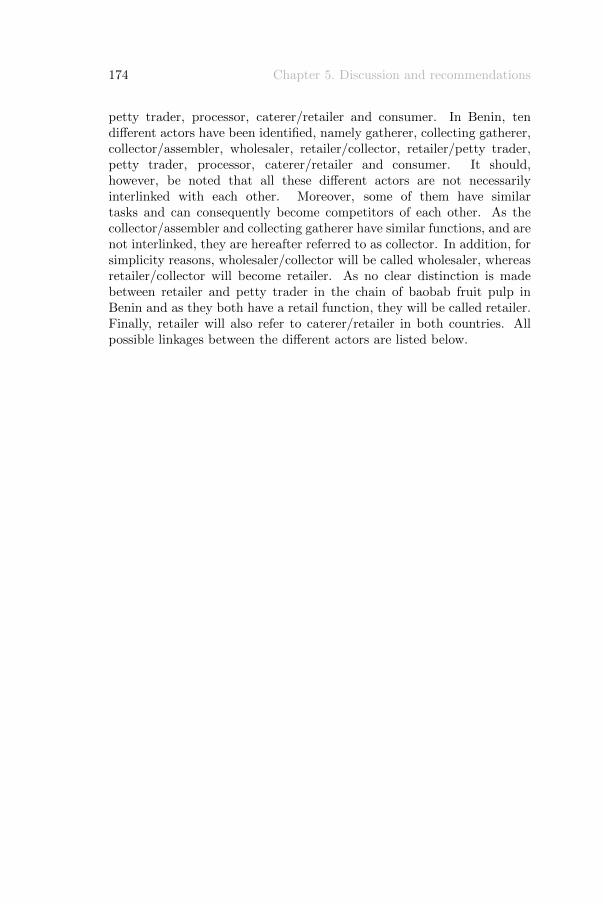
174 Chapter 5. Discussion and recommendations
petty trader, processor, caterer/retailer and consumer. In Benin, tendifferent actors have been identified, namely gatherer, collecting gatherer,collector/assembler, wholesaler, retailer/collector, retailer/petty trader,petty trader, processor, caterer/retailer and consumer. It should,however, be noted that all these different actors are not necessarilyinterlinked with each other. Moreover, some of them have similartasks and can consequently become competitors of each other. As thecollector/assembler and collecting gatherer have similar functions, and arenot interlinked, they are hereafter referred to as collector. In addition, forsimplicity reasons, wholesaler/collector will be called wholesaler, whereasretailer/collector will become retailer. As no clear distinction is madebetween retailer and petty trader in the chain of baobab fruit pulp inBenin and as they both have a retail function, they will be called retailer.Finally, retailer will also refer to caterer/retailer in both countries. Allpossible linkages between the different actors are listed below.
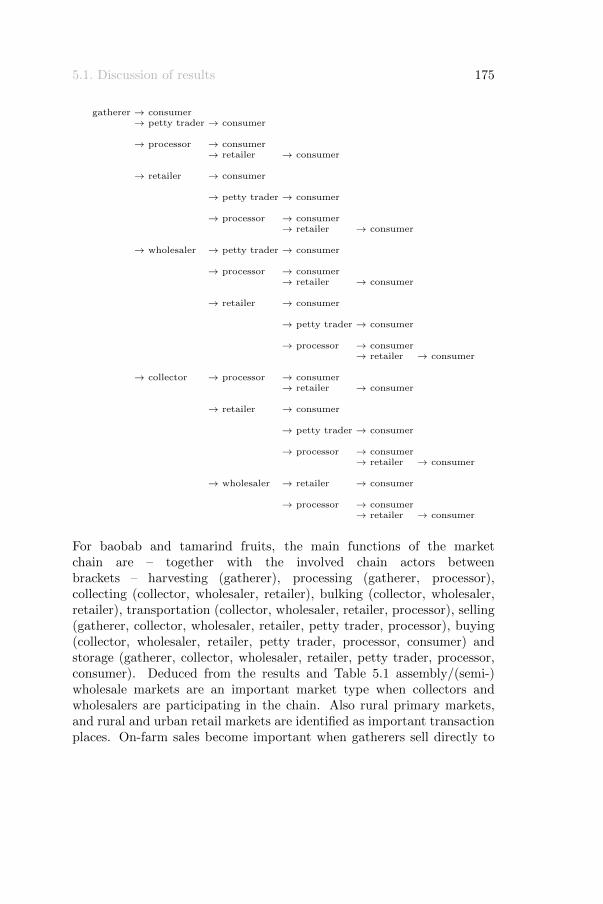
5.1. Discussion of results 175
gatherer → consumer→ petty trader → consumer
→ processor → consumer→ retailer → consumer
→ retailer → consumer
→ petty trader → consumer
→ processor → consumer→ retailer → consumer
→ wholesaler → petty trader → consumer
→ processor → consumer→ retailer → consumer
→ retailer → consumer
→ petty trader → consumer
→ processor → consumer→ retailer → consumer
→ collector → processor → consumer→ retailer → consumer
→ retailer → consumer
→ petty trader → consumer
→ processor → consumer→ retailer → consumer
→ wholesaler → retailer → consumer
→ processor → consumer→ retailer → consumer
For baobab and tamarind fruits, the main functions of the marketchain are – together with the involved chain actors betweenbrackets – harvesting (gatherer), processing (gatherer, processor),collecting (collector, wholesaler, retailer), bulking (collector, wholesaler,retailer), transportation (collector, wholesaler, retailer, processor), selling(gatherer, collector, wholesaler, retailer, petty trader, processor), buying(collector, wholesaler, retailer, petty trader, processor, consumer) andstorage (gatherer, collector, wholesaler, retailer, petty trader, processor,consumer). Deduced from the results and Table 5.1 assembly/(semi-)wholesale markets are an important market type when collectors andwholesalers are participating in the chain. Also rural primary markets,and rural and urban retail markets are identified as important transactionplaces. On-farm sales become important when gatherers sell directly to
176 Chapter 5. Discussion and recommendations
consumers in Mali or when collectors are involved in the chain. Thetentacles of the market chain of baobab and tamarind fruits spread allover Mali and Benin, and also regional trade has been recorded. As aresult, the market chain has domestic and regional importance. Moreover,international trade of baobab and tamarind fruits has been recorded,which gives this chain also an international potential.
5.1.3 Market chain analysis
Quantities and prices
Although baobab and tamarind products play an important role in localmarkets in West Africa (Gustad et al., 2004; Assogbadjo et al., 2008;Buchmann et al., 2010; Fandohan et al., 2010a; van der Stege et al., 2011),up till now, only a handful of authors have reported about quantitiesand prices in the commercialisation of baobab and tamarind products.The present study is the first that has recorded quantities bought andsold, and purchasing and selling prices for different actors involved in thecommercialisation of baobab and tamarind products in Mali and Benin.Based on the recorded quantities and prices in the present study, baobabfruit pulp is traded in larger quantities in Benin than in Mali, whereasbaobab leaf powder and tamarind fruit pods are marketed in largerquantities in Mali than in Benin. Prices are lower in Benin for baobabfruit pulp and baobab leaf powder than in Mali, while tamarind fruit podsare cheaper in Mali compared to Benin. However, it is important to notethat some findings show that answers of respondents might not alwaysbe very reliable. For instance, Table 4.9 shows that all chain actors inMali claim to sell the baobab fruit pulp at a higher price than the priceconsumers reported to pay and raises the following question: where doesthis consumer gets his/her products? The answer is most certainly thatthe consumer buys his/her products with the petty trader – who is themost expected buying source of consumers. But this cannot be concludedbased on Table 4.9 as consumers in Mali recorded a cheaper purchasingprice than the selling price of petty traders, i.e. 410 FCFA / kg versus630 FCFA / kg.
A three months market survey in 2001 showed that 6,923 kg baobab fruitpulp generated 900,000 FCFA (1,372e) per year on a small market inBoukoumbe in north-west Benin. In total, 48 traders were involved,thus the revenue per trader amounted to 18,750 FCFA (29e) for about144 kg sold (Codjia et al., 2001, 2003). Codjia et al. (2003) calculated a

5.1. Discussion of results 177
mean product price for baobab pulp of 130 FCFA/kg. Another study inMalanville (north-east Benin) showed that during a five months period(2003-2004), ten tons of baobab pulp and one ton of baobab leaf powderwere commercialised and generated up to 400,000 FCFA (610e) and200,000 FCFA (305e) for 139 rural households involved in that business(Assogbadjo, 2006). Based on these data, a mean price of 40 FCFA/kgfor baobab fruit pulp and 200 FCFA/kg for baobab leaf powder wascalculated. In Burkina Faso, Lamien et al. (1996) reported in 1994-95 amean product price for baobab leaf powder of 110 FCFA/kg, 143 FCFA/kgfor tamarind fruits and 100 FCFA/kg for tamarind leaves. On the weeklymarket in Cinzana (near Segou in Mali), Gustad et al. (2004) reportedwholesale and retail prices for baobab fruit pulp, 310 and 950 FCFA/kg,respectively, as well as for baobab leaf powder, 75 and 440 FCFA/kg,respectively, and tamarind fruits, 100 and 80 FCFA/kg, respectively.
Prices of baobab fruit pulp in literature thus range from 40 to950 FCFA/kg, whereas in the present study prices ranged from 180 to630 FCFA/kg for baobab fruit pulp in Benin and Mali. Additionally,higher retail prices than wholesale prices, and higher prices in Malicompared to prices in Benin for baobab fruit pulp were confirmed inliterature. This study found prices of baobab leaf powder ranging from90 to 305 FCFA/kg, which match prices reported in literature differingbetween 75 and 440 FCFA/kg. Tamarind fruit pods cost between 170 and405 FCFA in the present study, while cheaper prices varying between 80and 143 FCFA/kg were recorded from literature. Hereby, the author isaware that prices should first be corrected for inflation before they can becompared.
However, recording price fluctuations was not an objective of the presentstudy. Lamien et al. (1996) and Assogbadjo (2006) reported pricedifferences throughout the year for baobab and tamarind products. Pricesof baobab leaves and tamarind fruits were found to vary according tokind of tree on which products were harvested, whereby products frompersonal trees were cheaper than products from communal trees (Lamienet al., 1996). Product price was also determined by ecological zone: thescarcer a product, the higher the price. Prices thus reflect the laws ofsupply and demand (Lamien et al., 1996; Mertz et al., 2001; Assogbadjo,2006). Additionally, price differences were strongly affected by the timeof the year and availability of products (Lamien et al., 1996). Finally,some price differences were observed between rural and urban markets,

178 Chapter 5. Discussion and recommendations
whereby prices in rural market were – contrarily to expectation – higherthan in urban markets. It should hereby be noted that most baobab andtamarind products are processed into dry products to extend storage life,and thus to guarantee a rather constant availability throughout the yearand limit price fluctuations.
FAO has estimated the annual quantity of baobab and tamarind fruitsharvested in the 2006-07 period (FAO Stat, 2010). In Mali, 4,811 tonbaobab fruit pulp and 8,008 ton tamarind fruits were recorded; no nationalstatistics for Benin were found. When compared to the results of thepresent study, one can extrapolate that more than 400,000 gatherers,about 165 wholesalers and at least 5,000 petty traders are involved intrading baobab fruit pulp. For tamarind, it can be assumed that at least35,000 gatherers, about 440 wholesalers and more than 9,000 petty traderstake part in the commercialisation of tamarind fruits. These estimationsshow clearly the job creation potential generated by trading baobab andtamarind products. However, it should be noted that this rather concernssmall supplementary incomes than structural employment opportunities.
Added value
In the present study, added values for baobab and tamarind productsin Mali and Benin tend to be the highest for processors and gatherers.Hereby, it should be noted that added value may not be confused withprofit as no variable nor fixed costs were taken into account in the presentadded value analysis. This means that for processors, the cost of e.g.other ingredients such as sugar has not been taken into account and mayexplain the high added values. At first sight, the present study does notconfirm an exploitative role of middlemen as suggested by e.g. te Veldeet al. (2006). In general, traders are reported to have higher margins thansmallholders, and in particular travelling wholesalers are those profitingmost (Schreckenberg, 2003; Horna et al., 2007). Sissoko & Kergna (2003)reported a much higher margin for retailers compared to wholesalers. Inaddition, Akinnifesi et al. (2008a) also reported that retailers made moreprofit than wholesalers, but that producer’ profits were intermediate.Similar results show that collectors/gatherers have the lowest marginswhile retailers have the highest, and wholesaler margins were found to beintermediate (Vodouhe et al., 2008). However, some studies suggest thatthe role of middlemen has been underestimated (Padoch, 1992; te Veldeet al., 2006; Jensen, 2009) and that it would be a mistake to try to bypass
5.1. Discussion of results 179
them (Corry, 1993). Fafchamps & Gabre-Madhin (2001) reported for themedian trader in Benin variable marketing costs, which represent aboutone tenth of total purchase price.
Buying and selling periods
In general, the harvesting and buying period of baobab and tamarindproducts coincides with the dry season. In Benin, selling of baobab andtamarind products remains limited to the dry period, whereas in Malithe products are sold throughout the year. As a result, marketing ofbaobab and tamarind products happens principally in the dry season,i.e. the period when other agricultural products are becoming scarce andthus more expensive. This suggests that commercialisation of baobaband tamarind products may provide cash income complementary to otherincome generating activities, and thus act as a financial buffer.
The availability of baobab and tamarind fruits and leaves is determinedby the phenology of the tree. Baobab is a drought deciduous tree (Sidibe& Williams, 2002). In West Africa, baobab bears leaves from Apriltill November (Codjia et al., 2001; Sidibe & Williams, 2002; Dhillion &Gustad, 2004; Assogbadjo et al., 2005a; Diop et al., 2005; Assogbadjo,2006), i.e. during the rainy season. In order to extend the periodduring which fresh baobab leaves are available, farmers could adopt thetechnology developed by the World Agroforestry Centre to produce andharvest fresh leaves all year round (Box 5.1). Baobab fruits appearafter flowering in June and July. The first fruits in West Africa are ripein December or January and harvesting may go on until April (Codjiaet al., 2001; Sidibe & Williams, 2002; Dhillion & Gustad, 2004; Assogbadjoet al., 2005a; Diop et al., 2005; Assogbadjo, 2006), and thus coincides withthe dry season. In contrast with baobab, tamarind leaves are availablethroughout the year as tamarind is an evergreen tree (El-Siddig et al.,2006). In West Africa, flowering and fruiting of tamarind generally takesplace in the dry season. Fruits are ripe as from December (El-Siddig et al.,2006). Because all tamarind fruit pods on a tree do not ripen at thesame time, several harvests may be required (Daniel & Dudhade, 2007).Moreover, Yahia et al. (2008) report that tamarind is a non-climactericfruit and will does not ripen off the plant. Therefore fruit pods shouldonly be harvested when ripe. When fully ripe, shells are brittle, and easilybroken and removed (Yahia et al., 2008).
180 Chapter 5. Discussion and recommendations
Box 5.1: Baobab market gardens
Until now, the baobab tree has never been planted deliberately. Itgrows virtually wild, as part of a traditional parkland agroforestrysystem (ICRAF, 2003). Baobab leaves are typically harvested during therainy season, then dried and stored for further use during the long dryseason. However, it has been reported that during the drying process,the vitamin A content of leaves decreases significantly (Sidibe et al.,1998b; Scheuring et al., 1999; Sidibe & Williams, 2002; Traore, 2003).
An alternative technology, developed and proposed by the WorldAgroforestry Centre and its partners in West Africa, is to grow youngbaobab trees in irrigated garden plots and harvest the leaves regularlythroughout the year (ICRAF, 2003; Kalinganire et al., 2007; Bationoet al., 2009). Results in the Segou district of Mali indicate that, despitesome constraints, the technique is accessible to farmers in terms offeasibility. Constraints include the availability of sufficient manpower,land and water, and seed (Savard et al., 2003; Olivier et al., 2006; Savardet al., 2006). Uncertainties over the profitability of the technique mayalso be a major constraint (Traore, 2003; Savard et al., 2006).
An additional advantage is that when people start to plant and cultivatetheir own trees, they will no longer have to strip so many leaves fromadult trees around the village. Knowing that leaf stripping prevents90 % of wild baobab trees from bearing fruit, this technique has thusthe potential to simultaneously increase fruit production of wild trees(ICRAF, 2003; Buchmann et al., 2010).
5.1. Discussion of results 181
Storage practices
First and foremost, field research learned that storage is difficult toestimate because it fluctuates in time. Also the meaning seemed often notwell understood by local respondents. Most surveyed actors in the chainof baobab and tamarind products typically purchase a certain volume ofproduce, which is kept until it is sold, after which they replenish theirstock. This practice was also reported by Fafchamps & Gabre-Madhin(2001). The latter authors add that the great majority of traders in SSAdoes not undertake speculative or seasonal storage. Knowing that, onthe one hand, when a trader holds stocks, he/she runs both physical andcommercial risks (van der Laan, 1999), and, on the other hand, traders inMali and Benin lack storage infrastructure, space and financing, this canexplain why no seasonal storage is undertaken.
Baobab and tamarind products are mainly stored in recycled rice bagsin the house (Benin) or in a storehouse or granary (Mali). Dry baobableaves are traditionally stored as powder. These storage practices havealso been reported by several other authors (Sidibe et al., 1998b; Codjiaet al., 2003; Lamien & Traore, 2003; Dhillion & Gustad, 2004; Assogbadjo,2006; Vogl et al., 2009). They found that cleaned and sun-dried leaves, asa whole or powdered, are stored in polyethylene bags, or in cups or tinsand kept in the house or small granaries. To maintain the initial vitamincontent at its maximum, storage of baobab leaves as whole leaves ratherthan ground leaf powder is, however, recommended (Sidibe & Williams,2002). Similar storage practices for baobab fruit pulp have been reportedin literature (Assogbadjo, 2006; Dhillion & Gustad, 2004). However, Cisseet al. (2009) and Chadare (2010) pointed out that, without precaution,pulp composition evolved and quality quickly degraded during storage.Chadare (2010) detailed that especially vitamin C degraded. Moreover,browning of fruit pulp during storage increases by high temperatures andhigh humidity (Chadare, 2010). Tamarind fruits can be stored eitherwith the shell or as separate dry pulp. As reported by Yahia et al. (2008),the dry, dark-brown pulp becomes soft, sticky and almost black duringstorage.
In the present study, humidity and bug, mice and fungi attacks have beenidentified as the main problems during storage of baobab and tamarindproducts. Chadare et al. (2008) reported that after 6 months, insectlarvae invade baobab fruit pulp if it is exposed to humidity. In addition,the latter authors also recorded discoloration of baobab pulp as a major

182 Chapter 5. Discussion and recommendations
constraint to storage. Most of the problems listed here are relatedto exposure to humidity, light and high temperatures, and indirectlydepend on the quality of packaging material and the packaging techniques.Notwithstanding some storage problems, storage capacity of baobab andtamarind products was documented as good by Soloviev et al. (2004) dueto easy handling during transportation.
Trade centres
The region of Segou in Mali and the department Borgou in Benin havebeen identified as main trade centre for baobab leaf powder. The tradecentres for baobab fruit pulp are the capital district Bamako, and theregions of Kayes and Mopti. In Benin, the department Collines andCotonou (in the department Littoral) are assigned as baobab fruit pulptrade centres. Tamarind fruit pods are mainly traded in the region ofSikasso, and to a lesser degree also in the regions of Kayes and Mopti.The most important trade centre of tamarind fruits in Benin is found tobe the department of Atacora.
Traders in Mali and Benin reported that baobab and tamarind fruitsmay be imported from Burkina Faso. Export to Senegal and Mauritaniais recorded for baobab and tamarind products of Malian origin, whereasbaobab fruit pulp in Benin is exported to the neighbouring countries Nigerand Nigeria. In addition, Eyog Matig et al. (2002) and Assogbadjo (2006)reported an intensive regional trade of baobab and tamarind productsin West Africa. In Benin, export markets for baobab products – fruitpulp, leaf powder and kernels – are situated in the Atacora and Aliboridepartments (Assogbadjo, 2006). Export to Nigeria, Niger, Burkina Faso,Togo and Mali are recorded by Assogbadjo (2006). In Mali, tamarindfruits are important in the trade with Senegal. Unpublished results ofHamady Djouara (agricultural economist at IER, Mali) showed that, inthe 2006-07 period in Mali, baobab and tamarind products were exportedto Burkina Faso, Senegal and Ivory Coast, and imported from Nigeria andNiger (Table 5.2).
Quality criteria
In the present study, all baobab and tamarind products traded areundifferentiated and not graded nor standardised. Direct inspectionis the only method reported by which quality is assessed. Thesefindings have been confirmed by Fafchamps & Gabre-Madhin (2001) and

5.1. Discussion of results 183
Table 5.2: Export and import of baobab and tamarind products in Mali inthe period 2006-07 (figures are ton / year)
Baob
ab
fru
itp
ulp
Baob
ab
leaf
pow
der
Tam
ari
nd
fru
its
Export Burkina Faso 155 813 4,384Senegal 220 111 4,527Ivory Coast 30 89 66
Import Nigeria (via Burkina Faso) – – 2,736Niger 28 – –
Akinnifesi et al. (2005). The latter authors added also that indigenousfruits are marketed with little value adding in the form of packaging,processing, certification, quality control, and other utilities, therefore onlyeliciting small marketing margins. Any attempt to add value or increasethe marketing margin must be associated with targeting higher-incomeconsumers, who are able to compensate for this (Akinnifesi et al., 2008a).
Standards are a set of technical specifications that define quality features,size, weight and/or packaging of a product. Standards help to maketrade more efficient, more remunerative and more client-oriented (KIT& IIRR, 2008). The quality of a product can be defined by manyobjective and subjective parameters, such as size, shape, colour, gloss,absence of defects, texture and flavour (Yahia et al., 2008). As shownin this study, quality attributes may differ according to the ultimatedestination of the product. In other words, quality criteria used for aspecific product by local gatherers may not necessarily be the same asthose used by wholesalers or consumers. E.g. in addition to the overallagreed importance of processing and conservation techniques, consumersin Benin judge colour of baobab fruit pulp important, whereas gatherersand traders use taste as parameter. The quality criteria reported in thepresent study can be classified as, on the one hand, search attributes andare those that can be verified at the time of the transaction (e.g. colour),and, on the other hand, experience attributes which can be assessed onlyafter the transaction has taken place (e.g. taste) (based on Gibbon &Ponte, 2005). A third category, namely credence attributes, was not
184 Chapter 5. Discussion and recommendations
mentioned in this study. Credence attributes are attributes that cannotbe objectively verified and are based on trust (e.g. organic and fair trade).
Certification of baobab and tamarind products is considered more usefulto consumers in Mali compared to consumers in Benin. Certificationis an inspection process carried out by an independent body whichdemonstrates that a company or product complies with the requirementsthat are defined in ‘the standard’ (KIT & IIRR, 2008). A certified productgets a stamp or seal, so the consumer knows that it complies with theregulations. Certification improves the credibility of the standard, but itentails higher costs for the applicant (KIT & IIRR, 2008). Moreover,trademarks and labels can be effective mechanisms for differentiatingproducts in the marketplace. These not only add value to the product, butalso make the product unique by differentiating it from similar products.This uniqueness might be of great relevance for the consumer, but it isalso relevant for producers, who protect themselves from competitors byconveying greater negotiation power (Bernet et al., 2006).
Information flow
Lack of market information is commonly recognised to be a majorconstraint to developing NTFP commercialisation (Neumann & Hirsch,2000). This was confirmed in the present research as the majority ofsurveyed gatherers, traders and processors stated that market informationis lacking. Areas of particular concern are harvesting techniques,appropriate processing technologies, and marketing information aboutprice, quality and demand. FAO (1995b) and Hellin et al. (2005)confirmed that smallholders have little or no information on marketconditions, prices and quality of goods. Besides, they are not organisedcollectively and have limited experience with market negotiations. Asa result, Hellin et al. (2005) concluded that market literacy is lackingat the level of smallholders in SSA. The latter authors define marketliteracy as the awareness, understanding and capacity to build the process,institutions, competencies and relationships that enable market systemsto work for resource-poor farmers. Tollens (1997) also recognised thatinformation asymmetry between traders and producers is a commonproblem in food marketing systems in SSA. Consequently, this weakensthe bargaining position of the producers and exposes them to considerableprice uncertainty. Market information, together with market intelligenceand the ability to use that information, are thus important prerequisites
5.1. Discussion of results 185
for entering new markets and maintaining market share (Marshall et al.,2006b)
The present study showed that buyers and sellers need accurateinformation on availability, price and quality for making good decisionsas to where, when, from/to whom, and at what price to buy or sell.Incomplete or non-transparent market information leads to what is calledmarket failure (KIT & IIRR, 2008). However, KIT & IIRR (2008) addthat it is one thing to have market information, but that it is a differentthing to be able to actually use that information. The particular challenge,however, is to develop information that can be effective in countries withhigh levels of illiteracy (Azami, 2002). Up till now, talking to (other)traders has been proven to be the main source of information, and wasalso confirmed by Fafchamps & Gabre-Madhin (2001). But, KIT & IIRR(2008) expect that the recent spectacular growth of the telecommunicationsector in SSA – and thus of mobile phone use – may offer great possibilitiesto enhance information flow between gatherers and traders. In addition,Russell & Franzel (2004) suggested that to create and promote marketintelligence systems, we can build on mobile phone networks that aregrowing throughout Africa and better integrate market information intoextension programmes.
Problems
All problems identified by the actors in the market chain of baobab andtamarind products in Mali and Benin can be attributed to a lack of marketliteracy, development and coordination along the chain. Many authorsacknowledge the problems reported in the present study (Fafchamps &Gabre-Madhin, 2001; Awono et al., 2002; Veeman, 2002; Hughes & Haq,2003; Russell & Franzel, 2004; Akinnifesi et al., 2006, 2008b; KIT & IIRR,2008). It can be noted that most of these constraints reflect conditionstypical for developing countries and many governments fail to providethe basic public goods that are required for markets to operate efficientlyand reliably, such as basic market infrastructure, mechanisms for contractenforcement and standardization of quality grades (KIT & IIRR, 2008).
Variations in supply are mainly caused by seasonality of fruits and leaves,and can – under ideal conditions – be met by good processing and storagepractices. But storage is poor (Awono et al., 2002) and storage space islimited. In addition, post-harvest handling, including storage methods,drying, grading, processing, packaging and quality assurance, is poorly
186 Chapter 5. Discussion and recommendations
developed and supported (Akinnifesi et al., 2008b). Grading and qualitystandards are non-existent in Mali and Benin. However, a substantial tree-to-tree variation in fruit characteristics has been recorded for baobab andtamarind (Sidibe & Williams, 2002; Assogbadjo et al., 2005b; Assogbadjo,2006; Assogbadjo et al., 2006b; El-Siddig et al., 2006; Fandohan et al.,2010b; Assogbadjo et al., 2011; Fandohan et al., 2011a; Kouyate et al.,2011) and may thus result in a lack of uniformity in quality.
The largest marketing cost for traders is transport (Fafchamps & Gabre-Madhin, 2001; Awono et al., 2002) due to poor infrastructure, such asbad roads and poor quality of transport means used. Moreover, there is alack of access to credit. The majority of actors faces a variety of problemswhen seeking credit, including lack of information and high interest rates(Azami, 2002). Next to limited and conflicting market knowledge, othermarket constraints include lack of marketing networks and associations,and inadequate policies (Russell & Franzel, 2004). Indeed, indigenousfruit trees have not been subjected to agricultural or forest policies(Akinnifesi et al., 2004) and their inclusion in national agriculturalresearch programmes in developing countries is limited (Hughes & Haq,2003).
All transfers in the market chain of baobab and tamarind products involvemarketing activities in some form or other, and all these activities involvecosts (Shepherd, 2007). Due to an incomplete dataset, the present studyhas failed to calculate the marketing costs such as handling, transportand storage costs. According to Fafchamps & Gabre-Madhin (2001),marketing costs can be decomposed in transport (49 %), handling (13 %),travel/search for information (11 %), packing material (8 %), commissions(7 %), taxes (5 %), storage (4 %) and other costs (3 %). Due to limiteddata, no detailed marketing costs are reported in the present study.
5.2 SWOT and impact analysis
5.2.1 SWOT analysis
Commercialisation of baobab and tamarind products shows greatpotential on domestic, regional and international level. But, at the sametime, the production-to-consumption chain faces different challenges.Based on, on the one hand, results and observations presented in thepresent study and, on the other hand, findings reported in literature,
5.2. SWOT and impact analysis 187
the author used a SWOT logic to identify and list major strengths andweaknesses on domestic level, and opportunities and threats on domestic,regional and international level.
Strengths
Baobab and tamarind are both indigenous tree species that are well-knownand often used by local populations in Mali and Benin. As they providenumerous products – such as fruit pulp, seeds, leaves and bark – fornumerous food and medicinal uses and also supply tools and services,they are considered as multi-purpose tree species. Besides, baobab andtamarind have been identified by local people as priority species fordomestication. Other strengths of baobab and tamarind products aretheir nutritional value, health benefits and potential to generate income.In most producing countries, such as Benin and Mali, there already existsa local and national market for baobab and tamarind products, andtraditional processing methods have been reported to exist and be usedby local communities. Furthermore, the commercialisation of baobab andtamarind products has a substantial job creation potential.
Weaknesses
Baobab and tamarind are not (yet) cultivated in West Africa, but rathergrown in the wild (Abeyrathne & Jaenicke, 2006; Jama et al., 2008).Fruit harvesting has an impact on dispersal and establishment, whileleaf harvesting causes mutilation that reduces the number of fruits oneach tree (Dhillion & Gustad, 2004). Wild gathering of products fromundomesticated trees creates significant problems regarding variation inavailability, product quality and reliability of supply (Akinnifesi et al.,2006; Belcher & Schreckenberg, 2007; Nevenimo et al., 2007). Productquality is also affected by rudimentary processing techniques, and systemsfor quality grading, standardisation and certification are non-existentin Mali and Benin. Markets of baobab and tamarind products aremarked by a lack of product differentiation, poor storage facilities, lackof coordination and limited market information. Buyers and sellershave limited access to formal financial services and are, as a result,always in need of money, either for their businesses or for their families(KIT & IIRR, 2008). Because of low levels of educational attainment,entrepreneurial skills of local chain actors are relatively undeveloped.Moreover, linkages between various rural and urban markets tend to be

188 Chapter 5. Discussion and recommendations
weak due to poor roads and infrastructure (KIT & IIRR, 2008).
Opportunities
It has been estimated that insufficient fruit and vegetable intake, andmicronutrient deficiencies that often result from such shortages, causesome 2.7 million deaths each year, making it one of the top ten risk factorscontributing to mortality (Ezzati et al., 2002). Iron and pro-vitaminA deficiencies are two of the top three micronutrient deficiencies notedworldwide, responsible for serious health problems (e.g. anaemia andnight blindness). Indigenous fruit trees, such as baobab and tamarind,are rich in minerals and vitamins and should be promoted in developingcountries to assure food and health security.
Many international research organisations, such as CGIAR, FAO, WorldHealth Organisation (WHO), GFU and the Global Forum on AgriculturalResearch (GFAR), have expressed keen interest in underutilised species,including baobab and tamarind, for improving food and health securityand poverty alleviation in developing countries (Lumpkin et al., 2005).In addition, the World Agroforestry Centre has identified baobab andtamarind as priority species for domestication in semi-arid West Africa(Franzel et al., 1996), whereas together with the World Vegetable Centre(AVRDC) they are also developing baobab gardens (as explained in Box5.1).
Others, such as PhytoTrade Africa – a non-profit trade association thatpromotes sustainable harvesting of fair-traded natural products fromsouthern Africa – and Baobab Fruit Company Senegal (BFCS) – aprivate company limited by shares – market and export processed baobabfruit products. In 2008, baobab fruit pulp of PhytoTrade Africa wasacknowledged as novel food by the European Union (EU), whereas baobabfruit pulp produced by BFCS has been recognised as novel food in 2009.The approval as novel food may boost the trade of this product fromAfrican countries (Box 5.2). Additionally to this international marketpotential, also regional trade has been reported to be important.
In West Africa, seeds are an underutilised by-product of the processing ofbaobab and tamarind fruits (Sidibe & Williams, 2002; Ajayi et al., 2003,2006; El-Siddig et al., 2006; Kumar & Bhattacharya, 2008). Though seedscan supply significant amounts of oil which can be used as edible andcosmetic oils (Akinnifesi et al., 2005; Ajayi et al., 2003, 2006; Kumar &
5.2. SWOT and impact analysis 189
Bhattacharya, 2008). In Zimbabwe for instance, the two biggest producersof baobab oil, i.e. African Biodiversity Trading Company and CreativeOils, collectively produce approximately 20,000 l of oil worth 100,000 $per year (Akinnifesi et al., 2005). Also PhytoTrade Africa and BFCS areinvolved in the extraction of oil from baobab seeds for use in cosmeticsindustry. According to Bennett (2006) growth market areas for naturalproducts are cosmetics and functional food ingredients.
Although, in the present study, undifferentiated baobab and tamarindproducts were marketed and no quality control standards were reportedto exist in Mali and Benin, standards are important as they determineaccess to specific segments of markets (Gibbon & Ponte, 2005). As aconsequence, up till now, baobab and tamarind products in Mali andBenin are solely reported to be intended for domestic consumption, whichis a very broad and low income market segment. However, potentialmarket segments for baobab and tamarind fruits are food and beverage,cosmetics, health and functional foods, nutraceuticals, organic foods andethnic products (Sidibe & Williams, 2002; Ledda, 2004; Gruenwald &Galizia, 2005; Bennett, 2006; El-Siddig et al., 2006) (see also socio-belowunder economic and economic impact).
European consumers have a strongly increased interest in a healthy lifeand, consequently, in the consumption of health food (CBI, 2005c). Thelatter refers to food products, which are low in fat and have limitedsugar and salt content. Health food also includes functional foods, whichhave specific health promoting properties, and food products with addedvitamins and minerals or bacteria, which support the intestinal function(CBI, 2005c). Fresh fruits and vegetables are generally associated withhealth foods. This is because fruit and vegetables contain vitamins andnatural antioxidants, which are supposed to have properties to preventheart diseases and cancer (CBI, 2005c). Due to this increasing consumerconcern for healthier lifestyles, the tropical fruit market in the EU willcontinue to grow (CBI, 2005d). Baobab fruit pulp has been identifiedas an interesting candidate for a new generation of functional foods andnutraceuticals, due to a combination of its nutritional and health claims,together with its food technological functions (Gruenwald & Galizia,2005). Similar characteristics have been reported for tamarind. This trendthus opens major opportunities to baobab and tamarind food products.
190 Chapter 5. Discussion and recommendations
Box 5.2: Novel food regulation
On 27 June 2008, the European Union (EU) decided to authorisethe placing on the market of dried baobab fruit pulp as a novelfood ingredient under Regulation (EC) No 258/97 of the EuropeanParliament and of the Council (European Union, 2008). This approvalrefers only to those producers who are member of PhytoTrade Africa,and who supply the market through PhytoTrade Africa’s partner inSouth Africa, Afriplex (Lombard & Leakey, 2010). In August 2009,baobab fruit pulp produced by BFCS has also been recognised as novelfood (BFCS, 2011).
The novel food regulation regulates the placing of novel foods in EUmember states to protect public health by ensuring food safety. It callsfor anyone wishing to place a food product on the EU market to firstevaluate whether the food is novel and then to present evidence that itis safe (Will, 2008).
A novel food is defined as a food or food ingredient, which does not havea significant history of consumption within the EU prior to May 1997.All novel foods are subject to a premarket safety assessment under thenovel food regulation (EC) No. 258/97 (Arvanitoyannis et al., 2005).
To market a food product within the EU, it must have been sold in atleast one member state prior to 15 May 1997 to a significant degree.If this is not the case, the product will be considered a novel food andmust go through an expensive process to prove its safety. Each companythat wants to bring a novel food onto the EU market must submit itsproposal to the food and safety authority of a EU country. This requestwill then be sent to all other EU countries for their endorsement (CBI,2005a; Gruenwald & Galizia, 2005). The novel food regulation, withan average duration of 39 months for traditional food products, createsthus a non-tariff barrier (Hermann, 2009).
5.2. SWOT and impact analysis 191
Box 5.2: Novel food regulation (Continued)
The EU authorized the novel food application of baobab fruit pulp23 months after submission by PhytoTrade Africa and on behalfof the consortium’s 55 members drawn from eight southern Africancountries, including small producer groups, private sector companies,non-governmental organisations, research and government organisations(Hermann, 2009). According to a press report, PhytoTrade expended intotal more than 170,000e on the baobab application (Hermann, 2009).Conveniently extracted and traded at a wholesale price of approximately35e / kg and a retail price of 200e / kg, baobab fruit pulp has potentialfor use as a functional ingredient in smoothies, cereal bars, confectioneryand related products (Hermann, 2009).
Approving baobab fruit pulp as a novel food opens the door of theEuropean market to the African export of pulp from baobab fruits(Buchmann et al., 2010; Chadare, 2010). However, it is important thatthe current use of baobab in supporting the livelihood of local peopleis not undermined by commercialisation and that access to wild baobabpopulations remains guaranteed for local communities (Buchmann et al.,2010).
Another criticism to the novel food regulation is the fact that it fails todifferentiate between genuinely new foods that have not been consumedanywhere before, and foods that are merely new to Europe (Moorhead,2007). These latter foods, described as exotic, may have been eatensafely by many people over centuries, but this is not taken into accountwhen assigning these foods to a novel category in the EU. Therefore,a new, simple procedure for exotic foods should be introduced withrequirements appropriate to foods which are new to EU countries butwhich have a history of consumption elsewhere (Moorhead, 2007). Thegoal is to allow safe exotic foods access to the EU market, via a procedurethat is neither prohibitively expensive nor excessively time-consuming(Moorhead, 2007).
192 Chapter 5. Discussion and recommendations
Threats
A series of marketing constraints that hamper the development of baobaband tamarind markets in Mali and Benin is related to the overall contextof widespread poverty and low economic development in SSA. Manygovernments in SSA fail to provide the basic public goods requiredfor markets to operate efficiently and reliably, such as infrastructure,mechanisms for contract enforcement and standardisation of qualitygrades. Also market facilities, such as access and feeder roads, areas forloading and unloading, storage facilities, security and sanitation, could begreatly improved (KIT & IIRR, 2008). Over the past decades, governmentinvestments in the agricultural sector have steadily declined, which isevident from the state of the rural infrastructure and agricultural research.These adverse policies tend to push agricultural marketing into the so-called informal economy (Dijkstra, 1997; KIT & IIRR, 2008).
In addition, due to a lack of official recognition and national regulationsor policies, the inclusion of underutilised species in national agriculturalresearch programmes in developing countries is limited (Hughes & Haq,2003; Ndoye et al., 2004). Very few governments in SSA are awareof the extent of yhe use, or the value, of NTFPs in the informalsector. Nor are they aware of the magnitude of dependence of therural poor on these resources (Taylor et al., 1996). As a result, thecontribution of indigenous fruit trees to many farmers’ livelihoods isoften not acknowledged in neither national nor international level povertyreduction strategies (Schreckenberg et al., 2006). Moreover, NTFP-related activities usually fall under the responsibility of several ministries,such as national planning, agriculture and forestry, trade and industries,health and education. Consequently, collaboration of the various policymaking bodies at the national level is thus lacking (Lintu, 1995).
Competition with similar products from other countries or continents, e.g.Asian tamarind varieties and baobab fruit pulp from southern Africa, mayfor a barrier to further develop the existing markets.
In developed countries, numerous tropical fruits and their derivedproducts are quite unknown to many consumers and are likely to remainso, unless consumers’ acceptance of these products, followed by successfulmarket introduction, occurs (Sabbe et al., 2008). As a consequence,it is unlikely that tropical fruits will easily become part of consumers’daily diet. Consumers show both an interest in and a reluctance to try
5.2. SWOT and impact analysis 193
unfamiliar foods (Martins et al., 1997). The latter, called food neophobia,is expected to have a negative effect on the acceptance of functional foods(Sabbe et al., 2009a). Sensory characteristics, and taste in particular, arethe primary drivers for consumers’ food choice and purchasing intention,followed by health considerations (Sabbe et al., 2009b). However, mosttropical fruits are so exotic in taste and other sensory attributes that thismay act as an important barrier to consumption (Sabbe et al., 2009b).Sabbe et al. (2009b) reported that consumers’ general expectations werenegatively disconfirmed after tasting baobab juice and tamarind jam,which resulted in a decreased purchasing intention. As consumers seem toprefer sweet tastes and pleasant smells in food (Clark, 1998), it is possiblethat the more acid taste of tamarind led to a negative disconfirmation oftaste expectations. Unfamiliarity with new and unknown exotic flavours,as is the case with baobab juice, may explain the negative disconfirmationof taste expectations for baobab (Sabbe et al., 2009b).
5.2.2 Impact analysis
Most factors reported in the SWOT analysis may have a beneficial ornegative impact on food security, and (socio-) economic and naturalenvironment. Impacts associated with the commercialisation of baobaband tamarind products in Mali and Benin are hereafter discussed.
Impact on food security
Food security implies access to food for a productive and healthy life(Shah & Strong, 1999), i.e. the ability of households to produce,purchase, or acquire an adequate amount of food to meet all biologicalrequirements. There are various degrees of food insecurity such as proteinenergy malnutrition, micronutrient deficiencies (vitamins and minerals)and anaemia due to iron deficiency (UNICEF, 1992; Kavishe, 1993).
In developing countries, it is estimated that over one billion people do nothave enough food to meet their daily requirements (FAO, 2010f) whereasa further two billion people are deficient in one or more micronutrients(Azam-Ali & Battcock, 2001; Micronutrient Initiative, 2004, 2009), andthus suffering from ‘hidden hunger’. Deficiency of iron and vitamin A isprevalent in most parts of West Africa, including Benin and Mali (FAO,1999a, 2003).
According to WHO and FAO, up to 2.7 million lives could be saved
194 Chapter 5. Discussion and recommendations
annually with sufficient fruit and vegetable consumption. As a result,low fruit and vegetable intake is among the top ten selected risk factorsfor global mortality (WHO, 2003; FAO & WHO, 2005). A report onthe Joint FAO/WHO Expert Consultation on diet, nutrition and theprevention of chronic diseases, recommends the intake of a minimum of400 g of fruit and vegetables per day (excluding potatoes and other starchytubers) for the prevention of chronic diseases such as heart disease, cancer,diabetes and obesity, as well as for the prevention and alleviation of severalmicronutrient deficiencies, especially in less developed countries (WHO,2003; FAO & WHO, 2005).
Fruit and vegetable initiatives in developing countries should be integratedinto national food and nutrition policies, and should be consistent with thepredominant stage of the nutrition transition in each country (WHO, 2003;FAO & WHO, 2005). The nutrition transition refers to the movementfrom a famine stage (i.e. scarce, monotonous, low energy and cereal-baseddiets) through a receding famine stage (i.e. less scarce, less monotonous,but still low in energy, minimally processed, cereal-based diets) to awesternised, mass consumption stage (i.e. low fibre, high energy, fatty,salty, sugary diets with increasing animal products) (WHO, 2003; FAO &WHO, 2005). Most low-income countries are situated between the famineand receding famine stages where undernutrition disorders prevail. WestAfrica is below the target of 400 g of fruits and vegetables per person perday (WHO, 2003; FAO & WHO, 2005) with an average consumption of223 g per day per person (FAO Stat, 2010).
Edible indigenous plants of the West Africa, including baobab andtamarind, are widely used to supplement the largely cereal-based dietsof many of the rural populations (Nordeide et al., 1996; Glew et al., 1997;Sena et al., 1998; Lockett et al., 2000; Glew et al., 2005) and have thusthe potential to play a pivotal role in achieving the target set by FAOand WHO (Smith & Eyzaguirre, 2007). A thorough literature review onbaobab and tamarind food products pointed out that both species havea high nutritional value (De Caluwe et al., 2009b,c, 2010a,b). Baobabfruit pulp is extremely rich in vitamin C and has a high content ofcalcium. Baobab seeds are rich in the two essential fatty acids, linoleicand α-linolenic acid, whereas leaves are rich in vitamin A and iron, andare good sources of protein. Tamarind fruit pulp is rich in vitamin Band several amino acids, and is a good source of magnesium, copper,potassium and calcium. Tamarind seeds are important as protein source
5.2. SWOT and impact analysis 195
and are a good source of linoleic acid and calcium. The effective supplyof micronutrients depends on three elements: (i) the intake of food,(ii) the nutrient content of food, and (iii) the bioavailability of thesenutrients (Slingerland et al., 2006). Bioavailability is the proportion ofingested nutrients available for metabolic processes and storage in humans(Slingerland et al., 2006). Many authors have indicated the need to assessthe bioavailability of essential nutrients in edible indigenous plants (Yazzieet al., 1994; Nordeide et al., 1996; Smith et al., 1996; Glew et al., 1997;Barminas et al., 1998; Sena et al., 1998; Lockett et al., 2000; Glew et al.,2005). However, according to the author’s knowledge, up till now, nostudies have been done to assess the bioavailability of essential nutrients inthese plants. In addition, Boukari et al. (2001) report that food processingand methods of preparation greatly influence mineral composition andbioavailability.
Even though biochemical analyses indicate that baobab and tamarindfood products are rich in minerals and vitamins, bioavailability studies areurgently needed to assess the effective supply of these essential nutrients.It is only based on the results of the latter studies that the real potentialcontribution of baobab and tamarind food products to food security canbe assessed.
Socio-economic and economic impact
Local, national, regional and international markets exist for baobab andtamarind products and open perspectives for further market expansion.Local markets are important as they are easily accessible by smallholders,create job opportunities and generate income. Market opportunities forbaobab and tamarind products are reported to be substantial. E.g.the current trade in the southern African development community isestimated to be around 8,486,800e / y and to employ about 1,165,965households for gathering alone, whereas potential trade is estimated ataround 728,214,000e / y and with potential to employ about 2,640,333households for gathering (Bennett, 2006).
As mentioned earlier, baobab and tamarind products are frequently usedby rural households. However, it is unclear how this consumption maychange under the present globalisation of trade, demographic growth andincreasing urbanisation. Some authors predict that increased urbanisationmay be an important factor in the expansion of the size of localmarkets because it creates a new type of consumer who, unlike rural

196 Chapter 5. Discussion and recommendations
people, has to buy rather than gather for subsistence use (Ndoye et al.,1998). Also Gustad et al. (2004) expect that the regional demand forindigenous tree products will not decline in West Africa (Gustad et al.,2004). Irungu (2007) documented an increased demand and found thattraditional African leafy vegetables, which were once considered primitiveand unfashionable, have now become a delicacy in Nairobi and areconsumed in most homes at all levels. Thus, globalisation, urbanisationand demographic changes could change present consumption patterns,which in turn may cause traditional food products to be lost from thediet (Azam-Ali & Battcock, 2001).
Due to globalisation, the ethnic population in the European Union hasgrown and this has increased the demand for ethnic food products.Although ethnic groups may have adopted much of the European cuisine,they maintain at least a part of their culinary traditions (Babb, 1990;CBI, 2006). Lively ethnic markets exist in France, UK, Portugal andBelgium (Tabuna, 1999, 2000), and baobab and tamarind products havebeen encountered on the ethnic markets of Paris, London and Brussels(Verhaeghe, 2009). The latter study reported, however, that all tamarindproducts sold were all imported from Asia.
In addition, more and more European tourists enjoy a ‘tropical lifestyle’during their holidays and take home memories of the tropical cuisineand refreshing juices. Because of that, European consumers tend tobe open towards new ethnic and tropical fruits and juices (CBI, 2005d,2006). Indeed, Sabbe et al. (2008) found that tropical fruits are generallyperceived by consumers in Europe as attractive, special, tasty, healthyand nutritious. The potential of, in particular, baobab is great whenthe variation in marketable products is considered. E.g. BFCS (2011)sells baobab fruit shells as packaging material, baobab fruit pulp asdietary supplements or for cosmetic formulations, baobab seed powderas exfoliant or scrub, and baobab seed oil for use in cosmetics ornutritional formulation. In addition, Bennett (2006) published a listwith the potential growth and key markets for various baobab products.Gruenwald & Galizia (2005) identified baobab fruit pulp as an interestingcandidate for a new generation of functional foods and nutraceuticals dueto its nutritional and health claims, and food technology functions.
In Europe, food niche markets, such as fair-traded and organic-labelledfoods, are among the fastest expanding market segments in the fooddistribution sector. In addition, they do not require large volumes for
5.2. SWOT and impact analysis 197
trade, and offer possibilities for obtaining premium prices for producers(Vantomme, 2003b). Several NTFPs are ideally fit for such markets,particularly those which have at the same time a high per unit value,a long shelf live, and are easy to process, store and handle (Vantomme,2003b). In fact, both baobab and tamarind products are characterisedby those properties and can thus be considered good candidates for fairtrade and/or organic markets (Box 5.3).
Environmental impact
In West Africa, increasing population and a high rate of land useintensification are resulting in the degradation of the Sahelian parklandsand thus a decrease in the most important indigenous trees, whichin turn reduces the availability of wild products to local populations(Dhillion & Gustad, 2004; Kalinganire et al., 2007). Additionally, localand regional high demand of baobab leaves in West Africa may reducethe number of fruiting baobab trees due to unsustainable leaf harvesttechniques that often include removing flower buds (Assogbadjo, 2006).Large branches of baobab trees are often deliberately pruned to stimulateleaf growth instead of fruit production. Local people in West Africa usecertain specific criteria to differentiate baobab and tamarind individualsin situ (Assogbadjo et al., 2006a, 2008; Fandohan et al., 2011a). As aresult, gathering may affect the genetic diversity of baobab and tamarindpopulation being exploited, especially when harvesting fruits that showdifferent traits (Arnold & Ruiz Perez, 2001). In addition, some authorswarn that successful development and commercialisation of NTFPs maylead to increased harvesting and overexploitation (Stewart, 2003; Ticktin,2004; Belcher et al., 2005) as sustainable harvesting is rarely reported(Bennett, 2002). This suggests that many NTFPs will require some kindof management if they are to withstand heavy harvest pressure (Ticktin,2004) and this could mean bringing NTFPs into domestication (Marshallet al., 2006b).
In West Africa, baobab and tamarind might be classified as species inthe early stages of domestication, yet without established, well-knownvarieties (Assogbadjo et al., 2008). Although there are currently noplantations nor conservation areas that have been specifically set asidefor their protection, both species bear great potential for sustainabledomestication and development, and to promote their conservation.Therefore, it is crucial to develop and formulate policies, regulations
198 Chapter 5. Discussion and recommendations
Box 5.3: Niche markets
Conventional export markets bypass many of the poor small-scalefarmers. Therefore, it is more likely that smallholders will be able tobenefit from global markets if they are able to tap into niche markets(Hellin & Higman, 2002), such as fair trade and organic markets. Inboth cases, there are a number of environmental and social criteria thathave to be met before a product can be sold in either of these markets(Hellin & Higman, 2002). Success stories of fair and organic trade arethe baobab products traded by both PhytoTrade Africa/Afriplex andBFCS (BFCS, 2011; PhytoTrade Africa, 2011).
Certification is becoming very important in the natural product sector,including that of NTFPs (Ham et al., 2008). Providing consumers withassurances that products have certain embedded values is a significantgrowth area in agriculture and natural product marketing (Bennett,2006). Indeed, because consumers are increasingly concerned aboutsocial and ecological impacts of modern agriculture (Hellin & Higman,2002; CBI, 2005c; Van Looy et al., 2008), fair trade and organic marketsare growing in Europe, with annual growth rates of respectively 42.3 %and 5-15 % (CBI, 2005b).
Fair trade Fair trade aims to improve the social, environmental andeconomic conditions of the most disadvantaged producers in developingcountries by offering them the opportunity to move out of extremepoverty through creating market access under beneficial rather thanexploitative terms (Hellin & Higman, 2002; Vantomme, 2003b; Nicholls& Opal, 2005; Bennett, 2006).
Organic production Organic agriculture is a production systemthat sustains the health of soils, ecosystems and people, and relies onecological processes, biodiversity and cycles adapted to local conditions,rather than the use of inputs with adverse effects, such as syntheticfertilisers and pesticides (Hellin & Higman, 2002; Vantomme, 2003b;Bennett, 2006).
Although the potential of certification for natural products, the currentlyavailable information shows that experiences and data on NTFPcertification are scarcely out of the egg (Vantomme, 2003b).
5.3. Recommendations and scenarios for intervention 199
and/or strategies which will ensure that exploitation, processing,commercialisation and on-farm cultivation of indigenous trees does notpose a threat to their conservation (Shackleton et al., 2002; Akinnifesiet al., 2004). The policies required could be grouped as legislative andregulatory, marketing, extension en research issues, with considerableoverlap between them (Schreckenberg et al., 2006).
5.3 Recommendations and scenarios forintervention
5.3.1 Framework to develop marketing chains
Recommendations and scenarios for intervention will be formulated withinthe scope of two frameworks developed by the Royal Tropical Institute,namely chain participation (KIT et al., 2006) and trading up (KIT &IIRR, 2008). Hereafter, both frameworks are shortly introduced in Boxes5.4 and 5.5.
5.3.2 Local chain development: building linkages andenhancing trust
Prerequisites for all recommended interventions for local chaindevelopment are the will, motivation, or incentive of a chain actor toconduct a specific action, and the capacity to do so (Gruere et al.,2007a). Hereafter some necessary interventions for chain participation,chain upgrading and trading up will be given that are relevant for thecases studied in the present PhD thesis. The intention of the author is notto give a review of all possible recommendations, but to make a selectionof interventions that are considered to have the highest impact on thedevelopment of the commercialisation of baobab and tamarind productsin Mali and Benin in order to better valorise these products and developtheir markets.
Chain participation A necessary first step to chain development isto support smallholders to become crop specialists or chain actors by(i) ensuring that smallholders have the basic assets (e.g. financial,physical, human en social capital, and natural resources); (ii) improvingtheir production and management skills; and (iii) building smallholders’

200 Chapter 5. Discussion and recommendations
Box 5.4: Chain participation
Smallholders can participate in marketing chains in many different ways,which can be summarized into two broad dimensions (KIT et al., 2006;Marshall et al., 2006b):
• chain activities: being involved in various activities in the chain iscalled vertical integration; and
• chain management: having a high degree of control over chainmanagement is known as horizontal integration.
These two dimensions can be combined into a chain participation matrixas shown in Figure 5.2. Upgrading as a chain actor, a prerequisite to beable to achieve any form of chain development, means becoming a cropspecialists with a clear market orientation (KIT et al., 2006). As a chainactor, a smallholder can add value through vertical integration and thusincrease the involvement in a number of chain activities, e.g. movinginto joint processing and marketing. It is worth to note that verticalintegration will shorten the marketing chain by cutting out traders orother intermediaries. Another way in which smallholders can add value isto get involved in chain management and develop chain partnerships, e.g.cooperation with other chain actors undertaking similar roles. Whencombining both vertical and horizontal integration, chain actors candevelop ownership over the chain, e.g. building direct linkages withconsumers. This diagonal movement in Figure 5.2 will also enhanceaspects as information management, quality management, innovationmanagement, chain cooperation and marketing intelligence (KIT et al.,2006).
It should be noted that there is no ideal chain position for smallholdersas this depends on their specific situation and may change over time,whereby costs may outweigh benefits (KIT et al., 2006). Whereashorizontal integration may increase the smallholders’ negotiating power,vertical integration may facilitate and promote establishment ofspecialised niche marketing chains (Marshall et al., 2006b). Verticalintegration is often preferred by smallholders because they think thatadding activities will also provide extra income. However, this is notalways true as adding activities may also mean adding extra costsand risks. Moreover, increasing the number of activities often requiresadditional assets and skills, such as technology, finance, human resourcesand organisation (KIT et al., 2006).
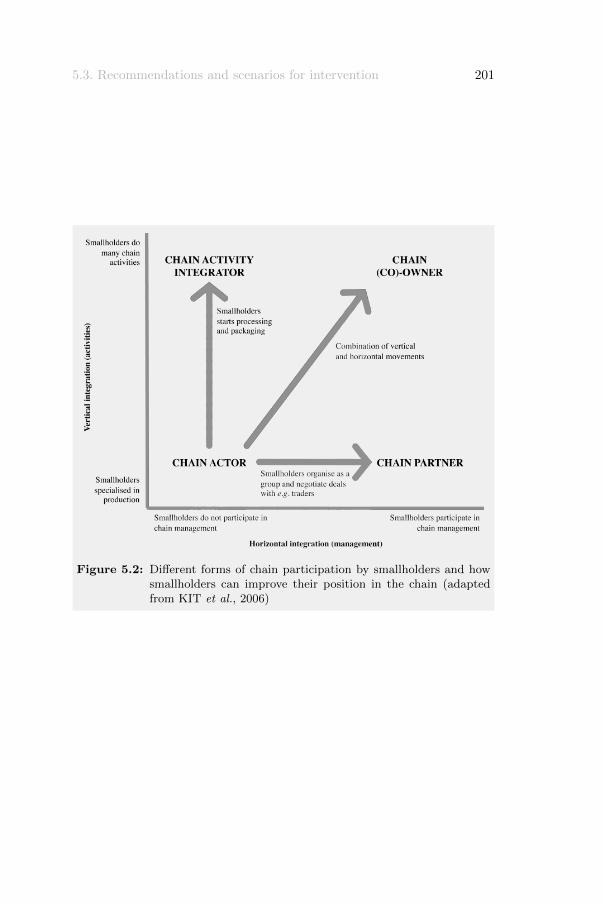
5.3. Recommendations and scenarios for intervention 201
Figure 5.2: Different forms of chain participation by smallholders and howsmallholders can improve their position in the chain (adaptedfrom KIT et al., 2006)

202 Chapter 5. Discussion and recommendations
Box 5.5: Trading up
There are two basic types of strategies for improved trading relations(KIT & IIRR, 2008), creating:
• stronger chain relations: create well-organised business relationsbetween the various actors in the value chain; and
• stronger market institutions: establish standards, regulations,policies and services to coordinate and support trading activities.
Whereas the first type of strategy seeks to improve the conditions fortrading within the value chain, the latter seeks to improve the conditionsin the business environment around the value chain (KIT & IIRR,2008). Stronger chain relations can be achieved by organising chainactors, creating mutual understanding, specialising on certain roles andservices, developing a chain partnership and coordinating the chain(KIT & IIRR, 2008). Stronger market institutions can be achieved bydeveloping market information systems, standardising quality, weightsand measures, developing contract enforcement mechanisms, providingfinancial services, and using policy leverage or advocacy (KIT & IIRR,2008).
The market interactions matrix in Figure 5.3 gives insights in possibleways to organise trading relations between smallholders and traders ina beneficial way, a process also known as trading up. Successful casestudies have demonstrated that to accomplish sustainable improvementsin trading or trading up, there needs to be simultaneous attention forimproved chain relations and stronger market institutions (KIT & IIRR,2008).
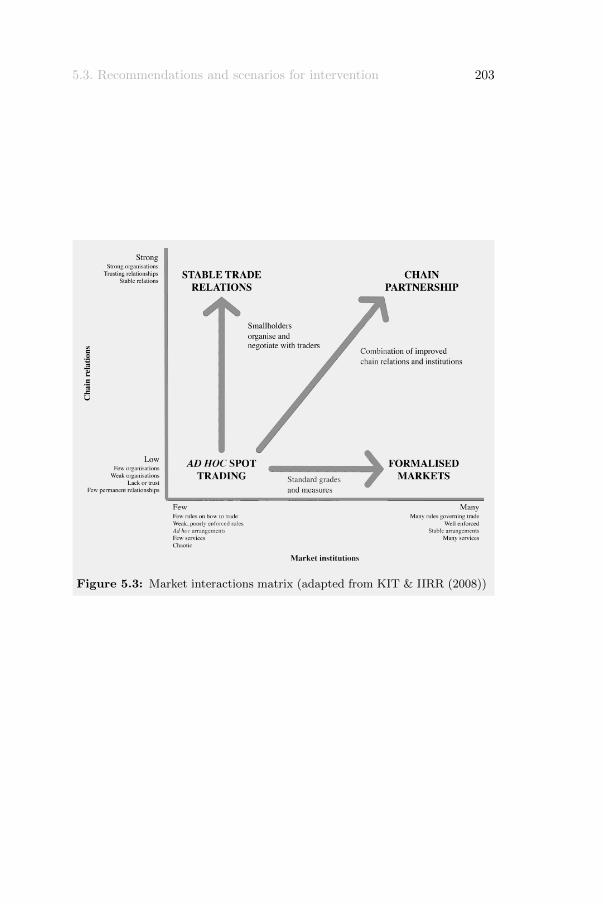
5.3. Recommendations and scenarios for intervention 203
Figure 5.3: Market interactions matrix (adapted from KIT & IIRR (2008))
204 Chapter 5. Discussion and recommendations
understanding of market chains, competition, consumer demands, farmersorganisations and contracts (KIT et al., 2006).
• Recommended interventions: domestication of baobab andtamarind, and training of smallholders.
• Goal: smallholders become specialised in producing baobaband tamarind, offer fairly attractive products, become organisedamong themselves and develop basic assets, management skills,understanding of markets and willingness to innovate.
Domestication of baobab and tamarind should be based on the principlesdeveloped and adopted by the World Agroforestry Centre and documentedby e.g. Kalinganire et al. (2007) and Tchoundjeu et al. (2006, 2007).Hereby, domestication, product development and commercialisationshould be seen as a cyclic process without a clear starting or endingpoint (Leakey & Izac, 1996; Akinnifesi et al., 2004) rather than separateinterventions. If domestication and commercialisation of agroforestry treeproducts occur in parallel problems regarding seasonality and reliabilityof supply, diversity and inconsistency of fruit quality will be overcomethroughout the market chain (Akinnifesi et al., 2006; Nevenimo et al.,2007). This is, however, a long-term investment that may requireyears to translate into profits for chain actors (Akinnifesi et al., 2006).Domestication and commercialisation projects of baobab and tamarindin West Africa should start/continue in collaboration with the WorldAgroforestry Centre. One of the advantages is that, in the pilotvillages selected by the World Agroforestry Centre, gaining confidenceand building-up truthful relationship with the local community will befacilitated due to an existing long-term collaboration.
Chain upgrading: horizontal integration When chain actors wantto exercise greater influence in the chain and aim at becoming achain partner, they need to develop abilities such as negotiating prices,developing technologies and setting quality standards. Therefore, theymay opt for a partnership strategy, i.e. horizontal integration, basedon shared interests and mutual growth (KIT et al., 2006). Farmerorganisations or producer groups can play a key role in organisingeconomic activities, as they might – unlike individual smallholders –benefit from market information, capital and skills, volume and quality(KIT et al., 2006; Jaenicke & Lengkeek, 2008). By linking up with abuyer, farmer organisations or producer groups can increase their businesssecurity and gradually improve and expand their businesses.

5.3. Recommendations and scenarios for intervention 205
• Recommended interventions: supporting smallholders to associate,collaborate and coordinate, enhancing trust, exchanginginformation, and communication and bargaining with a focuson shared interests.
• Goal: specialised and organised farmer groups of baobab andtamarind products cooperating with processors or traders.
Many authors acknowledge that collective action plays an essential role increating market access for smallholders (Gruere et al., 2007b; Will, 2008;Kruijssen et al., 2009; Jaenicke, 2010; Kwaschik et al., 2010) as it increasesthe bargaining power and economies of scale of small-scale producersand processors (Bienabe & Sautier, 2005; Marshall et al., 2006b). Theformation of community-based organisations, whereby smallholders canpool resources and market their products collectively, could overcome thehigh transaction costs resulting from their small size (Will, 2008; Kruijssenet al., 2009). Moreover, it can improve their access to resources (such asinputs, credit, training, transport and information), increase bargainingpower, and facilitate certification and labeling (Bienabe & Sautier, 2005;Will, 2008; Kruijssen et al., 2009). Information is needed on markets(demand, end-uses, supply), marketing factors (products, distributionchannels, promotion and prices), competition and marketing environment(including social, economic, technological, regulatory, legal, cultural andinfrastructural environments) (Lintu, 1995).
Chain upgrading: vertical integration When chain actors sell theirproduce as raw material at low prices, while at the end of the chain theconsumer pays a price that is many times higher, they may feel thatthey get little return from the market. These smallholders may increasetheir income by adding business activities usually together with othersmallholders, i.e. vertical integration (KIT et al., 2006). The easiest wayis by investing in higher productivity, better quality and specialisation;marketing is best left to traders (KIT & IIRR, 2008).
• Recommended intervention: grading of the (primary, processed)product into homogeneous quality grades, each with a differentprice, each eventually for a different market segment.
• Goal: quality management assures that the product can find itsway into the market, and that both the product and the productionprocesses satisfy the consumer.
206 Chapter 5. Discussion and recommendations
In addition, commercially viable processing enterprises require productuniformity and consistently good quality, availability of new andimproved processing technologies to meet market requirements, necessarymachinery and equipment, and adequate and easy access to the necessaryinformation on processing, packaging, marketing, product preservation,etc. (Ham et al., 2008; Haq et al., 2008). Successful processing stories,such as those of PhytoTrade Africa (Welford & Le Breton, 2008; Lombard& Leakey, 2010) and BFCS (BFCS, 2011), may be inspiring in how toachieve product research and development, and how to develop marketsand market awareness.
Trading up: stronger trade relations Smallholders and traders willbenefit if they manage to make their chain relationships more stable, moretransparent and better organised (KIT & IIRR, 2008).
• Recommended intervention: organising chain actors, creatingmutual understanding, and specialising in certain roles and services.
• Goal: create stronger and stable trade relations betweensmallholders and traders.
Trading up: stronger market institutions Market institutions arenorms, rules, regulations, policies or services that shape the way inwhich farmers and traders interact. They give structure and supportto trade activities, thereby reducing the costs and risks that farmers andtraders face in their businesses. They form the business environment thatsurrounds the trading activities in the market chain. Improving marketinstitutions is a basic strategy to improve trading (KIT & IIRR, 2008).
• Recommended interventions: developing transparent marketinformation systems, standardising quality, weights and measures,and providing basic infrastructure and financial services.
• Goal: create formalised markets with, on the one hand, accurateinformation on the availability, price and quality for making gooddecisions as to where, when, to whom, and at what price to buyor sell, and, on the other hand, standardisation of quality features,size, weight and/or packaging of a product.
The aim of all these interventions should be that baobab and tamarindproducts are better valorised and find their way into the market.Therefore, all recommended interventions must be tailored to market

5.3. Recommendations and scenarios for intervention 207
demands (KIT et al., 2006). As a result, there is a strong need tostudy consumer behaviour, needs and preferences that underpin existingconsumption (Jordaan et al., 2008) as a better understanding of consumerpreferences is essential to market development (Mishili et al., 2009).Another important issue is that the focus on developing market outletsfor baobab and tamarind products needs to be kept in balance with theuse of these products to meet subsistence needs (Arnold & Ruiz Perez,1998; Buchmann et al., 2010).
Successful implementation of these strategies for developing the marketchain of baobab and tamarind products will need the implication andcollaboration of the private sector, NGO’s, governments and researchinstitutes (GFU, 2003).
5.3.3 ... and beyond?
Once the major domestic limitations have been tackled, commercialisationof baobab and tamarind products on regional scale should be developedand expanded in West Africa. Simultaneously, international marketsshould be targeted. In Europe, a dynamic and increasing demand forvarious tropical fruits is manifesting itself. This rising demand can beexplained by increased consumers’ health consciousness and interest infruit consumption in general, as well as by population growth of ethnicminorities in Europe and international travel and global communication(CBI, 2006). Hereby, quick gains can be made by strengtheningcollaboration and knowledge exchange with other countries or continents,where the same species (or varieties) are better valued or are alreadyextensively commercially utilised (Jama et al., 2008; Fandohan et al.,2010a). Key examples for production practices and marketing potentialof tamarind can be found in Asian countries, such as India and Thailand.Commercialisation of the products of the African baobab can be inspiredby the development of a marketing chain for the roots of the Australianboab (Adansonia gregorii) as a novel vegetable into a gourmet vegetablemarket (Johnson et al., 2002, 2006).
A combination of strong domestic, regional, and international marketsseems the best option allowing for diversification, and thus increasedlivelihood resilience against fluctuations in any one of these markets(Buchmann et al., 2010).


6General conclusions
210 Chapter 6. General conclusions
This final chapter gives the overall conclusions of this PhD research basedon the objectives and formulates directions for future research.
6.1 Main results per objective
Most aspects of the market chains of baobab and tamarind productsin Mali and Benin studied in the present research have – according tothe author’s knowledge – not yet been studied and published elsewhere.Therefore, this research should be considered as a pilot case study inobtaining insight in the structure and functioning of the markets of baobaband tamarind products.
6.1.1 Chain actors and their activities
Gatherers
Gatherers of baobab and tamarind products can be categorised assmallholders according to the definition of Davis (2006). Additionally,gatherers in Mali and Benin are involved in primary processing of baobaband tamarind products. After harvesting, they transform fresh baobableaves into dry baobab leaves and/or baobab leaf powder, baobab fruitsare processed into baobab fruit pulp, tamarind leaves are dried, andtamarind fruit pods are stripped from their shell. In the present study,the portion of cash income obtained from baobab and tamarind productsis about 4 % for the poorest and 5 % for the richer households in Mali,whereas, in Benin, a contribution of up to 11 % is reported for the poorestgroup of smallholders. These results show thus that baobab and tamarindcash income can be supplementary to the more important crop cashincome. Moreover, marketing of baobab and tamarind products happensprincipally in the dry season, which is also the period during which otheragricultural products are becoming scarce and thus more expensive. Thissuggests that commercialisation of baobab and tamarind products mayprovide cash income complementary to other income generating activities,and thus act as a financial buffer. This confirms that baobab and tamarindproducts fall into the gap-filling income category as defined by Marshallet al. (2006b). The present study showed also that gatherers in Maliharvest baobab and tamarind products mainly for home consumption,whereas, in Benin, most of the produce is sold by gatherers and may thusprovide an income.
6.1. Main results per objective 211
The majority of surveyed gatherers in Mali and Benin reported to sell theirbaobab and tamarind products at the farmgate. Baobab and tamarindfruits and leaves are harvested using traditional harvesting techniques,which only require manual labour and low-cost tools. According tofield observation and also substantiated by some authors (Assogbadjo,2006; Buchmann et al., 2010), leaf harvesting practices, in the case ofbaobab, may negatively impact on fruit production. Therefore, in general,sustainable harvesting practices need to be developed and proposed topromote the species’ conservation and avoid overexploitation. Particularlyfor baobab leaves, baobab market gardens as developed by the WorldAgroforestry Centre and its partners (ICRAF, 2003) can be recommended.At last, surveyed gatherers in Mali and Benin mentioned dangerousharvesting techniques, seasonality and limited availability of baobab andtamarind products, time-consuming processing practices, product qualityand a lack of market information as their major problems.
Traders
Traders of baobab and tamarind products fulfil different and varyingfunctions, which points to a lack of functional specialisation. Therefore,the term trader in the present study encompasses collectors/assemblers,wholesalers, retailers and petty traders. Moreover, next to baobab andtamarind products, traders sell a great variety of other food products.Traders of baobab and tamarind products are mainly women, whichconfirms that NTFPs are generally traded by women (Ndoye et al., 1998;Fafchamps & Gabre-Madhin, 2001; Ahenkan & Boon, 2010). Findingsin the present study revealed three possible price setting processes: (i)fair negotiation, usually when the produce is sold at the market place;(ii) traders have more bargaining power, especially when the produce issold at the farmgate; and (iii) collecting gatherers in Benin have moreinfluence in the price setting than traders. The latter shows the beneficialimpact of collective action strategies in increasing the bargaining powerof smallholders. Additionally, the present study identified distinct tradecentres for baobab leaf powder, baobab fruit pulp and tamarind fruit podsin Mali and Benin. The surveyed traders reported the following principalproblems: variable product quality, limited storage space, transportdifficulties due to poor roads, lack of market information and no access toformal financial services.
212 Chapter 6. General conclusions
Processors
Processors in Benin reported to make juice from baobab and tamarindfruit pulp, whereas in Mali, processors use baobab and tamarind fruitsin the preparation of juice, syrup, jam and instant juice powder.Additionally, baobab fruit pulp is used in Mali for the preparation ofmillet cream (locally called degue). This shows that surveyed processorsare solely involved in secondary processing. Additionally, processing isgenerally not reported as a one-man’s business and processing (family)enterprises were found to transform a whole range of different products.The present study reported that traditionally processing practices arewidely adopted in Mali and Benin, however, several authors found thatlocal processing techniques may have a negative impact on the productquality (Sidibe et al., 1996, 1998b; Scheuring et al., 1999; Hell et al.,2009). Notwithstanding the manual processing techniques and simplicityof equipment used, the portion of efficient processors identified by meansof a data envelopment analysis is 63 % in Mali and 49 % in Benin.Thus, processors appear to be efficient under the given circumstancesin Mali and Benin. The major cost that processors in both countriesface is the cost of packaging material, which has also been mentionedin literature as the main barrier for small-scale processors (Fafchamps &Gabre-Madhin, 2001; Gabre-Madhin, 2001; Fafchamps, 2004; Abeyrathne& Jaenicke, 2006; Shepherd, 2007). Moreover, surveyed processors inMali and Benin reported inappropriate and expensive packaging material,limited availability of adequate processing equipment, bad transport dueto poor road infrastructure, lack of financial means and limited marketinformation as main constraints.
Consumers
The present study showed that both rural and urban consumers buy anduse baobab and tamarind products on a regular basis. Baobab fruit pulpis reported to be used in porridges and/or juices, whereas baobab leavesare used in sauce preparations. Most surveyed consumers use tamarindleaves and fruits in the preparation of juices and/or for souring meals.Substitution products for all baobab and tamarind products are reportedin the present study and confirmed by literature. The main problemsrecorded by consumers are seasonality of supply, price fluctuations andunreliable product quality.
6.1. Main results per objective 213
6.1.2 Market chains
In total, six different baobab and tamarind products are reported in thisstudy to be traded in Mali and Benin. Based on the market maps drawnfor these products, three different market chains were identified.
Market chain of fresh baobab leaves and tamarind leaves
The market chain of fresh baobab leaves in Mali and Benin and tamarindleaves in Mali is short as only two to four different chain actors areinvolved, namely gatherers, retailers, petty traders and consumers. Directon-farm sales and rural primary markets are the most important markettypes, whereas rural and urban retail markets play a minor role. Thismarket chain is characterised as locally important and has thus a domesticpotential.
Market chain of dry baobab leaves and baobab leaf powder
The number of actors involved in the market chain of dry baobableaves and baobab leaf powder varies between two and six in Mali,and may include gatherers, collectors/assemblers, wholesalers, retailers,petty traders and consumers. In Benin, up to five actors take part inthe market chain of baobab leaf powder, namely gatherers, collectinggatherers, retailers, petty traders and consumers. Thus, two differencesin chain actors between Mali and Benin have been surveyed. First, nowholesalers were identified in Benin. Secondly, the collecting and bulkingfunction is done by collecting gatherers in Benin, whereas in Mali this isthe task of collectors/assemblers. Most transactions take place in ruralprimary markets, and rural and urban retail markets. When collectorsare involved in the chain, assembly/(semi-) wholesale markets and on-farm sales become also important. Additionally, in Mali, direct selling atthe farmgate was reported. The market chain of dry baobab leaves andbaobab leaf powder have a clear local, provincial and national importance.Moreover, regional trade in baobab leaf powder has been reported. As aresult, this market chain is characterised as important on domestic levelwith a regional potential.
Market chain of baobab and tamarind fruits
In the market chain of baobab and tamarind fruits, up toseven different actors may be involved in Mali and include
214 Chapter 6. General conclusions
gatherers, wholesalers/collectors, retailers, petty traders, processors,caterers/retailers and consumers. In Benin, ten different actors can beidentified, namely gatherers, collecting gatherers, collectors/assemblers,wholesalers, retailers/collectors, retailers/petty traders, petty traders,processors, caterers/retailers and consumers. As not all these differentchain actors are interlinked with each other, a maximum of six actorshave been reported to be linked in the chain. Moreover, some of the actorshave similar tasks and are consequently competitors of each other. All fourmarket types are important, namely on-farm sales, rural primary markets,assembly/(semi-) wholesale markets, and rural and urban retail markets.Besides a clear national importance of the market chain of baobab andtamarind fruits in Mali and Benin, regional trade have been recorded,whereas international market potential has been reported in literature.Thus, this market chain is characterised by its domestic and regionalimportance with international potential.
6.1.3 Market chain analysis
Nevertheless the importance of baobab and tamarind products inlocal West African markets has been recognised (Gustad et al., 2004;Assogbadjo et al., 2008; Buchmann et al., 2010; Fandohan et al., 2010a;van der Stege et al., 2011), only a few authors have reported aboutmarketed quantities and prices. The present study is the first that hasrecorded quantities bought and sold, and purchasing and selling prices fordifferent actors involved in the commercialisation of baobab and tamarindproducts in Mali and Benin. Based on the quantities and prices recorded,baobab fruit pulp is traded in larger quantities in Benin than in Mali,whereas baobab leaf powder and tamarind fruit pods are marketed inlarger quantities in Mali than in Benin. Prices are lower in Benin forbaobab fruit pulp and baobab leaf powder than in Mali, while tamarindfruit pods are cheaper in Mali when compared to Benin. Prices surveyedfor baobab leaf powder and fruits are in the same order of those foundin literature, whereas tamarind fruit pods in the present study werefound to be more expensive than the prices reported in literature. Basedon both own figures and FAO estimates, an extrapolation shows thatthe commercialisation of baobab fruit pulp in Mali involves more than400,000 gatherers, about 165 wholesalers, and at least 5,000 petty traders.Moreover, at least 35,000 gatherers, about 440 wholesalers and more than9,000 petty traders take part in the market chain of tamarind fruit pods inMali. In conclusion, commercialisation of baobab and tamarind products
6.1. Main results per objective 215
creates a lot of employment opportunities. In addition, added values forbaobab and tamarind products were calculated in the present study andshow that processors and gatherers tend to have the highest added values.This trend is found to be more pronounced in Mali than in Benin. Asadded value does not take into account any costs, it is impossible to givea decision about which actor has the highest margins.
The availability of baobab and tamarind products is determined by thephenology of the trees. Baobab bears only leaves during the rainy season,whereas tamarind leaves are available throughout the year. The fruitingperiod of both baobab and tamarind coincides with the dry season inMali and Benin. As a result, harvesting of baobab and tamarind fruits,and baobab leaves is highly seasonal. This is further reflected in thecommercialisation of baobab and tamarind products which is found tooccur chiefly during the dry season in Benin. In Mali, marketing ofbaobab and tamarind products is observed to be less seasonal. However,no seasonal storage has been surveyed in Mali and Benin due to a lack ofstorage infrastructure, space and financial means. Most surveyed chainactors typically purchase a certain volume of produce, which is storeduntil it is sold, after which they replenish their stock. As a result,storage duration is observed to be very variable. In the present study,dry baobab and tamarind products are mainly stored in recycled rice bagswhich are kept in the house or in a storehouse or granary, in respectivelyBenin and Mali. Even though humidity and bug, mice and fungi attackswere reported as main problems during storage, the informants ratedoverall storage conditions as good. But some authors pointed out thatthese traditional storage practices may negatively affect the quality of theproduce (Sidibe & Williams, 2002; Cisse et al., 2009; Chadare, 2010).
In the present study, all baobab and tamarind products are not gradednor standardised. Direct inspection is the only method reported by whichquality is assessed. Moreover, it has been observed that different actorsuse different quality criteria. All chain actors in Mali and Benin attachgreat importance to processing and storage techniques for baobab andtamarind products, and expect a well-dried or finely ground productwithout impurities, which has not been exposed to humidity. Additionally,colour and taste are important quality parameters in Mali, whereas tasteis only a criterion in Benin for baobab and tamarind fruits. Maturity,freshness and size, together with the absence of insects or insect lesionsare important quality criteria used to assess quality of tamarind fruits and
216 Chapter 6. General conclusions
leaves in Mali. The same criteria are used in Benin to inspect the qualityof fresh baobab leaves.
Lack of market information is commonly recognised to be a majorconstraint in the commercialisation of NTFPs (Neumann & Hirsch, 2000).This was confirmed in the present study as the majority of surveyedchain actors stated that market information is lacking. Information isparticularly lacking about harvesting and processing techniques, price,quality and demand. Chain actors in Mali particularly need moreinformation about demand and they reported not to be satisfied aboutthe access to information. In contrast, surveyed actors in Benin needespecially information about quality and say to be rather satisfiedwith overall information flow. Incomplete or non-transparent marketinformation leads to market failure (KIT & IIRR, 2008).
SWOT analysis
In Mali and Benin, both baobab and tamarind are multi-purposeindigenous tree species which are well-known and often used by localpopulations because of their nutritional value and health benefits, andhave the potential to generate income on existing domestic markets.Besides, both species have been identified by local people as priorityspecies for domestication and they are included in research anddevelopment programmes of many international research organisations toimprove food and health security and alleviate poverty. On internationallevel, baobab and tamarind products are interesting candidates to enterpromising market segments, such as functional foods and nutraceuticals.Additionally, the novel food approval of baobab fruit pulp may boost theinternational trade of this product. Next to this international marketpotential, also regional trade has been reported to be important. Baobaband tamarind seeds are often regarded as by-products of fruit processing.However, their potential is significant in the marketing of edible andcosmetic oils (Akinnifesi et al., 2005; Bennett, 2006).
But, domestic markets are characterised by a lack of organisation, poorstorage facilities, limited market infrastructure and weak linkages, whereaschain actors have undeveloped entrepreneurial skills, limited access toformal financial services and a lack of market information. Moreover,there is a great variation in product quality due to wild harvesting fromundomesticated trees (Akinnifesi et al., 2006; Belcher & Schreckenberg,2007; Nevenimo et al., 2007) and rudimentary processing techniques,
6.1. Main results per objective 217
and grading or standardisation are non-existent in Mali and Benin.Governments in SSA fail to provide basic market infrastructure. Dueto a lack of official recognition and national regulations, the inclusionof indigenous species in national research programmes is limited. Oninternational level, baobab and tamarind products may, on the one hand,be so exotic in taste that this may act as a barrier to consumption (Sabbeet al., 2009b), and, on the other hand, face competition with similarproducts from other countries, regions or continents.
Impact analysis
Baobab and tamarind are widely used to supplement the largely cereal-based diets of many of the rural populations in Mali and Benin andhave thus the potential to play a pivotal role in achieving the targetset by FAO and WHO, namely a daily consumption of 400 g fruits andvegetables. Moreover, baobab and tamarind products are rich in mineralsand vitamins which makes them interesting candidates to combat hiddenhunger. However, up till now, no studies have been done to assess thebioavailability of essential nutrients in these species.
Increased urbanisation may expand the size of domestic and regionalmarkets for baobab and tamarind products. Due to globalisation, ethnicfood markets as well as international demand for exotic and novel foodproducts will grow. This opens perspectives for baobab and tamarindproducts to enter new market segments, such as niche markets andfunctional foods.
In West Africa, increasing population and a high rate of land useintensification are resulting in the degradation of the Sahelian parklandsand thus a decrease in the most important indigenous trees, such asbaobab and tamarind. Additionally, local leaf harvesting techniquesmay reduce the number of fruits per tree. Therefore, domestication andconservation of baobab and tamarind should be promoted.
6.1.4 Recommendations and scenarios forintervention
Local chain development should build linkages and enhance trustbetween actors in the market chain. This can be achieved byinterventions formulated within the frameworks of chain participation,chain upgrading and trading up. Recommendations are formulated
218 Chapter 6. General conclusions
in many fields: (i) parallel domestication and commercialisation ofbaobab and tamarind; (ii) training of smallholders to improve theirproduction and management skills; (iii) supporting smallholders toassociate, collaborate and coordinate to achieve economies of scale intheir transactions with buyers; (iv) making channels of information andmarket intelligence accessible to all chain actors;(v) enabling chain actorsto understand and better satisfy product, process or delivery standardsrequired by buyers; and (vi) improving market institutions. The aimof all these interventions should be that baobab and tamarind productsare better valorised and find their way into the market. Therefore, allrecommended interventions must be tailored to consumer preferences.
Once the major domestic limitations have been tackled, commercialisationof baobab and tamarind products on regional scale should be developedand expanded in West Africa. Simultaneously, international marketsshould be targeted as, in Europe, a dynamic and increasing demandfor various tropical fruits is manifesting itself. A combination of strongdomestic, regional, and international markets seems the best optionallowing for diversification, and thus increased livelihood resilience againstfluctuations in any one of these markets (Buchmann et al., 2010).
6.2 Limitations and directions for futureresearch
The present study combined various research methods and tools, bothquantitative and qualitative, to obtain a holistic view of the structureand functioning of baobab and tamarind markets and trade channels inMali en Benin. The results of this research are undoubtedly invaluable toobtain insights in how baobab and tamarind products can be valorised inMali and Benin. Nonetheless, there are some limitations on this study.
The semi-structured interviews were long, sometimes too long to keep therespondents’ attention and consisted of a wide range of questions, whichmight have hindered respondents to stay focused. As a consequence, theauthor had to cope with missing, incomplete and inconsistent data. Inturn, this lead, during data analysis, to numerous estimates, assumptionsand/or simplifications, which probably had an influence on the accuracyof results.
Although a great population was sampled, an even greater sample size

6.2. Limitations and directions for future research 219
would have been better in order to explain quantitative differences and/orsimilarities reported between individual respondents. This is the reasonwhy the author was sometimes unable to give a(n) (clear) explanationof the results found. In addition, the data sampling plan was rathercomplex as two countries, six food products and different chain actorswere taken into account. Although this allowed for many results, it madedata analysis difficult.
Another challenge was the – by the author so-called – ‘snapshot’technique, which means that one single field research was performed ineach country. As no repetitions in time occurred, seasonal fluctuationscould not be evidenced and data were assumed to be mean figures. In somecases, the latter might have led to under- or misestimations. Additionally,the period during which field research was performed, did not coincide inboth countries, i.e. in Mali data were collected during the wet season,whereas in Benin data collection took place during the dry season. Thismight have biased the information given by the respondents.
Finally, and additionally to the limitations mentioned above, themultidisciplinary and at the same time holistic character of the presentstudy restricted some in-depth interpretation of results. However, thisleaves scope for future research.
According to the author, three types of further research and actionare needed. Primarily, a follow-up in-depth market chain analysis isrequired for each baobab and tamarind product taking into account thequantitative assessment of (i) marketing costs and margins (per kg, perlabour day, per einvested) of each chain actor; (ii) price fluctuationsbetween seasons, regions and market types (rural, urban, wholesale, retail,etc.); and (iii) post-harvest practices such as processing, storage andtransport. Secondly, a detailed study of each chain actor is recommended.Such a single actor study should aim to identify roles and needs, andempower competences of each actor implied in the market chain in orderto formulate tailored strategies to improve each stakeholder’s competitiverole within the chain. Hereby, special attention should focus on theconsumer as more emphasis is needed on assessing demand and gettingto know consumers’ preferences in order to promote specific marketsegments. Finally, the results of the two preceding studies should feed intoan integrative strategic action plan to build linkages and enhance trust inorder to develop the market chain of baobab and tamarind products.

Bibliography
Abeyrathne A. & Jaenicke H. (2006). Potential for Small ScaleProcessing and Marketing of Tropical Fruits in the Kandy, Galle andHorana Divisional Secretariat Divisions of Sri Lanka. Research ReportNo. 1. ICUC - International Centre for Underutilised Crops, Colombo,Sri Lanka.
Abrahams C. (2010). Transforming the region: supermarkets and thelocal food economy. African Affairs, 109:115–134.
Afolabi O. & Popoola T. (2005). The effect of baobab pulp powder onthe micro flora involved in tempe fermentation. European Food Researchand Technology, 220:187–190.
Agea J. , Ssebuliba E. & Obaa B. (2005). Marketing of agroforestryproducts in Nama sub-county, Mukono district, Uganda. African CropScience Conference Proceedings, 7:537–540.
Ahenkan A. & Boon E. (2010). Commercialization of non-timber forestproducts in Ghana: Processing, packaging and marketing. Journal ofFood, Agriculture & Environment, 8:962–969.
Ahenkan A. & Boon E. (2011). Non-timber forest products (NTFPs):clearing the confusion in semantics. Journal of Human Ecology, 33:1–9.
Ahmad Y. & Ahmad I. , editors (2007). Proceedings of the internationalseminar on economics and marketing of tropical and subtropical fruits,16-18 July 2007, Kuala Lumpur, Malaysia. TFNet - InternationalTropical Fruits Network.
Ajayi I. , Dawodu F. , Oderinde R. & Egunyomi A. (2003). Fatty acidcomposition and metal content of Adansonia digitata seeds and seedsoil. La Rivista Italiana delle Sostanze Grasse, LXXX:41–43.

222 Bibliography
Ajayi I. , Oderinde R. , Kajogbola D. & Uponi J. (2006). Oil contentand fatty acid composition of some underutilized legumes from nigeria.Food Chemistry, 99:115–120.
Akinnifesi F. , Ajayi O. , Sileshi G. , Matakala P. , Kwesiga F. ,Ham C. , Kadzere I. , Mhango J. , Mng’omba S. , Chilanga T. &Mkonda A. (2008a). Creating opportunities for domesticating andcommercializing Miombo indigenous fruit trees in southern Africa. InAkinnifesi F. , Leakey R. , Ajayi O. , Sileshi G. , Tchoundjeu Z. ,Matakala P. & Kwesiga F. , editors, Indigenous Fruit Trees in theTropics: Domestication, Utilization and Commercialisation, chapter 8,pp. 137–170. CABI - CAB International, Oxfordshire, UK.
Akinnifesi F. , Jordaan D. & Ham C. (2005). Building opportunities forsmallholder farmers to commoditize indigenous fruit trees and productsin southern Africa: 2. processing, markets, and rural livelihoods.In Proceedings of Conference on International Agricultural Researchfor Development - Tropentag 2005, 11-13 October 2005, Stuttgart-Hohenheim, Germany.
Akinnifesi F. , Kwesiga F. , Mhango J. , Chilanga T. , Mkonda A. ,Kadu C. , Kadzere I. , Mithofer D. , Saka J. , Sileshi G. , RamadhaniT. & Dhliwayo P. (2006). Towards the development of Miombo fruittrees as commercial tree crops in southern Africa. Forests, Trees andLivelihoods, 16:103–121.
Akinnifesi F. , Kwesiga F. , Mhango J. , Mkonda A. , Chilanga T. & SwaiR. (2004). Domesticating priority for Miombo indigenous fruit treesas a promising livelihood option for small-holder farmers in southernAfrica. Acta Horticulturae, 632:15–30.
Akinnifesi F. , Sileshi G. , Ajayi O. & Tchoundjeu Z. (2008b). Accelerateddomestication and commercialization of indigenous fruit and nut treesto enhance better livelihoods in the tropics: Lessons and way forward.In Akinnifesi F. , Leakey R. , Ajayi O. , Sileshi G. , Tchoundjeu Z. ,Matakala P. & Kwesiga F. , editors, Indigenous Fruit Trees in theTropics: Domestication, Utilization and Commercialisation, chapter 1,pp. 1–27. CABI - CAB International, Oxfordshire, UK.
Al-Fatimi M. , Wurster M. , Schroder G. & Lindequist U. (2007).Antioxidant, antimicrobial and cytotoxic activities of selected medicinalplants from Yemen. Journal of Ethnopharmacology, 111:657–666.

Bibliography 223
Albu M. & Griffith A. (2005). Mapping the market: A frameworkfor rural enterprise development policy and practice. Technical report,Practical Action, Markets and Livelihoods Programme, Warwickshire,UK.
Albu M. & Griffith A. (2006). Mapping the market: participatorymarket-chain development in practice. Small Enterprise Development,17:12–22.
Almeida M. , de Sousa P. , Fonseca M. , Magalhaes C. , Lopes M. F. &de Lemos T. (2009). Avaliacao de macro e microminerais em frutastropicais cultivadas no nordeste brasileiro. Ciencia e Technologia deAlimentos, 29:581–586.
Almond F. & Hainsworth S. , editors (2005). Beyond Agriculture - makingmarkets work for the poor: proceedings of an international seminar, 28February - 1 March 2005, Westminster, London, UK. CPHP - CropPost-Harvest Research Programme, Natural Resources InternationalLimited, Kent, UK and Practical Action, Warwickshire, UK.
Ambe G.-A. (2001). Les fruits sauvages comestibles des savanesguineennes de Cote-d’Ivoire: etat de la connaissance par unepopulation locale, les Malinke. Biotechnology, Agronomy, Society andEnvironment, 5:43–58.
Ambrose-Oji B. (2003). The contribution of NTFPs to the livelihoods ofthe ’forest poor’: evidence from the tropical forest zone of south-westCameroon. International Forestry Review, 5:106–117.
Anani K. , Hudson J. , de Souza C. , Akpaganal K. , Tower G. , AmasonJ. & Gbeassor M. (2000). Investigation of medicinal plants of Togo forantiviral and antimicrobial activities. Pharmaceutical Biology, 38:40–45.
Angelsen A. & Wunder S. (2003). Exploring the forest – poverty link: keyconcepts, issues and research implications. CIFOR Occasional PaperNo. 40. CIFOR - Center for International Forestry Research, BogorBarat, Indonesia.
Anonymous (2007). Strategie de croissance pour la reduction de lapauvret’e. Technical report, Republique du Benin.
224 Bibliography
APG II (2003). An update of the angiosperm phylogeny groupclassification for the orders and families of flowering plants: APG II.Botanical Journal of the Linnean Society, 141:399–436.
Arnold J. (1995). Socio-economic benefits and issues in non-wood forestproducts use. In FAO , editor, Report of the International ExpertConsultation on Non-Wood Forest Products. Non-Wood Forest Products3. FAO - Food and Agriculture Organization of the United Nations,Rome, Italy.
Arnold J. & Ruiz Perez M. (1998). The role of non-timber forestproducts in conservation and development. In Wollenberg E. & InglesA. , editors, Incomes from the forest. Methods for the development andconservation of forest products for local communities. CIFOR - Centerfor International Forestry Research, Bogor Barat, Indonesia & IUCN -The World Conservation Union.
Arnold J. & Ruiz Perez M. (2001). Can non-timber forest products matchtropical forest conservation and development objectives? EcologicalEconomics, 39:437–447.
Arnold T. , Wells M. & Wehmeyer A. (1985). Khoisan food plants:taxa with potential for future economic exploitation. In Wickens G. ,Goodin J. & Field D. , editors, Plants for Arid Lands, chapter 6, pp.69–86. Allen and Unwin, London, UK.
Arvanitoyannis I. , Choreftaki S. & Tserkezou P. (2005). An update ofEU legislation (directives and regulations) on food-related issues (safety,hygiene, packaging, technology, GMOs, additives, radiation, labelling):presentation and comments. International Journal of Food Science andTechnology, 40:1021–1112.
Assogbadjo A. (2006). Importance socio-economique et etude dela variabilite ecologique, morphologique, genetique et biochimique dubaobab ( Adansonia digitata L.) au Benin. Ph.D. thesis, Faculty ofBioscience Engineering, Ghent University, Belgium.
Assogbadjo A. , De Caluwe E. , Sinsin B. , Codjia J. & Van DammeP. (2006a). Indigenous knowledge of rural people and importance ofbaobab tree (Adansonia digitata L.) in Benin. In Proceedings of the IVthInternational Congress of Ethnobotany, 21-26 August 2005, Istanbul,Turkey, pp. 39–47.

Bibliography 225
Assogbadjo A. , Glele Kakaı R. , Chadare F. , Thomson L. , Kyndt T. ,Sinsin B. & Van Damme P. (2008). Folk classification, perception,and preferences of baobab products in West Africa: Consequences forspecies conservation and improvement. Economic Botany, 62:74–84.
Assogbadjo A. , Glele Kakaı R. , Edon S. , Kyndt T. & Sinsin B. (2011).Natural variation in fruit characteristics, seed germination and seedlinggrowth of Adansonia digitata L. in Benin. New Forests, 41:113–125.
Assogbadjo A. , Glele Kakaı R. , Kyndt T. & Sinsin B. (2010).Conservation genetics of baobab (Adansonia digitata L.) in theparklands agroforestry systems of Benin (West Africa). NotulaeBotanicae Horti Agrobotanici Cluj-Napoca, 38, Special Issue:136–140.
Assogbadjo A. , Kyndt T. , Chadare F. , Sinsin B. , Gheysen G. ,Eyog Matig O. & Van Damme P. (2009a). Genetic fingerprinting usingAFLP cannot distinguish traditionally classified baobab morphotypes.Agroforestry Systems, 75:157–165.
Assogbadjo A. , Kyndt T. , Sinsin B. , Gheysen G. & Van DammeP. (2006b). Patterns of genetic and morphometric diversity in baobab(Adansonia digitata): Populations across different climatic zones ofBenin (West Africa). Annals of Botany, 97:819–830.
Assogbadjo A. , Sinsin B. , Codjia J. & Van Damme P. (2005a).Ecological diversity and pulp, seed and kernel production of the baobab(Adansonia digitata L.) in Benin. Belgian Journal of Botany, 138:47–56.
Assogbadjo A. , Sinsin B. , De Caluwe E. & Van Damme P. (2009b).Developpement et domestication du baobab au Benin. LEA-FSA-UAC/DADOBAT, Cotonou, Benin.
Assogbadjo A. , Sinsin B. & Van Damme P. (2005b). Caracteresmorphologiques et production des capsules de baobab (Adansoniadigitata L.) au Benin. Fruits, 60:327–340.
Awono A. , Ndoye O. , Schreckenberg K. , Tabuna H. , Isseri F. & TempleL. (2002). Production and marketing of safou (Dacryodes edulis) inCameroon and internationally: market development issues. Forests,Trees and Livelihoods, 12:125–147.
226 Bibliography
Azam-Ali S. & Battcock M. (2001). Promoting and protecting traditionalfood products. issues paper 4. Technical report, DFID Crop PostHarvest Programme.
Azami S. (2002). Use of information for promotion of underutilisedfruit trees. In Haq N. & Hughes A. , editors, Fruits for the Futurein Asia: Proceedings of the Consultation Meeting on the Processingand Marketing of Underutilised Tropical Fruits in Asia. ICUC -International Centre for Underutilised Crops, Southampton, UK.
Babb E. (1990). Marketing new crops. In Janick J. & Simon J. , editors,Advances in new crops, pp. 6–11. Timber Press, Portland, OR, USA.
Bammann H. (2007). Participatory value chain analysis for improvedfarmers income, employment opportunities and food security. Technicalreport, FAO - Food and Agriculture Organization of the United Nations,Sub-Regional Office for the Pacific Islands, Apia, Samoa.
Banker R. , Charnes A. & Cooper W. (1984). Some models for estimatingtechnical and scale efficiency in data envelopment analysis. ManagementScience, 30:1078–1092.
Barminas J. , Charles M. & Emmanuel D. (1998). Mineral compositionof non-conventional leafy vegetables. Plant Foods for Human Nutrition,53:29–36.
Barry I. (2007). A value-chain analysis for the Sri Lankan rambutansubsector. research report no. 2. Technical report, ICUC - InternationalCentre for Underutilised Crops, Colombo, Sri Lanka.
Bationo B. , Lamien N. , Demers N. & Kandji S. (2009). Culture dubaobab Adansonia digitata L. (Bombacaceae) en planche maraıchere:une methode pour simplifier sa recolte et favoriser sa propagation auSahel. Bois et Forets des Tropiques, 299:80–86.
Baum D. (1995a). The comparative pollination and floral biology ofbaobabs (adansonia - bombacaceae). Annals of the Missouri BotanicalGarden, 82:322–348.
Baum D. (1995b). A systematic revision of adansonia (Bombacaceae).Annals of the Missouri Botanical Garden, 82:440–471.
Bibliography 227
Baum D. , Small R. & Wendel J. (1998). Biogeography and floralevolution of baobabs (adansonia, bombacaceae). Systematic Biology,47:181–207.
Becker B. (1983). The contribution of wild plants to human nutrition inthe Ferlo (northern Senegal). Agroforestry Systems, 1:257–267.
Belcher B. (2003). What isn’t an NTFP? International Forestry Review,5:161–168.
Belcher B. (2005). Forest product markets, forests and poverty reduction.International Forestry Review, 7:82–89.
Belcher B. , Ruız Perez M. & Achdiawan R. (2005). Global patterns andtrends in the use and management of commercial NTFPs: Implicationsfor livelihoods and conservation. World Development, 33:1435–1452.
Belcher B. & Schreckenberg K. (2007). Commercialisation of non-timberforest products: A reality check. Development Policy Review, 25:355–377.
Bennett B. (2002). Forest products and traditional peoples: economic,biological, and culural considerations. Natural Resources Forum,26:293–301.
Bennett B. (2006). Foreign direct investment in South Africa: Howbig is southern Africa’s natural product opportunity and what tradeissues impede sectoral development? Technical report, RTFP - RegionalTrade Facilitation Programme, Pretoria, South Africa.
Bernet T. , Devaux A. , Ortiz O. & Thiele G. (2005). Participatorymarket chain approach. BeraterInnen News, 1:8–13.
Bernet T. , Thiele G. & Zschocke T. (2006). Participatory Market ChainApproach (PMCA) - User Guide. CIP - International Potato Center,Lima, Peru.
Besco E. , Braccioli E. , Vertuani S. , Ziosi P. , Brazzo F. ,Bruni R. , Sacchetti G. & Manfredini S. (2007). The useof photochemiluminescence for the measurement of the integralantioxidant capacity of baobab products. Food Chemistry, 102:1352–1356.
228 Bibliography
Best R. , Ferris S. & Schiavone A. (2005). Building linkages andenhancing trust between small-scale rural producers, buyers in growingmarkets and suppliers of critical inputs. In Almond F. & HainsworthS. , editors, Beyond Agriculture - making markets work for the poor:proceedings of an international seminar, 28 February - 1 March 2005,Westminster, London, UK, pp. 19–50. CPHP - Crop Post-HarvestResearch Programme, Natural Resources International Limited, Kent,UK and Practical Action, Warwickshire, UK.
BFCS (2011). http://www.baobabfruitco.com.
Bienabe E. & Sautier D. (2005). The role of small-scale producers’organisations in addressing maket access. In Almond F. & HainsworthS. , editors, Beyond Agriculture - making markets work for the poor:proceedings of an international seminar, 28 February - 1 March 2005,Westminster, London, UK, pp. 69–85. CPHP - Crop Post-HarvestResearch Programme, Natural Resources International Limited, Kent,UK and Practical Action, Warwickshire, UK.
Bioversity International (2011). SAFORGEN. http://www2.bioversityinternational.org/information sources/networks/saforgen.
Boffa J.-M. (1999). Agroforestry parklands in sub-Saharan Africa. FAOConservation Guide No. 34. FAO - Food and Agriculture Organizationof the United Nations, Regional Office for Asia and the Pacific, Rome,Italy.
Bosch C. , Sie K. & Asafa B. (2004). Adansonia digitata L. In GrubbenG. & Denton O. , editors, PROTA 2: Vegetables/Legumes. PROTA,Wageningen, the Netherlands.
Boukari I. , Shier N. , Fernandez R. X. , Frisch J. , Watkins B. , PawloskiL. & Fly A. (2001). Calcium analysis of selected western Africanfoods. Journal of Food Composition and Analysis, 14:37–42.
Bourou S. , Ndiaye F. , Diouf M. , Diop T. & Van Damme P. (2010).Tamarind (Tamarindus indica L.) parkland mycorrhizal potentialwithin three agro-ecological zones of Senegal. Fruits, 65:1–9.
Boxall P. & Beckley T. (2002). An introduction to approaches andissues for measuring non-market values in developing economies. InCampbell B. & Luckert M. , editors, Uncovering the hidden harvest.Valuation methods for woodland & forest resources. People and plants

Bibliography 229
conservation series, chapter 4, pp. 103–140. Earthscan PublicationsLtd, London, UK.
Buchmann C. , Prehsler S. , Hartl A. & Vogl C. (2010). The importanceof baobab (Adansonia digitata L.) in rural west African subsistence -suggestion of a cautionary approach to international market export ofbaobab fruits. Ecology of Food and Nutrition, 49:145–172.
Burkill H. (1985). The Useful Plants of West Tropical Africa. RoyalBotanical Gardens Kew, UK.
Carr W. (1955). Ascorbic acid content of baobab fruit. Nature, 176:1273.
Cavendish W. (2002). Quantitative methods for estimating the economicvalue of resource use to rural households. In Campbell B. & Luckert M. ,editors, Uncovering the hidden harvest. Valuation methods for woodland& forest resources. People and plants conservation series, chapter 2, pp.17–65. Earthscan Publications Ltd, London, UK.
CBI (2005a). EU legislation: Novel foods including traditional foods.Technical report, CBI - Centre for the Promotion of Imports fromDeveloping Countries, Rotterdam, The Netherlands.
CBI (2005b). EU market survey: organic food products. Technical report,CBI - Centre for the Promotion of Imports from developing countries,Rotterdam, The Netherlands.
CBI (2005c). Fresh fruit and vegetables: EU market survey 2005.Technical report, CBI - Centre for the Promotion of Imports fromDeveloping Countries, Rotterdam, The Netherlands.
CBI (2005d). Fruit juices and concentrates: EU market brief 2005.Technical report, CBI - Centre for the Promotion of Imports fromDeveloping Countries, Rotterdam, The Netherlands.
CBI (2006). The fresh fruit and vegetables market in the EU: CBI marketsurvey. Technical report, CBI - Centre for the Promotion of Importsfrom Developing Countries, Rotterdam, The Netherlands.
CGIAR Science Council (2005). Summary report on system priorities forCGIAR research 2005-2015. Technical report, CGIAR Science Council,Rome, Italy.
230 Bibliography
Chadare F. (2010). Baobab ( Adansonia digitata L.) foods fromBenin: composition, processing and quality. Ph.D. thesis, WageningenUniversity, Wageningen, The Netherlands.
Chadare F. , Hounhouigan J. , Linnemann A. , Nout M. & van BoekelM. (2008). Indigenous knowledge and processing of Adansonia digitataL. food products in Benin. Ecology of Food and Nutrition, 47:338–362.
Chadare F. , Linnemann A. , Hounhouigan J. , Nout M. & van BoekelM. (2009). Baobab fruit products: A review on their compositionand nutritional value. Critical Reviews in Food Science and Nutrition,49:254–274.
Charnes A. , Cooper W. & Rhodes E. (1978). Measuring the efficiencyof decision making units. European Journal of Operational Research,2:429–444.
Chavas J.-P. , Petrie R. & Roth M. (2005). Farm householdproduction efficiency: Evidence from the Gambia. American Journalof Agricultural Economics, 87:160–179.
CIA (2011a). https://www.cia.gov.
CIA (2011b). The world fact book - Africa: Benin. http://www.cia.gov.
CIA (2011c). The world fact book - Africa: Mali. http://www.cia.gov.
Cisse M. , Sakho M. , Dornier M. , Diop C. , Reynes M. & Sock O. (2009).Caracterisation du fruit du baobab et etude de sa transformation ennectar. Fruits, 64:19–34.
Clark J. (1998). Taste and flavour: their importance in food choice andacceptance. Proceedings of the Nutrition Society, 57:639–643.
Codjia J. , Assogbadjo A. & Ekue M. (2003). Diversite et valorisation auniveau local des ressources vegetales forestieres alimentaires du Benin.Cahiers d’etudes et de recherches francophones / Agricultures, 12:321–331.
Codjia J. , Fonton B. , Assogbadjo A. & Ekue M. (2001). Le baobab( Adansonia digitata): une espece a usage multiple au Bnin. CocoMultimdia, Cotonou, Benin.
Bibliography 231
Coelli T. , Rahman S. & Thirtle C. (2002). Technical, allocative, costand scale efficiencies in Bangladesh rice cultivation: A non-parametricapproach. Journal of Agricultural Economics, 53:607–626.
Coelli T. , Rao D. , O’Donnell C. & Battese G. (2005). An Introductionto Efficiency and Productivity Analysis. Springer, New York, USA.
Corry S. (1993). ‘Harvest moonshine’ taking you for a ride. Technicalreport, Survival International, London, UK.
Crawford I. (1997). Agricultural And Food Marketing Management. FAO -Food and Agriculture Organization of the United Nations, Rome, Italy.
Cuni Sanchez A. , Haq N. & Assogbadjo A. (2010). Variation in baobableaf morphology and its relation to drought tolerance. Genetic Resourceand Crop Evolution, 57:17–25.
da Silva C. & de Souza Filho H. (2007). Guidelines for rapid appraisalof agrifood chain performance in developing countries. AgriculturalManagement, Marketing and Finance Occasional Paper 20. FAO - Foodand Agriculture Organization of the United Nations, Rome, Italy.
DADOBAT (2006). Domestication and development of baobab andtamarind. Specific Targeted Research Project.
Daniel J. & Dudhade P. (2007). Analysis of economic characteristics ofvalue chains of three underutilised fruits of India. research report no. 3.Technical report, ICUC - International Centre for Underutilised Crops,Colombo, Sri Lanka.
Danthu P. , Roussel J. , Gaye A. & El Mazzoudi E. (1995).Baobab (Adansonia digitata L.) seed pretreatments for germinatonimprovement. Seed Science and Technology, 23:469–475.
Davis J. (2006). How can the poor benefit from the growing marketsfor high value agricultural products? In Proceedings of InternationalWorkshop on ’How can the poor benefit from the growing markets forhigh value agricultural products’, 3-5 October 2005, Cali, Colombia.Natural Resource Institute, Kent, UK.
Dawson I. , Guarino L. & Jaenicke H. (2007). Underutilised plant species:Impacts of promotion on biodiversity. Position Paper No. 2. ICUC -International Centre for Underutilised Crops, Colombo, Sri Lanka.
232 Bibliography
de Beer J. & McDermott M. (1989). The economic value of non-timber forest products in southeast Asia with emphasis on Indonesia,Malaysia and Thailand. Technical report, The Netherlands Committeefor IUCN - International Union for the Conservation of Nature,Amsterdam, The Netherlands.
De Caluwe E. , De Smedt S. , Assogbadjo A. , Samson R. , Sinsin B. &Van Damme P. (2009a). Ethnic differences in use value and use patternsof baobab (Adansonia digitata L.) in northern benin. African Journalof Ecology, 47:433–440.
De Caluwe E. , Halamova K. & Van Damme P. (2009b). Adansoniadigitata L. - a review of traditional uses, phytochemistry andpharmacology. In Juliani H. , Simon J. & Ho C. , editors, AfricanNatural Plant Products: Discoveries and Challenges in Quality Control,chapter 4, pp. 51–84. American Chemical Society, Washington DC,USA.
De Caluwe E. , Halamova K. & Van Damme P. (2009c). Tamarindusindica L. - a review of traditional uses, phytochemistry andpharmacology. In Juliani H. , Simon J. & Ho C. , editors, AfricanNatural Plant Products: Discoveries and Challenges in Quality Control,chapter 5, pp. 85–110. American Chemical Society, Washington DC,USA.
De Caluwe E. , Halamova K. & Van Damme P. (2010a). Adansoniadigitata L. - a review of traditional uses, phytochemistry andpharmacology. Afrika Focus, 23:11–51.
De Caluwe E. , Halamova K. & Van Damme P. (2010b). Tamarindusindica L. - a review of traditional uses, phytochemistry andpharmacology. Afrika Focus, 23:53–83.
Dhillion S. & Gustad G. (2004). Local management practices influencethe viability of the baobab (Adansonia digitata Linn.) in different landuse types, Cinzana, Mali. Agriculture, Ecosystems and Environment,101:85–103.
Dhungana B. , Nuthall P. & Nartea G. (2004). Measuring the economicinefficiency of Nepalese rice farms using data envelopment analysis.Australian Journal of Agricultural and Resource Economics, 48:347–369.
Bibliography 233
Diallo B. , Joly H. , McKey D. , Hossaert-McKey M. & Chevallier M.-H. (2007). Genetic diversity of Tamarindus indica populations: Anyclues on the origin from its current distribution? African Journal ofBiotechnology, 6:853–860.
Diallo B. , Joly H. , McKey D. , Hossaert-McKey M. & ChevallierM.-H. (2010). Variation des caracteres biometriques des graineset des plantules de neuf provenances de Tamarindus indica L.(Caesalpinioideae). Fruits, 65:153–167.
Diallo B. , McKey D. , Chevallier M.-H. , Joly H. & Hossaert-McKey M. (2008). Breeding system and pollination biology ofthe semi-domesticated fruit tree, Tamarindus indica L. (Leguminosae:Caesalpinioideae): Implications for fruit production, selective breeding,and conservation of genetic resources. African Journal of Biotechnology,7:4068–4075.
Dijkstra T. (1997). Marketing channel analysis: Relevant aspects forhorticultural trade in sub-Saharan Africa. In Trading the fruits of theland: Horticultural marketing channels in Kenya, chapter 4, pp. 53–67.Ashgate Publishing Ltd, Hants, UK.
Dimara E. , Pantzios C. , Skuras D. & Tsekouras K. (2005). The impactsof regulated notions of quality on farm efficiency: A DEA application.European Journal of Operational Research, 161:416–431.
Diop A. , Sakho M. , Dornier M. , Cisse M. & Reynes M. (2005). Lebaobab africain (Adansonia digitata L.): principales caracteristiques etutilisations. Fruits, 61:55–69.
Dolan C. , Humphrey J. & Harris-Pascal C. (1999). Horticulturecommodity chains: the impact of the UK market on the African freshvegetable industry. IDS Working Paper 96. Technical report, IDS -Institute of Development Studies, Brighton, UK.
Dovie D. , Shackleton C. & Witkowski E. (2006). Valuation of communalarea livestock benefits, rural livelihoods and related policy issues. LandUse Policy, 23:260–271.
ECOWAS-SWAC/OECD (2006). http://www.atlas-ouestafrique.org.
El-Siddig K. , Ebert G. & Ldders P. (1999). Tamarind (Tamarindusindica L.): a review on a multipurpose tree with promising future in
234 Bibliography
the Sudan. Journal of Applied Botany - Angewandte Botanik, 73:202–205.
El-Siddig K. , Gunasena H. , Prasad B. , Pushpakumara D. , Ramana K. ,Vijayanand P. & Williams J. (2006). Tamarind, Tamarindus indica L.Fruits for the future 1. CUC - Southampton Centre for UnderutilisedCrops, Southampton, UK.
Engelter C. & Wehmeyer A. (1970). Fatty acid composition of oilsof some edible seeds of wild plants. Journal of Agricultural and FoodChemistry, 18:25–26.
European Union (2008). Commission decision 2008/575/EC. OfficialJournal of the European Union, 11/07/2008 L 183:38–39.
Eyog Matig O. , Gaoue O. & Dossou B. , editors (2002). ReseauEspeces Ligneuses Alimentaires. Compte rendu de la premiere reuniondu Reseau tenue, 11-13 decembre 2000, Ouagadougou, Burkina Faso.IPGRI - Programme de ressources genetiques forestieres en Afrique ausud du Sahara.
Ezeagu I. , Petzke K. , Lange E. & Metges C. (1998). Fat content andfatty acid composition of oils extracted from selected wild-gatheredtropical plant seeds from Nigeria. Journal of the American OilChemists’ Society, 75:1031–1035.
Ezzati M. , Lopez A. , Rodgers A. , Hoorn S. & Murray C. (2002).Selected major risk factors and global and regional burden of disease.Lancet, 360:1347–1360.
Fafchamps M. (1997). Introduction: Markets in sub-Saharan Africa.World Development, 25:733–734.
Fafchamps M. (1999). Networks, communities and markets in sub-Saharan Africa: Implications for firm growth and investment. WPs/99-24. Technical report, CSAE - Centre for the Study of AfricanEconomies, University of Oxford, Oxford.
Fafchamps M. (2004). Market Institutions in sub-Saharan Africa - Theoryand Evidence. MIT Press, Massachusetts, USA.
Fafchamps M. & Gabre-Madhin E. (2001). Agricultural markets inBenin and Malawi: Operation and performance of traders. Policy
Bibliography 235
Research Working Paper WPS2734. Technical report, The World Bank,Washington, DC, USA.
Fafchamps M. & Hill R. (2005). Selling at the farmgate or traveling tomarket. American Journal of Agricultural Economics, 87:717–734.
Fandohan B. (2007). Structure des populations et importance socio-culturelle du tamarinier ( Tamarindus indica L.) dans la Communede Karimama (Benin). Master’s thesis, Faculte des SciencesAgronomiques, Universite d’Abomey-Calavi, Benin.
Fandohan B. , Assogbadjo A. , Glele Kakaı R. , Kyndt T. , De CaluweE. , Codjia J. & Sinsin B. (2010a). Women’s traditional knowledge,use value, and the contribution of tamarind (Tamarindus indica L.) torural households’ cash income in Benin. Economic Botany, 64:248–259.
Fandohan B. , Assogbadjo A. , Glele Kakaı R. , Kyndt T. &Sinsin B. (2011a). Quantitative morphological descriptors confirmtraditionally classified morphotypes of Tamarindus indica L. fruits.Genetic Resources and Crop Evolution, 58:299–309.
Fandohan B. , Assogbadjo A. , Glele Kakaı R. & Sinsin B. (2010b).Variation in seed morphometric traits, germination and early seedlinggrowth performances of Tamarindus indica L. International Journal ofBiological and Chemical Sciences, 4:1102–1109.
Fandohan B. , Assogbadjo A. , Glele Kakaı R. & Sinsin B. (2011b).Effectiveness of a protected areas network in the conservationof Tamarindus indica L. (Leguminosae-Caesalpinioideae) in Benin.African Journal of Ecology, 49:40–50.
Fandohan B. , Assogbadjo A. , Glele Kakaı R. & Sinsin B. (2011c).Geographical distribution, tree density and fruit production ofTamarindus indica L. (Fabaceae) across three ecological regions inbenin. Fruits, 66:65–78.
Fandohan B. , Assogbadjo A. , Glele Kakaı R. , Sinsin B. & Van DammeP. (2010c). Impact of habitat type on the conservation status oftamarind (Tamarindus indica L.) populations in the W national parkof Benin. Fruits, 65:11–19.
FAO (1995a). Non-wood forest products for rural income and sustainableforestry. Non-Wood Forest Products 7. FAO - Food and AgricultureOrganization of the United Nations, Rome, Italy.
236 Bibliography
FAO (1995b). Report of the International Expert Consultation on Non-Wood Forest Products. Non-Wood Forest Products 3. FAO - Food andAgriculture Organization of the United Nations, Rome, Italy.
FAO (1996). Domestication and commercialization of non-timber forestproducts in agroforestry systems. Non-Wood Forest Products 9. FAO -Food and Agriculture Organization of the United Nations, Rome, Italy.
FAO (1997). Agriculture food and nutrition for Africa - A resource bookfor teachers of agriculture. FAO - Food and Agriculture Organizationof the United Nations, Rome, Italy.
FAO (1999a). Mali: Apercus nutritionnels par pays. Technical report,FAO - Food and Agriculture Organization of the United Nations, Rome,Italy.
FAO (1999b). Towards a harmonized definition of non-wood forestproducts. Unasylva, 50:198.
FAO (2001). State of forest genetic resources in Sahelian and north-Sudanian Africa & Regional action plan for their conservation andsustainable use. Forest Genetic Resources Working Papers, WorkingPaper 2. Technical report, FAO, Forest Resources Development Service,Forest Resources Division, Rome, Italy.
FAO (2003). Benin: Apercus nutritionnels par pays. Technical report,FAO - Food and Agriculture Organization of the United Nations, Rome,Italy.
FAO (2010a). Benin - monitoring progress towards hunger reductiontargets of the World Food Summit and the Millennium DevelopmentGoals. Technical report, FAO - Food and Agriculture Organization ofthe United Nations, Rome, Italy.
FAO (2010b). Benin: Country profile: Food security indicators. Technicalreport, FAO - Food and Agriculture Organization of the United Nations,Rome, Italy.
FAO (2010c). Mali - monitoring progress towards hunger reduction targetsof the World Food Summit and the Millennium Development Goals.Technical report, FAO - Food and Agriculture Organization of theUnited Nations, Rome, Italy.
Bibliography 237
FAO (2010d). Mali: Country profile: Food security indicators. Technicalreport, FAO - Food and Agriculture Organization of the United Nations,Rome, Italy.
FAO (2010e). The second report on the state of the world’s plant geneticresources for food and agriculture. Technical report, FAO - Food andAgriculture Organization of the United Nations, Rome, Italy.
FAO (2010f). The state of food insecurity in the world. Adressing foodinsecurity in protraced crises. Technical report, FAO - Food andAgriculture Organization of the United Nations, Rome, Italy.
FAO (2011a). http://www.fao.org.
FAO (2011b). State of the world’s forests. Technical report, FAO - Foodand Agriculture Organization of the United Nations, Rome, Italy.
FAO & WHO (2005). Fruit and vegetables for health. In Proceedings ofa Joint FAO/WHO Workshop on Fruit and Vegetables for Health, 1-3 September 2004, Kobe, Japan, p. 46. FAO - Food and AgricultureOrganization of the United Nations, Rome, Italy & WHO - WorldHealth Organization, Geneva, Switzerland.
FAO Stat (2010). http://faostat.fao.org.
Fenner M. (1980). Some measurements on the water relations of baobabtrees. Biotropica, 12:205–209.
Ferrand D. , Gibson A. & Scott H. (2004). Making markets work for thepoor: An objective and an approach for governments and developmentagencies. Technical report, The ComMark Trust, Woodmead, SouthAfrica.
Ferris S. , Kaganzi E. , Best R. , Ostertag C. , Lundy M. & WandschneiderT. (2006). A Market Facilitator’s Guide to Participatory AgroenterpriseDevelopment. Enabling Rural Innovation (ERI) Guide 2. CIAT - CentroInternacional de Agricultura Tropical, Cali, Colombia.
FIAS (2007). Moving toward competitiveness: A value-chain approach.Technical report, The World Bank Group, Washington, DC, USA.
Fook J. , Macedoa L. , Moura G. , Teixeira A. , Oliveira A. , QueirozaA. & Salesa M. (2005). A serine proteinase inhibitor isolatedfrom Tamarindus indica seeds and its effects on the release of humanneutrophil elastase. Life Sciences, 76:2881–2891.

238 Bibliography
Franzel S. , Akinnifesi F. & Ham C. (2008). Setting priorities amongindigenous fruit tree species in Africa: Examples from southern, easternand western Africa regions. In Akinnifesi F. , Leakey R. , Ajayi O. ,Sileshi G. , Tchoundjeu Z. , Matakala P. & Kwesiga F. , editors,Indigenous Fruit Trees in the Tropics: Domestication, Utilization andCommercialisation, chapter 1, pp. 1–27. CABI - CAB International,Oxfordshire, UK.
Franzel S. , Jaenicke H. & Janssen W. (1996). Choosing the right trees:Setting priorities for multipurpose tree improvement. Technical report,ISNAR - International Service for National Agricultural Research, TheHague, The Netherlands.
Gabre-Madhin E. (2001). Market institutions, transaction costs, andsocial capital in the Ethiopian grain market. IFPRI Research Report124. Technical report, IFPRI - International Food Policy ResearchInstitute, Washington, USA.
Gaiwe R. , Nkulinkiye-Nfura T. , Bassene E. , Olschwang D. , Ba D. &Pousset J. (1989). Calcium et mucilage dans les feuilles de Adansoniadigitata (baobab). International Journal of Crude Drug Research,2:101–104.
Garrity D. (2004). Agroforestry and the achievement of the MillenniumDevelopment Goals. Agroforestry Systems, 61:5–17.
Gebauer J. (2003). Okophysiologie und Verwendungsmoglichkeiten derWildobstarten Adansonia digitata und Tamarindus indica im Sudan.Ph.D. thesis, Landwirtschaftlich-Gartnerischen Fakultat der Humboldt-Universitat zu Berlin.
Gebauer J. , El-Siddig K. & Ebert G. (2002a). Baobab (Adansoniadigitata L.): a review on a multipurpose tree with promising future inthe Sudan. Gartenbauwissenschaft, 67:155–160.
Gebauer J. , El-Siddig K. & Ebert G. (2002b). The potential of under-utilized fruit trees in Central Sudan. In Proceedings of Conference onInternational Agricultural Research for Development - Tropentag 2002,9-11 October 2002, Witzenhausen, Germany.
Gereffi G. (1999). International trade and industrial upgrading in theapparel commodity chain. Journal of International Economics, 48:37–70.
Bibliography 239
GFU (2003). Approaches and Decision Steps for the Promotion andDevelopment of Underutilized Plant Species. GFU - Global FacilitationUnit for Underutilized Species, Rome, Italy.
GFU (2011). http://www.underutilized-species.org.
Gibbon P. & Ponte S. (2005). Trading Down: Africa, Value Chains, andthe Global Economy. Temple University Press, Philadelphia, USA.
Giuliani A. (2007). Developing markets for agrobiodiversity: securinglivelihoods in dryland areas. Earthscan Publications Ltd, London, UK.
Giuliani A. , Adbulkarim N. & Buerli M. (2007). Linking biodiversityproducts to markets to improve the livelihoods of the resource poor:Case study on the market chain of capers in Syria. In Proceedings ofRegional Consultation on Linking Farmers to Markets: lessons learnedand successful practices, 29 January - 2 February 2006, Cairo, Egypt.
Giuliani A. & Padulosi S. (2005). Enhancing the value chain for marketsfor traditional products of (neglected and underutilized) aromatic,vegetable and fruit species in the Near East: a pilot study in Syria.In Promoting Cummunity-driven Conservation and Sustainable Use ofDryland Agrobiodiversity, ICARDA International Conference, 18-21April 2005, Aleppo, Syria.
Glew R. , Vanderjagt D. , Chuang L.-T. , Huang Y.-S. , Millson M. &Glew R. (2005). Nutrient content of four edible wild plants from WestAfrica. Plant Foods for Human Nutrition, 60:187–193.
Glew R. , Vanderjagt D. , Lockett C. , Grivetti L. , Smith G. , PastuszynA. & Millson M. (1997). Amino acid, fatty acid, and mineralcomposition of 24 indigenous plants of Burkina Faso. Journal of FoodComposition and Analysis, 10:205–217.
Granovetter M. (1985). Economic action and social structure: Theproblem of embeddedness. American Journal of Sociology, 91:481–510.
Gruenwald J. & Galizia M. (2005). Market brief in the European Unionfor selected natural ingredients derived from native species: Adansoniadigitata L. - baobab. Technical report, UNCTAD - The United NationsConference on Trade and Development & BioTrade Initiative / BTFP- BioTrade Facilitation Programme.
240 Bibliography
Gruere G. , Giuliani A. & Smale M. (2006). Marketing underutilizedplant species for the benefit of the poor: A conceptual framework. EPTdiscussion paper 154. Technical report, IFPRI - International FoodPolicy Research Institute, Washington, USA.
Gruere G. , Nagarajan L. & Oliver King E. (2007a). Collective actionand marketing of underutilized plant species: The case of minor milletsin Kolli Hills, Tamil Nadu, India. capri working paper no.69. InProceedings of Research Workshop on Collective Action and MarketAccess for Smallholders, 2-5 October 2006, Cali, Colombia.
Gruere G. , Nagarajan L. & Oliver King E. (2007b). Marketingunderutilized plant species for the poor: a case study of minor milletsin Kolli Hills, Tamil Nadu, India. Technical report, GFU - GlobalFacilitation Unit for Underutilized Species, Rome, Italy.
Gustad G. , Dhillion S. & Sidibe D. (2004). Local use and culturaland economic value of products from trees in the parklands of themunicipality of Cinzana, Mali. Economic Botany, 58:578–587.
Guzman I. , Arcas N. , Ghelfi R. & Rivaroli S. (2009). Technical efficiencyin the fresh fruit and vegetable sector: a comparison study of Italianand Spanish firms. Fruits, 64:243–252.
Ham C. , Akinnifesi F. , Franzel S. , du P.S. Jordaan D. , Hansmann C. ,Ajayi O. & de Kock C. (2008). Opportunities for commercialisationand enterprise development of indigenous fruits in southern Africa. InAkinnifesi F. , Leakey R. , Ajayi O. , Sileshi G. , Tchoundjeu Z. ,Matakala P. & Kwesiga F. , editors, Indigenous Fruit Trees in theTropics: Domestication, Utilization and Commercialisation, chapter 1,pp. 1–27. CABI - CAB International, Oxfordshire, UK.
Haq N. , Bowe C. & Dunsiger Z. (2008). Challenges to stimulating theadoption and impact of indigenous fruit trees in tropical agriculture.In Akinnifesi F. , Leakey R. , Ajayi O. , Sileshi G. , Tchoundjeu Z. ,Matakala P. & Kwesiga F. , editors, Indigenous Fruit Trees in theTropics: Domestication, Utilization and Commercialisation, chapter 3,pp. 50–69. CABI - CAB International, Oxfordshire, UK.
Havinga R. , Hartl A. , Putscher J. , Prehsler S. , Buchmann C. &Vogl C. (2010). Tamarinus indica L. (Fabaceae): patterns of use intraditional African medicine. Journal of Ethnopharmacology, 127:573–588.

Bibliography 241
Hell K. , Gnonlonfin B. , Kodjogbe G. , Lamboni Y. & AbdourhamaneI. (2009). Mycoflora and occurrence of aflatoxin in dried vegetablesin Benin, Mali and Togo, West Africa. International Journal of FoodMicrobiology, 135:99–104.
Hellin J. , Griffith A. & Albu M. (2005). Mapping the market: market-literacy for agricultural research and policy to tackle rural poverty inAfrica. In Almond F. & Hainsworth S. , editors, Beyond Agriculture- making markets work for the poor: proceedings of an internationalseminar, 28 February - 1 March 2005, Westminster, London, UK, pp.109–148. CPHP - Crop Post-Harvest Research Programme, NaturalResources International Limited, Kent, UK and Practical Action,Warwickshire, UK.
Hellin J. & Higman S. (2002). Smallholders and niche markets: lessonsfrom the Andes. Network paper no. 118. Technical report, AgREN -Agricultural Research & Extension Network.
Hellin J. & Meijer M. (2006). Guidelines for value chain analysis.Technical report, FAO - Food and Agriculture Organization of theUnited Nations, Rome, Italy.
Hermann M. (2009). The impact of the European novel food regulationon trade and food innovation based on traditional plant foods fromdeveloping countries. Food Policy, 34:499–507.
Hobbs J. , Cooney A. & Fulton M. (2000). Value market chains in theagrifood sector. What are they? How do they work? Are they for me?Technical report, Department of Agricultural Economics, University ofSaskatchewan, Canada.
Horna D. , Timpo S. & Gruere G. (2007). Marketing underutilized crops:The case of the African garden egg (Solanum aethiopicum)in Ghana.Technical report, GFU - Global Facilitation Unit for UnderutilizedSpecies, Rome, Italy.
Hudson J. , Ananil K. , Lee M. , de Souza C. , Arnason J. & GbeassorM. (2000). Further investigations on the antiviral activities of medicinalplants of Togo. Pharmaceutical Biology, 38:46–50.
Hughes A. & Haq N. (2003). Promotion of indigenous fruit trees throughimproved processing and marketing in Asia. International ForestryReview, 5:176–181.
242 Bibliography
ICRAF (2003). When a tree becomes a garden vegetable - baobab gardensin Mali. Agroforestry in Action, 2:1–2.
ICRAF (2007a). ICRAF agroforestry tree database: Adansonia digitataL. http://www.worldagroforestrycentre.org.
ICRAF (2007b). ICRAF agroforestry tree database: Tamarindus IndicaL. http://www.worldagroforestrycentre.org.
ICRISAT (2010). http://www.icrisat.org.
ICUC (2004). Baobab – Africa’s multipurpose upside-downtree to improverural livelihoods. A briefing paper for non-governmental and communitybased organizations (NGOs and CBOs). Technical report, ICUC -International Centre for Underutilised Crops, Colombo, Sri Lanka.
IFC (2009). Benin: port of Cotonou. Success Stories InfrastructureAdvisory, 10:1–2.
Igboeli L. , Addy E. & Salami L. (1997). Effects of some processingtechniques on the antinutrient contents of baobab seeds (Adansoniadigitata). Bioresource Technology, 59:29–31.
IMF (2008a). Benin: Poverty reduction strategy paper - annualprogress report. Technical report, IMF - International Monetary Fund,Washington D.C., USA.
IMF (2008b). Mali: Poverty reduction strategy paper. Technical report,IMF - International Monetary Fund, Washington D.C., USA.
IPGRI (2002). Neglected and Underutilized Plant Species: Strategic ActionPlan of the International Plant Genetic Resources Institute. IPGRI -International Plant Genetic Resources Institute, Rome, Italy.
Irungu C. (2007). Analysis of markets for African leafy vegetables withinNairobi and its environs and implications for on-farm conservationof biodiversity. Technical report, GFU - Global Facilitation Unit forUnderutilized Species, Rome, Italy.
Ishola M. , Agbaji E. & Agbaji A. (1990). A chemical study ofTamarindus indica (tsamiya) fruits grown in Nigeria. Journal of theScience of Food and Agriculture, 51:141–143.
Bibliography 243
Jaenicke H. (2006). Strengthening underutilised crops research anddevelopment in Africa and Asia. Technical report, ICUC - InternationalCentre for Underutilised Crops, Colombo, Sri Lanka.
Jaenicke H. (2010). Optimising the CGIAR’s contribution to global effortson the conservation and sustainable use of underutilized plant geneticresources –some thoughts about strategic priorities. Report preparedfor the Global Public Goods Programme Phase 2 of the System-wideGenetic Resources Programme. Technical report, ICUC - InternationalCentre for Underutilised Crops/Crops for the Future.
Jaenicke H. & Hoschle-Zeledon I. (2006). Strategic framework forunderutilized plant species research and development, with specialreference to Asia and the Pacific, and to sub-Saharan Africa. Technicalreport, ICUC - International Centre for Underutilised Crops, Colombo,Sri Lanka & GFU - Global Facilitation Unit for Underutilized Species,Rome, Italy.
Jaenicke H. & Lengkeek A. (2008). Marketing the productsof underutilized crops - challenges and opportunities for pro-pooreconomic development. Acta Horticulturae, 770:87–94.
Jama B. , Mohamed A. , Mulatya J. & Njui A. (2008). Comparing the”big five”: A framework for the sustainable management of indigenousfruit trees in the drylands of East and Central Africa. EcologicalIndicators, 8:170–179.
Janssens W. , Wijnen K. , De Pelsmacker P. & Van Kenhove P. (2008).Marketing research with SPSS. Pearson Education Ltd, Essex, UK.
Jensen A. (2009). Valuation of non-timber forest products value chains.Forest Policy and Economics, 11:34–41.
Johnson P. , Green E. , Crowhurst M. & Robinson C. (2006).Commercialisation of boab tubers. RIRDC Project No.DAW-108A.Technical report, RIRDC Publication No. 06/022. RIRDC - RuralIndustries Research and Development Corporation, Australia.
Johnson P. , Robinson C. & Green E. (2002). The prospect ofcommercialising boab roots as a vegetable. RIRDC Project No.DAW-95A. Technical report, RIRDC Publication No. 02/020. RIRDC - RuralIndustries Research and Development Corporation, Australia.
244 Bibliography
Jordaan D. P. , Akinnifesi F. , Ham C. & Ajayi O. (2008). The feasibilityof small-scale indigenous fruit processing enterprises in southern Africa.In Akinnifesi F. , Leakey R. , Ajayi O. , Sileshi G. , Tchoundjeu Z. ,Matakala P. & Kwesiga F. , editors, Indigenous Fruit Trees in theTropics: Domestication, Utilization and Commercialisation, chapter 1,pp. 1–27. CABI - CAB International, Oxfordshire, UK.
Kadzere I. , Watkins C. , Merwin I. , Akinnifesi F. , Saka J. & MhangoJ. (2006). Harvesting and postharvesting handling practices andcharacteristics of Uapaca kirkiana (Muell. Arg.) fruits: a survey ofroadside markets in Malawi. Agroforestory Systems, 68:133–142.
Kalaba F. , Chirwa P. & Prozesky H. (2009). The contribution ofindigenous fruit trees in sustaining rural livelihoods and conservationof natural resources. Journal of Horticulture and Forestry, 1:1–6.
Kalinganire A. , Weber J. , Uwamariya A. & Kone B. (2007). Improvingrural livelihoods through domestication of indigenous fruit trees in theparklands of the Sahel. In Akinnifesi F. , Leakey R. , Ajayi O. ,Sileshi G. , Tchoundjeu Z. , Matakala P. & Kwesiga F. , editors,Indigenous Fruit Trees in the Tropics: Domestication, Utillizationand Commercialization, chapter 10, pp. 186–203. CAB International,Oxfordshire, UK.
Kaplinsky R. , Memedovic O. , Morris M. & Readman J. (2003).The global wood furniture value chain: what prospects for upgradingby developing countries? unido sectoral studies series. Technicalreport, UNIDO - United Nations Industrial Development Organization,Vienna, Austria.
Kaplinsky R. & Morris M. (2001). A handbook for value chain research.IDRC - International Development Research Centre, Otawa, Canada.
Kavishe F. (1993). Nutrition-relevant actions in Tanzania. MonographSeries No. 1. Technical report, Tanzania Food and Nutrition Centre,Dar es Salaam, Tanzania.
Kazembe-Phiri H. (2005). Approaches to successful development of low-cost fruit juice extraction technologies: A case study to improved rurallivelihood in Malawi. In Proceedings of the Conference on InternationalAgricultural Research for Development - Tropentag, 11-13 October2005, Stuttgart-Hohenheim, Germany.
Bibliography 245
KIT , Faida MaLi & IIRR (2006). Chain empowerment: SupportingAfrican farmers to develop markets. KIT - Royal Tropical Institute,Amsterdam, The Netherlands; Faida MaLi - Faida Market Link,Arusha, Tanzania; and IIRR - International Institute of RuralReconstruction, Nairobi, Kenya.
KIT & IIRR (2008). Trading up: Building cooperation between farmersand traders in Africa. KIT - Royal Tropical Institute, Amsterdam, TheNetherlands & IIRR - International Institute of Rural Reconstruction,Nairobi, Kenya.
Komutarin T. , Azadi L. , S. Butterworth, Keil D. , Chitsomboon B. ,Suttajit M. & Meade B. (2004). Extract of the seed coat of Tamarindusindica inhibits nitric oxide production by murine macrophages in vitroand in vivo. Food and Chemical Toxicology, 42:649–658.
Kotler P. , Wong V. , Saunders J. & Armstrong G. (2005). Principlesof Marketing. Pearson Education Limited, Essex, UK, fourth europeanedition edition.
Kouyate A. , De Caluwe E. , Guindo F. , Diawara H. , Diarra I. , N’DiayeI. & Van Damme P. (2011). Variabilite morphologique du baobab(Adansonia digitata L.) au Mali. Fruits, XX:XX–XX.
Kruijssen F. , Keizer M. & Giuliani A. (2009). Collective action forsmall-scale producers of agricultural biodiversity products. Food Policy,34:46–52.
Kumar C. & Bhattacharya S. (2008). Tamarind seed: Properties,processing and utilization. Critical Reviews in Food Science andNutrition, 48:1–20.
Kwaschik R. , Looney N. & Hermann M. (2010). Collective action for pro-poor specialty crops, species and products. Issues paper for the GlobalConference on Agricultural Research for Development (GCARD) andthe Workshop on Challenges and Innovative Processes for CapacityStrengthening in Agriculture for Development (CIPCAD), Montpellier,26-31 March, 2010. Technical report, Global NTFP Partnership, GlobalHorticulture Initiative & Crops for the Future.
Kyndt T. , Assogbadjo A. , Hardy O. , Kakaı R. , Sinsin B. , Van DammeP. & Gheysen G. (2009). Spatial genetic structuring of baobab
246 Bibliography
(Adansonia digitata, Malvaceae) in the traditional agroforestry systemsof West Africa. American Journal of Botany, 96:950–957.
Lamien N. , Sidibe A. & Bayala J. (1996). Use and commercializationof non-timber forest products in western Burkina Faso. In Leakey R. ,Temu A. , Melnyk M. & Vantomme P. , editors, Domestication andcommercialization of non-timber forest products in agroforestry systems.Non-wood forest products 9, pp. 51–64. FAO - Food and AgricultureOrganization of the United Nations, Rome, Italy.
Lamien N. & Traore S. (2003). Commercialisation des produits nonligneux des arbres de la zone semi-aride du Burkina Faso: cas des feuillesseches de baobab (Adansonia digitata L.). In Bonneville J. , OlivierA. & Traore C. , editors, Comptes rendus 2e atelier regional sur lesaspects socio-economiques de l’agroforesterie au Sahel, 4-6 mars 2002,Bamako, Mali.
Lamien-Meda A. , Lamien C. , Compaore M. , Meda R. , KiendrebeogoM. , Zeba B. , Millogo J. & Nacoulma O. (2008). Polyphenol contentand antioxidant activity of fourteen wild edible fruits from BurkinaFaso. Molecules, 13:581–594.
Leakey R. (1999). Potential for novel food products from agroforestrytrees: a review. Food Chemistry, 66:1–14.
Leakey R. & Izac A.-M. (1996). Linkages between domesticationand commercialization of non-timber forest products: implications foragroforestry. In Leakey R. , Temu A. , Melnyk M. & VantommeP. , editors, Domestication and commercialization of non-timber forestproducts in agroforestry systems. Non-Wood Forest Products 9, pp. 1–7. FAO - Food and Agriculture Organization of the United Nations,Rome, Italy.
Leakey R. & Simons A. (1998). The domestication and commercializationof indigenous trees in agroforestry for the alleviation of poverty.Agroforestry Systems, 38:165–176.
Leakey R. , Tchoundjeu Z. , Schreckenberg K. , Shackleton S. &Shackleton C. (2005). Agroforestry tree products (AFTPs): Targetingpoverty reduction and enhanced livelihoods. International Journal ofAgricultural Sustainability, 3:1–23.
Bibliography 247
Ledda B. (2004). Market opportunities for underutilized species products.what does the market want? Technical report, GFU - GlobalFacilitation Unit for Underutilized Species, Rome, Italy.
Lintu L. (1995). Trade and marketing of non-wood forest products. InFAO , editor, Report of the International Expert Consultation of Non-Wood Forest Products. Non-Wood Forest Products 3, chapter Appendix4.2.2. FAO - Food and Agriculture Organization of the United Nations,Rome, Italy.
Lockett C. , Calvert C. & Grivetti L. (2000). Energy and micronutrientcomposition of dietary and medicinal wild plants consumed duringdrought. Study of rural Fulani, northeastern Nigeria. InternationalJournal of Food Sciences and Nutrition, 51:195–208.
Lockett C. & Grivetti L. (2000). Food-related behaviors during drought:a study of rural Fulani, northeastern Nigeria. International Journal ofFood Sciences and Nutrition, 51:91–107.
Loftas T. , editor (1995). Dimensions of need - An atlas of food andagriculture. FAO - Food and Agriculture Organisation of the UnitedNations, Rome, Italy.
Lombard C. & Leakey R. (2010). Protecting the rights of farmers andcommunities while securing long term market access for producers ofnon-timber forest products: experience in southern Africa. Forests,Trees and Livelihoods, 19:235–249.
Lumpkin T. , Weinberger K. & Moore S. (2005). Increasing incomethrough fruit and vegetable production opportunities and challenges.In Proceedings of Consultative Group on International AgriculturalResearch Science Forum, CGIAR Priorities: Science for the Poor, 6December 2005, Marrakech, Morocco, p. 10.
Lundy M. , Gottret M. , Cifuentes W. , Ostertag C. & Best R. (2004a).Design of Strategies to Increase the Competitiveness of SmallholderChains. Field Manual. CIAT - International Center for TropicalAgriculture, Cali, Colombia.
Lundy M. , Gottret M. , Cifuentes W. , Ostertag C. , Best R. , PetersD. & Ferris S. (2004b). Increasing the Competitiveness of Marketchains for Smallholder producers. A Field Guide. CIAT - InternationalCenter for Tropical Agriculture.
248 Bibliography
Lundy M. , Gottret M. , Ostertag C. , Best R. & Ferris S. (2007).Participatory Market Chain Analysis for Smallholder Producers. CIATpublication no.357. CIAT Rural Agroenterprise Development. GoodPractice Guide 4. CIAT - International Center for Tropical Agriculture,Cali, Colombia.
Lykke A. , Mertz O. & Ganaba S. (2002). Food consumption in ruralBurkina Faso. Ecology of Food and Nutrition, 41:119–153.
Maranz S. , Niang A. , Kalinganire A. , Konate D. & Kaya B. (2008).Potential to harness superior nutritional qualities of exotic baobabsif local adaptation can be conferred through grafting. AgroforestorySystems, 72:231–239.
Marshall E. , Newton A. & Schreckenberg K. (2003). Commercialisationof non-timber forest products: first steps in analysing the factorsinfluencing success. International Forestry Review, 5:128–137.
Marshall E. , Rushton J. , Schreckenberg K. , Arancibia E. , Edouard F. &Newton A. (2006a). Practical Tools for Researching Successful NTFPCommercialization: A Methods Manual. NTFP CommercializationResearch Methods. UNEP World Conservation Monitoring Centre,Cambridge, UK.
Marshall E. , Schreckenberg K. & Newton A. , editors (2006b).Commercialisation of Non-Timber Forest Products: Factors InfluencingSuccess. Lessons Learned from Mexico and Bolivia and PolicyImplications for Decision-makers. UNEP World ConservationMonitoring Centre, Cambridge, UK.
Martinello F. , Soares S. , Franco J. , Santos A. , Sugohara A. , Garcia S. ,Curti C. & Uyemura S. (2006). Hypolipemic and antioxidant activitiesfrom Tamarindus indica L. pulp fruit extract in hypercholesterolemichamsters. Food and Chemical Toxicology, 44:810–818.
Martins Y. , Pelchat M. & Pliner P. (1997). ”try it; it’s good and it’sgood for you”: Effects of taste and nutrition information on willingnessto try novel foods. Appetite, 28:89–102.
Masola S. , Mosha R. & Wambura P. (2009). Assessment ofantimicrobial activity of crude extracts of stem and root barks fromAdansonia digitata (Bombacaceae) (African baobab). African Journalof Biotechnology, 8:5076–5083.
Bibliography 249
Melendez P. & Capriles V. (2006). Antibacterial properties of tropicalplants from Puerto Rico. Phytomedicine, 13:272–276.
Mertz O. , Lykke A. & Reenberg A. (2001). Importance and seasonalityof vegetable consumption and marketing in Burkina Faso. EconomicBotany, 55:276–289.
Micronutrient Initiative (2004). Vitamin and mineral deficiency: Aglobal damage assessment report. Technical report, The MicronutrientInitiative, Ottawa, Canada & UNICEF.
Micronutrient Initiative (2009). Investing in the future: A united callto action on vitamin and mineral deficiencies. Technical report, TheMicronutrient Initiatives, The Flour Fortification Initiative, USAID,GAIN, WHO, The World Bank & UNICEF.
Ministere du Developpement Social de la Solidarite et des Personnes Agees& UNDP (2005). Rapport 2005 sur le developpement humain au Mali:gestion de l’environnement pour un developpement humain durable.Technical report, Ministere du Developpement Social de la Solidarite etdes Personnes Agees, Observatoire du Developpement Humain Durableet de la Lutte contre la Pauvrete, Mali & UNDP - United NationsDevelopment Programme.
Mishili F. , Fulton J. , Shehu M. , Kushwaha S. , Marfo K. , Jamal M. ,Kergna A. & Lowenberg-DeBoer J. (2009). Consumer preferences forquality characteristic along the cowpea value chain in Nigeria, Ghana,and Mali. Agribusiness, 25:16–35.
Moorhead A. (2007). Missing the market - how exotic foods are beingbarred from the EU. Technical report, Novel Food Regulation - jointpaper prepared for UNCTAD, the CBI, GTZ, GFU and IPGRI.
Morton J. (1987). Tamarind: Tamarindus indica. In Morton J. , editor,Fruits of warm climates, pp. 115–121. Morton, J.F., Miami, USA.
Murray S. , Schoeninger M. , Bunn H. , Pickering T. & Marlett J. (2001).Nutritional composition of some wild plant foods and honey used byhadza foragers of Tanzania. Journal of Food Composition and Analysis,14:3–13.
Narrod C. , Devesh R. , Okello J. , Avendano B. , Rich K. & ThoratA. (2007). The role of public-private partnerships and collective

250 Bibliography
action in ensuring smallholder participation in high value fruit andvegetable supply chains. CAPRi working paper No. 70. Technicalreport, CaPRI - CGIAR Systemwide Program on Collective Action andProperty Rights, Washington, DC, USA.
Ndoye O. , Awono A. , Schreckenberg K. & Leakey R. (2004).Commercialising indigenous fruit for poverty alleviation. A policybriefing note for governments in the African humid tropics region.Technical report, Overseas Development Institute, London, UK andCIFOR, Yaounde, Cameroon.
Ndoye O. , Ruiz Perez M. & Eyebe A. (1998). The markets of non-timberforest products in the humid forest zone of Cameroon. Network paper22c. Technical report, Rural Development Forestry Network, London,UK.
Neumann R. (1996). Forest products research in relation to conservationpolicies in Africa. In Ruiz Perez M. & Arnold J. , editors, Currentissues in non-timber forest products research, pp. 161–176. CIFOR -Center for International Forestry Research, Bogor Barat, Indonesia.
Neumann R. & Hirsch E. (2000). Commercialisation of Non-TimberForest Products: Review and Analysis of Research. CIFOR - Center forInternational Forestry Research, Bogor, Indonesia & FAO - Food andAgriculture Organization of the United Nations, Rome, Italy.
Nevenimo T. , Moxon J. , Wemin J. , Johnston M. , Bunt C. &Leakey R. (2007). Domestication potential and marketing of Canariumindicum nuts in the pacific: 1. A literature review. AgroforestrySystems, 69:117–134.
Nicholls A. & Opal C. (2005). Fair trade: Market-driven ethicalconsumption. SAGE Publications Ltd., London, UK.
Nicol B. (1957). Ascorbic acid content of baobab fruit. Nature, 180:287.
Nkafamiya I. , Aliyu B. , Manji A. & Modibbo U. (2007). Degradationproperties of wild Adansonia digitata (baobab) and Prosopis africana(lughu) oils on storage. African Journal of Biotechnology, 6:751–755.
Nnam N. & Obiakor P. (2003). Effect of fermentation on the nutrientand antinutrient composition of baobab (Adansonia digitata) seeds andrice (Oryza sativa) grains. Ecology of Food and Nutrition, 42:265–277.

Bibliography 251
Nordeide M. , Hatløy A. , Følling M. , Lied E. & Oshaug A. (1996).Nutrient composition and nutritional importance of green leaves andwild food resources in an agricultural district, Koutiala, in southernMali. International Journal of Food Sciences and Nutrition, 47:455–468.
Nour A. , Magboul B. & Kheiri N. (1980). Chemical composition ofbaobab fruit (Adansonia digitata L.). Tropical Science, 22:383–388.
Obizoba I. & Amaechi N. (1993). The effect of processing methods onthe chemical composition of baobab (Adansonia digitata L.) pulp andseed. Ecology of Food and Nutrition, 29:199–205.
Obizoba I. & Anyika J. (1994). Nutritive value of baobab milk (gubdi)and mixtures of baobab (Adansonia digitata L.) and hungry rice, acha(Digitaria exilis) flours. Plant Foods for Human Nutrition, 46:157–165.
Odetokun S. (1996). The nutritive value of baobab fruit (Adansoniadigitata). La Rivista Italiana delle Sostanze Grasse, LXXIII:371–373.
Olivier A. , Savard V. & Franzel S. (2006). Des feuilles fraıches de baobaben toute saison! Resultats de recherche au Mali. Sahel Agroforesterie,7:1–4.
Osman M. (2004). Chemical and nutrient analysis of baobab (Adansoniadigitata) fruit and seed protein solubility. Plant Foods for HumanNutrition, 59:29–33.
Padoch C. (1992). Marketing of non-timber forest products in westernAmazonia: general observations and research priorities. In NepstadD. & Schwartzman S. , editors, Non-Timber Products from TropicalForests: Evaluation of a Conservation and Development Strategy.Advances in Economic Botany, vol. 9, pp. 43–50. The New YorkBotanical Garden, New York, USA.
Padulosi S. , Eyzaquirre P. & Hodgkin T. (1999). Challengesand strategies in promoting conservation and use of neglected andunderutilized crop species. In Janick J. , editor, Perspectives on newcrops and new uses, pp. 140–145. ASHS Press, Alexandria, USA.
Padulosi S. , Hodgkin T. , Williams J. & Haq N. (2002). Underutilizedcrops: Trends, challenges and opportunities in the 21st century. InEngels J. , Ramanatha Rao V. , Brown A. & Jackson M. , editors,
252 Bibliography
Managing Plant Genetic Diversity, chapter 30, pp. 323–338. IPGRI,CABI Publishing, UK.
PhytoTrade Africa (2011). http://www.phytotradeafrica.com.
Pimentel D. , McNair M. , Buck L. , Pimentel M. & Kamil J. (1997).The value of forests to world food security. Human Ecology, 25:91–120.
Porter M. (1998). Competitive advantage: creating and sustainingsuperior performance: with a new introduction. Free Press, New York,USA; Collier Macmillan, London, UK.
Poulton C. & Poole N. (2001). Poverty and fruit tree research. FRPissues and options paper no. 6. project no. ZF0141. Technical report,DFID - United Kingdom Department for International Development.
Prentice A. , Laskey M. , Shaw J. , Hudson G. , Day K. , Jarjou L. ,Dibba B. & Paul A. (1993). The calcium and phosphorus intakes ofrural Gambian women during pregnancy and lactation. British Journalof Nutrition, 69:885–896.
Prescott-Allen R. & Prescott-Allen C. (1990). How many plants feedthe world? Conservation Biology, 4:365–374.
Proll J. , Petzke K. , Ezeagu I. & Metges C. (1998). Low nutritionalquality of unconventional tropical crop seeds in rats. Journal ofNutrition, 128:2014–2022.
Quang D. & Anh T. (2006). Commercial collection of NTFPs andhouseholds living in or near the forests: Case study in Que, Con Cuongand Ma, Tuong Duong, Nghe An, Vietnam. Ecological Economics,60:65–74.
Raikes P. , Jensen M. & Ponte S. (2000). Global commodity chainanalysis and the French filiere approach: Comparison and critique.Economy and Society, 29:390–417.
Rajchal R. (2006). Analytical review of the definitions of non timberforest product. Technical report, Institute of Forestry, Pokhara, Nepal.
Ramadan A. , Harraz F. & El-Mougy S. (1994). Anti-inflammatory,analgesic and antipyretic effects of the fruit pulp of Adansonia digitata.Fitoterapia, LXV:418–422.
Bibliography 253
Rao P. (1948). Tamarind seed (jellose pectin) and its jellying properties.Journal of Science and Industrial Research, 68:89–90.
Ravallion M. , Chen S. & Sangraula P. (2009). Dollar a day revisited.The World Bank Economic Review, 23:163–184.
Reardon T. (2006). The rapid rise of supermarkets and the use of privatestandards in their food product procurement systems in developingcountries. In Ruben R. , Slingerland M. & Nijhoff H. , editors, Agro-foodchains and networks for development, chapter 8, pp. 79–105. Springer,The Netherlands.
Rimbau V. , Cerdan C. , Vila R. & Iglesias J. (1999). Antiinflammatoryactivity of some extracts from plants used in the traditional medicineof North-African countries (II). Phytotherapy Research, 13:128–132.
Roduner D. (2005). Value-chains: What is behind this ‘new’ key word?And what is the role of development agencies in value chain developmentin developing countries? Rural Development News, 2:10–15.
Ros-Tonen M. (1999). Refining concepts, objectives and researchquestions for NTFP research. In NTFP Research in the TropenbosProgramme: results and perspectives. The Tropenbos Foundation,Wageningen, The Netherlands.
Ros-Tonen M. (2000). The role of non-timber forest products insustainable tropical forest management. Europe Journal of Wood andWood Products, 58:196–201.
Ruiz Perez M. , Ndoye O. , Eyebe A. & Puntodewo A. (2000). Spatialcharacteristics of non-timber forest product markets in the humid forestzone of Cameroon. International Forestry Review, 2:71–83.
Russell D. & Franzel S. (2004). Trees of prosperity: agroforestry, marketsand the African smallholder. Agroforestory Systems, 61:345–355.
Sabbe S. , Verbeke W. , Deliza R. , Matta V. & Van Damme P. (2009a).Effect of a health claim and personal characteristics on consumeracceptance of fruit juices with different concentrations of acaı (Euterpeoleracea Mart.). Appetite, 53:84–92.
Sabbe S. , Verbeke W. & Van Damme P. (2008). Familiarity andpurchasing intention of Belgian consumers for fresh and processedtropical fruit products. Britisch Food Journal, 110:805–818.
254 Bibliography
Sabbe S. , Verbeke W. & Van Damme P. (2009b).Confirmation/disconfirmation of consumers’ expectations aboutfresh and processed tropical fruit products. International Journal ofFood Science and Technology, 44:539–551.
SAFRUIT (2004). Sahelian fruit trees. Specific Targeted Research Project.
Saka J. & Msonthi J. (1994). Nutritional value of edible fruits ofindigenous wild trees in Malawi. Forest Ecology and Management,64:245–248.
Satyanaryana V. & Rao B. (1983). In vivo conversion of tryptophanto nicotinic acid in rats studied by simultaneous incorporation of [3h]-tryptophan and [14c]-nicotinic acid into liver NAD and NADP. Annalsof Nutrition and Metabolism, 27:1–7.
Savard V. , Olivier A. & Franzel S. (2003). Evaluation du potentield’adoptation des planches maraıcheres de baobab dans la region desegou, au Mali. In Bonneville J. , Olivier A. & Traore C. , editors,Comptes rendus 2e atelier regional sur les aspects socio-economiquesde l’agroforesterie au Sahel, 4-6 mars 2002, Bamako, Mali.
Savard V. , Olivier A. & Franzel S. (2006). Technique de productionmaraıchere de feuilles de baobab: potentiel d’adoption. Bois et Foretsdes Tropiques, 287:21–34.
Scheuring J. , Sidibe M. & Frigg M. (1999). Malian agronomic researchidentifies local baobab tree as source of vitamin A and vitamin C. Sightand Life - Newsletter, 1:21–24.
Schneider F. (2002). Size and measurement of the informal economy in110 countries around the world. Technical report, The World Bank,Washington, DC, USA.
Schreckenberg K. (1999). Products of a managed landscape: non-timberforest products in the parklands of the Bassila region, Benin. GlobalEcology and Biogeography, 8:279–289.
Schreckenberg K. (2000). Non-timber forest products in the woodysavannas of Benin Republic. In Cline-Cole R. & Madge C. , editors,Contesting Forestry in West-Africa, chapter 13, pp. 285–306. AshgatePublishing Limited, Hampshire, UK.
Bibliography 255
Schreckenberg K. (2003). Appropriate ownership models for naturalproduct-based small and medium enterprises in namibia. Technicalreport, Consultancy Report for the Ministry of Trade and Industry,Windhoek, Namibia.
Schreckenberg K. (2004). The contribution of shea butter (Vitellariaparadoxa C.F. Gaertner) to local livelihoods in Benin. In SunderlandT. & Ndoye O. , editors, Forest Products, Livelihoods and Conservation.Case Studies of Non-timber Forest Product Systems. Volume 2 - Africa,chapter 6, pp. 91–113. CIFOR - Center for International ForestryResearch, Bogor Barat, Indonesia.
Schreckenberg K. , Awono A. , Degrande A. , Mbosso C. , NdoyeO. & Tchoundjeu Z. (2006). Domesticating indigenous fruit treesas a contribution to poverty reduction. Forests, Trees and Livelihoods,16:35–51.
Seck A. , Sow I. & Niass M. (1999). Senegal. In Biodiversity of TraditionalLeafy Vegetables, chapter 5A, pp. 85–110. IPGRI - International PlantGenetic Resources Institute, Rome, Italy.
Sena L. , Vanderjagt D. , Rivera C. , Tsin A. , Muhamadu I. , MahamadouO. , Millson M. , Pastuszyn A. & Glew R. (1998). Analysis ofnutritional components of eight famine foods of the republic of niger.Plant Foods for Human Nutrition, 52:17–30.
Shackleton S. , Shackleton C. , Netshiluvhi T. , Geach B. , Ballance A. &Fairbanks D. (2002). Use patterns and value of Savanna resources inthree rural villages in South Africa. Economic Botany, 56:130–146.
Shah M. & Strong M. (1999). Food in the 21 century-from scienceto sustainable agriculture. Technical report, CGIAR System Review,Washington, USA.
Shepherd A. (2007). A guide to marketing costs and how to calculatethem. Technical report, FAO - Food and Agriculture Organization ofthe United Nations, Rome, Italy.
Shukla Y. , Dubey S. , Jain S. & Kumar S. (2001). Chemistry, biology,and uses of Adansonia digitata - a review. Journal of Medicinal andAromatic Plant Sciences, 23:429–434.
256 Bibliography
Siddhuraju P. (2007). Antioxidant activity of polyphenolic compoundsextracted from defatted raw and dry heated Tamarindus indica seedcoat. LWT - Food Science and Technology, 40:982–990.
Siddhuraju P. , Vijayakumari K. & Janardhanan K. (1995). Nutritionaland antinutritional properties of the underexploited legumes Cassialaevigata Willd. and Tamarindus Indica L. Journal of Food Compositionand Analysis, 8:351–362.
Sidibe M. , Scheuring J. , Kone M. , Hofman P. & Frigg M. (1998a).More on baobab’s homegrown vitamin C. Agroforestry Today, 4:10.
Sidibe M. , Scheuring J. , Kone M. , Schierle J. & Frigg M. (1998b). A(and C) for Africa. Agroforestry Today, 4(4):7–9.
Sidibe M. , Scheuring J. , Tembely D. , Sidibe M. , Hofman P. & FriggM. (1996). Baobab - homegrown vitamin C for Africa. AgroforestryToday, 8:13–15.
Sidibe M. & Williams J. (2002). Baobab, Adansonia digitata L. Fruitsfor the future 4. ICUC - International Centre for Underutilised Crops,Southampton, UK.
Siegel S. & Castellan N. (1988). Nonparametric statistics for thebehavioral sciences. Statistical Series. McGraw-Hill Book Company,New York, USA, 2nd edition.
Simons A. (1996). ICRAF’s strategy for domestication of non-wood treeproducts. In Leakey R. , Temu A. , Melnyk M. & Vantomme P. , editors,Domestication and commercialization of non-timber forest products inagroforestry systems. Non-Wood Forest Products 9, pp. 8–22. FAO -Food and Agriculture Organization of the United Nations, Rome, Italy.
Simons A. & Leakey R. (2004). Tree domestication in tropicalagroforestry. Agroforestry Systems, 61:167–181.
Sissoko P. & Kergna A. (2003). Etude diagnostique des circuits decommercialisation des produits du jujubier dans la zone sahelienne duMali: cas de l’arrondissement de Kayes. In Bonneville J. , Olivier A. &Traore C. , editors, Comptes rendus 2e atelier regional sur les aspectssocio-economiques de l’agroforesterie au Sahel, 4-6 mars 2002, Bamako,Mali.

Bibliography 257
Slingerland M. , Traore K. , Kayode A. & Mitchikpe C. (2006).Fighting Fe deficiency malnutrition in West Africa: an interdisciplinaryprogramme on a food chain approach. Wageningen Journal of LifeScience, 53:253–279.
Smith G. , Clegg M. , Keen C. & Grivetti L. (1996). Mineral valuesof selected plant foods common to southern Burkina Faso and toNiamey, Niger, West Africa. International Journal of Food Sciencesand Nutrition, 47:41–53.
Smith I. & Eyzaguirre P. (2007). African leafy vegetables: their rolein the world healt organization’s global fruit and vegetables initiative.African Journal of Food, Agriculture, Nutrition and Development, 7:1–17.
Soloviev P. , Niang T. , Gaye A. & Totte A. (2004). Variabilite descaracteres physicochimiques des fruits de trois especes ligneuses decueillette recoltes au Senegal: Adansonia digitata, Balanites aegyptiacaet Tamarindus indica. Fruits, 59:109–119.
Soong Y. & Barlow P. (2004). Antioxidant activity and phenolic contentof selected fruit seeds. Food Chemistry, 88:411–417.
Speelman S. , D’Haese M. , Buysse J. & D’Haese L. (2008). A measurefor the efficiency of water use and its determinants, a case study ofsmall-scale irrigation schemes in North-West Province, South Africa.Agricultural Systems, 98:31–39.
Stamm A. (2004). Value chains for development policy. challenges fortrade policy and the promotion of economic development. Technicalreport, GTZ, Eschborn, Germany.
Stewart K. (2003). The African cherry (Prunus africana): Canlessons be learned from an overexploited medicinal tree? Journal ofEthnopharmacology, 89:3–13.
Stoate C. & Jarju A. (2008). A participatory investigation intomultifunctional benefits of indigenous trees in West African savannafarmland. International Journal of Agricultural Sustainability, 6:122–132.
Sudjaroen Y. , Haubner R. , Wurtele G. , Hull W. , Erben G. ,Spiegelhalder B. , Changbumrung S. , Bartsch H. & Owen R. (2005).
258 Bibliography
Isolation and structure elucidation of phenolic antioxidants fromtamarind (Tamarindus indica L.) seeds and pericarp. Food andChemical Toxicology, 43:1673–1682.
SUN (2005). Tools for management and Sustainable Use of Naturalvegetation in West Africa. Specific Targeted Research Project.
Sunderland T. & Ndoye O. , editors (2004). Forest Products, Livelihoodsand Conservation. Case Studies of Non-timber Forest Product Systems.Volume 2 - Africa. CIFOR - Center for International Forestry Research,Bogor Barat, Indonesia.
Tabuna H. (1999). Le marche des produits forestiers non ligneuxde l’Afrique Centrale en France et en Belgique. Produits, acteurs,circuits de distiribution et debouches actuels. Occasional Paper No.19.Technical report, CIFOR - Center for International Forestry Research,Bogor, Indonesia.
Tabuna H. (2000). Evaluation des echanges des produits forestiers nonligneux entre l’Afrique subsaharienne et l’Europe. Technical report,FAO - Food and Agriculture Organization of the United Nations, Rome,Italy.
Taylor F. , Mateke S. & Butterworth K. (1996). A holistic approach tothe domestication and commercialization of non-timber forest products.In Leakey R. , Temu A. , Melnyk M. & Vantomme P. , editors,Domestication and commercialization of non-timber forest products inagroforestry systems. Non-wood forest products 9, pp. 75–85. FAO -Food and Agriculture Organization of the United Nations, Rome, Italy.
Tchoundjeu Z. , Asaah E. , Anegbeh P. , Degrande A. , Mbile P. , FacheuxC. , Tsobeng A. , Atangana A. , Ngo-Mpeck M. & Simons A. (2006).Putting participatory domestication into practice in West and CentralAfrica. Forests, Trees and Livelihoods, 16:53–69.
Tchoundjeu Z. , Atangana A. , Asaah E. , Tsobeng A. , Facheux C. ,Foundjem D. , Mbosso C. , Degrande A. , Sado T. , Kanmegne J. ,Mbile P. , Tabuna H. , Anegbeh P. & Useni M. (2007). Domestication,utilization and marketing of indigenous fruit trees in West and CentralAfrica. In Akinnifesi F. , Leakey R. , Ajayi O. , Sileshi G. , TchoundjeuZ. , Matakala P. & Kwesiga F. , editors, Indigenous Fruit Trees in theTropics: Domestication, Utillization and Commercialization, chapter 9,pp. 171–185. CAB International, Oxfordshire, UK.
Bibliography 259
Tchoundjeu Z. , Degrande A. , Leakey R. , Nimino G. , Kemajou E. ,Asaah E. , Facheux C. , Mbile P. , Mbosso C. , Sado T. & TsobengA. (2010). Impacts of participatory tree domestication on farmerlivelihoods in West and Central Africa. Forests, Trees and Livelihoods,19:217–234.
te Velde D. , Rushton J. , Schreckenberg K. , Marshall E. , Edouard F. ,Newton A. & Arancibia E. (2006). Entrepreneurship in value cahins ofnon-timber forest products. Forest Policy and Economics, 8:725–741.
Teklehaimanot Z. (2008). The role of indigenous fruit trees in sustainabledryland agriculture in eastern Africa. In Akinnifesi F. , Leakey R. ,Ajayi O. , Sileshi G. , Tchoundjeu Z. , Matakala P. & KwesigaF. , editors, Indigenous Fruit Trees in the Tropics: Domestication,Utilization and Commercialisation, chapter 11, pp. 204–223. CABI -CAB International, Oxfordshire, UK.
Ticktin T. (2004). The ecological implications of harvesting non-timberforest products. Journal of Applied Ecology, 41:11–21.
Tiisekwa J. , Kasimila B. & Tiisekwa B. (2005). Constraints toindigenous fruits utilization in Uluguru mountain areas in Tanzania.Uongozi Journal of Management Development, 17:15–31.
Tollens E. (1997). Wholesale markets in African cities. diagnosis, role,advantages, and elements for further study and development. Technicalreport, FAO - Food and Agriculture Organization of the United Nations,Rome, Italy and University of Leuven, Leuven, Belgium.
Tracey-White J. (1999). Market infrastructure planning. A guide fordecision makers. Technical report, FAO - Food and AgricultureOrganization of the United Nations, Rome, Italy.
Tracey-White J. (2005). Rural-urban marketing linkages. Aninfrastructure identification and survey guide. FAO AgriculturalServices Bulletin 161. FAO - Food and Agriculture Organization ofthe United Nations, Rome, Italy.
Traore C. (2003). Analyse economique des planches de baobab sous unregime de fertilisation et d’irrigation au Mali. In Bonneville J. , OlivierA. & Traore C. , editors, Comptes rendus 2e atelier regional sur lesaspects socio-economiques de l’agroforesterie au Sahel, 4-6 mars 2002,Bamako, Mali.
260 Bibliography
Tsuda T. , Watanabe M. , Ohshima K. , Yamamoto A. , Kawakishi S. &Osawa T. (1994). Antioxidative components isolated from the seedof tamarind (Tamarindus indica L.). Journal of Agricultural and FoodChemistry, 42:2671–2674.
UNDP (2008). Rapport sur le developpement humain au Benin2007/2008: responsabilite sociale, corruption et developpement humaindurable. Technical report, UNDP - United Nations DevelopmentProgramme & Le Gouvernement de la Republique du Benin.
UNDP (2010a). Human development report - Country fact sheets: Benin.http://hdrstats.undp.org.
UNDP (2010b). Human development report - Country fact sheets: Mali.http://hdrstats.undp.org.
UNDP (2010c). Human development report 2010. Technical report,UNDP - United Nations Development Programme, New York, USA.
UNDP & Ministere du Developpement Social, de la Solidarite et desPersonnes Agees (2008). Rapport national sur le developpement humaindurable: microfinance et reduction la pauvrete au Mali. Technicalreport, UNDP - United Nations Development Programme & Ministeredu Developpement Social de la Solidarite et des Personnes Agees,Observatoire du Developpement Humain Durable et de la Lutte contrela Pauvrete, Mali.
UNICEF (1992). Strategies for improved nutrition of children and womenin developing countries. A UNICEF Policy Review. Technical report,UNICEF - United Nations International Children’s Emergency Fund,New York, USA.
United Nations (2007). Principles and recommendations for populationand housing censuses. ST/ESA/STAT/SER.M/67/Rev.2. Technicalreport, United Nations, Department of Economic and Social Affairs,Statistics Division, New York, USA.
United Nations (2010). The Millennium Development Goals Report.Technical report, United Nations Department of Economic and SocialAffairs.
van den Berg M. , Boomsma M. , Cucco I. , Cuna L. , Janssen N. ,Moustier P. , Prota L. , Purcell T. , Smith D. & Van Wijk S. (2007).
Bibliography 261
Making Value Chains Work Better for the Poor: A Toolbook forPractitioners of Value Chain Analysis. Working Group: Market AccessFor the Poor (SNV), Markets and Agriculture Linkages for Cities inAsia (CIRAD/VAAS/IPSARD).
van den Boogaerde P. & Tsangarides C. (2005). Ten years after theCFA Franc devaluation: Progress toward regional integration in theWAEMU. IMF Working Paper WP/05/145. Technical report, IMF -International Monetary Fund, African Department.
van der Laan L. (1999). Agricultural marketing in tropical Africa:Obstacles to systematic study. In van der Laan L. , Dijkstra T. &van Tilburg A. , editors, Agricultural Marketing in Tropical Africa:Contributions from The Netherlands, chapter 1, pp. 1–17. AshgatePublishing Limited, Hants, UK.
van der Stege C. (2010). The ethnobotany of baobab ( Adansoniadigitata L.) and tamarind ( Tamarindus indica L.) in West Africa:their importance in rural subsistence and potential for participatorydomestication to guarantee future access for the rural poor. Ph.D. thesis,University of Natural Resources and Life Sciences, Vienna, Austria.
van der Stege C. , Prehsler S. , Hartl A. & Vogl R. (2011). Tamarind(Tamarindus indica L.) in the traditional west African diet: Not just afamine food. Fruits, XX:XX–XX.
Van Looy T. , Carrero G. , Mathijs E. & Tollens E. (2008). Underutilizedagroforestry food products in Amazonas (Venezuela): a market chainanalysis. Agroforestry Systems, 74:127–141.
Vantomme P. (2003a). Compiling statistics on non-wood forest productsas policy and decision-making tools at the national level. InternationalForestry Review, 5:156–160.
Vantomme P. (2003b). Trade opportunities for non-wood forest productsin niche markets. In Proceedings of World Forestry Congress, 21-28September 2003, Quebec, Canada.
Veeman M. (2002). Understanding local and regional markets for forestproducts. In Campbell B. & Luckert M. , editors, Uncovering thehidden harvest. Valuation methods for woodland & forest resources.People and plants conservation series, chapter 3, pp. 66–102. EarthscanPublications Ltd, London, UK.
262 Bibliography
Verhaeghe E. (2009). Etnisch marktpotentieel van tamarinde( Tamarindus indica L.) en baobab ( Adansonia digitata L.). Master’sthesis, Faculteit Bio-ingenieurswetenschappen, Universiteit Gent, Gent,Belgie.
Verheij E. (2003). Agroforestry. Agrodok 16. Agromisa foundation,Wageningen, Nederland.
Vermeulen S. , Woodhill J. , Proctor F. & Delnoye R. (2008).Chain-Wide Learning for Inclusive Agrifood Market Development: Aguide to multi-stakeholder processes for linking small-scale producers tomodern markets. IIED - International Institute for Environment andDevelopment, London, UK and Wageningen University and ResearchCentre, Wageningen, The Netherlands.
Vertuani S. , Braccioli E. , Buzzoni V. & Manfredini S. (2002).Antioxidant capacity of Adansonia digitata fruit pulp and leaves. ActaPhytotherapeutica, V:2–7.
Vimalanathan S. & Hudson J. (2009). Multiple inflammatory andantiviral activities in Adansonia digitata (baobab) leaves, fruits andseeds. Journal of Medicinal Plants Research, 3:576–582.
Vodouhe F. , Coulibaly O. , Assogbadjo A. & Sinsin B. (2008). Medicinalplant commercialization in benin: an analysis of profit distributionequity across supply chain actors and its effect on the sustainable useof harvested species. Journal of Medicinal Plants Research, 2:331–340.
Vogl C. , Hartl A. , Buchmann C. , Havinga R. & Prehsler S. (2009).DADOBAT (INCO-CT-2006-032217): D.5.1. Ethnobotanicalinformation on baobab and tamarind is documented by differentethnic groups occurring in the 3 african countries and confronted withknown ethnobotanical information from literature & D.5.4. Indigenousknowledge regarding the traditional processing of different organs isoutlined. Technical report, BOKU - Universitat fur Bodenkultur,Vienna, Austria.
Walter S. (2001). Non-wood forest products in Africa: a regional andnational overview. Technical report, FAO - Food and AgricultureOrganization of the United Nations, Rome, Italy.
Watt J. & Breyer-Brandwijk M. (1962). The Medicinal and PoisonousPlants of Southern and Eastern Africa. Being an Account of Their
Bibliography 263
Medicinal and Other Uses, Chemical Composition, PharmacologicalEffects and Toxicology in Man and Animal. E. & S. Livingstone Ltd.,Edinburgh, UK.
Welford L. & Le Breton G. (2008). Bridging the gap: PhytoTradeAfrica’s experience of the certification of natural products. Forests,Trees and Livelihoods, 18:69–79.
Whetham E. (1972). The process of marketing. In Whetham E. , editor,Agricultural Marketing in Africa. Oxford University Press, London, UK.
White F. (1983). The vegetation of Africa. UNESCO Natural Resources,Paris, France.
WHO (2003). Fruit and vegetable promotion initiative – report of themeeting, Geneva, 25-27 August 2003. Technical report, WHO - WorldHealth Organization, Geneva, Switzerland.
Wickens G. (1979). The uses of the baobab (Adansonia digitata L.) inAfrica. In Kunkel G. , editor, Proceedings of IX plenary meeting ofAETFAT, 1978, Las Palmas, Gran Canaria, p. 250. Bentham-MoxonTrust.
Wickens G. (1982). The baobab: Africa’s upside-down tree. Kew Bulletin,37:173–209.
Wickens G. & Lowe P. (2008). The Baobabs: Pachycauls of Africa,Madagascar and Australia. Springer.
Will M. (2008). Promoting Value Chains of Neglected and UnderutilizedSpecies for Pro-Poor Growth and Biodiversity Conservation. Guidelinesand Good Practices. GFU - Global Facilitation Unit for UnderutilizedSpecies, Rome, Italy.
Williams J. & Haq N. (2002). Global research on underutilized crops. Anassessment of current activities and proposals for enhanced cooperation.ICUC - International Centre for Underutilised Crops, Southampton,UK.
Wollenberg E. & Ingles A. , editors (1998). Incomes from the forest.Methods for the development and conservation of forest products forlocal communities. CIFOR - Center for International Forestry Research,Bogor Barat, Indonesia & IUCN - The World Conservation Union.

264 Bibliography
Woolfe M. , Chaplin M. & Otchere G. (1977). Studies on mucilagesextracted from okra fruits (Hibiscus esculentus L.) and baobab leaves(Adansonia digitata L.). Journal of the Science of Food and Agriculture,28:519–529.
World Bank (2010). Workers in the informal economy.http://web.worldbank.org.
World Bank (2011). http://data.worldbank.org.
Yahia E. , El Tamzini M. , El Saied A. & Al Yateem S. (2008). TrainingManual on Postharvest Handling and Marketing of HorticulturalCommodities. FAO - Food and Agriculture Organization of the UnitedNations, Regional Office for the Near East, Cairo, Egypt.
Yazzie D. , Vanderjagt D. , Pastuszyn A. , Okolo A. & Glew R. (1994).The amino acid and mineral content of baobab (Adansonia digitata L.)leaves. Journal of Food Composition and Analysis, 7:189–193.
Yin R. (2003). Case Study Research: Design and Methods. SagePublications, Inc., California, USA.
Zablocki L. & Pecore S. (1996). New patents: Additives: Tamarindextract. Trends in Food Science & Technology, 7:307–307.

About the author
Personal information
Name: Emmy De CaluweDate of birth: 25 February 1982Citizenship: BelgianMarital status: Cohabiting
Education
2006 – present: PhD candidate, Faculty of BioscienceEngineering, Ghent University,Belgium
2000 – 2005: Master in Bioscience Engineering inAgronomy (magna cum laude), GhentUniversity, Belgium
1994 – 2000: Secondary school, Koninklijk Lyceum,Ghent, Belgium
Professional training
August – September 2010: Project management, Doctoral School,Ghent University, Belgium
February 2010: Negotiation skills, Doctoral School,Ghent University, Belgium
February 2010: Dealing with conflict, Doctoral School,Ghent University, Belgium

266 About the author
December 2009: Personal efficiency, Doctoral School,Ghent University, Belgium
April – May 2009: Presentation techniques, DoctoralSchool, Ghent University, Belgium
February – May 2007: Academic English: writing skills,University Language Centre, GhentUniversity, Belgium
February 2006: Algemene Informatiecycli BTC, BTC-CTB, Brussels, Belgium
Professional and research experience
December 2006 – present: PhD candidate, Faculty of BioscienceEngineering, Ghent University, Belgium
• Tutorship and supervision of several MSc-students
• Author of different scientific publications
• Participation to international symposia
December 2006 – January 2006: Project co-coordinator of internationalR & D project INCO-CT-2006-032217-DADOBAT, Faculty of BioscienceEngineering, Ghent University, Belgium
• Project management, reporting towards and communication withthe EC, and interface between EC and project partners
• Drafting, writing and editing of annual activity and managementreports, and scientific deliverables
• Collaboration in designing plan for use and dissemination of resultsto a larger public and relevant stakeholders
• Organisation of annual project meetings and training workshops inWest Africa
May – June 2006: Desk study during internship, Centre for UnderutilisedSpecies, Southampton University, UK
267
Experience abroad
December 2009: PhD field research in Benin
September 2008: PhD field research in Senegal
July – October 2007: PhD field research in Mali
May – June 2006: Internship at the Centre forUnderutilised Crops, SouthamptonUniversity, UK
July – September 2004: MSc field research in Benin
January 2004: Multidisciplinary field course inGuatemala during Erasmus exchange,Royal Veterinary and AgriculturalUniversity, Copenhagen, Denmark
September – December 2003: Erasmus exchange, Royal Veterinaryand Agricultural University,Copenhagen, Denmark
Publications
Articles published in international peer-reviewed journalsincluded in the Science Citation Index (A1 publications)
Kouyate A.M., De Caluwe E., Guindo F., Diawara H., Diarra I., N’DiayeI., & Van Damme P. (2011). Variabilite morphologique du baobab(Adansonia digitata L.) au Mali. Fruits, accepted.
Fandohan B., Assogbadjo A.E., Glele Kakaı R., Kyndt T., De Caluwe E.,Codjia J.T.C. & Sinsin B. (2010). Women’s traditional knowledge,use value and the contribution of tamarind (Tamarindus indicaL.) to rural households’ cash income in Benin. Economic Botany,64:248–259.
De Caluwe E., De Smedt S., Assogbadjo A.E., Samson R., Sinsin B.& Van Damme P. (2009). Ethnic differences in use value anduse patterns of baobab (Adansonia digitata L.) in northern Benin.African Journal of Ecology, 47:433–440.
268 About the author
Articles published in international peer-reviewed journals notincluded in the Science Citation Index (A2 publications)
De Caluwe E., Halamova K. & Van Damme P. (2010). Adansoniadigitata L. – A review of traditional uses, phytochemistry andpharmacology. Afrika Focus, 23:11-51.
De Caluwe E., Halamova K. & Van Damme P. (2010). Tamarindusindica L. – A review of traditional uses, phytochemistry andpharmacology. Afrika Focus, 23:53-83.
Books (B1 publications)
Assogbadjo A.E., Sinsin B., De Caluwe E. & Van Damme P. (2009).Developpement et domestication du baobab au Benin. LEA-FSA-UAC/DADOBAT, Cotonou, Benin.
Articles published in book (B3 publications)
De Caluwe E., Halamova K. & Van Damme P. (2009). Adansoniadigitata L. – A review of traditional uses, phytochemistry andpharmacology. In Juliani H., Simon J. and Ho C., editors, AfricanNatural Plant Products: Discoveries and Challenges in QualityControl, chapter 4, pp. 51–84. American Chemical Society,Washington DC, USA.
De Caluwe E., Halamova K. & Van Damme P. (2009). Tamarindusindica L. – A review of traditional uses, phytochemistry andpharmacology. In Juliani H., Simon J. and Ho C., editors, AfricanNatural Plant Products: Discoveries and Challenges in QualityControl, chapter 5, pp. 85–110. American Chemical Society,Washington DC, USA.
Articles published in conference proceedings (C1 publications)
De Caluwe E., De Groote S. & Van Damme P. (2010). Domesticationand development of baobab and tamarind (DADOBAT). In vander Burgt X., van der Maesen J. and Onana J.-M, editors,Systematics and conservation of African plants. Proceedings of the18th AETFAT Congress, Yaounde, Cameroon. Kew Publishing,Royal Botanical Gardens Kew, UK.
269
Assogbadjo A.E., De Caluwe E., Sinsin B. & Codjia J.T.C. (2006).Indigenous knowledge of rural people and importance of baobabtree (Adansonia digitata L.) in Benin. In Proceedings of theIVth International Congress of Ethnobotany (ICEB 2005), Istanbul,Turkey, pp.39–47.
Conferences: oral and poster presentations (C3 publications)
De Caluwe E. & Van Damme P. (2010). Value chain ofbaobab and tamarind in West Africa. Oral presentation atInternational Symposium on Indigenous Fruit Trees for DrylandAfrica: Domestication for Use in a Changing Environment, 25-27October 2010, Allada, Benin.
De Caluwe E., Djouara H. & Van Damme P. (2007). Production andmarketing chain analysis of baobab and tamarind. Poster presentedat Ghent Africa platform symposium, 18 December 2007, Ghent,Belgium.
De Caluwe E., Djouara H. & Van Damme P. (2007). Production andmarketing chain analysis of baobab and tamarind. Poster presentedat ICRAF - Agroforestry policy and research options for improvingnutrition, health and livelihood of the rural poor in West en CentralAfrica, 12-14 November 2007, Bamako, Mali.
De Groote S., De Caluwe E. & Van Damme P. (2007). DADOBAT– Development and domestiation of baobab and tamarind. Posterpresented at Tropentag, 9-11 October 2007, Kassel-Witzenhausen,Germany.
De Caluwe E., Djouara H. & Van Damme P. (2007). Production andmarketing chain analysis of baobab and tamarind. Poster presentedat 5th International symposium on new crops and uses: their role ina rapidly changing world, 3-4 September 2007, Southampton, UK.
Gutler M., Hartl A., Vogl C.R., De Caluwe E., De Groote S. & VanDamme P. (2007). Documentation of folk uses and management ofbaobab (Adansonia digitata L.) and tamarind (Tamarindus indicaL.) in four West African countries. Poster presented at 48th AnnualSociety of Economic Botany Meeting, 4-7 June 2007, Chicago, USA.
De Caluwe E., De Groote S. & Van Damme P. (2007). DADOBAT –Domestication and development of baobab and tamarind. Poster

270 About the author
presented at 18th AETFAT Congress, 26 February-2 March 2007,Yaounde, Cameroon.