Mark-recapture estimates of pup production for the Australian sea lion, Neophoca cinerea at Seal Bay...
16
Mark-Recapture Estimates of Pup Production for the Australian Sea Lion ( Neophoca cinerea) at Seal Bay Conservation Park, South Australia Rebecca R. McIntosh La Trobe University, Zoology Department, Sea Mammal Ecology Group, Melbourne, Victoria, Australia Peter D. Shaughnessy CSIRO Sustainable Ecosystems, Canberra, Australian Capital Territory, Australia Simon D. Goldsworthy South Australian Research and Development Institute (SARDI), Aquatic Sciences Centre, Adelaide, South Australia, Australia Abstract Australian sea lion (Neophoca cinerea) pup counts have been conducted at monthly intervals at Seal Bay Conservation Park, South Australia, since 1983. The protracted breeding season of the Australian sea lion causes difficulties for estimating pup production as simple counts of pups are likely to underestimate pup abundance. Here we describe the use of a mark-recapture technique, the modified Petersen estimate, to estimate the total number of sea lion pups produced at Seal Bay by the end of the breeding season in late June 2003. Our aims were to compare the estimate of pup numbers from direct counting with that from mark-recapture, and evaluate methods used to estimate pup abundance at the end of the pupping season. Pups (n = 74) were marked over a four month period by clipping the hair on the rump. Pups were also given individually identify- ing microchips (23 mm TIRIS™ RFID) that were inserted subcutaneously. These identifying microchips were used to test for unequal catchability and estimate the number of marked pups in the population at the time Sea Lions of the World 353 Alaska Sea Grant College Program • AK-SG-06-01, 2006
Transcript of Mark-recapture estimates of pup production for the Australian sea lion, Neophoca cinerea at Seal Bay...

Mark-Recapture Estimates of Pup Production for the Australian Sea Lion (Neophoca cinerea) at Seal Bay Conservation Park, South AustraliaRebecca R. McIntoshLa Trobe University, Zoology Department, Sea Mammal Ecology Group, Melbourne, Victoria, Australia
Peter D. ShaughnessyCSIRO Sustainable Ecosystems, Canberra, Australian Capital Territory, Australia
Simon D. GoldsworthySouth Australian Research and Development Institute (SARDI), Aquatic Sciences Centre, Adelaide, South Australia, Australia
AbstractAustralian sea lion (Neophoca cinerea) pup counts have been conducted at monthly intervals at Seal Bay Conservation Park, South Australia, since 1983. The protracted breeding season of the Australian sea lion causes difficulties for estimating pup production as simple counts of pups are likely to underestimate pup abundance. Here we describe the use of a mark-recapture technique, the modified Petersen estimate, to estimate the total number of sea lion pups produced at Seal Bay by the end of the breeding season in late June 2003. Our aims were to compare the estimate of pup numbers from direct counting with that from mark-recapture, and evaluate methods used to estimate pup abundance at the end of the pupping season. Pups (n = 74) were marked over a four month period by clipping the hair on the rump. Pups were also given individually identify-ing microchips (23 mm TIRIS™ RFID) that were inserted subcutaneously. These identifying microchips were used to test for unequal catchability and estimate the number of marked pups in the population at the time
Sea Lions of the World 353Alaska Sea Grant College Program • AK-SG-06-01, 2006

of the mark-recapture (n = 74). The mark-recapture was conducted after peak pup production in the seventh month of the breeding season. The best estimate of the number of sea lion pups in the Seal Bay colony was 230 (95% CI 203-257). These incorporate the mark-recapture estimates. In their absence, the estimate from direct counting of pups in the whole colony was 163 (95% CI 147-179). Thus the mark-recapture estimate was 187% of the direct count (95% CI 173-201), highlighting that pup counts underestimate pup production at Seal Bay Conservation Park.
Introduction Seal Bay on the south coast of Kangaroo Island, South Australia, is one of the largest breeding colonies of the Australian sea lion, Neophoca cinerea. During 1990, a survey through the species’ range ranked Seal Bay the fourth largest colony with an estimated 180 pups (Gales et al. 1994). Sea lions at Seal Bay are the major attraction for visitors to Kangaroo Island, where tourism has become an important income generator for the island (Twyford and Vickery 2001).
During the breeding season, pups have been counted at monthly intervals since 1983. The usual method for determining abundance of Australian sea lions is for two or three observers to walk through a colony searching for and counting pups and, in some instances, animals of other age and sex classes. Observers travel in a survey line, tallying pups as they move through the colony, resulting in a single count of pups for each monthly survey. The number of pups is the preferred index of abundance because pups are easily recognizable and most of the pups are ashore at one time. Long-term pup counts are a valuable tool for wildlife man-agement and research as they are considered to be reliable indicators of population change when used in conjunction with life history information (Berkson and DeMaster 1985).
Simple counts of pups are likely to underestimate pup abundance because some pups ashore will be in places such as rock holes or under bushes where they are likely to be overlooked (Shaughnessy et al. 1995, Shaughnessy and Dennis 1999). Australian sea lion populations are noto-riously difficult to census because of their unusual reproductive strategy that includes an aseasonal (average of 17.6 month) breeding cycle and a protracted (five to seven month) breeding season (Ling and Walker 1976, 1978; Higgins 1993). The extended breeding season of the Australian sea lion further increases the likelihood of underestimating pup production, as pups born earlier in the breeding season may be up to seven months old, molted and actively mobile, while newborn pups are still being pro-duced in the colony.
By using a mark-recapture approach to estimate abundance of pups, problems with overlooking pups that are ashore can be addressed, re-ducing sightability bias in the estimate. Additionally, the mark-recapture
354 McIntosh et al.—Mark-Recapture Estimates of Pup Production

method enables the variance or error around the mean number of pups to be estimated, which cannot be obtained from a single count. Observation error and variance can be calculated from direct counts if counts are made by several observers or if replicate counts are made. But such counts do not address sightability biases as effectively as a mark-recapture model that compares proportions of marked and unmarked individuals.
Mark-recapture methods have been applied successfully to estimate population parameters (e.g., Cormack 1964, Jolly 1965, Lebreton et al. 1992, Nichols 1992, Cameron and Siniff 2004), and as an effective method of estimating pup production in seal populations (e.g., Chapman and Johnson 1968, York and Kozloff 1987, Ries et al. 1998). In mark-recap-ture studies of Australian otariid species, surveys generally estimate the number of live pups found in the colony at the time of the mark recapture using the Petersen formula or its modification (Shaughnessy et al. 1995, Shaughnessy et al. 2000), adding the number or percentage of dead pups identified at the time of the survey to this estimate when such data are available (Pemberton and Kirkwood 1994, Shaughnessy and Dennis 1999, Shaughnessy et al. 2002, Shaughnessy and McKeown 2002).
There are four basic assumptions for Petersen mark-recapture es-timates: (i) every animal, marked and unmarked, must have the same probability of capture and recapture; (ii) every animal must have the same probability of mortality or of leaving the sampling area for the duration of the experiment; (iii) marks must not be lost and must be correctly reported; and (iv) no animal is born or immigrates to the study area be-tween marking and recapturing (Caughley 1977, Seber 1982). These as-sumptions are often difficult to reconcile for mark-recapture experiments in wild populations (Caughley 1977).
Movement of pups out of the colony is not a problem for mark- recapture estimates provided the rate of movement is equal for marked and unmarked individuals (Caughley 1977). Repeated counts and simple mark-recapture models provide an estimate of the number of pups that are in a colony at the time of the recaptures, but do not account for the number of pups that may have moved out of the colony between mark-ing and recapture periods (Caughley 1977). There can therefore be an availability bias in mark-recapture estimates, where not all the marked pups are available at the time of the estimate and total pup production cannot be calculated.
Applying an individual identification, such as numbered tags, to marked pups is not necessary for a simple mark-recapture model. How-ever, in order to test the assumptions of a mark-recapture study, and to evaluate the level of availability bias in marked pups, such information is necessary (Leslie and Chitty 1951, Orians and Leslie 1958). In this study, pups were physically marked by clipping the fur of the rump and also by implanting subcutaneous microchips (TIRIS™ RFID 23 mm passive transponders). These microchips provide an individual number for each
355Sea Lions of the World

marked pup and allow frequency of recapture to be analyzed to test for unequal catchability (zero-truncated Poisson model [Darroch 1958, Orians and Leslie 1958, Caughley 1977]) and the number of marked pups in the population at the time of the mark-recapture to be estimated (modified Petersen estimate).
Recent surveys of pup production at Seal Bay suggest that visual counts underestimate pup production, because of the propensity of animals that are obscured or absent from the colony on the day of the survey. In November 2001, during one of the monthly counts of animals in the colony only 23 of the 53 live pups (43%) that had been marked with fore-flipper tags were located (D. Dowie, Department for the Environment and Heritage, South Australia, 2001, pers. comm.). Furthermore, in July 1999 a mark-recapture trial undertaken on the population of Australian sea lions at Dangerous Reef (Shaughnessy and Dennis 1999) showed that pup production estimates based on the mark-recapture estimation proce-dure were 19% larger than those derived from direct counting.
Here we describe the use of a mark-recapture technique to estimate the number of Australian sea lion pups produced at Seal Bay at the end of the breeding season in late June 2003. Our aims were to compare the estimate of pup numbers from direct counting with that from mark-re-capture, and evaluate methods used to estimate pup abundance at the end of the pupping season.
Methods Seal Bay colony Seal Bay Conservation Park (35º41'S, 136º53'E) is situated on the southern coast of Kangaroo Island in South Australia (Fig. 1). The sea lion colony at Seal Bay comprises five areas (Fig. 2) that are referred to as Pup Cove (2 km from the visitor center), the Western Prohibited Area (WPA), Main Beach, sand dunes and swales inland from Main Beach, and the Eastern Prohibited Area (EPA). The sand dune area inland from Main Beach and the EPA beach is vegetated with grey saltbush (Atriplex cinerea) while the swales and inland area behind the saltbush are vegetated with the low-lying Bower spinach (Tetragonia implexicoma) and coast velvet bush (Laisiopetalum discolor). Limestone promontories separate the WPA and EPA from Main Beach. The colony extends along the coast for 7 km. Most pups are born at Pup Cove and in the WPA; smaller numbers of pups are born to the east of Main Beach in the EPA, at the western end of Main Beach and inland from the WPA and Main Beach.
Mark-recapture procedure Pups from the 2002/03 breeding season were born over a six month period commencing in late November 2002 and were marked over a four month period by clipping a strip of hair across their rump almost
356 McIntosh et al.—Mark-Recapture Estimates of Pup Production

Figure 1. Map of Kangaroo Island, South Australia, showing the location of Seal Bay Conservation Park.
0 25
kilometers
50
KANGAROO ISLAND
Seal Bay
AUSTRALIA
Public access area
100m
Pup Cove 1.5 km
WesternProhibited
Area
EasternProhibited
Area
DangerPoint
Main Beach
InformationCentre
Boardwalk
Dunes Cliffs
Cliffs
N
Figure 2. Map of Seal Bay Conservation Park showing the main fea-tures of the breeding colony.
down to skin level. A microchip was inserted subcutaneously in the pup’s rump, which provided it with an individual identification number. To successfully identify a pup, an RFID reader was held at a distance of up to 10 cm from the site where the microchip was inserted. No handling of the pups was required after initial marking. Criteria for choosing pups to
357Sea Lions of the World

be marked were that they were a minimum of two months old, were not accompanied by an adult female, and that little disturbance would result from their initial capture. By 24 June 2003, when the mark-recapture study commenced, seventy-four pups had been marked in this manner. Pups were marked in the WPA, on Main Beach, and in the nearby dunes. Due to steep limestone cliffs that made access difficult, pups were not marked in Pup Cove. Marked pups were not seen in Pup Cove at any time during the breeding season. Permit limitations prevented the marking of pups in the EPA. Pups that ventured from the EPA to Main Beach were marked, and marked pups were seen frequently in the EPA.
The three recapture sessions were conducted on 25, 26, and 27 June 2003, in the WPA, on Main Beach, and inland from these areas (where pups had been marked). Each recapture session required a full day due to the large area to be covered. In addition, recapture sessions extended into the EPA because pups and their mothers are known to move eastward in the Seal Bay colony during the pupping season (Higgins and Gass 1993). All areas of the colony except Pup Cove made up the mark-recapture area. Numbers of pups in Pup Cove were estimated by direct counting from the cliff-tops on three occasions.
Recaptures (essentially “re-sights”) were conducted visually, without handling the pups, by one to three people working separately in allo-cated areas of the colony. At least 35 marked pups required recapturing to provide an unbiased estimate with a standard error of 10% or lower of the Petersen estimate (Caughley 1977) assuming a total pup population of 180 pups (Gales et al. 1994). All marked pups that were located were scanned with a microchip reader so that their identity could be estab-lished. That information was used to estimate the number of marked pups present in the study population.
Classification of pupsFour groups of pups were recognized, as follows.
1. Marked pups: identified by a clipped strip of hair across the rump as noted above. Very few pups were fully molted at the time of the mark-recapture study. A few pups had completed their molt. If they had been marked, the clipped area would no longer have been visible. Therefore all molted pups were scanned and identified as “marked” if a microchip was recorded.
2. Dead pups: counted as they were found, and a cumulative record of the number of dead pups was maintained during the pupping season. Dead pups were either removed from the colony for further analysis, or marked with quick-drying paint when they were found to avoid recounting.
3. Unclassed pups: un-molted and molted pups that were seen but the
358 McIntosh et al.—Mark-Recapture Estimates of Pup Production

presence or absence of a mark could not be confirmed due to their swimming in shallows near the shore. Unclassed pups were not in-cluded in the estimate for pup production.
4. Pups outside the mark-recapture area: pups within Pup Cove that were not marked due to its inaccessibility.
Mark-recapture methodologyThe modified Petersen formula (Seber 1982) as outlined in Shaughnessy et al. (1995) was used as the basis for the mark-recapture design. The pupping season of the Australian sea lion is of 5-7 months duration and pups were marked over four months leading up to the mark-recapture survey. Therefore some pups may have dispersed with their mothers before the mark-recapture project was conducted. In order to satisfy this assumption, the number of marked pups within the mark-recapture area available for recapture was estimated.
Pups were marked in equal proportions throughout the colony, except for the EPA due to permit limitations. It is most important that marks are not lost. Identification of the clipped mark was reliable until well after the
Mark-recapture session
1 2 3
Date of recapture session 25 June 26 June 27 June
M (number of marked pups in the study population) 74 74 74
n1 (number of live pups seen) 69 81 81
m1 (number of marked pups seen) 39 41 38
N (pup population estimate for the mark-recapture study population) 130.2 145.4 156.7
Standard deviation 9.2 10.3 12.5
Dead pups 70 70 70
Unclassed pups 2 7 0
Pup Cove (direct count) 15 19 15
Best estimate for whole colony, including the mark- recapture estimate 215.2 234.4 241.7
Direct count for whole colony 154 170 166
Table 1. Estimates of the number of Australian sea lion pups at Seal Bay, Kan-garoo Island, in June 2003 from three mark-recapture sessions.
359Sea Lions of the World
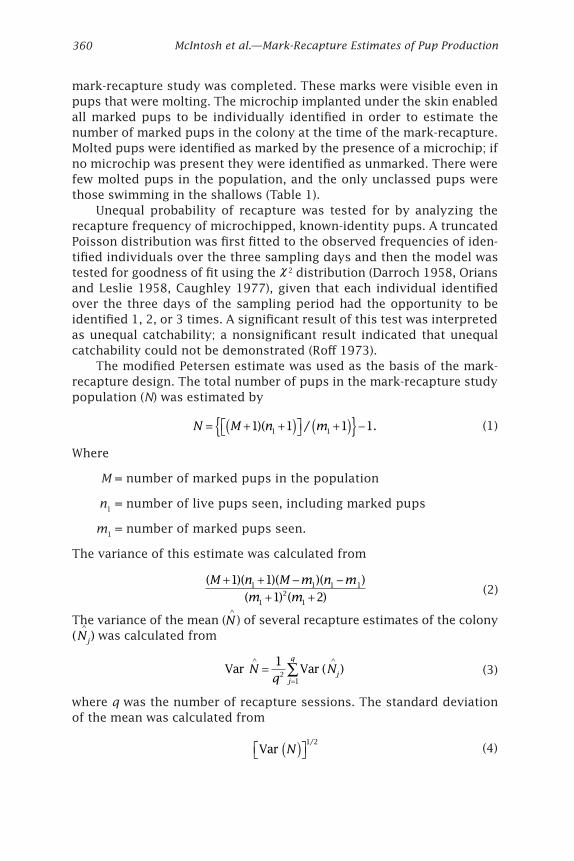
mark-recapture study was completed. These marks were visible even in pups that were molting. The microchip implanted under the skin enabled all marked pups to be individually identified in order to estimate the number of marked pups in the colony at the time of the mark-recapture. Molted pups were identified as marked by the presence of a microchip; if no microchip was present they were identified as unmarked. There were few molted pups in the population, and the only unclassed pups were those swimming in the shallows (Table 1).
Unequal probability of recapture was tested for by analyzing the recapture frequency of microchipped, known-identity pups. A truncated Poisson distribution was first fitted to the observed frequencies of iden-tified individuals over the three sampling days and then the model was tested for goodness of fit using the χ 2 distribution (Darroch 1958, Orians and Leslie 1958, Caughley 1977), given that each individual identified over the three days of the sampling period had the opportunity to be identified 1, 2, or 3 times. A significant result of this test was interpreted as unequal catchability; a nonsignificant result indicated that unequal catchability could not be demonstrated (Roff 1973).
The modified Petersen estimate was used as the basis of the mark-recapture design. The total number of pups in the mark-recapture study population (N) was estimated by
N M n m= + +( ) +( ){ } −1 1 1 11 1)( / .
Where
M = number of marked pups in the population
n1 = number of live pups seen, including marked pups
m1 = number of marked pups seen.
The variance of this estimate was calculated from
( )( )( )( )( ) ( )
M n M m n mm m
+ + − −+ +
1 11 2
1 1 1 1
12
1
The variance of the mean (N∧
) of several recapture estimates of the colony (Nj
∧
) was calculated from
Var1
Var ( )21
Nq
Njj
q∧ ∧
== ∑
where q was the number of recapture sessions. The standard deviation of the mean was calculated from
Var N( ) 1 2/
(1)
(2)
(3)
(4)
360 McIntosh et al.—Mark-Recapture Estimates of Pup Production

As some pups may have dispersed from the colony or died, the num-ber of marked pups remaining in the study population at the time of sur-vey (M) was estimated by M1 by examining a sub-sample of microchipped pups over two consecutive days (day 1 and day 2).
The number of marked pups in the study population was calculated from
M M n m1 2 2 21 1 1 1= +( ) +( ) +( ){ } −/
where
M2 = number of individual marked pups identified on day 1, the day before a recapture session
n2 = number of marked pups identified at a recapture session (day 2)
m2 = number of individual marked pups re-identified at a recapture session (i.e., identified on day 1 and again on day 2).
The best estimate of pup production is obtained from the following sum-mation:
Best estimate = N + Dead pup count + Pup count for Pup Cove. (6)
An estimate of pup numbers based on direct counting using the same data set is obtained from:
Direct count = n1 + Unclassed pup count + Dead pup count + Pup count for Pup Cove.
The 95% confidence interval (CI) of the estimated pup numbers were calculated with the estimate ± (1.96 × s.d.).
Results Equal catchabilityUnequal catchability could not be demonstrated for marked pups (χ2 = 2.21, d.f. = 1, P > 0.10) (Table 2). This indicated that the marked pups identified over the three days of the census were randomly recaptured, allowing the assumption of equal catchability to be accepted.
Number of marked pups in the study population Marked pups were found in all parts of the Seal Bay colony that had been designated as the mark-recapture study area, namely the WPA, Main Beach, nearby dunes, and the EPA. The number of marked pups in the study population was estimated, using data from the marked pups on three consecutive days (Table 3) that gave estimates of 57 (s.d. = 12.9) and 73 (s.d. = 12.2) marked pups. The variation between the estimates may have two explanations: observer bias on 25 June, or fewer pups
(5)
(7)
361Sea Lions of the World

available for identification on 25 June. A greater number of microchipped pups was identified on the second and third day of the survey (Table 3). As pups not identified on the first day, but identified on the second and third day must have been alive on the first day of the survey, the estimate of 73 pups was considered a more likely result. It was therefore concluded that all 74 marked pups were available in the colony at the time of the mark-recapture.
No marked pups were found dead in the colony by 27 June (date of third census). After two months of age, pups are better able to defend themselves and as a consequence suffer lower mortality rates compared to younger pups (Higgins and Tedman 1990). Given that pups in this study were marked after two months of age, it has been assumed that mortality of marked and unmarked pups from 2 to 7 months of age was equal and therefore unequal mortality would not violate the assumptions of mark-recapture. It was also assumed that no pups died over the three days of the surveys.
Number of pups in the study population For the mark-recapture estimation procedure, it was assumed that all of the marked pups were available for recapturing (as discussed above), and M was set at 74. Data are available for three recapture sessions (Table 1). Estimates of the number of pups in the study area (N) ranged from 130 to 157, with mean 144.1 and standard deviation 6.2 (95 % CI 132-156). No births were observed during the recapture sessions.
Table 2. Observed and expected frequencies of resights of microchipped Australian sea lion pups over three consecutive days based on uni-form catchability of pups and a truncated Poisson distribution.
Number of times captured i
Number of individuals f
Expected frequencies E( f )
f E f
E f
− ( ) ( )
2
1 27 30.653 0.435
2 18 13.426 1.558
3 3 3.920 0.216
f =∑ 48 χ2 2 210= .
d.f. = 1
P > 0.10
362 McIntosh et al.—Mark-Recapture Estimates of Pup Production

Estimate of pup numbers at Seal Bay in June 2003 The best estimates of the number of sea lion pups in the Seal Bay colony in late June 2003 ranged from 215 to 242 (Table 1), with mean 230 and standard deviation 13.7 (95% CI 203-257). In contrast, the estimates based on direct counting of pups in the whole colony ranged from 154 to 170, with mean 163 and standard deviation 8.3 (95% CI 147-179). On average, the estimates based on the mark-recapture (N ) were 1.87 times that of those based on direct counting methods (n1) (s.d. = 7.2, 95% CI 173-201).
DiscussionSatisfying mark-recapture assumptions Several assumptions are made in estimating population size by the mark-recapture technique (Seber 1982). Pertinent ones are reviewed here for estimates of abundance of Australian sea lion pups at Seal Bay.
Migration Marks were applied over a period of four months prior to the mark-re-capture survey. A potential problem is that some pups may have left the colony prior to the recapture sessions. This seems unlikely because we estimated that all marked pups were still in the colony at the time of the
Date
25 and 26 June 26 and 27 June
Number of observers identifying microchips 1 2
M2, number of marked pups identified on day 1 14 26
n2, number of marked pups identified on day 2 26 32
m2, number of individual marked pups identified on day 1 and day 2 6 11
M1, number of marked pups in the study population 57 73
Standard deviation 12.9 12.2
Table 3. Estimate of the number of marked Australian sea lion pups in the mark-recapture study population at Seal Bay, Kangaroo Island, in June 2003 from three consecutive days of resights involving only marked microchipped pups.
363Sea Lions of the World

mark-recapture estimate. These results indicate that little or no emigra-tion of pups had taken place prior to the mark-recapture estimates, seven months after the commencement of the breeding season.
Reliability of marksNo problems were experienced in recognizing the marks on pups that were ashore, even on pups that were molting and few fully molted pups were observed. Several pups were swimming and it was not possible to determine whether or not they were marked; they were categorized as “Unclassed.” Fortunately there were few of them and they would have little effect on the comparison between the estimates from direct count-ing and from mark-recapture.
Probability of recaptureThe probability of marking and recapturing pups should be identical in a mark-recapture. The test of unequal catchability demonstrated that it was fair to assume equal catchability throughout the survey area. Pups were marked in the WPA, on Main Beach, and in the dunes behind these areas. Recapture sessions were conducted in these areas and in the EPA. Several marked pups were recorded in the EPA; that and previous evidence that adult females and their pups generally move eastwards within the colony and that some of them move into the EPA (Higgins and Gass 1993) gave us confidence that marked and unmarked pups had mixed sufficiently within the mark-recapture study area. It is recognized that adequate mixing of marked and un-marked pups does not suffice to accept the assumption that pups are marked evenly throughout the mark-recapture area (Caughley 1977). In order to accept this assumption, the permit limitations at this study site must be addressed for future mark-recapture experiments in order include marking pups in the EPA.
Timing of mark-recapture estimation The mark-recapture estimates reported here were made in June 2003, seven months after pupping began, when approximately half of the pups in the mark-recapture study area were marked. Based on direct counts of pups in the colony, maximum numbers of pups were observed in late May and it would have been preferable to have made the mark-recapture estimation then. An aim in future seasons should be to mark half of the pups by the fifth month of the season and then perform the mark-recap-ture estimate.
Comparison of estimates by direct counting and mark-recapture If the number of live pups in the mark-recapture study area had been estimated by direct counting on the three days from 25 to 27 June, the
364 McIntosh et al.—Mark-Recapture Estimates of Pup Production

estimates would have been 69, 81, and 81, respectively, which are the values for n1 in Table 1. Thus the mark-recapture estimates were 189%, 179%, and 193% of the direct counts for these days, with an average of 187% and standard deviation 7.2 (95% CI 173-201). This is much greater than the difference obtained for this species at Dangerous Reef colony in 1999, where the mark-recapture estimate was 119% of the direct count (Shaughnessy and Dennis 1999). Such a difference is not unexpected be-cause the terrain at Dangerous Reef is more open (with no bushes) than at Seal Bay, and hence fewer pups are likely to be overlooked by direct counting at Dangerous Reef.
The results of this study indicate that estimates of abundance of Australian sea lion pups are biased downward to varying extents. We suspect that the underestimate for small colonies of the Australian sea lion, especially those on rocky islands, are much smaller than indicated here for Seal Bay, where pups are easier to locate.
ConclusionThis is the first mark-recapture study to estimate pup production num-bers of Australian sea lions at Seal Bay Conservation Park. The resulting best estimate of 230 pups represents the sum of the estimated number of pups alive in the colony at the end of the breeding season and the cumu-lative number of dead pups. This estimate is 187% of the mean pup count, suggesting that historic pup count data at this site are biased downward to a large extent, primarily due to the difficulty of finding pups in direct counts. This estimate is also greater than the previous estimate of pup production at Seal Bay (Gales et al. 1994) of 180 pups.
Due to the inability to access Pup Cove and the inability to mark pups in the EPA, the pup production mark-recapture estimate in this study is also likely to be biased downward. Even so, the pup production estimate in this study is a better estimate of total pup production than those derived from simple pup counts, as it was established that there was no emigration of marked pups from the survey site. The counting of newborn pups may provide a good way of estimating pup production in a breeding colony where 230 pups may be born. This method is not ideal as it is very laborious over the lengthy sea lion breeding season and is not currently possible due to restrictions on access to the EPA and Pup Cove. With further investigation, application of a mark-recapture method that best suits this population will be developed to monitor pup production more accurately.
AcknowledgmentsWe thank Mel Berris and the staff of Seal Bay Conservation Park and Kangaroo Island Department for the Environment and Heritage (DEH) for logistic and field support and all the research volunteers for their
365Sea Lions of the World

assistance, particularly Clarence Kennedy, Jason Nicholls, Kiera Perrott, and Georgie Schotter. This research was supported by Sea World Research and Rescue Foundation Incorporated, the South Australian DEH, PADI Asia Pacific, Kangaroo Island Sealink, Kangaroo Island Central Hostel, and Ms. R. Gray. We thank the Australian Marine Science Association for awarding R. McIntosh the International Student Prize and the Alaska Sea Grant College Program for conference support. R. McIntosh received the La Trobe University Postgraduate Award to conduct this project. All work was conducted under DEH permit number Z24347, ethics approval number AEC00/42(L).
ReferencesBerkson, J.M., and D.P. DeMaster. 1985. Use of pup counts in indexing population
changes in pinnipeds. Can. J. Fish. Aquat. Sci. 42:873-879.
Cameron, M.F., and D.B. Siniff. 2004. Age-specific survival, abundance, and immigra-tion rates of a Weddell seal (Leptonychotes weddellii) population in McMurdo Sound, Antarctica. Can. J. Zool. 82:601-615.
Caughley, G. 1977. Analysis of vertebrate populations. John Wiley and Sons, Chichester.
Chapman, D.G., and A.M. Johnson. 1968. Estimation of fur seal pup populations by randomized sampling. Trans. Am. Fish. Soc. 97:264-270.
Cormack, R.M. 1964. Estimates of survival from the sighting of marked animals. Biometrika 51:429-438.
Darroch, J.N. 1958. The multiple recapture census. I. Estimation of a closed popula-tion. Biometrika 45:343-359.
Gales, N.J., P.D. Shaughnessy, and T.E. Dennis. 1994. Distribution, abundance and breeding cycle of the Australian sea lion Neophoca cinerea (Mammalia: Pin-nipedia). J. Zool. Lond. 234:353-370.
Higgins, L.V. 1993. The nonannual, nonseasonal breeding cycle of the Australian sea lion, Neophoca cinerea. J. Mammal. 74:270-274.
Higgins, L.V., and L. Gass. 1993. Birth to weaning: Parturition, duration of lacta-tion, and attendance cycles of Australian sea lions (Neophoca cinerea). Can. J. Zool. 71:2047-2055.
Higgins, L.V., and R.A. Tedman. 1990. Effect of attacks by male Australian sea lions, Neophoca cinerea, on mortality of pups. J. Mammal. 71:617-619.
Jolly, G.M. 1965. Explicit estimates from capture-recapture data with both death and immigration-stochastic model. Biometrika 52:225-247.
Lebreton, J.D., K.P. Burnham, J. Clobert, and D.R. Anderson. 1992. Modelling survival and testing biological hypotheses using marked animals: A unified approach with case studies. Ecol. Monogr. 62:67-118.
Leslie, P.H., and D. Chitty. 1951. The estimation of population parameters from data obtained by means of the capture-recapture method. I. The maximum-likeli-hood equations for estimating death-rate. Biometrika 38:269-292.
366 McIntosh et al.—Mark-Recapture Estimates of Pup Production
Ling, J.K., and G.E. Walker. 1976. Seal studies in South Australia: Progress report for the year 1975. S. Aust. Nat. 50:59-68, 72.
Ling, J.K., and G.E. Walker. 1978. An 18-month breeding cycle in the Australian sea lion? Search 9:464-465.
Nichols, J.D. 1992. Capture-recapture models: Using marked animals to study population dynamics. BioScience 42:94-102.
Orians, G.H., and P.H. Leslie. 1958. A capture-recapture analysis of a shearwater population. J. Anim. Ecol. 27:71-86.
Pemberton, D., and R.J. Kirkwood. 1994. Pup production and distribution of the Australian fur seal, Arctocephalus pusillus doriferus, in Tasmania. Wildl. Res. 21:341-352.
Ries, E.H., L.R. Hiby, and P.J.H. Reijnders. 1998. Maximum likelihood population size estimation of harbour seals in the Dutch Wadden Sea based on a mark-recapture experiment. J. Appl. Ecol. 35:332-339.
Roff, D.A. 1973. An examination of some statistical tests used in the analysis of mark-recapture data. Oecologia 12:35-54.
Seber, G.A.F. 1982. The estimation of animal abundance and related parameters. MacMillan, New York.
Shaughnessy, P.D., and T. Dennis. 1999. Seal research in South Australia, 1998/1999: Abundance of New Zealand fur seal pups on Kangaroo Island and Australian sea lion pups at Dangerous Reef. Report to South Australian National Parks and Wildlife, Department of Environment, Heritage and Aboriginal Affairs. 39 pp.
Shaughnessy, P.D., and A. McKeown. 2002. Trends in abundance of New Zealand fur seals, Arctocephalus forsteri, at the Neptune Islands, South Australia. Wildl. Res. 29:363-370.
Shaughnessy, P.D., S.D. Goldsworthy, and J.A. Libke. 1995. Changes in abundance of New Zealand fur seals, Arctocephalus forsteri, on Kangaroo Island, South Australia. Wildl. Res. 22:201-215.
Shaughnessy, P.D., R.J. Kirkwood, and R.M. Warneke. 2002. Australian fur seals, Arc-tocephalus pusillus doriferus: Pup numbers at Lady Julia Percy Island, Victoria, and a synthesis of the species’ population status. Wildl. Res. 29:185-192.
Shaughnessy, P.D., S.K. Troy, R. Kirkwood, and A.O. Nicholls. 2000. Australian fur seals at Seal Rocks, Victoria: Pup abundance by mark-recapture estimation shows continued increase. Wildl. Res. 27:629-633.
Twyford, K., and F. Vickery. 2001. User-pays fees and regional development on Kangaroo Island. In: G. Worboys, M. Lockwood, and T. De Lacy (eds.), Protected area management principles and practices. Oxford University Press, South Melbourne, p. 175.
York, A., and P. Kozloff. 1987. On the estimation of numbers of northern fur seal, Callorhinus ursinus, pups born at St. Paul Island, 1980-86. Fish. Bull. U.S. 85:367-375.
367Sea Lions of the World