An Augmented Reality Nanomanipulator for Learning Nanophysics: The
Upload
khangminh22Category
view
0download
0
Marine Visualization System: An Augmented Reality Approach
by
Eduard Cojoc-WisernigB.Eng.,M.Sc., Politehnica University of Bucharest, 2008
M.A., University of Bucharest, 2010B.Phil., University of Bucharest, 2009
A Dissertation Submitted in Partial Fulfillment of theRequirements for the Degree of
DOCTOR OF PHILOSOPHY
in the Department of Computer Science
c© Eduard Wisernig, 2020University of Victoria
All rights reserved. This dissertation may not be reproduced in whole or inpart, by photocopying or other means, without the permission of the author.

Marine Visualization System: An Augmented Reality Approach
by
Eduard Cojoc-WisernigB.Eng.,M.Sc., Politehnica University of Bucharest, 2008
M.A., University of Bucharest, 2010B.Phil., University of Bucharest, 2009
Supervisory Committee
Dr. Brian Wyvill, Supervisor(Department of Computer Science)
Dr. Bruce Kapron, Supervisor(Department of Computer Science)
Dr. Eric Hochstein, Outside Member(Department of Philosophy)
ii

Supervisory Committee
Dr. Brian Wyvill, Supervisor(Department of Computer Science)
Dr. Bruce Kapron, Supervisor(Department of Computer Science)
Dr. Eric Hochstein, Outside Member(Department of Philosophy)
ABSTRACT
Sailboat operation must account for a variety of environmental factors,including wind, tidal currents, shore features and atmospheric conditions.We introduce the first method of rendering an augmented reality scene forsailing, using various visual techniques to represent environmental aspects,such as particle cloud animations for the wind and current. The visual con-tent is provided using a hardware/software system that gathers data fromvarious scattered sources on a boat (e.g. instruments), processes the dataand broadcasts the information over a local network to one or more displaysthat render the immersive 3D graphics.
Current technology provides information about environmental factors viaa diverse collection of displays which render data collected by sensors and in-struments. This data is typically provided numerically or using rudimentaryabstract graphical representations, with minimal processing, and with littleor no integration of the various scattered sources. My goal was to build thefirst working prototype of a system that centralizes collected data on a boatand provides an integrated 3D rendering using a unified AR visual interface.
Since this research is the first of its kind in a few largely unexplored areasof technological interest, I found that the most fruitful method to evaluate thevarious iterations of different components was to employ an autobiographicaldesign method.
iii

Sailing is the process of controlling various aspects of boat operation inorder to produce propulsion by harnessing wind energy using sails. Devisinga strategy for safe and adequate sailboat control relies upon a solid under-standing of the surrounding environment and its behaviour, in addition tomany layers of know-how pertaining to employing the acquired knowledge.
My research is grouped into three distinct, yet interdependent parts; first,a hardware and software system that collects data with the purpose of pro-cessing and broadcasting visual information; second, a graphical interfacethat provides information using immersive AR graphics; and last, an in-depth investigation and discussion of the problem and potential solutionsfrom a design thinking perspective.
The scope of this investigation is broad, covering aspects from assemblingmechanical implements, to building electronics with customized sensing ca-pabilities, interfacing existing ship’s instruments, configuring a local networkand server, implementing processing strategies, and broadcasting a WebGL-based AR scene as an immersive visual experience.
I also performed a design thinking investigation that incorporates recentresearch from the most relevant fields of study (e.g. HCI, visualization etc.)with the ultimate goal of integrating it into a conceptual system and a tax-onomy of relevant factors. The term interdisciplinary is most accurate indenoting the nature of this body of work.
At the time of writing, there are two major players that are starting todevelop AR-based commercial products for marine navigation: Raymarine(an AR extension of their chart-based data) and Mitsubishi (AR navigationsoftware for commercial/industrial shipping). I am not aware of any marineAR visualization that is targeted at environmental awareness for sailboatsthrough visualization (wind, tidal currents etc.) and my research constitutesthe first documented and published efforts that approached this topic.
Keywords: marine visualization, augmented reality, distributed system,information synthesis, abstraction model, autobiographical design, pseudo-natural visual appearance
iv

To Albert and Pam,
to Love,
to Life.
v

ACKNOWLEDGEMENTS
In a lifelong pursuit of learning, I am forever in debt to an increasinglylarge list of people including family, friends, colleagues and instructors. I amfortunate and grateful for the opportunity to have worked with each personon this list. I would never have been able to complete this thesis withoutyour dedication, inspiration and wisdom. I wish you all the best and thankyou from the bottom of my heart!
I would first like to thank the supervisory committee, for their guidance,support, endless patience and direction through the winding path that finallyled to this work. Brian, I want to thank you for your patient support andfor all of the opportunities I was given to further my research. Bruce, youprovided me with the vision that I needed to choose the right direction tosuccessfully complete my dissertation. Eric, your insightful feedback pushedme to sharpen my thinking and brought my work to a higher level.
I would like to acknowledge my colleagues from the Computer ScienceDepartment at the University of Victoria. In particular, Lucky and RobertSteacy, your feedback and assistance helped me time and time again.
Thank you to Jerome and Tyler from the Coast Capital Innovation Centrefor your support and guidance.
In addition, I would like to thank my parents for their for endless love,support, patience and faith in me. You are always there for me.
Finally, I could not have completed this dissertation without the supportof my friends who provided stimulating discussions as well as happy distrac-tions to rest my mind outside of my research. In no particular order, Pauland Shona Lalonde, Jan Wall, Derk Wolmuth, John Coppard, Rick Schiller,Paul Coppard and family, Mark Reuten, Pat Coppard and family, Stockmanfamily, Jurek Romaniec, Allan Eppler, Andrei Toma, Meegan and Vadim.
I would also like to express my gratitude to the department secretariesand staff, who helped me stay on track throughout the administrative steps.
Most importantly, thank you Pamela, for Albert, for a life abundantin bliss and love and for the courage to put up with the roller coaster ofadventures we have every day.
To Albert, whose coming into existence gave me the incentive for the finalpush to finish and defend.
vi

“Believe me, my young friend, there is nothing – absolutely noth-ing – half so much worth doing as simply messing about in boats.Simply messing, he went on dreamily: messing – about – in –boats”
The Wind in the WillowsKenneth Grahame
vii

“Always make a definition or sketch of what presents itself toyour mind, so you can see it stripped bare to its essential natureand identify it clearly, in whole and in all its parts, and can tellyourself its name and the names of those elements of which it iscompounded and into which it will be dissolved.
Nothing is so conducive to greatness of mind as the ability tosubject each element of our experience in life to methodical andtruthful examination, always at the same time using this scrutinyas a means to reflect on the nature of the universe, the contribu-tion any given action or event makes to that nature, the value ithas for the whole[...]”
Meditations, Marcus AureliusBook Three, 11
viii

Contents
Supervisory Committee . . . . . . . . . . . . . . . . . . . . . . . . . iiAbstract . . . . . . . . . . . . . . . . . . . . . . . . . . . . . . . . . iiiDedication . . . . . . . . . . . . . . . . . . . . . . . . . . . . . . . . vAcknowledgements . . . . . . . . . . . . . . . . . . . . . . . . . . . viList of Tables . . . . . . . . . . . . . . . . . . . . . . . . . . . . . . xiiiList of Figures . . . . . . . . . . . . . . . . . . . . . . . . . . . . . . xiv
1 Introduction 11.1 Context . . . . . . . . . . . . . . . . . . . . . . . . . . . . . . 21.2 Problem . . . . . . . . . . . . . . . . . . . . . . . . . . . . . . 5
1.2.1 The Immediate Environment . . . . . . . . . . . . . . . 61.2.2 The Sailboat . . . . . . . . . . . . . . . . . . . . . . . 8
1.3 Solution . . . . . . . . . . . . . . . . . . . . . . . . . . . . . . 101.4 Objectives . . . . . . . . . . . . . . . . . . . . . . . . . . . . . 121.5 Contributions . . . . . . . . . . . . . . . . . . . . . . . . . . . 141.6 Dissertation Organization . . . . . . . . . . . . . . . . . . . . 15
2 Related Work 182.1 Early Virtual Environments . . . . . . . . . . . . . . . . . . . 182.2 Marine Applications . . . . . . . . . . . . . . . . . . . . . . . 242.3 Augmented Reality . . . . . . . . . . . . . . . . . . . . . . . . 25
3 Background 293.1 Sailing Context . . . . . . . . . . . . . . . . . . . . . . . . . . 31
3.1.1 Anatomy of a Sailboat . . . . . . . . . . . . . . . . . . 313.1.2 Points of Sail . . . . . . . . . . . . . . . . . . . . . . . 33
3.2 Feedback Loop . . . . . . . . . . . . . . . . . . . . . . . . . . 333.3 Sailing Scenarios . . . . . . . . . . . . . . . . . . . . . . . . . 35
3.3.1 Sailing without Instruments . . . . . . . . . . . . . . . 37
ix

3.3.2 Sailing with Instruments . . . . . . . . . . . . . . . . . 393.3.3 Sailing with the Marine Visualization System . . . . . 403.3.4 Comparative Scenario Discussion . . . . . . . . . . . . 42
3.4 Summary . . . . . . . . . . . . . . . . . . . . . . . . . . . . . 44
4 Preliminary Designs 454.0 Motivation . . . . . . . . . . . . . . . . . . . . . . . . . . . . . 474.1 Autobiographical Design . . . . . . . . . . . . . . . . . . . . . 47
4.1.1 Alternatives . . . . . . . . . . . . . . . . . . . . . . . . 494.1.2 Limitations . . . . . . . . . . . . . . . . . . . . . . . . 49
4.2 Timeline . . . . . . . . . . . . . . . . . . . . . . . . . . . . . . 504.2.1 Stage 1. Sailboat Automation (2013 - 2014) . . . . . . 504.2.2 Stage 2. Data Sources (2014 - 2015) . . . . . . . . . . . 524.2.3 Stage 3. 3D Content (2015) . . . . . . . . . . . . . . . 534.2.4 Stage 4. Augmented Reality (2015 - 2018) . . . . . . . 534.2.5 Stage 5. Conceptually-Modelled Content (2018 - 2020) 55
4.3 Phase 1. Sailboat Automation . . . . . . . . . . . . . . . . . . 574.3.1 Problem 1.0: Sailing is Difficult . . . . . . . . . . . . . 574.3.2 Solution 1.0: Autonomous Sailboat System . . . . . . . 58
4.4 Phase 2. Semi-Autonomous Sailboat System . . . . . . . . . . 584.4.1 Problem 2.0: Sailing is Complex . . . . . . . . . . . . . 584.4.2 Solution 2.0: Semi-Autonomous Sailboat . . . . . . . . 594.4.3 Prototype 2.0: Sailboat Control System . . . . . . . . . 604.4.4 Solution 2.0 Observations . . . . . . . . . . . . . . . . 66
4.5 Phase 3. Marine Visualization System . . . . . . . . . . . . . 684.5.1 Problem 3.0: Scattered Data Sources in Sailing . . . . 684.5.2 Solution 3.0: A Centralized Interface . . . . . . . . . . 684.5.3 Problem 3.1 - Sailing Requires Access to Information . 694.5.4 Solution 3.1 - AR Interface . . . . . . . . . . . . . . . . 704.5.5 Prototype 3.1 - AR Visualization System . . . . . . . . 71
4.6 Conclusion . . . . . . . . . . . . . . . . . . . . . . . . . . . . . 71
5 System 735.1 Overview . . . . . . . . . . . . . . . . . . . . . . . . . . . . . . 745.2 Sensing Module . . . . . . . . . . . . . . . . . . . . . . . . . . 74
5.2.1 Telemetry Unit . . . . . . . . . . . . . . . . . . . . . . 765.2.2 Imaging Unit . . . . . . . . . . . . . . . . . . . . . . . 775.2.3 Instruments Unit . . . . . . . . . . . . . . . . . . . . . 78
x

5.2.4 Internal Unit . . . . . . . . . . . . . . . . . . . . . . . 805.3 Networking Module . . . . . . . . . . . . . . . . . . . . . . . . 815.4 Processing Module . . . . . . . . . . . . . . . . . . . . . . . . 815.5 Visualization Module . . . . . . . . . . . . . . . . . . . . . . . 82
5.5.1 Devices . . . . . . . . . . . . . . . . . . . . . . . . . . 825.5.2 Software . . . . . . . . . . . . . . . . . . . . . . . . . . 835.5.3 Visual Interface . . . . . . . . . . . . . . . . . . . . . . 83
5.6 Summary . . . . . . . . . . . . . . . . . . . . . . . . . . . . . 83
6 Visualization 846.1 User Interaction . . . . . . . . . . . . . . . . . . . . . . . . . . 85
6.1.1 Devices . . . . . . . . . . . . . . . . . . . . . . . . . . 856.1.2 User Input . . . . . . . . . . . . . . . . . . . . . . . . . 85
6.2 Screen Areas . . . . . . . . . . . . . . . . . . . . . . . . . . . . 866.2.1 Main Area . . . . . . . . . . . . . . . . . . . . . . . . . 886.2.2 Picture-in-picture Area . . . . . . . . . . . . . . . . . . 886.2.3 Panels . . . . . . . . . . . . . . . . . . . . . . . . . . . 89
6.3 Content Perspective . . . . . . . . . . . . . . . . . . . . . . . . 906.3.1 Immersive . . . . . . . . . . . . . . . . . . . . . . . . . 906.3.2 Diorama . . . . . . . . . . . . . . . . . . . . . . . . . . 90
6.4 Content Appearance . . . . . . . . . . . . . . . . . . . . . . . 906.4.1 Numeric Appearance . . . . . . . . . . . . . . . . . . . 916.4.2 Graph Appearance . . . . . . . . . . . . . . . . . . . . 916.4.3 Natural Appearance . . . . . . . . . . . . . . . . . . . 916.4.4 Abstract Appearance . . . . . . . . . . . . . . . . . . . 926.4.5 Pseudo-natural Appearance . . . . . . . . . . . . . . . 926.4.6 Distorted Content . . . . . . . . . . . . . . . . . . . . . 93
6.5 Content Organization . . . . . . . . . . . . . . . . . . . . . . . 966.5.1 Background . . . . . . . . . . . . . . . . . . . . . . . . 966.5.2 Motion . . . . . . . . . . . . . . . . . . . . . . . . . . . 966.5.3 Orientation . . . . . . . . . . . . . . . . . . . . . . . . 966.5.4 Course . . . . . . . . . . . . . . . . . . . . . . . . . . . 986.5.5 Heading . . . . . . . . . . . . . . . . . . . . . . . . . . 986.5.6 Wind . . . . . . . . . . . . . . . . . . . . . . . . . . . . 986.5.7 Tidal current . . . . . . . . . . . . . . . . . . . . . . . 986.5.8 Depth . . . . . . . . . . . . . . . . . . . . . . . . . . . 996.5.9 Waypoints . . . . . . . . . . . . . . . . . . . . . . . . . 99
6.6 Summary . . . . . . . . . . . . . . . . . . . . . . . . . . . . . 99
xi

7 Solution Analysis 1017.1 Overview . . . . . . . . . . . . . . . . . . . . . . . . . . . . . . 1017.2 Observations . . . . . . . . . . . . . . . . . . . . . . . . . . . . 1037.3 Insights . . . . . . . . . . . . . . . . . . . . . . . . . . . . . . 104
7.3.1 Sailing Insights . . . . . . . . . . . . . . . . . . . . . . 1067.3.2 Geo-physical Insights . . . . . . . . . . . . . . . . . . . 1097.3.3 Visualization Insights . . . . . . . . . . . . . . . . . . . 1117.3.4 Human-Computer Interaction Insights . . . . . . . . . 1137.3.5 Ergonomics Insights . . . . . . . . . . . . . . . . . . . 1157.3.6 Perception and Abstraction Insights . . . . . . . . . . . 1167.3.7 Art Insights . . . . . . . . . . . . . . . . . . . . . . . . 119
7.4 Conceptual Principles . . . . . . . . . . . . . . . . . . . . . . . 1227.5 Design Principles . . . . . . . . . . . . . . . . . . . . . . . . . 1267.6 Distinctive Features . . . . . . . . . . . . . . . . . . . . . . . . 1327.7 Conceptual Flow . . . . . . . . . . . . . . . . . . . . . . . . . 1357.8 Summary . . . . . . . . . . . . . . . . . . . . . . . . . . . . . 137
8 Future Work 1398.1 Model Sailboat . . . . . . . . . . . . . . . . . . . . . . . . . . 1398.2 Remote Sailing Training . . . . . . . . . . . . . . . . . . . . . 1418.3 Extended Implicit Modelling . . . . . . . . . . . . . . . . . . . 141
8.3.1 Implicit Shape Modelling . . . . . . . . . . . . . . . . . 1428.3.2 Implicit Material Modelling . . . . . . . . . . . . . . . 1428.3.3 Implicit Scene Modelling . . . . . . . . . . . . . . . . . 144
9 Conclusion 1469.1 Contributions . . . . . . . . . . . . . . . . . . . . . . . . . . . 147
9.1.1 Sailboat Control Scenarios . . . . . . . . . . . . . . . . 1479.1.2 Preliminary Designs . . . . . . . . . . . . . . . . . . . 1479.1.3 Sailboat Visualization System . . . . . . . . . . . . . . 1489.1.4 Augmented Reality Interface . . . . . . . . . . . . . . . 1489.1.5 Systematic Background Investigation . . . . . . . . . . 148
9.2 Limitations . . . . . . . . . . . . . . . . . . . . . . . . . . . . 148
Appendix A. Sea-trial Report 150.1 Observations . . . . . . . . . . . . . . . . . . . . . . . . . . . . 152.2 Transcript . . . . . . . . . . . . . . . . . . . . . . . . . . . . . 153
xii

Appendix B. Observations 159
xiii

List of Tables
7.1 List of insights . . . . . . . . . . . . . . . . . . . . . . . . . . 1237.2 List of conceptual principles . . . . . . . . . . . . . . . . . . . 1297.3 List of design principles . . . . . . . . . . . . . . . . . . . . . 1317.4 List of features . . . . . . . . . . . . . . . . . . . . . . . . . . 136
xiv

List of Figures
1.1 Gypsy Moth IV, sailed single-handed around the world by SirFrancis Chichester in 1965 . . . . . . . . . . . . . . . . . . . . 1
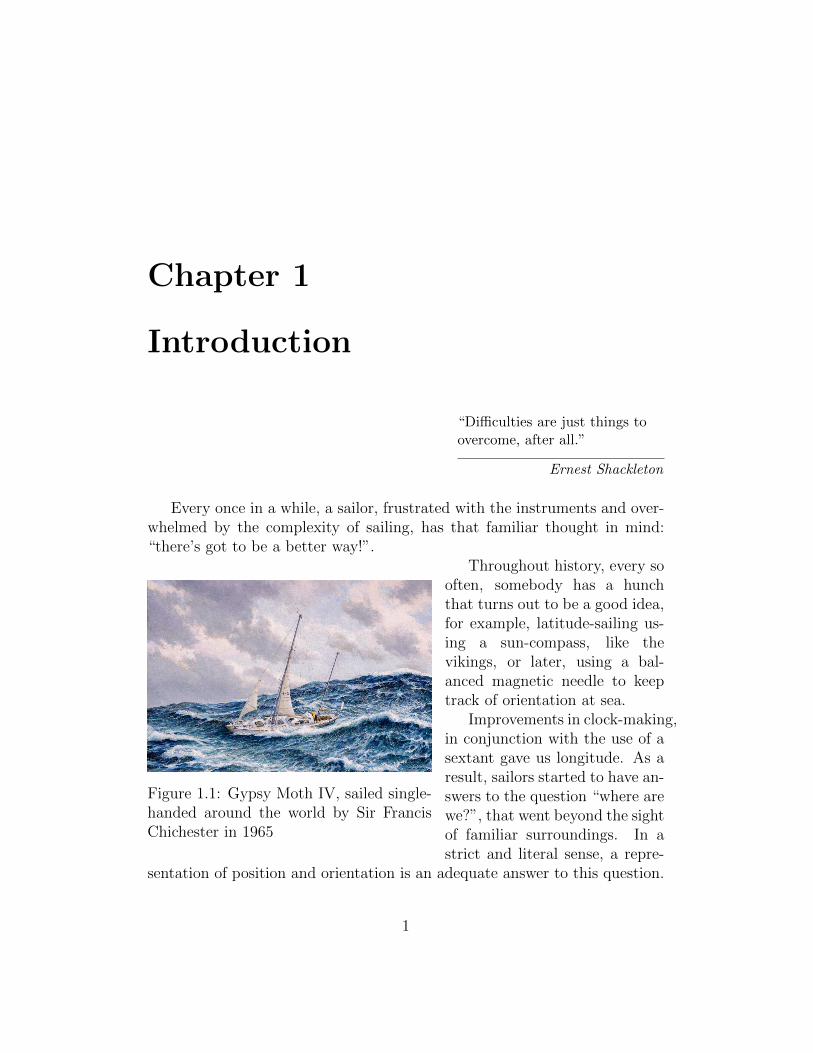
1.2 Some examples of AR applications: (a) Product design usingOST HMD, (b) Navigation using VST handheld, (c) Part de-scription using VST handheld, (d) Pokemon Go game usingVST handheld. . . . . . . . . . . . . . . . . . . . . . . . . . . 2
1.3 (a) Latest generation GPS chart-plotter, (b) Chart-table in-struments, (c) Typical cockpit instruments, (d) High-end bridge. 3
1.4 AR scene: (a) path overlay, (b) distance awareness overlay, (c)self-driving car visualization, (d) America’s cup visualization . 4
1.5 HUD: (a) early jet fighter, (b) commercial aviation, (c) modernAR bridge concept, (d) HMD AR engine inspection . . . . . . 5
1.6 Problem overview . . . . . . . . . . . . . . . . . . . . . . . . . 71.7 Spirit of St. Louis: (a) outside view, (b) diagram, (c) cockpit . 81.8 Foredeck in heavy seas . . . . . . . . . . . . . . . . . . . . . . 91.9 Typical cockpit with instruments . . . . . . . . . . . . . . . . 101.10 Solution overview . . . . . . . . . . . . . . . . . . . . . . . . . 111.11 System overview . . . . . . . . . . . . . . . . . . . . . . . . . 13
2.1 Chauvet Cave Rock-Art . . . . . . . . . . . . . . . . . . . . . 192.2 Sistine Chapel, Vatican . . . . . . . . . . . . . . . . . . . . . . 202.3 World’s first computer art . . . . . . . . . . . . . . . . . . . . 222.4 Sensorama . . . . . . . . . . . . . . . . . . . . . . . . . . . . . 222.5 Sketchpad . . . . . . . . . . . . . . . . . . . . . . . . . . . . . 232.6 Early Concept of an Augmented Reality Vehicular Interface . 27
3.1 Sailboat Diagram . . . . . . . . . . . . . . . . . . . . . . . . . 323.2 Points of sail . . . . . . . . . . . . . . . . . . . . . . . . . . . 34
xv

3.3 Operation Feedback Loop in the Sailor/Boat Continuum . . . 353.4 Axes . . . . . . . . . . . . . . . . . . . . . . . . . . . . . . . . 363.5 Sailing without Instruments . . . . . . . . . . . . . . . . . . . 383.6 Sailing with Instruments . . . . . . . . . . . . . . . . . . . . . 403.7 Sailing with the marine visualization system . . . . . . . . . . 423.8 Processing workload comparison . . . . . . . . . . . . . . . . . 43
4.1 SV Moonshadow in Hartley Bay, BC . . . . . . . . . . . . . . 464.2 Map of the Northward Bound 2013 research expedition . . . . 484.3 On-route to Alaska, developing the first version of the network
and processing server . . . . . . . . . . . . . . . . . . . . . . . 594.4 Autopilot simulator: (a) side view, (b) top view . . . . . . . . 624.5 Autopilot in action . . . . . . . . . . . . . . . . . . . . . . . . 624.6 PID Feeback loop diagram . . . . . . . . . . . . . . . . . . . . 624.7 The Dangler . . . . . . . . . . . . . . . . . . . . . . . . . . . . 634.8 Early visualization concept . . . . . . . . . . . . . . . . . . . . 65
5.1 System Overview . . . . . . . . . . . . . . . . . . . . . . . . . 755.2 Telemetry unit components . . . . . . . . . . . . . . . . . . . 765.3 Instruments unit components . . . . . . . . . . . . . . . . . . 785.4 Internal unit components . . . . . . . . . . . . . . . . . . . . . 805.5 Processing module components . . . . . . . . . . . . . . . . . 82
6.1 AR Scene . . . . . . . . . . . . . . . . . . . . . . . . . . . . . 866.2 Diagram of screen areas . . . . . . . . . . . . . . . . . . . . . 876.3 Scene rendered using only the main and diorama areas . . . . 886.4 Standalone screenshot of the PIP area, with wind and motion
vectors seen in blue and red . . . . . . . . . . . . . . . . . . . 896.5 Numeric Panel . . . . . . . . . . . . . . . . . . . . . . . . . . 906.6 Pseudo-natural appearance: ducks with feet on the surface of
the water . . . . . . . . . . . . . . . . . . . . . . . . . . . . . 926.7 Bottom: original space. Top: warped space. . . . . . . . . . . 946.8 Gravity well by Derk Wolmuth . . . . . . . . . . . . . . . . . 956.9 Scene content . . . . . . . . . . . . . . . . . . . . . . . . . . . 97
7.1 Meaning of arrow in diagrams: Basis and consequence . . . . . 1027.2 Overview of the design process pipeline . . . . . . . . . . . . . 1027.3 The design process pipeline . . . . . . . . . . . . . . . . . . . 1037.4 Sailboat Telltales . . . . . . . . . . . . . . . . . . . . . . . . . 106
xvi

7.5 Dangerous Heeling . . . . . . . . . . . . . . . . . . . . . . . . 1077.6 A lightning strike can fry the electronics and/or captain . . . . 1087.7 Voyage of the James Caird: (a) departing Elephant Island, (b)
approaching South Georgia Island . . . . . . . . . . . . . . . . 1097.8 The puppy’s hair can be used to estimate the wind direction
and strength . . . . . . . . . . . . . . . . . . . . . . . . . . . . 1107.9 The tilt of an anchored floating object can help us estimate
tidal current direction and strength . . . . . . . . . . . . . . . 1117.10 The shape and position of the turbulence provides clues about
the current . . . . . . . . . . . . . . . . . . . . . . . . . . . . . 1127.11 Example of self-contained and self-validated meta-information 1137.12 Example of a bird’s eye view of a sailboat . . . . . . . . . . . 1147.13 Wallace’s Line . . . . . . . . . . . . . . . . . . . . . . . . . . . 1177.14 Conceptual flow between insights and conceptual principles.
See Tables 7.1 and 7.2 for a list of symbols . . . . . . . . . . . 1277.15 Conceptual flow between conceptual principles, design princi-
ples and features. See Tables 7.3 and 7.2 for a list of symbols. 1287.16 Conceptual flow between insights, conceptual principles, de-
sign principles and features. See Tables 7.1, 7.3, 7.2 and 7.4for a list of symbols. . . . . . . . . . . . . . . . . . . . . . . . 138
8.1 maribot Vane wing-sail sailboat model . . . . . . . . . . . . . 140
1 Sea Trial Route May 16 . . . . . . . . . . . . . . . . . . . . . 151
xvii
Chapter 1
Introduction
“Difficulties are just things toovercome, after all.”
Ernest Shackleton
Every once in a while, a sailor, frustrated with the instruments and over-whelmed by the complexity of sailing, has that familiar thought in mind:“there’s got to be a better way!”.
Figure 1.1: Gypsy Moth IV, sailed single-handed around the world by Sir FrancisChichester in 1965
Throughout history, every sooften, somebody has a hunchthat turns out to be a good idea,for example, latitude-sailing us-ing a sun-compass, like thevikings, or later, using a bal-anced magnetic needle to keeptrack of orientation at sea.
Improvements in clock-making,in conjunction with the use of asextant gave us longitude. As aresult, sailors started to have an-swers to the question “where arewe?”, that went beyond the sightof familiar surroundings. In astrict and literal sense, a repre-
sentation of position and orientation is an adequate answer to this question.
1
Though, in a more accurate way, the answer is akin to an onion, wrappedin concentric layers of complexity and ultimately bound by only imaginationitself.
In sailboat navigation, whether we are talking about that drying rockjust outside the breakwater or the eye of a storm in open ocean, anotherimportant layer to add to the concepts of position and orientation is anunderstanding of the current surrounding environment.
The more we peel the various layers of knowledge needed to safely sail,the more we realize that there are actually only two questions that come toplay: “where are we?” and “what’s happening around us?”.
The purpose of my research is to push the boundaries of current technol-ogy in the quest for a unified answer to these questions.
1.1 Context
Augmented reality (AR) technology is on the cusp of triggering a massiveparadigm shift in the way we use and understand computing and meta-information integration into every day life.
Over the last decade we have seen increasing interest in AR hardwareresearch. Prototypes, such as Google Glass or Microsoft HoloLens, capturedthe hopes and dreams of many software developers and visionaries.
AR technology has been a hot research topic for several decades, yet overthe last few years it has started to transcend academia and cross into thecommercial domain with the first generation of product offerings. Theseare almost entirely focused on indoor AR experiences, particularly after the
(a) (b) (c) (d)
Figure 1.2: Some examples of AR applications: (a) Product design usingOST HMD, (b) Navigation using VST handheld, (c) Part description usingVST handheld, (d) Pokemon Go game using VST handheld.
2

collapse of the Osterhoutgroup earlier this year.Initial AR head-mounted display (HMD) (Figure 1.2a) products received
mixed reviews when they were first introduced, but since their launch, sev-eral other companies have joined in and recently we have seen a boom inAR glasses at affordable prices. Other non-HMD AR applications have alsobecome popular, with Pokemon Go (Figure 1.2d) being an example of anapplication that provides AR content on a handheld device, such as a smart-phone or a tablet, without requiring any specialized hardware. AR navigationand service/manufacturing applications have also seen extensive research andproduct development (Figure 1.2b and 1.2c, respectively). A quick distinc-tion to be made is between video see-thru (VST) devices and optical see-thrudevices (OST), where the visual feed comes from a camera in the former anddirectly from the eyes in the latter [1].
Sailing, i.e. operating a boat that uses sails for propulsion, is anothermajor focus of my research. The process of sailing requires sailors to beaware of the wind, the shore, tidal currents, wildlife, sail geometry, driftand many more aspects. Fortunately, there are instruments that can helpacquire data from several sources: wind direction and strength from theanemometer, water depth from the depth sounder, navigational informationfrom the GPS chart-plotter and others. Even so, sailboat operation is achallenging and demanding task even for experienced sailors. The marineenvironment is unforgiving and hostile towards electronics, which can beseen in the delayed adoption of commonplace electronic systems such as GPSnavigators. Electronic devices that operate in the marine environment needto be built to rugged standards [2]. It is for this reason that, at the time ofwriting, there is no AR HMD suitable for marine use available either as acommercial product or even in experimental development.
(a) (b) (c) (d)
Figure 1.3: (a) Latest generation GPS chart-plotter, (b) Chart-table instru-ments, (c) Typical cockpit instruments, (d) High-end bridge.
3

Another aspect that may be related is the fact that the 2D paradigmin which marine information is displayed in even the most advanced recentchart-plotters resembles GPS car navigators from 20 years ago (Figure 1.3a).Also, the prohibitively high cost for marine electronics determines a slowrate of adoption of new technology; in fact, most sailboats from the last fewdecades still operate with the original instruments they were outfitted with(Figure 1.3b, 1.3c).
Even on a more advanced and modern bridge, like in Figure 1.3d, wefind the same digital chart-plotter and numeric display instrument stylesthat were used for at least a couple decades. It is, therefore, not surprisingthat there are few academic research efforts that we know of that approachthe idea of extending AR technology to address marine navigational andenvironmental awareness.
Before I talk about the needs of sailors from an informational perspective,let’s first look at a few existing ideas for developing aids to navigation using anAR paradigm. Car manufacturers were early adopters of advancements in ARtechnology and there have been some remarkable developments as a result.In Figure 1.4a we see an early AR scene with a correlated perspective of thereal and virtual environments, where the information is coming from the GPSsensors and displayed with a simple path representation. Figure 1.4b adds alayer of complexity by incorporating data regarding the distance to nearbyvehicles, using sensors and computer vision methods. The simulated conceptAR scene from Figure 1.4c shows the scenario of vehicular visualization ina self-driving car. The closest any AR application has gotten to the marineenvironment came in the form of the TV visualizations used for the America’sCup (Figure 1.4d) [3].
Due to the structured and heavily regulated environment they operate
(a) (b) (c) (d)
Figure 1.4: AR scene: (a) path overlay, (b) distance awareness overlay, (c)self-driving car visualization, (d) America’s cup visualization
4

in, drivers have fundamentally different needs than sailors [4]. In fact, theearliest examples of a rudimentary form of AR comes from the use of heads-up displays (HUD) in jet fighters (Figure 1.5a) [5]. This kind of immersivedisplay was subsequently adopted by the civil aviation industry (Figure 1.5b).Figure 1.5c shows a modern approach, using a sophisticated AR scene. Bythis point we start to realize that there is definitely potential in investigatingthe use of AR technology to develop navigational assistance applications.So, the imminent question is, can we use a similar approach for sailboatnavigation and environment awareness?
Further, should we?The short answer to both questions is ”yes,” and the long answer is the
remainder of this document, starting with the problem statement in thefollowing section and continuing to explore a series of aspects pertaining tofinding a path towards potential solutions.
1.2 Problem
The problem I address in this research is the inherent difficulty of sailboatoperation arising from the complexity of disparate sources of data requiringvarying levels of attention, processing and interpretation, and the need forreal-time decision-making based on this data.
I will explore whether it is possible to process and display data regard-ing a boat’s operation and immediate environment in a form that is moreimmediate and convenient than that provided by the existing paradigm ofmultiple instruments and pure sensory processing by the sailor (Figure 1.6).
In the context of pure sailing, sailors of small sailboats learn to gauge
(a) (b) (c) (d)
Figure 1.5: HUD: (a) early jet fighter, (b) commercial aviation, (c) modernAR bridge concept, (d) HMD AR engine inspection
5

things like current and wind speed through all kinds of intuitive visual andbodily cues (e.g. the feel of the swaying of the boat, visual cues from theappearance or movement of the waves, etc.)
There are, however, all kinds of information that may be relevant tothe sailor which are not intuitively available in this way (e.g. obstructionsunder the water, potential shifts in atmospheric conditions, subtle changesin pressure, etc.)
Sailors working on larger sailing vessels are less able to navigate by feelin the same way. They compensate by using various kinds of instrumentswhich can display things like wind speed, air pressure, current direction, etc.
The problem is that each of these readouts in isolation can be misleading.Looking at air pressure by itself, or current direction by itself, or wind
speed by itself, ignores the ways in which these features interact. In orderto sail effectively, sailors must be able to calculate the complex causal inter-play between these features and how each feeds into the others. Having theinformation displayed on readouts in this way can be unintuitive, difficult totrack, and cognitively taxing on sailors who must attempt to integrate themmentally.
1.2.1 The Immediate Environment
In broad strokes, safe sailing relies on the process of controlling the operationof a boat while constantly seeking answers to two fundamental questions:
1. What is happening around us?
2. Where are we?
If we’re talking about sailing vessels in particular, the fact that sails areused to harness the power of the wind for propulsion implies an increasednecessity for an astute awareness regarding the behaviour of the wind.
Because of natural limitations of traditional sailboat hull designs (i.e.displacement hull), sailboats are slow, especially when compared to othervehicles [6]. Sailboat displacement hulls have a predefined maximum hullspeed, which cannot be surpassed, no matter how much force the boat canproduce; this is due to the fact that the boat starts climbing its own bowwave.
Hullspeed ≈ 1.35 ∗√Lengthofwaterline
6

Figure 1.6: Problem overview
7

The hull speed of a typical sailboat around 35ft in length is approx. 7.4kn(13.7km/h), which is comparable to the tidal currents speeds commonlyfound on the west coast of Canada1. So, it is quite common for sailorsto pay close attention to what the tidal currents are doing.
Hitting rocks or reefs can easily turn into a catastrophe, so another im-portant aspect of safe sailing is to be aware of the position, orientation andmotion of the boat relative to known threats. Having access to informationregarding the shore topography is, therefore, paramount, either in the form ofnavigation tools (e.g. paper charts, digital chart-plotters etc.) or by relyingon memory and experience.
In addition to these important aspects, there are several others that needto be constantly monitored, such as local boat traffic, marine wildlife, artifi-cial structures, aids to navigation or floating debris.
1.2.2 The Sailboat
Everything I’ve mentioned so far is part of a boat’s environment. There isanother major source of information that needs to be monitored and that isthe boat itself and all of the various subsystems it features.
Before I examine the details of a sailboat system, let’s first look at anotherkind of vehicle: the airplane ”The Spirit of St. Louis.” Charles Lindbergh
1The highest currents commonly encountered are more than twice the maximum speedof a regular size sailboat. For example: Skookumchuck Narrows - 17.7kn, Nakwakto Rapids- 18kn, and the notorious Seymour Narrows (15kn), which was described by CaptainVancouver as ”one of the vilest stretches of water in the world.”
(a) (b) (c)
Figure 1.7: Spirit of St. Louis: (a) outside view, (b) diagram, (c) cockpit
8
flew this famous airplane in 1927 on the first solo, nonstop transatlantic flight(Figure 1.7a). The internal distribution of space inside the plane was focusedon prioritizing the location of the main tank that carried a massive volumeof fuel relative to the weight of the plane (Figure 1.7b). This made for arather peculiar cockpit design, which didn’t have any forward facing windows.Instead, there were two small side windows and a retractable periscope, whichoffered extremely limited visibility. The forward facing part of the cockpitwas basically a sheet of plywood with rudimentary instrumentation (Figure1.7c).
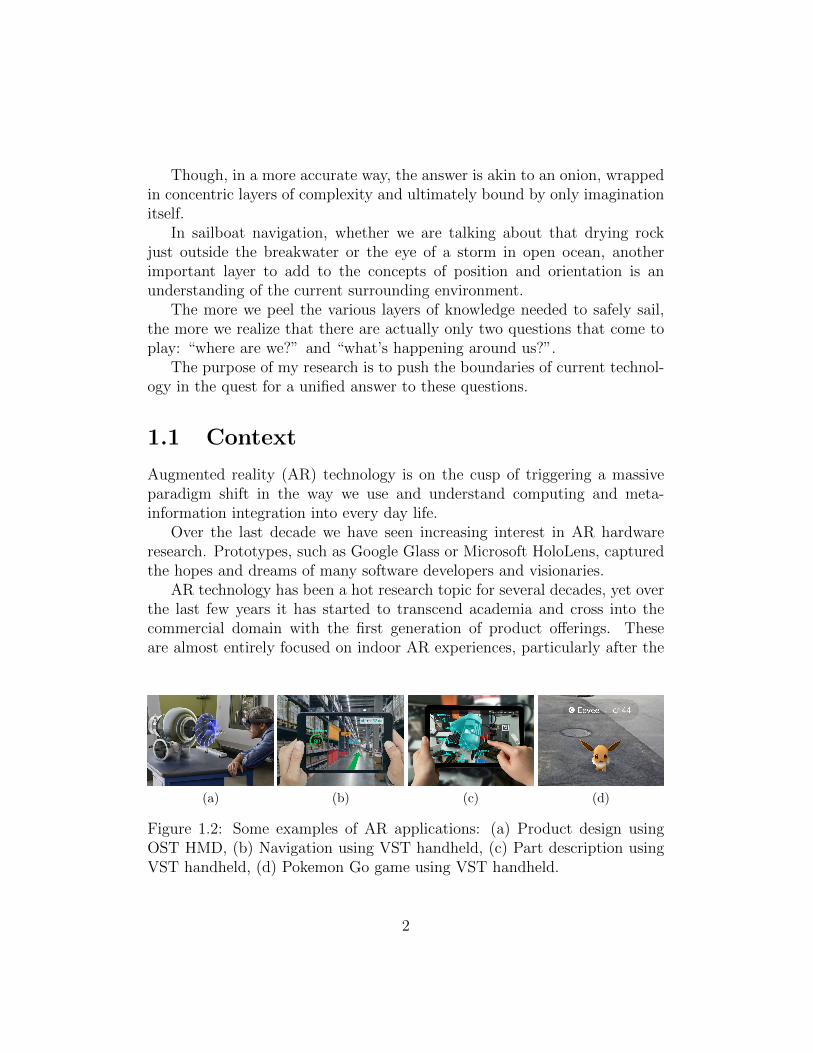
Figure 1.8: Foredeck in heavy seas
The reason I am mentioning this particular and unusual vehicular designfeature is to highlight the fact that even though the amount of informationavailable to Lindbergh was minimal, he, nevertheless, achieved a spectacularfeat: crossing the Atlantic ocean nonstop. The point I am making is thatevery vehicle has its own needs regarding the scope of awareness the operatormust face, even if some features may seem highly unintuitive, like having thevisual awareness capabilities heavily restricted.
In strong contrast, sailboats require sailors to be able to visually monitorcountless components, including sail position and condition, running riggingobstructions, wind indicator, tangled lines and standing rigging condition,just to mention a few entities outside of the cockpit (see Figure 1.8).
Inside the cockpit, there are typically various instruments that provideinformation about the status of the boat (e.g. engine control panel), as wellas several devices that control the boat, with the most important being thehelm (i.e. steering wheel or tiller). The most important source of informationfor sailors is usually found either in front of the steering wheel or mounted
9

Figure 1.9: Typical cockpit with instruments
into the outside of the companionway bulkhead in the form of a bundle of in-struments connected to sensors embedded into the boat’s systems. The mostcommon instrument configurations include an anemometer (wind sensing),depth sounder, impeller log (speed over water), magnetic compass (orienta-tion) and others (Figure 1.9).
One of the most important instruments and the tools sailors probablyuse most often is the GPS chart-plotter (location). Sometimes mechanicalgauges can be attached to provide information, like atmospheric pressure orheeling angles.
1.3 Solution
I propose creating a system that integrates all this information together forthe sailor and display that information in a centralized location (Figure 1.10).
One effective way to do this is to simplify the information delivered tosailors. I can provide overly simplistic, abstracted, or idealized, representa-tions to the sailor to avoid information overload. This solves the problemof cognitive overload on sailors, but it introduces a new set of problems: ifI simplify or idealize the information presented to sailors, then they are nolonger acting on accurate information. Instead of correct information abouttheir environment, they now have overly simplified accounts. Easier to un-derstand, but far more dangerous if the sailor confuses the idealizing andsimplifying assumptions for real facts about the world.
Bad choices can suddenly lead to disaster. The correct and more accurate
10

Figure 1.10: Solution overview
information needs to be available for sailors to use, but presenting this in-formation intuitively requires idealizing and distorting it. It appears I mustmake a trade-off between models being understandable and being accurate.
Therefore, in order to balance all of these concerns, I need an approachthat conveys a lot of different kinds of information to sailor in a way thatis more intuitive than just a collection of different numerical readouts, butwhich also provides a greater variety of information than can be gained frompure sailing.
This information must be integrated to relieve sailors from the strain ofinterpreting it from the sailor.
I need to represent the information in a simplified and intuitive mannerwhich will require distorting and idealizing what is presented to the sailors,while at the same time not misleading them so that they cause accidents.
Lastly, I also need to make sure that the more accurate (but less intuitive)numerical information is still available to sailors in case the more intuitiverepresentation is insufficient for their needs.
My approach towards finding a solution is at the intersection of severalfields of academic study, which will be grouped into a two-part solution:implementation and investigation.
The aim of the implementation part of the solution is to design, build,and test out sensory, processing, and visualization capabilities. Given theexperimental nature of the solution and the absence of previous work to build
11

upon, the process involves several iterations and prototyping phases, whosesuccess or failure needs to be evaluated and reintegrated into the conceptualmodel at each step.
The aim of the investigative part of the solution is to acquire facts andobservations relating to the research problem, to generate insights into thevarious disconnected entities under scrutiny, and ultimately, to conceptuallyjoin these entities together into a unified abstract model, as part of theconceptual side of the system. Some of the most important aspects underinvestigation are a general understanding of the elements that come to playin vehicle operation, and particularly pertaining to the marine environment,as well as a thorough mapping of various perception-related concepts andtheories. This model is a complex web of connections between relevant, yetdisparate aspects of the problem and it serves as the blueprint for subsequentefforts to implement practical features.
1.4 Objectives
The overall aim of this dissertation is twofold:
1. To design and build elements of a prototype AR-based visualizationsystem that aids in the navigation of a sailboat (Figure 1.11).
2. To use an investigative method inspired by design-thinking that cov-ers the in-depth analysis of the problem as well as the transition intoprinciples and subsequently into system features.
The first aim is of a scientific/technological nature, featuring the followingobjectives:
• To identify, classify, and analyze the factors, entities and processes thatcome to play in the process of sailing (e.g. wind, sail trim, currents,navigation, etc.);
• To propose a model of the complex relationship among the entitiesmentioned above;
• To design a system that augments sailors’ understanding of the envi-ronment and their boats’ operation (see Figure 1.11);
12

Figure 1.11: System overview
13

• To build mechanical implements, electronic components, a network, avisual interface, etc.;
• To create a model to present visual content as part of an augmentedreality scene.
Our second aim is of an eclectic nature with some of the most significantobjectives being:
• To explore a diverse palette of perception, modelling, and abstractionconsiderations that affect the way we understand and use visualizationtools;
• To investigate the meaning of information representation, particularlythat of non-visual entities being represented visually;
• To devise a methodology of inquiry into the causes and explanationsof relevant phenomena;
• To outline a method of keeping track of the decision-making pipeline,starting with facts and observations, continuing with insights, concep-tual and design principles, and finally resulting in actual features.
1.5 Contributions
Considering that the field of AR vehicular visualization is still in its infancy,I investigated and, where possible, filled in some of the major aspects thatdetermine the foundation upon which this field of study relies, in particularpertaining to its use for the purpose of marine visualization.
List of contributions:
� C1. A vehicular visualization system featuring a network of devices,instrument interfaces, imaging capabilities, sensor readings, processingand broadcasting capabilities (Chapter 5)
� C2. Telemetry and internal units featuring an array of sensors notcommonly present on sailboats (Sections 5.2.1, 5.2.4)
� C3. A WebGL-based immersive AR interface (Section 5.5)
14

� C4. An AR scene featuring entities that correlate with geo-physicalphenomena from the sailing environment (Chapter 6)
� C5. A method of investigating entities and aspects vital to the processof sailing (Sections 7.3.1, 7.3.2)
� C6. An interaction/correlation model for these entities (Section 7.7)
� C7. A discussion on the nature of these entities and of suitable poten-tial visualization approaches (Chapter 6)
� C8. A design recount of the process of interface development insidethe AR paradigm, focused on marine vehicular visualization (Chapter7)
� C9. A graph-based flow matrix that keeps track of the extensive num-ber of inter-dependencies between observations, insights, principles,and features (Section 7.7)
� C10. An in-depth analysis of the particular elements that comprisefeedback loops in the process of sailboat operation, in three differentscenarios (Chapter 3)
� C11. A recount of the preliminary design process in three phases oriterations (Chapter 4)
� C12. A classification of different potential layers of abstraction forsailing phenomena (Section 6.4)
� C13. A discussion about the potential of using visual aids to achievecontextual visual awareness (Sections 6.4.5, 6.4.6)
1.6 Dissertation Organization
Related Work
In the related work chapter I examined the foundational background againstwhich many facets of our research is set. I examine the concepts behind vir-tual environments and few a notable examples. Then, I explore the conceptsof augmented reality and augmented perception.
15

Background
This chapter begins with a brief introduction of the most important aspectsof the process of sailing. First, I discuss terms that are relevant to myfield of research. Then, I continue by looking into the different points ofsail. Afterwards, I discuss the main topic of this chapter: the feedbackloop, which is a way to formalize the interaction between sailors and theirboats/environment. Last, I identify and cover three different sailing methodsand discuss how sailors’ cognitive processes are determined by the type offeedback loop they employ.
Preliminary Designs
In this chapter we see a chronological and conceptual map of how I got tothis final point in our research. After covering the background against whichthis project has started, I look at the preliminary investigation of the subjectmatter. Then, I explore the creation of the first prototypes and ultimatelyevaluate those. The last section follows the impact of the lessons learned andhow these changed my understanding of the problem at hand.
System
In this chapter provides detailed descriptions of all the major engineeringcomponents, classified as modules and units (Figure 1.11. The sensing mod-ule performs real-time data acquisition from a wide range of sources: teleme-try unit, imaging unit, instruments unit, internal unit. The networking mod-ule covers the details such as the topology of the network as well as the devicesand protocols used. The processing module gathers data, logs it, processesit, and broadcasts it. The visualization module section covers various aspectsabout way the system provides access to the visualization content (devices,software, and interface details).
Visualization
The visualization chapter is a detailed recount of the structure of the sceneused to display the AR content. It starts with detailed descriptions of theentities used and finishes with a discussion of the visualization choices madein the development process.
16

Solution Analysis
This chapter identifies and correlates all of the aspects that determine theimplementation choices I made. In sequence, I cover observations, insights,conceptual principles, design principles, and, finally, features. In addition toidentifying and discussing intimate details that take important roles, I builda flow matrix by tracing a network of conceptual dependencies.
Annex A, Sea-trial Report
This annex is a recount of one of the sea-trials I performed. It features adescription of the objectives and goals of the sea-trial, a track of the routetaken, a list of invaluable observations, and a detailed transcript of the notesI took at sea.
Annex B, Observations
In this annex I describe a series of observations I collected over time. They areliteral transcripts of the thoughts people had when asked about the system.They are not sorted by any criteria and some of them became the basis forinsights, while some others did not.
17

Chapter 2
Related Work
The current chapter works on two fronts, both as an introduction to themajor concepts that are specific to my field of study, and also as a recount ofsignificant research activity that shares some conceptual resemblance to myresearch project.
At the time of writing, the topic of real-time visualization of marineaspects using an Augmented Reality paradigm with the particular applicationof creating an interface that aids in vessel navigation is largely unexplored.
There are, however, a few projects that target the topic of autonomousships. There is some noteworthy overlap, despite the fact that these projectsare aimed at industrial-scale, commercial shipping in contrast to my focuson recreational vessels and, particularly sailboats.
From a commercial perspective, there were two noteworthy productslaunched in 2019, the Raymarine Axiom Enhanced Awareness and the GarminNautix. These two products approach the topic of AR visualization for therecreational boating market. However, I could not find any peer-reviewedacademic papers about either product at the time of writing.
2.1 Early Virtual Environments
My research relies on the paradigm of augmented reality (AR) visualization.To understand AR, we need to first explore a couple fundamental aspectssuch as virtual environments and the virtuality continuum.
The concept of a virtual environment is preceded by that of presence.According to Slater and Wilbur, “Presence is a state of consciousness, the
18

[psychological] sense of being in the virtual environment”. [7]Presence itself is a subjective concept, seen as “when the multimodal sim-
ulations (images, sounds, haptic feedback, etc.) are processed by the brainand understood as a coherent environment in which we can perform someactivities and interact.” [8] In this context, the concept of a virtual environ-ment is used as a medium to provide the user with meaningful information.
Even though the terminology and the concepts I employ are relativelyrecent, we can find instances of virtual environments going back tens of thou-sands of years.
One of the earliest examples I found is the complex collection of paintingson the walls of the Chauvet Cave dated around 35,000 BC [9].
Figure 2.1: Chauvet Cave Rock-Art
In the book “The archaeology of rock-art”, Chippendale gives us an ideaabout the immersive nature of the experience of being exposed to this kind ofart form. [10] Wavering light is produced by torches, hearths, or bonfires andis projected onto the walls to create the impression of animation (see Figure2.1). Even more, there is an element of interactivity as the scene comes tolife while the user walks around, changing the perspective.
A similar, though much more recent virtual environment (VE) can beexperienced in the Vatican’s Sistine Chapel (see Figure 2.2) where visitorsfind themselves immersed and overwhelmed by an abundance of visual stimulithat portray an overarching story line.
From these two examples, however, it would be erroneous to assume thatany work of art is a VE, since there are several characteristics that are re-
19

Figure 2.2: Sistine Chapel, Vatican
20

quired for it to qualify, with immersion and presence being two of the mostobvious.
A major breakthrough that contributed to a widespread change in thenature of art and subsequently a precursor to virtual reality came in the formof Wagner’s aesthetic concept of gesammtkunstwerk1 [11]. According to Koss,the “Gesamtkunstwerk, as conceived by Wagner, [...] retained the specificityof the single discipline but enforced its strength through an interdisciplinarycollaborative effort.” [12]
In the book “The Total Work of Art: From Bayreuth to Cyberspace”,Smith [13] sheds light on how, guided by this ideal, Wagner’s later operasattempted to create a harmonious fusion between the various media typi-cally encountered in this art form, including the music, libretto style, storyplot, stage effect and setup, and choreography. By contrast, contemporaryrival composers were portrayed by Wagner as employing celebrated bravurasinging, sensational stage effects, and meaningless plots, resulting in a dis-sonant experience [11]. Towards the end of the 19th century, Wagner pio-neered an experimental, one-off opera house2 with exceptional acoustics anddesigned to enhance the audio-visual operatic experience, where the orches-tra pit was invisible to the audience [14]. The aim of this endeavour wasto provide users with a focused experience where non-essential aspects werepurposely hidden.
In the early 20th century there were a few experiments in static stereog-raphy as the audio-visual technology progressed.
From a graphics perspective, the world’s first computer art, dated around1956-1958, was a rendered glowing image of a pin-up girl on a military IBMcomputer: “The pin-up image itself was programmed as a series of short lines,or vectors, encoded on a stack of about 97 Hollerith type punched cards” [15](Figure 2.3).
It was in the 60’s, however, when the interest in immersive experienceswas met with new advances in technology that triggered a whole wave ofscientific inquiry into what we today call Virtual Reality (VR).
In 1962 the cinematographer M. Heilig built a multi sensory vehicle sim-ulator called Sensorama, (see Figure 2.4) which users could experience notonly stereographic video, surround sound, and haptic feedback, but also air-
1Gesamtkunstwerk could be translated and understood as a total (or complete) workof art
2Bayreuther Festspielhaus
21

Figure 2.3: World’s first computer art
flow generated with fans, and even smells. [16] In this early VR precursor,the user had no control over the experience, but was fully immersed in it.
Figure 2.4: Sensorama
Around the same time, I. Sutherland startedworking on a research project involving the first ap-plication of computer aided-design, Sketchpad [17],which was also the first program ever that featured agraphical user interface. Human computer interac-tion had been in use for several decades at that time,but none of those early approaches used a graphicalmedium.
The infamous 1965 article entitled “The ulti-mate display”, published by Sutherland [18] servesas an invitation to explore the potential of futuretechnology; it makes a case for the use of keyboardsand hints at pointing devices such as joysticks, aswell as approaching topics such as computer render-
ing and display types. This article is considered to be the first instance ofthe concept of VR being presented as a potentially achievable technology.
At this point, it is noteworthy to ponder on the meaning of the termdisplay, particularly since today’s understanding of the term may overshadow
22

Figure 2.5: Sketchpad
some of its broader original meaning and conceptual potential.The Merriam-Webster dictionary defines the verb to display as:
display (verb):to make evident:to exhibit ostentatiously
From an engineering perspective, one could argue that a display may takethe form of any technological means that can produce a representation of de-liberate content, with notable examples being Sensorama’s olfactory featuresand wind simulation using fans.
Even more so, in the above mentioned paper [18], Sutherland goes as faras proposing a display that could alter matter itself, much like the Holodeckconcept seen in Star Trek.
In 1967, F. Brooks started Project GROPE, that would span severaldecades. This project investigated how haptic displays would improve users’understanding of the virtual content [19].
Sutherland’s further research into head-mounted displays (HMDs) from1968 featured the first truly immersive stereographic interactive system; thetechnology of HMDs has never stopped evolving since [20].
23

2.2 Marine Applications
Advances in vessel-based sensor technology, better ship-to-shore communi-cation connectivity, and increases in vessel traffic necessitated advances inautomation for maritime navigation. Data fusion, including integration ofship-based data, electronic charts, and remote sensing data, such as satellite[21] and coastal RADAR offer new possibilities for enhanced safety in navi-gation. Initiatives such as the “Chart of the Future”, which aims to enhancepaper charts by incorporating bathymetry and shoreline imagery have beenin development for over a decade [22]. Despite these technological advances,navigation, especially aboard small vessels, is often still done with papercharts and relies on human interpretation of sensor data.
Many systems have been introduced for enhanced visualization of sensordata, yet I am not aware of the existence of any augmented reality visual-ization interfaces designed exclusively for operators of small sailing vessels,either in academia, in industry, or as a commercial product. I will brieflydescribe a few existing systems below.
The problem of interface design for ship bridge operation is addressed in[23]. In this work, the author explores several aspects for integrating moreand more navigation systems such as the ARPA/ECDIS. Our system buildson the existing 2D interface attempts by introducing an augmented realityinterface.
As of early 2015, Rolls Royce [24] announced its intention to developan augmented reality based interface for controlling various aspects in thecommand, navigation, and operation of cargo ships. The company releaseda design concept to the press, however, no articles or research reports havebeen published yet.
The open-source navigation software OpenCPN (as well as several othercommercial products) has among its features a plug-in called Dashboard,that successfully integrates and displays NMEA-available information in aminimal 2D window system. While this plug-in approaches the same prob-lem, displaying information from NMEA sensors, it does so in a 2D windowedparadigm, using a rudimentary 2D geometric and numeric approach. In myapproach, I process the same data and render it as animated 3D layers in anaugmented reality system.
A similar system based on augmented reality visualization for vehicleshas been implemented on cars for a study with seniors [25]. The work isdifferent from ours because it is focused primarily on creating an artificial
24
environment, rather than augmenting the perceived reality. From this source,I learned about an interesting approach to mixed reality. Another paperdescribed the research effort of a team using a simulated augmented realitywindshield display to aid seniors in driver navigation [26].
Some of the benefits and flaws of augmented reality systems that arecommon with this project have been discussed at length in a survey from2009 [27]. An interesting project from the Columbia University exploresthe potential to use augmented reality technologies to evaluate the potentialbenefits of using AR for armoured vehicle maintenance [28]. Its focus isprimarily on the identification of different controls inside a tank, which couldbe applied to the interior of a sailboat (e.g for reading tank levels or engineRPM) at a later stage in our project.
Due to the rough nature of the marine environment, many aspects haveto be taken into consideration for achieving the required level of ruggednessand reliability. In an interesting paper from 1999, the authors mention thechallenges of making an AR system work in a rough environment [29] andmost of the identified technological limitations are still valid today.
While these limitations still stand 20 years later, ruggedized versions ofdevices such as smartphones and tablets can serve as steppingstones towardsbringing augmented reality visualization into rough environments.
The above mentioned research projects, together with the commercialAR products mentioned at the beginning of the chapter, offer a glimpse intothe vibrant beginnings of a trend that tries to use AR in different ways fornavigation.
2.3 Augmented Reality
Head mounted devices (HMDs) have been a research topic ever since I.Sutherland’s initial research in the 1960s, yet the first efforts towards us-ing an HMD in direct relation to elements of the real world have startedaround the early 1990s.
In [30] a 1992 article, Tom Caudell introduced the term ”AugmentedReality:”
“The enabling technology for this access interface is a heads-up(see-thru) display head set [...], combined with head position sens-ing and workplace registration systems. This technology is used
25

to “augment” the visual field of the user with information nec-essary in the performance of the current task, and therefore werefer to the technology as “augmented reality” (AR).”
The following year, A. Janin continued the research in a paper [31] thatfurther discusses the problem of calibrating the system.
One of the first approaches towards identifying the various degrees ofmixed reality can be seen in P. Milgram’s paper from 1994 [32]. In thisarticle we get a first glimpse at the mixed reality spectrum.
In Azuma’s 1999 paper [29], we find one of the first in-depth surveys ofaugmented reality research and terminology.
Starting with the early 2000s, we saw an increase of AR research projects,with AR Quake, outdoor augmented reality system [33] being a most promi-nent example.
In a paper from 2014 [34] entitled “Towards the Holodeck” the authorsexplored the potential use of a virtual reality environment for the purposesof visualization of scientific and engineering data. They also approached theissue of interactivity and proposed a scenario where a boat designer used aVR system to aid in understanding the spatial distribution of various featureson a ship.
One of the earliest portrayals of the idea of VR being used for vehicularcontrol is from the original Alien [35] movie. It also features as a greatopportunity to showcase the potential for VR to be used as AugmentedReality as well, as in Figure 2.6.
In a paper from 2010 [36], the authors examined a few approaches tousing AR technology for marine navigation purposes. They look into varioustopics, including fusing satellite photos with nautical charts, a vision system,and a discussion of using AR for marine applications. The considerationspublished in this paper are rather general, despite several figures illustratingcommercial ships.
Another related paper from 2014 [37], focused on the issue of naviga-tional awareness for large ships. The authors proposed an AR interface thatintegrates different kinds of data (GPS, AIS, wind etc.)
In one of my own papers from 2015 [38], I presented an early attemptto use an augmented reality system to visualize essential sailing information.The initial work sparked a related research project [39] that looked into usingcomputer vision to identify debris in the video feed and to issue warningsusing the display.
26

Figure 2.6: Early Concept of an Augmented Reality Vehicular Interface
27

Beyond our main focus on vehicular AR applications, the field of researchsurrounding augmented reality has seen a veritable explosion of interest overthe last 10 years. While not directly related to my research project, thefollowing papers provide a context of recent research in AR research thatcan be applied to my research endeavours.
The current approaches to extended reality (which includes AR and VR)have some serious limitations due to the input methods used such as thewell established voice recognition, keyboards, or pointing devices. In aproject from 2017, a promising alternative [40] comes in the form of elec-troencephalography interfacing, which facilitates real-time mental selectionusing tools commonly found in the medical sector.
A paper from Microsoft research published in 2015 [41] explored the ca-pability of the Hololens not only to perform the typical functionalities of aHMD, but also to broadcast the visual experience to other users over Skypeon regular displays. Another similar project, JackIn (2014) [42] used the livevideo feed from a HMD to construct a broader visual context for a spectatorwho observes a traditional 2D display.
Also on the topic of remote collaboration, this journal paper from 2014[43] discussed potential ways to achieve collective, world-stabilized annota-tions for virtual environments.
And lastly, augmented reality can be achieved through non-visual content,such as haptics. In a CHI paper from 2017 [44] the authors devised a hapticsystem that allows the wearer of an HMD to actually feel the weight of avirtual object, but stimulating the user’s muscles with electrical signals.
28

Chapter 3
Background
“If one does not know to whichport one is sailing, no wind isfavorable”
Lucius Annaeus Seneca
This chapter introduces significant concepts, terminology, and sailing sce-narios that will be used in the subsequent chapters.
Before discussing the visualization system we have developed, it is imper-ative that we familiarize ourselves with the most important aspects aboutsailing. In the following chapters, I assume that the reader already knowsthe vital terminology.
First, I will explore the sailing context by looking at the anatomy of asailboat and points of sail. Then, I will analyze the process of sailing a boat,in particular the feedback loop sailors use to maintain control of the boatunder sail. Later, I identify three unique sailing scenarios in which sailorsuse different means to gather information regarding the status of the boatand its environment. I finish with a quick, comparative discussion regardingthe processes sailors follow to obtain information.
29

Sailing is fun, there is no doubt about it; but one would be hard pressedto find an experienced sailor claiming that it is easy.
This chapter is not going to be a tutorial about sailing itself, but ratheran evaluation of the devices, methods, and tools used in the process. Thenautical terms I use can be found in any dictionary or beginner’s manual onsailing; these terms, however, will be kept to a minimum.
Much like the process of controlling any device, sailing is a matter ofobserving what the boat is doing, processing the observed data (i.e. analyzingthe data), reasoning, and performing actions (i.e. controlling the boat). Therepetition of this sequence becomes the feedback loop that I will explore atlength in the following sections.
Depending on the type of boat and the technology available on it, I willidentify and explore a few different categories of options regarding informa-tion acquisition.
I will discuss the information acquisition process the captain goes throughin three different scenarios. The term cognitive load is a loaded term; it hasvarying meanings in several fields of academic inquiry, among which one ofthe most significant being cognitive task load analysis as encountered as abranch of software design [45]. My understanding and limited use of termssuch as cognitive load, cognitive effort, or cognitive strain can be seen asthe sum of mental actions sailors need to perform in order to achieve acertain outcome. This includes actions such as remembering details, analysisand processing of data, synthesis of information, and the effort involved inplanning and maintaining the oversight of physical activities.
However, I will use these terms informally, without appealing to anyparticular theory of cognitive processing. My approach is largely qualitative,as I examine the underlying interdependence among several factors.
The three identified categories mentioned above are:
1. Pure sailing or sailing unaided by any instruments other than the hu-man senses (e.g. dinghy sailing);
2. Sailing aided by instruments, as well as the human senses (e.g. largerboats that may have an anemometer, depth sounder, a GPS chart-plotter, etc.);
3. Sailing aided by our proposed marine visualization system, instruments,as well as the human senses.
30
3.1 Sailing Context
In this section I will introduce the main sailing concepts that will play a rolethroughout this document, first by looking at the most important parts of asailboat and then at the process of sailing itself.
3.1.1 Anatomy of a Sailboat
The distinctive difference between sailboats and other boats is that sailboatsrely on sails for propulsion. In order to facilitate propulsion using sails, thereare several unique hardware components that sailboats must have.
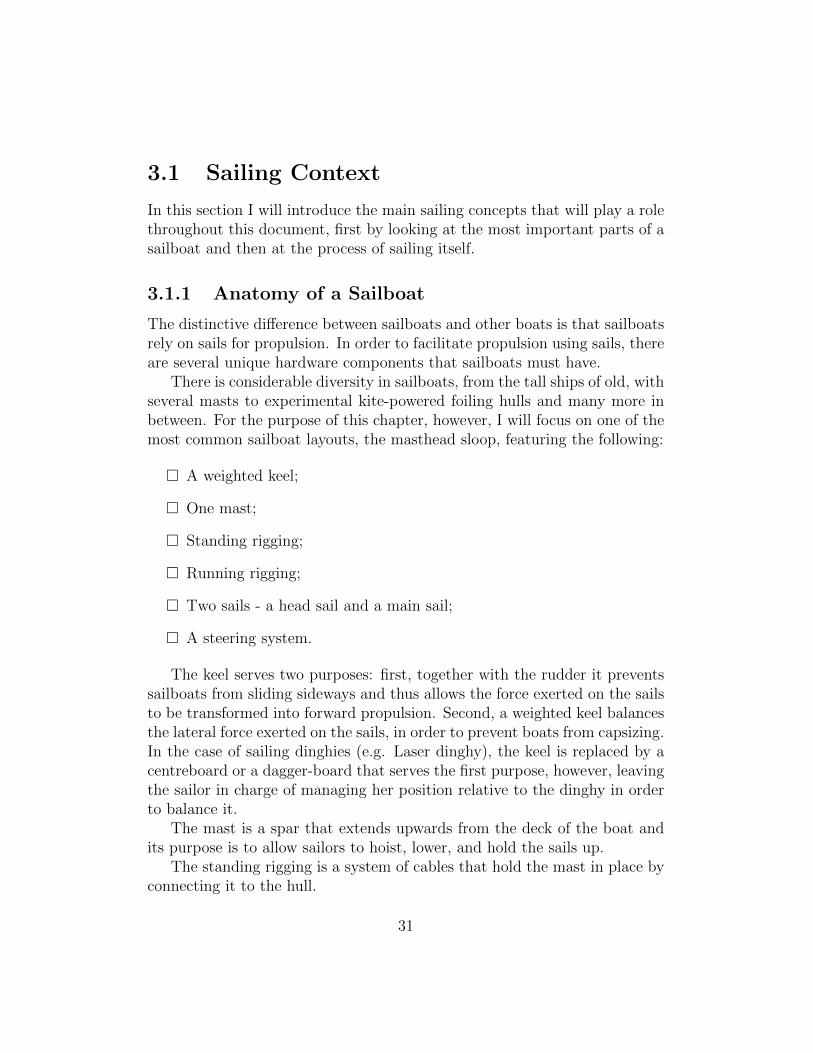
There is considerable diversity in sailboats, from the tall ships of old, withseveral masts to experimental kite-powered foiling hulls and many more inbetween. For the purpose of this chapter, however, I will focus on one of themost common sailboat layouts, the masthead sloop, featuring the following:
� A weighted keel;
� One mast;
� Standing rigging;
� Running rigging;
� Two sails - a head sail and a main sail;
� A steering system.
The keel serves two purposes: first, together with the rudder it preventssailboats from sliding sideways and thus allows the force exerted on the sailsto be transformed into forward propulsion. Second, a weighted keel balancesthe lateral force exerted on the sails, in order to prevent boats from capsizing.In the case of sailing dinghies (e.g. Laser dinghy), the keel is replaced by acentreboard or a dagger-board that serves the first purpose, however, leavingthe sailor in charge of managing her position relative to the dinghy in orderto balance it.
The mast is a spar that extends upwards from the deck of the boat andits purpose is to allow sailors to hoist, lower, and hold the sails up.
The standing rigging is a system of cables that hold the mast in place byconnecting it to the hull.
31

Figure 3.1: Sailboat Diagram
32

The running rigging is a system of ropes that allows for the movementof sails, both upward/downward and sideways, called halyards and sheets,respectively.
The sails are sheets of canvas, most often triangular in shape and typicallymade of Dacron material, that form an upward wing shape. The sails areused to harness the force of the wind.
The rudder steers the boat. It controls the turn rate of the boat. Therudder is controlled either by a tiller or a steering wheel.
3.1.2 Points of Sail
We have all seen floating objects drifting downwind, so, naturally, most be-ginners think that sailboats would travel downwind. With modern sail rigsit is possible to use a sail as a wing, and by using the lateral resistance of thekeel, to transform the force generated on the sail into forward motion, evenwhen traveling against the wind.
The different angles the boat intends to travel, relative to the wind direc-tion, are called points of sail. The points of sail will influence many aspectsof sailboat operations, for example sail adjustments (trim) or heel. Whenrunning (i.e. sailing downwind) the boat does not heel, but sailing closehauled (i.e. sailing closely into the wind) produces significant heeling.
3.2 Feedback Loop
The focus of this dissertation is not only to propose a marine visualizationsystem as a digital aid to control a sailboat, but also to compare it to moretraditional sailing methods that preceded it. For this purpose, I will firstlook at the common characteristics that most sailing methods share.
At its most basic, the process of sailing can be broken down to a loopwith the following three steps:
1. Observation. The skipper observes the behaviour of:
(a) The boat: heeling angle, sail trim, rudder angle, motion, etc.;
(b) The environment: wind direction and strength, tidal currents,depth tendency, etc.
2. Reasoning. The skipper decides on a strategy for the next actions.
33

Figure 3.2: Points of sail
34

Figure 3.3: Operation Feedback Loop in the Sailor/Boat Continuum
3. Action. The crew/skipper performs actions according to the outlinedstrategy.
At every new iteration of the loop, the expected results are compared tothe actual results and the error is taken into account in the reasoning step.In the next section I will further break down the steps and investigate thetasks that determine a higher or lower mental workload, depending on thetechnological aids used.
3.3 Sailing Scenarios
There are as many ways of sailing a boat as there are sailors, but for ourpurposes, I have identified three sailing scenarios: unaided by technology,aided by instruments, and aided by the marine visualization system.
All three methods follow the same basic feedback loop structure andachieve the same goal: safely sailing a boat. Once I go deeper and exploremore details, I can identify both subtle and not-so-subtle differences thathave significant consequences regarding the mental workload imposed ontothe sailor.
In the diagrams used for the different scenarios, the various entities areorganized relative to the horizontal and vertical axes, like in Fig. 3.4. On
35

Figure 3.4: Axes
the horizontal axis I have identified three distinct domains:
� The human domain is where we place processes that require human ef-fort without interacting with the boat (e.g. feeling the wind, analyzingthe tidal current, reasoning, etc.);
� The boat domain is where we place processes that the boat facilitates(e.g. analyzing depth tendency, sensor readings, etc.);
� The interactive domain is where we place processes of interaction be-tween the human and the boat (e.g. acquiring data from visualizers orinstrument displays, actions such as steering, etc.).
On the vertical axis I use a simplified version of the DIKW hierarchy.The DIKW model tries to classify purported structural and/or functionalrelationships as data, information, knowledge, or wisdom.
“Typically, information is defined in terms of data, knowledge in termsof information, and wisdom in terms of knowledge.” [46].
For our purpose, we broadly define these concepts using the followingmeaning:
36

� Data - raw, unprocessed quantitative evidence, representing variousaspects; data requires significant mental filtering and processing to beconsidered useful in real-time;
� Information - quantitative and qualitative data that has been synthe-sized for a certain purpose; information is useful, due to its syntheticand focused nature;
� Knowledge - can be seen as meta-information, or ways to achieve some-thing using information (i.e. know-how relative to a specific topic);
� Wisdom - strategy, reasoning, general know-how.
In the effort of trying to attempt to understand the factors that determinethe process sailors go through to acquire information, I first look at thecomplexity, position on the diagram, and number of tasks that the skipperhas to perform throughout the different scenarios.
3.3.1 Sailing without Instruments
In my first scenario, let’s assume we are sailing on a boat that has no instru-ments whatsoever, not even a mechanical wind indicator. This is the ancientway of sailing; the Vikings sailed thousands of miles into the unknown usingnothing but their senses.
Skippers would be able to estimate the wind direction and strength byfeeling it on their faces. They could estimate the water depth either visuallyor by using a weight tied to a rope. Experienced sailors can read the watersand estimate the direction and strength of tidal currents. The old sea-dogscan predict the incoming storm by their aching knees and joints.
This kind of sailing is still practised on sailing dinghies, where is it im-possible to install instruments due to the size restrictions of the boats.
One of the most obvious problems is that it takes a long time to learn howto interpret and predict the behaviour of various natural elements reliably.Another problem is that given the qualitative nature of the sensory data, itis very difficult to make accurate longer term predictions about position ormovement. Thus it is not only difficult to lay out a long term strategy, butit would also require constant attention by processing several disconnectedsources of data. For this particular case, skippers face substantial sensingand processing challenges.
37

Figure 3.5: Sailing without Instruments
The process of sailing in this scenario is similar to the idealized feedbackloop I introduced in section 3.2. The notable difference is that the observa-tion step is broken down into sensory acquisition and analysis. For example,in order to determine one’s movement over ground, we need to sequentiallyform two ranges and observe the movement of the foreground relative to thebackground. Then we analyze this data by triangulation. By incorporatingit into a mental representation of the sailing scene, we can generate an esti-mation of the likely movement over ground and thereby the possible positionat a given time in the future.
The horizontal axis in Fig. 3.5 represents a spectrum with the skipper onthe left and the boat on the right. In the center, we see the actions wherethe skipper directly interacts with the boat. On the left we see the sensoryacquisition, analysis, and reasoning, since all of these demand the skipper’sattention and effort to perform. On the right we have nothing, because thereis no useful information being collected by the boat. Everything the skipperknows, they know through their senses and mental processing efforts.
38

3.3.2 Sailing with Instruments
For our second scenario, I will assume a modern sailboat around 35 feetin length. This would be a common sight around the sailing communityand many sailors would be familiar with the process of sailing such a vessel.In fact, most of the marine visualization system I discuss here has beendeployed and tested on a Nicholson 35, a masthead sloop designed for blue-water cruising. These sailboats typically have instruments that aid in theprocess of data acquisition:
� Anemometer - an instrument that measures and displays informationrelating to the apparent wind direction and strength;
� Depth sounder - an instrument that measures and displays the waterdepth under the boat;
� Impeller log - an instrument that measures the speed of the boat relativeto the water;
� GPS digital chart-plotter - an instrument that displays the boat’s po-sition relative to a digital marine chart.
For more detailed information about these kinds of instruments, pleasesee section 5.2.3.
In this scenario, skippers rely on instrument readings for acquiring instantdata regarding the wind, depth or speed over water, position relative to theground, etc. Using the displays, skippers would constantly analyze the data,then incorporate this information into the process of reasoning according tosome strategy. Afterwards, skippers would perform certain actions such astrimming the sails or steering a certain course.
The process of sailing in this scenario is still similar to the idealizedfeedback loop introduced in section 3.2. The main difference between thisscenario and the first scenario (as seen in section 3.3.1) is that the data aboutboth the environment and the boat is coming from instruments as opposedto the senses. That means that the instruments displace some of the sensingworkload from skippers to their boats by filtering some of the raw data andpresenting more focused data.
For example, in this scenario skippers can rely both on the GPS chart-plotter and on the depth sounder information to avoid collision with a reef orother underwater threats. Without these instruments, determining the risk
39

Figure 3.6: Sailing with Instruments
of such threats would be difficult and would most likely determine a differentsailing strategy. In figure 3.6 we see a similar diagram to the previous scenariowith the added difference that now the skipper gets the relevant data usingthe instrument displays. These, in turn, get their raw data from the adjacentsensors, which are integrated into the boat’s systems. Skipper don’t acquiredata from the sensors directly, but rather through the displays, which filterthe data to a certain extent, yet still require careful analysis.
The displays are positioned in the diagram in the centre and the sensorson the right side. Skippers have more accurate data that demands less mentalprocessing, thus reducing the workload and freeing up time for other tasks.
3.3.3 Sailing with the Marine Visualization System
Our third and last scenario is that of the same boat from the second scenario,including the same instruments, but in addition to those, featuring the marinevisualization system.
The marine visualization system can be deployed using two differentmodes:
� As an exocentric mode visualizer (e.g. a fixed tablet in front of the
40
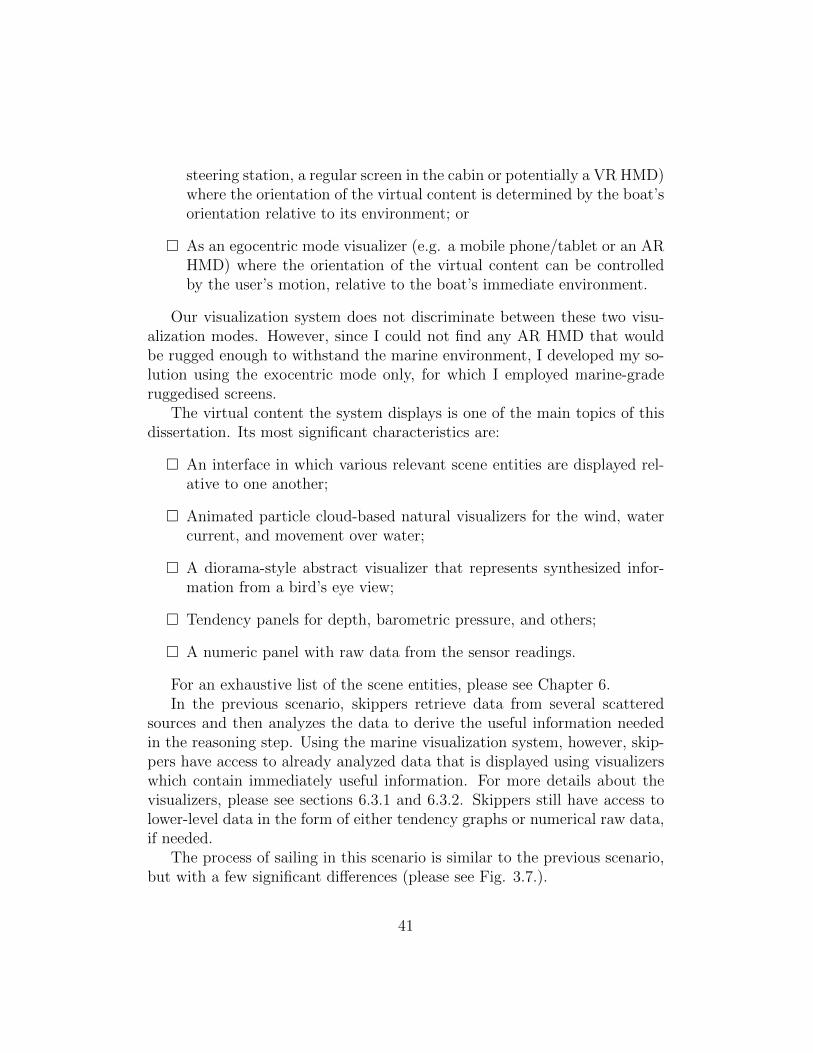
steering station, a regular screen in the cabin or potentially a VR HMD)where the orientation of the virtual content is determined by the boat’sorientation relative to its environment; or
� As an egocentric mode visualizer (e.g. a mobile phone/tablet or an ARHMD) where the orientation of the virtual content can be controlledby the user’s motion, relative to the boat’s immediate environment.
Our visualization system does not discriminate between these two visu-alization modes. However, since I could not find any AR HMD that wouldbe rugged enough to withstand the marine environment, I developed my so-lution using the exocentric mode only, for which I employed marine-graderuggedised screens.
The virtual content the system displays is one of the main topics of thisdissertation. Its most significant characteristics are:
� An interface in which various relevant scene entities are displayed rel-ative to one another;
� Animated particle cloud-based natural visualizers for the wind, watercurrent, and movement over water;
� A diorama-style abstract visualizer that represents synthesized infor-mation from a bird’s eye view;
� Tendency panels for depth, barometric pressure, and others;
� A numeric panel with raw data from the sensor readings.
For an exhaustive list of the scene entities, please see Chapter 6.In the previous scenario, skippers retrieve data from several scattered
sources and then analyzes the data to derive the useful information neededin the reasoning step. Using the marine visualization system, however, skip-pers have access to already analyzed data that is displayed using visualizerswhich contain immediately useful information. For more details about thevisualizers, please see sections 6.3.1 and 6.3.2. Skippers still have access tolower-level data in the form of either tendency graphs or numerical raw data,if needed.
The process of sailing in this scenario is similar to the previous scenario,but with a few significant differences (please see Fig. 3.7.).
41

Figure 3.7: Sailing with the marine visualization system
First, because the marine visualization system uses only the instrumentsensor data, the displays of the instruments become redundant, so they areeliminated from the feedback loop. Then, the analysis step is removed fromthe left side of the spectrum and placed on the right side, where the generatedinformation is provided by the system using the visualizers. And last, usersacquire immediately useful information from the marine visualization systemvia the visualizers, before going through the process of reasoning.
Using this paradigm, both the sensory acquisition as well as the analy-sis processes are moved to the right side of the spectrum, thus meeting theskippers’ need for easily accessible information. In fact, we can see in the di-agram that the process of observation has been reduced to simply immersingoneself into the marine visualization system, where most of the importantinformation is readily available.
3.3.4 Comparative Scenario Discussion
At this point in my research it is important to differentiate fact from opin-ion or assumptions. The previous three sections described different ways ofaccessing content in an objective manner.
In this section, however, I explore a set of assumptions from an autobi-
42

ographical perspective, drawing observations from personal use of the aug-mented reality system I built [47]. I am not trying to state immutable facts,but rather to explore potentially subjective matters that remain to be fur-ther explored in the subsequent chapters. This also means that this is basedon my own experiences with sailing and with the development of the visu-alization system derived from a sequence of design iterations (see Chapter4).
Figure 3.8: Processing workload comparison
In the first scenario, skippers have to acquire all the relevant data usingtheir own senses, then analyze this data and use it for reasoning, all in real-time.
In the second scenario, skippers collect data using the instruments’ dis-plays, and then they must still analyze the data and make decisions basedon it.
In the third scenario, skippers accesses information that has already beenanalyzed and synthesized by the boat, with a focus on providing instant,specific, immediately useful information.
I assume that the easier the observation process is (i.e. obtaining higher-quality, focused information), the lower the cognitive effort of the skipper. Ialso assume that by off-loading some of the processing effort from the humandomain to the boat domain, I may reduce the cognitive strain. Figure 3.8
43

shows a comparison of the cognitive process between the different sailingscenarios.
3.4 Summary
In this chapter I presented vital information pertaining to the process ofsailing a boat, including an introduction into the sailing context, controlfeedback loop, and a discussion of a few sailing scenarios.
In the first section, 3.1 I introduced terminology regarding a sailboat’sanatomy (see 3.1.1) and points of sail (see 3.1.2).
In the next section, 3.2 I discussed the process of sailing a boat, by usingand identifying the individual components of a feedback loop.
In the last section, 3.3 I identified and presented three sailing scenariosand followed up by engaging in a discussion of the scenarios when comparedto one another (see 3.3.4). The three scenarios are sailing without instru-ments (see 3.3.1), sailing with instruments (see 3.3.2) and sailing with themarine visualization system (see 3.3.3).
44

Chapter 4
Preliminary Designs
“Be thankful for problems. Ifthey were less difficult, someonewith less ability might haveyour job”
Jim Lovell
In this chapter I follow the design process that resulted in the currentdirection of my research project.
In the previous chapter, 3, we looked at various aspects of the problem aswe tried to answer the question why are we researching this? Here we embarkon a journey to seek answers to another fundamental question, what is thesolution going to be? And in Chapters 5, 6, and 7 we answer the questionhow are we implementing the solution? from three perspectives: hardware,visual content, and conceptual flow, respectively.
The difference between this chapter and Chapter 7 is that this chapterexplores different ideas and directions in order to settle on a desired vision,while Chapter 7 explored the different kinds of content used to fulfill thisvision.
As the title suggests, this chapter follows the design process by takinga close look at a detailed timeline that tracks the various iterations of thedesign process, from early concepts all the way to the current, final design.
I begin by attempting to identify the motivation that led me to pursuethis research project. Then, in section 4.3 I look at the first idea for ageneral direction: a fully autonomous sailboat. In the next section, 4.4, I try
45
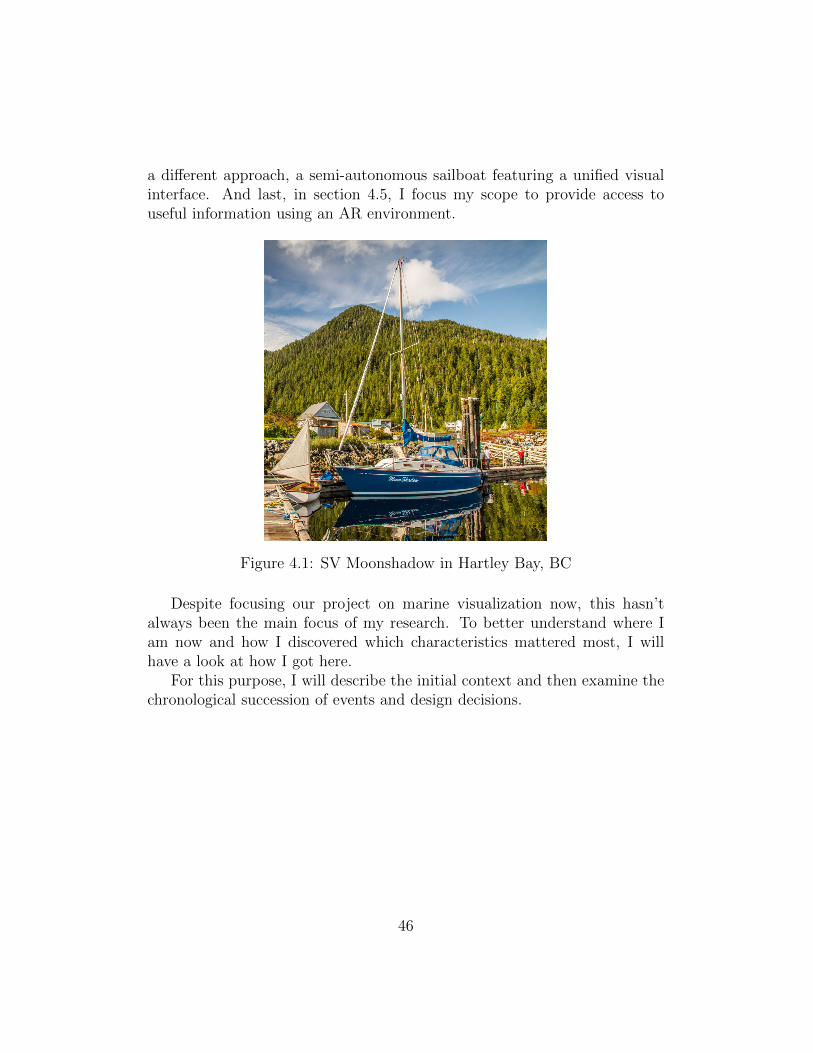
a different approach, a semi-autonomous sailboat featuring a unified visualinterface. And last, in section 4.5, I focus my scope to provide access touseful information using an AR environment.
Figure 4.1: SV Moonshadow in Hartley Bay, BC
Despite focusing our project on marine visualization now, this hasn’talways been the main focus of my research. To better understand where Iam now and how I discovered which characteristics mattered most, I willhave a look at how I got here.
For this purpose, I will describe the initial context and then examine thechronological succession of events and design decisions.
46
4.0 Motivation
The first idea of starting a research project related to sailboats came to mein 2013 when I embarked on a six-month sailing trip to explore Canada’sPacific Coast (see Fig. 4.2 Map of the 2013 expedition). I had no experiencewhatsoever with sailing or anything related to the ocean and I had justbought SV Moonshadow, a 26’ Paceship, only a few months before settingsail on the expedition. At that time I was at the beginning of my PhD andI was looking for research ideas.
Sailing is not an easy task, especially when sailing alone in some of themost remote areas of the Pacific Coast. In fact, sailing is one of the mostcomplex examples of vehicular control. Even though things happen relativelyslowly in sailboat operation compared to flying or even driving, the numberof parameters involved in successful sailing is significantly higher. Theseinclude the weather, topography of the shore and seabed, wildlife, man-madestructures, marine currents and many more. So, I decided to investigate thepossibility of a technological approach to simplifying the sailing process, andthus potentially increasing safety and pleasure at sea.
4.1 Autobiographical Design
For our purposes, within the limited scope of this dissertation, my team choseto approach the testing of various elements of the system from an autobio-graphical perspective by following this method, based on [48]. I started withan ideation session, then established assumptions, tried implementing severalideas, and finally reached conclusions regarding the feasibility of the ideas bycomparing the conclusions and the assumptions [49].
I decided early to pursue an autobiographical design as my researchmethod to guide the design process, being influenced by similar researchprojects such as [50]. I experienced many iterations and failures before reach-ing stable solutions to sub-problems, a process well established, [51]. I builtan extensive database of observations in the form of notes, logbooks, soundrecordings, photos, and videos.
The autobiographical design method is a study or design testing methodthat involves the designer actually personally using the prototype duringthe design iterations, similar to [52]. The designer uses and evaluates theprototype himself, as opposed to competing methods of testing such as user
47
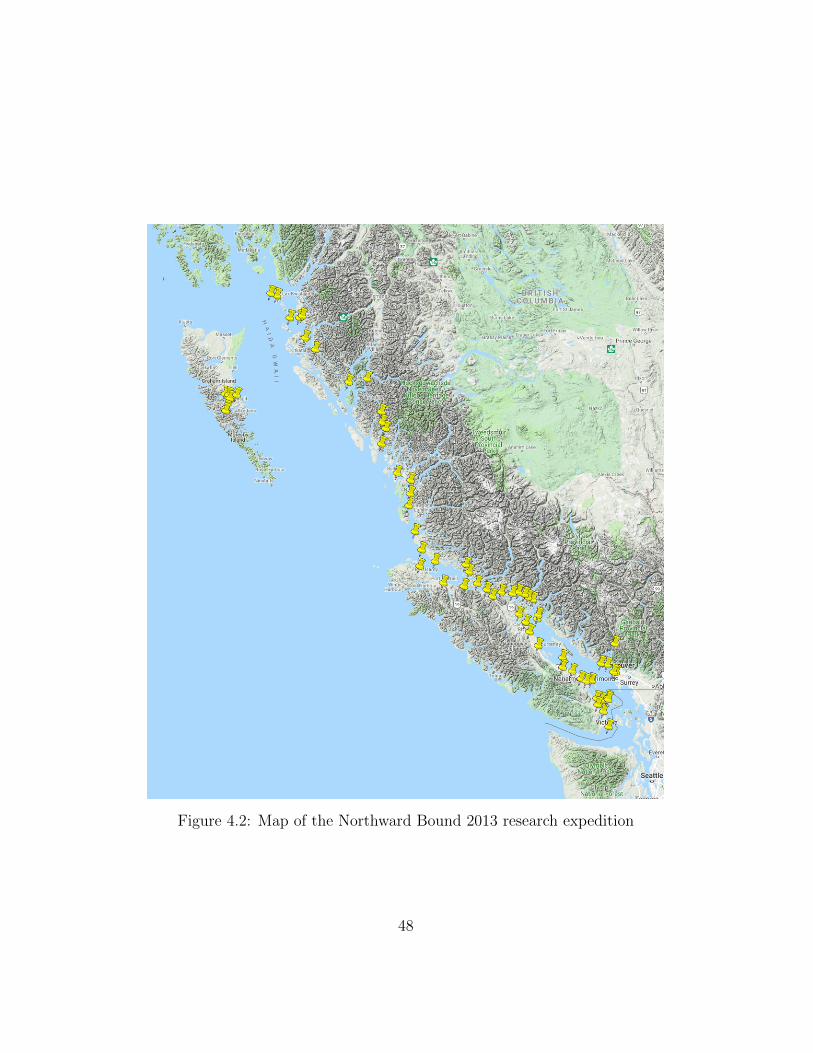
Figure 4.2: Map of the Northward Bound 2013 research expedition
48

studies, whereby users unfamiliar with the prototype are invited to evaluateit, [53].
Developing sailing applications is a good fit for autobiographical designwhen the researcher has access to a sailboat, because the prototype can beactively tested at each iteration, as in [51].
4.1.1 Alternatives
One good example of that was testing different constants for the PID systemused to implement the autopilot. This process involved the mathematicianwho designed the model and me sailing for several hours, trying out differentvalues and taking notes on the behaviour of the vessel.
An alternative design method is beta-testing, [54]. This calls for theprototype to be tested multiple times on a sample of likely customers. Inthis method, the researcher does not test the prototype directly; instead hecollects observations from the beta-testers.
A second alternative is experimental design, where the designer createsa simulator to test the product, [55]. I employed this method in the firstphase of the autopilot development efforts while ironing out details suchas electronics, motor drivers, sensing devices, etc. I created an obstaclecourse and tested several iterations of the autopilot, until it successfully andrepeatedly navigated through it.
4.1.2 Limitations
Some of the obvious limitations of autobiographical design are the expertknowledge of the user and blind spots regarding the experience of other users.The researchers are usually highly experienced and knowledgeable regardingthe system, [48]. This expertise in their field can cause them to forget whata layman might be able to do with the product.
For example, Sam knows how to set up a solar panel and battery chargingsystem, but Jimbo has no idea how to do it. The task might feel trivial toSam, but it wouldn’t be for most other users. This is a significant limitationwhen it comes to designing a product that targets many different kinds ofusers.
Our system, as a prototype, needs to work with a limited set of users inmind, at first; yet, eventually it has to have the ability to be extended to abroader user base. One of the hazards of using the autobiographical method
49

is that the researcher can end up designing a product that is best suited forhim and only him, [53].
4.2 Timeline
Fundamentally, sailboats have not changed in a very long time. Materialshave improved, no doubt. But even the most modern, blue-water sailboatstoday have basically the same components as the lateen boats from the timeof the Caesars.
If one of Professor Duncan’s time-travelling adventures1would bring for-ward in time a viking warrior-sailor (please do!), he’d have trouble with manyof our modern day contraptions, but skippering a modern sailboat wouldn’tbe a great difficulty. In fact, of all the vehicles people use today, the mostfamiliar one to a time traveller from the past would be a boat, especially asailboat. Operating a modern sailboat is almost exactly the same as it wasin the time of the vikings, or even earlier, in the time of the Roman Empire:the boat harnesses the wind for propulsion using sails controlled by ropesand the boat is steered with a rudder.
This is largely due to the fact that no matter how many times peopletried to improve sailboats, their original design was already quite efficient(see Chapter 3). Multi-hull designs and composite materials have certainlyaided in optimizing certain aspects, but it’s still sails and ropes all the way,thousands of years later.
Nevertheless, there is still considerable opportunity to apply technologyto aid in sensing the immediate environment and perhaps even understandingit well enough to try out various degrees of automation.
4.2.1 Stage 1. Sailboat Automation (2013 - 2014)
This is where my research story really began: in April 2013, I weighed anchorand set sail, northward bound, trying to make it to Alaska aboard a smallsailboat called Moonshadow.
For the first couple of months (section 4.3), I experimented with build-ing an autopilot and interfacing the anemometer, but this proved to be toomechanically challenging to build while underway. Instead, I developed a
1Like any respectable history scholar should, Professor Duncan could time travel bymaking use of naturally occurring worm holes, often used for getting into trouble [56].
50

rudimentary network of electronic devices offering limited sensing capabili-ties, like motion (GPS, gyro) and orientation (accelerometer, magnetometer).Commercially available autopilots allow for user input using a rudimentaryinterface with a few buttons. Some advanced units allow for course inputover a digital interface - e.g. Raymarine’s Seatalk. In 2013, however, therewere no commercial autopilot products that allowed low level access to con-trolling just the position of the rudder; that’s why I decided to build onefrom scratch using a linear actuator.
After I returned to Victoria in September, I started working on a simula-tor for the development of the autopilot. I completed the job in December.It took a while, but the process was rewarding and when the autopilot be-came functional, it lived up to my design expectations. When the weathergot better in March 2014, I started testing the autopilot in the open ocean.
Around the same time, I started working on debris detection, a vitalcomponent of the automation problem [39]. The other sensing capabilities,I experimented with also saw significant progress. Without a visual compo-nent to sense unpredictable obstacles on the water, however, the idea of fullautomation was untenable. It would be impractical to develop a fully auto-mated device without a visual analysis component. Full automation meansfar more than following a given course; any functional autopilot can do that.I wanted a device that was able to steer clear of unknown obstacles; thiswould require a sophisticated visual information processor.
At first, the offline prediction proved promising, but it never materializedinto a real-time solution.
This roadblock, around September 2014 became the first real crisis of theproject.
After going back to the drawing board, I realized that I couldn’t makethe boat sail itself. Further, from an ethical perspective, I shouldn’t evenattempt it because I couldn’t guarantee that my device would safely controlthe boat or prevent harm to others.
I could, however, make it easier for sailors to sail.I took several months to consider what I had learned and forge a vision
of what the realistic situation was, good and bad.I pondered the nature of the difficulties sailors encounter and realized that
there are simply too many disconnected sources of information. Sailors needaccess to readings from the anemometer, impeller log, GPS chart-plotter,and depth sounder, just to name a few of the instruments (see Section 5.2.1).In addition to reading these instruments, sailors also need to check the status
51
of the sails, observe and read the currents on the water, be aware of wildlifeand debris – all while planning ahead for the next course of action.
4.2.2 Stage 2. Data Sources (2014 - 2015)
Most of today’s sailors have become experienced in sailing using instrumentssuch as GPS chart plotters, depth-sounders, and anemometers. Without thistechnology, our Viking mates would do a much better job sailing our modernboat using ancient methods that call for a different kind of environmentalawareness. They would rely heavily on reading the water and the wind,memorizing local landscapes, and maybe other techniques lost in the haze ofhistory.
Recognizing the importance of being aware of the immediate environmentstarted to point towards a new potential approach.
At this point in my research (early 2015), I realized that the integration ofdata from so many disparate sources of information about the environmentplaced a heavy burden on sailors.
The notion of developing a single, integrated representation of this dis-parate data became the focus of the second phase of my research (section4.4), after I realized that full automation would be fruitless.
The visual paradigm shared by an overwhelming majority of the marineinstruments available today is reminiscent of 1990s style displays, with theirstrengths and follies.
There is a reasonable explanation for the stagnation of this technology:the marine environment is harsh on everything, but especially on electronicdevices. As such, building marine instruments takes a lot of developmenteffort and usually implies testing against extremely demanding standardssimilar to those often seen in military applications specifications. Only large,well-funded companies can afford to bring products like these to market; thishappens at a much slower pace than other types of electronic devices.
This turned out to be the first big crossroad where my approach veeredaway from the status quo. Instead of having several instruments, each withsensors and adjacent ruggedized displays, I would use the instruments’ sens-ing capabilities, but discard their displays. Instead, I would use off-the-shelfdisplay devices like tablets and smartphones connected to the boat’s networkto display a composite scene. I wanted to display all the data at one time ina way that was highly intuitive to interpret.
52

One obvious weakness is that non-rugged devices wouldn’t last very longin a marine environment. A ruggedized smartphone, however, is considerablycheaper than rugged instrument displays. It also requires only one screen todisplay data from any number of instruments.
This decentralized, non-monolithic hardware approach also meant havingaccess to all of the data on one display. Another major advantage is thatby making the data transfer wireless and incorporating redundant processingunits, a potential failure of any of the system components would be elegant(i.e. failing one a time), rather than catastrophic (i.e. failing all at once).
From a visual perspective, I was still at the beginning of my research. Iexperimented with numeric and 2D data approaches to displaying the data,but only achieved a virtual copy of the actual instrument displays. Thismeant that instead of physically having to switch between media for data,now we had to use the interface to virtually cycle through each data source.
Since the tablets I used were quite powerful, I realized I could adopt aVirtual Reality paradigm to render the data in a 3D virtual environment.By September 2015, I started experimenting with a few VR options suitablefor tablet visualization.
4.2.3 Stage 3. 3D Content (2015)
Using virtual reality content meant that I could integrate all of the data intoone 3D view. This proved to be another major crossroad in my project and Istarted focusing on rendering 3D content instead of just displaying the data.
My VR scene, at this point, featured an abundance of data, using colour-coded content in the form of animations. I experimented with particle cloudsand vector representations. As one might expect, the scene prototype wascluttered with data; making sense of the various environmental componentswas difficult. In fact, during an informal conversation over a pint with anexperienced sailor, my drinking buddy argued that it’s simply easier to readthe boat displays instead of the busy VR scene.
4.2.4 Stage 4. Augmented Reality (2015 - 2018)
By early October 2015, I had collected enough unfavourable opinions on theinterface appearance and functionality to feel the pressure to choose a dif-ferent direction. As I explored different ideas and options, I learned that if I
53

integrated either the cameras of the handheld devices or a bow-mounted cam-era, then I could make the jump to a genuine Augmented Reality paradigm.By using Augmented Reality, I would greatly enhance the sailors’ environ-mental awareness because the virtual content would be registered in realspace by synchronizing it with the video-feed from the camera which wouldprovide the background.
Here I hit another fork in the road: I had to choose the focal point ofmy AR scene. If I use the camera feed from the tablet, then the virtualcontent would be rendered according to the perspective of the tablet. If, onthe other hand, I used a video feed from a bow mounted camera, the contentwould be conceptually related to the boat’s perspective, in particular, to theperspective from the bow of the sailboat.
There are advantages and disadvantages to both approaches, but ulti-mately I looked at sensor data accuracy. An average tablet weighs 1lb and atypical sailboat weighs 20,000lb. The accuracy of the motion and orientation(e.g. accelerometer, gyro and magnetometer) sensors used on both the tabletand the boat are comparable; the mass is of the device the sensor is strappedto is important.
The sensor readings regarding the boat’s orientation were considerablymore reliable. This translated into much better synchronization betweenthe real and virtual content of the visualization, so I chose the boat-centredapproach featuring a bow-mounted camera. In late 2015 I published a journalpaper at the Cyberworlds conference that provided several details about thestate of my research at that point.
By mid 2016, having completed most of the important mechanical, elec-tronic, networking, and processing aspects, I could now turn my attention tooptimizing the virtual scene.
Realizing that I was heading towards the conceptual aspects of organizingthe content, I started an inquiry into the various theoretical frameworks Icould use to structure the underlying essence of the visual content, such asontology and mereotopology.
It was obvious that I needed a system to represent the nature of the con-tent, but the geometric-focused approach did not yield any promising results,perhaps with the exception of ontology, which produced an experimental hi-erarchical description of the content. I realized that the discussion about thecontent is not only about the visual appearance itself, but also about themeaning of the parts of the visual scene.
I thought I hit a dead end because the AR content would only be a direct
54

visual representation of the data. I employed a few techniques that improvedthe visual feel of the AR scene, in particular the particle animations, but Ialso knew something major was missing.
4.2.5 Stage 5. Conceptually-Modelled Content (2018- 2020)
Neither the geometric-focused, nor the mereology approaches provided theunderlying foundation I was looking for, so I realized that I needed to changethe framework of my investigation to address aspects like perception andabstraction to examine the meaning of the scene content. This, ultimately,determines the structure and appearance of the scene entities. By October2018, I realized that it was time to reach out to experts in the field of phi-losophy of mind and philosophy of science; this proved to be a fertile andauspicious endeavour.
From a series of papers from the field of philosophy of science, I noticeda common pattern regarding the usefulness of accuracy versus abstraction ininformation modelling. I realized that improving the accuracy of the modeldid not make it easier to understand. At the other extreme, a model thatis too abstract is also undesirable. So, scientific models have to be accurateenough to deliver their information content, but abstract enough that theinformation does not become overwhelming.
This one idea triggered a dramatic paradigm shift in my understanding ofthe value of the content in the context of my research. It also inspired me tonot be bound by the rigours of a direct visual representation, but rather tostay true to the purpose of a visual interface which would provide useful in-formation. That meant that as long as I aimed at increasing awareness aboutthe environment anything goes from a visual and conceptual perspective.
Investigating the visual content of the scene suddenly became a problemof modelling the conceptual meaning rather than the graphical appearance ofthe virtual content. By March 2019, I looked closely at how to gather cluesregarding the meaning of both the sensory information collected as well asthe sailors’ needs and limitations in assimilating this information.
I used the Data-Information-Knowledge-Wisdom hierarchy tool (see 3.3)because it allowed me to model the sailing process in terms of levels of ab-straction of information relative to specific tasks. According to this hierarchy,the main difference between data and information is that data is objective
55

and it serves only to quantify something. Information, on the other hand,incorporates not only the underlying data, but also a qualitative descriptionof the observed entity and its context (meaning, use, relationships, etc.).
After a long process of conceptual analysis and synthesis, I managed toidentify a series of insights, design and conceptual principles, and ultimatelyfeatures which served as the basis of the development of new kinds of visualcontent.
Among the concepts I found to be most valuable were those of pseudo-natural appearance, distorted content, and conceptually metamorphic con-tent.
Pseudo-natural appearance applies to content that looks and acts like itsreal-life counterpart regarding most of the observable characteristics. Thereis, however, one very obvious and easily recognizable difference that givesusers a clear idea that the content is virtual, not real. Using pseudo-naturalcontent conveys visual information that will be displayed in the interface asclose as possible to real information, despite it coming from a source thatnormally doesn’t have a visual representation.
A way to achieve pseudo-natural appearance is by employing distortedcontent. This kind of content is conceptually modelled to change the under-lying meaning of the content which, in turn, changes the appearance of thecontent. I have identified several ways to conceptually distort content.
For example, I could combine the idea of a flat plane of movement (alongthe surface of the water that spans from the boat to the horizon) with theidea of a gravity well. The visual and conceptual content of a gravity wellmakes the viewer assume unseen forces, such as the force of gravity.
When we combine the fact that the surface of the water is planar withthe perception of the gravity well pulling one towards its centre, then wecan visually distort the planar image to make users feel as though they aredrawn towards the centre. This means I can use this visually homogeneousgraphical representation as an example of a conceptually composite entitywhich can illustrate in a visceral manner the direction in which the boat ismoving.
By comparison, an abstract representation of the boat’s motion could besomething like a 3D vector arrow, which would require cognitive processingto understand the direction of motion, as opposed to simply feeling beingdrawn along the direction of motion through a cunningly warped spatialrepresentation of the background image.
Normally, visualization research project have a user-study of the content
56

that is being proposed; I certainly agree that it would be highly beneficialto have such an empiric evaluation. Given the broad scope of the problem Iwas addressing and the equally vast solution, including significant hardware,software, and conceptual components, I had to consider evaluating the con-tent from an autobiographical perspective, by carefully tracking observations,while moving through several design iterations.
4.3 Phase 1. Sailboat Automation
The idea of making sailing more accessible is clear and easy enough to un-derstand, but to actually turn this idea into a research project, I collectedfacts and observations along with surveys of existing technology and its lim-itations. My first insights emerged by considering a set of design principles.This led me to a new problem statement.
Using these initial insights and design principles, the first problem state-ment started to become a bit clearer to me and I started working on the firstdesign challenge.
4.3.1 Problem 1.0: Sailing is Difficult
Initially, we came up with the following problem statement:
� Who: Sailors, young and old, experienced and inexperienced
� What: Sailing to be made trivial
� Why: Sailing is too difficult - it requires lots of practice to master andsignificant physical and mental stamina
� Where: Inland, coastal and offshore waters
� When: At any time, but especially in rough weather conditions
So, we asked ourselves:
Design Challenge 1.0: How might we design some kind oftechnology that will make the sailing process trivial?
57
4.3.2 Solution 1.0: Autonomous Sailboat System
Jumping to the first daring idea was easy: design an autonomous systemthat sails the boat. This meant I could transfer the knowledge needed forsailing to an autopilot system, instead of training every single skipper. Thesails would be automatically controlled with electric or hydraulic systems.
Pros:
� Easy to use by anybody
� Requires very minimal inputfrom the skipper
� Requires no physical interac-tion with the sails/anchor
� The data collected from thesensors and used by the systemcan be visualized, as an addedbonus
Cons:
� Prohibitively expensive hard-ware (electrical/hydraulic com-ponents)
� The system complexity wouldbe so high it would require fi-nancial means beyond academicfunding limits
� Existing boats cannot be easilyretrofitted
It became obvious soon that I simply did not have the resources forsuch an endeavour and that even if it worked, it would not be feasible forwidespread use due to the high hardware costs. Another issue is that it wouldremove the hands-on aspect of sailing to such an extent that it would takethe fun out of sailing altogether.
4.4 Phase 2. Semi-Autonomous Sailboat Sys-
tem
As the need for another iteration of the design process became obvious, Itweaked and re-examined the insights and design principles to find clues onhow how pose a problem statement with more realistic potential solutions.
4.4.1 Problem 2.0: Sailing is Complex
� Who: Sailors and crew
� What: Sailing to be simpler
58
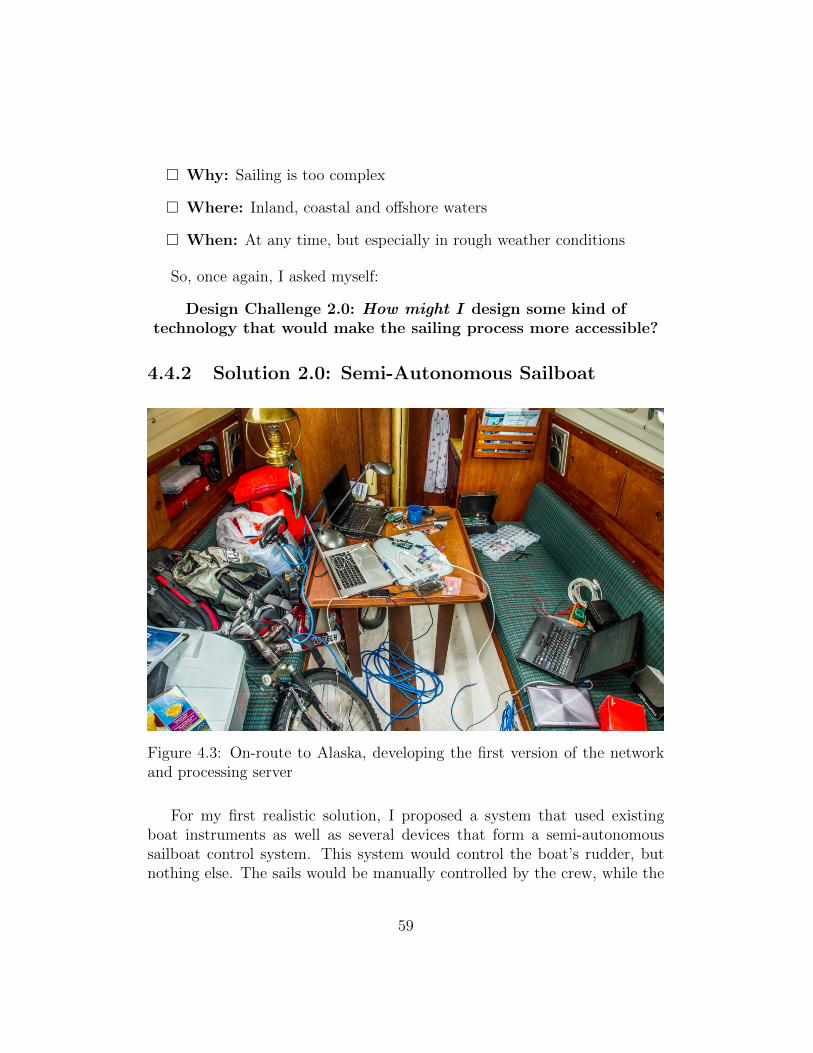
� Why: Sailing is too complex
� Where: Inland, coastal and offshore waters
� When: At any time, but especially in rough weather conditions
So, once again, I asked myself:
Design Challenge 2.0: How might I design some kind oftechnology that would make the sailing process more accessible?
4.4.2 Solution 2.0: Semi-Autonomous Sailboat
Figure 4.3: On-route to Alaska, developing the first version of the networkand processing server
For my first realistic solution, I proposed a system that used existingboat instruments as well as several devices that form a semi-autonomoussailboat control system. This system would control the boat’s rudder, butnothing else. The sails would be manually controlled by the crew, while the
59

skipper performed navigation tasks using contemporary methods (i.e. usinga chart-plotter, depth sounder, etc.).
I realized I needed to design and build several system components tocontrol the steering, detect debris, and manage the autopilot. An augmentedreality interface would also provide the skipper data visualization.
Pros:
� Simplifies the sailing process
� Only requires temporary over-sight from the skipper, as op-posed to permanent attendance
� Existing boats can beretrofitted without great effort
� The data collected from thesensors and used by the systemcan be visualized
Cons:
� Requires installing a ruddercontrol mechanism, a gimbaledcamera on the bow, and a pro-cessing server which interfacesthe boat’s instruments
� The system complexity is signif-icant
� Requires reliable debris detec-tion (using computer visionmethods), for safe operation
4.4.3 Prototype 2.0: Sailboat Control System
In accordance with the Solution 2.0 concept, I developed Prototype 2.0 con-sisting of a mechanical/electronic/software system (Figure 4.3) that takes indata from sensors, processes it, controls the rudder, performs debris detectionand ultimately displays relevant information on a screen using an immersiveAR interface.
Autopilot Simulator
One of the first intermediary steps to achieving my ultimate goal was tobuild a physical simulator which enabled me to develop and test the autopi-lot hardware and algorithms. This step allowed me to test the electroniccomponents, such as the magnetometer, gyro, and micro-controller withoutleaving the lab.
I considered several control systems and ultimately chose a PID controller.I could not use GPS data in the lab (GPS does not work indoors), so I
60
determined the heading and motion by the magnetometer and gyro, whilethe heal of the boat was derived from the accelerometer.
As soon as the electronic components were sufficiently reliable, I disman-tled the simulator and reused the parts for the actual mechanical autopilot,in particular the linear actuator, which became the main mechanical actuatorof the autopilot.
Rudder Control Unit (Autopilot)
The rudder control unit is a hardware component built around a linear ac-tuator that performs the task of controlling the position of the rudder, andthus the direction of the boat.
This unit is controlled by the processing unit to determine the currentrudder position and to alter the course of the boat. Seen from the perspectiveof a black-box paradigm, the inputs of the system are either the magneticheading, GPS heading, or wind direction; the output is a transition to aspecified position of the linear actuator.
Due to the mechanical constraints of the linear actuator (DC motor pow-ering a worm gear), the electric controller reads the current position of therod and powers the DC motor to reach the set position. I could not reliablyachieve a desired rod position by using a constant motor speed, so I had todevelop a method that slows down the motor proportionally to the distanceof the target position.
As soon as I could accurately control the position of the rod, I devised acunning PID strategy based on the GPS heading.
After many attempts at tweaking the PID system, I found the followingvalue to best suit our needs:
� Kp = 20
� Ki = 2
� Kd = 1.2
The performance of the complete autopilot was outstanding, outperform-ing any commercial competitor, especially in rough weather2.
2There was one interesting behaviour we had to learn to live with; on boot-up, theautopilot had a devious tendency to sharply turn toward the nearest reef or boat, terrifyingthe crew, missing the looming threat by inches, before running reliably, elegantly and
61

(a) (b)
Figure 4.4: Autopilot simulator: (a) side view, (b) top view
Figure 4.5: Autopilot in action
Figure 4.6: PID Feeback loop diagram
62

Processing Unit
The processing unit is a boat server that provides a number of built-in sen-sors (accelerometer, gyro, etc.), in addition to interfacing the boat’s existinginstruments. This unit is used mainly to perform the necessary computations
Figure 4.7: The Dangler
for the PID control of the rudder. It also serves as a computing platform forthe debris detection unit. One final feature is the implementation of a WiFinetwork on which sensor and instrument data is broadcast.
Debris Detection Unit
This debris detection unit consist of two components: an early warning col-lision unit (aka The Dangler) on the bow and a computer vision program
smoothly for the rest of the trip. It took us about a year of putting up with this funkybehaviour before discovering that there was a bug in the programming, where the integralsum was only properly initialized upon a change of course, and therefore starting at randomvalues at boot-up. After I fixed the bug, the autopilot operation became less exciting, butcertainly more relaxing and trustworthy, especially for the faint of heart
63

running on the Processing Unit. The main goal of this unit is to determinewhether there are any hazardous debris in front of the boat floating on thesurface of the water.
Together with Tanmana Sadhu and under the supervision of A. Branzan-Albu, I launched my research on the debris detector in 2015. The off-lineresults were quite promising. I published the results of this research in 2016at the Conference on Computer and Robot Vision (CRV). [39] Unfortunately,I shelved the project because it never achieved satisfactory results in real-world situations.
As for the image acquisition system, aka the dangler, while it did work wellin normal conditions, in heavy seas it dangled too much. In later iterations,I attempted to reduce the dangling by enlarging the length and width ofthe dangler arm, but to no avail. I also experimented with a stabilizer, butthat, in turn, introduced too much video noise. Nothing seemed to stop thedangling, so we ultimately abandoned the dangler altogether and decided touse a fixed camera for the next iteration.
I presented the initial results of the debris detection project at the Cy-berworlds 2015 Conference and published them as a journal paper in 2016.[38]
Visualization Unit
The visualization unit is the graphics component of the system. Built uponan augmented reality paradigm, it aids the skipper in visualizing informationcollected from the sensors.
At this early stage of the project, the aim of the visualization was largelyto cover the most important aspects (i.e. wind, current and movement overwater) using particle systems as well as some other panels. For an in-depthanalysis of the visualization component as of 2015, please see the paper “Aug-mented Reality Visualization for Sailboats” [38](Figure 4.8).
This was the first iteration of the visualization system our current researchis focusing on. While it looked similar, there were key differences, mostly dueto the fact that at the time we simply wanted to add as much informationas possible, without much focus on what that information looks like or howuseful it is.
64
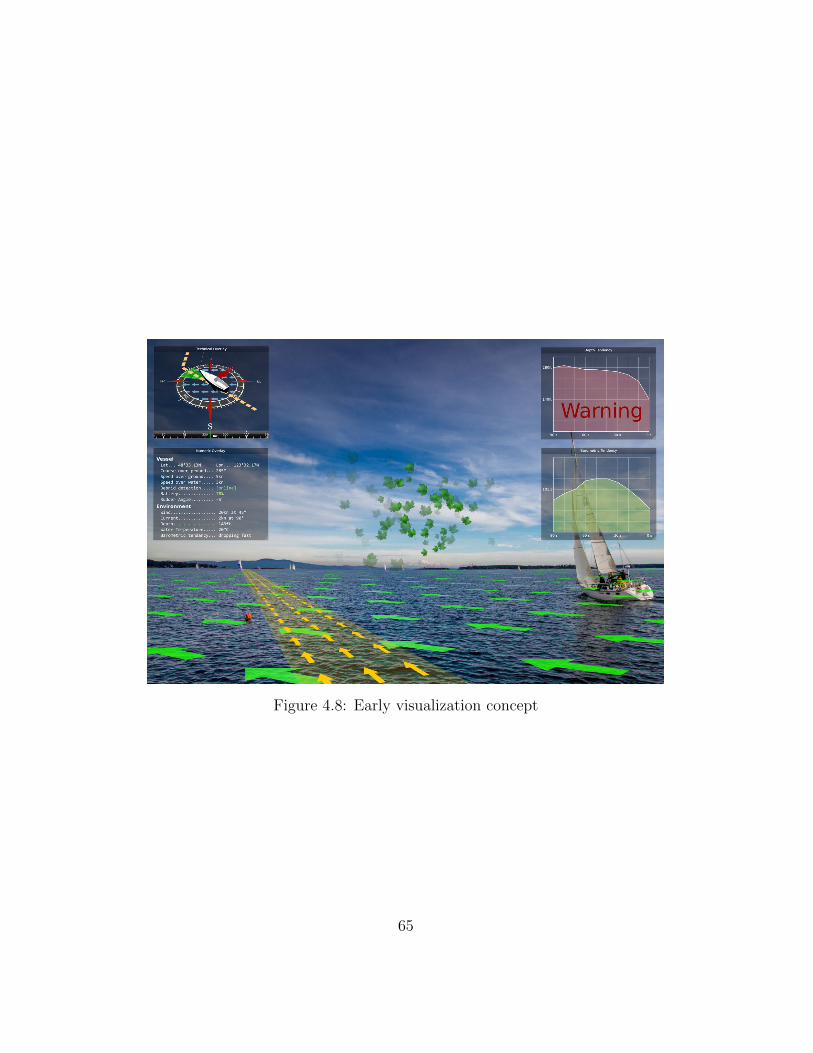
Figure 4.8: Early visualization concept
65

4.4.4 Solution 2.0 Observations
After publishing the two papers on the research project and after having thesystem partially operational for several months at sea, I gathered invaluableobservations about the various system components.
� PID System Observations
– Hard to get the right initial PID values
– Reliable and good performance after 1-2 minutes of operation
– Comparable performance with existing autopilot products (e.g.Raymarine ST6000)
– Required tweaking for different sea conditions
� Rudder Control Observations
– The linear actuator out-performed autopilot products, especiallyin rough sea conditions
– Redundant and cumbersome if the boat is equipped with an ex-isting autopilot
– Ended up being used mainly as a way to determine the rudderposition for the visualizer
– Flexible solution and very cheap to implement if there is no off-the-shelf autopilot present
� Debris Detection Unit Observations
– Only worked offline (i.e. on recorded data, not in real-time)
– The results were satisfying and promising, but not stellar and notgood enough to ensure safe navigation
– Proved difficult to use the same algorithms in real-time
� Processing Unit Observations
– The Arduino Mega ADK implementation though temporary, provedhighly reliable and powerful enough for the test at hand
– At this stage, the deployed unit interfaced instruments and sen-sors, and logged and relayed data
66

– For debris detection, it would have been necessary to use muchmore powerful hardware (at least RaspberryPI)
� Image Capture System Observations
– The gimbaled camera system dangled too much, especially inrough seas
– The stabilized version introduced too much noise into the videofeed
� Visualization Interface Observations (recorded from an autobiographi-cal perspective)
– Introduced many new visual elements, especially the immersivecomponents using particle animations
– The interface proved to be too busy and confusing at times
– Too colourful and distracting at times
– Colour coding for various elements should be replaced with shapecoding if possible
– Implemented in Qt + C++ and could not easily be ported tomobile devices
These observations were invaluable in continuing to the last phase of ourresearch project, the marine visualization system.
After compiling the set of observations regarding the solution proposedin Phase 2, we realized that several components of the Sailboat ControlSystem using the existing technology may be a dead end. In particular,the mixed results of the Debris Detector meant that the boat could not betrusted to stay on autopilot, requiring the crew to monitor the seas aheadof the boat at all times. The mechanical rudder control system also provedto become redundant if an existing commercial autopilot was installed. Theimage capture system was unsatisfactory and needed a major revision. Intime, it became obvious that the visualization unit has several advantagesthat could be explored and expanded.
67

4.5 Phase 3. Marine Visualization System
The marine visualization system is the target of the current phase of devel-opment for our research. In this phase we focused on designing a system toaid in providing sailors with easy access to information regarding the boatand its immediate environment.
In this third and last major iteration of the design process, we revisitedall the observations learned from the previous experiments and tried to figureout which aspects could be solved with existing technology (e.g. autopilot,commercial stabilized gimbaled camera) and which aspects were unsolvablewith current technology and methods (e.g. debris detection).
4.5.1 Problem 3.0: Scattered Data Sources in Sailing
Sailors depend on a wide range of sources of data and most of these arescattered throughout the boat.
As an example, consider navigating a stretch of water that has tidalcurrents. First we need to find the tide tables and a clock and look up theparticular tides levels. Then we get a chart book, where – based on the tidelevels – we have an idea about the tidal current direction. Finally, we getthe paper charts (or chartplotter) and plot a course that takes advantage ofthe best currents.
Other instruments include depth sounders, radar, and AIS, all of whichare important, individual sources that demand the skipper’s attention.
� Who: The helmsman
� What: Access to data from one centralized source
� Why: The data sources are scattered
So, once again, I asked myself:
Design Challenge 3.0: How might I design a system that willprovide easy access to centralized data?
4.5.2 Solution 3.0: A Centralized Interface
After analyzing the results of the previous research projects, I realized thatby discarding the unsuccessful/obsolete units (e.g. debris detection, autopilot
68

etc.) I could still reuse most of the system components. So, I decided that Icould contribute most by providing a centralized data system. This systemwould read the existing boat instruments as well as add several sensors,grouped as a telemetry unit, to provide users with access to data in oneunified interface. The system would provide the helmsman significantly easieraccess to data.
It is true that several instruments can be centralized using modern tech-nologies, such as NMEA2000 and displayed using chart-plotter units or chart-plotter software such as OpenCPN. These tools, however, display the infor-mation in very rudimentary ways, usually either numerically or using variouskinds of simple 2D graphical representations. Several other data sources areusually unavailable on most sailboats (accelerometer, gyro, magnetometer,bow-mounted camera etc.) and our system incorporates all of these andmore.
After examining our experience with Prototype 2.0, we soon realized howmuch of the previous technology we could use and that most of our subse-quent focus should go into the visualization component.
This was the point when we decided it was time to go back to the draw-ing board and use all of the tools available in order to design an intuitive,innovative and, most importantly, effective visualization interface.
4.5.3 Problem 3.1 - Sailing Requires Access to Infor-mation
� Who: The captain
� What: Access to immediately useful information
� Why: The data sources are scattered and processing data into infor-mation is a significant mental effort
In the context of pure sailing, sailors on small sailboats learn to gaugethings like current and wind speed through all kinds of intuitive visual andbodily cues (e.g. the feel of the swaying of the boat, visual cues from theappearance or movement of the waves, etc.)
There are, however all kinds of information that may be relevant to thesailor which are not intuitively available in this way (e.g. obstructions underthe water, potential shifts in atmospheric conditions, subtle changes in winddirection, etc.)
69

Sailors working on larger sailing vessels are less able to navigate by feel inthe same way, but compensate by using various kinds of instruments whichcan display things like wind speed, air pressure, current direction, etc.
The problem is that each of these readouts in isolation can be misleading.Looking at air pressure by itself, or current direction by itself, or wind speedby itself, ignores the ways in which these features interact in unforeseen ways.In order to sail effectively, sailors must be able to calculate the complexcausal interplay between these features and how each feeds into the others.Having the information displayed on readouts in this way can be unintuitive,difficult to keep track of, and cognitively taxing on sailors who must attemptto integrate them.
Design Challenge 3.1: How might we design a system that willprovide access to immediately useful information?
4.5.4 Solution 3.1 - AR Interface
We propose creating a system that integrates all this information for sailorsand displays the information all at once.
This, however does not solve the problem of facing a significant processingeffort. Now, sailors are inundated with all kinds of data, but are not providedwith an intuitive sense of how to pull out relevant information from the dataneeded for effective sailboat navigation. There is so much information atonce, that it becomes noise. We need some way to present this informationthat is intuitive and easy to digest, allowing for a response requiring minimaladditional processing of the data.
One effective way to do this is to simplify the information provided bythe visualizer. I can provide overly simplistic, abstracted, or idealized, rep-resentations to sailors to avoid information overload. This addresses issuesrelated to cognitive processing, but it introduces a new set of problems: ifI simplify or idealize the information I present to sailors, then the sailorsare no longer acting on accurate information. Instead of correct informationabout their environment, they now have overly simplified accounts. Easierto understand, but far more dangerous, if sailors confuse the idealizing andsimplifying assumptions for real facts about the world.
Bad choices can suddenly lead to disaster. The visualization cannot com-promise with respect to accuracy, but in order to present the information in amore intuitive fashion, certain distortions or idealizations may be employed.
70

It appears I must make a trade-off between models being understandable andbeing accurate.
Therefore, in order to balance all of these concerns, I need a vehicle thatconveys many different kinds of information to sailors in a way that is moreintuitive than just a collection of different numerical readouts, but whichalso provides a greater variety of information than can be gained from puresailing.
Lastly, I also need to ensure that the more accurate (but less intuitive)numerical information is still available to sailors in case the more intuitiverepresentation is insufficient for their needs.
4.5.5 Prototype 3.1 - AR Visualization System
Once I had a vision of the big picture in my mind, I started adding detailto the picture. It was a long path, but I finally arrived at the heart of myresearch quest. Prototype 3.1 is the focus of this dissertation.
Our proposed marine visualization system is a composite structure com-prised of various elements:
� Chapter 5. A hardware system that aggregates several mechanical,chemical, electrical, and electronic devices.
� Chapter 6. A software system that provides methods for interfacingsensors, processing data, transferring data across devices, and ulti-mately implementing an augmented reality interface.
� Chapter 7. A design-mapping system that manages the collection ofinsights, the emergence of conceptual and design principles, and ulti-mately the specification of features to be implemented.
4.6 Conclusion
I could not have made it here without testing the feasibility of certain ideasand ultimately keeping only those that worked in the long run. By testing,I don’t mean user-testing as commonly found in HCI-related research, butrather testing the practical feasibility of various entities from an autobio-graphical perspective and recording the observations that emerged from theexperiments.
71

I inherited the general idea of making the process of sailing more accessiblefrom Phase 1, though the problem/solution of this phase proved not to befeasible due to obvious financial constraints.
I inherited the idea of using electro-mechanical automation wherever pos-sible from Phase 2, but most importantly devising new technological contrap-tions to better support the overwhelming need to interpret the environment,in the form of providing visual aids.
Phase 3 represented a departure from the physical aspects of sailing anda focus towards providing more access to data regarding the boat and itsimmediate environment.
Prototype 3.1 inherits the need for data acquisition and visualizationfrom Solution 3.0, and supplies added consideration toward a classificationbetween data and information with the latter being immediately useful, andnot requiring numeric processing as the former does.
72

Chapter 5
System
“We must free ourselves of thehope that the sea will ever rest.We must learn to sail in highwinds”
Aristotle Onassis
In the current chapter I will create a detailed recount of most of thehardware and software elements that make up the system. The followingchapter, 6, will explore the visual elements that make up the AR scene.
The system is comprised of a vast scope of elements, all working together.These elements are grouped into modules, based on the purpose they serve.
The sensing module (see 5.2) features the system’s sensory capabilities,by interfacing various instruments and sensors. The module is divided intofour units: the telemetry unit (see 5.2.1), the imaging unit (see 5.2.2), theinternal unit (see 5.2.4), and the instruments unit (see 5.2.3).
The networking module (see 5.3) features the system’s communicationcapabilities; it implements various networking solutions.
The processing module (see 5.4) features the system’s computational ca-pabilities; it processes acquired data and generating desired information.
Finally, the visualization module (see 5.5) features a brief introductioninto the visualization capabilities of the system.
73

5.1 Overview
My approach to the problem of providing sailors with access to marine relatedinformation for vehicular awareness purposes is to implement a system thatrelies on sensory, processing, and visualization capabilities. The system iscomprised of four modules:
1. Sensing Module;
2. Networking Module;
3. Processing Module;
4. Visualization Module.
During the course of this chapter we will follow the information trail,beginning with raw data from several sensors and going all the way to filteredand processed information ready to be delivered to users in the form of avisualizer application (Figure 5.1.)
The information path starts with the sensing module, where relevant datais collected from several sources in the vessel. Then, using the networkingmodule, the raw data is transported to the processing module, where it islogged, filtered, and processed. One or more visualizers connect to the server(also using the networking module) and establish a live stream of informationthat is displayed in real-time using the visualization module.
5.2 Sensing Module
The sensing module supplies the sensory capabilities of the system, e.g.telemetry readings, on-board instruments integration, cameras, battery read-ings, etc. There are four major categories of sensory sources, grouped asunits, based on their hardware and integration into the vessel systems.
1. Telemetry Unit;
2. Imaging Unit;
3. Internal Unit;
4. Instruments Unit.
74

Figure 5.1: System Overview
75

5.2.1 Telemetry Unit
Figure 5.2: Telemetry unit components
The telemetry unit is a hardware assembly featuring a micro-controllerand several sensors, all bundled together inside a sealed box, attached to theoutside of the hull. It is placed at the intersection of the ship’s central axesand it provides information about the boat’s pose (position+orientation)and movement relative to the ground and the boat itself; it also providesenvironmental data such as atmospheric pressure and air temperature. Theunit reads data from the sensors, maintains a permanent connection to theserver, and constantly sends current data over the network.
76

GPS
The GPS sensor is a hardware component that provides information aboutthe position and movement relative to the ground. The position is providedin degrees decimal minutes format (e.g. Lat. 64◦ 53.754’ S, Lon. 69◦ 20.050’W). The movement is provided using speed over ground (SOG) and courseover ground (COG) data.
Absolute Orientation Sensor
Absolute orientation readings are provided by a Bosch BNO55 sensor thatsupplies not only orientation information like roll, pitch, and yaw, but alsoin-depth readings like 3D magnetic heading or accelerometer/gyro data.
Barometer
The barometer provides atmospheric pressure data. This data is subse-quently processed in order to provide information regarding the tendencyof the atmospheric pressure readings.
Thermometer (Air)
The thermometer found in the telemetry unit provides data regarding theair temperature outside of the boat. The data is collected, logged, and usedtogether with the barometric readings for micro-weather forecasts.
5.2.2 Imaging Unit
The imaging unit is an electronic component comprised of a micro-controller(Raspberry Pi 3) and two cameras, a main camera, and a night-vision camera.This unit captures a video feed from the cameras and streams it to the server.The micro-controller maintains a permanent connection to the server over thenetwork and streams video content in real-time.
The main camera captures video content in the visible spectrum of light.The actual hardware is a Raspberry Pi Camera Module V2 capable of record-ing 1080p30 and it is connected to the CSI port on the Raspberry Pi.
The night-vision camera captures video content when there is little or novisible ambient light. The hardware used is a Raspberry Pi NoIR CameraV2.
77

According to the website raspberrypi.org: “The Pi NoIR gives everythingthe regular Camera Module offers, with one difference: it does not employan infrared filter. (NoIR = No Infrared.) This means that pictures you takeby daylight will look decidedly curious, but it gives you the ability to see inthe dark with infrared lighting.”
For research purposes, the cameras have been used interchangeably on thesame micro-controller or using multiple micro-controllers. I do not plan topurchase an Arducam Multi Camera Adapter Module that will allow the useof two daytime cameras and two night-vision cameras with only one micro-controller. This would allow for both daytime and night-vision stereo-graphicvideo capture.
5.2.3 Instruments Unit
Figure 5.3: Instruments unit components
The instruments unit is an electronic component that allows the interfac-ing of various instruments and sensors already installed on the boat.
The unit can be seen as an interface between the NMEA2K/SeaTalk busconnecting the instruments and the boat server. For my purposes, I use aGarmin GNDTM 10 Black Box Bridge that allows a direct USB connection.
The difference between the hardware in the instruments unit and thehardware in the other units is that the instruments are off-the-shelf products
78

and are used on the boat independent of the ARVS System. In fact, thereare several gauges and displays mounted in the cockpit that display suchinformation such as wind speed/strength or speed over water, completelyseparate from the proposed marine visualization system.
Anemometer
An anemometer is an instrument used to determine the apparent wind di-rection and strength, relative to the motion and orientation of the boat. Tobetter understand and emphasize the relative nature of the reading, let’sconsider the following scenarios: if the vessel is travelling downwind at 5kn,in 10kn winds, then the apparent wind is 5kn; yet, if the vessel were to go inthe opposite direction, the apparent wind would be 15kn.
The anemometer sensor is wired into the GND 10 Black Box.
Impeller Log
An impeller log is an instrument used for determining the speed over water(SOW) - i.e. the speed of the vessel relative to the water; this is differentthan the SOG readings from the GPS unit, which reflects the speed relativeto the ground below. By measuring the SOG and the SOW, I can estimatethe speed and direction of the tidal currents the boat is travelling on. E.g. Ifthe vessel is travelling with a SOW of 2kn over a current in the same directionof 3kn, then the SOG will be 5kn.
The impeller log sensor is wired into the GND 10 Black Box.
Depth Sounder
A depth sounder is an instrument used to determine the water depth underthe boat. By computing the tendency of the water depth over time, theserver can provide an estimate about the relative danger of running aground.
The depth sounder transducer is wired into the GND 10 Black Box.
Thermometer (Water)
The depth sounder transducer also features a thermometer to measure thewater temperature.
79

5.2.4 Internal Unit
Figure 5.4: Internal unit components
The internal unit is a hardware assembly featuring a micro-controller andseveral sensors. It provides readings about various boat aspects (e.g. batterylevel, relative humidity, temperature, etc.) This unit is conceptually similarto the telemetry unit and it uses similar hardware, however it is targeted atinternal aspects of the boat. The unit reads data from the sensors, maintainsa permanent connection to the server, and constantly sends current data overthe network.
80
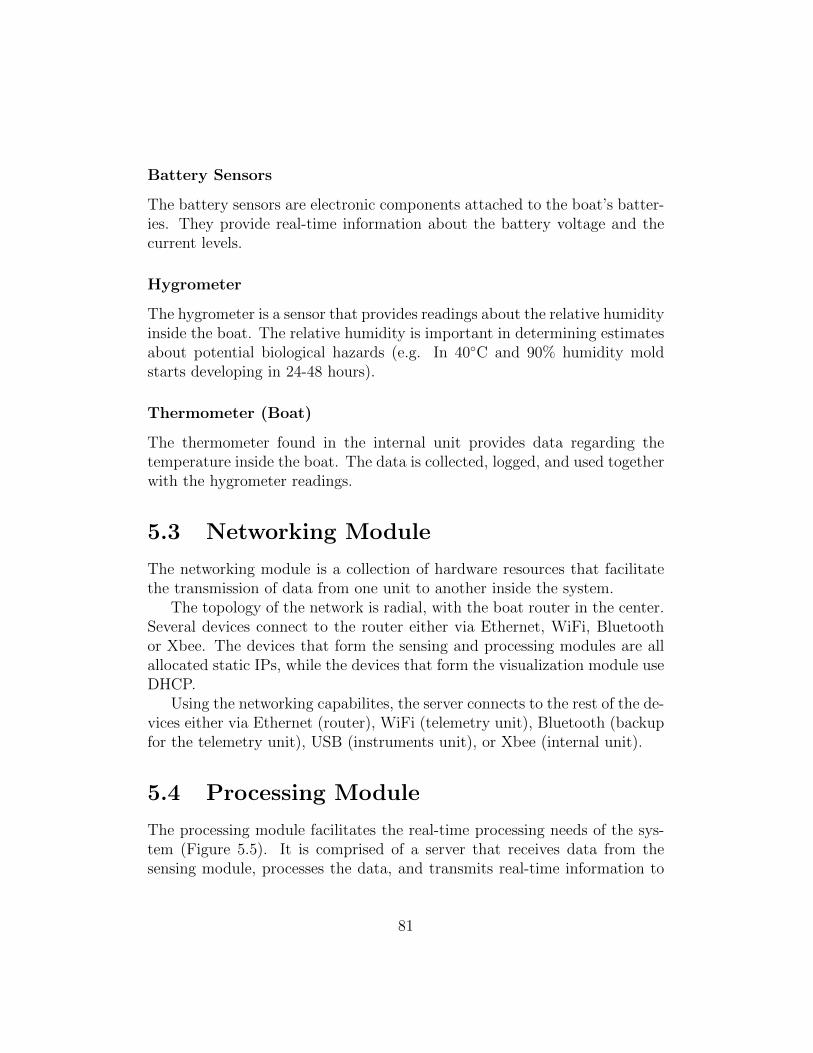
Battery Sensors
The battery sensors are electronic components attached to the boat’s batter-ies. They provide real-time information about the battery voltage and thecurrent levels.
Hygrometer
The hygrometer is a sensor that provides readings about the relative humidityinside the boat. The relative humidity is important in determining estimatesabout potential biological hazards (e.g. In 40◦C and 90% humidity moldstarts developing in 24-48 hours).
Thermometer (Boat)
The thermometer found in the internal unit provides data regarding thetemperature inside the boat. The data is collected, logged, and used togetherwith the hygrometer readings.
5.3 Networking Module
The networking module is a collection of hardware resources that facilitatethe transmission of data from one unit to another inside the system.
The topology of the network is radial, with the boat router in the center.Several devices connect to the router either via Ethernet, WiFi, Bluetoothor Xbee. The devices that form the sensing and processing modules are allallocated static IPs, while the devices that form the visualization module useDHCP.
Using the networking capabilites, the server connects to the rest of the de-vices either via Ethernet (router), WiFi (telemetry unit), Bluetooth (backupfor the telemetry unit), USB (instruments unit), or Xbee (internal unit).
5.4 Processing Module
The processing module facilitates the real-time processing needs of the sys-tem (Figure 5.5). It is comprised of a server that receives data from thesensing module, processes the data, and transmits real-time information to
81

Figure 5.5: Processing module components
the visualization module. It also supplies the adjacent functionalities of datalogging and network (http) server.
For the server we have used several mini-computers, including a Macmini, an Wintel W8, and a Raspberry Pi. The server uses Debian Linux asan operating system.
5.5 Visualization Module
In the current section I explore most of practical aspects regarding the visu-alization effort. This includes hardware components, software technologiesused, and conceptual considerations regarding the design of the visual inter-face.
The visualization module provides users with an augmented reality scenethat is populated with real-time information from the processing module.The scene can be rendered in a browser on various compatible devices.
5.5.1 Devices
The visual information is provided to users via a browser installed on anydevice capable of rendering the real-time augmented reality scene. For myresearch purposes, I successfully tested the system on several devices includ-ing the following: Apple MacBook Pro, ThinkPad T40, RaspberryPi Ver. 3,
82
ASUS Transformer Pad TF700, NVIDIA Shield Tablet, Sonim XP7, iPhone6s. I found that most of the devices could handle the core visualization fea-tures, but only the MacBook, Raspberry Pi, and the Shield Tablet could runthe more demanding particle cloud animations successfully.
5.5.2 Software
From a software perspective, my system can run on most of the currentoperating systems (i.e. Android, iOS, macOS, Linux, etc.). It requires aworking browser and I have used the Chrome/Chromium browsers. Thebrowser needs to be able to run HTML5, CSS, JavaScript, and WebGL. Thescene is implemented using the Three.js library and API.
5.5.3 Visual Interface
The visual interface is the graphical entity that provides access to the aug-mented reality scene. It renders the scene by populating a scene templatewith real-time information streaming from the processing unit. The scenetemplate is comprised of several different kinds of layers with a wide rangeof visual elements, which I will explore in Chapter 6.
5.6 Summary
This chapter provides a detailed account of the various elements that makeup the system.
I introduced and explored in detail the main modules of the system:sensing (see 5.2), networking (see 5.3), processing (see 5.4) and visualization(see 5.5).
The sensing module is the most vast and complex and it is made up offour units: the telemetry unit (see 5.2.1), the imaging unit (see 5.2.2), theinternal unit (see 5.2.4), and the instruments unit (see 5.2.3).
In the next chapter, 6, I will examine in-depth the different visualizationaspects of my research.
83

Chapter 6
Visualization
“A sailor is an artist whosemedium is the wind”
Webb Chiles
This chapter discusses issues that pertain to the visualization process ingeneral and the AR scene anatomy in particular.
Before going into the technical details, I introduce the way users interactwith the system.
On the technical side, I start by identifying the different screen areasused. Then, I examine the perspective from which I see the AR content.Afterwards, I discuss a few different types of content appearance I consideredusing. Last, I explore the individual scene elements and the way they arerepresented as part of the scene structure.
The visual content I am proposing is by no means the best option onecould come up with and, in fact, I have experimented with many differentconfigurations with varying success. It would take several axes of interestand investigation of the actual graphical representations to determine whatis most appropriate for a given set of user scenarios. My contribution isnot centred on tweaking the actual visual content, but rather on creatinga system by identifying and using known technologies and methods as wellas proposing new ones, like pseudo-natural appearance (6.4.5) and contentdistortion (section 6.4.6).
84

6.1 User Interaction
Before examining the technical aspects of the system, I should shed somelight on a few details about how users interact with the system.
6.1.1 Devices
The users are presented with a tablet (NVidia Shield Tablet) and a smart-phone (Sonim XP8). Both devices are connected over a WiFi connection tothe ship’s server. Both the tablet and the smartphone have Velcro patchesglued to their backs and they can be fixed to various surfaces in several placesthroughout the cockpit and inside the main cabin. The tablet is usually po-sitioned in front of the steering well. It can also be attached to the wall infront of the chart table or in front of the galley, when the user is inside thecabin.
The smartphone is mostly used when the sailor is performing sail adjust-ments, weighing anchor, or performing other tasks on deck. The phone issometimes held in hand and sometimes attached to the sailor’s arm, betweenthe wrist and the elbow using the Velcro material.
Both devices have the same AR scene rendered, but at different resolu-tions. The server provides a live feed of the video data captured by the bowcamera that is synchronized with an information package that includes winddirection, heeling angle, and speed over ground among others.
The video that the user sees is not streamed, but rendered on the de-vice, using web technologies including HTML5, JS, and WebGL, all inside abrowser. The interface does not require installing a special app; instead itrequires only a URL to load into a browser window.
6.1.2 User Input
To understand how the user interacts with the interface, I need to identifytwo different modes: interface configuration and real-time operation. Forresearch purposes, I allow users to switch between these two modes.
In the configuration mode, users can access a menu, where various aspectsof the interface can be configured.
In real-time operation mode, users do not directly control the interfaceusing the input capabilities of the tablet, but rather using the sensing capa-bilities that have been added to the boat. User access the boat’s mechanical
85

devices to control the operation of the boat, which ultimately determineswhat the interface will display.
For example, when sailors make a 90 degree turn from a beam-reach to awing-on-wing point of sail, the user interface will reflect the turn by changingall the displayed data to match the new situation.
Figure 6.1: AR Scene
6.2 Screen Areas
The screen can be organized between different working areas, depending onthe kind of content that will be displayed (Figures 6.1, 6.2).
� Main area (covering the whole screen with immersive content)
� Diorama (top left blending into the main area, bird’s eye view of boat)
� Panels
– Numeric panel (all incoming data)
– Graph tendency (depth, atmospheric pressure)
� Menu (normally collapsed, expands when needed)
86

Figure 6.2: Diagram of screen areas
87

6.2.1 Main Area
The main area covers the entire screen and it typically features content wherethe live video-feed from the camera (used as a background) is synchronizedwith the overlayed virtual content that is distributed all around the viewer,creating an immersive feel (see Section 6.3.1).
It is possible for the content of the main area to be switched to a non-default perspective for specialized purposes, such as visually investigatingthe vectors (e.g. wind, current) that act on the boat.
Figure 6.3: Scene rendered using only the main and diorama areas
Often, the main area looks like the screenshot featured in Figure 6.3.
6.2.2 Picture-in-picture Area
The picture-in-picture (PIP) area is smaller, overlayed on top of the mainarea, and it features customizable size/position/transparency (Figure 6.4).
This kind of area features a transparent background that allows it toblend in with the main area; as such, it does not have a visible border. Theperspective of the content of the PIP area is what I have called the Dioramaperspective (Section 6.3.2).
88

Figure 6.4: Standalone screenshot of the PIP area, with wind and motionvectors seen in blue and red
The content that is typically found in this area is of an abstract nature,including a grid synchronized with the ground, range rings, vectors represent-ing the wind, current and motion, and an animation of the roll/pitch/yaw ofthe boat in real-time.
6.2.3 Panels
The panels are screen areas clearly defined by a border and/or backgroundcolour and they feature either numeric information or 2D tendency graphs(e.g. depth, barometric readings).
These areas stand out and hover above the main and PIP areas; they canbe moved and turned on/off (Figure 6.5).
89

Figure 6.5: Numeric Panel
6.3 Content Perspective
Perspective is another important issue in discussing augmented perception.For my purposes, I identified the following two:
6.3.1 Immersive
In the immersive perspective, the virtual content is generated and synchro-nized both conceptually and visually with the background, which is a livevideo stream from the cameras. As such, the user sees what the boat seesand this view is augmented with virtual content, surrounding the viewer.
6.3.2 Diorama
In the diorama perspective, the camera has a bird’s eye view of a scene withthe boat in the centre and the virtual content displayed around it (Figure6.4).
6.4 Content Appearance
In my approach, I distinguish between different methods of displaying data/informationand this determines the appearance of the content. The numeric and graphmethods are nothing new as they have been featured in visualization projects
90
for decades. The natural appearance is what we see with our own eyes, sothis topic, too, doesn’t require much detail. The abstract method has beenfeatured in such applications as car GPS systems in the form of either mo-tion indicators or waypoints/direction markers. In my project, however, dueto the highly complex nature of the propulsion, a solid understanding of theenvironment requires a complex abstraction model as resulting graphical rep-resentations. In the last method, the pseudo-natural appearance is the cruxof my research. It is content that looks and behaves like natural content, buthas one vital clue to make it obvious to users that it is virtual.
6.4.1 Numeric Appearance
The numeric content is exactly that, information displayed in numeric form(Figure 6.5).
6.4.2 Graph Appearance
As for the graph content, it tracks the tendency of various entities over time(e.g. depth) in visual 2D form, but without registering it in the spatialcontext of the augmented reality content.
6.4.3 Natural Appearance
In the immersive perspective (6.3.1), the content is made up of the back-ground video-feed coming from the cameras and overlayed by the virtualcontent. All of the virtual content is related to the background video and itis registered into the adjacent spatial context generated based on sensor data(e.g. boat orientation, heading, etc.).
In this context, by natural content I refer to the video stream comingfrom the cameras. For example, if there are visible features (e.g. debris onthe water, shore etc.) and the boat is in motion, I can derive the directionof movement of the boat based on the appearance of the features: if theyare moving from the top of the screen towards the bottom, then the boatis moving forward. Also, the features themselves (e.g. a floating log) havethe actual meaning they have in real-life, as opposed to the pseudo-naturalcontent, as seen below in Section 6.4.5.
91

6.4.4 Abstract Appearance
By abstract content I refer to a series of abstract visual representations (e.g.arrows) that are used to represent information on a higher conceptual level.For example, I could represent the wind direction and strength relative to thespatial context by displaying an arrow with a certain orientation and lengthinside the virtual scene (see Figure 6.4).
6.4.5 Pseudo-natural Appearance
We introduce the concept of pseudo-natural appearance as content that mim-ics the natural appearance and behaviour of an entity, but with a distinctivevisual or conceptual component that makes it immediately recognizable asvirtual content. The concept is related to that of biomimicry [57]. Usingpseudo-natural content can create a synesthetic visual effect, where informa-tion from non-visual sources can be displayed in a visual medium.
Figure 6.6: Pseudo-natural appearance: ducks with feet on the surface of thewater
For example, on the West Coast it is quite common to see Canada geeseon the water and this would be considered natural content. If, however, wewere to see a flock of rubber ducks in our scene displaying the same behaviouras Canada geese, we would think that the entity represented by the flock isakin to actual geese in behaviour, yet it is obviously made of virtual objects.
In Figure 6.6 we see a couple of ducks used as content with a pseudo-natural appearance. The ducks are supposed to look realistic, yet the virtu-ality clue is their feet. If the ducks are standing on their feet, making the
92

feet visible, then they have to stand on a solid surface, not on water. Butif the ducks are floating on the surface of the water, then their feet will notbe visible. This clue should make even in a photo-realistic rendering of theducks obvious to viewers that they are, in fact, virtual content.
I propose the use of pseudo-natural (PN) appearance to create a kind ofcontent that is visually easier to comprehend than an abstract representationof the same underlying information.
Natural and pseudo-natural content is visually and mentally assimilatedin similar ways, in contrast to abstract content, which requires significantmental effort. For example, if one sees leaves blowing in the wind, one pro-cesses the wind direction differently that one seeing a numeric representationof the wind direction in degrees.
6.4.6 Distorted Content
Another concept I would like to explore is that of distorted content, designedto trigger an usual conceptual or emotional response.
Spatial Distortion
In Figure 6.7 we see a warped space effect whereby the boat seems to slidetowards and up the red line, which indicates the estimated route. In thisexample I used a grid and a red path to accentuate the effect, but normallyit would be only the background image that is warped, creating a morenatural, milder effect.
I used this effect only on the background image, but I can easily warpthe spatial coordinates of the scene to illustrate attraction or repulsion. Forexample, if there’s a known threat, I could warp the background and also theplacement of the object in the virtual scene to provide hints to steer awayfrom the hazard.
The idea of designing content that stimulates a feeling of attraction orrepulsion was inspired by an art piece created by the conceptual artist DerkWolmuth, in which by manipulating spandex to form a gravity-well-shapedobject, a viewer would feel like they’re being pulled in (see Figure 6.8).
93

Figure 6.7: Bottom: original space. Top: warped space.
94

Figure 6.8: Gravity well by Derk Wolmuth
Shape Distortion
If I want to give a certain shore feature or rock wide berth, I could distortthe shape of the actual feature to highlight the danger. For example, I couldmake the height of a drying rock three times higher.
Colour Distortion
The appearance of a scene entity could be manipulated from the perspectiveof colour. Excessive heeling could be visualized using a red haze layer towardthe peripheries of the screen, with transparency proportional to the heelingangle, as seen sometimes in computer games.
To achieve PN appearance, particle clouds mimicking bio-luminescencecould have a colour that is implausible (e.g. white or gray).
Perspective Distortion
Illustrating excessive motion can be achieved using a method of distortingthe perspective.
For example, for excessive heeling in coastal cruising, the motion of theboat in the diorama area could be exaggerated by a factor to increase theawareness. Also, the background image could be rotated to exaggerate themotion.
On the other hand, in open ocean sailing sometimes sailors get seasickwhile below decks and a powerful tool to fight this is simply seeing the hori-
95

zon, either naturally, out the window, or using our system. Even more, zicould play down the visual swaying using the sensor data, which may reducesea-sickness.
6.5 Content Organization
In this section I will explore the different kinds of content we will encounterin our scene. Please see Figure 6.9 for a diagram of the scene content.
6.5.1 Background
The background video is made up of live content captured by the bow-mounted camera(s).
6.5.2 Motion
Motion content:
� Main: pseudo-natural ducks (speed)
� Diorama: vector (direction, speed), grid moving backwards
� Panel: numeric (direction, speed)
An old method of estimating the speed of a boat over water was to throwsome object in the water at the bow and measure how long it takes for it toclear the stern. Our take on this method is to place artificial debris in thewater, to simulate the boat’s passing relative to the debris, and therefore togenerate an impression of motion. In the screenshots I used ducks instead ofdebris.
6.5.3 Orientation
Orientation content:
� Diorama: model boat orientation (pitch, roll)
� Panel: numeric (yaw, pitch, roll)
96

Figure 6.9: Scene content
97

6.5.4 Course
Course content:
� Main: highlighted path, warped background
� Diorama: vector (direction, speed)
� Panel: numeric (direction, speed)
6.5.5 Heading
Heading content:
� Diorama: vector (angle)
� Panel: numeric (angle)
6.5.6 Wind
Wind content:
� Main: leaf-based particle cloud (direction, speed)
� Diorama: vector (direction, speed)
� Panel: numeric (direction, speed)
6.5.7 Tidal current
Tidal current content:
� Main: artificial kelp floating with the current
� Diorama: vector (direction, speed)
� Panel: numeric (direction, speed)
98
6.5.8 Depth
Depth content:
� Main: depth-plane rising as warning (depth)
� Diorama: depth-plane (depth)
� Panel: numeric (depth), graph (depth tendency)
6.5.9 Waypoints
Waypoints content:
� Main: buoys (within a local horizon)
� Diorama: buoys (within a local horizon)
� Panel: numeric (distance and bearing to next waypoint)
6.6 Summary
In this chapter we saw an systematic recount of the visual aspects that de-termine the content of the AR scene in support of the visualization effort.
First, we looked at the different screen areas that form the visual interface:main area (see 6.2.1), picture-in-picture (see 6.2.2) area and the panels (see6.2.3).
Then, we explored two perspectives from which the content can be cre-ated: immersive perspective (see 6.3.1) and diorama perspective (see 6.3.2).
Next, I discussed different ways of approaching the visual appearance ofconceptual content: numeric appearance (see 6.4.1), tendency graph appear-ance (see 6.4.2), natural appearance (see 6.4.3), abstract appearance (see6.4.4), pseudo-natural appearance (see 6.4.1), distorted content (see 6.4.1)and conceptually metamorphic content (see 6.4.1).
And last, I created a structure that keeps track of the various types ofcontent I use for the visualization (see 6.5. Among the content elements,the most notable are the background, the wind and current, motion andorientation and course and heading.
Next, in Chapter 7, I will employ a design system that starts by inves-tigating the conceptual background for my research and continues to refine
99

and correlate findings gradually, until I obtain an emergent set of conceptualand design principles which, ultimately, materialize in the form of systemfeatures and specifications.
100
Chapter 7
Solution Analysis
“I must be a mermaid, Rango. Ihave no fear of depths and agreat fear of shallow living”
Anais Nin
This chapter discusses the solution and the entities that enter into thescope of relevance for our design. The examination in this chapter addressesthe effort of drafting a blueprint of the solution. It is one of the most impor-tant contributions in this dissertation, and certainly the most voluminous.
Together with Chapter 4, this chapter recounts the design process that ledto the system implementation presented in Chapter 5 and Chapter 6. WhileChapter 4 explores the design iterations and choices that led to the latestproblem/solution statement, this chapter focuses on the individual conceptsthat form the solution and the conceptual relationship among them.
7.1 Overview
Many of the terms used will be familiar to a reader versed in Design Thinking[58].
I will start by ,discussing the role observations played in the design pro-cess. Next, I will cover most of the important insights I derived from anextensive analysis of the underlying study.
I will explore insights from several sources, including sailing and geo-physical aspects, perception and ergonomics, human-computer interaction
101

and visualization concepts.Then, using these insights, I will propose a set of conceptual principles
that explain what I am trying to achieve by understanding why I am tryingto achieve them. In fact, this will be the meaning of the arrow symbolI use in my diagrams (Figure 7.1). The study of the causal relationship[59] between the various entities in this chapter should be seen from theperspective of theoretical philosophy and, in particular, conceptual modelling[60] and ontology [61], rather than design thinking.
Figure 7.1: Meaning of arrow in diagrams: Basis and consequence
Afterwards, starting off from the conceptual principles, I will draft a setof design principles that will determine what system features will be imple-mented. The detailed description of the system features will form the basisfor the actual implementations; I will recount this last stage as specifications.
Figure 7.2: Overview of the design process pipeline
The conceptual flow, starting from observations, through insights, prin-ciples, features, and ending with specifications is formalized by using keyedtables of entities and dependencies/relations. A simplified graphical repre-sentation of the conceptual flow can be seen in Figure 7.2. The design processspans a conceptual/practical spectrum and the two halves of the spectrumdenote the investigation and implementation efforts on the left and right side,respectively.
102

The physical specifications of the system are covered in the Chapter 5,while the conceptual specification of the AR scene implementation are fea-tured in Chapter 6.
Please see Figure 7.3 for a detailed diagram of my implementation of thedesign process pipeline [58].
Figure 7.3: The design process pipeline
7.2 Observations
The Oxford English Dictionary defines the term “observation” thus:
“The action or an act of observing scientifically; esp. the carefulwatching and noting of an object or phenomenon in regard toits cause or effect, or of objects or phenomena in regard to theirmutual relations. [...]”
For my purposes, I will understand the concept of observation as simplywhat I saw, heard, or thought. A fact.
During my research project, I collected many observations and relevantfacts which I compiled to support the derivation of insights by understand-ing the context, performing conceptual prototyping, developing mechanical,electronic, and software implementations.
103

I also devoted considerable effort to investigating existing cognitive sci-ence papers, journals, and other published materials that informed many ofmy design decisions from the perspectives of epistemology, perception, andcognitive science.
It would be well beyond the scope of this document to include all of theobservations I collected, so I will only mention a few of the most importantsources:
� User Feedback. I consistently consulted over time with users withdiverse backgrounds and collected their opinions on a wide range ofrelevant topics (e.g. sailors, visualization researchers, mechanical engi-neers, electronics specialists, software experts, etc.).
� Brainstorming Sessions. I organized several brainstorming sessionsto support the initial creative process for several components of thesystem, most notably the autopilot & PID Controller, the visualizationinterface and the conceptual background for important sections of myresearch.
� Presentation Discussions. After every public presentation, I recordedthe questions and suggestions members of the public offered.
� Sea-trial Reports. During sea-trials, I used recording devices to ex-haustively document details that I would have lost otherwise. Oncein port, I compiled transcripts. Later, I analyzed these transcripts togenerate detailed sea-trial reports.
Please see Annex 9.2 for an example of a sea-trial report.
� Research Journal. I kept a research journal that documented themost important events of this project. In fact, I drafted Chapter 4following the chronological events documented in my journal.
During all of the phases of this research project, collecting and docu-menting observations proved to be vital task. My documentation was aninvaluable source for the subsequent steps in the solution investigation pro-cess.
7.3 Insights
Before I discuss my insights, I need to explain how I use the term.
104

The Oxford English Dictionary defines insight as:
“The fact of penetrating with the eyes of the understanding intothe inner character or hidden nature of things; a glimpse or viewbeneath the surface; the faculty or power of thus seeing.”
And the Merriam-Webster dictionary defines it as:
“1 : the power or act of seeing into a situation: to penetrate;2 : the act or result of apprehending the inner nature of thingsor of seeing intuitively.”
Within the scope of my research, I use the term “insight” [62] with thesame meaning and connotation found in the process and theory of DesignThinking.
I identified a few themes I use to structure my insights:
� Sailing. Insights about the process of sailing.
� Geo-physical. Insights about geo-physical phenomena.
� Perception and abstraction. Insights pertaining to perception andabstraction.
� Visualization. Insights about visualization aspects.
� Human-Computer Interaction. Insights relevant for interface de-sign.
� Ergonomics. Insights about the use and efficiency of various interfaceelements.
� Art. Insights from literature, photography, and cultural phenomena.
In the following sections, I will discuss an array of insights, which I willuse later to derive conceptual principles. I will use those conceptual prin-ciples to synthesize design principles, the precursors to the actual systemfeatures. For this reason, I will cover the insights only briefly, without pro-viding unnecessary details, focusing more on the relation they bear to theircorresponding conceptual principles. For a complete list of the insights, seeTable 7.1.
A few of the more important insights make assertions that seem to requirevalidation. Wherever possible, I cited the sources. In the other cases, I basedthese insights on common sense.
105

7.3.1 Sailing Insights
Figure 7.4:Sailboat Tell-tales
These insights relate to various aspects of sailing includingsources of information, heeling, electronics malfunction, therole of a first mate, situational perception, etc.
S1. The captain, the vessel and the sea
The process of sailing involves a captain being in control ofa ship at sea. The captain needs to recognize and know howto interpret the countless eclectic aspects of the surround-ing environment [63] (e.g. wind, tidal currents, etc.) Thecaptain also needs to be intimately familiar with the boat’ssystems and how to control them.
Among these systems, the propulsion (e.g. sails), steer-ing (e.g. rudder), and navigation (e.g. chart-plotter) arethe most important. Access to information regarding thestatus of these systems, either through the senses or medi-ated by technology, is paramount.
S2. Data Sources
Sailors need access to data from a diverse range of sources (e.g. depthsounder, wind indicator on mast, sail telltales, tidal charts, current atlas,heeling angle indicator, etc.)
It is quite often overwhelming to get easy access to information. Un-fortunately, it usually leads the captain to shift his attention from other,sometimes vital activities. [64]
S3. Heeling Danger
Heeling on a sailboat occurs naturally and is inevitable, yet it can be dan-gerous (Figure 7.5). Sailors routinely monitor how much the boat is heelingand take action in order to prevent capsizing [65].
The strategies for addressing over-heeling may be counter-intuitive to in-experienced sailors, like steering to weather which actually increases the heelfor a moment, before going in irons. Seasoned sailors know from experiencehow to predict excessive heeling.
106
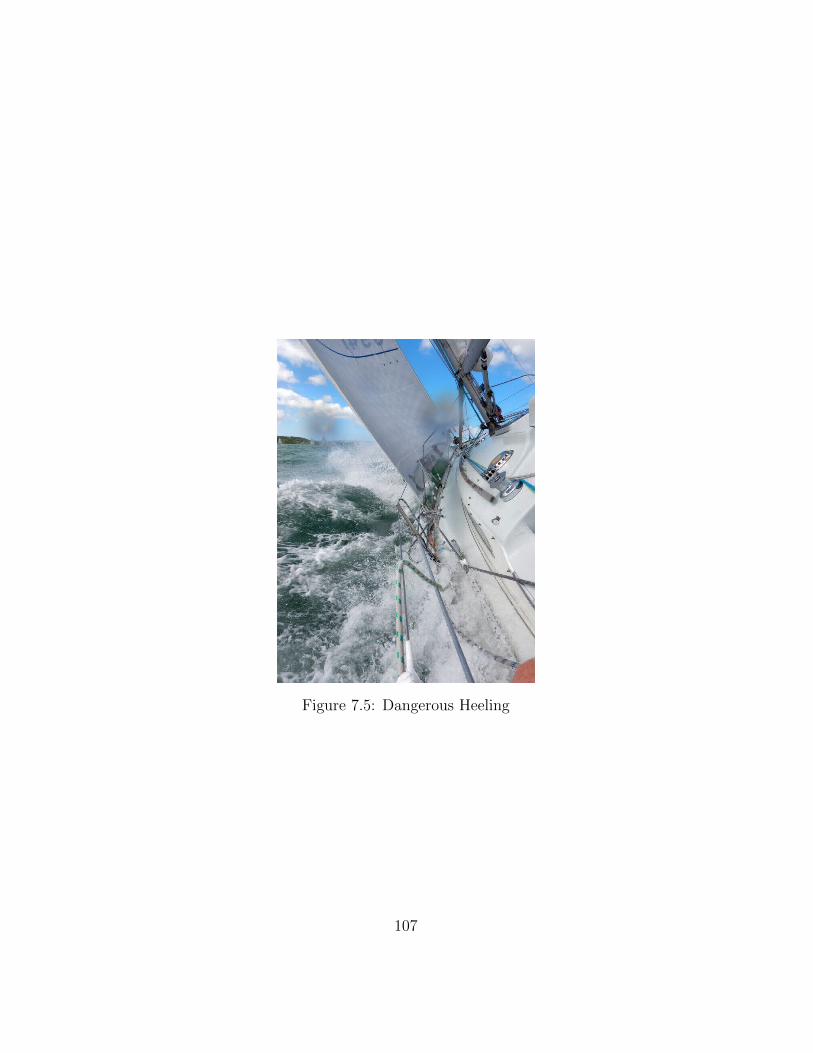
Figure 7.5: Dangerous Heeling
107

S4. Electronics Malfunction
Electronics are a valuable source of information for sailors, however, theyoften have malfunctions and when these occur, they can lead to catastrophicsituations (e.g. lightning strike, Figure 7.6). While marine electronics areusually built ruggedly, according to strict regulations, they seldom have back-ups (e.g. GPS chart-plotters). Redundant systems are prohibitively expen-sive and rarely implemented. Sailors could benefit from secondary or tertiarysources, in case of electronics failures.
Figure 7.6: A lightning strike can fry the electronics and/or captain
S5. First Mate
Traditionally, one of the duties of a first mate was to disagree with the captainwhen the circumstances called for it [66]. This was a mutually beneficial andpositive interaction, because the first mate would thus make the captainaware of his blind-spots in reasoning or action. The captain is still in chargeand has the last word, but he is better informed because of the disagreement.
What we can take from this is that the first mate wouldn’t make obviousobservations, because the captain, being more experienced is already awareof them. The information the captain is presented with is targeted towardshis blind-spots - it has to be focused and meaningful, not redundant.
S6. Non-linear Perception
“The wind blows harder the closer you get to the mountaintop.”
Leland Owlsley, Marvel character
108
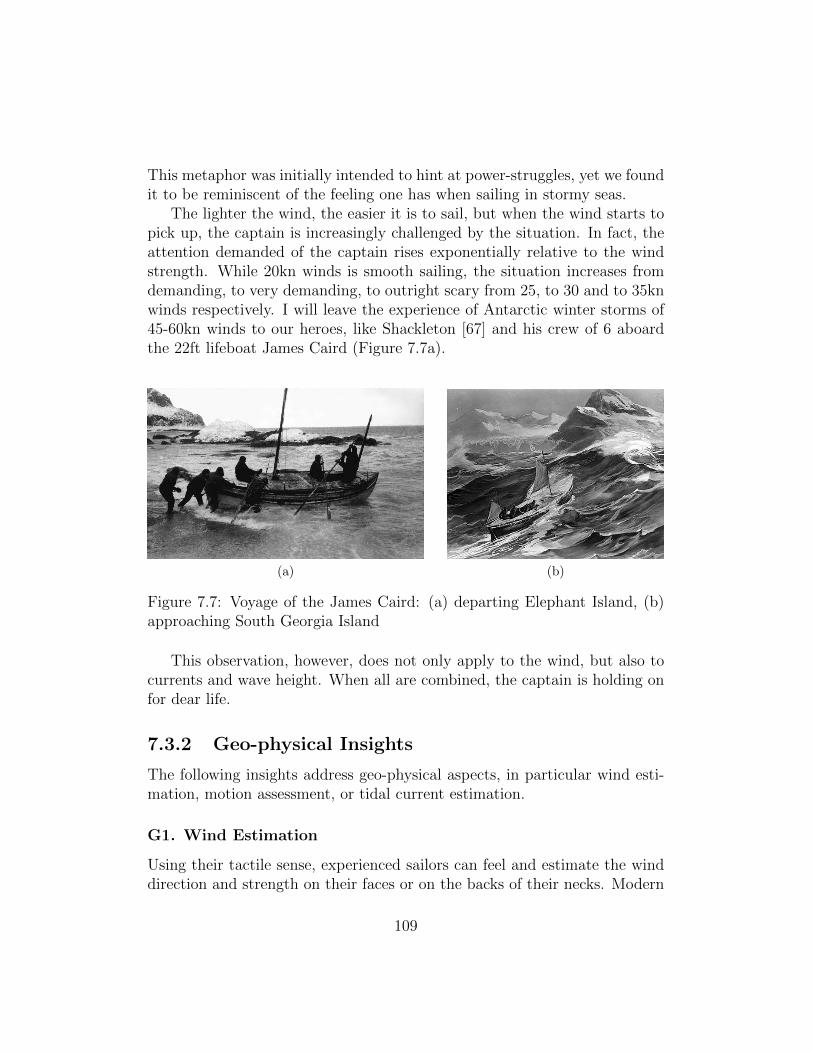
This metaphor was initially intended to hint at power-struggles, yet we foundit to be reminiscent of the feeling one has when sailing in stormy seas.
The lighter the wind, the easier it is to sail, but when the wind starts topick up, the captain is increasingly challenged by the situation. In fact, theattention demanded of the captain rises exponentially relative to the windstrength. While 20kn winds is smooth sailing, the situation increases fromdemanding, to very demanding, to outright scary from 25, to 30 and to 35knwinds respectively. I will leave the experience of Antarctic winter storms of45-60kn winds to our heroes, like Shackleton [67] and his crew of 6 aboardthe 22ft lifeboat James Caird (Figure 7.7a).
(a) (b)
Figure 7.7: Voyage of the James Caird: (a) departing Elephant Island, (b)approaching South Georgia Island
This observation, however, does not only apply to the wind, but also tocurrents and wave height. When all are combined, the captain is holding onfor dear life.
7.3.2 Geo-physical Insights
The following insights address geo-physical aspects, in particular wind esti-mation, motion assessment, or tidal current estimation.
G1. Wind Estimation
Using their tactile sense, experienced sailors can feel and estimate the winddirection and strength on their faces or on the backs of their necks. Modern
109

Figure 7.8: The puppy’s hair can be used to estimate the wind direction andstrength
sailing equipment, like anemometers, use a wind sensor and a display to relaywind information either in numerical form or using rudimentary arrows andother 2D representations [68].
Humans cannot see the wind, but they can see the effects of the wind onobservable entities (e.g. trees, leaves, ripples on the water, or an adorablepuppy as in Figure 7.8).
G2. Motion Assessment
Considering the typical speeds of humans, we can seamlessly be aware ofmovement and motion through the kinesthetic and vestibular senses. Whendeveloping virtual content for AR or VR applications, we cannot tailor thiscontent for the visceral senses that evaluate motion and, instead, we rely onvisual cues to create the impression of motion.
On a light-wind day it is very hard to estimate the motion of a sailboat,even with one’s own senses, let alone solely relying on visual interpretations.A floating piece of debris slowly passing by can be an invaluable source ofinformation.
110

s
Figure 7.9: The tilt of an anchored floating object can help us estimate tidalcurrent direction and strength
G3. Tidal Currents
We can estimate the tidal currents for a large zone using tools such as acurrent atlas or marine chart in conjunction with local tide tables. Deter-mining the tidal current behaviour for a certain location, however, is almostimpossible. In stretches of water prone to currents, it is possible to estimatevisually that there is a strong current, but the direction of the current isdifficult to predict.
The most reliable ways to help us estimate the current direction is byobserving either the direction of the turbulence around a shore feature (e.g.a day-marker or a rock, Figure 7.10) or the inclination and direction of ananchored object (e.g. buoys, Figure 7.9).
7.3.3 Visualization Insights
In this section I encountered a set of insights that approach visualizationconsiderations.
V1. Rubber Duckies
Rubber ducks have proven useful in scientific visualization endeavours timeand time again.
111
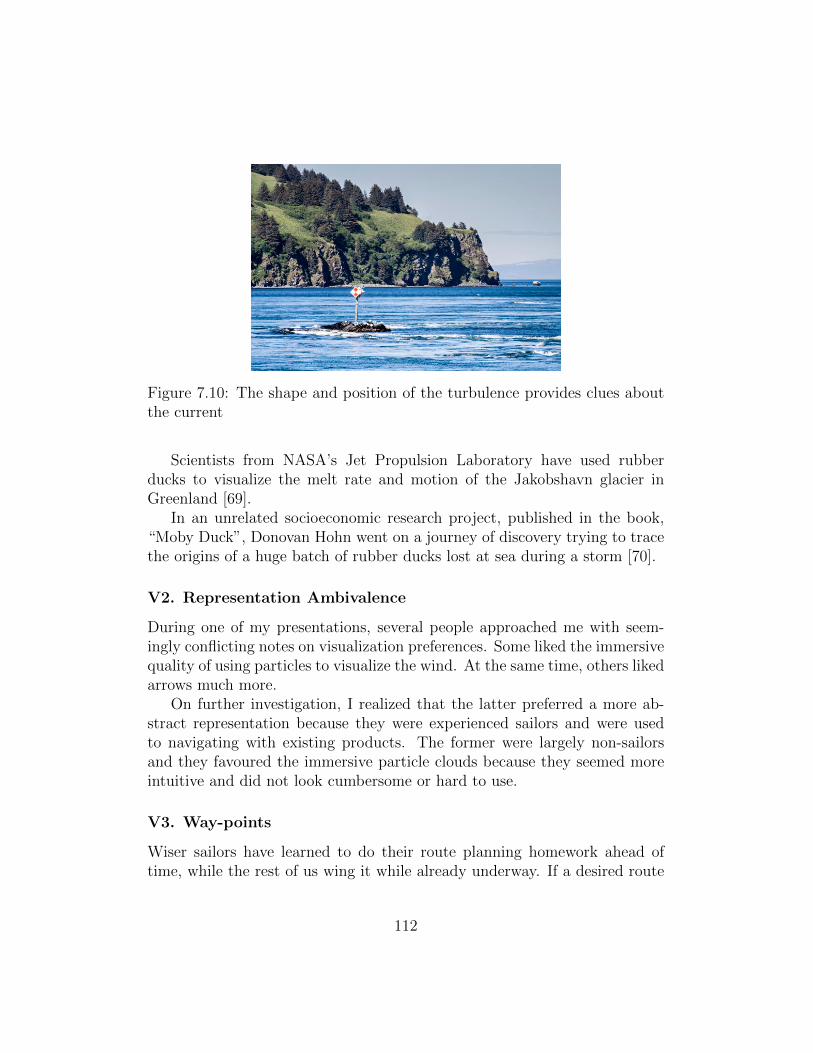
Figure 7.10: The shape and position of the turbulence provides clues aboutthe current
Scientists from NASA’s Jet Propulsion Laboratory have used rubberducks to visualize the melt rate and motion of the Jakobshavn glacier inGreenland [69].
In an unrelated socioeconomic research project, published in the book,“Moby Duck”, Donovan Hohn went on a journey of discovery trying to tracethe origins of a huge batch of rubber ducks lost at sea during a storm [70].
V2. Representation Ambivalence
During one of my presentations, several people approached me with seem-ingly conflicting notes on visualization preferences. Some liked the immersivequality of using particles to visualize the wind. At the same time, others likedarrows much more.
On further investigation, I realized that the latter preferred a more ab-stract representation because they were experienced sailors and were usedto navigating with existing products. The former were largely non-sailorsand they favoured the immersive particle clouds because they seemed moreintuitive and did not look cumbersome or hard to use.
V3. Way-points
Wiser sailors have learned to do their route planning homework ahead oftime, while the rest of us wing it while already underway. If a desired route
112

is known in advance, then it can be exported in the form of a series ofway-points [71]. If these way-points could be integrated in the system andincluded in the visual experience, then the sailors could hold the desiredcourse much more easily.
7.3.4 Human-Computer Interaction Insights
The following insights address a series of topics commonly found in the fieldof human-computer interaction research.
H1. Meta-Information
Figure 7.11: Exam-ple of self-containedand self-validatedmeta-information
In order to fully understand how I want to use avail-able augmented reality technologies, I must firststart with the concept of meta-information, whichis information about some aspect of a particular en-tity.
Figure 7.11 is an excellent instance of the useof meta-information: the text on the t-shirt intro-duces new information about the subject, while thesubject himself presents it. The meta-information isself-contained. In this particular case, the contextalso confirms the meta-information, so the meta-information is also self-validated. In a way, this ex-ample of meta-information is actually meta-meta-information.
H2. Three Scenarios of AR
1. Let’s consider this first scenario: today, the most common under-standing of AR technologies is that of AR glasses, with the MicrosoftHoloLens being an excellent example. For these kinds of devices, thevideo feed is captured with one’s own eyes and the virtual content isoverlayed using various kinds of projections. The user and the capturedevice are one and the same and therefore there is only one perspectiveto consider. The user controls the perspective of the virtual content bypointing his head or eyes in a certain direction.
113

2. For the next scenario, I will take a tablet or a phone and point ittowards some object. The video feed comes from the camera and isdisplayed on the screen. The user sees real and virtual content thatis relative to the phone’s perspective, not the user’s perspective. Theuser has control over the perspective of the virtual content by pointingthe AR device in a certain direction.
3. In the last scenario, I use a camera on the bow of a boat and thendisplay the video feed on a screen set up in a different location. Now Ihave three different perspectives: that of the bow camera, the display,and ultimately that of the user. The user doesn’t have control overthe perspective at all; the virtual content is relative not to the user’sperspective, nor to the display’s perspective, but to the boat’s.
H3. Bird’s Eye View
A bird’s eye view representation of an object can be a powerful aid to certainabstract processes. A classic example of this comes from physics in the formof a graphical representation of the composition of forces for an object on aslope. Using a similar approach, but in 3D, we can see the forces that affecta vehicle, as in Fig. 7.12.
Figure 7.12: Example of a bird’s eye view of a sailboat
H4. To each Media, their own Representation
The captain plots a course on a chart by using precise numeric readingsfrom the instruments. A particle cloud representation of the course would
114

be useless.An abstract visual correlation between the vectors representing the move-
ment over water relative to the movement over ground is inevitable for cal-culating the drift.
A certain barometric value is meaningless, but the barometric tendencyis vital in forecasting the weather.
The depth tendency is important, but only when also knowing the actualdepth; if it rises by 10 fathoms at a depth of 1000 fathoms it’s insignificant,but a rise of 1 fathom at 3 fathoms of depth may signify imminent groundingdanger.
In turbulent waters, estimating the current direction is vital, but moni-toring the current tendency would serve no purpose.
There are no general solutions. The various media simply have their ownspecialized uses and representations.
7.3.5 Ergonomics Insights
I formulated a few insights based on ergonomic considerations, particularlythe separation of planning and navigation and seasickness/anxiety reduction.
E1. Navigation/Planning Separation
Existing navigation products like digital chart-plotters try to accomplish boththe task of planning and navigation at the same time, not performing eitheras well as they could. When navigating (i.e. sailing for the next little while),we do not need to see information in the interface that is not immediatelyrelevant.
E2. Seasickness Reduction
Seasickness is a common occurrence for many sailors when below deck, espe-cially in rough seas. Observing the horizon usually alleviates the sea sickness.If seasick sailors were to have access to a visual representation of not only thehorizon, but also the motion of the vessel using a screen [72], this could provebeneficial to achieving the same benefits as actually observing the horizonoutside.
115

E3. Anxiety Reduction
Having early warning features for various aspects of the system can alleviateanxiety. If the system can predict that the boat will heel too much before itactually does or predicts an incoming storm, it would reduce crew’s anxiety.In the particular case of depth tendency warnings, this feature is well knownto be invaluable to reducing anxiety [73].
7.3.6 Perception and Abstraction Insights
We have devoted considerable attention to several insights regarding abstrac-tion and perception, which aided us to better understand various aspects re-lating to the nature of human thought and practice, in particular regardingperception and visualization.
P1. Abstraction
“Always make a definition or sketch of what presents itself toyour mind, so you can see it stripped bare to its essential natureand identify it clearly, in whole and in all its parts, and can tellyourself its name and the names of those elements of which it iscompounded and into which it will be dissolved.
Nothing is so conducive to greatness of mind as the ability tosubject each element of our experience in life to methodical andtruthful examination, always at the same time using this scrutinyas a means to reflect on the nature of the universe, the contribu-tion any given action or event makes to that nature, the value ithas for the whole[...]”
Mediations, Marcus Aurelius, Book Three, 11
Our research relies on a strong understanding of the surrounding envi-ronment and the boat’s behaviour. These are complex entities that require asystematic breakdown into individual components and reintegration into anabstract model [74].
P2. Representation Model Accuracy
In the paper “The diverse aims of science” [75], A. Potochnik argues thatin the quest for scientific understanding, we need to simplify and idealize
116

models in order to make complex phenomena more intuitive and easier tounderstand. An excessively idealized scientific model is not helpful.
A model must pass a threshold of truth (i.e. it needs to be true enoughfor our purposes), but beyond that point, adding true details will make themodel more difficult to understand. Understanding is more important thanaccuracy.
P3. Wallace’s Line
Figure 7.13: Wallace’s Line
In the paper “Evolution, biogeography, and maps: An early history ofWallace’s Line” [76], Camerini provides a focused account of historical detailsrelating to Wallace and Darwin’s efforts towards the development of thetheory of evolution.
The point of the paper is that Wallace and Darwin were both able todevelop essential parts of the theory of evolution only when they were ableto literally see how different populations were spread out over different ge-ographic areas. By examining information they already had in other formsand representing it visually on a map, they gained insights and saw patternsthey could not see before.
117

Also, the accuracy of the actual position of the line did not matter verymuch, but putting a line on the map made a huge difference.
For my research, the take away from this example is that trying to employvisual tools with the intention of representing inherently non-visual informa-tion can have a powerful impact on one’s understanding of the information,regardless of how accurate the representation is.
P4. Visual Representation
The following papers provide a basis for understanding how and why visualrepresentations are useful in conveying complex information in more accessi-ble ways.
The Kulvicki [77] paper “Knowing with images: Medium and message”talks about how visual representations allow us to intuitively encode all kindsinformation, and how the same information, encoded in non-visual terms,would be far more cumbersome and harder to understand.
In Sheredos’s [78] article “Why do biologists use so many diagrams?”,the authors argue that “diagrams have distinctive characteristics that makethem effective mediums for communicating research findings, but they areeven more impressive as tools for scientific reasoning.” In the same resource,we find several accounts of a practice-based preference among biologists touse graphical representations of inherently quantitative content.
These papers, together with Wallace’s line and many others trace a clearpicture that visual representation of non-visual information is a powerful toolfor scientists from diverse fields of study and even that without these tools,scientific discovery would progress at a slower pace.
P5. Misleading Visual Representations
A. Roskies in the paper “Are neuroimages like photographs of the brain?”[79] investigates the nature of the visual content of neuroimages and howthat generated visual content differs from the actual structure of the brain:
“Brain images are epistemically compelling, in part because theyare likely to be viewed as akin to photographs of brain activ-ity. [...] neuroimaging diverges from photography in ways thatseriously undermine the photographic analogy [...][and] properinterpretation of brain images is much more complex than it ap-pears.”
118

The paper examines how fMRIs look like they are pictures of brain ac-tivity, but this is in fact deceiving. fMRIs track blood flow by amalgamatingdifferent kinds of statistical information and then generating something thatlooks like an image. By presenting this information visually, it is far easierfor scientists to understand it. Yet, it is also potentially deceptive becauseit gives the incorrect impression that we are directly looking at visual orstructure features of the brain when we are not (as opposed to looking at astatistical re-creation of certain neural properties given statistical softwaredesigned to look like an image).
There are two important ideas to take away from here. First, we buildupon the already common theme that visual representations of informationare easier to understand than other kinds of representations. Second, andmost important, we need to be aware that synthetic visual information maynaturally be confused with authentic visual information, which can be seri-ously misleading.
P6. Part Salience
The paper “Salience of visual parts” [80] is an excellent study of the processof making sense of objects visually, and particularly relative to the conceptsof parts, boundaries, and salience.
The concept of minima rule is used in order to distinguish the fundamentalparts needed for recognizing an object. By manipulating a fundamental partof the shape, we can also make a case for exhaustive content objects thatappear obviously artificial in order to create a clue of virtuality.
7.3.7 Art Insights
The next section follows an eclectic list of insights ranging from sources suchas journalism, literature, or cultural phenomena. We bundled them togetherunder the umbrella term “art”, for a lack of a better term.
A1. The Esemplastic Power of Imagination
In the midst of an epiphany about an overwhelming experience at the opera,Homer Simpson admitted, “you made me believe I was in a magical worldwhere singing is talking” [81].
119

This subtle Simpsons moment is a mere glimpse into the breath-takingpower of imagination. Following in Schopenhauer’s footsteps, in Biographialiteraria [82], Samuel Taylor Coleridge strives to amass the power of imagi-nation’s magnitude, substance and sublime nature, coining the term esem-plastic1 in the attempt:
“The esemplastic power unifies, ‘all in each’, and arranges allideas and expressions in one scale.”
When exposed to a meaningful, gripping, and insightful experience onetranscends one’s limits, shatters the bounds of time, space and mind, andthen steps into a world where veritable understanding is fluid and all-encompassing,where all is interconnected in wild, wily, and deeply profound ways.
A2. Emotional Impact
In one of the sketches [83] of the Drop the Dead Donkey show2, a teamof journalists was discussing the ethical implications of staging a scene byadding a teddy bear (Dimbles):
“You know what these stories are like. You turn up, and theemergency services have cleared away all the carnage so you’vegot no pictures. And these are just creative touches to bringhome the full drama of the story to the viewer. I’ve won threeawards with Dimbles. All right, all right, I concede that maybeI’ve overused him a teensy bit.
A teensy bit? This bear’s visited more disaster scenes than Mar-garet Thatcher. It’s the only cuddly toy to have taken part inthe Iran Iraq War, where, as I recall, you claimed it was a mascotabandoned by martyrs of Allah.”
The sketch itself was aimed at discussing the ethics of altering or doctoringa scene in journalism. The same scene without the teddy bear would affectthe viewer psychologically in a completely different way.
1Esemplastic, a term first used by Samuel Taylor Coleridge and according to a memo-rable side note by Blob “and never used again since.”
2Drop the Dead Donkey is a situation comedy that first aired on Channel 4 in theUnited Kingdom between 1990 and 1998. It is set in the offices of ”GlobeLink News,” afictional TV news company.
120

The point we can take away from this story is that artfully-planted visualcues can have a powerful emotional impact while still being fundamentallyirrelevant to the objective facts.
A3. Perception of Familiar Surroundings
Years ago, while working as a travel journalist in the Lofoten Islands innorthern Norway, I met an old fisherman and he shared a few tales of thesea with me. There’s one particular remark I recall vividly.
While comparing the roaring winter storms of the open waters of theNorth Atlantic to his native shores, he said that despite the fjords havingstronger, unpredictable winds than the open ocean, as well as unforgivingcurrents and shoals that can wreck your ship in an instant, he is still muchmore at ease when, “he can rest his eye on a familiar mountain.”
The phrasing, “to rest my eye on a familiar mountain,” echoed profoundemotional depths and I could see in his eyes the warm wood-fire of his Rorbuhut, the smell of fresh salmon, and in his smile I saw the laughter of hischildren running along the pier to welcome him back in the perpetual starrydarkness of the polar night underneath a river of northern lights in all thecolours of the rainbow.
From this story we can take away the insight that despite one situationbeing better than another as an objective evaluation of sailing conditions,one’s emotional response may be counter-intuitive and dependent on cuessuch as a familiar sight or simply an action and/or an object associated witha certain desired psychological state (e.g. resting one’s eye on a mountain).
A4. Guided vs. Exhaustive Content
A common-sense observation in improvisational theater is that trying to comeup with content without directions is very difficult. If one is given a few cluesto start from, then the imagination can take it from there and run free withthe given scenario.
Our take on this theatrical technique is that a powerful experience is onewhere one’s mind is taking an active part in creating content by filling in thegaps. We shall refer to this as guided content. Instead of experiencing anexhaustive description of something (i.e. exhaustive content), an experiencebased on incomplete content, guided by essential cues is a more human-friendly approach and better suited to create an organic experience.
121

One clear illustration that comes to mind regarding this conceptual di-chotomy is the different experience of a story in the form of a book as opposedto a movie. From a visual perspective, the book is guided content, while themovie is exhaustive content.
7.4 Conceptual Principles
After exploring all of the insights at length, we can now move to the nextpart, the generation of conceptual principles.
By conceptual principles we understand a set of principles that deter-mine the conceptual content pertaining to our solution. From a practicalperspective, the difference between the insights and the conceptual princi-ples is that while focused, the insights have no direct relation to the solution,they simply provide an explanation for some relevant aspect pertaining tothe problem. The conceptual principles, on the other hand, are active inshaping the direction of the solution.
CP1. Transcendental Experience
The visual experience should address one’s imagination as much as, if notmore than it should provide information. One’s imagination is where magicalthings happen, where a child sees the wind as clear as day, even when thereare no senses to actually see the wind.
The content shall tell a story, it shall plant accurate cues and detailshere and there, so that the actual experience will happen in the viewer’simagination, where there are no limits to the profoundness of one’s connectionto all in each1.
CP2. Environment Awareness
The captain needs to be aware of the status of various environmental aspectsadjacent to one’s ship. Among these aspects, the most important are thewind, the shore, and the tidal currents for coastal sailing. For off-shore sail-ing, the most important aspects are the wind and the atmospheric pressure.Also, for any kind of sailing, the captain needs to be aware of nearby ships,wildlife, and debris.
1“On the Imagination, or Esemplastic Power” Ch 13, Biographia literaria, STC. [82]
122
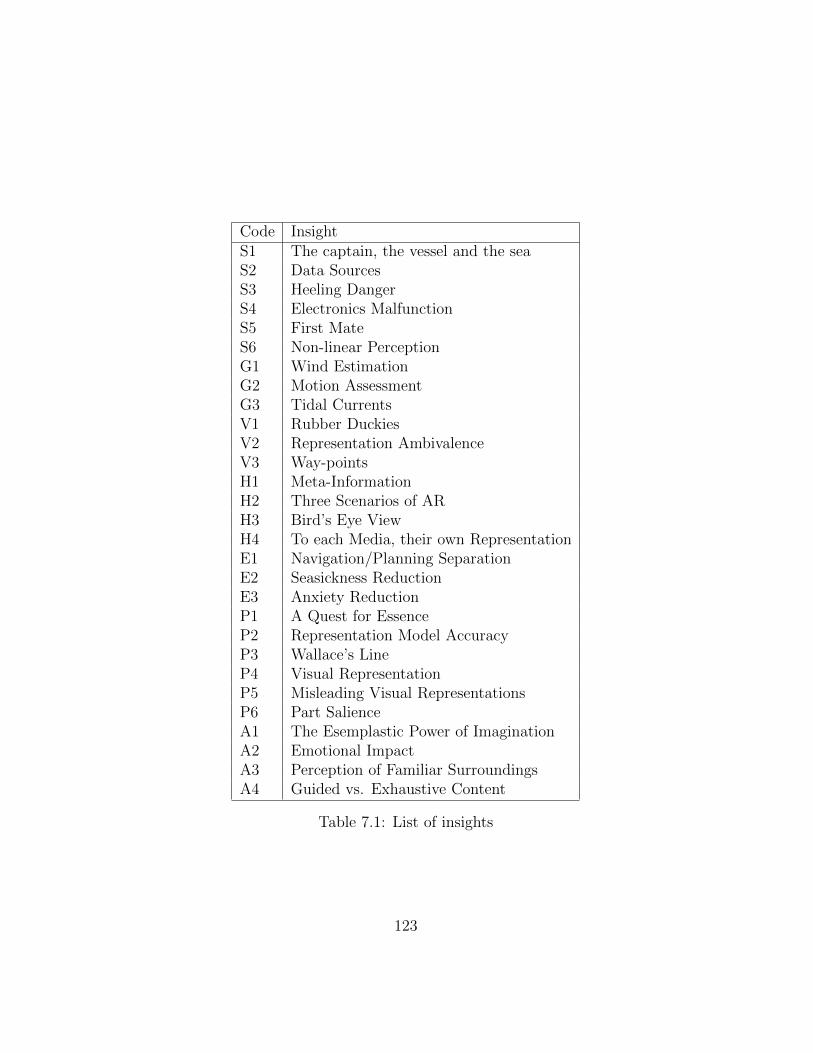
Code InsightS1 The captain, the vessel and the seaS2 Data SourcesS3 Heeling DangerS4 Electronics MalfunctionS5 First MateS6 Non-linear PerceptionG1 Wind EstimationG2 Motion AssessmentG3 Tidal CurrentsV1 Rubber DuckiesV2 Representation AmbivalenceV3 Way-pointsH1 Meta-InformationH2 Three Scenarios of ARH3 Bird’s Eye ViewH4 To each Media, their own RepresentationE1 Navigation/Planning SeparationE2 Seasickness ReductionE3 Anxiety ReductionP1 A Quest for EssenceP2 Representation Model AccuracyP3 Wallace’s LineP4 Visual RepresentationP5 Misleading Visual RepresentationsP6 Part SalienceA1 The Esemplastic Power of ImaginationA2 Emotional ImpactA3 Perception of Familiar SurroundingsA4 Guided vs. Exhaustive Content
Table 7.1: List of insights
123

CP3. Ship Awareness
The captain needs to be aware of the status of the ship’s systems, most impor-tantly propulsion and navigation equipment. Access needs to be provided ina reliable and immediate way to information relative to these systems. Wher-ever electronic sensors can be used, the data should be integrated into thesensing system. For aspects that cannot be accessed by any other means thanone’s senses (e.g. sail telltales), the electronic system should be designed toallow for a break in the captain’s attention to attend to these aspects.
CP4. Centralized Data
Access to data should be centralized wherever possible, to speed up the accesstime. The solution should integrate data from as many sources as possible.It should also display it in as few places as possible.
CP5. Heeling Awareness
Strategies for preventing excessive heeling require understanding of the rea-sons why heeling happens. When the inexperienced sailor can’t predict thepotentially dangerous heeling in advance, our solution should perform theprediction instead and enhance heeling awareness.
CP6. Mission-Critical Design
The electronic system has to be designed according to mission-critical re-dundant principles. If there is a failure, it should be only local, withoutimpacting the entire system. Instead of using a monolithic paradigm thesystem should mandate partial functionality for mission critical features.
CP7. Synthetic Synesthesia
Synesthesia in this context is used as an analogy, not literally. Understandingof geo-physical phenomena that cannot be natively assessed using humansenses, should be represented visually (e.g. depth, atmospheric pressure,etc.) Information about the wind, tidal currents, and forward motion mustbe visually represented as closely as possible to what would be the actualsensory perception.
124

CP8. Pseudo-Natural Appearance
The appearance of virtual content featured in supporting AR roles should bepseudo-natural:
Natural. The content should be as close as possible in appearance andbehaviour to its corresponding entity in real life.
Pseudo-. There should be one obvious and fundamental difference care-fully planted so that the virtual content can never be mistaken for genuinescene content.
CP9. 4 Paradigms of Visualization
In strong contrast to existing navigational tools that mix all the visual con-tent together, I conceptually classify the system entities using four differ-ent paradigms of visualization collected in the form of two fundamental di-chotomies. The first dichotomy is based upon perspective and it identifiesa detached versus an immersive experience. The second is based upon thelevel of abstraction of data and it identifies natural versus symbolic contentrepresentation.
CP10. Experience Awareness
The interface should be flexible enough to accommodate the needs of a broadspectrum of users. Despite trying to create a consistent experience, I shouldbe aware that sailors may have different needs depending on their experiencelevel. Sailor caught in a storm off-shore may want a reduction in the interfaceinformation to the bare essentials. Inexperienced captains in coastal watersmay want exaggerated features to highlight and predict potential danger.
CP11. Course Awareness
The system should address the captain’s need for course awareness by facil-itating access to information regarding the desired course, the actual coursemade good, and the difference between them.
CP12. Representation Synergy
The various kinds of information to be displayed should be individually ana-lyzed to determine the most appropriate graphical representation. The rep-
125

resentations should tell a story and be intuitive regarding the subject theyrepresent. More than one kind of representation for a certain subject isacceptable, where appropriate (e.g. pseudo-natural and abstract representa-tions).
Ultimately, the information should be displayed in a form that is in har-mony with everything: boat, environment, and the captain.
CP13. Blind-spot Awareness
The system should make captains aware of their blind-spots and also supplynew insights. The captain’s own existing knowledge should be respected andonly new information should be added, without stating the obvious.
CP14. Emotional Stimulation
Visual cues can trigger wildly powerful emotional reactions. While objectiv-ity is indeed important, carefully crafted little details that may seem insignif-icant to the scientific-oriented observation may make the difference betweenhaving a sterile image that speaks to the reasoning mind, or an organic im-age that informs while also serving as a ramp to inducing powerful emotionalstates. If we can, we should investigate the possibility of incorporating non-distracting, calming (familiar) visual cues in stressful sailing situations.
CP15. Goldilocks Scenario
The scientific models behind the data acquisition process should try to reacha balance between too detailed or too abstract.
For a complete list of the conceptual principles and their dependencies,see Table 7.2.
7.5 Design Principles
In this section I will discuss the design principles I identified. The differencebetween the conceptual principles and the design principles [84] is that theformer deal with more general, abstract concepts, while the latter are focusedon providing more specific, practical constraints and hints.
Ultimately, both sets of principles are used to derive a set of systemfeatures, as we will see in the next section.
126

Figure 7.14: Conceptual flow between insights and conceptual principles. SeeTables 7.1 and 7.2 for a list of symbols
127

Figure 7.15: Conceptual flow between conceptual principles, design principlesand features. See Tables 7.3 and 7.2 for a list of symbols.
128

Code Conceptual Principle Based onCP1 Transcendental Experience A1-4, P2-4, S1CP2 Environment Awareness E2, G1-3, S1-3, 5, 6CP3 Ship Awareness S1-3,5,6CP4 Centralized Data S2CP5 Heeling Awareness S3CP6 Mission-Critical Design S4CP7 Synthetic Synesthesia A1,3, G1-3, S2, S6CP8 Pseudo-Natural Appearance P3-6CP9 4 Paradigms of Visualization H1-4, E1, V2CP10 Experience Awareness V2CP11 Course Awareness S1,2, V3CP12 Representation Synergy A4, P1,2, V1CP13 Blind-spot Awareness S1, S5,6, H1CP14 Emotional Stimulation A1-4, E3, S5CP15 Goldilocks Scenario P2,4,5
Table 7.2: List of conceptual principles
DP1. Instruments Interface
The system should interface existing boat instruments (e.g. anemometer,depth sounder, impeller log, GPS, etc.)
DP2. Enhanced Sensing Capabilities
The system should provide sensors for data sources that are absent among thenative vessel instruments (e.g. camera, accelerometer, gyro, magnetometer,hygrometer, barometer, etc.)
DP3. Display Device(s)
The provided information should be presented on one or more display de-vice(s) (e.g. tablet, phone, AR glasses, indoor monitor, external screen, etc.)
DP4. Visual Interface
The display device(s) will feature a graphical user interface, where the screenspace will be comprised of an amalgamation of visualization areas.
129

DP5. Visualize Heeling
The heeling tendencies of the boat should be analyzed and dangerous heelingshould be forecasted and visualized. Our solution should provide a visualwarning about dangerous heeling either while it is happening or, preferably,ahead of time.
DP6. Distributed Topology
Following a modular design, where individual units are isolated and spe-cialized to a certain functionality, the system should feature a distributedtopology. The individual modules should transfer data wirelessly as much aspossible.
DP7. Electric Shock Protection
The individual electronic system components should maintain functionalitydespite the potential of an electric shock in the system (e.g. lightning strike,reverse polarity, etc).
DP8. Supporting Visual Cues
In the pseudo-natural paradigm, the wind, current, and boat motion shouldbe visualized using supporting visual cues featuring pseudo-natural content.
DP9. Scene Modelling
The AR scene should be customizable in more than just appearance, incomponence2and ultimately in essence. For this purpose, no explicit (hard-coded) scene should be used, but instead the scene should be generated froma conceptual description of the media that inhabit it.
DP10. Route Integration
The system should provide a feature that can import way-points from plan-ning software. Both the desired route (from way-points), and the actualcourse made good should be available, as well as potentially highlighting thedifference between the two.
2componence - (linguistics) The composition of a grammatical structure in terms of thecomponents it contains, without regard to their arrangement.
130

DP11. Display Areas
The display should represent distinct layers or areas. The main area layer(i.e. the background) covers the entire display and it displays the live videofeed from the camera. Additional immersive layers featuring pseudo-naturalcontent (e.g. wind/current particle cloud, visual cues etc.) also cover theentire display. Other areas include a bird’s eye view dedicated to the visu-alization of more abstract information (e.g. vector composition for currentcalculation).
DP12. Mix and Match Content
Just because the immersive area is typically associated with pseudo-naturalcontent and the bird’s eye view area is associated with more abstract rep-resentations, it does not mean they cannot feature any kind of availablecontent. An arrow-based representation of the current may be used in theimmersive area or a particle cloud-based representation of the current can beused in the bird’s eye view area.
For a complete list of the design principles and their dependencies, seeTable 7.3.
Code Design Principle Based onDP1 Instruments Integration CP2,3DP2 Additional Sensors CP2,3DP3 Display Device(s) CP2,3DP4 Visual Interface CP2,3DP5 Visualize Heeling CP5DP6 Distributed Topology CP6DP7 Electric Shock Protection CP6DP8 Supporting Visual Cues CP2,3,7,8,12,15DP9 Scene Modelling CP9,10DP10 Route Integration CP11DP11 Display Areas CP9,14DP12 Mix and Match Content CP9,12
Table 7.3: List of design principles
131

7.6 Distinctive Features
In this section I finally arrived at the core of my research, the distinctivefeatures of the system. I use the word feature as having the meaning of adescription of a particular characteristic of the system, and not as the morewidely used meaning of implementation. Extensive implementation detailsof the features can be found in form of system specifications, in Chapters 5and 6.
Even more specifically, in this section I will look at the distinctive features,meaning of features that set our implementation apart from other, commonlyused instances of corresponding entities in related fields of study. For exam-ple, most of the electronic components of my system are interconnected usingWebsocket technology, based on a TCP/IP network; this would indeed be afeature of the system, but since the use of this technology is considered to bewidespread and an obvious choice, I simply assume it, without mentioning itas being a distinctive feature.
In order to paint a clear picture of the system, I encourage the readerto start off from the list of distinctive features and, where details are notprovided, to fill in the gaps using the most obvious solutions according tocurrent technological trends.
First of all, I need to clarify the explicit meaning of a few terms: by screenI mean the working area that can be used by my software to exhibit visualcontent. The related term display (noun) covers the hardware aspects of thevisualization process (i.e. the display is 4 inches wide and made of plastic).As an action, to display (verb) is used for both software and hardware withthe widely accepted meaning.
F1. Customizable Screen Areas
The screen is composed of three different kinds of areas:
1. Main area. Forms the background of the visualization; it featuresa live video stream and additional overlayed virtual content (Section6.2.1)
2. Picture-in-picture area. Smaller area, blends into the main area(Section 6.2.2)
3. Panel area. Windows with specialized content (numeric, graphs,menu etc.) (Section 6.2.3)
132

F2. Customizable Perspective
In the main and PIP areas, the perspective of the scene/content can becustomized:
1. Immersive perspective. The content is synchronized with the videofeed and is distributed around the viewer (Section 6.3.1)
2. Diorama perspective. The boat is seen from a bird’s eye view per-spective and the content is displayed around the boat (Section 6.3.2)
F3. Customizable Content Appearance
The appearance of the visual content presented to the sailor can be catego-rized according the following taxonomy:
1. Non-spatial representation
(a) Numeric content. Quantitative information like heading ordepth (Section 6.4.1)
(b) Graph content. Graphs that provide information about thetendency of various readings, like depth (Section 6.4.2)
2. Spatial representation
(a) Natural content Visual content streamed directly from the cam-eras (Section 6.4.3)
(b) Abstract content Abstract visual content such as vector arrows,grid, distance rings etc. (Section 6.4.4)
(c) Pseudo-natural content Visual content that comes in pseudo-natural form, such as particle clouds, 3D models etc. (Section6.4.5)
F4. Pseudo-natural Appearance
The pseudo-natural content can be explained as content that first looks nat-ural (most of its characteristics follow a natural appearance), and secondthere is a significant characteristic that makes it stand out as obviously vir-tual content, so it cannot be mistaken for natural content. (Section 7.4,section 6.4.5).
133

F5. Distorted Content
One method for achieving pseudo-natural appearance for content is by exag-gerating features, like a warped grid, or an unnatural colour in bio-luminescence(Section 6.4.6). Distorted content, like exaggerated heeling angles, could bealso used to alert sailors to danger.
F6. Way-points
The system has a feature for importing way-points and displaying only theones that enter a local horizon (e.g. approx. 0.1nm)
F7. Visual Elements
The visualization component of the scene employs several visual elements toillustrate the following characteristics:
� Heading
� Course
� Motion
� Orientation
� Wind
� Tidal current
� Depth
� Way-points
F8. Decentralized System
A system (Chapter 5) distributed over a boat network featuring sensing, pro-cessing, and visualization modules. The system is decentralized, as opposedto the monolithic paradigm used in most common marine devices (e.g. GPSchart-plotter, radar etc.), allowing for failures to be localized, rather thancatastrophic.
F9. Instruments Interface
The sensing module (Section 5.2) has a unit dedicated to interfacing existingboat instruments (Section 5.2.3). Among the interfaced instruments are ananemometer, GPS chart-plotter, impeller log and others.
134

F10. Telemetry and Internal Units
Other important sensing capabilities are provided by the telemetry unit andinternal units. The telemetry unit provides data regarding boat position,orientation, motion, and others (Section 5.2.1). The internal unit providesdata regarding battery level, tank levels, temperature and humidity (Section5.2.4).
F11. Visualization Broadcast
The visual content (Chapter 6) is provided to users via any device that canaccess the boat’s WiFi and can support a JavaScript and WebGL-capablebrowser. Some of the devices I tested include laptops, tablets, and smart-phones (Section 5.5).
F12. Inductive Charging
The processing server, telemetry, internal, and imaging units provide wirelessdata and they are powered through their own batteries, charged via inductivecharging. This prevents the risk of catastrophic failure due to a short circuitas a consequence of unforeseen factors in the electrical system (e.g. lightningstrike, alternator failure, etc.)
F13. Server
The boat server acts as the main processing, logging, broadcasting agent,having two main tasks: to accumulate real-time data from the sensors andto provide visualization content (Section 5.4).
Among the processing tasks, some of the most significant are data filteringand information modelling (abstraction). The processing unit can be doubledwith a backup unit, running in redundancy mode.
For a complete list of the features and their dependencies, see Table 7.4.
7.7 Conceptual Flow
After identifying and delving into all the concepts I covered, I will formalizethe relationship among them.
The use of the following complex web of conceptual inter-connectivityaims to provide a central core for our symbolic representation of the entities
135

Code Feature Based onF1 Customizable Screen Areas CP10,12,14, DP11,12F2 Customizable Perspective CP10, DP8,9,11F3 Customizable Content CP1,7,8,9,10,DP8F4 Pseudo-natural Appearance CP1,7,DP5F5 Distorted Content CP1,3,13,14,DP5F6 Waypoints CP2,11,DP10F7 Visual Elements CP2,3,7,11,DP8F8 Decentralized System DP1-3,6,7F9 Instruments Interface CP4,DP1F10 Telemetry and Internal Units DP2F11 Visualization Broadcast DP3F12 Inductive Charging DP6,7F13 Server DP6
Table 7.4: List of features
and considerations at play and to lighten the Atlassian burden of holding allof them up in the air, while trying to make sense of how to make use of them[85].
In the previous sections we encountered four tables: 7.1, 7.2, 7.3 and7.4, that recounted insights, conceptual and design principles and features,respectively.
In these tables we see that a certain entity has a code, a name, and isbased on another entity (or none for insights). Is we start parsing the featuresusing the ”based on” information recursively, we end up tracing all of theconceptual relations, all the way to insights.
Using a flow graph, I track the conceptual relationships between the con-siderations that played a role in the emergence of the features:
� To trace the bottom up emergence of features by slowly bubblingfrom hard facts and observations to abstract representations (i.e. in-sights and principles), that are ultimately crystallized into a hard-ware/software feature shaped by a clearly stated purpose, which satis-fies a contextual necessity (Figure 7.16).
� To split apart the manifold of existence into varying conceptual realmsas part of a local horizon of relevance.
136

� To examine the entities and processes that inhabit these conceptualrealms and to create an abstract model of understanding regardingtheir underlying essence.
� To form a vision of the sailor’s needs in terms of a visual experience.
� To build an esemplastic augmented reality scene that finds an appro-priate place for each visual element, where they can transcend theirmedium and germinate in harmony with the sailors’ imaginations.
� To investigate the process of data-gathering and to reformulate it in away that can be visually delivered to sailors.
� To facilitate an immersive, meaningful, transcendental visual experi-ence that caters to the imagination and delivers immediately usefulvisual content.
7.8 Summary
In this chapter I create a record of the design process by modelling the inter-dependency between all of the conceptual elements that played a role indrafting the solution in its current form.
In Chapter 4 we saw a similar process through which I found the shape ofour solution. In this chapter I continued the previous work and filled in thedetails by starting from a collection of observations; then through a processof ideation, found a set of insights, organized into six categories. Then, fromthese insights, a set of principles emerged. These conceptual and designprinciples guided me towards a brief set of feature descriptions that specifiedthe system components.
Lastly, I tracked all of the elements using relational tables of entities andcreated a visual, graph-based representation of the conceptual relationships.
This chapter offered an investigation of the research problem as well asfacilitated the leap towards a detailed solution with features and specifica-tions.
137

Figure 7.16: Conceptual flow between insights, conceptual principles, designprinciples and features. See Tables 7.1, 7.3, 7.2 and 7.4 for a list of symbols.
138

Chapter 8
Future Work
8.1 Model Sailboat
There are obvious limitations in the process of developing and testing navi-gational sailing equipment. Due to the improvised nature of prototypes de-signed for research purposes, the trustworthiness and reliability of the equip-ment is significantly less than established, off-the-shelf products. Fortunately,most of the equipment I have used so far is relatively small in dimensionsand can easily be mounted on a 13 ft model of a sailboat, instead of the 23,26, and 35 ft sailboats normally used. The system is designed to broadcastthe information feed over a network. As a result, operators don’t necessarilyhave to be in the boat; they can be on the shore, receiving data, renderingthe AR scene locally, and transmitting commands back to the model shipover a remote control.
Recent research in the field of sailboat automation [86] shows promisingresults using a free-rotating wing sail. Such a setup is made up of a rig thatrequires only one linear actuator for the sail and another linear actuator forthe rudder.
In the future, I hope to either retrofit an existing 2.4 mr sailboat to awing-sail or to establish a partnership with an existing research project todeploy my AR visualization technology to it.
139

Figure 8.1: maribot Vane wing-sail sailboat model
140

8.2 Remote Sailing Training
Another direction my research could go into is remote teaching and in par-ticular instructional applications. By implementing the ship’s system as anIoT device, sailing instructors could sit in an office in Victoria, while theirclients would be sailing in the Bahamas. The sailing lesson would take placeover a significant distance, but it would take place nonetheless.
8.3 Extended Implicit Modelling
We have barely scratched the surface of the potential for the paradigm ofimplicit modelling. At the moment, I am aware of past and present effortsto use implicit modelling for shape generation, but I have attempted littlebeyond the scope of geometric shapes.
In broad terms, implicit shape modelling approaches the problem of gen-erating a shape based on a mathematical description involving the samplingof a field generated based on a set of geometric primitives and operations.There are several other interesting proposed methods of generating shapesbased on parametric descriptions, among which attribute-based modellingcomes to mind and would be an alternate candidate for AR scene modelling.For my purposes, however, I focus on the concept of fields radiating fromprimitives, permeating space.
Implicit material modelling picks up a shape and uses a mathemati-cal/physical/chemical description to generate a distribution of matter insidethe shape; properties such as density, colour, or even chemical substance canbe modelled throughout the given shape.
Implicit scene modelling generates an augmented reality scene (i.e. sim-ilar to a theater stage) with distinct entities interacting with one another,based on an ontological description of the real-world model for the generatedcontent.
In the following sections we have included implicit shape modelling andimplicit material modelling for the purpose of providing a stepping stonetowards implicit scene modelling.My preferred method of investigation is thatof extending the reader’s understanding of a certain topic by introducing newcontent in a step-by-step fashion using analogies to known topics.
141

8.3.1 Implicit Shape Modelling
The field of implicit geometric modelling is complex and there are severaldecades of research that went into the investigation of the process of gen-erating shapes based on a process of sampling geometrical primitive-derivedfields.
An early paper on the topic describes these generated shapes as, “a surfaceof constant value in a scalar field over three dimensions.” [87] The complex-ity of the shapes can be enhanced by using advanced techniques, such assketch-based modelling with BlobTrees. Using such an approach, “sketch-based modelling operations are defined that combine [...] basic shapes usingstandard blending and CSG operators.” [88]
There are countless resources that approach the various facets of implicitgeometric modelling, but for my conceptual purposes, let’s settle on a fewfundamental terms:
� Primitive - a geometric shape with a known position and orientationin space.
� Field - the space adjacent to a primitive that extends and permeatesthe surrounding space.
� Sampling value - A certain value at which the field around a primitiveis sampled.
� Operation - a technique that combines primitives and/or fields to gen-erate desired shapes using a system of operators.
8.3.2 Implicit Material Modelling
In the traditional sense, the point of implicit modelling is to create shapes us-ing geometric operations through primitives and fields that permeate space.This kind of representation is suitable for the process of computer render-ing, where shapes are immaterial. Textures can be used to imitate materialproperties, but are ultimately still immaterial.
In implicit material modelling I look closely at additional properties thataugment a given shape. For this purpose, I can explore the vision that theprimitives and fields contained in space are only one layer of many.
Shape is a most obvious object property and it is an excellent place tostart; I shall call this Layer 1.
142

When I consider objects in the real world, however they consist of mat-ter and therefore have material properties, like density, colour, or chemicalsubstance.
Since rendering only approaches immaterial content, I need to look atdifferent processes to see potential applications, with the most obvious onebeing 3D printing. For 3D printing, density is an important property toconsider.
Let’s assume I have a simple pill-like shape and I want to distributea known volume of plastic throughout the shape. I could use current 3Dprinting techniques and allow an algorithm to distribute the plastic accordingto a strategy, usually concatenating layers with hexagonal or other shapes,like we find in a honey-comb.
I propose envisioning a density layer (Layer 2) with its own field, a densityfield based on density primitives (i.e. unrelated to the shape primitives). Icould distribute the plastic homogeneously by assigning a constant value (e.g.1) in the density field for the entire space it occupies. When I 3D print thisconfiguration, I would see a completely full shape with no gaps inside.
Now let’s suppose I use a step function over the density field. Everythingon the left side of the axis of the pill is 1 and everything on the right side is0. The shape of the pill remains untouched, but the material density is 1 onthe left and 0 on the right. When I 3D print, I get half a pill.
If I reduce the density value from 1 to 0.95 and 3d print again, I wouldsee air pockets start to appear randomly because the individual blobs ofplastic would solidify in random shapes in the closest position to where itwas injected.
Next, let’s use a grid and sample the density field at various points wherethe shape meets the grid. Let’s assume that the grid will match the printingresolution of the 3D printer. So, now I can create a density gradient, goingfrom the leftmost point on the pill to the rightmost with values ranging from0.25 to 0.75, respectively. Plastic is ideal because it can stretch a volume ofmaterial over a shorter or longer distance to match our density specifications.
There is great freedom in generating structures based on the density fieldsimply by combining the grid points in different ways. I can slice it and createsequential 2D structures. I can sample it by grid point adjacency and createskeletal tetrahedral structures. Or if I were to print in graphite, I could useplanar structures with varying orientations.
Using similar methods to CSG, I can distribute density to create the ma-terial equivalent of a peanut shell, hollow on the inside and with a particular
143

material distribution throughout the shell.Seeing what I can do with density alone, let’s consider more potential lay-
ers. Colour is a material property that can be modelled based on colour prim-itives, fields, and operators. Chemical composition is another one. Printingin 3D with soluble and insoluble substances offers great shape freedom andsolves the problem of printing supports to prevent sagging.
The most important point we are trying to make, however, is that shapeis only the beginning, and that object properties can be modelled using fieldsand primitives as part of a layered model.
8.3.3 Implicit Scene Modelling
In the previous two sections, I talked about implicit modelling from theperspective of modelling objects by controlling shape and material properties,respectively. I did so in order to create a conceptual stage against which Icould introduce our proposal for an implicit modelling approach to scenegeneration.
Our augmented reality stage will be designed to fulfill the purpose ofcompiling virtual content to be attached to video content captured in thereal world.
I have already encountered the most common scene entities in Chapter6.
In section 8.3.1 I worked with one layer comprised of a scalar field togenerate the shape of an object.
In the following section, 8.3.2, I started adding subsequent layers com-prised of their own scalar fields to add material properties (e.g. density,colour, substance) to a given shape.
For the purpose of creating an AR scene using the same multi-layeredparadigm as used before, I propose a dichotomy of understanding and repre-sentation between the real-world and our virtual content.
The real-world experience as captured by a video device is a samplingof the manifold of localized existence. The captured video content, howeveris only a recount of the elements that fit within the limits of the capturingdevice. A video camera cannot capture the smell of a meadow or the strengthof the wind. But, if we had a thermal camera, we could see the temperatureof the elements in the scene.
I am trying to add information onto the visible spectrum captured videostream by synchronizing virtual content with the video feed. Some layers
144

will be represented by scalar fields (e.g. temperature, atmospheric pressure,depth, etc.), while other will use vector fields (e.g. wind, current, boat heel,etc.)
The current model used for describing the scene elements and populatingthe scene is explicit. Scene elements like wind particles or debris on thesurface on the water are predetermined to occupy a certain partition of thescene space, in which they are animated using real-time data.
My proposal for a future research direction is to establish an implicitsystem that would create a higher level of abstraction to describe the locationof various scene elements based on the type of their underlying ontologicalnature.
For example, both the particles used for the wind and the objects usedas debris on the water are particle clouds. The wind particles occupy the 3Dshape described by a cuboid. The debris particles occupy a 2D shape spacedescribed by a plane that also coincides with the internal system representa-tion of the idealized surface of the water.
Both the wind particles and the debris particles are implementations ofa proposed type of scene primitives, particle cloud. The scene primitiveparticle cloud has a relation to shape primitives (see 8.3.1) as well as tomaterial primitives (see 8.3.2). The material primitives would not be usedand do not encode information literally, as in Implicit Material Modelling,but instead they determine how the AR scene is rendered. If I look at theway I try to visualize the wind, I see that the abstract particle cloud getsinstantiated as inhabiting a certain cuboid, and that the particles will bebased on maple leafs: i.e. they have the mass, appearance and behaviour ofa maple leaf.
There is still a long way to go in this direction of Implicit Scene Modellingfor AR purposes, and I hope I will see interest in the field in the future.
145

Chapter 9
Conclusion
There are significant efforts towards researching AR-based marine naviga-tional awareness solutions, and there is an undeniable overlap between theseand our solution. This overlap is mostly inherited from the use of an ARparadigm: perspectives, interface elements, registered content, etc.
There are, however, important differences: while most of the competingresearch efforts focus on optimizing the visual appearance and position ofvarious elements as part of an interface [37], our research focuses more ona conceptual analysis and exploration of the nature, quality, and purposeof the content being displayed, while also attempting to find a close matchbetween the visual and conceptual content of the AR scene.
The jump from a 2D environment to an AR paradigm can be seen inRaymarine’s ClearCruise AR product [89], as well as other research projects(see Chapter 2). The information that is now being displayed using an ARperspective is almost exactly the same information that the chart-plotteruses in the 2D view mode. It’s still numbers, arrows, and windows all theway, but this time overlayed on a live video feed from a camera. This kind ofincipient obvious transition into AR is a natural development. Since most ofthe competing solutions are targeted at commercial shipping, it makes senseto take a gradual approach which doesn’t alienate existing users.
We, on the other hand, have focused on sailboat operation, which hasdifferent priorities.
� Propulsion. A sailboat is propelled using sails; this means that theinterface features a strong focus on visual aids to understanding thebehaviour of the wind and tidal currents.
146

� Dangers. A sailboat, when compared to powerboats, faces differentchallenges and dangers (e.g. excessive heeling and restricted manoeu-vrability); the interface provides information about these dangers inreal time.
� Visual experience. Our interface includes visual features that pro-vide information in a natural style, without the need to resort to nu-merical or abstract representations.
Since this is one of the first research projects earmarked for sailboat op-eration visualization, I undertook a thorough investigation of the underlyingproblem. I also had the luxury of starting from scratch and not being re-stricted by existing tradition or inertia. It is this freedom to innovate thatallowed me to experiment with different electronic, conceptual, and visualcomponents in my system. Most notably, I feel that the pseudo-natural ap-pearance as well as the use of particle clouds and distorted content stand outagainst the general contemporary tendency of marine visualization research.
9.1 Contributions
9.1.1 Sailboat Control Scenarios
[C10] I conducted an in-depth analysis of the particular elements that com-prise feedback loops in the process of sailboat operation, in three differentscenarios (Chapter 3). These scenarios are idealized and exaggerated in or-der to support my assumption that implementing an AR visual interface isfeasible. In reality, there are endless scenarios in the spectrum that meetsparticular vessel-control needs.
9.1.2 Preliminary Designs
[C11] I created a recount of the three design phases (or iterations) my projectwent through (Chapter 4). First I pursued sailboat automation, followedby semi-autonomous sailboat control, and finally settled on marine AR vi-sualization. The chapter is presented from a design perspective, within achronological/conceptual progression.
147
9.1.3 Sailboat Visualization System
[C1] I developed a vehicular visualization system featuring a network of de-vices, instrument interfaces, imaging capabilities, sensor readings, process-ing and broadcasting capabilities (Chapter 5). As part of the system, [C2]the telemetry and internal units feature an array of sensors not commonlypresent on sailboats (Sections 5.2.1, 5.2.4). [C3] The system also supportsan immersive AR interface (Section 5.5).
9.1.4 Augmented Reality Interface
[C4] I designed an AR interface featuring a scene made up of entities thatcorrelate with geo-physical phenomena that form the sailing environment(Chapter 6). [C7] I discuss the nature of these entities and of suitable po-tential visualization approaches (Chapter 6). [C12] I classified the differentpotential layers of abstraction for sailing phenomena (Section 6.4) and later[C13] discussed the prospect of using visual aids to achieve contextual visualawareness (Sections 6.4.5, 6.4.6).
9.1.5 Systematic Background Investigation
[C8] I devised a systematic approach to investigating entities and aspectsvital to the process of sailing (Sections 7.3.1, 7.3.2). [C5] This approach wasinspired by design-thinking and follows a conceptual flow that starts withobservations that are used to gather insights. Next I see the emergence ofconceptual and design principles that lead to features and ultimately systemspecifications. [C6] I created an interaction/correlation model for these enti-ties (Section 7.7), by building a [C9] graph-based flow matrix that keeps trackof the extensive number of inter-dependencies among observations, insights,principles, and features (Section 7.7)
9.2 Limitations
The research project in this dissertation can be aptly described by termssuch as interdisciplinary or composite. Its scope spans a vast spectrum ofknowledge, starting with practical aspects like sailing, soldering electronicsboards, or building mechanical implements. Then, it ventures into more tech-nical aspects like data sampling, information processing, PID configurations,
148
frame interpolation for animation, etc. Next, I derive theoretical aspectsfrom topics like design-thinking, philosophy, and cognitive science. And last,I deal with implementation aspects like running wires, configuring a network,writing thousands of lines of code, and drawing up an AR 3D visual scene.
I used existing resources to the extent possible. I adopted ideas fromrecent research in many areas. I, however, had to break new ground in manyareas, too. I evaluated many of the features I created from an autobiograph-ical perspective to speed up the general system development.
I am aware that user studies on various aspects presented here would beof great advantage and I am planning to undertake several user studies infuture projects.
149
Appendix A. Sea-trial Report
This document is a recount of the findings collected during the sea trial datedMay 16, 2015.
During the sea trial, I exhaustively documented the sequence of tasksneeded to prepare the vessel, launch it, sail for a routine stretch, round adangerous day-marker under sail, and safely return home.
The sea conditions were fair, however the southwesterly wind was rel-atively strong, ranging between 10 and 20 knots, with strong gusts beinginfluenced by various shore and land features. Under these conditions, theskipper had to devote a significant amount of attention to the operation ofthe vessel as high speeds (4-7 kn) were commonplace. At these speeds, onlyan experienced skipper can cope with the vast amount of prediction thatneeds to be calculated, both in terms of forecasting the behaviour of theenvironment as well as the behaviour of the vessel.
The route I chose started and ended in Cadboro Bay at the Royal VictoriaYacht Club. After successfully hoisting the sails, the route followed theshoreline south, in the direction of Oak Bay. Just before Cattle Point, inFlotsam Cove, the skipper was asked to ignore the marine safety warningsigns and round a day-marker on the danger side while under sail.
Please see Figure 1 for more details about the recorded route.I did this at high tide, allowing for a clearance of at least 2m under the
keel and a distance of about 10m between the day-marker and the closestshore feature. This task was chosen as a deliberately difficult manoeuvre totest the attention span of the skipper and to push him to his limits.
During the sea trial, I used a voice recorder to capture a detailed descrip-tion of the tasks as I performed them.
In the Observation section, I recorded several observations and notes.The subsequent Transcript section is a literal, detailed recount of the
voice recording.
150

Figure 1: Sea Trial Route May 16
151

Even though the original recording intermingled the tasks and observa-tions, I split these into their respective sections, for clarity.
.1 Observations
In this section, I recorded the notes and observations I made during the testtrials. Because I wanted to capture not only the content, but also the generalfeeling of the moment, I kept the following observations unaltered.
“If I had a wind instrument, I would know where the wind iscoming from without having to look up at the top of the mast allthe time.”
“I am inspecting the shape of the sails anyway, so checking up onthe wind indicator is convenient.”
“The GPS [chart-plotter] is an advantage; it helps me have anidea about where I am on the map [relative to the shore].”
“On a small boat, a depth sounder is very important, especiallyaround familiar shores.”
“It’s hard to control the boat while winching. An autopilot wouldbe a great advantage. [...] I have to decide whether to continuetrimming the jib or to steer.”
“One hand on the tiller, another one on a line, I have to let go ofthe tiller to do the winch.”
“I can only look at the chart for 1-2 seconds, things are happeningvery fast.”
“Checking the wind, sails, water, current, steering and everythingelse is all automatic. I’m aware only of the planning process forthe rounding strategy.”
“I’m picking a range to visually determine the motion.”
“I’m preparing the tack: I’m looking at the windward sheet, atthe leeward sheet, grab the handle, helm’s alee.”
“I don’t have time to look at the GPS, I’m only monitoring thedepth while getting ready to tack.”
152

“From the winching position, I can’t see the wind indicator. I seethe sails, but I’m guessing the wind direction.”
“While heeling over 20deg, it would be great to see the wind.”
“I see a sailboat going very fast against the background of ChathamIsland, which makes me think there’s a strong current there.”
“Not enough time to do important tasks and I chose them by howurgent they were while guessing a lot.”
“I left the tiller unattended, even when it was steering in thewrong direction because I was trimming the jib. It was moreimportant.”
.2 Transcript
This section represents a recount of the voice notes recorded as part of theexperiment.
In several instances, I used short code-words to denote a complex ac-tion. For example, I used the word nogo to denote checking the immedi-ate surroundings for mooring balls, other vessels, shore features, man-madestructures, debris, or any other kind of obstruction or hazard. In the cur-rent transcript, however, I replaced these code-words with longer and moredescriptive wording.
The transcript is partitioned into a series of sections, depending on thestrategy I employed or the outcome I desired.
Pre-launch Sequence
� Everything properly stowedaway (cabin/cockpit/decks)
� Lift and drop the engine in thewater
� Switch to Battery 1
� Pull up engine latch
� Attach throttle cable
� Prime the hose bulb
� Pull choke
� Start the engine by turning key
� Push choke
� Shut forward hatch
� Release jib sheets
153

� Remove mainsail cover
� Attach the main halyard
� Remove headsail cover
� Attach jib halyard
� Attach jib sheets
� Remove cover for the depthsounder
� Turn on depth sounder from in-struments panel
� Cast off the mooring lines
Post-launch Sequence
� Connect rail
� Secure mooring lines
� Stow fenders in lazarette
� Choose a course (downwind)
� Locate mooring balls and boats
ahead
� Steer through the mooring field
� Find a spot with noboats/moorings and leeway tohead upwind for sails deploy-ment
Hoist Mainsail
� Release mainsail straps
� Release the main sheet
� Release the vang
� Set heading upwind
� Secure tiller using a line
� Set engine throttle high enoughto stay on course
� Grab winch handle
� Hoist the mainsail
� Cleat main halyard
� Centre the traveller
� Trim main sheet
� Trim vang
Plan Heading
� Scout horizon
� Locate nearby boats, mooring
balls, and shore features
� Check wind direction
154

� Check sail trim
� Check waves for wind gusts
� Plan course with reference to
landmarks
� Steer course (steer)
� Trim mainsheet
Hoist Headsail
� Hoist jib halyard
� Check on stuck sail
� Locate winch handle
� Tighten halyard using thewinch
� Cleat halyard
� Secure winch handle
Lift Engine
� Turn off engine
� Release throttle cable
� Push down latch
� Lift engine up until it locks inthe diagonal position
Sail
� Locate nearby boats, mooringballs, shore features and otherhazards
� Check wind direction
� Check sail trim
� Trim headsail sheets
� Trim mainsheet
� Wind shift
� Trim headsail sheets
� Trim mainsheet
� Wind shift
� Trim mainsheet
� Check waves for wind gusts
� Check wind direction
� Locate nearby boats, mooringballs, shore features and otherhazards
� Check sail trim
� Steer course
� Wind gust
155

� Trim mainsheet
� Trim headsail sheets
� Steer course
� Look at the chart
� Locate nearby boats, mooringballs, shore features and otherhazards
� Check waves for wind gusts
� Check wind direction
� Check sail trim
� Steer course
� Trim mainsheet
� Trim headsail sheets
� Look at the chart
� Locate nearby boats, mooringballs, shore features and otherhazards
� Check waves for wind gusts
� Check wind direction
� Check sail trim
� Trim mainsheet
� Trim headsail sheets
� Steer course
� Check wind direction
� Check waves for wind gusts
� Check sail trim
� Look at the chart
� Trim mainsheet
� Observe the heel of the boat
� Locate winch handle
� Secure winch handle
� Steer course
� Alter course to avoid crab traps
� Locate winch handle
� Trim headsail sheets
� Trim mainsheet
� Observe the heel of the boat
� Look at the chart
� Wind gust
� Check sail trim
� Trim mainsheet
� Trim headsail sheets
� Observe the heel of the boat
� Check sail trim
� Locate winch handle
� Observe the heel of the boat
� Trim mainsheet
� Look at the chart
� Wind shift
� Check tides
156

Daymarker Rounding
� Plan rounding the day marker(take wind gusts and shifts,shore, currents, and drift intoaccount)
� Memorize the passage
� Automatic: Locate nearbyboats, mooring balls, shore fea-tures and other hazards, wind,sail, water, steer, main
� Develop rounding strategy
� Tack
� Trim mainsheet
� Jib trim (find winch handle,move to lower side, trim jib, se-cure handle, move to the highside)
� Lower headsail to reduce speedfor rounding
� Snagged a line with a foot
� Look at the chart
� Tack
� Wind dropped down
� Hoist jib
� Tack
� Observe near rocks
� Tack
� Check wind direction
� Trim mainsheet
� Trim headsail sheets
� Tack
� Monitor depth
� Heeling a lot
� Monitor day marker
� Depth
� Look at the chart
� Trim mainsheet
� Wind gust
� Monitor day marker
� Depth
� That’s it
� Look at the chart
� Change course
� Jibe
� Trim mainsheet
� Trim headsail sheets
� Locate nearby boats, mooringballs, shore features and otherhazards
157

� Check waves for wind gusts
� Horizon
� Paddleboarder
� Clouds, weather estimate
Sail Back
� Beam reach
� Automatic sailing most of the
time
� Thinking about other things
158

Appendix B. Observations
In the course of my project, I collected countless observations in many forms.I used these observations to derive insights for the design process.
I’ve listed a few of these observations below in no particular order. I’veidentified the contributors by name – unless I was the contributor.
“The wind particles shouldn’t only be in front of you, but allaround.”
Senior sailor with moderate skills
“The model shouldn’t be too idealized, i.e. too abstract”
“Real time drift (current) is interesting [to experienced sailors],especially the behind the scenes computation. Maybe you canadd more information about how it’s performed.”
Senior sailor with lots of off-shore experience
“Experienced sailors don’t see the need for [the system], they arehappy with the current tech”
“Arrows [instead of particles] (abstract representations) are muchmore attractive to older sailors, who are used to similar graphicalrepresentations.”
Senior sailor with lots of off-shore experience
“Pseudo-natural vs. abstract representations should not be theobvious design choice. Let’s not put the cart before the horse;just because I thought particles looked cool, it doesn’t necessarilymean they’re also intuitive to everybody.”
159

“Don’t you scientist-types use rubber ducks for research!? I heardin the news about a NASA project in the arctic with ducks.”
Sailing enthusiast
“Arrows should be able to change [in] length or width”
Senior sailor with moderate skills
“Was overwhelmed at first, said ’send it to me to use it,’ willingto give it a try”
Senior sailor with lots of off-shore experience
“Ways to visualize current: kelp, buoy, day marker, etc.”
“Camera is a massive bonus, you can see ahead of the boat evenwhen down below”
Senior sailor with lots of off-shore experience
“Now, say you’re to somehow use the radar like they have ’emsonar contraptions, that’d be somethin’ actually useful, see?!”
Scruffy old sailor and shipwright
“Literally seeing the effects of the wind is easier to process thanimagining the wind from a description via a typical wind instru-ment”
“Aggregating several forces (wind, current, speed) is hard toimagine, but easy to understand if visually available”
“Look into AIS integration, that’s a major helper in open ocean.Keeps ’em massive ships away.”
Off-shore sailor
“A combination of arrows and natural elements is preferable tosome sailors”
160

“There’s no stopping on a boat, dude; everything keeps movingall the time. You can’t like pull on the side of the road and stopall chill-like, like in a car. And then there’s mad gusts, and waves,and such. Jibing is hella-crazy, the boom goes, like whoosh, kah-pow! It’ll slash your melon right off!”
Teenager attending the sailing school
“Virtual objects should have a similar appearance and behaviourto real objects, but with a twist - a significant difference thatmakes it obvious that they are not real”
“Information encoded in non-visual ways is significantly morecumbersome to understand.”
And last, when asked what he thinks about the system, this gentlemanreplied thusly: (we’re still not completely certain what it means)
“[...]be sure to be shiverin’ yer timbers and bucklin’ yer swashesshould you be rollin’ about the hoggin’ or careenin’ ashore, lestthe brethren of the sea address yea that day, aaarrrggghhhh!
Spread the word ’n don’t be forgettin’ to Stick to the Code!”
Rambunctious, wise-cracking, drunken sailor on Sept 19, the In-ternational talk like a pirate day
161

Bibliography
[1] Julie Carmigniani and Borko Furht. “Augmented reality: an overview”.In: Handbook of augmented reality. Springer, 2011, pp. 3–46.
[2] Iain MacIntyre. “Raymarine: Electronics forged for tough marine con-ditions”. In: Ausmarine 35.1 (2012), p. 50.
[3] Benito Nimi Ponappan. “3D visualization of sailing regatta in realtime”. PhD thesis. Kaunas University of Technology, 2015.
[4] Kyong-Ho Kim and Kwang-Yun Wohn. “Effects on productivity andsafety of map and augmented reality navigation paradigms”. In: IEICETRANSACTIONS on Information and Systems 94.5 (2011), pp. 1051–1061.
[5] David C Foyle, Anthony D Andre, and Becky L Hooey. “Situationawareness in an augmented reality cockpit: Design, viewpoints andcognitive glue”. In: Proceedings of the 11th International Conferenceon Human Computer Interaction. Vol. 1. 2005, pp. 3–9.
[6] A Millward. “A study of the forces exerted by an oarsman and theeffect on boat speed”. In: Journal of sports sciences 5.2 (1987), pp. 93–103.
[7] Mel Slater and Sylvia Wilbur. “A framework for immersive virtualenvironments (FIVE): Speculations on the role of presence in virtualenvironments”. In: Presence: Teleoperators & Virtual Environments 6.6(1997), pp. 603–616.
[8] Mario Gutierrez, Frederic Vexo, and Daniel Thalmann. Stepping intovirtual reality. Springer Science & Business Media, 2008.
[9] Helene Valladas, Jean Clottes, J-M Geneste, et al. “Palaeolithic paint-ings: evolution of prehistoric cave art”. In: Nature 413.6855 (2001),p. 479.
162

[10] Christopher Chippindale and Paul SC Tacon. The archaeology of rock-art. Cambridge University Press, 1998.
[11] Richard Wagner. Das Kunstwerk der Zukunft. Wigand, 1850.
[12] Juliet Koss. “Modernism after Wagner”. In: Leonardo Reviews Quar-terly 2.01— 2012 37 (2010).
[13] Matthew Wilson Smith. The total work of art: from Bayreuth to cy-berspace. Routledge, 2007.
[14] Frederic Spotts. Bayreuth: A history of the Wagner Festival. Yale Uni-versity Press, 1994.
[15] Newton Lee. “From a Pin-up Girl to Star Trek’s Holodeck: ArtificialIntelligence and Cyborgs”. In: Digital Da Vinci. Springer, 2014, pp. 1–21.
[16] Morton L Heilig. Sensorama simulator. US Patent 3,050,870. Aug.1962.
[17] Ivan E Sutherland. “Sketchpad a man-machine graphical communica-tion system”. In: Simulation 2.5 (1964), R–3.
[18] Ivan E Sutherland. “The ultimate display”. In: Multimedia: From Wag-ner to virtual reality (1965), pp. 506–508.
[19] Frederick P Brooks Jr, Ming Ouh-Young, James J Batter, et al. “ProjectGROPEHaptic displays for scientific visualization”. In: ACM SIGGraphcomputer graphics. Vol. 24. 4. ACM. 1990, pp. 177–185.
[20] Ivan E Sutherland. “A head-mounted three dimensional display”. In:Proceedings of the December 9-11, 1968, fall joint computer conference,part I. ACM. 1968, pp. 757–764.
[21] Shachak Peeri, Chukwuma Azuike, Lee Alexander, et al. “Beyond theChart: The use of Satellite Remote Sensing for Assessing the Adequacyand Completeness Information”. In: Niagara Falls, Ontario, Canada,May 2012. url: www.chc2012.ca.
[22] Rick Brennan Matthew D. Plumlee Roland Arsenault and Colin Ware.“Chart of the Future Project: Maximizing Mariner Effectiveness throughFusion of Marine & Visualization Technologies”. In: Washington, DC,Nov. 2004. url: www.chc2012.ca.
163

[23] M. May. “Cognitive aspects of interface design and human-centeredautomation on the ship bridge: the example of ARPA/ECDIS integra-tion”. In: Human Int erfaces in Control Rooms, Cockpits and CommandCentres, 1999. International Conference on. June 1999, pp. 394–399.doi: 10.1049/cp:19990222.
[24] O. Levander. “oX Bridge Concept Press Release”. In: [Online; accessed24-May-2015]. 2014.
[25] Ghada Moussa, Essam Radwan, and Khaled Hussain. “Augmented Re-ality Vehicle system: Left-turn maneuver study”. In: TransportationResearch Part C: Emerging Technologies 21.1 (2012), pp. 1–16. issn:0968-090X. doi: http://dx.doi.org/10.1016/j.trc.2011.08.005.url: http://www.sciencedirect.com/science/article/pii/
S0968090X1100115X.
[26] SeungJun Kim and Anind K. Dey. “Simulated Augmented RealityWindshield Display As a Cognitive Mapping Aid for Elder DriverNavigation”. In: Proceedings of the SIGCHI Conference on HumanFactors in Computing Systems. CHI ’09. Boston, MA, USA: ACM,2009, pp. 133–142. isbn: 978-1-60558-246-7. doi: 10.1145/1518701.1518724. url: http://doi.acm.org/10.1145/1518701.1518724.
[27] DWF Van Krevelen and R Poelman. “A survey of augmented realitytechnologies, applications and limitations”. In: International Journalof Virtual Reality 9.2 (2010), p. 1.
[28] S. J. Henderson and S. Feiner. “Evaluating the benefits of augmentedreality for task localization in maintenance of an armored personnelcarrier turret”. In: Mixed and Augmented Reality, 2009. ISMAR 2009.8th IEEE International Symposium on. Oct. 2009, pp. 135–144. doi:10.1109/ISMAR.2009.5336486.
[29] Ronald T Azuma. “The challenge of making augmented reality workoutdoors”. In: Mixed reality: Merging real and virtual worlds (1999),pp. 379–390.
[30] PC Thomas and WM David. “Augmented reality: An application ofheads-up display technology to manual manufacturing processes”. In:Hawaii international conference on system sciences. 1992, pp. 659–669.
164
[31] Adam L Janin, David W Mizell, and Thomas P Caudell. “Calibra-tion of head-mounted displays for augmented reality applications”. In:Proceedings of IEEE Virtual Reality Annual International Symposium.IEEE. 1993, pp. 246–255.
[32] Paul Milgram and Fumio Kishino. “A taxonomy of mixed reality visualdisplays”. In: IEICE TRANSACTIONS on Information and Systems77.12 (1994), pp. 1321–1329.
[33] Wayne Piekarski and Bruce Thomas. “ARQuake: the outdoor aug-mented reality gaming system”. In: Communications of the ACM 45.1(2002), pp. 36–38.
[34] Stefan Marks, Javier E Estevez, and Andy M Connor. “Towards theHolodeck: fully immersive virtual reality visualisation of scientific andengineering data”. In: Proceedings of the 29th International Conferenceon Image and Vision Computing New Zealand. ACM. 2014, pp. 42–47.
[35] Alien. 1979.
[36] Olivier Hugues, Jean-Marc Cieutat, and Pascal Guitton. “An experi-mental augmented reality platform for assisted maritime navigation”.In: Proceedings of the 1st Augmented Human International Conference.2010, pp. 1–6.
[37] OH Jaeyong, Sekil Park, and Oh-Seok Kwon. “Advanced navigationaids system based on augmented reality”. In: International Journal ofe-Navigation and Maritime Economy 5 (2016), pp. 21–31.
[38] E. Wisernig, T. Sadhu, C. Zilinski, et al. “Augmented Reality Visu-alization for Sailboats (ARVS)”. In: 2015 International Conference onCyberworlds (CW). Oct. 2015, pp. 61–68. doi: 10.1109/CW.2015.74.
[39] T. Sadhu, A. B. Albu, M. Hoeberechts, et al. “Obstacle Detection forImage-Guided Surface Water Navigation”. In: 2016 13th Conferenceon Computer and Robot Vision (CRV). June 2016, pp. 45–52. doi:10.1109/CRV.2016.34.
[40] Jay Jantz, Adam Molnar, and Ramses Alcaide. “A brain-computerinterface for extended reality interfaces”. In: ACM SIGGRAPH 2017VR Village. 2017, pp. 1–2.
165

[41] Henry Chen, Austin S Lee, Mark Swift, et al. “3D collaboration methodover HoloLensTM and SkypeTM end points”. In: Proceedings of the3rd International Workshop on Immersive Media Experiences. 2015,pp. 27–30.
[42] Shunichi Kasahara and Jun Rekimoto. “JackIn: integrating first-personview with out-of-body vision generation for human-human augmenta-tion”. In: Proceedings of the 5th Augmented Human International Con-ference. 2014, pp. 1–8.
[43] Steffen Gauglitz, Benjamin Nuernberger, Matthew Turk, et al. “World-stabilized annotations and virtual scene navigation for remote collab-oration”. In: Proceedings of the 27th annual ACM symposium on Userinterface software and technology. 2014, pp. 449–459.
[44] Pedro Lopes, Sijing You, Lung-Pan Cheng, et al. “Providing haptics towalls & heavy objects in virtual reality by means of electrical musclestimulation”. In: Proceedings of the 2017 CHI Conference on HumanFactors in Computing Systems. 2017, pp. 1471–1482.
[45] Mark A Neerincx. “Cognitive task load analysis: allocating tasks anddesigning support”. In: Handbook of cognitive task design 2003 (2003),pp. 283–305.
[46] Jennifer Rowley. “The wisdom hierarchy: representations of the DIKWhierarchy”. In: Journal of information science 33.2 (2007), pp. 163–180.
[47] Tejinder K Judge and Carman Neustaedter. Studying and designingtechnology for domestic life: lessons from home. Morgan Kaufmann,2014.
[48] Carman Neustaedter and Phoebe Sengers. “Autobiographical design:what you can learn from designing for yourself”. In: interactions 19.6(2012), pp. 28–33.
[49] Robert V Bullough Jr and Stefinee Pinnegar. “Guidelines for qualityin autobiographical forms of self-study research”. In: Educational re-searcher 30.3 (2001), pp. 13–21.
[50] Yasamin Heshmat, Carman Neustaedter, and Brendan DeBrincat. “Theautobiographical design and long term usage of an always-on videorecording system for the home”. In: Proceedings of the 2017 Confer-ence on Designing Interactive Systems. 2017, pp. 675–687.
166

[51] Audrey Desjardins and Aubree Ball. “Revealing tensions in autobio-graphical design in HCI”. In: proceedings of the 2018 designing inter-active systems conference. 2018, pp. 753–764.
[52] William W Gaver. “The video window: my life with a ludic system”.In: Personal and Ubiquitous Computing 10.2-3 (2006), pp. 60–65.
[53] Audrey Desjardins and Ron Wakkary. “Living in a prototype: A recon-figured space”. In: Proceedings of the 2016 CHI Conference on HumanFactors in Computing Systems. 2016, pp. 5274–5285.
[54] Michael R Fine. Beta testing for better software. John Wiley & Sons,2002.
[55] Roger E Kirk. “Experimental design”. In: Handbook of Psychology, Sec-ond Edition 2 (2012).
[56] Brian Wyvill. The Second Gate. Thunderchild Publishing, 2018.
[57] Moheb Sabry Aziz et al. “Biomimicry as an approach for bio-inspiredstructure with the aid of computation”. In: Alexandria EngineeringJournal 55.1 (2016), pp. 707–714.
[58] Michael Lewrick, Patrick Link, and Larry Leifer. The design thinkingplaybook: Mindful digital transformation of teams, products, services,businesses and ecosystems. John Wiley & Sons, 2018.
[59] Harold F Dorn. “Philosophy of inferences from retrospective studies”.In: American Journal of Public Health and the Nations Health 43.6 Pt 1(1953), pp. 677–683.
[60] Nicola GUARINO, Giancarlo GUIZZARDI, and John MYLOPOU-LOS. “On the Philosophical Foundations of Conceptual Models”. In:Information Modelling and Knowledge Bases XXXI 321 (2020), p. 1.
[61] C Maria Keet. “Introduction to part-whole relations: mereology, con-ceptual modelling and mathematical aspects”. In: KRDB ResearchCentre Technical Report KRDB06-3 (Tutorial reader), Faculty of Com-puter Science, Free University of Bozen-Bolzano, Italy 2 (2006).
[62] Roger Martin. “Design thinking: achieving insights via the “knowledgefunnel””. In: Strategy & Leadership (2010).
[63] Hugo A Myers et al. “Theory of sailing applied to ocean racing yachts”.In: Marine Technology and SNAME News 12.03 (1975), pp. 223–242.
167

[64] Hadi Saoud, Minh-Duc Hua, Frederic Plumet, et al. “Modeling andcontrol design of a robotic sailboat”. In: Robotic Sailing 2013. Springer,2014, pp. 95–110.
[65] William C Lasher and Logan S Flaherty. “CFD analysis of the surviv-ability of a square-rigged sailing vessel”. In: Engineering Applicationsof Computational Fluid Mechanics 3.1 (2009), pp. 71–83.
[66] Ian Speller. Understanding naval warfare. Routledge, 2018.
[67] Ernest Shackleton. South: The last Antarctic expedition of Shackletonand the Endurance. Bloomsbury Publishing, 2014.
[68] Toshifumi Fujiwara, Michio Ueno, and Tadashi Nimura. “Estimationof wind forces and moments acting on ships”. In: Journal of the Societyof Naval Architects of Japan 1998.183 (1998), pp. 77–90.
[69] Alexandra Witze. “Ice in motion: As frozen lands disintegrate, re-searchers rush to catch the collapse”. In: Science News 179.7 (2011),pp. 22–25.
[70] Donovan Hohn. Moby-Duck: The True Story of 28,800 Bath Toys Lostat Sea & of the Beachcombers, Oceanograp hers, Environmentalists &Fools Including the Author Who Went in Search of Them. Penguin,2011.
[71] Thor I Fossen. Handbook of marine craft hydrodynamics and motioncontrol. John Wiley & Sons, 2011.
[72] A Rolnick and W Bles. “Performance and well-being under tilting con-ditions: the effects of visual reference and artificial horizon.” In: Avia-tion, space, and environmental medicine (1989).
[73] WG Peng, LB Hong, and Fang Fang. “Effect of Long Term Voyage onAnxiety, Depression and Sleep Quality of Sailors in Naval Ship and Nu-clearpowered Submarine”. In: Journal of Preventive Medicine of Chi-nese People’s Liberation Army 6 (2002), pp. 418–421.
[74] Marcus Aurelius. The Meditations of Marcus Aurelius. Vol. 3. Rout-ledge, 1894.
[75] Angela Potochnik. “The diverse aims of science”. In: Studies in Historyand Philosophy of Science Part A 53 (2015), pp. 71–80.
[76] Jane R Camerini. “Evolution, biogeography, and maps: An early his-tory of Wallace’s Line”. In: Isis 84.4 (1993), pp. 700–727.
168

[77] John Kulvicki. “Knowing with images: Medium and message”. In: Phi-losophy of Science 77.2 (2010), pp. 295–313.
[78] Benjamin Sheredos, Daniel Burnston, Adele Abrahamsen, et al. “Whydo biologists use so many diagrams?” In: Philosophy of Science 80.5(2013), pp. 931–944.
[79] Adina L Roskies. “Are neuroimages like photographs of the brain?” In:Philosophy of Science 74.5 (2007), pp. 860–872.
[80] Donald D Hoffman and Manish Singh. “Salience of visual parts”. In:Cognition 63.1 (1997), pp. 29–78.
[81] Carl Bybee and Ashley Overbeck. “Homer Simpson explains our post-modern identity crisis, whether we like it or not: media literacy afterThe Simpsons”. In: Studies in Media & Information Literacy Education1.1 (2001), pp. 1–53.
[82] Samuel Taylor Coleridge. Biographia literaria, or, Biographical sketchesof my literary life and opinions. Vol. 7. Princeton University Press,1984.
[83] Channel 4 - Drop the dead donkey. Teddy Bear in War Zone. Youtube.2007. url: https://youtu.be/sLZ1LT0kd-4.
[84] Michael J French. “Insight, design principles and systematic invention”.In: Engineering Design Synthesis. Springer, 2002, pp. 19–34.
[85] EDT Lupton and Ellen Lupton. Graphic design thinking: Beyond brain-storming. Princeton Architectural Press, 2011.
[86] Claes Tretow. Design of a free-rotating wing sail for an autonomoussailboat. 2017.
[87] Geoff Wyvill, Craig McPheeters, and Brian Wyvill. “Soft objects”. In:Advanced Computer Graphics. Springer, 1986, pp. 113–128.
[88] Ryan Schmidt, Brian Wyvill, Mario Costa Sousa, et al. “Shapeshop:Sketch-based solid modeling with blobtrees”. In: ACM SIGGRAPH2006 Courses. ACM. 2006, p. 14.
[89] Raymarine. ClearCruise AR. url: https://www.raymarine.com/
clearcruise.html.
169
Copyright © 2022 FDOKUMEN