
Analysis of Augmented Reality Games on Android platform
53
Analysis of Augmented Reality Games on Android platform Author Fekolkin Roman Year 2013 Student thesis, Bachelor, 15 HE Computer science Study Programme for a Degree of Bachelor of Science in Computer Science Examiner: Julia Åhlen Supervisor: Peter Jenke
Transcript of Analysis of Augmented Reality Games on Android platform
Analysis of Augmented Reality Games on Android platform
Author Fekolkin Roman
Year 2013
Student thesis, Bachelor, 15 HE Computer science
Study Programme for a Degree of Bachelor of Science in Computer Science
Examiner: Julia Åhlen Supervisor: Peter Jenke

Analysis of Augmented Reality Games on Android platform
by
Fekolkin Roman
Faculty of Engineering and Sustainable Development
University of Gävle
S-801 76 Gävle, Sweden
Email:
Abstract
In this paper the research surrounding the Augmented Reality in games on Android
platform was performed by testing 108 games from Google Play Market and by
analyzing the hundreds of user reviews to determine the level of acceptance and the
level of technical stability of the mobile games based on that technology. The
Location-based, Marker-based and games based on somewhat different approach
were studied and compared by the runtimes, game genres and by the featuring
aspects including the presence of multiplayer mode, sound effects and the dimension
that the virtual objects were positioned in. The overview of the studied games was
presented in this paper. The results, for instance, include that the AR game variation
is very narrow in terms of gameplay style and technical issues are very commonly
encountered and it makes them very influential to the gameplay experience. The
rareness of the multiplayer mode among the AR games was discovered meaning the
domination of the single-player game designs.

Contents
1 Introduction .............................................................................................................. 1 1.1 Importance of the Study .................................................................................................. 1
1.2 Research Question ........................................................................................................... 2
1.3 Purpose of the Study ........................................................................................................ 2
1.4 Definition of the terms ..................................................................................................... 2
2 Related Work ........................................................................................................... 5 2.1 Overview ......................................................................................................................... 5
2.2 Games .............................................................................................................................. 7
2.3 Another less Game-Related Technique ......................................................................... 13
3 Method .................................................................................................................... 13 3.1 Overview ....................................................................................................................... 13
3.2 Hardware ....................................................................................................................... 14
3.3 Game’s Analysis ............................................................................................................ 14
3.4 User Studies ................................................................................................................... 16
4 Results ..................................................................................................................... 18 4.1 Result of Games’ Analysis ............................................................................................ 18
4.2 Result of User Studies ................................................................................................... 27
5 Discussion ............................................................................................................... 34 5.1 Discussion of the games tests’ results ........................................................................... 35
5.2 Discussion of the users’ reviews analysis ...................................................................... 37
5.3 Overview discussion ...................................................................................................... 39
6 Conclusion .............................................................................................................. 40
Acknowledgments ...................................................................................................... 41
References .................................................................................................................. 41
Appendix 1: The data from the games’ analysis ..................................................... 44
Appendix 2: The result of the users reviews’ analysis ........................................... 48

1
1 Introduction Playing games has always been a significant part of the human evolution, as well as, a
defining factor in behavioural qualifier of a person [10]. The industry of game
development, similarly to film industry, has a cultural significance that may start to
initialize it as new form of art. The sense of relaxation and refreshment of a person’s
mind, as well as a teaching process, are all the possible outcomes that can be provided
by a game session. The games offer an opportunity to relieve the stress of everyday
life and to provide the sense of control over the situation where specific goals have to
be achieved, by making decisions that actually result in something meaningful.
The games can be roughly categorized into 3 clusters (figure 1) like sports,
digital and board games. Each one of the clusters has different organizational
structure, different groups of interest (audience) and different environmental
specifications in which games can be performed.
Figure 1: Three structural clusters of game types
The industry of digital games has not done any particular steps towards improving the
Human-Computer Interaction (HCI) since 1980s. It mostly depends on the
unwillingness of the game companies to risk large budgets invested into the
development due to the possibility of unsuccessful acceptance of the game on the
market that would not pay off those investments.
Augmented Reality is one of the new technologies that can provide a totally
unique HCI by combining the strong sides of digital games and real world games.
Before this technology can be widely used by the developers, it has to be proved to
have stability, with defined possible limitations and the infrastructure used for
building the AR system available to developers. It should also be understandable, in
what way the AR technology can be used to become a part of the game process. The
game design is a tricky procedure, so sometimes it is difficult to understand the best
way of using the technology creatively and appropriately. The gameplay strongly
depends on that aspect. Another important thing is the accessibility of the hardware,
allowing playing the actual game, for the target audience. Without the proper
accessibility the game risks to be a commercial failure.
1.1 Importance of the Study
The proper research of AR started in 90s [3], it has a lot of uncovered potential of
further expending the interactivity experience, bringing it to a whole new, deeper
level, offering a more vivid sense of presence than ever before [5]. It’s a very rapidly
growing technology which can be considered as another step deeper into the age of the
progressive digital inventions. The games that are based on the Augmented Reality
can be used for both entertainment and educational [8] purposes, thus there are many
ways of creating really worthy games using creativity to find out the innovative ways

2
of applying this technology. When the study of the Augmented Reality started to
grow, initially the games based on AR would require expensive equipment that made
the created games not commercially advantageous. But, as the technology developed,
the equipment became more available for the broader audience and thus the
development of the AR games became more and more attractive for the independent
developers [39]. The technological progress makes the ways of implementation and
application of AR to become broader, due to the minimization of technical limitations
and increase in the variety of the hardware to be used for inventive AR ideas to be
realized. Due to the current availability and the strengthened positions of the AR based
games on the market, it would be interesting to take a closer look at how the
technology can be used to provide AR based interactivity in the games and to see if it
offers any perspective in creating a any new perception of the gaming experience for
the players.
According to the prognosis from analytics from Juniper Research [24], the share
of AR games compared to other areas of AR application (medicine, education etc) will
increase up to ¼ of the whole market before year 2015. The analytics from Semico [1]
explained in their latest report the role of AR on the market and they stated that AR
games will be in popular demand due to rapid increase in technology development.
According to the Gartner Hype Cycle in emerging technologies[17], the AR
technology is at the stage of increased expectations which means there will be a lot of
different applications, both successful and not. Thus, it would be enlightening to
research how the AR behaves in the game industry and what kind of game
applications are available on the market right now and how well they are accepted by
the audience.
1.2 Research Question
How is the Augmented Reality used in games on the Android platform?
1.3 Purpose of the Study
I am interested in finding out how the AR is used on mobile devices. The research will
be performed by making an overview of the technical aspects of the current situation
surrounding the mobile AR the result of which will be an overview that will clarify
what kinds of AR techniques are currently used for mobile AR games and how well
the AR games are accepted by users. Since the AR is a newly emerged technology,
especially on mobile devices, its aspects are currently not very well uncovered for
understanding of how exactly it is used and what kind of approaches are used to
achieve the AR effect and how well those approaches work in terms of the technical
stability and gameplay interest. The result of the study will give a general opinion
about the AR mobile games. This work will provide the general technical information
as well as the information about how successful the AR currently behaves on mobile
devices. Since this work only focuses on analysis of the AR games available on the
Android platform that is why the analysis performed in this work can later be used as a
basis for future research of the mobile AR games for both Android and other platforms
in order to compare them by technical performance and gameplay solutions.
1.4 Definition of terms
The term Augmented Reality was first proposed by Tom Caudell [11] who was a
researcher at a Boeing company in the year 1990. In 1994 Paul Milgram and Fumio
Kishino [31] described the Continuum of Reality-Virtuality, a space between reality
and virtuality with augmented reality (closer to reality) and augmented virtuality
(closer to virtuality) as the intermediate elements (see figure 2).

3
Figure 2: Reality-Virtuality Continuum [31]
There are several definitions of Augmented Reality. One of the definitions was
proposed by Ronald Azuma [4] in 1997. He defined AR as a system that:
1. Combines Virtuality and Reality
2. Interacts in the real time
3. Works in 3D
The augmented reality can also be defined as a combination of two initially
independent dimensions on one screen.
The dimension of the real world, that surrounds a person, and the dimension of
the computer generated world. This interactive technoloegy offers the user to overlay
digitally generated 2D or 3D objects on top of the image received from a camera,
augmenting or adding them to the real world images [39]. Per se, regardless of the
name, the Augmented Reality technology could be applied for both filling the
surrounding world with virtual objects, as well as, removing the objects from the real
world. The capabilities of Augmented Reality are only limited by the capabilities of
the hardware and the software. In the simplest case, to achieve Augmented Reality,
four components would be needed:
Marker – special image, visual identifier
Web-camera – that “sees” the marks in real time and sends the signal to the
computer
Software – that handles the received signal and combines the virtual objects with
the real world image.
Computer
The user prints a special image (marker) on a paper and shows it to the camera. The
software, installed on the computer, should recognize the marker from the image that
was received from the camera and according to the position of the marker it will place
some kind of virtual object on top of it. The virtual objects could be texts, website
links, photos, 3D objects, sounds, video etc. They could either be just observed by
users – passive, or they could be interactive.
Head-Mounted Display (HMD) is a display that is commonly built into a helmet
or glasses that allows the flexibility for the user to maintain the proper view position
produced by the display regardless of the head orientation. HMDs can be binocular-
two displays for both eyes, or monocular- one display for one eye only [16]. The first
HMD was created by Ivan Sutherland [38]. Originally it was too bulky and
uncomfortable for the usage. But as the technology progressed, the HMDs became
more mobile. The application area of HMDs is broad. They could be used in different
simulations for medicine, military, entertainment etc. Since the display image has to
be updated in real time, the high update rate is a very important factor that needs to be
taken care of in order to fulfil the proper usage experience received from HMD and
provide nice and smooth image generation synchronously with the head movement.
The HMD is a somewhat old fashioned type of AR hardware which in the future could
be improved by the Google Glass [21].

4
The markers are crucial components in Marker-Based AR system. Without the
detected marker the positioning of the object, that should be augmented, would not be
possible. The markers specify the position and orientation of the virtual objects to be
augmented into the real world. They work as “triggers” for Augmented Reality and
they can be placed on any surface. The role of markers can be assigned to illustrations,
photos, logos, QR-codes, product packages and even human body. The markers could
be both binary (black and white) printed images, as well as, colored images. The
difference between them is in the marker detection/segmentation algorithm used to
extract the marker from the image received from the camera.
There was a research performed by Zhang et al [46], where they, through an
experiment, compared the efficiency of 4 different marker systems (figure 3) and
found no apparent sign of the qualitative domination of one system over the other. So
any system can be chosen depending on the developers’ preferences.
Figure 3: Four types of marker system [46]
Location-Based AR is an approach that uses the virtual object positioning
according to the phone’s orientation and position that could be determined by, for
example, Global Positioning System (GPS). An example of the location-based AR
game called “DroidShooting” [35] can be seen in the figure 4.
Figure 4: “DroidShooting” location-based AR game.
Marker-Based AR is one of the generally used approaches used for determining
the virtual object positioning in space. The position and orientation of the virtual
object is determined by the position and orientation of the marker. The marker-
detection includes extracting the marker from the camera image by receiving the data

5
from the camera that is later post-processed by the feature detector, whose output is
later used for specification of the virtual object position. An example of the marker-
based game called “Hoops AR” [7] can be observed in the figure 5.
Figure 5:”Hoops AR” marker-based AR game.
Other approach – in this paper will be referred to games where virtual objects
would be positioned regardless either of the marker or phone positioning properties.
2 Related Work In this chapter the papers about the AR application methods are briefly overviewed.
The types of hardware and the game design solutions are summarized and some of the
papers that defined the general AR definition and its structure are presented.
2.1 Overview
In the paper "A survey of Augmented Reality Technologies, Application and
Limitations" [40], the authors performed a review of the technologies, applications
and limitations in the AR field. The purpose of the paper was to give a starting point
for the readers who are interested in the studies of AR field. It was supposed to give
the general overview of the different aspects surrounding the AR field. As described in
their paper, the AR application area could be clustered into several groups. The groups
can be visualized as a tree structure for easier comprehension (figure 6).
Figure 6: Application areas of AR

6
The authors described some of the limitations that must be overcome in order to make
the AR technology more accepted by the audience. The limitations described by the
authors of the paper can be structured as a tree (figure 7), as well.
Figure 7: Limitations of AR
According to the paper the AR displays can be divided into 3 categories (figure 8)
Figure 8: The classification of AR displays
As mentioned previously, the application area for the AR is very broad. In particular,
the AR can be used to create games of different genres. The classification of the game
genres was presented by Starner et al [36] in their paper.
The games were classified into several categories (figure 9) where each category
would need a different approach of using the AR technology.
Figure 9: The classification of game genres
There are numerous papers describing different techniques used for application of the
Augmented Reality in games. Tan and Soh [39] presented a good summary of what
kind of technology that was used in the time interval starting from 2000 up to 2010. In

7
that paper the authors divided the games into 2 categories depending on their purpose
and positioned them on the graph according to the game release date and the
technology that was used in it. According to their work, the AR equipment changed
from expensive head- mounted displays (HMDs) and motion sensor to the less
expensive marker-driven detectors and the phone cameras. From that same figure we
can conclude, that as the technology became more available (especially from 2007),
the purpose of the games became more educationally dedicated rather than just
dedicated to fulfilling the entertaining purposes.
However, Lundgren and Björk [29] explored in their paper how the embedded
computer technology [43], newly developed sensor devises and ad-hoc networking
[19] can be used to broaden the game genre or to create new genre types, as well as
exploring the possibilities on enhancement of interaction in traditional games. As the
result of their exploration the various game mechanics were identified for expending
the mechanic possibilities for game designers. The research revealed also the fact that
there is no particular structure of the concepts of mechanics, or in other words, there
are no obvious patterns that could be used for classifying the game mechanics which
makes it significantly harder to perform a proper analysis of the game design and
game processes.
2.2 Games
The computer games usually lack the sense of reality, because the only thing the
player has to do is to manipulate the mouse, keyboard or gamepad to perform the
actions in the game. The AR technology allows a variety of ways for achieving very
realistic interaction between the player and the game.
Andersen et al. [2] in their paper proposed a theory that applying AR technique
would enrich and deepen the experience received by the players from a gameplay. As
a proof of their theory, they presented a prototype of a multiplayer AR board game
called “BattleBoard 3D” (BB3D). For structuring the prototype, they used ARToolkit
library. Their game was the result of the inspiration they received from the Star Wars
Episode IV movie, where two characters were playing the living chess game with
pieces that would actually perform the fighting interaction with each other at certain
conditions. To play the game the Virtual Reality (VR) glasses or a regular computer
display with a web camera would be needed in order to observe the result of
augmentation. In the first case, one player would have to ware the VR helmet and the
other player would watch the game process through the display. In the second case,
the fixed camera was used and both players had to follow the game process through
the display. In order to provide a proper gaming experience for both players, 2 VR
helmets and 2 computers synchronised with each other for handling the computation
received from each of the VRs, would need to be used by both players. The purpose of
their game was to combine of digitally generated game features with the real board
game pieces. In that game, the user had to physically move the game pieces that had
markers with graphical symbols to which the animated virtual objects would later be
attached. The structure of the markers had to satisfy the marker properties required by
the ARToolkit. Examples of those markers were mentioned in the first chapter of this
work. The gameplay included capturing the chest of the opponent. The virtual objects
associated with markers were LEGO figures. The markers for the game were made out
of real pieces of LEGO to provide the right physical feeling and consistency for the
game structure.
After testing the game with the group of children, they received generally a
positive feedback. To increase the re-playability, the downsides like a small variety in
character animations and absence of a single player mode against a computer Artificial
Intelligence would have to be fixed. Overall, the observed game was an example of
the successfully applied AR to a board game.

8
Another multiplayer AR game called “BragFish” was presented by Yan [45] in
their paper exploring the social interaction in AR games. The game was played in a
shared space, which allowed multiple users to communicate and affect the game
process in a more social way. The gameplay involved navigating the boat around the
lake, catching fish and stealing the fish from other player’s boat. In order to play the
game, a fixed game plane with markers was required. The Gizmondo handheld device
with a camera mounted on the back was the only hardware required for the users to
play. Even though the game offered a socially active gameplay, it did not involve any
actual physical interaction between the player and the virtual game objects, keeping it
only within the screen of the handheld device.
Later on, the authors expended their idea presented in the “BragFish” in another
paper. In their paper [23], they explored the ways of making the gameplay more
physically interactive, in order to make the gaming experience more vivid and closer
to the traditional boardgames. The goal was also to make the game more portable.
Considering the requirements, they developed and presented “Art of Defense (AoF)” –
an AR handheld strategy board game of type “Tower Defense” for cooperative use. In
the game the players were allowed physical interaction with the game pieces. The
purpose of the game was for two players to protect the main tower from increasing
waves of enemies. For protection, the players would have to build and upgrade the
defending towers on the game field. Both players would have to communicate to
successfully develop a strategy for defeating the enemies. The intended mobility of
the game was provided by small game pieces, adjusted design implementation and a
regular phone with a camera to be used as hardware. The structure of the game plane
consisted of hexagon-shaped tiles. To explore the game world the user would have to
reposition the tiles to move further. For building the towers, the user would have to
position a special token on the chosen tile, specifying the direction of attack of the
tower. For upgrading, the token would have to be added to the tile with the tower.
Both constructing and upgrading the towers needed to be confirmed by pointing the
camera and pressing the button.
For implementation of the game, the authors used OpenGL ES programming
interface and Edgelib [15] game engine. StbTracker [37] library was used for tracking
multiple markers. The described game implementation proved to be effective for
improvement of the players’ communication and game experience. Compared to the
“BragFish”, the “Art of Defense” became more portable due to the use of assembled
game plane and appropriately adjusted game design suitable for mobile devices,
making the portability a part of the gameplay.
A non-portable example of AR board game was proposed by Molla and Lepetit
[32] in the paper “Augmented Reality for Board Games”. In the paper they converted
a well known “Monopoly” board game into an AR domain. Instead of phone cameras
and markers, they used a simple display with web camera and pawns that represent the
player on the game board to which the virtual objects were attached. The pawns offer
a physical user activity and the real feel of the game, which is the main advantage of
using the tangible interfaces. As the player moves the pawns around the game plane,
the orientation and position of the virtual objects attached to the pawns were
calculated, so that the virtual objects would look in the right direction. Each pawn had
a unique color and a simple shape, to make it easier to distinguish them in post-
processing of object detection. However, the virtual objects associated with those
pawns did not have any animation that could enrich the gaming experience.
An interesting approach of creating the AR board game with animated virtual
objects was presented by Billinghurst and colleagues [8]. They made an overview of
Shared Reality with the Augmented Reality as its interface technology. The AR based
multiplayer game with tangible pieces was demonstrated in that overview. The
hardware required for the user was a HMD. The gameplay was fairly simple. Its
purpose was to match together the cards containing tracking patterns that would later

9
be used for positioning the virtual objects. When the match was successful an
animation was triggered involving the two logically suitable virtual objects.
The game process involved also the communication between players when
asking for matching cards. The authors tested the game and according to the
performed experiments, this kind of AR interface proved to be effective and easy to
understand without any requirement for additional gameplay instructions.
Another example of the AR board game with tangible game pieces was presented
by Lee et al. [26]. They presented a game where 2 players would sit at the glass table.
Both players were given a set of cards where each card had a marker attached to them
on the back side. And due to the transparency of the table the markers could easily be
detected thought the table surface. To track the markers, the “tracking” camera under
the table was used that observed the markers through the reflection in mirror that was
positioned under the table under a certain angle. The mirror improved the tracking
limitations that could arise depending on the height of the table which affected the
view angle of the camera. When the player made the move, by putting a card on the
table with the marker pointing down, the second “augmenting” camera, installed
above the table, would augment the virtual object depending on the marker properties
detected by the “tracking” camera. For the implementation of the game, the authors
used OpenGL for rendering, OpenCV for image processing and ARToolkit to position
the virtual object according to marker properties. The AR approach described in the
paper was strictly non-mobile, due to the special table requirement that was designed
specifically for that game prototype.
Unlike some of the previously described papers, the approach presented in the
paper “Augmented Reality Chinese Checkers” [14] did not involve the use of any
actually physical game pieces. Instead those pieces were entirely digitally generated.
In order to move those virtual game pieces, the user would have to move the marker.
For the game, the authors developed a special interactive marker prototype that
extended the functionality of the regular markers. The game included 3 markers. Two
of them were made for defining the size of the game plane and one for the interaction.
The marker that was responsible for interaction had 2 buttons, which signalled the user
events like choosing and changing the position of the checker pieces. This marker had
to be shared by all players in the game depending on whose turn it was. The other two
markers defined the game board’s spatial properties like orientation, position and
scaling size. The scaling size was defined by the positions of those two markers,
placed in the lower left corner and upper right corner. The scaling size could be
adjusted by simply repositioning the 2 markers at any time during the game session.
The augmented objects had to be observed on the large screen. The observed view
could be chosen from one of the 5 cameras positioned above the game board. Those 5
cameras were used as structuring elements of the Passive Detection Framework
(PDF). Depending on the choice of camera, the positions of the virtual objects had to
be recalculated accordingly.
Another interesting proposal of AR board game was presented by Lam et al. [25].
In their paper they presented a specially developed prototype of the Augmented
Reality Table (ART) that would be used for playing the trading card games like
“Dungeons and Dragons etc”. The intention of the table was to broaden the regular
gaming experience by augmenting the visual and sound effects while maintaining the
basic card gameplay process. As hardware for this ART, they used an over-head
camera that acted as the only input device and it was positioned above the table. They
also used a computer for performing the augmentation and computational processes
and the plazma TV aligned horizontally. This TV acted as the table on which the
players would actually play the game. Instead of the marker detection they used the
Canny edge detector for determining the content and the position of the card. Besides
card interaction, the user was also allowed to perform spell attacks by “pressing” the
buttons on the “screen” table. The button event was detected in the similar manner as
the card recognition.

10
Piekarski and Thomas [34] offered an interesting way of the outdoor AR
interaction in the first-person single-player shooter “ARQuake”. They used a
transparent HMD, whose orientation and position determined the view. The game
statistics were shown on the HMD. For the movements the player would actually have
to walk some distance in the desired direction. Due to this interaction, the virtual
world aligned with the real world. The game play was adjusted appropriately,
removing the actions that would cause some difficulties to be performed (swimming
and flying). The walls, floors and buildings were omitted from the game to allow the
user see the real structures. For the shooting action - the props or in other words the
plastic replicas of the real weapons were used. Due to the lack of bulky hardware and
wires, the user could freely navigate in the real world while eliminating the virtual
enemies without any hindrances. The “ARQuake” was one of the first AR games that
could be used outdoors.
Expending the idea presented in the “ARQuake” from the previous paper, Cheok
et al. [12] developed a multi-player game called “Game City” that was set in real
world dimensions (e.g real city). In their game, the authors combined the AR and
Virtual Reality (VR) in a single gameplay. Since this particular technique was based
on the relatively old hardware (from 2002) and the gameplay involved players to
move around large distances carrying a lot of hardware in order to fulfil the intended
purposes of the game, thus the game sessions might be exhausting. The required
hardware included HMD with camera and inertia sensor, GPS receiver, mobile
wearable computer for augmentation of virtual objects into the real world, and a power
supply to keep the whole wearable system powered up. The game process included 3
stages. First, the player had to collect treasures and clues. To collect those, the players
were provided with hints and directions shown on the HMD. After that, the player was
guided to a place where he would have to defeat a virtual witch by using a “gun”
whose functionality was provided by a gamepad. In order to avoid enemy hits, the
player would physically have to dodge the attacks. At the last stage, the player would
enter a full VR to find the princess. In the VR, the navigation was provided by the
gamepad and the orientation was determined by the HMD. Considering the year of
release of the proposed game, the authors used effectively the available, at that time,
technology to provide an engaging gameplay.
In the paper “Motivations for Augmented Reality Gaming” [33], the authors
developed “Hybrid AR Worms” - an improved version of the earlier implemented
“AR Worms” game. The original “AR Worms” was based on the “Worms” [44]
computer game. The gameplay involved eliminating the members of the other
players’ groups until only one group remained. The implementation of their original
AR game was done using the ARToolkit, OpenGL and OpenAL. In order to play the
game, the players wearing HMDs, had to stand around the table on top of which the
virtual game world would be augmented. The controls for the game were provided by
the gamepad. To select a worm (group member), the player would have to
concentrate/point the HMD’s view at the desired worm that needed to be controlled. It
was also possible to play the entire game from the first-person perspective, which
would transform the game domain from Augmented to fully Virtual. After testing the
game with some players, the game design revealed some drawbacks that negatively
affected the gameplay. The HMDs and short cables disabled the free movement of the
players. The marker trackers had flaws regarding the unstable/flickering appearance of
the virtual objects attached to those markers and it affected some game functions
making them non-functional. The worms appeared too small to be easily identified or
seen by the players. However, the authors took into account the observed test results
and implemented “Hybrid AR Worms”, improving stability of the original game
features and overall functionality. In the updated version the marker system was
improved, almost eliminating previously noticed problems. The gamepad was
replaced by the Personal Digital Assistant (PDA). The wall projector was used to
display the view perspectives and game statistics, making them available for

11
observation for non-participating users. The additional game effects like terrain
randomizer, bonus kits positioned on the map and particle system were implemented
into the game design.
Besides displays and HMDs, the augmented world could be seen through a
projection. An example of such approach was presented by Löchtefeld et al. [30] in
their paper. In the paper the authors explored the idea of using the phone projector for
achieving the AR by implementing the game called “LittleProjectedPlanet”. They
used mobile phone with an in-build camera projector instead of using bulky HMDs
and phone cameras for each player. The game was projected onto the whiteboard
which would allow multiple players to participate in one game session without the
need of a lot of hardware. The authors based their game idea on the Playstation 3
exclusive game “Little Big Planet” developed by Media Molecule [28]. The game
process included two modes. In the first one, the player would have to build a level by
drawing the primitives/lines on a whiteboard. The second mode included moving an
object through the created level from start to finish. One of the important requirements
for the game was that the light and surface conditions in the room had to be satisfied
in order to provide a good contrast which would make it possible for the edge detector
to distinguish the created drawings. The game was implemented in Java, using the
Phys 2D engine for calculating the physical behaviour of the object. The hardware
included the Nintendo Wii Remote, which played the role of the electronic compass,
attached to the camera projector. In nowadays, an alternative to the presented
hardware would be a regular smartphone with an inbuilt accelerometer and gyroscope.
Considering the previously described papers, the AR can only be seen through some
kind of projection or a display that is usually present, for instance, in HMDs and
handheld devices. However, the problem with the handheld devices is their small
screen size which limits the perception of the augmented world. We can not see on the
screen what is not viewed by the device. Cho et al. [13] introduced a special term
called “dynamic environment” that they used in their game “Ghost Hunter”. The
purpose of the dynamic environment was to expend the perception boundaries when
using the handheld device for AR. They developed an approach of allowing the
players to feel the game world even when some parts of it were not observed through
the device. To achieve the dynamic environment, they developed a special game board
with physical elements. The board included small building, lights that would keep the
player aware of the position of approaching enemies (ghosts), and tombs that would
open automatically when the enemy appeared. The positions of the physical elements
could be re-customized, in order to allow the users some variety in the gameplay. In
order to detect collisions between monsters and buildings, they used specially
generated 3D models of those buildings that were later digitally overlaid on top of the
real ones. The authors also developed a special hardware called “AR Gun”. The “AR
Gun” contained the display and the camera, and it was connected to a wearable
computer. The gun configuration was chosen as an alternative to smartphones and
PDAs due to their limited computational capabilities. The solution for the AR design,
presented in their paper, was particularly useful when using AR applications on
handheld devices. In that solution the users would have to react to actions beyond the
screen, making the game more engaging.
There was another example of a dynamic game environment presented in the
paper by Barakonyi et al. [6]. In the paper the authors demonstrated the capabilities of
the autonomous agents by means of the virtual game characters. They tried to show
how those agents can simulate player’s behaviour without the actual player’s
participation in the character control. In order to demonstrate that, the authors
developed a multiplayer game called “MonkeyBridge”. In that game the player would
have to guide one of such agents towards a destination point by placing virtual, as well
as, physical (real) objects on the game table.
The virtual objects could be positioned by using the marker. Those objects were
randomly chosen from the list of existing predefined 3D models, so the user would

12
have to react according to the object type. The additional physical objects were used
for decoration, as well as, for hindering the way of building the bridge easily from
starting point to the end point. Some of those objects were mechanically enhanced to
provide a proper game feeling. The table surface was covered by a digitally generated
ocean to make the gameplay more vivid. The agent character had a proper animation
and sound effects for different game situations. When implementing the game the
authors used the ARToolkit library and 3DS Max for character modelling and
animation. The augmented view could be observed by using a display with web
camera or a HMD as an alternative.
The application of AR for education purposes may play an important role in helping
people to perceive information in a more effective and engaging way.
One of educational AR applications was described in “Augmented Reality Kanji
Learning” [42] paper, where authors presented an educational AR board game for
learning the kanji symbols. Two players would have to sit at the table, both given 10
cards and a PDA with the inbuilt camera. The cards were turned with their back side
pointed up, showing a symbol. On the other side of the card was a marker. The main
game purpose was to find the figure shown on the PDA and find the kanji symbol that
corresponded to that figure. The player would have to choose one of the 10 cards and
then flip it over. Then, through the PDA, the player would see a 3D object associated
with the card’s marker. If that object was the same as the required figure on the PDA
then the player would gain a point, otherwise the turn was given to another player. The
augmentation process and the game’s rules determination was performed directly on
the PDA which made the game significantly mobile by removing the need for any
bulky hardware. The game was implemented by using OpenGL and ARToolkit
libraries.
A different type of educational AR was introduced by Ardito et al. [3] in their
paper about the use of AR in historical parks. They implemented a mobile AR
application that could be run on a cellular phone with a removable memory card. This
choice of hardware removed the necessity of having any expensive hardware, but the
quality of the augmentation would be affected by that hardware choice. The purpose
of their application was to enhance the excursion procedure for students in
archaeological parks. At the start of the excursion, the players (students) were given
the instructions which included finding some particular place in the park and taking a
photo of the QR code positioned in that place. When the photo was taken, a digital
model of that place (e.g statue) would be shown on the phone screen. Due to limited
computational capabilities of the phones, the application showed a set of sequential
snapshots of the model instead of the actual 3D model. At the end of the game, the
memory cards were collected by the instructor and then analysed, in order to
determine the results of the excursion. The game structure had to be adjusted each
time in order to be used in different parks. The game was implemented using Java and
it had a XML file responsible for structuring the game and that file had to be modified
when adjusting the game for another location.
The different types of simulation training could also be supported by AR. For
instance, Brown et al. [9] tested the effect of applying the AR in the military
simulation to improve the training skills. In particular, they researched the difference
between the training with the AR and without. For that, they developed a special AR
system. The training process consisted of 2 stages. At the first stage, the participants
had to go through the location, observing the surroundings through the HMD, while
carrying the backpack with the computer. The purpose of the first stage of the
simulation was to clear the location from the virtual enemies. At the second stage, the
same participants had to go through that same location, but this time they had to
“eliminate” the real enemies. During this stage, the participants had to be put in the
same conditions as in the AR training. They had to wear the backpacks with hardware
and HMD on the head, but without the need to look through it. After the participants
passed two stages, the statistical results of completion were compared. As it turned

13
out, the AR did not improve the training skills of the participants. The results
depended perhaps on the wrongly structured simulation stages. The location layout
was the same during both stages which might affect the results of the second stage.
Further testing, considering some of the simulation aspects, might result in the
different outcome.
2.3 Another less game-related technique
There was a technique presented by Vera et al. [41] that offered an interaction with the
surrounding audience with help of the augmented mirror, while maintaining a realistic
way of movement of the computer generated character. The movement was based on
the detection of the different parts of the player by attaching four different devices
responsible for tracking different parts of the body. The Kinect [27] tracked the basic
body movements (arms and legs). The tracking of the orientation of the head was
performed by the Gyroscope. The microphone detected the motion of the lips and the
WiiMote provided the user with the set of facial expressions to choose from.
Considering the amount of equipment required for providing that kind of result, it
would require some significant financial spending which would most likely make the
games based on that kind of technological approach, unattractive on the market.
3 Method The process of the data retrieval that was performed during the analysis was divided
into 2 stages. During the first stage the games were analysed for the presence of the
sound effects, multiplayer mode, 3D object positioning, game’s genre and the
distribution type. Another major part of the first stage of the games’ analysis included
the measurement of the frame rate for each one of the 108 games. During the second
stage of the data collection the analysis of the user reviews was performed that
included going through the user reviews for each game and separating them roughly
into positive and negative categories. The technical complains were collected as part
of the negative reviews and their proportion was later calculated in order to see the
main reason for negative acceptance. The games’ ratings and number of installs were
collected from the game’s description page on Google Play Market.
3.1 Overview
The general questions about the performed research can give some insight into the
process that that was performed in this work in order to collect and represent the data.
All of the collected data was not biased in any way by any hidden factors that might
affect the judgement during the testing. With a personal 16 years of experience being
closely familiar with the gaming products of various types, the test results were
collected in an objective way. If the game future was present in the tested game then
it was noted as such. If it was absent then it was noted appropriately as well.
Who was the study about?
The study was about the users who used the AR based gaming mobile applications.
The players are the corner stone in the commercial success of every game, and thus
their opinions or feedbacks play a major role in the gaming industry. Since, the AR is
a newly emerged technology, thus the acceptance of the games among the users would
define the reliability of the whole idea of creation of AR based games. In this
particular study the players who use the Android platform were taken into account and
studied.

14
What was the study about?
The study was about the games that used the AR technology. In particular, the study
concentrated on the Android platform for mobile games. The development of the AR
applications is just emerging and it’s a large research field for creative design ideas
which would offer some innovative gameplay solutions using the technological
advantages of AR. The general overview and understanding of the current situation
surrounding AR in gaming on mobile platform was performed. The conclusions were
reached based on observations and experimentations with the currently available
freeware and payware mobile games that were installed from the Google Play Market.
What and how did I do it?
I performed a detailed testing of 108 games for Android platform. The list of
available AR games was made. Then those games were installed on a mobile device.
The games were studied one by one. The observed information was recorded. In order
to test the games, 3 different mobile phones were used. The information of interest
included the general game features like multiplayer mode, sound effects and 3D which
was absent in some games. The game genres and commercial status was taken into
consideration as well. The result of analysis was used to overview the current situation
in the mobile AR gaming field. The analysis of the users’ reviews from Google Play
Market was performed in order to find out how the AR based games were accepted
when it comes to using them on mobile platforms. The information about the
acceptance of the gameplay and the current problems that were frequently noticed by
the users was recorded. All of the data from the study was recorded into the table and
later that data was used to build graphs and charts for later interpretation and
conclusion making. All of the graphs and tables were made using the MS Excel,
EDGE Diagrammer and Photoshop for visually enhancing and highlighting some of
the graph features.
What did I look for?
I looked for the evidence that would proof that the AR can be successfully applied to
mobile game while maintaining the interesting gameplay in order to keep users
satisfied.
3.2 Hardware
For the testing, 3 different mobile phones were used: Samsung Galaxy Note 2, Sony
Xperia Z and HTC One X. Three different devices were needed in order to run all of
the applications, due to incompatibility issues that appeared when trying to run some
particular application on one phone.
3.3 Android games’ analysis
The most important part was actually to find a sufficient number of games to be used
for testing in order to allow a more representative representation of the data. The
games were found on the Google Play Market [20], using “Augmented Reality Game”
as search keywords. After that, the AR games were installed one by one. But before
installation, they had to be separated from the occasionally encountered non-AR
games. When installing the game, the installer would ask for the permissions that the
game needs an access to. Those permissions had to be noted in the table by setting a
mark “x”. The game’s genre was taken from the description page of the each game
and it was recorded into the table as well. The commercial status, specifying if the
game is freeware or payware, had to be noted in the “Freeware” column by choosing
either “Yes” or “No”. After the installation, the game was run and tested for technical

15
features. First of all, the approach had to be specified. If in order to play the game, a
marker had to be used, then the appropriate mark had to be set in the table in the
proper column. If the positions of the virtual objects were location-based, or in other
words the positions of those objects were correlated to the position of the mobile
device then the mark had to be set in another column. Some of the tested games were
neither location-based nor marker-based. In fact those games were hardly even AR,
because they were just regular games, but with the camera background, meaning that
the data received from the camera did not influence object positioning and the virtual
game objects were not actually integrated into the real world. However, the virtual
objects were still overlaid on top of the real world images, even though they were not
dependent from it in any way and thus those kinds of games would still be considered
as AR-based. The games of that sort were not encountered as frequently as the games
based on other two approaches.
To better understand the process of gathering data we can take a look at the
following example. For example, after testing the payware game called “3D Pool
game 3ILLIARDS”, we can conclude by observation that there were sound effects
when interacting with the virtual objects, it was set in 3D space where the position of
the virtual object was determined by the position of the marker, and there was a
multiplayer mode in this game allowing several users to participate in the game
process (table 1).
Table 1: Specification of General Information and AR Approach in the table.
The access to the phone’s features that was required by the game had to be noted too,
but in the different section of the table. The information about access could be
collected when installing the game on the phone. It will request your permission to
allow the application to use some particular phone’s features that were intended to
provide the proper gameplay.
In the “3D Pool game 3ILLIARDS”, during the installation the game requested
access to the phone’s hardware controls, network communication and phone calls
(table 2).
Table 2: Specification of the required access in the table.
After all that data for the game was recorded into the table, a next game had to be
tested in the same manner. Some of the games could not be run on one phone, thus 3
different phones were used in order to run all of the games. This was one of the major
drawbacks of the actual testing process. This particular compatibility problem is
perhaps one of the major problems that currently exist on the Android platform,
perhaps due to the universality of this platform making it available for different
phones with different system configurations to run the same applications. Thus it
would be very interesting to compare the AR games from the Android and iOS
platforms to see if these technical limitations would be resolved on the Apple devices.
It would be interesting to see what platform is more preferable for developers to create
AR applications for and to determine which one of the platforms is more dominant on
the market.
As an important part of this thesis work the runtime for each tested game was
measured by using a special application called “FPS Meter” [18]. This was done in
order to determine which of the AR approaches more computationally demanding on

16
the device’s hardware. The application that run at the same time as a tested game,
calculated and displayed the average runtime measured in Frames per Second (FPS).
The average runtime is calculated by adding together the FPS values collected at some
intervals and then dividing that sum by the total number of the collected samples.
3.4 User Studies
After running the tests for each one of the 108 games while recording the observed
functional and technical aspects into the table, the user reviews taken from Google
Play Market’s description page for the tested game were analyzed and recorded into
the table judging by their affiliation. The affiliation could be either positive or
negative. The affiliation types were chosen in such a way due to impossibility to
expand the intermediate stages between negativity and positivity which would be
impossible to do because the user reviews were analysed without the actual contact
with each respondent user whose reviews were analysed. Even though the affiliation
assignation might seem too subjective, but the reviews could clearly be distinguished
by their affiliation due to the fact that the users did not intend to make a feedback with
double meaning. For example if the review was positive it was obvious that the review
was positive due to the structure of the sentences that did not contain any positivity
about the reviewed game. There were no “not so bad and not so good” or “some parts
are good and some parts are bad” reviews and this fact makes the process of
determination of the review affiliation type fairly clear. An insufficient number of
reviews might give a wrongly guided impression about the games since the same user
could complain about the same problem several times when actually that problem is
not very common among other users. Thus the larger is the number of reviews; the
more representative will be the opinion about the game. But for the purpose of my
analysis, the games with at least 5 reviews were considered only.
The table for the reviews contained 4 columns. The columns included percentage
of positive and negative reviews, as well as, the percentage of the technical complains
and the total user ranking of the particular game. For example, in case of “3D Pool
game 3ILLIARDS”, after studying the user reviews (figure 10), the descriptive
statistics were summarized in the table appropriately.
Figure 10: Counting Positive/Negative/Technical notes for “3D Pool game 3ILLIARDS”.

17
In the figure the lines represent each review or opinion. Those lines were set on
different side dependent on their affiliation. The lines in circles represented the
technical issues and they were considered as negative reviews. From that figure, we
can calculate the proportion of positive and negative reviews by:
% of Positive = # of Positive / Total Reviews = 75/101 = 0.74
% of Negative = # of Negative / Total Reviews = 26/101 = 0.26
Since the technical complains were considered as part of the negative reviews, their
proportion will be taken with respect to the total number of the negative reviews:
% of Technical Complains = # of Technical Complains / # of Negative = 20/26 = 0.77
In case of technical complains received from users, the game had to be run again in
order to confirm that the technical issue really existed. This confirmation was done
only when there were a small number of reviews and just a few of them had
complains. In cases where a lot of complains were noted, no further confirmation was
needed. After the user reviews were separated by category or affiliation, the total
rating for the game was collected from the Google Play Market’s game description
page. For the “3D Pool game 3ILLIARDS” game the rating equalled to 4.3. All of the
calculated user reviews’ statistics were then recorded into the table (table 3).
Table 3: Result of the user review for “3D Pool game 3ILLIARDS”.
Opinion Technical issues Game Rating
Good Bad (technical/total bad) 0.74 0.26 0.77 4,3
As we can see from the figure, the cell containing the percentage of good reviews was
colored in red, which means that the good reviews were dominant in the total number
of studied reviews. In some cases the proportion of the good reviews equaled the
proportion of the bad reviews (0.50 each) and there was no particular domination of
one review type over the other. The determination of the dominant review was done
using the following simple algorithm:
If (good reviews > 0.50)
Dominant = Good; Else if (bad reviews > 0.50)
Dominant = Bad; Else
Dominant = Tie;
In some cases the number of pages with the reviews was too large to be analyzed,
because each page contained, on average, around 9 reviews. In order to cut down the
amount of reviews to choose from, the randomly generated page numbers were used to
determine the page of interest. To generate random page numbers, the table of random
digits was used.
The process of game and review analysis was performed for each one of the 108
game applications. In some cases there were no user reviews or there were an
insufficient number of reviews to be representative for the users’ opinion about the
game and thus the users’ study for those games were skipped. The table with the
complete Game and User study can be seen in the Appendix section.

18
4 Results The results of my research were recorded into the table. The categorical data from the
main table was counted and summarized in the several tables represented by different
graphs. Those graphs were used to represent the findings of the research.
4.1 Result of Games’ Analysis
The studied 108 games were distinguished by the approach that they were based on.
The following table (table 4) summarizes the number of games of different genres for
different AR approaches.
Table 4: The game genres for different AR approaches
Marker-Based Location-Based Other Total
Action 22 27 6 55
Casual 10 9 2 21
Puzzle 8 1 0 9
Sports game 9 1 1 11
Lifestyle 2 1 0 3
Entertainment 4 3 0 7
Racing 2 0 0 2
Total 57 41 9 108
According to the total number of games per approach (figure 11) we can see that there
were 57 games that used marker-based approach. For the Location-based approach
there were in total 41 games, while the remaining 9 games belonged to the category
that used a somewhat questionable approach that can hardly be considered as AR.
Figure 11: Total number of games per approach.
The total share of each one of the AR approaches can be summarized as a pie-chart
(figure 12).
Figure 12: Share of AR approaches
The Marker-Based games appeared to occupy more than half (53%) of the total share
of the AR games for Android platform. The Location-Based approach was used by
58
41
9
Marker - Based Location - Based Other
Number of games
53% 38%
9% Marker-Based
Location-Based
Other

19
15% less number of games having 38% of the total share. The remaining 9% were
occupied by the games that used other “AR” approaches.
As noted in the table previously, the games were of different genres. Each genre
represented a somewhat different style of game. In total there were 7 different game
genres one of each was represented by a different number of games (figure 13).
Figure 13: The number of games for different genres
According to the figure, the most common AR game genre for “Action” with total 55
games which made up 51% of the total game genres’ share (figure 14) and which was
more than double of the number of “Casual” games that counted up to 21 occupying
only 19% of total share. The remaining 30% were distributed among the rest of the
genres, where 2% went to the “Racing” genre and 3% to the “Lifestyle” games being
the least frequent AR game genres on Android platform. Every second game
application build by developers were of “Action” genre.
Figure 14: The share of AR game genres
After separating the games by approach and by genre we can see the number of games
that represented each approach in each genre (figure 15). The proportion of each
approach for each one of game genres can be observed in side-by-side bar charts
(figure 16). Judging by the number of “Action” games, we can see that the majority of
AR games belonged to this genre regardless of the approach that was used in them. It
appears that marker-based approach was more frequently used in almost every genre
except for the slight 9% lose in “Action” category where Location-Based games were
represented by 22 games which occupied 49% out of total number of “Action” games.
In the “Casual” genre the Marker-Based games were just slightly more dominant with
10 games that corresponded to 48% of total rate compared to 9 Location-Based games
that occupied 43% of all “Casual” games. For the other game genres we can clearly
observe the major dominance of Marker-Based games. Nearly 90% of “Puzzle” games
were using the markers and around 80% of “Sports games” were based on marker-
system as well. Besides the total proportion, we can see that Marker-based approach
55
21
9
11
3
7
2
0 10 20 30 40 50 60
Action
Casual
Puzzle
Sports game
Lifestyle
Entertainment
Racing
# of Games
51%
19%
8%
10%
3%
7%
2% Action
Casual
Puzzle
Sports game
Lifestyle
Entertainment
Racing

20
was represented by 9 “Sport” games which made it the 3rd
largest genre type for this
approach. Twice as many (67%) of “Lifestyle” games were using the marker system
compared to 33% of location-based ones. The “Entertainment” category was
represented by 2 approaches with the 67% rate of marker-based games and 33% rate
of location-based games. All of the “Racing” games were using the marker system.
The slightly less frequently encountered “Puzzle” genre was represented by 8 marker-
based games which made up around 90% of all “Puzzle” games. The least frequently
encountered game genres included “Entertainment” genre with 4 representatives and 2
games for each ”Lifestyle” and “Racing” genre. However, this small number of games
occupied the larger proportion compared to the number of representative games from
other AR approaches. Regardless of the domination of Marker-Based games, the
Location-Based games were significantly more frequent than the “Other” approach
games that were rarely encountered. We can see that the rate is somewhat equally
distributed among the 3 game genres (“Action”, “Casual” and “Sports game”) with the
rate of 11% in “Action” genre which was slightly larger compared to 9% rate for both
“Casual” and “Sports” genre, while being completely absent in the other genre
categories. There were totally 9 games that used “Other” approach with 6 games of
“Action” genre, 2 of “Casual” and 1 of “Sport game” genre. In general, we can see
that the variation of gameplay type is somewhat biased, being much more dominant in
“Action” and “Casual” game genres and being almost completely absent in other
genres.
Figure 15: Frequency of games of each genre per AR approach.
Figure 16: Frequency of games of each AR approach per genre.
22
10 8 9
2 4
2
27
9
1 1 1 3
0
6 2
0 1 0 0 0 0
5
10
15
20
25
30
Marker-Based Location-Based Other
0,4 0,48
0,89 0,82 0,67
0,57
1
0,49 0,43
0,11 0,09
0,33 0,43
0 0,11 0,09
0 0,09
0 0 0 0
0,2
0,4
0,6
0,8
1
Marker-Based Location-Based Other

21
To get a more specific overview of the genres for 3 approaches, the pie charts in figure
17 can be observed.
Figure 17: Dominance of game genres per approach
From the figure we can see that “Action” games were the most common for all three
categories with 64% for Location-Based, 39% for Marker-Based and 67% of share for
other approaches. This genres’ share occupies more than half of the total genre
distribution in Location-Based approach being the most frequently encountered game
genre in this category. It was nearly 3 times as frequent as the “Casual” games, while
the other genres occupied only 14% of the total share. In marker-based games, the
“Sports”, “Puzzle” and “Casual” games were almost equally frequent, in total,
occupying roughly 50% of the total share of genres for this approach. The remaining
share was divided between “Racing”, “Entertainment” and “Lifestyle”. While most of
the games that used the “Other” AR approach were of “Action” genre, there were still
22% and 11% of games in “Casual” and “Sports game” genres respectively.
In order to use the phone appropriately to achieve the AR effect, some of the phone
features had to be accessed and manipulated by the game application. The required
access to the phone features were presented for user confirmation when the user would
actually install the games. The information about the requests for access to different
phone features was recorded and displayed as a bar chart (figure 18).
Figure 18: Bar chart that shows the # of games that requested access.
53
102 104
71
33
54
4 1 5 1 0
20
40
60
80
100
120
Type of Required Access

22
The major part of the studied games, which was counted as 102 games or more than
90% of all studied games, required the access to the “Network Communications” and
they required the access to “Hardware controls” which included the usage of camera
features and audio settings. The “Phone calls” feature for saving the data in case if the
game process was interrupted by the phone call, was required by 66% of games.
There were 50% of games that needed to control “System Tools” which allows the
modification of network connectivity and screen turn on/off properties all of which in
their turn affect the phone’s battery life and thus the applications that need this access
might be energy draining. Around 50% of games needed access to the phone’s
storage in order to modify (add/delete) information from the memory card. The GPS
location that lets the application to know where the user is provided by the “Your
location” permission and it was requested by 31% of the studied games. There were
several games that needed access of somewhat “dangerous” phone features. For
example, the “Services that cost you money” permission allows the application to
make phone calls and it was requested by 4% of games. The “Your messages”
permission is similar to the previous one, in terms of that it performs actions like
sending messages that would cost you money and this kind of access was requested by
only 0.09% of all games which is an insignificant amount. The “Your personal
information” is somewhat unusual permission to be requested by a game, since most
commonly it’s used by messaging applications, however it was requested by 5% of the
studied games. There were also 0.09% of games that needed access to the User’s
accounts.
Some of the permission requests could indeed be harmful to the mobile device or
to users personal information confidentiality in one sense or another, so in order to
detect if the game application deserves to be trusted the access to the phone features,
it’s wise to evaluate the user reviews as well as the number of downloads and rating
for the game of interest before the installation. Those particular aspects are examined
in the section 4.2 of this paper.
Some of the tested games had proper AR effect but in some cases the additional
technical aspects or features were omitted, the presence of which would otherwise
improve the gameplay experience. In particular the games were tested for the presence
of the features like multiplayer mode, sound effects triggered when interacting with
the virtual objects and the 3D position of those virtual objects in space. The result of
the game tests for three different game features was recorded for each one of the
games and summarized in the table (table 5).
Table 5: Table with number of games with features of interest
3d Multiplayer Sound Effects
Marker-Based 55 5 46
Location-Based 34 9 22
Other 0 0 4
Total 89 14 72
In the figure 19 we can see the number of games with one of the features.
Figure 19: Number of games with features of interest
72 89
14
0
50
100
Sound Effects 3D Multiplayer mode
Sound Effects 3D Multiplayer mode

23
The proportion of the games with noted features to the total number of studied games
can be seen in the figure 20.
Figure 20: Proportion of games with features of interest
According to the results of testing, we can see that 72 games or 67% of the total
number of games had the sounds when the player interacted with the virtual objects
giving the game a proper appeal and more noticeable feedback. 89 out of 108 or 83%
of the games were noted to have the 3D object positioning. The absence of the 3D
mode was noticed mostly in the games that could hardly live up to the AR definition
that was previously described in the paper. Most of those games were simply using the
camera view as a game background. Some of the games were using the Google map as
a gaming ground with virtual objects positioned on top of that 2D map and the users’
positions would be determined by the GPS. As noted from observation, only 14
games, which accounted for only 13% of the total number of examined games, had the
multiplayer mode that would allow multiple players to participate in the game session
either through a network or by taking turns on the same device. We can say also
conclude that only 9 out of 10 AR games did not have the multiplayer mode and
roughly every 7 and 8 games out of 10 had the sound effects and the 3D mode
respectively.
Separating the games with features by approach we can see in what approach-
based games those features were most commonly encountered (figure 21) and what is
the total share of the games with futures from the total number of the games that used
one of the 3 approaches (figure 22).
Figure 21: Number of games with features per approach
67%
83%
13%
0%
20%
40%
60%
80%
100%
Sound Effects 3D Multiplayer Mode
Sound Effects 3D Multiplayer Mode
55
5
46
34
9
22
0 0 4
3d Multiplayer Sound Effects
Marker-Based Location-Based Other

24
Figure 22: Proportion of games with features per approach
As we can see from those 2 figures with bar charts, the marker-based games has a
bigger frequency of having the 3D and Sound Effects features 55 and 46
representative games which make up 96% and 81% from the total number of marker-
based games respectively. When it comes to the Location-Based games, 34 games had
the 3D and 22 games had the sound effects which were accounted for 83% and 54%
from the total number of the games that used this approach. Even though, the games
that were based on the Other AR approach had a questionable AR effect, they still had
sound effects in 4 out of 9 cases which accounted for 44% of all Other-based games,
while the other 2 features were completely absent.
Some of the games had more than one of those features implemented in one
game while some of the games did not have either one of them. The number of games
having different features was counted and summarized in the table (table 6). Where,
SE = {Games with Sound Effects}
3D = {Games with 3D object positioning}
MM = {Games with Multiplayer Mode}
Table 6: Number of games with features of interest
SE 3D MM SE U 3D 3D U MM MM U SE MM U SE U 3D not(MM U SE U 3D) Total
# of Games 6 23 2 56 2 2 8 9 108
Using the data from the table, the Venn diagram was constructed for easier
understanding of the presence and absence of game features (figure 23).
Figure 23: Venn diagram representing Number of games with features of interest
96,00%
9,00%
81,00% 83,00%
22,00%
54,00%
0,00% 0,00%
44,00%
3d Multiplayer Sound Effects
Marker-Based Location-Based Other

25
From the Venn diagram we can see that 6 games had only sound effects and no other
features. Another 23 games had 3D positioning only. There were 2 games did not have
neither sound effects nor 3D, however they had multiplayer mode. Another 56 games
had only 3D and Sound Effects. There were also 2 games that had both multiplayer
mode and sound effects and another 2 games that had multiplayer mode and 3D object
positioning. Considering the total amount of tested games there were a very few
games that had all three features present at the same time. There were only 8 out of the
108 games had Sound Effects, Multiplayer Mode and 3D positioning which is only
7% of all games. There were also 9 games that did not have either one of the features
where 5 of those games were based on the “Other” AR approach which actually
explains the absence of those features due to the poor AR implementation quality of
those game applications.
The runtimes for all 108 games were measured and recorded into the table. The
result of the measurements can be observed as the two bar-charts merged into one
graph for a better comparison (figure 24).
Figure 24: The bar-charts that display the FPS for each game separating them by AR
approach
From the figure above we can see that the majority of games that were using the
Location-based approach were running at more than 35 FPS while the majority of the
Marker-based games were running at less than 35 FPS. There was one outlying
Location-based game that showed the lowest result that was observed during testing
which approximated to fall within the interval of 10 to 15 FPS.
The games that were tested in this research had different distribution type. They
could either be freeware or payware. The freeware are the game applications that are
free to be used without any additional cost. Even though the freeware games held the

26
majority, there were some games that had the payware status meaning they were
developed as commercial software and they were required to be purchased (figure 25).
Figure 25: Number of games of different distribution type
From the bar chart above we can see that 91 games were freeware which corresponds
to 84% of all studied games. There were 17 games or in other words 16% of all games
that were distributed as a payware (figure 26).
Figure 26: Share of games of different distribution type
Taking a closer look at the payware and freeware games by separating them by the AR
approach we can note that every 8 marker-based and location-based games were
freeware, while the games that were using other techniques were distributed for no
commercial purposes (figure 27).
By taking a closer look at the AR approaches distinguished by distribution type
we can conclude that for every 10 AR games that were Location- or Marker-Based,
roughly 8 games were freeware which clearly shows the domination of this kind of
distribution on the platform. The games that were based on the Other-approach were
fully freeware.
Figure 27: Number of freeware/payware games for each AR approach
91
17
0
50
100
Freeware Payware
Distribution type
84%
16%
Freeware
Payware
48
34
9 10 7 0
0
20
40
60
Marker - Based Location - Based Other
Freeware Payware

27
When it comes to the payware games there is a specific price for each one of them.
The prices for the payware game applications were summarized and analysed (table
7).
Table 7: Overview of payware prices
Prices
Mean 10,8
Min 7
Max 16,99
Std.dev 3,86
Num 17
The average price of the payware game, judging by the total 17 payware games, was
at around 11 SEK with the minimum price of 7 SEK and the maximum price of ca. 17
SEK. The prices varied with standard deviation of 3.8 SEK.
From the bar chart (figure 28) we can see that the majority of payware games’
prices were at around 7 SEK with only 3 games having the price of ca. 16 SEK. In the
majority the user was asked the smallest possible price for this kind of game
applications.
Figure 28: Bar chart of prices
The full table of collected information about games, their runtimes and the AR
approaches that were used in them can be seen in the Appendix 1 section of this work.
After studying the technical aspects of the AR games and taking a look at the prices
we can proceed with examining the results received from the user studies.
4.2 Result of User Studies
The reviews were studied for as many games as possible. To be more specific, only 61
out of 108 games which is only 55% had a sufficient number of reviews in order to
calculate a representative proportion. In other words, roughly every second game was
not sufficiently reviewed to give an opinion. If the proportion of either review
affiliation (positive or negative) was larger than the proportion of other affiliation then
the game was considered to be reviewed according to the affiliation that had larger
proportion. From the games that actually were reviewed there were 37 positive and 23
negative reviewed games in total, which correspond to 61% and 38% respectively.
There was 1 game that had equal number of both positive and negative reviews
9
0
1
0 0
3
2 2
0
3
7-8 sek 8-9 sek 9-10 sek
10-11 sek
11-12 sek
12-13 sek
13-14 sek
14-15 sek
15-16 sek
16-17 sek
# of games

28
resolving in a tie situation but for the analysis we disregard this reviewed game, since
we are only interested in positive and negative reviews (Figure 29).
Figure 29: Proportion of good, bad and “equal” reviews
By taking a look at the proportion of bad and good reviews separated by the approach,
we can see that in general the proportion of good reviews is larger than the proportion
of bad reviews for all three approaches (figure 30), however the proportion of bad
reviews is significant, since we can conclude that in general only 6 out of 10 games
were positively accepted by the users. For the Location-Based and Marker-Based
approaches there were 58% and 69% of positively reviewed games, while for the
“Other” approach the negative reviews were dominant with 60% of share. Even
thought the percentage of bad reviews is very significant, the Marker-Based games
still tend to be more positively accepted than other approaches, regardless of the fact
that the user have to print the actual marker in order to play the game.
Figure 30: Bar charts and pie charts displaying the proportion of good and bad reviews for
each AR approach.
38%
61%
1%
Negative
Positive
Tie

29
Generalizing the reviews into Positive and Negative categories was done using the
comparison of reviews’ proportions. So, if the proportion of good reviews was larger
than the bad reviews’ proportion then the game was considered to be generally
positively reviewed, otherwise it would be categorized as the negatively reviewed one.
But before generalizing the reviews, their frequencies of appearance were counted
(figure 31).
Figure 31: Bar charts and pie charts displaying the proportion of good and bad reviews for
each AR approach.
From the graph above we can notice some similarities between percentages of both
bad and good reviews. For both review categories the number of reviews tended to be
in the intervals from 30-40% and 60-70% of affiliation. Meaning that from 30% to
40% of the reviews for 11 games had a positive acceptance and for the same
percentage interval there were 14 games that had negative acceptance. The 60-70% of
reviews were negative for 12 games and positive for 16 games. There were 3 games
that fell in the 90-100% interval meaning that they were nearly fully positively
accepted by the users.
Besides the positive and negative reviews there were also user feedbacks that
complained about some technical aspects, whether it was some object positioning
problem or compatibility problem that made it impossible to properly run the game.
The technical complains were very probable reasons of the bad game reviews and thus
the proportion of technical complains to the total number of bad reviews per each
game was calculated and represented as percentage intervals as well(figure 32).
Figure 32: The bar chart that displays the number of games with different proportion of
technical complains to the bad reviews.
3 2
0 2
0 2
0 2
6 6
0 2 4 6 8
Frequency
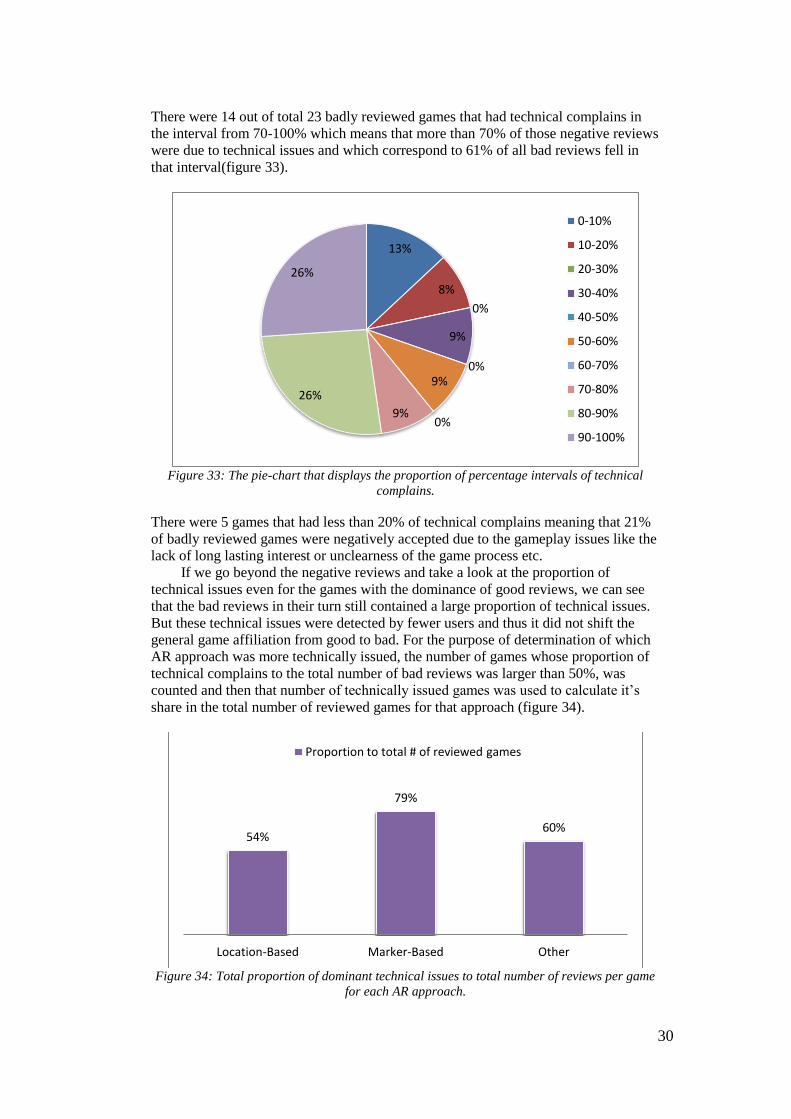
30
There were 14 out of total 23 badly reviewed games that had technical complains in
the interval from 70-100% which means that more than 70% of those negative reviews
were due to technical issues and which correspond to 61% of all bad reviews fell in
that interval(figure 33).
Figure 33: The pie-chart that displays the proportion of percentage intervals of technical
complains.
There were 5 games that had less than 20% of technical complains meaning that 21%
of badly reviewed games were negatively accepted due to the gameplay issues like the
lack of long lasting interest or unclearness of the game process etc.
If we go beyond the negative reviews and take a look at the proportion of
technical issues even for the games with the dominance of good reviews, we can see
that the bad reviews in their turn still contained a large proportion of technical issues.
But these technical issues were detected by fewer users and thus it did not shift the
general game affiliation from good to bad. For the purpose of determination of which
AR approach was more technically issued, the number of games whose proportion of
technical complains to the total number of bad reviews was larger than 50%, was
counted and then that number of technically issued games was used to calculate it’s
share in the total number of reviewed games for that approach (figure 34).
Figure 34: Total proportion of dominant technical issues to total number of reviews per game
for each AR approach.
13%
8%
0%
9%
0% 9%
0% 9%
26%
26%
0-10%
10-20%
20-30%
30-40%
40-50%
50-60%
60-70%
70-80%
80-90%
90-100%
54%
79%
60%
Location-Based Marker-Based Other
Proportion to total # of reviewed games

31
It appeared that the Marker-Based games generally received more technical complains
than other AR approaches. There were 79% of all reviewed marker-based games that
had more than 50% of technical complains per each. We can conclude that roughly 8
out of 10 marker-based games had technical issues. The much smaller percentage of
Location-Based games caused any technical complains from users where only 54% of
reviewed games were technically issued to some extent. There were also 60% of
reviewed games based on “Other” approach that had technical complains. Considering
the data from the bar chart it’s clear that the marker-based games are still in need of
improving the technical stability.
Another important factor that could influence the users to choose the game was
the total number of times the game was installed by other users, meaning that the
larger is the number the more popular the game is and the more reliability it gives to
other users to try it out for themselves. In the figure 35 we can see the number of
games with different number of installs by users.
Figure 35: The number of installs by the users.
We can see that the major part or 58 of games had been installed at least 1000 and at
most 50000 times. This makes up to 53% of the total number of installs for all studied
games (figure 36).
Figure 36: The proportion of installs by the users.
1
6 4
17
5
22
10
26
5 8
2 2
# of Installs
1%
5% 4%
16%
5%
20% 9%
24%
5%
7%
2% 2% 1-5
10-50
50-100
100-500
500-1000
1000-5000
5000-10000
10000-50000
50000-100000
100000-500000
500000-1000000
1000000-5000000

32
From the pie chart we can see that only 4 games were popular enough to gather at
least 500000 installs with the maximum at 5 million installs. Those 4 games occupied
only 4% percent of the total number of installs. About 26% of the studied games were
downloaded less than 500 times which means that roughly every 3 out of 10 examined
AR games were hardly known by users or were of unreliable quality.
The number of installs for both distribution types of games can be seen in the
figure 37.
Figure 37: The proportion of installs by the users for each distribution type.
From those pie-charts we can see that for payware games there were no particularly
popular games that had the number of installs above 50000. Out of those games 70%
had at most 5000 installs only. While, taking a look at the freeware games we can see
a larger popularity. For the freeware games there were noticed 2 games that had been
installed at least 1 million times. Those games were “Parallel Kingdom” which was a
multiplayer online game and “Red Bull AR Reloaded”. In its majority, the freeware
games were more popular. In 50% of cases the games were installed at least 10000
times and in 25% of cases there were at least 50000 installs while this number of
installs was not even detected among the payware games. In only 6% of freeware
games there were at most 100 installs, while among the payware games this
percentage was 5 times larger being 29% percent of all payware games. The detailed
number of installs for both payware and freeware can be observed in the Appendix I.
One of the important aspects that might influence the users’ opinion about the game is
the game’s rating that was set by other users. In the figure 38 we can see the most
common ratings for the AR games on Android platform. The ratings were only
collected from the games that had at least 5 votes. The games with fewer votes were
disregarded due to the lack of representativeness. In total the ratings from 81 games
were collected.

33
Figure 38: Number of games for each rating.
According to the graph the majority of games were given the rating “3”. While almost
half of that amount were given rating “4”. There was one game called “Destroyer AR”
which was based on the “Other” approach and that was given rating “1” (the lowest
possible) which made up 20% of the total games of this approach and that most likely
depended on the technical issues of this game that was based on the Other AR
approach. If we take a look at the proportion of game ratings to the total number of
rated games per approach (figure 39) we can see that biggest proportion of games for
all AR approaches had the rating of “3”. For instance, 60% of Location-based games
had rating “3” while only twice as few games based on that approach had rating “4”.
Figure 39: Proportion of games for each rating separated by approach
1
8
46
26
0
1 2 3 4 5
# of Games
0
0,1
0,6
0,3
0 0
0,12
0,55
0,33
0
0,2
0
0,5
0,3
0
1 2 3 4 5
Location-Based Marker-Based Other

34
Since the games were distinguished by different genres, we can take a look at how the
ratings were distributed among those genres (figure 40).
Figure 40: Rating distribution for each game genre.
Both “Action” and “Casual” games’ median ratings were set around 3.5, while the
ratings for “Casual” games were much more consistent judging by the spread of
distribution. However, both genres had some outlying games with uncommonly low
for that genre rating. The outlier for “Action” genre had the rating of 1.7, while the
outlier for “Casual” game had the rating of 2.3 which was even higher than the
extreme value of “Action” game which laid at 2.2. In general, the main distribution of
both “Casual” and “Sports” genres were similar where the second one received
slightly higher ratings. For the “Puzzle” genre, 50% of games had the rates in the
interval from 2.9 and 4.4 which corresponds to the lowest rating consistency among
other genres. 25% of “Puzzle” games received rating lower than 2.9 which is the
largest amount out of all genres. The “Entertainment” genre had the most clustered
distribution of rating compared to other genres, which depends on the insufficient
number of encountered games from this category compared to the studied games of
other genres. However, all of the rating for this genre was set above 3.4 with the
median rating positioned at 3.8 which is the highest detected median rating among all
studied genres.
The representation of game rating for “Racing” and “Lifestyle” games were
disregarded due to insufficient amount of user votes that determined the game rating
which was less than 5 votes. The complete table with data about user opinions and
game ratings and number of installs can be found in Appendix 2 section.
5 Discussion When the research in the AR field just began, it always required a lot of expensive and
bulky hardware which made the games based on that technique non-mobile and
inaccessible for the broader audience. Compared to the regular non-AR gaming
session where the user interacts by simply pushing the buttons, in the AR games the
actual interaction between the user and the virtual world is provided by making the
spatial position of the user to become a part of the gameplay. With the increased
computational power of the modern mobile devices the possibilities in terms of
technological solutions in achievement of completely new style of human computer
interaction can become much broader for developers to realise the creative and

35
innovative ideas. The ideas that were analysed in this paper also varied in both
approach and the implementation quality.
5.1 Discussion of the games tests’ results
According to the test results that can be observed in the figure 12, it was
discovered that Marker-Based approach was used in more than 50% of mobile AR
games, being the most frequently encountered AR approach for games on Android.
The location-based games were somewhat less frequent being encountered in roughly
40% of cases. There were, however, around 10% of games that were "pretending" to
be using the AR technique, in terms of using the camera view as a game background,
where the virtual objects were not actually integrated into the real world or in other
words they were not positioned according to the processed data received from that
camera view. They were perhaps more like a misunderstanding of how the AR games
should be structured and what goals they should fulfil.
When it comes to the game genres, we can see some tendencies that the AR
games have. According to figure 17, more than 50% of all studied games turned out to
be of "Action" genre and only around 20% of games were “Casual” genre whereas the
“Racing” was almost completely absent from the AR game genres being only
encountered 2 times where one of them could not be even called proper AR. That
tendency makes it possible to conclude that the game developers do not stray too far
away from the general stream of game design ideas. It means that the outreach of the
experiments in terms of innovative gameplay is currently very narrow. The more
equally distributed frequency among the genres would mean the larger variation of
games on the market to choose from. The variety of genres, however, is related to the
AR approach that is used in the games. The game genres for Marker-Based games are
more diverse according to figure 16, meaning that the gameplay of those games are
more spread in terms of design solutions. Even though the “Action” games still
occupied nearly 40% rate of the total genres’ share, the marker-based games, however,
included a somewhat equal share between “Casual”, “Puzzle” and “Sports” game
genres offering users more variety of game design solutions compared to Location-
based games. This perhaps depends on the fact that the usage of marker can open up
some creative design ideas for developers due to the virtual object positioning attached
to the marker positioning which can be regulated by the player and that in its turn
offers more interactivity than the “location” games. In the location based-games the
“Action” genre occupied 64%, whereas “Casual” games took other 22% of the total
share of games based on this approach leaving only 14% for the games of other
genres. So in general, 8 out of 10 games would either be “Action” or “Casual” which
does not offer so much variety from game to game. The games based on another “AR”
approach was only represented by 3 genres which included nearly 70% of “Action”
and the remaining share was divided between “Casual” and “Sports” genres. The
drawback of all AR games on Android is their limitedness in the variety of gameplay
styles, meaning that most of the games are made in the similar genre which means a
very poor variety of gameplay styles from one game to another.
Since on the Android platform the user is the one who allows the application to
access the phone features by permitting some of them when required, the information
about those requirements was recorded and analysed. According to the results of the
analysis depicted in the figure 18, as expected, more than 90% of all AR games
required access to the camera that was provided by the “Hardware controls”
permission and which in its turn is the main idea behind the AR which is
augmentation of the virtual objects to the real world data received from the camera.
The access to network communications was required by the majority of AR games and
that was used, for example, to download online updates. During the user reviews’
analysis performed in this work, it appeared that the users concerned about the
questionable permissions that the game asks access to and which might make the
mobile device vulnerable or exposed to threats. The main concerns were triggered by

36
the permissions that would allow the application to use the features that might cost
money or to access the account data and the data on the internal storage of the phone.
Perhaps, some of the complaints about some of those permissions were due to the lack
of the understanding of what those permissions actually do and how much influence
the applications might get by getting that access. In fact, some of the truly so called
“dangerous” features like account data and monetary spending permissions were only
encountered in only 4% of cases making them very rare to be encountered at all.
During the analysis, the complaints about the permission were integrated as a part of
the technical complains about a game and they were analysed as a whole.
The important things that in combination with technical stability and decent
gameplay might greatly improve and broaden the game experience could be, for
instance, the sound effects, 3D object positioning and multiplayer mode. Those
features were chosen to be analysed because in case of 3D it was interesting to
determine how many games were actually using the 3D object positioning and if the
2D positioning was considered by developers when creating the AR games and which
one of them was more popular. According to the results represented in the figure 20,
the sound effects were detected in quite fewer games than it would be expected. It was
noted 33% of studied games did not have any sounds which means that 3 out of 10
games were without any audible feedback that would provide the user with the more
realistic and noticeable feedback to his actions and the absence of which would make
the gameplay sessions somewhat tedious due to the complete muteness. The 3D mode,
which corresponded to the virtual object positioning in the 3D coordinate system, was
present in most games. The frequency of 3D occurrence corresponded to 83% or in
other words, roughly 8 out of 10 games were using the 3D object positioning leaving
the remaining share to the 2D AR games and the 2D non-AR games that simply used
camera video as a background. The 3D AR games are currently more frequently
encountered compared to 2D AR games meaning that the variety of 3D games is much
broader than the variety of 2D games. The multiplayer mode was, on the other hand, a
very rare feature that could be found in AR games. It was encountered in only 13% of
the studied games or in other words only 1 out of 10 games had the multiplayer mode.
This actually means that at this stage of game development the AR games are mostly
dedicated to the single player use. The gameplay styles were more concentrated on
achieving somewhat simple game goals that would not require assistance of multiple
users. There were only 8 out of 108 games that had all 3 features detected in one game
or in other words, 1 out of 10 games had all three technical aspects which account for
only 8% of total share.
By taking a look at those features for each AR approach separately in the figure
22, we can see that marker-based games were more frequently noticed to have those
features compared to other two approaches. Especially, if in Marker-based games the
presence of sound effects was detected in 8 out of 10 marker-based games whereas
only 5 out of 10 location-based games had any sound effects. As expected, the games
that used neither one AR approach had neither multiplayer mode nor 3D object
positioning, however the sound effects were present in 44% of them. So, in general
the marker-based games are more technically advanced in terms of additional
technical features than other AR games.
Another distinguishing factor between the AR games for Android was the
distribution type that could either be payware or freeware. By taking a look at the
figure 26 we can see that the distribution type’s share was equal for both Marker- and
Location-based games but in general, the proportion of freeware games was
significantly larger than the payware proportion meaning that roughly 8 out of 10
games were distributed without any charge. So, the developers of Android
applications were not concentrated on implementing an AR game for
commercialization purposes. This fact, in its turn, should broaden the audience due to
the increased accessibility of AR applications available for testing without any

37
additional charge and that would probably increase the audience and increase the
interest rate in this kind of games.
According to the figure 28 the average price for a payware game was
approximated up to 11 SEK with standard variation of 3.9 SEK whereas 50% of
payware games’ prices were below 10 SEK. The prices for the games varied
depending on the popularity of the brand. For example, the price for “The
Ghostbusters: Paranormal Blast” was around 13 SEK and which depended on the
popularity of the franchise compared, for instance, to the “Lunar Eclipse” whose price
was only 7 SEK. The prices for the more popular brands or for the games that were
developed by more famous developers were larger due to reliability factor. It means
that the quality of the games based on the popular brands would be expected to be
better than the quality of the non-famous brands.
The runtimes can simplify the understanding about what approach is more
computationally heavy and thus which one of them requires a more powerful
hardware. Since the FPS is the speed of refreshment of the image, it plays an
important role in the perception of the game process and in particular in the AR games
where each millisecond matters. The proper refreshment rate is crucial in order to
provide a smooth augmentation of the virtual objects into the constantly changing
orientation of the camera’s view when the user moves the mobile device around in
order to observe the surroundings. Thus the measurement of FPS for each of the game
applications was important to compare the refreshment rate for both AR approaches.
Since 24 FPS is the minimum for the human to perceive the sequence of images as a
moving image. But the closer the FPS is to 60 FPS which is the average FPS the eye
can perceive the smoother and more natural is the game process [22]. As we can see
from the test results depicted in the figure 24, the optimization issues are especially
noticeable for the Marker-based approach where the majority of games were
performing at less than 35 frames per second with an average of 31.5 frames per
second. If we compare those results to the location-based approach we can see the
significant superiority of the location based approach that in the majority of cases
performed with more than 35 FPS with an average of 42 frames per second offering a
somewhat smoother performance in AR gaming applications.
5.2 Discussion of the users’ reviews analysis
The users’ opinions can influence greatly the choice of other users whether to
play the game or not. However not all of the games have the user reviews to guide the
other users choice. Approximately, every second game did not have enough reviews to
represent the quality of the game experienced by other users. The games with more
than 5 reviews were considered as representatively reviewed in this work. As
previously mentioned the reviews were divided into positive and negative categories
because the reviews in general were either fully positive or fully negative without
intermediate steps that might represent neutral opinion. From the analysis results
depicted in the figure 29, it appeared that only 2 out of 3 games were of satisfactory
quality in both gameplay and technical performance which is a quite low result. From
the overall percentage of positive reviews represented in the figure 30, the main share
or to be more precise 55% of all reviewed games was occupied by the marker-based
ones. Further on, from the total number of reviewed marker-based games, 70% were
positively accepted whereas for location-based games the positive acceptance rate was
slightly less than 60%. The user reviews statistics prove that, in general, the marker-
based games are more positively accepted offering a more satisfactory gameplay and
technical performance compared to the Location-Based games.
When it comes to the user feedbacks about technical stability, the compatibility
issue is very common, which makes some of the games completely unplayable on
some mobile devices. As we can see from the figure 33, it appeared that the majority
of games that tended to be negatively reviewed, mostly had the presence of technical
complains. Every 6 out of 10 AR games were negatively reviewed due to technical

38
problems. According to the figure 34 we can see that the main proportion of technical
issues occurred in mostly Marker-Based games where nearly 80% of reviewed games
based on that approach were mostly negatively reviewed due to technical issues. The
Location-Based games appeared to be much less troublesome in terms of technical
issues where roughly 5 out of 10 location-based games were overwhelmed by
technical complains. The most frequently encountered problem with Location-based
games besides incompatibility issue was the unstable object positioning. It was
especially actual for the shooter games where the virtual objects would flicker and get
stuck somewhere in space, making the game impossible to play. For the marker-based
games the incompatibility issue was also not the only issue with that approach.
The unstable marker tracking was very frequently noticed both during testing of
the games and the analysis of user reviews. That instability led to the shaky gameplay,
meaning that the movement of the camera was very sensitively affecting the proper
marker detection, which led to the frequent disappearance of the digitally generated
game plane on top of the marker. The problem with marker depended greatly on the
screen size of the mobile device. The larger screen size would allow observing a larger
game area without the need to constantly move the camera around to see other parts of
that area. The screen size would also be more suitable for location based games as
well offering the larger area around the user that can be observed at once. This
suggests that the AR would perhaps be more suitable for the tablets that have the
screen big enough to cover a larger area of interest in the virtual world.
Judging by the results of the performed analysis many of the AR games were still
in the experimenting phase, meaning that the developers, by trying to integrate the AR
technology into the game, resulted in raw, but mostly positively accepted games. The
gameplay styles were somewhat positively accepted because according to the figure
32 only less than 20% of negatively reviewed games were due to the non-technical
problems. Those problems had to do almost entirely with the gameplay issues.
However, the proportion of unstable and technically flawed games was still large
enough to decrease the amount of trust in the AR field and thus repulse the desire of
users to slightly stray away from the regular mobile games and try the AR games out
as well.
One of the advantages of location-based games over marker-based ones was that
the digital distribution of the location based games seemed more simplistic than of the
marker-based games due to the absence of needing the physical marker that actually
was required to be downloaded and printed in order to trigger the game. For the
location-based games, the only thing the user had to do was to install the game and
play it basically everywhere without the need of any additional required game
materials. However, the marker aspect would, in some cases, make marker-based kind
of games non-mobile. Regardless of the complains about the need of marker to play
certain games, more than half of the available AR games were based on the marker
system, making it the most commonly encountered AR technique (figure 12).
However, the marker-based games might be more compact in terms of that the
gameplay revolves around the position where the marker was placed, while for the
location-based games the user would have to be more physically active making the
player's movements as the basic requirement for the game of that type.
The main and the most obvious definer of how well the game was accepted by
the users was provided by the overall game’s rating. According to the figure 39, the
rating frequency was somewhat similar for both Location-Based and Marker-Based
games that resulted in the similar variation of rating distribution. The average
acceptance rate for games of all AR approaches was around “3” out of “5” possible
points (figure 38).
One of the other defining factors that specifies how well the game is distributed
among the users, could be determined by the number of times the game was installed
by users. The number of installs in some way defines the popularity of the particular
game among the users. The popularity denoted by the number of installs tells us

39
whether the users are ready to pay for this newly, yet not completely discovered game
technology, or not. According to the results of the analysis depicted in the figure 36
and figure 37, around 50% of all studied AR games were installed at least 1000 times
and at most 50000 times. The share of games that were particularly popular with the
number of downloads that exceeded 50000 up to 5 million times were only around
16% of all games, whereas all of those games were distributed as freeware making the
maximum number of installs for payware game applications at most 50000 times.
Perhaps the small number of installs of payware games depends on the uncertainty
that surrounds the usage of AR technology and which leads to the doubtfulness of
satisfaction that could be received from the gameplay session by users. The larger
popularity of the freeware AR games’ might depend on the fact that those games were
distributed without any charge, meaning that anyone can try it without any financial
spending that might not live up to expectations.
5.3 Overview discussion
As mentioned previously in this paper, the AR technology could be used to
broaden the way people perceive information around them. This became especially
topical because the AR applications could be accessed on mobile devices that can
allow users to increase the amount of information they perceive, depending on the
type of AR application of course. However, when it comes to the gaming applications
that use AR, the situation is somewhat different. Many of the AR games suffer from
the poor design choices that make the gameplay not long lasting, while the
implementation in many cases suffer greatly as well. If properly implemented, the AR
has a perspective future amongst many fields of study including mobile games. It
seems like the proper development of AR based games on Android platform and
perhaps other mobile platforms too is just initiating, being at somewhat initial states of
creative and successful design ideas, attempting to make steps into the direction that
would actually make the AR-based mobile games technically stable and capable of
competitiveness with the regular non-AR mobile games. In general, all games are
dedicated to fulfilling the entertaining purposes. Those purposes could be fulfilled by
the regular non-AR games which have a much larger amount of variation in terms of
gameplay styles and the amount of trust they received during the years of their
existence. On the other hand, the AR games offer a somewhat different style of
gameplay, but the amount of repetitiveness in gaming styles is still too large. At this
point of mobile AR’s existence the variation of AR games and their quality still
remains a large issue to be taken into consideration for the future improvement of the
situation in the AR game field.
In this paper the statistical overview of AR games and users’ opinions about
those games was performed for the Android platform taking into account technical
aspects and features of those games. This overview can be used as a basis for
understanding of the current situation around AR on mobile platforms. The functional
stability of every game was tested and the results were analysed to determine the
general stability of AR on Android. Since this paper offers the analysis of nearly all of
the AR games, including the most recent ones, for the Android platform, this work can
later be updated to see if the current AR situation will obtain a more solid structure
and a stable position among the other non-AR games which would make it to become
one of the major and widely accepted game types.
To answer the question about how the AR is used in games, we can say that,
generally it could be used by applying one of the commonly known AR approaches
that use either Location-based or Marker-based techniques. The former one uses
object positioning where the objects are positioned according to the users location.
The later one determines the virtual object positions according to the marker position
and orientation. The games based on each one of those techniques differ in the
gameplay styles. It’s hard to say which one of the two approaches is better when it
comes to the mobile games. Marker-based games have a slightly larger variation than

40
location-games when it comes to the game styles. Both approaches, however, suffer
from the technical issues. However, the majority of the studied games seem to be as
the initial prototypes of the examples of how the AR can be applied as a part of the
game design. There were just a few examples of a sufficiently good AR
implementation. The use of AR in games still seems unnatural compared to the regular
games. The AR gaming with its technical and design challenges still has a long way to
go to become a core member of the game industry.
The previous work that was presented in the scientific papers by other authors
was mostly concentrated on the application of AR technology for the more hardware
demanding approaches. However those works presented much more creativity in
terms of game design solutions and stability of the technical functionality of those
games. In my work I concentrate on the AR application that does not require any
specific hardware except for the mobile phones with Android OS, which is especially
important and timely with the current availability and spread of the powerful mobile
devices in the modern society.
However, my work could be improved by adding the analysis of AR games
available on Apple devices. It’s uncertain if the gameplay variation issue and the
technical complains would be present on the devices that use Apple’s iOS, and thus it
would be interesting to analyse which one of the platforms offer more perspective for
developers to create AR games contributing to the AR gaming field of research. The
contribution would perhaps depend on the fact that the Google Play Market uses
somewhat different distribution policy compared to Apple Store that in its turn is more
advantageous for developers in terms of commercialization.
6 Conclusion In my paper I performed an analysis of 108 mobile AR game applications currently
available for Android platform. The general information and technical aspects about
the games were collected and analysed. During the study some of the major limitations
of the AR games were discovered and the tendencies of the AR game creation were
detected. user reviews were collected and processed to determine the general user
acceptance of the AR games on Android platform and to find the possible reason for
the negative complains. All of the collected data was gathered and summarized as
graphs. In this paper only games were taken into consideration thus the non-gaming
AR applications were not analysed.
The studied games varied in terms of genre and AR approach that was used in
them. The approaches were determined by how the virtual objects were positioned in
real world. They could either be location- or marker depended, while some of the
examples of questionable AR approach were detected as well. Those games used
neither one of the two commonly known approaches. The runtimes for the games of
Location- and Marker-based approaches were measured and studied in order to
understand the computational demands of the approaches.
Since the target audience of the studied AR games was users of the Android
mobile devices, the reviews of the users for the studied games were analysed.
Unfortunately, it was impossible to gather enough reviews due to their absence for
some games and thus the review information only for 61 games was gathered that
corresponds to nearly half of the studied games. The popularity of the AR games was
studied by collecting the data about the number of installs for each one of the games.
The ratings were collected only for those games that had more than 5 votes that
contributed to the average rating. This was done in order to make it more reliable in
terms of difference of opinions that might come from different users. The user reviews
were generally divided into 2 categories. They could either be positive or negative
since the reviews were with a straight meaning and there were no intermediate and
hesitating about the game quality reviews. The information about technical complains

41
was gathered as part of the negative reviews and then their proportion to the total
number of negative reviews was calculated to determine if the negative reviews
mostly depended on the technical issues or some other non-technical aspects that had
to do with the overall game design or gameplay interest. . As it turned out the
technical issues are very commonly encountered in the currently available mobile AR
games on Android platform. In general, the Marker-based games were more variant in
terms of game styles but at the same time they were more computationally heavy and
technically flawed compared to the Location-based games that offered a higher FPS
and less technical complains. Regardless of the different technical specifications of the
AR approaches, the games based on them were somewhat equally accepted by the
users.
After the analysis of the games it turned out that the multiplayer mode is a very
rare feature to be encountered in the modern AR games on Android platform. It means
that game design of the current AR games concentrates on the achievement of the
game goals suitable for single player use only
This work can be used as a basis for the analysis of the gaming applications that
will be released for the Android platform in the future in order to detect if the
unevenness in game style variation will be fixed. The general overview of the current
situation of the AR games can help to understand how the AR is currently used on
Android and if it can become a worthy competitor to the regular non-AR games.
Acknowledgments I would like to express my deep gratitude to my family for their support and
encouragement throughout my study.
References [1] "Revenues for Augmented Reality in Consumer Electronics Industry to Approach
$600 Billion by 2016, Forecasts Semico Research." Newsgroup. BussinessWire. N.p.,
16 Aug. 2012. Web. 10 Apr. 2013.
<http://www.businesswire.com/news/home/20120816006090/en/Revenues-
Augmented-Reality-Consumer-Electronics-Industry-Approach>. (Online; accessed
11-May-2013).
[2] Andersen, T. L., Kristensen, S., Nielsen, B. W., & Grønbæk, K. (2004, June).
Designing an augmented reality board game with children: the battleboard 3D
experience. In Proceedings of the 2004 conference on Interaction design and children:
building a community (pp. 137-138). ACM.
[3] Ardito, C., Buono, P., Costabile, M. F., Lanzilotti, R., & Pederson, T. (2007,
January). Re-experiencing history in archaeological parks by playing a mobile
augmented reality game. In On the Move to Meaningful Internet Systems 2007: OTM
2007 Workshops (pp. 357-366). Springer Berlin Heidelberg.
[4] Azuma, R. T. (1997). A survey of augmented reality. Presence-Teleoperators and
Virtual Environments, 6(4), 355-385.
[5] Azuma, R., Baillot, Y., Behringer, R., Feiner, S., Julier, S., & MacIntyre, B.
(2001). Recent advances in augmented reality. Computer Graphics and Applications,
IEEE, 21(6), 34-47.
[6] Barakonyi, I., Weilguny, M., Psik, T., & Schmalstieg, D. (2005, June).
MonkeyBridge: autonomous agents in augmented reality games. In Proceedings of the

42
2005 ACM SIGCHI International Conference on Advances in computer entertainment
technology (pp. 172-175). ACM.
[7] Big PlayAR, http://www.bigplayar.com , (Online; accessed 29-May-2013).
[8] Billinghurst, M., Poupyrev, I., Kato, H., & May, R. (2000). Mixing realities in
shared space: An augmented reality interface for collaborative computing. In
Multimedia and Expo, 2000. ICME 2000. 2000 IEEE International Conference on
(Vol. 3, pp. 1641-1644). IEEE.
[9] Brown, D. G., Coyne, J. T., & Stripling, R. (2006, March). Augmented reality for
urban skills training. In Virtual Reality Conference, 2006 (pp. 249-252). IEEE.
[10] Caillois, R. (2001). Man, play, and games. University of Illinois Press.
[11] Caudell, T. P., & Mizell, D. W. (1992, January). Augmented reality: An
application of heads-up display technology to manual manufacturing processes. In
System Sciences, 1992. Proceedings of the Twenty-Fifth Hawaii International
Conference on (Vol. 2, pp. 659-669). IEEE.
[12] Cheok, A. D., Wan, F. S., Yang, X., Weihua, W., Huang, L. M., Billinghurst, M.,
& Kato, H. (2002). Game-city: A ubiquitous large area multi-interface mixed reality
game space for wearable computers. In Wearable Computers, 2002.(ISWC 2002).
Proceedings. Sixth International Symposium on (pp. 156-157). IEEE.
[13] Cho, K., Kang, W., Soh, J., Lee, J., & Yang, H. S. (2007). Ghost hunter: a
handheld augmented reality game system with dynamic environment. In
Entertainment Computing–ICEC 2007 (pp. 10-15). Springer Berlin Heidelberg.
[14] Cooper, N., Keatley, A., Dahlquist, M., Mann, S., Slay, H., Zucco, J., ... &
Thomas, B. H. (2004, September). Augmented reality Chinese checkers. In
Proceedings of the 2004 ACM SIGCHI International Conference on Advances in
computer entertainment technology (pp. 117-126). ACM.
[15] EdgeLib, http://www.edgelib.com, (Online; accessed 27-April-2013).
[16] Fan, J. C., Jacobsen, J., Ronzani, P. A., & Pombo, S. (2002). U.S. Patent No.
6,452,572. Washington, DC: U.S. Patent and Trademark Office.
[17] Fenn, J., & LeHong, H. (2011). Hype cycle for emerging technologies, 2011.
Gartner, July.
[18] FPSMeter, https://play.google.com/store/apps/details?id=com.aatt.fpsm , (Online;
accessed 27-May-2013).
[19] Gerla, M. (2005). Ad Hoc Networks. Ad Hoc Networks, 1-22.
[20] Google Play Market, play.google.com , (Online; accessed 24-May-2013).
[21] Google Glass, www.google.com/glass/start/, (Online; accessed 19-May-2013).
[22] Haggard, E. A., & Isaacs, K. S. (1966). Micromomentary facial expressions as
indicators of ego mechanisms in psychotherapy. In Methods of research in
psychotherapy (pp. 154-165). Springer US.

43
[23] Huynh, D. N. T., Raveendran, K., Xu, Y., Spreen, K., & MacIntyre, B. (2009,
August). Art of defense: a collaborative handheld augmented reality board game. In
Proceedings of the 2009 ACM SIGGRAPH symposium on video games (pp. 135-142).
ACM.
[24] Höllerer, T., & Feiner, S. (2004). Mobile augmented reality. Telegeoinformatics:
Location-Based Computing and Services. Taylor and Francis Books Ltd., London,
UK.
[25] Lam, A. H., Chow, K. C., Yau, E. H., & Lyu, M. R. (2006, June). ART:
augmented reality table for interactive trading card game. In Proceedings of the 2006
ACM international conference on Virtual reality continuum and its applications (pp.
357-360). ACM.
[26] Lee, W., Woo, W., & Lee, J. (2005, May). Tarboard: Tangible augmented reality
system for table-top game environment. In 2nd International Workshop on Pervasive
Gaming Applications, PerGames (Vol. 5, pp. 2-1).
[27] Leyvand, T., Meekhof, C., Wei, Y. C., Sun, J., & Guo, B. (2011). Kinect identity:
Technology and experience. Computer, 44(4), 94-96.
[28] LittleBigPlanet , http://www.littlebigplanet.com/, 2008. (Online; accessed 18-
April-2013).
[29] Lundgren, S., & Bjork, S. (2003, November). Game mechanics: Describing
computer-augmented games in terms of interaction. In Proceedings of TIDSE (Vol. 3).
[30] Löchtefeld, M., Schöning, J., Rohs, M., & Krüger, A. (2009).
LittleProjectedPlanet: an augmented reality game for camera projector phones.
Artificial Intelligence, 15-27.
[31] Milgram, P., & Kishino, F. (1994). A taxonomy of mixed reality visual displays.
IEICE TRANSACTIONS on Information and Systems, 77(12), 1321-1329.
[32] Molla, E., & Lepetit, V. (2010, October). Augmented reality for board games. In
Mixed and Augmented Reality (ISMAR), 2010 9th IEEE International Symposium on
(pp. 253-254). IEEE.
[33] Nilsen, T., Linton, S., & Looser, J. (2004). Motivations for augmented reality
gaming. Proceedings of FUSE, 4, 86-93.
[34] Piekarski, W., & Thomas, B. (2002). ARQuake: the outdoor augmented reality
gaming system. Communications of the ACM, 45(1), 36-38.
[35] Quest-Com Co.,Ltd, http://www.quest-com.co.jp/ , (Online; accessed 20-May-
2013).
[36] Starner, T., Leibe, B., Singletary, B., Lyons, K., Gandy, M., & Pair, J. (2000).
Towards augmented reality gaming. In Proceedings of IMAGINA.
[37] StbTracker, http://handheldar.net/stbtracker.php . (Online; accessed 11-May-
2013).

44
[38] Sutherland, I. E. (1968, December). A head-mounted three dimensional display.
In Proceedings of the December 9-11, 1968, fall joint computer conference, part I (pp.
757-764). ACM.
[39] Tan, C. T., & Soh, D. (2010). Augmented reality games: A review. Proceedings
of Gameon-Arabia, Eurosis.
[40] Van Krevelen, D. W. F., & Poelman, R. (2010). A survey of augmented reality
technologies, applications and limitations. International Journal of Virtual Reality,
9(2), 1.
[41] Vera, L., Gimeno, J., Coma, I., & Fernández, M. (2011). Augmented mirror:
interactive augmented reality system based on kinect. Human-Computer Interaction–
INTERACT 2011, 483-486.
[42] Wagner, D., & Barakonyi, I. (2003, October). Augmented reality kanji learning.
In Proceedings of the 2nd IEEE/ACM International Symposium on Mixed and
Augmented Reality (p. 335). IEEE Computer Society.
[43] Wolf, W. (2002). What is embedded computing?. Computer, 35(1), 136-137.
[44] Worms, http://www.team17.com/, 1995. (Online; accessed 11-May-2013).
[45] Xu, Y., Gandy, M., Deen, S., Schrank, B., Spreen, K., Gorbsky, M., ... &
MacIntyre, B. (2008, December). BragFish: exploring physical and social interaction
in co-located handheld augmented reality games. In Proceedings of the 2008
international conference on advances in computer entertainment technology (pp. 276-
283). ACM.
[46] Zhang, X., Fronz, S., & Navab, N. (2002, September). Visual marker detection
and decoding in AR systems: A comparative study. In Proceedings of the 1st
International Symposium on Mixed and Augmented Reality (p. 97). IEEE Computer
Society.
Appendix 1: The data from the games’ analysis.
The following table contains the data received during the game testing. However, the
information about the permissions that the games required access to was removed due to the
large size of that information. That information can be send on request. The presence of
some feature was denoted as the “x” sign.
General Information Approach
Genre
Freew
are
Sound
Effects 3D
Multiplayer
mode FPS
Location
-based
Marker
based Other
AR Defender Action No x x 49 x
DroidShooting Action Yes x x 33 x
Sky Siege Action No x x 40 x
Buzz Casual Yes x 37 x
BIFITH-AR Action Yes 29 x
Chick-fil-A Kids &
Family
Entertai
nment Yes x x 30 x
AR Invaders Action No x x 48 x

45
Parallel Kingdom Casual Yes x x 10 x
Zombie Room AR Action No x x 30 x
Hoops AR
Sports
game Yes x x 32 x
AR Basketball
Sports
game No x x 34 x
AR Baloons Action Yes x 41 x
Catch the Fairy AR Action Yes x x 39 x
Ghost Detector
Entertai
nment Yes x 52 x
Lumpeeks Action Yes x 44 x
AR Wild West Action No x 45 x
Skeeter Beater Casual No x x 44 x
Augmentron AR Action Yes x x 26 x
Sokoban 3R Puzzle No x x 28 x
Gunman Action Yes x x x 45 x
AR-Racing 2
Sports
game Yes 28 x
AR 3C Capture Casual Yes 41 x
iSnipeYou (Lite) Action Yes x x 32 x
League of Legends Action Yes x 33 x
GreedyFish Casual Yes x x 26 x
Augmented
Scavenger Action Yes x 39 x
JengAR Puzzle No x x x 45 x
Fly Free Action Yes x 34 x
ARachnophobia Free Casual Yes x 32 x
SpecTrek
Lifestyl
e No x x 41 x
Squash 'em All Action Yes 56 x
Pepsi Sokket Goal
Sports
game Yes x 54 x
3D Pool game -
3ILLIARDS
Sports
game No x x x 28 x
Urban Troops Action Yes x x x 54 x
PhotoShoot - The
Duel Action Yes x x 39 x
DefendAR Action Yes x x 25 x
Drop Defender Action Yes x x 27 x
Gold Detector Radar
Entertai
nment Yes x 47 x
HEADSHOT Gun
Camera Action Yes x 53 x
Zooz AR Shooting
Game Action Yes x x 43 x
Molecular City Puzzle Yes x x 32 x
AR-App - Tin can
throwing Action Yes x x 26 x
Droiders cARs Racing Yes x 22 x
NerdHerder Puzzle Yes x x 34 x
Warp Runner Puzzle Yes x x 25 x

46
MummyTapBeta
Lifestyl
e Yes x x 43 x
Ingress Action Yes x x 34 x
Piano AR Casual Yes x x 28 x
HiddenAttack (Lite) Action Yes x 49 x
TaTeTi Casual Yes x x 29 x
Auggy! Gamer
Edition
Entertai
nment Yes x 40 x
SlinGame Demo Action Yes x 41 x
Destroyer AR Action Yes x 38 x
Ball BreakAR Action Yes x x 27 x
PopAR Construction
Puzzle Casual Yes x x 29 x
Swivel Gun! Deluxe Action No x x 22 x
Sea Monster Action Yes x x 28 x
Biljet AR - AC130
Beta Action Yes x x 29 x
Huebner Game Casual Yes x x 30 x
Lipton Dip&Win Action Yes x 27 x
apptoyz Alien Attack Action Yes x x 39 x
Red Bull AR
Reloaded Racing Yes x x 54 x
AR Targets Lite Casual Yes x x 30 x
Android Archer Casual Yes x x 35 x
BoostAR
Entertai
nment Yes x x 29 x
Ghostbusters:
Paranormal Blast Action No x x 49 x
Capture! Hearts Casual Yes x x x 38 x
AR-App - Shuffle Action Yes x x 32 x
Catch The Oreo Action Yes x x 58 x
Pull! Action Yes x x 56 x
AR Shooter Shooting
Game Casual Yes x x 38 x
BILLABOOM
Sports
game Yes x x x 29 x
Mosquito Killer
Camera Casual Yes x 49 x
Killing Souls Action Yes x x 33 x
MushABellies Action Yes x x 31 x
BattleFlagerAR Action Yes x x 29 x
AR Arsenal HD Casual Yes x x 43 x
BugZapAR Action Yes x x 25 x
Ultimate 3D Boxing
Game Action Yes x x 30 x
PopAR Soccer Puzzle
Sports
game Yes x x 28 x
Marco Macaco Puzzle Yes x x 46 x
Missile DefendAR Action Yes x x 18 x
DmC - The Eye of
Dante Puzzle Yes x 32 x

47
AR Flick the Bean
Entertai
nment Yes x x 31 x
SoccerAR
Entertai
nment Yes 48 x
Lunar Eclipse -
Asteroid game Action No x x 32 x
Argomoku Puzzle Yes x x 30 x
PopAR Picnic Puzzle Casual Yes x x 29 x
AR Shootout
Sports
game Yes x 39 x
Camera Birds Casual Yes x 32 x
DROID Combat Action Yes x x 53 x
BlueTea Game Action Yes x x 29 x
Arma 2: Firing Range Action Yes x x x 32 x
Home Invasion Action Yes x 35 x
Treasure Hunters AR
beta Casual Yes x 39 x
Castrol Golden Strike
Sports
game Yes x x 33 x
Paintball Action Yes x x x 38 x
VuHunt Go. Share.
Conquer. Win Casual Yes x 39 x
Football Game by
Hand and Foot
Sports
game Yes 21 x
AssassinMaster Action Yes x 35 x
Walking Tracker
Sports
game Yes 36 x
Diamond Hunt Puzzle Yes 45 x
Valwen Action Yes x 59 x
TWOTW:
Augmented Reality Action No x 33 x
Armed Cam Action Yes 34 x
Evil Hornets AR -
$Ed Action No x 46 x
Paparazzi -
Augmented Reality Casual No x x 31 x
Catch The Ball
Lifestyl
e Yes x 34 x
Total 108 91 72 89 14 41 58 9

48
Appendix 2: The result of the analysis of the users’ reviews. In the following table the data collected from the analysis of the users’ reviews was
recorded. The Opinions were represented as proportions. For example value 0.33
corresponds to 33% rate meaning that 33% of all reviews for the game were positive. Where
the data was missing due to insufficient number of review, then it was denoted as “ND” or
“No data”. The number of installs was represented as intervals that specifies in which
interval the value falls. For example the interval “100-500” can be interpreted as the game
was installed at least 100 times and at most 500 times.
Opinion Technical issues Game Rating # of Installs
Games Good Bad (technical/total bad)
AR Defender 0.33 0.67 1.0 3,1 1000-5000
DroidShooting 0.65 0.35 0.75 4,0 500000-1000000
Sky Siege 0.37 0.63 0.84 2,8 10000-50000
Buzz 1.0 0.0 No data 4,0 100-500
BIFITH-AR ND ND No data No data 1000-5000
Chick-fil-A Kids & Family 0.61 0.39 0.93 3,8 10000-50000
AR Invaders 0.51 0.49 1.0 3,5 500-1000
Parallel Kingdom 0.89 0.11 0.8 4,1 1000000-5000000
Zombie Room AR 0.54 0.46 0.59 3,4 10000-50000
Hoops AR 0.69 0.31 0.78 3,7 100000-500000
AR Basketball ND ND No data 3,5 10-50
AR Baloons 0.35 0.65 0.55 3,2 10000-50000
Catch the Fairy AR 0.32 0.68 0.87 3,2 10000-50000
Ghost Detector 0.58 0.42 0.12 3,6 100000-500000
Lumpeeks ND ND No data 3.0 50-100
AR Wild West ND ND No data 2,3 50-100
Skeeter Beater 0.77 0.23 0.33 3,5 10000-50000
Augmentron AR 0.29 0.71 0.8 2,8 5000-10000
Sokoban 3R ND ND No data No data 1000-5000
Gunman 0.73 0.27 0.41 4,2 100000-500000
AR-Racing 2 ND ND No data 3,6 1000-5000
AR 3C Capture ND ND No data No data 100-500
iSnipeYou (Lite) 0.44 0.56 0.36 3,6 100000-500000
League of Legends 0.54 0.46 0.59 4,1 10000-50000
GreedyFish ND ND No data No data 100-500
Augmented Scavenger ND ND No data No data 100-500
JengAR ND ND No data 4,0 10-50
Fly Free ND ND No data 3,0 1000-5000
ARachnophobia Free ND ND No data 3,5 1000-5000
SpecTrek 0.91 0.09 0.11 4,7 5000-10000
Squash 'em All ND ND No data No data 100-500
Pepsi Sokket Goal 0.67 0.33 No data 3,2 1000-5000
3D Pool game - 3ILLIARDS 0.74 0.26 0.77 4,3 1000-5000
Urban Troops 0.63 0.37 0.75 4,1 10000-50000

49
PhotoShoot - The Duel ND ND No data No data 5000-10000
DefendAR ND ND No data 4,8 500-1000
Drop Defender 0.38 0.62 0.8 3,5 10000-50000
Gold Detector Radar 0.36 0.64 0.0 3,9 10000-50000
HEADSHOT Gun Camera 0.63 0.37 0.55 3,5 50000-100000
Zooz AR Shooting Game ND ND No data No data 500-1000
Molecular City ND ND No data 2,1 1000-5000
AR-App - Tin can throwing ND ND No data 3,0 5000-10000
Droiders cARs 0.64 0.36 0.2 3,3 10000-50000
NerdHerder 0.81 0.19 1.0 4,5 1000-5000
Warp Runner 0.75 0.25 1.0 3,8 5000-10000
MummyTapBeta ND ND No data No data 100-500
Ingress 0.69 0.31 0.32 4,2 500000-1000000
Piano AR 0.14 0.86 0.17 2,9 1000-5000
HiddenAttack (Lite) ND ND No data 3,6 5000-10000
TaTeTi ND ND No data 3,3 1000-5000
Auggy! Gamer Edition ND ND No data No data 1-5
SlinGame Demo 0.43 0.57 1.0 3,3 10000-50000
Destroyer AR 0.21 0.79 0.73 1,7 10000-50000
Ball BreakAR 0.4 0.6 0.11 3,3 10000-50000
PopAR Construction Puzzle ND ND No data No data 1000-5000
Swivel Gun! Deluxe 0.59 0.41 0.29 3,8 100-500
Sea Monster ND ND No data No data 100-500
Biljet AR - AC130 Beta 0.52 0.48 0.8 3,1 50000-100000
Huebner Game ND ND No data No data 50-100
Lipton Dip&Win 0.33 0.67 0.38 3,1 1000-5000
apptoyz Alien Attack 0.37 0.63 0.88 3,1 10000-50000
Red Bull AR Reloaded 0.61 0.39 0.65 4,0 1000000-5000000
AR Targets Lite 0.83 0.17 No data 4,3 500-1000
Android Archer 0.14 0.86 0.93 2,3 100000-500000
BoostAR 0.6 0.4 1.0 3,9 1000-5000
Ghostbusters: Paranormal Blast 0.93 0.07 0.43 4,6 5000-10000
Capture! Hearts ND ND No data No data 100-500
AR-App - Shuffle ND ND No data No data 50-100
Catch The Oreo ND ND No data 3,4 1000-5000
Pull! ND ND No data No data 1000-5000
AR Shooter Shooting Game ND ND No data No data 1000-5000
BILLABOOM 0.63 0.37 1.0 4,4 10000-50000
Mosquito Killer Camera 0.33 0.67 0.0 3,4 10000-50000
Killing Souls ND ND No data No data 100-500
MushABellies 0.17 0.83 0.97 2,2 10000-50000
BattleFlagerAR ND ND No data 4,7 1000-5000
AR Arsenal HD 0.64 0.36 0.33 3,9 10000-50000
BugZapAR ND ND No data No data 100-500
Ultimate 3D Boxing Game 0.6 0.4 0.14 3,9 10000-50000

50
PopAR Soccer Puzzle ND ND No data No data 100-500
Marco Macaco ND ND No data 4,4 50000-100000
Missile DefendAR ND ND No data 3,4 1000-5000
DmC - The Eye of Dante 0.29 0.71 0.98 2,9 10000-50000
AR Flick the Bean ND ND No data No data 100-500
SoccerAR 0.68 0.32 1.0 3,4 5000-10000
Lunar Eclipse - Asteroid game ND ND No data No data 10-50
Argomoku ND ND No data No data 100-500
PopAR Picnic Puzzle ND ND No data No data 10-50
AR Shootout ND ND No data 3,6 500-1000
Camera Birds 0.67 0.33 0.71 3,9 5000-10000
DROID Combat 0.68 0.32 0.68 4,0 50000-100000
BlueTea Game ND ND No data No data 10-50
Arma 2: Firing Range 0.58 0.42 0.61 3,8 100000-500000
Home Invasion 0.37 0.63 0.59 3,5 10000-50000
Treasure Hunters AR beta 0.2 0.8 0.0 3,8 10000-50000
Castrol Golden Strike ND ND No data 4,1 5000-10000
Paintball 0.87 0.13 0.56 4,3 100000-500000
VuHunt Go. Share. Conquer. Win 0.5 0.5 0.0 3,5 10000-50000
Football Game by Hand and Foot ND ND No data No data 100-500
AssassinMaster 0.47 0.53 0.71 3,5 10000-50000
Walking Tracker 0.54 0.46 0.67 4,0 50000-100000
Diamond Hunt 0.34 0.66 0.82 3,1 10000-50000
Valwen ND ND No data 4,2 100-500
TWOTW: Augmented Reality ND ND No data 4,8 100-500
Armed Cam 0.83 0.17 0.8 4,3 100000-500000
Evil Hornets AR - $Ed ND ND No data No data 10-50
Paparazzi - Augmented Reality 0.42 0.58 0.91 3,2 1000-5000
Catch The Ball 0.75 0.25 1.0 4,3 1000-5000