Mapping the land surface for global atmosphere-biosphere models: toward continuous distributions of...
16
JOURNAL OF GEOPHYSICAL RESEARCH, VOL. 100, NO. D10, PAGES 20,867-20,882, OCTOBER 20, 1995 Mapping the land surface for global atmosphere-biosphere models- Toward continuous distributions of vegetation's functional properties Ruth S. DeFries,• ChristopherB. Field,2 Inez Fung, • Christopher O. Justice, 1 SietseLos, 4 Pamela A. Matson? Elaine Matthews, 6 Harold A. Mooney, 7 ChristopherS. Potter, 8 Katharine Prentice, 6 Piers J. Sellers, 9 John R. G. Townshend, • Compton J. Tucker, 9 Susan L. Ustin, •ø and Peter M. Vitousek 7 Abstract. Globalland surface characteristics are important boundary conditions for global models that describe exchanges of water, energy, and carbondioxide between the atmosphere and biosphere. Existingdata setsof global land cover are basedon classification schemes that characterize each grid cell as a discrete vegetation type. Consequently, parameter fields derived from these data setsare dependenton the particular scheme and the number of vegetation typesit includes. The functionalcontrolson exchanges of water, energy,and carbon dioxidebetweenthe atmosphere and biosphere are now well enoughunderstood that it is increasingly feasible to model these exchanges using a smallnumberof vegetation characteristics that either are relatedto or closely relatedto the functional controls. Ideally, these characteristics wouldbe mapped as continuous distributions to capture mixtures and gradients in vegetation within the cell sizeof the model.While such an approach makes it more difficult to build models from detailed observations at a small number of sites, it increases the potential for capturing functionally important variation within, as well as between, vegetation types. Globally, the vegetation characteristics that appear to be most important in controlling fluxes of water, energy, and carbondioxideinclude(1) growthform (tree, shrub, herb), (2) seasonality of woody vegetation (deciduous, evergreen), (3) leaf type (broadleaf, coniferous), (4) photosynthetic pathway of nonwoody vegetation (C3, C4), (5) longevity (annual,perennial),and (6) type and intensity of disturbance (e.g., cultivation, fire history). Many of thesecharacteristics can be obtainedthroughremote sensing, thoughsomerequire ground-based information.The minimum number and the identity of the required land surface characteristics almost certainlyvary with the intended objective, but the philosophy of driving models with continuous distributions of a smallnumberof land surface characteristics is likely to be applicableto a broad range of problems. 1. Introduction Models to describe exchanges of energy, water, and carbon dioxide between the atmosphere and biosphere require global- scale informationabout the states of both the atmosphere and biosphere. In the case of atmospheric parameters, stationdata •Department of Geography, University of Maryland, College Park. 2Department of Plant Biology, Carnegie Institution, Stanford, Cal- ifornia. 3NASA Goddard Institute for Space Studies andSchool of Earth and Ocean Sciences, University of Victoria, Victoria, British Colum- bia, Canada. 4Sciences Systems and Applications Inc., NASA Goddard Space Flight Center, Greenbelt, Maryland. 5Department of SoilScience, University of California, Berkeley. 6NASA Goddard Institute for Space Studies, NewYork. ?Department of Biological Sciences, Stanford University, Stanford, California. SNASA AmesResearch Center, Moffett Field, California. 9Biospherics Sciences Branch, NASA Goddard Space Flight Center, Greenbelt, Maryland. •0 Department of Land, Air, andWater Resources, University of California, Davis. Copyright1995by the American Geophysical Union. Paper number 95JD01536. 0148-0227/95/95JD-01536505.00 provide a long history of measurements for deriving global distributions of atmospheric circulation statistics. In contrast, measurements of biospheric parameters over the land surface are sparse. Parameters suchas biomass, albedo,leaf area in- dex, and photosynthetic capacity havebeen measured at only a few sites.Global distributions for these parametersare typi- callygenerated by assigning thesefew measured values to grid cells on the basisof vegetationtypes defined by a land cover classification scheme [Dickinson, 1995]. The process of binning land surface propertiesinto a small number of discretegroupsdefined by a classification scheme createsseveralweaknesses. First, the approachassumes that all vegetation within the area labeled as a given cover type functions similarly. For parameters like leaf area index [Prince, 1991b]or photosynthetic capacity [Chabot and Mooney,1985], spatial and temporal variation within a traditional vegetation type can be twofold to 10-fold, with much of the variation reflectingdisturbance as well as patternsin ecosystem charac- teristics such aslimited water and nutrient availability. Second, discrete distributions of vegetation types described by land cover classification schemes do not realistically reflect gradi- ents in vegetation types over the landscapeor mixtures of vegetation types within a grid cell. Consequently, land surface properties that vary continuously over spaceor are discontin- 20,867
-
Upload
independent -
Category
Documents
-
view
4 -
download
0
Transcript of Mapping the land surface for global atmosphere-biosphere models: toward continuous distributions of...

JOURNAL OF GEOPHYSICAL RESEARCH, VOL. 100, NO. D10, PAGES 20,867-20,882, OCTOBER 20, 1995
Mapping the land surface for global atmosphere-biosphere models- Toward continuous distributions of vegetation's functional properties
Ruth S. DeFries, • Christopher B. Field, 2 Inez Fung, • Christopher O. Justice, 1 Sietse Los, 4 Pamela A. Matson? Elaine Matthews, 6 Harold A. Mooney, 7 Christopher S. Potter, 8 Katharine Prentice, 6 Piers J. Sellers, 9 John R. G. Townshend, • Compton J. Tucker, 9 Susan L. Ustin, •ø and Peter M. Vitousek 7
Abstract. Global land surface characteristics are important boundary conditions for global models that describe exchanges of water, energy, and carbon dioxide between the atmosphere and biosphere. Existing data sets of global land cover are based on classification schemes that characterize each grid cell as a discrete vegetation type. Consequently, parameter fields derived from these data sets are dependent on the particular scheme and the number of vegetation types it includes. The functional controls on exchanges of water, energy, and carbon dioxide between the atmosphere and biosphere are now well enough understood that it is increasingly feasible to model these exchanges using a small number of vegetation characteristics that either are related to or closely related to the functional controls. Ideally, these characteristics would be mapped as continuous distributions to capture mixtures and gradients in vegetation within the cell size of the model. While such an approach makes it more difficult to build models from detailed observations at a small number of sites, it increases the potential for capturing functionally important variation within, as well as between, vegetation types. Globally, the vegetation characteristics that appear to be most important in controlling fluxes of water, energy, and carbon dioxide include (1) growth form (tree, shrub, herb), (2) seasonality of woody vegetation (deciduous, evergreen), (3) leaf type (broadleaf, coniferous), (4) photosynthetic pathway of nonwoody vegetation (C3, C4), (5) longevity (annual, perennial), and (6) type and intensity of disturbance (e.g., cultivation, fire history). Many of these characteristics can be obtained through remote sensing, though some require ground-based information. The minimum number and the identity of the required land surface characteristics almost certainly vary with the intended objective, but the philosophy of driving models with continuous distributions of a small number of land surface characteristics is likely to be applicable to a broad range of problems.
1. Introduction
Models to describe exchanges of energy, water, and carbon dioxide between the atmosphere and biosphere require global- scale information about the states of both the atmosphere and biosphere. In the case of atmospheric parameters, station data
•Department of Geography, University of Maryland, College Park. 2Department of Plant Biology, Carnegie Institution, Stanford, Cal-
ifornia.
3NASA Goddard Institute for Space Studies and School of Earth and Ocean Sciences, University of Victoria, Victoria, British Colum- bia, Canada.
4Sciences Systems and Applications Inc., NASA Goddard Space Flight Center, Greenbelt, Maryland.
5Department of Soil Science, University of California, Berkeley. 6NASA Goddard Institute for Space Studies, New York. ?Department of Biological Sciences, Stanford University, Stanford,
California.
SNASA Ames Research Center, Moffett Field, California. 9Biospherics Sciences Branch, NASA Goddard Space Flight Center,
Greenbelt, Maryland. •0 Department of Land, Air, and Water Resources, University of
California, Davis.
Copyright 1995 by the American Geophysical Union.
Paper number 95JD01536. 0148-0227/95/95JD-01536505.00
provide a long history of measurements for deriving global distributions of atmospheric circulation statistics. In contrast, measurements of biospheric parameters over the land surface are sparse. Parameters such as biomass, albedo, leaf area in- dex, and photosynthetic capacity have been measured at only a few sites. Global distributions for these parameters are typi- cally generated by assigning these few measured values to grid cells on the basis of vegetation types defined by a land cover classification scheme [Dickinson, 1995].
The process of binning land surface properties into a small number of discrete groups defined by a classification scheme creates several weaknesses. First, the approach assumes that all vegetation within the area labeled as a given cover type functions similarly. For parameters like leaf area index [Prince, 1991b] or photosynthetic capacity [Chabot and Mooney, 1985], spatial and temporal variation within a traditional vegetation type can be twofold to 10-fold, with much of the variation reflecting disturbance as well as patterns in ecosystem charac- teristics such as limited water and nutrient availability. Second, discrete distributions of vegetation types described by land cover classification schemes do not realistically reflect gradi- ents in vegetation types over the landscape or mixtures of vegetation types within a grid cell. Consequently, land surface properties that vary continuously over space or are discontin-
20,867

20,868 DEFRIES ET AL: MAPPING THE LAND SURFACE
0.7 -
0.6 -
0.4
o.a
0.2 -
0.1 -
: July NDVI
- - ß - - cover type from classification
72 68 64 60 56 52 48 44
degrees N latitude
-9
-8
-7
-5
-4
-3
-2
Figure 1. July NDVI values from Los et al. [1995] across transect shown in Plate 1. The cover types correspond to those in Plate I.
uous on a fine spatial scale are depicted in the models by discrete boundaries. Third, the parameter fields generated from discrete vegetation types are dependent on the classifi- cation scheme and the number of vegetation types included in the scheme.
As an example of the distortions that occur when character- izing vegetation gradients as discrete cover types, Plate 1 shows the location of a transect through central Asia that traverses from north to south through tundra, coniferous forest, grass- land, shrubs and bare ground, and bare ground. The land cover classification shown in Plate 1, derived from remotely sensed data [DeFries and Townshend, 1994a], portrays the vegetation along the transect as discrete cover types. However, summer- time normalized difference vegetation index (NDVI) values, which are related to radiation absorption by photosynthetic tissue, vary gradually and not discretely across the transect (Figure I). To the extent that NDVI describes an important aspect of vegetation function, parameter fields derived from discrete cover types will not realistically reflect the true varia- tions in ecosystem function.
Approaches that assign land surface parameters according to vegetation type implicitly assume that the classification scheme captures the functionally important variation in these parameters. Recent advances in remote sensing provide an alternative approach to estimating global distributions of these parameters. For example, NDVI provides a continuous distri- bution of a parameter related to surface primary productivity [Goward et al., 1985; Tucker et al., 1985b]. Some models [Sellers et al., 1994] use a combination of remotely sensed data and discrete vegetation types to calculate global fields of biophys- ical parameters. An alternative to approaches based on dis- crete types uses climate rather than vegetation as the basis for extrapolation. Examples of models based on this approach estimate net primary production [Pittick, 1986; Webbet al., 1983], ecosystem structure and function [Woodward et al., 1991], forest succession [Solomon and Bartlein, 1992], maxi- mum photosynthetic rate [Woodward and Smith, 1993], and soil respiration [Raich and Schlesinger, 1992].
In this paper, we review several existing land surface classi- fication schemes commonly used in atmosphere-biosphere models. We illustrate the effects of using different vegetation classifications to derive global fields of land surface parame- ters. We then consider the functional properties of vegetation
required to calculate parameter fields used in the models and suggest an approach for describing the land surface using con- tinuous distributions of these functional properties.
This paper focuses on information about the vegetated land surface required for models of water, energy, and carbon di- oxide exchange between the atmosphere and biosphere. We consider the land surface requirements for atmosphere- biosphere models to be primarily related to vegetation char- acteristics. We do not address other characteristics of the land
surface, such as soil characteristics, topography, and aspect. Moreover, it is likely that other types of global change models, including those dealing with exchanges of other trace gases (e.g., methane, nitrous oxide), vegetation and population dy- namics, or policy options will have different requirements for land surface information.
2. Land Surface Classification Schemes
Over the last century, many schemes for classifying the land surface have been developed. Schemes for classifying vegeta- tion are generally based on physiognomic characteristics of the vegetation such as dominant life form or floristic composition. Environmental factors such as soils or climate have also been
utilized directly or as surrogates for vegetative cover (for a review of these schemes, see Mueller-Dumbois [1984]).
2.1. Vegetation Distributions From Ground-Based Observations
Large-scale (small areal coverage and fine spatial resolution) vegetation maps are typically based on compilations of field observations. Data on the location and abundance of plant species or plant types are aggregated and subjectively weighted to produce broad groupings of vegetation types and maps delineating boundaries of these types. This process often em- ploys aerial photographs. Such maps, in turn, form the basis for the production of small-scale (large areal coverage and coarse spatial resolution) maps for continents and, ultimately, for the globe.
Global maps of vegetation created by these traditional means have a number of limitations that make comparisons between them difficult [Townshend et al., 1991]. First, they rely on compilations from numerous sources because ground ob- servations using a single system of classification have never been attempted at a global scale. Integrating local studies into regional and, ultimately, global maps raises problems because the original maps are often produced at different times. Sec- ond, widely varying criteria are used to classify the vegetation, including several different physiognomic, floristic, and environ- mental properties [Fosberg, 1967; Kuchler, 1967; Mueller- Dumbois and Ellenberg, 1974]. Consequently, compilers of maps may have to force very different categories into a com- mon scheme. Third, data reliability is inconsistent because the field-based large-scale maps are unavailable for much of the world. Without large-scale maps, extrapolation using indirect sources may be the only information available.
Digital versions of ground-based maps compiled to global scales are generally tailored to a particular application. For example, Hummel and Reck [1979] digitized the vegetation/ land use map in the Oxford Atlas [Cohen, 1973] for albedo studies and discriminated 12 vegetation types. Subsequently, Olson et al. [1983] updated the Hummel and Reck data set into 43 types to discriminate carbon densities of vegetation.
Matthews [1983] "translated" about 70 published vegetation

DEFRIES ET AL: MAPPING THE LAND SURFACE 20,869
. I
ll
i
1
,.!
m
ß J ß e.
e
't

20,870 DEFRIES ET AL: MAPPING THE LAND SURFACE
maps into the Unesco [1973] hierarchical classification scheme and compiled the maps into a global digital data set at 1 ø x 1 ø resolution. The Matthews [1983] digital database identifies 178 types that can be grouped according to application. A com- monly used version includes 32 vegetation types. As a compan- ion to the vegetation database, Matthews also compiled a land use database specifying the cultivated fraction of each 1 ø cell. Wilson and Henderson-Sellers [1985] combined vegetation and land use information into a database of 53 dominant and sec-
ondary cover types. There is considerable variation among the global land cover
data sets compiled from ground-based sources [Townshend et al., 1991]. Comparison of three digital data sets (Matthews [1983] data set of 32 vegetation types, the data set for primary land cover from Wilson and Henderson-Sellers [1985], and the land cover data set of Olson et al. [1983]) reveals that, after translating each scheme into a common scheme for the basis of comparison, the three agree on only about 26% of the total land surface [DeFries and Townshen& 1994b]. Two of the three data sets agree on an additional 46% of the land surface, while none of the data sets agree on 28% of the land surface (Plate 2). Some of this lack of agreement is due to incompatible classification schemes used in the three data sets, some due to the lack of agreement in geographical extent of various cover types, and some due to the necessarily subjective procedure for grouping the classes for the basis of comparison. Whatever the reason, the comparison shows that there are large differences among existing ground-based sources of information on global land cover.
2.2. Vegetation Distributions From Bioclimatic Classification Schemes
An important distinction between the various schemes for classifying vegetation is whether existing or potential vegeta- tion is mapped. Bioclimatic schemes, which classify vegetation on the basis of climate, do not account for successional stage or disturbances caused by anthropogenic or nonanthropogenic factors. In contrast to vegetation distributions derived from ground-based or satellite observations, bioclimatic schemes produce maps of "climatic climax" rather than actual vegeta- tion.
Many combinations of climate parameters have been used to describe vegetation distributions. Although temperature and precipitation are the two climate parameters used in all the schemes, the schemes differ primarily in their respective em- phasis on seasonal information. The Holdridge [1947] scheme, probably because of its tropical origins, uses only annual mean values, while at the other extreme, the Troll and Paffen [1964] scheme uses detailed information on the seasonality of climate (e.g., maximum winter precipitation, moderately warm sum- mers, less than 6 months of humidity). The scheme of KOppen [1936] is based on vegetation physiology constructed from the Grisebach [1872] vegetation map.
More recently, other researchers have developed data sets of potential vegetation. Prentice [1990] compared several biocli- matic schemes with the Matthews [1983] vegetation data set and modified the Holdridge scheme to identify 29 bioclimatic zones. Prentice et al. [1992] developed a global biome model that predicts global patterns in vegetation based on primary driving variables such as mean coldest month temperature, annual accumulated temperature, and a drought index. Box [1981] developed a classification system with 90 plant life forms to describe the major types of vegetation structure on the
Earth and predicted the occurrence of these life forms from climatic data.
2.3. Vegetation Distributions From Satellite Data
Satellite data have been used extensively to provide infor- mation on the geographic distribution of actual vegetation at local scales. Data from Landsat's multispectral scanner system (MSS) at approximately 80-m resolution and thematic mapper (TM) at approximately 30-m resolution as well as SPOT's high-resolution visible sensor (HRV) at approximately 20-m resolution have been the principal sources of data. The ap- proach usually adopted is to use either visual interpretation or to apply multivariate statistical methods based on the multi- spectral and textural differences among cover types [Conese et al., 1988; Fuller et al., 1989; Hill and Megier, 1988] using data from a single satellite overpass. Images from more than one overpass can improve discrimination by allowing phenological variations to assist classification [Badwhar, 1984], though such methods have not been commonly applied. Because of the high volumes of data associated with these high-resolution sensors and the frequent lack of comprehensive spatial coverage, coarse resolution data from the advanced very high resolution radiometer (AVHRR) sensor of the National Oceanic and Atmospheric Administration (NOAA) operational meteoro- logical satellites have been increasingly used for the purposes of continental and global land cover mapping.
At regional and global scales, phenologies of different veg- etation types, as reflected in intrannual variations in the NDVI, provide a basis for mapping and monitoring vegetation. For the continent of Africa, Tucker et al. [1985a] used NOAA's Global Vegetation Index to produce a general land cover clas- sification at a spatial resolution of 15-20 km based on mean annual NDVI and seasonality. Townshend et al. [1987] classi- fied land cover for South America using multiple images from different dates throughout the year. In addition, Loveland et al. [1991] used AVHRR local area coverage data at approxi- mately 1-km spatial resolution for an unsupervised classifica- tion that derived homogeneous land cover regions for the conterminous United States.
A few attempts have been made to use satellite data for deriving distributions of land cover types at a global scale. Koomanoff [1989] produced a global map of nine basic vege- tation types using an integrated annual value of NDVI, and Shimoda et al. [1986] derived statistical estimates of global land cover types. DeFries and Townshend [1994a] produced a global distribution of major land cover types based on a global 1 ø x 1 ø NDVI data set [Los et al., 1994; Sellers et al., 1994]. Running et al. [1994] propose that a global vegetation classification for the purposes of biogeochemical models could be derived from a combination of primary attributes of plant-canopy structure. They also identify remotely sensed observations from multi- temporal AVHRR data that could be used to classify vegeta- tion according to these structural characteristics.
Like the maps of vegetation distributions compiled from field observations and modeled from bioclimatic classification
schemes discussed above, vegetation distributions derived from satellite data have generally classified vegetation types into discrete units that do not necessarily reflect the gradients or mosaics of vegetation types across the landscape. Informa- tion from satellite data has not been fully exploited to provide continuous distributions of global land surface characteristics, although such information is inherent in the data.
Deconvolution of landscape components to describe mix-

DEFRIES ET AL: MAPPING THE LAND SURFACE 20,871
20,872 DEFRIES ET AL: MAPPING THE LAND SURFACE
Paci
Oce
Hudson
Bay lOO%
herbaceous
lOO%
woody Plate 3. Example of an approach to obtain continuous fields of land surface characteristics from remote sensing. The figure illustrates continuous gradients for woodincss of the vegetation for a portion of the boreal zone in North America covering a gradient from grassland to boreal forest to tundra. Gradients between tundra, trees (primarily coniferous), and grass were obtained from a linear mixture model [11anan et al., 1991 ] for the three components, using monthly NDVI and brightness values for 1989 [roma revised version of the Global Vegetation Index [Goward et al., 1994]. Herbaceous/woody ratios were obtained from Friedlingstein et al. [1992] for each component and then summed over the three components to obtain total hcrbaceousness- woodiness.
tures of cover types in terms of percentage cover, as has been carried out at local and regional scales using high-resolution data [Hanan et al., 1991; Smith et al., 1990a, b], is one approach that could provide information on continuous distributions of vegetation characteristics. Ustin et al. [1993] suggested using linear unmixing techniques to derive vegetation characteristics from satellite data that are independent of fioristic descrip- tions. This approach has been applied to a variety of biome types, including semiarid [Smith et al., 1990a, b], coastal sa- vanna [Gamon et al., 1992; Roberts et al., 1993], and tropical broadleaf forests [,4dams et al., 1990].
Plate 3 is an example of a linear unmixing approach to obtain a continuous distribution of woodiness of the vegetation for a portion of the boreal zone in North America. For this
example, woodiness was obtained from herbaceous/woody ra- tios from Friedlingstein et al. [1992] applied to fractional covers for tundra, trees, and grass obtained from a linear mixture model [Hanan et al., 1991] based on 1989 monthly NDVI and brightness values in a revised version of the Global Vegetation Index [Goward eta!., 1994].
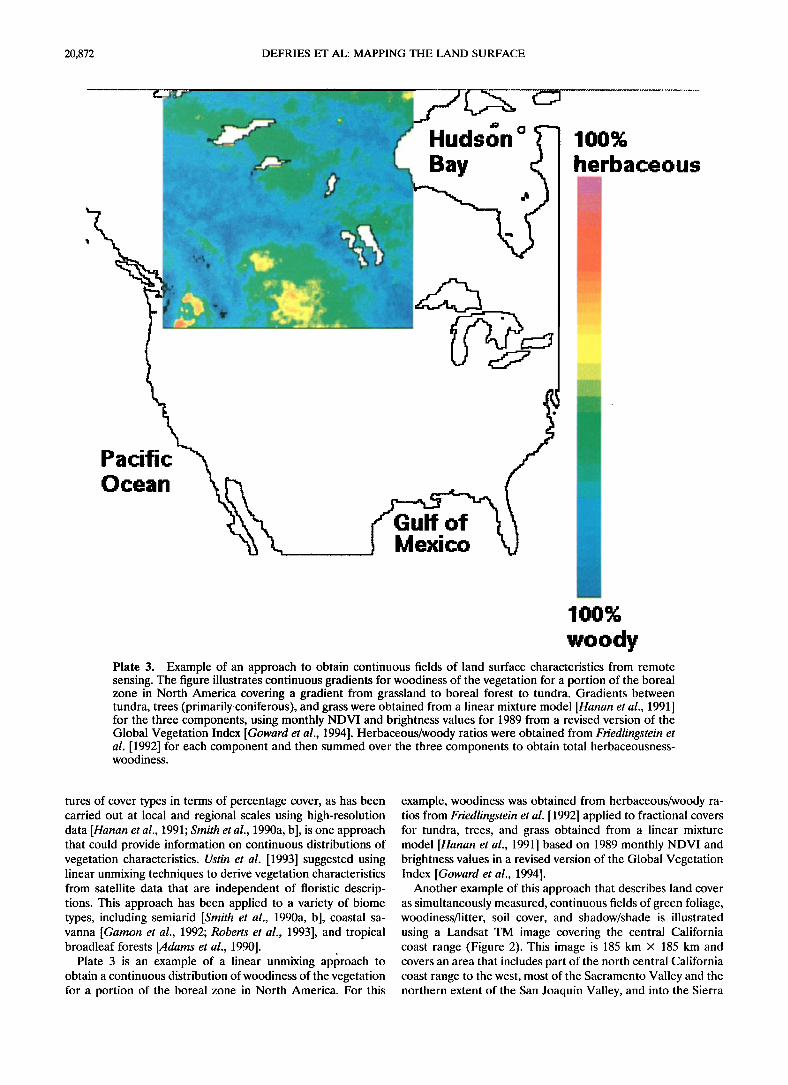
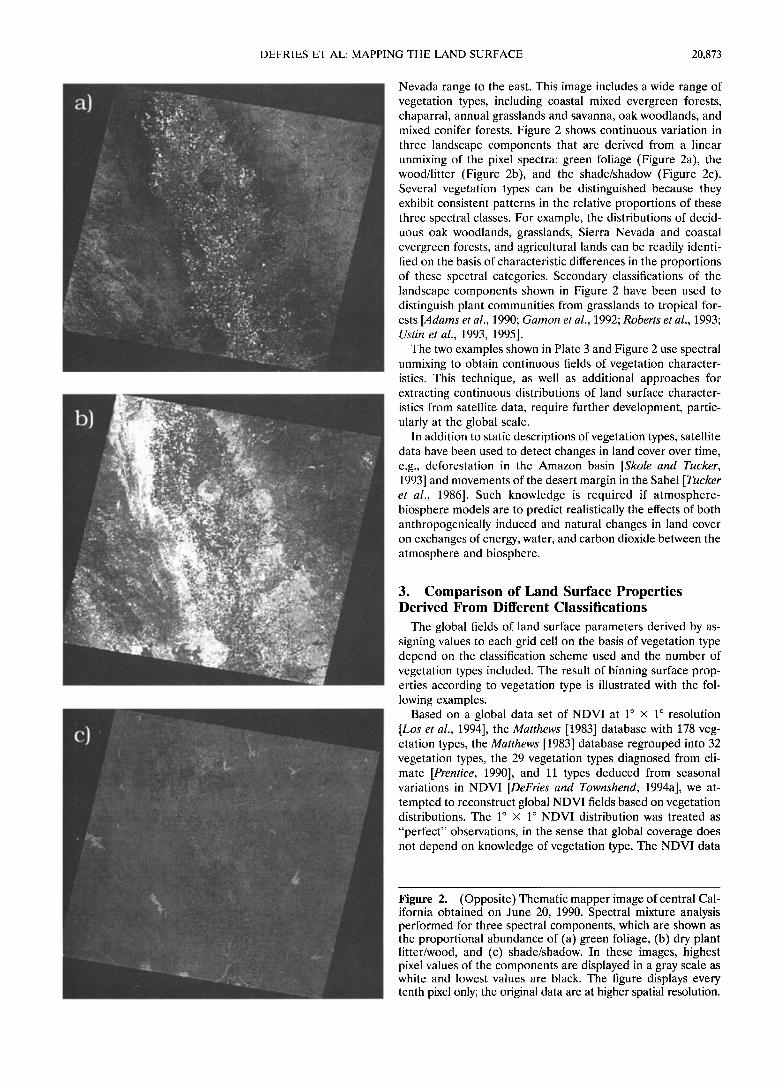
Another example of this approach that describes land cover as simultaneously measured, continuous fields of grcen foliage, woodiness/litter, soil cover, and shadow/shade is illustrated using a Landsat TM image covering the central California coast range (Figure 2). This image is 185 km x 185 km and covers an area that includes part of the north central California coast range to the west, most of the Sacramento Valley and the northern extent of the San Joaquin Valley, and into the Sierra
DEFRIES ET AL: MAPPING THE LAND SURFACE 20,873
a)
ß 5 .• •,•'•:.'•,•;:•i• • •'. •'::':?.• ..... ß 3•-.• :• :•"i:. ½;• ½ --'-,-'.'.:;':::• •755-:• • ..
. ...•::.:
. .. •... .......
•*..'. •$•:.: .,.. . . •: .•.. •--½-•...• .... •.. ....:'" .•'•-i•:.:•:? :} ":4":' - .....
,...
c)
Nevada range to the east. This image includes a wide range of vegetation types, including coastal mixed evergreen forests, chaparral, annual grasslands and savanna, oak woodlands, and mixed conifer forests. Figure 2 shows continuous variation in three landscape components that are derived from a linear unmixing of the pixel spectra: green foliage (Figure 2a), the wood/litter (Figure 2b), and the shade/shadow (Figure 2c). Several vegetation types can be distinguished because they exhibit consistent patterns in the relative proportions of these three spectral classes. For example, the distributions of decid- uous oak woodlands, grasslands, Sierra Nevada and coastal evergreen forests, and agricultural lands can be readily identi- fied on the basis of characteristic differences in the proportions of these spectral categories. Secondary classifications of the landscape components shown in Figure 2 have been used to distinguish plant communities from grasslands to tropical for- ests [Adams et al., 1990; Gamon et al., 1992; Roberts et al., 1993; Ustin et al., 1993, 1995].
The two examples shown in Plate 3 and Figure 2 use spectral unmixing to obtain continuous fields of vegetation character- istics. This technique, as well as additional approaches for extracting continuous distributions of land surface character- istics from satellite data, require further development, partic- ularly at the global scale.
In addition to static descriptions of vegetation types, satellite data have been used to detect changes in land cover over time, e.g., deforestation in the Amazon basin [Skole and Tucker, 1993] and movements of the desert margin in the Sahel [Tucker et al., 1986]. Such knowledge is required if atmosphere- biosphere models are to predict realistically the effects of both anthropogenically induced and natural changes in land cover on exchanges of energy, water, and carbon dioxide between the atmosphere and biosphere.
3. Comparison of Land Surface Properties Derived From Different Classifications
The global fields of land surface parameters derived by as- signing values to each grid cell on the basis of vegetation type depend on the classification scheme used and the number of vegetation types included. The result of binning surface prop- erties according to vegetation type is illustrated with the fol- lowing examples.
Based on a global data set of NDVI at 1 ø x 1 ø resolution [Los et al., 1994], the Matthews [1983] database with 178 veg- etation types, the Matthews [1983] database regrouped into 32 vegetation types, the 29 vegetation types diagnosed from cli- mate [Prentice, 1990], and 11 types deduced from seasonal variations in NDVI [DeFries and Townshen& 1994a], we at- tempted to reconstruct global NDVI fields based on vegetation distributions. The 1 ø x 1 ø NDVI distribution was treated as
"perfect" observations, in the sense that global coverage does not depend on knowledge of vegetation type. The NDVI data
Figure 2. (Opposite) Thematic mapper image of central Cal- ifornia obtained on June 20, 1990. Spectral mixture analysis performed for three spectral components, which are shown as the proportional abundance of (a) green foliage, (b) dry plant litter/wood, and (c) shade/shadow. In these images, highest pixel values of the components are displayed in a gray scale as white and lowest values are black. The figure displays every tenth pixel only; the original data are at higher spatial resolution.

20,874 DEFRIES ET AL: MAPPING THE LAND SURFACE
0.3
0.25
0.2
0.15
0.1
0.05
0 o o O O O O O O O O
LATITUDE
0.1
O.O6 I 0.02 _,•
-0.02 '
-0,06 , -o.1
0 0 • 0 0 0 0 0 0
•TITUDE
z • 0.1 _.oz
_.< •o o.o8
'"' [ z •' 0.04 ß 7 - z o. o2
03• 0 ....... O O O O O O O O O O
LATITUDE
Figuœe 3. (a) Latitudinal variation of zonally averaged mean annual NDVI, (b) departure from the full- resolution "perfect" NDVI, and (½) standard deviation for mean annual NDVI from 1 ø x 1 ø NDVI data set [œoz ½t al., 1994; $½ll½rz ½t M., 1994] for full-resolution NDVI data set (bold solid line) and reconstructions based on 178 vegetation types from Matthewz [1983] (thin solid line), 32 vegetation types M•llhewz []983] (dashed line), •g vegetation types from Prentice []gg0] (altematin• lon• dash-sho•t dash line), and ]] vegetation types from DeFriez •n• Townzhen• []ggS] (lon• dash-double short dash line).
set was used to calculate the mean NDVI of each vegetation type in each of the four vegetation distributions. Global NDVI distributions were reconstructed from each of the four data
sets by extrapolating the mean NDVI value for each vegetation type to all grid cells identified in the data set as that type. Figure 3 shows the latitudinal variation of the zonally averaged NDVI using the full-resolution NDVI data set as well as for the three reconstructed distributions. The reconstructed distri-
butions clearly depart from the original distribution. The dif- ference is larger between the profiles calculated from the full- resolution NDVI data set and the reconstructed NDVI data set
calculated from the 178 vegetation types than among those calculated from the 178, 32, 29, and 11 vegetation types.
Global distributions of most land surface properties used in atmosphere-biosphere models are not available. Tabular data exist for some of the properties. For example, Whittaker and Likens [1975] provide widely used parameter values typical of major vegetation types. To obtain the global distribution, a common practice is to assign the parameter value to a vegeta- tion type and extrapolate the value over the geographic distri- bution of the vegetation type using a digital vegetation distri- bution. This procedure requires a translation and matching of
the vegetation definitions in the tabular and geographic data- bases. The results are illustrated in the following examples.
We extrapolated tabular data for three properties, biomass for 11 vegetation types [Reiners, 1973], leaf area index for 15 vegetation types [Lieth, 1975], and July-September albedo for 12 vegetation types [Hummel and Reck, 1979], using three vegetation distributions. The vegetation distributions were 32 vegetation types compiled from maps [Matthews, 1983], 29 vegetation types diagnosed from climate [Prentice, 1990], and 11 types deduced from seasonal variations in NDV! [DeFries and Townshend, 1994a]. The three vegetation distributions were also used to map leaf area index (LAI) from a table of LA! values for 15 vegetation types and July-August-September albedos from a table of albedo values for 12 major vegetation types. The latitudinal profiles of the three resultant albedo, LAI, and biomass distributions are shown in Figure 4. The difference among the three estimates is as high as 50% of the mean. Albedo differences of approximately 5% (absolute value) in northern hemisphere midlatitudes are thought to be significant for simulations of the physical climate system [Dick- inson and Hanson, 1984].
Clearly, the choice of land surface classification scheme

DEFRIES ET AL: MAPPING THE LAND SURFACE 20,875
a)
3O
26
22
18
14
10
•'
LATITUDE
b)
2O
16
12
8
LATITUDE
c)
ac 5
z• 4
u) •_ 3
i i I ii i
LATITUDE
2O
16
12
8
LATITUDE
z lO
i
LATITUDE
Figure 4. Latitudinal variations and standard deviations of (a) albedo, (b) leaf area index (LAI), and (c) biomass calculated from vegetation distributions based on Matthews [1983] (solid line), Prentice [1990] (long-dashed line), and DeFries and Townsbend [1994a] (short-dashed line).
can significantly influence the parameter fields for atmosphere- biosphere models. Discrepancies among the land cover data sets in geographic distributions of vegetation types add problems beyond those related to the loss of information resulting from binning a spatially varying quantity into discrete classes.
Ideally, either the fluxes of water, energy, and carbon diox- ide or the fields of parameters that control them would be derived directly from remote sensing or other sources. Unfor- tunately, current remote sensing instruments and algorithms are not sutficient for this, at least for the broad range of parameters that could be included in a model. Given that we lack the ideal data, we are faced with the alternative of iden- tifying land surface characteristics from which parameters that control fluxes can be derived. For example, a global mapping of LAI or roughness length requires knowledge of the vegeta- tion's growth form and leaf type [Sellers et al., 1994]. Running et al. [1994] propose that a description of global vegetation can be derived from combinations of three primary attributes of plant-canopy structure: permanence of aboveground live bio- mass, leaf longevity, and leaf type.
The question becomes how to most accurately map these vegetation characteristics. We have addressed some of the problems with the assumption underlying the approach based on discrete classes. Now, we turn to the question of which land surface characteristics control the fluxes and assess how these
or useful surrogates of them can be mapped globally. This is the first step in an iterative process that involves (1) identifying the ideal land surface characterization for a model, (2) iden- tifying limitations on what can be provided globally, and (3) modifying the models to utilize data that are feasible to obtain [ Ustin et al., 1993].
4. Land Surface Information for
Atmosphere-Biosphere Models Currently, process models for water, energy, and carbon
exchange generally use discrete vegetation classes as a basis for estimating a number of parameters. Is it possible to obtain better estimates for these parameters from alternative ap- proaches to characterize the land surface, especially ap- proaches that use remote sensing? To answer this question, it

20,876 DEFRIES ET AL: MAPPING THE LAND SURFACE
is necessary to assess the major processes individually. This paper provides insufficient space for a complete review of the processes. It does, however, offer the opportunity to connect trends emerging from many lines of recent research.
Models of atmosphere-biosphere exchanges of water, en- ergy, and carbon require an overlapping suite of surface and ecosystem parameters. For energy and water exchange, impor- tant parameters include surface albedo, surface roughness, and canopy conductance, with the latter influenced by soil depth and soil moisture holding capacity. For carbon exchange, the information needed is CO2 fixation through photosynthesis and release through plant respiration and microbial decompo- sition, as well as the sizes and dynamics of carbon pools. Im- portant parameters include photosynthetic capacity, stomatal conductance, LAI, intercepted solar radiation, partitioning of dry matter among leaves, stems, and roots, chemical composi- tion of the plant biomass, and a number of soil properties related to depth, aeration, moisture holding capacity, and par- ent material. Individual models may require more or less de- tail, but the current understanding of the biophysical and bio- chemical controls on the processes encourages most models to work from similar parameters.
The following sections discuss the potential for a geograph- ically referenced system for characterizing global vegetation as continuous distributions of a small number of functional prop- erties. These properties are identified in terms of their end points, such as deciduous or evergreen vegetation. In reality, each grid cell is a combination of these end points. Describing the functional properties as mixtures of these end points would allow the calculation of continuous parameter fields for bio- sphere-atmosphere models. In this way, the parameter field would not depend on the number of vegetation types or the spatial resolution of the land cover data set as is currently the case with land cover data sets describing a discrete number of cover types.
It is not within the scope of this paper to address parame- terization methods for all atmosphere-biosphere models. Rather, the notion of continuous fields to describe the land surface is proposed as an alternative approach to discrete classes to provide a richer and more accurate description of the land surface on which improved parameterization methods for atmosphere-biosphere models could be based.
In the following five sections, we consider the functional properties required to calculate the most important parame- ters for atmosphere-biosphere models, namely, absorbed radi- ation, energy exchange (albedo, canopy conductance, and aerodynamic roughness), photosynthesis and transpiration, net primary production, and carbon and nutrient dynamics.
4.1. Absorbed Radiation
The fraction of downwelling photosynthetically active radi- ation (FPAR) intercepted by green plants is a component of surface albedo and therefore an important determinant of surface energy balance. The product of FPAR and down- welling photosynthetically active radiation (PAR) yields inter- cepted PAR (IPAR), one of the plant parameters most strongly correlated with plant production. The relationship between IPAR and net primary production has been explored with theoretical [Field et al., 1994; Kumar and Monteith, 1981] and empirical [Monteith, 1977; Russell et al., 1989; Yoder, 1992] studies, as has the relationship between IPAR and gross pri- mary production (for theory [Choudhury, 1987; Sellers, 1985, 1987; Sellers et al., 1992], and for empirical studies [Desjardins
et al., 1992; l/alentini et al., 1995]). While many correlations are far from perfect [Running and Hunt, 1993], and the relation- ship involves substantial conceptual problems [Demetriades- Shah et al., 1992], the utility of IPAR as an element of plant production models is well established.
Since FPAR summarizes aspects of the interactions between the terrestrial surface and the downwelling radiation, it is po- tentially amenable to quantification on the basis of satellite measurements of the solar radiation reflected from the Earth's
surface. Satellite-based estimates of FPAR typically employ the large contrast between the red and infrared reflectances of leaves, not seen in the wood or soil background. This contrast is the basis for several spectral vegetation indices and has, in addition to FPAR, been related to green biomass [Gamon et al., 1992; Tucker et al., 1986] and gross and net primary pro- duction [Goward et al., 1985; Prince, 1991a].
The relationship between vegetation indices and FPAR de- pends on several factors, including the choice of vegetation index and spectral bands [Sellers, 1987], the color of the soil/ surface background [Asrar et al., 1992; Choudhury, 1987; Goward and Huemmrich, 1992; Sellers, 1985], solar and sensor geometry, and vegetation characteristics, including canopy ar- chitecture and spatial heterogeneity [Begue, 1993; Huemmrich and Goward, 1992; Myneni et al., 1992]. Errors resulting from each of these complicating factors can be corrected, but the corrections are facilitated with additional information, includ- ing some that depend on vegetation type, spatial distribution of canopies, and soil background properties.
The absence of a general theory for calculating FPAR from a vegetation index encourages, at least at this point, an empir- ical approach at the global level such as that developed by Sellers et al. [1994]. This approach has revealed that vegetation characteristics do affect the relationships between FPAR and vegetation indices calculated from remotely sensed data. In general, the relationship differs according to whether the veg- etation is (1) tall, broadleaf evergreen vegetation including woodland and shrubs with ground cover, (2) broadleaf decid- uous vegetation, including mixed needle and broadleaf, (3) tall, needleleaf vegetation, including deciduous and evergreen classes, and (4) agriculture, including all short land cover types with the exception of shrubs with ground cover. In conclusion, satellite-based estimates of FPAR appear to require a land surface characterization scheme that describes each cell in
terms of percentage area covered by vegetation with different seasonality (deciduous or evergreen) and leaf type (broadleaf or needleleaf).
4.2. Energy and Water Exchange
For calculations of surface fluxes of energy, water vapor, and momentum, the critical vegetation parameters are albedo, can- opy conductance to water vapor, and aerodynamic roughness. Albedo is closely related to FPAR, discussed above. In addi- tion to leaf area, the critical parameters are canopy architec- ture and the albedo of individual leaves. The albedo of indi-
vidual leaves is relatively invariant [Gates, 1980], but canopy architecture, including aspects of leaf shape and arrangement and crown spacing, can be an important determinant of albedo. The biggest contrasts are between optically rough forests, in which crowns of different heights produce extensive shadows, and uniform crop or grassland canopies, in which all the plant spacing is relatively uniform and plants are about the same size [Strahler and Jupp, 1991]. Estimates of shadowing can be ob- tained with multi-angle remote sensing [Kimes, 1991] or from

DEFRIES ET AL: MAPPING THE LAND SURFACE 20,877
geometric analyses [Li and Strahler, 1985, 1986] and deconvo- lution techniques [Smith et al., 1990a, b; Ustin et al., 1993] using high-resolution sensors. Appropriate sensors for global-scale measurements are not yet operational. Until they are, a land surface characterization indicating the mixture within each grid cell of forest and nonforested areas would provide a useful adjunct to absorbed photosynthetically active radiation (APAR).
Canopy conductance varies widely among vegetation types. Schtt[ze eta[. [1994] conclude that maximum canopy conduc- tance varies in parallel to maximum leaf conductance and that maximum leaf conductance is highly correlated with maximum photosynthetic capacity. Sellers eta[. [1992] showed how max- imum leaf conductance and FPAR can be combined to esti-
mate total (area-averaged) canopy conductance. Thus the de- terminants of photosynthetic capacity provide a useful starting point for estimating maximum canopy conductance. The most important exception involves the distinction between C3 and C4 plants, with the latter typically operating at lower conduc- tances than the former. Among the ecosystems considered by Schu[ze eta[. [1994], agricultural ecosystems tended to have substantially higher maximum conductances than any of the natural ecosystems, suggesting that a land surface character- ization indicating extent or intensity of agriculture would be useful, especially if the associated soils information indicated the amount of fertilizer used.
Aerodynamic roughness is mainly a function of plant height, architecture, and spacing and a weak function of LAI [Grace, 1977]. The most important information is whether the land surface is forested. Because conifers typically differ from broad- leaved species in the height at which the projected horizontal wind velocity drops to zero, a land surface characterization indicating the relative abundances of these two leaf types would be a major asset for modeling. Additional useful infor- mation would come from distinctions between grasslands and shrublands and between even aged and uneven aged forests.
4.3. Photosynthesis and Transpiration
The biochemical capacity for photosynthesis in higher plants, defined per unit of leaf mass or area, varies by approx- imately 2 orders of magnitude [Mooney and Gulmon, 1979]. Maximum transpiration rates vary over a similar range. Maxi- mum leaf or stomatal conductance, the determinant of tran- spiration under physiological control, tends to be highly cor- related with biochemical capacity for photosynthesis [Korner et al., 1979], but with two important caveats. First, plants with the C4 photosynthetic pathway typically, but not always, have much lower maximum conductance, relative to photosynthesis, than plants with the C3 pathway [Pearcy and Ehleringer, 1984]. Sec- ond, within each photosynthetic pathway, plants in water- stressed sites tend to operate at somewhat lower conductances than plants in mesic sites [Schulze, 1986].
The most important biochemical determinant of photosyn- thetic capacity is the leaf nitrogen content [Field and Mooney, 1986]. Nitrogen is one of the nutrients most limiting to plant growth [[4'tousek and Howarth, 1991]. Nitrogen availability can control photosynthesis at many levels, including biochemical capacity of individual leaves, canopy development, and the suite of species successful on a site [Chapin et al., 1986]. While it may ultimately be practical to quantify leaf nitrogen with remote sensing [Wickland, 1991], the best currently available predictors are combinations of measures that quantify canopy development (e.g., NDVI) and growth potential. The impor-
tant characteristics tend to be whether the vegetation is woody or nonwoody, annual or perennial, and the photosynthetic pathway (C3 or C4) [Chapin, 1993].
Biochemical capacity for photosynthesis is highly correlated with maximum relative growth rate [Schulze and Chapin, 1987], with the highest levels of both in herbaceous plants character- istic of disturbed sites and the lowest in woody plants found in resource-poor sites in which low light, low nutrient availability, low or very high water availability, or low temperature strongly limit growth [Chapin, 1993]. Plants characteristic of resource poor sites appear to utilize low potential growth and photo- synthesis as a mechanism for tolerating chronic resource short- ages [Chapin, 1980]. In addition, such plants conserve re- sources, especially nutrients, through slow tissue turnover and prolonged persistence of leaves, roots, and stems. Stress toler- ance minimizes sensitivity to chronic and acute resource short- ages, but with the consequence that potential growth, photo- synthesis, and transpiration are all constrained [Chapin, 1991].
Woodiness is the most characteristic feature of stress-
resistant plants, especially in sites with low biomass. The ranges of maximum relative growth rates, photosynthesis, and conductance overlap between woody and nonwoody plants, but the overlap is modest. Therefore percentage of woody and nonwoody plants in each cell should be the first feature used to characterize the land surface for quantifying photosynthesis and transpiration.
Among woody plants, long-lived species tend to be slower growing than short-lived species, and the same pattern is gen- erally true for herbaceous species [Grime and Campbell, 1991]. Short-lived species are successful only in habitats where they can gather enough resources to grow and reproduce in a short time. The mechanistic reason that long life implies slow growth is not clear, but the pattern is present. The pattern is perhaps most clearly expressed in the contrast between annual and perennial herbaceous plants (essentially all woody plants are perennials). Annuals tend to grow fast, construct short-lived, high-nitrogen tissues, and have high photosynthetic rates. Per- centage of annuals and perennials within a cell therefore needs to be the second level of a land surface characterization.
A land surface characterization for calculating photosynthe- sis and transpiration should also include photosynthetic path- way. Though C3 and C4 species overlap in essentially all phys- iological functions, differences in temperature dependence, and nitrogen and water requirements are too consistent to omit from a land surface characterization scheme [Pearcy and Ehleringer, 1984].
4.4. Net Primary Production
Net primary production (NPP), defined as total plant growth or the difference between photosynthesis and plant respiration, is the primary descriptor of the net removal of carbon from the atmosphere. Annual NPP varies from less than 100 g carbon m -2 in desert and tundra ecosystems to more than 1000 g carbon m -2 in fertile forest and agricultural ecosystems. NPP has been modeled with approaches based on climate, biome characteristics, the resources necessary for plant growth, and combinations of these factors [FieM et al., 1994]. Neither cur- rent understanding of the underlying mechanisms nor available surface data provides a satisfactory platform for assessing the relative roles of these controllers at the global scale.
A scheme to characterize vegetation to support NPP models should be similar to a scheme designed for photosynthesis and transpiration (above) because photosynthesis and growth are

20,878 DEFRIES ET AL: MAPPING THE LAND SURFACE
interdependent [Chapin, 1993]. Information on growth form (tree, shrub, herb, grass) is additionally important for NPP because carbon loss through respiration varies as a function of both plant growth and plant biomass [Amthor, 1989].
Several global models utilize a formulation in which NPP is calculated from a product of IPAR and a radiation use effi- ciency [Field et al., 1994]. Measured radiation use efficiencies are typically higher in crops with the C4 than the C3 photosyn- thesis pathway [Sinclair and Horie, 1989], and higher in annual crops than in natural grasslands or forests [Ruimy et al., 1994], emphasizing the C3-C 4 and annual-perennial distinctions dis- cussed in relation to photosynthesis and transpiration.
The role of woody biomass as a control on NPP is difficult to assess at the global scale. Forest NPP tends to be higher than grassland NPP [Chapin, 1993], though this may reflect the frequent dominance of woody plants on richer sites more than inherent differences in growth potential. As for photosynthesis, extended tissue longevity and, especially, evergreen plants are more common in low-resource habitats and represent adapta- tions for coping with resource limitation [Chapin, 1980]. The possibility that slow growth is an adaptation to resource limi- tation [Chapin, 1980] also argues that evergreen vegetation should be associated with low NPP.
The primary vegetation characteristics that need to be cap- tured for global NPP models are woody versus nonwoody, evergreen versus deciduous, C3 versus C4 photosynthetic path- way, and crop versus noncrop. These characteristics will also facilitate models of APAR, nutrient dynamics, and photosyn- thesis and transpiration, which often play a role in NPP calcu- lations.
4.5. Carbon and Nutrient Dynamics
A land surface characterization designed for global analyses of carbon and nutrient stocks and their actual and potential dynamics should have at its first level the relative abundance of woody and nonwoody vegetation types. This distinction is cru- cial because woody plants use carbon to produce long-lived, difficult-to-decompose structural tissue that not only contains large quantities of carbon [Reiners, 1988], but also affects all aspects of ecosystem function [Harmon et al., 1986]. Many very different terrestrial ecosystems converge rather closely in APAR and productivity (especially during favorable seasons), but systems dominated by woody plants can contain two orders of magnitude more carbon in vegetation than those systems dominated by nonwoody vegetation. Wood contains relatively smaller quantities of nitrogen and other nutrients, but never- theless the total nutrient content of wood (including bark and branches) in forests generally is greater than that of foliage [Waring and Schlesinger, 1985].
For woody vegetation the second level of information re- quired in a land surface characterization is disturbance history. Within a region, the amount of carbon and nutrients in bio- mass varies widely as a function of disturbance. Storing large amounts of carbon and nutrients in structural material requires a substantial amount of time following disturbance. Natural disturbance (windstorms, wildfire) usually occurs on a rela- tively fine scale (from <1 to 1000 km2), and its influence can be considered to be in a quasi-steady state over sufficiently coarse scales. In contrast, human-caused disturbance (forest harvest- ing, land clearing, anthropogenic fires) can cause a significant decrease in carbon in woody vegetation on continental scales [Detwiler and Hall, 1988; Skole and Tucker, 1993]. This distinc- tion is also important because of the systematic decline in soil
Table 1. Land Surface Characteristics Required to Calculate Parameters Used in Atmosphere-Biosphere Models of Water, Energy, and Carbon Dioxide Exchange
Land Surface Parameter
Land Surface Characteristic
Required to Calculate Parameter Field
Absorbed radiation
Albedo
Canopy conductance
Roughness Photosynthesis and
transpiration
Net primary production
Carbon and nutrient
dynamics
Seasonality (evergreen, deciduous), leaf type (broadleaf, coniferous)
Woodiness (trees/shrubs, herbaceous plants, bare ground)
Photosynthetic pathway (C3, C4), disturbance type (e.g., cultivation)
Woodiness, leaf type Photosynthetic pathway, woodiness,
plant longevity (annual, perennial)
Woodiness, seasonality, photosynthetic pathway, disturbance type
Woodiness, disturbance type, plant longevity
carbon with cultivation [Post and Mann, 1990; Schlesinger, 1986] and because the intensity of human use in cultivated areas affects nutrient transformations as well as nutrient gains, losses, and storage. Large regions that are altered by human activity should therefore be distinguished from areas with little human disturbance.
For nonwoody vegetation a land surface characterization should distinguish between annual- and perennial-dominated areas. Perennial plants (most important, perennial grasses) are not readily distinguished from annuals in their peak season APAR, but they function wholly differently in the ways that they allocate carbon and nutrients and in their responses to natural and anthropogenic disturbance.
Many of the critical controls on carbon and nutrient dynam- ics involve below ground processes, including nutrient uptake, root production and turnover, and organic matter decomposi- tion. All of these interact strongly with soils characteristics. The properties of soils, especially vegetated soils, are relatively inaccessible through remote sensing. There is thus a need for improved characterization of global soils as well as for global vegetation.
5. A New Approach to Land Surface Characterization
The above discussion outlines a number of functional prop- erties of vegetation important for specifying inputs to global models of water, energy, and carbon dioxide exchange between the biosphere and atmosphere. These requirements were iden- tified from the perspective of information needed for calcula- tions of FPAR, albedo, canopy conductance, roughness, pho- tosynthesis and transpiration, net primary production, and carbon and nutrient dynamics (Table 1).
Spatially explicit information about continuous gradients and mixtures of vegetation characterized by its functional properties would improve descriptions of the spatially hetero- geneous vegetation over the Earth's land surface. This ap- proach would improve the accuracy of the land surface char- acterization over the traditional approach of assigning grid cells to discrete land cover types. A small suite of continuous descriptors potentially identifies more combinations of ecosys-

DEFRIES ET AL: MAPPING THE LAND SURFACE 20,879
Table 2. Units to Describe Land Surface Characteristics With Continuous Distributions
Land Surface Characteristic
Units to Describe Characteristic as Continuous Field Potential Means to Obtain Land Surface Characteristic
Woodiness
Seasonality
Leaf type
Photosynthetic pathway
Plant longevity
Disturbance type
% area with woody vegetation; % area with nonwoody vegetation; % area with no vegetation
% area with deciduous woody vegetation; % area with evergreen woody vegetation
% area with broadleaf trees; % area with coniferous trees
% area of nonwoody vegetation with C3 photosynthetic pathway; % area of nonwoody vegetation with C4 photosynthetic pathway
% area with annual nonwoody vegetation; % area with perennial nonwoody vegetation
% area under cultivation; % area experiencing fires with specified frequency
NDVI temporal dynamics; land surface temperature; red and near-infrared reflectances
NDVI temporal dynamics; maximum land surface temperature
NDVI temporal dynamics; climatic regions where different cover types occur
Climate (warm, wet climates favorable to C4 plants)
Possibly greenness duration from NDVI temporal profile; ground-based sources
Possibly remotely sensed data at high spatial resolution; ground-based sources
G. J. Collatz and J. A. Berry (manuscript in preparation, 1995), DeFries et al. [1995], Nemani et al.. [1993], and Running et al. [1995] present more detailed discussion of potential means to obtain the land surface characteristics.
tem states than even the most complex typological schemes. With continuous descriptors, there is no fixed number of veg- etation classes, so the number of vegetation classes can be adjusted according to requirements of different models. How- ever, obtaining some of these land surface characteristics will require fundamentally different approaches to collecting infor- mation, including combinations of remote sensing and ground- based efforts.
The information about the vegetated land surface required for calculations of FPAR, albedo, canopy conductance, rough- ness, photosynthesis and transpiration, net primary produc- tion, and carbon and nutrient dynamics could largely be met by geographically referenced information on continuous distribu- tions of a relatively small number of vegetation characteristics (Table 2). The most important vegetation characteristics are the spatial extent of woody plants (gradations between bare ground, herbaceous plants, and trees and/or shrubs), season- ality of photosynthetic activity of woody vegetation (deciduous, evergreen), leaf type (broadleaf, coniferous), photosynthetic pathway of nonwoody vegetation, plant longevity of nonwoody vegetation (annual, perennial), and disturbance type (e.g., cul- tivation, fire history). Many of these distinctions are also called for by Running et al. [1994]. In continuous fields describing these characteristics, each grid cell would be characterized by percentage of land surface area occupied by vegetation with the characteristic.
Ideally, these required land surface characteristics would be obtained from remote sensing, so that the parameter fields would be internally consistent. Some of the characteristics, such as a distinction between deciduous and evergreen vege- tation, woody and nonwoody vegetation, and to some extent, broadleaf and needleleaf vegetation, can be remotely sensed based on temporal dynamics in the NDVI (e.g., mean NDVI, amplitude in NDVI temporal profile, greenness duration), red and near-infrared reflectances, and land surface temperature [DeFries et al., 1995; Nemani et al., 1993; Running et al., 1994]. Other parameters, such as a distinction between C3 and C 4 vegetation, cannot be directly measured with remote sensing but can be derived from climatic parameters (e.g., grassland locations with warm, wet climates are favorable to C4 physiol- ogy) (G. J. Collatz and J. A. Berry, manuscript in preparation, 1995). Still other distinctions, such as whether nonwoody veg- etation is annual or perennial, would probably need to rely on ground-based information (Table 2). Methodologies to de-
velop continuous fields for each of the land surface character- istics are likely to be unique to the particular characteristic.
In order to use remote sensing to obtain continuous fields, substantial methodological development is required. This pa- per provides examples of one possible approach, linear unmix- ing, that has been applied at local and regional scales to obtain continuous fields of vegetation attributes (Plate 3 and Figure 2). In order for this approach to be globally applicable, globally valid "pure end-members" for each vegetation characteristic need to be identified. Other methods in addition to linear
unmixing methods need to be investigated as well.
Acknowledgments. This paper was developed from ideas that emerged within the Earth Observing System-Interdisciplinary Science team for Biosphere-Atmosphere Interactions led by Piers Sellers and Harold Mooney and supported by NASA. Investigators on the team, as well as others who contributed to the paper, are included as authors. Research for the paper was also supported by NASA (contract NAGW2723) at the University of Maryland, College Park. We thank Jasmin John, Goddard Institute for Space Studies, for technical assis- tance.
References
Adams, J. B., V. Kapos, M. O. Smith, R. A. Filho, A. P. Gillespie, and D. A. Roberts, A new Landsat view of land use in Amazonia, Int. Soc. Photogramm. Remote Sensing, 28, 177-185, 1990.
Amthor, J. S., Respiration and Crop Productivity, 215 pp., Springer- Verlag, New York, 1989.
Asrar, G., R. B. Myneni, and B. J. Choudhury, Spatial heterogeneity in vegetation canopies and remote sensing of absorbed photosynthet- ically active radiation: A modeling study, Remote Sens. Environ., 22, 209-233, 1992.
Badwhar, G. D., Use of Landsat-derived profile features for spring small-grains classification, Int. J. Remote Sens., 5, 783-797, 1984.
Begue, A., Leaf area index, intercepted photosynthetically active radi- ation, and spectral vegetation indices: A sensitivity analysis for reg- ular clumped canopies, Remote Sens. Environ., 46, 45-59, 1993.
Box, E. O., Macroclimate and Plant Forms:/In Introduction to Predictive Modeling in Phytogeography, Dr. W. Junk, Norwell, Mass., 1981.
Chabot, B. F., and H. A. Mooney, Physiological Ecology of North /imerican Plant Communities, Chapman and Hall, New York, 1985.
Chapin, F. S., III, The mineral nutrition of wild plants,/innu. Rev. Ecol. Syst., 11, 233-260, 1980.
Chapin, F. S., III, Integrated responses of plants to stress, Bioscience, 41, 29-36, 1991.
Chapin, F. S., III, The functional role of growth forms in ecosystem and global processes, in Scaling Physiological Processes: Leaf to

20,880 DEFRIES ET AL: MAPPING THE LAND SURFACE
Globe, edited by J. R. Ehleringer and C. B. Field, pp. 287-312, Academic, San Diego, Calif., 1993.
Chapin, F. S., III, P.M. Vitousek, and K. Van Cleve, The nature of nutrient limitation in plant communities, ,4m. Natur., 127, 48-58, 1986.
Choudhury, B. J., Relationships between vegetation indices, radiation, absorption and net photosynthesis evaluated by a sensitivity analysis, Remote Sens. Environ., 22, 209-233, 1987.
Cohen, S. B., The Oxford World Atlas, 190 pp., Oxford Univ. Press, New York, 1973.
Conese, C., G. Maracchi, F. Miglietta, F. Maselli, and V. M. Sacco, Forest classification by principal component analyses of TM data, Int. J. Remote Sens., 9, 1597-1612, 1988.
DeFries, R. S., and J. G. R. Townshend, NDVI-derived land cover classification at global scales, Int. J. Remote Sensing, 15(17), 3567- 3586, 1994a.
DeFries, R. S., and J. R. G. Townshend, Global land cover: Compar- ison of ground-based data sets to classifications with AVHRR data, in Environmental Remote Sensing From Regional to Global Scales, edited by G. Foody and P. Curran, pp. 84-110, John Wiley, New York, 1994b.
DeFries, R. S., and J. R. G. Townshend, An initial coarse resolution NDVI-derived global land cover classification, in ISLSCP Initiative I: Global Data Sets for Land-Atmosphere Models 1987-1988, CD Rom, vols. 1-5, edited by B. W. Meeson et al., NASA, Greenbelt, Md., 1995.
DeFries, R., M. Hansen, and J. Townshend, Global discrimination of land cover types from metrics derived from AVHRR Pathfinder data, Remote Sens. Environ., in press, 1995.
Demetriades-Shah, T. H., M. Fuchs, E. T. Kanemasu, and I. Flitcroft, A note of caution concerning the relationship between cumulated intercepted solar radiation and crop growth, ,4gric. Forest Meteorol., 58, 193-207, 1992.
Desjardins, R. L., P. H. Schuepp, J. I. MacPherson, and D. J. Buckley, Spatial and temporal variations of the fluxes of carbon dioxide and sensible and latent heat over the FIFE site, J. Geophys. Res., 97, 18,467-18,475, 1992.
Detwiler, R. P., and C. A. S. Hall, Tropical forest and the global carbon budget, Science, 239, 42-47, 1988.
Dickinson, R. E., Land processes in climate models, Remote Sens. Environ., 51, 27-38, 1995.
Dickinson, R. E., and B. Hanson, Vegetation-albedo feedbacks, in Climate Processes and Climate Sensitivity, Geophys. Monogr. Set., vol. 29, edited by J. Hansen and T. Takahashi, pp. 180-186, AGU, Washington, D.C., 1984.
Field, C., and H. A. Mooney, The photosynthesis-nitrogen relationship in wild plants, in On the Economy of Plant Form and Function, edited by T. J. Givnish, pp. 25-55, Cambridge Univ. Press, New York, 1986.
Field, C. B., J. T. Randerson, C. M. Malmstr6m, and C. S. Potter, Ecological controls on net primary production: Lessons from global models, in Scaling Up, edited by P. van Gardingen, G. Foody, and P. Curran, Br. Soc. for Exp. Biol., London, England, 1994.
Fosberg, F. R., A classification of vegetation for general purposes, in Guide to the Checksheet for IBP Areas, IBP Handb. 4, edited by G. F. Peterken, pp. 73-120, Blackwell, Cambridge, Mass., 1967.
Friedlingstein, P., C. Delire, J. F. Muller, and J. C. Gerard, The climate induced variation of the continental biosphere: A model simulation of the last glacial maximum, Geophys. Res. Lett., 19, 897-900, 1992.
Fuller, R. M., R. J. Parsell, M. Oliver, and G. Wyatt, Visual and computer classifications of remotely sensed images: A case study of grasslands in Cambridgeshire, !nt. J. Remote Sens., 10, 193-210, 1989.
Gamon, J. A., C. B. Field, D. A. Roberts, S. L. Ustin, and R. Valentini, Functional patterns in an annual grassland during and AVIRIS overflight, Remote Sens. Environ., 44, 239-253, 1992.
Gates, D. M., Biophysical Ecology, 611 pp., Springer-Verlag, New York, 1980.
Goward, S. N., and K. F. Huemmrich, Vegetation canopy PAR ab- sorptance and the normalized difference vegetation index: An as- sessment using the SAIL model, Remote Sens. Environ., 39, 119-140, 1992.
Goward, S. N., C. J. Tucker, and D. G. Dye, North American vegeta- tion patterns observed with NOAA 7 advanced very high resolution radiometer, Vegetatio, 64, 3-14, 1985.
Goward, S. N., S. Turner, D. G. Dye, and S. Liang, The University of
Maryland improved Global Vegetation Index product, Int. J. Remote Sens., 15(17), 3365-3396, 1994.
Grace, J., Plant Responses to Wind, Academic, San Diego, Calif., 1977. Grime, J.P., and B. D. Campbell, Growth rate, habitat productivity,
and plant strategy as predictors of stress response, in Response of Plants to Multiple Stresses, edited by H. A. Mooney, W. E. Winner, and E. J. Pell, pp., Academic, San Diego, Calif., 1991.
Grisebach, A., Die Vegetatia der Erde nach ihrer klimatischen ,4nord- hung, vols. 1 and 2, Wilhelm Engelmann, Leipzig, 1872.
Hanan, N. P., S. D. Prince, and P. H. Y. Hiernaux, Spectral modelling of multicomponent landscapes in the Sahel, Int. J. Remote Sens., 12, 1243-1258, 1991.
Harmon, M. E., et al., Ecology of coarse woody debris in temperate ecosystems, ,4dv. Ecol. Res., 15, 133-302, 1986.
Hill, J., and J. Megier, Regional land cover and agricultural area statistics in the Departement Ardeche, France, by use of thematic mapper data, Int. J. Remote Sens., 9, 1573-1596, 1988.
Holdridge, L. R., Determination of world formations from simple climatic data, Science, 105, 367-368, 1947.
Huemmrich, K. F., and S. N. Goward, 1992, Spectral vegetation in- dexes and the remote sensing of biophysical parameters, in Proceed- ings of the International Geoscience and Remote Sensing Symposium, pp. 1017-1019, Inst. of Elec. and Electron. Eng., New York, 1992.
Hummel, J., and R. Reck, A global surface albedo model, J. ,4ppl. Meteorol., 18, 244, 1979.
Kimes, D. S., Radiative transfer in homogeneous and heterogeneous vegetation canopies, in Photon-Vegetation Interactions, edited by R. B. Myneni and J. Ross, pp. 339-388, Springer-Verlag, New York, 1991.
Koomanoff, V. A., Analysis of global vegetation patterns: A compar- ison between remotely sensed data and a conventional map, Mas- ter's thesis, Dep. of Geogr., Univ. of Md., 1989.
K6ppen, W., Das geographische system der klimate, in Handbuch der Klimatotogie 1 (C), edited by W. Koppen and R. Geiger, Gebr, Born- traeger, Berlin, 1936.
Korner, C. H., J. A. Scheel, and H. Bauer, Maximum leaf diffusive conductance in vascular plants, Photosynthetica, 13, 45-82, 1979.
Kuchler, A. W., Vegetation Mapping, John Wiley, New York, 1967. Kumar, M., and J. L. Monteith, Remote sensing of crop growth, in
Plants and the Daylight Spectrum, edited by H. Smith, pp. 133-144, Academic, New York, 1981.
Li, X., and A. H. Strahler, Geometric-optical bidirectional reflectance modeling of a conifer forest canopy, IEEE Trans. Geosci. Remote Sens., GE-24, 906-919, 1985.
Li, X., and A. H. Strahler, Geometric-optical modeling of a conifer forest canopy, IEEE Trans. Geosci. Remote Sens., GEE-23, 508-514, 1986.
Lieth, H., Primary production of major vegetation units of the world, in Primary Productivity of the Biosphere, edited by H. Lieth and R. H. Whittaker, pp. 203-215, Springer-Verlag, New York, 1975.
Los, S., C. Justice, and C. J. Tucker, A global 1 x 1 degree NDVI data set for climate studies derived from the GIMMS continental NDVI
data, Int. J. Remote Sens., 15(17), 3493-3518, 1994. Loveland, T. R., J. W. Merchant, D. O. Ohlen, and J. F. Brown,
Development of a land-cover characteristics database for the con- terminous U.S., Photogramm. Eng. Remote Sens., 57, 1453-1463, 1991.
Matthews, E., Global vegetation and land use: New high resolution data bases for climate studies, J. Clim. ,4ppl. Meteorol., 22, 474-487, 1983.
Monteith, J. L., Climate and the efficiency of crop production in Brit- ain, Philos. Trans. R. Soc. London B, 281, 277-294, 1977.
Mooney, H. A., and S. L. Gulmon, Environmental and evolutionary constraints on photosynthetic characteristics of higher plants, in Topics in Plant Population Biology, edited by O. T. Solbrig et al., pp. 316-337, Columbia Univ. Press, New York, 1979.
Mueller-Dombois, D., Classification and mapping of plant communi- ties: A review with emphasis on tropical vegetation, in SCOPE 23: The Role of Terrestrial Vegetation in the Global Carbon Cycle, edited by G. M. Woodwell, pp. 21-90, John Wiley, New York, 1984.
Mueller-Dumbois, D., and H. Ellenberg, Aims and Methods of Vege- tation Ecology, John Wiley, New York, 1974.
Myneni, R. B., G. Asrar, D. Tanre, and B. J. Choudhury, Remote sensing of solar radiation absorbed and reflected by vegetated land surfaces, IEEE Trans. Geosci. Remote Sens., 30(2), 302-314, 1992.
Nemani, R., L. Pierce, S. Running, and S. Goward, Developing satel-

DEFRIES ET AL: MAPPING THE LAND SURFACE 20,881
lite-derived estimates of surface moisture status, J. Appl. Meteorol., 32, 548-557, 1993.
Olson, J. S., J. Watts, and L. Allison, Carbon in live vegetation of major world ecosystems, Rep. W-7405-ENG-26, U.S. Dep. of Energy, Oak Ridge Natl. Lab., Oak Ridge, Tenn., 1983.
Pearcy, R. W., and J. Ehleringer, Comparative ecophysiology of C3 and C4 plants, Plant Cell Environ., 7, 1-13, 1984.
Pittick, A. B., The effect of changing climate on Australian biomass production--A preliminary study, Clim. Change, 8, 243-255, 1986.
Post, W. M., and L. K. Mann, Changes in soil organic carbon and nitrogen as a result of cultivation, in Soils and the Greenhouse Effect, edited by A. F. Bouwman, pp. 401-406, John Wiley, New York, 1990.
Prentice, I. C., W. Cramer, S. P. Harrison, R. Leemans, R. A. Mon- serud, and A.M. Soloman, A global biome model based on plant physiology and dominance, soil properties and climate, J. Biogeogr., 19, 117-134, 1992.
Prentice, K. C., Bioclimatic distribution of vegetation for general cir- culation model studies, J. Geophys. Res., 95, 11,811-11,830, 1990.
Prince, S. D., A model of regional primary production for use with coarse resolution satellite data, Int. J. Remote Sens., 12, 1313-1330, 1991a.
Prince, S. D., Satellite remote sensing of primary production: Com- parison of results from Sahelian grasslands 1981-1988, Int. J. Remote Sens., 12, 1301-1331, 1991b.
Raich, J. W., and W. H. Schlesinger, The global carbon dioxide flux in soil respiration and its relationship to vegetation and climate, Tellus, 44B, 81-99, 1992.
Reiners, W. A., Terrestrial detritus and the carbon cycle, Brookhaven Syrup. Biol., 25, 303-327, 1973.
Reiners, W. A., Achievements and challenges in forest energetics, in Concepts of Ecosystem Ecology, edited by L. R. Pomeroy and J. J. Alberts, pp. 75-114, Springer-Verlag, New York, 1988.
Roberts, D. A., R. O. Green, D. E. Sabol, and J. B. Adams, Temporal changes in endmember abundances, liquid water, and water vapor over vegetation at Jasper Ridge: Summaries of the Fourth Annual JPL Airborne Geoscience Workshop, pp. 153-156, Jet Propul. Lab., Pasadena, Calif., Oct. 25-29, 1993.
Ruimy, A., G. Dedieu, and B. Saugier, Methodology for the estimation of terrestrial net primary production from remotely sensed data, J. Geophys. Res., 99, 5263-5284, 1994.
Running, S. W., and E. R. Hunt, Generalization of a forest ecosystem process model for other biomes, BIOME-BGC, and an application for global-scale models, in Scaling Physiological Processes: Leaf to Globe, edited by J. R. Ehleringer and C. B. Field, pp. 141-158, Academic, San Diego, Calif., 1993.
Running, S. W., T. R. Loveland, and L. L. Pierce, A vegetation clas- sification logic based on remote sensing for use in global biogeo- chemical models, Ambio, 23, 77-81, 1994.
Running, S. W., T. W. Loveland, L. L. Pierce, R. R. Nemani, and E. R. Hunt Jr., A remote sensing based vegetation classification logic for global land cover analysis, Remote Sens. Environ., 51, 39-48, 1995.
Russell, G., P. G. Jarvis, and J. L. Monteith, Absorption of radiation by canopies and stand growth, in Plant Canopies: Their Growth, Form and Function, edited by G. Russell, B. Marshall, and P. G. Jarvis, pp. 21-39, Cambridge Univ. Press, New York, 1989.
Schlesinger, W. H., Changes in soil carbon storage and associated properties with disturbance and recovery, in The Changing Carbon Cycle: A Global Analysis, edited by J. R. Trabalka and D. E. Reichle, pp. 194-200, Springer-Verlag, New York, 1986.
Schulze, E.-D., Carbon dioxide and water vapor exchange in response to drought in the atmosphere and in the soil, Annu. Rev. Plant Physiol., 37, 247-274, 1986.
Schulze, E.-D., and F. S. Chapin III, Plant specialization to environ- ments of different resource availability, in Potentials and Limitations in Ecosystem Analysis, edited by E.-D. Schulze and H. Zwolfer, pp. 120-148, Springer-Verlag, New York, 1987.
Schulze, E.-D., F. M. Kelliher, C. Korner, J. Looyd, and R. Leuning, Relationship among maximum stomatal conductance, ecosystem surface conductance, carbon assimilation rate, and plant nitrogen nutrition: A global ecology scaling exercise, Annu. Rev. Ecol. Syst., 25, 629-660, 1994.
Sellers, P. J., Canopy reflectance, photosynthesis and transpiration, Int. J. Remote Sens., 6, 1335-1372, 1985.
Sellers, P. J., Canopy reflectance, photosynthesis and transpiration, II,
The role of biophysics in the linearity of their interdependence, Remote Sens. Environ., 21, 143-183, 1987.
Sellers, P. J., J. A. Berry, G. J. Collatz, C. B. Field, and F. G. Hall, Canopy reflectance, photosynthesis and transpiration, III, A reanal- ysis using improved leaf models and a new canopy integration scheme, Remote Sens. Environ., 42, 187-216, 1992.
Sellers, P. J., C. J. Tucker, G. J. Collatz, S. O. Los, C. O. Justice, D. A. Dazlich, and D. A. Randall, A global 1 degree by 1 degree data set for climate studies, Part 2; The generation of global fields of terres- trial biophysical parameters from the NDVI, Int. J. Remote Sens., 15(17), 3519-3545, 1994.
Shimoda, H., K. Fukue, T. Hosomura, and T. Sakata, Global vegeta- tion monitoring using NOAA GAC data, pp. 505-508, Remote Sens. for Resour. Dev. and Environ. Manage., Enschede, The Nether- lands, 1986.
Sinclair, T. R., and T. Horie, Leaf nitrogen, photosynthesis, and crop radiation use efficiency: A review, Crop Sci., 29, 90-98, 1989.
Skole, D., and C. Tucker, Tropical deforestation and habitat fragmen- tation in the Amazon: Satellite data from 1978 to 1988, Science, 260, 1905-1910, 1993.
Smith, M. O., S. L. Ustin, J. B. Adams, and A. R. Gillespie, Vegetation in deserts: I, A regional measure of abundance from multispectral images, Remote Sens. Environ., 31, 1-26, 1990a.
Smith, M. O., S. L. Ustin, J. B. Adams, and A. R. Gillespie, Vegetation in deserts: II, Environmental influences on regional abundance, Remote Sens. Environ., 31, 27-52, 1990b.
Solomon, A.M., and P. J. Bartlein, Past and future climate change: Response by mixed deciduous-coniferous forest ecosystems in northern Michigan, Can. J. For. Res., 22, 1727-1738, 1992.
Strahler, A. H., and D. L. B. Jupp, Geometric-optical modeling of forests as remotely sensed scenes composed of three-dimensional, discrete objects, in Photon-Vegetation Interactions, edited by R. B. Myneni and J. Ross, pp. 415-440, Springer-Verlag, New York, 1991.
Townshend, J. R. G., C. O. Justice, and V. T. Kalb, Characterization and classification of South American land cover types using satellite data, Int. J. Remote Sens., 8, 1189-1207, 1987.
Townshend, J. R. G., C. O. Justice, W. Li, C. Gurney, and J. McManus, Global land cover classification by remote sensing: Present capabil- ities and future possibilities, Remote Sens. Environ., 35, 243-256, 1991.
Troll, C., and K. Paffen, The seasonal climates of the earth (in German with English summary), Erkunde, 18, 5-28, 1964.
Tucker, C. J., J. R. G. Townshend, and T. E. Goff, African land-cover classification using satellite data, Science, 227, 369-375, 1985a.
Tucker, C. J., C. L. Vanpraet, M. J. Sharman, and G. Van Ittersum, Satellite remote sensing of total herbaceous biomass production in the Senegalese Sahel: 1980-1984, Remote Sens. Environ., 17, 233- 249, 1985b.
Tucker, C. J., C. O. Justice, and S. D. Prince, Monitoring the grass- lands of the Sahel, Int. J. Remote Sens., 7, 1571-1582, 1986.
Unesco, International classification and mapping of vegetation, Ecol. Conserv., 6, 15-16, 1973.
Ustin, S. L., M. O. Smith, and J. B. Adams, Remote sensing of eco- logical processes: A strategy for developing and testing ecological models using spectral mixture analysis, in Scaling Physiological Pro- cesses: Leaf to Globe, edited by J. Ehrlinger and C. B. Field, pp. 339-357, Academic, San Diego, Calif., 1993.
Ustin, S. L., L. Duan, Q. J. Hart, and R. Haxo, Seasonal changes observed in AVIRIS images of Jasper Ridge, California, paper pre- sented at the International Geoscience and Remote Sensing Sym- posium (IGARSS-94), Calif. Inst. of Technol., Pasadena, 1995.
Valentini, R., J. A. Gamon, and C. B. Field, Ecosystem gas exchange in a California serpentine grassland: Seasonal patterns and implica- tions for scaling, Ecology, in press, 1995.
Vitousek, P.M., and R. W. Howarth, Nitrogen limitation on land and in the sea: How can it occur?, Biogeochemistry, 13, 87-115, 1991.
Waring, R. H., and W. H. Schlesinger, Forest Ecosystems: Concepts and Management, 340 pp., Academic, San Diego, Calif., 1985.
Webb, W. L., W. K. Laurenroth, S. R. Szarek, and R. S. Kinerson, Primary production and abiotic controls on forests, grasslands, and desert ecosystems in the United States, Ecology, 64, 134-151, 1983.
Whittaker, R. H., and G. E. Likens, The biosphere and man, in Primary Productivity ofthe Biosphere, edited by H. Lieth and R. H. Whittaker, pp. 281-302, Springer-Verlag, New York, 1975.
Wickland, D. E., Mission to planet earth: The ecological perspective, Ecology, 72, 1923-1933, 1991.

20,882 DEFRIES ET AL: MAPPING THE LAND SURFACE
Wilson, M. F., and A. Henderson-Sellers, A global archive of land cover and soils data for use in general circulation models, J. Clima- tol., 5, 119-143, 1985.
Woodward, F. I., and T. M. Smith, Predictions and measurements of the maximum photosynthetic rate, Amax at the global scale, in Ecophysiology and Photosynthesis, Ecol. Stud., vol. 100, edited by E. D. Schulze and M. M. Caldwell, pp. Springer-Verlag, New York, 1993.
Woodward, F. I., G. B. Thompson, and I. F. McKee, The effects of elevated concentrations of carbon dioxide on individual plants, pop- ulations, communities and ecosystems, Ann. Bot., 67, suppl. 1, 23-28, 1991.
Yoder, B. J., Photosynthesis of conifers: Influential factors and poten- tials for remote sensing, Ph.D. dissertation, Oreg. State Univ., Cor- vallis, 1992.
R. DeFries and J. Townshend, Department of Geography, 1113 Lefrak Hall, University of Maryland, College Park, MD 20742.
C. Field, Carnegie Institution, 290 Panama Street, Stanford, CA 94305.
I. Fung, School of Earth and Ocean Sciences, University of Victoria, P.O. Box 1700, Victoria, B.C. V8W 2Y2, Canada.
C. O. Justice, S. Los, P. Sellers, and C. J. Tucker, NASA/Goddard Space Flight Center, Code 923, Greenbelt, MD 20771.
E. Matthews and K. Prentice, NASA/GISS, 2880 Broadway, New York, NY 10025.
P. Matson, Department of Soil Science, 108 Hilgard Hall, University of California, Berkeley, CA 94720.
H. Mooney and P. Vitousek, Department of Biological Sciences, Stanford University, Stanford, CA 94305.
C. Potter, NASA/Ames Research Center, MS 239-20, Moffett Field, CA 94035.
S. Ustin, Department of Hydrologic Science, University of Califor- nia, Davis, CA 95616.
(Received November 17, 1994; revised May 16, 1995; accepted May 16, 1995.)