
Mapping Potential Energy Surfaces by Neural Networks: The ethanol/Au(1 1 1) interface
13
This article appeared in a journal published by Elsevier. The attached copy is furnished to the author for internal non-commercial research and education use, including for instruction at the authors institution and sharing with colleagues. Other uses, including reproduction and distribution, or selling or licensing copies, or posting to personal, institutional or third party websites are prohibited. In most cases authors are permitted to post their version of the article (e.g. in Word or Tex form) to their personal website or institutional repository. Authors requiring further information regarding Elsevier’s archiving and manuscript policies are encouraged to visit: http://www.elsevier.com/copyright
Transcript of Mapping Potential Energy Surfaces by Neural Networks: The ethanol/Au(1 1 1) interface

This article appeared in a journal published by Elsevier. The attachedcopy is furnished to the author for internal non-commercial researchand education use, including for instruction at the authors institution
and sharing with colleagues.
Other uses, including reproduction and distribution, or selling orlicensing copies, or posting to personal, institutional or third party
websites are prohibited.
In most cases authors are permitted to post their version of thearticle (e.g. in Word or Tex form) to their personal website orinstitutional repository. Authors requiring further information
regarding Elsevier’s archiving and manuscript policies areencouraged to visit:
http://www.elsevier.com/copyright
Author's personal copy
Mapping Potential Energy Surfaces by Neural Networks:The ethanol/Au(111) interface
Diogo A.R.S. Latino a,b, Rui P.S. Fartaria a, Filomena F.M. Freitas a, João Aires-de-Sousa b,Fernando M.S. Silva Fernandes a,*
a Centre of Molecular Sciences and Materials, Department of Chemistry and Biochemistry, Faculty of Sciences, University of Lisboa, Campo Grande, 1749-016 Lisboa, Portugalb CQFB and REQUIMTE, Department of Chemistry, Faculty of Sciences and Technology, New University of Lisboa, 2829-516 Caparica, Portugal
a r t i c l e i n f o
Article history:Received 9 June 2008Received in revised form 29 July 2008Accepted 31 July 2008Available online 11 September 2008
Keywords:Potential Energy SurfacesEnsembles of Feed-Forward NeuralNetworksEthanol adsorption on Au(111)
a b s t r a c t
Potential Energy Surfaces (PES) for the ethanol/Au(111) interface are mapped by Neural Networks (NNs).Interaction energies, calculated from Density Functional Theory (DFT), for the adsorption of the ethanolon Au(111) surfaces are used to train Ensembles of Feed-Forward Neural Networks (EnsFFNNs). The dis-tance of the ethanol molecule to the surface, two angles describing the molecular orientation relatively tothe surface, and three binary descriptors encoding the gold adsorption sites, are the input to the NNs. Thetraining sets contain energy values at different distances, for seven molecular orientations and threeadsorption sites. The models are assessed by: (a) internal cross validation; (b) Leave-One-Out procedure(LOO); and (c) external test sets corresponding to orientations not used in the training procedure. Theresults are compared with the ones obtained from an analytical force field recently proposed by someof us to match the DFT data. It is shown that NNs can be trained to map PES with a similar or better accu-racy than analytical representations. This is a relevant point, particularly in simulations by Monte Carlo(MC) or Molecular Dynamics (MD), which require an extensive screening of the interaction sites at theinterface, turning the development of analytical functions a non-trivial task as the complexity of the sys-tems increases.
� 2008 Elsevier B.V. All rights reserved.
1. Introduction
The structure and dynamics of electrode/solution interfaces areof great importance in the domain of electrochemistry. The modi-fication of metallic surfaces properties by the adsorption of mole-cules allows, for example, photovoltaic, biosensing, and corrosionprotection developments.
The adsorption and spontaneous organization of organic mole-cules on metallic surfaces giving rise to films of organized and sta-ble monolayers is known as Self-Assembled Monolayers (SAMs).SAMs can be produced using different types of molecules and sub-strates. Typically, alkane chains (with 10 or more methylene units)and a thiol (SH) head group are used with Au surfaces due to thewell-known chemical affinity between sulfur and gold. These spe-cies have the advantage and singular characteristic of creatingdense monolayers when the thiol molecules adsorb onto gold withthe tail chains pointing outwards the surface. Moreover, it is possi-ble to functionalize the tail chain, after the formation of the SAMs,by the chemical insertion of specific functional groups ormolecules.
To investigate the mechanisms involved in the adsorption andself-assembly of solvated organic molecules on metallic electrodesby Monte Carlo (MC) or Molecular Dynamics (MD) simulations, thedetermination of the Potential Energy Surfaces (PES) of the systemsis crucial. They should describe the interactions between themolecular species present in the liquid phase as well the interac-tions between those species and the electrodes. Our current inter-est is the study of the adsorption of alkylthiols, solvated by ethanol,on gold electrodes and the understanding of the physi- and chemi-sorption mechanisms. To this end, our group has recently proposedan analytical force field, based on Density Functional Theory (DFT)calculations, for the interaction of ethanol with Au(111) surfaces.A preliminary test of the force field has also been carried out byMC simulations [1].
A function that matches DFT data provides, on one hand, a topo-graphical visualization of the surface features, which may not beevident from a coarse-grained quantum mechanical study. Onthe other hand, it is a suitable input for simulation work. A goodrepresentation of PES should smoothly connect the asymptotic aswell as the most interactive regions of the configuration space. Itshould accurately represent the true potential energy in the re-gions for which experimental or theoretical results are availableand predict the interaction energies for the regions where such
0022-0728/$ - see front matter � 2008 Elsevier B.V. All rights reserved.doi:10.1016/j.jelechem.2008.07.032
* Corresponding author. Tel.: +351 21 7500133; fax: +351 21 7500088.E-mail address: [email protected] (F.M.S.S. Fernandes).
Journal of Electroanalytical Chemistry 624 (2008) 109–120
Contents lists available at ScienceDirect
Journal of Electroanalytical Chemistry
journal homepage: www.elsevier .com/locate / je lechem
Author's personal copy
data is not available. Fitting analytical functions to the energies of aset of suitable configurations of the system is one of the standardapproaches to obtain PES. The London–Eyring–Polanyi–Sato (LEPS)functions, many-body expansions, splines and semiempiricalpotentials with adjustable parameters to reproduce experimentaland theoretical results, are commonly used [2,3].
It appears, however, that as the complexity of the systems in-creases, the development of accurate analytical functions becomesa non-trivial task. In the last years, Neural Networks (NNs) turnedout as an alternative way for mapping PES from ab initio/DFT en-ergy data sets. [4–15] In such approximation, there are no a prioriguesses of analytical functions and the results come out in tabularform. Moreover, once the networks are well trained, they are ableto produce, as output, any required number of energy points fornumerical interpolations with similar or better accuracy than otherrepresentation methods.
Single Feed-Forward Neural Networks (FFNNs) have been ap-plied, for example, to obtain PES for water dimer [4], HClþ[5],OHþ [6] and Hþ [7].
Some authors have compared structural, dynamical and ther-mal properties, obtained by MC and MD simulations, from NNs –PES and analytical functions. Gassner et al. [8] applied FFNNs toreproduce the three body interaction energy of the system H2O–Al3þ–H2O and assessed the MC radial distribution functions, usingan analytical function and the NN–PES. A similar study was done
by Cho et al. [9] where a polarizable force field for water was devel-oped using NNs and tested in MC simulations.
A more systematic work was performed by Witkoskie and Do-ren [10] who studied the NNs accuracy in terms of some parame-ters such as the optimal number of neurons and data needed in thetraining. Likewise, our group [11] trained ensembles of Feed-For-ward Neural Networks (EnsFFNNs) and Associative Neural Net-works (ASNNs) for mapping PES also represented by well-knownanalytical potential functions, and then assessed the accuracy ofthe method by comparison of the simulation results from NNsand analytical PES. Training sets with different number of points,from 15 differently parametrized Lennard–Jones (LJ) potentials,were used and argon was taken to test the models. MD simulationswere performed using the tabular potential energies, predicted bythe NNs, to work out thermal, structural and dynamical propertieswhich compare well with the values obtained from the LJ analyti-cal function.
NNs have also been used to obtain PES for the study of adsorp-tion on metallic surfaces. The study of reactions in surfaces wasperformed by Lorenz et al. [12] to build continuous PES for H2
interacting with a (2� 2) Pd(100) surface covered by potassium.More recently, the same authors [13] applied NNs to fit six dimen-sional PES for H2 dissociation on the clean and sulfur coveredPd(100) surfaces. The models describe reaction rates for the disso-ciative adsorption and show that a description of dissociation reac-
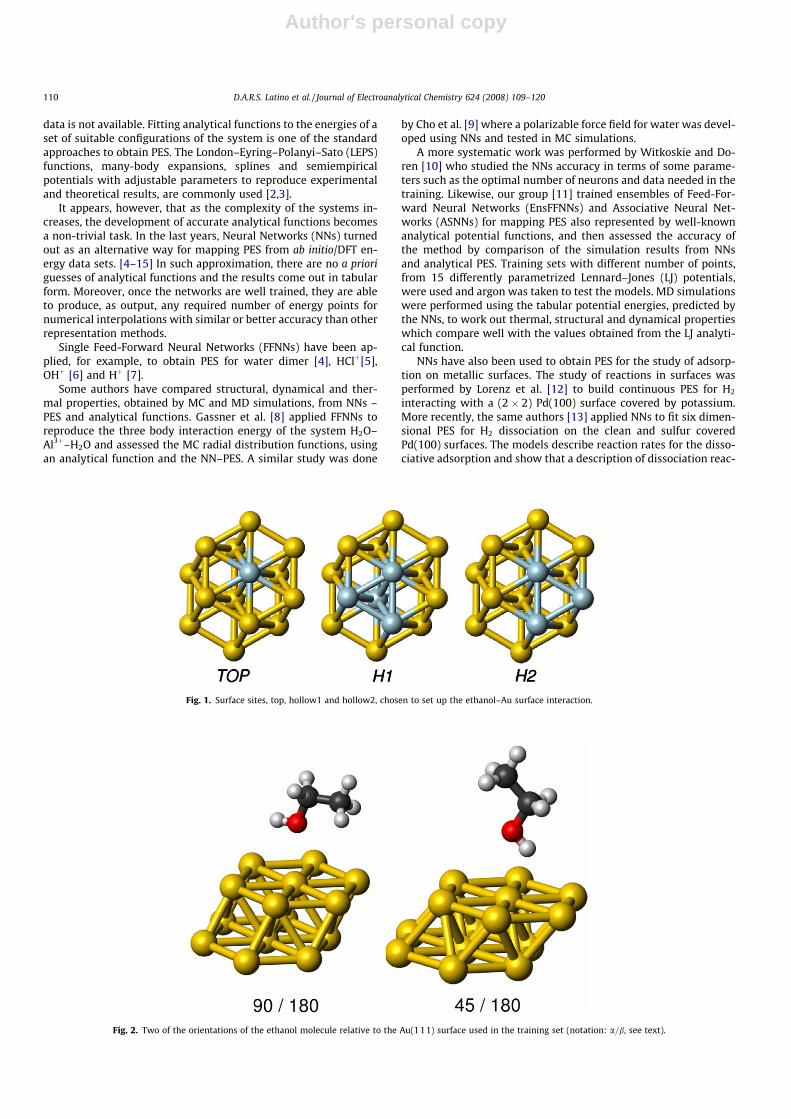
Fig. 2. Two of the orientations of the ethanol molecule relative to the Au(111) surface used in the training set (notation: a=b, see text).
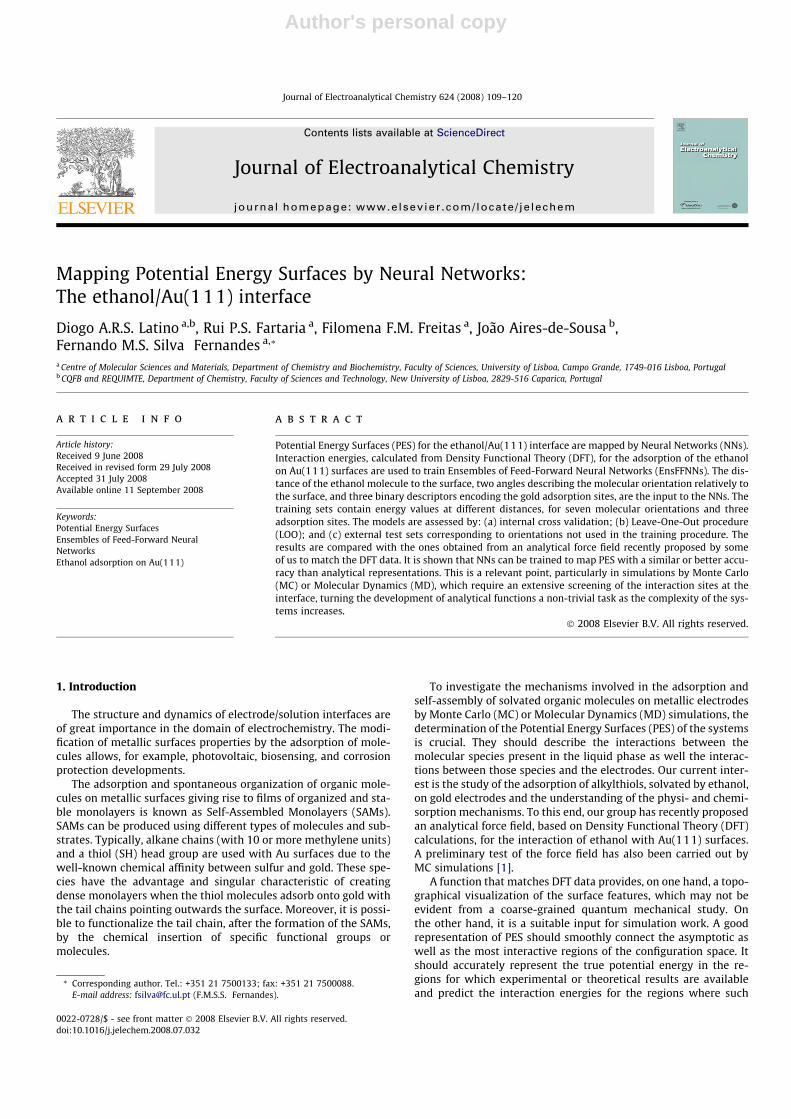
Fig. 1. Surface sites, top, hollow1 and hollow2, chosen to set up the ethanol–Au surface interaction.
110 D.A.R.S. Latino et al. / Journal of Electroanalytical Chemistry 624 (2008) 109–120
Author's personal copy
tions with NNs is orders of magnitude smaller than that of the onefor ‘‘on the fly” ab initio dynamics.
The main objective of the present work is to assess an alterna-tive to our analytical force field [1], in order to map multidimen-sional PES for the interaction of ethanol and Au(111) surfacesregarding the simulation of the adsorption and self-assembly ofalkylthiols solvated by ethanol.
The machine learning methods used to estimate the full en-ergy surface have been EnsFFNNs [16,17]. They show a greatergeneralization ability over single FFNNs in problems of modellingand fitting. EnsFFNNs, a supervised learning technique, are anextension of single FFNNs and a memory-less method (after the
training, all information about the input patterns are stored inthe NN weights without the explicit storage of the data in thesystem).
The distance of the ethanol molecule to the surface, two anglesdescribing the molecular orientation relatively to the surface, andthree binary descriptors encoding the gold adsorption sites, arethe input to the NNs. The training sets contain energy values at dif-ferent distances, for seven molecular orientations and threeadsorption sites. The models are assessed by: (a) internal cross val-idation; (b) Leave-One-Out procedure (LOO); and (c) external testsets corresponding to orientations not used in the trainingprocedure.
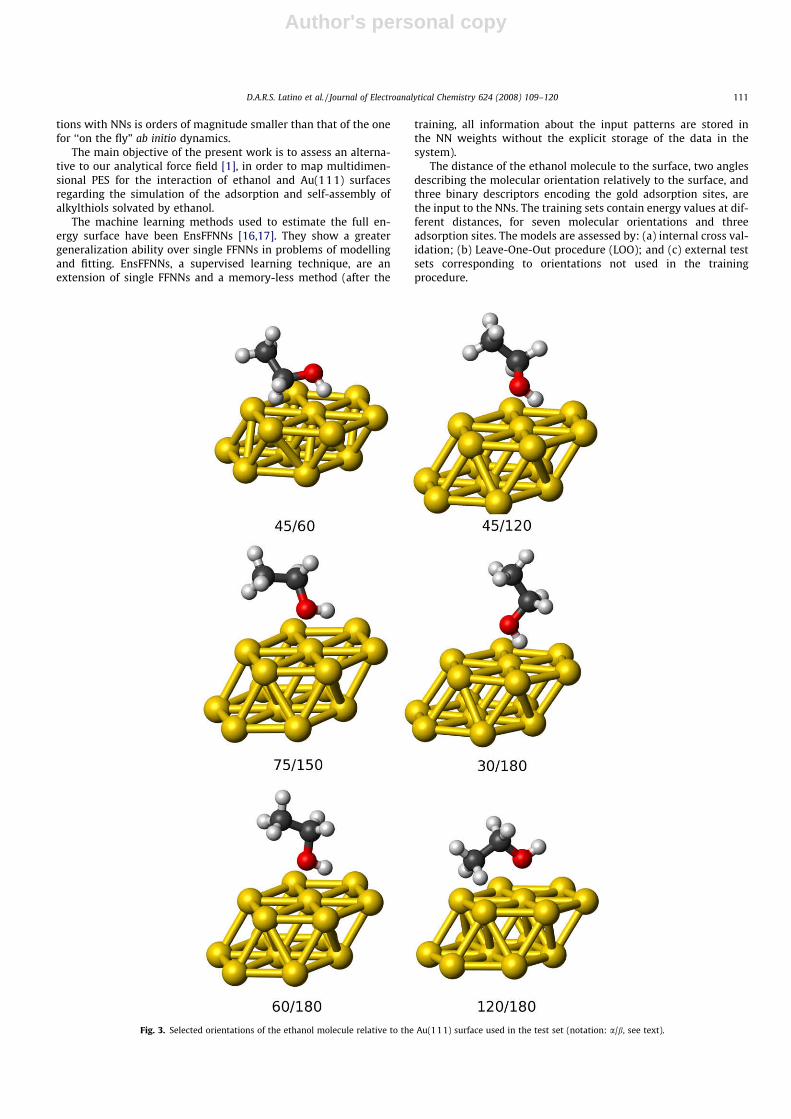
Fig. 3. Selected orientations of the ethanol molecule relative to the Au(111) surface used in the test set (notation: a/b, see text).
D.A.R.S. Latino et al. / Journal of Electroanalytical Chemistry 624 (2008) 109–120 111
Author's personal copy
The next section contains the methodology and computationaldetails. Section 3 discusses the NNs results and their comparisonwith the ones from the analytical force field. Section 4 presentsthe concluding remarks.
2. Methodology and computational details
The training has been performed with the DFT data of Fartariaet al. [1] used to set up the analytical force field. Additional DFT en-
ergy points have been calculated, at six orientations, to test theaccuracy of the model in regions of the PES not considered bythe training set.
EnsFFNNs is the machine learning method used to set up therelationship between the input (two orientation angles, the dis-tance between the ethanol oxygen atom and the plane of the firstlayer of the Au(111) surface, and three binary descriptors to en-code the adsorption sites) and the output (potential energy). Themodels are tested with different internal data sets (internal crossvalidation and LOO procedure) and external data sets.
Table 1Energy minima from DFT, analytical function and EnsFFNNs training set
Ethanol orientation Distance Potential energy – U/kJ mol�1
a/degrees b/degrees O-surface r/Å DFT Anal. function EnsFFNNs
Top site0 180 3.54 7.76 8.7 (0.94) 7.96 (0.20)135 180 4.07 5.87 6.7 (0.83) 6.15 (0.28)180 180 6.0 1.37 1.2 (0.17) 1.78 (0.41)45 180 3.3 9.04 15.0 (5.96) 9.13 (0.09)90 0 5.5 2.32 1.5 (0.82) 2.38 (0.06)90 180 2.67 19.03 19.25 (0.22) 18.17 (0.86)90 90 3.54 11.77 10.4 (1.37) 11.95 (0.18)
H1 site0 180 3.3 13.14 10.7 (2.44) 12.93 (0.21)135 180 4.29 4.34 5.5 (1.16) 3.96 (0.34)180 180 6.04 1.35 0.9 (0.45) 1.51 (0.16)45 180 2.87 16.42 13.3 (3.12) 14.61 (1.81)90 0 5.57 2.35 1.4 (0.95) 2.46 (0.11)90 180 2.87 12.8 15.5 (2.7) 13.91 (1.11)90 90 3.87 5.99 7.1 (1.11) 6.03 (0.04)
H2 site0 180 3.3 10.46 9.8 (0.66) 10.32 (0.14)135 180 4.2 5.08 5.3 (0.22) 4.96 (0.12)180 180 6.04 1.48 1.0 (0.48) 1.42 (0.06)45 180 3.08 11.82 12.7 (0.88) 11.39 (0.43)90 0 5.37 2.33 1.4 (0.93) 2.37 (0.04)90 180 2.67 15.07 14.7 (0.37) 14.86 (0.21)90 90 3.87 5.75 7.1 (1.35) 6.03 (0.28)
In parenthesis is the absolute error.
5 10 15 20 25Number of neurons in hidden layer
0
2
4
6
8
10
RM
SE /
kJ m
ol-1
RM
SE /
kJ m
ol-1
Learning setValidation setLOOTest set
0 50 100 150 200Number of networks in the ensemble
0
2
4
6
8
10
12Learning setValidation setLOOTest set
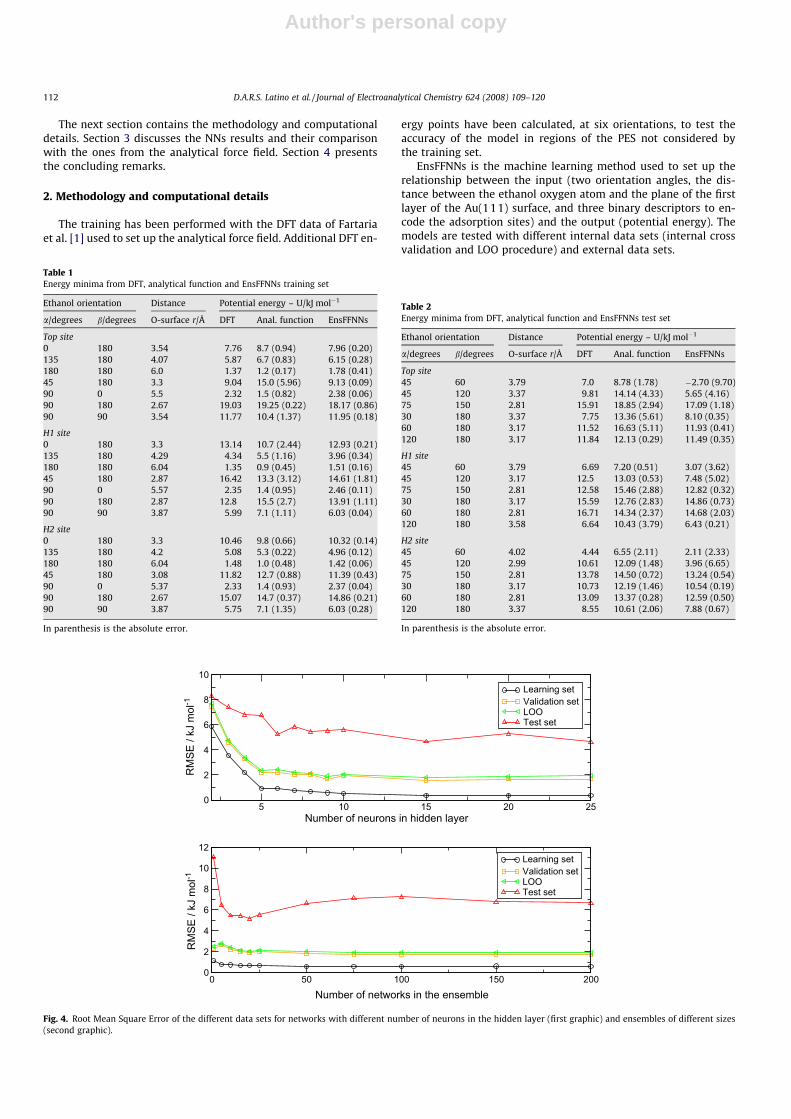
Fig. 4. Root Mean Square Error of the different data sets for networks with different number of neurons in the hidden layer (first graphic) and ensembles of different sizes(second graphic).
Table 2Energy minima from DFT, analytical function and EnsFFNNs test set
Ethanol orientation Distance Potential energy – U/kJ mol�1
a/degrees b/degrees O-surface r/Å DFT Anal. function EnsFFNNs
Top site45 60 3.79 7.0 8.78 (1.78) �2.70 (9.70)45 120 3.37 9.81 14.14 (4.33) 5.65 (4.16)75 150 2.81 15.91 18.85 (2.94) 17.09 (1.18)30 180 3.37 7.75 13.36 (5.61) 8.10 (0.35)60 180 3.17 11.52 16.63 (5.11) 11.93 (0.41)120 180 3.17 11.84 12.13 (0.29) 11.49 (0.35)
H1 site45 60 3.79 6.69 7.20 (0.51) 3.07 (3.62)45 120 3.17 12.5 13.03 (0.53) 7.48 (5.02)75 150 2.81 12.58 15.46 (2.88) 12.82 (0.32)30 180 3.17 15.59 12.76 (2.83) 14.86 (0.73)60 180 2.81 16.71 14.34 (2.37) 14.68 (2.03)120 180 3.58 6.64 10.43 (3.79) 6.43 (0.21)
H2 site45 60 4.02 4.44 6.55 (2.11) 2.11 (2.33)45 120 2.99 10.61 12.09 (1.48) 3.96 (6.65)75 150 2.81 13.78 14.50 (0.72) 13.24 (0.54)30 180 3.17 10.73 12.19 (1.46) 10.54 (0.19)60 180 2.81 13.09 13.37 (0.28) 12.59 (0.50)120 180 3.37 8.55 10.61 (2.06) 7.88 (0.67)
In parenthesis is the absolute error.
112 D.A.R.S. Latino et al. / Journal of Electroanalytical Chemistry 624 (2008) 109–120

Author's personal copy
The results are compared with the values from DFT calculationsand the ones from the analytical function developed. The full NNs–PES for each site in 3D representation is presented and analysed. Amodel is also trained with a different training and test sets, and withall the available data being compared with the one obtained from theinitial training set. The interpolation ability of the NN is analysed.
2.1. DFT calculations and analytical force field
The theory level chosen to calculate the interaction energy ofethanol/Au(111) was the hybrid B3LYP method [18,19] with theLanL1MB basis set [20] applied to the gold atoms and the 6-31Gbasis set [21] for the H, C and O atoms. The calculations have beenperformed by the Gaussian 98 package [22].
A cluster of 14 Au atoms, to represent the gold surface, and oneethanol molecule, in the optimized gas-phase geometry, have beenused to model the ethanol/Au(111) PES. The size of the gold cluster
was chosen with a compromise between the consistency of theinteraction energy and the computation time. Fig. 1 shows thethree adsorption sites, top (Top), hollow 1 (H1) and hollow 2(H2), that have been selected to study the ethanol/Au(111)interaction.
In the Top site, the oxygen atom of ethanol approaches the sur-face directly over a gold atom of the first layer; the H1 site corre-sponds to a hexagonal closed packed (hcp) site and the approachof the ethanol is made in the direction of the centre of a triangleformed between three gold atoms of the first layer with a goldatom of the second layer at the centre; and the H2 site correspondsto a face centred cubic (fcc) site and the ethanol approach is madein the direction of the centre of a triangle formed between threegold atoms of the first layer.
The ethanol/Auð111Þ14 cluster interaction energy, as a functionof the distance and orientations of ethanol molecule to theAu(111) surface, is calculated by
2 4-20
-10
0
10
20
30
40
50
U /
kJ m
ol-1
U
/ kJ
mol
-1
U /
kJ m
ol-1
75 / 150 - DFT75 / 150 - EnsFFNNs 120 / 180 - DFT120 / 180 - EnsFFNNs 60 / 180 - DFT 60 / 180 - EnsFFNNs
-20
-10
0
10
20
30
40
50
60 / 180 - DFT 60 / 180 - EnsFFNNs 30 / 180 - DFT 30 / 180 - EnsFFNNs 75 / 150 - DFT 75 / 150 - EnsFFNNs
2r O-Au
first layer
/
-20
-10
0
10
20
30
40
50
75 / 150 - DFT 75 / 150 - EnsFFNNs 60 / 180 - DFT 60 / 180 - EnsFFNNs 30 / 180 - DFT 30 / 180 - EnsFFNNs
4 6 8
2 4 6 8
3 5 6 7 8
Fig. 5. Ethanol–Au(111)14 potential energy curves by DFT and EnsFFNNs for the Top, H1 and H2 sites (from top to bottom, respectively) from the test set.
D.A.R.S. Latino et al. / Journal of Electroanalytical Chemistry 624 (2008) 109–120 113

Author's personal copy
Uethanol—Auð111Þ14ðr;a; bÞ ¼ UAuð111Þþethanolðr;a; bÞ � UAuð111Þ14
� Uethanol
ð1Þwhere UAuð111Þþethanol is the energy of the system composed by theethanol molecule and the cluster; UAuð111Þ and Uethanol are the ener-gies of the isolated cluster and ethanol molecule; r is the distancefrom the ethanol oxygen atom to the plane of the first layer of theAu(111) surface; a is the angle between the O–H bond and the nor-mal to the surface and b is the angle between the plane H–O–C andthe plane H–O–normal to the surface (both angles in degrees). Theorientations for the ethanol molecule have been selected to spana wide range. Fig. 2 shows the two orientations with the highestbinding energies used in the training, and Fig. 3 displays the molec-ular orientations used to test the models. The full list of orientationsused in the training set are presented in Table 1 and the respectivesnapshots in Ref. [1].
For each orientation, several values of r, along the interval0–10 Å, have been chosen and the Uethanol—Auð111Þ14
evaluated. Fulldetails of the DFT calculations are described elsewhere [1].
The following analytical function was fitted to the above men-tioned DFT results:
UEtOH—Au ¼ UHðrH—AuÞ þ 1þ B0 cosðh=radÞ20=r3
O—Au
� �UOðrO—AuÞ
þ UCH2 ðrCH2—AuÞ þ UCH3 ðrCH3—AuÞ þ VðrO—Au; h;/Þ ð2Þ
where
Uiðri�AuÞ ¼ A0;i exp½A1;iðri�Au þ A2;iÞ� � A3;i exp½A4;iðri�Au þ A5;iÞ� ð3Þ
is the site–site interaction energy, and
VðrO—Au; h;/Þ ¼ C0 sinðh=radÞ6 exp½ðr sinðh=radÞ � C1Þ2=C2�ðC3
� C4 cosð3ð/=rad� C5ÞÞ þ C6 cosð6ð/=rad
� C5ÞÞÞ ð4Þ
is the contribution due to the surface symmetry around a Top site. Itis noteworthy that the cosine term with exponent 20, in Eq. 2, canbe expressed by other forms (e.g. expð�10x2Þ).
The function expresses the sum of the interactions betweeneach gold atom and the sites of the ethanol molecule further mod-ulated by two angular contributions, one related to the Top sitesurface symmetry and the other to the O–Au relative direction.The ethanol molecule was described by a united atom model withthe H, O, CH2 and CH3 as the interaction sites. The variables usedare: the distances, ri, from each Au atom to each of the ethanolsites; the angle, h, between the rO—Au vector and the normal tothe surface; and the angle, /, between the projection of the rO—Au
vector on the surface plane and a reference surface vector begin-ning in a Top site and directed to a H1 site. The fit to the DFT resultswas performed by means of genetic algorithms, using an Au(111)double layered electrode with 74 Au atoms in order to minimizeborder effects from the surface.
The overall fitting quality is good. We shall return to it in Sec-tion 3. The function parameters and the details of the fitting proce-dure can be seen elsewhere [1].
2.2. Feed-Forward Neural Networks
FFNNs [23] were implemented with six input neurons, one hid-den layer of neurons, and one output neuron. In the input layer andin the hidden layer, an extra neuron (called bias) with the value ofone was also added. A NN converts the input data X, X ¼ ðx1; x2;
. . . ; xi; . . . ; xmÞ into the output data Y, Y ¼ ðy1; y2; . . . ; yi; . . . ; ynÞ. Eachneuron of the first layer receives all the input signals of an object,and the signals, after processing by the neuron, are sent to all neu-rons of the next layer. Each neuron of one layer is connected to allthe neurons of the next layer. These connections are associated
with weights that represent the strength of the connection. Allneurons j in the network perform three basic operations:
(1) Obtain input signals from m neurons.(2) Convert these signals to a Net input signal using the
expression:
Netj ¼Xm
i¼1
wjixi ð5Þ
where wji is the strength of the connection between neuron iand neuron j, and xi is the input signal from neuron i.
(3) Transform the Net signal into an output signal:
Out ¼ f ðNetjÞ ¼1
1þ expð�cNetj þ mÞ ð6Þ
The function f is called the transfer function which, in thepresent study, is a sigmoidal function.
The networks were trained using the ASNN program of IgorTetko [24,25] taking as input the distance between the ethanoloxygen atom and the plane of the first layer of the Au(111) surface(r), two angles to describe the orientation of the ethanol to the sur-face (a and b) and three binary descriptors to encode the goldadsorption sites (Top, H1 and H2). Corrections of the weightsduring the training procedure were performed by the Levenberg–Marquardt algorithm [26,27] and the number of neurons in thehidden layer was optimized. Before the training, the whole trainingset was randomly partitioned into a learning and validation set,each one with 50% of the objects. Full cross validation of the entiretraining set was performed by the Leave-One-Out method (LOO).The logistic activation function was used (a sigmoidal) and each in-put and output variable was linearly normalized between 0.1 and0.9 on the basis of the training set. The maximum number of iter-ations in the training was 5000 or 10,000. The training stoppedwhen no further improvement in the root mean squared error(RMSE) for the validation set [28] was observed. After the training,
Fig. 6. PES of ethanol over the H1 site. Three isoenergetic surfaces are displayed at�14, �10 and �5 kJ mol�1. The plane cuts the surfaces at a ¼ 45� . The isoenergeticlines correspond to the energies �14, �10, �5, 0, 5 and 10 kJ mol�1. The colored barrepresents the energy scale.
114 D.A.R.S. Latino et al. / Journal of Electroanalytical Chemistry 624 (2008) 109–120

Author's personal copy
the results were calculated for the learning set, validation set, LOOmethod and test sets.
2.3. Ensembles of Feed-Forward Neural Networks
An EnsFFNN consists of several independently trained FFNNs,each one contributing with a single prediction [16,17]. The finalprediction for an object, in our case the potential energy, is theaverage of the outputs from all FFNNs of the ensemble. This meth-odology smoothes out the random fluctuations in the individualFFNNs predictions. The experiments were carried out with theASNN program [29].
3. Results and discussion
The impact of the number of hidden neurons, and the size of theensembles, on the accuracy of the models is analysed in terms ofthe root mean square error:
RMSE ¼
ffiffiffiffiffiffiffiffiffiffiffiffiffiffiffiffiffiffiffiffiffiffiffiffiffiffiffiffiffiffiffiffiffiffiffiffiffiffiffiffiffiffiffiPni¼1½ðYcalc � YexpÞ2�
n
sð7Þ
where Ycalc is the predicted value, Yexp is the target value and n isthe number of objects.
The RMSE is calculated for the training set and for the differentinternal and external test sets. After the optimization of theseparameters, a discussion of the NN–PES is presented. The minimaof the DFT-calculated potential energy for each molecular orienta-tion and adsorption site are compared with the values from theNNs and from the analytical function at the same distances. Thethree preferential orientation curves for each site are analysedfor the test set. The obtained models are used to generate the3D representation of the PES for each site. The interpolation abil-ity of different EnsFFNNs is also investigated with EnsFFNNstrained with a different partition of the data and with all dataavailable. The comparison between the DFT data, the predictionsof the different EnsFFNNs, and the analytical function are ana-lysed in terms of the RMSE, the correlation coefficient of the pre-dictions relatively to the DFT data,and the mean absolute error(MAE):
MAE ¼Pn
i¼1jYcalc � Yexpjn
ð8Þ
Fig. 7. PES projections for the Top (first column), H1 (second column) and H2 (third column) sites. First row, from the left to right, projections at r ¼ 2:8;3:0;2:7 Å; second row,from left to right, projections at a ¼ 90� , 45�, 90�; third row, b ¼ 180� for all sites. The isoenergetic lines correspond to potential energy of �14, �10, �5, 0, 5 and 10 kJ mol�1.The colored bar represents the energy scale.
D.A.R.S. Latino et al. / Journal of Electroanalytical Chemistry 624 (2008) 109–120 115

Author's personal copy
where Ycalc is the predicted value, Yexp is the target value and n isthe number of objects.
3.1. Impact of the number of hidden neurons and networks in theensemble
Ensembles of 15 FFNNs were evaluated for the training, internalvalidation and external test sets, using different numbers of neu-rons in the hidden layer: 2–10, 15, 20 and 25. Then EnsFFNNs weretrained with different number of networks (1, 5, 10, 15, 20, 25, 50,75, 100, 150, 200).
Fig. 4 shows a decrease in the RMSE for the test set from� 8 kJ mol�1 for networks with two neurons, to a RMSE of� 5 kJ mol�1 for networks with more than five hidden neurons.The results for the training and other internal validation sets corre-late with those for the external test set. Reduction of the RMSE val-ues is more pronounced up to five hidden neurons. Training withmore than 10 hidden neurons does not indicate improvementsand increases computational requirements. Thus a compromise
of eight hidden neurons has been chosen for the experiments. Asfor the impact of the ensemble size, the use of ensembles withmore than 10 networks has not shown a significant improvementin the predictions.
3.2. Mapping of PES by EnsFFNNs
The minima of the potential energy for each orientation of theethanol molecule and adsorption sites, from the DFT calculations,and their comparison with the values from the EnsFFNNs and theanalytical function at the same distances are presented in Table 1for the points of the training set.
The EnsFFNNs training results are, in general, in good agree-ment with those from DFT. Only two cases present absolute errorshigher than 1 kJ mol�1: 1.8 kJ mol�1 for the 45/180 orientation and1.1 kJ mol�1 for the 90/180 orientation both on the H1 the site.
As for the comparison with the values obtained from the analyt-ical function the EnsFFNNs provide, in general, more accurate pre-dictions for the energy minima. Moreover, it should be emphasized
Table 3Energy minima from DFT, analytical function and different EnsFFNNs
Ethanol orientation Distance Potential energy – U/kJ mol�1
a/degrees b/degrees O-surface r/Å DFT Anal. function EnsFFNNs1 EnsFFNNs2 EnsFFNNs3 EnsFFNNs4
Top site0 180 3.54 7.76 8.7 (0.94) 7.96 (0.20) 8.68 (0.92) 7.92 (0.16) 8.21 (0.45)135 180 4.07 5.87 6.7 (0.83) 6.15 (0.28) 5.84 (0.03) 5.78(0.09) 6.02 (0.15)180 180 6.0 1.37 1.2 (0.17) 1.78 (0.41) 1.47 (0.10) 2.14 (0.77)* 1.57 (0.20)45 180 3.3 9.04 15.0 (5.96) 9.13 (0.09) 9.68 (0.64) 9.20 (0.16) 9.34 (0.30)90 0 5.5 2.32 1.5 (0.82) 2.38 (0.06) 1.82 (0.50) 2.31 (0.01) 2.23 (0.09)90 180 2.67 19.03 19.25 (0.22) 18.17 (0.86) 16.82 (2.21) 17.85(1.18) 17.93 (1.10)90 90 3.54 11.77 10.4 (1.37) 11.95 (0.18) 11.53 (0.24) 11.81(0.04) 11.25 (0.52)45 60 3.79 7.0 8.78 (1.78)* �2.70 (9.70)* 5.15 (1.85)* 5.94(1.06)* 6.83 (0.17)45 120 3.37 9.81 14.14 (4.33)* 5.65 (4.16)* 12.29 (2.48)* 9.68(0.13) 9.88 (0.07)75 150 2.81 15.91 18.85 (2.94)* 17.09 (1.18)* 16.89 (0.98)* 15.77(0.14) 15.75 (0.16)30 180 3.37 7.75 13.36 (5.61)* 8.10 (0.35)* 8.30 (0.55)* 7.82(0.07)* 7.97 (0.22)60 180 3.17 11.52 16.63 (5.11)* 11.93 (0.41)* 12.41 (0.89)* 11.44(0.08) 11.49 (0.03)120 180 3.17 11.84 12.13 (0.29)* 11.49 (0.35)* 9.72 (2.12)* 12.28 (0.44)* 11.61 (0.23)
HI site0 180 3.3 13.14 10.7 (2.44) 12.93 (0.21) 13.36 (0.22) 12.92(0.22) 13.15 (0.01)135 180 4.29 4.34 5.5 (1.16) 3.96 (0.34) 4.11 (0.23) 4.23(0.11) 4.23 (0.11)180 180 6.04 1.35 0.9 (0.45) 1.51 (0.16) 1.36 (0.01) 3.44(2.09)* 1.38 (0.03)45 180 2.87 16.42 13.3 (3.12) 14.61 (1.81) 14.81 (1.61) 15.74(0.68) 15.23 (1.19)90 0 5.57 2.35 1.4 (0.95) 2.46 (0.11) 2.69 (0.34) 2.42 (0.07) 2.37 (0.02)90 180 2.87 12.80 15.5 (2.7) 13.91 (1.11) 12.93 (0.13) 12.94(0.14) 13.49 (0.69)90 90 3.87 5.99 7.1 (1.11) 6.03 (0.04) 6.00 (0.01) 5.71 (0.28) 5.68 (0.31)45 60 3.79 6.69 7.20 (0.51)* 3.07 (3.62)* 6.35 (0.34)* 1.48 (5.21)* 6.45 (0.24)45 120 3.17 12.50 13.03 (0.53)* 7.48 (5.02)* 11.74 (0.76)* 12.26(0.24) 12.2 (0.30)75 150 2.81 12.58 15.46 (2.88)* 12.82 (0.32)* 13.99 (1.41)* 12.72(0.14) 12.88 (0.30)30 180 3.17 15.59 12.76 (2.83)* 14.86 (0.73)* 14.41 (1.18)* 15.10(0.49)* 14.9 (0.69)60 180 2.81 16.71 14.34 (2.37)* 14.68 (2.03)* 15.22 (1.49)* 15.84(0.87) 15.6 (1.11)120 180 3.58 6.64 10.43 (3.79)* 6.43 (0.21)* 5.87 (0.77)* 5.72(0.92)* 6.37 (0.27)
H2 site0 180 3.3 10.46 9.8 (0.66) 10.32 (0.14) 10.20 (0.26) 10.37(0.09) 10.30 (0.16)135 180 4.2 5.08 5.3 (0.22) 4.96 (0.12) 5.06 (0.02) 4.94 (0.14) 4.78 (0.30)180 180 6.04 1.48 1.0 (0.48) 1.42 (0.06) 1.44 (0.04) 3.4(1.92)* 1.45 (0.03)45 180 3.08 11.82 12.7 (0.88) 11.39 (0.43) 11.72 (0.10) 11.77(0.05) 11.58 (0.24)90 0 5.37 2.33 1.4 (0.93) 2.37 (0.04) 2.47 (0.14) 2.38 (0.05) 2.43 (0.10)90 180 2.67 15.07 14.7 (0.37) 14.86 (0.21) 14.67 (0.40) 14.68(0.39) 15.20 (0.13)90 90 3.87 5.75 7.1 (1.35) 6.03 (0.28) 5.84 (0.09) 5.58 (0.17) 5.74 (0.01)45 60 4.02 4.44 6.55 (2.11)* 2.11 (2.33)* 6.32 (1.88)* 4.10 (0.34)* 4.50 (0.06)45 120 2.99 10.61 12.09 (1.48)* 3.96 (6.65)* 7.08 (3.53)* 10.36(0.25) 10.26 (0.35)75 150 2.81 13.78 14.50 (0.72)* 13.24 (0.54)* 14.00 (0.22)* 13.58(0.20) 13.65 (0.13)30 180 3.17 10.73 12.19 (1.46)* 10.54 (0.19)* 10.52 (0.21)* 10.75(0.02)* 10.64 (0.09)60 180 2.81 13.09 13.37 (0.28)* 12.59 (0.50)* 12.79 (0.30)* 12.80(0.29) 12.73 (0.36)120 180 3.37 8.55 10.61 (2.06)* 7.88 (0.67)* 7.35 (1.20)* 7.15(1.40)* 7.97 (0.58)
EnsFFNNs1 – training with 366 energy points, tested with 414 energy points (results from Tables 1 and 2); EnsFFNNs2 – same training and test set as EnsFFNNs1, differentinitial weights; EnsFFNNs3 – training with a new partition in training and test set (training with 536 energy points, test with 244 energy points); EnsFFNNs4 – training with alldata available.For all orientations the results from the test set are marked with *.In parenthesis is the absolute error.
116 D.A.R.S. Latino et al. / Journal of Electroanalytical Chemistry 624 (2008) 109–120
Author's personal copy
that while the analytical function shows an evident discrepancy,relatively to the order of the DFT binding energies, for the referredto 45/180 and 90/180 orientations on the H1 site, the neural net-works predict the right DFT energy order.
Table 2 presents the results for the energy minima from the testset, whose elements, as already said, have not participated in thetraining. The results show, in general, the same level of accuracyas those from the training set, except for the 45/60 and 45/120 ori-entations that exhibit considerable errors at all the chosen sites.The value for the 45/60 orientation at the Top site is even a non-physical one, since it predicts a positive binding energy.
The bad results for those orientations are presumably due to thefact that the b angle range is not well covered in the training set.From the seven orientations used in it only two have a b angle dif-ferent of 180: the 90/0 and the 90/90 orientations. To set up mod-els allowing more accurate predictions for all the PES regions it isessential that the training set covers a wider range of possiblemolecular orientations. This issue will be reanalysed in the follow-ing Section 3.3 through the generation of a PES by training with thesame set as before but with different initial weights, using a differ-ent training and test set and training with all available data with-out an external test set.
The comparison with the results from the analytical functionshows that, except for the 45/60 and 45/120 orientations, the Ens-FFNNs provide, in general, more accurate predictions for the en-ergy minima: a maximum absolute error of � 2 kJ mol�1 fromthe NNs against � 6 kJ mol�1 from the function.
Fig. 5 displays the whole NNs PES, from the test set, for the threemost attractive orientations on each site and their comparisonwith the DFT data, as a complement of Table 2 (that only presentsthe values of the potential energy minima).
In all presented orientations the most considerable deviationsfrom DFT data are always in the repulsive part of the curves. De-spite this deviations this part of the curves is less important ifwe take into consideration that, at 298 K, kT is only 2.4 kJ mol�1,suggesting that the probability of the high repulsive parts of thePES becoming sampled, during a simulation, is very low.
The 120/180 orientation on the Top site presents an averagedeviation from the DFT data, of � 6 kJ mol�1, at the repulsive partof the curve. For the other two orientations the predictions are ingood accordance with DFT data over the entire curves. On the H1site, very accurate predictions are obtained for the 30/180 and75/150 orientations, and for the 60/180 orientation a deviation,of � 2 kJ mol�1, is observed in the attractive part of the curve.For H2 site the NNs predicted curves are in good agreement withthe DFT data.
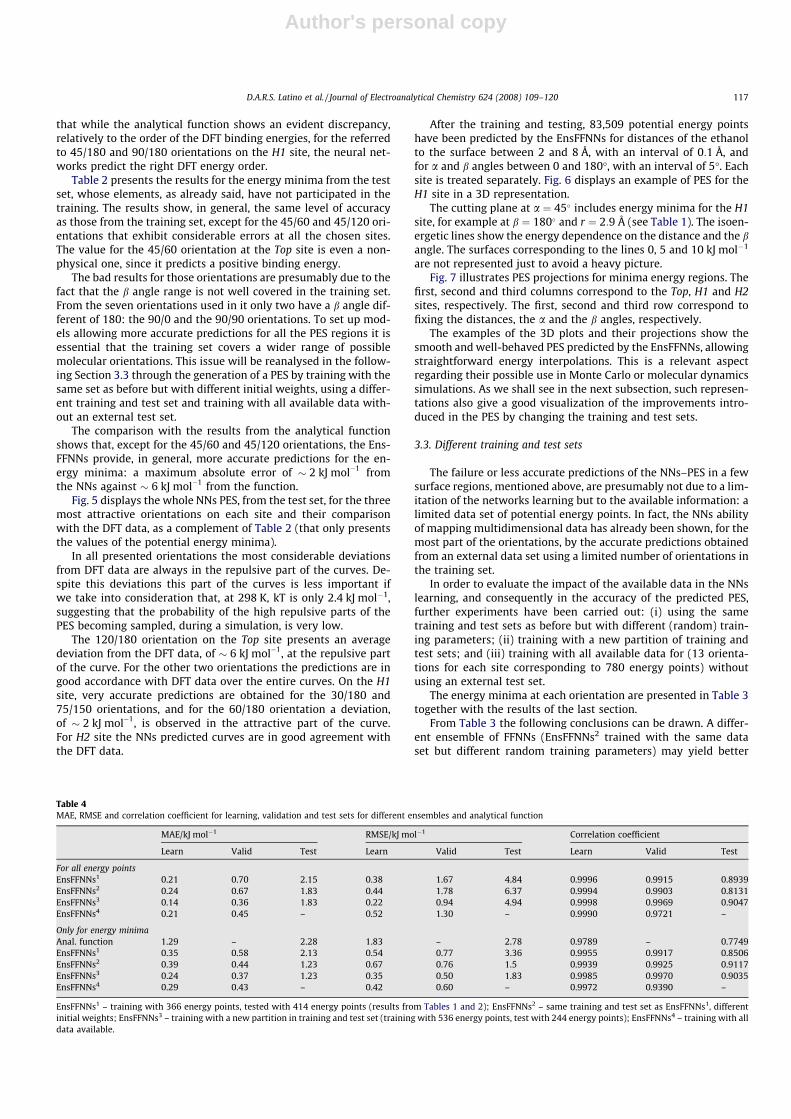
After the training and testing, 83,509 potential energy pointshave been predicted by the EnsFFNNs for distances of the ethanolto the surface between 2 and 8 Å, with an interval of 0:1 Å, andfor a and b angles between 0 and 180�, with an interval of 5�. Eachsite is treated separately. Fig. 6 displays an example of PES for theH1 site in a 3D representation.
The cutting plane at a ¼ 45� includes energy minima for the H1site, for example at b ¼ 180� and r ¼ 2:9 Å (see Table 1). The isoen-ergetic lines show the energy dependence on the distance and the bangle. The surfaces corresponding to the lines 0, 5 and 10 kJ mol�1
are not represented just to avoid a heavy picture.Fig. 7 illustrates PES projections for minima energy regions. The
first, second and third columns correspond to the Top, H1 and H2sites, respectively. The first, second and third row correspond tofixing the distances, the a and the b angles, respectively.
The examples of the 3D plots and their projections show thesmooth and well-behaved PES predicted by the EnsFFNNs, allowingstraightforward energy interpolations. This is a relevant aspectregarding their possible use in Monte Carlo or molecular dynamicssimulations. As we shall see in the next subsection, such represen-tations also give a good visualization of the improvements intro-duced in the PES by changing the training and test sets.
3.3. Different training and test sets
The failure or less accurate predictions of the NNs–PES in a fewsurface regions, mentioned above, are presumably not due to a lim-itation of the networks learning but to the available information: alimited data set of potential energy points. In fact, the NNs abilityof mapping multidimensional data has already been shown, for themost part of the orientations, by the accurate predictions obtainedfrom an external data set using a limited number of orientations inthe training set.
In order to evaluate the impact of the available data in the NNslearning, and consequently in the accuracy of the predicted PES,further experiments have been carried out: (i) using the sametraining and test sets as before but with different (random) train-ing parameters; (ii) training with a new partition of training andtest sets; and (iii) training with all available data for (13 orienta-tions for each site corresponding to 780 energy points) withoutusing an external test set.
The energy minima at each orientation are presented in Table 3together with the results of the last section.
From Table 3 the following conclusions can be drawn. A differ-ent ensemble of FFNNs (EnsFFNNs2 trained with the same dataset but different random training parameters) may yield better
Table 4MAE, RMSE and correlation coefficient for learning, validation and test sets for different ensembles and analytical function
MAE/kJ mol�1 RMSE/kJ mol�1 Correlation coefficient
Learn Valid Test Learn Valid Test Learn Valid Test
For all energy pointsEnsFFNNs1 0.21 0.70 2.15 0.38 1.67 4.84 0.9996 0.9915 0.8939EnsFFNNs2 0.24 0.67 1.83 0.44 1.78 6.37 0.9994 0.9903 0.8131EnsFFNNs3 0.14 0.36 1.83 0.22 0.94 4.94 0.9998 0.9969 0.9047EnsFFNNs4 0.21 0.45 – 0.52 1.30 – 0.9990 0.9721 –
Only for energy minimaAnal. function 1.29 – 2.28 1.83 – 2.78 0.9789 – 0.7749EnsFFNNs1 0.35 0.58 2.13 0.54 0.77 3.36 0.9955 0.9917 0.8506EnsFFNNs2 0.39 0.44 1.23 0.67 0.76 1.5 0.9939 0.9925 0.9117EnsFFNNs3 0.24 0.37 1.23 0.35 0.50 1.83 0.9985 0.9970 0.9035EnsFFNNs4 0.29 0.43 – 0.42 0.60 – 0.9972 0.9390 –
EnsFFNNs1 – training with 366 energy points, tested with 414 energy points (results from Tables 1 and 2); EnsFFNNs2 – same training and test set as EnsFFNNs1, differentinitial weights; EnsFFNNs3 – training with a new partition in training and test set (training with 536 energy points, test with 244 energy points); EnsFFNNs4 – training with alldata available.
D.A.R.S. Latino et al. / Journal of Electroanalytical Chemistry 624 (2008) 109–120 117

Author's personal copy
Fig. 8. PES from training with the first set (first column) and with all available data (second column) for the Top (first row), H1 (second row) and H2 (third row) sites.Isoenergetic surfaces at: �14, �10 and �5 kJ mol�1. The colored bar represents the energy scale. (For interpretation of the references in color in this figure legend, the readeris referred to the web version of this article.)
118 D.A.R.S. Latino et al. / Journal of Electroanalytical Chemistry 624 (2008) 109–120

Author's personal copy
predictions for some orientations, namely 45/60 and 45/120, butthe performance degrades for other tests (the overall RMSE forthe validation and test sets) (see Table 4). However, if it is onlyconsidered the predictions for the energy minima of each orienta-tion the EnsFFNNs2 results are more accurate: a RMSE of1.5 kJ mol�1 against 3.36 kJ mol�1 for the test set. Also, the correla-tion coefficients between the DFT results for the energy minimaand the EnsFFNNs2 are improved from 0.85 to 0.91 (Table 4).
A similar situation was observed by using a different partitionof the data set into training and test sets. The RMSE are improvedfrom 3.36 kJ mol�1 to 1.83 kJ mol�1 for the test set (Table 4). Thenew orientations used in the training help the NNs to learn muchbetter the interactions at 45/60 and 45/120 orientations. Yet, thebinding energies at orientations 180/180 in the sites H1 and H2and 45/60 in H1 site are less accurately predicted. These resultsindicate that the training sets did not cover well enough the config-uration space, leading to some instability in the results, as well aslarge errors for some orientations. Even though, excellent predic-tions were achieved for most of the orientations in the indepen-dent test set.
Fig. 8 shows isoenergetic surfaces for the three sites trainedwith the initial set and with all available data.
The isoenergetic surfaces allow the visualization of theimprovement for the regions not so well represented with the firsttraining set. When the training uses all data available, the surfacescover, in general, wider regions in the configurational space. As al-ready referred to before, it is very important to cover as much aspossible the configurational space in the training in order to obtainaccurate predictions.
In the course of the present experiments, Associative NeuralNetworks have also been probed. An ASNN is a combination of amemory-less (after the training all information about the inputpatterns are stored in the NN weights of the networks) and a mem-ory-based method (the data used to build the models are alsostored in a ‘‘memory” and the predictions are corrected based onsome local approximations of the stored examples). The results ob-tained by ASNNs are not presented and discussed here becausethey are similar to the ones from EnsFFNNs. Nonetheless, this isan important methodology to take into account – it allows to incor-porate new data in the memory after the training is finished, mak-ing it possible to improve predictions with new data without theneed to retrain the NNs. It has a potential application in the courseof our future experiments, when DFT data for new orientations andsites will become gradually available and kept in the ‘‘memory” ofthe system.
4. Conclusions
The present results indicate that NNs can be trained to map PESwith suitable accuracy to be used in molecular simulations, partic-ularly for the ethanol–Au(111) interactions. Once the networks arewell trained they are able to produce, as output, any required num-ber of energy points for numerical interpolations, with similar orbetter accuracy than other mapping methods.
EnsFFNNs give better results than single FFNNs, showing theircapability of taking into account the most subtle features of thistype of interactions when the model was tested for orientationsthat did not participate in the learning procedure.
The NNs–PES have to be tested in molecular simulations. Thetest will be carried out using the tabular potential energies, pre-dicted by the NNs, for working out thermal, structural and dynam-ical properties to be compared with the preliminary Monte Carlosimulation values already obtained from the analytical function[1]. One point has already turned out, however, in the presentwork: in general, the NNs can reproduce the DFT results with a bet-
ter accuracy than the analytical function as far as the probed inter-action sites are concerned.
Work is in progress regarding a much finer screening, by DFT, ofthe different gold interaction sites and ethanol orientations. In-deed, before a full simulation test can be performed, based onthe NNs data, it is necessary to obtain DFT results for sites otherthan the Top, H1 and H2. Such results will certainly increase theaccuracy of the NNs mappings, using different memories as thenew data is becoming available.
Finally, it should be mentioned that the representation ofmetallic surfaces by cluster models has been a common approxi-mation in order to minimise the heavy computational require-ments. We have commented on that elsewhere [1,30]. Yet,nowadays, accurate periodic DFT methods can be implementedin relatively low cost computer networks. We will consider themin future applications to surface models. Nevertheless, the conclu-sions of the present paper do not depend on the choice of the sys-tem and model but rather indicate that NNs offer an alternative tobe used in Monte Carlo and molecular dynamics simulations. As formolecular dynamics, which usually require continuously differen-tiable potentials, the interpolation routines may, however, slowdown the simulations.
Acknowledgements
The authors acknowledge Fundação para a Ciência e Tecnologia(FCT, Lisbon, Portugal) for financial support, and for a Ph.D. grant(SFRH/BD/18347) awarded to D.A.R.S. Latino. The authors alsothank Dr. Igor Tetko who made available the software to imple-ment EnsFFNNs and ASNNs.
References
[1] R.P.S. Fartaria, F.F.M. Freitas, F.M.S.S. Fernandes, Int. J. Quantum Chem. 107 (11)(2007) 2169.
[2] M.Y. Ballester, A.J.C. Varandas, Phys. Chem. Chem. Phys. 7 (2005) 2305.[3] J.N. Murrell, S. Carter, S.C. Farantos, P. Huxley, A.J.C. Varandas, Molecular
Potential Energy Functions, John Wiley & Sons, London, 1984.[4] K.T. No, B.H. Chang, S.Y. Kim, M.S. Ihon, H.A. Scheraga, Chem. Phys. Lett. 271
(1997) 152.[5] F.V. Prudente, J.J.S. Neto, Chem. Phys. Lett. 287 (1998) 585.[6] A.C.P. Bittencourt, F.V. Prudente, J.D.M. Vianna, Chem. Phys. 297 (2004) 153.[7] T.M.R. Filho, Z.T. Oliveira, L.A.C. Malbouisson, R. Gargano, J.J.S. Neto, Int. J.
Quantum Chem. 95 (2003) 281.[8] H. Gassner, M. Probst, A. Lauenstein, K. Hermansson, J. Phys. Chem. A 102
(1998) 4596.[9] K.-H. Cho, K.T. No, H.A. Scheraga, J. Mol. Struct. 641 (2002) 77.
[10] J.B. Witkoskie, D.J. Doren, J. Chem. Theory Comput. 1 (2005) 14.[11] D.A.R.S. Latino, F.F.M. Freitas, J. Aires-de-Sousa, F.M.S.S. Fernandes, Int. J.
Quantum Chem. 107 (2007) 2120.[12] S. Lorenz, A. Gross, M. Sheffler, Chem. Phys. Lett. 395 (2004) 210.[13] S. Lorenz, M. Sheffler, A. Gross, Phys. Rev. B 73 (2006) 115431.[14] S. Manzhos, T. Carrington Jr., J. Chem. Phys. 125 (2006) 084109.[15] L.M. Ralf, M. Malshe, M. Hagan, D.I. Doughan, M.G. Rockley, R. Komanduri, J.
Chem. Phys. 122 (2005) 084104.[16] D.K. Agrafiotis, W. Cedeno, V.S. Lobanov, J. Chem. Inf. Comput. Sci. 42 (2002)
903.[17] T.G. Dietterich, Ensemble Learning, in: The Handbook of Brain Theory and
Neural Networks, Arbib, MIT Press, Cambridge, MA, 2002, pp. 405–408.[18] A.D. Becke, J. Chem. Phys. 98 (1993) 5648.[19] A.D. Becke, J. Chem. Phys. 98 (1993) 1372.[20] P.J. Hay, W.R. Wadt, J. Chem. Phys. 82 (1985) 270.[21] W.J. Hehre, R. Ditchfield, J.A. Pople, J. Chem. Phys. 56 (1972) 2257.[22] M.J. Frisch, G.W. Trucks, H.B. Schlegel, G.E. Scuseria, M.A. Robb, J.R. Cheeseman,
V.G. Zakrzewski, J.A. Montgomery, R.E. Stratmann, J.C. Burant, S. Dapprich, J.M.Millam, A.D. Daniels, K.N. Kudin, M.C. Strain, O. Farkas, J. Tomasi, V. Barone, M.Cossi, R. Cammi, B. Mennucci, C. Pomelli, C. Adamo, S. Clifford, J. Ochterski, G.A.Petersson, P.Y. Ayala, Q. Cui, K. Morokuma, D.K. Malick, A.D. Rabuck, K.Raghavachari, J.B. Foresman, J. Cioslowski, J.V. Ortiz, B.B. Stefanov, G. Liu, A.Liashenko, P. Piskorz, I. Komaromi, R. Gomperts, R.L. Martin, D.J. Fox, T. Keith,M.A. Al-Laham, C.Y. Peng, A. Nanayakkara, C. Gonzalez, M. Challacombe,P.M.W. Gill, B.G. Johnson, W. Chen, M.W. Wong, J.L. Andres, M. Head-Gordon,E.S. Replogle, J.A. Pople, Gaussian 98, Gaussian Inc., Pittsburgh PA, 1998.
[23] J. Zupan, J. Gasteiger, Neural Networks in Chemistry and Drug Design, Wiley-VCH, Weinheim, 1999.
[24] I.V. Tetko, J. Chem. Inf. Comput. Sci. 42 (2002) 717.
D.A.R.S. Latino et al. / Journal of Electroanalytical Chemistry 624 (2008) 109–120 119

Author's personal copy
[25] I.V. Tetko, Neural Process. Lett. 16 (2002) 187.[26] W.H. Press, S.A. Teukolsky, W.T. Vetterlung, B.P. Flannery, Numerical Recipes
in C, second ed., Cambridge University Press, New York, 1994. p. 998.[27] A.J. Shepherd, Second Order Methods for Neural Networks, Springer-Verlag,
London, 1997. p. 145.[28] M. Bishop, Neural Networks for Pattern Recognition, Oxford University Press,
Oxford, 1995.
[29] VCCLAB, Virtual Computational Chemistry Laboratory, 2005. <http://www.vcclab.org>.
[30] R.S. Neves, A.J. Motheo, R.P.S. Fartaria, F.M.S.S. Fernandes, J. Electroanal. Chem.609 (2007) 140.
120 D.A.R.S. Latino et al. / Journal of Electroanalytical Chemistry 624 (2008) 109–120