Mapping H5N1 highly pathogenic avian influenza risk in Southeast Asia
6
Mapping H5N1 highly pathogenic avian influenza risk in Southeast Asia Marius Gilbert* † , Xiangming Xiao ‡ , Dirk U. Pfeiffer § , M. Epprecht ¶ , Stephen Boles ‡ , Christina Czarnecki ‡ , Prasit Chaitaweesub , Wantanee Kalpravidh**, Phan Q. Minh †† , M. J. Otte ‡‡ , Vincent Martin ‡‡ , and Jan Slingenbergh ‡‡ *Biological Control and Spatial Ecology, Universite ´ Libre de Bruxelles, CP160/12, Avenue FD Roosevelt 50, B-1050 Brussels, Belgium; ‡ Institute for the Study of Earth, Oceans, and Space, University of New Hampshire, 39 College Road, Durham, NH 03824; § Epidemiology Division, Department of Veterinary Clinical Sciences, The Royal Veterinary College, University of London, London AL9 7TA, United Kingdom; ¶ Swiss National Center of Competence in Research North–South, 3012 Berne, Switzerland; Department of Livestock Development, Ministry of Agriculture and Cooperatives, Bangkok 10400, Thailand; **Regional Office for Asia and the Pacific, Food and Agriculture Organization of the United Nations, Bangkok 10200, Thailand; †† Department of Animal Health, Ministry of Agriculture and Rural Development, Hanoi, Vietnam; and ‡‡ Food and Agriculture Organization of the United Nations, Viale delle Terme di Caracalla, 00100 Rome, Italy Edited by Rita R. Colwell, University of Maryland, College Park, MD, and approved February 7, 2008 (received for review November 9, 2007) The highly pathogenic avian influenza (HPAI) H5N1 virus that emerged in southern China in the mid-1990s has in recent years evolved into the first HPAI panzootic. In many countries where the virus was detected, the virus was successfully controlled, whereas other countries face periodic reoccurrence despite significant con- trol efforts. A central question is to understand the factors favoring the continuing reoccurrence of the virus. The abundance of do- mestic ducks, in particular free-grazing ducks feeding in intensive rice cropping areas, has been identified as one such risk factor based on separate studies carried out in Thailand and Vietnam. In addition, recent extensive progress was made in the spatial pre- diction of rice cropping intensity obtained through satellite imag- ery processing. This article analyses the statistical association between the recorded HPAI H5N1 virus presence and a set of five key environmental variables comprising elevation, human popu- lation, chicken numbers, duck numbers, and rice cropping intensity for three synchronous epidemic waves in Thailand and Vietnam. A consistent pattern emerges suggesting risk to be associated with duck abundance, human population, and rice cropping intensity in contrast to a relatively low association with chicken numbers. A statistical risk model based on the second epidemic wave data in Thailand is found to maintain its predictive power when extrap- olated to Vietnam, which supports its application to other coun- tries with similar agro-ecological conditions such as Laos or Cam- bodia. The model’s potential application to mapping HPAI H5N1 disease risk in Indonesia is discussed. animal husbandry epidemiology remote sensing spatial modeling H ighly pathogenic avian influenza (HPAI) H5N1 virus emerged in Southern China in the mid-1990s (1), but the first large-scale epizootic took place in the winter of 2003/2004 in East and Southeast Asia (2). The virus persisted in the region until the winter of 2005/2006 when it spread westward across the Palearctic zoogeographical region (as of August 6, 2007, 60 countries have reported the virus; ref. 3). The impact in the affected countries comprises human disease and death (194 people of 321 cases as of August 16, 2007; ref. 4 and www.who.int/ csr/disease/avianinfluenza/country/en), mortality in poultry and birds culled to halt the spread of disease, and the loss of local and international trade of poultry and poultry products. In Southeast Asia alone, it has been estimated that HPAI H5N1 virus outbreaks caused the death of 140 million domestic birds with economic losses at $10 billion (5). Importantly, reducing virus circulation in the poultry sector is the best way to prevent human infections and a possible mutation in a form that could pass between humans (6). The rapid spread of HPAI H5N1 virus results from its ability to transmit through both human and bird host contact systems (7). However, even if HPAI H5N1 virus has been introduced, local development vary greatly as the virus does not become established, spread, and persist everywhere equally. Virus es- tablishment is inf luenced by the extent of surveillance and early detection, and therefore it is subject to an unknown degree of underreporting bias. Once established, HPAI H5N1 virus spread is believed to be influenced primarily by local trade patterns, density of wet markets, poultry production structure, and disease control and preventive efforts. Persistence is thought to be mediated by domestic ducks because of their potential role as virus reservoir (8–10), but the large live poultry markets also probably contribute (11). However, even when the main risk factors associated with local introduction, spread, and persis- tence are broadly known, it remains challenging to quantify their relative importance and contribution and to define HPAI H5N1 virus outbreak risk in space and time (location-sensitive ‘‘hot spots’’ and time-sensitive ‘‘hot times’’). With the panzootic originating and persisting in East and South- east Asia, it is of interest to concentrate on this region to quantify how established risk factors are associated with disease patterns. Vietnam and Thailand are interesting in that regard because they were both subject to several epidemic waves, applied differential control strategies, succeeded in temporarily controlling the virus, and were faced with periodic reoccurrences (Fig. 1). Vietnam undertook massive repeated vaccination campaigns in combination with other control measures. Thailand has not implemented vac- cination and placed emphasis on early detection, prevention of movements in high-risk areas, including premovement testing, and transformation of the free-ranging duck production sector (12). It is difficult to assess whether the reoccurrences resulted from local persistence of the virus or new introductions, but recent results suggest that Southeast Asia may constitute a regional ‘‘evolutionary sink’’ for HPAI H5N1 virus (13), supporting the idea that the region faces periodic reintroductions. In previous work, it was demonstrated that the risk of HPAI H5N1 virus presence was associated with free-ranging duck num- bers in Thailand (10) and the local abundance of both duck and geese in Vietnam (14), in addition to other risk factors such as chicken numbers, human population, and topographical features. Both studies also found evidences of a relationship between HPAI H5N1 virus presence and rice production. Free-ranging duck production in Thailand is largely confined within areas with double Author contributions: M.G., X.X., W.K., M.J.O., V.M., and J.S. designed research; M.G. performed research; M.G., X.X., D.U.P., M.E., S.B., C.C., P.C., and P.Q.M. analyzed data; and M.G., X.X., D.U.P., and J.S. wrote the paper. The authors declare no conflict of interest. This article is a PNAS Direct Submission. Freely available online through the PNAS open access option. † To whom correspondence should be addressed. E-mail: [email protected]. This article contains supporting information online at www.pnas.org/cgi/content/full/ 0710581105/DCSupplemental. © 2008 by The National Academy of Sciences of the USA www.pnas.orgcgidoi10.1073pnas.0710581105 PNAS March 25, 2008 vol. 105 no. 12 4769 – 4774 ECOLOGY
-
Upload
independent -
Category
Documents
-
view
2 -
download
0
Transcript of Mapping H5N1 highly pathogenic avian influenza risk in Southeast Asia
Mapping H5N1 highly pathogenic avian influenza riskin Southeast AsiaMarius Gilbert*†, Xiangming Xiao‡, Dirk U. Pfeiffer§, M. Epprecht¶, Stephen Boles‡, Christina Czarnecki‡,Prasit Chaitaweesub�, Wantanee Kalpravidh**, Phan Q. Minh††, M. J. Otte‡‡, Vincent Martin‡‡, and Jan Slingenbergh‡‡
*Biological Control and Spatial Ecology, Universite Libre de Bruxelles, CP160/12, Avenue FD Roosevelt 50, B-1050 Brussels, Belgium; ‡Institute for the Studyof Earth, Oceans, and Space, University of New Hampshire, 39 College Road, Durham, NH 03824; §Epidemiology Division, Department of Veterinary ClinicalSciences, The Royal Veterinary College, University of London, London AL9 7TA, United Kingdom; ¶Swiss National Center of Competence in ResearchNorth–South, 3012 Berne, Switzerland; �Department of Livestock Development, Ministry of Agriculture and Cooperatives, Bangkok 10400, Thailand;**Regional Office for Asia and the Pacific, Food and Agriculture Organization of the United Nations, Bangkok 10200, Thailand; ††Department of AnimalHealth, Ministry of Agriculture and Rural Development, Hanoi, Vietnam; and ‡‡Food and Agriculture Organization of the United Nations, Viale delle Termedi Caracalla, 00100 Rome, Italy
Edited by Rita R. Colwell, University of Maryland, College Park, MD, and approved February 7, 2008 (received for review November 9, 2007)
The highly pathogenic avian influenza (HPAI) H5N1 virus thatemerged in southern China in the mid-1990s has in recent yearsevolved into the first HPAI panzootic. In many countries where thevirus was detected, the virus was successfully controlled, whereasother countries face periodic reoccurrence despite significant con-trol efforts. A central question is to understand the factors favoringthe continuing reoccurrence of the virus. The abundance of do-mestic ducks, in particular free-grazing ducks feeding in intensiverice cropping areas, has been identified as one such risk factorbased on separate studies carried out in Thailand and Vietnam. Inaddition, recent extensive progress was made in the spatial pre-diction of rice cropping intensity obtained through satellite imag-ery processing. This article analyses the statistical associationbetween the recorded HPAI H5N1 virus presence and a set of fivekey environmental variables comprising elevation, human popu-lation, chicken numbers, duck numbers, and rice cropping intensityfor three synchronous epidemic waves in Thailand and Vietnam. Aconsistent pattern emerges suggesting risk to be associated withduck abundance, human population, and rice cropping intensity incontrast to a relatively low association with chicken numbers. Astatistical risk model based on the second epidemic wave data inThailand is found to maintain its predictive power when extrap-olated to Vietnam, which supports its application to other coun-tries with similar agro-ecological conditions such as Laos or Cam-bodia. The model’s potential application to mapping HPAI H5N1disease risk in Indonesia is discussed.
animal husbandry � epidemiology � remote sensing � spatial modeling
H ighly pathogenic avian influenza (HPAI) H5N1 virusemerged in Southern China in the mid-1990s (1), but the
first large-scale epizootic took place in the winter of 2003/2004in East and Southeast Asia (2). The virus persisted in the regionuntil the winter of 2005/2006 when it spread westward across thePalearctic zoogeographical region (as of August 6, 2007, 60countries have reported the virus; ref. 3). The impact in theaffected countries comprises human disease and death (194people of 321 cases as of August 16, 2007; ref. 4 and www.who.int/csr/disease/avian�inf luenza/country/en), mortality in poultryand birds culled to halt the spread of disease, and the loss of localand international trade of poultry and poultry products. InSoutheast Asia alone, it has been estimated that HPAI H5N1virus outbreaks caused the death of 140 million domestic birdswith economic losses at �$10 billion (5). Importantly, reducingvirus circulation in the poultry sector is the best way to preventhuman infections and a possible mutation in a form that couldpass between humans (6).
The rapid spread of HPAI H5N1 virus results from its abilityto transmit through both human and bird host contact systems(7). However, even if HPAI H5N1 virus has been introduced,local development vary greatly as the virus does not become
established, spread, and persist everywhere equally. Virus es-tablishment is influenced by the extent of surveillance and earlydetection, and therefore it is subject to an unknown degree ofunderreporting bias. Once established, HPAI H5N1 virus spreadis believed to be influenced primarily by local trade patterns,density of wet markets, poultry production structure, and diseasecontrol and preventive efforts. Persistence is thought to bemediated by domestic ducks because of their potential role asvirus reservoir (8–10), but the large live poultry markets alsoprobably contribute (11). However, even when the main riskfactors associated with local introduction, spread, and persis-tence are broadly known, it remains challenging to quantify theirrelative importance and contribution and to define HPAI H5N1virus outbreak risk in space and time (location-sensitive ‘‘hotspots’’ and time-sensitive ‘‘hot times’’).
With the panzootic originating and persisting in East and South-east Asia, it is of interest to concentrate on this region to quantifyhow established risk factors are associated with disease patterns.Vietnam and Thailand are interesting in that regard because theywere both subject to several epidemic waves, applied differentialcontrol strategies, succeeded in temporarily controlling the virus,and were faced with periodic reoccurrences (Fig. 1). Vietnamundertook massive repeated vaccination campaigns in combinationwith other control measures. Thailand has not implemented vac-cination and placed emphasis on early detection, prevention ofmovements in high-risk areas, including premovement testing, andtransformation of the free-ranging duck production sector (12). Itis difficult to assess whether the reoccurrences resulted from localpersistence of the virus or new introductions, but recent resultssuggest that Southeast Asia may constitute a regional ‘‘evolutionarysink’’ for HPAI H5N1 virus (13), supporting the idea that the regionfaces periodic reintroductions.
In previous work, it was demonstrated that the risk of HPAIH5N1 virus presence was associated with free-ranging duck num-bers in Thailand (10) and the local abundance of both duck andgeese in Vietnam (14), in addition to other risk factors such aschicken numbers, human population, and topographical features.Both studies also found evidences of a relationship between HPAIH5N1 virus presence and rice production. Free-ranging duckproduction in Thailand is largely confined within areas with double
Author contributions: M.G., X.X., W.K., M.J.O., V.M., and J.S. designed research; M.G.performed research; M.G., X.X., D.U.P., M.E., S.B., C.C., P.C., and P.Q.M. analyzed data; andM.G., X.X., D.U.P., and J.S. wrote the paper.
The authors declare no conflict of interest.
This article is a PNAS Direct Submission.
Freely available online through the PNAS open access option.
†To whom correspondence should be addressed. E-mail: [email protected].
This article contains supporting information online at www.pnas.org/cgi/content/full/0710581105/DCSupplemental.
© 2008 by The National Academy of Sciences of the USA
www.pnas.org�cgi�doi�10.1073�pnas.0710581105 PNAS � March 25, 2008 � vol. 105 � no. 12 � 4769–4774
ECO
LOG
Y

or triple rice cultivation per year because the rice grain left in thefield after harvest provides a low-cost source of feed for duckproduction (15). Similar coupled production systems associatingfree-ranging ducks and multiple-rice agriculture are observedacross Southeast Asia, including Vietnam (e.g., ref. 16) andIndonesia. Rice paddy fields are an important habitat forfree-ranging ducks, but also for wild waterfowl exploiting thesame food resource in the wintering season, and thus they mayform a critical risk factor in HPAI H5N1 virus introduction,persistence, and spread. In recent years, substantial progress hasbeen achieved in methods for predicting rice crop distributions.It is now possible to routinely map and monitor rice paddyagriculture (17, 18) and cropping intensity in Asia, using imagesfrom the Moderate Resolution Imaging Spectroradiometer(MODIS) sensor onboard the National Aeronautics and SpaceAdministration Terra satellite. The satellite image-based algo-rithms permit the production of maps of cropping intensity,cropping calendar (planting and harvesting dates), and irrigationpractices at moderate spatial resolution (250–500 m) and innear-real-time fashion.
This article has three main objectives: first, to compare riskfactors associated with HPAI H5N1 virus presence in Thailandand Vietnam during the three epidemic waves that took placebetween early 2004 and end 2005 by using the same set of riskfactors (elevation, human population, and chicken and duckdensity); second, to evaluate and compare the added value ofrice cropping variables for predicting HPAI H5N1 virus pres-ence in the two countries; and third, to evaluate the predictivepower of an HPAI H5N1 virus risk map for Southeast Asia, bydeveloping a model for Thailand, testing it for Vietnam, andapplying it to the region.
ResultsThe three H5N1 epidemic waves that have affected Thailand andVietnam show distinct temporal and spatial distributions (Figs.1 and 2). The spatial pattern of wave II in Thailand is exploredin further detail in Gilbert et al. (10) and Tiensin et al. (19), andthe temporal and spatial patterns of waves I–III in Vietnam areexamined in Pfeiffer et al. (14). However, the results obtainedfrom the statistical analysis of outbreak distributions in relationto risk factors are more consistent than one would expect on thebasis of the contrasted spatial patterns between waves (Table 1).The variables showing the highest level of consistency in theirrelationship with HPAI H5N1 virus presence are human pop-
ulation, rice cropping intensity, and, to a somewhat lesser extent,duck numbers, all of which were found to be significantlyassociated with virus presence in both countries. Chicken num-bers failed to show as a significant predictor of disease presence,except in wave III in Vietnam. The latter is probably becausewave III primarily affected the Red River delta where chickensare far more abundant than in the rest of the country. If oneconsiders only the northern part of Vietnam in the analysis[supporting information (SI) Table S1], chicken number is nolonger a highly significant predictor of HPAI H5N1 viruspresence. The number of ducks was positively associated withHPAI H5N1 virus presence in Thailand waves I and II andVietnam wave II. Elevation was negatively related to viruspresence only in Thailand during waves I and II, although thesignificance of the change in �2 log likelihood (LL) uponremoval is close to 0.05 for Vietnam wave I. All significantvariables showed consistency in similar sign in all models wherethey were significantly related to HPAI H5N1 virus presence.The predictive power of the models, as measured by the areaunder the curve (AUC) (Table 1), receiver-operating character-istic (ROC) curves (Fig. S1) and Cohen’s kappa is moderate,with the AUC value ranging from 0.66 to 0.88.
In complement with the results presented in Table 1, weverified that the significance of cropping intensity did not resultfrom the fact that free-grazing ducks and farmed ducks werepooled into a single category. In Thailand, the data on free-grazing ducks and farmed ducks were available separately andallowed testing models where they replaced the duck/geesevariables. The results showed that (i) the free-grazing duckvariable is significantly associated with HPAI H5N1 virus pres-ence (change in �2LL upon removal is 8.56, 58.49, and 3.90 forwaves, I, II, and III, respectively), and (ii) cropping intensitymaintains its significance in waves I and II in the presence of thefree-grazing duck variable (change in �2LL upon removal is3.28, 40.83, and 1.85 for waves, I, II, and III, respectively).Farmed ducks were in no instance found to be significantlyassociated with virus presence.
Despite their moderate predictive power, these five variablesappear to provide relatively robust risk prediction. The model
Fig. 1. Temporal distribution of daily HPAI H5N1 virus records reported inThailand (Upper) and Vietnam (Lower).
Fig. 2. Spatial distribution of HPAI H5N1 virus records reported during thethree main epidemic waves in Thailand and Vietnam.
4770 � www.pnas.org�cgi�doi�10.1073�pnas.0710581105 Gilbert et al.

with best-fit parameters based on Thailand wave II data appliedto predicting HPAI H5N1 virus presence in other epidemicwaves provides very close predictive power to that of each wave’sbest-fit model (Fig. 3). In Thailand, the wave II model predictswave I and wave III risk with an AUC of 0.66 and 0.74,respectively, which are comparable with the 0.66 and 0.88 of eachbest-fit model. More remarkably, the Thailand wave II modelpredicts Vietnam waves I, II, and III with AUC values of 0.66,0.74, and 0.61, respectively, which are comparable with 0.69,0.77, and 0.66 of each best-fit model. This result implies thatspatial and temporal extrapolation of the model from Thailandwave II to other areas and other years is possible at relatively lowcost in terms of loss of predictive power. On average, the AUCof the Thailand wave II model accounted for 93.5% of the AUCof the best-fit models.
DiscussionThe results presented here highlight three main findings: (i)although large differences may have resulted from the contrast-ing and dynamic disease management in Thailand and Vietnam,there is a common, consistent risk pattern reemerging for thethree waves observed in Thailand and Vietnam; (ii) croppingintensity is consistently associated with HPAI H5N1 viruspresence in Thailand and Vietnam; and (iii) the model of HPAIH5N1 virus risk developed in Thailand with the data from thesecond epidemic wave maintains its predictive power whenapplied to other epidemic waves or other regions, indicating thatthe model predictions can be extrapolated in space and time.
Disease management in the two countries changed markedlyover the 3 years, and the results of the risk factor analysis needto be considered by taking account of these changes. During thefirst wave, there was undoubtedly a problem with disease re-porting because the highest priority for the two countries was tocurb the epidemics in an emergency situation, involving logisti-cally demanding culling and depopulation. These operationstook most of the resources, distracting attention from diseasedetection and notification. At the same time, the public andfarmers were not yet well informed on risky practices of HPAI
transmission, which may have assisted the spread of the diseaseand could explain some of the findings obtained for wave I. InThailand, outbreaks were scattered and less numerous thanduring Vietnam wave I, and underreporting may explain part ofthis difference. With human population density as the toppredictor of wave I HPAI H5N1 presence in Vietnam thissuggests a relatively large contribution of human-related trans-mission during that wave. The relatively lower importance ofduck and cropping intensity, both variables interpreted here asdefining the ecological niche of the virus, is then not surprisingas it may have been hidden by human-mediated transmission ormay also result from reporting bias.
By the time the second wave emerged, disease surveillancesystems were fully in place. Thailand implemented its x-raysurveys involving the participation of several hundred thousandinspectors searching door to door for evidence of HPAI presence(19). The second wave epidemic started earlier in Thailand andwas concentrated to areas where free-grazing ducks are raised.In Vietnam, the epidemic wave was concentrated in the Mekongdelta where domestic ducks are most abundant. At the time ofthe second wave, people and farmers were much better informedabout the risk of human-mediated transmission of HPAI. Thesecond-wave epidemic was significant for both countries, high-lighting that control efforts were still insufficient. In bothcountries, the number of ducks and cropping intensity constitutethe most important predictors during the second wave, followedby human population. Although the role of ducks as a reservoirof virus may already have played a role during wave I in Thailand,the results suggest it played a more prominent role during thesecond wave.
Thailand and Vietnam both undertook major efforts to step upcontrol efforts. Thailand targeted domestic ducks by implement-ing systematic annual testing, imposing premovement testing,and initiating the transformation of the free-ranging duck sectorinto farms. Vietnam undertook massive vaccination campaigns,targeted also at domestic duck populations. Both strategies wereapparently very effective in that the third wave that started inJuly 2005 involved a very low number of outbreaks in Thailand
Table 1. Summary results of the autologistic regression models for the three main HPAI H5N1 virus epidemic waves in Thailand andVietnam between 2004 and 2005
Wave Cst Alt Hpop Ch Du CropMean ArT AUC, � SD kappa, � SD Pseudo-R2, � SD
Thailand I �1.05 0.00103* 2.2510�5 3.3910�6 2.0310�5 0.556 247 0.66 � 0.023 0.26 � 0.043 0.062 � 0.019
2.31† 5.46 2.98 7.14 4.13 22.4
P � 0.129‡ P � 0.0194 P � 0.08411 P � 0.00753 P � 0.0422 P � 0.001
Thailand II �1.143 �0.00219 1.0610�5 1.8810�7 3.0410�5 0.964 88.6 0.79 � 0.0073 0.49 � 0.018 0.19 � 0.012
25.7 5.92 1.07 44.7 46.8 65.8
P � 0.001 P � 0.0150 P � 0.301 P � 0.001 P � 0.001 P � 0.001
Thailand III 0.0634 �0.0128 5.9910�5 1.6910�6 5.5110�5 0.777 1486 0.88 � 0.034 0.67 � 0.073 0.40 � 0.079
19.3 2.99 1.49 5.04 2.03 5.58
P � 0.001 P � 0.084 P � 0.222 P � 0.024 P � 0.154 P � 0.0181
Vietnam I �1.74 �0.00021 9.1910�5 4.7110�6 6.0910�6 0.188 63.1 0.69 � 0.0049 0.27 � 0.009 0.078 � 0.0042
3.83 90.0 3.56 2.49 5.73 808
P � 0.0503 P � 0.001 P � 0.0591 P � 0.115 P � 0.0167 P � 0.001
Vietnam II �2.67 0.000328 9.2210�5 �2.1110�6 2.8510�5 0.730 160 0.77 � 0.0085 0.41 � 0.018 0.17 � 0.013
1.39 19.8 1.45 12.1 19.3 312
P � 0.238 P � 0.001 P � 0.229 P � 0.001 P � 0.001 P � 0.001
Vietnam III �1.58 0.000408 �3.9010�5 3.4310�5 6.4 10�6 0.497 245 0.66 � 0.018 0.25 � 0.031 0.055 � 0.014
1.31 3.55 14.1 1.20 4.36 198
P � 0.253 P � 0.0595 P � 0.001 P � 0.274 P � 0.0367 P � 0.001
All values result from 500 models including all positive and an equivalent number of bootstrap-selected negatives. Alt, Hpop, Ch, Du and CropMean are theaverage altitude, human population, chicken number, duck number, and mean number of rice crop harvested 500-m pixels, respectively, in each subdistrict(Thailand) or commune (Vietnam). ArT is the autoregressive term.*Average coefficient.†Average change in �2LL upon variable removal.‡Significance of the change.
Gilbert et al. PNAS � March 25, 2008 � vol. 105 � no. 12 � 4771
ECO
LOG
Y

and was confined mostly to the northern part of the country inVietnam. With control measures targeted at ducks, which de-couples the linkage between free-grazing ducks and paddy ricefields, ducks and rice cropping intensity became less strongpredictors of the HPAI H5N1 presence in wave III.
The statistical relationship between ducks and HPAI H5N1virus presence and the role of ducks as reservoir has beendiscussed elsewhere (10, 14, 20–22). However, we found a strongand consistently positive association with rice cropping intensityacross epidemic waves and countries. Rice descriptors may forma better risk predictor than free-grazing duck number numbersfor causal reasons. For example, the x-ray survey that providedthe duck data was carried out at the village level, and flocks wereassigned to the village where the duck raisers lived. However,free-ranging duck flocks are moved around to multiple, adjacent,and nonadjacent districts during their life span (21). The addedvalue of a rice variable over a free-ranging duck variable maytherefore ensue from the fact that the rice descriptor definesmore precisely where the ducks are moved, fed, and kept duringhigh-risk periods with extensive opportunities for virus releaseand exposure. Moreover it is possible that rice paddy fields forma temporary habitat of other bird species also feeding on leftoverrice grains that may become infected and initiate a local out-break. Finally, rice fields are frequently flooded, and waterpresence improves viral persistence in the environment as op-posed to dry soils.
Given the role of free-grazing duck as a strong driver of thespatial distribution of HPAI risk in Thailand and Vietnam,demographics and seasonality of the free-grazing duck produc-tion sector may also help in the understanding of the temporalvariability in HPAI H5N1 virus prevalence. Exploratory resultsobtained from Thailand suggest that this may indeed be the case.
Most duck restocking in the form of hatching and subsequentrelease in nurseries takes place in July/August, so that the rapidlygrowing young ducks benefit from the forage at the peak of themonsoon-associated rice harvest in November/December/January. Juvenile ducks are known to be of particular impor-tance in avian influenza ecology (23, 24), and because of thesedemographics, the peak in the proportion of juveniles in theflocks occurs in September/October; at the time when the peakof the Thailand second wave outbreak took place. So far thisevidence is circumstantial, but it suggests the need for thecollection of comprehensive data quantifying duck production inspace and time in all duck–rice areas where HPAI H5N1 viruspersistence risk is to be quantified.
A traditional problem with risk distribution maps predicted bystatistical models, based on linking the presence/absence of adisease or species to a series of predictors, is that they often losemuch of their predictive power when extrapolated outside of thespatial range of their training data, which makes external vali-dation difficult. It is thus quite remarkable that this model basedon Thailand data loses so little predictive power when validatedin Vietnam, which gives confidence to extrapolating the modelto adjacent areas. Of course, the model has only moderatepredictive power, but it is largely compensated for by its extrap-olation ability.
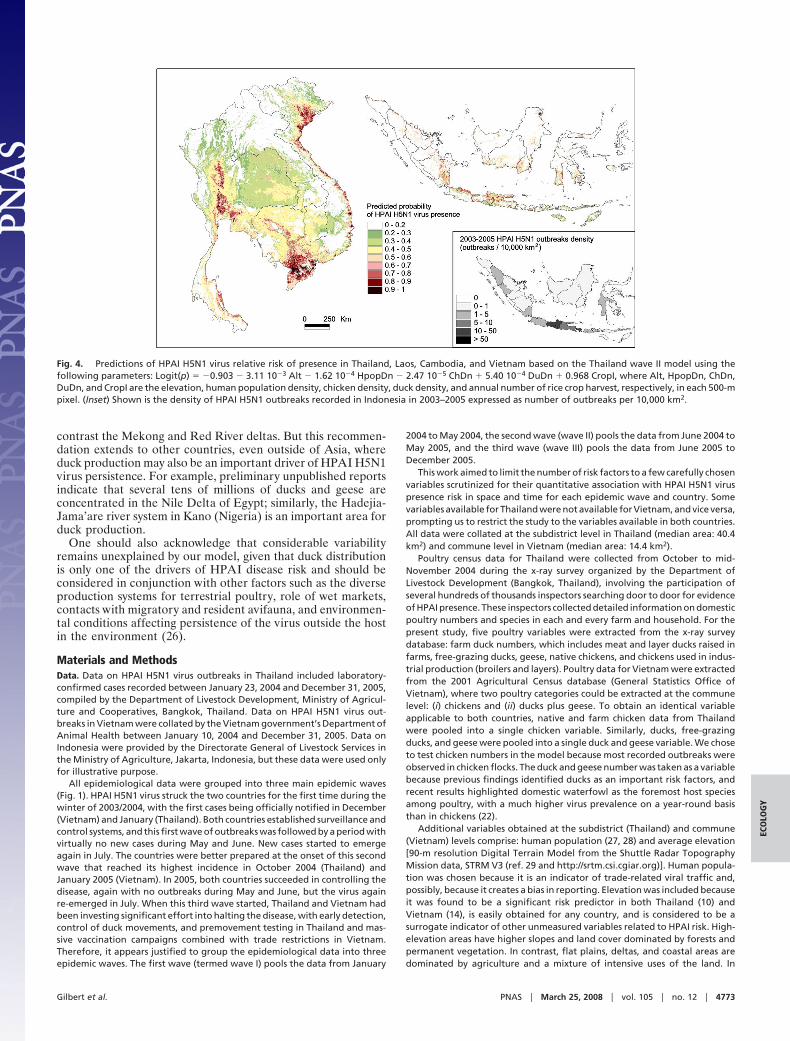
It thus appeared justified to produce risk maps for adjacentregions with similar farming conditions, such as Vietnam, Laos, orCambodia (Fig. 4). In the latter two countries, the model predictsonly restricted HPAI H5N1 virus spread in Laos, a higher risk inthe areas surrounding the Tonle Sap Lake in Cambodia, and, evenmore so, in the transfrontier area of the Mekong delta. A risk mapbased on the same model was also produced for Indonesia (Fig. 4),but it needs to be interpreted cautiously, for several reasons. First,comparatively higher disease circulation is taking place in Indonesiaas compared with Thailand and Vietnam. This assumption is basedon regular reports of human cases (4) reflecting disease circulationin poultry and results from participatory disease surveys. Obser-vations in the field suggest a much higher relative contribution ofpeople and chickens to disease spread and persistence, and with it,a relatively lower importance of duck–rice contribution to thespatial definition of HPAI risk. At present, these observations areparticularly difficult to evaluate because of the scarce and patchydata on HPAI H5N1 virus distribution in Indonesia. Second,eco-climatic conditions differ from those in the Mekong countries.Precipitation is less seasonal and more evenly distributed across themonthly calendar. As a result, the divide between rain-fed rice cropareas with a single rice crop per year and areas with irrigated riceand two or three rice crops per annum is less clear. The mappingof rice cropping intensity is also complicated by the local relief ofvolcano landscapes that results in small paddy fields asynchronouslyplanted at any time of the year (25). Hence, although free-grazingducks are known to be associated with rice production, the scale atwhich this relationship applies, and its spatial and temporal char-acteristics may differ from those in the Mekong countries. For theabove reasons, HPAI H5N1 data for Indonesia for 2003–2005 werenot used to evaluate the model quantitatively, but are provided forillustrative purpose (Fig. 4).
An applied result of this study is that the distribution of ricecropping intensity can readily be established at any time and beused to complement traditional duck census data. Remotesensing data are available at a much higher spatial and temporalresolution than traditional censuses, thus allowing fine-scale riskmapping. So the prospect of fine-scale spatiotemporal predictionof duck production and the associated HPAI risk is to beconsidered as a potential medium-term output still requiringsignificant development and understanding of spatiotemporalrelationships between duck and crop farming. Areas of firstinterest include Thailand and Vietnam, where detailed data areavailable for performing follow-up analyses, in particular to
Fig. 3. ROC curves of the predictive power of the Thailand wave II multiplelogistic regression model on the presence/absence of HPAI H5N1 virus at thesubdistrict (Thailand) or commune (Vietnam) level (gray areas, 500bootstrapROC curves; black lines, average ROC curve).
4772 � www.pnas.org�cgi�doi�10.1073�pnas.0710581105 Gilbert et al.
contrast the Mekong and Red River deltas. But this recommen-dation extends to other countries, even outside of Asia, whereduck production may also be an important driver of HPAI H5N1virus persistence. For example, preliminary unpublished reportsindicate that several tens of millions of ducks and geese areconcentrated in the Nile Delta of Egypt; similarly, the Hadejia-Jama’are river system in Kano (Nigeria) is an important area forduck production.
One should also acknowledge that considerable variabilityremains unexplained by our model, given that duck distributionis only one of the drivers of HPAI disease risk and should beconsidered in conjunction with other factors such as the diverseproduction systems for terrestrial poultry, role of wet markets,contacts with migratory and resident avifauna, and environmen-tal conditions affecting persistence of the virus outside the hostin the environment (26).
Materials and MethodsData. Data on HPAI H5N1 virus outbreaks in Thailand included laboratory-confirmed cases recorded between January 23, 2004 and December 31, 2005,compiled by the Department of Livestock Development, Ministry of Agricul-ture and Cooperatives, Bangkok, Thailand. Data on HPAI H5N1 virus out-breaks in Vietnam were collated by the Vietnam government’s Department ofAnimal Health between January 10, 2004 and December 31, 2005. Data onIndonesia were provided by the Directorate General of Livestock Services inthe Ministry of Agriculture, Jakarta, Indonesia, but these data were used onlyfor illustrative purpose.
All epidemiological data were grouped into three main epidemic waves(Fig. 1). HPAI H5N1 virus struck the two countries for the first time during thewinter of 2003/2004, with the first cases being officially notified in December(Vietnam) and January (Thailand). Both countries established surveillance andcontrol systems, and this first wave of outbreaks was followed by a period withvirtually no new cases during May and June. New cases started to emergeagain in July. The countries were better prepared at the onset of this secondwave that reached its highest incidence in October 2004 (Thailand) andJanuary 2005 (Vietnam). In 2005, both countries succeeded in controlling thedisease, again with no outbreaks during May and June, but the virus againre-emerged in July. When this third wave started, Thailand and Vietnam hadbeen investing significant effort into halting the disease, with early detection,control of duck movements, and premovement testing in Thailand and mas-sive vaccination campaigns combined with trade restrictions in Vietnam.Therefore, it appears justified to group the epidemiological data into threeepidemic waves. The first wave (termed wave I) pools the data from January
2004 to May 2004, the second wave (wave II) pools the data from June 2004 toMay 2005, and the third wave (wave III) pools the data from June 2005 toDecember 2005.
This work aimed to limit the number of risk factors to a few carefully chosenvariables scrutinized for their quantitative association with HPAI H5N1 viruspresence risk in space and time for each epidemic wave and country. Somevariables available for Thailand were not available for Vietnam, and vice versa,prompting us to restrict the study to the variables available in both countries.All data were collated at the subdistrict level in Thailand (median area: 40.4km2) and commune level in Vietnam (median area: 14.4 km2).
Poultry census data for Thailand were collected from October to mid-November 2004 during the x-ray survey organized by the Department ofLivestock Development (Bangkok, Thailand), involving the participation ofseveral hundreds of thousands inspectors searching door to door for evidenceof HPAI presence. These inspectors collected detailed information on domesticpoultry numbers and species in each and every farm and household. For thepresent study, five poultry variables were extracted from the x-ray surveydatabase: farm duck numbers, which includes meat and layer ducks raised infarms, free-grazing ducks, geese, native chickens, and chickens used in indus-trial production (broilers and layers). Poultry data for Vietnam were extractedfrom the 2001 Agricultural Census database (General Statistics Office ofVietnam), where two poultry categories could be extracted at the communelevel: (i) chickens and (ii) ducks plus geese. To obtain an identical variableapplicable to both countries, native and farm chicken data from Thailandwere pooled into a single chicken variable. Similarly, ducks, free-grazingducks, and geese were pooled into a single duck and geese variable. We choseto test chicken numbers in the model because most recorded outbreaks wereobserved in chicken flocks. The duck and geese number was taken as a variablebecause previous findings identified ducks as an important risk factors, andrecent results highlighted domestic waterfowl as the foremost host speciesamong poultry, with a much higher virus prevalence on a year-round basisthan in chickens (22).
Additional variables obtained at the subdistrict (Thailand) and commune(Vietnam) levels comprise: human population (27, 28) and average elevation[90-m resolution Digital Terrain Model from the Shuttle Radar TopographyMission data, STRM V3 (ref. 29 and http://srtm.csi.cgiar.org)]. Human popula-tion was chosen because it is an indicator of trade-related viral traffic and,possibly, because it creates a bias in reporting. Elevation was included becauseit was found to be a significant risk predictor in both Thailand (10) andVietnam (14), is easily obtained for any country, and is considered to be asurrogate indicator of other unmeasured variables related to HPAI risk. High-elevation areas have higher slopes and land cover dominated by forests andpermanent vegetation. In contrast, flat plains, deltas, and coastal areas aredominated by agriculture and a mixture of intensive uses of the land. In
,
Fig. 4. Predictions of HPAI H5N1 virus relative risk of presence in Thailand, Laos, Cambodia, and Vietnam based on the Thailand wave II model using thefollowing parameters: Logit(p) � �0.903 � 3.11 10�3 Alt � 1.62 10�4 HpopDn � 2.47 10�5 ChDn � 5.40 10�4 DuDn � 0.968 CropI, where Alt, HpopDn, ChDn,DuDn, and CropI are the elevation, human population density, chicken density, duck density, and annual number of rice crop harvest, respectively, in each 500-mpixel. (Inset) Shown is the density of HPAI H5N1 outbreaks recorded in Indonesia in 2003–2005 expressed as number of outbreaks per 10,000 km2.
Gilbert et al. PNAS � March 25, 2008 � vol. 105 � no. 12 � 4773
ECO
LOG
Y

addition, wetlands, rivers, canals, ponds, and irrigation networks are concen-trated in those lowlands.
Satellite-based mapping algorithm using data from the MODIS of the Terrasatellite allows identification and tracking of image pixels that experiencedflooding and rice transplanting over time, based on temporal profile analysisof the Normalized Different Vegetation Index, Enhanced Vegetation Index,and Land Surface Water Index (17, 18). The method permits an estimation ofthe cropping intensity (number of rice cropping in a year) within individual500-m pixels. This variable estimated for 2004 was aggregated by averagingthe pixel values within each subdistrict and commune of Thailand and Viet-nam, respectively. This variable was incorporated in the analysis because ofpreliminary results indicating that the presence of rice paddy fields is associ-ated with HPAI H5N1 virus presence risk (10, 14), and that free-grazing ducksare found in much higher numbers where cropping intensity is high (15).
Analyses. We used a multiple logistic regression framework to relate HPAIH5N1 presence to the predictors by pooling the data by epidemic wave andcountry, converting the number of outbreaks into presence or absence. Themodel was built by using altitude, human population, chicken, ducks andgeese, and mean rice cropping intensity as predictors of HPAI H5N1 presencefor each of the three synchronous epidemic waves in Thailand and Vietnam atthe subdistrict and commune levels, respectively.
An autologistic approach was used to account for spatial autocorrelation inthe response variable, by forcing an additional covariate, termed autoregres-sive term, into the multiple logistic regression model (30). The autoregressiveterm accounts for spatial dependency in the response variable and is esti-mated by averaging the presence/absence among a set of neighbors definedby the limit of autocorrelation, weighted by the inverse of the Euclideandistance (30). The extent of the autocorrelation in the response variable isobtained from the range of the spatial correlogram �(h) of the responsevariable, here HPAI H5N1 virus presence or absence.
Another problem that arises when applying logistic regression models todisease data are that low prevalence values for the response variable (�10%)tend to bias model performance metrics (31). For each model, we selected allHPAI H5N1 virus-present subdistricts or communes and a randomly selectedequivalent number of negative samples. We then bootstrapped this operation
500 times. For each model and each set of negatives, we estimated thecoefficient of each variable, the change in �2LL of each variable upon re-moval, the AUC of the ROC plots, Cohen’s � index, and pseudo-R2 as indicatorsof model performance. We then averaged these estimates over the 500bootstraps and estimated the significance of the average change in �2LL ofeach variable upon removal. The individual variable coefficient and change in�2LL upon removal were estimated based on an autologistic model, and theAUC, ROC curve, Cohen’s �, and pseudo-R2 were estimated based on the samemodel without the autoregressive term.
Our second objective was to test the performance of a model built for aparticular time period and region for predicting HPAI H5N1 virus presence fora different time period and region, i.e., to measure the ability of a model toextrapolate risk predictions in space and time. The parameters of the best-fitmodel for Thailand wave II were used to predict HPAI H5N1 virus presence inThailand waves I and III and Vietnam waves I, II, and III. The model perfor-mance was estimated by using the AUC and ROC plot, by bootstrapping datato force an equivalent number of positive and negatives in the test sets.
Finally, we used the model based on Thailand wave II HPAI data to predictHPAI H5N1 virus presence probability for the whole of the Mekong region andfor Indonesia, at a spatial resolution of 500 m, using topographic data fromthe STRM V3 (29, 32), human population data from the Global Rural-UrbanMapping Project (33, 34), and poultry population data from the GlobalLivestock Production and Health Atlas database (35). Poultry data were in-cluded for Cambodia (chicken: province level; ducks: province level; except forthe provinces Ratana Kiri and Svay Rieng for which the information wasmissing and replaced by the national average duck density), Laos (chickens:province level; ducks: province level), and Indonesia [chicken: Province level,ducks: district level for Java and Sumatra (36), province level elsewhere], and500-m rice cropping intensity predictions.
ACKNOWLEDGMENTS. The Food and Agricultural Organization thanks thestudied countries for sharing their information. This study was supported bythe Food and Agricultural Organization and National Institutes of HealthFogarty International Center Grant R01TW00786901 (through the NationalInstitutes of Health National Science Foundation Ecology of Infectious Dis-eases Program).
1. Li KS, et al. (2004) Genesis of a highly pathogenic and potentially pandemic H5N1influenza virus in eastern Asia. Nature 430:209–213.
2. Alexander DJ (2007) Summary of avian influenza activity in Europe, Asia, Africa, andAustralasia, 2002–2006. Avian Dis 51:161–166.
3. World Organization for Animal Health (2007) Update on Avian Influenza in Animals(Type H5) (World Organization for Animal Health, Paris).
4. WHO (2006) Confirmed Human Cases of Avian Influenza A(H5N1) (WHO, Geneva).5. Food and Agriculture Organization (2005) A Global Strategy for the Progressive
Control of Highly Pathogenic Avian Influenza (HPAI). (Food and Agriculture Organi-zation, Rome).
6. Webster RG (2002) The importance of animal influenza for human disease. Vaccine20:S16–S20.
7. Kilpatrick AM, et al. (2006) Predicting the global spread of H5N1 avian influenza. ProcNatl Acad Sci USA 103:19368–19373.
8. Hulse-Post DJ, et al. (2005) Role of domestic ducks in the propagation and biologicalevolution of highly pathogenic H5N1 influenza viruses in Asia. Proc Natl Acad Sci USA102:10682–10687.
9. Sturm-Ramirez KM, et al. (2005) Are ducks contributing to the endemicity of highlypathogenic H5N1 influenza virus in Asia? J Virol 79:11269–11279.
10. Gilbert M, et al. (2006) Free-grazing ducks and highly pathogenic avian influenza,Thailand. Emerg Infect Dis 12:227–234.
11. Sims LD (2007) Lessons learned from Asian H5N1 outbreak control. Avian Dis 51:174–181.
12. Tiensin T, et al. (2007) Geographic and temporal distribution of highly pathogenicavian influenza A virus (H5N1) in Thailand, 2004–2005: An overview. Avian Dis 51:182–188.
13. Wallace RG, Hodac H, Lathrop RH, Fitch WM (2007) A statistical phylogeography ofinfluenza A H5N1. Proc Natl Acad Sci USA 104:4473–4478.
14. Pfeiffer D, Minh P, Martin V, Epprecht M, Otte J (2007) An analysis of the spatial andtemporal patterns of highly pathogenic avian influenza occurrence in Vietnam usingnational surveillance data. Vet J 174:302–309.
15. Gilbert M, et al. (2007) Avian influenza, domestic ducks and rice agriculture in Thailand.Agric Ecosyst Environ 119:409–415.
16. Teo SS (2001) Evaluation of different duck varieties for the control of the golden applesnail (Pomacea canaliculata) in transplanted and direct seeded rice. Crop Protection20:599–604.
17. Xiao X, et al. (2006) Mapping paddy rice agriculture in South and Southeast Asia usingmulti-temporal MODIS images. Remote Sens Environ 100:95–113.
18. Xiao XM, et al. (2005) Mapping paddy rice agriculture in southern China usingmulti-temporal MODIS images. Remote Sens Environ 95:480–492.
19. Tiensin T, et al. (2005) Highly pathogenic avian influenza H5N1, Thailand, 2004. EmergInfect Dis 11:1664–1672.
20. Webster RG, et al. (2007) Changing epidemiology and ecology of highly pathogenicavian H5N1 influenza viruses. Avian Dis 51:269–272.
21. Songserm T, et al. (2006) Domestic ducks and H5N1 influenza epidemic, Thailand.Emerg Infect Dis 12:575–581.
22. Smith GJD, et al. (2006) Emergence and predominance of an H5N1 influenza variant inChina. Proc Natl Acad Sci USA 103:16936–16941.
23. Halvorson DA, Kelleher CJ, Senne DA (1985) Epizootiology of avian influenza: effect ofseason on incidence in sentinel ducks and domestic turkeys in Minnesota. Appl EnvironMicrobiol 49:914–919.
24. Stallknecht DE, Shane SM (1988) Hosts range of avian influenza virus in free-livingbirds. Vet Res Commun 12:124–141.
25. Linser W (2006) Analysis and Suggestions to Improve the Capacity of the MODIS RiceAlgorithm to Identify Rice Planting Patterns in Java, Indonesia: Report to the AnimalHealth Division, Food and Agriculture Organization (Food and Agriculture Organiza-tion, Rome).
26. Brown JD, Swayne DE, Cooper RJ, Burns RE, Stallknecht DE (2007) Persistence of H5 andH7 avian influenza viruses in water. Avian Dis 51:285–289.
27. Thailand Environment Institute (1996) Thailand on a Disk: Digital National Databasefor Use with PC Arc/Info and/or ArcView (Thailand Environment Research Institute,Bangkok).
28. General Statistics Office (2001) Rural Agriculture and Fisheries Census Hanoi, Vietnam(Department of Agriculture, Forestry, and Fisheries Statistics, General Statistics Office,Hanoi, Vietnam).
29. Farr TG, et al. (2007) The shuttle radar topography mission. Rev Geophys 45:10.1029/2005RG000183.
30. Augustin NH, Mugglestone MA, Buckland ST (1996) An autologistic model for thespatial distribution of wildlife. J Appl Ecol 33:339–347.
31. McPherson JM, Jetz W, Rogers DJ (2004) The effects of species’ range sizes on theaccuracy of distribution models: Ecological phenomenon or statistical artefact? J ApplEcol 41:811–823.
32. Jarvis A, Reuter HI, Nelson A, Guevara E (2006) Hole-Filled Seamless SRTM Data V3(International Center for Tropical Agriculture, Cali, Columbia).
33. Balk DL, et al. (2006) Determining global population distribution: Methods, applica-tions, and data. Adv Parasitol 62:119–156.
34. Hay SI, Noor AM, Nelson A, Tatem AJ (2005) The accuracy of human population mapsfor public health application. Trop Med Int Health 10:1073–1086.
35. Food and Agricultural Organization (2007) Global Livestock Production and HealthAtlas (Food and Agricultural Organization, Rome).
36. Direktorat Jendral Peternakan (2006) Statistik Peternakan (Direktorat Jendral Peter-nakan, Jakarta, Indonesia).
4774 � www.pnas.org�cgi�doi�10.1073�pnas.0710581105 Gilbert et al.