NS reassortment of an H7-type highly pathogenic avian ...
127
NS REASSORTMENT OF AN H7-TYPE HIGHLY PATHOGENIC AVIAN INFLUENZA VIRUS AFFECTS ITS PROPAGATION BY ALTERING THE REGULATION OF VIRAL RNA PRODUCTION AND ANTI-VIRAL HOST RESPONSE
-
Upload
khangminh22 -
Category
Documents
-
view
3 -
download
0
Transcript of NS reassortment of an H7-type highly pathogenic avian ...

NS REASSORTMENT OF AN H7-TYPE HIGHLY
PATHOGENIC AVIAN INFLUENZA VIRUS AFFECTS ITS
PROPAGATION BY ALTERING THE REGULATION OF
VIRAL RNA PRODUCTION AND ANTI-VIRAL HOST
RESPONSE

Aus dem Institut für Medizinische Virologie
der Justus-Liebig-Universität Giessen
Betreuer: Prof. Dr. Stephan Pleschka
NS REASSORTMENT OF AN H7-TYPE HIGHLY
PATHOGENIC AVIAN INFLUENZA VIRUS AFFECTS ITS
PROPAGATION BY ALTERING THE REGULATION OF
VIRAL RNA PRODUCTION AND ANTI-VIRAL HOST
RESPONSE
INAUGURAL-DISSERTATION
zur Erlangung des Grades eines
Dr. rer. nat.
beim Fachbereich Naturwissenschaft
der Justus-Liebig-Universität Gießen
eingereicht von
Zhongfang Wang
Master of Medizin
geboren in Shandong, China
Giessen, Juli 2010

Mit Genehmigung des Fachbereichs Biologie
der Justus-Liebig-Universität Giessen
Dekan: Prof. Dr. Volkmar Wolters
Gutachter: Prof. Dr. Stephan Pleschka
Institut für Medizinische Virologie
Justus-Liebig-Universität Gießen
Gutachter: Prof. Dr. Peter Friedhoff
Institut für Biochemie
Justus-Liebig-Universität Gießen

i
Erklärung
„Ich erkläre: Ich habe die vorgelegte Dissertation selbständig und ohne unerlaubte fremde
Hilfe und nur mit den Hilfe angefertigt, die ich in der Dissertation angegeben habe. Alle
Textstellen, die wörtlich oder sinngemäß aus veröffentlichten oder nicht veröffentlichten
Schriften entnommen sind, und alle Angaben, die auf mündlichen Auskünften beruhen, sind
als solche kenntlich gemacht. Bei den von mir durchgeführten und in der Dissertation
erwähnten Untersuchungen habe ich die Gründsätze guter wissenschaftlicher Praxis, wie sie
in der „Satzung der Justus-Liebig-Universität Giessen zur Sicherung guter wissenschaftlicher
Praxis“ niedergelegt sind, eingehalten.“
Giessen, Juli 2010
Zhongfang wang

ii
Zusammenfassung
Seit 1997 führt das Auftreten von hoch pathogenen aviären Influenza Viren (HPAIV) des H5-
Subtyps zu schweren Verlusten in der Geflügelindustrie und verursachte bislang über 500
humane Infektionen mit über 60% Mortalität. In Europa zirkulieren H7-Subtyp HPAIV seit
langem, allerdings mit niedriger Pathogenität für den Menschen. Gleichwohl könnte die
Fähigkeit von Influenza Viren (IV) ihr segmentiertes Genom bei einer Doppelinfektion zu
vermischen (reassortieren) zu neuen H7-Typ HPAIV mit neuen Eigenschaften führen, die
evtl. eine Gefahr für den Menschen darstellen. Das NS-Segment, welches für das NS1- und
NS2/NEP-Protein kodiert, teilt sich in zwei Alleltypen auf (Aund B). Es kann sowohl die anti-
virale Wirtsantwort beeinflussen und die zelluläre mRNA-Prozessierung hemmen, als auch
die Translation viraler mRNA fördern. NS1 trägt zu erhöhter Virulenz und Änderung des
Wirtsspektrums bei und es wurde berichtet, dass NS-Segmente von H5-Typ HPAIV, welche
nach 1998 isoliert wurden, die Vermehrung humaner IV in Säugerzellen erhöhten können.
Dennoch ist nicht klar, wie der NS-Alleltyp, der Subtyp und das Jahr der Isolation des
parentalen Viruses das Wirtsspektrum, die Genom-Replikation/Transkription, die
Virusvermehrung und Pathogenität einer H7-Typ Reassortante beeinflußt.
Zur Beantwortung dieser wichtigen Fragen wurden mittels reverser Genetik verschiedene
reassortante A/FPV/Rostock/34 (H7N1) HPAIV mit NS-Segmenten von aviären H5- und H7-
Typ IV-Stämme erstellt. Virologische Charakterisierung zeigte, daß die Wachstumskinetiken
der reassortanten IV sich vom wild Typ FPV unterscheiden und davon abhängen, ob Säuger-
oder Vogelzellen infiziert worden waren. Überraschender Weise waren die verschiedenen NS-
Segmente nicht nur für Änderungen der anti-viralen Wirtsantwort verantwortlich, sondern
beeinflußten außerdem die virale Genom-Replikation/-Transkription und dessen intra-
zellulären Transport. Weitere Experimente demonstrierten, daß die Effekte auf die
Akkumulation der viralen RNA-Species sowohl von den spezifischen NS-Segmenten
abhingen, als auch von dem genetischen Hintergrund der Viruspolymerase. IFN-beta-
Expression und Apoptose-Induktion waren entgegengesetzt zur Virusvermehrung, wogegen
das NS-Allel, der Virussubtyp und das Maß der NS1-Expression keine Korrelation zeigten.
Obwohl es wahrscheinlich ist, dass die Vielzahl der Effekte von NS1 sich auf viele Virus- und
Wirtsprozesse auswirken, wodurch es auch nicht möglich ist den wichtigsten Effekt für die
Virusvermehrung zu definieren, zeigen diese Ergebnisse das der Ursprung des NS-Segments
die Vermehrungseffizienz, das Wirtsspektrum und die Pathogenität von H7-Typ HPAIV
beeinflussen kann.

iii
Summary
Since 1997 the emergence of H5-type highly pathogenic avian influenza virus (HPAIV) has
resulted in major losses to the poultry industry and caused over 500 human infections with
approximately 60% mortality. In Europe H7-type HPAIV have been circulating for a long
time with very little pathogenicity for humans. Nevertheless, the ability of influenza viruses
(IV) to mix their segmented genomes upon double infections could lead to the emergence of
new, reassortant H7-type HPAIV with altered characteristics that could pose an additional
threat to humans. The viral NS segments encoding the NS1 and NS2/NEP proteins can affect
the anti-viral host responses, inhibit cellular mRNA processing and enhance viral mRNA
translation. NS1 contributes to high virulence and host range variation and it was reported that
NS segments of H5-type HPAIV isolated after 1998 can enhance replication of human IV
reassortants in mammalian cells. Still it is not clear how the NS allele type, the subtype and
the year of isolation of the parental virus affects host range, genome replication/transcription,
viral propagation and pathogenicity of an H7-type reassortant.
In order to elucidate several of these important questions reassortant A/FPV/Rostock/34
(H7N1) HAPIV with NS segments from H5- and H7-type avian IV strains were generated by
reverse genetics. Virological characterizations demonstrated that growth kinetics of the
reassortant viruses differed from the wild type FPV and depended on the mammalian or avian
origin of the infected cells. Surprisingly, the different reassortant NS segments were not only
responsible for alterations in the anti-viral host response, but furthermore affected viral
genome replication/transcription and its intra-cellular transport. Further experiments
demonstrated that the effects on accumulation of viral RNA species depended on the specific
NS-segment as well as on the genetic background of the viral polymerase. IFN-beta
expression and apoptosis induction were found to be inversely correlated to viral growth,
while the NS allele, virus subtype and NS1 protein expression levels showed no correlation.
Even though it is likely that the multiple effects of the NS1 protein act on many viral and host
processes as why one can not conclude which of the effects is the most important for the viral
replication ability, these results demonstrate that the origin of NS segment can affect the
replication efficiency, host range and pathogenicity of H7-type HPAIV.

iv
List of publications:
1. Ma, W., D. Brenner, Z. Wang, B. Dauber, C. Ehrhardt, K. Hogner, S. Herold, S. Ludwig, , K. Yu, J. A. Richt, O. Planz, and S. Pleschka. 2010. The NS segment of an H5N1 highly pathogenic avian influenza virus (HPAIV) is sufficient to alter replication efficiency, cell tropism, and host range of an H7N1 HPAIV. J Virol 84:2122-33.
2. Z. Wang, NC. Robb, E. Lenz, T. Wolff, E. Fodor and S. Pleschka. 2010. NS reassortment of an H7-type HPAIV affects its propagation by altering the regulation of viral RNA production and anti-viral host response. J Virol (in revision).

Table of Content
v
ZUSAMMENFASSUNG ................................................................................................................................... III
SUMMERY.......................................................................................................................................................... IV
LIST OF PUBLICATIONS..................................................................................................................................V
CONTENTS......................................................................................................................................................... VI
1. INTRODUCTION..............................................................................................................................................1
1.1. Influenza viruses..............................................................................................................................................1 1.1.1. Classification of influenza viruses............................................................................................................ 1 1.1.2. Avian influenza virus (AIV)..................................................................................................................... 1 1.1.3. Epidemiology of influenza viruses ........................................................................................................... 2 1.1.4. Risk of influenza pandemics (cited from report of CDC USA)............................................................... 4 1.1.5. Morphology and structure of IAV ............................................................................................................ 4
1.2 Propagation and genome replication of IAV .................................................................................................6 1.2.1. Binding and uncoating.............................................................................................................................. 6 1.2.2. Transcription and replication of viral genome.......................................................................................... 7 1.2.3. Virus assembling and budding (as reviewed in Nancy JC et al.(11)) ....................................................... 9
1.3. The pathogenecity and virulence of IAV.....................................................................................................10 1.3.1 Viral glycoproteins .................................................................................................................................. 10 1.3.2 Viral ribonucleoprotein complex (RNP) ................................................................................................. 11 1.3.3 The role of multifunctional NS1 protein in pathogencity........................................................................ 13
1.3.3.1 NS1 localization and structure..........................................................................................................13 1.3.3.2. NS1 can affect mRNA splicing, mRNA processing, post transcription modification, mRNA export and translation (as reviewed in Hale BG et al. (125))...................................................................................14 1.3.3.3. NS1 can affect host innate and adaptive immune response. ............................................................16 1.3.3.4. NS1 can modulate the host pro-apoptotic and anti-apoptotic response. ..........................................18
1.3.4 Host antiviral response: immune response and apoptosis........................................................................ 19 1.3.4.1 Immune response ..............................................................................................................................19 1.3.4.2 Apoptosis ..........................................................................................................................................20
1.4. Aim of this project.........................................................................................................................................21 1.4.1. To investigate the effect of different NS segments from H5 and H7-type HAPIV on the replication of a strictly avian H7-type HPAIV .......................................................................................................................... 21 1.4.2 Defining molecular mechanisms that explain how NS segments affect the propagation of FPV............ 22
1.4.2.1 Effects on the viral replication cycle including genome replication/transcription and export of viral genome .........................................................................................................................................................22 1.4.2.2 Modulation of antiviral host response: stimulation of the IFN response and induction of apoptosis22
2. MATERIALS AND METHODS.....................................................................................................................24
2.1. Materials ........................................................................................................................................................24 2.1.1. Instruments ............................................................................................................................................. 24 2.1.2. Reagents and general materials .............................................................................................................. 25 2.1.3. Monoclonal and polyclonal antibodies................................................................................................... 28 2.1.4. Materials for cell culture......................................................................................................................... 28 2.1.5. Enzymes ................................................................................................................................................. 29 2.1.6. Kits ......................................................................................................................................................... 29 2.1.7. E. coli strain, recombinant viruses and cell lines.................................................................................... 29 2.1.8. Plasmids ................................................................................................................................................. 30 2.1.9. Media and gels........................................................................................................................................ 33 2.1.10. Buffers and solutions............................................................................................................................ 37

Table of Content
vi
2.2. Methods..........................................................................................................................................................41 2.2.1. DNA cloning and sub cloning ................................................................................................................ 41
2.2.1.1. Preparation of competent cells for electroporation ..........................................................................41 2.2.1.2. Electroporation ................................................................................................................................41 2.2.1.3. Preparation of plasmid DNA ...........................................................................................................42 2.2.1.4. Measurement of plasmid DNA concentration .................................................................................42 2.2.1.5. Restriction endonuclease digestion..................................................................................................43 2.2.1.6. Agarose gel electrophoresis .............................................................................................................43 2.2.1.7. Preparation of DNA fragments ........................................................................................................43 2.2.1.8. Ligation............................................................................................................................................43 2.2.1.9. TOPO directional cloning................................................................................................................43
2.2.2. Maintenance of cell culture .................................................................................................................... 46 2.2.2.1 Maintenance of mammalian and avian cell culture...........................................................................46 2.2.2.2. Mice primary cell isolation and maintainance .................................................................................46 2.2.2.3. Storage of cell cultures ....................................................................................................................47
2.2.3. Infection of cells ..................................................................................................................................... 47 2.2.4. Preparation of cell lysates for Western blot analysis .............................................................................. 48 2.2.5. DNA-transfection of eucaryotic cell cultures ......................................................................................... 48
2.2.5.1. Transfection of adherent 293T cells and MDCK cells.....................................................................48 2.2.5.2. Transfection of suspended 293T cells..............................................................................................49 2.2.5.3. RNP reconstitution assay .................................................................................................................49
2.2.6. Chloramphenicol Acetyl Transferase ( CAT) assay ............................................................................... 49 2.2.6.1. Preparation of cell extracts ..............................................................................................................50 2.2.6.2. Determination of relative protein amount........................................................................................50 2.2.6.3. Chloramphenicol reaction................................................................................................................51 2.2.6.4. Loading samples on TLC plate ........................................................................................................51
2.2.7. Generation, amplification and purification of NS reassortants of H7-type highly pathogenic avian influenza virus .................................................................................................................................................. 51 2.2.8. Analysis of infectious virus titers ........................................................................................................... 52
2.2.8.1. Standard plaque assay......................................................................................................................52 2.2.8.2. Immunohistochemistry (MC Foci assay).........................................................................................52 2.2.8.3. Immunohistochemistry (Avicel Foci assay) ....................................................................................53
2.2.9. Haemagglutination (HA) ........................................................................................................................ 54 2.2.10. Confocal laser scanning microscopy and immunofluorescence assay (IFA)........................................ 54 2.2.11. “In cell” western blot............................................................................................................................ 55 2.2.12. Western blotting (Semi-dry)................................................................................................................. 55
2.2.12.1. Measurement of protein concentration (Bio-Rad protein assay) ...................................................55 2.2.12.2. Sodium dodecyl sulfate polyacrylamide gel electrophoresis (SDS-PAGE)...................................56 2.2.12.3. Transfer membrane in "Semi-dry" electroblotter...........................................................................56 2.2.12.4. Immunodetection of proteins .........................................................................................................56 2.2.12.5. Enhanced chemiluminescence (ECL) reaction ..............................................................................57 2.2.12.6. Quantification of protein bands .....................................................................................................57
2.2.13. Primer extension................................................................................................................................... 58 2.2.13.1. Isolating RNA (Trizol Method) .....................................................................................................58 2.2.13.2. Primer labeling...............................................................................................................................58 2.2.13.3. DNA-marker labelling ...................................................................................................................59 2.2.13.4. Reverse transcriptase .....................................................................................................................59 2.2.13.5. Running the 6% 7M urea polyacrylamide gel................................................................................61 2.2.13.6. Quantification of cDNA bands from different viral RNAs and 5sRNA ........................................61
2.2.14. Tunel assay (in situ cell death detection kit)......................................................................................... 62 2.2.15. IFN-beta enzyme linked immunosorbent assay (ELISA)..................................................................... 62
3. RESULTS .........................................................................................................................................................63
3.1. Generation and confirmation of the recombinant H7-type HPAIV with different NS segments from H5- and H7-HPAIV..............................................................................................................................................63
3.2. Analysis of the NS1 and NS2 protein sequences of the recombinant viruses ...........................................64
3.3. NS segments can change the plaque phenotype of reassortant FPV viruses............................................66
Table of Content
vii
3.4. NS segments can change the infectious titre and the HA titre of reassortant FPV viruses ....................67
3.5. NS1 protein production level do not affect the virus infectious titer. .......................................................69
3.6. NS1 protein localization does not correlate with infectious viral titre......................................................70
3.7. NS segment reassortment can affect viral replication and transcription .................................................72
3.8. The effect of NS segment on viral replication and transcription is not segment specific. .......................73
3.9. Expression of individual NS1 and NS2/NEP proteins affects the accumulation of viral RNAs in an RNP reconstitution assay.....................................................................................................................................75
3.10. NS1 could have different effects on different RNP complexes. ...............................................................78
3.11. NS segment exchange alters RNP export ..................................................................................................79
3.13. Recombinant viruses induce different levels of apoptosis........................................................................82
3.14. Recombinant viruses show different ability to counteract apoptosis......................................................84
3.15. Recombinant virus titre is not correlated with PKR activation..............................................................85
4. DISCUSSION ...................................................................................................................................................87
4.1. The effect of different NS segments on the replication of a recombinant HPAIV FPV is independent of NS allele, the virus subtype and the year the virus was isolated, but depends on host factors and the genetic background. .............................................................................................................................................87
4.2. NS1 localization and expression level is not correlated to the alteration of viral propagation...............89
4.3. Molecular mechanisms of NS segments that could affect the propagation of FPV .................................91 4.3.1. Effects of NS segments on the viral replication/transcription activity ................................................... 91 4.3.2. The effect of NS1 on the RdRp depends on the RNP complex .............................................................. 94
4.4. NS exchange also changes the RNP export patterns and this is correlated to the virus titer. ................95
4.5. The ability to limit type 1 interferon response differs among the different NS1 proteins and the IFN beta level is inversely correlated to virus titer. ..................................................................................................95
4.6. The NS reassortants show different ability to induce apoptosis and the number of apoptotic cells is inversely correlated to virus titer........................................................................................................................96
4.7. The effect of NS segment reassortment on virus propagation results from a summary of effects in multiple steps during the viral infection cycle. ..................................................................................................97
5. REFERENCE ...................................................................................................................................................99
APPENDICES ....................................................................................................................................................114

1. Introduction
1
1. Introduction
1.1. Influenza viruses
1.1.1. Classification of influenza viruses
The Orthomyxoviridae family is divided into five genera: Influenza A virus (IAV), Influenza
B virus, Influenza C virus, Isavirus and Thogoto virus. Orthomyxo viruses are single-standed
RNA viruses containing a linear segmented genome. For influenza viruses (IV), the number of
RNA segments varies: eight for influenza A and B virus, seven for influenza C virus. The
three genera of influenza (A; B; C) virus are classified by the characteristic of their
nucleoprotein and matrix protein. Based on the antigenicity of their hemaggulutinin (HA) and
neuraminidase (NA), IAV is further subdivided into 16 HA subtypes and 9 NA subtypes (1).
For influenza B and C, they have not been subdivided into any subtype.
IAV can infect birds and mammals. Wild aquatic birds are their natural reservoir in which
they generally cause no apparent disease (2, 3). Influenza B viruses are normally found only
in humans. Although influenza B viruses can cause human epidemics, they have not caused
pandemics. Influenza C virus usually causes either a very mild respiratory illness or no
symptoms at all; it does not cause epidemics or pandemics and it does not have the severe
public health impact compared to influenza types A and B.
1.1.2. Avian influenza virus (AIV)
Usually, “avian influenza virus” (AIV) refers to influenza A virus found in birds, but
infections with these viruses can occur to human occasionally. Wild birds carry AIV in their
intestines so that AIV is shed and spread via feces, saliva and nasal secretions. Most species
of wild birds infected with AIV usually do not get sick.
Only IAV can infect birds. So far all subtypes (including 16 HA and 9 NA) of IAV have been
found in aquatic birds (2). Based on the pathogenicity for chickens, AIV can be classified into
lowly pathogenic avian influenza virus (LPAIV) and highly pathogenic avian influenza virus
(HPAIV). LPAIV is the common form of virus found in wild birds. It usually causes limited
infection and leads to only mild symptoms in domestic birds. However, HPAIV causes
disease that affects multiple internal organs and has a mortality rate of as high as 100%. Only
H5 and H7 subtypes can become highly pathogenic and each of the highly pathogenic H5 and
H7 lineages originated from non-pathogenic precursor viruses (4). So far, the AIV that have
been transmitted from commercial poultry to humans are of subtypes H5, H7 and H9 (5).
1. Introduction
2
1.1.3. Epidemiology of influenza viruses
Every year, especially in the cold season, influenza can easily spread among human and often
become epidemic or sometimes pandemic, resulting annually in thousands of deaths in
millions in pandemic outbreak. Generally, an influenza outbreak normally reaches its peak
around 2-3 weeks after its sudden beginning, and may last for 5-8 weeks (6). An influenza
pandemic is a “flu” epidemic that involves almost all age groups of people in two or more
continents (WHO). At least three pandemics occurred in the last century (Fig1.1). In 1918 (7),
the pandemic was caused by a H1N1 virus and more than 20 millions people died. In 1957, a
new pandemic subtype (H2N2) appeared in China, replaced the old H1N1 completely and
spread quickly and world wide, resulting in a million of deaths (8). This H2N2 virus
continued to cause epidemics until 1968 it was completely substituted by another pandemic
subtype (H3N2) which originated from Hong Kong (9). In 1977, the subtype H1N1
reappeared. Unlike the situation in 1957 and in 1968, the new H1N1 subtype didn’t eliminate
the old H3N2 subtype. In addition, influenza B has been circulating in humans since 1940
(10). Up to now, as Fig1.1 shows, the prevalent circulating IV are a mixture of H3N2, H1N1
and influenza B. In 2009, a global flu pandemic outbreak caused by a new strain of H1N1
influenza virus, often referred to colloquially as "swine flu", which contains a combination
of genes from swine, avian, and human IV (http://www.cdc.gov/H1N1flu /qa.htm).
For a human influenza pandemic, there are three prerequisites: 1) emergence of a new IV
subtype to which the population has little or no immunity and against which there is no
effective vaccine; and 2) ability of IV to replicate in human beings and cause disease; and 3)
the new IV can transmit from human to human. For example, the three pandemic stains H1N1
(1918), H2N2 (1957) and H3N2 (1968) are believed to be reassortant viruses between human
IV and avian influenza virus (AIV) which evolved during a coinfection in pigs. Pigs are
recoginized as mixure vessels for the generation of reassort IV. Reassortant viruses may be
introduced into a naïve human population and may cause new pandemics (11).

1. Introduction
3
Fig. 1.1: Pandemics of influenza: Four worldwide (pandemic) outbreaks of influenza in the human populations
have occurred since 1900: 1918 spanish flu (H1N1), 1957 Asian flu (H2N2), 1968 Hong Kong flu (H3N2) and
2009 pandemic new H1N1 flu. Some notable epidemics although not classified as true pandemics occurred: one
in 1889, one in 1990 and another one in 1977 that was a pandemic in children. (adapted and modified from Dr
Masato Tashiro, Director, Centre for IV Research, National Institute of Infectious Diseases (NIID), Japan)
In Italy, avian infection was firstly recorded in 1878 and the disease was known as “fowl
plague”. In 1902, the first documented IV was isolated from chicken. Since 1959 to 2000,
primary outbreaks of HPAI in poultry (turkey and chicken) have been reported 17 times (eight
since 1990). In each outbreak, millions of birds were slaughtered in order to control the
outbreak (12). Of the hundreds of strains of AIV, only several are known to have caused
human infections: H5N1, H7N2, H7N3, H7N7, and H9N2. In general, human infection with
these viruses has resulted in mild symptoms and rarely with severe illness, with one notable
exception: the highly pathogenic H5N1 virus. HPAIV attracted people’s concerns since 1997,
when an H5N1 outbreak in Hong Kong was accompanied with 18 human infections resulting
in 6 deaths. In March 2003, HPAIV H7N7 broke out in Netherlands and quickly spread to
Belgium and Germany (13, 14). The virus infected 89 persons and caused conjunctivitis in 83
persons, and one death (15). Other outbreaks of HPAIV H5N1 subtype happened again in
Vietnam’s and Thailand’s poultry industry in the early 2004 accompanied with human cases
(16). Since then, the virus has spread across Asia and into Europe, the Middle East, and
Africa. Humans in close contact with sick poultry and on rare occasion with other infected
humans have become infected. Until June 8th, 2010, 499 confirmed human cases caused by
H5N1 with 295 deaths (59.1% mortality) were reported by the WHO (WHO: cumulative
number of confirmed human cases of avian influenza A/(H5N1) reported to WHO).

1. Introduction
4
1.1.4. Risk of influenza pandemics (cited from report of CDC USA)
As mentioned before, H5, H7 and H9 have caused outbreaks in birds and humans. Especially
H5N1 has crossed host barrier to humans, and occasionally human-to-human cases have been
observed in 2007 (17). More particular concerns about this H5N1 virus are: 1) domestic ducks
can excrete large quantities of highly pathogenic virus without showing signs of illness, and
are acting as a “silent” reservoir of the virus, perpetuating transmission to other birds (18). 2)
When compared with H5N1 viruses from 1997 and early 2004, H5N1 viruses now circulating
are more lethal to experimentally infected mice and to ferrets (a mammalian model) and
survive longer in the environment. 3) H5N1 appears to have expanded its host range, infecting
and killing mammalian species previously considered resistant to infection with avian
influenza viruses. 4) The behavior of the virus in its natural reservoir, wild waterfowl, may be
changing. The spring 2005 die-off of 6,000 migratory birds, caused by H5N1, was highly
unusual.
1.1.5. Morphology and structure of IAV
IV particles are pleomorphic, they can be filamentous and spherical. The diameter of spherical
particle ranges from 80nm to 120nm (19). IAV is an enveloped virus containing eight single
stranded RNA segments of negative polarity. The lipid bilayer is derived from the plasma
membrane of infected cells when viruses bud from cells. As Fig1.2 shows, two integral
membrane glycoproteins HA and NA protrude from the virion surface. Matrix protein 2 (M2,
ion channel protein) is also integrated and tanslocated into the membrance. Matrix protein 1
(M1) underlies the lipid envelop and interacts with the NS2 protein. Within the envelope, the
RNA-dependent RNA-polymerase (RdRp) subunits (PB2, PB1 and PA) and the nucleocapsid
protein (NP), together with viral RNA segments, which differ in length from 890nt to 2341nt,
constitute the ribonucleoprotein (RNP) complexes. The RNPs resemble into a twisted rod (10-
15nm in width and 30-120nm in length) that is folded back and coiled on itself (20). Eight rod
like RNPs of different length surround a central segment, which may play a role in
maintaining the integrity of the viral genome during repeated cycles of replication (20) .

1. Introduction
5
Fig. 1.2: structure of the influenza virion. The eight viral RNA segments were separated by electrophoresis
(left). The corresponding gene products and their localization within the virus particle are depicted on the right.
The only non-structural virus protein, the NS1, is only found inside infected cells. (Adapted from Ludwig et
al.(21))
Each of the eight RNA segments of IAV contains two highly conserved sequences: the first 12
nt at the 3’ end and the last 13 nt at the 5’ end. The partially complementary 5’- and 3’ end of
vRNA and cRNA, can form a “cork-screw” structure by intrastrand binding (22, 23), which
acts as the promoter for the viral RNA replication (24). Most of viral genes encode at least
one viral protein except the nonstructral (NS) gene and M gene which encode two proteins
(table 1.1). The NS gene encodes two proteins: a 26k Da protein NS1 and a 14k Da protein
NS2. NS2 is translated from spliced mRNA and shares the same AUG initiation codon and
the first 10 aa with NS1 (25). The M gene can be transcribed into three mRNAs: the unspliced
M1 mRNA, the other two alternative spliced mRNAs designated M2 and mRNA3, which
differs in the 5’ spliced site. M2 protein also shares the AUG initiation codon and the
subsequent eight amino acids with M1, whereas the product of mRNA3 (a nine amino acid
peptide) is not found in vivo (26, 27). Some IAV PB1 genes can encode an 87aa PB1-F2
protein(28), which is co-localized with the PB1 protein and may play a role in inducing
cellular apoptosis (29) . The viral proteins are shown in the table 1.1.
HA HA
NA NA NP NP
NA NA NP NP
HA HA
NS NS M M
PB2 PB2 PB1 PB1 PA PA
NS1 NS1
M1 M1 M2 M2
Segments
NEP NEP
PB2 PB2 PB1 PB1 PA PA
Gene - ProductsvRNA
HA HA HA HA
NA NA NA NA NP NP NP NP
NA NA NP NP
HA HA
NS NS M M
PB2 PB2 PB1 PB1 PA PA
NS1 NS1
M1 M1 M1 M1 M2 M2 M2 M2
Segments
NEP NEP NEP NEP
PB2 PB2 PB1 PB1 PA PA PB2 PB2 PB1 PB1 PA PA
Gene - ProductsvRNA

1. Introduction
6
Table 1.1: Influenza A virus proteins and functions (strain A/PR/8/34, H1N1)
(Modified from Ludwig et al. (30))
Segment vRNA (nt) Protein AA Functions
1 2341 PB2 759 subunit of RDRP; screening for cap sequence
2 2341 PB1
PB1-F2
757
87
catalytic subunit of RDRP; elongation
Not encoded by all IAV, can induce apoptosis
3 2233 PA 716 catalytic subunit of RDRP, can cut the cap structure from cellular
mRNA for viral RNA primers
4 1778 HA 566 hemagglutinin; surface-glycoprotein;
receptor binding; membrane fusion
5 1565 NP 498 nucleoprotein; encapsidation of vRNA and cRNA; part of
transcriptase complex; nuclear/cytoplasmic transport of vRNA
6 1413 NA 454 neuraminidase; surface-glycoprotein;
receptor disruption, virus releasing
7 1027 M1
M2
252
97
matrix protein
ion channel activity ; protecting HA-conformation
8 890 NS1
NEP/NS2
230
121
post-transcription regulator; inhibition of (i) pre-mRMA splicing,
(ii) polyadenylation (iii) PKR-activation
nuclear export factor, regulation of trancription and replication
1.2 Propagation and genome replication of IAV
The replication cycle of IAV can be descripted in three steps (Fig1.3): 1) binding and
uncoating; 2) replication and transcription; 3) virus assembling and budding.
1.2.1. Binding and uncoating
The HA protein of IAV can recognize and bind the sialyloligosaccharide receptor on the cell
surface which contains α2,3- or α2,6-galactose sialic acid linkages. After binding, the attached
virion undergoes endocytosis. The low pH in the late endocytic venicles triggers a
conformational change in the cleaved-HA (see later) resulting in the insertion of HA2 fusion
peptide into vesicle membrane. Meanwhile, under the low pH environment in the late
endocytic venicles, the ion channel protein M2 permits protons flow into virion interior by
simple diffusion, exposing the core to low pH. Low pH within the virions dissociates the
interaction between the M1 and the RNPs. The altered HA draws the virion membrane and
cell membrane together and then the fusion takes place. RNPs are released into cell cytoplasm
and then are imported into the nucleus in an ATP-dependent manner (31).

1. Introduction
7
Figure 1.3: Replication cycle of influenza virus. It starts when the HA-spike binds to its cellular receptor
determinant on the cell surface. The virion is then taken into the cell through endocytosis. After the fusion
between the viral and the endosomal membrane, the RNPs are released into the cell cytoplasm and transported
into the nucleus, where transcription and replication of the viral RNA takes place. The viral mRNA is
subsequently exported to the cytoplasm and translated into viral proteins. The replicative proteins like NP and
polymerase proteins are transported back to the nucleus and continue the genome replication. The viral surface-
glycoprotein (e.g. HA and NA) are transported to the cell surface and modified by various post-translational
processing. Late during virus replication cycle RNPs are exported out of the nucleus and packaged into new
enveloped virions that are released from the membrane of infected cell through budding. (Adapted from S.
Pleschka, Germany)
1.2.2. Transcription and replication of viral genome
The viral genome of IAV is replicated in the nucleus. Viral genomic RNA, the three
polymerase subunits (PB2, PB1, and PA) and the nucleocapsidprotein (NP) form the viral
Ribonucleoprotein complex (RNP), which is responsible for viral transcription and
replication. PB1 and PA form a dimer in the cytoplasm, which is imported into the nucleus
separately from PB2. Once in the nucleus, the PB1/PA dimer associates with PB2 to form the
trimetric polymerase.(32). In the complex, the N terminus of the PB1 protein interacts with
PB2, and the C terminus of PB1 interacts with PA (33, 34). The polymerase complex
recognizes the influenza virus promoter structure in a sequence-specific manner (35, 36) and
also interacts with NP (37). It is reported that only the PB1-PB2 or the PB1-PA complex have

1. Introduction
8
transcriptase or replicase activity respectively (38-40), however, all three polymerase subunits
maybe more efficient than the dimeric complexes for replication and transcription (41, 42).
Recent studies suggested a new model of viral replication and transcription: a template RNP is
replicated in trans by a soluble polymerase complex. A polymerase complex distinct from the
replicative enzyme directs the encapsidation of progeny vRNA. In contrast, transcription of
the vRNP would occur in cis and the resident polymerase complex is responsible for mRNA
synthesis and polyadenylation (43). The initiation of influenza virus mRNA systhesis is
primered by m7GpppXm-containing capped primers (10-13nt long), which are generated by
the cellular RNA polymerase II. PB2 of the RNP complex recognizes 5’ primer of cellular
mRNA and PA snatches the 5’ cap of cellular mRNA as primers for viral mRNAs (44, 45).
Chain elongation of viral RNA is carried out by PB1 (34). Transcription stops when it reaches
the polyA site which is 15–22nt away from the 5’ end of vRNA as shown in Fig 1.4..
Polyadenylation depends on three mechanisms: 1) viral vRNA contains a 5-7 Uridines-rich
region located 15-22nt away from its 5’ end, which serves as the polyA signal (46-50). 2) the
RNA duplex of the promoter structure; and specific nucleotides near the 5’ end of the vRNA
(49). And 3) the binding of the polymerase complex to the promoter region serves as a
physical barrier that causes reiterative copying at the neighbouring uridine stretch (24). After
polyadenoylation, the viral mRNAs are transported into the cellular cytoplasm for translation
by using the cellular translation machinery. After translation and post-translational
modification, some of polymerase proteins (PB2, PB1 and PA), as well as NP, are transported
back to nucleus for more replication and transcription. NP was found to bind new progeny
vRNA and cRNA (complementary RNA) but not mRNA, and stabilizes the viral RNP (51),
which is indispensable for viral replication in vivo. In the early infection, the synthesis of
mRNAs encoding NP and NS1 dominates, later the production of mRNA for HA, NA and M1
increases. While transcripts for polymerase proteins (PB2, PB1 and PA) are relatively low
throughout the infection cycles, except at the earliest times (52).
The viral cRNA was believed to be produced after the viral proteins had been synthesized. In
this model, newly synthesized NP acts as a “switch” from transcription (mRNA) to replication
(cRNA) by promoting the “read-through” at the ployA site and allowing the synthesis of
cRNA, which in turn serves as the template to produce more vRNA (53, 54). However, equal
quantities of cRNA are found to be synthesized through the infection cycles, which may
indicate there is no regulation on cRNA production. If cRNA is produced early in infection,
then the production of cRNA should increase. It was suggested that cRNA can be synthesized
early, but may be degraded rapidly by cellular nucleases in the early infection, while
1. Introduction
9
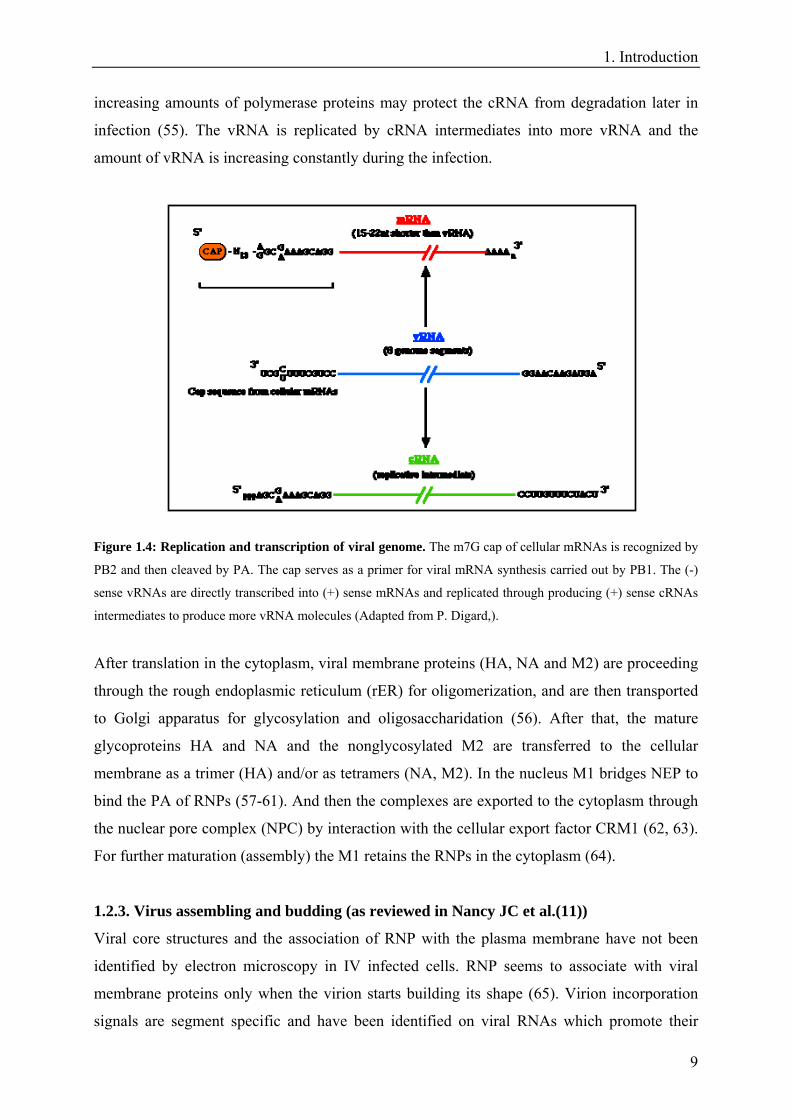
increasing amounts of polymerase proteins may protect the cRNA from degradation later in
infection (55). The vRNA is replicated by cRNA intermediates into more vRNA and the
amount of vRNA is increasing constantly during the infection.
Figure 1.4: Replication and transcription of viral genome. The m7G cap of cellular mRNAs is recognized by
PB2 and then cleaved by PA. The cap serves as a primer for viral mRNA synthesis carried out by PB1. The (-)
sense vRNAs are directly transcribed into (+) sense mRNAs and replicated through producing (+) sense cRNAs
intermediates to produce more vRNA molecules (Adapted from P. Digard,).
After translation in the cytoplasm, viral membrane proteins (HA, NA and M2) are proceeding
through the rough endoplasmic reticulum (rER) for oligomerization, and are then transported
to Golgi apparatus for glycosylation and oligosaccharidation (56). After that, the mature
glycoproteins HA and NA and the nonglycosylated M2 are transferred to the cellular
membrane as a trimer (HA) and/or as tetramers (NA, M2). In the nucleus M1 bridges NEP to
bind the PA of RNPs (57-61). And then the complexes are exported to the cytoplasm through
the nuclear pore complex (NPC) by interaction with the cellular export factor CRM1 (62, 63).
For further maturation (assembly) the M1 retains the RNPs in the cytoplasm (64).
1.2.3. Virus assembling and budding (as reviewed in Nancy JC et al.(11))
Viral core structures and the association of RNP with the plasma membrane have not been
identified by electron microscopy in IV infected cells. RNP seems to associate with viral
membrane proteins only when the virion starts building its shape (65). Virion incorporation
signals are segment specific and have been identified on viral RNAs which promote their

1. Introduction
10
efficient incorporation into virions (66-68). These signals are located in the non-coding
regions at both ends of the vRNAs and extend into part of translated regions, thereby
conferring segment specificity. Although influenza virus can accommodate more than eight
viral segments (69) (a finding that suggested random incorporation of vRNAs) efficient
packaging relies on cis-acting signals that govern the incorporation of the eight viral RNA
segments into virions. The mechanism for selective vRNA incorporation remains to be
determined. Presumably, RNP buds outward through the cell membrane. Substantial amounts
of M1 are found in the cytoplasm throughout the infection period. M1 interacts with cellular
membranes (70), and induces the formation of virus like particles (71, 72). Since at least a
fraction of M1 is associated with RNPs in the virion, this protein possibly serves as molecular
‘glue’, interacting with RNP on one hand and with HA, NA, or M2 on the other (61, 73). Such
interactions may function as a budding signal (11).
1.3. The pathogenecity and virulence of IAV
The pathogenicity of influenza virus is a very complex phenomenon. On the molecular basis,
the pathogenicity and virulence of influenza virus is determined by several interacting factors:
1) the viral factors: the ability to mix the genome between two viruses due to the segmented
genome of influenza virus (see later) (74), the ability to bind to the host cells, the replication
efficiency and the ability to counteract the host immune response (75, 76) or viral mechanisms
for stimulating a hyper-immune response; and 2) host factors, including the expression of
different receptors on the host cells, the availability of a protease which is essential for HA
cleavage (see later) and viral entry and the status of the host immune system.
1.3.1 Viral glycoproteins
Glycoproteins of IV play an important role in virulence and pathogenicity. As mentioned
before, the HA protein binds to sialic acid (SA)–containing surface molecules on the host cell,
and promotes the release of viral RNP complexes during infection into the cells through
membrane fusion. In contrast, the sialidase activity of the neuraminidase (NA) protein
removes SA to liberate new-born viruses from infected cells. The cleavage properties of HA
and the distribution of infectivity-activating proteases in the host are important for virus
tropism and the capacity of systemic spread. The HAs of HPAIV contain multiple amino acid
(aa) basic residues at the cleavage site, and can be cleaved by ubiquitous intracellular
proteases; while the HAs of all other IV contain only one aa R (Arginine) residue and can
only be recognized by extracellular proteases limited to some respiratory and intestinal cells.

1. Introduction
11
In addition, the specificity of HA can determine the host range. Human influenza viruses
preferentially recognize sialyloligosacchrides containing SAα2,6Gal, matched by mainly
NeuAcα2,6Gal linkages on the epithelial cells of the human trachea. In contrast, avian viruses
preferentially recognize SAα2,3Gal sialyloligosacchrides, in accordance with the
predominance of sialyoligosaccharides with NeuAcα2,3Gal linkages on the epithelial cells of
avian intestine. High viral burdens are achieved when newly synthesized viruses are released
from infected cells and then infect new cells (31). The NA glycoprotein removes SA from the
cell surface of infected epithelial cells, which is necessary for the release of newly synthesized
viruses. Thus, efficient virus replication involves balanced actions of both HA and NA
antigens (77). It was reported that an avian virus with an N2 NA was introduced into the
human population, and its SAα2,6 cleavage activity was increased, which suggests it had
adapted to the SAα2,6 receptor specificity of human HAs (78). The 1997 H5N1 viruses
isolated from patients in Hong Kong are characterized by a deletion in the NA stalk.
Moreover, most recent H5N1 viruses isolated from terrestrial poultry possess short NA stalks
and the NA stalks resulted in increased virulence in poultry (79).
1.3.2 Viral ribonucleoprotein complex (RNP)
More and more studies have highlighted the importance of mutations in the proteins of the
viral replication machinery for pathogenicity and host transmission. Classical co-infection
experiments in 1979 indicated a mixing of the components of the RNA polymerase complex
can lead to the loss of the pathogenicity even in the presence of highly pathogenic HA and NA
(80). Reassortants between lethal A/Vietanam/1203/04 (VN04) and nonlethal
A/chicken/Vietnam/C58/04 (CH58) showed that exchanging hemagglutinin and
neuraminidase genes did not alter the pathogenecity in ferret while substituting CH58
polymerase genes can completely attenuated VN 04 virulence in ferret and reduced viral
polymerase activity (81). A reassortant human H1N1 virus (A/Kawasaki/173/2001) carrying
the viral RNA polymerase complex (PA, PB1, and PB2) and NP of the pandemic 1918 virus
showed increased invasion virulence in upper and lower respiratory tracts of ferrets that was
similar to the wild type 1918 virus. This strongly implicated that the viral RNA polymerase
complex as a major determinant of the pathogenicity of the 1918 pandemic virus (82). Recent
large-scale sequence analyses revealed “signature” aa at specific positions in viral proteins
that distinguish human influenza viruses from avian viruses. By reverse genetics, mutant
viruses possessing signature aa in the PB2, PA, and NP of human influenza isolates ('human-
like aa') in the genetic background of an avian H5N1 virus were generated and exhibited

1. Introduction
12
enhanced pathogenicity in mice, suggesting the involvement of these host lineage-specific aa
in the pathogenicity of H5N1 avian influenza viruses in mammals(83).
PA (T97I) mutations could adapt avirulent wild-bird H5N2 strain A/Aquatic
bird/Korea/W81/05 (W81) to highly virulent virus in mice. It showed enhanced replication in
mammalian cells but not in avian cell lines. Animal experiments also showed that the PA
T97I mutation could increase replicative fitness in mice but not in chickens (84). Both the
1957 and 1968 pandemic viruses possessed avian PB1 genes, in addition to avian HA, NA
(85). Additionally, an experiment also indicated replication in mammalian cells was more
efficient with PB1 proteins from avian than with that of human virus (86), which showed that
avian PB1 might have a greater activity that could provide a replication advantage in
mammalian systems. A mutation at position 627 (E627K) of the PB2 protein allows avian
viruses to efficiently grow in humans and this mutation is considered as an important host
range determinant (87, 88). This was supported by the fact that an H7N7 virus isolated from a
patient with fatal pneumonia in the Netherlands in 2003 contained aa K at this position (89)
and some of the H5N1 viruses isolated from patients in Vietnam are characterized by E627K
(90), in contrast to viruses isolated from nonfatal cases and from chickens. PB2 K627
correlates with enhanced polymerase activity, virus replication, transmission, and in certain
cases, pathogenicity and mortality in mammals (81, 91-97). Especially, it was shown that PB2
627K enhanced IV replication in pigs, consistent with pigs serving as an intermediary viral
reservoir between birds and humans (98). Conversely, the presence of 627E severely
attenuates replication efficiency and pathogenicity in mammalian systems (92, 93). Strikingly,
approximately two-thirds of the H5N1 viruses recovered from human infections retain the
inhibitory avian-like E627. Moreover, all of the 2009 H1N1 isolates to date possess the avian-
signature E627, but these viruses replicate and are efficiently transmitted in humans and
animal models (99-103), which means there must be other domains or mutations to
compensate this deficiency. A recent study revealed that the new H1N1 pandemic virus
contains PB2 627E but its virulence can be compensated with a second site mutation, that is
why the pandemic new H1N1 virus can evolve to enhance replication and potentially
pathogenesis in humans (104). PB2 K627E in the A/Panama/2007/99 (H3N2) and A/Viet
Nam/1203/04 (H5N1) backgrounds was shown to decrease transmission. Introduction of an
701N, in conjunction with the K627E mutation, resulted in a phenotype more similar to that of
the parental strains, suggesting that this residue can compensate for the lack of 627K in terms
of increasing transmission in mammals (94).

1. Introduction
13
Several studies also highlighted the importance of NP’s role in virus replication and
pathogenecity. An avian virus NP segment against a background of a human virus resulted in
attenuation in squirrel monkeys (105). Infection with viruses containing a 184K induced
earlier mortality in chickens, increased virus titers and nitric oxide levels in tissues, and
resulted in up-regulated host immune genes, such as IFN-alpha, IFN-gamma, orthomyxovirus
resistance gene 1 (Mx1), and inducible nitric oxide synthase (105-107). Exchanging the NP
gene in the context of two H5N1 viruses greatly increased viral replication and expanded
tissue tropism, thus resulting in decreased mean death times (108). Adaptive mutations
D701N in PB2 and N319K in NP enhance binding to importin alpha1 in mammalian cells
(109). These findings demonstrate that adaptation of the viral polymerase to the nuclear
import machinery plays an important role in interspecies transmission of influenza virus
(109).
1.3.3 The role of multifunctional NS1 protein in pathogencity
1.3.3.1 NS1 localization and structure
NS1 is a 26 kDa protein of 230aa in length, depending on the virus strain. Some NS1 contain
C-terminal truncations (110) or 7 aa C-terminal extension or/and deletions in the internal
region. Additionally, sequence analysis shows a 7 aa C-terminal extension was gained and
retained in human H1N1, H2N2 and H3N2 viruses from 1940s to 1980s (111). Later the
extension was lost due to a stop codon mutation. NS1 is notionally divided into two distinct
functional domains: an N-terminal “RNA-binding” domain (residues 1–73), which binds in
vitro with low affinity to several RNA species in a sequence independent manner (112-114),
and a C-terminal “effector” domain (residues 74–230), which predominantly mediates
interactions with host-cell proteins, but also functionally stabilizes the RNA-binding domain
(115). Full-length NS1 likely exists as a homodimer, with both the RNA-binding and effector
domains contributing to multimerization (116). Dimerization is essential for the function of
dsRNA binding (117) and the effecter domain. Some residues such as aa 5T, 31P, 34N, 35R,
38R, 41K, 45G, 46R and 49T (117, 118) were reported to be involved in the interaction of
dsRNA binding. Especially, if 38R and 41K are mutated to Ala, NS1 will lose the dsRNA
binding activity (117).
NS1 predominantly localizes in the nucleus, but at the later time points of infection, a
significant proportion can also be found in the cytoplasm (111, 119-121). Within the nucleus,
NS1 has been shown to localize to ND10 structures (122) . NS1 contains one or two
nuclear localization sequences (NLS): NLS1 is highly conserved and involves three residues

1. Introduction
14
(35R, 38R and 41K) which are also located in the dsRNA binding domain (111). Some NS1
contain a NLS2 at the C-terminus which comprises the specific amino acids 219K, 220R,
231R and 232R). Other NS1 also contain a functional nucleolar localization signal (NoLS),
which concurrents with the NLS2 domain and involves additional basic residues (224R and
229R) (111). The meaning of NS1 localization is unknown, however, a mutant IAV
expressing a truncated NS1 protein unable to localize to nucleoli was not attenuated in
replication in tissue culture (111). In contrast, extensive accumulation of IV NS1 protein in
the nuclei causes effective viral growth in Vero cells (123). NS1 138–147 amino acid
sequence was recognized as an nuclear export signal (NES) (124), unmasking this NES by
mutating the adjacent aa can cause the NS1 localization change from nucleus to cytoplasm. If
the NES domain was deleted, the total NS1 proteins totally occur in the cell nucleus. In
transfected cells, the NES of NS1 was masked, while in infected cells, due to some host
factors or viral factors, the NES of NS1 was unmasked and lead the dramatic change of NS1
localization from nucleus to cytoplasm (124).
1.3.3.2. NS1 can affect mRNA splicing, mRNA processing, post transcription
modification, mRNA export and translation (as reviewed in Hale BG et al. (125))
NS1 is a multifunctional protein involved in many steps of viral replication cycle and
contributes to the virus virulence. This includes: 1) temporal regulation of viral RNA
synthesis; 2) control of viral mRNA splicing; 3) enhancement of viral mRNA translation; 4)
regulation of virus particle morphogenesis; 5) suppression of host immune/apoptotic
responses; 6) activation of phosphoinositide 3-kinase (PI3K); and 7) involvement in strain-
dependent pathogenesis. All of these NS1 functions rely on its ability to participate in a
multitude of protein–protein and protein–RNA interactions (125).
NS1 was reported to regulate the splicing of viral mRNA (126-129), NS1 protein alters the
splicing and transport of RNA polymerase II-driven transcripts (126). Inhibition of mRNA
splicing requires the N-terminal region of NS1, but is independent of RNA-binding. However
the inhibition of nuclear export of its own mRNA needs NS1 RNA-binding activity (126, 130,
131). It was suggested that the regulation of viral mRNA splicing by NS1 involves a cellular
protein (70kDa NS1-binding protein), termed NS1-BP. NS1-BP was initially identified as an
interaction partner for NS1 in yeast two-hybrid screens (132). Given that NS1-BP
predominantly co-localizes with the spliceosome assembly factor SC35, it was suggested that
this protein was normally involved in cellular mRNA splicing. During influenza A virus
infection, the cytoplasmic fraction of NS1-BP is redistributed to the nucleus, and apparently

1. Introduction
15
co-localizes with NS1 (132). Immunofluorescence experiments have also demonstrated that
NS1 expression caused redistribution of cellular splicing factors in the nuclei of infected cells
(133). These reports, together with findings that NS1 can bind and disrupt complexes between
specific small nuclear RNAs (snRNAs) (essential components of spliceosomes), highlighted
the possible biological interaction between NS1 and the cellular mRNA splicing machinery
(134-136).
Fig.1.5: Schematic interactions of the NS1 protein, together with its known interactors. The final 20 aa C-
terminal may be natively unstructured. NS1 contains two nuclear localization sequences (NLS1 and NLS2), and
a nuclear export sequence (NES). A nucleolar localization sequence (NoLS) has been reported for some strains,
and is concomitant with NLS2. Residues involved in RNA-binding (38R and 41K) are implicated in the
inhibition of OAS/RNase L, Jun N-terminal kinase, and RIG-I. Additionally, NS1 contains binding sites for:
poly(A)-binding protein I (PABPI), p85β, importin- , nucleolin, NS1-BP, eIF4GI, hStaufen, NS1-I, PKR,
PACT, CPSF30, poly(A)-binding protein II (PABPII), Crk/CrkL, PDZ domain-containing proteins, the viral
polymerase, and components of the cellular mRNA nuclear export machinery (E1B-AP5, p15, NXF1, and Rae1).
(Adapted from Hale BG (125))
1. Introduction
16
NS1 was reported to enhance the translation of viral mRNA and the N-terminal 113 residues
of NS1 were required for direct stimulation of viral mRNA translations. De la Luna et al.
suggested that NS1 selectively enhanced viral mRNA and did not affect the translation of
non-viral mRNAs (137). Salvatore et al. showed that NS1 has a general effect on the viral and
cellular mRNA (138). Additionally, Enami et al. demonstrated that NS1 does not affect viral
mRNA transcription (139). The mechanism behind NS1 mediated enhanced translation is not
clear, it was suggested to be mediated by NS1 binding to 5'UTR of viral mRNAs (137, 140),
however, it was also suggested to be vRNA segment-specific (139) because the enhanced
translation in a viral 5'UTR-dependent manner was not seen. Alternatively, some host cellular
protein maybe also involved in addition to NS1 binding to 5'UTR of viral mRNAs. Viral
mRNAs were shown to be efficiently translated even in the presence of low levels of the
cellular eIF4F cap-binding complex (141) and the residues 81–113 of NS1 can interact with
eIF4GI, the large subunit of eIF4F (142), implying that NS1 could bind or recruit eIF4GI, and
thus eIF4F, to the 5'UTR of viral mRNAs, thereby preferentially increasing viral translation.
Furthermore, as shown in Fig 1.5, 1-81 aa of NS1 could interact with PABPI, a known
interactor of eIF4GI, independently of RNA (143) and mapping studies suggested that a
heterotrimeric NS1–PABPI–eIF4GI complex might be possible (142, 143). In addition, NS1
could interact with and cause the redistribution of hStaufen, a dsRNA- and tubulin-binding
protein related to dsRNA-dependent Ser/Thr protein kinase R (PKR) (144). As hStaufen
normally contributes towards microtubular transport of cellular mRNAs to sites of enhanced
translation, such as polysomes, the interaction with NS1 may promote efficient viral mRNA
translation. In support of this, a proportion of both NS1 and hStaufen have previously been
found to co-fractionate with cytoplasmic polysomes in IAV-infected cells (144). Thus, to
increase viral protein synthesis, NS1 appeared to interact with viral 5'UTRs, hStaufen, eIF4GI
and PABPI to recruit viral mRNAs (at the expense of cellular mRNAs) to multi-protein
translation-initiation complexes It is still not clear if the observed binding of NS1 to poly(A)
sequences(145) has any role in viral mRNA translation.
1.3.3.3. NS1 can affect host innate and adaptive immune response.
Pathogenesis of viral infections depends partly on the ability of a virus to evade or suppress
the host immune response. Recombinant viruses containing NS1 deletion (delNS1) or NS1
with truncations demonstrated the NS1 protein plays a central role in countering the host
immune response. DelNS1 viruses could induce large amounts of IFN and were attenuated in
IFN-competent cells (146). Additionally, delNS1 viruses replicate more efficiently in IFN-

1. Introduction
17
deficient tissues such as Vero cells than the wild type virus (147, 148). NS1 impairs innate
and adaptive immunity by inhibiting host signal transduction and gene expression:
As such, NS1 can directly block the function of 2'-5'-oligoadenylate synthetase (OAS) (149)
and PKR (150, 151) by binding to dsRNA, which are important regulators of translation that
can induce IFN production and the host apoptotic response. OAS is activated by dsRNA, a
putative by-product of viral replication, and polymerizes ATP into 2'-5' oligoadenylate chains.
These chains cause dimerization and activation of the RNase L which inhibits virus replication
by degradation of viral RNA (152). Data indicated that a predominant function of the NS1
RNA-binding domain is to out-compete OAS for interaction with dsRNA, thereby inhibiting
this host antiviral strategy (149); dsRNA also binds and activates PKR, thereby releasing PKR
auto-inhibition. A major substrate for activated PKR is the eukaryotic translation initiation
factor 2 (eIF2 ). The phosphorylation of eIF2 leads to a reduction in both cellular and viral
protein synthesis (153). In vitro experiments initially indicated that NS1 may also compete
with PKR for binding dsRNA(151). Furthermore, NS1 has been shown to interact with PKR
in a dsRNA-independent manner, which required NS1 residues 123–127 (154, 155). However,
dsRNA has yet to be detected in influenza A virus-infected cells (156).
Furthermore, NS1 can inhibit retinoic acid-inducible gene I (RIG-I)-mediated induction of
IFN by binding to RIG-1, and preventing it from binding to single-stranded RNA (ssRNA)
bearing 5'-phosphates (157, 158). Co-precipitation of RIG-I with NS1 from A/Puerto
Rico/8/34 (PR8) is largely dependent upon 38R and 41K in PR8/NS1 (158), suggesting that
these two residues are involved in a potential protein–protein interaction, or that RNA acts as
an intermediary component; also, NS1 was shown to interact with the ubiquitin ligase
TRIM25 and then inhibits specifically TRIM25-mediated RIG-I CARD ubiquitination,
thereby suppressing RIG-I signal transduction (159).
Another way of NS1 to affect innate immunity is via the activation of transcription factors
such as ATF-2/c-Jun, NF-κB, and IRF-3/5/7, all of which stimulate IFN production (160-163).
Such pre-transcriptional inhibition requires two residues in the NS1 that strongly contribute to
RNA-binding: 38R and 41K (162).
NS1 forms an inhibitory complex with NXF1/TAP, p15/NXT, Rae1/mrnp41, and E1B-AP5,
which are important factors in the mRNA export machinery, thereby NS1 decreases cellular
mRNA transport in order to render cells highly permissive to influenza virus replication (164).
NS1 prevent the nuclear post-transcriptional processing of RNA polymerase II transcripts by
binding to the cellular proteins CPSF30 (165) and PAB II (166) and inhibits the 3'-end
processing of cellular pre-mRNAs to limit IFN-β production. The C-terminal effector domain

1. Introduction
18
of Ud/NS1 binds directly to two zinc-finger regions in the 30 kDa subunit of cleavage and
polyadenylation specificity factor (CPSF30) and requires 103P, 106M, 144L and residues
184–188 of NS1 from A/Udon/72 (Ud, H3N2) (165, 167). Binding to PABPII requires
residues 223–237 of Ud/NS1 (127).
NS1 might also affect host adaptive immune response. In a mouse model, a H5N1 NS1
protein was shown to reduce systemic and pulmonary pro-inflammatory cytokines and
prevented TNF- -mediated bone marrow lymphocyte depletion (168). Furthermore, in
human-derived primary DCs, PR8/NS1 was shown to limit induction of several genes
involved in DC maturation and migration (169). Consequently, infected DCs were unable to
mature, and failed to stimulate the secretion of IFN- from helper T-cells. The limitation of
gene-expression in DCs is specific only for certain genes, and mechanistically appears
unrelated to the suppression of IFN-β production by PR8/NS1 (169). Recent studies
demonstrated that protection against IV infection requires reactivation of memory T-cells by
antigens presented on bone marrow-derived DCs (170), so the prevention of DC maturation by
NS1 may limit virus-clearance by the host.
1.3.3.4. NS1 can modulate the host pro-apoptotic and anti-apoptotic response.
NS1 is reported to have both pro- and anti-apoptotic functions. It is suggested that NS1
contributes temporally to both ‘early’ suppression of apoptosis and ‘late’ induction of cell
death. Certain viral proteins, such as NA and PB1-F2, have pro-apoptotic functions (171).
Thus, the overall temporal regulation of both pro- and anti-apoptotic mechanisms may be
critical for the virus. Limiting apoptosis early during infection could promote events such as
genome replication, while enhancing apoptosis later may lead to increased release of progeny
virions. Apoptosis after viral replication may also increase the phagocytic clearance of
infected cells, which might otherwise stimulate cell-mediated cytotoxic responses. During
virus infection, NS1 clearly displayed anti-apoptotic function which is linked to its ability to
limit the production and downstream effects of IFN (172). In IFN-competent MDCK cells,
PR8 delNS1 virus induced higher levels of apoptosis than wt PR8 (172). However, in Vero
cells, which lack IFN- /β genes, both viruses induced similar levels of apoptosis, but at a
much slower rate than that observed in MDCK cells (172). It is not known if Vero cells are
defective in pathways and genes other than IFN- /β, therefore one can only speculate that
IFN- /β-antagonism by NS1 is the most important factor in limiting apoptosis. As
catalytically active PKR is reported to play a role in apoptosis during IV infection (173), the
direct binding and inhibition of PKR by NS1 could also lead to cell-death suppression. The

1. Introduction
19
same may be true for NS1-mediated inhibition of pro-apoptotic OAS/RNase L (149), or the
JNK/AP-1 stress pathway (160). The activation of the host-cell PI3K pathway has recently
been described as an additional direct method by which NS1 may limit induction of apoptosis
(174-176). Two polyproline motifs (amino acids 164 to 167 [PXXP]), SH3 binding motif 1
and (amino acids 213 to 216 [PPXXP]), SH3 binding motif 2 were identified in NS1. SH3
binding motif 1 was found to contribute to the interactions between NS1 and the p85beta
subunit of PI3K, which activates PI3K/Akt signal pathway leading to phosphorylation of
caspase-9 to inhibit virus induced apoptosis. Mutation in motif 1 will lead to more severe
apoptosis than wt virus (175).
1.3.4 Host antiviral response: immune response and apoptosis
1.3.4.1 Immune response
Host immune responses to IV involve innate immune responses, humoral and cell-mediated
adaptive immune response. Type I interferons, such as IFN- or IFN-β, are soluble cytokines
that are synthesized and secreted by cells in response to virus infection, IFN acts in both an
autocrine and paracrine manner to upregulate the expression of >300 IFN-stimulated antiviral
genes (177). Furthermore, intracellular expression of viral proteins, such as HA, NP and M1
and accumulation of viral RNA species, indirectly via PKR, Toll-like receptors, such as TLR-
3 -7/8, and RNA helicase proteins, such as RIG-I and mda-5 (178-183), can activate IKK
kinase, upstream of NF-B. Activated IKK phosphorylates IkBa leading to its ubiquitination
and degradation. NF-B heterodimer (composed p50 and p65 subunits) are therefore released
and can translocate into the nucleus and transactivate responsive genes including IFN genes
(21, 184). Even if progeny virus replicates in one host cell, the host innate immune responses
may interfere with the infection of other cells (185). Interferons may induce uninfected cells
to enter an antiviral state that inhibits viral replication and limits virus replication and spread.
Furthermore, studies on RIG-1 and mda-5 in IV infections showed a significant increase in
IFN promoter activity (186). In a study using human alveolar epithelial A549 cells, type I
IFNs were shown to be important for the activation of antiviral response genes, such as the
Mx1 (187), PKR and 2'-5' OAS.
Whereas the innate immune response is mainly responsible for controlling virus replication in
the early stages of infection, adaptive immune responses are generally essential to limit the
progression of the disease and to eliminate the virus completely (188-191). Adoptive transfer
experiments have shown that CD8+ T memory cells can cross-protect against different AIV

1. Introduction
20
subtypes (192). Furthermore, memory T cells induced in response to seasonal human
influenza can cross-protect even against avian influenza H5N1 (193, 194).
1.3.4.2 Apoptosis
Influenza A and B viruses induce apoptosis in both permissive and non-permissive cells
(195). However, the role of apoptosis induced by IV is controversial. Apoptosis was said to
reduce viral load and pathology. Whereas the activation of caspase 3, a critical enzyme
involved in apoptosis, has been found to enhance IV replication (196). Apoptosis was reported
to involve PKR, IFN type I secretion and the Fas antigen-encoding gene (197). The type I IFN
response could make cells sensitive to apoptosis signaling through FADD/caspase-8
activation (198).
Many intrinsic and extrinsic apoptotic induction pathways have been identified to be activated
by viral factors in virus-induced apoptosis. The dsRNA, NS1, NA and PB1-F2 can induce
apoptosis. PB1-F2 localizes and interacts with the mitochondrial-dependent apoptotic
pathway. The PB1-F2 protein induces apoptosis in various cell types, including human
monocytic cells, leading to the hypothesis that this protein functions to kill host immune cells
responding to IV infection (28). The dsRNA could activate Fas-Fas ligand intrinsic apoptotic
signal pathway via PKR. PKR is capable of controlling several important cell-signaling
pathways and therefore may have multiple effects; a predominant one is increased interferon
production and activity. NA has been shown to act via an extrinsic mechanism involving
proapoptotic host-defense molecules by activation of TGF-beta. As shown before, NS1 could
be proapoptotic and antiapoptotic. In addition, NS1 was shown to interfere with IFN induction,
and related cell-signaling pathways. IV infected cells undergoing apoptosis are readily
engulfed by macrophages (199). Infection of macrophages but not dendritic cells can trigger
apoptosis (200). It has also been reported that specific types of differentiated airway cells may
undergo necrotic cell death, promoting inflammatory damage in the airway (201). Apoptosis
was observed in alveolar epithelial cells, which is the major target cell type for the viral
replication. Apoptosis may play a major role in the pathogenesis of influenza (H5N1) virus in
humans by destroying alveolar epithelial cells. This pathogenesis causes pneumonia and
destroys leukocytes, leading to leukopenia, which is a prominent clinical feature of influenza
(H5N1) virus in humans. Whether observed apoptotic cells were a direct result of the viral
replication or a consequence of an overactivation of the immune system requires further
studies (202).

1. Introduction
21
1.4. Aim of this project
1.4.1. To investigate the effect of different NS segments from H5 and H7-type HAPIV on
the replication of a strictly avian H7-type HPAIV
Since 1997, the outbreak of an H5N1 HPAIV has resulted in major losses to the poultry
industry and caused about 467 human infections with approximately 60% mortality (203,
204). The virus firstly emerged in Asia but has now spread to many countries throughout
Europe and Africa and has the potential to cause a worldwide pandemic. H7-type HPAIV
strains have circulated in Europe for many years and have resulted in some infections in
humans, albeit with low mortality rates (205). With the rapid spread of H5N1 viruses into
Europe it is increasingly likely that H5-type viruses may reassort with H7-type HPAIV. As it
has previously been reported that H5N1 HPAIV NS segments selected after 1998 enhance
virus replication in mammalian cells (206), while we have previously shown that a NS
segments of A/Goose/Guangdong/1/96 (GD, H5N1) isolated in 1996 could increase the
replication and pathogenicity of a H7-type HPAVI FPV (207). Therefore I was interested to
investigate other NS segments from A/Vietnam/1203/2004 (VN, H5N1) isolated in 2004 and
from A/Mallard/NL/12/2000 (Ma, H7N3) in 2000 and tried to determine how different H7-
and H5-type NS segments affect H7-type HPAIV.
Phylogenetic analysis of the of influenza A viruses NS segments shows that they can be
classified into two groups: allele A and allele B (208). NS segments of human, swine, most
equine and some avian IV belong to allele A, while NS segments of one equine and avian IV
are grouped into allele B (110, 209, 210). The only example of an allele B NS segment from a
mammalian IV, A/Equine/Jilin/89, originated in China and caused severe disease and high
mortality in horses. The virus appeared to have crossed to horses from an avian source since
all eight segments appeared to be avian-like (210). Although four allele B NS segments were
reassorted into FPV background and rescued the viruses showed attenuated growth in squirrel
monkeys (211). It was previously shown that a reassortant H7N1 HPAIV bearing an allele B
NS segment of A/Goose/Guangdong/96 (GD, H5N1) was more virulent than the wild-type
H7N1, and can productively infect mice (212). Here, I extended our study to another allele B
NS segment which is similar to the GD NS and tried to see whether this allele B NS segment
can also increase the replication and virulence of FPV. Furthermore, I also included another
allele A-type NS segment in my investigation on the effect of NS reassortantant on H7-type
HPAIV replication.

1. Introduction
22
1.4.2 Defining molecular mechanisms that explain how NS segments affect the
propagation of FPV
1.4.2.1 Effects on the viral replication cycle including genome replication/transcription
and export of viral genome
Many studies have highlighted the importance of the interaction between RNP complex and
NS1 in virulence and pathogenecity (213-216). NS1 protein can be immunoprecipated with
RNP complex in vivo (213), and truncated NS1 affect the viral vRNA production in infected
MDCK cells, while cRNA and mRNA production were not affected at the restrictive
temperature, which indicated that NS1 is involved in replication but not in transcription (214).
Furthermore, NS1 protein regulates the time course of viral RNA synthesis during infection:
a recombinant Ud virus that expresses an NS1 protein in which only two aa (123 and 124) are
changed to Ala deregulates the normal time course of viral RNA synthesis that occurs in cells
infected by wt Ud virus (155). Influenza A virus polymerase can be an integral component of
CPSF30-NS1A protein complex in infected cells(215). The NS1 of influenza B virus was said
to form a complex with RNP complex intermediated by PKR (217). In addition, NS2/NEP
was shown to regulate the replication and transcription activity independent of RNP export
mechanism (216). In general, the viral replication (vRNA production) is dependent on the
viral RdRp while transcription (viral mRNA production) is critically affected by many cellular
transcription factors such as cellular DNA-dependent RNA polymerase II (pol II), cellular
splicing factor and cellular mRNA transport factors (51). NS1 protein was shown to interact
with pol II (218), splicing factor [122] and cellular mRNA transport complex (164). NS2 was
reported to interact with viral RNP export and regulate viral transcription and replication.
However, how the components of NS segment act on the viral RNP complex and how it
works is still unclear.
Based on above questions, this study investigates how different NS segments affect the
transcription/replication and the export of the viral genome of an H7-type AIV..
1.4.2.2 Modulation of antiviral host response: stimulation of the IFN response and
induction of apoptosis
In this study, a series of recombinant A /FPV/Rostock/34 viruses with NS segments from
A/FPV/Rostock/34 (FPV, H7N1), A/Goose/Guangdong/1/96 (GD, H5N1),
A/Vietnam/1203/2004 (VN, H5N1)18, and A/Mallard/NL/12/2000 (Ma, H7N3) were
generated by reverse genetics. As mentioned before (section 1.3.3.3 and section 1.3.4.1), NS1
protein is one of major factors for pathogenicity by affecting the host antiviral immune

1. Introduction
23
response and apoptosis. It can impair host innate and adaptive immunity in a number of ways
(as mentioned in section 1.3.3.3 and section 1.3.4.1), In order to determine the effect of NS
segment on host antiviral response and how they affect the virus propagation, the host
antiviral response including interferon response and apoptosis were examined.

2. Materials and Methods
24
2. Materials and Methods
2.1. Materials
2.1.1. Instruments
Abbocath-T (26Gx19mm) Hospira
Bacterial incubator and shaker (CH 4103) Infors AG
Bio Imaging Analyzer (BAS 2000) Fuji Film
Cell culture incubator Heraeus; Nuaire
Cell culture microscope Hund
Confocal laser scanning microscopy (TCS SP5) Leica
Culture Hood (HB2448) Heraeus
Developing machine Optimax, Protec
Disposable Razor Med Comfort AMPri GmbH
DNA-Spectrophotometer GeneQuant II Pharmacia Biotech
Electrophoresis apparatus system Institute for Medical Virology
Electrophoresis power supply (EPS500/400) Pharmacia
ELISA reader (Type LP 400) Diagnostic Pasteur
FACS calibur Becton Dickinson, USA
Fine scale (Mettler PM460) Mettler Waagen GmbH
Gene Pulser Biorad
GeneQuant II (RNA/DNA calculator) Pharmacia Biotech
Heat block Jumotron
BioMax TranScreen HE Intensifying Screen with
BioMax Cassette
Kodak
Magnetic stirrer IKA Labortechnik
Megafuge 1.0 R Heraeus
Microwave oven Quelle
Mini centrifuge Biofuge 13, Heraeus
PCR machine (GeneAmp, PCR system 2400) Perkin Elmer
pH meter (Type 632) Metrohm
Photo system for gel (P93D) Mitsubishi
Shaker (Type 3013) MSGV GmbH
Scale (P1200) Mettler
Scanner Canonscan 9900F Canon

2. Materials and Methods
25
SDS-PAGE gel system Institute for Medical Virology
Sonicator (Type HD70) Bondelin Sonoplus
Spectrophotometer (DU-70) Beckman
Speed Vac (SPD111V) Savant
Sterile needles BD Microlance 3 BD
Syringe (microliter, serial 700) Hamilton
Syringe 20ml single use Braun, Melsungen AG
Thermomixer Eppendorf
UV light source Vilber Lourmat
Vortex (Vibrofix VF1) IKA Labortechnik
Water bath (SW-20C) Julabo
Western-Blot chamber Institute for Medical Virology
2.1.2. Reagents and general materials
1 kb DNA ladder mix PEQLAB
10x restriction enzyme buffer 1, 2, 3 and 4 NEB
10x AccuPrime Pfx DNA polymerase buffer Invitrogen
Acrylamide Bio-Rad
Acrylamide/Bisacrylamide 19:1 premixed solution Appligene
AccuPrime dNTPs (3 mM) Invitrogen
Accutase PAA
Acetic acid Roth
Agar high-gel strength Serva
Agarose ultra pure Roth
Ammonium persulfate (APS) Serva
Ampicillin ICN
Aprotinin Roth
Avicel-Powder (Avicel microcrystalline cellulose NF,
B.P.)
IMCD Germany
β-mercaptoethanol (MetOH) Roth
Benzamidin Sigma
Blotting papers (GB004) Scheicher & Schuell
Boric acid Roth

2. Materials and Methods
26
Bradford reagent Biorad
Bromophenol blue Merck
BSA (Solution, 35%) MP Biomedicals
BSA (Powder) Roth
Casein Bacto-Casitone Difco Laboratories
Chloroform Roth
Coomassie brilliant blue R 250 Merck
Cryotubes Nunc
DAB Peroxidase substrate
(3,3’-Diaminobenzidine)
Sigma
DAPI (stock 1mg/ml) Roth
DEAE Dextran (MW: 500,000) Pharmacia Biotech
1,4-Diazabicyclo 2,2,2octane (DABCO) Merck
Dimethylsulfoxid (DMSO) Sigma
Di-Sodium hydrogen phosphate anhydrous (Na2HPO4) Merck
1,4-Dithiothreit (C4H10O2S2) (DTT) Roth
DNA loading buffer (6x) PeqLab
Electro cuvette Biorad
Eppendorf tube Eppendorf
Ethanol (absolute) Roth
Ethidium bromide Roche
Ethylenediamine tetraacetic acid (EDTA) Fluka
Extract of yeast powder Merck
Falcon centrifuge tube Falcon
Formamid Fluke
Glycerol Sigma
Glycine Roth
Hydrochloride (HCl) Roth
Isoamyl alcohol Roth
Isopropanol Roth
Kodak® BioMax™ MS film (20cm×25 cm) Sigma
Leupeptin Sigma
Lipofectamine and Plus Reagent Invitrogen
Lipofectamine 2000 Invitrogen

2. Materials and Methods
27
Magnesium chloride (MgCl2) Merck
Methylcellulose (methocel MC) Sigma
Microtiter plate (96 wells) Greiner
Mowiol 40 - 88 Aldrich
Methanol Roth
N-2-hydroxyethylpiperazine (HEPES) Sigma
Oxoid Agar Oxoid
Paraformaldehyde (PFA) Merck
Pefablock Roth
Peptone from meat trypsin-digested Merck
Potassium chloride (KCl) Roth
Polystyrene round-bottom tube (5ml) Becton Dickinson
Precision Plus Protein Standards (All Blue) BioRad
Potassium dihydrogen phosphate (KH2PO4) Roth
Propidium Iodide Sigma
PVDF-Membrane Immobilon-P transfer membrane Millipore
Quartz crystal cuvette Hellma GmbH
Rainbow marker Amersham
Re-Blot Plus – strong antibody stripping solution Chemicon
Roti-Free, ready-to-use Stripping Buffer Roth
Röntgenfilme BioMax MR Kodak
Roti-phenol Roth
RPMI 1640 Invitrogen
Roti-phenol/ chloroform Roth
SOC medium Invitrogen
Scientific Imaging film BioMax MR Kodak
Sodium chloride (NaCl) Roth
Sodium dodecyl sulfate (SDS) Merck
Sodium-β-glycerophosphate Sigma
Sodium hydroxide (NaOH) Merck
Sodium hydrogen carbonate (NaHCO3) Fluka
Sodium orthovanadate Sigma
Sodium pyrophosphate Sigma
TEMED (N,N,N',N'-Tetramethyl-ethylene diamine) Serva

2. Materials and Methods
28
TLC plates (20 x 20 cm Silica gel 60) Merck
Trypsin-EDTA (10×) PAA Laboratories GmbH
Tris HCl Roth
Triton X-100 (t-Octylphenoxypolyethoxyethanol) Sigma
Trizol Reagent Invitrogen
Tween 20 Roth
Urea Sigma
Whatman 3MM Papier Schleicher & Schüll
Xylene cyanole Sigma
2.1.3. Monoclonal and polyclonal antibodies
Antibody Company Dilution
Anti-P-ERK (E-4) mouse monoclonal IgG Santa Cruz Biotechnology 1:250
Anti-ERK2 (C-14) mouse monoclonal IgG Santa Cruz Biotechnology 1:500
HRP conjugated goat anti-mouse IgG Santa Cruz Biotechnology 1:1000
Anti-flu A NP (FPV) mouse (clone 1331) Biozol–Biodesign Internat. 1:6000
Anti-influenza A FPV/Rostock/34 rabbit
polyclonal serum
Marburg 1:1000
Texas Red conjugated rabbit anti-mouse Dianova 1:200
2.1.4. Materials for cell culture
Chicken Serum Sigma Aldrich
Dulbecco's Modified Eagle's medium (DMEM) Invitrogen/Gibco
Fetal calf serum (FCS) PAN
L-Glutamine 100× (200mM, 29.2 mg/ml in 0.85%
NaCl)
Invitrogen
Penicillin/Streptomycin, 100× liquid (Contains 10,000
units of penicillin (base) and 10,000 µg of
streptomycin (base)/ml utilizing penicillin G (sodium
salt) and Streptomycin sulfate in 0.85% saline.)
PAA
Trypsin-EDTA (10x) PAA
Tissue culture dish Becton Dickinson
Tissue culture flask NUNC

2. Materials and Methods
29
Tryptose Phosphate Broth Sigma Aldrich
Bovine Albumin 30% PAA
2.1.5. Enzymes
AccuPrime Pfx DNA Polymerase Invitrogen
GoTaq flexi DNA polymerase Promega
PlatinumR Pfx DNA polymerase Invitrogen
SuperScript TM III reverse transcriptase Invitrogen
T4 polynuleotide kinase (10,000 units/ml) NEB
Restriction endonucleases NEB
RQ1 RNase free DNase Promega
2.1.6. Kits
AEC staining kit Sigma
Anti-human IFN beta ELISA kit BioSource/Invitrogen
ECL (enhanced chemiluminescence) solution kit Amersham/GE
High pure PCR product purification kit Roche
In situ cell death detection kit, fluorescein Roche
NucleoPond Xtra Maxi kit for DNA plasmids prep Macherey-Nagel
pcDNATM 3.1 directional TOPO expression Kit Invitrogen
QIAprep Spin Miniprep Kit (250) Qiagen
QIAamp Viral RNA Mini Kit (250) Qiagen
Qiagen plasmid maxi kit Qiagen
Rapid DNA ligation kit Roche
TOPO XL PCR cloning kit Invitrogen
Lifpofectamine 2000 Invitrogen
Lifpofectamine TM Invitrogen
2.1.7. E. coli strain, recombinant viruses and cell lines
E. coli strain
XL1-Blue Stratagene
TOP 10 Invitrogen

2. Materials and Methods
30
Recombinant influenza viruses
A/FPV/Rostock/34 (H7N1) (FPV wt) Rescued at the Institute of
Virology, Giessen
FPV NS GD Rescued at the Institute of
Virology, Giessen
FPV NS VN Rescued at the Institute of
Virology, Giessen
FPV NS Ma Rescued at the Institute of
Virology, Giessen
Cell line
A549 (Human Alveoar Epithelial cells) Cell-collection the Institute of
Virology Giessen
MDCK-II (Madin-Darby canine kidney cells) Cell-collection the Institute of
Virology Giessen
Vero (African Green Monkey cells) Cell-collection the Institute of
Virology Giessen
293T (Human embryonic kidney cells) Cell-collection the Institute of
Virology Giessen
QT6 (quail fibroblast cells) Kind gift from the Institute for
Virology, Marburg
LMH (chicken hepatocellular carcinoma cells) Kind gift from the Institute for
Virology, Marburg
Mice primary aveleoar epithelial cells Isolated the Institute of Virology
Giessen
2.1.8. Plasmids
pPolI-FPV -PB1 (A/FPV/Rostock/34 (H7N1)) Kind gift from the Institute for
Virology, Marburg
pPolI-FPV -PB2 (A/FPV/Rostock/34 (H7N1)) Kind gift from the Institute for
Virology, Marburg
pPolI-FPV -PA (A/FPV/Rostock/34 (H7N1)) Kind gift from the Institute for
Virology, Marburg

2. Materials and Methods
31
pPolI-NP (A/FPV/Rostock/34 (H7N1)) Kind gift from the Institute for
Virology, Marburg
pPolI-FPV -HA (A/FPV/Rostock/34 (H7N1)) Kind gift from the Institute for
Virology, Marburg
pPolI-FPV -NA (A/FPV/Rostock/34 (H7N1)) Kind gift from the Institute for
Virology, Marburg
pPolI-FPV -M (A/FPV/Rostock/34 (H7N1)) Kind gift from the Institute for
Virology, Marburg
pPolI-FPV-NS (A/FPV/Rostock/34 (H7N1)) Kind gift from the Institute for
Virology, Marburg
pCI-GD-NS (A/Goose/Guangdong/1/96 (H5N1)) Kind gift from the Institute for
Virology, Marburg
pPolI-VN-NS (A/Vietnam/1203/2004 ( H5N1)) Kind gift from RKI, Berlin
pPolI-Ma-NS (A/Mallard/NL/12/2000 (H7N3)) Kind gift from the Institute for
Virology, Helsinki
pHMG-PA (A/Puerto Rico/8/34(H1N1)) Kind gift from the Institute for
Virology, Zurich
pHMG-PB1 (A/Puerto Rico/8/34(H1N1)) Kind gift from the Institute for
Virology, Zurich
pHMG-PB2 (A/Puerto Rico/8/34(H1N1)) Kind gift from the Institute for
Virology, Zurich
pHMG-NP (A/Puerto Rico/8/34(H1N1)) Kind gift from the Institute for
Virology, Zurich
pcDNA3.0-PR8-NS1 (A/Puerto Rico/8/34(H1N1)) Kind gift from the RKI, Berlin
pPolI-GFP-RT (Human Pol promoter) Constructed in AG Pleschka,
Giessen
pPolI-CAT-RT (Human Pol promoter) Kind gift from the department of
microbiology, Mountain Saint
School of Medicine, New York
pK9-CAT(469) (Canine Pol promoter) kindly provided by MedImmune
pCI-NP (A/Goose/Guangdong/1/96 (H5N1)) Constructed at the Institute of
Virology, Giessen
pCI-PB1 (A/Goose/Guangdong/1/96 (H5N1)) Constructed at the Institute of
Virology, Giessen

2. Materials and Methods
32
pCI-PB2 (A/Goose/Guangdong/1/96 (H5N1)) Constructed at the Institute of
Virology, Giessen
pCI-PA (A/Goose/Guangdong/1/96 (H5N1)) Constructed at the Institute of
Virology, Giessen
pcDNA3.1-GD-NP(A/Goose/Guangdong/1/96
(H5N1))
Constructed at the Institute of
Virology, Giessen
pcDNA3.0-GD-PB1(A/Goose/Guangdong/1/96
(H5N1))
Constructed at the Institute of
Virology, Giessen
pcDNA3.0-GD-PB2(A/Goose/Guangdong/1/96
(H5N1))
Constructed at the Institute of
Virology, Giessen
pcDNA3.0-GD-PA(A/Goose/Guangdong/1/96
(H5N1))
Constructed at the Institute of
Virology, Giessen
pcDNA3.0-GD-NS1(A/Goose/Guangdong/1/96
(H5N1))
Constructed at the Institute of
Virology, Giessen
pcDNA3.0-GD-NS2(A/Goose/Guangdong/1/96
(H5N1))
Constructed at the Institute of
Virology, Giessen
pcDNA3.1-FPV-NP (A/FPV/Rostock/34 (H7N1)) Constructed at the Institute of
Virology, Giessen
pcDNA3.0-FPV-PB1(A/FPV/Rostock/34 (H7N1)) Constructed at the Institute of
Virology, Giessen
pcDNA3.0-FPV-PB2(A/FPV/Rostock/34 (H7N1)) Constructed at the Institute of
Virology, Giessen
pcDNA3.0-FPV-PA(A/FPV/Rostock/34 (H7N1))
Constructed at the Institute of
Virology, Giessen
pcDNA3.0-FPV-NS1(A/FPV/Rostock/34 (H7N1)) Constructed at the Institute of
Virology, Giessen
pcDNA3.0-FPV-NS2(A/FPV/Rostock/34 (H7N1)) Constructed at the Institute of
Virology, Giessen
pcDNA3.0-VN-NS1 (A/Vietnam/1203/2004 ( H5N1)) Constructed at the Institute of
Virology, Giessen
pcDNA3.0-VN-NS2 (A/Vietnam/1203/2004 ( H5N1)) Constructed at the Institute of
Virology, Giessen
pcDNA3.0-Ma-NS1 (A/Mallard/NL/12/2000 (H7N3)) Constructed at the Institute of

2. Materials and Methods
33
Virology, Giessen
pcDNA3.0-Ma-NS2 (A/Mallard/NL/12/2000 (H7N3)) Constructed at the Institute of
Virology, Giessen
2.1.9. Media and gels
Avicel Medium (100ml)
10ml 10x MEM
33ml ddH2O
1ml Penicillin/Strepromycin liquid (100x)
1ml BSA (Solution, 35%)
50ml Avicell Stock (2.5%)
1ml 1% DEAE-Dextran
4ml NaHCO3 (7.5%)
Avicel Stock (2.5%)
5g Avicel-Powder
200ml ddH2O
autoclaved
Cell culture medium for LMH cells (500ml)
440ml RPMI 1640
5ml Penicillin/Strepromycin liquid (100x)
5ml L-Glutamin
40ml FCS
10ml chicken Serum
Cell culture medium for QT6 cells (500ml)
425ml HAM's-F10 media
5ml Penicillin/Strepromycin liquid (100x)
5ml L-Glutamine
50ml Fetal Calf Serum (FCS)
5ml Chicken Serum
10ml Tryptose Phosphate Broth

2. Materials and Methods
34
DEAE Dextran (1%)
1g Dextran
Dissolve in 100ml dH2O
Autoclave it
Cell fixing buffer (100ml)
95ml PBS++
4ml 37% Formaldehyde (PFA)
1ml Triton X-100 (t-Octylphenoxypolyethoxyethanol)
DMEM/10% FCS/P/S (complete DMEM 0.5L)
445ml DMEM
50ml FCS (heat inactivated)
5ml Penicillin/Strepromycin liquid (100x)
DMEM/BA (0.5L)
492ml DMEM
5ml penicillin/streptomycin (100x)
3ml Bovine Albumin (BA) (35%)
Dulbecco´s Modified Eagle Medium (DMEM 10L)
1x DMEM powder high glucose
37 g/10 L bicarbonate
100ml/10 L sodium pyruvate
100ml/10 L penicillin/streptomycin, liquid (100x)
sterile filtered
Luri-Broth (LB) medium
0.5% (w/v) Extract of yeast powder
1% (w/v) Peptone from meat trypsin-digested
1% (w/v) NaCl
adjust pH to 7.5 with NaOH and total volume to 1 L

2. Materials and Methods
35
with ddH2O, autoclaved
for plates, add 1.5% (w/v) agar high-gel strength,
autoclaved
Methyl cellulose media, 1.5% stock (100ml) for Foci
assay
50ml methyl cellulose stock (3%)
1ml Penicillin/Strepromycin liquid (100x)
1ml BA (30%)
10ml MEM (10x)
4ml NaHCO3 (7.5%)
1ml DEAE Dextran (MW: 500,000) (1%)
33ml ddH2O
mix well and store at 4°C
Methyl cellulose stock (3%)
500ml ion free water was preheated with microwave to boiled, slowly add 15g Methyl
cellulose power into water and until the liquid become evenly suspension solution, then the
liquid was distributed into different bottle (100ml/bottle). Afterwards the bottles were
placed at 4°C for overnight and then autoclaved it. The bottles were placed at 4°C for anther
3 days, during incubation, the bottles were up and down placed for several times until no big
clots were seen.
Mowiol DABCO
2.4 g Mowiol
6 g Glycerol
6ml ddH2O
Mixed thoroughly over night. Next day add 12ml 0.2 M Tris-HCl (pH 8.5) and incubated at
50°C for 30 min. Centrifuge the viscous mixture at 12000 g (Megafuge 1.0R, 6000 rpm) at
room temperature for 15 min, and mix the supernatant with 2.5% DABCO.
Plaque assay agar mixture (50ml)
8,5ml ddH2O
25ml 2x DMEM/BA

2. Materials and Methods
36
0,5ml 1% DEAE-Dextran (MW: 500,000)
1ml 5% NaHCO3
15ml 3% Oxoid agar
SDS-PAGE stacking gel
2,9ml ddH2O
1,25ml Tris HCl, pH 6.8 (0.5 M)
50 μl SDS (10%)
750 μl polyacrylamide (PAA) (30%)
50 μl APS (10%)
4 μl TEMED
SDS-PAGE resolving gel (10%)
4ml ddH2O
2,5ml Tris HCl, pH 8.8 (1.5 M)
100 μl SDS (10%)
3,3ml polyacrylamide (PAA) (30%)
50 μl APS (10%)
6 μl TEMED
2x TY medium
16 g Bacto-trypton
10 g Bacto-yeast extract
5 g NaCl
adjust pH to 7.4 with NaOH and total volume to 1 L
with ddH2O, autoclaved
for plates, add 15 g Bacto-agar
6%, 7M urea polyacrylamide gel
21g urea
5ml 10X TBE
7.5ml 40% acrylamide
Fill up the tube to 50ml with sterile water
0.5ml 10% APS

2. Materials and Methods
37
0.05ml TEMED
2.1.10. Buffers and solutions
100x Ca2+/Mg2+ solution (100ml)
1 g MgCl2
1.32 g CaCl2
ddH2O added up to 100ml
autoclaved, then filtered with the 0.2µm filter column
Acetate buffer (SC AEC)
(50mM) 7.708g Ammoniumacetat powder (M=77.08)
(8.8mM) 534µl 30% H2O2 (Roth)
1950ml dH2O
set pH to 5.0
set total volume to 2000ml with dH2O
AEC-staining-solution
4ml dH2O
2 drops Acetate-buffer
1 drop substrate
1 drop 3% H2O2
DEPC (diethylpyrocarbonate) H2O
Prepare 0.1% DEPC solution with millipore water,
Let it sit at room temperature or more at 37ºC for 12h.
Then autoclave it for 60 min to inactivate the DEPC.
Check it by smelling to make sure that DEPC has
evaporated.
Phosphate-Buffered Saline (10x PBS) (1L)
0.137 M NaCl
0.27 mM KCl
8.1 mM Na2HPO4

2. Materials and Methods
38
1.47 mM KH2PO4
adjust total volume to 1 L with ddH2O, autoclaved
1x PBS++ buffer (0,5L)
495ml 1x PBS (autoclaved)
5ml Ca2+/Mg2+ solution (100x)
PBS/Ca2+/Mg2+/BA/antibiotic (200ml)
20ml 10x PBS (see above)
174.8 ml ddH2O (sterile)
2ml Penicillin/Strepromycin liquid (100x)
1.2ml BSA (35%)
2ml Ca2+/Mg2+ (100x)
SDS-PAGE loading buffer (2x) (Laemmli Buffer)
100 mM Tris-HCl, pH 6.8
200 mM DTT (dithiothreitol)
4% SDS
20% glycerol
0.2% bromophenol blue
SDS-PAGE running buffer (5x) (1L)
1 g SDS
6 g Tris HCl
28.8 g glycin
adjust total volume to 1 L with ddH2O
SDS-PAGE transfer buffer (1L)
5.8 g Tris HCl
2.9 g glycin
0.17 g SDS
200ml methanol
adjust total volume to 1 L with ddH2O

2. Materials and Methods
39
Tris-Acetate-EDTA (50x TAE)
2 M Tris HCl
1 M acetid acid
0.1 M EDTA
adjust total volume to 1 L with ddH2O
TLB buffer
20 mM Tris HCl, pH 7.4
137 mM NaCl
10% (v/v) glycerol
1% (v/v) Triton X-100
2 mM EDTA
50 mM sodium-β-glycerophosphate
20 mM sodiumpyrophosphate
(Addition of inhibitors for lysis buffer, see below)
Lysis buffer (10ml)
10ml TLB buffer (see TLB buffer)
10 μl Pefablock (200 mM)
10 μl Aprotinin (5 mg/ml)
10 μl Leupeptin (5 mg/ml)
100 μl Sodium orthovanadate (100 mM)
50 μl Benzamidine (1 M)
3x DNA loading buffer, formamide mix
9ml Formamid p.a. (Fluka)
1ml 100mM EDTA
½ sparula Xylene cyanole
½ sparula bromphenole blue
mix, alliquot and freeze away
Tris-Buffered Saline (10x TBS) (1L)
24.2 g Tris HCl
80 g NaCl

2. Materials and Methods
40
dissolve by adding 900ml ddH2O
adjust pH to 7.6 and total volume to 1 L with ddH2O
TBS/Tween (0.05%) (1x TBS-T) (1L)
100ml 10x TBS
900ml ddH2O
0.5ml Tween 20
Blocking buffer and antibody diluting solution
5% (w/v) nonfat dry milk
in 1x TBS-T (see above)
Coomassie brilliant blue solution (100ml)
0.25 g Coomassie brilliant blue R 250
90ml Methanol /H2O (v/v, 1:1)
10ml acetic acid (10% (v/v))
Filtered with normal filter paper.

2. Materials and Methods
41
2.2. Methods
2.2.1. DNA cloning and sub cloning
2.2.1.1. Preparation of competent cells for electroporation
10 l glycerol stock of Escherichia coli XL1-Blue (or DH5α) strain was transferred into 10 ml
LB medium. Cells were grown overnight at 37C on the incubator shaker with moderate
shaking (200 rpm). 10ml overnight culture was transferred into 1 L LB medium. Cells were
grown for additional 3-4 hours at 37C until the OD595 reached 0.5-0.8. After cooling down on
ice for 30 min, cells were transferred into four sterile 250ml centrifugation tubes and pelleted
by centrifugation for 10 min at 10,000 rpm (Biofuge 13, 16,000 g), 4C. Then cells were
sequentially resuspended in 500ml of chilled 1 mM HEPES (pH 7.0), pelleted again by
centrifugation and resuspended in 250ml of chilled 1 mM HEPES (pH 7.0), pelleted by
centrifugation again as above. The cells were resuspended in 50ml chilled 10% glycerol in
ddH2O, centrifuged again as above and resuspended in 2.5-3ml 10% (v/v) glycerol.
Competent cells were aliquoted in 100 l on ice. The tubes containing the competent cells
were placed into fluid nitrogen to be frozen, and then stocked immediately at -70C.
2.2.1.2. Electroporation
This should be prepared before performing electroporation:
Chilled sterile electro cuvette
1ml sterile SOC medium in an eppendorf tube
Thaw competent cells rapidly on ice
Transformation equipment setting:
Ohm: 200
Capacitance: 25
Voltage: 2.5 KV
Time: time Const
10 µl of plasmid DNA (10 ng/µl) or 20 l of desalted ligation mixture was mixed in 100 l of
rapidly thawed competent cells by stirring gently with the pipette tip. Transformation mixture
was added into the chilled cuvette, then cuvette was quickly wiped and placed into the device
of the Gene Pulser. Then two red buttons were pushed simultaneously until a signal was heard
(the expected electroporation time is about 4 ms). Immediately 1ml of SOC medium was

2. Materials and Methods
42
added into the cuvette and mixed with the cells. The cells and SOC medium were removed
from the cuvette and transferred into the eppendorf tube, then incubated in the 37C water
bath for 30-45 min. If ligation mixture was transformed, the cells and SOC medium mixture
was centrifuged shortly after incubation, then only 100 µl medium was kept in the eppendorf
tube, rest of supernatants were discarded. The cell pellet was resuspended in the 100 µl liquid
as mentioned and spread onto a pre-warmed LB plate containing 100 µg/ml ampicillin. The
plates were incubated overnight at 37C (plasmid transformed bacteria are selected on LB
plates with ampicillin). Afterwards one single colony was picked and inoculated in LB
medium with ampicillin and shaken overnight at 37°C. The bacteria culture was then used for
preparing plasmid DNA and frozen glycerol stocks by mixing 850 µl bacteria culture with 150
µl autoclaved 100% glycerol.
2.2.1.3. Preparation of plasmid DNA
Plasmid DNA maxi preparation was preformed using QIAprep plasmid midi or maxi kit. The
culture of bacteria containing plasmids was grown in 100ml of LB media overnight in 37°C
incubator with shaking at 200 rpm. The bacteria were collected by centrifuging the overnight
culture at 6,000 rpm (Beckman JA14, 7,500 g) and 4°C for 15 min. There after the bacterial
pellet was resuspended in 10ml of buffer P1 and 10ml buffer P2 was added. The whole
mixture was mixed gently and incubated at room temperature for 5 min. 10ml of chilled
buffer P3 was added, mixed immediately and incubated on ice for 20 min. The mixture was
centrifuged at 4,000 rpm (Megafuge 1.0R, 5,400 g) for 30 min at 4°C. The supernatant was
applied to an equilibrated QIAGEN-tip 500 and allowed to enter the resin by gravity flow.
The QIAGEN-tip was washed twice with 30ml buffer QC. DNA was eluted with 15ml buffer
QF. The DNA is precipitated by adding 0.7 volumes (10.5ml) of isopropanol and
centrifugation at 12,000 rpm (Beckman JA20, 21,000 g) for 30 min at 4°C. The resulting
pellet was washed twice with 70% ethanol and air-dried at room temperature. The pellet is
then carefully resuspended in certain volume of TE buffer depending on the size of DNA
pellet. The concentration of plasmid DNA was photometric measured and adjusted to 1 µg/µl.
The plasmid DNA can be stored at 4°C for a short time only or at -20°C over a longer period.
2.2.1.4. Measurement of plasmid DNA concentration
The DNA concentration is determined by using a DNA photometer (GeneQuant II) at
wavelength of 260 nm. The absorption of 1 at 260 nm corresponds to a concentration of 50
µg/ml double stranded DNA. First of all an appropriate DNA dilution (normally 1:100) was

2. Materials and Methods
43
made, transferred into a quartz crystal cuvette and placed into the photometer, which has been
calibrated before to the solvent (either H2O or TE buffer). The desired OD should lie between
0.2 and 0.4 to ensure correct measurement.
2.2.1.5. Restriction endonuclease digestion
Digestion of DNA with restriction endonuclease was performed by pipetting DNA sample,
10x restriction buffer, restriction enzyme, and distilled and deionized water (ddH2O) in a
1.5ml eppendorf tube. The reaction mixture was incubated at the recommended temperature
(usually at 37°C). Normally 1 or 5 Units of restriction enzyme were used to digest 1 g DNA.
2.2.1.6. Agarose gel electrophoresis
The agarose (1-3%) was melted in 1X TAE buffer using a microwave oven, and cooled to
about 55oC. Before the gel was poured into a casting platform, ethidium bromide (4 µl of 10
mg/ml in 100ml solved agarose) was added. DNA samples were mixed with appropriate
amount of 6x loading buffer before loaded into the wells. Normally, the gel was run with 100-
120 V and 300-400 mA. DNA was visualized by placing gel on a UV light source and picture
was photographed directly by a photo system.
2.2.1.7. Preparation of DNA fragments
DNA bands were excised from gel and subsequently purified with a High pure PCR product
purification kit (Roche). The preparation was performed according to the manufacturer’s
instruction. After purification, 5 l of the purified DNA was run on agarose gel for determing
the DNA amount for ligation.
2.2.1.8. Ligation
Ligations were done with a rapid DNA ligation kit (Roche). Each 4 µl of linearized vector
DNA and purified DNA fragment were used. The exact operation was performed according to
the manufacturer’s instruction. The ligation products were purified with high pure PCR
product purification kit according to the manufacturer’s instruction, before they were used for
electroporation.
2.2.1.9. TOPO directional cloning
2.2.1.9.1. PCR to produce Blunt-End Products
PCR reaction mixture in 50 µl voloume:

2. Materials and Methods
44
Template (10 ng/µl) 1.0 µl
forward primer (10 pmol/µl) 3.0 µl
backward primer (10 pmol/µl) 3.0 µl
10×Pfx Amplification Buffer 11.25 µl
10 mM dNTP mixture 1.0 µl
50 mM MgSO4 1.0 µl
Platinum® Pfx DNA Polymerase (2.5 U/µl, Invitrogen) 1.0 µl
ddH2O to 50 µl
The mixture was denatured for 2 min at 94°C. 25-35 cycles of PCR amplification was perform
as follows:
Denaturation 15 s 95oC
Annealing 30 s 55oC
Extension 2 min 68°C for 1 min per kb
Final extension 10 min 68oC
Cool down to 4oC, Samples can be stored at -20°C until use.
2.2.1.9.2. Cloning of the PCR fragments into pcDNA™3.1 directional TOPO®
expression vector
The principle for the directional TOPO expression vector is shown in the Fig 2.1 (adapted
from the Invitrogen kits description.

2. Materials and Methods
45
Fig 2.1: Directional TOPO cloning: In this system, PCR products are directionally cloned by adding four bases
to the forward primer (CACC). The overhang in the cloning vector (GTGG) invades the 5′end of the PCR
product, anneals to the added bases, and stabilizes the PCR product in the correct orientation. Inserts can be
cloned in the correct orientation with efficiencies equal to or greater than 90%. (modified from invitrogen
directional ROPO cloning kit description)
A 0.5:1 to 2:1 molar ratio of PCR product:TOPO vector was set up in cloning reaction as
followed:
Fresh purified PCR product 4.0 µl
Diluted 6×Salt solution 1.0 µl
TOPO vector 1.0 µl
The final volume of mixture is 6.0 µl and the mixture was incubated at room temperature for 5
min (if the cloning fragments is more than 1kb, incubation time can be varied from 5min to
30min). Afterwards electroporation was performed. Positive clones were detected after
plasmid DNA isolation and restriction analysis.

2. Materials and Methods
46
2.2.3. Working with cell cultures
2.2.2. Maintenance of cell culture
2.2.2.1 Maintenance of mammalian and avian cell culture
MDCK (Mardin-Darby canine kidney cells), A549 (Human Alveoar Epithelial cells), Vero
(African Green Monkey cells) and 293T (Human embryonic kidney cells) are maintained in
Dulbecco modified Eagles medium (DMEM) containing phenol red as a pH-indicator,
supplemented with 10% heat inactivated fetal calf serum (FCS) and P/S. The cells are
incubated at 37°C with 5% CO2 and 95% humidity. They are routinely cultured to a 100%
confluence and than passaged according to the need.
QT6 (quail fibroblast cells) were maintained in HAM's-F10 media containing 1% L-
Glutamine, supplemented with 8% heat inactivated fetal calf serum (FCS), 2% Chicken
Serum, 2% Tryptose phosphate broth and P/S LMH (chicken hepatocellular carcinoma cells)
were maintained in RPMI 1640 containing 1% L-Glutamine, supplemented with 8% heat
inactivated fetal calf serum (FCS), 2% Chicken Serum and P/S. The cells are incubated at
37°C with 5% CO2 and 95% humidity. They are routinely cultured to a 100% confluence and
than passaged according to the need.
2.2.2.2. Mice primary cell isolation and maintainance
Mice primary alveolar epithelial cells (AECs) were isolated as previously described (Corti et
al., Am J Respir Cell Mol Biol, 1996) but with some modifications. C57BL/6 mice were
euthanised by an overdose of isoflurane and exsanguinated by cutting the inferior vena cava.
Lungs were then perfused with 20ml of sterile HBSS via the right ventricle until they were
clean of blood. A shortened 21-gauge cannula was then firmly fixed to the exposed trachea
through a small incision performed on the trachea. 1.5ml of sterile dispase (enzyme used for
digestion) was then applied through the needle into the lungs followed by 500 µl of sterile 1%
low melting agarose in PBS (37oC). After 2 min of incubation, the lungs were removed into a
15ml tube containing 2ml of dispase and allowed to incubate for a further 40 min at RT. The
lungs were then placed in a culture dish containing DMEM/2.5% HEPES buffer/0.01%
DNase (also enzyme used for digestion), and the tissue was carefully dissected from the
airways and large vessels. The cell suspension was successively filtered (first through a 100
µM then through 40µM mesh filter membranes and finally through a 20 µM filter paper) to
obtain a single cell suspension and resuspended in 10ml of complete DMEM media. The cells
were then incubated with biotinylated rat anti-mouse CD16/32 and rat anti-mouse CD45
mAbs (specific leukocyte antibodies) for 30 min at 37oC. After this period, cells were washed
2. Materials and Methods
47
and incubated with streptavidin-linked MagneSphere Paramagnetic Particles for 30 min at RT
with gentle rocking, followed by magnetic separation of contaminating leukocytes for 15 min.
The purity of freshly isolated mice primary alveolar epithelial cells (AECs) in the supernatant
was always >90% (assessed by trypan blue dye exclusion). Cells were then seeded on 24-well
cell culture plates at a density of 4x10⁵ cells/well and grown to 90% confluence for 2 days
with complete DMEM media. On day 2 cells were washed and serum starved with 0.2% FCS
and left until day 3, upon which they were submitted to virus infection, as described above.
2.2.2.3. Storage of cell cultures
For freezing; cells were washed with 1x PBS and 5ml of 1x trypsin-EDTA was then added.
They were then incubated at 37°C with 5% CO2 and 95% humidity and left until cell
detachment, after which 5ml complete media was added. Cell suspensions were then
centrifuged at 350 g (Megafuge 1.0R, 1000 rpm), 4°C for 5 min. The cell pellet was gently
resuspended with 1ml freeze medium (90% complete DMEM and 10% DMSO) and
transferred into cryotubes. These were set into a styropore box and left to freeze gradually in
the -80°C freezer. The DMSO prevents ice crystal formation and allows the cells to remain
intact. After 24 hours, cells were transferred into liquid nitrogen where they can be kept for a
longer period of time.
For thawing; cells were removed from liquid nitrogen and immediately transferred into a 37°C
water bath for 5 min. Cells were then resuspended carefully and transferred into a cell culture
flask filled with 19ml of corresponding medium (such as complete DMEM for mammalian
cells). After 24h cells will have reached 100% confluency and should be passaged for further
propagation.
2.2.3. Infection of cells
The virus inoculum was prepared by adding the according amount of virus stock to a certain
volume of PBS/BA/P/S/Ca2+Mg2+ depending on the desired multiplicity of infection (97) used
for experiment. Confluent cells in 3.5 cm dishes were washed with 1x PBS++ and 200 µl of
virus inoculum was laid on top by creating bubbles in the middle of dish, to ensure a
consistent virus distribution. The cells were further incubated at room temperature for 1 hour,
after which the inoculum was removed by aspiration and 2ml of DMEM/BA media was
added. Cells were then further incubated at 37°C with 5% CO2 for the desired time points.

2. Materials and Methods
48
The calculation of moi was done as follows:
2.2.4. Preparation of cell lysates for Western blot analysis
After certain time of infection or transfection, cells were washed with cold 1x PBS++.
Thereafter another 1ml of cold 1x PBS++ was added to the cells, then they were scraped off
and transferred into eppendorf cups. Centrifuge at 13,000 rpm (Biofuge 13, 25,000 g) for 1
min and the cell pellet resuspend in 75 µl lysis buffer. The lysis was done by incubating cells
for 20-30 min on ice with vortexing every 5 min. The lysed cells were centrifuged at 13,000
rpm (Biofuge 13, 25,000 g), 4°C for 15 min. The supernatant was finally transferred into new
eppendorf cups and stored at -70°C till required.
2.2.5. DNA-transfection of eucaryotic cell cultures
2.2.5.1. Transfection of adherent 293T cells and MDCK cells
The day before transfection, 293T or MDCK cells were split 1:2 into a new flask to promote
cell growth. The next day the cells were seeded in 3.5 cm dishes to grow to approximately
90% confluence over night for the transfection. DNA and Lipofectamine 2000 mix were
prepared as follows: some amount of DNA (in µg) was diluted in OPTI-MEM reduced serum
medium (final volume is 100 µl) and mixed gently in a 5ml polystyrene round-bottom tube.
Some amount of Lifectamine 2000 (2µl of lipofectamine 2000 per µg DNA) was mixed and
diluted in OPTI-MEM (final volume is 100 µl) in another 5ml polystyrene round-bottom tube,
mixed gently and incubated not longer than 5 min at room temperature. The diluted
Lipofectamine 2000 was added to the tube containing the diluted DNA, then mixed gently and
incubated for 20 min or longer (no more than 6h) at room temperature to allow forming of the
DNA-L2000 complexes. During the complexes were formed, culture medium was washed
with 1xPBS and refreshed with 800 μl of new medium without antibiotics (DMEM+10%
FCS). The DNA-Plus-Lipofectamine Reagent complexes (total 200 µl volume) were added
dropwise into the dish containing fresh medium. The cells were incubated at 37oC at 5% CO2
for 6h. Thereafter, the media containing DNA-Plus-Lipofectamine Reagent complexes was
removed and replaced with 2 ml of complete DMEM media. The cells were further incubated
at 37oC at 5% CO2 for 24-48h.
1000 µl
Virus titer [PFU] moi x cell amount in the culture
X µl virus =

2. Materials and Methods
49
2.2.5.2. Transfection of suspended 293T cells
The day before transfection, 293T cells were split 1:2 into a new flask to promote cell growth.
On the day of transfection, confluent cells in 75 cm2 culture flask were washed with 1x PBS,
detached by 5ml Accutase I and incubated at 37°C for 15 min. During incubation time, DNA
and Lipofectamine 2000 mix were prepared as mentioned section 2.2.5.1. After cell
detachment, 5ml medium without antibiotics (DMEM with 10% FCS) was added into the
flask, the mixture was transferred into a 15 ml Falcon centrifuge tube and subsequently
centrifuged at 1,000 rpm (Megafuge 1.0R, 350 g) for 5 min. The supernatant was removed by
aspiration, then the cell pellet was resuspended by adding 7ml medium (DMEM with 10%
FCS). 800 µl of cell suspension was mixed with 200 µl of DNA-L2000 complexes and
reseeded onto 3.5 cm dishes. The cells were incubated at 37oC with 5% CO2 for 6 hours, then
1ml of media (DMEM with 10% FCS) was added. After 24h post tranfection, the media
containing DNA-L2000 complexes was replaced with 2ml of complete DMEM medium.
2.2.5.3. RNP reconstitution assay
2.2.5.3.1. Transfection of adherent cells to do CAT assay after RNP reconstitution assay
1.2µg of DNA mixture of four expression plasmids encoding the PB1, PB2, PA and NP
proteins (in the ratio of 1:1:1:2) from PR8, FPV and GD virus respectively, and 2.0 µg of
pPolI-CAT-RT (carrying the human polI-promoter), together with either empty vector pcDNA
3.0 (4.0 µg) or pcDNA-NS1 (4.0 µg) from PR8, FPV and GD virus respectively were
transfected according to section 2.2.5.1.
2.2.5.3.2. Transfection of suspension cells to do primer extension assay after RNP
reconstitution assay
1 μg of each of relevant plasmids including pcDNA-PB1, PB2, PA and NP from FPV and
pPolI-FPV-NA-RT as reporter gene, together with either empty vector pcDNA 3.0 or pcDNA-
NS1 or pcDNA-NS2 from FPV, GD, VN and Ma virus were transfected according to section
2.2.5.2. Cells were harvested 48h post transfection or at the time points indicated.
2.2.6. Chloramphenicol Acetyl Transferase ( CAT) assay
The principle for CAT assay was shown in Fig 2.2.

2. Materials and Methods
50
2.2.6.1. Preparation of cell extracts
Cells were washed with 1xPBS++ and cells were scraped in 500 μl 1xPBS++
and transferred in
new eppendorf (on ice). Cells were centrifuged at 3000 rpm in a microcentrifuge (Heraeus,
Germany) at 4°C for 1 min. Pellet was resuspended in 100 μl of 0.25M Tris-HCl (pH-7.4).
Resuspended pellet was incubated for 2 min in liquid nitrogen followed by 5 min incubation
at 37°C in water bath. This process was repeated for two more times and centrifuged at 3000
rpm for 1 min at 4°C. 100μl supernatant, which is the enzyme extract, was transferred into a
new eppendorf on ice and was used for CAT assay ((Invitrogen, USA) or was stored at -70°C.
Fig. 2.2: The principle of CAT assay: CAT, a bacterial gene to neutralize the antibiotics chloramphenicol by
acetylating the drug at one or two hydroxyl groups. Cell lysis containing CAT enzyme are simply incubated with
the fluorescent substrate and acetyl CoA at 37°C, ethyl acetate is added to terminate the reaction and to extract
the fluorescent substrate and its acetylated derivatives, which are then resolved by thin layer chromatograph
(TLC, Invitrogen). Brightly fluorescent, well-separated spots can be visualized with a hand-held UV lamp. To
quantify CAT activity, a laser scanner typoon (GE healthcare) is used.
2.2.6.2. Determination of relative protein amount
A 5 μl sample from the cell lysate was taken to measure the relative protein amount and
mixed as followed:
5 μl sample
200 μl Bio-Rad protein assay buffer
800 μl ddH2O
The relative concentration of protein was calculated by the measurement of the absorbance at
the wavelength 595 nm in a DU-70 spectrophotometer (Beckman). According to the indicated
absorbance, the protein concentration of different samples could be calculated by standcurve
%

2. Materials and Methods
51
derived from BSA standards or compared between samples by normalizing the lowest
concentration to 1.
2.2.6.3. Chloramphenicol reaction
Running chamber was set up one day before Chloramphenicol reaction. 26ml of methanol and
174ml of chloroform (13:87) was mixed for running buffer, and then running buffer was
poured into the chamber and covered with a lid for overnight to generate a stable air gas phase.
50 μl of each prediluted enzyme (1:10, 1:100 and 1:1000) extract was incubated with 20 μl
(4mM) AcCoA and 5 μl BODIPY (Invitrogen). It was mixed properly and this 75 μl reaction
mixture was incubated at 37°C for two and a half hours in a water bath. Thereafter, 500 μl of
ethyl acetate was added and mixed, the mixture was vortexed vigorously for 5 min and then
centrifuged at 13000 rpm for another 5min. Aftermath, two phases including upper ethyl
acetate layer (450 μl) and lower water layer were created. Ethyl acetate layer was transferred
into new eppendorf (with holes made in the lid) and were dried with speed vac machine
(Savant) for 25min.
2.2.6.4. Loading samples on TLC plate
The dried pellet was dissolved with 20 μl ethyl acetate and was loaded in the form of little
dots on TLC plate with the help of air supply. Air supply helps minimizing spread of ethyl
acetate on TLC plate during sample loading. TLC plate was placed a little higher than the
level of pre-equilibrated running buffer in an inclined position. The spots were migrated up by
capillary action until the solvent reached the top of the TLC sheet (around 30min). Then it
was stopped and allowed to dry. Later, the products (acetylated chloramphenicol) and the
unacetylated substrate were visualized as a light green color spot on the chromatogram in UV-
light (as Fig. 2.3.). The plates were scanned by Typhoon 9200 (GE Healthcare) and the spots
were quantified and calculated (as Fig. 2.3.) by GenQuant software (GE Healthcare).
2.2.7. Generation, amplification and purification of NS reassortants of H7-type highly
pathogenic avian influenza virus
293T cells in 35 mm diameter dishes were transfected with 12 plasmids (5 μg DNA in total)
according to section 2.2.5.1. For the generation of wt FPV, 1.2 μl (1μg/μl) of the protein
expression plasmids (pHMG-PB1, pHMG-PB2, pHMG-PA and pHMG-NP) were transfected
in a ratio of 1:1:1:2 along with 3.8 μl (1μg/μl) of the polI plasmids (pPolI-FPV-PB1, FPV-
PB2, FPV-PA, FPV-NP, FPV-HA, FPV-NA, FPV-M and FPV-NS) in a ratio of

2. Materials and Methods
52
1:1:1:1:2:2:1:1. To generate the reassortant viruses carrying different NS segments (GD-NS,
VN-NS and Ma-NS), the pPolI-NS FPV plasmid was substituted by the polI-NS plasmids of
GD, VN or Ma.
At 24 h after transfection, the transfection mixture was removed and the cells were incubated
with 8ml of fresh medium, which was replaced daily for 4 days. The harvested medium from
transfected dishes was screened for rescued influenza virus by observation of liquid CPE and
plaque assay on MDCK cells according to the section 2.2.8.1. The progeny viruses were
amplified on MDCK cells in 75mm flask and continued for 3 round of Plaque purification
according to section 2.2.8.1 to purify the viruses. The purified viruses were then amplified and
titrated on MDCK cells by Foci assay according to section 2.2.8.2 and stored at -70°C. The
generation of all viruses was carried out using biosafety level 3 procedures.
2.2.8. Analysis of infectious virus titers
2.2.8.1. Standard plaque assay
MDCK cells were seeded on 3.5 cm dishes one day before and grew to 100% confluency. The
cells were washed once with 1x PBS++, then 100 µl of virus dilution was laid on the cells. The
cells were incubated at RT for 1h. During the incubation, 2% Oxoid agar was melted and
incubated alongside at 42oC in a water bath. DMEM/BA medium was also incubated in a
37oC water bath. After one hour, the inoculum was removed from the dishes, 2% oxoid agar
was mixed with DMEM/BA (and the other solutions, as describe in section 2.1.9.). 2ml
mixture was given immediately to every plate using a sterile plastic pipette. When the agar
became solid, the dishes were inversely laid in a 37oC, 5% CO2 humidified incubator.
Depending on the virus type, normally after 2 or 3 days plaques were seen on the dishes. Then
the agar was removed from the dishes with a spatula. Cells were stained with coomassie
brilliant blue (1ml/3.5 cm plate) at room temperature for 5 min, and then the plates were
washed gently with tab water. Plaques were counted at different dilutions and the total amount
of plaques was calculated by the following formula:
PFU/ml number of plaques volume factor dilution factor
Volume factor: PFU (Plaque forming unit) is related to 1ml. If a dish was infected with 100 µl
viral dilution solution, the factor is 10.
2.2.8.2. Immunohistochemistry (MC Foci assay)
Virus dilutions were made in the 96 well microtiter plates with U-form bottom. First 180 µl of
virus dilution solution was pipetted into each well and 20 µl of the virus stock was added into
the wells of the first row. The virus dilution (200 µl) was mixed by up and down pipetting and

2. Materials and Methods
53
20 µl of it was transferred into wells of the second row. The same steps were repeated up to
the last row to get 10-1 to 10-8 dilution series.
MDCK cells were seeded in 96-well plates and grown over night at 37°C with 5% CO2 so that
they were 90% confluent on the day of infection. The cells were washed once with 1x PBS++,
then infected with 50µl of virus dilution and incubated at room temperature for 1 hour. Virus
inoculum was aspirated and 150µl methylcellulose media was added into each well. The plate
was placed at 37°C with 5% CO2 for 30 or 48 hours depending on the virus strain. After the
incubation, methylcellulose media was removed by aspiration. Cells were washed twice with
1x PBS++ and fixed, as well as permeabilized, with 330µl/well of 4% PFA/1% TritonX-100 in
1x PBS++ overnight at 4°C or alternatively for 1 hour at RT. Afterwards cells were washed
and three times with 1x PBS/0.05% Tween20 and incubated with 50 µl of primary antibody
(anti NP-mAb, 1:6000 diluted in PBS++/3% BSA) for 1h at room temperature. After aspirating
the primary antibody dilution, cells were again washed three times with PBS/0.05% Tween20,
followed by secondary antibody incubation (Horse Radish Peroxidase (HRP)-conjugated anti
mouse, 1:1000 diluted in PBS++/3% BSA) for 45 min at room temperature. Cells were washed
40 µl of AEC staining kit solution (section 2.1.10) was used and was added into each well and
placed at room temperature for 30-60 min. The AEC (3-Amino-9-ethylcarbazole) Staining Kit
is used for staining peroxidase labelled compounds in immunohistochemistry or
immunoblotting techniques. AEC produces an insoluble end product which has a red colour.
Red stained foci were observed under microscope, wells were washed with normal water to
remove the rest of salts and air dried at room temperature. After drying, the plates were
scanned using the Canonscan 9900F (Canon) at 1600 dpi and virus foci counted. The viral
titre was determined as follows:
FFU/ml = number of foci x volume factor x dilution factor
Volume factor: FFU (Foci forming unit) is related to 1ml. If a dish was infected with 50 μl
viral dilution solution, the factor is 20.
One foci was considered when more than 3-5 adjacent cells were stained in one particular
area, as opposed to single cell staining which would probably mean, that the cell had not
produced an infectious virus.
2.2.8.3. Immunohistochemistry (Avicel Foci assay)
Compared to MC foci assay with 150µl methylcellulose media., the incubation time for the
foci forming was shorten to 20-30h in avicel foci assay with 150 μl 1.2% Avicel medium

2. Materials and Methods
54
overlay because low viscousity Avicel allowed higher mobility of virus particles. The rest of
the procedure was the same as in section 2.2.8.2.
2.2.9. Haemagglutination (HA)
Red blood cells should be taken from Specific Pathogen Free (SPF) chickens. If SPF chickens
are not available, blood may be taken from normal chickens that are shown to be free from
antibodies to avian influenza viruses. Firstly about 20-30ml fresh chicken blood was
transferred to a 50ml sterilized falcon centrifugation tube containing 10ml of 3.7% sodium
citric acid. The RBCs was washed by filling the tube to 50ml with cooled PBS++ and
centrifuged at 1,500 rpm (Megafuge 1.0R, 700 g) at 4oC for 10 min. The supernatant above
the RBC-fraction containing serum, white blood cells and fat was carefully removed by
aspiration, and then RBCs pellet was washed again with cooled PBS++ and centrifuged as
mentioned above. This washing step was repeated twice. Finally the pellet of RBCs was
diluted to 0.5% (v/v) with cooled PBS++ for haemagglutination assay.
50 µl PBS++ was dispensed into each well of a plastic V-bottomed microtitre plate (96 wells),
then 50 µl virus suspension (for example, cell culture supernatant) was placed in the first well.
Two-fold dilutions of 50 µl volumes of the virus suspension were made from well #1-#12 in
each row (left to right), subsequently 50 µl of 0.5% chicken RBCs was dispensed to each
well. The mixture of every well was mixed by tapping the plate gently and then the RBCs
were allowed to settle for about 30-60 min at 4oC. The Haemagglutinating Units (HAU) are:
2x, where X is the number of the last well without tear-shaped streaming.
2.2.10. Confocal laser scanning microscopy and immunofluorescence assay (IFA)
Confluent cells were trypsinized by 1x trypsin-EDTA, reseeded in the 3.5 cm dish containing
sterile glass cover-slips (12 mm) and incubated at 37°C with 5% CO2. On the next day, the
cells were confluent. After infection or transfection, the growth medium was removed from
the culture dish at the indicated time points, and the cells were washed once with 1x PBS++,
then the cells were fixed with 1ml 4% PFA in 1x PBS++ over night at 4°C. After fixation, cells
were washed twice with 1x PBS++ and subsequently incubated with 1ml 1% Triton X-100 for
45 min. Cells were then washed 3 x with PBS and incubated with 20 µl of the primary mouse
anti-Flu A NP mouse (clone 1331) (1:200 dilution in PBS++/3% BSA) or Rabbit anti-GST-
NS1 polyclonal antibody (1:1000 in PBS/3% bovine serum albumin), kindly provided by T.
Wolff, (Berlin, Germany) for each cover-slip for 1 hour at room temperature. Afterwards cells
were washed three times as before, and further incubated with 20 µl of the secondary

2. Materials and Methods
55
TexasRed-labeled goat anti-mouse IgG (1:200 diluted in PBS++/3% BSA) or goat anti-rabbit
IgG (1:200 diluted in PBS++/3% BSA) for 1 hour at room temperature. The cells were then
washed again three times and incubated with 20 µl DAPI (10mg/ml in PBS/3% bovine serum
albumin, Roth) for 5 minutes. After a further three washes (as above) and an extra wash with
ddH2O, the glass cover slip was fixed on a glass slide with Mowiol/DABCO overnight.
Fluorescence was visualised using a TCS-SP5 confocal laser-scanning microscope (Leica).
2.2.11. “In cell” western blot
Confluent MDCK cells in 96-well plates were infected with 50 μl of the different recombinant
viruses at an MOI of 1. After 1h the virus innoculum was removed and 150µl DMEM/BA/P/S
was added and the cells were incubated at 37°C with 5% CO2. At 2h, 4h, 6h and 8h p.i., the
cells were washed with 1×PBS and fixed with 330 µl/well of 4% PFA for 20 min,
permeabilized by washing four times for 5 min each with 150 µl/well of 1% Triton X-100,
and blocked with 5 ml PBS–5% nonfat dried milk. To detect NS1, NP, and extracellular
signal-regulated kinase 2 (ERK2; loading control) cells were incubated for 2h at room
temperature on a shaker with a first antibody, which was either polyclonal rabbit anti-NS1
serum (anti-GST-NS1 9101 at 1:1,000; GST is glutathione S-transferase; T. Wolff), mouse
anti-NP MAb (1:5,000; Abcam), mouse anti-ERK2 MAb (1:100; Santa Cruz), or polyclonal
rabbit anti-ERK2 (1:100; Santa Cruz) serum diluted in PBS, 5% nonfat dried milk, 0.2%
Tween-20. Thereafter, cells were washed four times for 5 min each with Tween washing
solution (PBS, 0.5% Tween-20) and incubated for 1 h at room temperature in the dark with a
second antibody (goat anti-rabbit IRDye 680 or goat anti-mouse IRDye 800 CW (both from
Licor)) in PBS, 5% nonfat dried milk, 0.2% Tween-20. Finally, plates were washed again one
time as described above with PBS, dried, and analyzed using the Odyssey Infrared Imaging
System and application software package (Licor). For each time point six wells were
analyzed.
2.2.12. Western blotting (Semi-dry)
2.2.12.1. Measurement of protein concentration (Bio-Rad protein assay)
The Bio-Rad Protein Assay is based on the observation that when Coomasie Brilliant Blue
G250 binds to the protein the absorbency maximum shifts from 450 nm to 595 nm. 5 µl of
cell lysate (as described in 2.2.4. section) was added into diluted Bio-Rad Dye Reagent (1:5
dilution of Dye Reagent concentrate in ddH2O). Mix well and after a period of 10 min, the
relative protein content was determined by measuring the absorption at wavelength 595 versus

2. Materials and Methods
56
reagent blank (containing the lysis buffer only). This was done to apply an equal protein
amount of all samples onto the SDS-PAGE gel.
2.2.12.2. Sodium dodecyl sulfate polyacrylamide gel electrophoresis (SDS-PAGE)
The electrophoresis apparatus was assembled according to manufacturer's (Bio-Rad)
instruction, and the resolving gel was poured in between the two glas plates. Leave a space
about 1 cm plus the length of the teeth of the comb. Isopropanol or 100% ethanol was added
to the surface of the gel to apply an even distribution along the gel surface. After the resolving
gel was polymerized, isopropanol was removed and the stacking gel was poured on top of the
resolving gel. Insert the comb and let the gel polymerise. 75 µl total containing protein of one
sample (after determining the protein concentration) with 35 µl laemlli buffer containing 10%
β-mercaptoethanol to reduce disulphide bonds were incubated for 5 min at 95°C and cooled
on ice for 1 min, then shortly centrifuged and the calculated amount was loaded into wells of
gel. Rainbow protein marker (Roche, 2 µl marker + 8 µl laemlli buffer) was loaded as control.
After running buffer was added to the chamber, a cover was placed over the gel chamber.
Gels should be run at about 20 V/cm gel length. The negatively charged SDS-proteins
complexes migrate in the direction of the anode at the bottom of the gel. Small proteins move
rapidly through the gel, whereas large ones stay at the top. Proteins that differ in mass by
about 2% can be distinguished with this method. The electrophoretic mobility of many
proteins in SDS-polyacrylamide gels is proportional to the logarithm of their mass.
2.2.12.3. Transfer membrane in "Semi-dry" electroblotter
After the cell extracts were subjected to SDS-PAGE, the proteins were transferred by
electroblotting onto a PVDF-Membrane, which was incubated before in 100% Methanol for
2-3 min, and washed three times (5 min each) in ddH2O, then equilibrated in the transfer
buffer for 2-3 min. On the layer of 2 blotting papers soaked with transfer buffer the PVDF-
Membrane was laid. The polyacrylamide gel and again 2 blotting papers soaked with transfer
buffer were then placed on the PVDF-Membrane, making a "sandwich" (without any
bubbles), and laid in "Semi-dry" Electroblotter. The current was set to 0.8 mA/cm2 for 90 min
for transfer.
2.2.12.4. Immunodetection of proteins
After transferring the proteins, the PVDF-Membrane was washed for 5 min in 1x TBST
buffer, then the membrane was blocked in blocking buffer for 2 hours at room temperature or

2. Materials and Methods
57
overnight at 4°C. There after the membrane was washed for 5 min in 1x TBST buffer, then
incubated with the primary antibody (e.g. P-ERK monoclonal antibody, 1:500 dilution in
blocking buffer) for 1 hour at room temperature. After washing three times (5 min each) in 1x
TBST buffer, the membrane was incubated with the secondary antibody solution (e.g.: HRP-
conjugated anti mouse monoclonal antibody, 1:1000 dilution in blocking buffer) for 1 hour at
room temperature.
2.2.12.5. Enhanced chemiluminescence (ECL) reaction
As mentioned above the membrane was washed three times (5 min each) in 1x TBST buffer
and once in 1x TBS, then incubated for 1 min in ECL (enhanced chemiluminescence) solution
which was prepared according to the manufactor (Amersham) between a glass plate and a
clear plastic membrane. After 1 min, everything was laid into a photo cassette, and then a light
sensitive film was placed on top of the membrane and exposed for 1.5-5 min or longer. The
film was then developed.
In order to detect the ERK2 protein (as a loading control), the attached antibody was striped
from membrane by incubating with a 1:10 diluted “strong stripping solution” (Re-Blot Plus
Western Blot Recycling Kit, Chemicon) for 45-60 min at 37°C. After washing with 1x TBST
buffer for 5 min, the membrane was incubated in blocking buffer for 2 hours at room
temperature. Then it was washed for 5 min in 1x TBST buffer and incubated with the anti
ERK2 monoclonal antibody (1:1000 dilutions in blocking buffer) solution for 1 hour at room
temperature. Subsequently the membrane was washed three times in 1x TBST buffer and
washed once in 1x TBS, then incubated for 1 min in ECL solution and proceeded as
mentioned above.
2.2.12.6. Quantification of protein bands
Protein bands exposed on the film were scanned (Canoscan LiDE 30/N1240U) at 800 dpi and
the picture was saved in grey scales as TIFF file. The intensity of protein bands was
densitometrically determined by means of PC-BAS software. These steps were done for P-
ERK bands as well as ERK2 bands. The lowest value of ERK2 band, which was set to one,
was divided by each value of ERK2 bands to get a factor for each according P-ERK band
value. This calculation was done to normalize the amount of P-ERK by the amount of ERK-
protein loaded.

2. Materials and Methods
58
2.2.13. Primer extension
2.2.13.1. Isolating RNA (Trizol Method)
To isolated total RNA from infected cells, confluent MDCK cells in 35mm dishes were
infected with different recombinant virus at MOI=1 in triplicates. The total cellular RNA was
extracted with Trizol reagent (Invitrogen) at different time point post infection (2h p.i., 4h p.i.,
6h p.i. and 8h p.i.) as followed:
The medium for transfected or infected cells in 35mm dishes was aspirated and 1ml of Trizol
was added into the dishes, after 5min incubation at room temperature, Trizol was stired with
P1000 tip until all the cells are suspended. Then the solution was transferred into an reaction
tube and was incubated at room temperature for 10min. To each reaction tube 200 μl of
chloroform was added and mixed properly and incubate for 5 min at room temperature with
occasional shaking. Later the tubes were centrifuged for 20 min at 4°C at 13000 rpm. The
upper phase (app. 0.6ml) was transferred later into fresh RNAase free reaction cup. 0.5ml
isopropanol was added to this upper phase supernatant and mixed properly and incubated at
room temperature for 10 min. Afterwards centrifuge at 13000 rpm for 20 min at 4°C. The
supernatant was removed carefully and 1ml of ethanol was added to the pellet and centrifuged
at 13000 rpm for 5-10 min at 4°C. Without dislodging the pellet, alcohol content was
discarded and pellet was air dried for 5-10 min and dissolved in 30 μl of RNAase free (DEPC)
H2O and used directly for the experiment or frozen at -70°C.
2.2.13.2. Primer labeling
The gene-specific primers used were as followed: NA vRNA: 5´-
GTAGCAATAACTGATTGGTCG-3´ (expected size 134nt); NA mRNA and cRNA: 5´-
GCGCAAGCTTCATGAGATTATGTTTCC-3´(expected size of cRNA 160 nt and mRNA
approx 169-174 nt); NP vRNA: ATGATGGAGAGTGCCAGACC 3' (expected size of band
181 nt); NP mRNA and cRNA 5ʹ- ACCATTCTCCCAACAGATGC 3' (expected size of
cRNA 121 nt and mRNA approx 135 nt). On receiving, the primers should be diluted into the
concentration of 10pmol/ µl.
Labeling reaction: Primer 10pmol/µl 1µl
DPEC H2O 6µl
10x PNK Buffer (Roche) 1µl
[γ-32P]ATP (6000 Ci/mmol, 10µCi/µl) 1µl
PNK (T4 polynucleotide kinase, 10U/µl) 1µl
------------------
10µl

2. Materials and Methods
59
Mixed well and incubated at 37°C for 1h in PCR thermoblock. After 1h incubation, This 10 μl
mixture was transferred into new 1.5ml RNAase-free reaction cup and further 450 μl PN-
buffer (Qiagen Nucleotide removal kit) was added, mixed well and placed over the Qiagen
Nucleotide removal column with the help of a pipette. The column was spun for 1 min at 6000
rpm and the collection was discarded. The column was washed 2 times with 500 μl PE-buffer
(Qiagen). Further spun down for 1 min at 6000 rpm and the collection was discarded followed
by one more time spinning down for one minute at 13000 rpm to remove residual alcohol
content in the column. Fresh 1.5ml RNAase free eppendorf tube was labeled clearly and the
column was placed onto it. 40 μl EB-buffer (Qiagen) or DEPC H2O was added on the column
and incubated for 2 min at room temperature. Finally the tube was centrifuged for 1 min at
13000 rpm and the eluate (40 μl) was collected in the eppendorf. This can be stored at -20°C
in isotope room.
2.2.13.3. DNA-marker labelling
Labeling reaction: autoclaved dH2O 6.0µl
1 Kb DNA Ladder (Roche marker IV) 1.0µl
10x PNK Buffer (Roche) 1.0µl
[γ-32P]ATP (6000 Ci/mmol, 10µCi/µl) 1.0µl
PNK (T4 polynucleotide kinase, 10U/µl) 1.0µl
------------------
10µl
Mixed well and incubated at 37°C for 1h in PCR thermoblock. After 1h incubation, This 10 μl
mixture was transferred into new 1.5ml RNAase-free eppendorf tube and further 190 μl 3x
DNA loading dye buffer is added mixed well and stored at -20°C in isotope room. Before gel
loading, add the phosphorylated markers directly to the Loading Dye, heat at 95°C for 10
minutes and then immediately load the markers onto the denature running gel.
2.2.13.4. Reverse transcriptase
Labelled primer-mix : mix the primers as follows according to the no. of samples to be
analyzed and always make surplus than the need.

2. Materials and Methods
60
For one sample:
P32 labelled Primer for vRNA (10mmol/µl)(µl) 0.25 µl
P32 labelled primer for cRNA and mRNA (10mmol/µl) (µl) 0.25 µl
P32 labelled primer for 5s rRNA100 (10mmol/µl) (µl) 0.25 µl
Primer for 5s rRNA100 (cold) (10mmol/µl) (µl) 0.25 µl
DEPC H2O (µl) 3 µl
Total (µl) 4 µl
For one reaction, 1.0µl of trizol-purified RNA was mixed with 4.0µl of primer mixture.
After 3 min running at 95°C in PCR block, the tubes were placed on ice for 5min.
During 5 min incubation time, the superscript mixture was prepared as followed:
For one sample :
5x RT buffer (Invitrogen) (µl) 2 µl
100mM DTT (Invitrogen) (µl) 1 µl
10mM dNTP (sigma) (µl) 0.5 µl
DEPC ddH2O (µl) 1.25 µl
Superscript II (Invitrogen, 10 units/ µl )(µl) 0.25 µl
Total (µl) 5 µl
Superscript master mix was prepared as mentioned in the table above, and then pre-incubated
at 45°C alongside with the primer-RNA mixture in a PCR block. When the RNA-primer
samples reached to 45°C, 5μl of the Superscript mix was aliquoted into the RNA mix, then
incubated for 1 hour at 45°C (for reverse transcriptase reaction), followed by incubation at
70°C for 10 minutes (to inactivate the Superscript) and cold to 4°C.

2. Materials and Methods
61
2.2.13.5. Running the 6% 7M urea polyacrylamide gel
During reverse transcriptase reaction, the 6% 7M urea polyacrylamide gel should be prepared
as follows:
Urea 21.0g
10X TBE 5.0ml
40% acrylamide 7.5ml
------------------
Autoclaved ion free water to 50ml
The above solution was mixed very well until the powder is dissolved. When the gel
apparatus is ready, 0.5ml 10% APS and 0.05ml TEMED is added to the falcon tube and mixed
quickly. The gel mixture was poured into the apparatus followed by 20min incubation at RT
and was fixed in the gel tank.
8μl of formamide mix containing 10mM EDTA, xylene cyanol (Sigma No: X-2751XC) and
Bromophenol blue (Sigma, sodium salt) ACS reagent, No: B-7021BPB) was added to each
samples and mixed, and heated to 95°C. 10μl of each sample was loaded on the gel. The gel
was run at 1200V until the blue dye is approximately 3 cm away from the bottom of the plate.
When the gel run was finished, the glass plate was separated very carefully and the gel should
stick to one of the glasses. The gel on the glass was wrapped into clingfilm and transferred to
a cassette (BioMax Cassette 35 x 43 cm , cat 856 2381), then the intensifying screen was
placed on top of the gel. In the darkroom, a Kodak® BioMax™ MS film (Sigma, Z363006 or
Kozak MS-1 8294985) was placed between two layers of Intensifying screens (BioMax™
Transcreen®, Sigma, Z374318) and everything is placed on top of the gel . After that, the
cassette was incubated at -80°C overnight or longer. To develop the film, the Cassette should
be opened in dark room again and the film was put into film develop machine (Kozak).
2.2.13.6. Quantification of cDNA bands from different viral RNAs and 5sRNA
The gel on the glass plates was transferred to wattman-paper (right size) and was wrapped in
cllingfilm (plastic foil side at the top). Then the gel was dried in vacuum drier for 90min.
When the gel was dried, it was placed in the screen cassettes together with a image plate
phosphor (Fuji Photo Film Co. Ltd. )the gel side should be facing towards the white side of
screen) overnight. Next day the screen was scanned on a typhoon 9200 (GE Healthcare) and
the bands were quantified using GenQuant software (GE Healthcare).

2. Materials and Methods
62
2.2.14. Tunel assay (in situ cell death detection kit)
Extensive DNA degradation is a characteristic event which occurs in the late stages of
apoptosis. Cleavage of the DNA may yield double-stranded, LMW DNA fragments (mono-
and oligonucleosomes) as well as single strand breaks (“nicks”) in HMW-DNA. Those DNA
strand breaks can be detected by enzymatic labeling of the free 3’-OH termini with modified
nucleotides (X-dUTP, X = biotin, DIG or fluorescein). This method called “Terminal
deoxynucleotidyl transferase dUTP nick end labeling” (TUNEL).
MDCK cells grown on glass coverslips were infected with recombinant viruses at MOI= 1 for
10h. Cells were washed with 1×PBS PBS, and fixed with 4% paraformaldehyde (PFA) in
1×PBS (pH 7.4) over night at 4°C. The samples were then washed twice with 1×PBS and
permeabilised with 1% Triton X-100 in 0.1% sodium citrate on ice for 20 min. Cells were
washed and incubated with 50µl reaction mixture (provided in the kit, Invitrogen) or the "no
enzyme" control in 50µl label solution (provided in the kit, Invitrogen) for 1h in the dark.
After 3 washes with 1×PBS, cells were incubated with DAPI (10mgml-1 in PBS/3% bovine
serum albumin) for 10 min in the dark. Finally, cells were washed twice and were fixed in
Mowiol/DABCO. Fluorescence was visualised using a TCS-SP5 confocal laser-scanning
microscope (Leica).
2.2.15. IFN-beta enzyme linked immunosorbent assay (ELISA)
IFN-beta concentrations were assessed using the human IFN-beta ELISA kit (Fujirebio)
according to the manufacturer’s protocol. Briefly, confluent A549 cells in 3.5cm dishes were
infected with the different recombinant virus at an MOI of 0.01, and at 24h p.i., 36h p.i. and
48h p.i. 100 μl of supernatant was taken and added into 96-well plates coated with human
IFN-beta IgG Fab fragments, together with standards, and incubated for 1h with shaking at
RT. After 2 washes with washing solution, the human HRP-labeled IFN-beta antibody was
added and incubated for 1h with shaking at room temperature. After 3 washes, the substrate
solution was added to develop the color, followed by the stop solution (0.5M H2SO4) and the
OD at 450nm was measured.

3. Results
63
3. Results
3.1. Generation and confirmation of the recombinant H7-type HPAIV with different NS
segments from H5- and H7-HPAIV
Reassortant influenza viruses in the genetic background of A/FPV/Rostock/34 (FPV, H7N1)
were generated by reverse genetics. As mentioned in section 2.2.7, 293T cells were
transfected with 4 plasmids expressing polymerase proteins, NP and 7 plasmids expressing
vRNA of FPV-PB1, FPV-PB2, FPV-PA, FPV-NP, FPV-HA, FPV-NA, FPV-M, together with
plasmids expressing vRNA of FPV-NS, the wild type A/chicken/FPV/Rostock/34 (FPV wt,
H7N1) or with other NS segments from A/Goose/Guangdong/1/96 (GD, H5N1),
A/Mallard/NL/12/2000 (Ma, H7N3) and A/Vietnam/1203/2004 (VN, H5N1) respectively,
FPV NS GD, FPV NS VN and FPV NS Ma were generated. At 24 h after transfection in 293T
cells, the harvested medium from transfected dishes was screened for rescued influenza virus
by observation of liquid CPE and plaque assay on MDCK cells according to the section
2.2.8.1.
After three rounds of plaque purification, the recombinant viruses were confirmed by
restriction enzyme digestion of RT-PCR products obtained from the NS vRNA. Additionally,
the NS, HA, NA and PB2 segments from different recombinant viruses were amplified by
RT-PCR and sequenced by GATC corp. The results showed that after three passages, the NS,
HA, NA and PB2 were not changed.
Fig3.1: Confirmation of different recombinant viruses by restriction enzyme digestion of RT-PCR
products. RT-PCR products were incubated with restriction enzymes and separated on a 1.5% agarose gel. The
undigested RT-PCR product is shown as a control. With Spe I, Ma NS1 gave two bands of 435bp and 455bp.
With EcoR I, VN NS1 produced two bands of 226bp and 549bp. With Hae III, the GD NS was digested into two
bands of 367bp and 523p.
3. Results
64
3.2. Analysis of the NS1 and NS2 protein sequences of the recombinant viruses
In order to investigate how allele B NS segments affected virus replication in mammalian and
avian cells, two allele B NS segments from A/Goose/Guangdong/1/96 (GD, H5N1) and
A/Mallard/NL/12/2000 (Ma, H7N3) were used (Fig. 3.2A). A/Goose/Guangdong/1/96 was the
source of the HA and NA gene segments in the A/HongKong/483/97 (HK97) virus which
caused the first cluster of confirmed human cases infected with avian influenza virus in the
world (219). The original GD virus itself has become established in geese and formed a
distinct lineage in southern China (220, 221). The sequence of the GD NS1 protein is very
similar to that of the Ma NS1, differing by only 8 aa (Fig. 3.2B). Of interest are those
differences found at position 41, which is reported to be important for dsRNA binding (117);
position 166, which is implicated in the interaction with PI3K (175); and position 224, which
is located in the PABII binding region (166). The other differences are located in
uncharacterized regions.
In order to investigate whether H5-sourced NS segments generally increase the replication of
an H7N1 FPV, I chose the NS segment from A/Vietnam/1203/2004 (VN, H5N1), which,
similarly to the NS gene from A/chicken/FPV/Rostock/34 (FPV wt, H7N1), belongs to allele
A (Fig. 3.2A). This virus was isolated from a human in 2004 (220), and is therefore a more
recently emerged H5N1 virus than the GD H5N1 strain. The VN NS1 protein is truncated at
the C-terminus by 10 aa, and also contains a 5 aa internal deletion (Fig. 3.2B). As a
consequence of the 10 aa C- terminal truncation, the VN NS1 protein lacks a PDZ domain
(227-230aa) and PABII-binding region (223-230aa). The deletion of residues 80–84 found in
VN NS1 was often seen in recent H5N1 strains and implicated in cytokine resistance but not
virulence (222, 223). These residues are part of a flexible linker between the RNA binding
domain (RBD) and the effecter domain, and thus their deletion may greatly alter the
orientation or stability of the RBD, or both. The deletion could compact NS1 and might confer
more stability to the RBD, possibly increasing dsRNA binding affinity similarly to the D92E
mutation (224).
Comparison of the NS2/NEP aa sequences of these viruses reveals that this protein is more
conserved than NS1 (Fig. 3.2C). The majority of differences are found between the two allele
A and two allele B viruses; however there are 2 aa differences between the GD and Ma
NS2/NEP proteins, and 6 aa differences between FPV and VN NS2/NEP. Here a single aa
difference located at position 14 is in the nuclear export sequence (NES) which is suggested to
be a Crm-1 binding site, while the remaining differences are in uncharacterised regions (62).

3. Results
65
Fig. 3.2: Sequence comparison between different NS1 and NS2 proteins. A) Phylogenetic analysis of the
NS1 gene of A/FPV/Rostock/34 (FPV, H7N1), A/Goose/Guangdong/1/96 (GD, H5N1), A/Vietnam/1203/2004
(VN, H5N1) and A/Mallard/NL/12/2000 (Ma, H7N3) and their allele type. B) Alignment of the aa sequences of
the four NS1 proteins with sequence identity coloured in black. The sequence comparison was performed using
Lasergene 6.0 software. C) Analysis of the NS2 protein sequences of the recombinant viruses.

3. Results
66
3.3. NS segments can change the plaque phenotype of reassortant FPV viruses
In order to investigate whether the different NS segments altered the replication ability of the
wt FPV virus, the plaque size of the different viruses was measured in MDCK, A549 and
Vero cells by foci assay (Fig. 3.3). The plaque diameters on MDCK cells were measured and
are represented as a distribution curve (Fig. 3.3B). The reassortant virus FPV NS Ma
produced similar sized plaques to wt FPV, while those of FPV NS VN were much smaller
than wt FPV and those of FPV NS GD were much bigger. This indicates that the FPV NS GD
virus has a propagation advantage in MDCK cells compared to the other three viruses. In
contrast, the FPV NS VN virus seems to replicate less efficiently in MDCK cells compared to
the other viruses. The same phenotype was seen on A549 and Vero cells (Fig. 3.3C).
Fig. 3.3: Plaque phenotype of recombinant FPV viruses in different mammalian cells. A) Foci assay
showing plaque sizes. MDCK cell monolayers were infected with the different recombinant viruses and stained
with a monoclonal antibody against NP. B) Distribution curve of the average plaque diameters. 50-78 plaques
of each recombinant virus were measured. C) Plaque phenotype of recombinant FPV viruses in A549 cells and
Vero cells.
3. Results
67
3.4. NS segments can change the infectious titre and the HA titre of reassortant FPV
viruses
Viral growth curves and the HA titres of the different viruses in mammalian cells and avian
cells were also determined (Fig.3.4). In mammalian cells (MDCK), the viral growth curves
demonstrate that FPV NS GD replicates to higher titres than FPV wt, while FPV NS VN and
FPV NS Ma replicate to lower titres (Fig. 3.4, represented as lines). This shows that the NS-
segments of both H7- and H5-type HPAIVs can affect the virus replication efficiency of FPV
in mammalian cells and confirms the results obtained from the plaque phenotypes. Although
both the Ma- and GD NS segments are grouped in allele B, the differences in the infectious
titres between these two viruses indicates that the effects of the NS gene on virus replication
efficiency does not depend on the allele type. In addition, these results suggest that H5-
sourced NS segments do not necessarily increase H7-type HPAIV infectious titre, as both the
GD- and VN-NS segments are from H5N1 viruses and only the FPV NS GD virus had an
increased titre.
In order to determine whether the NS segments could affect the propagation of FPV in host
cells of different origin, virus growth curves in an additional three mammalian cell lines and
two avian cell lines were analyzed (Fig. 3.4). Similar results to those found in MDCK cells
were obtained for the mammalian A549, 293T and Vero cell lines. The results in Vero cells,
shown to have an IFN deficiency (225), suggests that virus propagation is not affected by the
type 1 IFN response. However, in avian LMH and QT6 cells, the NS reassortants showed
different growth curves, as the FPV wt, FPV NS GD and FPV NS Ma viruses had similar
titres, while FPV NS VN had a significantly lower titre. The FPV NS VN virus is attenuated
in both mammalian and avian cells while the FPV NS Ma and FPV wt viruses replicate as
efficiently as FPV NS GD in avian cells, but less well in mammalian cells. I therefore
conclude that NS segment reassortment can have an effect on aiding viruses to cross host
barriers and this might affect host transmission.
I also found that the HA titres of the viruses differed from the infectious virus titres (Fig. 2C,
represented as bars), which may indicate that different NS segments can affect the formation
of virus particles and change the ratio between defective particles and infectious particles. For
example, at 48h p.i. FPV NS VN has the highest HA titre (virus particles titre) of the
reassortant viruses, equivalent to that of FPV wt; however this virus has a much lower
infectious titre than the wt virus in MDCK cells (Fig. 3.4). FPV NS VN has a low titre also in
the other mammalian and avian cell lines tested while it produces higher or similar HA titres

3. Results
68
compared to the other reassortant viruses (Fig. 3.4), suggesting that this virus produces large
numbers of defective particles.
Fig. 3.4: Viral infectious titre and HA titre of recombinant FPV viruses in mammalian and avian cell
culture systems. Confluent monolayers of cells (as indicated) were infected with the recombinant viruses at an
MOI of 0.01. Supernatants were harvested every 12h p.i., and samples were titrated on MDCK cells. Results
represent the average of three independent experiments. Virus growth curves (represented as lines) were
determined by foci assays in different cells and measured in FFU/ml. HA titres (represented as bars) were
determined using 1.5% chicken red blood cells and measured in HA units/ml. Results represent the average of
three independent experiments

3. Results
69
3.5. NS1 protein production level does not affect the virus infectious titer.
In order to investigate whether the effect of NS gene exchange on the propagation of
recombinant viruses was caused by differences in the NS1 protein expression levels, “in cell”
western blots were performed (Fig. 3.5). I found that early in infection the FPV NS VN virus
had higher levels of NS1 protein expression than the other viruses, however by later time
points there were no significant differences. The different properties of the recombinant
viruses could therefore not be explained by different NS1 expression levels. In addition, the
effect of NS gene exchange on the expression of another viral protein (the nucleoprotein, NP)
was investigated, and no significant correlations were observed.
Fig, 3.5: NS1 and NP protein expression measured by in-cell western blot. Confluent MDCK cells in 96-well
plates were infected with the different recombinant viruses at an MOI of 1. Cells were fixed at 2 hour intervals
and an in-cell western blot using an anti-NS1 antibody and anti-NP antibody, ERK2 antibody (as control)
followed by staining with goat anti-rabbit IRDye 680 or goat anti-mouse IRDye 800 CW (both from Licor) was
carried out. Infrared Imaging System and application software package were used (Licor). For each time point
six wells were analyzed.
FPV wt FPV NS GD FPV NS VN FPV NS Ma
020406080
100120140
2h 4h 6h 8h p.i.
01020304050
2h 4h 6h 8h p.i.
Re
lativ
e N
s1 p
rodu
ctio
n
Re
lativ
e N
p p
rodu
ctio
n

3. Results
70
3.6. NS1 protein localization does not correlate with infectious viral titre.
NS1 contains two nuclear localization signals (NLS) and one nuclear export signal (NES),
which are responsible for transport of the protein between the nucleus and cytoplasm. The
NS1 protein can therefore be present in the nucleus, the cytoplasm or both (119, 226). The aa
sequence comparison (Fig. 3.2) showed that the sequence of both the NLS1 (34-39aa) and
NLS2 (216-220aa) are conserved between the four NS1 proteins, however the sequence of the
NES (138-147aa) differs at three aa positions between the allele A and B NS1 proteins.
Therefore, I investigated the localization of the NS1 proteins of the different reassortant
viruses in both infected and transfected MDCK cells. At all time points of infection I found
that wt FPV NS1 was predominantly nuclear, GD NS1 and Ma NS1 were predominantly
cytoplasmic, while VN NS1 showed a cytoplasmic and nuclear localization (Fig. 3.6). There
was therefore no correlation between the infectious titer of the reassortant viruses and NS1
localization during infection. Interestingly, when NS1 localization was investigated in
transfected MDCK cells after 24 hours, NS1 proteins of all viruses were located exclusively in
the nucleus (Fig. 3.6).

3. Results
71
Fig 3.6: Immunofluorescence looking at NS1 protein localisation. A) MDCK cells were infected with
recombinant viruses at an MOI of 0.1. At 4h, 6h and 8h p.i. the cells were fixed for immunofluorescence
analysis. Immunofluorescence was carried out using antibodies against the NS1 protein (200) and DAPI (blue)
for the nucleus. 70-80% of confluent MDCK cells were tranfected with 2 µg of different NS1 respectively. B) At
24h post transfection, cells were fixed for immunofluorescence analysis. Immunofluorescence was carried out
using antibodies against the NS1 protein and DAPI (blue) for the nucleus.

3. Results
72
3.7. NS segment reassortment can affect viral replication and transcription
In order to analyze whether NS segment exchange could affect the virus replication and
transcription, NA and NP gene-specific primer extensions were performed. Briefly, MDCK
cells were infected with the different viruses at MOI of 1.0 and RNA was harvested at various
time points post-infection (2h interval), then the primer extension was performed in
triplicates. The principle of primer extension is shown in the Fig 3.7.1. The viral transcription
and replication can be reflected by the amount of viral RNA species detected by primer
extension.
Fig 3.7.1: primer extension for detection of viral replication and transcription. As mentioned before, viral
vRNA is replicated by a cRNA with full length copy into more vRNA (replication) and trancribed into viral
mRNA primed by cellular 5’ cap primer from vRNA (transcription). These three viral RNAs are different in their
ends. If two radioactivity labelled primers are used for reverse transcription (RT) reaction to detect vRNA and
cRNA/mRNA, they will give products of different length. After separation on the 7M urea 6% PAGE sequence
gel, the RT products can be quantified to show the amount of viral RNA species.
The results (Fig 3.7.2) showed that NS segment reassortment could alter the kinetic curves of
viral replication and transcription for the different viruses by NP segment specific primer
extension. I found that the FPV wt, FPV NS GD and FPV NS VN viruses show a similar
accumulation of mRNA, peaking at 4h.p.i. and then decreasing, while the mRNA
accumulation of FPV NS Ma peaks at 6 h.p.i. (Fig. 3.7.2B), indicating that FPV NS Ma had
become a slower virus compared to other three recombinant viruses.
The vRNA kinetic curve of FPV NS GD was similar to that of FPV NS Ma, while FPV wt
and FPV NS VN seemed to have a slower kinetic. The amount of viral RNAs from all four
different reassortant viruses was seen to increase continually. For the kinetic curve of viral
cRNA, FPV wt, FPV NS GD and FPV NS VN showed similar cRNA amounts during the first
replication cycle, while FPV NS Ma showed a different kinetic and peaked at 6h.p.i..
When the relative accumulation of RNA species for the different viruses was compared (Fig.
3.7.2 C), I found that the FPV NS GD virus always produced more vRNA, cRNA and mRNA
compared to FPV wt at all time points analyzed, while the FPV NS VN virus produced similar
levels. At different time intervals, it seemed that the NS reassortant viruses have different

3. Results
73
production kinetics. At 4h p.i., the difference between FPV wt, FPV NS GD and FPV NS VN
is bigger than at other timepoints. At 2h p.i., FPV NS Ma produced less viral RNA species
than FPV wt, but at later timepoints, it produces slightly higher amounts of RNA products
than FPV wt. The Ma NS segment can therefore increase the level of accumulation of RNS
species but not as efficiently as the GD NS segment. For FPV NS GD at 8h p.i., the amount of
viral vRNA was more than that of viral mRNA.
3.8. The effect of NS segment on viral replication and transcription is not segment
specific.
In order to determine whether the effects on replication and transcription were segment
specific, I also analyzed viral RNAs derived from the NA segment. The results obtained (Fig.
3.8) showed similar relative RNA accumulation levels compared to those obtained for the NA
gene, indicating that the effect of NS segment exchange on the production of RNA species is
not segment specific. Overall, these results suggest that the NS segment products play a role
in the regulation of viral replication and transcription.
3. Results
74
Fig. 3.7.2: Comparison of the accumulation of viral RNA species during infection by NP gene-specific
primer extension. A) Primer extension analysis. MDCK cells were infected at an MOI of 1 and total RNA
harvested at the time points indicated. NP gene-specific primers were used in a reverse transcription reaction and
the products analysed on a 6M urea gel. B) Quantitation of the accumulation of RNA species for each
recombinant virus. RNA levels were normalized using the 5S rRNA control and results represent the average of
three independent experiments. C) Quantitation of the accumulation of RNA species at each different time point.
RNA levels were normalized using the 5S rRNA control and results represent the average of three independent
experiments. Levels of FPV wt RNA species were set to 1.
3. Results
75
Fig. 3.8: Comparison of the accumulation of viral RNA species during infection by NA gene-specific
primer extension. A) Primer extension analysis. MDCK cells were infected at an MOI of 1 and total RNA
harvested at the time points indicated. NA gene-specific primers were used in a reverse transcription reaction
and the products analysed on a 6M urea gel. B) Quantitation of the accumulation of RNA species for each
recombinant virus. RNA levels were normalized using the 5S rRNA control and results represent the average of
three independent experiments. C) Quantitation of the accumulation of RNA species at each different time point.
RNA levels were normalized using the 5S rRNA control and results represent the average of three independent
experiments. Levels of FPV wt RNA species were set to 1
3.9. Expression of individual NS1 and NS2/NEP proteins affects the accumulation of
viral RNAs in an RNP reconstitution assay
Next I wanted to detect which protein encoded by the NS segment is responsible for the
change in viral replication and transcription activity that I have observed in section 3.7 and
section 3.8. An RNP reconstitution assay in which different NS1 or NS2/NEP proteins were
individually co-expressed, alongside the polymerase and NP proteins and a viral RNA
template, was carried out as decrypted in section 2.2.5.3.2. The principle of in vitro RNP
reconstitution assay is shown in Fig. 3.9.1.

3. Results
76
Fig 3.9.1: Principle of RNP reconstitution assay for primer extension and CAT assay: The plasmid pPOLI-
CAT-RT (or pPOLI-FPV-NA-RT) contains the CAT open reading frame in minus sense flanked by the
noncoding regions of the NS RNA segment of influenza A/WSN/33 virus (or FPV NA) segments. Expression of
the influenza virus-like RNA is driven by a truncated human RNA polI promoter and ended by a sequence
derived from the hepatitis delta virus genomic ribozyme (R). The other four plasmids express viral PB1, PB2,
PA, and NP proteins with a CMV promoter. These proteins are able to amplify and transcribe the influenza virus-
like RNA expressed by pPOLI-CAT-RT or pPOLI-NA-RT into mRNA, resulting in the detection of CAT
activity and NS RNAs for primer extension in transfected human 293 cells. The represented regions in
theplasmid constructs are not drawn to scale.
Having shown that NS segment exchange can affect the transcription and replication of the
viral RNA, I set out to further investigate the role of individually expressed NS1 and
NS2/NEP proteins on these processes. An RNP reconstitution assay was employed, in which
the four different NS1 or NS2/NEP proteins were individually co-expressed with the FPV
polymerase and NP proteins and a viral RNA template (227). The results show that the
transient expression of both NS1 and NS2/NEP proteins affected the accumulation viral
RNAs (Fig. 3.9.2). Expression of all NS2/NEP proteins resulted in an increase in cRNA
3. Results
77
compared to the negative control, consistent with a previous report (24) (Fig. 3.9.2B).
However, the NS2/NEP proteins of GD, Ma and VN did not produce significant changes in
the accumulation of viral RNAs compared to the FPV NS2/NEP, suggesting that this protein
is not responsible for the differences in transcription and replication between the reassortant
viruses. Expression of all NS1 proteins resulted in a decrease in the accumulation of all viral
RNAs compared to the negative control (Fig. 3.9.2C). When compared to FPV NS1, GD NS1
down-regulated the accumulation of mRNA, while the Ma and VN NS1 proteins had little or
no effect. The differential effect of the GD NS1 protein on the accumulation of viral mRNA
could indicate a role for NS1 in viral transcription and replication
It has been reported previously that the NS1 protein can inhibit cellular mRNA processing
through an interaction with CPSF30 (127, 165, 167) and PABII (166). In order to address the
possibility whether viral polymerase proteins and NP in the RNP reconstitution assay
expressed from polII promoter-driven constructs were affected by NS1 protein expression, I
transfected cells with a pcDNA3.0-CAT reporter construct and pcDNA-GD-NS1. I found that
GD NS1 protein did not affect CAT protein expression (Fig. 3.9.2D), and therefore I conclude
that viral protein expression from polII promoter-driven plasmids is unlikely to be affected by
the NS1 protein.
3. Results
78
Fig. 3.9.2: Comparison of the accumulation of viral RNA species during RNP reconstitution by NP gene-
specific primer extension. A) Primer extension analysis. 293T cells were transfected with plasmids expressing
the PB1, PB2, PA and NP proteins of FPV and FPV NA vRNA. Either empty vector or plasmids encoding the
various NS1 or NS2/NEP proteins were co-transfected into the cells. Total RNA was harvested after 48 hours
and analyzed by NA gene-specific primer extension. B) Quantification of RNA levels following expression of
different NS2/NEP proteins. mRNA, cRNA and vRNA levels were calculated from three independent
experiments and expressed as a percentage of the values in the presence of FPV NS2/NEP (which were set to
100%). C) Quantification of RNA levels following expression of different NS1 proteins. mRNA, cRNA and
vRNA levels were calculated from three independent experiments and expressed as a percentage of the values in
the presence of FPV NS1 (which were set to 100%). D) CAT assay testing the effect of the GD NS1 protein on
CAT expression. 293T cells were transfected with plasmids expressing CAT at different concentrations
(pcDNA3-CAT, 0.05µg, 0.1µg, 0.2µg) and GD NS1 (pcDNA3-GD NS1, 4.0µg). After 48h, cell extracts were
prepared and tested for CAT activity in a 1:10 dilution.
3.10. NS1 could have different effects on different RNP complexes.
In order to investigate the effect of different NS1 proteins on polymerase function, plasmids
expressing polymerase proteins and nucleoprotein from either FPV, GD or A/Puerto
Rico/8/34 (PR8, H1N1) viruses, together with a CAT vRNA reporter vector (227) and
plasmids expressing different NS1 proteins (FPV, GD and PR8), were transfected into 293T
cells. I found that the FPV and GD NS1 protein decreased the reporter gene expression in all

3. Results
79
three virus systems (Fig.3.10). These results are in agreement with the observation from the
RNP reconstitution assay (Fig. 3.9.2B) that the various NS1 proteins can decrease the
accumulation of all viral RNA products. Surprisingly, the PR8 NS1 protein enhanced CAT
expression in the homologous PR8 system, but not in the FPV or GD systems (Fig.3.10).
Since it reached the CAT convertion plateau at the dilution of 1:10 for PR8 NS1 in the PR8
system, I also did further dilutions, which showed PR8 could enhance CAT proteins 10-100
fold than PR8 system without PR8 NS1 (data not shown). Taken together, these data suggest
that the NS1 proteins may have an effect on the RNP complex to regulate transcription and
replication without the help of other viral proteins.
Figure 3.10: CAT assay to investigate the effect of between various NS1 proteins on RNP complexes.
293T cells were transfected with plasmids expressing the PB1, PB2, PA and NP proteins from FPV, GD or PR8
viruses and pPolI-CAT-RT for vRNA expression together with either empty vector or plasmids expressing FPV-
NS1, GD-NS1 or PR8-NS1. At 48h post-transfection, cell extracts were prepared and tested for CAT activity
(1:!0 dilution).
.
3.11. NS segment exchange alters RNP export
Efficient nuclear export of RNPs is important for the production of infectious virus (19). In
order to investigate whether the NS segment exchange affected viral RNP export patterns, NP
localization was analyzed by immunofluorescence using an anti-NP antibody (Fig. 3.11A). At
8h p.i. most FPV NP was located in the cytoplasm, as was that of FPV NS GD, while FPV NS

3. Results
80
Ma and FPV NS VN showed a more nuclear localization. These results indicate that NS
segment exchange can alter RNP export dynamics and suggest a correlation between rapid
RNP export and higher infectious virus titres.
It has previously been shown that virus-induced activation of the Raf/MEK/ERK (MAPK)-
signal transduction cascade is an essential prerequisite for efficient nuclear RNP export (228).
Membrane accumulation of the viral haemagglutinin (HA) glycoprotein in lipid-raft domains
seems to be an important trigger that coordinates this signal-induction event with packaging of
new RNPs into progeny virions (229). Induction or inhibition of the cascade will increase or
reduce progeny virus titers respectively (228, 230, 231). Therefore, I investigated the extent to
which the viruses activated the MAPK-cascade by detection of activated ERK (P-ERK) (Fig
3.11B). The highest level of phospho-ERK was detected for the FPV NS GD virus, followed
by wt FPV, with lower levels detected for FPV NS Ma and FPV NS VN, correlating these
results with the finding that the RNPs of wt FPV and GD NS viruses are transported more
efficiently than those of the FPV NS Ma and VN viruses.

3. Results
81
Fig. 3.11: Recombinant viruses show differences in the nuclear export of RNPs. A) Immunofluorescence
showing RNP export of the different recombinant viruses. MDCK cells were infected with recombinant viruses
at an MOI of 0.1 and at 8h p.i. stained with an anti-NP antibody (red) and DAPI (blue) for the nuclei. B) Cell
lysates of MDCK cells infected with the different viruses at MOI of 1 were analyzed for ERK activation by
western blot using a phospho-specific anti-ERK and an anti-ERK2 (control) monoclonal antibody. C) Graph
showing ERK activation of by different recombinant viruses. MDCK cells were infected with recombinant
viruses at an MOI of 1 and cell lysates were prepared at 4h, 6h and 8h.p.i. Samples were analyzed for ERK
activation by western blot using a phospho-specific anti-ERK and an anti-ERK2 (control) monoclonal antibody.
The relative ERK activation values of two independent experiments were normalized to the loading control
(ERK2).

3. Results
82
3.12. NS segment exchange affects IFN-beta levels
In order to test the ability of the different NS1 proteins to counteract the host innate immune
response, IFN-beta levels were measured by ELISA in A549 cells infected with recombinant
viruses at an MOI of 0.01 at various time points (24h, 36h and 48h p.i.). I found that FPV NS
VN induced the highest IFN-beta response at all time points compared to the other three
viruses, followed by FPV at 24 and 36 h.p.i. (Fig. 3.12). When these results are compared to
the titres of the various viruses it can be concluded that in general the more IFN-beta induced,
the lower the virus titre.
Fig. 3.12: Recombinant viruses induce different levels of IFN-beta. A549 cells were infected with the
recombinant viruses at an MOI of 0.01. Supernatants were harvested at 24, 36 and 48 h.p.i., and measurement
were taken using an IFN-beta ELISA kit. Results represent the average of three independent experiments.
3.13. Recombinant viruses induce different levels of apoptosis
During the course of our experiments I observed that the FPV NS VN virus appeared to cause
cell death in a different way than the wt FPV, FPV NS GD and FPV NS Ma viruses in MDCK
cells. Cells infected with FPV NS VN rounded-up but did not detach from the dishes, while
infection with the other three viruses resulted in the cells becoming detached. I hypothesized
that the FPV NS VN virus was inducing a different level of apoptosis compared to the other
viruses. In order to determine the extent of apoptosis induced in cells infected with the
different viruses. A Tunel assay was used in which MDCK cells were infected and examined
by confocal microscopy (232). The number of dead cells was counted in five random viewing

3. Results
83
fields by the confocal microscope and the results were represented as a graph (Fig. 3.13). It
was observed that the FPV NS VN virus induced the highest levels of apoptosis, followed by
FPV NS Ma, FPV wt and FPV NS GD (Fig. 3.13B). Reassortant viruses containing different
NS segments therefore differ in their abilities to induce cell death. When the extent of
apoptosis is compared to the infectious titres of the various viruses it can be concluded that
the higher levels of apoptosis correlate with lower virus titres
Fig. 3.13: Tunel assay to detect levels of apoptosis induced by the recombinant viruses. A) MDCK cells
were infected with recombinant viruses at an MOI of 1, and at 10 h p.i. the cells were fixed and permeabilized
before being processed using the In-Situ Cell Death Detection Kit (Roche) according to the manufacturer’s
instructions. The specimens were then examined by confocal microscopy. Green dots represent apoptotic cells.
B) Quantitation of the number of apoptotic cells. The number of green cells in five random views was counted
in three independent experiments.

3. Results
84
3.14. Recombinant viruses show different ability to counteract apoptosis
NS1 is reported to have both pro- and anti-apoptotic functions (174-176). It was suggested
that NS1 contributes temporally to both ‘early’ suppression of apoptosis and ‘late’ induction
of cell death. The anti-apoptotic functions are linked to PI3K/Akt signal pathway. PI3K
activation, as determined by Akt phosphorylation, was shown to occur in the first 8 h
of infection (176) and is caused by expression of the viral NS1 protein (174, 175). In order to
see how our NS exchange affects the anti-apoptic possibilities of the reassortant viruses, I also
measured the amount of phosphalated Akt. The result showed in the early timepoints, FPV wt
induced more Akt activation than FPV NS VN, FPV NS GD and FPV NS Ma, but this has no
correlation to the virus titer, implying that the anti-apoptotic function is not responsible for the
change in propagation of the recombinant viruses.
0
1
2
3
4
5
6
7
4 6 8 h.p.i.
rela
tive
am
ou
nt
of
AK
T
acti
viat
ion
untreated FPV wt FPV NS GD FPV NS Ma FPV NS VN
Fig. 3.14: Recombinant viruses show differences in Akt activation. Confluent MDCK cells in 96-well plates
were infected with the different recombinant viruses at an MOI of 1. Cells were fixed at 2 hour intervals and an
in-cell western blot using an anti-phosphalated Akt antibody, Akt antibody (as control) followed by staining with
goat anti-rabbit IRDye 680 or goat anti-mouse IRDye 800 CW (both from Licor)) was carried out. Infrared
Imaging System and application software package were used (Licor). For each time point six wells were
analyzed.

3. Results
85
3.15. Recombinant virus titre is not correlated with PKR activation
One of the prominent functions of the NS1 protein is the inhibition of PKR. Normally,
accumulation of dsRNA, a typical replication intermediate of RNA viruses, will activate PKR.
Activated PKR leads to the induction of IFN via activation of NF-κB by IKK (233) and
phosphorylation of eIF2α (150, 155, 234). The initiation of this cellular mechanism prevents
further virus propagation. In order to analyze the ability of the various recombinant viruses to
down-regulate PKR, I investigated the extent of eIF2α-phosphorylation as an indicator of
PKR activity. MDCK cells were infected with the recombinant viruses at an M.O.I. of 1 and
cell lysates were analyzed by western blot using an antibody specific for phosphorylated
eIF2α. Surprisingly, none of the viruses caused a significant increase in phosphorylated eIF2α
levels, and thus PKR activation, compared to untreated cells (Fig. 3.15A). In fact, infection
with any of the viruses appears to lead to a decrease in levels of phospho-eIF2α at some time
points compared to uninfected cells, suggesting that all of the viruses can inhibit the activation
of PKR to some extent. There appears to be no strict correlation between the titres of the
recombinant viruses and PKR activation.
This evidence was supported by infection of PKR(+/+) and PKR (-/-) primary mouse lung
alveolar epithelial cells (AEC) with the different reassortant viruses. The cells were infected
at an M.O.I of 0.05 and foci assays was carried out at 12h, 24h and 36 h p.i. I found that there
were no significant differences in the titres of the recombinant viruses between PKR (+/+) and
PRK (-/- cells) (Fig. 3.15B), again suggesting that the abilities of the different NS1 proteins to
suppress PKR activation was not responsible for the differences in titres between the
recombinant viruses.
3. Results
86
Fig. 3.15: Recombinant virus titre is not correlated with PKR activation. A) PKR activity measured by
eIF2α-phosphorylation. MDCK cells were infected with recombinant viruses at an MOI of 0.05, and cell lysates
were analyzed by western blot using a monoclonal antibody specific for phosphorylated eIF2α at the indicated
time points. The relative phospho-eIF2α levels from four independent experiments were normalized to the
loading control (eIF2α) and to the levels of NP as a control for viral protein expression. B) PKR(+/+) and PKR (-
/-) primary mouse lung epithelial cells were infected at an M.O.I of 0.05 with the recombinant viruses and foci
assays were carried out with the supernatants at 12h, 24h and 36 h p.i.
A
B
0
500
1000
1500
2000
2500
3000
3500
4000
4500
5000
FPV wt FPV NS GD FPV NS M a FPV NS VN FPV wt FPV NS GD FPV NS M a FPV NS VN
PKR (+/+) PKR (-/-)
12h p.i.
24h p.i.
36h p.i.
0
0.2
0.4
0.6
0.8
1
1.2
1.4
1.6
untreated FPV wt FPV NS GD FPV NS Ma FPV NS VN
Rel
ativ
e ac
tiva
tio
n o
f eI
F2a
lph
a
untreated 2h 4h 6h 8h

4. Discussion
87
4. Discussion
In this work, I showed that replacement of the NS segment of the A/FPV/Rostock/34 (H7N1)
influenza virus with NS segments from a variety of other H5 and H7-type viruses resulted in
changes in the viral characteristics in mammalian and avian cell culture. Characterisation of
the viruses in mammalian cells revealed differences in the growth kinetics of the reassortant
viruses compared to wt FPV and to each other. As mentioned in the introduction, H7-type
HPAIV had out breaken in Europe for many times while H5-type HPAIV has started
spreading from Asia to Europe. This may raise the risk for the reassortantments between H7-
and H5-HPAIV and may raise a potential threat for pandemics as it could confer enhanced
replication ability of a highly pathogenic avian influenza viruses in mammalians system..
In order to elucidate how NS segment reassortment altered virus propagation, multiple aspects
of the interaction between the reassortant viruses and the host were examined. On the virus
side, viral replication, transcription and genome transport were examined; on the host side the
known functions of the NS1 protein in counter-acting the host innate immune response and
inducing apoptosis were studied.
4.1. The effect of different NS segments on the replication of a recombinant HPAIV FPV
is independent of NS allele, the virus subtype and the year the virus was isolated, but
depends on host factors and the genetic background.
A series of recombinant A/FPV/Rostock/34 (H7N1) viruses with NS segments from H5- and
H7-types, and from both allele A and B, were studied. The trend in the replication kinetic (Fig
3.3) for the four recombinant viruses in four types of mammalian cells showed: 1) no
difference between different mammal origin cells (A549 cells and 293T cells are from human,
MDCK originates from Canine and Vero cells from Monkey) at MOI of 0.01; 2) no difference
between interferon (IFN) competent cells (MDCK cells, A549 cells and 293T cells) and IFN-
/β deficient cells (Vero cells), indicating IFN- /β may not significantly limit the replication
of the four recombinant viruses in the multiple replication cycles in a cell culture system.
Vero cells are interferon-deficient and can not secrete type 1 interferon when infected by
viruses (235), but it is not known whether Vero cells are defective in pathways and genes
other than IFN- /β. The induction of an antiviral state can also occur in the absence of IFN
signaling (236-240). From this aspect, I thought the production of Interferon in this case may
just be an indicator of cellular antiviral status, and maybe other cytokines play a more
important role. Additionally, in cell culture without other immunological cells such as DCs,
NKs and Macrophage cells, the production of interferon can only induce neighbor cells to be

4. Discussion
88
in an antiviral status, but it can not induce the adaptive immune response. Another possible
explanation is that our recombinant viruses replicated very fast and one single replication
cycle is about 6-8hs, which I determined from the kinetics of viral RNAs production. Also I
detected that at 12 hours, the viruses nearly reached the plateau of the replication kinetics,
while the interferon beta level induced by the recombinant viruses in A549 cells was still not
detectable (Fig. 3.12.). This indicates that the IFN-beta may not response in time to limit the
virus replication at early time points. (Generally, at 2h p.i., type 1 interferon will be secreted,
but then it has to reach the effective amount)
I found that the FPV NS GD virus, which contains an allele B NS segment, replicated more
efficiently than the wt FPV virus (allele A) in both mammalian and avian cell culture systems.
This is in agreement with a previous study that also demonstrated that this virus had higher
pathogenicity in mice (212). Reassortment of this allele B NS segment therefore has the
potential to result in the emergence of an HPAIV that could cause severe infection in
mammals. However, the results presented here show that the general effect of NS exchange
on the replication efficiency is independent of the genetic group, as the second virus with an
allele B NS segment, FPV NS Ma, had a lower replication titre than wt FPV. As mentioned
before, allele B NS segments are not found in mammalian IV in nature except that one that
was discovered in equine infection and which was believed to be also avian like origin. Also,
a previous study showed that allele B NS segments decrease avian virus replication in
mammalian (211). It seems that allele B NS segments are not compatible with mammalian
infection in nature, indicating that allele B NS segments are linked to avian species. However,
my results alarmed us and highlighted that allele B NS segments may also increase the
virulence in mammalians.
I also addressed the question of whether H5-sourced NS segments, particularly those from
viruses that emerged after 1998, increased viral growth of an H7-type HAPIV in mammalian
cells. In a study by Twu et al. (206), a series of reassortant A/Udorn/72 (Ud, H3N2) viruses
carrying NS segments from A/Hong Kong/483/97 (HK97, H5N1), A/Brevig Mission/1/18
(1918, H1N1) and A/Vietnam/1203/04 (VN04, H5N1) were generated. It was shown that the
HK97 NS virus replicated less efficiently than wt Ud virus, while in contrast the VN04 virus
replicated as efficiently as wt Ud, and it was therefore concluded that H5N1 virus NS genes
selected after 1998 seemed to enhance the replication of influenza viruses in mammalian cells.
However, in my study, I observed that the NS segment from the VN virus isolated in 2004
decreased the replication of reassortant avian H7-type virus (FPV) compared to the wild type,
while the NS segment from the GD virus, isolated in 1996, enhanced FPV replication and

4. Discussion
89
increased the plaque size. These results show that H5-sourced NS segments do not necessarily
increase the replication of avian IV and the year of emergence does not appear to play a role.
It is possible that the same NS segment may have different effects on virus replication due to
the different genetic contexts; for example in this study we used the avian FPV virus as the
background while in the study of Twu et al. a human virus strain was used. Other studies also
showed that NS segment of HK97 viruses conferred high pathogenicity virus in mice (223)
and in pigs (222) when inserted into the PR8 background while reassortant Ud virus
containing HK97 NS segment showed decreased replication efficiency in mammalian cells
(206).
The differences in replication between the different viruses in cells of mammalian and avian
origin (Fig 3.4) suggest that the effect of NS segments on viral propagation is dependant on
host factors. In avian LMH and QT6 cells, wt FPV, FPV NS GD and FPV NS Ma had similar
titres while FPV NS VN had a significantly (2 logs) lower titre, whereas in mammalian cells
FPV NS GD replicated to titres of almost 1 log higher than wt FPV and two logs higher than
FPV NS Ma. The NS segments of GD, FPV and Ma originated from avian viruses, and
therefore I speculate that they all could have a replication advantage in avian cells. Wild type
FPV and FPV NS Ma replicated to lower titres than FPV NS GD in mammalian cells,
suggesting that the GD NS segment may play a role in helping the virus cross the host barrier
to mammals. In this context it should be noted that in a previous study, the NS segment of the
1918 IV (H1N1) was set in the genetic background of A/WSN/33 (H1N1). The virus
replicated well in tissue culture (MDCK cells) but was attenuated in mice as compared with
the control viruses (241). It was therefore suggested that the attenuation in mice may be
related to the human origin of the 1918 NS1 gene and that interaction of the NS1 protein with
host-cell factors plays a significant role in viral pathogenesis. Taken together, for the effects
exerted by the NS segment exchange it seems to be relevant from which host the donor strain
was isolated and in which host the recipient is tested.
4.2. NS1 localization and expression level is not correlated to the alteration of viral
propagation
In order to investigate whether the effect of NS exchange on the propagation of recombinant
viruses was caused by differences in the NS1 protein expression levels, the individual
expression rate was investigated (Fig.3.5). I found that early in infection the FPV NS VN
virus had higher levels of NS1 protein expression than the other viruses, however by later
time points there were no significant differences. The different properties of the recombinant

4. Discussion
90
viruses could therefore not be explained by different NS1 expression levels. In addition, the
effect of NS gene exchange on the expression of another viral protein (the nucleoprotein, NP)
was investigated, and here also no significant differences were observed.
In theory, newly synthesized NS1 is present in the cytoplasm, where it may be involved in
inhibiting the type 1 interferon expression by binding to dsRNA or pppRNA, or inducing a
pro-apoptotic or anti-apoptotic pathway. After synthesis, the protein is also transported into
the nucleus where it interferes with the processing and export of cellular mRNAs (128, 144)
(128, 133, 134, 145, 226). Later, some NS1 will be reexported into the cytoplasm, where it
may play a role in the regulation of the host anti-viral response and possibly in the
enhancement of viral mRNA translation. It was shown that NS1 can bind viral mRNA and
viral vRNA, which allows the possibility that the later export of NS1 protein is related to viral
mRNA transport (242). The NS1 protein has many diverse roles in both the cytoplasm and
nucleus of infected cells, and therefore at this stage I cannot exclude the possibility that the
different localizations of the NS1 proteins studied may play a role in the downstream effects
observed.
Another report showed that all NS1 located in the nucleus of cells transfected with plasmids
expressing NS1 protein. It was suggested that the NES of NS1 was specifically inhibited by
the adjacent aa sequence in the effecter domain (124). In contrast, in IV-infected cells the
NES of the NS1 protein molecules was unmasked, and a substantial amount of the NS1
protein is exported in the cytoplasm. Since this unmasking only happened in infected cells but
not uninfected cells, it was conluded in the report that it is more likely that this unmasking
resulted from specific interaction between another virus-specific protein or host factors
induced/altered by infection and the NS1 protein. Here, I also checked the localization of the
four NS1 protein expressed from transfected plasmids. The results of Fig. 3.6 showed all the
NS1 proteins located in nucleus of transfected MDCK cells, which is consistant with the
previous report (124). In infected cells, GD NS1 and Ma NS1 are localized more in cytoplasm
than in the nucleus compared to FPV NS1 and VN NS1 at 4, 6 and 8h p.i.. For GD NS1 and
Ma NS1, most is localized in cytoplasm at 4h p.i. while most of FPV NS1 and VN NS1 was in
nucleus at 4h and 6h p.i.. Later more NS1 was transported into cytoplasm. Why these NS1
showed different localization patterns and what it means is still not clear. I assume that GD
and Ma NS1 may have exterted more functions in the cytoplam compared to FPV and VN
NS1, which may lead to stronger limitation of host antiviral response, including IFN response
and apoptosis in the cytoplasm. FPV and VN NS1 are located preferentially in nucleus and
therefore maybe inhibit mRNA processing and mRNA export. As mentioned before (section

4. Discussion
91
1,4.3), NS1 contains two nuclear localization signals (NLS) and one nuclear export signal
(NES) responsible for their transport between nucleus and cytoplasm. Therefore NS1 can be
present in the nucleus, or the cytoplasm or both (119, 128, 144, 162, 226, 243). The aa
sequence comparison between my four NS1 (Fig 3.2) showed that the NLS1 (34aa-39aa) and
NLS2 (216aa-220aa) are the same between the four NS1. NES differs in 3 amino acids.
Maybe these three amino acids differences contributed to the different localization of the four
NS1.
NS1 accumulation in the nucleus has been reported to help the replication of IV (123) Here,
although GD NS1 and Ma NS1 had the same patterns NS1 localization, they produced
different virus titer. The results showed that there was no correlation between intra-cellular
NS1 localization and virus titres, which means they may have different functions even they all
localized in nucleus or cytoplasm.
4.3. Molecular mechanisms of NS segments that could affect the propagation of FPV
In order to investigate how the NS segment altered virus replication and virulence, multiple
aspects of the interaction between the recombinant viruses and the host were examined. On
the virus side, viral replication and transcription and genome transport were examined; while
on the host side the known functions of the NS1 protein in counter-acting the host innate
immune response and inducing apoptosis were studied. The results of Fig.3.7 and Fig. 3.8
clearly show that the NS segments plays a role in the differential regulation of viral replication
and transcription between the viruses (214). I could show that the NS1 protein played the
major role in this regulation through an indirect effect on the viral polymerase in infection,
which might be independent of PKR activity (Fig. 3.15). Differences in the regulation of viral
RNA production between the infection assay and the RNP reconstitution assay were observed,
leading to the speculation that viral factors and/or host factors may mediate the interaction
between NS1 and the RNP complex, and that such host factors could be induced or altered by
virus infection. This speculation is supported by the differences in viral replication between
cells of mammalian and avian origin (Fig 3.3).
4.3.1. Effects of NS segments on the viral replication/transcription activity
Other have shown that the virus carrying NS1 with C-terminally deleted forms of NS1 (NS1-
81 and NS1-110) produced less vRNA, but the similar amounts of cRNA and mRNA
compared to wt virus at restrictive temperature, indicating that the NS1 protein is involved in
the replication process during infection (214). In this work, the results of Fig 3.7.2 and Fig 3.8

4. Discussion
92
clearly show that NS segments play a role in the differential regulation of viral replication and
transcription between the viruses. The C-terminus of the VN NS1 is truncated by 10 aa, but
the results in Fig 3.9.2 show a similar vRNA and cRNA production for wt FPV and FPV NS
VN. The GD and Ma NS segments affected both transcription and replication and enhanced
the accumulation of viral mRNAs compared to wt FPV and FPV NS VN in infected cells.
FPV NS GD enhanced the accumulation of vRNA, cRNA and mRNA at different time points
compared to FPV wt, implying that the components of GD NS could be possibly involved in
regulation of both the replication and transcription progress. FPV NS Ma produced less viral
RNAs (vRNA, cRNA and mRNA) at early timepoints (2h p.i.), but later it produced more
viral RNAs than FPV wt, suggesting that components of Ma NS segment have different
regulation efficiency at different stages of the IV infection cycle.
Interestingly, NS exchange against the FPV genetic background also changed the kinetic
curve of viral RNA production. FPV wt, FPV NS GD and FPV NS VN show similar kinetics
for all viral RNAs: viral mRNA peaked at 4 h p.i. and then decreased, which is consistent with
the observation that viral mRNA can peak up from 2.5 h p.i. to 4.5 h p.i and becomes weaker
later on (242). The peak and later decrease could indicate that virus started to switch from
transcription to replication. Equal quantities of cRNA are found to be synthesized through out
the infection cycles except that FPV NS GD produced a marginal increase of cRNA at 4h.p.i
(32), which is consistent with the observation of Vreede et al (55). Concerning vRNA
kinetics, the results show that during the whole infection cycle, vRNA continued to increase
which is in agreements with the study of Robb et al. (216). However, compared to the other
three viruses, FPV NS Ma showed peak time point at 6h p.i instead of 4h p.i., for cRNA and
mRNA. Also cRNA and mRNA at 8h. p.i. showed just a little decrease compared to that of
6h.p.i. The delayed peak of accumulation of mRNA suggests that NS segments can influence
the time course of RNA synthesis. It seems that the components of the Ma NS segment
interfere with the RdRp activity in the transcription and in the replication step from vRNA to
cRNA, and maybe also in the switch from transcription to replication.
It was reported that specific mutations at position 123 and 124 in the NS1 protein of the Ud
virus regulate the time course of viral RNA synthesis: vRNA, viral mRNA and proteins for
early genes and late genes are synthesized at high levels at very early times after infection
(155). In order to investigate whether the regulation observed in my experiments does not
only affect the early NP gene expression, the viral RNAs production for the late NA gene was
also tested by primer extension (Fig.3.8). The kinetic curves for the NA segments showed a
similar trend like those for NP, which indicates that the regulation of the segments was is

4. Discussion
93
similar for early genes as well as for late genes, indicating a general effect of NS components
was involved in regulation of viral RNAs accumulations.
Although the results show that the gene products of the NS segment can affect transcription
and replication activity of the viral RdRp, the mode of this interaction is still elusive. For
example, which gene product of NS segment is responsible for this interaction? Is there any
direct functional interaction between NS1/NS2 (NEP) and viral RNP complex? In vitro RNP
constitution experiments (Fig.3.9.2) demonstrated that both NS1 and NS2 (NEP) regulated the
production of viral RNAs. All NS2 proteins down regulated slightly viral mRNA and
unregulated cRNA accumulation (consistent with a previous report (216)) compared to the
negative control, indicating that NS2 interferes with the replication step from vRNA to cRNA.
Furthermore, NS2 did not change viral RNA production between different viruses
significantly, implying that NS2 may not be the cause of the differences in viral RNAs
production in infected cells. On the other side, the NS1 protein decreases the accumulations of
viral RNAs compared to the negative control, this hint at the possibility that the NS1 is
involved in the transcription and the replication step. Compared to the FPV NS1, the GD NS1
decreased the accumulation of mRNA more, while the Ma and VN NS1 resulted only in a
little or no change. This suggests that the difference in the regulation of replication and
transcription during viral infection maybe caused by the NS1 protein. But still I cannot
exclude that NS1, NS2 and viral RNAs from NS segments may cooperate in this effect.
Both components (NS1, NS2) from the GD- and the Ma NS segments did not increase the
accumulation of viral RNAs in the transient in vitro system in contrast to the increase in
infected cells, indicating that the enhanced effect of NS prodcuts on the viral transcription and
replication in infected cells might not be a direct effect and could depend on virus-induced
host factors or other viral factors. It is not clear how NS1 affects the viral transcription and
replication. Although, the viral RNP complex can direct viral transcription and replication
without host factors (244), it was also reported that host factors might regulate or further
enhance viral RNA transcription and replication in infected cells (245, 246). Additionally, the
NS1 protein was reported to interact with the viral transcription–replication complex in vivo
(213). If so, there must be other viral or host factors induced by the infection affecting this
interaction. It was also shown that NS1 could counteract with some cellular factors which
inhibits the viral replication and help the polymerase proteins dissociated from RNP complex
for virus replication (247). Recently, the influenza A virus NS1 protein was reported to form a
complex with CPSF-30 and the viral RNPs (215). Since CPSF-30 is present in both the
infection and RNP reconstitution assays, this suggests that the interaction with CPSF-30 is

4. Discussion
94
unlikely to be responsible for the different effects observed during infection and RNP
reconstitution. In addition, our previous data showed that GD NS1 and FPV NS1 have similar
binding affinities for the F2F3 domain of CPSF-30 (212). However, we cannot exclude that
the macromolecular complex may also contain other host factors besides CPSF30-NS1A and
RNP complex. From the results derived from RNP reconstitution assay, it can be assumed that
NS1 inhibits the viral transcription and replication with or without the participation of other
viral factors or host factors. However, in infection, the interaction between NS1 and some
viral factors or some host factors induced/altered by infection may modify this inhibition and
thereby regulate transcription and replication.
It has become clear in previous research that the host cell nucleus provides important
functions for the vRNA synthesis machinery. In fact, it is likely that the full spectrum of
activities of the viral RdRp and of its regulation can only be seen within the cell nucleus. As
discussed before, and as shown in Fig 3.6, NS1 located in nucleus of transfected cells, while
GD- and Ma NS1 proteins from recombinant viruses located predominantly in the cytoplasm
of infected cells. This NS1 relocalization from nucleus to cytoplasm maybe one of possible
reasons that explains why different effects of NS1 on RdRp activity between infected cells
and uninfected cells were detected. It was suggested that the nuclear export signal (NES) of
NS1 is masked by an inhibitory aa sequence adjacent to the NES in transfected cells while it
could be unmasked by the specific interaction with another virus-specific protein (124). It can
be assumed that the GD- and Ma NS segments enhance the replication and transcription
activity of RdRp in infection but decrease its activity in in vitro RNP constitution
experiments, which might be due to the unmasking effect in infected cells. In RNP
constitution experiments, the retention of the NS1 protein in nucleus may lead to the decrease
of the RdRp activity directly or indirectly. If it is true, it will be of great interest to identify the
putative specific protein that interacts with the NS1 protein to unmask its NES and allows
cztoplasmatic NS1 localisation.
4.3.2. The effect of NS1 on the RdRp depends on the RNP complex
The results shown in Fig 3.10 revealed that the NS1 effect on viral transcription and
replication may depend on the fact whether the viral RNP complex represents the homology
or a heterology complex . It is interesting to note that expression of the PR8 NS1 protein
increases the polymerase activity of the PR8 RNP complex,. It has been suggested that PR8
NS1 protein can enhance polymerase and NP protein expression by increasing translation
(138). However as the PR8 NS1 protein has no effect on the FPV and GD systems it seems as
4. Discussion
95
though this is strain-specific. The speculation that the effect of NS1 on RNP activity is
dependent on the virus strain is also supported by a study showing that NS1 proteins can only
form complexes containing CPSF30 with cognate RNP complexes24 rather than RNP
complexes of other viral strains (215).
4.4. NS exchange also changes the RNP export patterns and this is correlated to the virus
titer.
The transport of viral RNP complexes was investigated using immunofluorescence, The
results showed that the RNP localization of the FPV wt and FPV NS GD viruses had a mostly
cytoplasmic distribution, while FPV NS VN and FPV NS Ma showed a more nuclear RNP
localization. This suggests that transport of the viral genome out of the nucleus was reduced
for these viruses (Fig.3.6). The more rapid RNP export was found to correlate with higher
virus titers An explanation for this could be that less efficient RNP export should lead to
lower infectious titres by limiting RNPs available for packaging (228). NS2 can mediate RNP
export by interaction with M1 protein. The aa comparison of NS2/NEP (Fig. 1C) shows that
there are only two aa differences between the GD and Ma NS2/NEP protein sequences.
Therefore, if NS2/NEP confers the demonstrated difference in RNP export, it should be based
on this two aa difference, otherwise the RNP export of FPV NS GD should be similar to FPV
NS Ma, while RNP export of FPV wt should be similar to that of FPV NS VN. In contrast,
here data showed RNP export of FPV NS GD is stronger than FPV wt and that of FPV wt is
stronger than FPV NS Ma and FPV NS VN. I was therefore unlikely that NS2/NEP is
responsible for the observed differences. Further experiments need to be performed to
investigate this.
4.5. The ability to limit type 1 interferon response differs among the different NS1
proteins and the IFN beta level is inversely correlated to virus titer.
The influenza NS1 protein has been characterized as a type I IFN antagonist that is crucial for
efficient viral replication by blocking interferon production and the anti-viral effects of IFN-
induced proteins, such as PKR and and 2'5'-oligoadenylate synthetase (OAS)/RNase L. My
results showed that the NS segment exchange in an FPV genetic background altered IFN-beta
production, and that IFN-beta levels were inversely correlated to the infectious virus titer.
Since NS1 proteins of several diverse avian IAV strains were shown to have different
inhibitory properties against IFN gene expression in mammalian cells (248), it can be
assumed that the different innate immune response raised by the different NS reassortant

4. Discussion
96
viruses in A549 cells are related to the difference of NS1 protein. However, as discussed
before, the kinetics of the viral replication curves in type 1 deficient Vero cells showed no
marked difference compared to MDCK cells. This indicates that type 1 interferon may not
play the major role in inhibiting replication of the reassortant viruses and may only act as the
indicator of host innate immune response. This assumption needs to be confirmed by
investigations to determine whether the same amount of IFN-beta induced by the reassortant
viruses can inhibit FPV wt replication to corresponding level as that the reassortant viruses
reached. Wild type VN virus induces higher TNF-α levels than some human influenza A virus
(249). In this reports, it was shown that VN NS alone in an A/WSN/33 (H1N1) background
did not confer higher TNF-α level, but it rather depends on gene constellations like H5
replication complex (NP/PA/PB1/PB2) or H5 surface proteins in addition to H5 matrix
proteins (HA/NA/M). From this results, it can not be excluded that the different ability of our
four NS segments to induce IFN-beta level also relies on the genetic background.
4.6. The NS reassortants show different ability to induce apoptosis and the number of
apoptotic cells is inversely correlated to virus titer.
It is known that the NS1 protein is involved in the apoptosis during viral infection of host
cells; however it is not clear whether it plays a pro- or anti-apoptotic role. The extent of
apoptosis induced by the recombinant viruses was examined, and it was found that the FPV
NS VN and FPV NS Ma viruses induced more apoptosis than the FPV wt and FPV NS GD
viruses (Fig. 3.13). The levels of apoptosis induced were found to be inversely correlated to
the virus titers. Therefore a general trend was observed; infection with recombinant viruses in
which the NS segment exchange resulted in lower titers induced higher levels of IFN-beta and
cellular apoptosis compared to those viruses with higher titers. It is known that IFN can render
cells more sensitive to apoptosis (198), but the relationship between viral
replication/transcription and the anti-viral response is still not clear, including the type-1
interferon response and apoptosis. PKR inhibition can affect the IFN response and viral RNA
synthesis IV infection (125, 138, 150, 155, 250), and is also correlated to cell apoptosis in
cancer (251). However, the result shows that PKR doesn’t seem to play a major role for the
effects caused by NS segment reassortment (Fig. 8). It would be of interest in the future to
investigate whether the differences in viral replication and transcription are the consequence
of the host antiviral response or whether they are responsible for initiating the host response.

4. Discussion
97
4.7. The effect of NS segment reassortment on virus propagation results from a
summary of effects in multiple steps during the viral infection cycle.
FPVwt FPV NS GD FPV NS VN FPV NS Ma
NS1 localization in transfected cells
all in the nucleus
all in the nucleus
all in the nucleus all in the nucleus
NS1 localization in infected cells
most in the
nucleus
most in the cytoplasm
some in the nucleus, some in
the cytoplasm
most in the cytoplasm
NS1 and protein level (compared to FPV wt
at 4h p.i.)
1 1.27 1.32 1.92
Transcription and replication compared to FPV wt ( at 4h.p.i.)
mRNA: 1
cRNA: 1
vRNA:1
(levels set to 1)
mRNA: 3.5
cRNA: 15
vRNA:11
(compared to FPV wt)
mRNA: 1.2
cRNA: 1.2
vRNA:1.3
(compared to FPV wt)
mRNA: 1.3
cRNA: 3.4
vRNA: 2.2
(compared to FPV wt)
viral genome replication and nuclear export
RNP export ++ +++ + +
IFN beta leverl (36h.p.i.)
17 IU/ml 10 IU/ml 11 IU/ml 37 IU/ml
anti apoptosis (6h p.i.) +++ + + ++
host anti viral response
apoptosis induction + + ++ +++
virus infectious titer (FFU/ml)
106 107 105 105
HA (HU/ml, at 24h p.i.)
2560 5120 5120 1280
viral propagation
plaque size ++ +++ ++ +
In summary, the NS1 protein is a small 26 kDa protein but it plays a very important and multi-
factorial role in the battle between the influenza virus and its host. Our results show that the
exchange of NS segments can have a significant effect on the replicative ability and
infectivity of the virus, and supports the notion that NS products are involved in many stages
of the virus lifecycle; from replication, transcription and vRNP export to the counteraction of

4. Discussion
98
the host response and induction of apoptosis. It is not possible to say which of these effects is
the most important. This suggests that the effect of NS segment reassortment on virus
replication and virulence is a summary effect and might depend on team work with other viral
gene products.

5. References
99
5. Reference 1. Fouchier RA, et al. (2005) Characterization of a novel influenza A virus
hemagglutinin subtype (H16) obtained from black-headed gulls. J Virol 79(5):2814-2822.
2. Peiris JS, de Jong MD, & Guan Y (2007) Avian influenza virus (H5N1): a threat to human health. (Translated from eng) Clin Microbiol Rev 20(2):243-267 (in eng).
3. Widjaja L, Krauss SL, Webby RJ, Xie T, & Webster RG (2004) Matrix gene of influenza a viruses isolated from wild aquatic birds: ecology and emergence of influenza a viruses. J Virol 78(16):8771-8779.
4. Alexander DJ (2007) An overview of the epidemiology of avian influenza. (Translated from eng) Vaccine 25(30):5637-5644 (in eng).
5. Capua I & Alexander DJ (2002) Avian influenza and human health. Acta Trop 83(1):1-6.
6. Glezen WP & Couch RB (1978) Interpandemic influenza in the Houston area, 1974-76. (Translated from eng) N Engl J Med 298(11):587-592 (in eng).
7. Taubenberger JK & Morens DM (2006) 1918 Influenza: the mother of all pandemics. (Translated from eng) Emerg Infect Dis 12(1):15-22 (in eng).
8. Langmuir AD (1961) Epidemiology of Asian influenza. With special emphasis on the United States. (Translated from eng) Am Rev Respir Dis 83(2)Pt 2:2-14 (in eng).
9. Schulman JL & Kilbourne ED (1969) Independent variation in nature of hemagglutinin and neuraminidase antigens of influenza virus: distinctiveness of hemagglutinin antigen of Hong Kong-68 virus. (Translated from eng) Proc Natl Acad Sci U S A 63(2):326-333 (in eng).
10. Nerome R, et al. (1998) Evolutionary characteristics of influenza B virus since its first isolation in 1940: dynamic circulation of deletion and insertion mechanism. (Translated from eng) Arch Virol 143(8):1569-1583 (in eng).
11. Nancy J. Cox GN, Ruben O. Donis, and Yoshihiro Kawaoka (2005) Orthomyxoviruses: influenza (chapter 32, London) (eng) pp 634-680.
12. Alexander DJ (2000) A review of avian influenza in different bird species. Vet Microbiol 74(1-2):3-13.
13. Barclay WS & Zambon M (2004) Pandemic risks from bird flu. Bmj 328(7434):238-239.
14. Monto AS (2005) The threat of an avian influenza pandemic. N Engl J Med 352(4):323-325.
15. Van Reeth K (2007) Avian and swine influenza viruses: our current understanding of the zoonotic risk. (Translated from eng) Vet Res 38(2):243-260 (in eng).
16. Ungchusak K, et al. (2005) Probable person-to-person transmission of avian influenza A (H5N1). N Engl J Med 352(4):333-340.
17. Wang H, et al. (2008) Probable limited person-to-person transmission of highly pathogenic avian influenza A (H5N1) virus in China. (Translated from eng) Lancet 371(9622):1427-1434 (in eng).
18. Stohr K (2005) Avian influenza and pandemics--research needs and opportunities. (Translated from eng) N Engl J Med 352(4):405-407 (in eng).
19. Lamb R & Krug R (2001) Orthomyxoviridae: the viruses and their replication. 4th edn. Lippincott Williams & Wilkins Ed pp p. 1487-1531.
20. Noda T, et al. (2006) Architecture of ribonucleoprotein complexes in influenza A virus particles. (Translated from eng) Nature 439(7075):490-492 (in eng).
21. Ludwig S, Planz O, Pleschka S, & Wolff T (2003) Influenza-virus-induced signaling cascades: targets for antiviral therapy? Trends Mol Med 9(2):46-52.

5. References
100
22. Flick R & Hobom G (1999) Interaction of influenza virus polymerase with viral RNA in the 'corkscrew' conformation. J Gen Virol 80 ( Pt 10):2565-2572.
23. Flick R, Neumann G, Hoffmann E, Neumeier E, & Hobom G (1996) Promoter elements in the influenza vRNA terminal structure. (Translated from eng) RNA 2(10):1046-1057 (in eng).
24. Fodor E, Pritlove DC, & Brownlee GG (1994) The influenza virus panhandle is involved in the initiation of transcription. (Translated from eng) J Virol 68(6):4092-4096 (in eng).
25. Lamb RA & Choppin PW (1979) Segment 8 of the influenza virus genome is unique in coding for two polypeptides. (Translated from eng) Proc Natl Acad Sci U S A 76(10):4908-4912 (in eng).
26. Lamb RA, Lai CJ, & Choppin PW (1981) Sequences of mRNAs derived from genome RNA segment 7 of influenza virus: colinear and interrupted mRNAs code for overlapping proteins. (Translated from eng) Proc Natl Acad Sci U S A 78(7):4170-4174 (in eng).
27. Lamb RA & Choppin PW (1981) Identification of a second protein (M2) encoded by RNA segment 7 of influenza virus. (Translated from eng) Virology 112(2):729-737 (in eng).
28. Chen W, et al. (2001) A novel influenza A virus mitochondrial protein that induces cell death. Nat Med 7(12):1306-1312.
29. Conenello GM, Zamarin D, Perrone LA, Tumpey T, & Palese P (2007) A single mutation in the PB1-F2 of H5N1 (HK/97) and 1918 influenza A viruses contributes to increased virulence. (Translated from eng) PLoS Pathog 3(10):1414-1421 (in eng).
30. Ludwig S, Pleschka S, & Wolff T (1999) A fatal relationship--influenza virus interactions with the host cell. Viral Immunol 12(3):175-196.
31. Lamb RA KR (2001) Orthomyxoviridae: the viruses and their replication (Fields Virology) 4th Ed pp 1487-1531.
32. Huet S, et al. (2009) Nuclear import and assembly of the influenza A virus RNA polymerase studied in live cells by Fluorescence Cross Correlation Spectroscopy. (Translated from Eng) J Virol (in Eng).
33. Honda A & Ishihama A (1997) The molecular anatomy of influenza virus RNA polymerase. (Translated from eng) Biol Chem 378(6):483-488 (in eng).
34. Perez DR & Donis RO (2001) Functional analysis of PA binding by influenza a virus PB1: effects on polymerase activity and viral infectivity. (Translated from eng) J Virol 75(17):8127-8136 (in eng).
35. Honda A, Ueda K, Nagata K, & Ishihama A (1987) Identification of the RNA polymerase-binding site on genome RNA of influenza virus. (Translated from eng) J Biochem 102(5):1241-1249 (in eng).
36. Tiley LS, Hagen M, Matthews JT, & Krystal M (1994) Sequence-specific binding of the influenza virus RNA polymerase to sequences located at the 5' ends of the viral RNAs. (Translated from eng) J Virol 68(8):5108-5116 (in eng).
37. Biswas SK, Boutz PL, & Nayak DP (1998) Influenza virus nucleoprotein interacts with influenza virus polymerase proteins. (Translated from eng) J Virol 72(7):5493-5501 (in eng).
38. Honda A & Ishihama A (1997) [Transcription and replication of influenza virus genome]. (Translated from jpn) Nippon Rinsho 55(10):2555-2561 (in jpn).
39. Honda A, Mizumoto K, & Ishihama A (2002) Minimum molecular architectures for transcription and replication of the influenza virus. (Translated from eng) Proc Natl Acad Sci U S A 99(20):13166-13171 (in eng).
5. References
101
40. Lee MT, et al. (2002) Definition of the minimal viral components required for the initiation of unprimed RNA synthesis by influenza virus RNA polymerase. (Translated from eng) Nucleic Acids Res 30(2):429-438 (in eng).
41. Fodor E, et al. (2002) A single amino acid mutation in the PA subunit of the influenza virus RNA polymerase inhibits endonucleolytic cleavage of capped RNAs. (Translated from eng) J Virol 76(18):8989-9001 (in eng).
42. Perales B & Ortin J (1997) The influenza A virus PB2 polymerase subunit is required for the replication of viral RNA. (Translated from eng) J Virol 71(2):1381-1385 (in eng).
43. Jorba N, Coloma R, & Ortin J (2009) Genetic trans-complementation establishes a new model for influenza virus RNA transcription and replication. (Translated from eng) PLoS Pathog 5(5):e1000462 (in eng).
44. Dias A, et al. (2009) The cap-snatching endonuclease of influenza virus polymerase resides in the PA subunit. (Translated from eng) Nature 458(7240):914-918 (in eng).
45. Yuan P, et al. (2009) Crystal structure of an avian influenza polymerase PA(N) reveals an endonuclease active site. (Translated from eng) Nature 458(7240):909-913 (in eng).
46. Li X & Palese P (1994) Characterization of the polyadenylation signal of influenza virus RNA. (Translated from eng) J Virol 68(2):1245-1249 (in eng).
47. Luo GX, Luytjes W, Enami M, & Palese P (1991) The polyadenylation signal of influenza virus RNA involves a stretch of uridines followed by the RNA duplex of the panhandle structure. J Virol 65(6):2861-2867.
48. Poon LL, Pritlove DC, Fodor E, & Brownlee GG (1999) Direct evidence that the poly(A) tail of influenza A virus mRNA is synthesized by reiterative copying of a U track in the virion RNA template. J Virol 73(4):3473-3476.
49. Pritlove DC, Poon LL, Devenish LJ, Leahy MB, & Brownlee GG (1999) A hairpin loop at the 5' end of influenza A virus virion RNA is required for synthesis of poly(A)+ mRNA in vitro. (Translated from eng) J Virol 73(3):2109-2114 (in eng).
50. Zheng H, Lee HA, Palese P, & Garcia-Sastre A (1999) Influenza A virus RNA polymerase has the ability to stutter at the polyadenylation site of a viral RNA template during RNA replication. (Translated from eng) J Virol 73(6):5240-5243 (in eng).
51. Engelhardt OG & Fodor E (2006) Functional association between viral and cellular transcription during influenza virus infection. (Translated from eng) Rev Med Virol 16(5):329-345 (in eng).
52. Yamanaka K, Ishihama A, & Nagata K (1988) Translational regulation of influenza virus mRNAs. (Translated from eng) Virus Genes 2(1):19-30 (in eng).
53. Beaton AR & Krug RM (1986) Transcription antitermination during influenza viral template RNA synthesis requires the nucleocapsid protein and the absence of a 5' capped end. (Translated from eng) Proc Natl Acad Sci U S A 83(17):6282-6286 (in eng).
54. Shapiro GI & Krug RM (1988) Influenza virus RNA replication in vitro: synthesis of viral template RNAs and virion RNAs in the absence of an added primer. (Translated from eng) J Virol 62(7):2285-2290 (in eng).
55. Vreede FT, Jung TE, & Brownlee GG (2004) Model suggesting that replication of influenza virus is regulated by stabilization of replicative intermediates. J Virol 78(17):9568-9572.
56. Doms RW, Lamb RA, Rose JK, & Helenius A (1993) Folding and assembly of viral membrane proteins. (Translated from eng) Virology 193(2):545-562 (in eng).
57. Bui M, Wills EG, Helenius A, & Whittaker GR (2000) Role of the influenza virus M1 protein in nuclear export of viral ribonucleoproteins. J Virol 74(4):1781-1786.

5. References
102
58. Huang X, Liu T, Muller J, Levandowski RA, & Ye Z (2001) Effect of influenza virus matrix protein and viral RNA on ribonucleoprotein formation and nuclear export. Virology 287(2):405-416.
59. Martin K & Helenius A (1991) Nuclear transport of influenza virus ribonucleoproteins: the viral matrix protein (M1) promotes export and inhibits import. Cell 67(1):117-130.
60. Whittaker G, Kemler I, & Helenius A (1995) Hyperphosphorylation of mutant influenza virus matrix protein, M1, causes its retention in the nucleus. (Translated from eng) J Virol 69(1):439-445 (in eng).
61. Hara K, et al. (2003) Inhibition of the protease activity of influenza virus RNA polymerase PA subunit by viral matrix protein. (Translated from eng) Microbiol Immunol 47(7):521-526 (in eng).
62. Neumann G, Hughes MT, & Kawaoka Y (2000) Influenza A virus NS2 protein mediates vRNP nuclear export through NES-independent interaction with hCRM1. Embo J 19(24):6751-6758.
63. Sakaguchi A, Hirayama E, Hiraki A, Ishida Y, & Kim J (2003) Nuclear export of influenza viral ribonucleoprotein is temperature-dependently inhibited by dissociation of viral matrix protein. (Translated from eng) Virology 306(2):244-253 (in eng).
64. Elton D, et al. (2001) Interaction of the influenza virus nucleoprotein with the cellular CRM1-mediated nuclear export pathway. J Virol 75(1):408-419.
65. Patterson S, Gross J, & Oxford JS (1988) The intracellular distribution of influenza virus matrix protein and nucleoprotein in infected cells and their relationship to haemagglutinin in the plasma membrane. (Translated from eng) J Gen Virol 69 ( Pt 8):1859-1872 (in eng).
66. Fujii Y, Goto H, Watanabe T, Yoshida T, & Kawaoka Y (2003) Selective incorporation of influenza virus RNA segments into virions. (Translated from eng) Proc Natl Acad Sci U S A 100(4):2002-2007 (in eng).
67. Fujii Y, Watanabe T, Horimoto T, & Kawaoka Y (2003) [The enigma of influenza virus genome packaging revealed]. (Translated from jpn) Tanpakushitsu Kakusan Koso 48(10):1357-1363 (in jpn).
68. Watanabe T, Watanabe S, Noda T, Fujii Y, & Kawaoka Y (2003) Exploitation of nucleic acid packaging signals to generate a novel influenza virus-based vector stably expressing two foreign genes. (Translated from eng) J Virol 77(19):10575-10583 (in eng).
69. Enami M & Palese P (1991) High-efficiency formation of influenza virus transfectants. (Translated from eng) J Virol 65(5):2711-2713 (in eng).
70. Kretzschmar E, Bui M, & Rose JK (1996) Membrane association of influenza virus matrix protein does not require specific hydrophobic domains or the viral glycoproteins. (Translated from eng) Virology 220(1):37-45 (in eng).
71. Gomez-Puertas P, Albo C, Perez-Pastrana E, Vivo A, & Portela A (2000) Influenza virus matrix protein is the major driving force in virus budding. (Translated from eng) J Virol 74(24):11538-11547 (in eng).
72. Latham T & Galarza JM (2001) Formation of wild-type and chimeric influenza virus-like particles following simultaneous expression of only four structural proteins. (Translated from eng) J Virol 75(13):6154-6165 (in eng).
73. Ali A, Avalos RT, Ponimaskin E, & Nayak DP (2000) Influenza virus assembly: effect of influenza virus glycoproteins on the membrane association of M1 protein. (Translated from eng) J Virol 74(18):8709-8719 (in eng).
74. Li C, Hatta M, Watanabe S, Neumann G, & Kawaoka Y (2008) Compatibility among polymerase subunit proteins is a restricting factor in reassortment between equine

5. References
103
H7N7 and human H3N2 influenza viruses. (Translated from eng) J Virol 82(23):11880-11888 (in eng).
75. Neumann G & Kawaoka Y (2006) Host range restriction and pathogenicity in the context of influenza pandemic. (Translated from eng) Emerg Infect Dis 12(6):881-886 (in eng).
76. Matrosovich M, Stech J, & Klenk HD (2009) Influenza receptors, polymerase and host range. (Translated from eng) Rev Sci Tech 28(1):203-217 (in eng).
77. Mitnaul LJ, et al. (2000) Balanced hemagglutinin and neuraminidase activities are critical for efficient replication of influenza A virus. (Translated from eng) J Virol 74(13):6015-6020 (in eng).
78. Baum LG & Paulson JC (1991) The N2 neuraminidase of human influenza virus has acquired a substrate specificity complementary to the hemagglutinin receptor specificity. (Translated from eng) Virology 180(1):10-15 (in eng).
79. Matsuoka Y, et al. (2009) Neuraminidase stalk length and additional glycosylation of the hemagglutinin influence the virulence of influenza H5N1 viruses for mice. (Translated from eng) J Virol 83(9):4704-4708 (in eng).
80. Rott R, Orlich M, & Scholtissek C (1979) Correlation of pathogenicity and gene constellation of influenza A viruses. III. Non-pathogenic recombinants derived from highly pathogenic parent strains. (Translated from eng) J Gen Virol 44(2):471-477 (in eng).
81. Salomon R, et al. (2006) The polymerase complex genes contribute to the high virulence of the human H5N1 influenza virus isolate A/Vietnam/1203/04. (Translated from eng) J Exp Med 203(3):689-697 (in eng).
82. Watanabe T, et al. (2009) Viral RNA polymerase complex promotes optimal growth of 1918 virus in the lower respiratory tract of ferrets. (Translated from eng) Proc Natl Acad Sci U S A 106(2):588-592 (in eng).
83. Kim JH, et al. (2009) Role of host-specific amino acids in the pathogenicity of avian H5N1 influenza viruses in mice. (Translated from Eng) J Gen Virol (in Eng).
84. Song MS, et al. (2009) The polymerase acidic protein gene of influenza a virus contributes to pathogenicity in a mouse model. (Translated from eng) J Virol 83(23):12325-12335 (in eng).
85. Kawaoka Y, Krauss S, & Webster RG (1989) Avian-to-human transmission of the PB1 gene of influenza A viruses in the 1957 and 1968 pandemics. (Translated from eng) J Virol 63(11):4603-4608 (in eng).
86. Naffakh N, Massin P, Escriou N, Crescenzo-Chaigne B, & van der Werf S (2000) Genetic analysis of the compatibility between polymerase proteins from human and avian strains of influenza A viruses. (Translated from eng) J Gen Virol 81(Pt 5):1283-1291 (in eng).
87. Li Z, et al. (2005) Molecular basis of replication of duck H5N1 influenza viruses in a mammalian mouse model. (Translated from eng) J Virol 79(18):12058-12064 (in eng).
88. Munster VJ, et al. (2007) The molecular basis of the pathogenicity of the Dutch highly pathogenic human influenza A H7N7 viruses. (Translated from eng) J Infect Dis 196(2):258-265 (in eng).
89. Fouchier RA, et al. (2004) Avian influenza A virus (H7N7) associated with human conjunctivitis and a fatal case of acute respiratory distress syndrome. (Translated from eng) Proc Natl Acad Sci U S A 101(5):1356-1361 (in eng).
90. Puthavathana P, et al. (2005) Molecular characterization of the complete genome of human influenza H5N1 virus isolates from Thailand. (Translated from eng) J Gen Virol 86(Pt 2):423-433 (in eng).

5. References
104
91. Subbarao EK, London W, & Murphy BR (1993) A single amino acid in the PB2 gene of influenza A virus is a determinant of host range. (Translated from eng) J Virol 67(4):1761-1764 (in eng).
92. Hatta M, Gao P, Halfmann P, & Kawaoka Y (2001) Molecular basis for high virulence of Hong Kong H5N1 influenza A viruses. (Translated from eng) Science 293(5536):1840-1842 (in eng).
93. Shinya K, et al. (2004) PB2 amino acid at position 627 affects replicative efficiency, but not cell tropism, of Hong Kong H5N1 influenza A viruses in mice. (Translated from eng) Virology 320(2):258-266 (in eng).
94. Steel J, Lowen AC, Mubareka S, & Palese P (2009) Transmission of influenza virus in a mammalian host is increased by PB2 amino acids 627K or 627E/701N. (Translated from eng) PLoS Pathog 5(1):e1000252 (in eng).
95. Mehle A & Doudna JA (2008) An inhibitory activity in human cells restricts the function of an avian-like influenza virus polymerase. (Translated from eng) Cell Host Microbe 4(2):111-122 (in eng).
96. Hatta M, et al. (2007) Growth of H5N1 influenza A viruses in the upper respiratory tracts of mice. (Translated from eng) PLoS Pathog 3(10):1374-1379 (in eng).
97. Rameix-Welti MA, Tomoiu A, Dos Santos Afonso E, van der Werf S, & Naffakh N (2009) Avian Influenza A virus polymerase association with nucleoprotein, but not polymerase assembly, is impaired in human cells during the course of infection. (Translated from eng) J Virol 83(3):1320-1331 (in eng).
98. Manzoor R, et al. (2009) PB2 protein of a highly pathogenic avian influenza virus strain A/chicken/Yamaguchi/7/2004 (H5N1) determines its replication potential in pigs. (Translated from eng) J Virol 83(4):1572-1578 (in eng).
99. Fraser C, et al. (2009) Pandemic potential of a strain of influenza A (H1N1): early findings. (Translated from eng) Science 324(5934):1557-1561 (in eng).
100. Dawood FS, et al. (2009) Emergence of a novel swine-origin influenza A (H1N1) virus in humans. (Translated from eng) N Engl J Med 360(25):2605-2615 (in eng).
101. Munster VJ, et al. (2009) Pathogenesis and transmission of swine-origin 2009 A(H1N1) influenza virus in ferrets. (Translated from eng) Science 325(5939):481-483 (in eng).
102. Maines TR, et al. (2009) Transmission and pathogenesis of swine-origin 2009 A(H1N1) influenza viruses in ferrets and mice. (Translated from eng) Science 325(5939):484-487 (in eng).
103. Itoh Y, et al. (2009) In vitro and in vivo characterization of new swine-origin H1N1 influenza viruses. (Translated from eng) Nature 460(7258):1021-1025 (in eng).
104. Mehle A & Doudna JA (2009) Adaptive strategies of the influenza virus polymerase for replication in humans. (Translated from eng) Proc Natl Acad Sci U S A 106(50):21312-21316 (in eng).
105. Clements ML, et al. (1992) Use of single-gene reassortant viruses to study the role of avian influenza A virus genes in attenuation of wild-type human influenza A virus for squirrel monkeys and adult human volunteers. (Translated from eng) J Clin Microbiol 30(3):655-662 (in eng).
106. Takeda J & Kinoshita T (1995) GPI-anchor biosynthesis. Trends Biochem Sci 20(9):367-371.
107. Wasilenko JL, Sarmento L, & Pantin-Jackwood MJ (2009) A single substitution in amino acid 184 of the NP protein alters the replication and pathogenicity of H5N1 avian influenza viruses in chickens. (Translated from eng) Arch Virol 154(6):969-979 (in eng).

5. References
105
108. Wasilenko JL, et al. (2008) NP, PB1, and PB2 viral genes contribute to altered replication of H5N1 avian influenza viruses in chickens. (Translated from eng) J Virol 82(9):4544-4553 (in eng).
109. Gabriel G, Herwig A, & Klenk HD (2008) Interaction of polymerase subunit PB2 and NP with importin alpha1 is a determinant of host range of influenza A virus. (Translated from eng) PLoS Pathog 4(2):e11 (in eng).
110. Suarez DL & Perdue ML (1998) Multiple alignment comparison of the non-structural genes of influenza A viruses. (Translated from eng) Virus Res 54(1):59-69 (in eng).
111. Melen K, et al. (2007) Nuclear and nucleolar targeting of influenza A virus NS1 protein: striking differences between different virus subtypes. (Translated from eng) J Virol 81(11):5995-6006 (in eng).
112. Chien CY, et al. (2004) Biophysical characterization of the complex between double-stranded RNA and the N-terminal domain of the NS1 protein from influenza A virus: evidence for a novel RNA-binding mode. (Translated from eng) Biochemistry 43(7):1950-1962 (in eng).
113. Hatada E & Fukuda R (1992) Binding of influenza A virus NS1 protein to dsRNA in vitro. J Gen Virol 73 ( Pt 12):3325-3329.
114. Qian XY, Chien CY, Lu Y, Montelione GT, & Krug RM (1995) An amino-terminal polypeptide fragment of the influenza virus NS1 protein possesses specific RNA-binding activity and largely helical backbone structure. (Translated from eng) RNA 1(9):948-956 (in eng).
115. Wang X, et al. (2002) Functional replacement of the carboxy-terminal two-thirds of the influenza A virus NS1 protein with short heterologous dimerization domains. (Translated from eng) J Virol 76(24):12951-12962 (in eng).
116. Nemeroff ME, Qian XY, & Krug RM (1995) The influenza virus NS1 protein forms multimers in vitro and in vivo. (Translated from eng) Virology 212(2):422-428 (in eng).
117. Wang W, et al. (1999) RNA binding by the novel helical domain of the influenza virus NS1 protein requires its dimer structure and a small number of specific basic amino acids. (Translated from eng) RNA 5(2):195-205 (in eng).
118. Yin C, et al. (2007) Conserved surface features form the double-stranded RNA binding site of non-structural protein 1 (NS1) from influenza A and B viruses. (Translated from eng) J Biol Chem 282(28):20584-20592 (in eng).
119. Greenspan D, Palese P, & Krystal M (1988) Two nuclear location signals in the influenza virus NS1 nonstructural protein. (Translated from eng) J Virol 62(8):3020-3026 (in eng).
120. Newby CM, Sabin L, & Pekosz A (2007) The RNA binding domain of influenza A virus NS1 protein affects secretion of tumor necrosis factor alpha, interleukin-6, and interferon in primary murine tracheal epithelial cells. (Translated from eng) J Virol 81(17):9469-9480 (in eng).
121. Garaigorta U, Falcon AM, & Ortin J (2005) Genetic analysis of influenza virus NS1 gene: a temperature-sensitive mutant shows defective formation of virus particles. (Translated from eng) J Virol 79(24):15246-15257 (in eng).
122. Sato Y, et al. (2003) Localization of influenza virus proteins to nuclear dot 10 structures in influenza virus-infected cells. (Translated from eng) Virology 310(1):29-40 (in eng).
123. Ozaki H & Kida H (2007) Extensive accumulation of influenza virus NS1 protein in the nuclei causes effective viral growth in vero cells. (Translated from eng) Microbiol Immunol 51(5):577-580 (in eng).

5. References
106
124. Li Y, Yamakita Y, & Krug RM (1998) Regulation of a nuclear export signal by an adjacent inhibitory sequence: the effector domain of the influenza virus NS1 protein. (Translated from eng) Proc Natl Acad Sci U S A 95(9):4864-4869 (in eng).
125. Hale BG, Randall RE, Ortin J, & Jackson D (2008) The multifunctional NS1 protein of influenza A viruses. (Translated from eng) J Gen Virol 89(Pt 10):2359-2376 (in eng).
126. Garaigorta U & Ortin J (2007) Mutation analysis of a recombinant NS replicon shows that influenza virus NS1 protein blocks the splicing and nucleo-cytoplasmic transport of its own viral mRNA. (Translated from eng) Nucleic Acids Res 35(14):4573-4582 (in eng).
127. Li Y, Chen ZY, Wang W, Baker CC, & Krug RM (2001) The 3'-end-processing factor CPSF is required for the splicing of single-intron pre-mRNAs in vivo. Rna 7(6):920-931.
128. Fortes P, Beloso A, & Ortin J (1994) Influenza virus NS1 protein inhibits pre-mRNA splicing and blocks mRNA nucleocytoplasmic transport. Embo J 13(3):704-712.
129. Muraki Y, et al. (2010) Influenza C virus NS1 protein upregulates the splicing of viral mRNAs. (Translated from eng) J Virol 84(4):1957-1966 (in eng).
130. Alonso-Caplen FV & Krug RM (1991) Regulation of the extent of splicing of influenza virus NS1 mRNA: role of the rates of splicing and of the nucleocytoplasmic transport of NS1 mRNA. (Translated from eng) Mol Cell Biol 11(2):1092-1098 (in eng).
131. Alonso-Caplen FV, Nemeroff ME, Qiu Y, & Krug RM (1992) Nucleocytoplasmic transport: the influenza virus NS1 protein regulates the transport of spliced NS2 mRNA and its precursor NS1 mRNA. (Translated from eng) Genes Dev 6(2):255-267 (in eng).
132. Wolff T, O'Neill RE, & Palese P (1998) NS1-Binding protein (NS1-BP): a novel human protein that interacts with the influenza A virus nonstructural NS1 protein is relocalized in the nuclei of infected cells. J Virol 72(9):7170-7180.
133. Fortes P, Lamond AI, & Ortin J (1995) Influenza virus NS1 protein alters the subnuclear localization of cellular splicing components. (Translated from eng) J Gen Virol 76 ( Pt 4):1001-1007 (in eng).
134. Lu Y, Qian XY, & Krug RM (1994) The influenza virus NS1 protein: a novel inhibitor of pre-mRNA splicing. Genes Dev 8(15):1817-1828.
135. Qiu Y, Nemeroff M, & Krug RM (1995) The influenza virus NS1 protein binds to a specific region in human U6 snRNA and inhibits U6-U2 and U6-U4 snRNA interactions during splicing. (Translated from eng) RNA 1(3):304-316 (in eng).
136. Wang W & Krug RM (1998) U6atac snRNA, the highly divergent counterpart of U6 snRNA, is the specific target that mediates inhibition of AT-AC splicing by the influenza virus NS1 protein. (Translated from eng) RNA 4(1):55-64 (in eng).
137. de la Luna S, Fortes P, Beloso A, & Ortin J (1995) Influenza virus NS1 protein enhances the rate of translation initiation of viral mRNAs. (Translated from eng) J Virol 69(4):2427-2433 (in eng).
138. Salvatore M, et al. (2002) Effects of influenza A virus NS1 protein on protein expression: the NS1 protein enhances translation and is not required for shutoff of host protein synthesis. (Translated from eng) J Virol 76(3):1206-1212 (in eng).
139. Enami K, Sato TA, Nakada S, & Enami M (1994) Influenza virus NS1 protein stimulates translation of the M1 protein. (Translated from eng) J Virol 68(3):1432-1437 (in eng).
140. Park YW & Katze MG (1995) Translational control by influenza virus. Identification of cis-acting sequences and trans-acting factors which may regulate selective viral mRNA translation. (Translated from eng) J Biol Chem 270(47):28433-28439 (in eng).

5. References
107
141. Feigenblum D & Schneider RJ (1993) Modification of eukaryotic initiation factor 4F during infection by influenza virus. (Translated from eng) J Virol 67(6):3027-3035 (in eng).
142. Aragon T, et al. (2000) Eukaryotic translation initiation factor 4GI is a cellular target for NS1 protein, a translational activator of influenza virus. (Translated from eng) Mol Cell Biol 20(17):6259-6268 (in eng).
143. Burgui I, Aragon T, Ortin J, & Nieto A (2003) PABP1 and eIF4GI associate with influenza virus NS1 protein in viral mRNA translation initiation complexes. (Translated from eng) J Gen Virol 84(Pt 12):3263-3274 (in eng).
144. Falcon AM, Fortes P, Marion RM, Beloso A, & Ortin J (1999) Interaction of influenza virus NS1 protein and the human homologue of Staufen in vivo and in vitro. (Translated from eng) Nucleic Acids Res 27(11):2241-2247 (in eng).
145. Qiu Y & Krug RM (1994) The influenza virus NS1 protein is a poly(A)-binding protein that inhibits nuclear export of mRNAs containing poly(A). (Translated from eng) J Virol 68(4):2425-2432 (in eng).
146. Egorov A, et al. (1998) Transfectant influenza A viruses with long deletions in the NS1 protein grow efficiently in Vero cells. (Translated from eng) J Virol 72(8):6437-6441 (in eng).
147. Garcia-Sastre A, et al. (1998) Influenza A virus lacking the NS1 gene replicates in interferon-deficient systems. (Translated from eng) Virology 252(2):324-330 (in eng).
148. Kochs G, Garcia-Sastre A, & Martinez-Sobrido L (2007) Multiple anti-interferon actions of the influenza A virus NS1 protein. (Translated from eng) J Virol 81(13):7011-7021 (in eng).
149. Min JY & Krug RM (2006) The primary function of RNA binding by the influenza A virus NS1 protein in infected cells: Inhibiting the 2'-5' oligo (A) synthetase/RNase L pathway. (Translated from eng) Proc Natl Acad Sci U S A 103(18):7100-7105 (in eng).
150. Lu Y, Wambach M, Katze MG, & Krug RM (1995) Binding of the influenza virus NS1 protein to double-stranded RNA inhibits the activation of the protein kinase that phosphorylates the elF-2 translation initiation factor. Virology 214(1):222-228.
151. Hatada E, Saito S, & Fukuda R (1999) Mutant influenza viruses with a defective NS1 protein cannot block the activation of PKR in infected cells. (Translated from eng) J Virol 73(3):2425-2433 (in eng).
152. Silverman RH (2007) Viral encounters with 2',5'-oligoadenylate synthetase and RNase L during the interferon antiviral response. (Translated from eng) J Virol 81(23):12720-12729 (in eng).
153. Garcia MA, et al. (2006) Impact of protein kinase PKR in cell biology: from antiviral to antiproliferative action. (Translated from eng) Microbiol Mol Biol Rev 70(4):1032-1060 (in eng).
154. Li S, Min JY, Krug RM, & Sen GC (2006) Binding of the influenza A virus NS1 protein to PKR mediates the inhibition of its activation by either PACT or double-stranded RNA. (Translated from eng) Virology 349(1):13-21 (in eng).
155. Min JY, Li S, Sen GC, & Krug RM (2007) A site on the influenza A virus NS1 protein mediates both inhibition of PKR activation and temporal regulation of viral RNA synthesis. (Translated from eng) Virology 363(1):236-243 (in eng).
156. Weber F, Wagner V, Rasmussen SB, Hartmann R, & Paludan SR (2006) Double-stranded RNA is produced by positive-strand RNA viruses and DNA viruses but not in detectable amounts by negative-strand RNA viruses. (Translated from eng) J Virol 80(10):5059-5064 (in eng).
157. Mibayashi M, et al. (2007) Inhibition of retinoic acid-inducible gene I-mediated induction of beta interferon by the NS1 protein of influenza A virus. (Translated from eng) J Virol 81(2):514-524 (in eng).

5. References
108
158. Pichlmair A, et al. (2006) RIG-I-mediated antiviral responses to single-stranded RNA bearing 5'-phosphates. (Translated from eng) Science 314(5801):997-1001 (in eng).
159. Gack MU, et al. (2009) Influenza A virus NS1 targets the ubiquitin ligase TRIM25 to evade recognition by the host viral RNA sensor RIG-I. (Translated from eng) Cell Host Microbe 5(5):439-449 (in eng).
160. Ludwig S, et al. (2002) The influenza A virus NS1 protein inhibits activation of Jun N-terminal kinase and AP-1 transcription factors. (Translated from eng) J Virol 76(21):11166-11171 (in eng).
161. Garcia-Sastre A (2004) Identification and characterization of viral antagonists of type I interferon in negative-strand RNA viruses. (Translated from eng) Curr Top Microbiol Immunol 283:249-280 (in eng).
162. Talon J, et al. (2000) Activation of interferon regulatory factor 3 is inhibited by the influenza A virus NS1 protein. J Virol 74(17):7989-7996.
163. Wang X, et al. (2000) Influenza A virus NS1 protein prevents activation of NF-kappaB and induction of alpha/beta interferon. J Virol 74(24):11566-11573.
164. Satterly N, et al. (2007) Influenza virus targets the mRNA export machinery and the nuclear pore complex. (Translated from eng) Proc Natl Acad Sci U S A 104(6):1853-1858 (in eng).
165. Twu KY, Noah DL, Rao P, Kuo RL, & Krug RM (2006) The CPSF30 binding site on the NS1A protein of influenza A virus is a potential antiviral target. (Translated from eng) J Virol 80(8):3957-3965 (in eng).
166. Chen Z, Li Y, & Krug RM (1999) Influenza A virus NS1 protein targets poly(A)-binding protein II of the cellular 3'-end processing machinery. Embo J 18(8):2273-2283.
167. Nemeroff ME, Barabino SM, Li Y, Keller W, & Krug RM (1998) Influenza virus NS1 protein interacts with the cellular 30 kDa subunit of CPSF and inhibits 3'end formation of cellular pre-mRNAs. Mol Cell 1(7):991-1000.
168. Hyland L, Webby R, Sandbulte MR, Clarke B, & Hou S (2006) Influenza virus NS1 protein protects against lymphohematopoietic pathogenesis in an in vivo mouse model. (Translated from eng) Virology 349(1):156-163 (in eng).
169. Fernandez-Sesma A, et al. (2006) Influenza virus evades innate and adaptive immunity via the NS1 protein. (Translated from eng) J Virol 80(13):6295-6304 (in eng).
170. Castiglioni P, Hall de S, Jacovetty EL, Ingulli E, & Zanetti M (2008) Protection against influenza A virus by memory CD8 T cells requires reactivation by bone marrow-derived dendritic cells. (Translated from eng) J Immunol 180(7):4956-4964 (in eng).
171. Palese PS, M. L (2007) rthomyxoviridae: the viruses and their replication. Fields Virology, ed Howley DMKPM (Lippincott Williams & Wilkins, Philadelphia), 5th Ed, pp 1647–1689.
172. Zhirnov OP, Konakova TE, Wolff T, & Klenk HD (2002) NS1 protein of influenza A virus down-regulates apoptosis. J Virol 76(4):1617-1625.
173. Takizawa T, Ohashi K, & Nakanishi Y (1996) Possible involvement of double-stranded RNA-activated protein kinase in cell death by influenza virus infection. (Translated from eng) J Virol 70(11):8128-8132 (in eng).
174. Ehrhardt C, Wolff T, & Ludwig S (2007) Activation of phosphatidylinositol 3-kinase signaling by the nonstructural NS1 protein is not conserved among type A and B influenza viruses. (Translated from eng) J Virol 81(21):12097-12100 (in eng).
175. Shin YK, et al. (2007) SH3 binding motif 1 in influenza A virus NS1 protein is essential for PI3K/Akt signaling pathway activation. (Translated from eng) J Virol 81(23):12730-12739 (in eng).

5. References
109
176. Zhirnov OP & Klenk HD (2007) Control of apoptosis in influenza virus-infected cells by up-regulation of Akt and p53 signaling. (Translated from eng) Apoptosis 12(8):1419-1432 (in eng).
177. Randall RE & Goodbourn S (2008) Interferons and viruses: an interplay between induction, signalling, antiviral responses and virus countermeasures. (Translated from eng) J Gen Virol 89(Pt 1):1-47 (in eng).
178. Alexopoulou L, Holt AC, Medzhitov R, & Flavell RA (2001) Recognition of double-stranded RNA and activation of NF-kappaB by Toll-like receptor 3. Nature 413(6857):732-738.
179. Yoneyama M, et al. (2004) The RNA helicase RIG-I has an essential function in double-stranded RNA-induced innate antiviral responses. Nat Immunol 5(7):730-737.
180. Andrejeva J, et al. (2004) The V proteins of paramyxoviruses bind the IFN-inducible RNA helicase, mda-5, and inhibit its activation of the IFN-beta promoter. (Translated from eng) Proc Natl Acad Sci U S A 101(49):17264-17269 (in eng).
181. Diebold SS, Kaisho T, Hemmi H, Akira S, & Reis e Sousa C (2004) Innate antiviral responses by means of TLR7-mediated recognition of single-stranded RNA. Science 303(5663):1529-1531.
182. Kato H, et al. (2005) Cell type-specific involvement of RIG-I in antiviral response. (Translated from eng) Immunity 23(1):19-28 (in eng).
183. Heil F, et al. (2004) Species-specific recognition of single-stranded RNA via toll-like receptor 7 and 8. (Translated from eng) Science 303(5663):1526-1529 (in eng).
184. Ludwig S, Pleschka S, Planz O, & Wolff T (2006) Ringing the alarm bells: signalling and apoptosis in influenza virus infected cells. Cell Microbiol 8(3):375-386.
185. Kuiken T, et al. (2006) Host species barriers to influenza virus infections. (Translated from eng) Science 312(5772):394-397 (in eng).
186. Siren J, et al. (2006) Retinoic acid inducible gene-I and mda-5 are involved in influenza A virus-induced expression of antiviral cytokines. Microbes Infect 8(8):2013-2020.
187. Ronni T, et al. (1997) Regulation of IFN-alpha/beta, MxA, 2',5'-oligoadenylate synthetase, and HLA gene expression in influenza A-infected human lung epithelial cells. J Immunol 158(5):2363-2374.
188. Durbin JE, et al. (2000) Type I IFN modulates innate and specific antiviral immunity. J Immunol 164(8):4220-4228.
189. Ivan Roitt JBaDM (1993) Immunology (Mosby-Year Book Europe Limited, London) Third Edition Ed.
190. Garcia-Sastre A, et al. (1998) The role of interferon in influenza virus tissue tropism. J Virol 72(11):8550-8558.
191. Shaw MW, Arden NH, & Maassab HF (1992) New aspects of influenza viruses. Clin Microbiol Rev 5(1):74-92.
192. Thomas PG, Keating R, Hulse-Post DJ, & Doherty PC (2006) Cell-mediated protection in influenza infection. (Translated from eng) Emerg Infect Dis 12(1):48-54 (in eng).
193. Peiris JS, Cheung CY, Leung CY, & Nicholls JM (2009) Innate immune responses to influenza A H5N1: friend or foe? (Translated from eng) Trends Immunol 30(12):574-584 (in eng).
194. Lee LY, et al. (2008) Memory T cells established by seasonal human influenza A infection cross-react with avian influenza A (H5N1) in healthy individuals. (Translated from eng) J Clin Invest 118(10):3478-3490 (in eng).
195. Takizawa T, et al. (1993) Induction of programmed cell death (apoptosis) by influenza virus infection in tissue culture cells. (Translated from eng) J Gen Virol 74 ( Pt 11):2347-2355 (in eng).

5. References
110
196. Wurzer WJ, et al. (2003) Caspase 3 activation is essential for efficient influenza virus propagation. Embo J 22(11):2717-2728.
197. Takizawa T, Fukuda R, Miyawaki T, Ohashi K, & Nakanishi Y (1995) Activation of the apoptotic Fas antigen-encoding gene upon influenza virus infection involving spontaneously produced beta-interferon. (Translated from eng) Virology 209(2):288-296 (in eng).
198. Balachandran S, et al. (2000) Essential role for the dsRNA-dependent protein kinase PKR in innate immunity to viral infection. (Translated from eng) Immunity 13(1):129-141 (in eng).
199. Shiratsuchi A, Kaido M, Takizawa T, & Nakanishi Y (2000) Phosphatidylserine-mediated phagocytosis of influenza A virus-infected cells by mouse peritoneal macrophages. (Translated from eng) J Virol 74(19):9240-9244 (in eng).
200. Bender A, et al. (1998) The distinctive features of influenza virus infection of dendritic cells. (Translated from eng) Immunobiology 198(5):552-567 (in eng).
201. Brydon EW, Smith H, & Sweet C (2003) Influenza A virus-induced apoptosis in bronchiolar epithelial (NCI-H292) cells limits pro-inflammatory cytokine release. (Translated from eng) J Gen Virol 84(Pt 9):2389-2400 (in eng).
202. Uiprasertkul M, et al. (2007) Apoptosis and pathogenesis of avian influenza A (H5N1) virus in humans. (Translated from eng) Emerg Infect Dis 13(5):708-712 (in eng).
203. Organization WH (2008) Cumulative Number of Confirmed Human Cases of Avian Influenza A/(H5N1) Reported to WHO.
204. Gambotto A, Barratt-Boyes SM, de Jong MD, Neumann G, & Kawaoka Y (2008) Human infection with highly pathogenic H5N1 influenza virus. (Translated from eng) Lancet 371(9622):1464-1475 (in eng).
205. Koopmans M, et al. (2004) Transmission of H7N7 avian influenza A virus to human beings during a large outbreak in commercial poultry farms in the Netherlands. (Translated from eng) Lancet 363(9409):587-593 (in eng).
206. Twu KY, Kuo RL, Marklund J, & Krug RM (2007) The H5N1 influenza virus NS genes selected after 1998 enhance virus replication in mammalian cells. (Translated from eng) J Virol 81(15):8112-8121 (in eng).
207. Ma W, et al. (2010) The NS segment of an H5N1 highly pathogenic avian influenza virus (HPAIV) is sufficient to alter replication efficiency, cell tropism, and host range of an H7N1 HPAIV. (Translated from eng) J Virol 84(4):2122-2133 (in eng).
208. Obenauer JC, et al. (2006) Large-scale sequence analysis of avian influenza isolates. (Translated from eng) Science 311(5767):1576-1580 (in eng).
209. Ludwig S, Schultz U, Mandler J, Fitch WM, & Scholtissek C (1991) Phylogenetic relationship of the nonstructural (NS) genes of influenza A viruses. (Translated from eng) Virology 183(2):566-577 (in eng).
210. Guo Y, et al. (1992) Characterization of a new avian-like influenza A virus from horses in China. (Translated from eng) Virology 188(1):245-255 (in eng).
211. Treanor JJ, Snyder MH, London WT, & Murphy BR (1989) The B allele of the NS gene of avian influenza viruses, but not the A allele, attenuates a human influenza A virus for squirrel monkeys. (Translated from eng) Virology 171(1):1-9 (in eng).
212. Ma W, et al. (2009) The NS-segment of an H5N1 highly pathogenic avian influenza virus (HPAIV) is sufficient to alter Replication Efficiency, cell tropism and host range of an H7N1 HPAIV. (Translated from Eng) J Virol (in Eng).
213. Marion RM, Zurcher T, de la Luna S, & Ortin J (1997) Influenza virus NS1 protein interacts with viral transcription-replication complexes in vivo. (Translated from eng) J Gen Virol 78 ( Pt 10):2447-2451 (in eng).

5. References
111
214. Falcon AM, et al. (2004) Defective RNA replication and late gene expression in temperature-sensitive influenza viruses expressing deleted forms of the NS1 protein. (Translated from eng) J Virol 78(8):3880-3888 (in eng).
215. Kuo RL & Krug RM (2009) Influenza a virus polymerase is an integral component of the CPSF30-NS1A protein complex in infected cells. (Translated from eng) J Virol 83(4):1611-1616 (in eng).
216. Robb NC, Smith M, Vreede FT, & Fodor E (2009) NS2/NEP protein regulates transcription and replication of the influenza virus RNA genome. (Translated from eng) J Gen Virol 90(Pt 6):1398-1407 (in eng).
217. Dauber B, et al. (2009) Influenza B virus ribonucleoprotein is a potent activator of the antiviral kinase PKR. (Translated from eng) PLoS Pathog 5(6):e1000473 (in eng).
218. Amorim MJ, Read EK, Dalton RM, Medcalf L, & Digard P (2007) Nuclear export of influenza A virus mRNAs requires ongoing RNA polymerase II activity. (Translated from eng) Traffic 8(1):1-11 (in eng).
219. Chen H, et al. (2004) The evolution of H5N1 influenza viruses in ducks in southern China. (Translated from eng) Proc Natl Acad Sci U S A 101(28):10452-10457 (in eng).
220. Li KS, et al. (2004) Genesis of a highly pathogenic and potentially pandemic H5N1 influenza virus in eastern Asia. Nature 430(6996):209-213.
221. Chen H, et al. (2006) Establishment of multiple sublineages of H5N1 influenza virus in Asia: implications for pandemic control. (Translated from eng) Proc Natl Acad Sci U S A 103(8):2845-2850 (in eng).
222. Seo SH, Hoffmann E, & Webster RG (2002) Lethal H5N1 influenza viruses escape host anti-viral cytokine responses. (Translated from eng) Nat Med 8(9):950-954 (in eng).
223. Lipatov AS, et al. (2005) Pathogenesis of Hong Kong H5N1 influenza virus NS gene reassortants in mice: the role of cytokines and B- and T-cell responses. (Translated from eng) J Gen Virol 86(Pt 4):1121-1130 (in eng).
224. Bornholdt ZA & Prasad BV (2006) X-ray structure of influenza virus NS1 effector domain. (Translated from eng) Nat Struct Mol Biol 13(6):559-560 (in eng).
225. Diaz MO, et al. (1988) Homozygous deletion of the alpha- and beta 1-interferon genes in human leukemia and derived cell lines. (Translated from eng) Proc Natl Acad Sci U S A 85(14):5259-5263 (in eng).
226. Qian XY, Alonso-Caplen F, & Krug RM (1994) Two functional domains of the influenza virus NS1 protein are required for regulation of nuclear export of mRNA. (Translated from eng) J Virol 68(4):2433-2441 (in eng).
227. Pleschka S, et al. (1996) A plasmid-based reverse genetics system for influenza A virus. (Translated from eng) J Virol 70(6):4188-4192 (in eng).
228. Pleschka S, et al. (2001) Influenza virus propagation is impaired by inhibition of the Raf/MEK/ERK signalling cascade. Nat Cell Biol 3(3):301-305.
229. Marjuki H, et al. (2006) Membrane accumulation of influenza A virus hemagglutinin triggers nuclear export of the viral genome via protein kinase Calpha-mediated activation of ERK signaling. (Translated from eng) The Journal of biological chemistry 281(24):16707-16715 (in eng).
230. Ludwig S, et al. (2004) MEK inhibition impairs influenza B virus propagation without emergence of resistant variants. FEBS Lett 561(1-3):37-43.
231. Marjuki H, et al. (2007) Higher polymerase activity of a human influenza virus enhances activation of the hemagglutinin-induced Raf/MEK/ERK signal cascade. (Translated from Eng) Virol J 4(1):134 (in Eng).
232. Cilloniz C, et al. (2009) Lethal influenza virus infection in macaques is associated with early dysregulation of inflammatory related genes. (Translated from eng) PLoS Pathog 5(10):e1000604 (in eng).
5. References
112
233. Zamanian-Daryoush M, Mogensen TH, DiDonato JA, & Williams BR (2000) NF-kappaB activation by double-stranded-RNA-activated protein kinase (PKR) is mediated through NF-kappaB-inducing kinase and IkappaB kinase. (Translated from eng) Molecular and cellular biology 20(4):1278-1290 (in eng).
234. Bergmann M, et al. (2000) Influenza virus NS1 protein counteracts PKR-mediated inhibition of replication. (Translated from eng) J Virol 74(13):6203-6206 (in eng).
235. Desmyter J, Melnick JL, & Rawls WE (1968) Defectiveness of interferon production and of rubella virus interference in a line of African green monkey kidney cells (Vero). (Translated from eng) J Virol 2(10):955-961 (in eng).
236. Boyle KA, Pietropaolo RL, & Compton T (1999) Engagement of the cellular receptor for glycoprotein B of human cytomegalovirus activates the interferon-responsive pathway. (Translated from eng) Mol Cell Biol 19(5):3607-3613 (in eng).
237. Mossman KL, et al. (2001) Herpes simplex virus triggers and then disarms a host antiviral response. (Translated from eng) J Virol 75(2):750-758 (in eng).
238. Netterwald JR, et al. (2004) Postattachment events associated with viral entry are necessary for induction of interferon-stimulated genes by human cytomegalovirus. (Translated from eng) J Virol 78(12):6688-6691 (in eng).
239. Preston CM, Harman AN, & Nicholl MJ (2001) Activation of interferon response factor-3 in human cells infected with herpes simplex virus type 1 or human cytomegalovirus. (Translated from eng) J Virol 75(19):8909-8916 (in eng).
240. tenOever BR, Servant MJ, Grandvaux N, Lin R, & Hiscott J (2002) Recognition of the measles virus nucleocapsid as a mechanism of IRF-3 activation. (Translated from eng) J Virol 76(8):3659-3669 (in eng).
241. Basler CF, et al. (2001) Sequence of the 1918 pandemic influenza virus nonstructural gene (NS) segment and characterization of recombinant viruses bearing the 1918 NS genes. (Translated from eng) Proc Natl Acad Sci U S A 98(5):2746-2751 (in eng).
242. Wang W, et al. (2008) Imaging and characterizing influenza A virus mRNA transport in living cells. (Translated from eng) Nucleic Acids Res 36(15):4913-4928 (in eng).
243. Briedis DJ, Conti G, Munn EA, & Mahy BW (1981) Migration of influenza virus-specific polypeptides from cytoplasm to nucleus of infected cells. (Translated from eng) Virology 111(1):154-164 (in eng).
244. Newcomb LL, et al. (2009) Interaction of the influenza a virus nucleocapsid protein with the viral RNA polymerase potentiates unprimed viral RNA replication. (Translated from eng) J Virol 83(1):29-36 (in eng).
245. Jorba N, et al. (2008) Analysis of the interaction of influenza virus polymerase complex with human cell factors. (Translated from eng) Proteomics 8(10):2077-2088 (in eng).
246. Nagata K, Kawaguchi A, & Naito T (2008) Host factors for replication and transcription of the influenza virus genome. (Translated from eng) Rev Med Virol 18(4):247-260 (in eng).
247. Shimizu K, Handa H, Nakada S, & Nagata K (1994) Regulation of influenza virus RNA polymerase activity by cellular and viral factors. (Translated from eng) Nucleic Acids Res 22(23):5047-5053 (in eng).
248. Hayman A, et al. (2006) Variation in the ability of human influenza A viruses to induce and inhibit the IFN-beta pathway. (Translated from eng) Virology 347(1):52-64 (in eng).
249. Peiris JS, Poon LM, Nicholls JM, & Guan Y (2009) The role of influenza virus gene constellation and viral morphology on cytokine induction, pathogenesis, and viral virulence. (Translated from eng) Hong Kong Med J 15(3 Suppl 4):21-23 (in eng).
250. Smith EJ, Marie I, Prakash A, Garcia-Sastre A, & Levy DE (2001) IRF3 and IRF7 phosphorylation in virus-infected cells does not require double-stranded RNA-

5. References
113
dependent protein kinase R or Ikappa B kinase but is blocked by Vaccinia virus E3L protein. J Biol Chem 276(12):8951-8957.
251. Jagus R, Joshi B, & Barber GN (1999) PKR, apoptosis and cancer. (Translated from eng) Int J Biochem Cell Biol 31(1):123-138 (in eng).

Appendices
114
Appendices
Acknowledgements
The work presented in this thesis was carried out at the Institute for Medical Virology during
the period from 2006 to 2010 and the promotion was done in the Faculty of Biology, Justus-
Liebig-University Giessen, Germany and was financially supported by the international
graduate colleges GRK1384 funded by the “German Research Foundation (DFG)”, which is a
project of the „International Research Training Group (IRTG): Enzymes and Multienzyme
Complexes acting on Nucleic Acids“.
During the past three years of lab work, I got a lot of help and encouragements from my
colleagues of my lab, my institute and my graduate school. Firstly, I would like to thank Prof.
Dr. Stephan Pleschka, it is him to give me the opportunity to finish my PhD work in the field
of influenza virus. I have greatly benefited from his vast scientific knowledge about influenza
and his excellent national and international network (FluResearchNet, EuroFlu). He gave me
fully support and fully trusts to do what I planned to do and always supported me to discover
and try new ideas. Especially, in the last stage of my PhD study, he had heart operation but he
tried his best to help me to correct my thesis and my paper, I know it means a lot, thanks a lot.
Secondly I would to be grateful to my lab colleagues Mr. Michael Stein and Miss Eva Ulrike
Lenz, without their excellent technical assistance, I could not do my thesis work. They helped
me and encouraged me, shared the happiness and sorrows originated from the experiments
with me. Finally I am sincerely thankful to my former colleague, Julia Lampe, Ruth Pinto and
Mohammad Intakhab Alam for the colaboration during my study in Giessen.
I am sincerely thankful to Prof. Dr. Peter Friedhoff for reviewing my dissertation. I greatly
appreciate Prof. Dr. Alfred Pingoud, Prof. Dr. Peter Freidhoff, Dr. Anja Drescher from the
graduate school GRK1384. Every time when I had problems, I went to Dr. Anja Drescher and
I will see her smiling face and got great helps from her. Further I would like to thank the
director of the institute, Prof. Dr. Wolfram Gerlich for providing me the chance to work in an
outstanding institute.
Particularly, I deeply thank to my dear wife Jie Gao (M.Sc), who is lovely, beautiful and
always try to be perfect, and who has done her best to support me and provide me the
motivation to achieve more in my career.

Appendices
115
Abbreviations
aa amino acids
Amp. ampicillin
APS ammonium persulfate
AI avian influenza
AIV avian influenza virus
bp base pairs
BSA bovine serum albumin
°C grade celcius
cm centimetre
DAG diacylglycerol
ddH2O deionized distilled water
DMEM Dulbecco's Modified Eagle's medium
DMSO dimethylsulfoxide
DNA deoxyribonucleic acid
dNTP deoxynucleoside triphosphate
DTT dithiothreitol
EDTA ethylenediamine tetraacetic acid
ECL enhanced chemoluminiscence
eIF2 eukaryotic translation initiation factor 2
ERK extracellular signal regulated kinase
et al. et alii (and others)
FCS fetal calf serum
FFU foci forming unit(s)
FPV fowl plague virus
g gram
h hour(s)
HA hemagglutinin
HEPES N-2-hydroxyethylpiperazine
HPAIV highly pathogenic avian influenza virus
IFA indirect immunofluoresces assay
IFN interferon
IRF3 IFN regulatory factor 3
kb kilobase pairs

Appendices
116
LPAIV lowly pathogenic avian influenza virus
M molar
M1 matrixprotein
M2 ion channel protein
MAPK mitogen-activated protein kinase
MAPKK MAPK kinase
MAPKKK MAPKK kinase
MEK MAPK/ERK activated kinase
MEKK MAPK/ERK activated kinase Kinase
MCD methyl-ß-cyclodextrin
mg milligram
min minute(s)
ml milliliter
mM millimolar
m.o.i. multiplicity of infection
mRNA messenger RNA
NA neuraminidase
NCR noncoding region(s)
NEP/NS2 nuclear export factor
NES nuclear export signal
NLS nuclear location signal
NP nucleocapsidprotein
NPC nuclear pore complex
NS1 nonstructural protein
ng nanogram
nt nucleotide(s)
OD optical density
PA subunit of RDRP
PAGE polyacrylamide gel eletrophoresis
PB1 subunit of RDRP
PB2 subunit of RDRP
PBS phosphate buffered saline
PCR polymerase chain reaction
PFU plaque forming unit(s)

Appendices
117
p.i. post infection
PKR dsRNA activated protein kinase
pmol picomolar
PolyA polyadenylic acid
Pol I RNA polymerase I
p.t. post transfection
RDRP RNA-dependent RNA-polymerase
RNA ribonucleic acid
RNPs ribonucleoproteins
rpm rounds per minute
RSK ribosomal S6 kinase
RTK receptor tyrosine kinase
s second(s)
SDS sodium dodecyl sulfate
TEMED N,N,N',N'-tetramethylethylenediamine
TPA 12-O-Tetradecanoylphorbol 13-acetate
Tris tris-hydroxymethylaminomethane
Tween 20 polyoxyethylenesorbiten monolaurate
V volt
vRNA viral RNA
v/v volume percentage
w/v weight percentage
µg microgram
µl microliter
µM micromolar