Mapping Alpine Landscape Values and Related Threats as Perceived by Tourists
17
This article was downloaded by: [94.160.44.177] On: 11 July 2014, At: 16:18 Publisher: Routledge Informa Ltd Registered in England and Wales Registered Number: 1072954 Registered office: Mortimer House, 37-41 Mortimer Street, London W1T 3JH, UK Landscape Research Publication details, including instructions for authors and subscription information: http://www.tandfonline.com/loi/clar20 Mapping Alpine Landscape Values and Related Threats as Perceived by Tourists Rocco Scolozzi a , Uta Schirpke b , Carlo Detassis c , Sabah Abdullah d & Alessandro Gretter c a University of Minho, Braga, Portugal b Institute for Alpine Environment, EURAC research, Bolzano, Italy c IASMA Fondazione Edmund Mach, San Michele all’Adige, Italy d Fondazione Eni Enrico Mattei (FEEM), Milan, Italy Published online: 09 Jul 2014. To cite this article: Rocco Scolozzi, Uta Schirpke, Carlo Detassis, Sabah Abdullah & Alessandro Gretter (2014): Mapping Alpine Landscape Values and Related Threats as Perceived by Tourists, Landscape Research, DOI: 10.1080/01426397.2014.902921 To link to this article: http://dx.doi.org/10.1080/01426397.2014.902921 PLEASE SCROLL DOWN FOR ARTICLE Taylor & Francis makes every effort to ensure the accuracy of all the information (the “Content”) contained in the publications on our platform. However, Taylor & Francis, our agents, and our licensors make no representations or warranties whatsoever as to the accuracy, completeness, or suitability for any purpose of the Content. Any opinions and views expressed in this publication are the opinions and views of the authors, and are not the views of or endorsed by Taylor & Francis. The accuracy of the Content should not be relied upon and should be independently verified with primary sources of information. Taylor and Francis shall not be liable for any losses, actions, claims, proceedings, demands, costs, expenses, damages, and other liabilities whatsoever or howsoever caused arising directly or indirectly in connection with, in relation to or arising out of the use of the Content. This article may be used for research, teaching, and private study purposes. Any substantial or systematic reproduction, redistribution, reselling, loan, sub-licensing, systematic supply, or distribution in any form to anyone is expressly forbidden. Terms &
Transcript of Mapping Alpine Landscape Values and Related Threats as Perceived by Tourists

This article was downloaded by: [94.160.44.177]On: 11 July 2014, At: 16:18Publisher: RoutledgeInforma Ltd Registered in England and Wales Registered Number: 1072954 Registeredoffice: Mortimer House, 37-41 Mortimer Street, London W1T 3JH, UK
Landscape ResearchPublication details, including instructions for authors andsubscription information:http://www.tandfonline.com/loi/clar20
Mapping Alpine Landscape Valuesand Related Threats as Perceived byTouristsRocco Scolozzia, Uta Schirpkeb, Carlo Detassisc, Sabah Abdullahd &Alessandro Gretterc
a University of Minho, Braga, Portugalb Institute for Alpine Environment, EURAC research, Bolzano, Italyc IASMA Fondazione Edmund Mach, San Michele all’Adige, Italyd Fondazione Eni Enrico Mattei (FEEM), Milan, ItalyPublished online: 09 Jul 2014.
To cite this article: Rocco Scolozzi, Uta Schirpke, Carlo Detassis, Sabah Abdullah & AlessandroGretter (2014): Mapping Alpine Landscape Values and Related Threats as Perceived by Tourists,Landscape Research, DOI: 10.1080/01426397.2014.902921
To link to this article: http://dx.doi.org/10.1080/01426397.2014.902921
PLEASE SCROLL DOWN FOR ARTICLE
Taylor & Francis makes every effort to ensure the accuracy of all the information (the“Content”) contained in the publications on our platform. However, Taylor & Francis,our agents, and our licensors make no representations or warranties whatsoever as tothe accuracy, completeness, or suitability for any purpose of the Content. Any opinionsand views expressed in this publication are the opinions and views of the authors,and are not the views of or endorsed by Taylor & Francis. The accuracy of the Contentshould not be relied upon and should be independently verified with primary sourcesof information. Taylor and Francis shall not be liable for any losses, actions, claims,proceedings, demands, costs, expenses, damages, and other liabilities whatsoever orhowsoever caused arising directly or indirectly in connection with, in relation to or arisingout of the use of the Content.
This article may be used for research, teaching, and private study purposes. Anysubstantial or systematic reproduction, redistribution, reselling, loan, sub-licensing,systematic supply, or distribution in any form to anyone is expressly forbidden. Terms &

Conditions of access and use can be found at http://www.tandfonline.com/page/terms-and-conditions
Dow
nloa
ded
by [
94.1
60.4
4.17
7] a
t 16:
18 1
1 Ju
ly 2
014
Mapping Alpine Landscape Values andRelated Threats as Perceived by Tourists
ROCCO SCOLOZZI*, UTA SCHIRPKE**, CARLO DETASSIS†,SABAH ABDULLAH‡ & ALESSANDRO GRETTER†,1*University of Minho, Braga, Portugal; **Institute for Alpine Environment, EURAC research, Bolzano, Italy;†IASMA Fondazione Edmund Mach, San Michele all’Adige, Italy; ‡Fondazione Eni Enrico Mattei (FEEM),Milan, Italy
ABSTRACT Alpine environments are increasingly appreciated by nature-based tourism,notwithstanding recent economic crises. To benefit from this and maintain the attractiveness of atourist destination, it is important to recognise the values of landscapes. We developed and testeda qualitative spatial valuation methodology, integrating existing quantitative survey methods, tosupport destination management and landscape planning at the local level. Data were collectedthrough semi-structured interviews and a mapping exercise at a nature-based tourism destinationin northern Italy. In identifying and mapping tourists’ perceived landscape values and relatedthreats, we also considered tourist profiles, experiences and preferences. The results indicatedthree tourist types (active seniors, families and sportive visitors). They identified five differentlandscape values (scenic, outdoor activity, aesthetic, historical-cultural and tranquillity) andseven categories of threats (urbanisation, lack of maintenance, congestion, visual and/or acousticdisturbance, pollution, overuse, and traffic). The maps show diverse ‘tourism landscapes’ andprovide useful insights into sites with high value or with potential conflict between rival uses,which can effectively ground proposals for the management of valued sites and support localspatial planning to maintain perceived landscape values.
KEY WORDS: Nature-based tourism, participatory GIS, landscape assessment, sustainable tourism,Alps
1. Introduction
Nature-based tourism relies on a combination of education, recreation and adventure,including interaction with natural assets such as lakes, forests and mountains, as well as airand snow, together with infrastructures such as accommodation and transportation(Laarman & Gregersen, 1996). Tourists select their destination—and possibly return—based on their subjective perceptions and experiences of natural resources and the socialenvironment (Beerli & Martín, 2004a; Goossens, 2000).Whilst the growth of the tourismsector has positive effects on the local economy, a rapid tourist inflow towards naturalenvironments often leads to environmental degradation (Neto, 2003), negatively affectingthe values attached to the places by tourists and having a detrimental impact on the local
Correspondence Address: Rocco Scolozzi, University of Minho, Braga, Portugal. Email:[email protected] address: Institute of Geography, University of Innsbruck, Austria.
© 2014 Landscape Research Group Ltd
Landscape Research, 2014http://dx.doi.org/10.1080/01426397.2014.902921
Dow
nloa
ded
by [
94.1
60.4
4.17
7] a
t 16:
18 1
1 Ju
ly 2
014

economy (Romeril, 1989). In highly populated regions, outdoor recreational use can easilybecome intensive and people may feel disturbed by others, perceiving overcrowding.Conflicts between different user groups (for example between cyclists and hikers) havebecome a common issue in most of Europe, for example in Belgium, Denmark, Germanyand the Netherlands (Bell, Tyrväinen, Sievänen, Pröbstl, & Simpson, 2007).
The relevance of such negative effects depends on several factors, including theobjectives for which an area is managed, the values that are placed on the environment,the cause of the effects, and the trade-offs between the benefits from tourismdevelopment and the costs to the environment (McCool & Lime, 2001).
Most of these factors depend upon the local context; thus, spatial information on thevalues attached to the environment derived from visitors is decisive in terms ofsupporting decision-making for landscape conservation and planning of local touristattractions and recreation opportunities (Dredge, 1999). To support such environmentaldecisions, surveys have been combined with Geographical Information Systems toidentify place values (Brown & Raymond, 2007).The assessment of landscape visualquality has been used as a tool for the conservation and management of rurallandscapes (Angler & Toccolini, 1993; Daniel, 2001), which are being reconsidered asareas rich in natural amenities and visual quality.
Since the 1960s, the US Forest Service has been undertaking research to provideinformation on the recreational use of forests, including scenic quality assessments andanalyses regarding the effects of changes in landscapes on recreation activities (USDAForest Service, 2013). With the recent rise in digital landscape visualisations,sophisticated and advanced Geographic Information System (GIS) tools have beendeveloped using descriptive visualisations (Grêt-Regamey, Bebi, Bishop, & Schmid,2008), as have three-dimensional (3-D) visualisations with data-driven models (Lange,Hehl-Lange, & Mambretti, 2004), and even multi-sensory experiences (Eckart, 2011).More recently, methodological approaches to landscape valuation have involved users’perspectives by participatory mapping (Brown & Reed, 2012) and have includedecosystem services (Raymond et al., 2009; Sherrouse, Clement, & Semmens, 2011).Such methods include paper maps in postal surveys, electronic maps on the internet,structured interviews and facilitated group activities, all with their advantages anddisadvantages (Brown & Reed, 2012)
Most of the above-mentioned studies focus on the generalisation of results (e.g.Bishop & Hulse, 1994), inductively looking at value functions or indicators replicablebeyond the studied sites (e.g. Schirpke, Tasser, & Tappeiner, 2013). Tourism geographystudies primarily regard places (areas including features distinguishing them from otherplaces) as an element of marketing and competitiveness in relation to regional orinternational perspectives (Hall & Page, 2009). The mapping of landscape values,identifying the most and the least appreciated sites within a destination area andexploring the specific associated motivations, can provide more functional knowledgeto assist in destination management and planning. Information on local peculiaritieswould allow decision-makers to gain greater understanding of their key local resource—the landscape—helping to recognise possible strengths and weaknesses. Since theattractiveness of landscape depends upon subjective perceptions and expectations, aswell as other factors, a decline in such attractiveness may not immediately be evident interms of environmental degradation. Consequently, the negative effects on tourism may
2 R. Scolozzi et al.
Dow
nloa
ded
by [
94.1
60.4
4.17
7] a
t 16:
18 1
1 Ju
ly 2
014
be ignored. To the best of our knowledge, there has been no attempt thus far to identifyand map landscape values and related threats as perceived by tourists at the local level.
The purpose of this study was to test a new valuation approach in estimating andmapping values and threats as perceived by tourists, with the aim of supporting sustainabledestination management and landscape planning. Such an approach essentially consists ofindividual interviews and a procedure to map respondents’ evaluations, indicating thedistribution of each recognised value within a defined destination area. This paper consistsof three distinct parts. In the first part, after a brief description of the study area, we describethe proposed approach to the mapping of perceived landscape values. In the second, we testthe methodology on a case study in the Italian Alps. In the third, we discuss the results andthe potential uses by local decision-makers.
2. Case Study
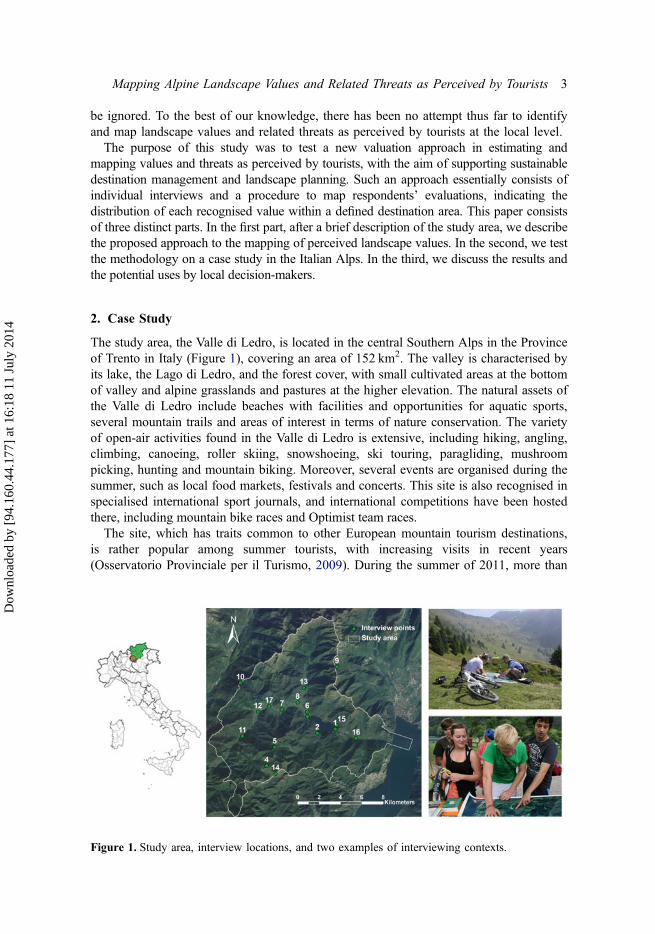
The study area, the Valle di Ledro, is located in the central Southern Alps in the Provinceof Trento in Italy (Figure 1), covering an area of 152 km2. The valley is characterised byits lake, the Lago di Ledro, and the forest cover, with small cultivated areas at the bottomof valley and alpine grasslands and pastures at the higher elevation. The natural assets ofthe Valle di Ledro include beaches with facilities and opportunities for aquatic sports,several mountain trails and areas of interest in terms of nature conservation. The varietyof open-air activities found in the Valle di Ledro is extensive, including hiking, angling,climbing, canoeing, roller skiing, snowshoeing, ski touring, paragliding, mushroompicking, hunting and mountain biking. Moreover, several events are organised during thesummer, such as local food markets, festivals and concerts. This site is also recognised inspecialised international sport journals, and international competitions have been hostedthere, including mountain bike races and Optimist team races.
The site, which has traits common to other European mountain tourism destinations,is rather popular among summer tourists, with increasing visits in recent years(Osservatorio Provinciale per il Turismo, 2009). During the summer of 2011, more than
Figure 1. Study area, interview locations, and two examples of interviewing contexts.
Mapping Alpine Landscape Values and Related Threats as Perceived by Tourists 3
Dow
nloa
ded
by [
94.1
60.4
4.17
7] a
t 16:
18 1
1 Ju
ly 2
014

86 000 tourists were recorded, in addition to the local population of about 5500inhabitants (personal communication from the local tourism board). Almost half of thetourists were from outside Italy but within Europe, mainly from Germany. Theaccommodation structures in this area primarily consist of three equipped campsites,several small hotels (< 30 rooms), a few bed and breakfasts (B&Bs) and a small sparesort. According to a survey conducted by the provincial Tourism Observatory(Osservatorio Provinciale per il Turismo, 2009), 45.8% of the tourists were attracted bythe beautiful natural environment and 24.5% by the outdoor or recreation activitiesavailable (equal percentages). More specifically, one third of the tourists coming to theValle di Ledro were motivated by the opportunity to take part in “active holidays”. Onaverage, they stayed 11 nights and 63% of them have returned several times.
3. Methods
We used a mixed methods approach to draw maps of perceived landscape values,complementing survey and spatial analysis. Our methodology consisted of a tailoredapproach in which interviewees were asked, during their holiday, to place colouredstickers on the study area map (as also by Raymond et al., 2009). In particular, themethodology consisted of the following steps:
(1) Semi-structured interviews, including the mapping of valued places and theinterpretation and categorization of information resulting from open questions.
(2) GIS analysis, that is, the identification and mapping of the landscape features asreferred to by the respondents, the mapping of landscape values according to thetotal number of mentions received, the different value categories, and therespondent types.
3.1. Interviews
The field work was undertaken during two summer seasons (August 2009 and August2010), as the Valle di Ledro is predominantly a summer destination. A total of 106respondents were involved, divided approximately equally across the two seasons. Thesample had to represent a wide range of experiential emotions, perspectives andopinions concerning the study area. For this specific reason, the interviews wereconducted in different contexts and at different times and sites, in places generallyfrequented by tourists, for example, at the end of a mountaineering activity, at the localmarket, or at the beach. In this way, it was assumed that respondents were relaxed andcould accurately recount their preferences and feelings. Specifically, the interview siteswere distributed across the study area (see the points in Figure 2), considering differentaltitudes, distances from villages and landscape types (e.g. lakes, grasslands,woodlands), or different features (such as mountain huts and hiking trails), to obtain awide variety of respondents.
The participants were selected randomly by inviting individuals who were passingthe survey point to be interviewed without further criteria for selection; in addition, toavoid homogeneous samples, the interviews were conducted for a maximum time of1.5 h for each survey point, defined according to a trade-off between the number of
4 R. Scolozzi et al.
Dow
nloa
ded
by [
94.1
60.4
4.17
7] a
t 16:
18 1
1 Ju
ly 2
014

interviews per site and the number of sites. We expected that sampling a full day at thesame site (e.g. local market) would be likely to provide a more homogeneous sample ofpeople (e.g. older people, residents in urban areas). The average time of an interviewwas 25 min., with a maximum duration of about 50 min. The languages used wereItalian and English, depending on whether the interviewee was Italian or foreign.
As an aid to collect spatially explicit information, we used a printed aerial colourorthophotograph of the study area (dimensions A0, 841 mm × 1189 mm). The aerialphotograph, at an approximate scale of 1:27 000 and a resolution (pixel size) of 0.5 m,clearly showed major roads and settlements and primary cover types (i.e. rocks, lakes,alpine pastures, woods).
The complete set of open questions asked during the interviews is reported inTable 1. The respondents were asked to identify their subjectively valued places on theprinted map, using 10 green sticky labels, and to specify the particular value associatedwith these sites. In this way, the respondents were free to express their own opinionsand share their motivations and experiences about the sites without a pre-defined (andthus limited and easily biased) set of values. In particular, we took note of all adjectivesor spatial attributes tourists expressed in their stories about their experiences andlandscape values at the destination area. A maximum number of 10 labels was assignedbased on the limited set of sites (i.e. approximately 15–20 sites) designated in touristmaps or guides.
Figure 2. Perceived landscape values: a) total score, b) tranquillity, c) aesthetic, d) historical-cultural,e) outdoor activity and f) nature and scenic value.
Mapping Alpine Landscape Values and Related Threats as Perceived by Tourists 5
Dow
nloa
ded
by [
94.1
60.4
4.17
7] a
t 16:
18 1
1 Ju
ly 2
014

The respondents were then asked to identify places perceived as threatened or at riskof losing their values, using five red sticky labels and expressing their opinions aboutpossible problems in the area. The rationale for using a maximum of five labels wasthat we assumed there would be fewer possible problematic places (as the area isappreciated by the many tourists travelling from a considerable distance) and also wewere inviting the respondents to be more selective. Concerning both the green(positive) and the red (negative) value labels, the respondents could assign a weightingindicating the importance of each site using more than one label. Once the participantshad placed all their stickers on the map, the interviewer recorded these stickers bytaking a picture. Subsequently, this information was spatially referenced onto a GISlayer and integrated into the analysis of the open questions.
Table 1. Interview structure
Type of information Questions
General motivation, previous visits � Why did you choose to come to the Valle diLedro?
� Have you been here before?� How many times (summers) have you visited?
Valued places � Which are the places you value most based on yourpersonal opinion/experience? (Please use the tengreen stickers to indicate the places. You can assignplaces a higher weighting by using more stickers).
Motivation and activities in the valuedplaces (attribution of weights)
� Why do you value this place/these places?� Which element of that place do you like in
particular?� What kind of activity/experience did you do/have
there?
‘Threatened’ places and motivation(attribution of weights)
� Thinking about the places you have indicated, butnot only those, which are the places you think arethreatened or may, in your personal opinion, losetheir value? (Please indicate these places using thefive red stickers. You can assign places a higherweighting by using more stickers).
� What are the threats/risks or related problems?
Free notes/observations � Free comments, or additional information
Auxiliary information on respondents � Date� Place of interview (using GPS or toponym)� Number identifying the photo of sticker positions
on the map� Respondent number, gender, age, place of origin� Accommodation type (e.g. hotel, campsite, B&B)
6 R. Scolozzi et al.
Dow
nloa
ded
by [
94.1
60.4
4.17
7] a
t 16:
18 1
1 Ju
ly 2
014

3.2. Spatial Analysis
In the GIS analysis, we mapped the landscape values through landscape feature editing.The valued sites (landscape feature), as indicated by the respondents’ place descriptionsand coloured stickers on the printed aerial photograph, were identified and mapped asareas (polygons in vector data, using ESRI® Arc Map 9.3). Such elaboration entailedan interpretation of respondents’ descriptions and digitalization on-screen using landcover maps, aerial orthophotographs and viewshed analysis (based on digital elevationmodels provided by the Province of Trento), in addition to all the information from theinterviews. As an example, descriptions such as “the bike trails nearby the RefugioTremalzo” or “the lawn where we usually have a picnic, close to the lake. . .” wereused as bases for identifying areas around the location of the stickers. Subsequently,each polygon was characterised by the details obtained from the interviews, such as thetotal number of stickers, respondent type and qualitative descriptors, storing these datain a table associated with the vector data. The subjectivity of interpretation and theresulting spatial uncertainty of area digitalization were not expected to be relevantbecause of the intrinsically qualitative nature of the whole approach.
As vector data introduce an unrealistic and abrupt discontinuity in landscape values,we applied kernel density estimation (Silverman, 1986), using one piece of informationat a time (e.g. the total number of green and red stickers for each site/polygon). Thekernel density estimation calculates the density of values in the neighbourhood aroundeach point, accounting for the statistical spatial distribution, and creates hotspot surfacesfor each value (as also applied, albeit using different information, by Alessa, Kliskey, &Brown, 2008; Vizzari, 2011). The input for the kernel density estimation was a regular5 × 5 m grid of points which were obtained from the polygon maps by converting theminto a raster with a resolution of 5 x 5 m. In our case, the kernel density output cellsize was set equal to the input cell size (5 m), assuming that survey respondents coulddetermine the locations on the printed map within—at best—a range of 5 m; theneighbourhood width (or kernel size) was set at 300 m, considering the minimum widthof the Valle di Ledro. The kernel density output values were reclassified into 10qualitative classes, using geometric intervals (in which the class breaks are based on ageometric series), where 1 is the lowest value and 10 is the highest.
We produced specific maps for distinct values by repeating the above procedure foreach category of landscape value as identified by the respondents. After identifyingdifferent tourist types, we created more specific maps by applying the same procedureto distinguish different perceptions and uses of the landscape by different users. In thesame way, we mapped the perceived threats or risks for the recognised landscapevalues.
4. Results
4.1. Tourist Types and Perceived Landscape Values
The results presented here are based on the interviews. The respondents included 56%men and 44% women, with an average age of 49 years (within a range of 20–72 years).Most of the visitors had frequented the area for several years (Table 2) motivated by:relaxing in nature (58%), outdoor activities (23%), holidaying with family (13%), less
Mapping Alpine Landscape Values and Related Threats as Perceived by Tourists 7
Dow
nloa
ded
by [
94.1
60.4
4.17
7] a
t 16:
18 1
1 Ju
ly 2
014

crowded sites (4%) and cultural heritage (2%). Based on these motivations and thesocio-demographic characteristics, and also considering the statistics of the localtourism board, three different tourist categories were identified: active seniors, familiesand sportive visitors (Tables 3 and 4). The first group included retired adults, over theage of 50, from cities in Italy or other European countries. The families were mainlyfrom urban areas of northern Italy. The third group, the sportive tourists, were typicallyvisitors on short stays, often individuals or small groups that were enjoyingmountaineering activities. This group generally came from Central and Northern Europe(mainly Germany and the Netherlands).
The respondents identified heterogeneous sets of places; some appreciated the valleyas a whole, while others valued particular locations. In total, 57 places were recognisedas having outstanding positive value. These were categorised into five types in order ofthe number of mentions as follows: built environments (e.g. villages or cultural sites),natural sites (biotopes or other ecological features), valley traits (i.e. panoramas orviewsheds), mountain trails and alpine huts.
The views expressed about landscape experiences by the respondents wereinterpreted and classified into five classes of value: ‘nature and scenic value’, ‘outdooractivity value’, ‘aesthetic value’, ‘historical-cultural value’ and ‘tranquillity’ (Table 3).The first, the nature and scenery value (50% of cases), referring to natural componentsof the landscape, was used whenever the respondents mentioned specific elements ofthe natural environment (e.g. pastures, woodland, the flowering of alpine vegetation).The outdoor activity value (30%) was assigned when the respondents valued aparticular site mainly for its pleasurable activities (e.g. hiking, mountain biking ormushroom picking). In many cases, the same respondents also expressed appreciationfor nature; in these cases, or similar, the first or repeated views expressed byrespondents were considered. Aesthetic value (10%) was related to man-made sites(typical expressions were “nice and lively village” or “colourful urban centre”).Historical-cultural value (5%) was associated with historical places or monuments in thevalley, predominantly related to nineteenth and early twentieth century artefacts (e.g.churches, ruins, First World War foxholes). The value of tranquillity (1%) wasrecognised when respondents exclusively referred to relaxing and peaceful places (e.g.
Table 2. Traits of respondents in terms of place of origin, number of visits, and category
Place of originReturns/Times Tourist types*
Germany 9.5% First time/visitors
21.9% Activeseniors
41.4%
Austria, Belgium, Poland, CzechRepublic, Sweden, Ireland andNetherlands
8.6% From 2ndtime to 5thyear
25.0% Families 35.6%
Extra Europe 1.0% 6th to 20thyear
32.3% Sportive 23.0%
Milan hinterland and Lombardy 30.5% > 20th year 18.8%Trento Province 14.3% No data 2.1%Rest of Italy 36.2%
*9.3% of total interviewees were locals, not tourists, this subset of sampling was not included inthe analysis.
8 R. Scolozzi et al.
Dow
nloa
ded
by [
94.1
60.4
4.17
7] a
t 16:
18 1
1 Ju
ly 2
014

for their “silence” and “quietness”). Tranquillity was often mentioned together withother values, principally associated with aspects such as nature and panorama; here, the1% refers to cases in which the respondents expressed tranquillity as the first and mostdistinctive quality of the site.
4.2. Popular Sites, Distribution of Values and Threats
Based on the spatial analysis and considering the total number of stickers assigned, themost valued places are situated at Lago di Ledro (darker areas in Figure 2a), the ValConcei floor (dark strip to the north in Figure 2a) and the Monte Tremalzo (dark areain the lower centre of Figure 2a). These latter two areas are semi-natural (typical alpinepastures and woods) and less urbanised but also easily accessible (e.g. by road andseveral mountain bike trails). The distribution of landscape values differs significantlyaccording to the value class (Figures 2b–f).
Spatial differentiation also appeared for the same landscape values when differenttourist types were considered (Figure 3). The active seniors primarily attributed highvalues to relatively more natural areas, even those at higher elevations (often mountainsand hiking trails were explicitly mentioned). The other two groups seemed to prefer themiddle and lower parts of the valley, including the areas surrounding the Lago di
Table 3. Perceived landscape values by respondent type (total number of stickers used on theprinted map)
Landscape valuesSportive
(101 stickers)Families
(108 stickers)Seniors
(168 stickers)All respondents(377 stickers)
Quietness – 1.9% 1.8% 1.3%Aesthetic 11.9% 6.5% 8.9% 9.0%Historical-cultural 4.0% 6.5% 6.5% 5.8%Outdoor experience 33.7% 27.8% 20.8% 26.3%Naturalistic scenery 44.6% 51.9% 59.5% 53.3%others 5.9% 5.6% 2.4% 4.2%
Table 4. Perceived threats to landscape values by respondent type (total number of stickers usedon the printed map)
Perceived threatsSport(10)
Families(19)
Seniors(34)
All respondents(63)
Abandonment, lack of maintenance 10.0% – 5.9% 4.8%congestion (e.g. mountain trails, places) – 26.3% 11.8% 14.3%visual and/or acoustic disturbance 10.0% 10.5% 5.9% 7.9%pollution 20.0% 21.1% 2.9% 11.1%overuse (e.g. excessive taking of wild
flowers)10.0% – 5.9% 4.8%
traffic and danger to pedestrians 30.0% 10.5% 8.8% 12.7%urbanisation 20.0% 31.6% 52.9% 41.3%others – – 5.9% 3.2%
Mapping Alpine Landscape Values and Related Threats as Perceived by Tourists 9
Dow
nloa
ded
by [
94.1
60.4
4.17
7] a
t 16:
18 1
1 Ju
ly 2
014

Ledro; for instance, families considered camping areas to be among the most importantsites.
The landscape values shown in Figure 3 refer to the total general ranking of the area,but the detailed value maps derived from each tourist type offer some insights intoareas of potential conflict where activities that are not compatible are likely to overlap.Areas with outdoor activity value (expected to be associated with outdoor sports suchas mountain bike racing) may compete for space in areas with tranquillity value(Figure 4a). Besides, even for the same use, the tourist groups differed, revealingpossible areas of contention, for example, between senior and sports tourists(Figure 4b).
In addition to the values assigned to different sites, respondents also identified aseries of threats in terms of the risk of losing or decreasing those values (Table 4),grouped in six classes. The type of threat most mentioned was urbanisation (41%;
Figure 3. Landscape values as perceived by different tourist types: a) seniors, b) sport tourists,and c) families.
Figure 4. Overlapping areas between different values and different landscape users, indicatingpotential conflict.
10 R. Scolozzi et al.
Dow
nloa
ded
by [
94.1
60.4
4.17
7] a
t 16:
18 1
1 Ju
ly 2
014

Figure 5a), followed by congestion (people crowding specific sites, 14%; Figure 5b),danger from vehicle traffic (especially from trucks, 13%), pollution (mainly concerningthe Lago di Ledro, 11%), and visual and/or acoustic disturbance (from noisy activitiessuch as races or visual blight due to new buildings, 8%), abandonment or lack ofmaintenance (5%) and overuse (5%). Different perceptions emerged from differentrespondents: while the active seniors and the families perceived a risk predominantlyfrom urbanisation, the sport group (particularly, the cyclists) considered traffic aparticular threat. The risk of congestion was only perceived by the families and activeseniors, but in different locations (Figures 6a–b). Abandonment or lack of maintenanceand overuse were not mentioned by the families.
5. Discussion and Conclusions
The approach adopted provided information on perceived landscape values requiringrelatively small input data and modest time resources. In this study, it required an
Figure 5. Two of the seven types of perceived threats to landscape values: a) urbanisation andb) congestion.
Figure 6. Congestion risk as perceived by two tourist types: a) families and b) active seniors.
Mapping Alpine Landscape Values and Related Threats as Perceived by Tourists 11
Dow
nloa
ded
by [
94.1
60.4
4.17
7] a
t 16:
18 1
1 Ju
ly 2
014

orthophotograph and two months of field work involving one interviewer. Thesophisticated information obtained was at the cost of a small sample of tourists (106interviewees). The assessment methodology is not intended to substitute for quantitativesurvey methods, but rather to complement them. Considering the relatively small areaof the case study (approximately 152 km2), the sample size is comparable to othersimilar qualitative studies (e.g. Beerli & Martín, 2004b; Brown, 2004; Chhetri,Arrowsmith, & Jackson, 2004).
The questionnaire-based surveys and the value mapping provide insightful detailsconcerning tourists’ priorities within the study area by identifying five classes oflandscape values: ‘nature and scenic value’, ‘outdoor activity value’, ‘aesthetic value’,‘historical-cultural value’ and ‘tranquillity’. The open questions in the semi-structuredinterview (Table 1) helped to capture the tourists’ responses associated with theirlandscape experience. The qualitative results provided a detailed level of information,which should be included when tourism is considered for landscape planning andresource management purposes (Gnoth, 1997). The qualitative and spatial informationallows the identification of a diversified ‘tourism landscape’ related to differentlandscape values of different tourist types. The value maps are easy to interpret and canhelp to comprehend landscapes in terms of key and vulnerable resources for localtourism. For example, the maps indicate the most valued places and provide detailedspatial information about the different landscape values (Figure 2) and the spatialdifferentiation of the different tourist types (Figure 3). In this study, the most valuedsites can be characterised as natural areas which are, at the same time, easily accessible.However, high landscape values can be threatened, for example by urbanisation orcongestion (Figures 5 and 6) as expressed by the respondents during the survey.
The maps may also be used to involve stakeholders in more informed decision-making. The scope of the study encompassed providing support for local decision-making for landscape management; for each new study area, the analytic schemeshould be repeated to obtain maps of the specific landscape values for the area.Nonetheless, some general lessons can be learned: the approach is especiallyinformative where tourism carrying capacity may be linked to perceived landscapevalues. The specific results from the case study indicate that natural scenery is onemajor aspect of nature-based tourism, as in other case studies (Daniel, 2001). Forexample, according to Arriaza, Cañas-Ortega, Cañas-Madueño, and Ruiz-Aviles (2004),perceived visual quality increases with the degree of wildness of the landscape, thepercentage of plant cover and the amount of water. The added value of the proposedapproach is due to the spatially detailed insights concerning the values attributed byrecreationists to specific sites within the same landscape. These results may containrelevant information for local administrations; by providing a detailed picture ofrecreational uses and preferences they can facilitate site assessment and management, inaddition to other standardised visitor surveys. Future applications of the proposedapproach should be integrated with the verification of the recreational use of landscapesin order to confirm the perceived values and related threats.
12 R. Scolozzi et al.
Dow
nloa
ded
by [
94.1
60.4
4.17
7] a
t 16:
18 1
1 Ju
ly 2
014
5.1. Relevance for Landscape Planning
Based on the different perceived landscape values and tourist groups, the resultsindicate overlapping areas of rival uses and potential fringe areas between touristgroups. The rivalry in this case refers to possible conflicts between uses or users in thesame area, for example sport tourists who are mountain biking may disturb families orelderly tourists relaxing in the natural environment; both groups may complain of alack of ‘free space’ for their use and may therefore choose other sites or destinations.In other cases, congestion, due to too many people using the site and belonging to thesame group, is perceived as a risk for valued sites. The fact that the majority ofrespondents return regularly on holiday means that they can perceive some land usechanges potentially threatening landscape values. The identification of such potentialconflict zones can assist managers, local owners and decision-makers in managingzones and their use. Furthermore, the simple recognition of the environmental value ofparticular sites, for example, historical sites or landscape features related to communityidentity, may promote their maintenance.
The maps of perceived threats, although these should be validated by further study,draw attention to places where values are particularly sensitive. Such insights caneffectively ground proposals for the management of specific sites in the studiedlandscape. Informed recommendations may include managing the valued places in away that does not decrease their natural scenic value. This may require setting limits onvisitor numbers or certain activities in defined areas to ensure the environmentmaintains the appreciated values. For example, we could suggest avoiding or limiting‘noisy’ activities, such as summer festival concerts or cycling races, in the areas mostvalued for their tranquillity. Moreover, local decision-makers and tourism managersmay influence tourist flows by creating appropriate infrastructures and by providinginformative maps.
The study results have been presented to local administrators and tourismstakeholders; according to these groups, the results presented potentially constitute animportant foundation for land use planning and will serve as a baseline to define futurestrategic tourism plans. In particular, local administrators and stakeholders expressedtheir interest in the approach and considered the illustrated information functional inidentifying appropriate uses of sites, as well as of use in imagining desired scenariosfor the valley. The common trends show that increasing numbers of people are likely toenjoy nature tourism in the future; thus, planners and managers will have to deal withincreasing demand for recreation activities and associated areas and consequently willhave to address the increasing pressure on the environment. Therefore, there is also agreater need for advanced methods and integrated approaches to evaluate and plan forthis.
Acknowledgements
S.R. and C.D. funded the Autonomous Province of Trento (Italy), OPENLOC project“Public policies and local development: innovation policy and its effects on locallyembedded global dynamics” project (2008–2011, www.openloc.eu). The authors alsothank Beatrice Marelli and Cristina Orsatti for their support during the field work.
Mapping Alpine Landscape Values and Related Threats as Perceived by Tourists 13
Dow
nloa
ded
by [
94.1
60.4
4.17
7] a
t 16:
18 1
1 Ju
ly 2
014
References
Alessa, L., Kliskey, A., & Brown, G. (2008). Social-ecological hotspots mapping: A spatial approach foridentifying coupled social-ecological space. Landscape and Urban Planning, 85, 27–39.
Angileri, V., & Toccolini, A. (1993). The assessment of visual quality as a tool for the conservation of rurallandscape diversity. Landscape and Urban Planning, 24, 105–112.
Arriaza, M., Cañas-Ortega, J. F., Cañas-Madueño, J. A., & Ruiz-Aviles, P. (2004). Assessing the visual qualityof rural landscapes. Landscape and Urban Planning, 69, 115–125.
Beerli, A., & Martín, J. D. (2004a). Factors influencing destination image. Annals of Tourism Research, 31,657–681.
Beerli, A., & Martı́n, J. D. (2004b). Tourists’ characteristics and the perceived image of tourist destinations: Aquantitative analysis—a case study of Lanzarote, Spain. Tourism Management, 25, 623–636.
Bell, S., Tyrväinen, L., Sievänen, T., Pröbstl, U., & Simpson, M. (2007, March 16). Outdoor Recreation andNature Tourism: A European Perspective. Living Reviews in Landscape Research, 1(2). Retrieved fromhttp://www.livingreviews.org/lrlr-2007-2
Bishop, I. D., & Hulse, D. W. (1994). Prediction of scenic beauty using mapped data and geographicinformation systems. Landscape and Urban Planning, 30, 59–70.
Brown, G. (2004). Mapping spatial attributes in survey research for natural resource management: Methodsand applications. Society Natural Resources, 18, 17–39.
Brown, G., & Raymond, C. (2007). The relationship between place attachment and landscape values: Towardmapping place attachment. Applied geography, 27, 89–111.
Brown, G. G., & Reed, P. (2012). Social landscape metrics: Measures for understanding place values frompublic participation geographic information systems (PPGIS). Landscape Research, 37, 73–90.
Chhetri, P., Arrowsmith, C., & Jackson, M. (2004). Determining hiking experiences in nature-based touristdestinations. Tourism Management, 25, 31–43.
Daniel, T. C. (2001). Whither scenic beauty? Visual landscape quality assessment in the 21st century.Landscape and Urban Planning, 54, 267–281.
Dredge, D. (1999). Destination place planning and design. Annals of Tourism Research, 26, 772–791.Eckart, L. (2011). 99 volumes later: We can visualise. Now what? Landscape and Urban Planning, 100,403–406.
Gnoth, J. (1997). Tourism motivation and expectation formation. Annals of Tourism research, 24, 283–304.Goossens, C. (2000). Tourism information and pleasure motivation. Annals of Tourism Research, 27, 301–321.Grêt-Regamey, A., Bebi, P., Bishop, I. D., & Schmid, W. A. (2008). Linking GIS-based models to valueecosystem services in an Alpine region. Journal of Environmental Management, 89, 197–208.
Hall, C. M., & Page, S. J. (2009). Progress in tourism management: From the geography of tourism togeographies of tourism—A review. Tourism Management, 30, 3–16.
Laarman, J. G., & Gregersen, H. M. (1996). Pricing policy in nature-based tourism. Tourism Management, 17,247–254.
Lange, E., Hehl-Lange, S., & Mambretti, I. (2004). Assessment of urban green space qualities using 3Dvisualization tools. In The real and virtual worlds of spatial planning (pp. 185–198). Berlin: Springer,Berlin.
McCool, S. F., & Lime, D. W. (2001). Tourism carrying capacity: Tempting fantasy or useful reality? Journalof Sustainable Tourism, 9, 372–388.
Neto, F. (2003). A new approach to sustainable tourism development: Moving beyond environmentalprotection. Natural Resources Forum, 27, 212–222.
Osservatorio Provinciale per il Turismo (2009). Il turismo nei Consorzi Pro Loco del Trentino. Domanda eofferta (Giugno 2009) [Tourism within local tourism organizations of Trentino. Supply and demand. June2009]. Trento: Osservatorio Provinciale per il Turismo. Retrieved from: http://www.turismo.provincia.tn.it/osservatorio/
Raymond, C. M., Bryan, B. A., MacDonald, D. H., Cast, A., Strathearn, S., Grandgirard, A., & Kalivas, T.(2009). Mapping community values for natural capital and ecosystem services. Ecological Economics, 68,1301–1315.
Romeril, M. (1989). Tourism and the environment — accord or discord? Tourism Management, 10, 204–208.Schirpke, U., Tasser, E., & Tappeiner, U. (2013). Predicting scenic beauty of mountain regions. Landscapeand Urban Planning, 111, 1–12.
14 R. Scolozzi et al.
Dow
nloa
ded
by [
94.1
60.4
4.17
7] a
t 16:
18 1
1 Ju
ly 2
014

Sherrouse, B. C., Clement, J. M., & Semmens, D. J. (2011). A GIS application for assessing, mapping, andquantifying the social values of ecosystem services. Applied Geography, 31, 748–760.
Silverman, B. W. (1986). Density estimation for statistics and data analysis. New York: Chapman and Hall.USDA Forest Service. (2013). Outdoor Recreation - US Forest Service Research & Development. OutdoorRecreation. Retrieved from: http://www.fs.fed.us/research/outdoor-recreation
Vizzari, M. (2011). Spatial modelling of potential landscape quality. Applied Geography, 31, 108–118.
Mapping Alpine Landscape Values and Related Threats as Perceived by Tourists 15
Dow
nloa
ded
by [
94.1
60.4
4.17
7] a
t 16:
18 1
1 Ju
ly 2
014