
Manganese-enhanced MRI in a rat model of Parkinson's disease
8
Original Research Manganese-Enhanced MRI in a Rat Model of Parkinson’s Disease Galit Pelled, PhD, 1,2 Hagai Bergman, MD, 3 Tamir Ben-Hur, MD, PhD, 4 and Gadi Goelman, PhD 1 * Purpose: To measure intra- and inter-hemispheric connec- tivity within the basal ganglia (BG) nuclei in healthy and in unilateral 6-hydroxydopamine (6-OHDA) Parkinson dis- ease rat model in order to test the BG interhemispheric connectivity hypothesis. Material and Methods: The manganese-enhanced MRI (MEMRI) method with direct injection of manganese chlo- ride into the entopeduncular (EP), substantia nigra (SN), and the Habenula nuclei in unilateral 6-OHDA (N 22) and sham-operated (N 16) rat groups was used. MEMRI mea- surements were applied before, 3, 24, and 48 hours post- manganese injection. Signal enhancements in T1-weighted images were compared between groups. Results: Manganese injection into the EP nucleus resulted with bihemispheric signal enhancements in the habenular complex (Hab) at both groups with stronger enhancements in the 6-OHDA group. It also exhibited lower sensorimotor cortex signal enhancement in the 6-OHDA rat group. SN manganese injection caused enhanced anteroventral tha- lamic and habenular nuclei signals in the 6-OHDA rat group. Manganese habenula injection revealed enhanced interpeduncular (IP) and raphe nuclei signals of the 6-OHDA rat group. Conclusion: Modulations in the effective intra- and inter- hemispheric BG connectivity in unilateral 6-OHDA Parkin- son’s disease (PD) rat model support the BG interhemi- spheric connectivity hypothesis and suggest a linkage be- tween the dopaminergic and serotonergic systems in PD, in line with clinical symptoms. Key Words: manganese-enhanced MRI; Parkinson’s dis- ease; 6-hydroxydopamine; basal ganglia; functional con- nectivity; rat Abbreviations: PD Parkinson’s disease, 6-OHDA 6-hydroxydopamine, BG basal ganglia, SN substantia nigra, SNc substantia nigra pars compacta, MRI magnetic resonance imaging. EP entopeduncular nucleus, MEMRI manganese-enhanced MRI. J. Magn. Reson. Imaging 2007;26:863– 870. © 2007 Wiley-Liss, Inc. THE BASAL GANGLIA (BG) nuclei are known to partic- ipate in the implementation of planned and motivated behaviors that integrate motor, cognitive, and limbic functions. While it is best known for its control of move- ment, the BG is also involved in processes such as emotions, motivations, and cognitions that lead up to movement. Based on the functional and anatomical organization of corticostriatal pathways, it is well ac- cepted that the BG nuclei are (fully or partially) segre- gated in accordance with cortical input. For example, BG ventral regions are involved in reward and partici- pate in addictive behavior as well as habit formation (1,2); central BG areas are involved in cognitive func- tions such as procedural learning and working memory (3); and the dorsolateral portion of the striatum is as- sociated with the control of movement. Moreover, dis- eases affecting mental health such as schizophrenia (4,5), drug addiction (6), and obsessive compulsive dis- order (7) are linked to BG pathology as are diseases affecting motor control. The association with multiple neurological and psychiatric disorders manifesting themselves in the BG-cortex circuitry highlights the importance of understanding this circuit. Several different models for this circuit were pro- posed, starting from the classical box-and-arrow Albin- DeLong model (8,9), through the example of parallel processing of cortical information (10). Other models include the idea of pathways allowing information from separate cortical-BG loops to influence each other (11,12), the concept of circuits that include nonrecip- rocal arrangements between structures (11,13), and the “reinforcement driven dimensionality reduction 1 MRI/MRS Laboratory, Human Biology Research Center, Department of Medical Biophysics and Nuclear Medicine, Hadassah Hebrew Uni- versity Medical Center, Jerusalem, Israel. 2 Laboratory of Functional and Molecular Imaging, National Institute of Neurological Disorders and Stroke, National Institutes of Health, Be- thesda, Maryland, USA. 3 Department of Physiology, Hadassah Medical School and the Eric Roland Center for Neurodegenerative Diseases, The Hebrew University, Jerusalem, Israel. 4 Department of Neurology, the Agnes Ginges Center for Human Neu- rogenetics, Hadassah Hebrew University Hospital, Jerusalem, Israel. Contract grant sponsors: Dana Foundation; Israel Ministry of Sciences and Israel Science Foundation (Grant no. 596/01). *Address reprint requests to: G.G., PhD, MRI/MRS lab, the Human Biology Research Center, Department of Medical Biophysics and Nu- clear Medicine, Hadassah Hebrew University Medical Center, Jerusa- lem, Israel. E-mail: [email protected] Received May 20, 2006; Accepted 30 May 2007. DOI 10.1002/jmri.21051 Published online in Wiley InterScience (www.interscience.wiley.com). JOURNAL OF MAGNETIC RESONANCE IMAGING 26:863– 870 (2007) © 2007 Wiley-Liss, Inc. 863
-
Upload
independent -
Category
Documents
-
view
2 -
download
0
Transcript of Manganese-enhanced MRI in a rat model of Parkinson's disease

Original Research
Manganese-Enhanced MRI in a Rat Model ofParkinson’s Disease
Galit Pelled, PhD,1,2 Hagai Bergman, MD,3 Tamir Ben-Hur, MD, PhD,4 andGadi Goelman, PhD1*
Purpose: To measure intra- and inter-hemispheric connec-tivity within the basal ganglia (BG) nuclei in healthy and inunilateral 6-hydroxydopamine (6-OHDA) Parkinson dis-ease rat model in order to test the BG interhemisphericconnectivity hypothesis.
Material and Methods: The manganese-enhanced MRI(MEMRI) method with direct injection of manganese chlo-ride into the entopeduncular (EP), substantia nigra (SN),and the Habenula nuclei in unilateral 6-OHDA (N � 22) andsham-operated (N � 16) rat groups was used. MEMRI mea-surements were applied before, 3, 24, and 48 hours post-manganese injection. Signal enhancements in T1-weightedimages were compared between groups.
Results: Manganese injection into the EP nucleus resultedwith bihemispheric signal enhancements in the habenularcomplex (Hab) at both groups with stronger enhancementsin the 6-OHDA group. It also exhibited lower sensorimotorcortex signal enhancement in the 6-OHDA rat group. SNmanganese injection caused enhanced anteroventral tha-lamic and habenular nuclei signals in the 6-OHDA ratgroup. Manganese habenula injection revealed enhancedinterpeduncular (IP) and raphe nuclei signals of the6-OHDA rat group.
Conclusion: Modulations in the effective intra- and inter-hemispheric BG connectivity in unilateral 6-OHDA Parkin-son’s disease (PD) rat model support the BG interhemi-
spheric connectivity hypothesis and suggest a linkage be-tween the dopaminergic and serotonergic systems in PD, inline with clinical symptoms.
Key Words: manganese-enhanced MRI; Parkinson’s dis-ease; 6-hydroxydopamine; basal ganglia; functional con-nectivity; rat
Abbreviations: PD � Parkinson’s disease, 6-OHDA � 6-hydroxydopamine,BG � basal ganglia, SN � substantia nigra, SNc � substantia nigra parscompacta, MRI � magnetic resonance imaging. EP � entopeduncular nucleus,MEMRI � manganese-enhanced MRI.
J. Magn. Reson. Imaging 2007;26:863–870.© 2007 Wiley-Liss, Inc.
THE BASAL GANGLIA (BG) nuclei are known to partic-ipate in the implementation of planned and motivatedbehaviors that integrate motor, cognitive, and limbicfunctions. While it is best known for its control of move-ment, the BG is also involved in processes such asemotions, motivations, and cognitions that lead up tomovement. Based on the functional and anatomicalorganization of corticostriatal pathways, it is well ac-cepted that the BG nuclei are (fully or partially) segre-gated in accordance with cortical input. For example,BG ventral regions are involved in reward and partici-pate in addictive behavior as well as habit formation(1,2); central BG areas are involved in cognitive func-tions such as procedural learning and working memory(3); and the dorsolateral portion of the striatum is as-sociated with the control of movement. Moreover, dis-eases affecting mental health such as schizophrenia(4,5), drug addiction (6), and obsessive compulsive dis-order (7) are linked to BG pathology as are diseasesaffecting motor control. The association with multipleneurological and psychiatric disorders manifestingthemselves in the BG-cortex circuitry highlights theimportance of understanding this circuit.
Several different models for this circuit were pro-posed, starting from the classical box-and-arrow Albin-DeLong model (8,9), through the example of parallelprocessing of cortical information (10). Other modelsinclude the idea of pathways allowing information fromseparate cortical-BG loops to influence each other(11,12), the concept of circuits that include nonrecip-rocal arrangements between structures (11,13), andthe “reinforcement driven dimensionality reduction
1MRI/MRS Laboratory, Human Biology Research Center, Departmentof Medical Biophysics and Nuclear Medicine, Hadassah Hebrew Uni-versity Medical Center, Jerusalem, Israel.2Laboratory of Functional and Molecular Imaging, National Institute ofNeurological Disorders and Stroke, National Institutes of Health, Be-thesda, Maryland, USA.3Department of Physiology, Hadassah Medical School and the EricRoland Center for Neurodegenerative Diseases, The Hebrew University,Jerusalem, Israel.4Department of Neurology, the Agnes Ginges Center for Human Neu-rogenetics, Hadassah Hebrew University Hospital, Jerusalem, Israel.Contract grant sponsors: Dana Foundation; Israel Ministry of Sciencesand Israel Science Foundation (Grant no. 596/01).*Address reprint requests to: G.G., PhD, MRI/MRS lab, the HumanBiology Research Center, Department of Medical Biophysics and Nu-clear Medicine, Hadassah Hebrew University Medical Center, Jerusa-lem, Israel. E-mail: [email protected] May 20, 2006; Accepted 30 May 2007.DOI 10.1002/jmri.21051Published online in Wiley InterScience (www.interscience.wiley.com).
JOURNAL OF MAGNETIC RESONANCE IMAGING 26:863–870 (2007)
© 2007 Wiley-Liss, Inc. 863

model” (14). In all these models, the cortex-BG-cortexcircuits are treated as being in a single hemisphereneglecting its bihemispherical connections. However,recently abnormal sensorimotor activation in hemipar-kinsonic patients and in the unilateral rat model ofParkinson’s disease (PD) was observed bilaterally, rais-ing the question of whether the bilateral connections ofthe BG affect BG circuitry.
Functional neuroimaging using positron emission to-mography and functional magnetic resonance imaging(fMRI) has shown bilateral cortical activation as a re-sponse to akinetic hand stimulation in human (15) andin the unilateral PD rat model during unilateral forepawsensory stimulation (16). This abnormal cortical re-sponse of the “healthy” hemisphere suggests strongeffective connectivity between hemispheres in the par-kinsonian state that could be accomplished throughthe cortex or, as we have hypothesis before (16), by anamplification of the BG bilateral connections. The lattermechanism is thought to be mediated by interhemi-spheric connections, which have been demonstrated toexist in primates, cats, and rats. The BG has two outputnuclei: the globus pallidus internal segment (GPi)which is the primate homologue to the rodent entope-duncular nucleus (EP), and the SN pars reticulata(SNr). It has been demonstrated that 15% to 20% of theprojections from the BG output nuclei terminate in thecontralateral hemisphere (17–20). To further reveal theBG circuitry, the habenular complex (Hab), that hadtraditionally not been considered part of this circuitry,has received much interest lately, with the observationsof its strong connections with the BG (21–23) and itsinvolvement in PD (24).
In order to better understand BG circuitry we wished:1) to identify the in vivo effective connectivity from thetwo BG output nuclei, the EP and the SNr nuclei, withthe Hab complex; and 2) to compare this connectivitybetween normal and BG pathological states (e.g., PD)using the unilateral 6-hydroxydopamine (6-OHDA) ratmodel. For in vivo measurements of anterograde con-nectivity, we used the manganese-enhanced MRI(MEMRI) method. In this method, manganese ions(Mn2�), which are paramagnetic and thus detectable byMRI, are directly injected into the brain. Due to thechemical and physical similarity of the Mn2� to calciumions, manganese ions are thought to enter neuronsthrough voltage gated calcium channels, move in ananterograde manner along axons and cross synapses(25). Manganese uptake has shown to be highly corre-lated with neuronal activity (25–29). In recent years,MEMRI methods have been applied to study functionaland structural connectivity in birds (30,31), rodent (32–34), and monkeys (29,35).
MATERIALS AND METHODS
All surgical and experimental procedures were con-formed and approved by the Animal Care committeeguidelines.
A total of 22 male Sprague-Dawley rats weighing250–300 g were anesthetized with ketamine (90 mg/kgintraperitoneally [i.p.]; Sigma, Israel) and xylazine (5mg/kg i.p.; Sigma) and stereotaxically injected into the
right substantia nigra pars compacta (SNc) with 4 �L of10 mM 6-OHDA hydrochloride with 0.01% ascorbicacid (Sigma), using a 10-�L Hamilton microsyringe fit-ted with a 26-gauge cannula. The injection rate was 1�L/minute and the cannula was left in place for anadditional five minutes. Lesion coordinates for SNc le-sion were anterior-posterior (AP)-4.8; medial-lateral(ML)-1.6, dorsal-ventral (DV)-8.4 from the dura, ac-cording to a rat brain atlas (36). For the control group,an additional 16 rats went through the same surgicalprocedure, but were injected with 4 �L of saline to theSNc (sham-operated rats).
Two weeks after the 6-OHDA lesion procedure, 0.3 �lof 0.16 M manganese chloride (MnCl2, dissolved in sa-line) solution was injected directly to the right EP (AP-2.3, ML-2.6, DV-7.5 from dura; six right-SNc-6-OHDAand six right-SNc-sham-operated rats) or to the rightSNr (AP-5.3, ML-2.8, DV-8.5 from dura; five right-SNc-6-OHDA and five right-SNc-sham-operated rats). Dueto the small volume of the Hab, injections to the rightHab (AP-2.5, ML-0.8, DV-4.4 from dura; seven right-SNc-6-OHDA and five right-SNc-sham-operated rats)were performed with 0.1 �L of 0.04 M MnCl2. The MnCl2injection rate was 0.05 �L/minute, and the cannulawas left in the injection sites for an additional sevenminutes. Three hours post MnCl2 injection rats wereimaged to ensure that the injection areas were in placeand comparable. Manual inspection revealed no differ-ences between animals within or between groups. Al-though we attempted to inject the MnCl2 exclusivelyinto the injection targets, we refer to them here as theEP, SN, and Hab areas, respectively, due to the possi-bility of manganese diffusion to their vicinity.
Using the average rate of axonal manganese (Mn2�)transport calculated in rats (2 mm/hour) (37), we esti-mated that 48 hours will be sufficient for most Mn2�
transportation of interest in this study. A total of fourMEMRI sessions were performed on each animal usinga 4.7 T Biospec system (Bruker Biospin MRI Gmbh,Ettlington, Germany), one before MnCl2 injection and at3, 24, and 48 hours post injection. Rats were anesthe-tized with isoflurane (2% with a mixture of 30:70 O2:N2O) and were restrained in a home-built head andbody holder. Body temperature was kept at 37°C, usinga heating pad. MRI measurements were performed witha 38-mm Bruker head-dedicated volume coil. ForMEMRI studies, T1 weighted images using a gradient-echo sequence was applied to obtain coronal slices(TR � 156 msec, TE � 6.7 msec, matrix size � 256 �128, zero-filled to 256 � 256, field of view � 3 cm, flipangle � 30, 30 averages, 10 slices, 1-mm slice thick-ness). MRI measuring time was �10 minutes with thetotal anesthesia time (that includes positioning, adjust-ments, and acquisition of anatomical images) ap-proaching 30 minutes. Since several studies demon-strated that a long anesthesia period effects bodyorgans such as the heart and brain in rodents (38–40),anesthesia was kept at short as possible, making theuse of three-dimensional (3D) higher spatial resolutionacquisition with comparable SNR difficult. At the end ofthe MRI measurements, rats were allowed to recoverbefore being sent back to the animal facility.
864 Pelled et al.

After MRI measurements, 6-OHDA lesioned rats wereperfused through the aorta, first with physiological sa-line and second with 4% paraformaldehyde by hydro-static pressure. To assess the degree of dopaminergicneuron depletion in the BG pathway, tyrosine hydrox-ylase (TH) immunofluorescent staining (rabbit immu-noglobulin G [IgG] 1:100, Chemicon, Temecula, USA)was performed on two 20-�m coronal frozen sections ofthe striatum. Staining intensity was measured usingAdobe PhotoShop 6.0 software and the lesioned sidewas compared to the intact side for determination oflesion severity in individual animals. Only 18 rats thatwere found to have a pronounced reduction (above60%) in TH expression in the striatum of the lesionedside as compared to the nonlesioned side were includedin this study. Another method that was used to assessthe behavioral outcome of dopaminergic neuron deple-tion in the 6-OHDA rats was the turning behavior test.It was previously demonstrated that due to the imbal-ance in the dopamine levels between the healthy andthe lesioned hemisphere, the rate of the rotations the6-OHDA rats exhibit following systemic administrationof dopamine agonist or antagonist, is directly related tothe dopaminergic lesion severity (41). The rate of rota-tions after apomorphine (dopamine agonist) injection (2mg/kg subcutaneously [s.c.]; Sigma) was measured in10 of the 6-OHDA rats for 60 minutes after MRI mea-surements. All these rats exhibited significant turningbehavior (�6 rotations/minute) (41), which indicates amassive loss of dopaminergic neurons.
All image analysis was carried out using custom-written IDL (Interactive Data Language, Research Sys-tems, Boulder, CO, USA) software developed in-house.The Paxinos and Watson (36) rat brain atlas was digi-tized, and overlaid on the corresponding MRI images toaid in selecting the appropriate regions of interest(ROIs). The ROIs were then selected in two differentways: first, ROIs were selected for each individual ani-mal independently; second, images from all animalswere registered using IDL 2D registration procedureand ROIs were selected only on the reference image.Since no significant differences were observed betweenthese two analyses, the results presented are from theformer analysis. The signal intensity in the ROIs wasaveraged and the percentage difference from the imagesbefore manganese injection was calculated. To correctfor possible variation in signal intensity between thedifferent measurements performed on different days,images were normalized according to the right muscu-lar area outside the brain where no Mn2� accumulationis expected or observed. Paired Student’s two tailedt-test statistics within groups (the same ROI at differenttime-points or between ROIs) and unpaired two tailedt-test across groups was used to assess significant sig-nal increase.
The ROIs that were selected for the SN manganeseinjection were: the anteroventral thalamic nucleus (AV;70 pixels), Hab complex (35 pixels) and the sensorimo-tor cortex (710 pixels) of the two hemispheres (total sixROIs), together with the right visual cortex area (650pixels) that was used as a control. For the EP injection,the same ROIs were used except for the thalamic relaynuclei due to its proximity to the injection site. For the
Hab injection, two ROIs were chosen at the interpedun-cular (IP) and the raphe nuclei.
RESULTS
Figure 1 shows the average signal time course for thePD and sham-operated rats at the four ROIs as a resultof MnCl2 injection to the EP. Examples of MEMRI im-ages taken 24-hour postinjection are also shown. Notethat for easier visualization of signal enhancementsthese images, as well as images in the other figures, areindependently scaled. Significant ipsi- and contralat-eral signal increase were observed in the Hab at 24hours and 48 hours postinjection in both PD and con-trol groups when compared with baseline (P � 0.05).There was significantly higher signal increases (at 24hours and 48 hours) in the PD rat group in both ipsi-and contralateral Hab (P � 0.05, Fig. 1a). Significantsignal increase compared to baseline was observed inthe sensorimotor cortex (Fig. 1b) 24 hours and 48 hourspostinjection, with significantly higher increase in thesham-operated group (P � 0.05). No signal increase wasobserved in the contralateral sensorimotor cortex.
Figure 2 shows the results of MnCl2 injections to theSN area. Significant signal increase was observed in thePD rat group 3 hours postinjection in both ipsi- andcontralateral AV (P � 0.05) with no corresponding in-creases in the sham-operated group (Fig. 2a). No signalincrease was observed at later times. In the Hab (Fig.2b), significant signal enhancement (P � 0.05) ipsi- andcontralateral to the injection site was observed 24hours postinjection, with no corresponding signalchange in the sham-operated rat group. At 48 hourspostinjection both the PD and sham-operated groupsexhibited significant signal increase in the ipsilateralHab (P � 0.05). No significant signal changes werefound in the sensorimotor cortex in both groups.
Figure 3 shows the results of MnCl2 injections to theHab area. As early as three hours after injection signif-icant signal increases in the IP were observed in thesham-operated rats as compared to baseline. In con-trast, IP signal enhancement in the PD rats reached itsmaximum at 24 hours postinjection (P � 0.05). In ad-dition, significant signal increases in the raphe nucleus(Fig. 3b) were observed at 24 hours postinjection in the6-OHDA group (P � 0.05) with no change in the controlgroup.
To test whether signal enhancement is independenton anatomical connections, a control area in the visualcortex was selected since it does not have direct con-nections with the EP, SN, or the Hab complex. As ex-pected, no Mn2� induced signal enhancement in thisarea was observed in any of the groups at any time-point postinjection following EP, SN, or Hab injections(P � 0.5).
DISCUSSION
The longitudinal study presented here and in particularthe proximity of the acquisition to the manganese in-jection operation, required special care with regard toanimal health conditions to minimize mortality. Multi-ple long anesthetic periods increase animal mortality
MEMRI in Parkinson’s Disease Rat Model 865

and can create irregular physiological conditions thatmight affect image signal intensity. Due to these rea-sons, effort was made to minimize the time that theanimals were kept under anesthesia. To obtain an SNRthat allows observing signal enhancement as low as�10% with total anesthetic time �30 minutes, 2Drather than 3D acquisition was used. Our other healthconcern was that long-term exposure to manganesecan cause neurological disorders whose symptoms aresimilar to Parkinsonism (42). However, animal studieshave demonstrated that a single dose (29) or repetitiveadministrations of MnCl2 (43) do not produce suchsymptoms in spite of the fact that in some cases anincrease in manganese concentration in BG nuclei wasobserved 24 hours after the first manganese adminis-tration (44). Therefore, we assume that the low dose ofinjected manganese did not create any neurological ef-fect particularly during the 48 hours of our measure-ments.
Major concerns in the MEMRI method used in thisstudy are: 1) the difficulty of differentiating between theeffect of passive diffusion and anterograde neuronaltransport; and 2) comparisons between the efficiency ofdifferent neuronal connections due to possible depen-dence on manganese transfer affinity. To address these
difficulties we have adopted the differential approach.Namely, we compare signal enhancements of nucleipair (injection site and chosen ROI) between control and6-OHDA groups. Additionally, nuclei proximate to in-jection sites or nuclei whose signal enhancement is notclearly separated from signal enhancement in the injec-tion site, are not used in the analysis.
In the discussion below we assume that: 1) the signalenhancement induced by manganese is related to theamount of manganese concentration (45); and 2) man-ganese accumulation and its time-course are indicativeof the connectivity between injection and target sites(46,47). Within these assumptions, the term “connec-tivity” is used repetitively below.
A good example of the strength and significance ofMEMRI is our results’ congruence with the expectedchanges in BG-cortex circuitry in the parkinsonianstate. The classical BG-cortex circuitry models predictthat following dopaminergic cell loss in the SNc, the BGoutput nuclei receive more excitatory input, resulting intheir increased inhibitory output (to the thalamus relaynuclei), followed by decreased cortical activity. Whileother neuroimaging studies have not observed de-creased primary motor activation in PD patients (48) orin a rat model of PD (49), our results suggest thatreduced BG-sensorimotor connectivity in PD is proba-
Figure 1. Percentage signal change following manganese in-jection to the entopeduncular nucleus (EP). Top panel: Per-centage signal change (with �1 mean standard error) before, 3,24, and 48 hours after injection to the EP in the habenulacomplex (Hab) (a) and the sensorimotor cortex (b) areas in thesham-operated (SHAM, N � 6) and 6-OHDA model rats (N � 6)(green and dashed-red for SHAM lesioned and nonlesionedhemispheres, respectively; blue and dashed-orange for6-OHDA lesioned and nonlesioned hemispheres, respectively;*P � 0.05 signal vs. baseline; §P � 0.05 SHAM vs. 6-OHDA).Bottom panels: typical MRI 24 hours after manganese injec-tion. Beside the injection site (black arrow), enhanced Mn2�
accumulation is seen (bright areas) in the ipsi- and contralat-eral Hab (a) and decreased Mn2� accumulation is observed inthe ipsilateral sensorimotor cortex in the Parkinson’s diseasemodel rats compared to sham-operated rats (b).
Figure 2. Percentage signal change following manganese in-jection to the substantia nigra (SN). Top panel: Percentagesignal change (with �1 mean standard error) before, 3, 24, and48 hours after injection to the SN in the anteroventral (AV)thalamic nucleus (a) and habenular complex (Hab) (b) areas inthe sham-operated (SHAM, N � 6) and 6-OHDA model rats(N � 6) (green and dashed-red for SHAM lesioned and nonle-sioned hemispheres, respectively; blue and dashed-orange for6-OHDA lesioned and nonlesioned hemispheres, respectively;*P � 0.05 signal vs. baseline; §P � 0.05 SHAM vs. 6-OHDA).Bottom panels: typical MRI 3 hours (a) and 24 hours (b) afterMnCl2 injection. Enhanced Mn2� accumulation is seen in theipsi- and contralateral AV thalamic nucleus (a) and Hab (b) inthe Parkinson’s disease model rats compared to sham-oper-ated rats.
866 Pelled et al.

bly a consequence of the reduced thalamus-cortex con-nectivity. Figure 1b shows the decreased sensorimotorcortex signal after MnCl2 injection to the EP area andFig. 2a shows the increase AV thalamic nucleus signalafter MnCl2 injection to the SN. This suggests that thesensorimotor cortex signal decrease was mediatedthrough the enhanced EP-thalamic functional (inhibi-tory) connectivity. Unfortunately, the proximity of thethalamic area to the EP has prohibited us from drawingany significant conclusions regarding changes in thethalamic signal intensity following EP MnCl2 injection.This agreement with classical model predictions,strengthens our view for the validity of the MEMRI re-sults in our PD/control comparison.
One of the motivations of this study was to test thehypothesis of bilateral BG connectivity (47) originatedby reports of bilateral abnormal cortical responses andresting state fluctuations in the unilateral model of PD(16,41,50) and in hemiparkinsonian patients (15). Thefindings of strong bilateral connections from the BGoutput nuclei to the AV thalamic nucleus and to theHab complex strongly support the idea of bilateral con-nectivity that is not mediated by the cortex (16). How-ever, one could claim that the bilateral connectivityfrom the BG output nuclei to the Hab complex, ob-served in the 6-OHDA rat group, could be explained bybilateral Hab connectivity and not by bilateral BG-Habconnectivity. However, since there are very few neurons
in the lateral Hab and none in the medial Hab withcontralateral projections within the habenular commis-sure (51), and since there were equivalent temporalpatterns of the signal increases in the right and the leftHab complexes following manganese injection to the SNarea (Fig. 2a), this favors the latter explanation of en-hanced bilateral BG projections (19,20).
Another goal of this study was to test whether the lossof dopamine in the SNc affects the effective connectivitybetween different limbic structures. The significant sig-nal enhancement in the Hab complex as a results ofmanganese injection to the BG output nuclei on onehand and the stronger signal enhancement in 6-OHDArats on the other hand, suggest that the Hab complex islinked to BG circuit in healthy and in parkinsonian-likestates, which was shown for the former in primates(23). The signal enhancement in the IP and in the raphenuclei in the 6-OHDA rat group after manganese injec-tion to the Hab, suggest enhanced connectivity from theHab to these nuclei and that this connectivity is prob-ably mediated by the enhanced BG-Hab connections.Of particular interest is the involvement of the raphenucleus since it generates most of the brain’s serotonin(5-HT), which is known to modulate mood, emotion,sleep, and appetite. Evidence for the involvement of5-HT dysfunction in PD depression (52–55) and innon-PD depressed patients (56), including the fact thatmore than 40% of PD patients suffer from depressionand mood disorders in addition to their motor disorders(57,58), support the notion that the serotonin system isinvolved in PD. The ventral striatum, including the nu-cleus accumbens, in which an interaction between the5-HT and the dopaminergic systems is known to exist,was suggested as a possible pathway connecting dopa-minergic and serotonergic systems, thus modulatingdopamine and 5-HT release in PD (59). Here, we pro-pose that the linkage between these two systems istaking place through the Hab complex: The overactiva-tion of the Hab complex by the BG output nuclei in-creases its inhibitory �-aminobutyric acid (GABA) out-put (60–62) to both the raphe and the IP nuclei,reducing 5-HT synthesis in the raphe nucleus.
Incorporating known anatomical connections withour findings, we propose to extend the classical box-and-arrow model of the BG-cortex circuitry by linking itto a limbic circuit. Indeed, little is known about thecomplex molecular and the network mechanisms link-ing these two circuits and, in particular, the modifica-tions they can undergo during pathological states. Al-though this extension is based on limited data andclearly additional different experiments are needed, theproposed circuit points out that alteration in one neu-ronal circuit (BG) affects the other (limbic). For simplic-ity, the cortex-BG-cortex circuit of the diagram (Fig. 4,right side) uses the classical view and no attempt hasbeen made to include more recent views. The shadedarea in the diagram symbolizes the new limbic circuitwhereas the classical cortex-BG-cortex circuit is shownin the bright (right) side. Black and white arrows areinhibitory and excitatory projections, respectively,while arrow width represents projection efficiency. Con-sider first the healthy brain: as in the classical view, thecortex sends excitatory input to the striatum, which in
Figure 3. Percentage signal changes following manganese in-jection to the habenular complex (Hab). Top panel: Percentagechange (with �1 mean standard error) before, 3, 24, and 48hours after injection to the Hab in the interpeduncular nu-cleus (IP) (a) and in the raphe nucleus (b) (green sham-oper-ated [SHAM, N � 6]; blue 6-OHDA N � 6; *P � 0.05 signal vs.baseline; §P � 0.05 SHAM and 6-OHDA difference). Bottompanels: typical MRI of SHAM and 6-OHDA rats taken 24 hoursafter MnCl2 injection. Significant enhanced Mn2� accumula-tion was found in the IP (a) and the raphe nucleus (b) 24 hourspostinjection in the 6-OHDA compared to sham-operated rats.[Color figure can be viewed in the online issue, which is avail-able at www.interscience.wiley.com.]
MEMRI in Parkinson’s Disease Rat Model 867
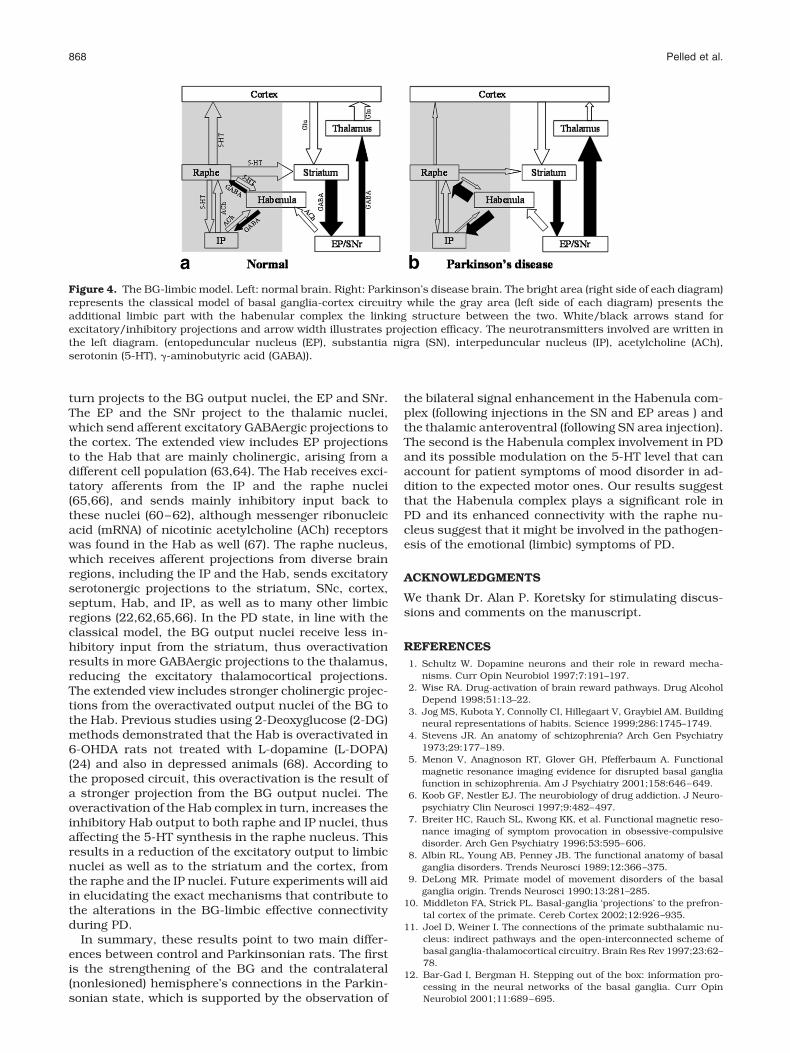
turn projects to the BG output nuclei, the EP and SNr.The EP and the SNr project to the thalamic nuclei,which send afferent excitatory GABAergic projections tothe cortex. The extended view includes EP projectionsto the Hab that are mainly cholinergic, arising from adifferent cell population (63,64). The Hab receives exci-tatory afferents from the IP and the raphe nuclei(65,66), and sends mainly inhibitory input back tothese nuclei (60–62), although messenger ribonucleicacid (mRNA) of nicotinic acetylcholine (ACh) receptorswas found in the Hab as well (67). The raphe nucleus,which receives afferent projections from diverse brainregions, including the IP and the Hab, sends excitatoryserotonergic projections to the striatum, SNc, cortex,septum, Hab, and IP, as well as to many other limbicregions (22,62,65,66). In the PD state, in line with theclassical model, the BG output nuclei receive less in-hibitory input from the striatum, thus overactivationresults in more GABAergic projections to the thalamus,reducing the excitatory thalamocortical projections.The extended view includes stronger cholinergic projec-tions from the overactivated output nuclei of the BG tothe Hab. Previous studies using 2-Deoxyglucose (2-DG)methods demonstrated that the Hab is overactivated in6-OHDA rats not treated with L-dopamine (L-DOPA)(24) and also in depressed animals (68). According tothe proposed circuit, this overactivation is the result ofa stronger projection from the BG output nuclei. Theoveractivation of the Hab complex in turn, increases theinhibitory Hab output to both raphe and IP nuclei, thusaffecting the 5-HT synthesis in the raphe nucleus. Thisresults in a reduction of the excitatory output to limbicnuclei as well as to the striatum and the cortex, fromthe raphe and the IP nuclei. Future experiments will aidin elucidating the exact mechanisms that contribute tothe alterations in the BG-limbic effective connectivityduring PD.
In summary, these results point to two main differ-ences between control and Parkinsonian rats. The firstis the strengthening of the BG and the contralateral(nonlesioned) hemisphere’s connections in the Parkin-sonian state, which is supported by the observation of
the bilateral signal enhancement in the Habenula com-plex (following injections in the SN and EP areas ) andthe thalamic anteroventral (following SN area injection).The second is the Habenula complex involvement in PDand its possible modulation on the 5-HT level that canaccount for patient symptoms of mood disorder in ad-dition to the expected motor ones. Our results suggestthat the Habenula complex plays a significant role inPD and its enhanced connectivity with the raphe nu-cleus suggest that it might be involved in the pathogen-esis of the emotional (limbic) symptoms of PD.
ACKNOWLEDGMENTS
We thank Dr. Alan P. Koretsky for stimulating discus-sions and comments on the manuscript.
REFERENCES1. Schultz W. Dopamine neurons and their role in reward mecha-
nisms. Curr Opin Neurobiol 1997;7:191–197.2. Wise RA. Drug-activation of brain reward pathways. Drug Alcohol
Depend 1998;51:13–22.3. Jog MS, Kubota Y, Connolly CI, Hillegaart V, Graybiel AM. Building
neural representations of habits. Science 1999;286:1745–1749.4. Stevens JR. An anatomy of schizophrenia? Arch Gen Psychiatry
1973;29:177–189.5. Menon V, Anagnoson RT, Glover GH, Pfefferbaum A. Functional
magnetic resonance imaging evidence for disrupted basal gangliafunction in schizophrenia. Am J Psychiatry 2001;158:646–649.
6. Koob GF, Nestler EJ. The neurobiology of drug addiction. J Neuro-psychiatry Clin Neurosci 1997;9:482–497.
7. Breiter HC, Rauch SL, Kwong KK, et al. Functional magnetic reso-nance imaging of symptom provocation in obsessive-compulsivedisorder. Arch Gen Psychiatry 1996;53:595–606.
8. Albin RL, Young AB, Penney JB. The functional anatomy of basalganglia disorders. Trends Neurosci 1989;12:366–375.
9. DeLong MR. Primate model of movement disorders of the basalganglia origin. Trends Neurosci 1990;13:281–285.
10. Middleton FA, Strick PL. Basal-ganglia ‘projections’ to the prefron-tal cortex of the primate. Cereb Cortex 2002;12:926–935.
11. Joel D, Weiner I. The connections of the primate subthalamic nu-cleus: indirect pathways and the open-interconnected scheme ofbasal ganglia-thalamocortical circuitry. Brain Res Rev 1997;23:62–78.
12. Bar-Gad I, Bergman H. Stepping out of the box: information pro-cessing in the neural networks of the basal ganglia. Curr OpinNeurobiol 2001;11:689–695.
Figure 4. The BG-limbic model. Left: normal brain. Right: Parkinson’s disease brain. The bright area (right side of each diagram)represents the classical model of basal ganglia-cortex circuitry while the gray area (left side of each diagram) presents theadditional limbic part with the habenular complex the linking structure between the two. White/black arrows stand forexcitatory/inhibitory projections and arrow width illustrates projection efficacy. The neurotransmitters involved are written inthe left diagram. (entopeduncular nucleus (EP), substantia nigra (SN), interpeduncular nucleus (IP), acetylcholine (ACh),serotonin (5-HT), �-aminobutyric acid (GABA)).
868 Pelled et al.

13. Joel D, Weiner I. The organization of the basal ganglia-thalamocor-tical circuits: open interconnected rather than closed segregated.Neuroscience 1994;63:363–379.
14. Bar-Gad I, Havazelet-Heimer G, Goldberg JA, Ruppin E, BergmanH. Reinforcement-driven dimensionality reduction—a model for in-formation processing in the basal ganglia. J Basic Clin PhysiolPharmacol 2000;11:305–320.
15. Thobois S, Dominey P, Decety J, Pollak P, Gregoire MC, BroussolleE. Overactivation of primary motor cortex is asymmetrical inhemiparkinsonian patients. Neuroreport 2000;11:785–789.
16. Pelled G, Bergman H, Goelman G. Bilateral overactivation of thesensorimotor cortex in the unilateral rodent model of Parkinson’sdisease—a functional magnetic resonance imaging study. EurJ Neurosci 2002;15:389–394.
17. Pritzel M, Sarter M, Morgan S, Huston JP. Interhemispheric nigro-striatal projections in the rat: bifurcating nigral projections and lociof crossing in the diencephalon. Brain Res Bull 1983;10:385–390.
18. Morgan S, Huston JP. The interhemispheric projection from thesubstantia nigra to the caudate-putamen as depicted by the an-terograde transport of [3H]leucine. Behav Brain Res 1990;38:155–162.
19. Parent A, Hazrati LN. Functional anatomy of the basal ganglia. I.The cortico-basal ganglia-thalamo-cortical loop. Brain Res Rev1995;20:91–127.
20. Gerfen CR, Wilson CJ. The basal ganglia. In: Swanson LW, Bjork-lund A, Hokfelt T, editors. In: Handbook of chemical neuroanat-omy, New York: Elsevier Science; 1996. p 371–468.
21. Sutherland RJ. The dorsal diencephalic conduction system: a re-view of the anatomy and functions of the habenular complex. Neu-rosci Biobehav Rev 1982;6:1.
22. Ellison G. Stimulant-induced psychosis, the dopamine theory ofschizophrenia, and the habenula. Brain Res Brain Res Rev 1994;19:223–239.
23. Saleem KS, Pauls JM, Augath M, et al. Magnetic resonance imagingof neuronal connections in the macaque monkey. Neuron 2002;34:685–700.
24. Trugman JM, Wooten GF. The effects of L-DOPA on regional cere-bral glucose utilization in rats with unilateral lesions of the sub-stantia nigra. Brain Res 1986;379:264–274.
25. Pautler RG, Silva AC, Koretsky AP. In vivo neuronal tract tracingusing manganese-enhanced magnetic resonance imaging. MagnReson Med 1998;40:740–748.
26. Koretsky AP, Silva AC. Manganese-enhanced magnetic resonanceimaging (MEMRI). NMR Biomed 2004;17:527–531.
27. Lee JH, Koretsky AP. Manganese enhanced magnetic resonanceimaging. Curr Pharm Biotechnol 2004;5:529–537.
28. Lin YJ, Koretsky AP. Manganese ion enhances T1-weighted MRIduring brain activation: an approach to direct imaging of brainfunction. Magn Reson Med 1997;38:378.
29. Saleem KS, Pauls JM, Augath M, et al. Magnetic resonance imagingof neuronal connections in the macaque monkey. Neuron 2002;34:685.
30. Van Der Linden A, Verhoye M, Van Meir V, et al. In vivo manganese-enhanced magnetic resonance imaging reveals connections andfunctional properties of the songbird vocal control system. Neuro-science 2002;112:467.
31. Van Meir V, Pavlova D, Verhoye M, et al. In vivo MR imaging of theseasonal volumetric and functional plasticity of song control nucleiin relation to song output in a female songbird. Neuroimage 2006;31:981–992.
32. Yu X, Wadghiri YZ, Sanes DH, Turnbull DH. In vivo auditory brainmapping in mice with Mn-enhanced MRI. Nat Neurosci 2005;8:961–968.
33. Angenstein F, Niessen HG, Goldschmidt J, et al. Manganese-en-hanced MRI reveals structural and functional changes in the cortexof Bassoon mutant mice. Cereb Cortex 2007;17:28–36.
34. Thuen M, Singstad TE, Pedersen TB, et al. Manganese-enhancedMRI of the optic visual pathway and optic nerve injury in adult rats.J Magn Reson Imaging 2005;22:492–500.
35. Murayama Y, Weber B, Saleem KS, Augath M, Logothetis NK. Trac-ing neural circuits in vivo with Mn-enhanced MRI. Magn ResonImaging 2006;24:349–358.
36. Paxinos G, Watson C. The rat brain in stereotaxic coordinates, 2ndedition. New York: Academic Press; 1986. 237 p.
37. Pautler RG, Silva AC, Koretsky AP. In vivo neuronal tract tracingusing manganese-enhanced magnetic resonance imaging. MagnReson Med 1998;40:740.
38. Iltis I, Kober F, Dalmasso C, Lan C, Cozzone PJ, Bernard M. In vivoassessment of myocardial blood flow in rat heart using magneticresonance imaging: effect of anesthesia. J Magn Reson Imaging2005;22:242–247.
39. Mills CD, Robertson CS, Contant CF, Henley CM. Effects of anes-thesia on polyamine metabolism and water content in the rat brain.J Neurotrauma 1997;14:943–949.
40. Wood AK, Klide AM, Pickup S, Kundel HL. Prolonged general anes-thesia in MR studies of rats. Acad Radiol 2001;8:1136–1140.
41. Schwarting RK, Huston JP. Unilateral 6-hydroxydopamine lesionsof meso-striatal dopamine neurons and their physiological se-quelae. Prog Neurobiol 1996;49:215–266.
42. Calne DB, Chu NS, Huang CC, Lu CS, Olanow W. Manganism andidiopathic parkinsonism: similarities and differences. Neurology1994;44:1583–1586.
43. Baek SY, Lee MJ, Jung HS, et al. Effect of manganese exposure onMPTP neurotoxicities. Neurotoxicology 2003;24:657–665.
44. Dodd CA, Ward DL, Klein BG. Basal ganglia accumulation andmotor assessment following manganese chloride exposure in theC57BL/6 mouse. Int J Toxicol 2005;24:389–397.
45. Chuang KH, Koretsky A. Improved neuronal tract tracing usingmanganese enhanced magnetic resonance imaging with fast T(1)mapping. Magn Reson Med 2006;55:604–611.
46. Van der Linden A, Van Meir V, Tindemans I, Verhoye M, BalthazartJ. Applications of manganese-enhanced magnetic resonance imag-ing (MEMRI) to image brain plasticity in song birds. NMR Biomed2004;17:602–612.
47. van der Zijden JP, Wu O, van der Toorn A, Roeling TP, Bleys RL,Dijkhuizen RM. Changes in neuronal connectivity after stroke inrats as studied by serial manganese-enhanced MRI. Neuroimage2007;34:1650–1657.
48. Sabatini U, Boulanouar K, Fabre N, et al. Cortical motor reorgani-zation in akinetic patients with Parkinson’s disease: a functionalMRI study. Brain 2000;123(Pt 2):394–403.
49. Pelled G, Bergman H, Goelman G. Bilateral overactivation of thesensorimotor cortex in the unilateral rodent model of Parkinson’sdisease—a functional magnetic resonance imaging study. EurJ Neurosci 2002;15:389–394.
50. Pelled G, Bergman H, Ben-Hur T, Goelman G. Reduced basal ac-tivity and increased functional homogeneity in sensorimotor andstriatum of a Parkinson’s disease rat model: a functional MRIstudy. Eur J Neurosci 2005;21:2227–2232.
51. Araki T, Tanji H, Kato H, Itoyama Y. Sequential changes of dopa-minergic receptors in the rat brain after 6- hydroxydopamine le-sions of the medial forebrain bundle. J Neurol Sci 1998;160:121–127.
52. Mayeux R, Stern Y, Cote L, Williams J. Altered serotonin metabo-lism in depressed patients with Parkinson’s disease. Neurology1984;34:642–646.
53. McCance-Katz EF, Marek KL, Price LH. Serotonergic dysfunction indepression associated with Parkinson’s disease. Neurology 1992;42:1813–1814.
54. Becker T, Becker G, Seufert J, et al. Parkinson’s disease and de-pression: evidence for an alteration of the basal limbic systemdetected by transcranial sonography. J Neurol Neurosurg Psychi-atry 1997;63:590–595.
55. Murai T, Muller U, Werheid K, et al. In vivo evidence for differentialassociation of striatal dopamine and midbrain serotonin systemswith neuropsychiatric symptoms in Parkinson’s disease. J Neuro-psychiatry Clin Neurosci 2001;13:222–228.
56. Smith KA, Morris JS, Friston KJ, Cowen PJ, Dolan RJ. Brainmechanisms associated with depressive relapse and associatedcognitive impairment following acute tryptophan depletion. Br JPsychiatry 1999;174:525–529.
57. Anderson KE, Weiner WJ. Psychiatric symptoms in Parkinson’sdisease. Curr Neurol Neurosci Rep 2002;2:303–309.
58. Burn DJ. Depression in Parkinson’s disease. Eur J Neurol 2002;9(Suppl 3):44–54.
59. Alexander GE, Crutcher MD, DeLong MR. Basal ganglia-thalamocortical circuits: parallel substrates for motor, oculomo-tor, “prefrontal” and “limbic” functions. Prog Brain Res 1990;85:119–146.
MEMRI in Parkinson’s Disease Rat Model 869

60. Wang RY, Aghajanian GK. Physiological evidence for habenula asmajor link between forebrain and midbrain raphe. Science 1977;197:89–91.
61. Nishikawa T, Fage D, Scatton B. Evidence for, and nature of, thetonic inhibitory influence of habenulointerpeduncular pathwaysupon cerebral dopaminergic transmission in the rat. Brain Res1986;373:324–336.
62. Kalen P, Strecker RE, Rosengren E, Bjorklund A. Regulation ofstriatal serotonin release by the lateral habenula-dorsal raphepathway in the rat as demonstrated by in vivo microdialysis: role ofexcitatory amino acids and GABA. Brain Res 1989;492:187–202.
63. Kha HT, Finkelstein DI, Pow DV, Lawrence AJ, Horne MK. Study ofprojections from the entopeduncular nucleus to the thalamus ofthe rat. J Comp Neurol 2000;426:366–377.
64. Moriizumi T, Hattori T. Choline acetyltransferase-immunoreactiveneurons in the rat entopeduncular nucleus. Neuroscience 1992;46:721–728.
65. Hamill GS, Jacobowitz DM. A study of afferent projections to the ratinterpeduncular nucleus. Brain Res Bull 1984;13:527–539.
66. Morley BJ. The interpeduncular nucleus. Int Rev Neurobiol 1986;28:157–182.
67. Deutch AY, Holliday J, Roth RH, Chun LL, Hawrot E. Immunohis-tochemical localization of a neuronal nicotinic acetylcholine recep-tor in mammalian brain. Proc Natl Acad Sci USA 1987;84:8697–8701.
68. Caldecott-Hazard S, Mazziotta J, Phelps M. Cerebral correlates ofdepressed behavior in rats, visualized using 14C-2-deoxyglucoseautoradiography. J Neurosci 1988;8:1951–1961.
870 Pelled et al.