Management Present - China Communications Services ...
39
-
Upload
khangminh22 -
Category
Documents
-
view
3 -
download
0
Transcript of Management Present - China Communications Services ...


MR. SI FURONG
MS. ZHANG XUEXECUTIVE VICE PRESIDENT & CFO
PRESIDENT
EXECUTIVE VICE PRESIDENT MR. LIANG SHIPING
Management Present

Agenda
Financial Results
Business Review
Overview

Overview
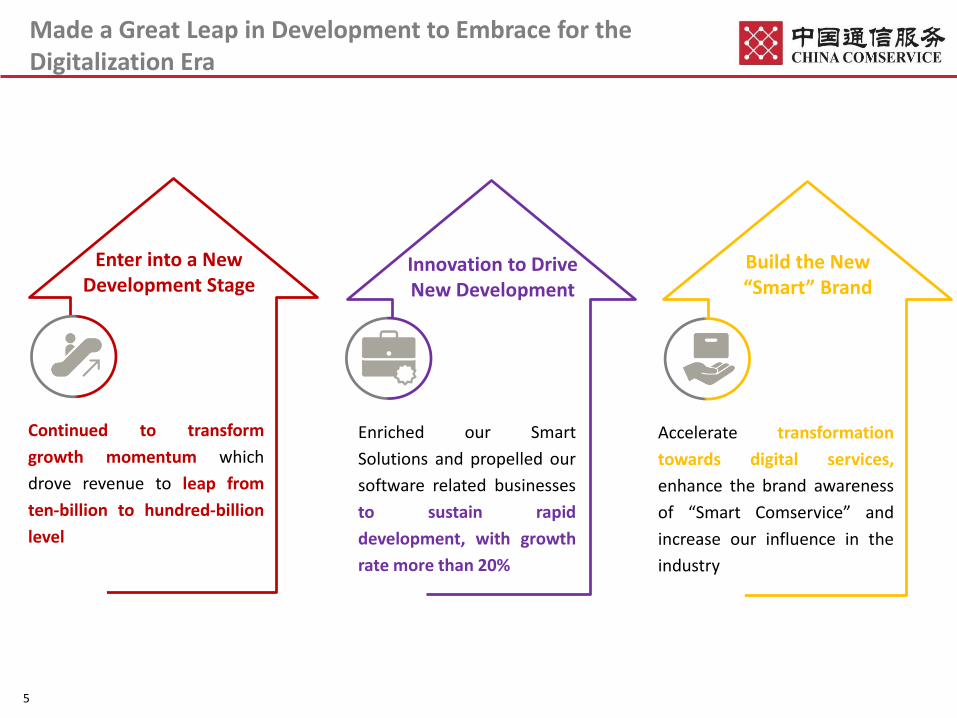
Innovation to Drive New Development
Build the New “Smart” Brand
Made a Great Leap in Development to Embrace for the Digitalization Era
Enter into a New Development Stage
5
Enriched our Smart
Solutions and propelled our
software related businesses
to sustain rapid
development, with growth
rate more than 20%
Continued to transform
growth momentum which
drove revenue to leap from
ten-billion to hundred-billion
level
Accelerate transformation
towards digital services,
enhance the brand awareness
of “Smart Comservice” and
increase our influence in the
industry

6
Favourable Operating Results
Revenue growth hit 6-year high yoy
2013 2014 2015 2016 2017 2018
Revenue Growth Rate
6.9%
10.6%9.3%
6.9%
12.3%11.3%
Unless otherwise stated, the following terms in the presentation are defined as follows:(1) Other than three telecommunications operators, domestic operator market also includes China Tower(2) Domestic non-operator represents domestic non-telecom operator market(3) Core businesses comprise TIS, Core BPO and ACO Businesses, i.e. excluded Products Distribution Business. Please refer to the business revenue breakdown on p.11 for details(4) Free cash flow = profit for the year + depreciation & amortization – changes in working capital – CAPEX(5) Cash conversion ratio = net cash generated from operating activities / net profit
Revenue grew by 12.3%
to RMB 106,177 million;
of which core businesses
revenue increased by
15.6%
Net profit
grew by 6.9% to
RMB 2,901 million
Free cash flow reached
RMB 3,613 million,
cash conversion ratio
continued to
maintain at a healthy level
DPS(with special dividend)
increased by 6.9%,
representing a dividend
payout ratio of 36%

Continued to Transform Growth Momentum, Driving Revenue Scale Exceeded Hundred-billion Level
Revenue Growth Drivers
(RMB’M)
DomesticOperator
TIS+2,817
DomesticNon-operator
Core Businesses
+4,650
DomesticOperatorCore BPO
+2,340
Others-160
(+26.5%)
(+14.1%)
(+7.9%)
DomesticNon-operator
Core Businesses
+7,516
DomesticOperator
TIS+1,676
201820172016
Products Distribution
-2,072
88,449
94,572
106,177
(+33.9%)
(+4.3%)
(+17.7%)
Others+1,141
Products Distribution
-3,524(-2.0%)
(-33.6%)
(+14.5%) (-29.8%)
DomesticOperatorCore BPO
+3,344
+6.9%
+12.3%
Domestic non-operator market: revenue growth accelerated, and its contribution to the overall incremental revenue surpassed domestic operator market
Domestic operator market:
Vigorously developed OPEX-driven business, and core BPO businesses’ contribution to incremental revenue surpassed TIS business of domestic operators
Maintained a steady growth on TIS business of domestic operators despite the fall of overall CAPEX in the telecom industry
Seized ICT business demand arising from the transformation of domestic operators, growth of ACO businesses accelerated
7
Domestic Operator Domestic Non-operator Overseas Customer

8
Enter into a New Stage of Development
新行列
New Image
New Breakthrough
New Power
New Milestone New Capabilities
Hundred-billion Enterprise
Smart
Comservice
Business
Innovation
Synergistic
Development
SOE
Reform
Economies of Scale
Brand Building
Officially released the Smart Society Product Portfolio; ranked 6th in “China's Top 100
Software Enterprises 2018” and was awarded “Top Ten Leading Enterprises for Information Technology Industry in 2019”,
which manifested its industry status
Transformed growth momentum, revenue hit
over RMB 100 billion level
Expedited Development
Software and system integration businesses in the ACO businesses
sustained >20% growth for 2 consecutive years, bringing proportion
of ACO revenue to total revenues increase for the 3rd straight year
Capability Enhancement
Reform and Innovation
Included in the list of “Double-hundred Action”, providing new
opportunities for the enhancement of corporate capabilities, vitality and
transformative development
Synergized cross-province marketing and implementation in the frontline with technical
expertise at backstage; leveraged resources of the whole group to form new power and won more than
60 projects through synergistic development, and large-scale benchmark projects continued to emerge

Seize New Opportunities along the Main Tracks of Development
Industry TrendMacro Environment National Policies
9
Leading Provider of Producer Services in the Informatization SectorValue‐driven, Seeking Steady yet Progressive Growth and High‐quality Development
Economic developmentmomentum shifts totechnology innovation
Digital Economy becomesthe new growth driver…
New technologies expedite theintegration of digitalization withindustries and enterprises
Government further promotes5G development…
“Cyberpower”, “Digital China”,“Smart Society”, “Belt and Road”Initiative
SOE Reform, “Double HundredAction” …
Bolstering Cyberpower Strategy,Building First-class Enterprise,Serving a Good Life
• Leverage on technologies such as BigData, Cloud Computing and IoT tofurther enrich and optimize smartsolutions for various industries
• Further enhance the cultivation of the“Smart Comservice” brand throughvarious means
• Utilize external and internal resourcesfor synergistic development andecosystem construction
• Take CAPEX and OPEX as dual drivers tofurther penetrate traditional businessesand closely follow 5G opportunities
• Accommodate demand from newecosystem and capture the demand onICT businesses arising from domesticoperators’ transformation
• Strengthen collaboration and jointlydevelop domestic non-operator andoverseas market
• Focus on telecommunicationsinfrastructure construction and networkupgrade; and replicate mature domesticsmart products to overseas market
• Cooperate with domestic operators and“Go Abroad” Chinese enterprises tojointly develop overseas market

Business Review

Business Revenue Breakdown
2017 2018 Change % % of Revenue
TIS (Telecommunications Infrastructure Services)
Design 10,239 10,605 3.6% 10.0%
Construction 36,668 42,863 16.9% 40.4%
Supervision 3,604 3,891 8.0% 3.6%
Subtotal 50,511 57,359 13.6% 54.0%
BPO (Business Process Outsourcing Services)
Maintenance 12,829 14,793 15.3% 13.9%
Facilities Management 4,555 5,278 15.9% 5.0%
Supply Chain 8,424 10,149 20.5% 9.6%
Subtotal 25,808 30,220 17.1% 28.5%
Products Distribution 6,955 4,883 -29.8% 4.6%
Subtotal 32,763 35,103 7.1% 33.1%
ACO (Applications, Content and Other Services)
System Integration 5,790 7,373 27.3% 6.9%
Software Development & System Support
2,049 2,502 22.1% 2.4%
Value-added Services 1,570 1,934 23.2% 1.8%
Others 1,889 1,906 0.9% 1.8%
Subtotal 11,298 13,715 21.4% 12.9%
Total for Core Businesses (1) 87,617 101,294 15.6% 95.4%
Total 94,572 106,177 12.3% 100%
Core BPO Businesses
(RMB’M)
(1) Core businesses comprise TIS, Core BPO and ACO Businesses, i.e. excluded Products Distribution Business11

11,29810,029
13,715
Revenue Growth Trend by Businesses and Markets
Revenue Growth by Markets
(RMB’M)
Revenue Growth by Businesses
(RMB’M)
106,177
ACO
94,572
+13.6%
+21.4%
+7.1%
TIS BPO
2017 2018
88,449
2016
+12.7%
+0.7%
+10.1%
35,103
32,76332,533
57,359
50,511
45,887
106,177
OverseasCustomer
94,572
+7.1%
+11.2%
+25.0%
+12.3%
Domestic Operator
Domestic Non-operator
2017 2018
88,449
2016
-26.2%
+12.4%
+6.9%
+6.9%
3,155
23,71426,656
60,889
65,080
33,317
69,705
+12.3%
+6.9%
2,8363,846
12
Compared with 2017, growth of 3 businesses and 3 markets experienced accelerating growth of various degree
Domestic Non-operator: led by planning and consultation businesses and capitalized on ACO core products,the provision of integrated comprehensive solutions drove the growth of TIS and BPO businesses
Domestic operator: vigorously developed OPEX business and exploited customers’ demand for ICT businesses,BPO and ACO businesses supported continuous and steady revenue growth
Overseas customer: breakthrough development on key projects were achieved, revenue stabilized andrecovered

Note: All % figures in bracket are as a % of total revenues, i.e. included Products Distribution Business
Core Businesses Revenue Composition
2016
2017
2018
39.7%(38.9%)
45.2%(43.9%)
48.3%(45.9%)
27.9%(26.8%)
26.3%(24.9%)
25.1%(22.9%)
29.3%(31.4%)
25.3%(28.2%)
22.5%(26.8%)
4.1%(4.4%)
3.2%(3.0%)
3.1%(2.9%)
China Telecom
China Mobile, China Unicom & China Tower
Domestic Non-operator
Overseas Customer
13
Customer revenue structure further optimized
and became more diversified, portion of
revenue from domestic operators other than
China Telecom and domestic non-operator
escalated progressively year on year
Proportion of Core Businesses revenue from
domestic non-operator for the first time
surpassed domestic operators other than
China Telecom and became the second largest
customer group

Domestic Non-operator Market I – Business Performance
Core Businesses
+7,516
Products Distribution
-855
Revenue Growth Drivers
(RMB’M)
Core Businesses
+4,650
Products Distribution
-1,708 Core Businesses Revenue
Products Distribution Revenue
14
Seizing the opportunities from Digital Economy and Smart Society and further enhancing the integrated service capabilitiesand market influence, turnkey projects of RMB100 million scale kept emerging:
Including Intelligentizatoin Project for Shenzhen World Exhibition & Convention Center, “Smart Park” Project forBeijing Expo 2019, etc.
Officially released the “Smart Society Product Portfolio”, and build the “Smart Comservice” branding
Successfully made foray into the software enterprise ecosystem, and ranked as top 10 enterprises in 2 renownedrankings in the industry
Proactive cultivation of ecosystems: internally, we established Ecosystem Alliances for Cloud Computing, IoT and SmartCity; externally, we established “Smart Service Industrial Ecosystem Alliance”
2017 2018
22,185
4,471
26,656
(+33.9%)
+25.0%
(-19.1%)
33,317
3,616
29,701
2016
23,714(+26.5%)
(-27.6%)
+12.4%
17,535
6,179
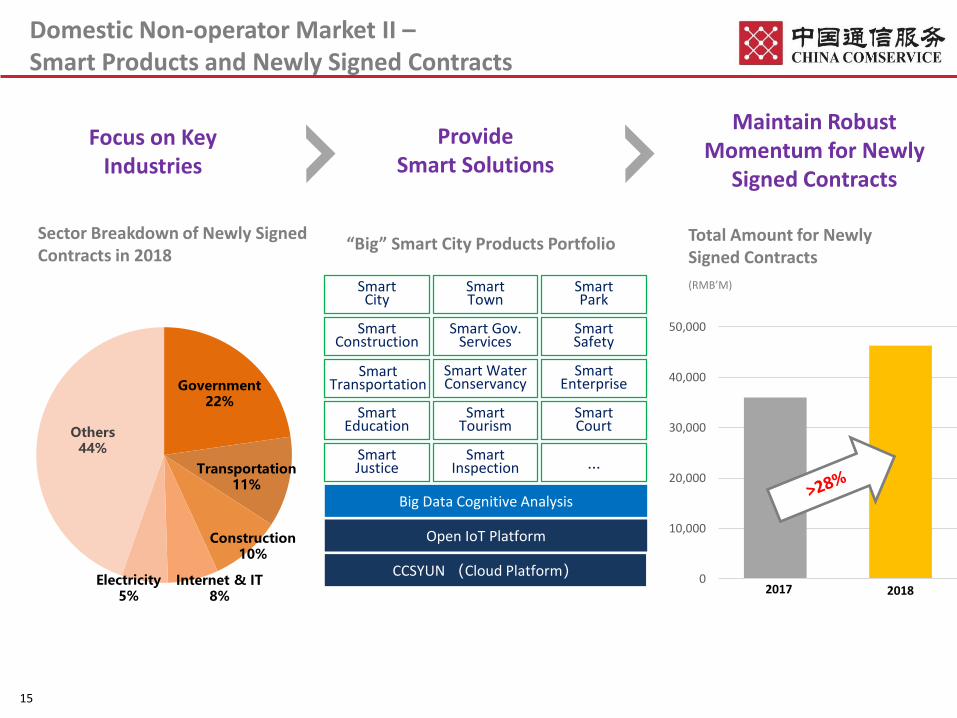
Government22%
Transportation11%
Internet & IT8%
Electricity5%
Others44%
Domestic Non-operator Market II –Smart Products and Newly Signed Contracts
Total Amount for NewlySigned Contracts
(RMB’M)
Sector Breakdown of Newly Signed Contracts in 2018
Construction10%
“Big” Smart City Products Portfolio
Focus on Key Industries
ProvideSmart Solutions
Maintain Robust Momentum for Newly
Signed Contracts
Smart Gov. Services
Smart City
Smart Tourism
Smart Water Conservancy
Smart Town
Smart Court
SmartPark
Smart Justice
SmartSafety
Smart Inspection
Smart Education
Smart Construction
…
Open IoT Platform
CCSYUN (Cloud Platform)
Big Data Cognitive Analysis
15
0
10,000
20,000
30,000
40,000
50,000
2017 2018
Smart Enterprise
Smart Transportation

Smart Platforms andRich Smart Product Portfolio
Domestic Non-operator Market III –Our Advantages and Ecosystem Construction
• With economies of scale and a
trustable partner for customers
• Leading by planning and consultationbusinesses and capitalizing on ACO coreproducts, provide integratedinformatization solutions to customers
• Over 20 smart product solutions and aproduct portfolio that could bedisassembled or combined atcustomers’ request
• Our team provide nationwidecoverage and localized support forimplementation, operation andmaintenance
Hundred-billionState-owned Listed Group
Top Qualification in Informatization Sector
• Possess decades of experience inserving domestic operators, topqualification for information &telecommunication sector andsecurity sector
Top-Level Planning and Design Capabilities for Smart City
• 10,000 consultation experts and10,000 software engineers providecomprehensive services from top-level design to product developmentand operation
Multi-business
Integrated ServicesLocalized Execution Capabilities
with Comprehensive Coverage
Leveraging on our competitiveedges and platforms to pooltogether the strength of OneCCS
Open up our fundamentalcapabilities to business partners,industry customers
Promote cross-sector cooperation,converge resources along industrialchain and develop new applicationsscenario
16
Cultivate a Tight IndustryEcosystem
Continuously OptimizeInternal Ecosystem
Form an Ecological Community

Domestic Operator Market I – Customer Performance
Revenue Growth Drivers
(RMB’M)
2017 2018
41,568
23,512
China Telecom
-28965,080
(-0.7%)
+7.1%
(+20.9%)
69,705
28,426
41,279
2016
60,889
China Telecom
+971
China Mobile, China Unicom & China Tower
+3,220
(+2.4%)(+15.9%)
+6.9%
China Telecom
40,597
20,292
China Mobile, China Unicom & China Tower
China Mobile, China Unicom & China Tower
+4,914
17
Domestic operator market maintained continuous growth through enhancing project management and
delivery quality
Revenue from domestic operators other than China Telecom grew over 20% and maintained rapid
development
Excluding products distribution business, revenue from Core Businesses of China Telecom increased by
1.5% yoy

Domestic Operator Market II – Business Performance
Revenue Growth Drivers
(RMB’M)
ACO+200
ACO+807Products
Distribution-1,166
(-32.3%)
Products Distribution
-1,202
(-49.2%)Core BPO
+2,340 5,86665,080
2017
TIS+1,676Core BPO
+3,344
38,649
21,372
TIS BPO ACO
(+4.3%)
(+17.7%)
(+15.9%)
:+9.3%
2018
5,059
69,705
23,514
40,325
2016
60,889
35,832
20,198
4,859
TIS+2,817
(+7.9%)
(+14.1%)(+4.1%)
: +9.4%
+7.1%
+6.9%
18
Core Businesses Revenue Growth
Core Businesses Revenue Growth
By vigorously developing OPEX business, contribution from Core BPO businesses to the incremental
revenue surpassed TIS business
Deeply penetrated into CAPEX business and enhanced our market share, TIS business maintained stable
growth
Proactively prepared for the new ICT businesses demand arising from domestic operator transformation,
revenue growth of ACO businesses accelerated

(RMB’billion)
800
700
600
500
400
300
200
100
02020 2021 2022 2023 2024 2025 2026 2027 2028 2029 2030
From operators
From all other industries
Year
2019
Domestic Operator Market III –CAPEX and OPEX Dually Drive Future Development
Maintenance(3)
2017 20182016
2020
Latest Key Events for 5G Development in China
2017 201820162017 20182016
(1) Source: “White Paper on 5G Economic and Social Impact” issued by China Academy of Information and Communications Technology (CAICT) in 2017
(2) Source: Information released in CAICT’s website in March 2019(3) Such data reflects revenues from domestic operator market only
Expand towards IT maintenance,DC maintenance, and Smart Familycustomer-end maintenance
9,324
13,037
11,1054,601
5,002
6,033
2,662 2,8203,201
(RMB’M) (RMB’M) (RMB’M)
CCS benefits from providing digital
services to industry sectors
CCS benefits from providing network
infrastructure services to operators
Promote the construction of 5G trial network, Smart Family and IoT, etc.
Support transformation and upgrade of operators and facilitate the deployment for new ICT business demand
Strive for Stable-to-Rising Market Share
2018
DecMIIT announced the
spectrum for 5G system trial of the
operators
CAPEX
OPEX
19
Supply Chain(3) Facilities Management(3)
Unify planning for whole network,synergize capabilities for warehousing,logistics and channels operation; expandinto enterprise customers
Further enhance standardization andsynergistic operation of propertymanagement, and extend servicecapabilities to enterprise customers
5G Expenditure by operators and other industries in China(1)
CommercialLaunch
MarOperators
announce 5G CAPEX plans in
2019Note(2): Total 5G network investmentis expected to be about RMB900B –1500B between 2020-2025.
JanMIIT minister mentioned 5G
temporary licenses would be
issued in 2019
Trial Network Pre-commercial Trial

Overseas Market – Review and Prospect
Revenue from Overseas Market
(RMB’M)
3,155
2,836
2017
+11.2%-26.2%
3,846
20182016
20
Breakthrough development on key projects wereachieved, revenue stabilized and recovered
Business and customer structure further optimizedand growth of overseas enterprise customersaccelerated
Collaborated with domestic operators and “GoAbroad” Chinese enterprises to jointly developbusinesses
Serving “Belt and Road” Information Infrastructure Construction
Promoting Smart Society Construction Overseas
1. Focus on the construction and maintenance demandfor operators
• Telecom sector in Asia-Pacific region, Africa andthe Middle East are mostly emerging markets withenormous infrastructure demand
• Global 5G deployment accelerates and newconstruction opportunities arise
2. Closely follow the digitalization and transformationopportunities arising from overseas customers andextend the domestic smart society products overseas,thus realizing the transformation and upgrade ofoverseas business
3. Establish new service model that fully covers theproduction chain ( EPC+ Financing +…)
4. Deepen the collaboration with domestic operator tofurther expand into overseas market
5. Closely monitor changes in overseas environment andprevent risk
Prospect

Financial Results

2017 2018 Change % % of Revenue
Revenue 94,572 106,177 12.3% 100%
Cost of Revenue 82,360 93,292 13.3% 87.9%
Direct Personnel 8,647 8,748 1.2% 8.3%
Materials 9,328 9,783 4.9% 9.2%
Direct Cost of Products Distribution
6,595 4,629 -29.8% 4.4%
Subcontracting 46,858 57,555 22.8% 54.2%
D & A 473 466 -1.4% 0.4%
Others 10,459 12,111 15.8% 11.4%
Gross Profit 12,212 12,885 5.5% 12.1%
SG & A 9,885 10,611 7.3% 10.0%
Net Profit 2,714 2,901 6.9% 2.7%
EPS (RMB) 0.392 0.419 6.9% -
ROE (%) 9.9% 9.6% -0.3pp -
Financial Performance
(RMB’M)
22

By utilizing subcontracting resources adaptively andcontrolling total staff number, direct personnel cost as a % ofrevenue kept declining while labour productivity increasednoticeably
Direct Personnel
Cost of Revenue as a % of Revenue
20182017
Materials
Subcontracting D & A and others
Direct Cost of Products Distribution
Rapid growth of construction, system integration and supplychain businesses drove the increase in materials cost, whileits % of revenue decreased
By proactively controlling the products distribution business,direct cost of products distribution as a % of revenue fell
Labour Productivity(1)
(RMB ’000/staff)
3.3%
2016 2017 2018
+3.6%
+18.9%909
1,119941
87.9%87.1%
8.3%
9.2%
54.2%
4.4%
11.8%
9.1%
9.9%
7.0%
49.5%
11.6%
23(1) Labour Productivity = revenue / staff number
Increase in subcontracting costs was mainly due to: (1) morelow-end tasks subcontracting were needed along thecompany’s transformation towards a management andtechnology-driven business model; (2) rapid growth inconstruction and maintenance businesses drove rapid growthfor the relevant subcontracting; (3) more subcontracting forcertain professional work were needed when more turnkeyprojects for domestic non-operator market were undertaken
-2.6pp
+4.7pp
+0.2pp
-0.7pp
-0.8pp

10.7% 10.5%10.0%
13.2% 12.9%12.1%
SG & A
(RMB’M)
Operating Efficiency
2016 2017 2018
+12.3%+6.9%
201820172016
2,901
2,714
88,449
106,17794,572
2,536
+7.0%+6.9%
Gross Profit Margin
+4.5%+5.5%
11,690 12,212 12,885
2016 2017 2018
Gross Profit
(RMB’M)
SG&A as a % of Revenue
+4.0% +7.3%
9,501 9,88510,611
2016 2017 2018
Net Profit Margin
2.9% 2.9% 2.7%
24
Gross profit margin decreased due to the decreased
service price in telecom industry, increased labour
related cost, as well as the development in the domestic
non-operator market still being in the introductory
phase
SG&A experienced a faster growth as R&D expenditure
increased to support enterprise transformation and
marketing cost also increased to build and promote the
“Smart Comservice” brand
Revenue
(RMB’M) Net Profit
(RMB’M)

Cash Conversion Ratio
(%)
124131 134
117 115111
Working Capital Management
31.12.201731.12.2016Accounts Receivable Turnover Days
Accounts Payable Turnover Days
+15.0%+20.6%
Accounts Receivable(1)
(RMB’M)
Free Cash Flow
(RMB’M)
Accounts Payable
(RMB’M)
+3.4%
31.12.2018
+13.1%
31.12.2017 31.12.201831.12.2016
29,36330,371
34,333
20,399
24,60128,280
20172016
+40.3%
2018
-40.9%
4,361
6,118
3,613
20172016 2018
207.6%
256.6%
146.9%
Working capital (accounts receivable and accounts payable) was still under good control
Free cash flow stayed healthy while cash conversion ratio maintained at a healthy level
25
(1) Disclosures on certain items of financial statements have been adjusted following the adoption of new accounting standards from 2018. To maintain the comparability with past year figures,the amount of accounts receivable as at 31 Dec 2018 is the sum of “Accounts and bills receivable, net” and “Contract assets” in financial statements.

Dividend Payout Ratio
Dividend Payout Ratio(Special dividend inclusive)
Dividend per Share
(RMB)
Shareholders’ Return
Special Dividend
While maintaining a relatively stable and
sustainable dividend policy, we increase return
to our shareholders in consideration of results
performance, cash flow and future
development needs, etc.
The Board recommends a final dividend of
RMB0.1257 per share, and a special dividend of
RMB0.0251 per share, total dividend for 2018 is
RMB0.1508 per share, up by 6.9% yoy, with the
total dividend payout ratio of 36%
Final Dividend
26
0.1318
0.1508
30%30%
36%
20172016
0.1098
0.0251
0.0220
0.1257
+6.9%
30%
36%
2018
+7.1%
0.1411
0.0235
0.1176
36%
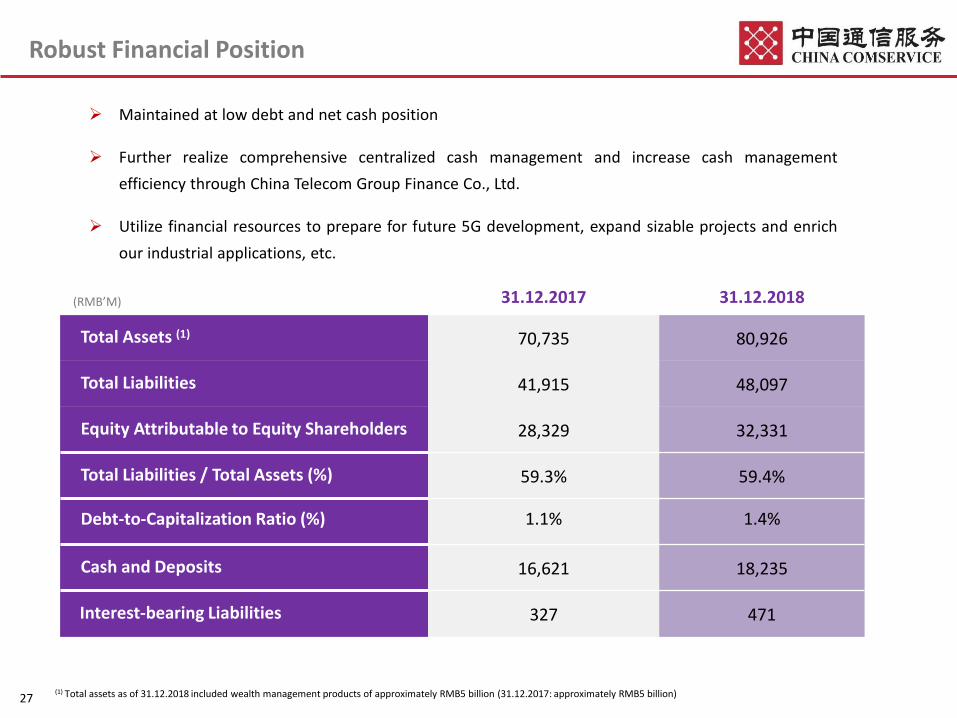
31.12.2017 31.12.2018
Total Assets (1) 70,735 80,926
Total Liabilities 41,915 48,097
Equity Attributable to Equity Shareholders 28,329 32,331
Total Liabilities / Total Assets (%) 59.3% 59.4%
Debt-to-Capitalization Ratio (%) 1.1% 1.4%
Cash and Deposits 16,621 18,235
Interest-bearing Liabilities 327 471
Robust Financial Position
(RMB’M)
Maintained at low debt and net cash position
Further realize comprehensive centralized cash management and increase cash management
efficiency through China Telecom Group Finance Co., Ltd.
Utilize financial resources to prepare for future 5G development, expand sizable projects and enrich
our industrial applications, etc.
27(1) Total assets as of 31.12.2018 included wealth management products of approximately RMB5 billion (31.12.2017: approximately RMB5 billion)

High-quality Operation
Strive to Enhance Enterprise Value
High-quality Features
Encourage innovation, and integrate advance technologies with market
expansion and services
High-quality Staff
Allocate resource effectively and enhance our core capabilities to facilitate sustainable business development for our 3 markets
High-quality Management
Push forward State-owned Enterprise Reform and internal-external collaboration to raise
our efficiency, capability and vitality
Value-driven, Seeking Steady yet Progressive Growth and
High-quality Development
Raise Shareholders’ Returns
Strengthen talent team building and optimize market-oriented incentive mechanism to
support enterprise development
•Driven by Advance Technologies
•High-quality Services
• Strong Sense of Social Responsibility
•Well-being
•Responsibility
•Recognition
• Loyalty
Strong Sense of
• High Efficiency
• High Market Share • High Customer Loyalty
• High Efficiency• High Vitality
• High Integrity
28
• Highly Synergized
• High Sustainability

Thank you!
• Platinum Award - Excellence in
Environmental, Social and Governance
• Best Investor Relations Team Award
--------by The Asset
• Best CEO
• Best CFO
• Best Investor Relations
--------by Corporate Governance Asia
• The Best of Asia - Icon on Corporate
Governance
• Asian Corporate Director
--------by Corporate Governance Asia

Appendix

Business Revenue Breakdown – By Customers
2017 2018 Change Change %
TIS (Telecommunications Infrastructure Services)
Domestic Operator 38,649 40,325 1,676 4.3%
Domestic Non-operator 9,710 14,646 4,936 50.8%
Overseas Customer 2,152 2,388 236 11.0%
TIS total 50,511 57,359 6,848 13.6%
BPO (Business Process Outsourcing Services)
Domestic Operator 18,926 22,270 3,344 17.7%
Domestic Non-operator 6,513 7,697 1,184 18.2%
Overseas Customer 369 253 -116 -31.8%
Subtotal (Core BPO) 25,808 30,220 4,412 17.1%
Products Distribution 6,955 4,883 -2,072 -29.8%
BPO total 32,763 35,103 2,340 7.1%
ACO (Applications, Content and Other Services)
Domestic Operator 5,059 5,866 807 15.9%
Domestic Non-operator 5,963 7,359 1,396 23.4%
Overseas Customer 276 490 214 77.2%
ACO total 11,298 13,715 2,417 21.4%
Total 94,572 106,177 11,605 12.3%
(RMB’M)
31

Smart Maintenance
Design Construction Supervision SI Maintenance
4G/5G WiFi Broadband IoT Cloud Resources Network Level
Sensors Chipsets Cameras Scanners …… Perception Level
Security Products Security SI Network Security Security Services
Network Construction
Open IoT Platform
……
CCSYUN (Cloud Platform)
Platforms with Innovative
Capabilities
Smart SafetySmart
TransportationSmart Water Conservancy
Smart Enterprise
Smart Education
Smart City Smart Town Smart ParkSmart
ConstructionSmart Gov.
Services
Smart Tourism Smart Court Smart JusticeSmart
Inspection ……
AI
“Big” Smart City
Big Data Cognitive Analysis
VR/AR Blockchain……
Smart Property
Management
Smart Supply Chain
Smart Customer
Service
Smart Transportation
Operation
Inte
gratedSe
rvices
Provider of Smart
Products and Platforms
Operator of Smart
Services
Builder of New Generation Information
Infrastructure Facilities
Provider of Big Data Application
Services
Big Data Applications and Services
32
Domestic Non-operator Market:Smart Society Products of China Comservice

Smart City – New Form of City Development in the Information Era
33
• A more thorough perception and a more comprehensive interconnection
• Ubiquitous services, efficient and orderly management
• Data open for co-sharing, economic development and green resources
• Promote modernization of city management through digitalization
Core Content of Smart City
IoT Cloud Platform Big Data
Informatization Technologies
RefinedManagement
User-friendlyServices
EnhancedCompetitiveness
Upgrade City Intelligence
Service Upgrade
Economic Transformation
City Security
Solving Urban Problems
SustainableDevelopment
Facilitate innovation of city management services and development model, a city reconstruction that is led by resources allocation with an emphasis on supply-demand
matching and development quality

Smart City – Enriched Top-level Planning and Design Experience
34
Led by top-level design for Smart City and capitalized on CCS Smart City Portfolio, we possess integrated implementation capabilities for complex and professional projects
Safe City
Smart Transportation
……
Smart Education
Smart Agriculture
Smart Community
Integrated Implementation
Wide-screen Joint System
Gateway ConsolidationApplication
Data Centre Integration
Multi-source Control System
Data Exchange Platform
Multi-mediaPlatform
United VideoPlatform
……
Smart Water Conservancy
Industry Applications
Information Infrastructure
Smart City Top-Level Design / Planning & Consultation
Smart Industry Electronic Products
City Operation Management Platform
Smart Gateway
Internet+ Capabilities Support Platform
Public Information Platform
Basic Database
Already provided superior Smart City top-level consultation solutions to cities of various tiers and the applications are highly recognized by city administrators
Smart Nanjing
SmartQuanzhou
SmartKunming
Smart Lake TaiTechnology Center
…
Smart Qianhai

Smart Park
35
Integrated Management System
Big Data AnalysisSystem
Smart Experience System
Energy ConsumptionManagement
One-key Control
• Based on Geographic InformationSystem, sub-systems are integratedto visualized management platformto realize coordination and controlamong systems
• Show statistics such as no. ofpeople in park, access no.,electronic payment etc.
• Run real-time analysis on businessdata, and provide data for businessanalysis, guide and navigation,content and facilityrecommendation
• Provide thematic graphs andforecasts for real-time park areatraffics which help decision making
• Leverage on AR technologies toenable real-time interactionbetween users and parks, easierinformation access and morecustomized arrangement
• Enable navigation and locating,information access, trip planningand online booking anytime andanywhere, thus enhancing flexibility,comfortability and interest
• Realize data collection, storage and management of various energy consumption for different types of parks
• Provide energy consumption data analysis, energy-saving diagnosis and control optimization, which save energy and lower operation cost
• Establish operation model andcontrol strategies based on variousparameters, run non-manualautomatic operation system byintroducing calendar mode
• Run diagnosis and parametersadjustment for an optimized andprecise operation, increaseautomation level to reduce staffand maintenance cost

Smart Park
36
Application Scenario:Applicable for tourist/exhibition parks, start-up/industrial parks, logistic parks, tariff-free zones, etc
• Provide “Smart Experience Services” and“Refined Scientific Management” to 16 millionperson-times within a 5km2 park area for the 6-month exhibition period
• The “Smart Park” informatization system willprovide comprehensive telecommunicationsservices and information technology support.Advanced technologies such as internetvisualization, VR, AR are used to provideservices such as display, guiding, etc.
Beijing Expo 2019 “Smart Park” Project
2017 Zhengzhou International Garden Expo “Smart Park” Project
• Through the establishment of people-orientedexpo system and smart-expo system,intelligent demand for IT infrastructure atparks is satisfied
• Based on highly-precise personnel location,IoT applications and Big Data analysisapplications, provide innovative smart guidingservices and smart management for exhibitionareas/parks

Open IoT Platform
37
Open IoT platform that is flexible, efficient and safe already supported >30 industry
applications, could connect and manage up to 100 million smart devices
Safety & Security
Data Security
Connection Safety
Terminal SafetyConnectivity Management Platform
Device Management
Platform
Application Enablement Platform
Business Operations
PlatformBig Data
Private Cloud Public Cloud Hybrid Cloud
Open
IoT
Platform
Smart Parking Smart Sewage Cover
Internet of Vehicles Smart Firefighting…
Smart Meter ReadingSmart Building
Environment MonitorSmart Home

Smart BuildingManagement Platform
Open IoT Platform
38
Location SmartParking
SmartHome
Triple Monitor
Interaction
CCS IoT
Scenario Editor
Automatically open parking lot gate and record attendance
Automatically recommend navigation route
Start vehicle-mounted video chat
Automatically start and tune home appliances such as air purifier, AC , lights, etc.
Community parking lot gate automatically open upon entrance
Facial recognition at the cloud platform to open unit door
……
Smart BuildingPlatform
Building Security System
Smart Parking System
Dynamic Monitoring System
Multi-mediaRelease System
Smart Catering System
Smart Office System
Smart Conference System
Private CloudPlatform
Centralized Control
JointControl
Visualized Management
Facial Recognition
Smart Parking Platform
Significant Achievements:
Connect & accommodate >80
categories and > 1000 types of
equipment
Complete application connection
services for >50 projects such as
Smart Park, Smart Tourism, etc.
Cooperate with > 200 equipment
manufacturers and connect with >30
million equipment
Various IoT applications such as Smart Safety, SmartParking, Smart Catering, Smart Entrance, NewsRelease and Dynamic Monitor provided by differentmanufacturers are all based on the platform’s publiccapabilities, enabling multi-application connection,data exchange and smart building management
Provide scenario editor that enables interconnectionof various equipment from different manufacturersand multi-scenarios. Users could customize scenariosettings based on their needs and connect variousapplication scenarios, experience enhanced life qualityat the era of IoT

Forward-looking Statements
The Company would like to caution readers about the forward-looking nature of certainstatements herein. These forward-looking statements are subject to risks, uncertainties andassumptions, which are beyond its control. Potential risks and uncertainties include thoseconcerning the growth of the telecommunications industry in China, the development of theregulatory environment, and our ability to successfully execute our business strategies. Inaddition, these forward-looking statements reflect the Company’s current views with respect tofuture events and are not a guarantee of future performance. The Company does not intend toupdate these forward-looking statements. Actual result may differ materially from the informationcontained in the forward-looking statements as a result of a number of factors.
39