Management Information for corporate Learning and ...
149
Master Thesis Management Information for corporate Learning and Development By: Steven Paul Balk (4311957) Schiphol, August 12 2015
-
Upload
khangminh22 -
Category
Documents
-
view
0 -
download
0
Transcript of Management Information for corporate Learning and ...
Master Thesis
Management Information for corporate
Learning and Development
By: Steven Paul Balk (4311957) Schiphol, August 12 2015
i
Management Information for corporate Learning and Development
By
S.P.P.J. Balk, B.Eng.
in partial fulfilment of the requirements for the degree of
Master of Science
in Management Of Technology
at the Delft University of Technology,
to be defended publicly on Wednesday August 19, 2015 at 4:00 PM.
Full Professor: R.M. Verburg, TU Delft
First supervisor: L. Rook, TU Delft
Second supervisor: L.J. Kortman, TU Delft
Company supervisor : A.J.G.M. Wijnen, KLM Business Campus
An electronic version of this thesis is available at http://repository.tudelft.nl/.
ii
Summary The corporate learning and development [L&D] environment is currently changing and
managers involved in corporate L&D are more and more requesting insight in the
contribution of learning towards their business and feedback on how well the department
is performing. To meet these business needs the objective of this study was to generate
the requirements for a management information system in relation to corporate learning.
Specific attention has been paid to the determination of the desired information elements
(i.e. measures and metrics) to be constructed and communicated by such a system. The
results of this research should help KLM Business Campus [KBC] and other corporate L&D
departments with the (further) development of their management information system.
In its research request KBC asked for a practical research, which should answer
managerial questions like: How can the performance/ productivity of a training and
development department be measured? How can the added value of a training and
development be measured? and On the basis of which Key Performance Indicators [KPIs]
could/should the department be managed? These questions formed the start of a
preliminary literature review, aimed to understand KBC’s request as a general business
need. The findings of this review were used to construct a conceptual framework. The
review revealed that both theory and practice lack a commonly accepted set of
management information elements to monitor and manage corporate L&D activities. The
identified lacks resulted in the formulation of the following main research question:
Which information elements evaluate the value of corporate learning and development
activities? Three sub-questions were formulated in order to provide an answer to this
main question: 1) What is management information and how can information elements
be determined?, 2) How does a corporate learning and development department operate
and what information elements can be derived from the operation? and 3) What
management information elements are currently used in theory and practice to manage
corporate L&D departments and evaluate their value?
Literature was used to formulate definitions associated with management information, to
get an understanding of what management information systems are, and to describe how
managers involved in corporate L&D can use management information. To determine
information elements both a top-down and a bottom-up approach have been used. By
the means of a case description, complemented with literature findings, this research was
able to describe the environment of corporate L&D and its operations using the ten
elements of the systems perspective. This description helps to understand the people,
organizations and technologies involved in corporate L&D, which is required to develop a
feasible, viable and desired set of management information elements. To find out which
management information elements are currently used in practice, six Dutch corporate
L&D departments have been interviewed and their management information has been
analyzed. This cross-case analysis found that L&D departments do have several
information elements in common. The results also show that, based on their use of data
and information in L&D, departments can find themselves at different stages of a so
called maturity model. The top-down approach determined appropriate measures and
metrics based on the strategy, vision, objectives and critical processes of KBC and its
environment (formed by Air France-KLM its commercial division). The Balanced Score
Card was used as a tool to derive these information elements. The top-down approach
resulted in a number of initially required and desired information elements for three
layers of management involved in L&D.
To answer for the main research question can be said that the value brought by
corporate L&D activities is a complex construct, which cannot be expressed in a single
quantitative measure or metric. A combination of subjective and objective, and
quantitative and qualitative measures is required to steer and manage the business, to
express the alignment of L&D activities with the learning needs of the organization, and
to communicate the effectiveness and efficiency of the L&D department operations to
L&D investors.
iii
Table of contents Summary ..................................................................................................................................................ii
Table of contents ..................................................................................................................................... iii
List of figures ......................................................................................................................................... viii
List of tables ............................................................................................................................................ ix
List of Appendices .................................................................................................................................... x
Preface ..................................................................................................................................................... xi
1 Introducing the research ................................................................................................................. 1
1.1 An introduction to KLM Business Campus .............................................................................. 1
1.1.1 Organizational structure of Air France-KLM and the position of KBC ............................. 2
1.1.2 Organizational structure and roles within KBC ............................................................... 2
1.1.3 Comparable departments and counterparts of KBC ....................................................... 4
1.1.4 KBC’s research request for management information .................................................... 5
1.2 Understanding the research request as a general business need .......................................... 6
1.2.1 A preliminary literature review into corporate L&D management information ............. 7
1.2.2 Findings of the preliminary literature review .................................................................. 8
1.2.3 Conceptual framework derived from the preliminary literature review ...................... 11
1.2.4 The general business need for corporate L&D management information ................... 12
1.3 Research objective ................................................................................................................ 12
1.4 Research questions................................................................................................................ 13
1.5 Research strategy .................................................................................................................. 13
1.5.1 Design science in information systems research .......................................................... 13
1.5.2 Guidelines for conducting design science in information systems research ................ 15
1.5.3 Research steps and methodologies used in this research ............................................ 17
1.6 The remainder of this thesis .................................................................................................. 18
2 Understanding management information and management information systems ..................... 19
2.1 Definitions related to management information .................................................................. 19
2.1.1 Management information ............................................................................................. 19
2.1.2 Information .................................................................................................................... 19
2.1.3 Observation, data, measures and metrics..................................................................... 20
2.2 Possible uses of management information ........................................................................... 20
2.2.1 Improve organizational performance, effectiveness and efficiency ............................. 21
2.2.2 Management control ..................................................................................................... 21
2.2.3 Other general uses of management information.......................................................... 22
iv
2.2.4 Use of data and management information in corporate learning and development... 23
2.3 Types and levels of management information ...................................................................... 24
2.3.1 Descriptive, diagnostic, predictive, prescriptive information ....................................... 24
2.3.2 Objective versus subjective measures .......................................................................... 24
2.3.3 Lagging and leading indicators ...................................................................................... 25
2.3.4 Key Performance Indicators .......................................................................................... 25
2.3.5 Levels of management information .............................................................................. 25
2.4 Determining/identifying information elements .................................................................... 25
2.4.1 Bottom-up approach ..................................................................................................... 25
2.4.2 Top-down approach ...................................................................................................... 26
2.5 Management Information and KPI pitfalls ............................................................................ 26
2.6 Management Information Systems ....................................................................................... 27
2.7 Communicating management information ........................................................................... 29
2.8 Summarizing conclusion ........................................................................................................ 29
3 Understanding the corporate L&D environment of KLM Business Campus ................................. 30
3.1 Missions, visions and strategies of Air France-KLM, the commercial division and KBC ........ 30
3.1.1 Mission, vision and strategy of Air France-KLM ............................................................ 30
3.1.2 Mission, vision and strategy of the Commercial Division .............................................. 32
3.1.3 Mission, vision and strategy of KBC............................................................................... 32
3.2 Applying a performance perspective on KBC ........................................................................ 35
3.3 See a corporate L&D department as a processing system .................................................... 36
3.4 The resources of a corporate L&D department .................................................................... 36
3.4.1 Materials ........................................................................................................................ 36
3.4.2 Human Resources .......................................................................................................... 36
3.4.3 Financial resources ........................................................................................................ 37
3.4.4 Technology .................................................................................................................... 38
3.5 The outputs of a corporate L&D department ....................................................................... 38
3.5.1 Learning and development programs as products........................................................ 38
3.5.2 Learning and development advice as service ................................................................ 40
3.6 The market of a corporate L&D department ........................................................................ 40
3.6.1 Market scope ................................................................................................................. 40
3.6.2 L&D customers .............................................................................................................. 40
3.7 The internal feedback within a corporate L&D department ................................................. 41
3.8 The market needs and customer feedback of a corporate L&D department ....................... 41
v
3.8.1 Learning and development needs and how they occur ................................................ 41
3.8.2 Identification of learning and development needs ....................................................... 41
3.8.3 Feedback from the corporate L&D market ................................................................... 42
3.8.4 Training Evaluation ........................................................................................................ 42
3.9 The competition of a corporate L&D department ................................................................ 52
3.10 The environment around a corporate L&D department ....................................................... 52
3.10.1 Organizational Culture influences on L&D .................................................................... 52
3.10.2 Learning Culture influences on L&D .............................................................................. 53
3.10.3 Changes in the environment ......................................................................................... 53
3.11 The internal processes of a corporate L&D department ....................................................... 53
3.11.1 Instructional design process .......................................................................................... 53
3.11.2 “Oerproces”: the instructional design process at KLM Business Campus ..................... 54
3.11.3 KBC’s organizational processes according to Bloomville .............................................. 55
3.12 Managerial control in a corporate L&D department ............................................................ 57
3.13 Summarizing conclusion ........................................................................................................ 57
4 Cross-case analysis of management information in corporate learning and development ......... 58
4.1 Interviewing six Dutch corporate learning and development departments ......................... 58
4.1.1 Interview approach and questions ................................................................................ 58
4.1.2 General information about the cross-case L&D departments and their customers ..... 59
4.2 Bottom-up identification of management information at the six L&D departments ........... 61
4.2.1 Management information at corporate L&D department 1 ......................................... 61
4.2.2 Management information at corporate L&D department 2 ......................................... 62
4.2.3 Management information at corporate L&D department 3 ......................................... 65
4.2.4 Management information at corporate L&D department 4 ......................................... 67
4.2.5 Management information at corporate L&D department 5 ......................................... 68
4.2.6 Management information at corporate L&D department 6 ......................................... 69
4.3 Analysing management information used in corporate L&D ................................................ 69
4.3.1 Most common used concepts ....................................................................................... 69
4.3.2 Clustering of concepts ................................................................................................... 70
4.3.3 Conclusion of the analysis ............................................................................................. 73
4.4 Support for the maturity model in practice .......................................................................... 74
4.4.1 Positions of the cross-case departments on the maturity model ................................. 75
4.4.2 Position of KBC on the maturity model ......................................................................... 75
vi
4.5 Five management information prototypes based on the other corporate learning and
development departments ............................................................................................................... 76
4.5.1 Prototype 1: Management information in A3 Dashboard ............................................ 76
4.5.2 Prototype 2: Management Information presentation .................................................. 77
4.5.3 Prototype 3: Management Information sandbox ......................................................... 78
4.5.4 Prototype 4: Yearly L&D Management Information document .................................... 78
4.5.5 Prototype 5: Management Information based on strategy .......................................... 80
4.6 Summarizing conclusion ........................................................................................................ 81
5 Deriving corporate L&D management information elements from the top-down ...................... 82
5.1 Define point of view .............................................................................................................. 82
5.2 Using the Balanced Score Card to derive information elements .......................................... 83
5.3 Financial objectives and measures ........................................................................................ 83
5.3.1 Financial objectives ....................................................................................................... 83
5.3.2 Main financial measures................................................................................................ 84
5.3.3 Other financial measures .............................................................................................. 84
5.4 Customer objectives and measures ...................................................................................... 84
5.4.1 Customer objectives ...................................................................................................... 85
5.4.2 Main customer measures .............................................................................................. 85
5.4.3 Other customer measures ............................................................................................. 87
5.5 Learning and growth objectives and measures..................................................................... 88
5.5.1 Learning and growth objectives for the wider organization ......................................... 88
5.5.2 Learning and growth objectives for the internal organization ...................................... 88
5.5.3 Main learning and growth measures ............................................................................ 89
5.5.4 Other learning and growth measures ........................................................................... 89
5.6 Business process objectives and measures ........................................................................... 90
5.6.1 Significant process outputs ........................................................................................... 91
5.6.2 Identify critical dimensions for the outputs .................................................................. 92
5.6.3 Developing measures and metrics for the processes ................................................... 93
5.6.4 Develop a goal/standard for each measure .................................................................. 95
5.6.5 The main process measures for the BSC ....................................................................... 95
5.7 The initially desired information elements ........................................................................... 96
5.8 Summarizing conclusion ........................................................................................................ 97
6 Conclusions .................................................................................................................................... 98
6.1 The information elements as the main research results ...................................................... 98
vii
6.2 Answering the sub-questions ................................................................................................ 99
6.2.1 What is management information and how can information elements be determined?
99
6.2.2 How does a corporate learning and development department operate and what
information elements can be derived from the operation? ......................................................... 99
6.2.3 What management information elements are currently used in theory and practice to
manage corporate L&D departments and evaluate their value? ................................................ 100
6.3 Answering the main question ............................................................................................. 101
7 Discussion and future work ......................................................................................................... 103
7.1 Evaluation of the management information systems and information elements during the
research ........................................................................................................................................... 103
7.1.1 Evaluation with the director of Ecole des Ventes ....................................................... 103
7.1.2 Evaluation with the Management Team of KBC ......................................................... 104
7.1.3 Evaluation with the financial controller ...................................................................... 105
7.1.4 Evaluation with the manager KLM Human Resources ................................................ 105
7.1.5 Reflection on evaluation approach ............................................................................. 105
7.2 Reflection on work .............................................................................................................. 105
7.2.1 Have the questions been answered? .......................................................................... 105
7.2.2 Have the objectives been achieved? ........................................................................... 106
7.2.3 Have the guidelines been followed? ........................................................................... 106
7.2.4 Were the right methods used and were the methods applied properly? .................. 107
7.3 Implications of the research results .................................................................................... 108
7.3.1 Implications for practice .............................................................................................. 108
7.3.2 Implications for theory ................................................................................................ 109
7.3.3 Implications for Management of Technology ............................................................. 109
7.4 Suggestions for future work ................................................................................................ 110
7.4.1 Further development and implementation of the information system ..................... 110
7.4.2 Future research ........................................................................................................... 110
References ........................................................................................................................................... 111
Appendices ............................................................................................................................................... I
viii
List of figures Figure 1 Organogram position KLM Business Campus, derived from: (Air France-KLM, 2015) & (Air
France-KLM, 2012) .................................................................................................................................. 2
Figure 2 Organogram of KLM Business Campus, source: (KLM Business Campus, 2015) ....................... 2
Figure 3 Organizational structure of L&D in the Air France KLM Commercial Division, source: (KLM
Business Campus, 2014) .......................................................................................................................... 4
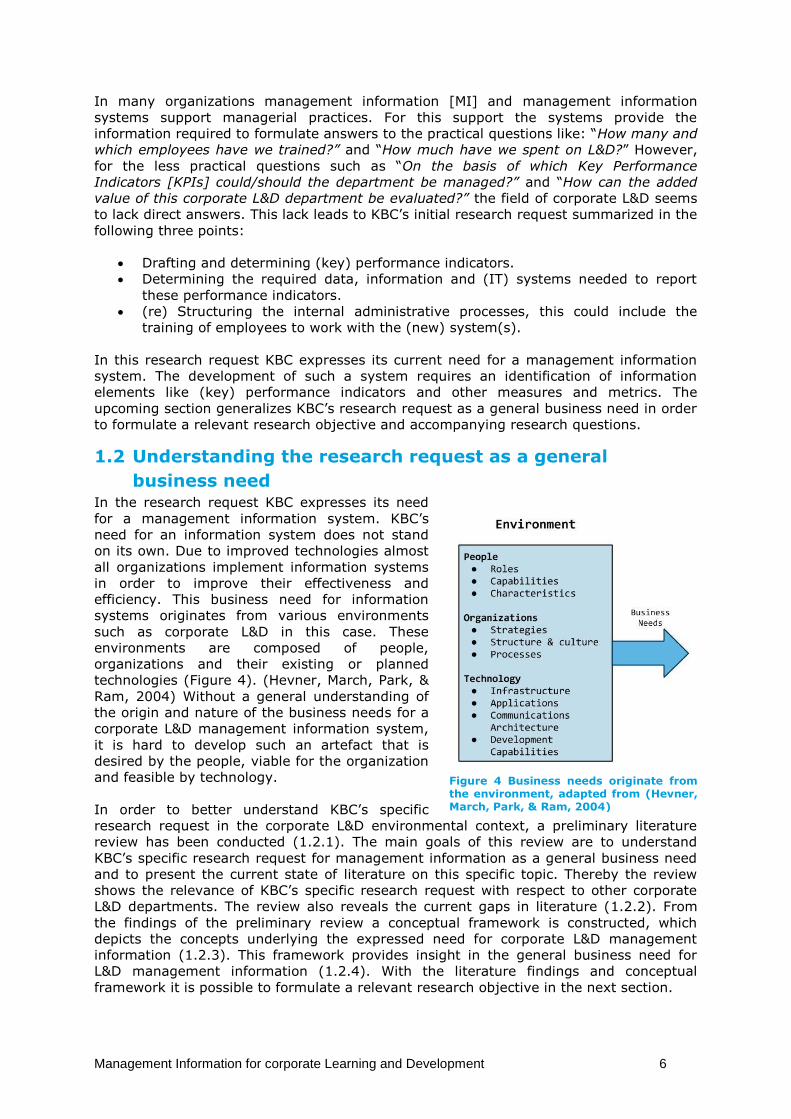
Figure 4 Business needs originate from the environment, adapted from (Hevner, March, Park, & Ram,
2004) ........................................................................................................................................................ 6
Figure 5 Conceptual framework based on literature findings .............................................................. 12
Figure 6 Framework for design science research in information systems, source: (Hevner, March,
Park, & Ram, 2004) ................................................................................................................................ 14
Figure 7 Confluence between people, business and technology, inspired on: (Brown, 2008) ............. 14
Figure 8 Thesis chapters ........................................................................................................................ 19
Figure 9 From observation to metric, inspired on: (Savkin, 2015) ........................................................ 20
Figure 10 Diagnostic control chart, source: (Veen-Dirks & Wijn, 2004) ............................................... 21
Figure 11 Bersin’s HR analytics maturity model, source: (Bersin, 2013) .............................................. 23
Figure 12 Types of Information, source: (Harsh, Connor, & Schwab, 1981) ......................................... 24
Figure 13 Top-down and Bottom-up approaches to identify are determine KPIs, inspired on:
(Unilytics, 2015) KPI Karta ..................................................................................................................... 25
Figure 14 Information Systems are designed for different management levels, functional areas and
organizational problems, adapted from: (McLeod & Schell, 2007) ...................................................... 27
Figure 15 General structure of a management information system, adapted from: (Barnett & Vance,
2012) ...................................................................................................................................................... 28
Figure 16 KLM Business Campus using the systems view, based on: (Rummler & Brache, 1990) ....... 35
Figure 17 ROI process model, source: (Phillips & Phillips, 2002) .......................................................... 44
Figure 18 The Bersin & Associates Learning Impact Measurement Framework®, source: (Bersin, 2007)
............................................................................................................................................................... 48
Figure 19 Linking training evaluation and Business L&D operation ...................................................... 49
Figure 20 Evaluation model of KBC, source: (KBC, 2014) ...................................................................... 50
Figure 21 ADDIE model .......................................................................................................................... 54
Figure 22 “Oerproces” KLM Business Campus ...................................................................................... 54
Figure 23 L&D department processes according to Bloomville, source: (Bakx, 2013) ......................... 55
Figure 24 Combination of management information and the learning and development environment,
adapted from: (Keller, 1998) ................................................................................................................. 58
Figure 25 Information system used at L&D department 3.................................................................... 66
Figure 26 Stage positions of the L&D departments within the maturity framework, based on the
interviews and observation at KBC ....................................................................................................... 75
Figure 27 Visualization of prototype 1 .................................................................................................. 77
Figure 28 Visualization of Development enrolments per training of prototype 4 ................................ 79
Figure 29 Visualization of Top 10 enrolments non-preferred of prototype 4 ...................................... 80
Figure 30 Increased Effectiveness Model of Training, source: (Bramley & Kitson, 1994) .................... 86
Figure 31 Individual training model, source: (Bramley & Kitson, 1994)................................................ 86
Figure 32 Example figure of how to derive measures and metrics from the oerproces, inspired on:
(Rummler & Brache, 1990) .................................................................................................................... 93
ix
List of tables Table 1 Roles, number of employees and their main tasks and responsibilities at KBC ......................... 3
Table 2 Divisions within KLM that have their own L&D representatives/department ........................... 4
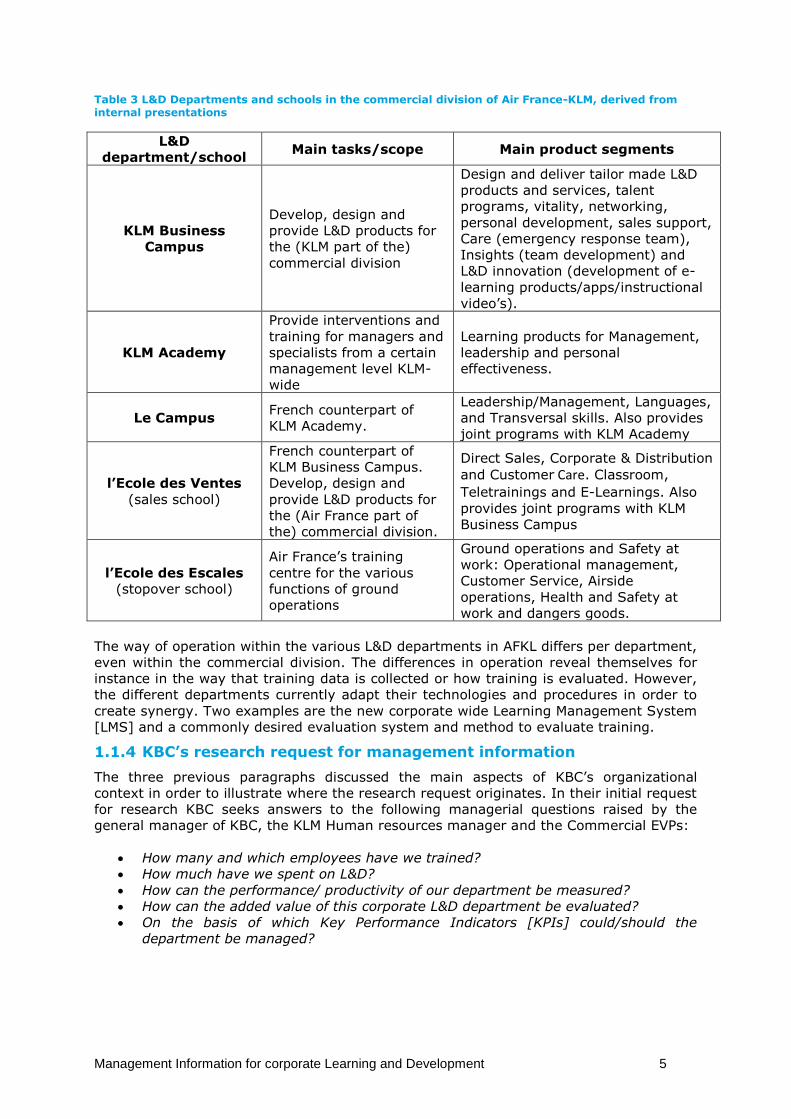
Table 3 L&D Departments and schools in the commercial division of Air France-KLM, derived from
internal presentations ............................................................................................................................. 5
Table 4 Design science Research guidelines, source: (Hevner, March, Park, & Ram, 2004)................. 15
Table 5 Strategic content on KLM level, adapted from: (KLM, 2014), (KLM Corporate Communicatie
AMS/DR, 2015), (KLM, 2015) ................................................................................................................. 31
Table 6 Strategic content on KBC level, adapted from KBC’s internal sources ..................................... 34
Table 7 Disciplines needed at a corporate L&D department, source: (Bersin & Associates, 2009)...... 37
Table 8 Tools & Technology used in corporate L&D, source: (Bersin & Associates, 2009) ................... 38
Table 9 Types of learning programs, source: (Bersin & Associates, 2009)............................................ 39
Table 10 Various types of learning and learning approaches, source: (Bersin & Associates, 2009) ..... 40
Table 11 Differences between formative and summative evaluation in training evaluation, adapted
from: (Kirk, 2014) .................................................................................................................................. 43
Table 12 Kirkpatrick’s four levels of evaluation, source: (Phillips, 1997) .............................................. 44
Table 13 Phillips’s five level ROI framework, source: (Phillips J. , Developing a Results-Based
Approach, 1997) .................................................................................................................................... 44
Table 14 Five levels of evaluation of human performance improvement intervention, adapted from:
(Phillips J. , Developing a Results-Based Approach, 1997) (Kaufman, Keller, & Watkins, 1995) .......... 45
Table 15 Five steps of Brinkerhoff’s success case method, source: (Rees, 2012) ................................. 47
Table 16 The nine measurement areas, adapted from: (Bersin, 2007) ................................................ 48
Table 17 The 23 questions and nine categories from KBC’s standard questionnaire ........................... 51
Table 18 Corporate cultural influences on L&D, source: (Bersin & Associates, 2009) .......................... 53
Table 19 Information elements derived from learning and development scorecard FY2014 L&D
department 1 ......................................................................................................................................... 62
Table 20 Information elements derived from management board presentation about L&D of
department 2; Effort Metrics ................................................................................................................ 64
Table 21 Department 2 Development and design metrics ................................................................... 64
Table 22 Department 2 Execution metrics ............................................................................................ 65
Table 23 Department 2 Service centre metrics ..................................................................................... 65
Table 24 Department 2 Demand and supply metrics ........................................................................... 65
Table 25 General L&D information available and used at L&D department 4...................................... 67
Table 26 L&D information available and used at L&D department 4 per audience ............................. 67
Table 27 External management information at department 5 ............................................................. 68
Table 28 Internal management information at department 5 ............................................................. 68
Table 29 Concepts occurring in the management information at two of the L&D departments ......... 70
Table 30 Concepts occurring at three of the L&D departments ........................................................... 70
Table 31 Concepts occurring at four of the L&D departments ............................................................. 70
Table 32 Colour coded concepts of table 29 ......................................................................................... 71
Table 33 Colour coded concepts of table 30 ......................................................................................... 71
Table 34 Colour coded concepts of table 31 ......................................................................................... 71
Table 35 Information elements identified by the bottom-up approach ............................................... 74
Table 36 Visualization of prototype 5 ................................................................................................... 81
Table 37 Other desired financial measures ........................................................................................... 84
x
Table 38 Customer objectives and main measures ............................................................................... 85
Table 39 Other desired customer measures ......................................................................................... 88
Table 40 Main learning and growth measures ...................................................................................... 89
Table 41 Other desired learning and growth measures ........................................................................ 90
Table 42 Most significant outputs of the oerproces ............................................................................. 92
Table 43 Significant outputs and critical dimensions of the oerproces ................................................ 93
Table 44 Significant outputs of the oerproces and their accompanying measures and metrics .......... 94
Table 45 Main business process measures for the oerproces .............................................................. 96
Table 46 Initially desired main measures for future information system ............................................. 96
List of Appendices Appendix I. Balanced Score Card method ......................................................................... I
Appendix II. Found pitfalls in the use and determination of MI and KPIs ........................ II
Appendix III. Intuitive presentation of management information .................................. III
Appendix IV. Conspiracy of convenience ........................................................................ IV
Appendix V. Standardized evaluation questionnaire ....................................................... V
Appendix VI. Description of oerproces per phase .......................................................... VII
Appendix VII. Counting the concepts ............................................................................... X
Appendix VIII. Visualization prototype 2 ....................................................................... XIII
Appendix IX. Main measures derived from the top-down ............................................ XVI
xi
Preface This report is the result of six months of research conducted at KLM Business Campus.
The report is written in partial fulfilment of the requirements for the degree of master of
science in Management of Technology [MoT], studied at the TU Delft. Where the master
aims to bridge the gap between technology and business, this thesis strives to contribute
to the daily practice of corporate learning departments by providing insight in how
management information (systems) can help them in their role as strategic business
partner.
Without the help various people it would have been impossible to conduct this research
and to write the thesis as it is presented to you.
I would first of all like to thank the general manager of KBC for proving me the
assignment and for the support during the internship. I hope that this thesis marks a
fruitful step in obtaining the desired situation. Then I would like to thank my supervisors
from the TU Delft for all their support and answers, for providing me the feedback when
needed and for keeping the research scientific relevant and valid by preventing me from
being too practical. Thirdly, I would like to thank all the company representatives
interviewed for being so open and collaborative in sharing your knowledge. For me it
proved that those involved in the corporate L&D really want to make others better. Your
collaboration serves as a strong example of the general L&D claim: “we can learn from
each other”.
For me corporate L&D was a whole new environment and therefore I would like to thank
all my colleagues at KBC for their support in letting me explore their daily work; either in
the form of proving me useful information and tools, or by just having fun talks during
lunch.
Special thanks go to Remy, who is not only a fellow intern at KLM, but also a fellow
student from my master and a great sparring partner during the research. Thanks for
your support and I am convinced that your research can be of great value for the
organization! I would also like to thank Wessel for his helpful feedback and comments.
Last, but certainly not least, I would like to thank my parents and girlfriend for their daily
support. The last few months have been quite busy and various things happened
simultaneously. It is good to know that I can always count on you!
I hope that you all enjoy reading this thesis and that you will find it inspiring and useful
for your organization, research, or just your own interest.
Steven Paul Balk, B.Eng.
Management Information for corporate Learning and Development 1
1 Introducing the research Most large organizations have a corporate Learning and Development [L&D] department
to support Human Resource Development [HRD]. The traditional role of these L&D
departments is to support the organization by the development and delivery of training.
This traditional role is currently changing into a modern role in most organizations, in
which L&D departments are more and more seen as (performance) consultants. In the
consultative role L&D should be aligned with the wider organizational environment (Ott,
2007). One of the consequences of this role change is that managers involved in
corporate L&D desire management information to support their managerial practices.
This chapter will introduce the research into management information for corporate L&D
as conducted at the KLM Business Campus [KBC]. KBC is one of the corporate L&D
departments within the airline Air France-KLM [AFKL]. AFKL originated in 2004 when the
Dutch airline KLM and the French airline Air France merged. The conceptual part of the
introduction starts with the research background describing the organizational context of
KBC and their specific research request (1.1). Thereafter KBC’s request is identified by
means of a preliminary literature review and conceptual framework as a general business
need for corporate L&D management information (1.2). The review reveals that theory
lacks consensus about which information elements to include in corporate L&D
management information. To bridge this gap the objective of this research is to generate
the requirements for a management information system in relation to corporate learning
and development, with specific attention to the desired information elements (1.3). In
order to achieve the objective one main and three sub research questions are
formulated. The answers to these questions should lead to the achievement of the
objective (1.4). The technical part of this introductory chapter presents the research
strategy and related methods used to conduct the research, find answers to the
questions, and obtain its objective (1.5). The final section of this chapter provides an
overview of the upcoming chapters and what will be discussed in them (1.6).
1.1 An introduction to KLM Business Campus To get a better understanding for the corporate L&D environment, from which the KBC’s
research request into management information originates, this section presents the main
aspects related to the organizational context of KBC. KBC is the corporate L&D
department for the commercial division of AFKL. Like many other organizations, the
commercial division positioned its corporate L&D department under Human Resources
[HR] (1.1.1). The primary task of KBC is to develop and provide L&D products e.g.
training for the employees working in international sales organization, the commercial
division, of AFKL. Therefore the learning consultants focus on identifying and analysing
the learning needs of individuals and teams. When appropriate those needs are turned,
with the help of product developers, into so-called learning solutions. Some of these
learning solutions are traditional classroom training, which can be facilitated by KBC’s
trainers (1.1.1). KBC is one of the various corporate L&D departments within AFKL, since
each division has its own representatives for L&D (1.1.3). In KBC’s research request the
department formulated its desire for a management information system to support the
managerial and operational practices around corporate L&D (1.1.4).
Management Information for corporate Learning and Development 2
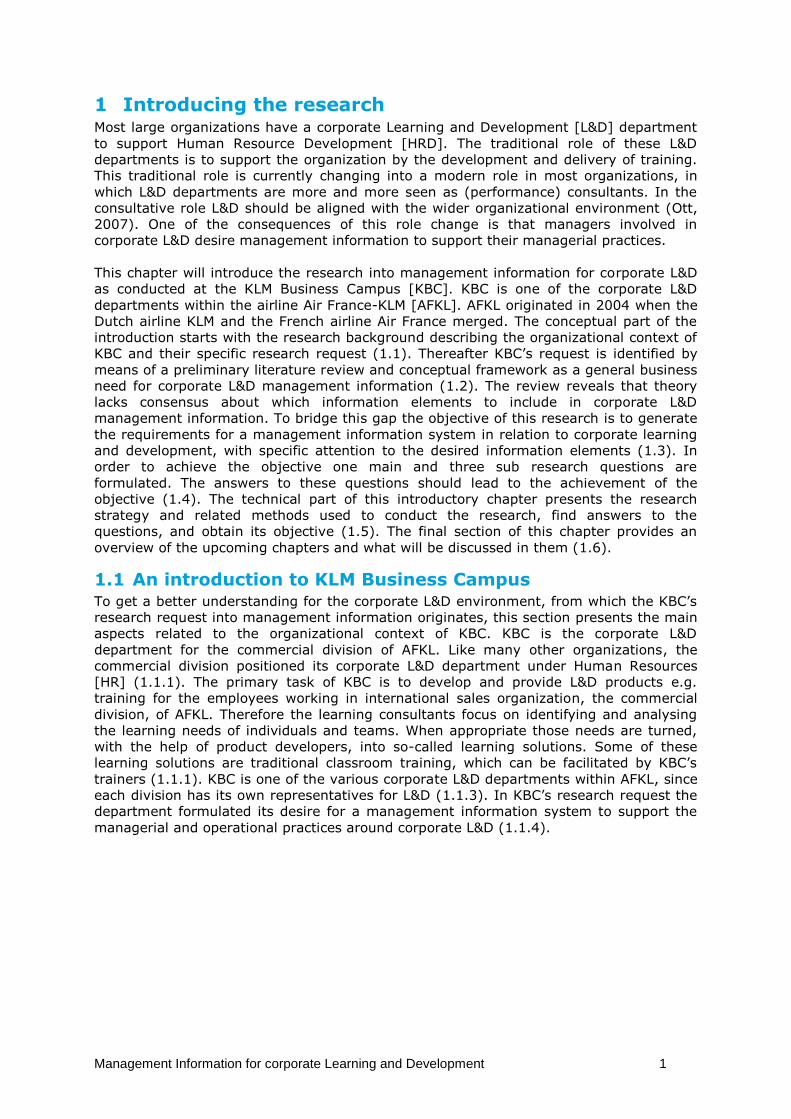
1.1.1 Organizational structure of Air France-KLM and the position of KBC
The traditional way to depict organizations and
their departments is by using an organogram. An
organogram shows the hierarchical levels within an
organization, indicating who are in charge and
responsible for the different departments (Figure
1). AFKL consists of multiple divisions and
departments. The Commercial Division is generally
responsible for the international sales of AFKL. The
division is led by two Executive Vice Presidents
[EVPs], one for commercial sales and alliances and
one for the commercial strategy. These two EVPs
are both in charge of two Human Resources
managers, one for Air France and one for KLM. KBC
is positioned under KLM’s Human Resource
manager. The department is focused on analysing
the learning needs of individuals and teams, within
the international sales organization and the
department is offering appropriate learning
solutions for the various employees within the
commercial division (KLM Business Campus, 2014).
KBC’s hierarchical position as presented in Figure 1
shows, from top to bottom, the three groups for
which management information is initially desired:
the Commercial EVPs, the manager KLM Human
Resources and the General Manager of KBC.
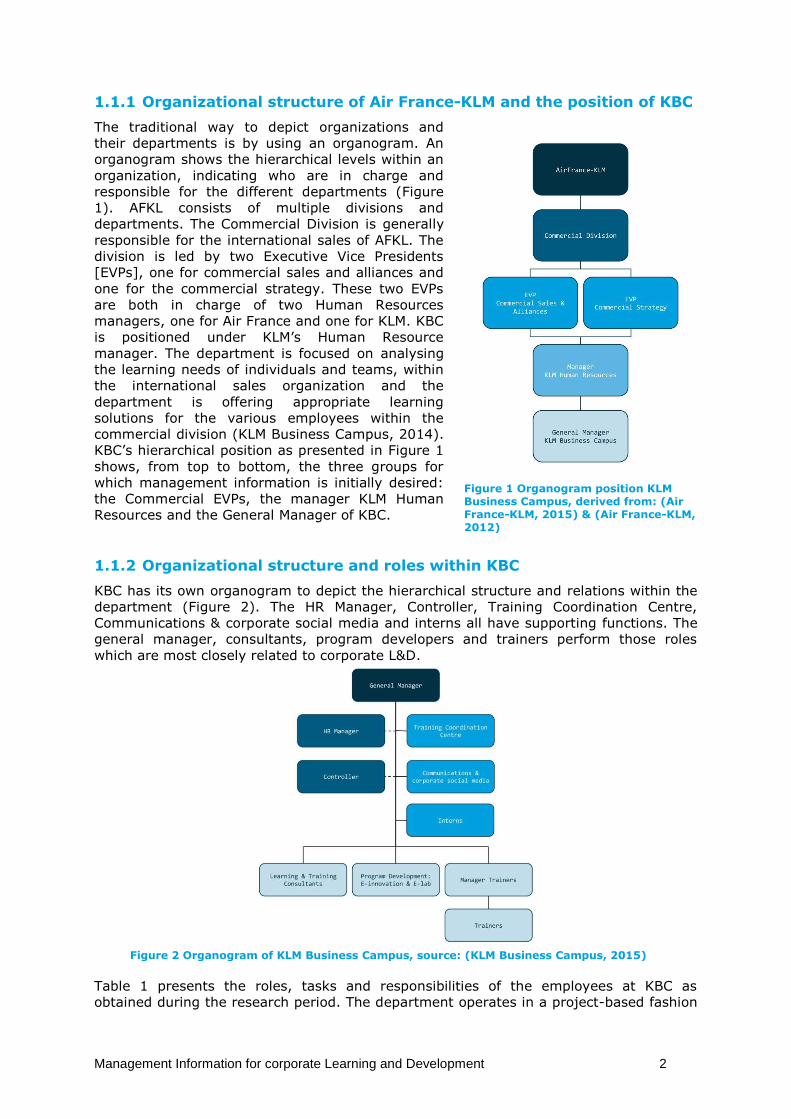
1.1.2 Organizational structure and roles within KBC
KBC has its own organogram to depict the hierarchical structure and relations within the
department (Figure 2). The HR Manager, Controller, Training Coordination Centre,
Communications & corporate social media and interns all have supporting functions. The
general manager, consultants, program developers and trainers perform those roles
which are most closely related to corporate L&D.
Figure 2 Organogram of KLM Business Campus, source: (KLM Business Campus, 2015)
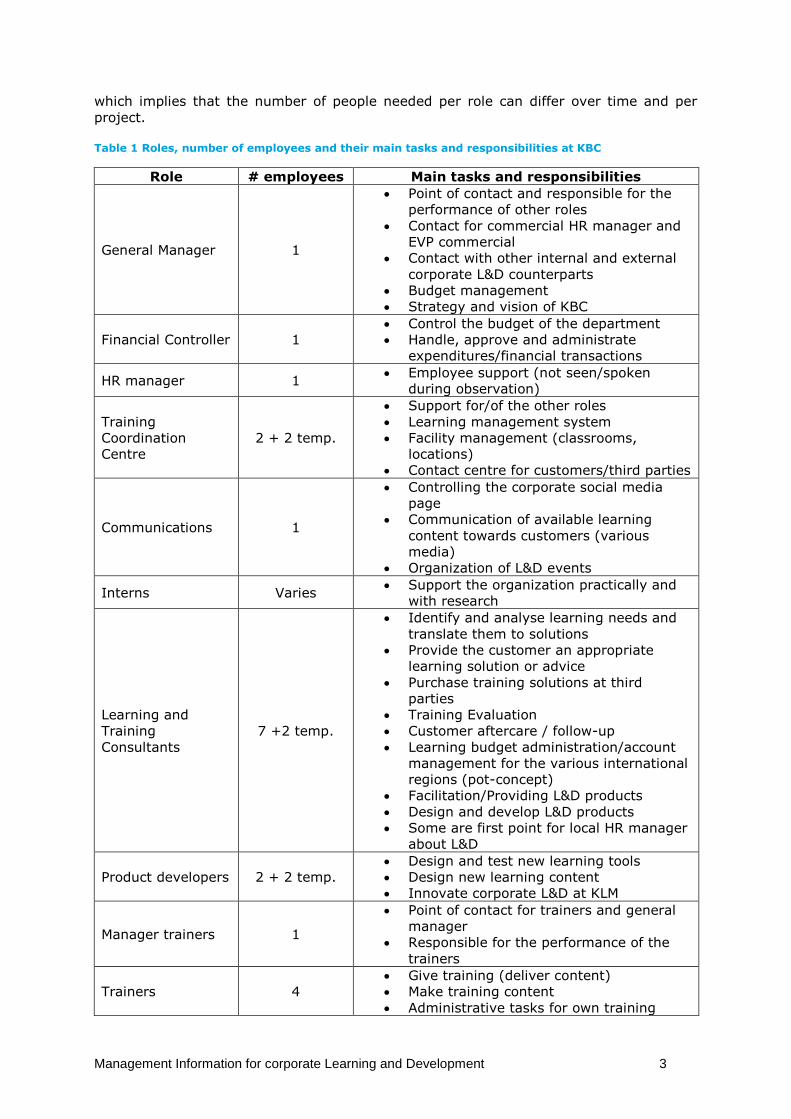
Table 1 presents the roles, tasks and responsibilities of the employees at KBC as
obtained during the research period. The department operates in a project-based fashion
Figure 1 Organogram position KLM Business Campus, derived from: (Air France-KLM, 2015) & (Air France-KLM, 2012)
Management Information for corporate Learning and Development 3
which implies that the number of people needed per role can differ over time and per
project.
Table 1 Roles, number of employees and their main tasks and responsibilities at KBC
Role # employees Main tasks and responsibilities
General Manager 1
Point of contact and responsible for the
performance of other roles
Contact for commercial HR manager and
EVP commercial
Contact with other internal and external
corporate L&D counterparts
Budget management
Strategy and vision of KBC
Financial Controller 1
Control the budget of the department
Handle, approve and administrate
expenditures/financial transactions
HR manager 1 Employee support (not seen/spoken
during observation)
Training
Coordination
Centre
2 + 2 temp.
Support for/of the other roles
Learning management system
Facility management (classrooms,
locations)
Contact centre for customers/third parties
Communications 1
Controlling the corporate social media
page
Communication of available learning
content towards customers (various
media)
Organization of L&D events
Interns Varies Support the organization practically and
with research
Learning and
Training
Consultants
7 +2 temp.
Identify and analyse learning needs and
translate them to solutions
Provide the customer an appropriate
learning solution or advice
Purchase training solutions at third
parties
Training Evaluation
Customer aftercare / follow-up
Learning budget administration/account
management for the various international
regions (pot-concept)
Facilitation/Providing L&D products
Design and develop L&D products
Some are first point for local HR manager
about L&D
Product developers 2 + 2 temp.
Design and test new learning tools
Design new learning content
Innovate corporate L&D at KLM
Manager trainers 1
Point of contact for trainers and general
manager
Responsible for the performance of the
trainers
Trainers 4
Give training (deliver content)
Make training content
Administrative tasks for own training
Management Information for corporate Learning and Development 4
1.1.3 Comparable departments and counterparts of KBC
KBC is not the only department involved in corporate L&D within AFKL. After the merger
both airlines kept most of their own divisions. These divisions often have their own L&D
departments or representative. For KLM nine divisions have their own L&D
representative/department, which are presented in Table 2. Each of these L&D
departments provides L&D products and services for its specific group of employees
working in that division. This construction of multiple departments and representatives
has grown into its current state since the learning needs of the various employees within
the airlines differ. A flight attendant has other learning needs and requires other training
than a sales representative. Alongside the divisional L&D representatives/departments,
there is the KLM Academy. This specific L&D department operates on KLM corporate level
and develops and provides its L&D products for all managers from a certain level.
Table 2 Divisions within KLM that have their own L&D representatives/department
Cargo Operations: Flight Ops,
Fleet Services, OCC Inflight Services
Chief Information Officer
/Information systems/IT
Commercial, Marketing,
Network, Revenue
Management
Engineering and
maintenance
Ground Services
Corporate: HR, Finance,
Procurement, Security
Services
KLM cityhopper
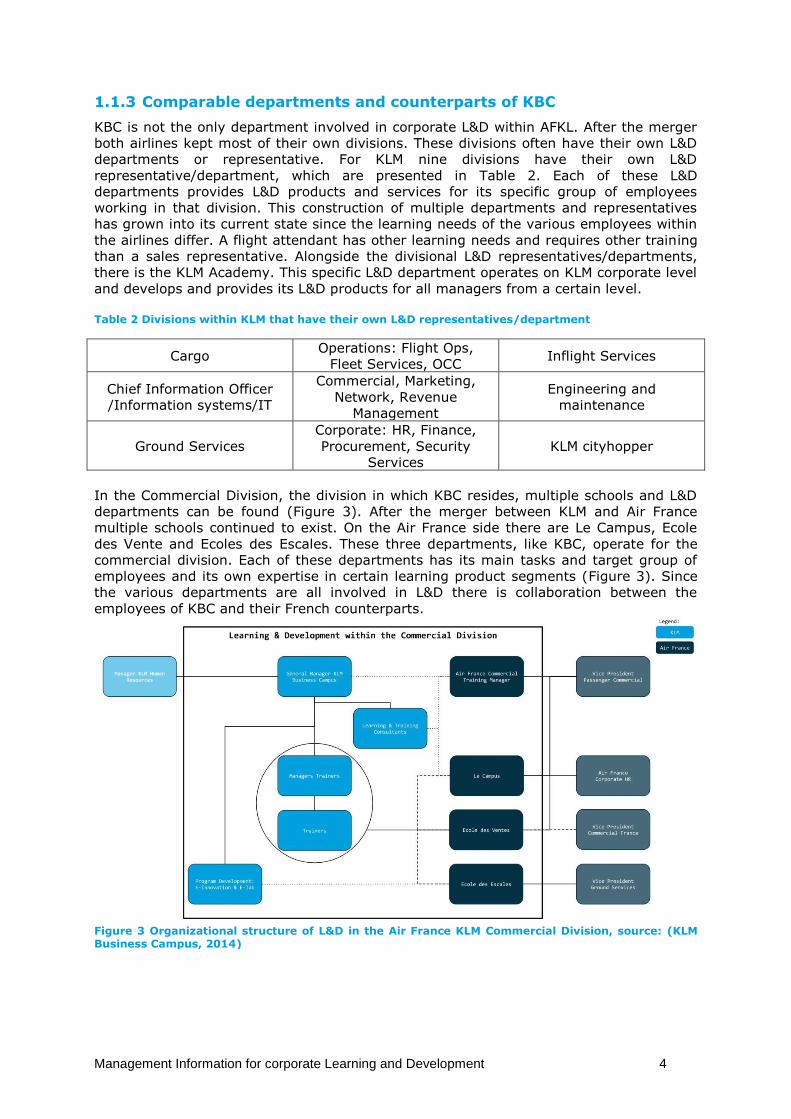
In the Commercial Division, the division in which KBC resides, multiple schools and L&D
departments can be found (Figure 3). After the merger between KLM and Air France
multiple schools continued to exist. On the Air France side there are Le Campus, Ecole
des Vente and Ecoles des Escales. These three departments, like KBC, operate for the
commercial division. Each of these departments has its main tasks and target group of
employees and its own expertise in certain learning product segments (Figure 3). Since
the various departments are all involved in L&D there is collaboration between the
employees of KBC and their French counterparts.
Figure 3 Organizational structure of L&D in the Air France KLM Commercial Division, source: (KLM Business Campus, 2014)
Management Information for corporate Learning and Development 5
Table 3 L&D Departments and schools in the commercial division of Air France-KLM, derived from internal presentations
L&D
department/school Main tasks/scope Main product segments
KLM Business
Campus
Develop, design and
provide L&D products for
the (KLM part of the)
commercial division
Design and deliver tailor made L&D
products and services, talent
programs, vitality, networking,
personal development, sales support,
Care (emergency response team),
Insights (team development) and
L&D innovation (development of e-
learning products/apps/instructional
video’s).
KLM Academy
Provide interventions and
training for managers and
specialists from a certain
management level KLM-
wide
Learning products for Management,
leadership and personal
effectiveness.
Le Campus French counterpart of
KLM Academy.
Leadership/Management, Languages,
and Transversal skills. Also provides
joint programs with KLM Academy
l’Ecole des Ventes
(sales school)
French counterpart of
KLM Business Campus.
Develop, design and
provide L&D products for
the (Air France part of
the) commercial division.
Direct Sales, Corporate & Distribution
and Customer Care. Classroom,
Teletrainings and E-Learnings. Also
provides joint programs with KLM
Business Campus
l’Ecole des Escales
(stopover school)
Air France’s training
centre for the various
functions of ground
operations
Ground operations and Safety at
work: Operational management,
Customer Service, Airside
operations, Health and Safety at
work and dangers goods.
The way of operation within the various L&D departments in AFKL differs per department,
even within the commercial division. The differences in operation reveal themselves for
instance in the way that training data is collected or how training is evaluated. However,
the different departments currently adapt their technologies and procedures in order to
create synergy. Two examples are the new corporate wide Learning Management System
[LMS] and a commonly desired evaluation system and method to evaluate training.
1.1.4 KBC’s research request for management information
The three previous paragraphs discussed the main aspects of KBC’s organizational
context in order to illustrate where the research request originates. In their initial request
for research KBC seeks answers to the following managerial questions raised by the
general manager of KBC, the KLM Human resources manager and the Commercial EVPs:
How many and which employees have we trained?
How much have we spent on L&D?
How can the performance/ productivity of our department be measured?
How can the added value of this corporate L&D department be evaluated?
On the basis of which Key Performance Indicators [KPIs] could/should the
department be managed?
Management Information for corporate Learning and Development 6
In many organizations management information [MI] and management information
systems support managerial practices. For this support the systems provide the
information required to formulate answers to the practical questions like: “How many and
which employees have we trained?” and “How much have we spent on L&D?” However,
for the less practical questions such as “On the basis of which Key Performance
Indicators [KPIs] could/should the department be managed?” and “How can the added
value of this corporate L&D department be evaluated?” the field of corporate L&D seems
to lack direct answers. This lack leads to KBC’s initial research request summarized in the
following three points:
Drafting and determining (key) performance indicators.
Determining the required data, information and (IT) systems needed to report
these performance indicators.
(re) Structuring the internal administrative processes, this could include the
training of employees to work with the (new) system(s).
In this research request KBC expresses its current need for a management information
system. The development of such a system requires an identification of information
elements like (key) performance indicators and other measures and metrics. The
upcoming section generalizes KBC’s research request as a general business need in order
to formulate a relevant research objective and accompanying research questions.
1.2 Understanding the research request as a general
business need In the research request KBC expresses its need
for a management information system. KBC’s
need for an information system does not stand
on its own. Due to improved technologies almost
all organizations implement information systems
in order to improve their effectiveness and
efficiency. This business need for information
systems originates from various environments
such as corporate L&D in this case. These
environments are composed of people,
organizations and their existing or planned
technologies (Figure 4). (Hevner, March, Park, &
Ram, 2004) Without a general understanding of
the origin and nature of the business needs for a
corporate L&D management information system,
it is hard to develop such an artefact that is
desired by the people, viable for the organization
and feasible by technology.
In order to better understand KBC’s specific
research request in the corporate L&D environmental context, a preliminary literature
review has been conducted (1.2.1). The main goals of this review are to understand
KBC’s specific research request for management information as a general business need
and to present the current state of literature on this specific topic. Thereby the review
shows the relevance of KBC’s specific research request with respect to other corporate
L&D departments. The review also reveals the current gaps in literature (1.2.2). From
the findings of the preliminary review a conceptual framework is constructed, which
depicts the concepts underlying the expressed need for corporate L&D management
information (1.2.3). This framework provides insight in the general business need for
L&D management information (1.2.4). With the literature findings and conceptual
framework it is possible to formulate a relevant research objective in the next section.
Figure 4 Business needs originate from the environment, adapted from (Hevner, March, Park, & Ram, 2004)
Management Information for corporate Learning and Development 7
1.2.1 A preliminary literature review into corporate L&D management
information
To conduct the preliminary review relevant articles and other literature needed to be
found and qualified. The steps towards the literature findings are presented in the
upcoming sub-paragraphs.
Identifying core concepts
The first step in the review is to identify core concepts related to the research topic which
can serve as search terms. The core concepts are underlined in the upcoming phrases
summarizing the research request. KBC as a training department wants to develop
management information in relation to corporate learning and development. This
information can be used by the various managers and employees related to L&D in order
to evaluate the performance and enhance decision making.
Constructing search-terms
The next step in the review is to construct initial search terms my making combinations
of the various concepts. These combinations lead to various search-terms like: training
evaluation, management information systems, performance measurement in L&D and
organizational performance measurement.
Selecting and qualifying literature
In order to select and qualify literature that is found by the search-term various criteria
are used. The first criterion is the relevancy of the literature as presented by the search
engines. Relevancy in these engines means that the search terms and thus the concepts
are incorporated in the text. Another criterion for relevancy is the publication date, as the
latest literature is better to find relevant research possibilities. The number of citations is
used as a criterion for the quality of literature. The number of citations provides an
indication of the acceptance and thus quality and usefulness of the literature. Of those
articles that were deemed relevant by the search engine and had a high number of
citations, the summaries were read and the articles were scanned whether they included
and explained the core concepts, if they tested hypotheses that showed relations
between the concepts, what the results of the study were and if new concepts were
introduced. The references within the literature were used to start the “snowball effect”:
The references of the found article are used to find more literature on the same topics or
related concepts.
Searching in general search engines
The next step is to use the search-terms and combinations of the search-terms on
general search engines like Google Scholar and Scopus. These engines are used to find
literature related to corporate L&D and containing the underlined concepts presented
earlier. These searches lead to relatively old and extensive books about the evaluation of
training, written by Kirkpatrick and Phillips. These books are useful to understand the
evaluation of training, but less suitable to identify the current state of science on the
topic of management information for corporate L&D. The search for organization
performance measurement leads to the article “Measuring Organizational Performance:
Towards Methodological Best Practice” (Richard, Devinney, Yip, & Johnson, 2009). This
article was selected for its high number of citations (367). The summary contains a call
for research into the topic of performance measurement within specific organizational
situations, which indicates a research opportunity for this thesis. By scanning the article
multiple tables containing the most commonly used performance measures appear,
probably useful to incorporate in the management information system.
Searching in specific journals
As said, the main findings of the general engines included relative old books. In order to
finds more up to date literature, presenting the current state of science on the research
topic, specific journals were used. Several search attempts with the same search-terms
as used earlier are done in journals such as The International Journal of Training and
Management Information for corporate Learning and Development 8
Development and the Journal of European Industrial Training. Also here the articles are
qualified as described above based on relevancy, citations, references and explanation of
concepts. The searches in training specific journals already lead to more L&D content
related literature. The findings presented in the found literature are presented in the
upcoming paragraph.
1.2.2 Findings of the preliminary literature review
After the search and selection of literature the following findings can be presented in
order to understand the research context and KBC’s research request as a general
business need. The sub-paragraphs below present the main findings.
Employees need to learn and develop
Employees require and use their human capital, i.e. their knowledge, skills, habits,
capabilities, attitudes, creativity and competences, to function and perform within their
organization. Organizations on their part use the collective of human capital embodied in
their employees to operate and perform in a competitive environment. Organizations can
use their human capital as a strategic asset in order to obtain a competitive advantage.
By the means of providing and supporting learning and development, organizations can
invest in their human capital. (Wheelock & Oughton, 2011)
Learning requires investment
Provision of, and support for, L&D products and services, e.g. classroom training, e-
learning, knowledge sharing platforms and learning consultancy, form the most tangible
category of human capital investments. In many organizations these products and
services are internally designed, developed and delivered by a so called corporate L&D
department. The choice for internal L&D development and delivery is often made to
assure that the products and services are better in fitting the company specific
requirements. In its L&D products companies can for instance express the desired
behaviour of their employees towards their customers or let them acquire skills that are
needed for a specific function.
Learning and development can lead to higher performance
The investments made in human capital should ultimately lead to an improved
organizational performance (Grossman & Salas, 2011). By this improved performance
high quality L&D within an organization can ensure a strategic advantage. Besides the
strategic advantage and organizational performance arguments various researchers
argue that providing high-quality L&D products is related to concepts such as
organizational success, successful job performance, attracting and retaining qualified
employees and keeping up with all kinds of (technological) developments (Grohmann &
Kauffeld, 2013).
Investors in L&D require (performance) feedback
The investments required in corporate L&D are for most companies quite substantive
(Grohmann & Kauffeld, Evaluating training programs:development and correlates of the
Questionnaire for Professional Training Evaluation, 2013). During times of financial
recession many organizations will look into their L&D department and try to find out
whether cost can be cut. During the cost-cutting exercise many investors demand
(performance) feedback from their L&D department. What the investors basically ask of
their L&D department is to justify its resource expenditures.
At companies where multiple L&D departments co-exist another incentive arises for
investors to demand feedback from their L&D department. This is because once multiple
L&D departments more or less have the same function within the organization, situations
can occur in which certain L&D activities are performed double and/or in different ways.
Double performed tasks can lead to higher cost and therefore the investors want to know
which L&D products and services are provided by the various departments and where
these departments differ from each other. In the case of comparable departments
Management Information for corporate Learning and Development 9
investors are also keen to assess the differences in performance between the
departments.
A third incentive to demand feedback from the L&D departments is caused by the
possibility to outsource corporate L&D activities. Many large organizations design and
develop their own L&D products. However, various specialised firms offer the possibility
to buy and/or co-create L&D products and services. The potential cost reductions of
outsourcing form another trigger for investors to demand insights in what their L&D
department contributes to (the performance of) the organization, given the resources
required by L&D department. (Grohmann & Kauffeld, 2013)
Feedback requires information like metrics and measures
Since investors increasingly judge L&D departments on their contribution to the
organizational performance, the demand for appropriate feedback measures and
management information systems for corporate L&D rises. L&D departments can use a
management information system in order to construct the measures, metrics and other
information to incorporate in the desired feedback. If composed of the right information
elements, management information can be used to evaluate the performance of an L&D
department and the contribution of L&D towards the organizational performance.
Measuring organizational performance
The desire to evaluate and measure the influence of L&D on the organizational
performance requires the use of organizational performance measures. These
performance measures can be used by managers to evaluate specific actions and create
a benchmark to see where the organization stands vis-à-vis its rivals. By measurement
one can also asses how the performance evolves over time. Richard, Devinney, Yip, &
Johnson, (2009) have researched how organizational performance is measured in
practice. First they defined that organizational performance encompasses three specific
areas of firm outcomes: financial performance, product market performance and
shareholder return (Richard, Devinney, Yip, & Johnson, 2009, p.722). Their research
shows that a large set of commonly used organizational performance measures exists to
measure these three areas. It depends per organization, department and even per level
within the department which management information is appropriate and useful. The
existence of this large amount of found measures and metrics is due to the
multidimensional conceptualization of organizational performance in practice.
Multidimensional conceptualization means that the definition of performance can vary
between organizations as the measures for performance are a construct of the various
aspects that define it. The authors conclude the following about the measurement of
organizational performance:
“All management research that claims to address organizational performance, should
explicitly address the following two requirements:
a) Possess a strong theoretical rationale on the nature of performance (i.e., theory
establishing which measures are appropriate to the research context) and
b) Rely on strong theory as to the nature of measures (i.e., theory establishing which
measures should be combined and the method for doing so)” (Richard, Devinney, Yip, &
Johnson, 2009) (p.718)
Thus, according to the authors whenever performance measures are going to be used in
corporate L&D management information, each measure will have to cover these two
requirements in order to be selected as appropriate information element.
The challenge to determine appropriate measures and metrics
As mentioned earlier, there is an enormous amount of possible performance indicators,
measures and metrics to choose from, or to establish, that could be included in corporate
L&D management information. The upcoming example illustrates that determining
Management Information for corporate Learning and Development 10
appropriate performance measures to tap organizational performance is not always a
straightforward exercise, due to the multidimensional conceptualization of performance.
In some cases the determination of appropriate measures to assess performance seems
relative straightforward. In the case of a standard production line, like within a tyre
factory, performance could be measured by a relative simple set of measures, e.g.
production cost per tyre, production time per tyre, on time delivery, and tyre quality. If
the production unit can lower its cost, or production time per tyre, while it maintains its
quality standard, it can be said to have enhanced its performance, that is its efficiency
and/or effectiveness. The straightforwardness of finding the appropriate measures for
performance is however not always clear once the scope is widened to organizational
performance. A production unit can produce tyres at the lowest possible cost, but if the
marketing department cannot make the appropriate promotion to sell enough tyres to
cover the production cost, the organization as a whole is not performing well. However,
the measurement of having good promotion is much more complex than the
measurement of unit production cost.
The determination of appropriate performance measures and metrics for an L&D
department is even harder than for a tyre factory production unit. Where the tyre
production unit performs a core business activity, an L&D department has a so called
supportive function within the organization. A supportive function means that the
department is not directly involved in the core business of the organization, making it
hard to determine performance measures. To illustrate: If the tyre production unit has a
lower performance, e.g. the tyres are no longer meeting quality standards, the whole
factory is likely to lose customers and thus see a reduction in revenue. Thus, tire quality
and total revenue can be seen as important performance measures. A low performance
of the supportive function as performed KBC is not likely to have a direct measureable
impact, neither on the core business of the commercial division (selling tickets) nor on
the core business of AFKL (transportation). It would therefore not make sense to assess
the performance of KBC on the number of sold tickets or on the revenue per passenger
kilometre, as long as the causality between KBC’s performance and the contribution to
the metrics cannot be demonstrated. However, the fact that the contribution and impact
to the core business of a supportive department are often vague or indirect provides no
argument to not measure the performance of an L&D department. Supportive
departments like L&D can be assessed on their efficiency, effectiveness and alignment
with the business (Bersin, 2007).
Sole use of objective measures quantitative measures will most likely not grasp the total
construct of L&D performance. Therefore if the performance of an L&D department
should be expressed in measures and metrics, as desired in the research request,
subjective quality aspects should be considered to be incorporated. A trainer for instance
should not be solely judged on the amount of people he trained over the last month.
Other subjective and qualitative aspects, like whether the learners liked his way of
teaching and how well he knows the training content, also play a role in his performance
and his contribution to L&D and thus the organization.
Other aspects in determining measures and metrics
The multidimensional conceptualization of performance implies that once corporate L&D
management information is going to be developed and performance measures are going
to be derived, one must always look at a variety of factors like the context of the
communicated information, the content and type of information that should be
communicated towards management, the way that information can be interpreted and
used, and the relevancy of the information for the different stakeholders. These various
factors are related to some dimensions of the organizational culture. For example
whether the organization is data-driven or whether managers assess people only based
on facts and figures.
Management Information for corporate Learning and Development 11
Research topics in corporate learning and development
Various researched topics in the field of L&D and accompanying concepts are among
others: the evaluation of training (Kirkpatrick, 1998), (Griffin, 2011), the contribution of
learning to an organization (Bramley & Kitson, 1994), training transfer (Saks & Burke,
2012), the design and management of a learning centre (Malone, 1997), the impacts of
training on an individual (Colquitt, LePine, & Noe, 2000) and the Return on Investment of
training (Phillips, 1997), (Chochard & Davoine, 2011). The findings of these researches,
and many others, including the methods used to quantify certain effects of training and
learning can be useful in developing management information for corporate L&D.
Science needs practical research in management information for corporate L&D
In his article Griffin argues that “workplace learning evaluation is still an emerging field
rather than a single settled discipline established within an accepted paradigm and
associated methodology and methods” (Griffin, 2011, p. 847). Workplace learning is
defined here as any planned event, experience or activity associated with the workplace
that results in or seeks to achieve a change in employees’ skills, knowledge and/or
attitudes. He calls for research that helps to put training evaluation on a stronger
theoretical basis. Richard, Devinney, Yip, & Johnson, (2009) conclude with a call for
research that examines performance measurement using multiple measures, which also
should appropriately align the research context, in this case corporate L&D, with the
measurement of organizational performance. In the research discipline of information
systems design science there is a call for research that aligns the discipline with real-
world experiences (Hevner, March, Park, & Ram, 2004). The practical research, as
performed at KBC and presented in this thesis, aims to contribute to these calls for
research by supporting the development of a management information systems for
corporate L&D by focusing on the determination of the appropriate information elements
to be obtained and communicated by this system.
1.2.3 Conceptual framework derived from the preliminary literature
review
The various findings of the literature as presented in the previous paragraph can be
summarized in a conceptual framework aggregating the found concepts and their
relations (Figure 5). In this conceptual framework two levels are hidden: the
organizational level and the L&D department level.
The organizational level of the conceptual framework
On organizational level, managers and EVPs need to decide (arrow 1) whether, which and
how much resources to invest in L&D departments (arrow 2) and how and on which
aspects the employees within the organization should develop themselves (arrow 8).
With the available resources the L&D department is enabled to develop or purchase L&D
products (arrow 3) and deliver these to the employees within the organization (arrow 4).
The idea of L&D products is that employees will learn and enhance their human capital
ultimately leading into an increase the performance of their work (arrow 5). If somehow
the L&D contributions to the organization can be evaluated and measured (arrow 6) and
communicated in sound and relevant management information (arrows 7 & 11),
managers can see what value L&D contributed to their employees and the organization.
Well communicated management information about how L&D contributes towards the
company will most likely result in better decision making in the assignment of corporate
resources to the L&D department.
The L&D department level of the conceptual framework
On the other level of the conceptual framework there is the L&D department as a
separate business entity, including its own employees, managers and performances. The
managers of the L&D department often need to decide how to allocate the resources
within their department (arrows 1 & 2) and how they manage these resources and the
L&D operations (arrows 8 & 9). In addition, L&D managers need to coordinate the
internal processes of the L&D department (arrows 3 & 4). If the department is properly
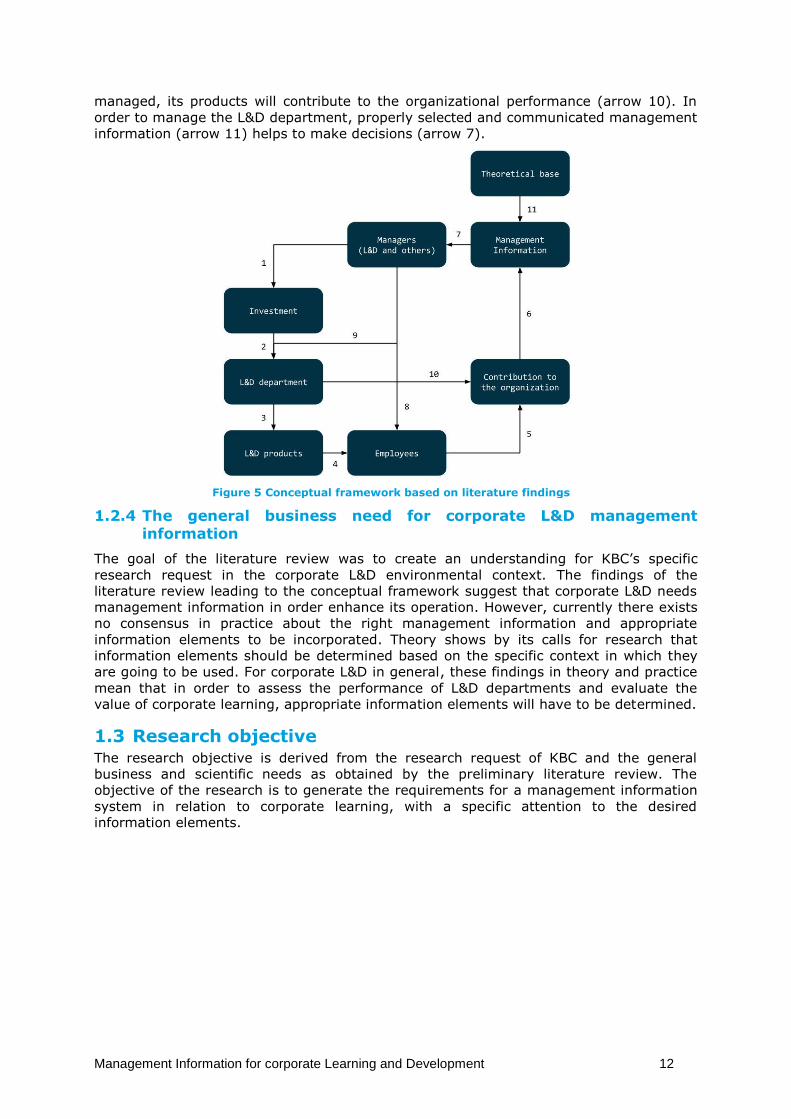
Management Information for corporate Learning and Development 12
managed, its products will contribute to the organizational performance (arrow 10). In
order to manage the L&D department, properly selected and communicated management
information (arrow 11) helps to make decisions (arrow 7).
Figure 5 Conceptual framework based on literature findings
1.2.4 The general business need for corporate L&D management
information
The goal of the literature review was to create an understanding for KBC’s specific
research request in the corporate L&D environmental context. The findings of the
literature review leading to the conceptual framework suggest that corporate L&D needs
management information in order enhance its operation. However, currently there exists
no consensus in practice about the right management information and appropriate
information elements to be incorporated. Theory shows by its calls for research that
information elements should be determined based on the specific context in which they
are going to be used. For corporate L&D in general, these findings in theory and practice
mean that in order to assess the performance of L&D departments and evaluate the
value of corporate learning, appropriate information elements will have to be determined.
1.3 Research objective The research objective is derived from the research request of KBC and the general
business and scientific needs as obtained by the preliminary literature review. The
objective of the research is to generate the requirements for a management information
system in relation to corporate learning, with a specific attention to the desired
information elements.
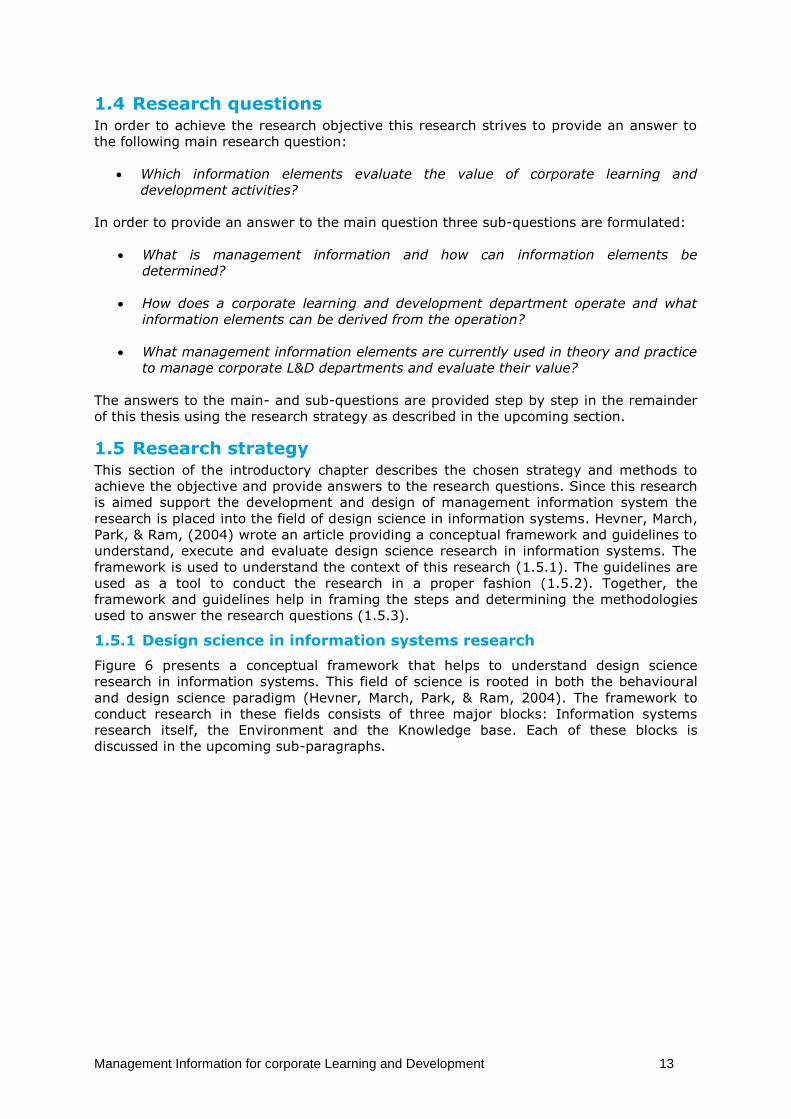
Management Information for corporate Learning and Development 13
1.4 Research questions In order to achieve the research objective this research strives to provide an answer to
the following main research question:
Which information elements evaluate the value of corporate learning and
development activities?
In order to provide an answer to the main question three sub-questions are formulated:
What is management information and how can information elements be
determined?
How does a corporate learning and development department operate and what
information elements can be derived from the operation?
What management information elements are currently used in theory and practice
to manage corporate L&D departments and evaluate their value?
The answers to the main- and sub-questions are provided step by step in the remainder
of this thesis using the research strategy as described in the upcoming section.
1.5 Research strategy This section of the introductory chapter describes the chosen strategy and methods to
achieve the objective and provide answers to the research questions. Since this research
is aimed support the development and design of management information system the
research is placed into the field of design science in information systems. Hevner, March,
Park, & Ram, (2004) wrote an article providing a conceptual framework and guidelines to
understand, execute and evaluate design science research in information systems. The
framework is used to understand the context of this research (1.5.1). The guidelines are
used as a tool to conduct the research in a proper fashion (1.5.2). Together, the
framework and guidelines help in framing the steps and determining the methodologies
used to answer the research questions (1.5.3).
1.5.1 Design science in information systems research
Figure 6 presents a conceptual framework that helps to understand design science
research in information systems. This field of science is rooted in both the behavioural
and design science paradigm (Hevner, March, Park, & Ram, 2004). The framework to
conduct research in these fields consists of three major blocks: Information systems
research itself, the Environment and the Knowledge base. Each of these blocks is
discussed in the upcoming sub-paragraphs.
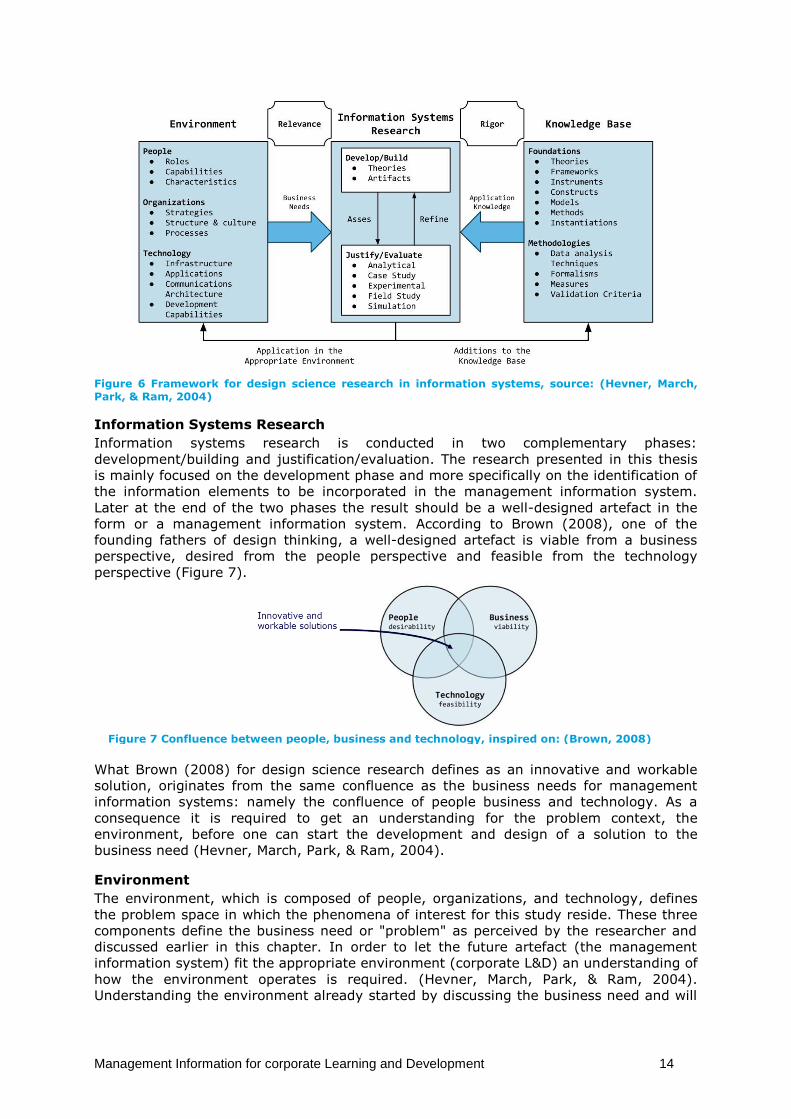
Management Information for corporate Learning and Development 14
Figure 6 Framework for design science research in information systems, source: (Hevner, March, Park, & Ram, 2004)
Information Systems Research
Information systems research is conducted in two complementary phases:
development/building and justification/evaluation. The research presented in this thesis
is mainly focused on the development phase and more specifically on the identification of
the information elements to be incorporated in the management information system.
Later at the end of the two phases the result should be a well-designed artefact in the
form or a management information system. According to Brown (2008), one of the
founding fathers of design thinking, a well-designed artefact is viable from a business
perspective, desired from the people perspective and feasible from the technology
perspective (Figure 7).
Figure 7 Confluence between people, business and technology, inspired on: (Brown, 2008)
What Brown (2008) for design science research defines as an innovative and workable
solution, originates from the same confluence as the business needs for management
information systems: namely the confluence of people business and technology. As a
consequence it is required to get an understanding for the problem context, the
environment, before one can start the development and design of a solution to the
business need (Hevner, March, Park, & Ram, 2004).
Environment
The environment, which is composed of people, organizations, and technology, defines
the problem space in which the phenomena of interest for this study reside. These three
components define the business need or "problem" as perceived by the researcher and
discussed earlier in this chapter. In order to let the future artefact (the management
information system) fit the appropriate environment (corporate L&D) an understanding of
how the environment operates is required. (Hevner, March, Park, & Ram, 2004).
Understanding the environment already started by discussing the business need and will
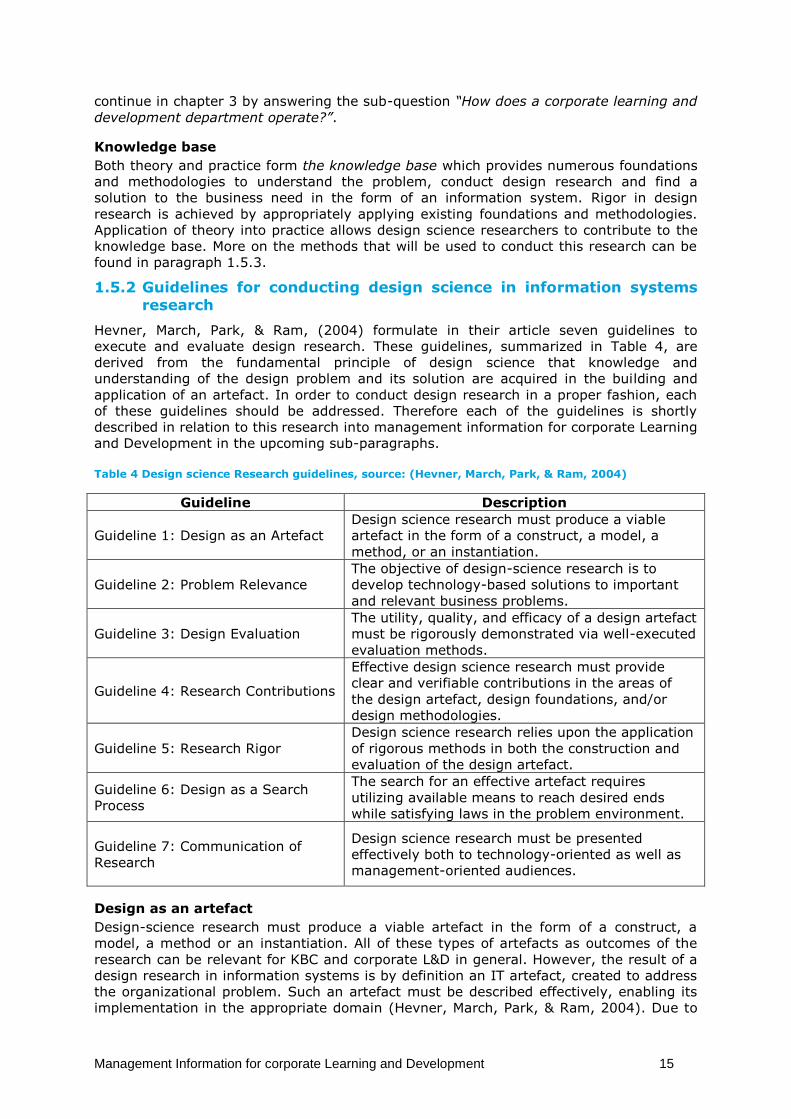
Management Information for corporate Learning and Development 15
continue in chapter 3 by answering the sub-question “How does a corporate learning and
development department operate?”.
Knowledge base
Both theory and practice form the knowledge base which provides numerous foundations
and methodologies to understand the problem, conduct design research and find a
solution to the business need in the form of an information system. Rigor in design
research is achieved by appropriately applying existing foundations and methodologies.
Application of theory into practice allows design science researchers to contribute to the
knowledge base. More on the methods that will be used to conduct this research can be
found in paragraph 1.5.3.
1.5.2 Guidelines for conducting design science in information systems research
Hevner, March, Park, & Ram, (2004) formulate in their article seven guidelines to
execute and evaluate design research. These guidelines, summarized in Table 4, are
derived from the fundamental principle of design science that knowledge and
understanding of the design problem and its solution are acquired in the building and
application of an artefact. In order to conduct design research in a proper fashion, each
of these guidelines should be addressed. Therefore each of the guidelines is shortly
described in relation to this research into management information for corporate Learning
and Development in the upcoming sub-paragraphs.
Table 4 Design science Research guidelines, source: (Hevner, March, Park, & Ram, 2004)
Guideline Description
Guideline 1: Design as an Artefact
Design science research must produce a viable
artefact in the form of a construct, a model, a
method, or an instantiation.
Guideline 2: Problem Relevance
The objective of design-science research is to
develop technology-based solutions to important
and relevant business problems.
Guideline 3: Design Evaluation
The utility, quality, and efficacy of a design artefact
must be rigorously demonstrated via well-executed
evaluation methods.
Guideline 4: Research Contributions
Effective design science research must provide
clear and verifiable contributions in the areas of
the design artefact, design foundations, and/or
design methodologies.
Guideline 5: Research Rigor
Design science research relies upon the application
of rigorous methods in both the construction and
evaluation of the design artefact.
Guideline 6: Design as a Search
Process
The search for an effective artefact requires
utilizing available means to reach desired ends
while satisfying laws in the problem environment.
Guideline 7: Communication of
Research
Design science research must be presented
effectively both to technology-oriented as well as
management-oriented audiences.
Design as an artefact
Design-science research must produce a viable artefact in the form of a construct, a
model, a method or an instantiation. All of these types of artefacts as outcomes of the
research can be relevant for KBC and corporate L&D in general. However, the result of a
design research in information systems is by definition an IT artefact, created to address
the organizational problem. Such an artefact must be described effectively, enabling its
implementation in the appropriate domain (Hevner, March, Park, & Ram, 2004). Due to
Management Information for corporate Learning and Development 16
time constraints the objective of this research is not to fully develop an IT-artefact but
has been limited to determining the information elements that need to be incorporated in
such a system. In this way this research contributes to the development of an IT-system
by deriving the information elements which become part of the design requirements for
the future system.
Problem Relevance
In design science research relevance is assured by framing the research activities in such
a way that they address the business needs. For this research it means that the findings
should help in the development of a corporate L&D management information system. In
the case of this research the problem originates from KBC’s research request, which is to
develop and implement a management information system for learning and
development. Since most companies have an L&D department, and a commonly accepted
set of information elements lacks in practice, the research is also relevant for a wider
audience than KBC alone.
Design Evaluation
The artefact, which is the outcome of a design science research, must demonstrate its
utility, quality and efficacy by using well-executed evaluation methods. Hevner, March,
Park, & Ram (2004) define five types of evaluation methods: observational, analytical,
experimental, testing and descriptive. In the case of an IT-artefact evaluation includes
integration of the artefact within the technical infrastructure of the business environment.
Translated to this research it would mean that (a part of) the management information
for learning and development organizations or a prototype of it should be evaluated
within the context of KBC.
Research Contributions
There are various areas where the research into management information for learning
and development organizations will contribute. From a scientific perspective, by serving
the calls of research mentioned in the preliminary literature review. From a practical
perspective the research contributes to L&D departments by determining desired and
viable information elements to be used in the desired artefact.
Research Rigor
The artefact, which is the outcome of the research, must be rigorously defined, formally
represented, coherent and internally consistent. The research therefore relies on the
application of rigorous methods in both the construction and evaluation of the design. For
this purpose the research will rely on various foundations and methodologies like
literature reviews, case studies, interviews, observation, and content analysis.
Design as a search process
Design can be seen as a search process in which various means (available actions and
resources) are used to reach a desired end, a solution. This process is in most instances
inherently iterative (Hevner, March, Park, & Ram, 2004). This research is basically set up
around two parts. First there is the L&D department of KBC which is used as a case study
example to describe how an L&D department operates. From this case it is possible to
derive and determine appropriate information elements related to the context of
corporate L&D. The other part is based on a cross-case study in which other L&D
departments and their management information elements are assessed. Observation and
interviews are therefore the two main methods in this research to arrive at the desired
end; achievement of the research objective. Achievement of the objective can be seen as
a step in the total development of an information system.
Research Communication
Design science research, and thus this final thesis, must be effectively presented to
technology as well as a management oriented audiences. In this research the scientific
community and the successors in the project are seen as the technical audience. The
Management Information for corporate Learning and Development 17
technology-oriented audience requires sufficient detail to construct the described artefact
and implement the desired information elements in the organizational context. For them
it is also important to include the processes by which the elements are constructed and
evaluated. The latter is also important for the repeatability of the research. The
management-oriented audience needs sufficient detail to determine whether the
organization should commit resources to the development and use of corporate L&D
management information. For this purpose a prototype could show the importance of the
problem and the novelty and effectiveness of the artefact. For this research the
management-oriented audience is seen as the future users of the artefact; the manager
of KBC and the higher level managers, since they can commit their resources to the
development process and artefact. Also other managers in corporate L&D are viewed as a
relevant audience.
1.5.3 Research steps and methodologies used in this research
The previous paragraph showed how this research relates to the seven guidelines for
design science research. The upcoming sub-paragraphs will explain in more detail which
steps are going to be taken in order to find answers to the research questions, and which
methodologies are going to be used during the steps.
Understanding the artefact
Before this research can contribute to the development of a management information
systems there needs to be an understanding for this artefact and related concepts. For
this purpose the question “What is management information and how can information
elements be determined?” will be answered. This question will be mainly answered by
exploration of the available literature on the topic of management information and
management information systems.
Understanding the environment
As mentioned earlier, purposeful artefacts can only be developed if there is an
understanding of the environment for which they are developed. In this research KBC is
used as a case study example to describe the operation of a corporate L&D department
in. This means that KBC is seen as a single case example of a corporate L&D department,
within the context of AFKL, in which multiple units of analysis reside, e.g. the various
roles and processes. Yin (1994) would therefore see the way to obtain an understanding
for the environment as a type 2 case study. In order to structure the description of the
environment a systems perspective is taken which will be introduced in chapter 3. This
step of the research should lead to a partial answer to the question “How does a
corporate learning and development department operate and what information elements
can be derived from the operation?”.
Deriving management information elements using the management information
of others
In order to find an answer to the question “What management information elements are
currently used in theory and practice to manage corporate L&D departments and
evaluate their value?” a cross-case analysis is conducted. By assessing the same
phenomenon of management information for multiple cases, corporate L&D departments,
a benchmark can be constructed of the information elements currently in use (Yin (1994)
would see it as a type 3 design). In order to obtain the information elements semi-
structured interviews with representatives of other corporate L&D departments are
conducted.
Deriving management information elements from own operation
Where the previous step finds an answer to the commonly used information elements
this steps will answer “(…) what information elements can be derived from the
operation?”. The goal of this fourth step is to derive information elements that are better
in fitting KBC’s case than the information elements obtained by the previous step. For
Management Information for corporate Learning and Development 18
this purpose a structured approach needs to be selected, which can only be done once
there is clarity about how to determine management information elements.
Answering the main question, implications and reflection
The four steps should lead to the answers of the sub-questions. From these answers it
should be possible to construct an answer to the main question. Thereafter can be
evaluated whether the objective has been achieved, whether the best methods have
been used, and what the various implications of the findings of this research are.
1.6 The remainder of this thesis This chapter introduced the research and presented the research background, the
objective, questions and the general research strategy. Now that the objectives and goals
are clear the remainder of the thesis will continue with the steps required to provide an
answer to the research questions and derive the information elements (Figure 8).
In order to gain an understanding about the artefact under development the next chapter
discusses management information and management information systems based on
literature findings (2). A well-designed artefact requires an understanding of the business
environment in which it is going to be used. Therefore KBC is used as a case company to
describe the environment and context of corporate learning and development. In order to
make this chapter more generalizable the case department is discussed in connection
with theory when appropriate (3). In order to find out whether other corporate L&D
departments are facing the same business need for management information and how
they satisfy this need, a cross-case analysis with six other corporate L&D departments is
conducted (4). From the cross-case analysis several generally used information elements
can be deducted. However, since management information is a very company specific
artefact information elements have also been identified using a so-called top-down
approach (5). Combination of all the steps leads to an answer to the main research
question and the initially desired management information elements to incorporate in a
management information system for corporate L&D (Fout! Verwijzingsbron niet
evonden.). Once the desired information elements are known, specialists should build
and construct the information system that aids managers and employees involved in
corporate L&D in their decision making. However, various steps are to be taken before
such an artefact becomes reality and future research and work is needed to assess the
selected information elements (7).
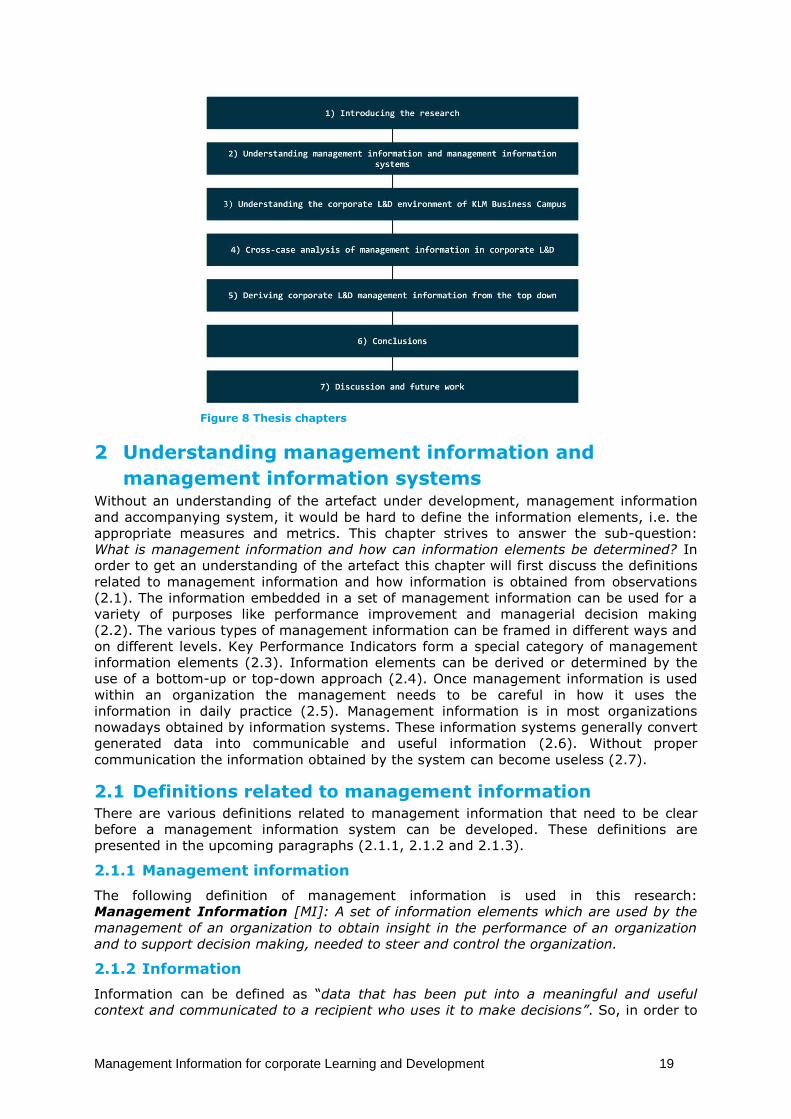
Management Information for corporate Learning and Development 19
Figure 8 Thesis chapters
2 Understanding management information and
management information systems Without an understanding of the artefact under development, management information
and accompanying system, it would be hard to define the information elements, i.e. the
appropriate measures and metrics. This chapter strives to answer the sub-question:
What is management information and how can information elements be determined? In
order to get an understanding of the artefact this chapter will first discuss the definitions
related to management information and how information is obtained from observations
(2.1). The information embedded in a set of management information can be used for a
variety of purposes like performance improvement and managerial decision making
(2.2). The various types of management information can be framed in different ways and
on different levels. Key Performance Indicators form a special category of management
information elements (2.3). Information elements can be derived or determined by the
use of a bottom-up or top-down approach (2.4). Once management information is used
within an organization the management needs to be careful in how it uses the
information in daily practice (2.5). Management information is in most organizations
nowadays obtained by information systems. These information systems generally convert
generated data into communicable and useful information (2.6). Without proper
communication the information obtained by the system can become useless (2.7).
2.1 Definitions related to management information There are various definitions related to management information that need to be clear
before a management information system can be developed. These definitions are
presented in the upcoming paragraphs (2.1.1, 2.1.2 and 2.1.3).
2.1.1 Management information
The following definition of management information is used in this research:
Management Information [MI]: A set of information elements which are used by the
management of an organization to obtain insight in the performance of an organization
and to support decision making, needed to steer and control the organization.
2.1.2 Information
Information can be defined as “data that has been put into a meaningful and useful
context and communicated to a recipient who uses it to make decisions”. So, in order to
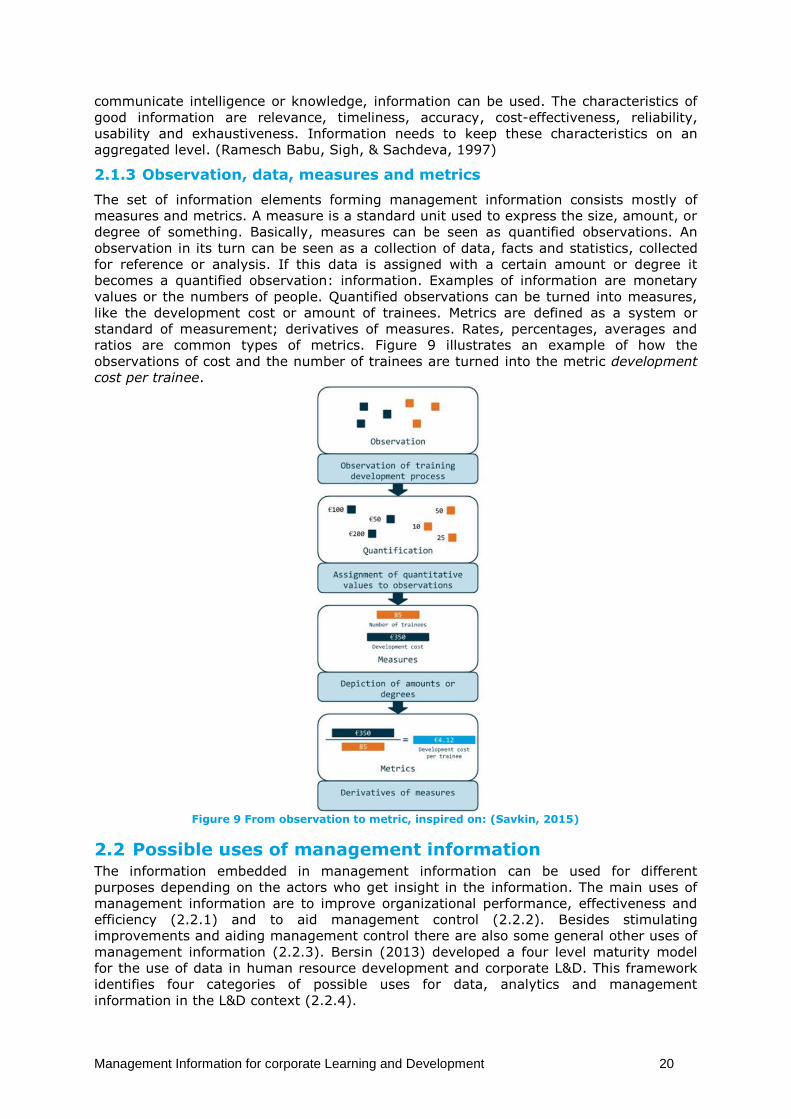
Management Information for corporate Learning and Development 20
communicate intelligence or knowledge, information can be used. The characteristics of
good information are relevance, timeliness, accuracy, cost-effectiveness, reliability,
usability and exhaustiveness. Information needs to keep these characteristics on an
aggregated level. (Ramesch Babu, Sigh, & Sachdeva, 1997)
2.1.3 Observation, data, measures and metrics
The set of information elements forming management information consists mostly of
measures and metrics. A measure is a standard unit used to express the size, amount, or
degree of something. Basically, measures can be seen as quantified observations. An
observation in its turn can be seen as a collection of data, facts and statistics, collected
for reference or analysis. If this data is assigned with a certain amount or degree it
becomes a quantified observation: information. Examples of information are monetary
values or the numbers of people. Quantified observations can be turned into measures,
like the development cost or amount of trainees. Metrics are defined as a system or
standard of measurement; derivatives of measures. Rates, percentages, averages and
ratios are common types of metrics. Figure 9 illustrates an example of how the
observations of cost and the number of trainees are turned into the metric development
cost per trainee.
Figure 9 From observation to metric, inspired on: (Savkin, 2015)
2.2 Possible uses of management information The information embedded in management information can be used for different
purposes depending on the actors who get insight in the information. The main uses of
management information are to improve organizational performance, effectiveness and
efficiency (2.2.1) and to aid management control (2.2.2). Besides stimulating
improvements and aiding management control there are also some general other uses of
management information (2.2.3). Bersin (2013) developed a four level maturity model
for the use of data in human resource development and corporate L&D. This framework
identifies four categories of possible uses for data, analytics and management
information in the L&D context (2.2.4).
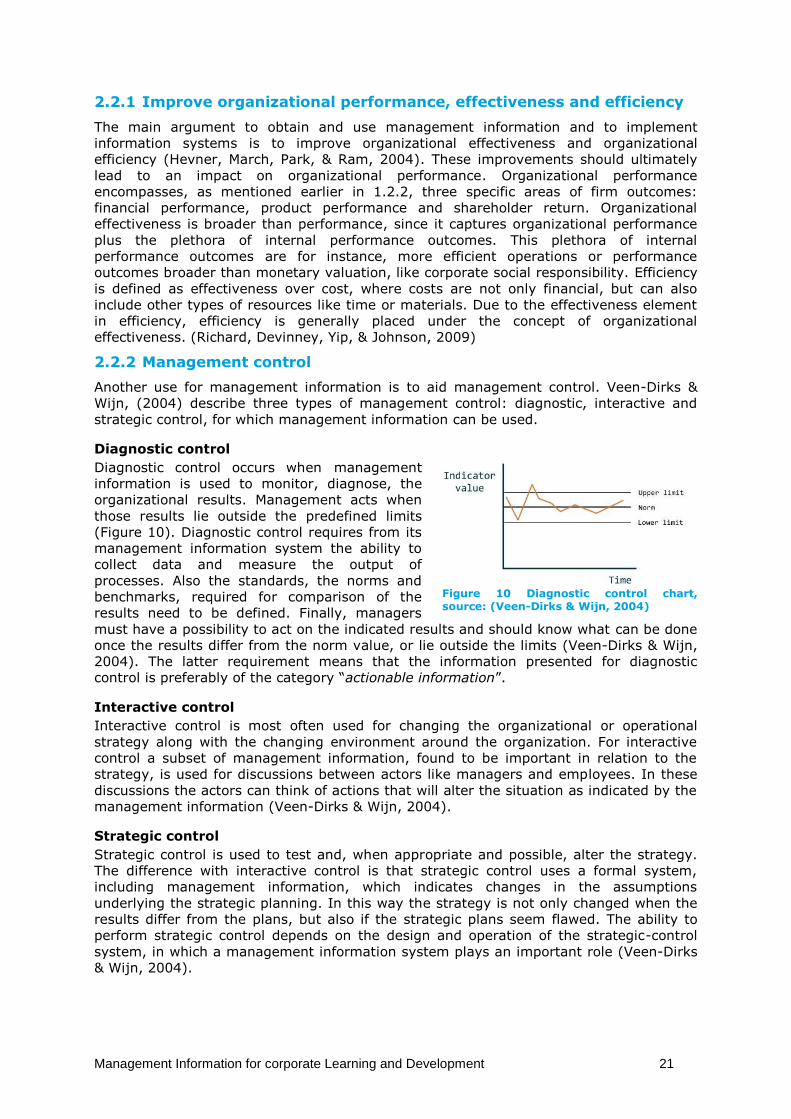
Management Information for corporate Learning and Development 21
2.2.1 Improve organizational performance, effectiveness and efficiency
The main argument to obtain and use management information and to implement
information systems is to improve organizational effectiveness and organizational
efficiency (Hevner, March, Park, & Ram, 2004). These improvements should ultimately
lead to an impact on organizational performance. Organizational performance
encompasses, as mentioned earlier in 1.2.2, three specific areas of firm outcomes:
financial performance, product performance and shareholder return. Organizational
effectiveness is broader than performance, since it captures organizational performance
plus the plethora of internal performance outcomes. This plethora of internal
performance outcomes are for instance, more efficient operations or performance
outcomes broader than monetary valuation, like corporate social responsibility. Efficiency
is defined as effectiveness over cost, where costs are not only financial, but can also
include other types of resources like time or materials. Due to the effectiveness element
in efficiency, efficiency is generally placed under the concept of organizational
effectiveness. (Richard, Devinney, Yip, & Johnson, 2009)
2.2.2 Management control
Another use for management information is to aid management control. Veen-Dirks &
Wijn, (2004) describe three types of management control: diagnostic, interactive and
strategic control, for which management information can be used.
Diagnostic control
Diagnostic control occurs when management
information is used to monitor, diagnose, the
organizational results. Management acts when
those results lie outside the predefined limits
(Figure 10). Diagnostic control requires from its
management information system the ability to
collect data and measure the output of
processes. Also the standards, the norms and
benchmarks, required for comparison of the
results need to be defined. Finally, managers
must have a possibility to act on the indicated results and should know what can be done
once the results differ from the norm value, or lie outside the limits (Veen-Dirks & Wijn,
2004). The latter requirement means that the information presented for diagnostic
control is preferably of the category “actionable information”.
Interactive control
Interactive control is most often used for changing the organizational or operational
strategy along with the changing environment around the organization. For interactive
control a subset of management information, found to be important in relation to the
strategy, is used for discussions between actors like managers and employees. In these
discussions the actors can think of actions that will alter the situation as indicated by the
management information (Veen-Dirks & Wijn, 2004).
Strategic control
Strategic control is used to test and, when appropriate and possible, alter the strategy.
The difference with interactive control is that strategic control uses a formal system,
including management information, which indicates changes in the assumptions
underlying the strategic planning. In this way the strategy is not only changed when the
results differ from the plans, but also if the strategic plans seem flawed. The ability to
perform strategic control depends on the design and operation of the strategic-control
system, in which a management information system plays an important role (Veen-Dirks
& Wijn, 2004).
Figure 10 Diagnostic control chart, source: (Veen-Dirks & Wijn, 2004)
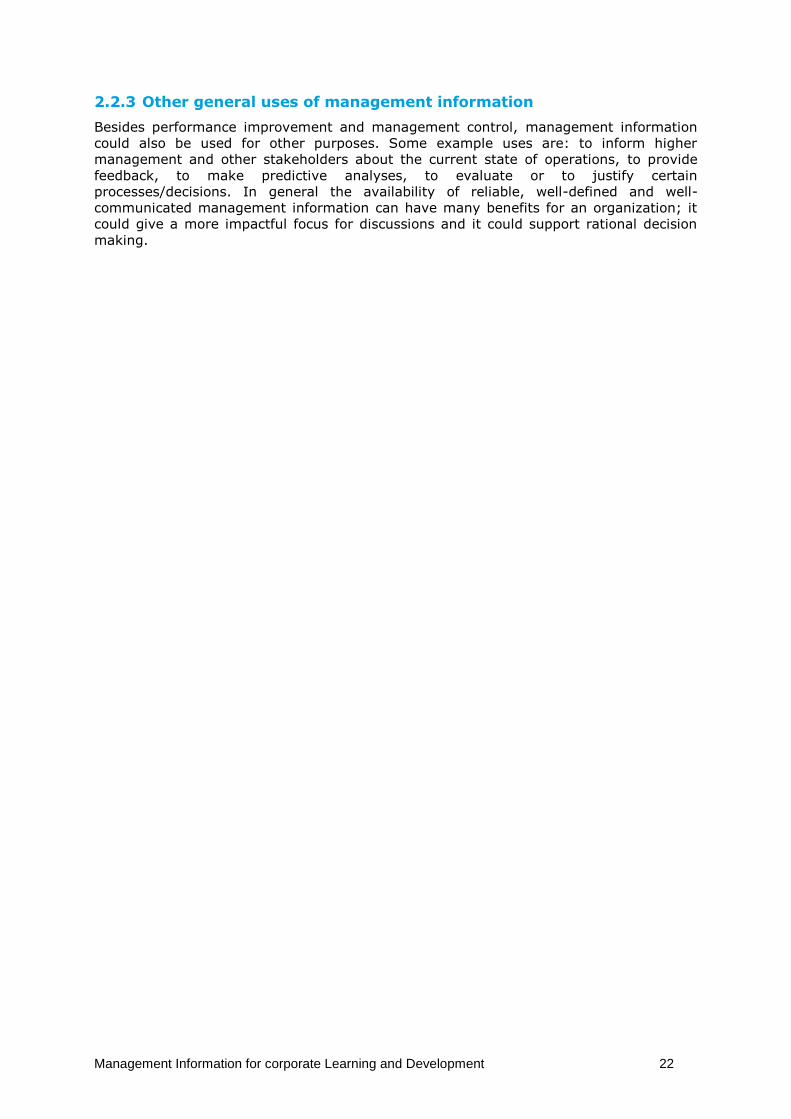
Management Information for corporate Learning and Development 22
2.2.3 Other general uses of management information
Besides performance improvement and management control, management information
could also be used for other purposes. Some example uses are: to inform higher
management and other stakeholders about the current state of operations, to provide
feedback, to make predictive analyses, to evaluate or to justify certain
processes/decisions. In general the availability of reliable, well-defined and well-
communicated management information can have many benefits for an organization; it
could give a more impactful focus for discussions and it could support rational decision
making.
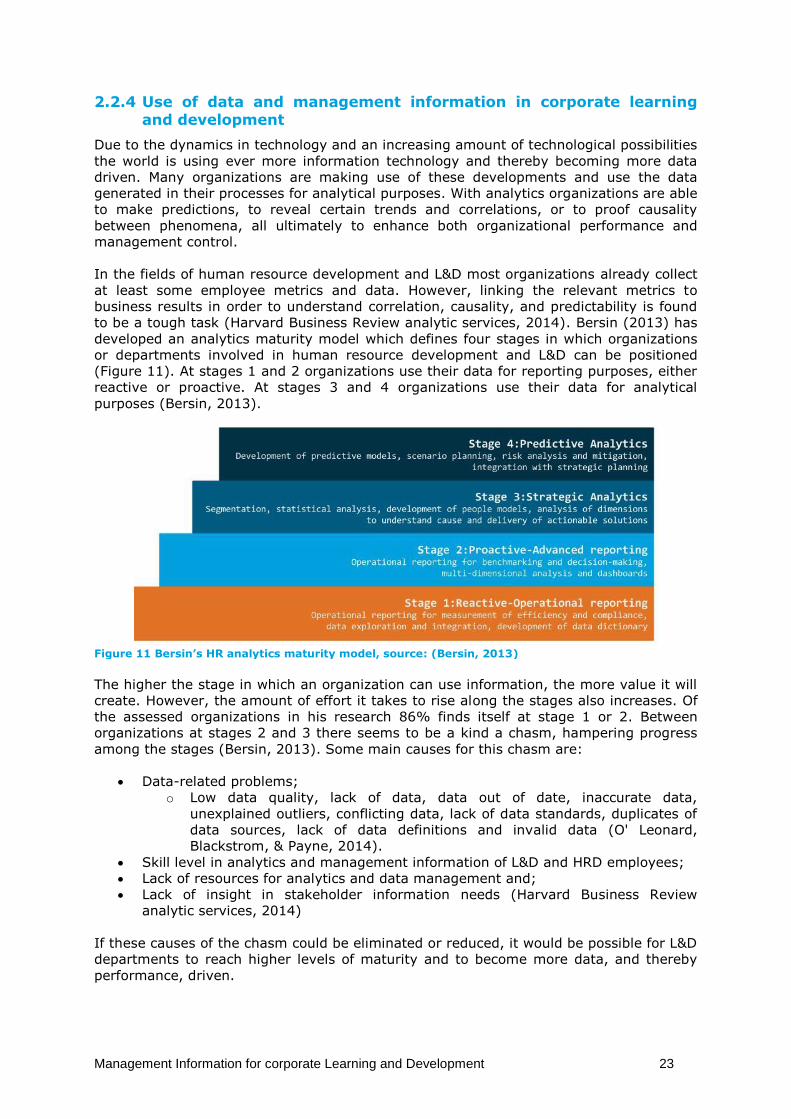
Management Information for corporate Learning and Development 23
2.2.4 Use of data and management information in corporate learning
and development
Due to the dynamics in technology and an increasing amount of technological possibilities
the world is using ever more information technology and thereby becoming more data
driven. Many organizations are making use of these developments and use the data
generated in their processes for analytical purposes. With analytics organizations are able
to make predictions, to reveal certain trends and correlations, or to proof causality
between phenomena, all ultimately to enhance both organizational performance and
management control.
In the fields of human resource development and L&D most organizations already collect
at least some employee metrics and data. However, linking the relevant metrics to
business results in order to understand correlation, causality, and predictability is found
to be a tough task (Harvard Business Review analytic services, 2014). Bersin (2013) has
developed an analytics maturity model which defines four stages in which organizations
or departments involved in human resource development and L&D can be positioned
(Figure 11). At stages 1 and 2 organizations use their data for reporting purposes, either
reactive or proactive. At stages 3 and 4 organizations use their data for analytical
purposes (Bersin, 2013).
Figure 11 Bersin’s HR analytics maturity model, source: (Bersin, 2013)
The higher the stage in which an organization can use information, the more value it will
create. However, the amount of effort it takes to rise along the stages also increases. Of
the assessed organizations in his research 86% finds itself at stage 1 or 2. Between
organizations at stages 2 and 3 there seems to be a kind a chasm, hampering progress
among the stages (Bersin, 2013). Some main causes for this chasm are:
Data-related problems;
o Low data quality, lack of data, data out of date, inaccurate data,
unexplained outliers, conflicting data, lack of data standards, duplicates of
data sources, lack of data definitions and invalid data (O' Leonard,
Blackstrom, & Payne, 2014).
Skill level in analytics and management information of L&D and HRD employees;
Lack of resources for analytics and data management and;
Lack of insight in stakeholder information needs (Harvard Business Review
analytic services, 2014)
If these causes of the chasm could be eliminated or reduced, it would be possible for L&D
departments to reach higher levels of maturity and to become more data, and thereby
performance, driven.
Management Information for corporate Learning and Development 24
2.3 Types and levels of management information Since management information can incorporate different information elements, multiple
types and typologies of management information can be distinguished. (2.3.1 till 2.3.4)
The sources of management information and the audiences can vary within and per
organization, resulting in the existence of different levels of management information
(2.3.5).
2.3.1 Descriptive, diagnostic, predictive, prescriptive information
Information can be categorized in different ways. In relation to management information,
which is often used to monitor whether managerial goals have been achieved, four types
of information can be distinguished (Figure 12). Descriptive information describes, in the
context of an organization, the as-is situation. An example is an answer to the question
What is number of L&D products in our portfolio? Diagnostic information is used to
describe the gap between the as-is and ought-to be; What is wrong with this specific
learning solution? Predictive information describes the possibilities of what could happen;
What would happen if we hire more trainers? The fourth type of information, Prescriptive
Information, aids managers in their decision making by providing information to answer
questions like: What should be done to increase the quality of our learning solutions?
(Harsh, Connor, & Schwab, 1981)
Figure 12 Types of Information, source: (Harsh, Connor, & Schwab, 1981)
When the four types of information are linked to the four stages of the maturity model
discussed earlier, it becomes clear that each maturity stage of the model requires other
types of information. Where descriptive information could be enough for the information
needs in stage 1, the other stages would require more “advanced” types of information.
Predictive analytics would for instance require predictive information. For management
information it implies that the more “mature” managers want to use information in their
decision making, the more advanced and devised that information itself should be.
2.3.2 Objective versus subjective measures
Measures can be divided over the categories objective and subjective. Objective
measures are seen as impartial measures; they are without personal bias or prejudice of
the observant. Examples are development time and production cost, which both can be
objectively measured. Subjective measures are influenced by the one who does the
observation. Subjective measures are often used to measure quality aspects, for example
how good certain training was according to the trainees. For the development of the
desired management information it is important to know whether a certain considered
measure is objective or subjective, as it influences how the measure should be
interpreted and used. (Richard, Devinney, Yip, & Johnson, 2009)
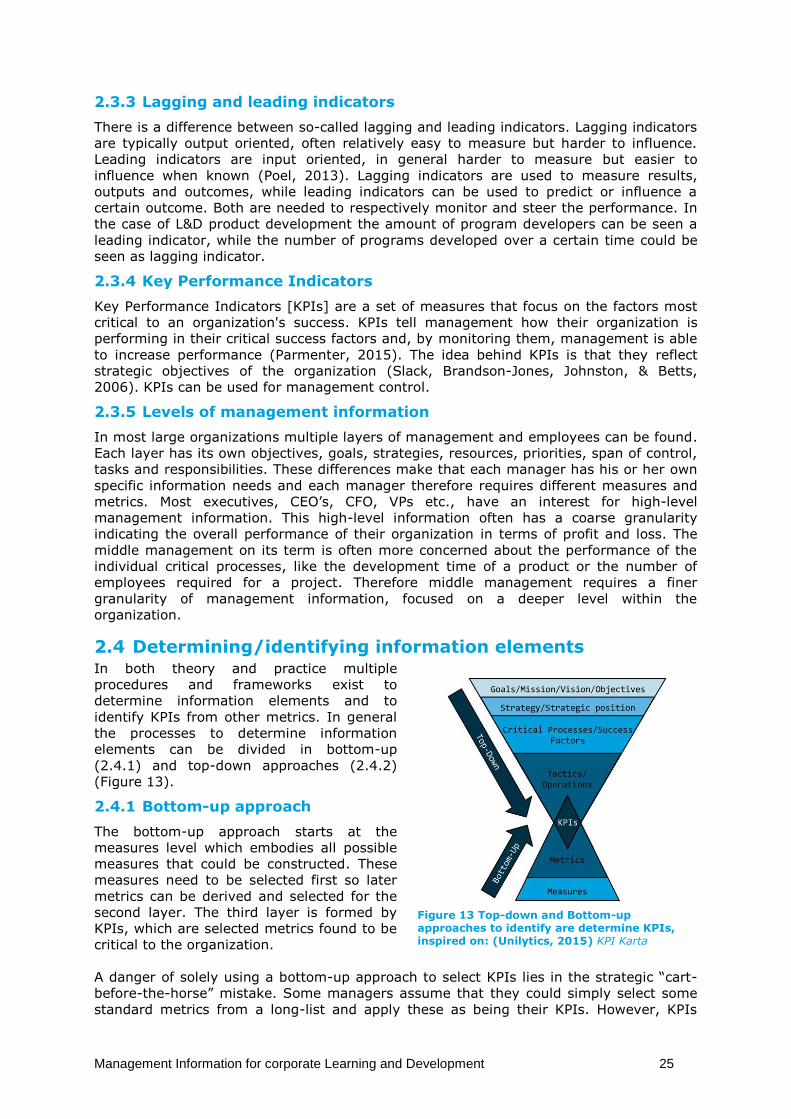
Management Information for corporate Learning and Development 25
2.3.3 Lagging and leading indicators
There is a difference between so-called lagging and leading indicators. Lagging indicators
are typically output oriented, often relatively easy to measure but harder to influence.
Leading indicators are input oriented, in general harder to measure but easier to
influence when known (Poel, 2013). Lagging indicators are used to measure results,
outputs and outcomes, while leading indicators can be used to predict or influence a
certain outcome. Both are needed to respectively monitor and steer the performance. In
the case of L&D product development the amount of program developers can be seen a
leading indicator, while the number of programs developed over a certain time could be
seen as lagging indicator.
2.3.4 Key Performance Indicators
Key Performance Indicators [KPIs] are a set of measures that focus on the factors most
critical to an organization's success. KPIs tell management how their organization is
performing in their critical success factors and, by monitoring them, management is able
to increase performance (Parmenter, 2015). The idea behind KPIs is that they reflect
strategic objectives of the organization (Slack, Brandson-Jones, Johnston, & Betts,
2006). KPIs can be used for management control.
2.3.5 Levels of management information
In most large organizations multiple layers of management and employees can be found.
Each layer has its own objectives, goals, strategies, resources, priorities, span of control,
tasks and responsibilities. These differences make that each manager has his or her own
specific information needs and each manager therefore requires different measures and
metrics. Most executives, CEO’s, CFO, VPs etc., have an interest for high-level
management information. This high-level information often has a coarse granularity
indicating the overall performance of their organization in terms of profit and loss. The
middle management on its term is often more concerned about the performance of the
individual critical processes, like the development time of a product or the number of
employees required for a project. Therefore middle management requires a finer
granularity of management information, focused on a deeper level within the
organization.
2.4 Determining/identifying information elements In both theory and practice multiple
procedures and frameworks exist to
determine information elements and to
identify KPIs from other metrics. In general
the processes to determine information
elements can be divided in bottom-up
(2.4.1) and top-down approaches (2.4.2)
(Figure 13).
2.4.1 Bottom-up approach
The bottom-up approach starts at the
measures level which embodies all possible
measures that could be constructed. These
measures need to be selected first so later
metrics can be derived and selected for the
second layer. The third layer is formed by
KPIs, which are selected metrics found to be
critical to the organization.
A danger of solely using a bottom-up approach to select KPIs lies in the strategic “cart-
before-the-horse” mistake. Some managers assume that they could simply select some
standard metrics from a long-list and apply these as being their KPIs. However, KPIs
Figure 13 Top-down and Bottom-up approaches to identify are determine KPIs, inspired on: (Unilytics, 2015) KPI Karta
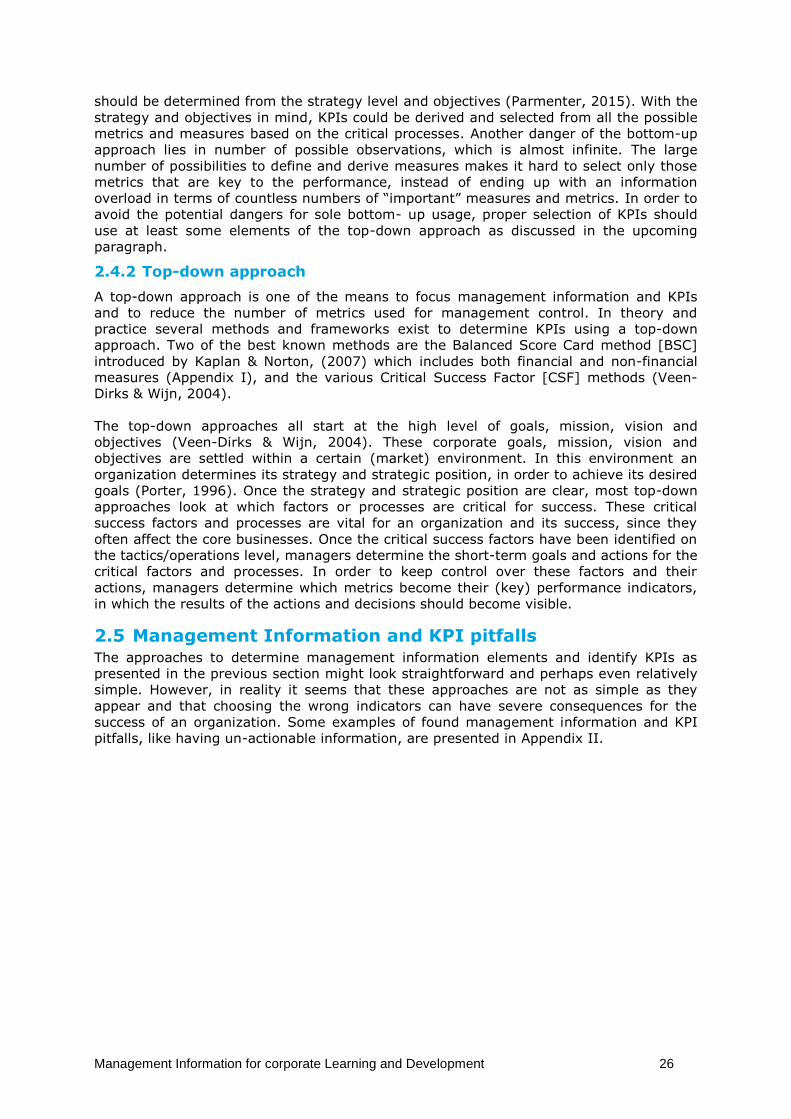
Management Information for corporate Learning and Development 26
should be determined from the strategy level and objectives (Parmenter, 2015). With the
strategy and objectives in mind, KPIs could be derived and selected from all the possible
metrics and measures based on the critical processes. Another danger of the bottom-up
approach lies in number of possible observations, which is almost infinite. The large
number of possibilities to define and derive measures makes it hard to select only those
metrics that are key to the performance, instead of ending up with an information
overload in terms of countless numbers of “important” measures and metrics. In order to
avoid the potential dangers for sole bottom- up usage, proper selection of KPIs should
use at least some elements of the top-down approach as discussed in the upcoming
paragraph.
2.4.2 Top-down approach
A top-down approach is one of the means to focus management information and KPIs
and to reduce the number of metrics used for management control. In theory and
practice several methods and frameworks exist to determine KPIs using a top-down
approach. Two of the best known methods are the Balanced Score Card method [BSC]
introduced by Kaplan & Norton, (2007) which includes both financial and non-financial
measures (Appendix I), and the various Critical Success Factor [CSF] methods (Veen-
Dirks & Wijn, 2004).
The top-down approaches all start at the high level of goals, mission, vision and
objectives (Veen-Dirks & Wijn, 2004). These corporate goals, mission, vision and
objectives are settled within a certain (market) environment. In this environment an
organization determines its strategy and strategic position, in order to achieve its desired
goals (Porter, 1996). Once the strategy and strategic position are clear, most top-down
approaches look at which factors or processes are critical for success. These critical
success factors and processes are vital for an organization and its success, since they
often affect the core businesses. Once the critical success factors have been identified on
the tactics/operations level, managers determine the short-term goals and actions for the
critical factors and processes. In order to keep control over these factors and their
actions, managers determine which metrics become their (key) performance indicators,
in which the results of the actions and decisions should become visible.
2.5 Management Information and KPI pitfalls The approaches to determine management information elements and identify KPIs as
presented in the previous section might look straightforward and perhaps even relatively
simple. However, in reality it seems that these approaches are not as simple as they
appear and that choosing the wrong indicators can have severe consequences for the
success of an organization. Some examples of found management information and KPI
pitfalls, like having un-actionable information, are presented in Appendix II.
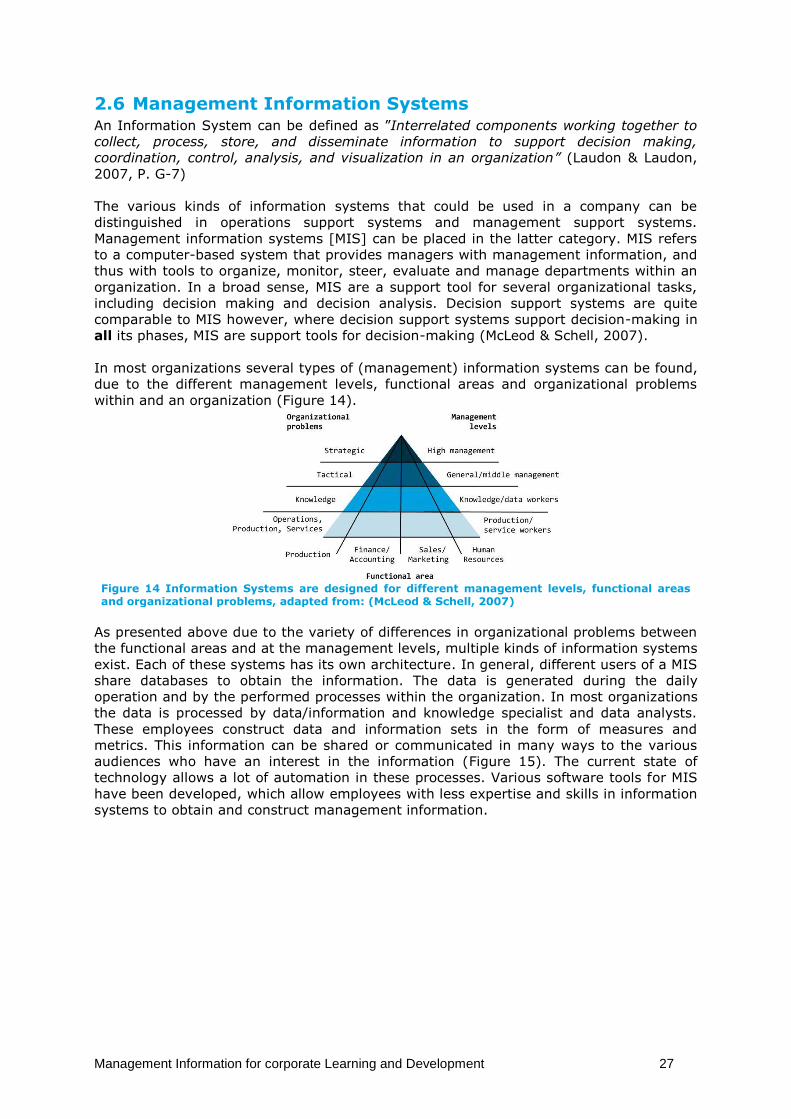
Management Information for corporate Learning and Development 27
2.6 Management Information Systems An Information System can be defined as ”Interrelated components working together to
collect, process, store, and disseminate information to support decision making,
coordination, control, analysis, and visualization in an organization” (Laudon & Laudon,
2007, P. G-7)
The various kinds of information systems that could be used in a company can be
distinguished in operations support systems and management support systems.
Management information systems [MIS] can be placed in the latter category. MIS refers
to a computer-based system that provides managers with management information, and
thus with tools to organize, monitor, steer, evaluate and manage departments within an
organization. In a broad sense, MIS are a support tool for several organizational tasks,
including decision making and decision analysis. Decision support systems are quite
comparable to MIS however, where decision support systems support decision-making in
all its phases, MIS are support tools for decision-making (McLeod & Schell, 2007).
In most organizations several types of (management) information systems can be found,
due to the different management levels, functional areas and organizational problems
within and an organization (Figure 14).
Figure 14 Information Systems are designed for different management levels, functional areas and organizational problems, adapted from: (McLeod & Schell, 2007)
As presented above due to the variety of differences in organizational problems between
the functional areas and at the management levels, multiple kinds of information systems
exist. Each of these systems has its own architecture. In general, different users of a MIS
share databases to obtain the information. The data is generated during the daily
operation and by the performed processes within the organization. In most organizations
the data is processed by data/information and knowledge specialist and data analysts.
These employees construct data and information sets in the form of measures and
metrics. This information can be shared or communicated in many ways to the various
audiences who have an interest in the information (Figure 15). The current state of
technology allows a lot of automation in these processes. Various software tools for MIS
have been developed, which allow employees with less expertise and skills in information
systems to obtain and construct management information.
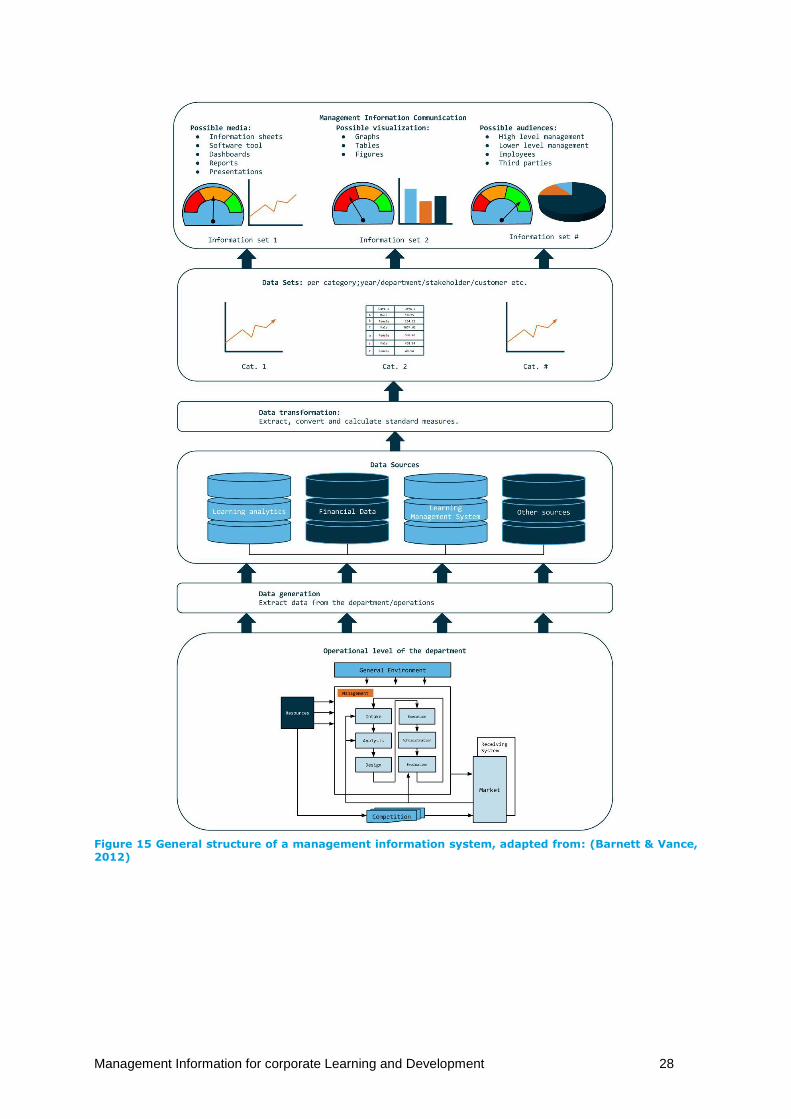
Management Information for corporate Learning and Development 28
Figure 15 General structure of a management information system, adapted from: (Barnett & Vance, 2012)
Management Information for corporate Learning and Development 29
2.7 Communicating management information In order to achieve the goal of a management information system, supporting managers
in their managerial practices, communication of the management information elements
plays an important role. Communication bridges the gap between the information and its
users. For effective communication of management information it is first of all needed to
determine the desired information content for the various audiences. Also the timing and
type of communication should be defined; what, when, how and how often information
will be presented. (Phillips J. , 1997). In the communication of information also the
context of how the information is presented relates to the effective use of the
information.
There are multiple ways to present management information. Three commonly used
communication media are dashboards, reports and presentations. The term dashboard
refers to a graphical tool that allows users to view data using charts, dials and other
visual approaches to understand business data. Preferably the information delivered by
the communication media is actionable and presented in such a way that it fits the users’
information needs. For decision support it is helpful if information is presented in an
intuitive manner. Appendix III provides examples, with fictive numbers, of how different
ways of data representation can influence the ease of use the incorporated information.
2.8 Summarizing conclusion The aim of this chapter was to answer the sub-question: What is management
information and how can information elements be determined? Therefore the general
theory of management information and accompanying systems has been discussed in
order to get a better understanding of the design artefact. Management information and
information in general have been defined. Also it is described how information elements
(e.g. metrics and measures) are derived from observations and how this can be done
using a management information system. Also the various kinds, usages and levels of
information are presented, which shows that each desired use of information has its
specific type of information, and that good information is relevant, timeliness, accurate,
cost-effective, reliable, usable and exhaustive on all levels. Key Performance Indicators
form a specific category of management information elements which can be defined or
indicated using a top-down or bottom-up approach. A top-down approach, like the
Balanced Score Card method, starts at the strategy level of an organization and derived
information elements looking at the critical processes and performances. A bottom-up
approach starts with at all the possible metrics and makes a selection of these that
become KPIs. The use of management information in decision making has various
consequences for an organization. It will influence how managers see and interpret their
environment which on its term will influence the decisions they make for the operations
and the achievement of the strategic goals. Managers need to be aware of this before
they use management information as a support tool.
The next chapter will continue with a case description of KBC as corporate learning and
development department using a systems perspective. The goal of the upcoming chapter
is to support a better understanding of the context around the desired artefact by
describing the corporate L&D environment and how it operates.
Management Information for corporate Learning and Development 30
3 Understanding the corporate L&D environment of KLM
Business Campus The aim of this chapter is to provide a partial answer to the sub-question How does a
corporate learning and development department operate and what information elements
can be derived from the operation? Without understanding of the environment, the
organization, people and technology, of a corporate Learning and Development
department it would be almost impossible to develop an artefact which can evaluate the
value brought by corporate learning. A lack of understanding would also make it hard to
develop a desired, viable and feasible information system (Hevner, March, Park, & Ram,
2004). In order to get an understanding of the corporate L&D environment chapter 1
already introduced the organizational structure of Air France-KLM and the position of
KBC. It also discussed the roles within KBC and the counterparts of the departments at
AFKL. In order to later derive the management information elements from the top down
the missions, visions and strategies within AFKL, the commercial division and KBC will be
presented as the first topic of this chapter (3.1). Thereafter the focus will shift to the
process and job levels of a corporate L&D department using a systems view (3.2). The
ten major elements of this view help to obtain more insight in the corporate L&D
environment, required to develop a management information system (3.3 till 3.12). The
results of using the systems view on corporate L&D will also help in identifying the
processes to derive management information elements from as presented later in
chapter 5.
3.1 Missions, visions and strategies of Air France-KLM, the
commercial division and KBC Most organizations operate according to their goals, mission, vision and strategy. The
performance of an organization is partly dependent on how well these elements are
defined and followed, and how well the organisation operates aligned to the strategy. The
strategies, missions and goals often reveal themselves in the form of short phrases
and/or concepts/constructs, considered important by the organization. The mission,
vision and strategy have a large impact on a corporate L&D environment. The impact
reveals itself for instance in the operation of the department and the available resources.
Missions, visions and strategies differ per (type of) company, which implies that the
appropriate information elements also differ. In order to determine the information
elements using a top-down approach later in this research and to get a better
understanding for the environment, the missions, visions and strategies of AFKL (3.1.1),
the commercial division (3.1.2) and KBC (3.1.3) are presented in the upcoming
paragraphs.
3.1.1 Mission, vision and strategy of Air France-KLM
The communication of the strategy at KLM presents itself in three ways. First there is the
company profile communicating the general strategy, as presented on the website of Air
France-KLM. For the longer term, the strategic goals, mission and vision are presented in
the various media considering Perform 2020. For the short term the KLM Flight plan 2015
presents these strategic elements of KLM. Table 5 summarizes the content of the various
documents.
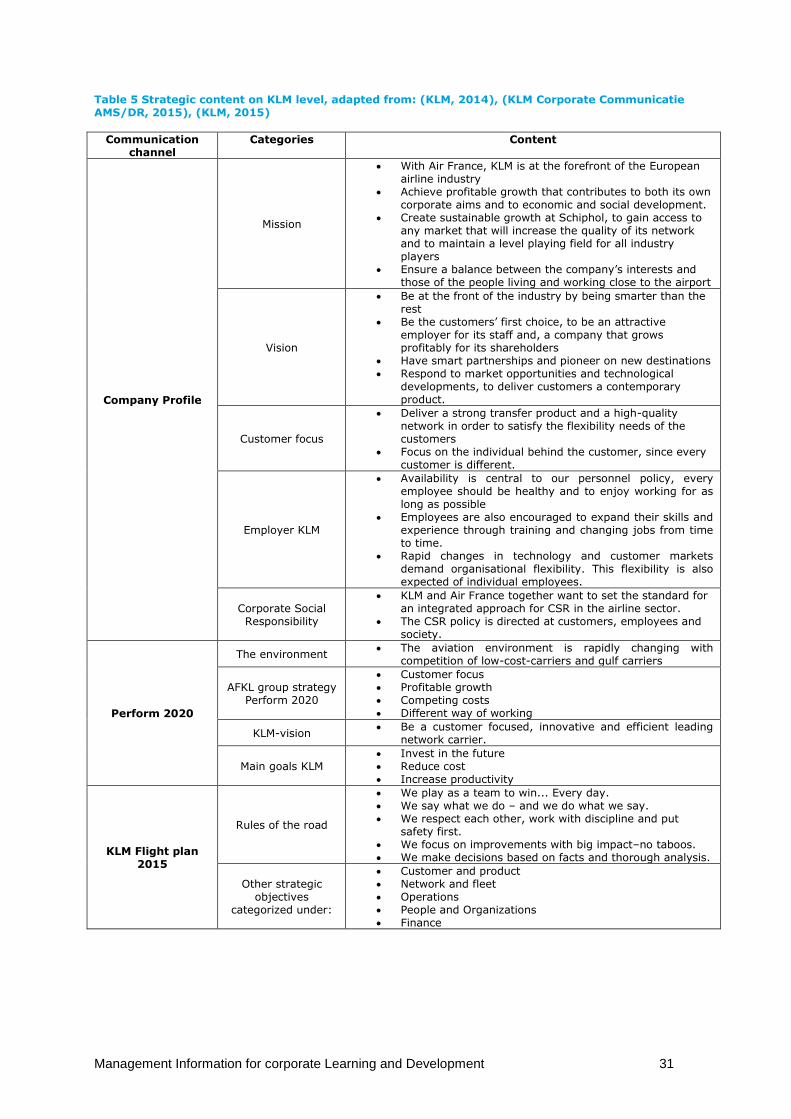
Management Information for corporate Learning and Development 31
Table 5 Strategic content on KLM level, adapted from: (KLM, 2014), (KLM Corporate Communicatie AMS/DR, 2015), (KLM, 2015)
Communication channel
Categories Content
Company Profile
Mission
With Air France, KLM is at the forefront of the European airline industry
Achieve profitable growth that contributes to both its own corporate aims and to economic and social development.
Create sustainable growth at Schiphol, to gain access to any market that will increase the quality of its network and to maintain a level playing field for all industry players
Ensure a balance between the company’s interests and those of the people living and working close to the airport
Vision
Be at the front of the industry by being smarter than the rest
Be the customers’ first choice, to be an attractive employer for its staff and, a company that grows profitably for its shareholders
Have smart partnerships and pioneer on new destinations Respond to market opportunities and technological
developments, to deliver customers a contemporary product.
Customer focus
Deliver a strong transfer product and a high-quality network in order to satisfy the flexibility needs of the customers
Focus on the individual behind the customer, since every customer is different.
Employer KLM
Availability is central to our personnel policy, every employee should be healthy and to enjoy working for as long as possible
Employees are also encouraged to expand their skills and experience through training and changing jobs from time to time.
Rapid changes in technology and customer markets demand organisational flexibility. This flexibility is also expected of individual employees.
Corporate Social Responsibility
KLM and Air France together want to set the standard for an integrated approach for CSR in the airline sector.
The CSR policy is directed at customers, employees and society.
Perform 2020
The environment The aviation environment is rapidly changing with
competition of low-cost-carriers and gulf carriers
AFKL group strategy Perform 2020
Customer focus Profitable growth Competing costs Different way of working
KLM-vision Be a customer focused, innovative and efficient leading
network carrier.
Main goals KLM Invest in the future Reduce cost Increase productivity
KLM Flight plan 2015
Rules of the road
We play as a team to win... Every day. We say what we do – and we do what we say. We respect each other, work with discipline and put
safety first. We focus on improvements with big impact–no taboos. We make decisions based on facts and thorough analysis.
Other strategic objectives
categorized under:
Customer and product Network and fleet Operations People and Organizations Finance
Management Information for corporate Learning and Development 32
3.1.2 Mission, vision and strategy of the Commercial Division
For KBC as corporate L&D department the strategic content of KLM does have an impact,
however it is on such a high level that the department does not have a direct impact nor
control on all these elements. One level deeper in the organization, the commercial
division level, the strategic goals, mission vision and objectives already become more
tangible and controllable and have a more direct impact on the daily operation of KBC.
The strategic objectives of the commercial division are presented in its Business Plan
2015, which is partly deducted, or translated, from the objectives presented in Perform
2020. This document can be seen as a more “personalized” strategic document, having
division wide KPI’s, under the strategic terms of:
Win the customer
Move fast
Be the best team
Make the budget (Commercial Division Air France-KLM, 2015)
The precise strategic content and KPIs of the commercial division are not presented in
this research since they are too company specific and will therefore not help to
understand corporate L&D in general.
3.1.3 Mission, vision and strategy of KBC
On corporate L&D department level, KBC itself does also have tacit proof for the
existence of strategic objectives and formulated missions and visions. The elements of
these documents are partly deducted from the higher levels, but also generated
internally. Like Air France-KLM, also on KBC’s operational level the strategic content
elements can be dived in long- and short term. The strategic terms and content that is
explicitly found at KBC is presented in .

Management Information for corporate Learning and Development 33
Table 6.
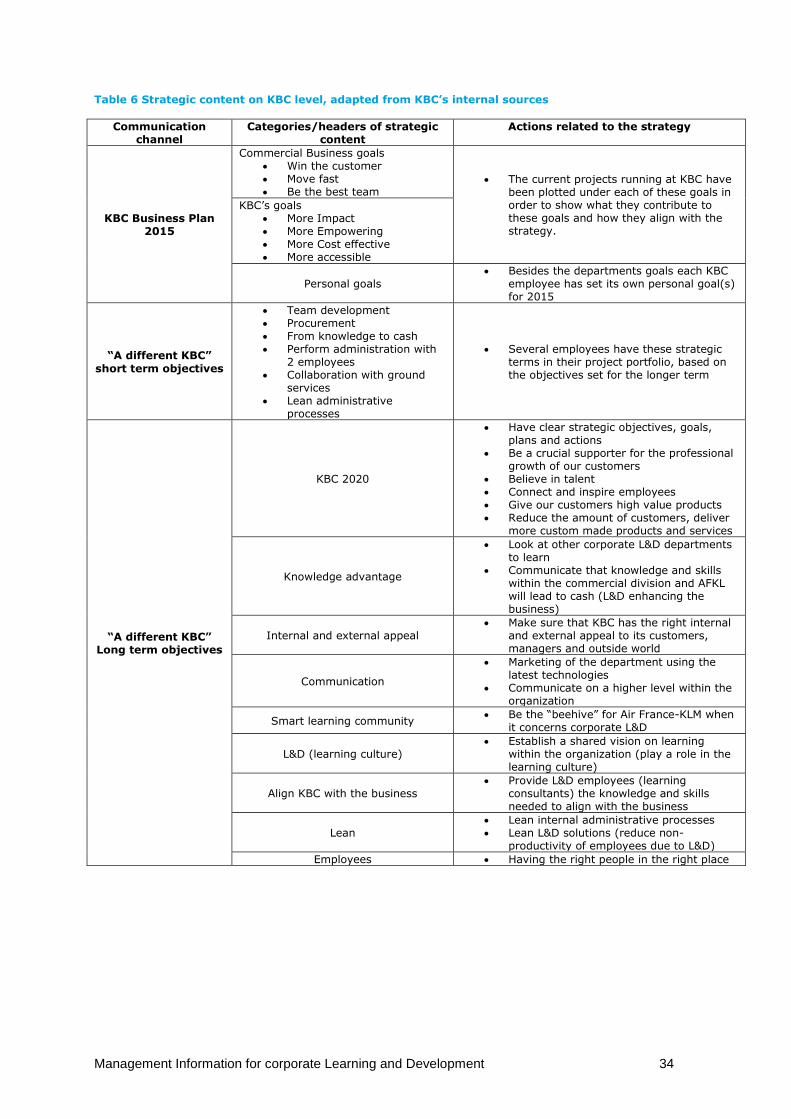
Management Information for corporate Learning and Development 34
Table 6 Strategic content on KBC level, adapted from KBC’s internal sources
Communication channel
Categories/headers of strategic content
Actions related to the strategy
KBC Business Plan 2015
Commercial Business goals Win the customer Move fast Be the best team
The current projects running at KBC have been plotted under each of these goals in order to show what they contribute to these goals and how they align with the strategy.
KBC’s goals More Impact More Empowering More Cost effective More accessible
Personal goals Besides the departments goals each KBC
employee has set its own personal goal(s) for 2015
“A different KBC”
short term objectives
Team development Procurement From knowledge to cash Perform administration with
2 employees Collaboration with ground
services Lean administrative
processes
Several employees have these strategic terms in their project portfolio, based on the objectives set for the longer term
“A different KBC” Long term objectives
KBC 2020
Have clear strategic objectives, goals, plans and actions
Be a crucial supporter for the professional growth of our customers
Believe in talent Connect and inspire employees Give our customers high value products Reduce the amount of customers, deliver
more custom made products and services
Knowledge advantage
Look at other corporate L&D departments to learn
Communicate that knowledge and skills within the commercial division and AFKL will lead to cash (L&D enhancing the business)
Internal and external appeal Make sure that KBC has the right internal
and external appeal to its customers, managers and outside world
Communication
Marketing of the department using the latest technologies
Communicate on a higher level within the organization
Smart learning community Be the “beehive” for Air France-KLM when
it concerns corporate L&D
L&D (learning culture) Establish a shared vision on learning
within the organization (play a role in the learning culture)
Align KBC with the business Provide L&D employees (learning
consultants) the knowledge and skills needed to align with the business
Lean Lean internal administrative processes Lean L&D solutions (reduce non-
productivity of employees due to L&D)
Employees Having the right people in the right place
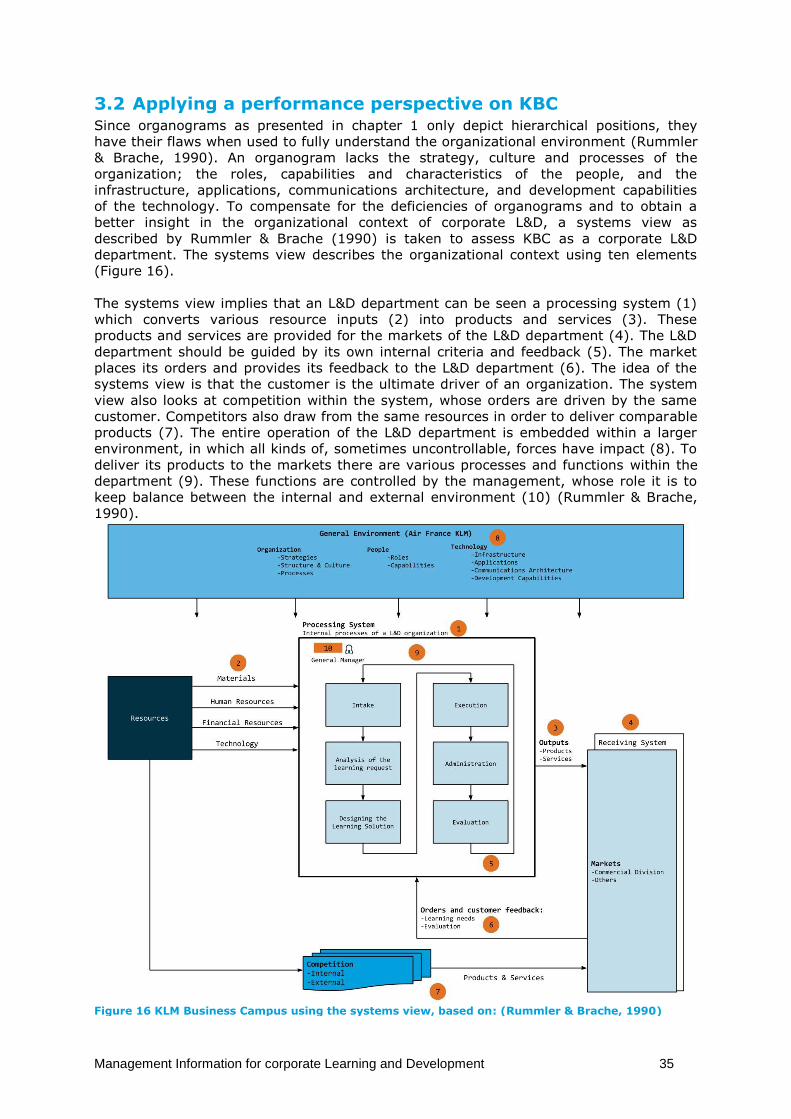
Management Information for corporate Learning and Development 35
3.2 Applying a performance perspective on KBC Since organograms as presented in chapter 1 only depict hierarchical positions, they
have their flaws when used to fully understand the organizational environment (Rummler
& Brache, 1990). An organogram lacks the strategy, culture and processes of the
organization; the roles, capabilities and characteristics of the people, and the
infrastructure, applications, communications architecture, and development capabilities
of the technology. To compensate for the deficiencies of organograms and to obtain a
better insight in the organizational context of corporate L&D, a systems view as
described by Rummler & Brache (1990) is taken to assess KBC as a corporate L&D
department. The systems view describes the organizational context using ten elements
(Figure 16).
The systems view implies that an L&D department can be seen a processing system (1)
which converts various resource inputs (2) into products and services (3). These
products and services are provided for the markets of the L&D department (4). The L&D
department should be guided by its own internal criteria and feedback (5). The market
places its orders and provides its feedback to the L&D department (6). The idea of the
systems view is that the customer is the ultimate driver of an organization. The system
view also looks at competition within the system, whose orders are driven by the same
customer. Competitors also draw from the same resources in order to deliver comparable
products (7). The entire operation of the L&D department is embedded within a larger
environment, in which all kinds of, sometimes uncontrollable, forces have impact (8). To
deliver its products to the markets there are various processes and functions within the
department (9). These functions are controlled by the management, whose role it is to
keep balance between the internal and external environment (10) (Rummler & Brache,
1990).
Figure 16 KLM Business Campus using the systems view, based on: (Rummler & Brache, 1990)
Management Information for corporate Learning and Development 36
This section briefly described the ten different elements of the systems view in relation to
corporate L&D. The upcoming sections describe KBC as corporate L&D department with
more detail, focusing on each of the ten elements (3.3 till 3.12). For this detailing of the
L&D department various sources are used. For each element KBC serves as a case
example. Where possible and appropriate the information is extended with theories or
other practices in order to become more relevant for corporate L&D in general.
3.3 See a corporate L&D department as a processing system This first step in the systems view is to see KBC as if it is an independent processing
system, operating within the Air France-KLM environment. This implies that for instance
the higher line management levels within the commercial division and AFKL and L&D
departments at other divisions within the company are not seen as part of KBC as L&D
department, but as part of the general environment or even as competition.
3.4 The resources of a corporate L&D department The resources, inputs, of an L&D department can be divided into four categories:
materials (3.4.1), human resources (3.4.2), financial resources (3.4.3) and technology
(3.4.4).
3.4.1 Materials
Material resources are used within the internal processes of the L&D department to
operate, and produce and deliver the outputs. In many cases there are external suppliers
for these material resources. The material resources can be divided according to the
value they deliver to the corporate L&D department, and the impact they have on L&D.
On the one hand there are material supplies for the daily operation of the L&D
department. These resources include for instance workspaces, computers, lunches and
office supplies. These kinds of material resources do not have a large impact on the
product outcomes of L&D but they are still needed to keep the corporate L&D department
running. On the other hand there are material supplies which are directly related to the
delivered products and services of the L&D department. These supplies, like tablet
computers to deliver the training content, classrooms and books used in the training,
have an impact on the final product and thus on the market. Therefore this latter
category of material resources and their quality has an influence on the corporate L&D
outcomes.
3.4.2 Human Resources
Employees, their skills, competences, knowledge, motivation and the time spend
working, form the major part of the human resources which an L&D department uses to
deliver its product to the market. The human resources therefore have a relative large
impact on the corporate L&D product outcomes. In the systems view people are seen as
the performers, each with his own role, tasks and responsibilities to run the business
(Rummler & Brache, 1990). The organization of human resources, as well as the role
descriptions, tasks responsibilities and capabilities of the performers differ per corporate
L&D department.
In order to deliver learning content which is aligned with the L&D needs of the business,
the teams involved in L&D are often multidisciplinary. A variety of skills, competences,
knowledge, expertise and disciplines (Table 7) are needed in order to deliver valuable
products.
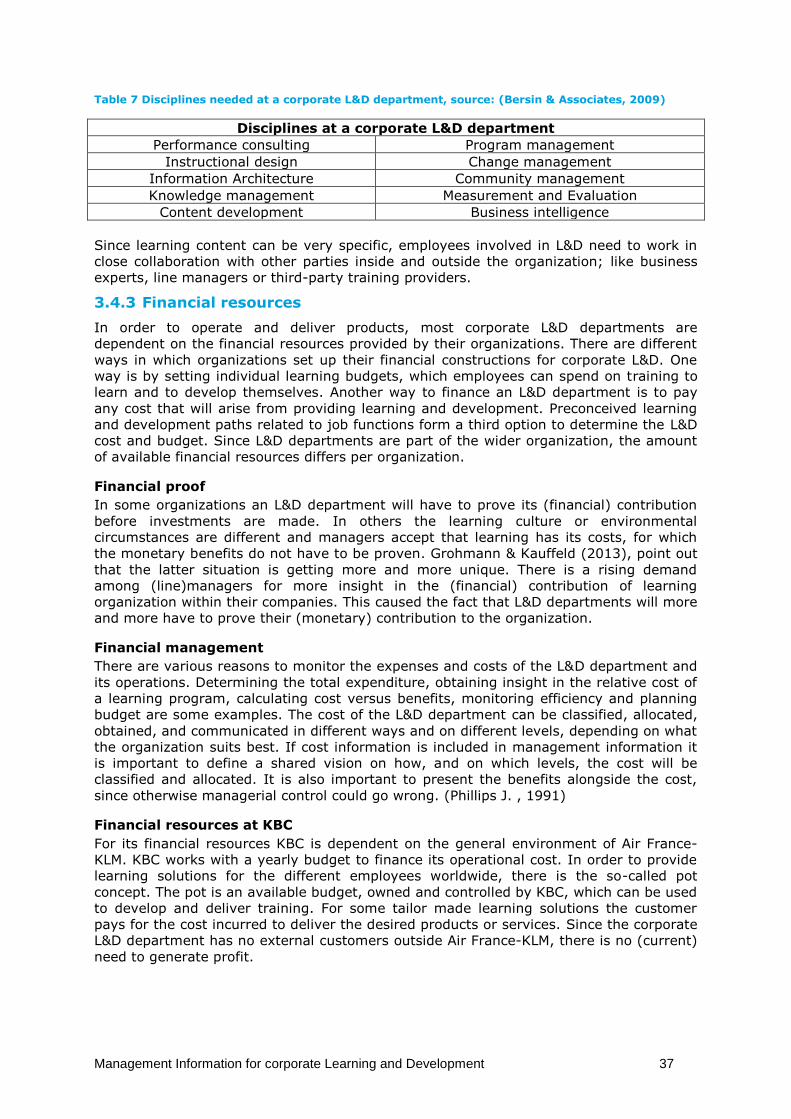
Management Information for corporate Learning and Development 37
Table 7 Disciplines needed at a corporate L&D department, source: (Bersin & Associates, 2009)
Disciplines at a corporate L&D department
Performance consulting Program management
Instructional design Change management
Information Architecture Community management
Knowledge management Measurement and Evaluation
Content development Business intelligence
Since learning content can be very specific, employees involved in L&D need to work in
close collaboration with other parties inside and outside the organization; like business
experts, line managers or third-party training providers.
3.4.3 Financial resources
In order to operate and deliver products, most corporate L&D departments are
dependent on the financial resources provided by their organizations. There are different
ways in which organizations set up their financial constructions for corporate L&D. One
way is by setting individual learning budgets, which employees can spend on training to
learn and to develop themselves. Another way to finance an L&D department is to pay
any cost that will arise from providing learning and development. Preconceived learning
and development paths related to job functions form a third option to determine the L&D
cost and budget. Since L&D departments are part of the wider organization, the amount
of available financial resources differs per organization.
Financial proof
In some organizations an L&D department will have to prove its (financial) contribution
before investments are made. In others the learning culture or environmental
circumstances are different and managers accept that learning has its costs, for which
the monetary benefits do not have to be proven. Grohmann & Kauffeld (2013), point out
that the latter situation is getting more and more unique. There is a rising demand
among (line)managers for more insight in the (financial) contribution of learning
organization within their companies. This caused the fact that L&D departments will more
and more have to prove their (monetary) contribution to the organization.
Financial management
There are various reasons to monitor the expenses and costs of the L&D department and
its operations. Determining the total expenditure, obtaining insight in the relative cost of
a learning program, calculating cost versus benefits, monitoring efficiency and planning
budget are some examples. The cost of the L&D department can be classified, allocated,
obtained, and communicated in different ways and on different levels, depending on what
the organization suits best. If cost information is included in management information it
is important to define a shared vision on how, and on which levels, the cost will be
classified and allocated. It is also important to present the benefits alongside the cost,
since otherwise managerial control could go wrong. (Phillips J. , 1991)
Financial resources at KBC
For its financial resources KBC is dependent on the general environment of Air France-
KLM. KBC works with a yearly budget to finance its operational cost. In order to provide
learning solutions for the different employees worldwide, there is the so-called pot
concept. The pot is an available budget, owned and controlled by KBC, which can be used
to develop and deliver training. For some tailor made learning solutions the customer
pays for the cost incurred to deliver the desired products or services. Since the corporate
L&D department has no external customers outside Air France-KLM, there is no (current)
need to generate profit.
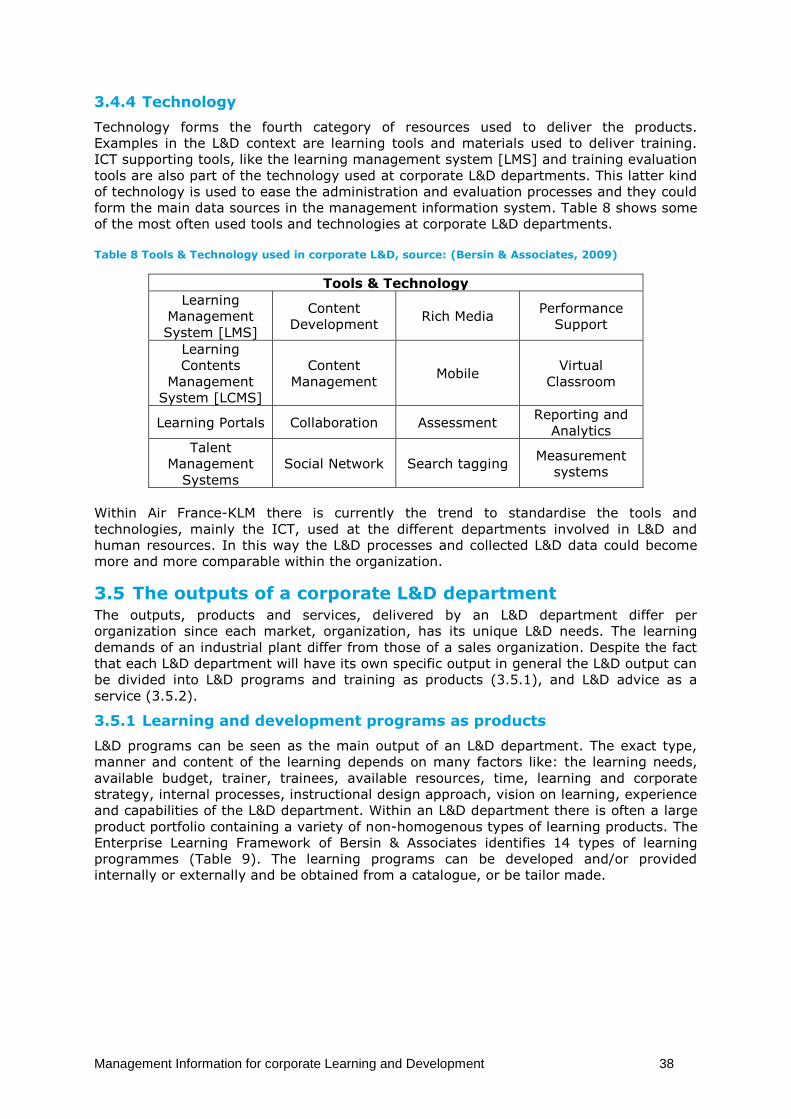
Management Information for corporate Learning and Development 38
3.4.4 Technology
Technology forms the fourth category of resources used to deliver the products.
Examples in the L&D context are learning tools and materials used to deliver training.
ICT supporting tools, like the learning management system [LMS] and training evaluation
tools are also part of the technology used at corporate L&D departments. This latter kind
of technology is used to ease the administration and evaluation processes and they could
form the main data sources in the management information system. Table 8 shows some
of the most often used tools and technologies at corporate L&D departments.
Table 8 Tools & Technology used in corporate L&D, source: (Bersin & Associates, 2009)
Tools & Technology
Learning
Management
System [LMS]
Content
Development Rich Media
Performance
Support
Learning
Contents
Management
System [LCMS]
Content
Management Mobile
Virtual
Classroom
Learning Portals Collaboration Assessment Reporting and
Analytics
Talent
Management
Systems
Social Network Search tagging Measurement
systems
Within Air France-KLM there is currently the trend to standardise the tools and
technologies, mainly the ICT, used at the different departments involved in L&D and
human resources. In this way the L&D processes and collected L&D data could become
more and more comparable within the organization.
3.5 The outputs of a corporate L&D department The outputs, products and services, delivered by an L&D department differ per
organization since each market, organization, has its unique L&D needs. The learning
demands of an industrial plant differ from those of a sales organization. Despite the fact
that each L&D department will have its own specific output in general the L&D output can
be divided into L&D programs and training as products (3.5.1), and L&D advice as a
service (3.5.2).
3.5.1 Learning and development programs as products
L&D programs can be seen as the main output of an L&D department. The exact type,
manner and content of the learning depends on many factors like: the learning needs,
available budget, trainer, trainees, available resources, time, learning and corporate
strategy, internal processes, instructional design approach, vision on learning, experience
and capabilities of the L&D department. Within an L&D department there is often a large
product portfolio containing a variety of non-homogenous types of learning products. The
Enterprise Learning Framework of Bersin & Associates identifies 14 types of learning
programmes (Table 9). The learning programs can be developed and/or provided
internally or externally and be obtained from a catalogue, or be tailor made.
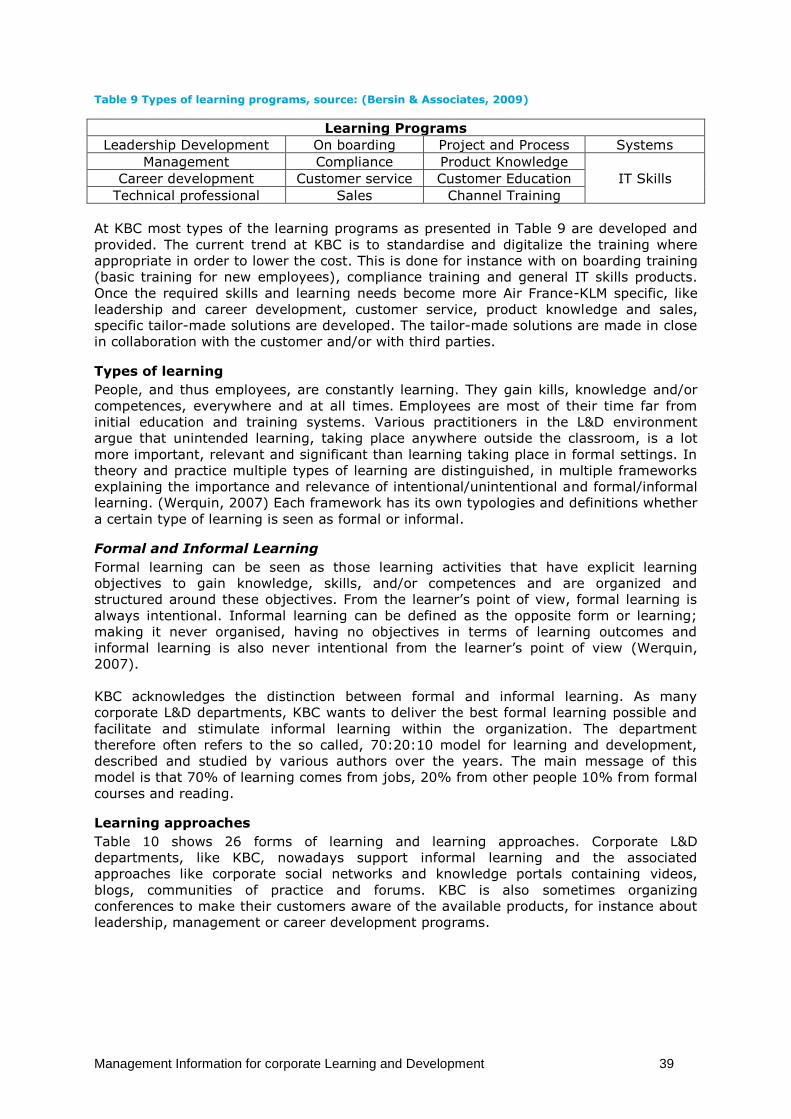
Management Information for corporate Learning and Development 39
Table 9 Types of learning programs, source: (Bersin & Associates, 2009)
Learning Programs
Leadership Development On boarding Project and Process Systems
Management Compliance Product Knowledge
IT Skills Career development Customer service Customer Education
Technical professional Sales Channel Training
At KBC most types of the learning programs as presented in Table 9 are developed and
provided. The current trend at KBC is to standardise and digitalize the training where
appropriate in order to lower the cost. This is done for instance with on boarding training
(basic training for new employees), compliance training and general IT skills products.
Once the required skills and learning needs become more Air France-KLM specific, like
leadership and career development, customer service, product knowledge and sales,
specific tailor-made solutions are developed. The tailor-made solutions are made in close
in collaboration with the customer and/or with third parties.
Types of learning
People, and thus employees, are constantly learning. They gain kills, knowledge and/or
competences, everywhere and at all times. Employees are most of their time far from
initial education and training systems. Various practitioners in the L&D environment
argue that unintended learning, taking place anywhere outside the classroom, is a lot
more important, relevant and significant than learning taking place in formal settings. In
theory and practice multiple types of learning are distinguished, in multiple frameworks
explaining the importance and relevance of intentional/unintentional and formal/informal
learning. (Werquin, 2007) Each framework has its own typologies and definitions whether
a certain type of learning is seen as formal or informal.
Formal and Informal Learning
Formal learning can be seen as those learning activities that have explicit learning
objectives to gain knowledge, skills, and/or competences and are organized and
structured around these objectives. From the learner’s point of view, formal learning is
always intentional. Informal learning can be defined as the opposite form or learning;
making it never organised, having no objectives in terms of learning outcomes and
informal learning is also never intentional from the learner’s point of view (Werquin,
2007).
KBC acknowledges the distinction between formal and informal learning. As many
corporate L&D departments, KBC wants to deliver the best formal learning possible and
facilitate and stimulate informal learning within the organization. The department
therefore often refers to the so called, 70:20:10 model for learning and development,
described and studied by various authors over the years. The main message of this
model is that 70% of learning comes from jobs, 20% from other people 10% from formal
courses and reading.
Learning approaches
Table 10 shows 26 forms of learning and learning approaches. Corporate L&D
departments, like KBC, nowadays support informal learning and the associated
approaches like corporate social networks and knowledge portals containing videos,
blogs, communities of practice and forums. KBC is also sometimes organizing
conferences to make their customers aware of the available products, for instance about
leadership, management or career development programs.
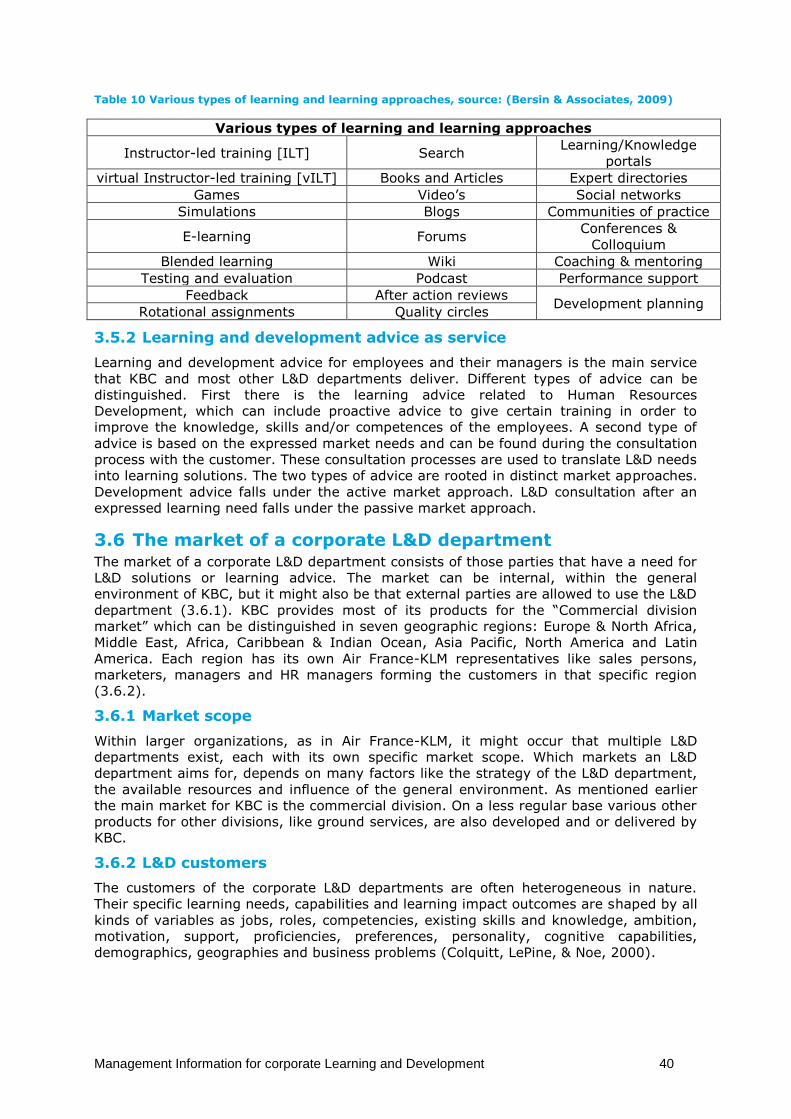
Management Information for corporate Learning and Development 40
Table 10 Various types of learning and learning approaches, source: (Bersin & Associates, 2009)
Various types of learning and learning approaches
Instructor-led training [ILT] Search Learning/Knowledge
portals
virtual Instructor-led training [vILT] Books and Articles Expert directories
Games Video’s Social networks
Simulations Blogs Communities of practice
E-learning Forums Conferences &
Colloquium
Blended learning Wiki Coaching & mentoring
Testing and evaluation Podcast Performance support
Feedback After action reviews Development planning
Rotational assignments Quality circles
3.5.2 Learning and development advice as service
Learning and development advice for employees and their managers is the main service
that KBC and most other L&D departments deliver. Different types of advice can be
distinguished. First there is the learning advice related to Human Resources
Development, which can include proactive advice to give certain training in order to
improve the knowledge, skills and/or competences of the employees. A second type of
advice is based on the expressed market needs and can be found during the consultation
process with the customer. These consultation processes are used to translate L&D needs
into learning solutions. The two types of advice are rooted in distinct market approaches.
Development advice falls under the active market approach. L&D consultation after an
expressed learning need falls under the passive market approach.
3.6 The market of a corporate L&D department The market of a corporate L&D department consists of those parties that have a need for
L&D solutions or learning advice. The market can be internal, within the general
environment of KBC, but it might also be that external parties are allowed to use the L&D
department (3.6.1). KBC provides most of its products for the “Commercial division
market” which can be distinguished in seven geographic regions: Europe & North Africa,
Middle East, Africa, Caribbean & Indian Ocean, Asia Pacific, North America and Latin
America. Each region has its own Air France-KLM representatives like sales persons,
marketers, managers and HR managers forming the customers in that specific region
(3.6.2).
3.6.1 Market scope
Within larger organizations, as in Air France-KLM, it might occur that multiple L&D
departments exist, each with its own specific market scope. Which markets an L&D
department aims for, depends on many factors like the strategy of the L&D department,
the available resources and influence of the general environment. As mentioned earlier
the main market for KBC is the commercial division. On a less regular base various other
products for other divisions, like ground services, are also developed and or delivered by
KBC.
3.6.2 L&D customers
The customers of the corporate L&D departments are often heterogeneous in nature.
Their specific learning needs, capabilities and learning impact outcomes are shaped by all
kinds of variables as jobs, roles, competencies, existing skills and knowledge, ambition,
motivation, support, proficiencies, preferences, personality, cognitive capabilities,
demographics, geographies and business problems (Colquitt, LePine, & Noe, 2000).
Management Information for corporate Learning and Development 41
3.7 The internal feedback within a corporate L&D department The internal feedback mechanisms and performance criteria form a guideline for
evaluation on how a department, like the corporate L&D department, is performing. It
provides insight in how well the internal processes are operated in terms of efficiency,
effectiveness, accuracy and alignment. Internal feedback should first of all evaluate how
well the products were delivered to market, how they were received by the customers
and how well they fitted their needs. The information needed for this feedback is related
to training evaluation, which is described under customer feedback in the upcoming
section. Besides training evaluation it is also important to review how efficient and
effective the given resources were transformed into the products and services. Finally,
internal feedback could also be used to compare the internal performance vis-a-vis
competitors.
At KBC several internal feedback mechanisms exist in which knowledge and/or lessons
learned from the various projects are shared among the employees within the
department or within the organization. For this purpose the corporate social network, I-
share, is commonly used.
3.8 The market needs and customer feedback of a corporate
L&D department The markets served by the corporate L&D department have their specific L&D needs.
How these needs occur and how an L&D department identifies these is discussed first
(3.8.1 and 3.8.2). After the occurrence of needs and the delivery of the products and
services customers provide feedback towards the department (3.8.3), mainly in the form
of training evaluation (3.8.4).
3.8.1 Learning and development needs and how they occur
From the systems perspective each employee is seen as a performer. The performance of
the employees is influenced by many factors. One group of factors is formed by the
knowledge skills and competences of an employee needed to achieve his/her job goals.
The purpose of training is often to enhance the knowledge and skills, ultimately resulting
in better performance. The need for training therefore often occurs when managers, or
employees themselves, think or feel that there is a gap between existing and needed
competences, knowledge and/or skills. The need for training might also arise if people
see the potential of a certain program that could enhance their performance. For
managers, employees and the corporate L&D department it is important to realize that
the systems perspective sees training only as a single alternative for performance
improvement. This is because the perspective argues that many other factors, like the
process design and job goals, also influence performance (Rummler & Brache, 1990).
3.8.2 Identification of learning and development needs
The market needs for corporate L&D exist within the employees of the organization. It is
often the responsibility of managers to identify these L&D needs of their employees.
Once they have an identification of their needs they could go to the corporate L&D
department and see whether and how their needs can be served (Malone, 1997). If an
L&D department works in this way it is reactively serving its market. In this approach the
L&D department assumes that its market is aware of their learning and development
needs and otherwise they have to accept that it can miss potential customers. If the
market is not aware of its needs, which is often the case in the context of L&D, or not
aware about what the corporate L&D department has to offer, a proactive market
approach might work better (Rummler & Brache, 1990). KBC operates using both a
reactive as well as a proactive market approach.
Reactive approach
If an L&D department reacts on a request for training it should, according to Rummler &
Brache, realize that the requester often has not conducted a thorough analysis and might
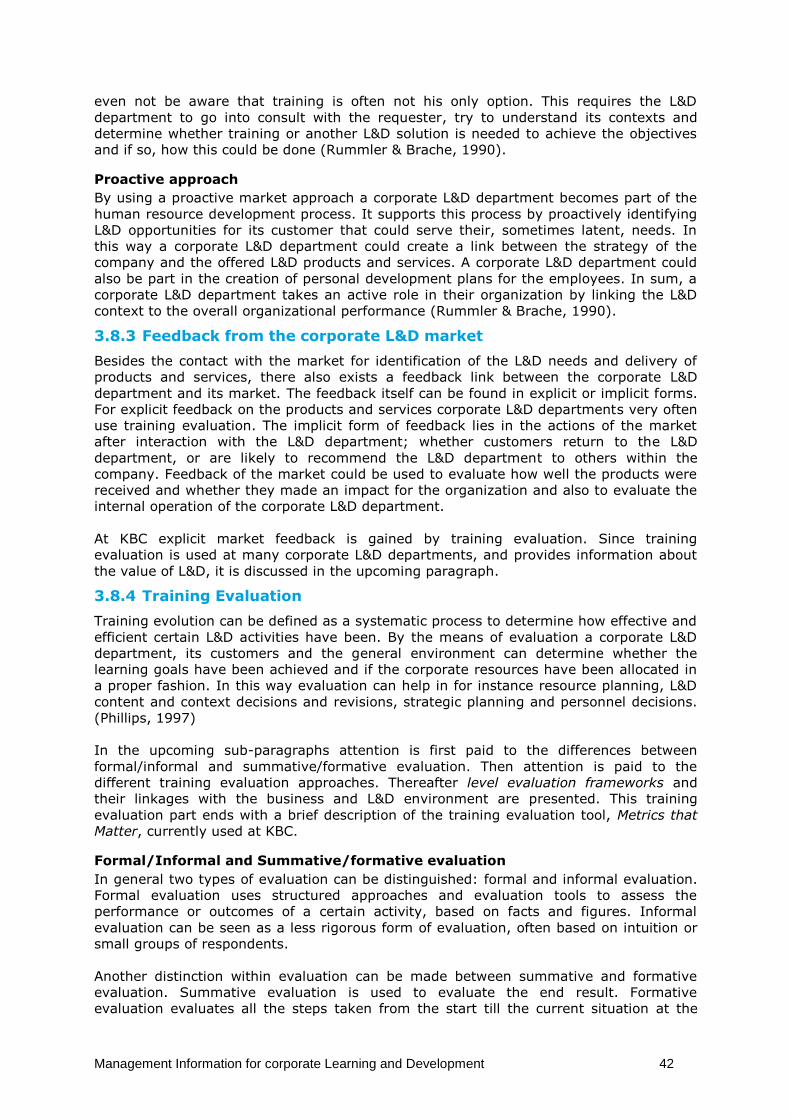
Management Information for corporate Learning and Development 42
even not be aware that training is often not his only option. This requires the L&D
department to go into consult with the requester, try to understand its contexts and
determine whether training or another L&D solution is needed to achieve the objectives
and if so, how this could be done (Rummler & Brache, 1990).
Proactive approach
By using a proactive market approach a corporate L&D department becomes part of the
human resource development process. It supports this process by proactively identifying
L&D opportunities for its customer that could serve their, sometimes latent, needs. In
this way a corporate L&D department could create a link between the strategy of the
company and the offered L&D products and services. A corporate L&D department could
also be part in the creation of personal development plans for the employees. In sum, a
corporate L&D department takes an active role in their organization by linking the L&D
context to the overall organizational performance (Rummler & Brache, 1990).
3.8.3 Feedback from the corporate L&D market
Besides the contact with the market for identification of the L&D needs and delivery of
products and services, there also exists a feedback link between the corporate L&D
department and its market. The feedback itself can be found in explicit or implicit forms.
For explicit feedback on the products and services corporate L&D departments very often
use training evaluation. The implicit form of feedback lies in the actions of the market
after interaction with the L&D department; whether customers return to the L&D
department, or are likely to recommend the L&D department to others within the
company. Feedback of the market could be used to evaluate how well the products were
received and whether they made an impact for the organization and also to evaluate the
internal operation of the corporate L&D department.
At KBC explicit market feedback is gained by training evaluation. Since training
evaluation is used at many corporate L&D departments, and provides information about
the value of L&D, it is discussed in the upcoming paragraph.
3.8.4 Training Evaluation
Training evolution can be defined as a systematic process to determine how effective and
efficient certain L&D activities have been. By the means of evaluation a corporate L&D
department, its customers and the general environment can determine whether the
learning goals have been achieved and if the corporate resources have been allocated in
a proper fashion. In this way evaluation can help in for instance resource planning, L&D
content and context decisions and revisions, strategic planning and personnel decisions.
(Phillips, 1997)
In the upcoming sub-paragraphs attention is first paid to the differences between
formal/informal and summative/formative evaluation. Then attention is paid to the
different training evaluation approaches. Thereafter level evaluation frameworks and
their linkages with the business and L&D environment are presented. This training
evaluation part ends with a brief description of the training evaluation tool, Metrics that
Matter, currently used at KBC.
Formal/Informal and Summative/formative evaluation
In general two types of evaluation can be distinguished: formal and informal evaluation.
Formal evaluation uses structured approaches and evaluation tools to assess the
performance or outcomes of a certain activity, based on facts and figures. Informal
evaluation can be seen as a less rigorous form of evaluation, often based on intuition or
small groups of respondents.
Another distinction within evaluation can be made between summative and formative
evaluation. Summative evaluation is used to evaluate the end result. Formative
evaluation evaluates all the steps taken from the start till the current situation at the
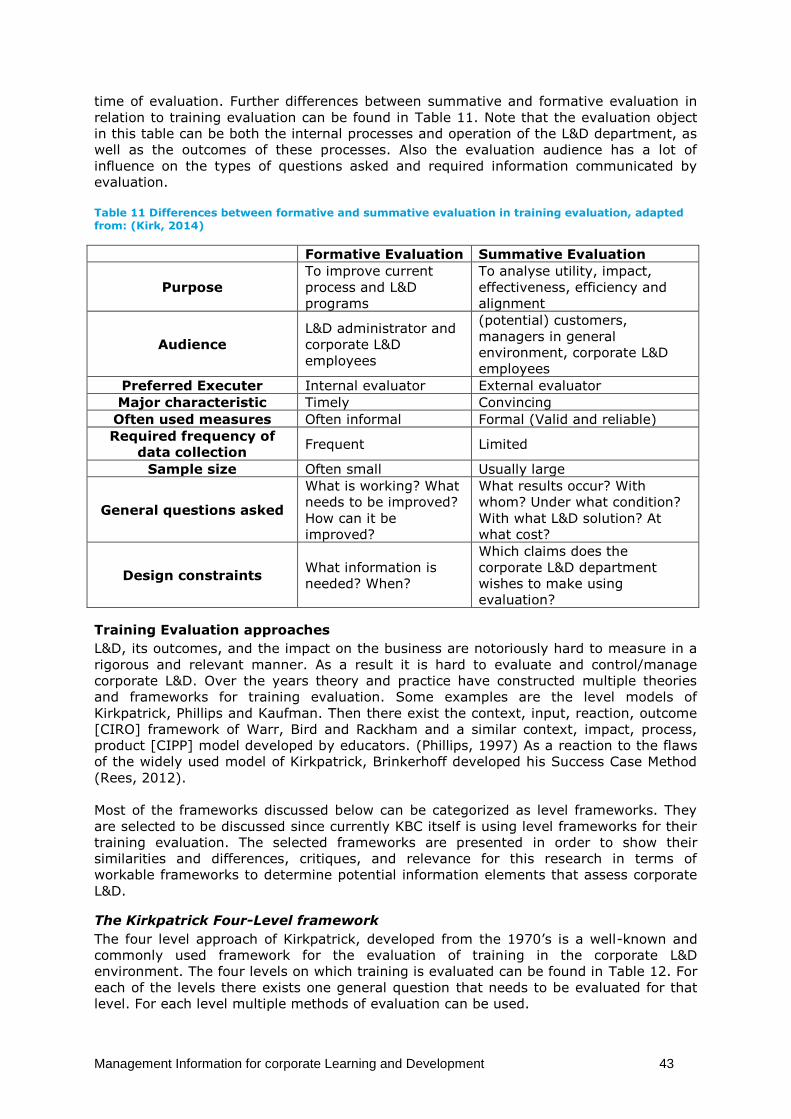
Management Information for corporate Learning and Development 43
time of evaluation. Further differences between summative and formative evaluation in
relation to training evaluation can be found in Table 11. Note that the evaluation object
in this table can be both the internal processes and operation of the L&D department, as
well as the outcomes of these processes. Also the evaluation audience has a lot of
influence on the types of questions asked and required information communicated by
evaluation.
Table 11 Differences between formative and summative evaluation in training evaluation, adapted from: (Kirk, 2014)
Formative Evaluation Summative Evaluation
Purpose
To improve current
process and L&D
programs
To analyse utility, impact,
effectiveness, efficiency and
alignment
Audience
L&D administrator and
corporate L&D
employees
(potential) customers,
managers in general
environment, corporate L&D
employees
Preferred Executer Internal evaluator External evaluator
Major characteristic Timely Convincing
Often used measures Often informal Formal (Valid and reliable)
Required frequency of
data collection Frequent Limited
Sample size Often small Usually large
General questions asked
What is working? What
needs to be improved?
How can it be
improved?
What results occur? With
whom? Under what condition?
With what L&D solution? At
what cost?
Design constraints What information is
needed? When?
Which claims does the
corporate L&D department
wishes to make using
evaluation?
Training Evaluation approaches
L&D, its outcomes, and the impact on the business are notoriously hard to measure in a
rigorous and relevant manner. As a result it is hard to evaluate and control/manage
corporate L&D. Over the years theory and practice have constructed multiple theories
and frameworks for training evaluation. Some examples are the level models of
Kirkpatrick, Phillips and Kaufman. Then there exist the context, input, reaction, outcome
[CIRO] framework of Warr, Bird and Rackham and a similar context, impact, process,
product [CIPP] model developed by educators. (Phillips, 1997) As a reaction to the flaws
of the widely used model of Kirkpatrick, Brinkerhoff developed his Success Case Method
(Rees, 2012).
Most of the frameworks discussed below can be categorized as level frameworks. They
are selected to be discussed since currently KBC itself is using level frameworks for their
training evaluation. The selected frameworks are presented in order to show their
similarities and differences, critiques, and relevance for this research in terms of
workable frameworks to determine potential information elements that assess corporate
L&D.
The Kirkpatrick Four-Level framework
The four level approach of Kirkpatrick, developed from the 1970’s is a well-known and
commonly used framework for the evaluation of training in the corporate L&D
environment. The four levels on which training is evaluated can be found in Table 12. For
each of the levels there exists one general question that needs to be evaluated for that
level. For each level multiple methods of evaluation can be used.
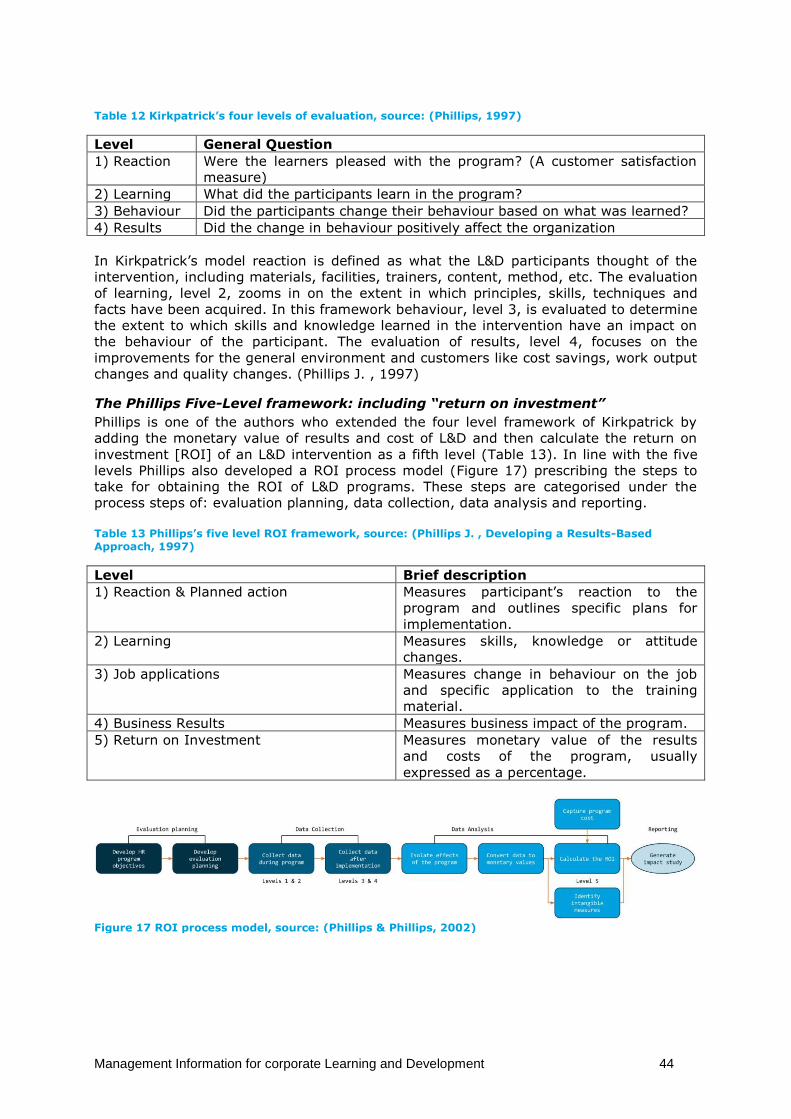
Management Information for corporate Learning and Development 44
Table 12 Kirkpatrick’s four levels of evaluation, source: (Phillips, 1997)
Level General Question
1) Reaction Were the learners pleased with the program? (A customer satisfaction
measure)
2) Learning What did the participants learn in the program?
3) Behaviour Did the participants change their behaviour based on what was learned?
4) Results Did the change in behaviour positively affect the organization
In Kirkpatrick’s model reaction is defined as what the L&D participants thought of the
intervention, including materials, facilities, trainers, content, method, etc. The evaluation
of learning, level 2, zooms in on the extent in which principles, skills, techniques and
facts have been acquired. In this framework behaviour, level 3, is evaluated to determine
the extent to which skills and knowledge learned in the intervention have an impact on
the behaviour of the participant. The evaluation of results, level 4, focuses on the
improvements for the general environment and customers like cost savings, work output
changes and quality changes. (Phillips J. , 1997)
The Phillips Five-Level framework: including “return on investment”
Phillips is one of the authors who extended the four level framework of Kirkpatrick by
adding the monetary value of results and cost of L&D and then calculate the return on
investment [ROI] of an L&D intervention as a fifth level (Table 13). In line with the five
levels Phillips also developed a ROI process model (Figure 17) prescribing the steps to
take for obtaining the ROI of L&D programs. These steps are categorised under the
process steps of: evaluation planning, data collection, data analysis and reporting.
Table 13 Phillips’s five level ROI framework, source: (Phillips J. , Developing a Results-Based Approach, 1997)
Level Brief description
1) Reaction & Planned action Measures participant’s reaction to the
program and outlines specific plans for
implementation.
2) Learning Measures skills, knowledge or attitude
changes.
3) Job applications Measures change in behaviour on the job
and specific application to the training
material.
4) Business Results Measures business impact of the program.
5) Return on Investment Measures monetary value of the results
and costs of the program, usually
expressed as a percentage.
Figure 17 ROI process model, source: (Phillips & Phillips, 2002)
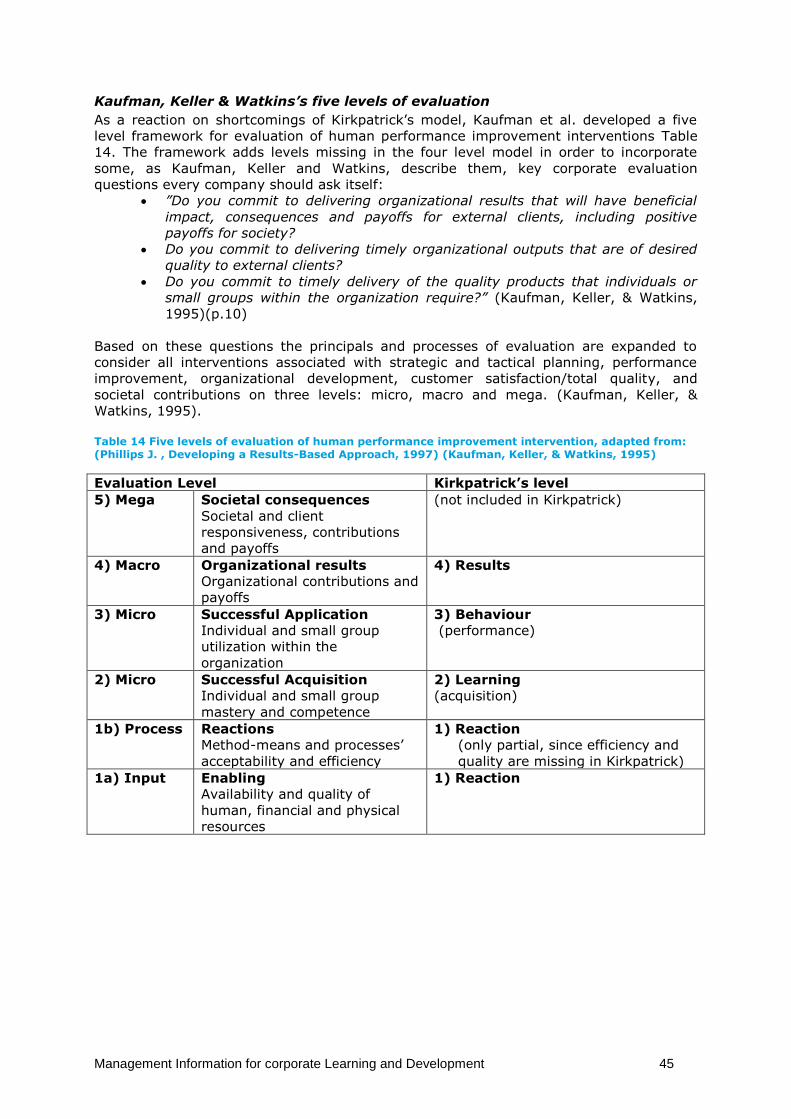
Management Information for corporate Learning and Development 45
Kaufman, Keller & Watkins’s five levels of evaluation
As a reaction on shortcomings of Kirkpatrick’s model, Kaufman et al. developed a five
level framework for evaluation of human performance improvement interventions Table
14. The framework adds levels missing in the four level model in order to incorporate
some, as Kaufman, Keller and Watkins, describe them, key corporate evaluation
questions every company should ask itself:
”Do you commit to delivering organizational results that will have beneficial
impact, consequences and payoffs for external clients, including positive
payoffs for society?
Do you commit to delivering timely organizational outputs that are of desired
quality to external clients?
Do you commit to timely delivery of the quality products that individuals or
small groups within the organization require?” (Kaufman, Keller, & Watkins,
1995)(p.10)
Based on these questions the principals and processes of evaluation are expanded to
consider all interventions associated with strategic and tactical planning, performance
improvement, organizational development, customer satisfaction/total quality, and
societal contributions on three levels: micro, macro and mega. (Kaufman, Keller, &
Watkins, 1995).
Table 14 Five levels of evaluation of human performance improvement intervention, adapted from: (Phillips J. , Developing a Results-Based Approach, 1997) (Kaufman, Keller, & Watkins, 1995)
Evaluation Level Kirkpatrick’s level
5) Mega Societal consequences
Societal and client
responsiveness, contributions
and payoffs
(not included in Kirkpatrick)
4) Macro Organizational results
Organizational contributions and
payoffs
4) Results
3) Micro Successful Application
Individual and small group
utilization within the
organization
3) Behaviour
(performance)
2) Micro Successful Acquisition
Individual and small group
mastery and competence
2) Learning
(acquisition)
1b) Process Reactions
Method-means and processes’
acceptability and efficiency
1) Reaction
(only partial, since efficiency and
quality are missing in Kirkpatrick)
1a) Input Enabling
Availability and quality of
human, financial and physical
resources
1) Reaction
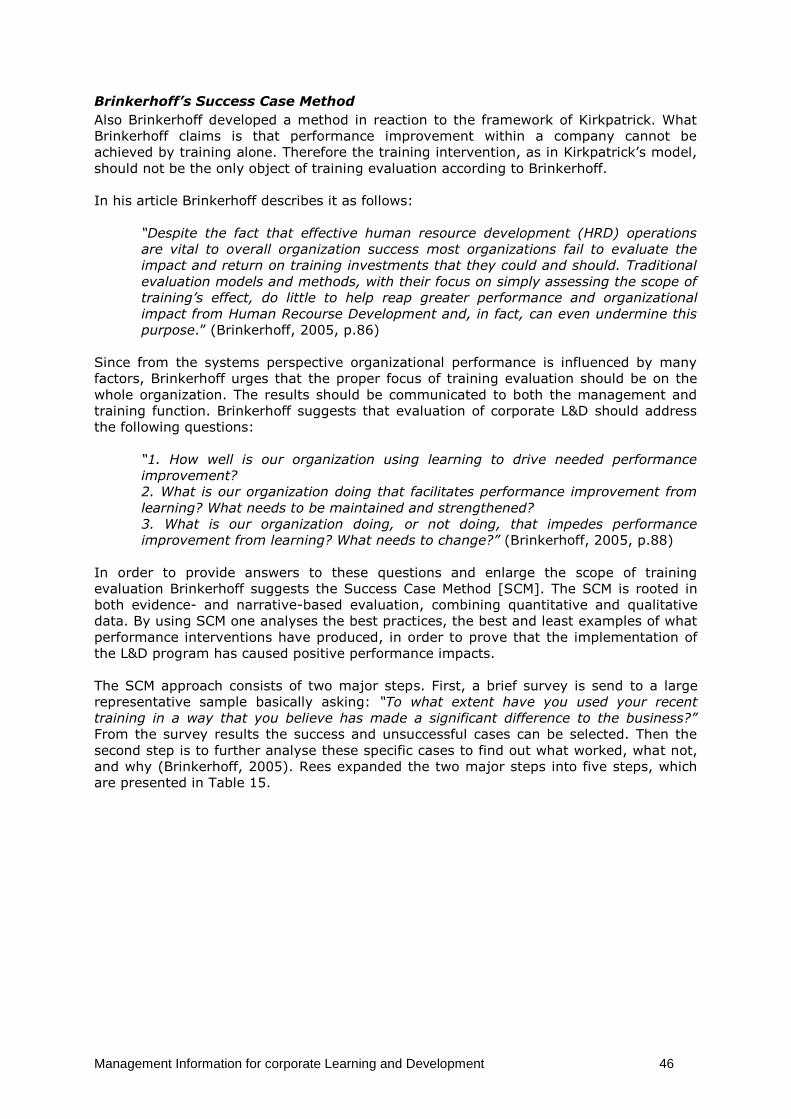
Management Information for corporate Learning and Development 46
Brinkerhoff’s Success Case Method
Also Brinkerhoff developed a method in reaction to the framework of Kirkpatrick. What
Brinkerhoff claims is that performance improvement within a company cannot be
achieved by training alone. Therefore the training intervention, as in Kirkpatrick’s model,
should not be the only object of training evaluation according to Brinkerhoff.
In his article Brinkerhoff describes it as follows:
“Despite the fact that effective human resource development (HRD) operations
are vital to overall organization success most organizations fail to evaluate the
impact and return on training investments that they could and should. Traditional
evaluation models and methods, with their focus on simply assessing the scope of
training’s effect, do little to help reap greater performance and organizational
impact from Human Recourse Development and, in fact, can even undermine this
purpose.” (Brinkerhoff, 2005, p.86)
Since from the systems perspective organizational performance is influenced by many
factors, Brinkerhoff urges that the proper focus of training evaluation should be on the
whole organization. The results should be communicated to both the management and
training function. Brinkerhoff suggests that evaluation of corporate L&D should address
the following questions:
“1. How well is our organization using learning to drive needed performance
improvement?
2. What is our organization doing that facilitates performance improvement from
learning? What needs to be maintained and strengthened?
3. What is our organization doing, or not doing, that impedes performance
improvement from learning? What needs to change?” (Brinkerhoff, 2005, p.88)
In order to provide answers to these questions and enlarge the scope of training
evaluation Brinkerhoff suggests the Success Case Method [SCM]. The SCM is rooted in
both evidence- and narrative-based evaluation, combining quantitative and qualitative
data. By using SCM one analyses the best practices, the best and least examples of what
performance interventions have produced, in order to prove that the implementation of
the L&D program has caused positive performance impacts.
The SCM approach consists of two major steps. First, a brief survey is send to a large
representative sample basically asking: “To what extent have you used your recent
training in a way that you believe has made a significant difference to the business?”
From the survey results the success and unsuccessful cases can be selected. Then the
second step is to further analyse these specific cases to find out what worked, what not,
and why (Brinkerhoff, 2005). Rees expanded the two major steps into five steps, which
are presented in Table 15.
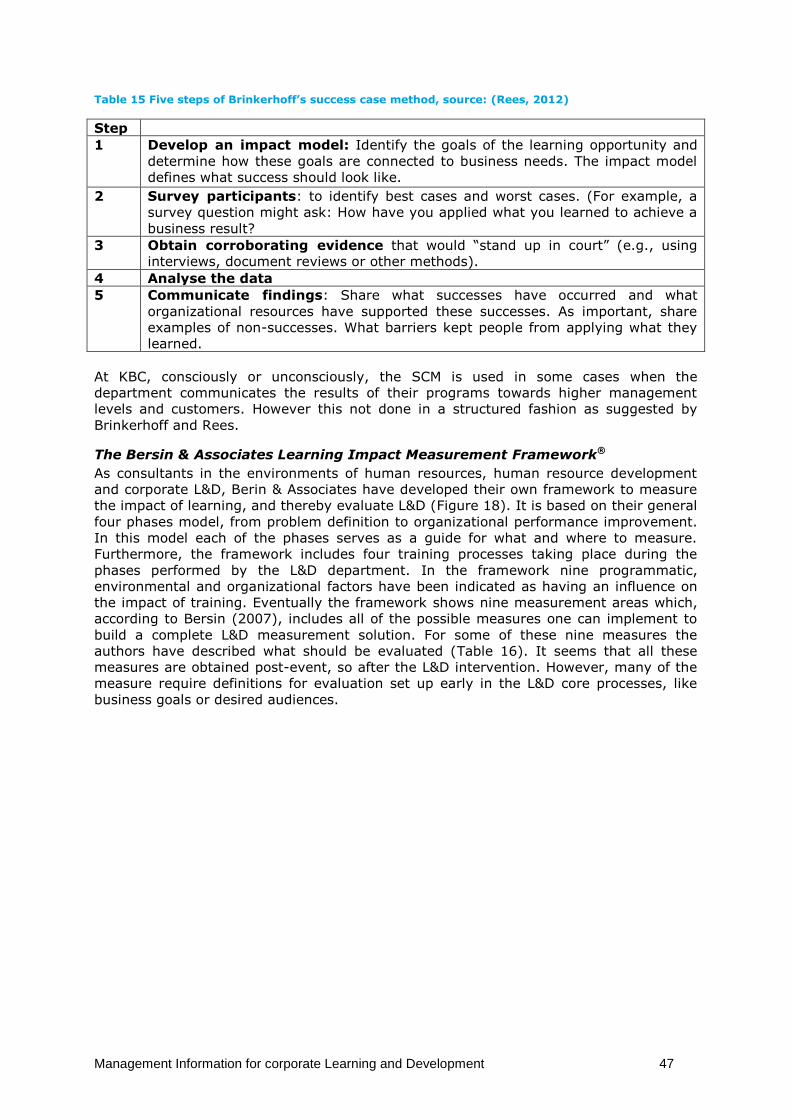
Management Information for corporate Learning and Development 47
Table 15 Five steps of Brinkerhoff’s success case method, source: (Rees, 2012)
Step
1 Develop an impact model: Identify the goals of the learning opportunity and
determine how these goals are connected to business needs. The impact model
defines what success should look like.
2 Survey participants: to identify best cases and worst cases. (For example, a
survey question might ask: How have you applied what you learned to achieve a
business result?
3 Obtain corroborating evidence that would “stand up in court” (e.g., using
interviews, document reviews or other methods).
4 Analyse the data
5 Communicate findings: Share what successes have occurred and what
organizational resources have supported these successes. As important, share
examples of non-successes. What barriers kept people from applying what they
learned.
At KBC, consciously or unconsciously, the SCM is used in some cases when the
department communicates the results of their programs towards higher management
levels and customers. However this not done in a structured fashion as suggested by
Brinkerhoff and Rees.
The Bersin & Associates Learning Impact Measurement Framework®
As consultants in the environments of human resources, human resource development
and corporate L&D, Berin & Associates have developed their own framework to measure
the impact of learning, and thereby evaluate L&D (Figure 18). It is based on their general
four phases model, from problem definition to organizational performance improvement.
In this model each of the phases serves as a guide for what and where to measure.
Furthermore, the framework includes four training processes taking place during the
phases performed by the L&D department. In the framework nine programmatic,
environmental and organizational factors have been indicated as having an influence on
the impact of training. Eventually the framework shows nine measurement areas which,
according to Bersin (2007), includes all of the possible measures one can implement to
build a complete L&D measurement solution. For some of these nine measures the
authors have described what should be evaluated (Table 16). It seems that all these
measures are obtained post-event, so after the L&D intervention. However, many of the
measure require definitions for evaluation set up early in the L&D core processes, like
business goals or desired audiences.
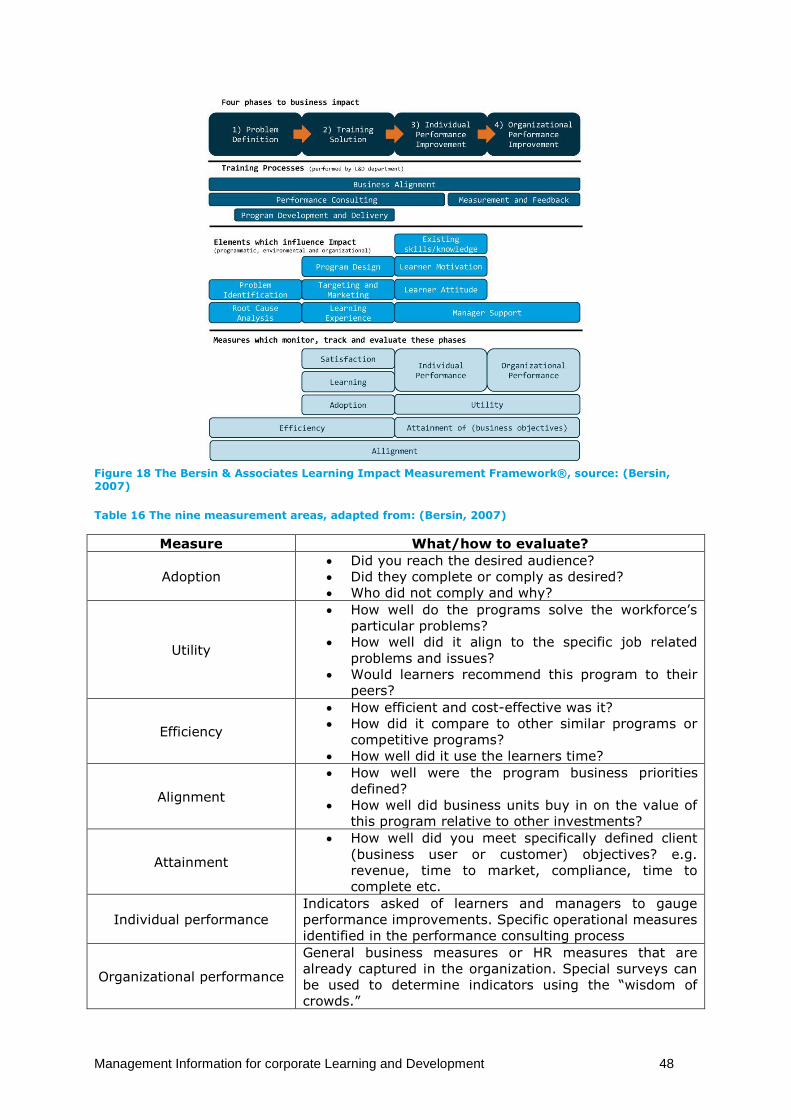
Management Information for corporate Learning and Development 48
Figure 18 The Bersin & Associates Learning Impact Measurement Framework®, source: (Bersin, 2007)
Table 16 The nine measurement areas, adapted from: (Bersin, 2007)
Measure What/how to evaluate?
Adoption
Did you reach the desired audience?
Did they complete or comply as desired?
Who did not comply and why?
Utility
How well do the programs solve the workforce’s
particular problems?
How well did it align to the specific job related
problems and issues?
Would learners recommend this program to their
peers?
Efficiency
How efficient and cost-effective was it?
How did it compare to other similar programs or
competitive programs?
How well did it use the learners time?
Alignment
How well were the program business priorities
defined?
How well did business units buy in on the value of
this program relative to other investments?
Attainment
How well did you meet specifically defined client
(business user or customer) objectives? e.g.
revenue, time to market, compliance, time to
complete etc.
Individual performance
Indicators asked of learners and managers to gauge
performance improvements. Specific operational measures
identified in the performance consulting process
Organizational performance
General business measures or HR measures that are
already captured in the organization. Special surveys can
be used to determine indicators using the “wisdom of
crowds.”
Management Information for corporate Learning and Development 49
Linking training evaluation to the Business and L&D environments
During the interviews used for the cross-case analysis one representative of a corporate
learning and development department explained, in a v-model framework, the linkage
between the operations of their businesses (on general and L&D level) and the evaluation
of training. For the latter the interviewed L&D department used a five level evaluation
model. The model, depicting the described framework, was drawn by the representative
during the interview and is presented in Figure 19. Below the figure the framework is
briefly explained and some comments are given, using the information from the
interview.
Figure 19 Linking training evaluation and Business L&D operation
The explanation of the v-model starts at the intervention level. On this level the L&D
solution/learning intervention takes place. As described above, these interventions can
be evaluated using different levels, presented on the right-hand side of the v-model. The
lowest two levels evaluate the intervention/training itself, levels 3 and 4 evaluate the
impact of the intervention on the business performance. On level 5, ROI, one should
decide whether the costs of conducting a ROI study outweigh the benefits of being able
to present the monetary benefits.
On the left-hand side of the model the business and L&D operations are presented, linked
to the levels of evaluation. In these operations two domains, L&D and business, can be
distinguished. According to the interviewed representative it should be the task of the
corporate L&D department to design and arrange everything to deliver the right
interventions. However, in order to be able to deliver the right interventions, those that
have an impact on business performance, it is the task of the business to communicate
their business performance needs, and the lack of skills, knowledge and competences
they face in order to satisfy these performance needs.
The cause for most of the difficulties faced by many corporate L&D departments lies in
the interaction between the business and L&D domain. Often the managers and
employees in the two domains have different priorities, focuses, roles, and
understandings of the current situation. Also different kinds of expertise and
accompanying business languages are of importance at the two domains: business is
focused on profit, L&D on well-designed interventions. The conspiracy of convenience,
described by Jennings (2010), helps to understand the problems occurring at the melting
point of these two domains (Appendix IV). It is however at the same melting point of
L&D and business, in which the corporate L&D department can play its most valuable
role: translating the business performance needs into the right products (intervention or
advice) in order to enhance skills, competences and knowledge needed to improve the
performance of the company (Jennings, 2010).
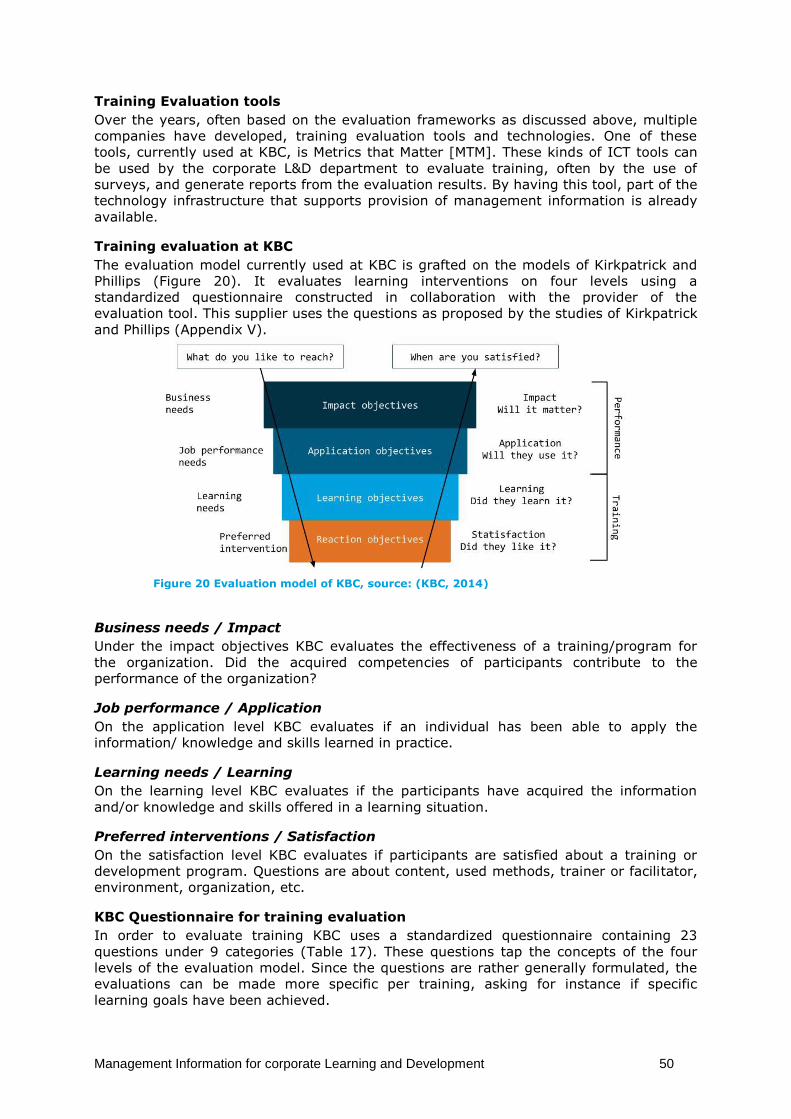
Management Information for corporate Learning and Development 50
Training Evaluation tools
Over the years, often based on the evaluation frameworks as discussed above, multiple
companies have developed, training evaluation tools and technologies. One of these
tools, currently used at KBC, is Metrics that Matter [MTM]. These kinds of ICT tools can
be used by the corporate L&D department to evaluate training, often by the use of
surveys, and generate reports from the evaluation results. By having this tool, part of the
technology infrastructure that supports provision of management information is already
available.
Training evaluation at KBC
The evaluation model currently used at KBC is grafted on the models of Kirkpatrick and
Phillips (Figure 20). It evaluates learning interventions on four levels using a
standardized questionnaire constructed in collaboration with the provider of the
evaluation tool. This supplier uses the questions as proposed by the studies of Kirkpatrick
and Phillips (Appendix V).
Figure 20 Evaluation model of KBC, source: (KBC, 2014)
Business needs / Impact
Under the impact objectives KBC evaluates the effectiveness of a training/program for
the organization. Did the acquired competencies of participants contribute to the
performance of the organization?
Job performance / Application
On the application level KBC evaluates if an individual has been able to apply the
information/ knowledge and skills learned in practice.
Learning needs / Learning
On the learning level KBC evaluates if the participants have acquired the information
and/or knowledge and skills offered in a learning situation.
Preferred interventions / Satisfaction
On the satisfaction level KBC evaluates if participants are satisfied about a training or
development program. Questions are about content, used methods, trainer or facilitator,
environment, organization, etc.
KBC Questionnaire for training evaluation
In order to evaluate training KBC uses a standardized questionnaire containing 23
questions under 9 categories (Table 17). These questions tap the concepts of the four
levels of the evaluation model. Since the questions are rather generally formulated, the
evaluations can be made more specific per training, asking for instance if specific
learning goals have been achieved.
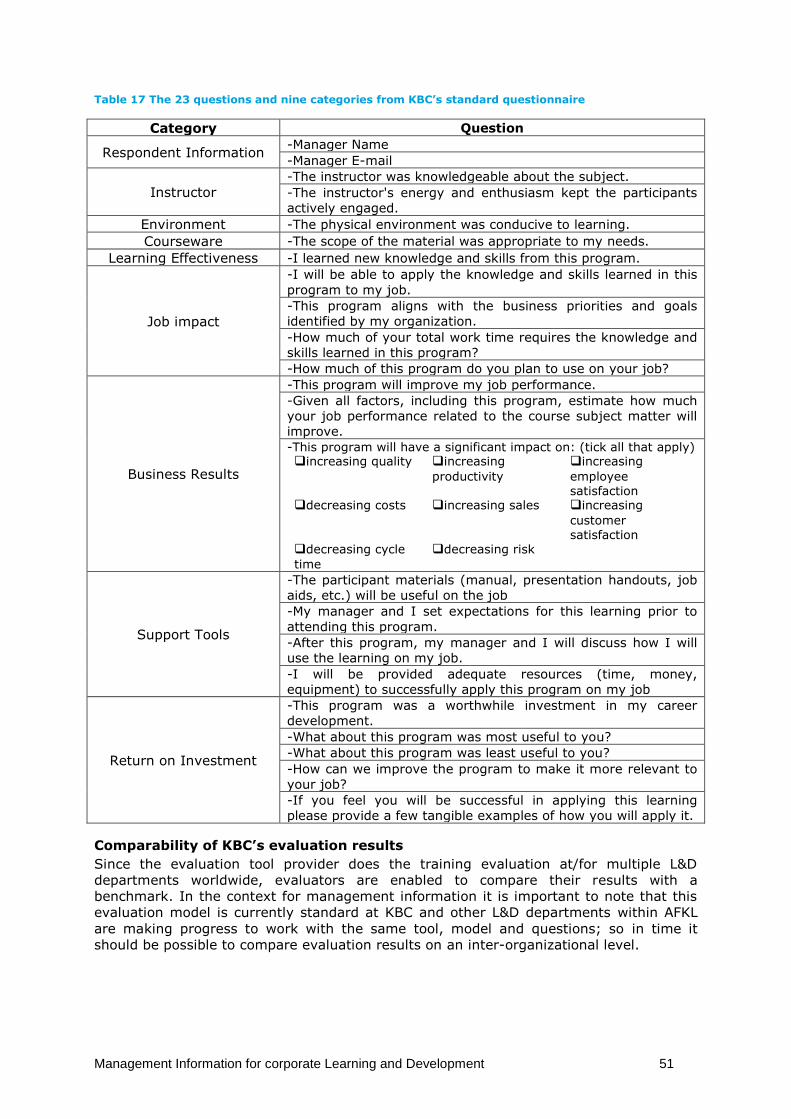
Management Information for corporate Learning and Development 51
Table 17 The 23 questions and nine categories from KBC’s standard questionnaire
Category Question
Respondent Information -Manager Name
-Manager E-mail
Instructor -The instructor was knowledgeable about the subject.
-The instructor's energy and enthusiasm kept the participants
actively engaged.
Environment -The physical environment was conducive to learning.
Courseware -The scope of the material was appropriate to my needs.
Learning Effectiveness -I learned new knowledge and skills from this program.
Job impact
-I will be able to apply the knowledge and skills learned in this
program to my job.
-This program aligns with the business priorities and goals
identified by my organization.
-How much of your total work time requires the knowledge and
skills learned in this program?
-How much of this program do you plan to use on your job?
Business Results
-This program will improve my job performance.
-Given all factors, including this program, estimate how much
your job performance related to the course subject matter will
improve.
-This program will have a significant impact on: (tick all that apply) increasing quality increasing
productivity increasing
employee satisfaction
decreasing costs increasing sales increasing
customer satisfaction
decreasing cycle
time decreasing risk
Support Tools
-The participant materials (manual, presentation handouts, job
aids, etc.) will be useful on the job -My manager and I set expectations for this learning prior to
attending this program. -After this program, my manager and I will discuss how I will
use the learning on my job.
-I will be provided adequate resources (time, money,
equipment) to successfully apply this program on my job
Return on Investment
-This program was a worthwhile investment in my career
development.
-What about this program was most useful to you? -What about this program was least useful to you?
-How can we improve the program to make it more relevant to
your job? -If you feel you will be successful in applying this learning
please provide a few tangible examples of how you will apply it.
Comparability of KBC’s evaluation results
Since the evaluation tool provider does the training evaluation at/for multiple L&D
departments worldwide, evaluators are enabled to compare their results with a
benchmark. In the context for management information it is important to note that this
evaluation model is currently standard at KBC and other L&D departments within AFKL
are making progress to work with the same tool, model and questions; so in time it
should be possible to compare evaluation results on an inter-organizational level.
Management Information for corporate Learning and Development 52
3.9 The competition of a corporate L&D department In general, competition is drawing on an equivalent set of resources in order to provide
products and services that serve the same or similar market needs (Rummler & Brache,
1990). In the L&D context competitors can be seen as internal or external L&D
departments where those having learning needs can go to. In those cases where multiple
L&D departments occur within the organization, like in the situation of KBC, one can also
speak of internal competition. However, since these internal competitors are dependent
on the same general environment and operate for the same company and markets, it
would be healthier to frame the internal competitors as colleagues, and speak in terms of
coopetition.
3.10 The environment around a corporate L&D department Each corporate L&D department operates in its own wider environment, which influences
the processes and relations between the other elements of the systems view. Some
general influences are governmental, economic and cultural influences (Rummler &
Brache, 1990). Also trends and developments in the environment of the organization,
(e.g. strategy, structure & culture and processes) the people, and the technology have
their influence on the corporate L&D department and its products. The goals, missions,
visions and strategies have already been described earlier in this chapter. The variety of
strategic content found over the different organizational levels will become helpful in
determining the management information elements in order to align them with the
corporate and department goals, mission, vision and strategy. In the upcoming
paragraphs the organizational culture influence on L&D (3.10.1), the learning culture
influences (3.10.2) and the changes in the environment (3.10.3) are discussed since
these, together with the strategy, are seen as the main influential environmental
elements around corporate L&D.
3.10.1 Organizational Culture influences on L&D
Each organization has its own organizational culture, which can be seen as the
“personality” of an organization. Organizational culture refers to a system of shared
meaning held by members of the organization, distinguishing the specific organization
from another. The essence of organizational culture has seven primary characteristics:
Innovation and risk taking;
Attention to detail;
Outcome orientation;
People orientation;
Team orientation;
Aggressiveness and
Stability (Robbins & Judge, 2012)
Within large organizations, like Air France-KLM, there are often several subcultures
alongside the dominant culture. In the case of KBC it can be said that the commercial
division as well as the L&D department itself, and other corporate L&D departments in Air
France-KLM, have their own subcultures.
The organizational culture and the subcultures have has a strong influence the operation
of the corporate L&D department and therefore on the quality of the L&D products. The
organizational culture also has an influence on the individuals and the organization as a
whole in the context of their desire to continuously increase knowledge, competences
and performance. Table 18 shows the elements of L&D on which the corporate culture
has an influence according to Bersin & Associates (2009).
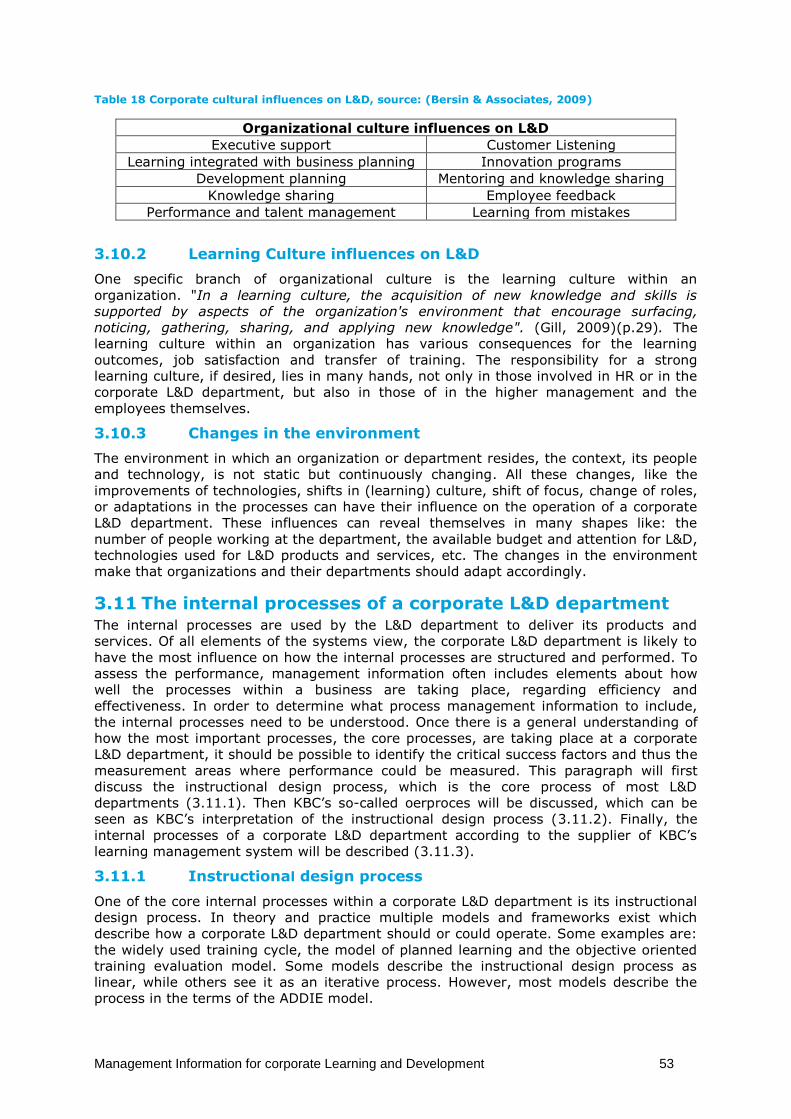
Management Information for corporate Learning and Development 53
Table 18 Corporate cultural influences on L&D, source: (Bersin & Associates, 2009)
Organizational culture influences on L&D
Executive support Customer Listening
Learning integrated with business planning Innovation programs
Development planning Mentoring and knowledge sharing
Knowledge sharing Employee feedback
Performance and talent management Learning from mistakes
3.10.2 Learning Culture influences on L&D
One specific branch of organizational culture is the learning culture within an
organization. "In a learning culture, the acquisition of new knowledge and skills is
supported by aspects of the organization's environment that encourage surfacing,
noticing, gathering, sharing, and applying new knowledge". (Gill, 2009)(p.29). The
learning culture within an organization has various consequences for the learning
outcomes, job satisfaction and transfer of training. The responsibility for a strong
learning culture, if desired, lies in many hands, not only in those involved in HR or in the
corporate L&D department, but also in those of in the higher management and the
employees themselves.
3.10.3 Changes in the environment
The environment in which an organization or department resides, the context, its people
and technology, is not static but continuously changing. All these changes, like the
improvements of technologies, shifts in (learning) culture, shift of focus, change of roles,
or adaptations in the processes can have their influence on the operation of a corporate
L&D department. These influences can reveal themselves in many shapes like: the
number of people working at the department, the available budget and attention for L&D,
technologies used for L&D products and services, etc. The changes in the environment
make that organizations and their departments should adapt accordingly.
3.11 The internal processes of a corporate L&D department The internal processes are used by the L&D department to deliver its products and
services. Of all elements of the systems view, the corporate L&D department is likely to
have the most influence on how the internal processes are structured and performed. To
assess the performance, management information often includes elements about how
well the processes within a business are taking place, regarding efficiency and
effectiveness. In order to determine what process management information to include,
the internal processes need to be understood. Once there is a general understanding of
how the most important processes, the core processes, are taking place at a corporate
L&D department, it should be possible to identify the critical success factors and thus the
measurement areas where performance could be measured. This paragraph will first
discuss the instructional design process, which is the core process of most L&D
departments (3.11.1). Then KBC’s so-called oerproces will be discussed, which can be
seen as KBC’s interpretation of the instructional design process (3.11.2). Finally, the
internal processes of a corporate L&D department according to the supplier of KBC’s
learning management system will be described (3.11.3).
3.11.1 Instructional design process
One of the core internal processes within a corporate L&D department is its instructional
design process. In theory and practice multiple models and frameworks exist which
describe how a corporate L&D department should or could operate. Some examples are:
the widely used training cycle, the model of planned learning and the objective oriented
training evaluation model. Some models describe the instructional design process as
linear, while others see it as an iterative process. However, most models describe the
process in the terms of the ADDIE model.
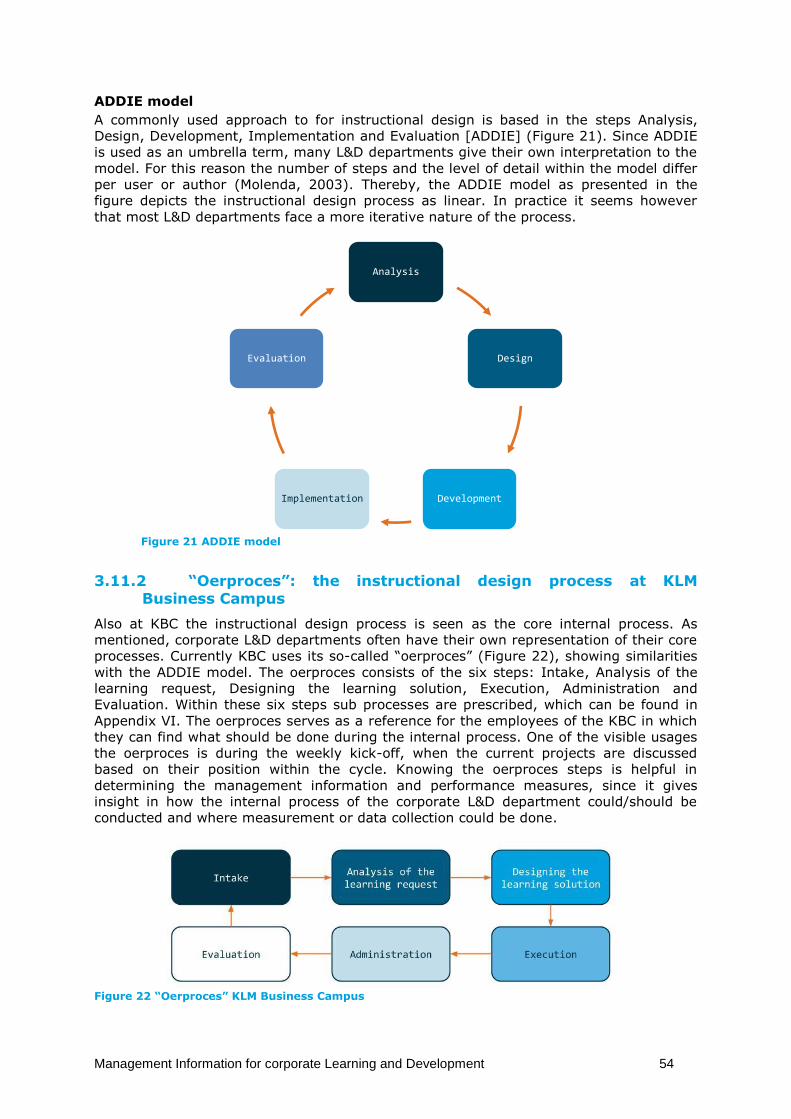
Management Information for corporate Learning and Development 54
ADDIE model
A commonly used approach to for instructional design is based in the steps Analysis,
Design, Development, Implementation and Evaluation [ADDIE] (Figure 21). Since ADDIE
is used as an umbrella term, many L&D departments give their own interpretation to the
model. For this reason the number of steps and the level of detail within the model differ
per user or author (Molenda, 2003). Thereby, the ADDIE model as presented in the
figure depicts the instructional design process as linear. In practice it seems however
that most L&D departments face a more iterative nature of the process.
Figure 21 ADDIE model
3.11.2 “Oerproces”: the instructional design process at KLM Business Campus
Also at KBC the instructional design process is seen as the core internal process. As
mentioned, corporate L&D departments often have their own representation of their core
processes. Currently KBC uses its so-called “oerproces” (Figure 22), showing similarities
with the ADDIE model. The oerproces consists of the six steps: Intake, Analysis of the
learning request, Designing the learning solution, Execution, Administration and
Evaluation. Within these six steps sub processes are prescribed, which can be found in
Appendix VI. The oerproces serves as a reference for the employees of the KBC in which
they can find what should be done during the internal process. One of the visible usages
the oerproces is during the weekly kick-off, when the current projects are discussed
based on their position within the cycle. Knowing the oerproces steps is helpful in
determining the management information and performance measures, since it gives
insight in how the internal process of the corporate L&D department could/should be
conducted and where measurement or data collection could be done.
Figure 22 “Oerproces” KLM Business Campus
Analysis
Design
Development Implementation
Evaluation
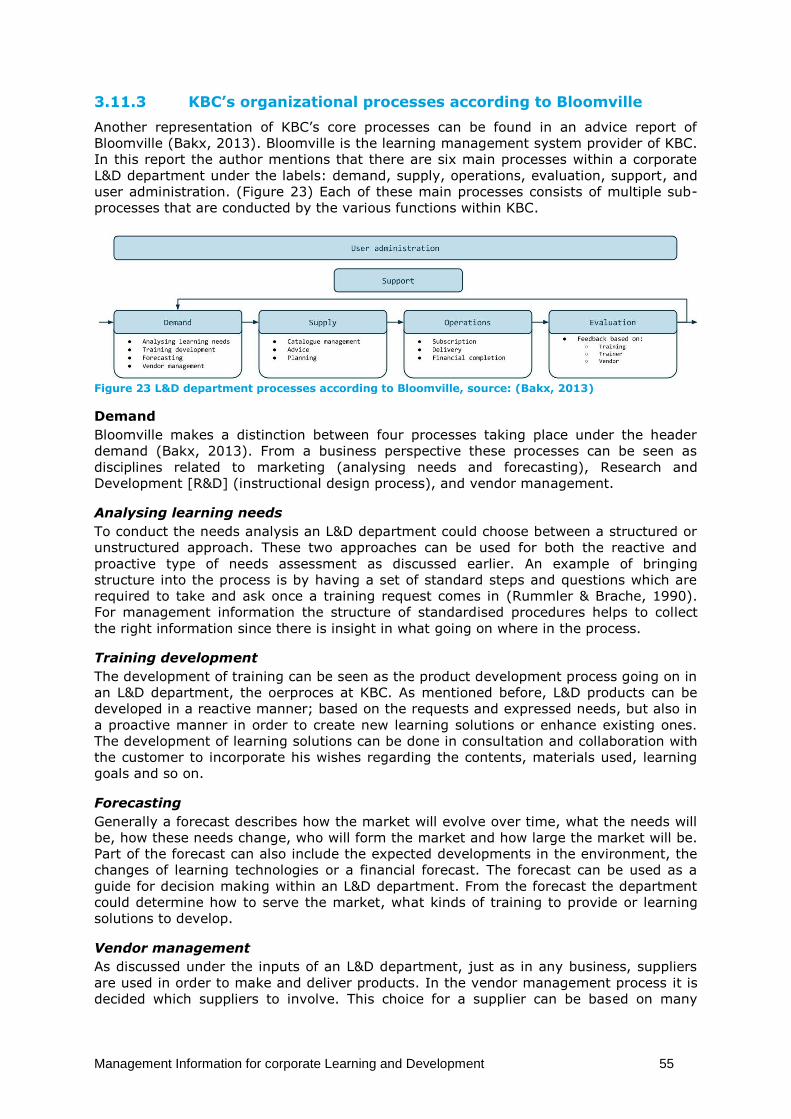
Management Information for corporate Learning and Development 55
3.11.3 KBC’s organizational processes according to Bloomville
Another representation of KBC’s core processes can be found in an advice report of
Bloomville (Bakx, 2013). Bloomville is the learning management system provider of KBC.
In this report the author mentions that there are six main processes within a corporate
L&D department under the labels: demand, supply, operations, evaluation, support, and
user administration. (Figure 23) Each of these main processes consists of multiple sub-
processes that are conducted by the various functions within KBC.
Figure 23 L&D department processes according to Bloomville, source: (Bakx, 2013)
Demand
Bloomville makes a distinction between four processes taking place under the header
demand (Bakx, 2013). From a business perspective these processes can be seen as
disciplines related to marketing (analysing needs and forecasting), Research and
Development [R&D] (instructional design process), and vendor management.
Analysing learning needs
To conduct the needs analysis an L&D department could choose between a structured or
unstructured approach. These two approaches can be used for both the reactive and
proactive type of needs assessment as discussed earlier. An example of bringing
structure into the process is by having a set of standard steps and questions which are
required to take and ask once a training request comes in (Rummler & Brache, 1990).
For management information the structure of standardised procedures helps to collect
the right information since there is insight in what going on where in the process.
Training development
The development of training can be seen as the product development process going on in
an L&D department, the oerproces at KBC. As mentioned before, L&D products can be
developed in a reactive manner; based on the requests and expressed needs, but also in
a proactive manner in order to create new learning solutions or enhance existing ones.
The development of learning solutions can be done in consultation and collaboration with
the customer to incorporate his wishes regarding the contents, materials used, learning
goals and so on.
Forecasting
Generally a forecast describes how the market will evolve over time, what the needs will
be, how these needs change, who will form the market and how large the market will be.
Part of the forecast can also include the expected developments in the environment, the
changes of learning technologies or a financial forecast. The forecast can be used as a
guide for decision making within an L&D department. From the forecast the department
could determine how to serve the market, what kinds of training to provide or learning
solutions to develop.
Vendor management
As discussed under the inputs of an L&D department, just as in any business, suppliers
are used in order to make and deliver products. In the vendor management process it is
decided which suppliers to involve. This choice for a supplier can be based on many
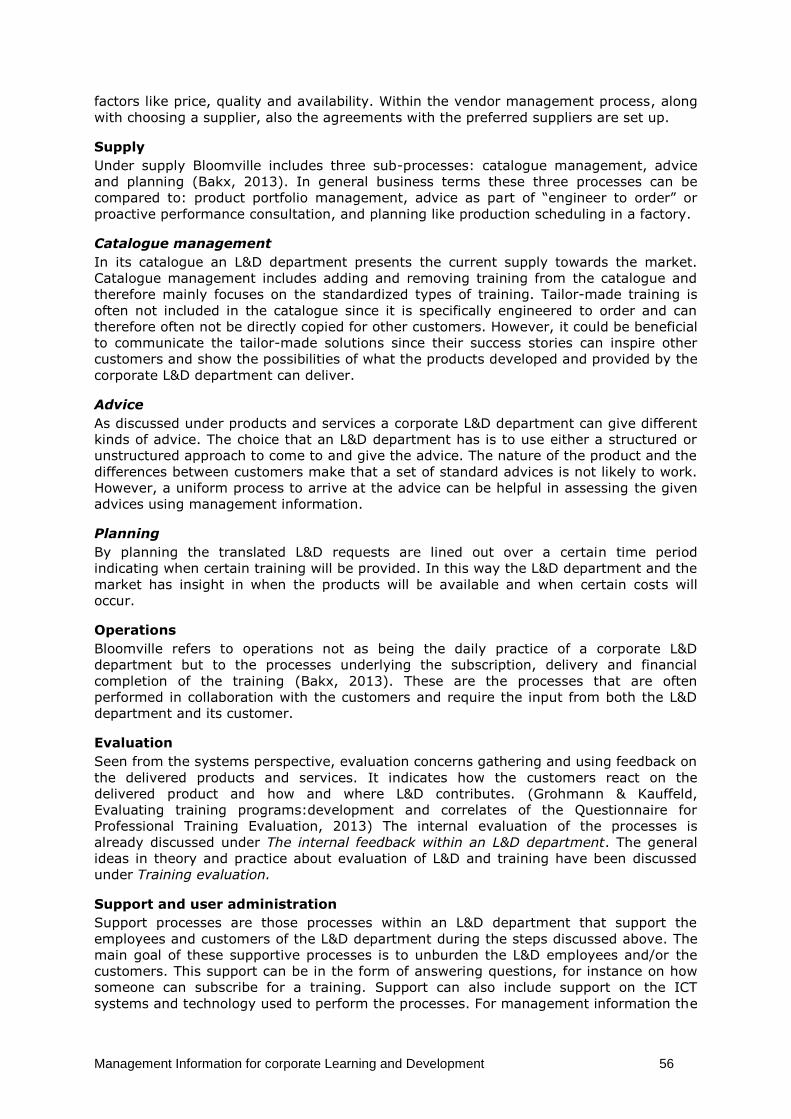
Management Information for corporate Learning and Development 56
factors like price, quality and availability. Within the vendor management process, along
with choosing a supplier, also the agreements with the preferred suppliers are set up.
Supply
Under supply Bloomville includes three sub-processes: catalogue management, advice
and planning (Bakx, 2013). In general business terms these three processes can be
compared to: product portfolio management, advice as part of “engineer to order” or
proactive performance consultation, and planning like production scheduling in a factory.
Catalogue management
In its catalogue an L&D department presents the current supply towards the market.
Catalogue management includes adding and removing training from the catalogue and
therefore mainly focuses on the standardized types of training. Tailor-made training is
often not included in the catalogue since it is specifically engineered to order and can
therefore often not be directly copied for other customers. However, it could be beneficial
to communicate the tailor-made solutions since their success stories can inspire other
customers and show the possibilities of what the products developed and provided by the
corporate L&D department can deliver.
Advice
As discussed under products and services a corporate L&D department can give different
kinds of advice. The choice that an L&D department has is to use either a structured or
unstructured approach to come to and give the advice. The nature of the product and the
differences between customers make that a set of standard advices is not likely to work.
However, a uniform process to arrive at the advice can be helpful in assessing the given
advices using management information.
Planning
By planning the translated L&D requests are lined out over a certain time period
indicating when certain training will be provided. In this way the L&D department and the
market has insight in when the products will be available and when certain costs will
occur.
Operations
Bloomville refers to operations not as being the daily practice of a corporate L&D
department but to the processes underlying the subscription, delivery and financial
completion of the training (Bakx, 2013). These are the processes that are often
performed in collaboration with the customers and require the input from both the L&D
department and its customer.
Evaluation
Seen from the systems perspective, evaluation concerns gathering and using feedback on
the delivered products and services. It indicates how the customers react on the
delivered product and how and where L&D contributes. (Grohmann & Kauffeld,
Evaluating training programs:development and correlates of the Questionnaire for
Professional Training Evaluation, 2013) The internal evaluation of the processes is
already discussed under The internal feedback within an L&D department. The general
ideas in theory and practice about evaluation of L&D and training have been discussed
under Training evaluation.
Support and user administration
Support processes are those processes within an L&D department that support the
employees and customers of the L&D department during the steps discussed above. The
main goal of these supportive processes is to unburden the L&D employees and/or the
customers. This support can be in the form of answering questions, for instance on how
someone can subscribe for a training. Support can also include support on the ICT
systems and technology used to perform the processes. For management information the
Management Information for corporate Learning and Development 57
data generated by the support user administration processes can be of high value since
they generate data like how many people have been registered on a certain training.
3.12 Managerial control in a corporate L&D department The role of the managerial control is to control and align the internal and external
environment of the corporate L&D department. Management is often responsible for
establishing and monitoring the strategy and goals of the department, tracking the
performance of the employees and processes, monitoring both the internal and external
feedback and allocating the resources (Rummler & Brache, 1990). During all these tasks
the management information system is one of the support tools that could be used to
monitor and control the L&D department. The lack of such a management information
system at KBC, combined with the desire to obtain more managerial control, led to the
request for this research.
3.13 Summarizing conclusion In this chapter KBC served as a case example of a corporate L&D department in order to
provide a partial answer to the question: How does a corporate learning and
development department operate and what information elements can be derived from
the operation? KBC’s organizational context has been discussed, together with some
general findings in theory and practice about the environment of corporate L&D. This
chapter thereby provides a better understanding of the corporate L&D environment, its
people, and the processes all required for the development of the information system.
With the more detailed description of training evaluation, insight is obtained in how the
value contributions of corporate L&D are currently assessed and evaluated in theory and
practice. The descriptions of the processes can later be used to identify information
elements for the management information system from the top-down.
The next chapter will continue with a cross-case analysis of Dutch corporate L&D
departments with a focus on their management information (systems) and the measures
and metrics they obtain and use to manage their L&D department and communicate
towards management and the outside world. In chapter 5 the other half of the question
How does a corporate learning and development department operate and what
information elements can be derived from the operation? will be answered.
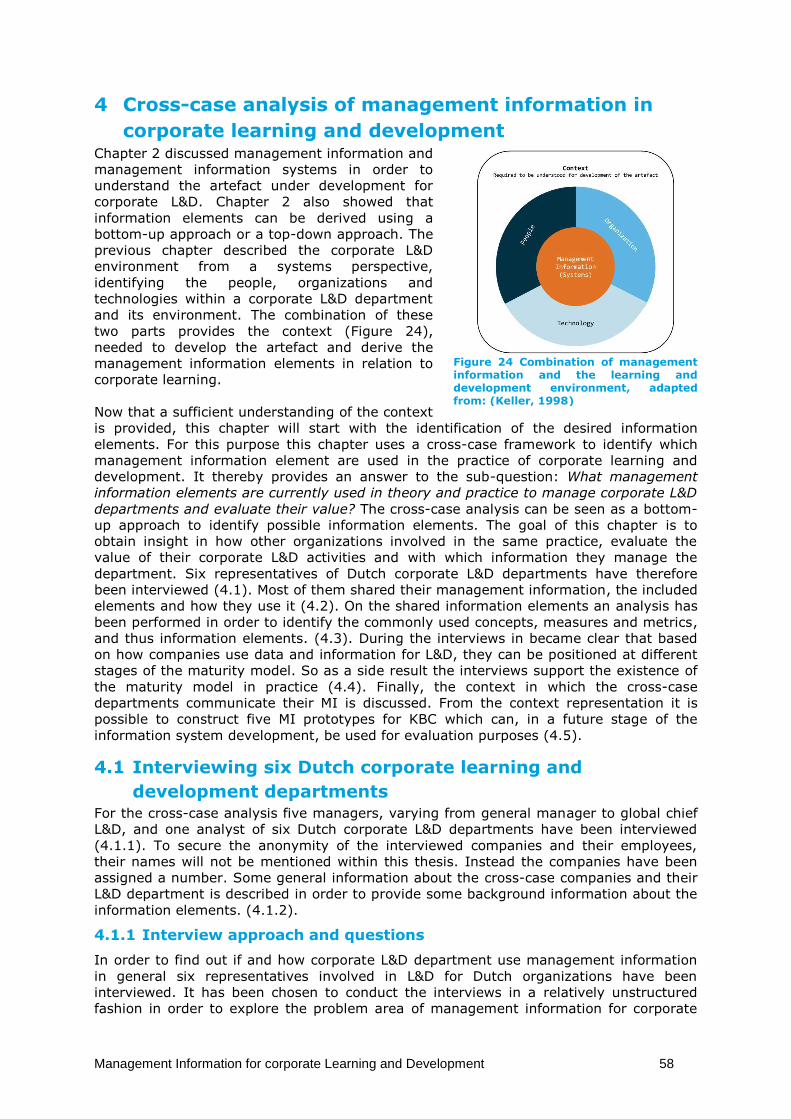
Management Information for corporate Learning and Development 58
4 Cross-case analysis of management information in
corporate learning and development Chapter 2 discussed management information and
management information systems in order to
understand the artefact under development for
corporate L&D. Chapter 2 also showed that
information elements can be derived using a
bottom-up approach or a top-down approach. The
previous chapter described the corporate L&D
environment from a systems perspective,
identifying the people, organizations and
technologies within a corporate L&D department
and its environment. The combination of these
two parts provides the context (Figure 24),
needed to develop the artefact and derive the
management information elements in relation to
corporate learning.
Now that a sufficient understanding of the context
is provided, this chapter will start with the identification of the desired information
elements. For this purpose this chapter uses a cross-case framework to identify which
management information element are used in the practice of corporate learning and
development. It thereby provides an answer to the sub-question: What management
information elements are currently used in theory and practice to manage corporate L&D
departments and evaluate their value? The cross-case analysis can be seen as a bottom-
up approach to identify possible information elements. The goal of this chapter is to
obtain insight in how other organizations involved in the same practice, evaluate the
value of their corporate L&D activities and with which information they manage the
department. Six representatives of Dutch corporate L&D departments have therefore
been interviewed (4.1). Most of them shared their management information, the included
elements and how they use it (4.2). On the shared information elements an analysis has
been performed in order to identify the commonly used concepts, measures and metrics,
and thus information elements. (4.3). During the interviews in became clear that based
on how companies use data and information for L&D, they can be positioned at different
stages of the maturity model. So as a side result the interviews support the existence of
the maturity model in practice (4.4). Finally, the context in which the cross-case
departments communicate their MI is discussed. From the context representation it is
possible to construct five MI prototypes for KBC which can, in a future stage of the
information system development, be used for evaluation purposes (4.5).
4.1 Interviewing six Dutch corporate learning and
development departments For the cross-case analysis five managers, varying from general manager to global chief
L&D, and one analyst of six Dutch corporate L&D departments have been interviewed
(4.1.1). To secure the anonymity of the interviewed companies and their employees,
their names will not be mentioned within this thesis. Instead the companies have been
assigned a number. Some general information about the cross-case companies and their
L&D department is described in order to provide some background information about the
information elements. (4.1.2).
4.1.1 Interview approach and questions
In order to find out if and how corporate L&D department use management information
in general six representatives involved in L&D for Dutch organizations have been
interviewed. It has been chosen to conduct the interviews in a relatively unstructured
fashion in order to explore the problem area of management information for corporate
Figure 24 Combination of management information and the learning and development environment, adapted from: (Keller, 1998)
Management Information for corporate Learning and Development 59
L&D. Relatively unstructured means that only some of the questions asked during the
interview were predetermined. These questions include: "Can you tell me something
about how is your L&D department organized?” as the answer of this question can be
used to compare the department with the others. Two other predetermined questions
are: “How does your organization and/or L&D department use management
information?" and if management information was used: “Which information do you
obtain in order to use, steer and manage?” Besides the predetermined questions the
representatives were left free in what they wanted to talk about in relation to corporate
L&D and management information. Due to these unstructured aspects of the interviews
some representatives shared more than only their information elements. Examples are
formed by the model presented in Figure 19 and the ways that information is obtained
and communicated presented later in this chapter. Three of the six interviews took place
at the location of the organization/L&D department, one at KLM and two via telephone.
4.1.2 General information about the cross-case L&D departments and their customers
The upcoming sub-paragraphs describe some general information about the corporate
L&D departments with whom the interviews have been conducted. For some departments
this information is more detailed than for others, caused by the limited information
available during the interview, information known to the representative, or willingness to
share information. The more details are known, the better the context of the case
companies can be understood. However, more important than understanding the context
with general information is that all interviewed departments have at least shared how
they deal with L&D management information, which information elements they use to
manage their department, and which information they communicate within their
companies. The latter will be discussed in the upcoming section.
General information L&D department 1
L&D department 1 operates for a company whose core business is to provide audit, tax
and advisory services. The Dutch market of the L&D department incorporates 3000 full
time equivalent [FTE] employees. The L&D department is part of the Dutch Human
Resource branch of the organization and is also linked to a global L&D/HR department.
The learning products offered by the department include most of the possible types, like
corporate on-boarding, legacy compliance and skill and competence building. Some of
the training content is developed in-house, some globally and some by third parties.
General information L&D department 2
Public transportation is the core business of the organization for which L&D department 2
operates. The market for this L&D department includes all employees working for this
organization within the Netherlands, more than 23.000. The L&D department operates as
a separate business entity within the larger organization. Internally, the department
operates in a matrix structure to serve the different business entities/ L&D markets
within the organization e.g. drivers, managers and maintenance engineers. The roles
within the L&D matrix are: a general manager, business directors (who maintain the
relations with the customers and who know the specific customer learning needs),
developers and designers (of L&D products), trainers, administration employees and
procurement staff. The department offers most possible kinds of L&D products. However,
still a lot of “old-fashioned” instructor-led internal classroom training is needed in this
organization due to the nature of the work and legislation requirements.
General information L&D department 3
The organization for which L&D department 3 operates is a global financial institution
offering banking services. Worldwide this organization has more than 53.000 employees,
who all need L&D products and services. In this organization L&D is centralized but
internally divided in 20 “learning groups”, each for a different market segment. Through
the learning groups the L&D department is organized in a matrix structure. The L&D
department offers various kinds of training products like legislation, business academy,
Management Information for corporate Learning and Development 60
financial training, skills and competences and bank training. Some training is provided in-
house, some by external parties, depending on what is most cost-efficient or whether the
required expertise to provide the training is present. The department has to deal with
about 1.000.000 training subscriptions each year worldwide, varying from e-learning to
multi-day training sessions.
General information L&D department 4
L&D department 4 offers L&D products and services for a global management-consulting
firm. Worldwide this firm has more than 17.000 employees. L&D for this company is
centralized in the Netherlands where the Global Chief Learning Officer is located. This
actor is responsible for the learning and leadership development of the company as a
whole. At each location or region other L&D managers have been installed, or other HR
employees take that role. This depends on the size of the office and number of
employees. The L&D department provides all kinds of L&D products like e-learning, on-
boarding, compliancy and leadership development. Some products are developed and
facilitated internally and some by third parties or in collaboration with third parties.
General information L&D department 5
The core business of the organization for which L&D department 5 operates involves
Telecom and IT services, mainly for the Dutch market. The market for the L&D
department consists of all 18.000 employees working at the organization worldwide. All
L&D products and learning solutions for the whole organization are centralized under one
department/academy which is part of the Human Resources department. Like the other
departments, department 5 also provides all kinds of L&D products for the variety of
functions within the organization. Not all L&D related activities are performed in-house,
as for instance the learning management system is managed by a third party and also
some training is purchased from, and/or given by, external suppliers.
General information L&D department 6
The sixth L&D department operates for an organization in the energy and petrochemical
sector. The targeted market of this L&D department depends on the organizational L&D
needs, which are identified each year from the strategy and organizational targets in
collaboration with the business and line managers. The main market consists of the
employees of the Projects & Technology division of the organization. This division is also
responsible for global safety & environment and contracting & procurement. Where most
products are specifically targeted and tailor-made, some L&D products like, safety
training or on-boarding are provided continuously for the whole division. Given its way of
operation the L&D department is mainly offering L&D advice for the business level of the
organization. Most L&D products are developed and provided by, or in collaboration with,
third parties. However, since training in this organization requires facilities, materials and
content that are company specific most training is facilitated internally at corporate
locations.
Management Information for corporate Learning and Development 61
4.2 Bottom-up identification of management information at
the six L&D departments During the interviews all representatives have shared or shown the information elements
they have constructed and use within their organizational environment. Hereafter for
each case-company these shared information elements are presented, most often in
tables (4.2.1 till 0). The real context in which the information is communicated and the
media used differs per organization; some use reports, while others use dashboards or
presentations. The context of how the information is communicated at the various
departments is presented in section 4.5.
4.2.1 Management information at corporate L&D department 1
L&D department 1 shared its information elements that can be found at their L&D
scorecard (Table 19). This scorecard has been designed by the department responsible
for global L&D. Each local L&D department has been asked to fill the dashboard with its
own data. In this way the company should be able to evaluate and compare the different
L&D departments worldwide, using the same information elements. In practice however,
it seems that the definitions of the desired information are unclear, not communicated or
that the definitions differ per region. Moreover, the way how the data is obtained differs
per learning product, even within the same department. For this reasons the interviewed
manager doubts whether the aggregated results, of for instance effectiveness and
program quality, are meaningful. It seems like the department is dissatisfied with the
granularity of the current desired and communicated information. This granularity is too
coarse for proper decision making in the eyes of the department, even more since in this
company the outcomes of the scorecard have a relative high impact on how the L&D
department is assessed and managed by the global organization.
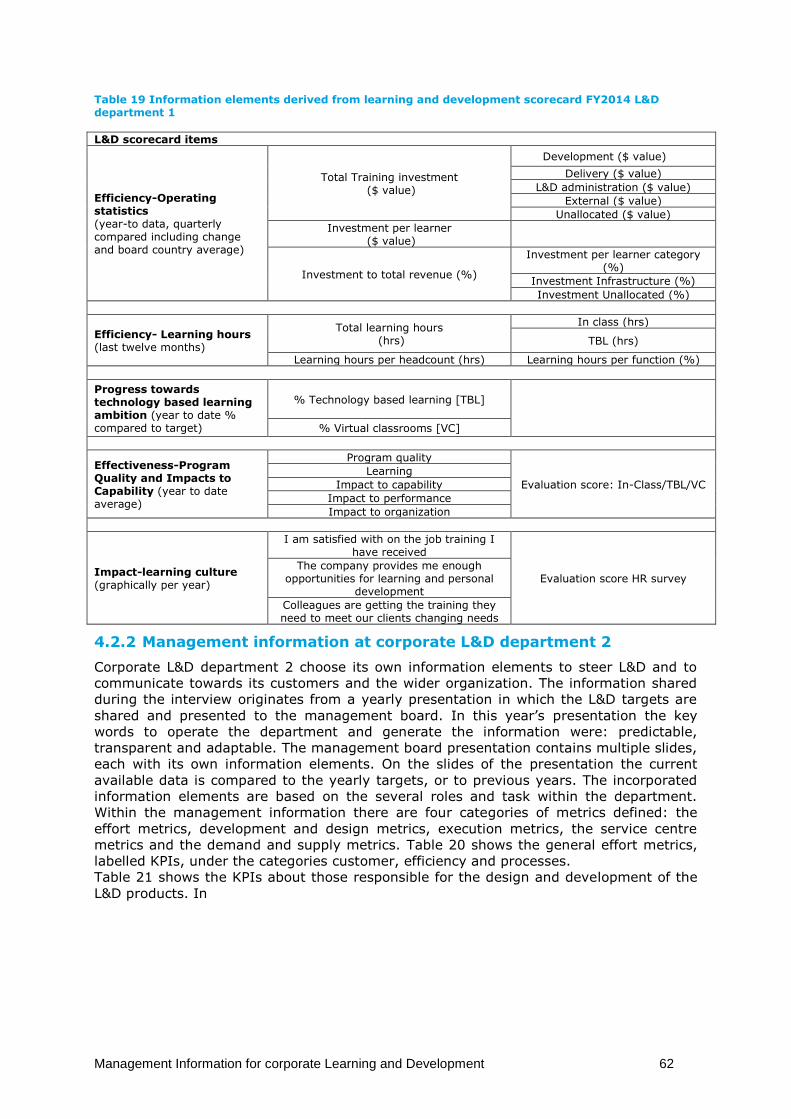
Management Information for corporate Learning and Development 62
Table 19 Information elements derived from learning and development scorecard FY2014 L&D department 1
L&D scorecard items
Efficiency-Operating statistics (year-to data, quarterly compared including change and board country average)
Total Training investment ($ value)
Development ($ value)
Delivery ($ value)
L&D administration ($ value)
External ($ value)
Unallocated ($ value)
Investment per learner ($ value)
Investment to total revenue (%)
Investment per learner category (%)
Investment Infrastructure (%)
Investment Unallocated (%)
Efficiency- Learning hours (last twelve months)
Total learning hours (hrs)
In class (hrs)
TBL (hrs)
Learning hours per headcount (hrs) Learning hours per function (%)
Progress towards technology based learning ambition (year to date % compared to target)
% Technology based learning [TBL]
% Virtual classrooms [VC]
Effectiveness-Program Quality and Impacts to Capability (year to date average)
Program quality
Evaluation score: In-Class/TBL/VC
Learning
Impact to capability
Impact to performance
Impact to organization
Impact-learning culture (graphically per year)
I am satisfied with on the job training I have received
Evaluation score HR survey The company provides me enough
opportunities for learning and personal development
Colleagues are getting the training they need to meet our clients changing needs
4.2.2 Management information at corporate L&D department 2
Corporate L&D department 2 choose its own information elements to steer L&D and to
communicate towards its customers and the wider organization. The information shared
during the interview originates from a yearly presentation in which the L&D targets are
shared and presented to the management board. In this year’s presentation the key
words to operate the department and generate the information were: predictable,
transparent and adaptable. The management board presentation contains multiple slides,
each with its own information elements. On the slides of the presentation the current
available data is compared to the yearly targets, or to previous years. The incorporated
information elements are based on the several roles and task within the department.
Within the management information there are four categories of metrics defined: the
effort metrics, development and design metrics, execution metrics, the service centre
metrics and the demand and supply metrics. Table 20 shows the general effort metrics,
labelled KPIs, under the categories customer, efficiency and processes.
Table 21 shows the KPIs about those responsible for the design and development of the
L&D products. In
Management Information for corporate Learning and Development 63
Table 22 the metrics are presented that tell something about the execution of training.
The service centre is the supporting branch of this L&D department and its KPIs are
presented in
Table 23. Finally, Table 24 shows the KPIs for the employees involved in the demand and
supply processes.
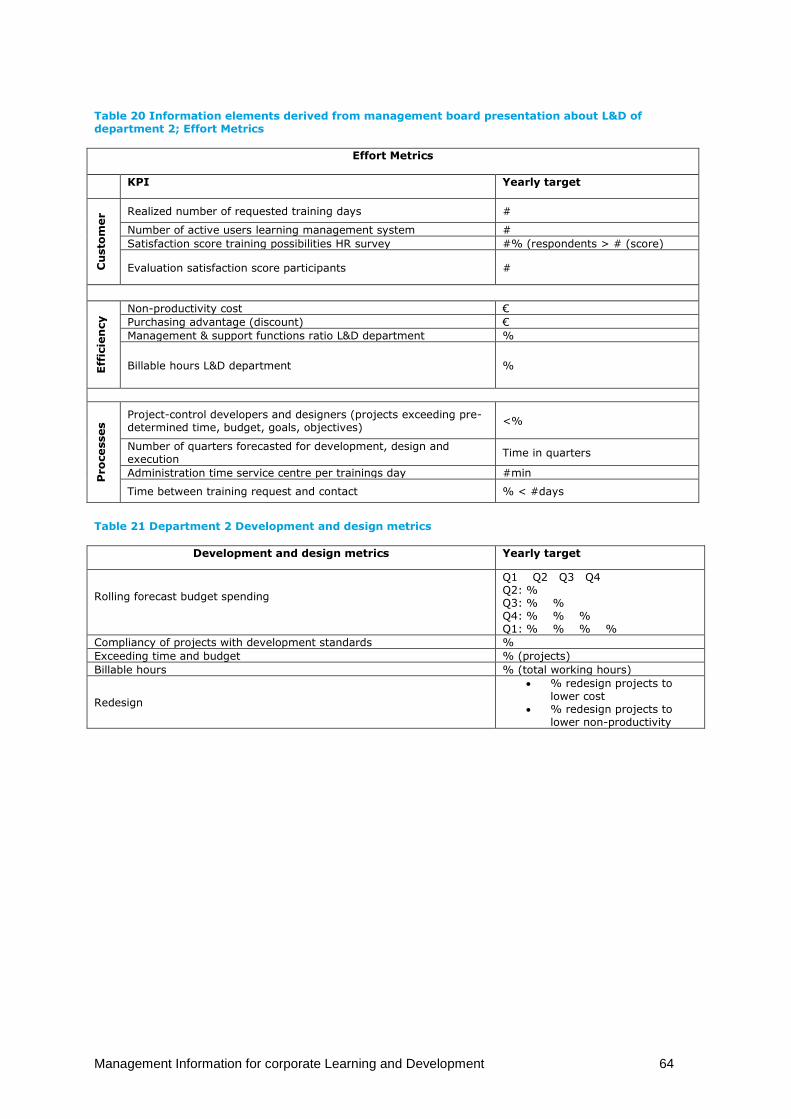
Management Information for corporate Learning and Development 64
Table 20 Information elements derived from management board presentation about L&D of department 2; Effort Metrics
Effort Metrics
KPI Yearly target
Cu
sto
mer Realized number of requested training days #
Number of active users learning management system #
Satisfaction score training possibilities HR survey #% (respondents > # (score)
Evaluation satisfaction score participants #
Eff
icie
ncy Non-productivity cost €
Purchasing advantage (discount) €
Management & support functions ratio L&D department %
Billable hours L&D department %
Pro
cesses Project-control developers and designers (projects exceeding pre-
determined time, budget, goals, objectives) <%
Number of quarters forecasted for development, design and execution
Time in quarters
Administration time service centre per trainings day #min
Time between training request and contact % < #days
Table 21 Department 2 Development and design metrics
Development and design metrics Yearly target
Rolling forecast budget spending
Q1 Q2 Q3 Q4 Q2: % Q3: % % Q4: % % % Q1: % % % %
Compliancy of projects with development standards %
Exceeding time and budget % (projects)
Billable hours % (total working hours)
Redesign
% redesign projects to lower cost
% redesign projects to lower non-productivity
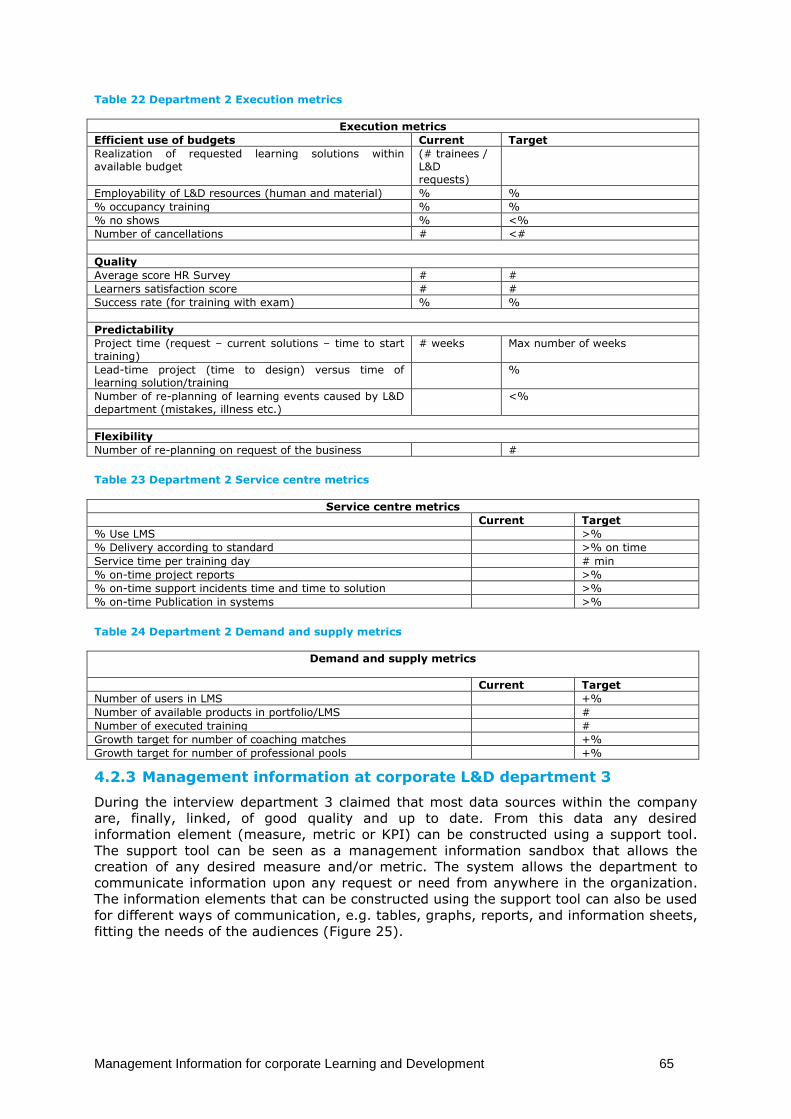
Management Information for corporate Learning and Development 65
Table 22 Department 2 Execution metrics
Execution metrics
Efficient use of budgets Current Target
Realization of requested learning solutions within available budget
(# trainees / L&D requests)
Employability of L&D resources (human and material) % %
% occupancy training % %
% no shows % <%
Number of cancellations # <#
Quality
Average score HR Survey # #
Learners satisfaction score # #
Success rate (for training with exam) % %
Predictability
Project time (request – current solutions – time to start training)
# weeks Max number of weeks
Lead-time project (time to design) versus time of learning solution/training
%
Number of re-planning of learning events caused by L&D department (mistakes, illness etc.)
<%
Flexibility
Number of re-planning on request of the business #
Table 23 Department 2 Service centre metrics
Service centre metrics
Current Target
% Use LMS >%
% Delivery according to standard >% on time
Service time per training day # min
% on-time project reports >%
% on-time support incidents time and time to solution >%
% on-time Publication in systems >%
Table 24 Department 2 Demand and supply metrics
Demand and supply metrics
Current Target
Number of users in LMS +%
Number of available products in portfolio/LMS #
Number of executed training #
Growth target for number of coaching matches +%
Growth target for number of professional pools +%
4.2.3 Management information at corporate L&D department 3
During the interview department 3 claimed that most data sources within the company
are, finally, linked, of good quality and up to date. From this data any desired
information element (measure, metric or KPI) can be constructed using a support tool.
The support tool can be seen as a management information sandbox that allows the
creation of any desired measure and/or metric. The system allows the department to
communicate information upon any request or need from anywhere in the organization.
The information elements that can be constructed using the support tool can also be used
for different ways of communication, e.g. tables, graphs, reports, and information sheets,
fitting the needs of the audiences (Figure 25).
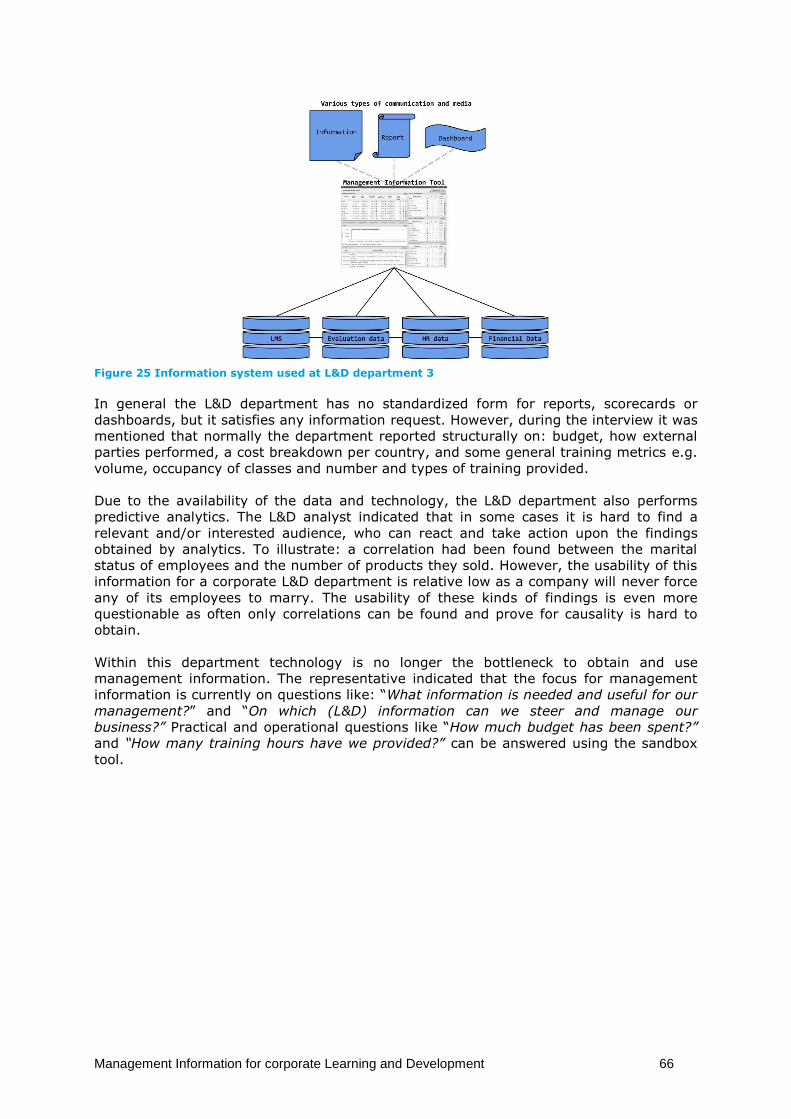
Management Information for corporate Learning and Development 66
Figure 25 Information system used at L&D department 3
In general the L&D department has no standardized form for reports, scorecards or
dashboards, but it satisfies any information request. However, during the interview it was
mentioned that normally the department reported structurally on: budget, how external
parties performed, a cost breakdown per country, and some general training metrics e.g.
volume, occupancy of classes and number and types of training provided.
Due to the availability of the data and technology, the L&D department also performs
predictive analytics. The L&D analyst indicated that in some cases it is hard to find a
relevant and/or interested audience, who can react and take action upon the findings
obtained by analytics. To illustrate: a correlation had been found between the marital
status of employees and the number of products they sold. However, the usability of this
information for a corporate L&D department is relative low as a company will never force
any of its employees to marry. The usability of these kinds of findings is even more
questionable as often only correlations can be found and prove for causality is hard to
obtain.
Within this department technology is no longer the bottleneck to obtain and use
management information. The representative indicated that the focus for management
information is currently on questions like: “What information is needed and useful for our
management?” and “On which (L&D) information can we steer and manage our
business?” Practical and operational questions like “How much budget has been spent?”
and “How many training hours have we provided?” can be answered using the sandbox
tool.
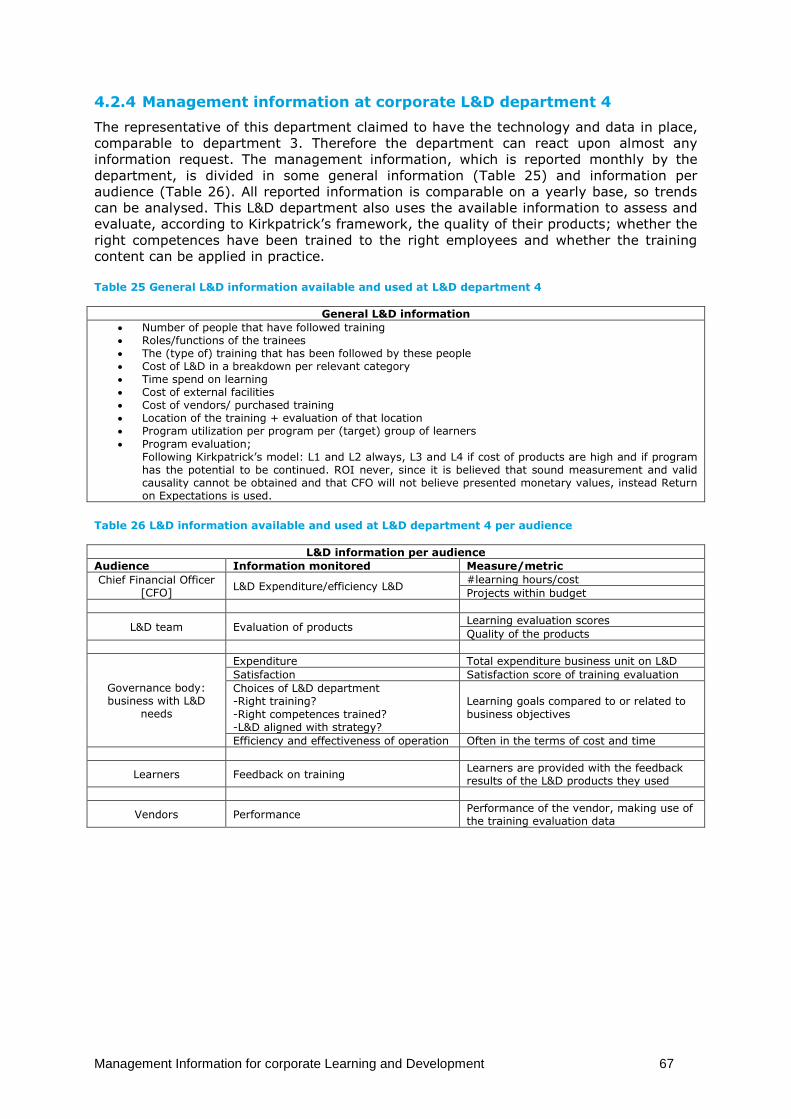
Management Information for corporate Learning and Development 67
4.2.4 Management information at corporate L&D department 4
The representative of this department claimed to have the technology and data in place,
comparable to department 3. Therefore the department can react upon almost any
information request. The management information, which is reported monthly by the
department, is divided in some general information (Table 25) and information per
audience (Table 26). All reported information is comparable on a yearly base, so trends
can be analysed. This L&D department also uses the available information to assess and
evaluate, according to Kirkpatrick’s framework, the quality of their products; whether the
right competences have been trained to the right employees and whether the training
content can be applied in practice.
Table 25 General L&D information available and used at L&D department 4
General L&D information
Number of people that have followed training Roles/functions of the trainees The (type of) training that has been followed by these people Cost of L&D in a breakdown per relevant category Time spend on learning Cost of external facilities Cost of vendors/ purchased training Location of the training + evaluation of that location Program utilization per program per (target) group of learners
Program evaluation; Following Kirkpatrick’s model: L1 and L2 always, L3 and L4 if cost of products are high and if program has the potential to be continued. ROI never, since it is believed that sound measurement and valid causality cannot be obtained and that CFO will not believe presented monetary values, instead Return on Expectations is used.
Table 26 L&D information available and used at L&D department 4 per audience
L&D information per audience
Audience Information monitored Measure/metric
Chief Financial Officer [CFO]
L&D Expenditure/efficiency L&D #learning hours/cost
Projects within budget
L&D team Evaluation of products Learning evaluation scores
Quality of the products
Governance body: business with L&D
needs
Expenditure Total expenditure business unit on L&D
Satisfaction Satisfaction score of training evaluation
Choices of L&D department -Right training?
-Right competences trained? -L&D aligned with strategy?
Learning goals compared to or related to
business objectives
Efficiency and effectiveness of operation Often in the terms of cost and time
Learners Feedback on training Learners are provided with the feedback results of the L&D products they used
Vendors Performance Performance of the vendor, making use of the training evaluation data
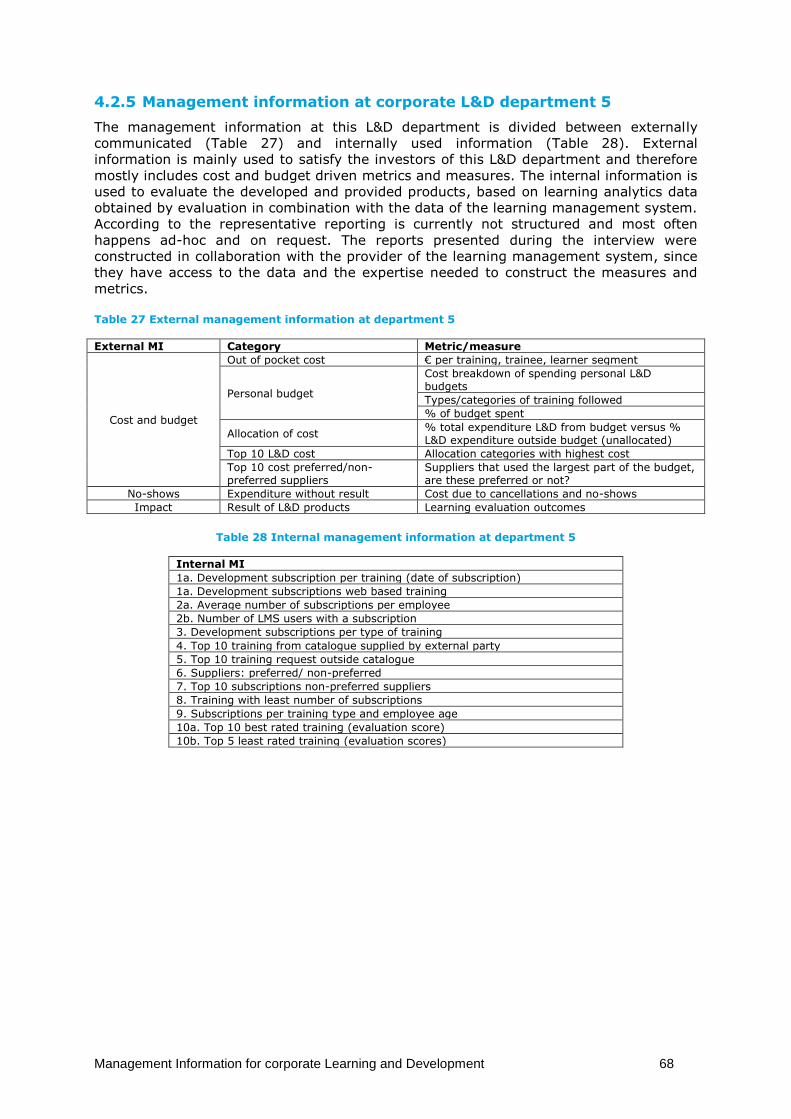
Management Information for corporate Learning and Development 68
4.2.5 Management information at corporate L&D department 5
The management information at this L&D department is divided between externally
communicated (Table 27) and internally used information (Table 28). External
information is mainly used to satisfy the investors of this L&D department and therefore
mostly includes cost and budget driven metrics and measures. The internal information is
used to evaluate the developed and provided products, based on learning analytics data
obtained by evaluation in combination with the data of the learning management system.
According to the representative reporting is currently not structured and most often
happens ad-hoc and on request. The reports presented during the interview were
constructed in collaboration with the provider of the learning management system, since
they have access to the data and the expertise needed to construct the measures and
metrics.
Table 27 External management information at department 5
External MI Category Metric/measure
Cost and budget
Out of pocket cost € per training, trainee, learner segment
Personal budget
Cost breakdown of spending personal L&D budgets
Types/categories of training followed
% of budget spent
Allocation of cost % total expenditure L&D from budget versus % L&D expenditure outside budget (unallocated)
Top 10 L&D cost Allocation categories with highest cost
Top 10 cost preferred/non-preferred suppliers
Suppliers that used the largest part of the budget, are these preferred or not?
No-shows Expenditure without result Cost due to cancellations and no-shows
Impact Result of L&D products Learning evaluation outcomes
Table 28 Internal management information at department 5
Internal MI
1a. Development subscription per training (date of subscription)
1a. Development subscriptions web based training
2a. Average number of subscriptions per employee
2b. Number of LMS users with a subscription
3. Development subscriptions per type of training
4. Top 10 training from catalogue supplied by external party
5. Top 10 training request outside catalogue
6. Suppliers: preferred/ non-preferred
7. Top 10 subscriptions non-preferred suppliers
8. Training with least number of subscriptions
9. Subscriptions per training type and employee age
10a. Top 10 best rated training (evaluation score)
10b. Top 5 least rated training (evaluation scores)
Management Information for corporate Learning and Development 69
4.2.6 Management information at corporate L&D department 6
This department also makes a distinction between internal and external management
information. In this separation the L&D department takes into account the different roles
and responsibilities within the organization and the accompanying information needs. In
this organization the higher management and business/L&D customer is more interested
whether business results have been achieved and how L&D contributes to the strategy.
L&D managers within this organization are more interested in how well (efficient and
effective) the department is operating. The communicated external information in this
department therefore contains a cost breakdown and strategy alignment with the
business. The strategy alignment is communicated in a presentation in which the
business (L&D customer) agrees with the L&D manager how much is going to be invested
in L&D and for which purposes. Evaluation results form the core of the internal
management information, used to manage the department and its vendors. During the
interview no concrete information elements, like at the other companies, have been
shared. The used information in this department was discussed on conceptual level
during the interview, as done in this paragraph as well. The framework presented earlier
in Figure 19 show how this department obtains information related to the development of
L&D. In this framework each level of operation, both in business and L&D, are evaluated
on their own Kirkpatrick level. Each level has its own specific information elements.
4.3 Analysing management information used in corporate
L&D All the management information elements shared during the interviews are presented in
the previous section. In this section the information elements will be counted and
clustered in order to identify the general used management information elements for
corporate L&D (4.3.1). The clustering of the most occurring concepts shows what kind of
information elements are commonly constructed, how the commonly used information
elements are communicated and what information is used to manage the department
(4.3.2). By the analysis of the used information elements an overview of commonly used
information elements in corporate L&D can be constructed (4.3.3).
4.3.1 Most common used concepts
Many concepts are hidden within the information elements obtained from the interviews.
These concepts could contain or direct to useful management information elements. To
reveal the common concepts first 109 concepts were taken from the MI tables (Table 19
till Table 28) of L&D departments 1, 2, 4 and 5 (Appendix VII). Departments 3 and 6
have not shared concrete information elements during the interview, so it was not
possible to include their information elements in this analysis. Within these tables was
searched where these concepts were mentioned, and counted how often these concepts
occurred and whether they occurred at more than one department. The frequency of
concept occurrence and the number of departments at which the concepts occur are used
as indicators for the acceptance of certain information elements. If the concepts occurred
at more than one department it was also required to understand the context in which
these concepts are used. For example the cost at department 1 can be defined and
allocated differently than cost at department 5. The identification of concepts occurring at
more than one department leads to three lists of concepts. The first list is presented in
Table 29 and contains the concepts that occurred at two of the four departments. Table
30 incorporates the concepts that occurred at three of the four departments. Finally,
Table 31 shows the concepts that occurred at all four departments.
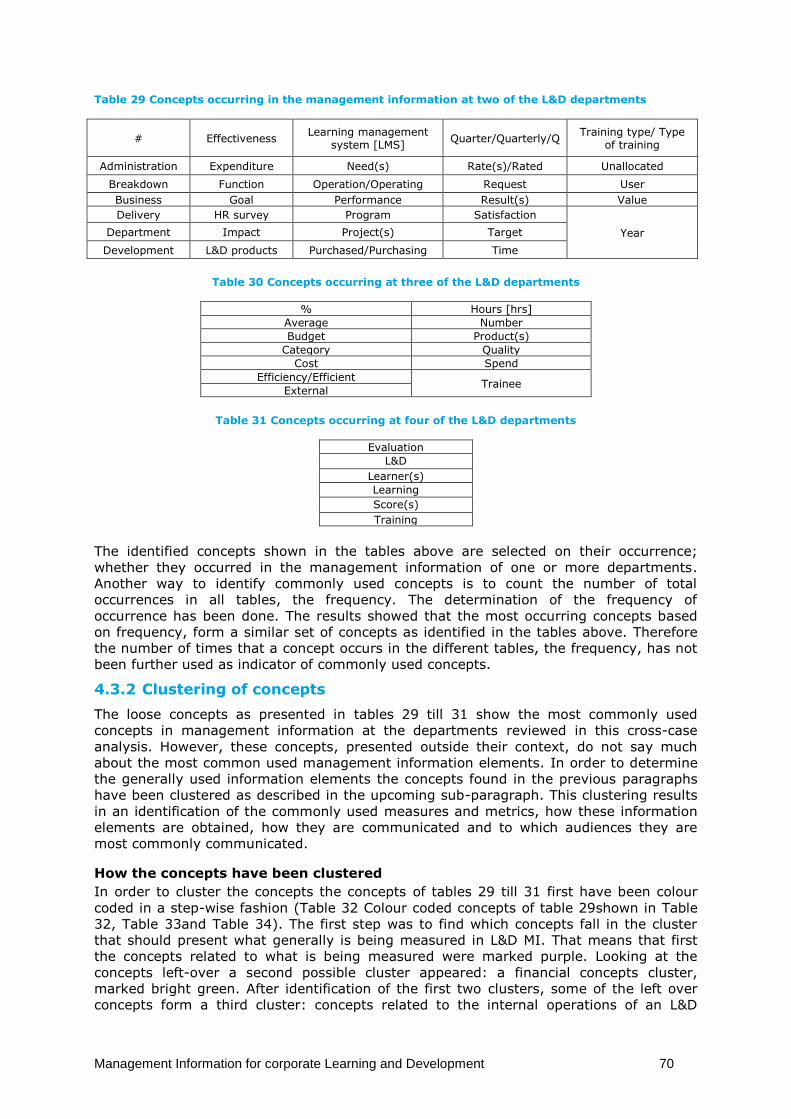
Management Information for corporate Learning and Development 70
Table 29 Concepts occurring in the management information at two of the L&D departments
# Effectiveness Learning management
system [LMS] Quarter/Quarterly/Q
Training type/ Type of training
Administration Expenditure Need(s) Rate(s)/Rated Unallocated
Breakdown Function Operation/Operating Request User
Business Goal Performance Result(s) Value
Delivery HR survey Program Satisfaction
Year Department Impact Project(s) Target
Development L&D products Purchased/Purchasing Time
Table 30 Concepts occurring at three of the L&D departments
% Hours [hrs]
Average Number
Budget Product(s)
Category Quality
Cost Spend
Efficiency/Efficient Trainee
External
Table 31 Concepts occurring at four of the L&D departments
Evaluation
L&D
Learner(s)
Learning
Score(s)
Training
The identified concepts shown in the tables above are selected on their occurrence;
whether they occurred in the management information of one or more departments.
Another way to identify commonly used concepts is to count the number of total
occurrences in all tables, the frequency. The determination of the frequency of
occurrence has been done. The results showed that the most occurring concepts based
on frequency, form a similar set of concepts as identified in the tables above. Therefore
the number of times that a concept occurs in the different tables, the frequency, has not
been further used as indicator of commonly used concepts.
4.3.2 Clustering of concepts
The loose concepts as presented in tables 29 till 31 show the most commonly used
concepts in management information at the departments reviewed in this cross-case
analysis. However, these concepts, presented outside their context, do not say much
about the most common used management information elements. In order to determine
the generally used information elements the concepts found in the previous paragraphs
have been clustered as described in the upcoming sub-paragraph. This clustering results
in an identification of the commonly used measures and metrics, how these information
elements are obtained, how they are communicated and to which audiences they are
most commonly communicated.
How the concepts have been clustered
In order to cluster the concepts the concepts of tables 29 till 31 first have been colour
coded in a step-wise fashion (Table 32 Colour coded concepts of table 29shown in Table
32, Table 33and Table 34). The first step was to find which concepts fall in the cluster
that should present what generally is being measured in L&D MI. That means that first
the concepts related to what is being measured were marked purple. Looking at the
concepts left-over a second possible cluster appeared: a financial concepts cluster,
marked bright green. After identification of the first two clusters, some of the left over
concepts form a third cluster: concepts related to the internal operations of an L&D
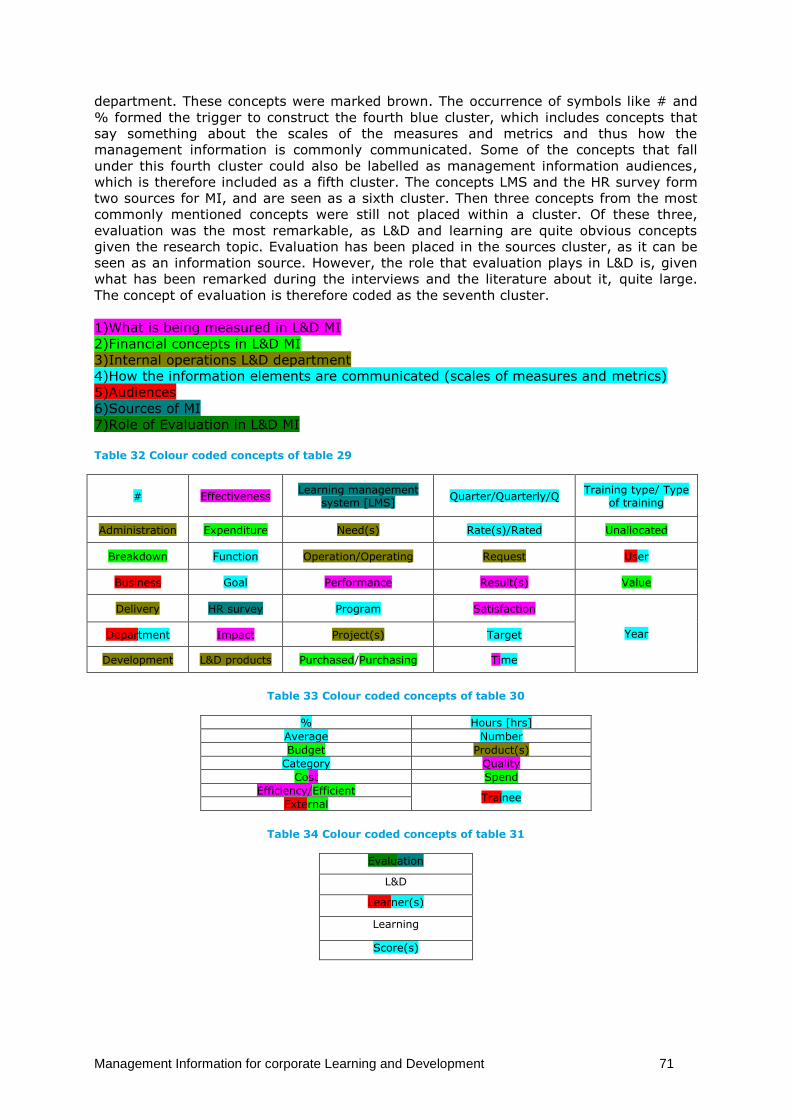
Management Information for corporate Learning and Development 71
department. These concepts were marked brown. The occurrence of symbols like # and
% formed the trigger to construct the fourth blue cluster, which includes concepts that
say something about the scales of the measures and metrics and thus how the
management information is commonly communicated. Some of the concepts that fall
under this fourth cluster could also be labelled as management information audiences,
which is therefore included as a fifth cluster. The concepts LMS and the HR survey form
two sources for MI, and are seen as a sixth cluster. Then three concepts from the most
commonly mentioned concepts were still not placed within a cluster. Of these three,
evaluation was the most remarkable, as L&D and learning are quite obvious concepts
given the research topic. Evaluation has been placed in the sources cluster, as it can be
seen as an information source. However, the role that evaluation plays in L&D is, given
what has been remarked during the interviews and the literature about it, quite large.
The concept of evaluation is therefore coded as the seventh cluster.
1)What is being measured in L&D MI
2)Financial concepts in L&D MI
3)Internal operations L&D department
4)How the information elements are communicated (scales of measures and metrics)
5)Audiences
6)Sources of MI
7)Role of Evaluation in L&D MI
Table 32 Colour coded concepts of table 29
# Effectiveness Learning management
system [LMS] Quarter/Quarterly/Q
Training type/ Type of training
Administration Expenditure Need(s) Rate(s)/Rated Unallocated
Breakdown Function Operation/Operating Request User
Business Goal Performance Result(s) Value
Delivery HR survey Program Satisfaction
Year Department Impact Project(s) Target
Development L&D products Purchased/Purchasing Time
Table 33 Colour coded concepts of table 30
% Hours [hrs]
Average Number
Budget Product(s)
Category Quality
Cost Spend
Efficiency/Efficient Trainee
External
Table 34 Colour coded concepts of table 31
Evaluation
L&D
Learner(s)
Learning
Score(s)
Management Information for corporate Learning and Development 72
Seven clusters of concepts
The following seven clusters can be seen as the main result of the content analysis.
Cluster 1: What is being measured in L&D MI
Various things can be measured to construct L&D management information. The concepts
of the first cluster reveal that Effectiveness, Impact, Performance, Satisfaction, Time,
Quality, Cost and Efficiency are measured at least at more than one department.
Cluster 2: Financial concepts in L&D MI
Of what is being measures by MI the financial concepts: cost, spending, budget, and
efficiency, form a second cluster. The existence of a financial cluster is strengthened by
the fact that Table 29 contains concepts like: breakdown, expenditure, value, unallocated
and purchased.
Cluster 3: Internal operations L&D department in L&D MI
Most of the interviewed L&D departments also communicate MI about the internal
operation of the department and how effective and efficient it has been performed. This
can be seen in the concepts like Product(s), (L&D) Request, Operation/Operating (L&D)
Need(s), Project(s), L&D products, Development, Delivery and Administration.
Cluster 4: How the information elements are communicated in L&D MI; scales of
measures and metrics
The largest group of coded concepts is formed by: the symbol #, Department, Function,
Goal, Program, Quarter/Quarterly/Q, Rate(s)/Rated, Target, Time, Training type/ Type of
training, User, Year, the symbol %, Average, Category, Hours [hrs], Number, Trainee,
Learner(s), Score(s), Training. All these concepts say something about how the
information elements are generally communicated: per type of training, in hours, in
number of people, percentages, quarterly or yearly, average numbers, score values or
relative to targets/goals. How the information is communicated differs due to various
reasons per department, the concepts of this group together with the context of the MI
tables, indicate some general ways.
If L&D departments want to use their MI for internal comparison or external
benchmarking, they should be aware to use the same definitions for concepts, measures,
metrics and timing. Hereby scalability also plays a role as an L&D department within a
large organization will most likely have a higher budget than a relative small L&D
department, and the budget spending over a week will be less than over a year.
Cluster 5: Audiences of L&D
Like the way of communication, also the audience to which the information is
communicated differs per department. However, by the use of coding and the context
provided by the MI tables, the following general L&D audiences are identified: the
Business, the L&D and other departments, external parties (vendors), and
Trainee/Learner(s)/Users.
Cluster 6: Sources of L&D MI
The coding of counted concepts reveals two sources of potential MI used by at least two
the departments: the HR survey and the Learning Management System. Later, the
concept evaluation is also included in this cluster as a possible source for MI.
Cluster7: Role of Evaluation in L&D MI
The fact that evaluation is named at all four L&D departments says something about the
role it plays in L&D MI. Apparently (training) evaluation data is used to construct at least
some of the information elements. It underpins the important role of evaluation in
assessing the value of training and managing the L&D department.
Management Information for corporate Learning and Development 73
Clustering the left-over concepts
Since each L&D department operates in a different environment, the context of the
identified concepts differs. As a result some information elements, or concepts, can be
found at multiple L&D departments but due to different definitions they were not always
identified using the word count and clustering techniques. For instance ROI, and the
symbols € and $ fall under the financial concepts. Another example is formed by the
concepts vendor and supplier, both only mentioned at one department, but it is possible
to cluster them with purchasing and external. In Appendix VII all counted concepts,
including the concepts mentioned once, are presented and when appropriate the context
of the identified concepts is presented between brackets. This text between brackets in
the appendix gives a hint about how these concepts could have be clustered.
4.3.3 Conclusion of the analysis
The goal of the concept analysis was to obtain insight in how other L&D departments
evaluate the value of their corporate L&D activities and on which information they
manage the department. From the concept analysis the following can be concluded:
In the management information about corporate L&D generally financial measures and
metrics are included. Also the performance of the internal operation is often assessed,
using the various elements of information derived from the practice of training
evaluation. Most commonly measured are concepts like Quality, Efficiency, Effectiveness,
Cost, Time, Impact, Performance and Satisfaction. The HR survey, the Learning
Management System and Evaluation results are potential data sources to construct the
information elements. Since every L&D department operates in its own environment and
with its own specific people and technologies the way of communicating and calculating
measures and metrics differs per department and audience. The L&D department, its
customers (business and learners) and the suppliers can be seen as the major categories
of occurring audiences.
The concepts brought together in cluster 1 can be used to obtain insight in the most
commonly used high-level information elements: Effectiveness, Impact, Performance,
Satisfaction, Time, Quality, Cost and Efficiency. For each concept of the cluster the
related lower level information elements are obtained from tables 19 till 28. and
presented in Table 35. However, due to the various definitions of the high-level elements
in use at the interviewed L&D departments, some concepts like quality, efficiency, cost
and effectiveness have multiple and diverse related lower level information elements.
Moreover, the information element number of provided learning hours over cost is even
related on a higher level to both cost and efficiency. Cost has only four related
information elements, while cluster 2 would suggest that more financially related
information elements are likely to be commonly used. All in all, the concepts of cluster 1
lead to a diverse list of lower level information elements. However, it seems that an
underlying structure/categorization for these lower information elements is lacking.
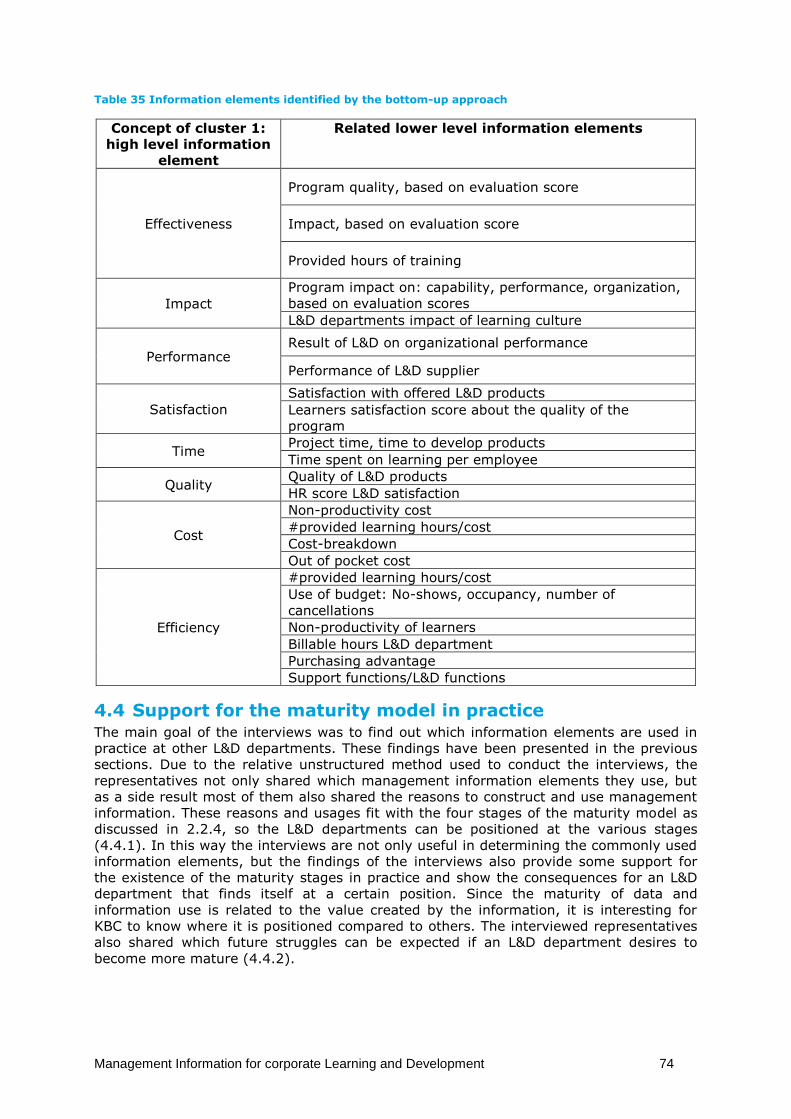
Management Information for corporate Learning and Development 74
Table 35 Information elements identified by the bottom-up approach
Concept of cluster 1:
high level information
element
Related lower level information elements
Effectiveness
Program quality, based on evaluation score
Impact, based on evaluation score
Provided hours of training
Impact
Program impact on: capability, performance, organization,
based on evaluation scores
L&D departments impact of learning culture
Performance Result of L&D on organizational performance
Performance of L&D supplier
Satisfaction
Satisfaction with offered L&D products
Learners satisfaction score about the quality of the
program
Time Project time, time to develop products
Time spent on learning per employee
Quality Quality of L&D products
HR score L&D satisfaction
Cost
Non-productivity cost
#provided learning hours/cost
Cost-breakdown
Out of pocket cost
Efficiency
#provided learning hours/cost
Use of budget: No-shows, occupancy, number of
cancellations
Non-productivity of learners
Billable hours L&D department
Purchasing advantage
Support functions/L&D functions
4.4 Support for the maturity model in practice The main goal of the interviews was to find out which information elements are used in
practice at other L&D departments. These findings have been presented in the previous
sections. Due to the relative unstructured method used to conduct the interviews, the
representatives not only shared which management information elements they use, but
as a side result most of them also shared the reasons to construct and use management
information. These reasons and usages fit with the four stages of the maturity model as
discussed in 2.2.4, so the L&D departments can be positioned at the various stages
(4.4.1). In this way the interviews are not only useful in determining the commonly used
information elements, but the findings of the interviews also provide some support for
the existence of the maturity stages in practice and show the consequences for an L&D
department that finds itself at a certain position. Since the maturity of data and
information use is related to the value created by the information, it is interesting for
KBC to know where it is positioned compared to others. The interviewed representatives
also shared which future struggles can be expected if an L&D department desires to
become more mature (4.4.2).
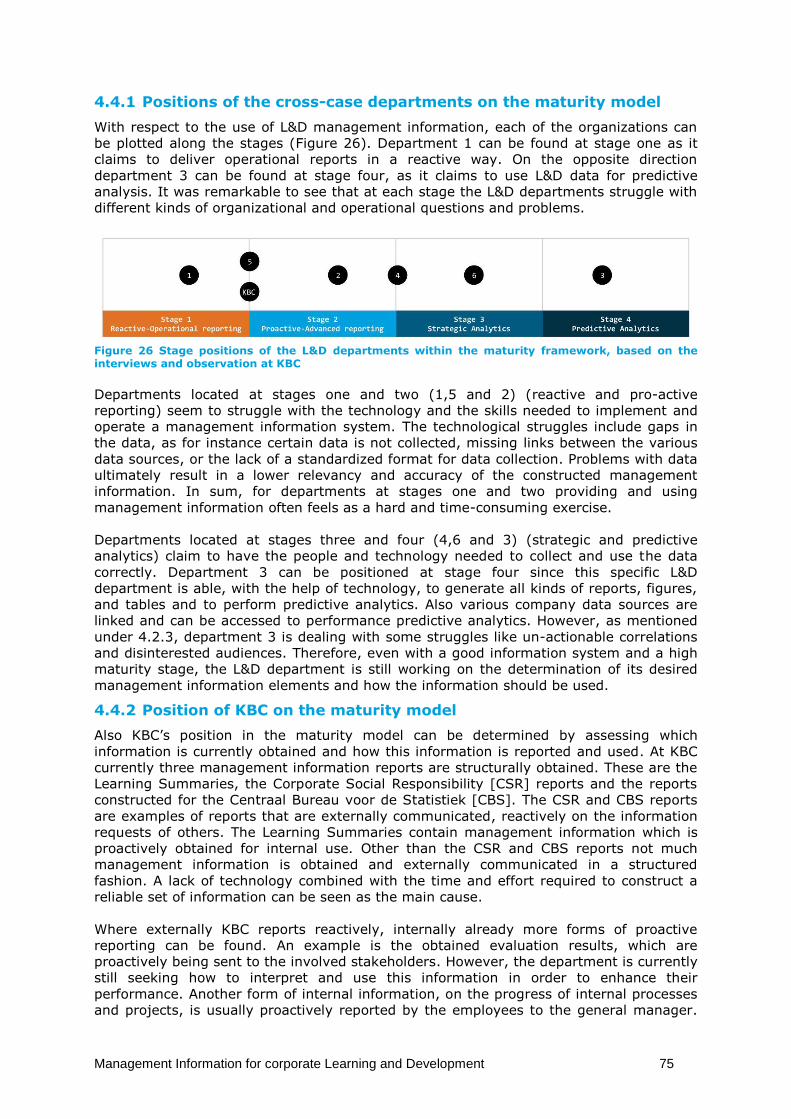
Management Information for corporate Learning and Development 75
4.4.1 Positions of the cross-case departments on the maturity model
With respect to the use of L&D management information, each of the organizations can
be plotted along the stages (Figure 26). Department 1 can be found at stage one as it
claims to deliver operational reports in a reactive way. On the opposite direction
department 3 can be found at stage four, as it claims to use L&D data for predictive
analysis. It was remarkable to see that at each stage the L&D departments struggle with
different kinds of organizational and operational questions and problems.
Figure 26 Stage positions of the L&D departments within the maturity framework, based on the interviews and observation at KBC
Departments located at stages one and two (1,5 and 2) (reactive and pro-active
reporting) seem to struggle with the technology and the skills needed to implement and
operate a management information system. The technological struggles include gaps in
the data, as for instance certain data is not collected, missing links between the various
data sources, or the lack of a standardized format for data collection. Problems with data
ultimately result in a lower relevancy and accuracy of the constructed management
information. In sum, for departments at stages one and two providing and using
management information often feels as a hard and time-consuming exercise.
Departments located at stages three and four (4,6 and 3) (strategic and predictive
analytics) claim to have the people and technology needed to collect and use the data
correctly. Department 3 can be positioned at stage four since this specific L&D
department is able, with the help of technology, to generate all kinds of reports, figures,
and tables and to perform predictive analytics. Also various company data sources are
linked and can be accessed to performance predictive analytics. However, as mentioned
under 4.2.3, department 3 is dealing with some struggles like un-actionable correlations
and disinterested audiences. Therefore, even with a good information system and a high
maturity stage, the L&D department is still working on the determination of its desired
management information elements and how the information should be used.
4.4.2 Position of KBC on the maturity model
Also KBC’s position in the maturity model can be determined by assessing which
information is currently obtained and how this information is reported and used. At KBC
currently three management information reports are structurally obtained. These are the
Learning Summaries, the Corporate Social Responsibility [CSR] reports and the reports
constructed for the Centraal Bureau voor de Statistiek [CBS]. The CSR and CBS reports
are examples of reports that are externally communicated, reactively on the information
requests of others. The Learning Summaries contain management information which is
proactively obtained for internal use. Other than the CSR and CBS reports not much
management information is obtained and externally communicated in a structured
fashion. A lack of technology combined with the time and effort required to construct a
reliable set of information can be seen as the main cause.
Where externally KBC reports reactively, internally already more forms of proactive
reporting can be found. An example is the obtained evaluation results, which are
proactively being sent to the involved stakeholders. However, the department is currently
still seeking how to interpret and use this information in order to enhance their
performance. Another form of internal information, on the progress of internal processes
and projects, is usually proactively reported by the employees to the general manager.
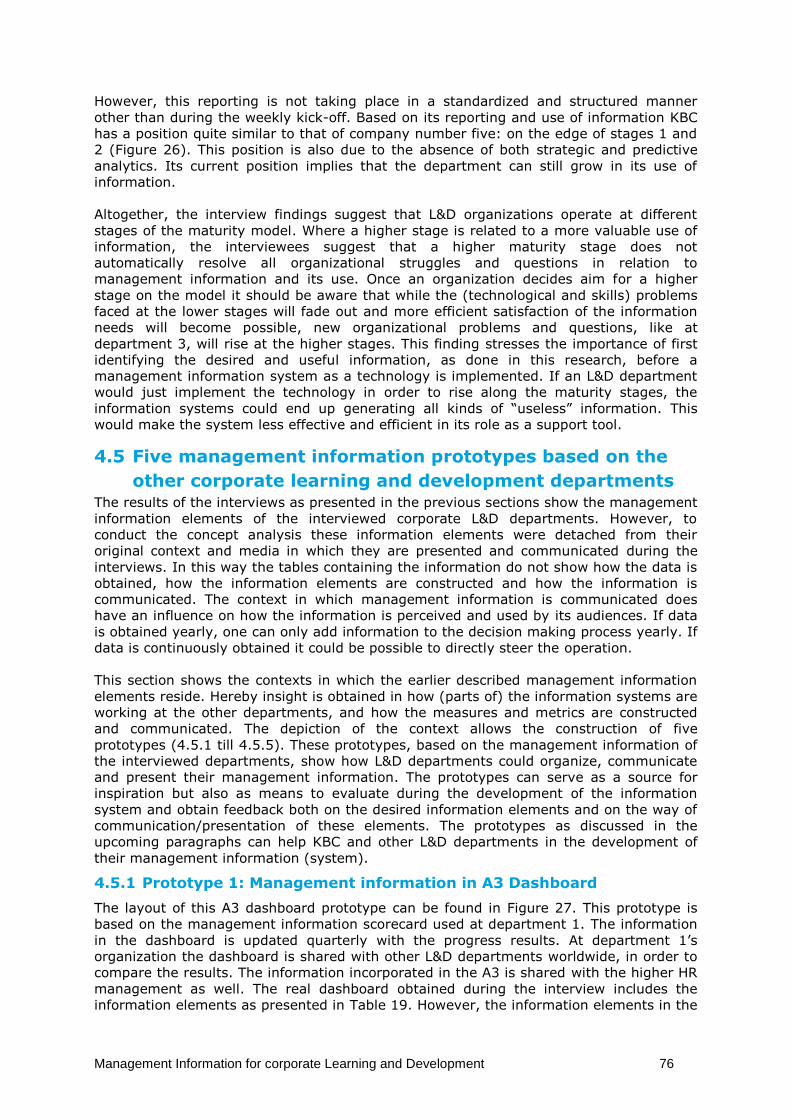
Management Information for corporate Learning and Development 76
However, this reporting is not taking place in a standardized and structured manner
other than during the weekly kick-off. Based on its reporting and use of information KBC
has a position quite similar to that of company number five: on the edge of stages 1 and
2 (Figure 26). This position is also due to the absence of both strategic and predictive
analytics. Its current position implies that the department can still grow in its use of
information.
Altogether, the interview findings suggest that L&D organizations operate at different
stages of the maturity model. Where a higher stage is related to a more valuable use of
information, the interviewees suggest that a higher maturity stage does not
automatically resolve all organizational struggles and questions in relation to
management information and its use. Once an organization decides aim for a higher
stage on the model it should be aware that while the (technological and skills) problems
faced at the lower stages will fade out and more efficient satisfaction of the information
needs will become possible, new organizational problems and questions, like at
department 3, will rise at the higher stages. This finding stresses the importance of first
identifying the desired and useful information, as done in this research, before a
management information system as a technology is implemented. If an L&D department
would just implement the technology in order to rise along the maturity stages, the
information systems could end up generating all kinds of “useless” information. This
would make the system less effective and efficient in its role as a support tool.
4.5 Five management information prototypes based on the
other corporate learning and development departments The results of the interviews as presented in the previous sections show the management
information elements of the interviewed corporate L&D departments. However, to
conduct the concept analysis these information elements were detached from their
original context and media in which they are presented and communicated during the
interviews. In this way the tables containing the information do not show how the data is
obtained, how the information elements are constructed and how the information is
communicated. The context in which management information is communicated does
have an influence on how the information is perceived and used by its audiences. If data
is obtained yearly, one can only add information to the decision making process yearly. If
data is continuously obtained it could be possible to directly steer the operation.
This section shows the contexts in which the earlier described management information
elements reside. Hereby insight is obtained in how (parts of) the information systems are
working at the other departments, and how the measures and metrics are constructed
and communicated. The depiction of the context allows the construction of five
prototypes (4.5.1 till 4.5.5). These prototypes, based on the management information of
the interviewed departments, show how L&D departments could organize, communicate
and present their management information. The prototypes can serve as a source for
inspiration but also as means to evaluate during the development of the information
system and obtain feedback both on the desired information elements and on the way of
communication/presentation of these elements. The prototypes as discussed in the
upcoming paragraphs can help KBC and other L&D departments in the development of
their management information (system).
4.5.1 Prototype 1: Management information in A3 Dashboard
The layout of this A3 dashboard prototype can be found in Figure 27. This prototype is
based on the management information scorecard used at department 1. The information
in the dashboard is updated quarterly with the progress results. At department 1’s
organization the dashboard is shared with other L&D departments worldwide, in order to
compare the results. The information incorporated in the A3 is shared with the higher HR
management as well. The real dashboard obtained during the interview includes the
information elements as presented in Table 19. However, the information elements in the
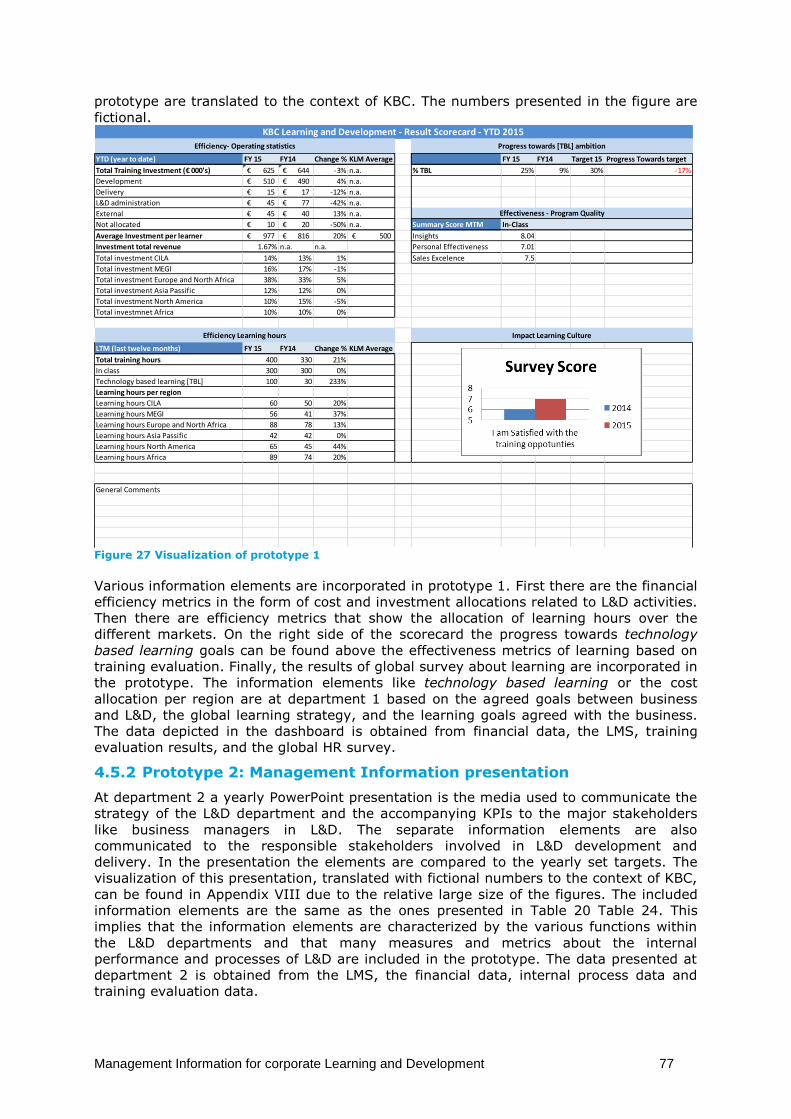
Management Information for corporate Learning and Development 77
prototype are translated to the context of KBC. The numbers presented in the figure are
fictional.
Figure 27 Visualization of prototype 1
Various information elements are incorporated in prototype 1. First there are the financial
efficiency metrics in the form of cost and investment allocations related to L&D activities.
Then there are efficiency metrics that show the allocation of learning hours over the
different markets. On the right side of the scorecard the progress towards technology
based learning goals can be found above the effectiveness metrics of learning based on
training evaluation. Finally, the results of global survey about learning are incorporated in
the prototype. The information elements like technology based learning or the cost
allocation per region are at department 1 based on the agreed goals between business
and L&D, the global learning strategy, and the learning goals agreed with the business.
The data depicted in the dashboard is obtained from financial data, the LMS, training
evaluation results, and the global HR survey.
4.5.2 Prototype 2: Management Information presentation
At department 2 a yearly PowerPoint presentation is the media used to communicate the
strategy of the L&D department and the accompanying KPIs to the major stakeholders
like business managers in L&D. The separate information elements are also
communicated to the responsible stakeholders involved in L&D development and
delivery. In the presentation the elements are compared to the yearly set targets. The
visualization of this presentation, translated with fictional numbers to the context of KBC,
can be found in Appendix VIII due to the relative large size of the figures. The included
information elements are the same as the ones presented in Table 20 Table 24. This
implies that the information elements are characterized by the various functions within
the L&D departments and that many measures and metrics about the internal
performance and processes of L&D are included in the prototype. The data presented at
department 2 is obtained from the LMS, the financial data, internal process data and
training evaluation data.
YTD (year to date) FY 15 FY14 Change % KLM Average FY 15 FY14 Target 15 Progress Towards target
Total Training Investment (€ 000's) 625€ 644€ -3% n.a. % TBL 25% 9% 30% -17%
Development 510€ 490€ 4% n.a.
Delivery 15€ 17€ -12% n.a.
L&D administration 45€ 77€ -42% n.a.
External 45€ 40€ 13% n.a.
Not allocated 10€ 20€ -50% n.a. Summary Score MTM In-Class
Average Investment per learner 977€ 816€ 20% 500€ Insights 8.04
Investment total revenue 1.67% n.a. n.a. Personal Effectiveness 7.01
Total investment CILA 14% 13% 1% Sales Excelence 7.5
Total investment MEGI 16% 17% -1%
Total investment Europe and North Africa 38% 33% 5%
Total investment Asia Passific 12% 12% 0%
Total investment North America 10% 15% -5%
Total investmnet Africa 10% 10% 0%
LTM (last twelve months) FY 15 FY14 Change % KLM Average
Total training hours 400 330 21%
In class 300 300 0%
Technology based learning [TBL] 100 30 233%
Learning hours per region
Learning hours CILA 60 50 20%
Learning hours MEGI 56 41 37%
Learning hours Europe and North Africa 88 78 13%
Learning hours Asia Passific 42 42 0%
Learning hours North America 65 45 44%
Learning hours Africa 89 74 20%
General Comments
Efficiency- Operating statistics
Efficiency Learning hours
Progress towards [TBL] ambition
KBC Learning and Development - Result Scorecard - YTD 2015
Effectiveness - Program Quality
Impact Learning Culture
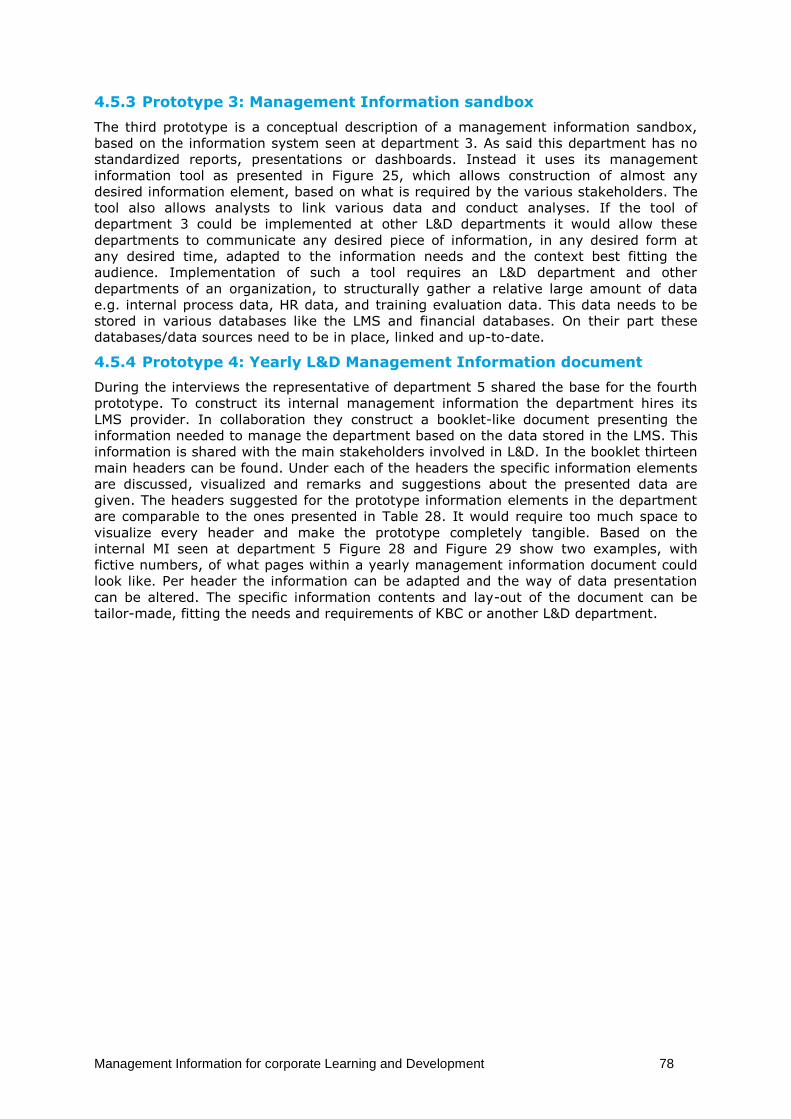
Management Information for corporate Learning and Development 78
4.5.3 Prototype 3: Management Information sandbox
The third prototype is a conceptual description of a management information sandbox,
based on the information system seen at department 3. As said this department has no
standardized reports, presentations or dashboards. Instead it uses its management
information tool as presented in Figure 25, which allows construction of almost any
desired information element, based on what is required by the various stakeholders. The
tool also allows analysts to link various data and conduct analyses. If the tool of
department 3 could be implemented at other L&D departments it would allow these
departments to communicate any desired piece of information, in any desired form at
any desired time, adapted to the information needs and the context best fitting the
audience. Implementation of such a tool requires an L&D department and other
departments of an organization, to structurally gather a relative large amount of data
e.g. internal process data, HR data, and training evaluation data. This data needs to be
stored in various databases like the LMS and financial databases. On their part these
databases/data sources need to be in place, linked and up-to-date.
4.5.4 Prototype 4: Yearly L&D Management Information document
During the interviews the representative of department 5 shared the base for the fourth
prototype. To construct its internal management information the department hires its
LMS provider. In collaboration they construct a booklet-like document presenting the
information needed to manage the department based on the data stored in the LMS. This
information is shared with the main stakeholders involved in L&D. In the booklet thirteen
main headers can be found. Under each of the headers the specific information elements
are discussed, visualized and remarks and suggestions about the presented data are
given. The headers suggested for the prototype information elements in the department
are comparable to the ones presented in Table 28. It would require too much space to
visualize every header and make the prototype completely tangible. Based on the
internal MI seen at department 5 Figure 28 and Figure 29 show two examples, with
fictive numbers, of what pages within a yearly management information document could
look like. Per header the information can be adapted and the way of data presentation
can be altered. The specific information contents and lay-out of the document can be
tailor-made, fitting the needs and requirements of KBC or another L&D department.
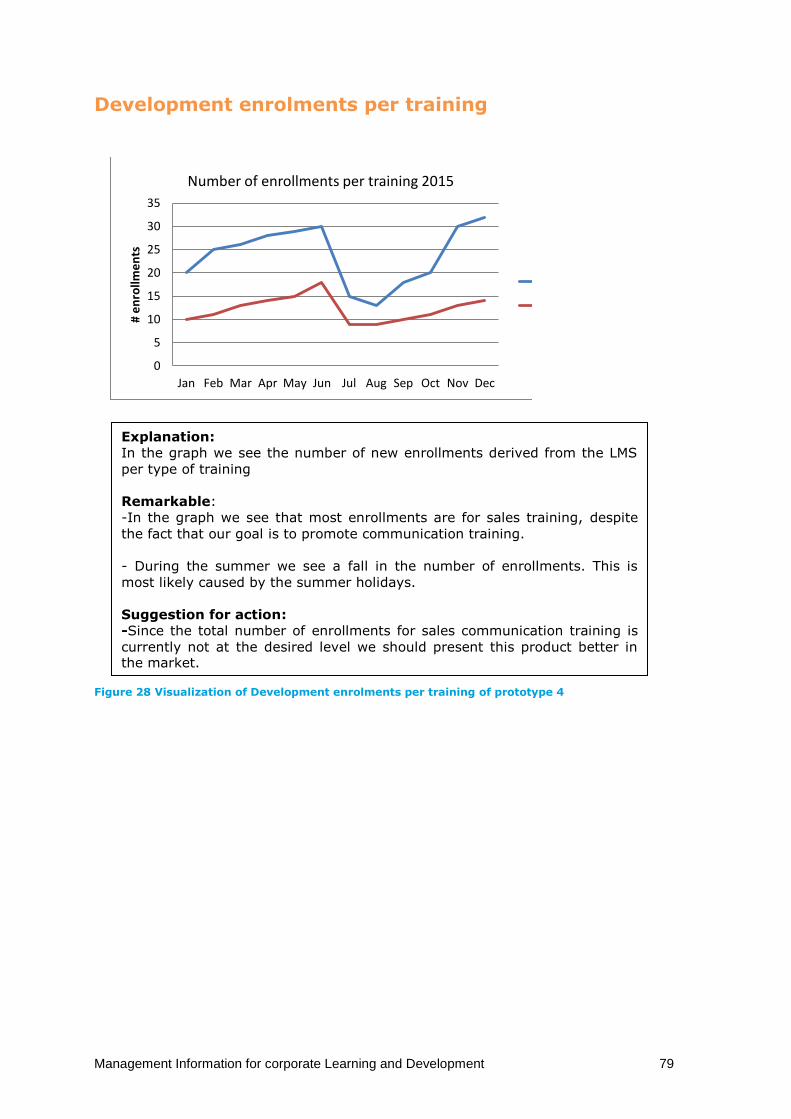
Management Information for corporate Learning and Development 79
Development enrolments per training
Figure 28 Visualization of Development enrolments per training of prototype 4
0
5
10
15
20
25
30
35
Jan Feb Mar Apr May Jun Jul Aug Sep Oct Nov Dec
# e
nro
llme
nts
Number of enrollments per training 2015
Explanation:
In the graph we see the number of new enrollments derived from the LMS
per type of training
Remarkable:
-In the graph we see that most enrollments are for sales training, despite
the fact that our goal is to promote communication training.
- During the summer we see a fall in the number of enrollments. This is
most likely caused by the summer holidays.
Suggestion for action:
-Since the total number of enrollments for sales communication training is
currently not at the desired level we should present this product better in the market.
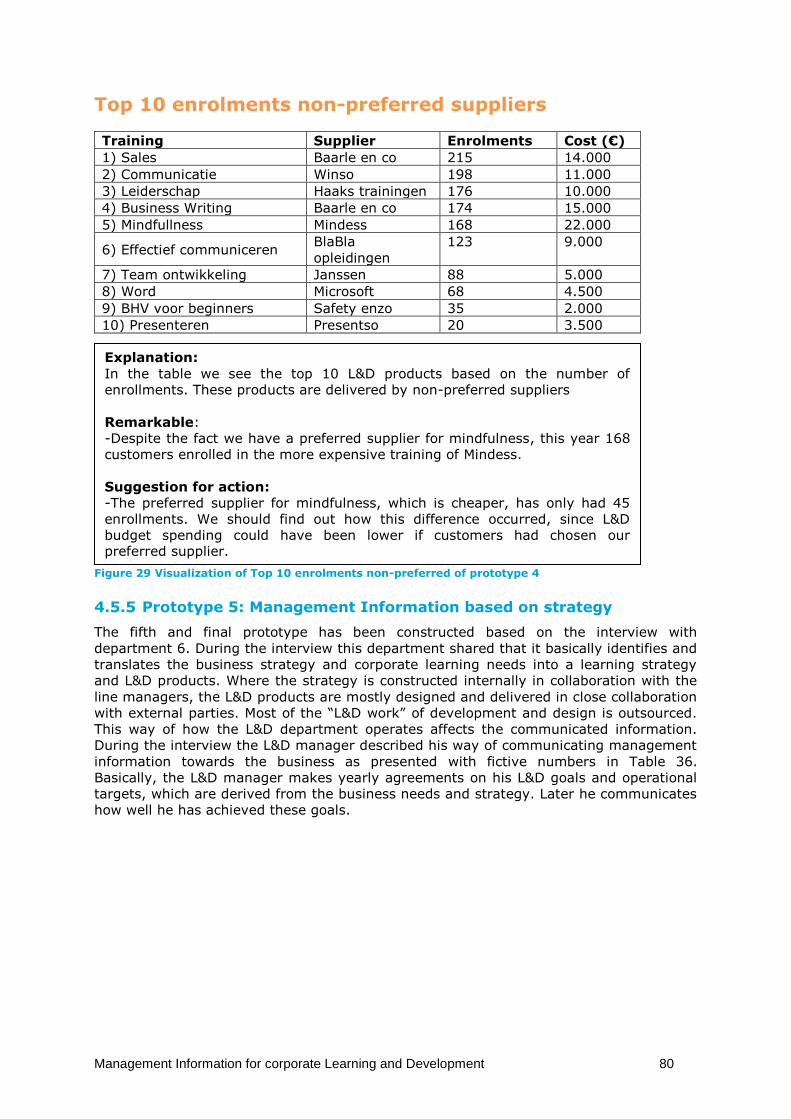
Management Information for corporate Learning and Development 80
Top 10 enrolments non-preferred suppliers
Training Supplier Enrolments Cost (€)
1) Sales Baarle en co 215 14.000
2) Communicatie Winso 198 11.000
3) Leiderschap Haaks trainingen 176 10.000
4) Business Writing Baarle en co 174 15.000
5) Mindfullness Mindess 168 22.000
6) Effectief communiceren BlaBla
opleidingen
123 9.000
7) Team ontwikkeling Janssen 88 5.000
8) Word Microsoft 68 4.500
9) BHV voor beginners Safety enzo 35 2.000
10) Presenteren Presentso 20 3.500
Figure 29 Visualization of Top 10 enrolments non-preferred of prototype 4
4.5.5 Prototype 5: Management Information based on strategy
The fifth and final prototype has been constructed based on the interview with
department 6. During the interview this department shared that it basically identifies and
translates the business strategy and corporate learning needs into a learning strategy
and L&D products. Where the strategy is constructed internally in collaboration with the
line managers, the L&D products are mostly designed and delivered in close collaboration
with external parties. Most of the “L&D work” of development and design is outsourced.
This way of how the L&D department operates affects the communicated information.
During the interview the L&D manager described his way of communicating management
information towards the business as presented with fictive numbers in Table 36.
Basically, the L&D manager makes yearly agreements on his L&D goals and operational
targets, which are derived from the business needs and strategy. Later he communicates
how well he has achieved these goals.
Explanation:
In the table we see the top 10 L&D products based on the number of
enrollments. These products are delivered by non-preferred suppliers
Remarkable:
-Despite the fact we have a preferred supplier for mindfulness, this year 168
customers enrolled in the more expensive training of Mindess.
Suggestion for action:
-The preferred supplier for mindfulness, which is cheaper, has only had 45
enrollments. We should find out how this difference occurred, since L&D
budget spending could have been lower if customers had chosen our preferred supplier.
Management Information for corporate Learning and Development 81
Table 36 Visualization of prototype 5
Business goal Audience and
needed competences
L&D solution Performed?
More sales in Africa [increase in revenue]
Sales reps. in Africa lack common sales skills
Sales training for African Sales reps.
● 80% of predetermined target group has followed training and passed the test ●Sales growth 4%
More sales in America [increase in revenue]
Sales reps. in America lack best practice sharing platform
Develop a platform for best practice sharing
● 100% of the American sales reps have an account for the platform ●daily 7 best practices are shared ●Sales growth 5%
Managers should function as the role models for our employees. [Increase in employee satisfaction score HR survey about management]
Worldwide, Level 3 managers lack coaching skills
Coaching training for level 3 managers
● 100% of the American managers have followed the course ●2pnt increase on management satisfaction score in HR survey ● 60% of the African managers have followed the course ●1.5 pnt increase on management satisfaction score in HR survey ● 20% of the European managers have followed the course ● no increase on management satisfaction score in HR survey
4.6 Summarizing conclusion The goal of the cross-case analysis was to obtain insight in the generally used
management information (systems) at corporate L&D departments. For this purpose six
representatives of departments have been interviewed. During these interviews most of
these representatives shared how they use MI in their daily operation and which
information elements they communicate. Concept analysis and clustering leads to seven
clusters of concepts for corporate L&D management information. One of these clusters
indicates the generally communicated and used high-level information elements like
time, cost, efficiency and effectiveness. Due to different definitions the lower level
indicators like Quality of L&D products, Satisfaction with offered L&D products and Non-
productivity of learners are less structured. Financial data and training evaluation data
are two main categories of information elements. The clustering also showed that HR
surveys and LMS are used to obtain the desired information and that the L&D
department, its customers (business and learners) and the suppliers can be seen as the
major categories of occurring audiences.
The identified information elements can be seen as the primary result of the bottom-up
approach. Besides these elements the interviews form the base of some secondary
outcomes. First there is support for the existence of the stages of the maturity model, as
the different departments can be related to these stages. The five prototypes are the
other secondary outcome of the interviews. These prototypes can later in the
development process be used to communicate the desired information elements. In this
way the prototypes are used as a tool to test and obtain feedback in order to find the
best way for communication of the desired information.
Where this chapter used the bottom-up approach the upcoming chapter will use a top-
down approach to derive information elements. Due to the top-down approach the
information elements will be based on the core processes and strategies of KBC. Since
the top-down approach can be seen as a structured way to derive elements, it is likely
that the obtained elements in the next chapter will be less ambiguous and easier to
structure and categorize than the element obtained indentified by the bottom-up
approach.
Management Information for corporate Learning and Development 82
5 Deriving corporate L&D management information
elements from the top-down The previous chapter used a cross-case analysis to derive management information
elements from the bottom up. As discussed in chapter 2 sole use of a bottom-up
approach to determine information elements can be dangerous since a connection
between the organization’s specific environment and the selected information elements
might lack. As a result the L&D department might select irrelevant indicators given its
environment, characterized by company specific factors like strategies, processes, roles
and tasks. In order to ensure that the information elements align with the specific
environment and are viable and feasible, they could be derived using a top-down
approach. In order to derive information elements from the top down various approaches
have been developed. As presented in chapter 2, these approaches have in common to
start on the strategy level and end, via the (core) processes, on the information element
level, i.e. measures and metrics.
As stated in chapter 3, in which the operation of a corporate L&D department has been
described, this chapter will provide an answer to the remaining part of the sub-question:
“How does a corporate learning and development department operate and what
information elements can be derived from the operation?”. In order to derive the
information elements a top-down approach will be used. To use the top-down approach
first a point-of-view [POV] has to be formulated. The POV helps to demarcate for which
desired audiences the information elements will be determined, since each audience has
different information needs and desires different information elements (5.1). To conduct
the top-down approach the questions and framework of the Balanced Score Card [BSC],
developed by Kaplan & Norton (2007), have been selected. In order to derive information
elements the BSC starts at the strategy and vision, from which measures and metrics are
deducted taking the multidimensional conceptualization of performance into account. This
multidimensional conceptualization is captured by the four perspectives of the BSC:
financial, customer, learning and growth, and internal business processes (5.2). The top-
down approach results in a variety of management information elements, categorized by
the four perspectives of the BSC (5.3 till 5.6). From the variety of management
information elements selected group can be categorized as initially desired (5.7).
5.1 Define point of view The first step in deriving measures and metrics is to define a point-of-view. This POV is
composed of a user, his needs, and an obtained insight. The POV helps in delimiting the
initial desired audience for which the information elements will be derived. Since each
audience requires its own types and granularity of information inclusion of all audiences
in a POV would most likely have too large a set of initial desired information elements as
a result. For derivation of the information elements the POV is framed as: Managers
involved in the corporate L&D and the business environment, need a Management
Information System and accompanying information elements in order to manage their
business and improve the performance of their organization.
The POV as described above sees the “management group” involved in L&D and the
business as the user. The Commercial EVPs, the manager KLM Human Resources and the
General Manager of KBC are, in this research, seen as this management group. The POV
thereby excludes users and thus audiences like the L&D product developers and
designers, trainers, and learning consultants. As explained above, these potential users
have been excluded in order to delimit the initial desired set of information elements.
Later in the development process of the information system it is still possible to derive
information elements for other users and audiences.
The POV has been translated into the following question: What information does a
manager need in order to manage the corporate L&D department as a business? Note
that the question is not to be seen as a substitute for the research question. The question
Management Information for corporate Learning and Development 83
is constructed to derive the measures and metrics from the top down, as the answer to
the question indicates information elements that are desired and viable. The business
part has been added since it links the systems perspective on L&D, which sees the L&D
department/KBC as a separate business entity, with the information elements.
5.2 Using the Balanced Score Card to derive information
elements In practice managers quite often use the BSC to determine their management
information. In the upcoming sections the BSC (Appendix I) will be used to derive the
information elements for KBC as a corporate L&D department. Basically it means that the
first two columns (objectives and measures) of the four balanced score card sections are
filled. Later in the development process the other two columns (targets and initiatives)
could be determined, once the initial objectives and desired information elements are
evaluated with the various managers.
As mentioned in the introduction of this chapter, the BSC has been selected since its
purpose is to derive the information elements from the top down, while taking the multi-
dimensional conceptualization of performance and the required balancing of measures
into account. The starting point of the BSC, like any top-down approach, is the vision and
strategy of an organization. From this vision and strategy objectives are to be
determined, based on the answers to the following four questions:
-To succeed financially how should we appear to our shareholders?
-To achieve our vision, how should we appear to our customers?
-To achieve our vision, how will we sustain our ability to change and improve?
-To satisfy our shareholders and customers, which business processes should we
excel at? (Kaplan & Norton, 2007).
Based on the objectives, measures can be deducted which should monitor the current
state or progress towards the objectives. In order to set objectives and determine
measures that fit the operations and environment of KBC, the top-down approach has
been done in collaboration with the general manager. During the derivation of
information elements, the measures obtained during the cross-case analysis have been
used as a source for inspiration. The upcoming sections (5.3 till 5.6) each present the
steps taken for, and the results of, translating the strategy and vision, determining the
objectives and deducting the accompanying main and other measures for the four
sections of the scorecard.
5.3 Financial objectives and measures The first section of the BSC encompasses the financial objectives and measures. In order
to succeed financially, and receive its monetary resources, KBC should appear financially
healthy to its shareholders; those who invest in the department and assign the financial
resources. Making profit, one of the most common objectives of any business, would be a
relatively strange objective for a healthy financial appearance of an internal operating
department, since it would imply that AFKL is paying more for L&D than necessary
compared to the cost of KBC. For this reason it is decided to use the Total Cost of
Ownership [TCO], instead of profit, to assess the financial position of the L&D
department (5.3.1). The TCO is defined as all the yearly costs, direct and indirect,
required to operate the L&D department and provide the L&D products to the market
(5.3.2). In order to construct the TCO an allocation key/cost breakdown will have to be
defined (5.3.3).
5.3.1 Financial objectives
The objective of KBC is to lower the total cost of ownership. However, a sole focus on
cost reduction could lead to situations where for instance the quality and the impact of an
L&D product become subordinate to the cost. Therefore the objective of lowering the TCO
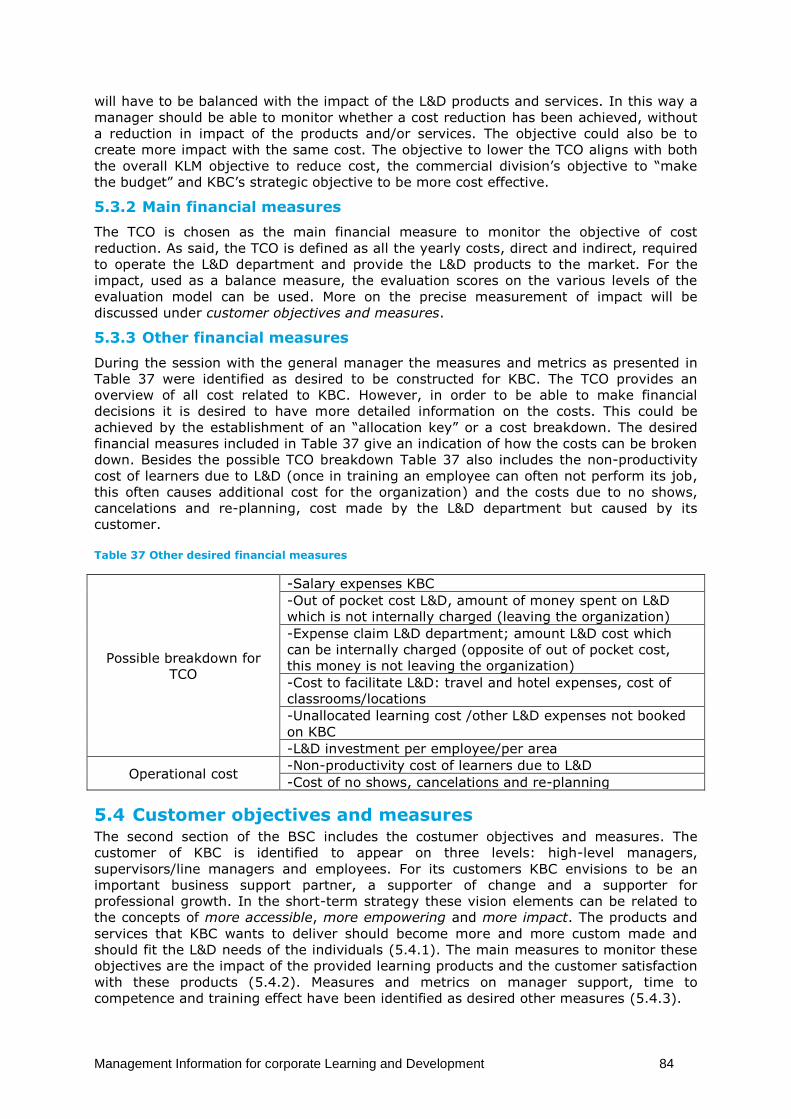
Management Information for corporate Learning and Development 84
will have to be balanced with the impact of the L&D products and services. In this way a
manager should be able to monitor whether a cost reduction has been achieved, without
a reduction in impact of the products and/or services. The objective could also be to
create more impact with the same cost. The objective to lower the TCO aligns with both
the overall KLM objective to reduce cost, the commercial division’s objective to “make
the budget” and KBC’s strategic objective to be more cost effective.
5.3.2 Main financial measures
The TCO is chosen as the main financial measure to monitor the objective of cost
reduction. As said, the TCO is defined as all the yearly costs, direct and indirect, required
to operate the L&D department and provide the L&D products to the market. For the
impact, used as a balance measure, the evaluation scores on the various levels of the
evaluation model can be used. More on the precise measurement of impact will be
discussed under customer objectives and measures.
5.3.3 Other financial measures
During the session with the general manager the measures and metrics as presented in
Table 37 were identified as desired to be constructed for KBC. The TCO provides an
overview of all cost related to KBC. However, in order to be able to make financial
decisions it is desired to have more detailed information on the costs. This could be
achieved by the establishment of an “allocation key” or a cost breakdown. The desired
financial measures included in Table 37 give an indication of how the costs can be broken
down. Besides the possible TCO breakdown Table 37 also includes the non-productivity
cost of learners due to L&D (once in training an employee can often not perform its job,
this often causes additional cost for the organization) and the costs due to no shows,
cancelations and re-planning, cost made by the L&D department but caused by its
customer.
Table 37 Other desired financial measures
Possible breakdown for
TCO
-Salary expenses KBC
-Out of pocket cost L&D, amount of money spent on L&D
which is not internally charged (leaving the organization)
-Expense claim L&D department; amount L&D cost which
can be internally charged (opposite of out of pocket cost,
this money is not leaving the organization)
-Cost to facilitate L&D: travel and hotel expenses, cost of
classrooms/locations
-Unallocated learning cost /other L&D expenses not booked
on KBC
-L&D investment per employee/per area
Operational cost -Non-productivity cost of learners due to L&D
-Cost of no shows, cancelations and re-planning
5.4 Customer objectives and measures The second section of the BSC includes the costumer objectives and measures. The
customer of KBC is identified to appear on three levels: high-level managers,
supervisors/line managers and employees. For its customers KBC envisions to be an
important business support partner, a supporter of change and a supporter for
professional growth. In the short-term strategy these vision elements can be related to
the concepts of more accessible, more empowering and more impact. The products and
services that KBC wants to deliver should become more and more custom made and
should fit the L&D needs of the individuals (5.4.1). The main measures to monitor these
objectives are the impact of the provided learning products and the customer satisfaction
with these products (5.4.2). Measures and metrics on manager support, time to
competence and training effect have been identified as desired other measures (5.4.3).
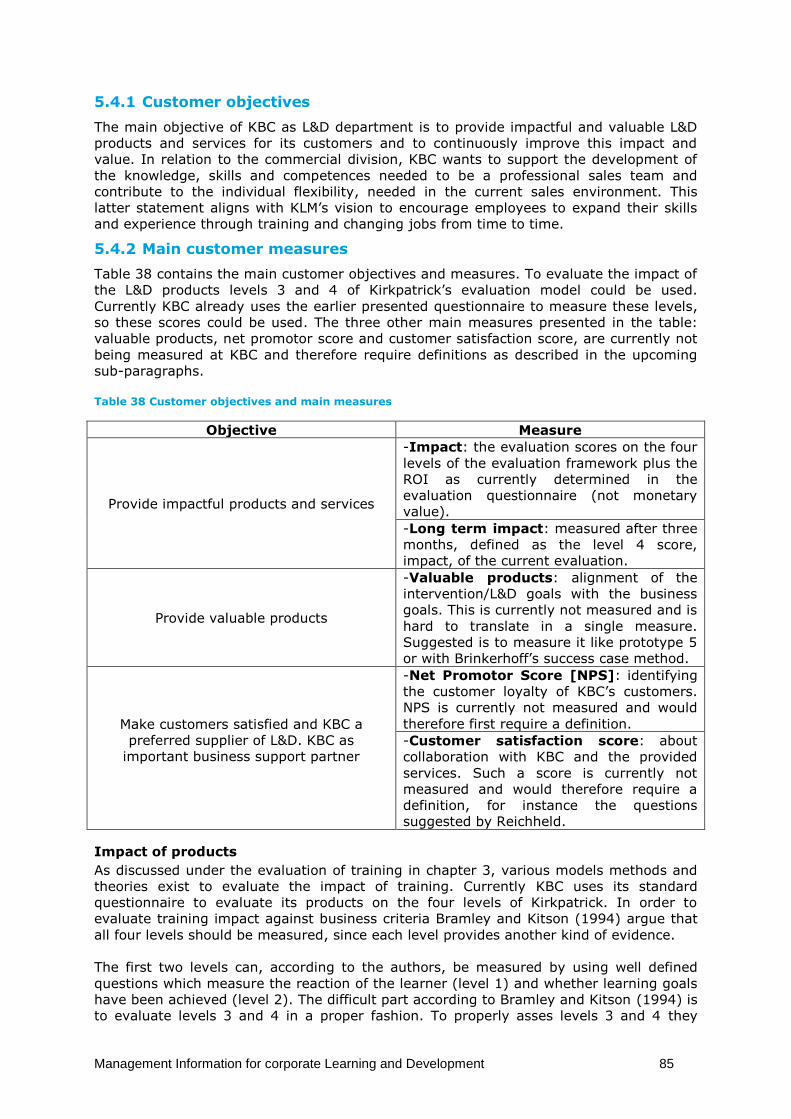
Management Information for corporate Learning and Development 85
5.4.1 Customer objectives
The main objective of KBC as L&D department is to provide impactful and valuable L&D
products and services for its customers and to continuously improve this impact and
value. In relation to the commercial division, KBC wants to support the development of
the knowledge, skills and competences needed to be a professional sales team and
contribute to the individual flexibility, needed in the current sales environment. This
latter statement aligns with KLM’s vision to encourage employees to expand their skills
and experience through training and changing jobs from time to time.
5.4.2 Main customer measures
Table 38 contains the main customer objectives and measures. To evaluate the impact of
the L&D products levels 3 and 4 of Kirkpatrick’s evaluation model could be used.
Currently KBC already uses the earlier presented questionnaire to measure these levels,
so these scores could be used. The three other main measures presented in the table:
valuable products, net promotor score and customer satisfaction score, are currently not
being measured at KBC and therefore require definitions as described in the upcoming
sub-paragraphs.
Table 38 Customer objectives and main measures
Objective Measure
Provide impactful products and services
-Impact: the evaluation scores on the four
levels of the evaluation framework plus the
ROI as currently determined in the
evaluation questionnaire (not monetary
value).
-Long term impact: measured after three
months, defined as the level 4 score,
impact, of the current evaluation.
Provide valuable products
-Valuable products: alignment of the
intervention/L&D goals with the business
goals. This is currently not measured and is
hard to translate in a single measure.
Suggested is to measure it like prototype 5
or with Brinkerhoff’s success case method.
Make customers satisfied and KBC a
preferred supplier of L&D. KBC as
important business support partner
-Net Promotor Score [NPS]: identifying
the customer loyalty of KBC’s customers.
NPS is currently not measured and would
therefore first require a definition.
-Customer satisfaction score: about
collaboration with KBC and the provided
services. Such a score is currently not
measured and would therefore require a
definition, for instance the questions
suggested by Reichheld.
Impact of products
As discussed under the evaluation of training in chapter 3, various models methods and
theories exist to evaluate the impact of training. Currently KBC uses its standard
questionnaire to evaluate its products on the four levels of Kirkpatrick. In order to
evaluate training impact against business criteria Bramley and Kitson (1994) argue that
all four levels should be measured, since each level provides another kind of evidence.
The first two levels can, according to the authors, be measured by using well defined
questions which measure the reaction of the learner (level 1) and whether learning goals
have been achieved (level 2). The difficult part according to Bramley and Kitson (1994) is
to evaluate levels 3 and 4 in a proper fashion. To properly asses levels 3 and 4 they
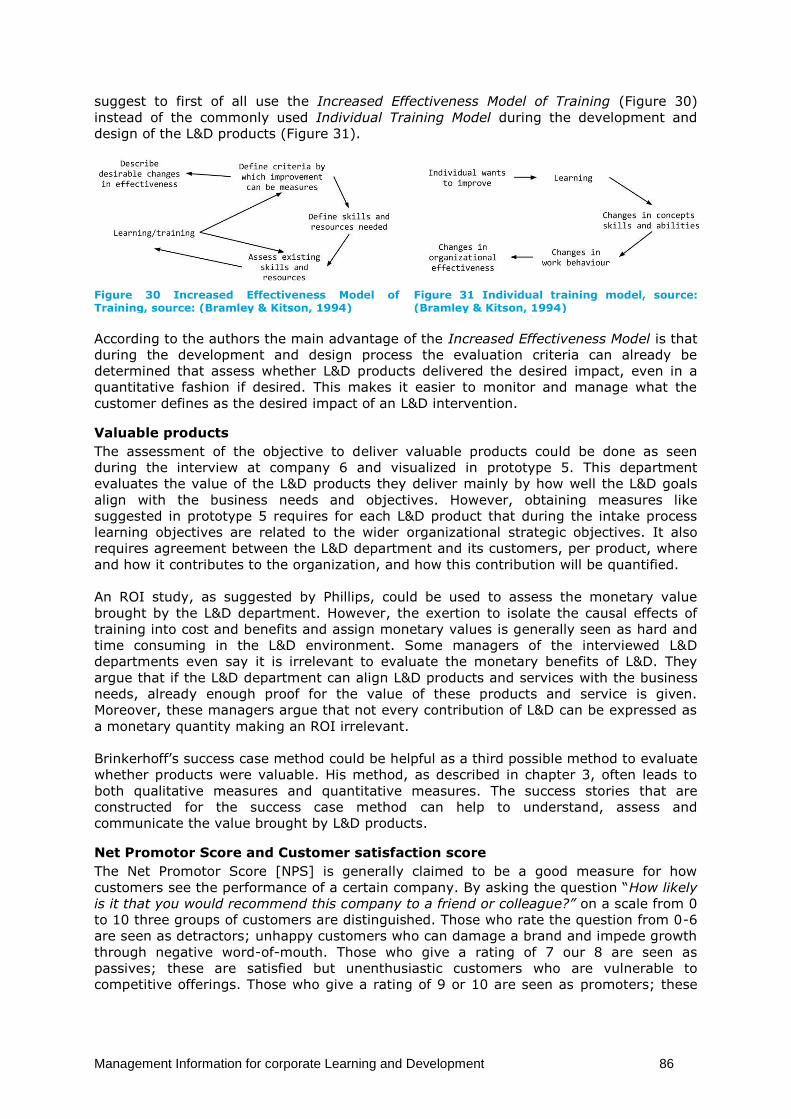
Management Information for corporate Learning and Development 86
suggest to first of all use the Increased Effectiveness Model of Training (Figure 30)
instead of the commonly used Individual Training Model during the development and
design of the L&D products (Figure 31).
Figure 30 Increased Effectiveness Model of Training, source: (Bramley & Kitson, 1994)
Figure 31 Individual training model, source: (Bramley & Kitson, 1994)
According to the authors the main advantage of the Increased Effectiveness Model is that
during the development and design process the evaluation criteria can already be
determined that assess whether L&D products delivered the desired impact, even in a
quantitative fashion if desired. This makes it easier to monitor and manage what the
customer defines as the desired impact of an L&D intervention.
Valuable products
The assessment of the objective to deliver valuable products could be done as seen
during the interview at company 6 and visualized in prototype 5. This department
evaluates the value of the L&D products they deliver mainly by how well the L&D goals
align with the business needs and objectives. However, obtaining measures like
suggested in prototype 5 requires for each L&D product that during the intake process
learning objectives are related to the wider organizational strategic objectives. It also
requires agreement between the L&D department and its customers, per product, where
and how it contributes to the organization, and how this contribution will be quantified.
An ROI study, as suggested by Phillips, could be used to assess the monetary value
brought by the L&D department. However, the exertion to isolate the causal effects of
training into cost and benefits and assign monetary values is generally seen as hard and
time consuming in the L&D environment. Some managers of the interviewed L&D
departments even say it is irrelevant to evaluate the monetary benefits of L&D. They
argue that if the L&D department can align L&D products and services with the business
needs, already enough proof for the value of these products and service is given.
Moreover, these managers argue that not every contribution of L&D can be expressed as
a monetary quantity making an ROI irrelevant.
Brinkerhoff’s success case method could be helpful as a third possible method to evaluate
whether products were valuable. His method, as described in chapter 3, often leads to
both qualitative measures and quantitative measures. The success stories that are
constructed for the success case method can help to understand, assess and
communicate the value brought by L&D products.
Net Promotor Score and Customer satisfaction score
The Net Promotor Score [NPS] is generally claimed to be a good measure for how
customers see the performance of a certain company. By asking the question “How likely
is it that you would recommend this company to a friend or colleague?” on a scale from 0
to 10 three groups of customers are distinguished. Those who rate the question from 0-6
are seen as detractors; unhappy customers who can damage a brand and impede growth
through negative word-of-mouth. Those who give a rating of 7 our 8 are seen as
passives; these are satisfied but unenthusiastic customers who are vulnerable to
competitive offerings. Those who give a rating of 9 or 10 are seen as promoters; these
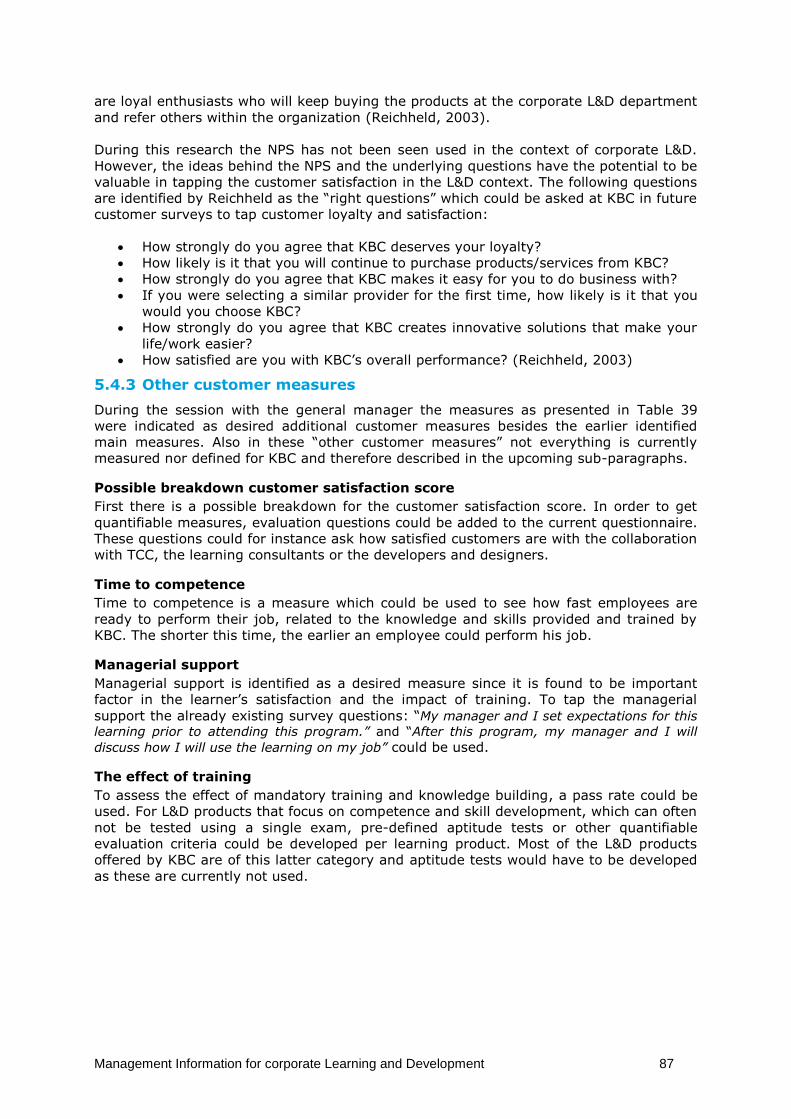
Management Information for corporate Learning and Development 87
are loyal enthusiasts who will keep buying the products at the corporate L&D department
and refer others within the organization (Reichheld, 2003).
During this research the NPS has not been seen used in the context of corporate L&D.
However, the ideas behind the NPS and the underlying questions have the potential to be
valuable in tapping the customer satisfaction in the L&D context. The following questions
are identified by Reichheld as the “right questions” which could be asked at KBC in future
customer surveys to tap customer loyalty and satisfaction:
How strongly do you agree that KBC deserves your loyalty?
How likely is it that you will continue to purchase products/services from KBC?
How strongly do you agree that KBC makes it easy for you to do business with?
If you were selecting a similar provider for the first time, how likely is it that you
would you choose KBC?
How strongly do you agree that KBC creates innovative solutions that make your
life/work easier?
How satisfied are you with KBC’s overall performance? (Reichheld, 2003)
5.4.3 Other customer measures
During the session with the general manager the measures as presented in Table 39
were indicated as desired additional customer measures besides the earlier identified
main measures. Also in these “other customer measures” not everything is currently
measured nor defined for KBC and therefore described in the upcoming sub-paragraphs.
Possible breakdown customer satisfaction score
First there is a possible breakdown for the customer satisfaction score. In order to get
quantifiable measures, evaluation questions could be added to the current questionnaire.
These questions could for instance ask how satisfied customers are with the collaboration
with TCC, the learning consultants or the developers and designers.
Time to competence
Time to competence is a measure which could be used to see how fast employees are
ready to perform their job, related to the knowledge and skills provided and trained by
KBC. The shorter this time, the earlier an employee could perform his job.
Managerial support
Managerial support is identified as a desired measure since it is found to be important
factor in the learner’s satisfaction and the impact of training. To tap the managerial
support the already existing survey questions: “My manager and I set expectations for this
learning prior to attending this program.” and “After this program, my manager and I will
discuss how I will use the learning on my job” could be used.
The effect of training
To assess the effect of mandatory training and knowledge building, a pass rate could be
used. For L&D products that focus on competence and skill development, which can often
not be tested using a single exam, pre-defined aptitude tests or other quantifiable
evaluation criteria could be developed per learning product. Most of the L&D products
offered by KBC are of this latter category and aptitude tests would have to be developed
as these are currently not used.
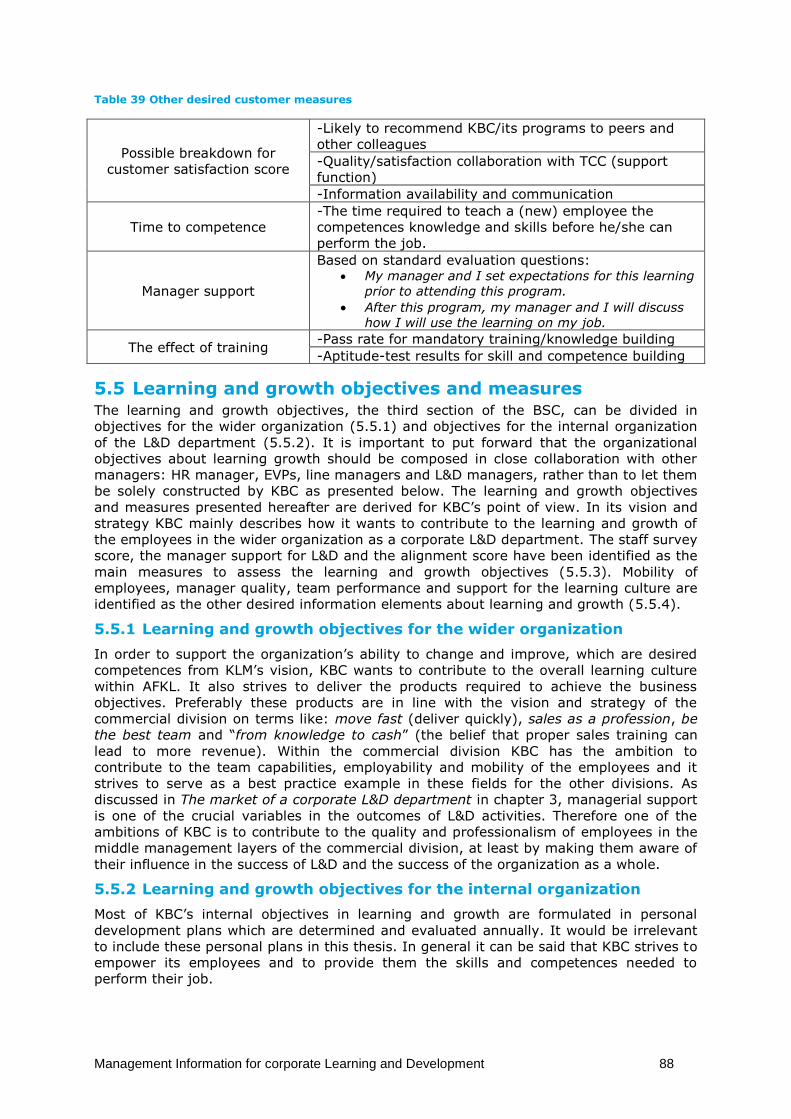
Management Information for corporate Learning and Development 88
Table 39 Other desired customer measures
Possible breakdown for
customer satisfaction score
-Likely to recommend KBC/its programs to peers and
other colleagues
-Quality/satisfaction collaboration with TCC (support
function)
-Information availability and communication
Time to competence
-The time required to teach a (new) employee the
competences knowledge and skills before he/she can
perform the job.
Manager support
Based on standard evaluation questions: My manager and I set expectations for this learning
prior to attending this program.
After this program, my manager and I will discuss
how I will use the learning on my job.
The effect of training -Pass rate for mandatory training/knowledge building
-Aptitude-test results for skill and competence building
5.5 Learning and growth objectives and measures The learning and growth objectives, the third section of the BSC, can be divided in
objectives for the wider organization (5.5.1) and objectives for the internal organization
of the L&D department (5.5.2). It is important to put forward that the organizational
objectives about learning growth should be composed in close collaboration with other
managers: HR manager, EVPs, line managers and L&D managers, rather than to let them
be solely constructed by KBC as presented below. The learning and growth objectives
and measures presented hereafter are derived for KBC’s point of view. In its vision and
strategy KBC mainly describes how it wants to contribute to the learning and growth of
the employees in the wider organization as a corporate L&D department. The staff survey
score, the manager support for L&D and the alignment score have been identified as the
main measures to assess the learning and growth objectives (5.5.3). Mobility of
employees, manager quality, team performance and support for the learning culture are
identified as the other desired information elements about learning and growth (5.5.4).
5.5.1 Learning and growth objectives for the wider organization
In order to support the organization’s ability to change and improve, which are desired
competences from KLM’s vision, KBC wants to contribute to the overall learning culture
within AFKL. It also strives to deliver the products required to achieve the business
objectives. Preferably these products are in line with the vision and strategy of the
commercial division on terms like: move fast (deliver quickly), sales as a profession, be
the best team and “from knowledge to cash” (the belief that proper sales training can
lead to more revenue). Within the commercial division KBC has the ambition to
contribute to the team capabilities, employability and mobility of the employees and it
strives to serve as a best practice example in these fields for the other divisions. As
discussed in The market of a corporate L&D department in chapter 3, managerial support
is one of the crucial variables in the outcomes of L&D activities. Therefore one of the
ambitions of KBC is to contribute to the quality and professionalism of employees in the
middle management layers of the commercial division, at least by making them aware of
their influence in the success of L&D and the success of the organization as a whole.
5.5.2 Learning and growth objectives for the internal organization
Most of KBC’s internal objectives in learning and growth are formulated in personal
development plans which are determined and evaluated annually. It would be irrelevant
to include these personal plans in this thesis. In general it can be said that KBC strives to
empower its employees and to provide them the skills and competences needed to
perform their job.
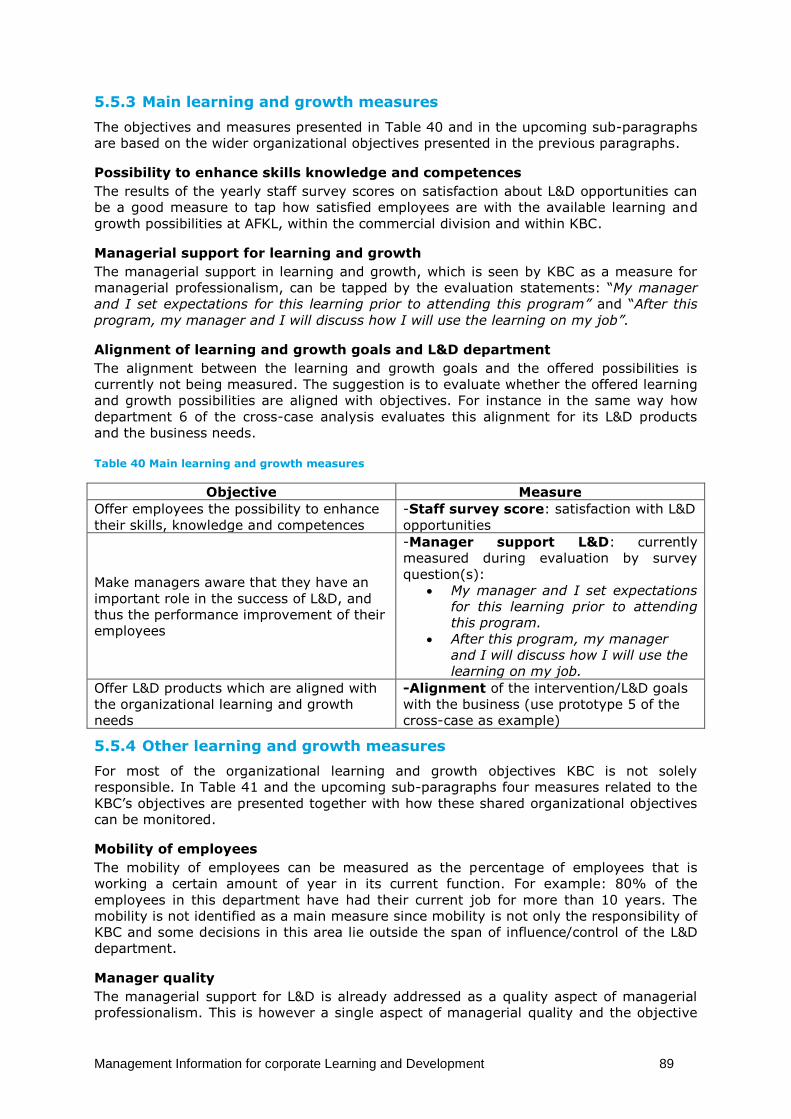
Management Information for corporate Learning and Development 89
5.5.3 Main learning and growth measures
The objectives and measures presented in Table 40 and in the upcoming sub-paragraphs
are based on the wider organizational objectives presented in the previous paragraphs.
Possibility to enhance skills knowledge and competences
The results of the yearly staff survey scores on satisfaction about L&D opportunities can
be a good measure to tap how satisfied employees are with the available learning and
growth possibilities at AFKL, within the commercial division and within KBC.
Managerial support for learning and growth
The managerial support in learning and growth, which is seen by KBC as a measure for
managerial professionalism, can be tapped by the evaluation statements: “My manager
and I set expectations for this learning prior to attending this program” and “After this
program, my manager and I will discuss how I will use the learning on my job”.
Alignment of learning and growth goals and L&D department
The alignment between the learning and growth goals and the offered possibilities is
currently not being measured. The suggestion is to evaluate whether the offered learning
and growth possibilities are aligned with objectives. For instance in the same way how
department 6 of the cross-case analysis evaluates this alignment for its L&D products
and the business needs.
Table 40 Main learning and growth measures
Objective Measure
Offer employees the possibility to enhance
their skills, knowledge and competences
-Staff survey score: satisfaction with L&D
opportunities
Make managers aware that they have an
important role in the success of L&D, and
thus the performance improvement of their
employees
-Manager support L&D: currently
measured during evaluation by survey
question(s):
My manager and I set expectations
for this learning prior to attending
this program.
After this program, my manager
and I will discuss how I will use the
learning on my job.
Offer L&D products which are aligned with
the organizational learning and growth
needs
-Alignment of the intervention/L&D goals
with the business (use prototype 5 of the
cross-case as example)
5.5.4 Other learning and growth measures
For most of the organizational learning and growth objectives KBC is not solely
responsible. In Table 41 and the upcoming sub-paragraphs four measures related to the
KBC’s objectives are presented together with how these shared organizational objectives
can be monitored.
Mobility of employees
The mobility of employees can be measured as the percentage of employees that is
working a certain amount of year in its current function. For example: 80% of the
employees in this department have had their current job for more than 10 years. The
mobility is not identified as a main measure since mobility is not only the responsibility of
KBC and some decisions in this area lie outside the span of influence/control of the L&D
department.
Manager quality
The managerial support for L&D is already addressed as a quality aspect of managerial
professionalism. This is however a single aspect of managerial quality and the objective
Management Information for corporate Learning and Development 90
to improve this quality is larger than only L&D support. In order to measure managerial
quality Air France currently uses a managerial practice development score. This score
taps seven competences found important as professional managerial competences within
Air France. A similar score could be introduced for the managers in the commercial
division and be used by KBC to measure whether L&D has impact. Since managerial
quality is not only the responsibility of KBC this score is not seen as a main measure. The
decision to introduce such a management quality score for the commercial division
should be made in close collaboration with other stakeholders within the organization.
Team performance
By some of the L&D products provided by KBC the department has some influence on the
performance of teams within the commercial division and AFKLM. However, team
performance is not something that is only influenced by L&D and therefore a measure for
team performance is not identified as a main measure for KBC. If it is desired to measure
team performance one needs to be aware that the construct is hard to tap by a single
measure, given the wide variety of aspects that define team performance. Therefore first
team performance should be defined and measures should be identified if KBC wants to
include team performance it in its management information.
Learning culture
The role that KBC foresees in supporting and developing the corporate learning culture is
one that is hard to measure as no single measure exists which taps the various
dimension of a learning culture. The multidimensionality of a learning culture is one of
the reasons to not define it as a main measure which can be controlled. What KBC could
do at this moment is to monitor the aspects influencing the learning culture, like trust,
reflection and empowerment of employees. To measure a learning culture for instance
the questionnaire of Marsick & Watkins, (2003) could be used.
Table 41 Other desired learning and growth measures
Mobility of employees
-% of employees on #years in their
function (not a main measures since out
the span of control and not solely
responsible).
Manager quality
-Managerial practice development score.
This score measures pre-defined
managerial competences and is currently
used at Air France.
Team performance
-Hard to tap by a single measure, not only
the responsibility of an L&D department.
Can monitor the aspects that have an
influence on team performance.
Support learning culture
-Not to tap in a single measure due to
variety of dimensions forming learning
culture. Can monitor the aspects found to
have an influence on the learning culture.
5.6 Business process objectives and measures Where the first three sections of the BSC are used to develop financial, customer and
learning and growth measures, the fourth section looks at business processes measures.
The business processes related to corporate L&D have been depictured and described by
the systems view of Rummler and Brache in chapter 3.
The same authors of the systems view also suggest how to develop sound measures.
First of all measures for processes should be developed on three levels. Organizational
measures should tap the performance between the department and its market. These
measures have been developed by the top-down approach as the customer related
Management Information for corporate Learning and Development 91
measures. The second level, job measures, should measure how well individuals within
the organization are performing. Since these job performance measures are too specific
for the internal operation of KBC, not all three audiences defined in the POV have a direct
interest for job performance measures of KBC. Therefore these job performance
measures are not further developed in this section. The main focus of this section will be
on the development of the third level, the development of business process measures.
One of the problems with developing business process measures is to select the right
measurement points given the large amount of processes going on in an L&D
department, which all offer possibilities to be measured. Therefore it is decided to first
lay the main focus for process measure development on the steps conducted in KBC’s
“oerproces”. The oerproces contains the core activities of the L&D department. Related to
the BSC the oerproces activities are the ones in which the department should excel. If
KBC, or other L&D departments, desire to widen the scope, it would be possible to
incorporate the other L&D process and aspects as described in chapter 3 as well.
Rummler & Brache, (1990) describe four steps to be taken in order to construct process
measures. First, the significant outputs of a process need to be identified (5.6.1). Then
the critical dimensions of these outputs need to be defined (5.6.2). Thereafter it is
possible to construct the measures and metrics that measure these critical dimensions
(5.6.3). Once the measures are constructed goals and standard values should be
determined (5.6.4). Finally, if all these steps have been taken the main measures to be
included in the BSC can be deducted (5.6.5).
5.6.1 Significant process outputs
The first step in determining process measures is to identify the most significant outputs
of a process (Rummler & Brache, 1990). The oerproces is conducted in six steps: intake,
analysis of the learning request, development and design of the learning solution,
execution, administration and evaluation. From these steps the most significant outputs
have been identified. The most critical output of for instance the administration process is
that the databases are filled with reliable and complete data. The fourteen most
significant outputs of the oerproces steps have been obtained from the oerproces
description (Appendix VI) and are presented in Table 42.
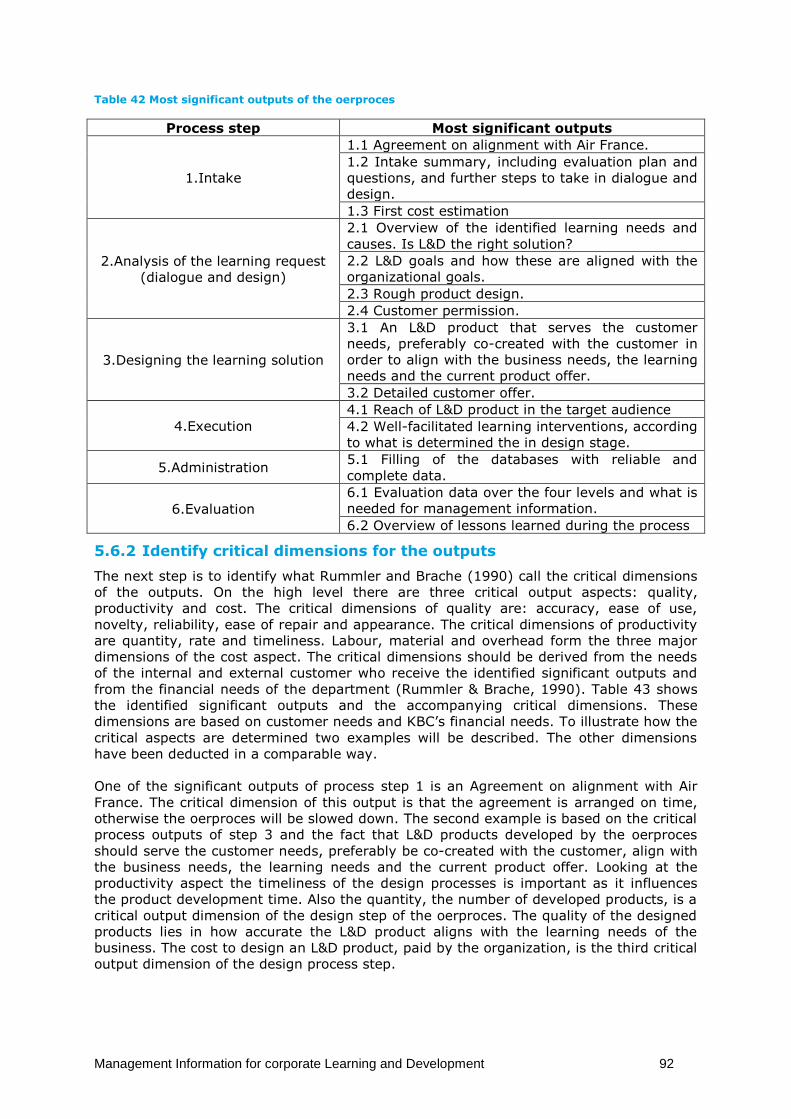
Management Information for corporate Learning and Development 92
Table 42 Most significant outputs of the oerproces
Process step Most significant outputs
1.Intake
1.1 Agreement on alignment with Air France.
1.2 Intake summary, including evaluation plan and
questions, and further steps to take in dialogue and
design.
1.3 First cost estimation
2.Analysis of the learning request
(dialogue and design)
2.1 Overview of the identified learning needs and
causes. Is L&D the right solution?
2.2 L&D goals and how these are aligned with the
organizational goals.
2.3 Rough product design.
2.4 Customer permission.
3.Designing the learning solution
3.1 An L&D product that serves the customer
needs, preferably co-created with the customer in
order to align with the business needs, the learning
needs and the current product offer.
3.2 Detailed customer offer.
4.Execution
4.1 Reach of L&D product in the target audience
4.2 Well-facilitated learning interventions, according
to what is determined the in design stage.
5.Administration 5.1 Filling of the databases with reliable and
complete data.
6.Evaluation
6.1 Evaluation data over the four levels and what is
needed for management information.
6.2 Overview of lessons learned during the process
5.6.2 Identify critical dimensions for the outputs
The next step is to identify what Rummler and Brache (1990) call the critical dimensions
of the outputs. On the high level there are three critical output aspects: quality,
productivity and cost. The critical dimensions of quality are: accuracy, ease of use,
novelty, reliability, ease of repair and appearance. The critical dimensions of productivity
are quantity, rate and timeliness. Labour, material and overhead form the three major
dimensions of the cost aspect. The critical dimensions should be derived from the needs
of the internal and external customer who receive the identified significant outputs and
from the financial needs of the department (Rummler & Brache, 1990). Table 43 shows
the identified significant outputs and the accompanying critical dimensions. These
dimensions are based on customer needs and KBC’s financial needs. To illustrate how the
critical aspects are determined two examples will be described. The other dimensions
have been deducted in a comparable way.
One of the significant outputs of process step 1 is an Agreement on alignment with Air
France. The critical dimension of this output is that the agreement is arranged on time,
otherwise the oerproces will be slowed down. The second example is based on the critical
process outputs of step 3 and the fact that L&D products developed by the oerproces
should serve the customer needs, preferably be co-created with the customer, align with
the business needs, the learning needs and the current product offer. Looking at the
productivity aspect the timeliness of the design processes is important as it influences
the product development time. Also the quantity, the number of developed products, is a
critical output dimension of the design step of the oerproces. The quality of the designed
products lies in how accurate the L&D product aligns with the learning needs of the
business. The cost to design an L&D product, paid by the organization, is the third critical
output dimension of the design process step.
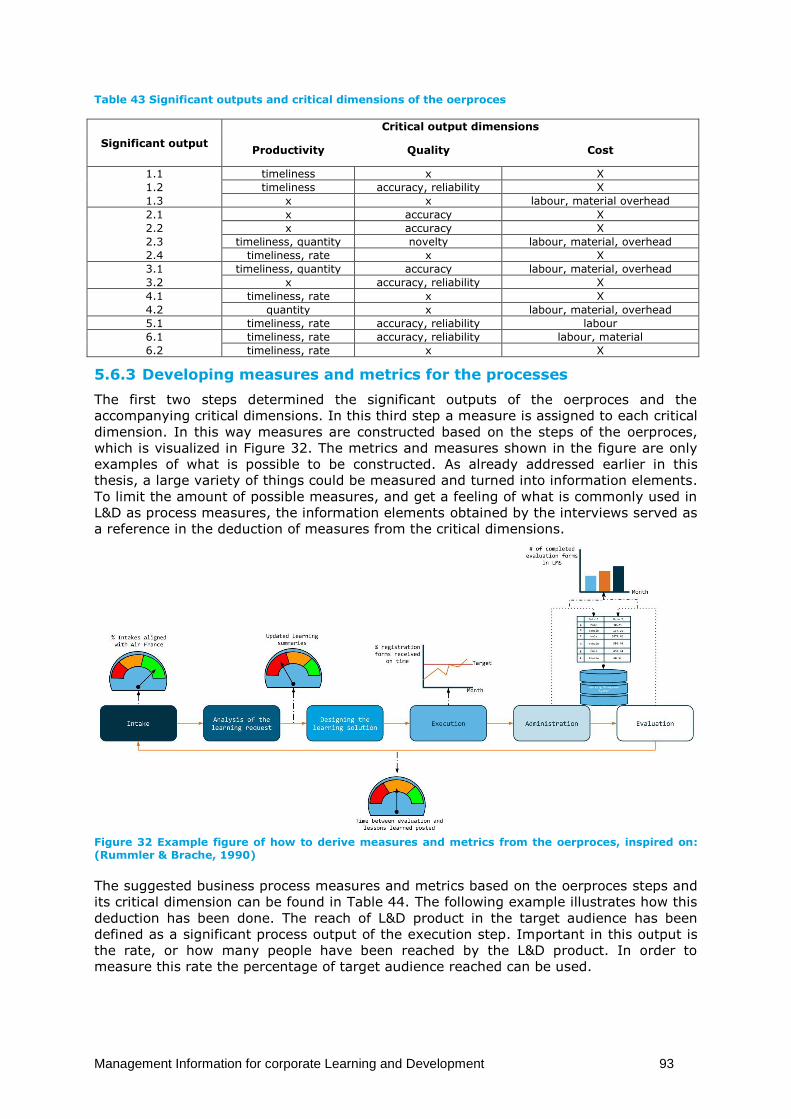
Management Information for corporate Learning and Development 93
Table 43 Significant outputs and critical dimensions of the oerproces
Significant output
Critical output dimensions
Productivity Quality Cost
1.1 timeliness x X
1.2 timeliness accuracy, reliability X
1.3 x x labour, material overhead
2.1 x accuracy X
2.2 x accuracy X
2.3 timeliness, quantity novelty labour, material, overhead
2.4 timeliness, rate x X
3.1 timeliness, quantity accuracy labour, material, overhead
3.2 x accuracy, reliability X
4.1 timeliness, rate x X
4.2 quantity x labour, material, overhead
5.1 timeliness, rate accuracy, reliability labour
6.1 timeliness, rate accuracy, reliability labour, material
6.2 timeliness, rate x X
5.6.3 Developing measures and metrics for the processes
The first two steps determined the significant outputs of the oerproces and the
accompanying critical dimensions. In this third step a measure is assigned to each critical
dimension. In this way measures are constructed based on the steps of the oerproces,
which is visualized in Figure 32. The metrics and measures shown in the figure are only
examples of what is possible to be constructed. As already addressed earlier in this
thesis, a large variety of things could be measured and turned into information elements.
To limit the amount of possible measures, and get a feeling of what is commonly used in
L&D as process measures, the information elements obtained by the interviews served as
a reference in the deduction of measures from the critical dimensions.
The suggested business process measures and metrics based on the oerproces steps and
its critical dimension can be found in Table 44. The following example illustrates how this
deduction has been done. The reach of L&D product in the target audience has been
defined as a significant process output of the execution step. Important in this output is
the rate, or how many people have been reached by the L&D product. In order to
measure this rate the percentage of target audience reached can be used.
Figure 32 Example figure of how to derive measures and metrics from the oerproces, inspired on: (Rummler & Brache, 1990)
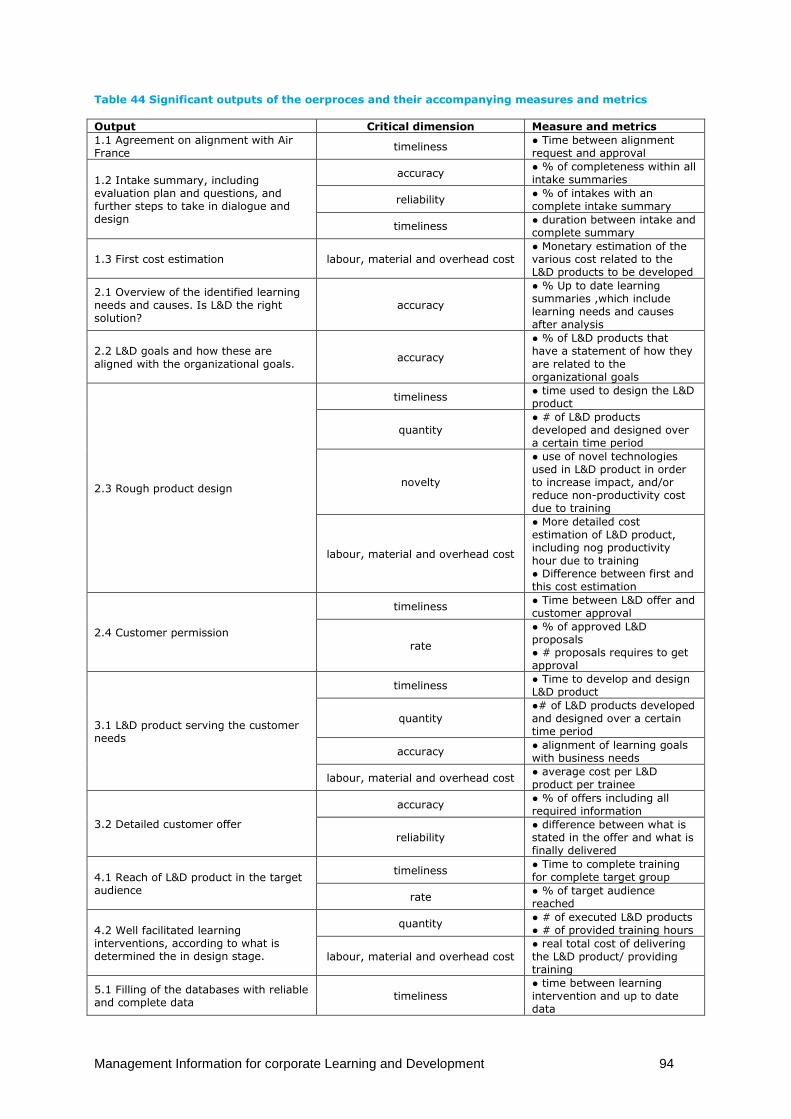
Management Information for corporate Learning and Development 94
Table 44 Significant outputs of the oerproces and their accompanying measures and metrics
Output Critical dimension Measure and metrics
1.1 Agreement on alignment with Air France
timeliness ● Time between alignment request and approval
1.2 Intake summary, including evaluation plan and questions, and further steps to take in dialogue and design
accuracy ● % of completeness within all intake summaries
reliability ● % of intakes with an complete intake summary
timeliness ● duration between intake and complete summary
1.3 First cost estimation labour, material and overhead cost ● Monetary estimation of the various cost related to the L&D products to be developed
2.1 Overview of the identified learning needs and causes. Is L&D the right solution?
accuracy
● % Up to date learning summaries ,which include learning needs and causes after analysis
2.2 L&D goals and how these are
aligned with the organizational goals. accuracy
● % of L&D products that have a statement of how they
are related to the organizational goals
2.3 Rough product design
timeliness ● time used to design the L&D product
quantity ● # of L&D products developed and designed over a certain time period
novelty
● use of novel technologies used in L&D product in order to increase impact, and/or reduce non-productivity cost due to training
labour, material and overhead cost
● More detailed cost estimation of L&D product, including nog productivity
hour due to training ● Difference between first and this cost estimation
2.4 Customer permission
timeliness ● Time between L&D offer and customer approval
rate
● % of approved L&D proposals ● # proposals requires to get approval
3.1 L&D product serving the customer needs
timeliness ● Time to develop and design L&D product
quantity ●# of L&D products developed and designed over a certain time period
accuracy ● alignment of learning goals with business needs
labour, material and overhead cost ● average cost per L&D product per trainee
3.2 Detailed customer offer
accuracy ● % of offers including all required information
reliability ● difference between what is stated in the offer and what is finally delivered
4.1 Reach of L&D product in the target audience
timeliness ● Time to complete training for complete target group
rate ● % of target audience reached
4.2 Well facilitated learning interventions, according to what is determined the in design stage.
quantity ● # of executed L&D products ● # of provided training hours
labour, material and overhead cost ● real total cost of delivering the L&D product/ providing training
5.1 Filling of the databases with reliable and complete data
timeliness ● time between learning intervention and up to date data
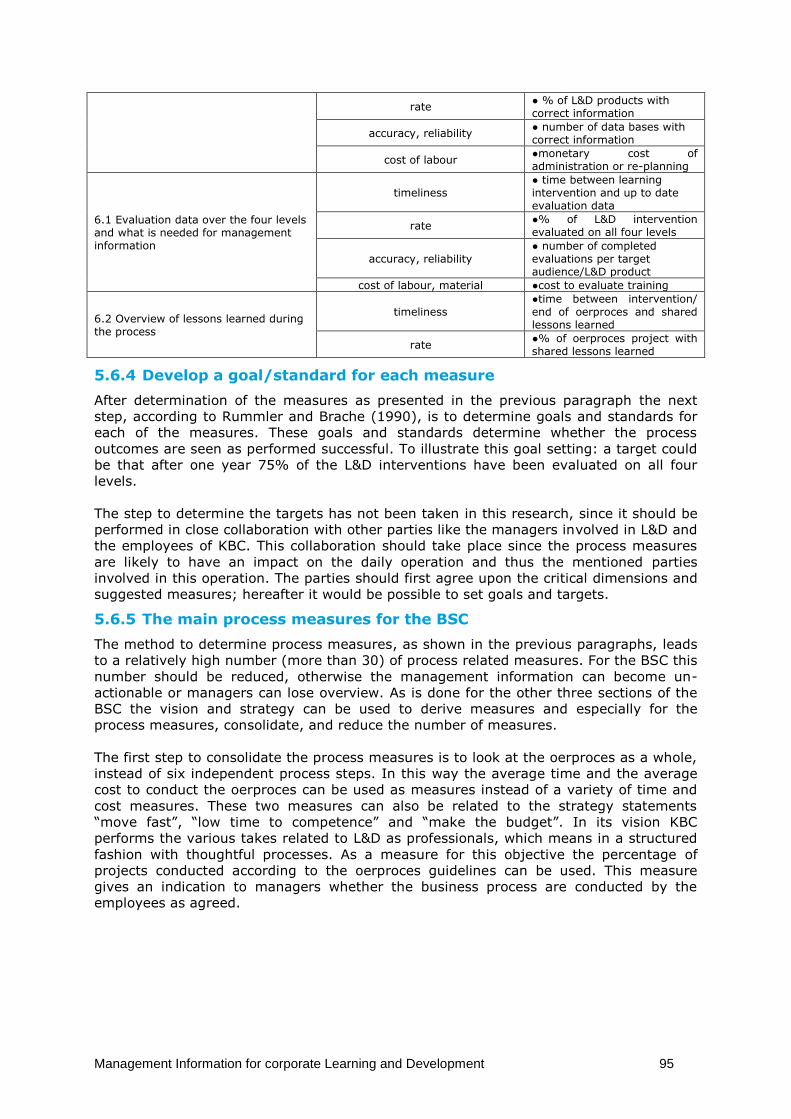
Management Information for corporate Learning and Development 95
rate ● % of L&D products with correct information
accuracy, reliability ● number of data bases with correct information
cost of labour ●monetary cost of administration or re-planning
6.1 Evaluation data over the four levels and what is needed for management information
timeliness ● time between learning intervention and up to date evaluation data
rate ●% of L&D intervention evaluated on all four levels
accuracy, reliability ● number of completed evaluations per target audience/L&D product
cost of labour, material ●cost to evaluate training
6.2 Overview of lessons learned during the process
timeliness ●time between intervention/ end of oerproces and shared lessons learned
rate ●% of oerproces project with shared lessons learned
5.6.4 Develop a goal/standard for each measure
After determination of the measures as presented in the previous paragraph the next
step, according to Rummler and Brache (1990), is to determine goals and standards for
each of the measures. These goals and standards determine whether the process
outcomes are seen as performed successful. To illustrate this goal setting: a target could
be that after one year 75% of the L&D interventions have been evaluated on all four
levels.
The step to determine the targets has not been taken in this research, since it should be
performed in close collaboration with other parties like the managers involved in L&D and
the employees of KBC. This collaboration should take place since the process measures
are likely to have an impact on the daily operation and thus the mentioned parties
involved in this operation. The parties should first agree upon the critical dimensions and
suggested measures; hereafter it would be possible to set goals and targets.
5.6.5 The main process measures for the BSC
The method to determine process measures, as shown in the previous paragraphs, leads
to a relatively high number (more than 30) of process related measures. For the BSC this
number should be reduced, otherwise the management information can become un-
actionable or managers can lose overview. As is done for the other three sections of the
BSC the vision and strategy can be used to derive measures and especially for the
process measures, consolidate, and reduce the number of measures.
The first step to consolidate the process measures is to look at the oerproces as a whole,
instead of six independent process steps. In this way the average time and the average
cost to conduct the oerproces can be used as measures instead of a variety of time and
cost measures. These two measures can also be related to the strategy statements
“move fast”, “low time to competence” and “make the budget”. In its vision KBC
performs the various takes related to L&D as professionals, which means in a structured
fashion with thoughtful processes. As a measure for this objective the percentage of
projects conducted according to the oerproces guidelines can be used. This measure
gives an indication to managers whether the business process are conducted by the
employees as agreed.
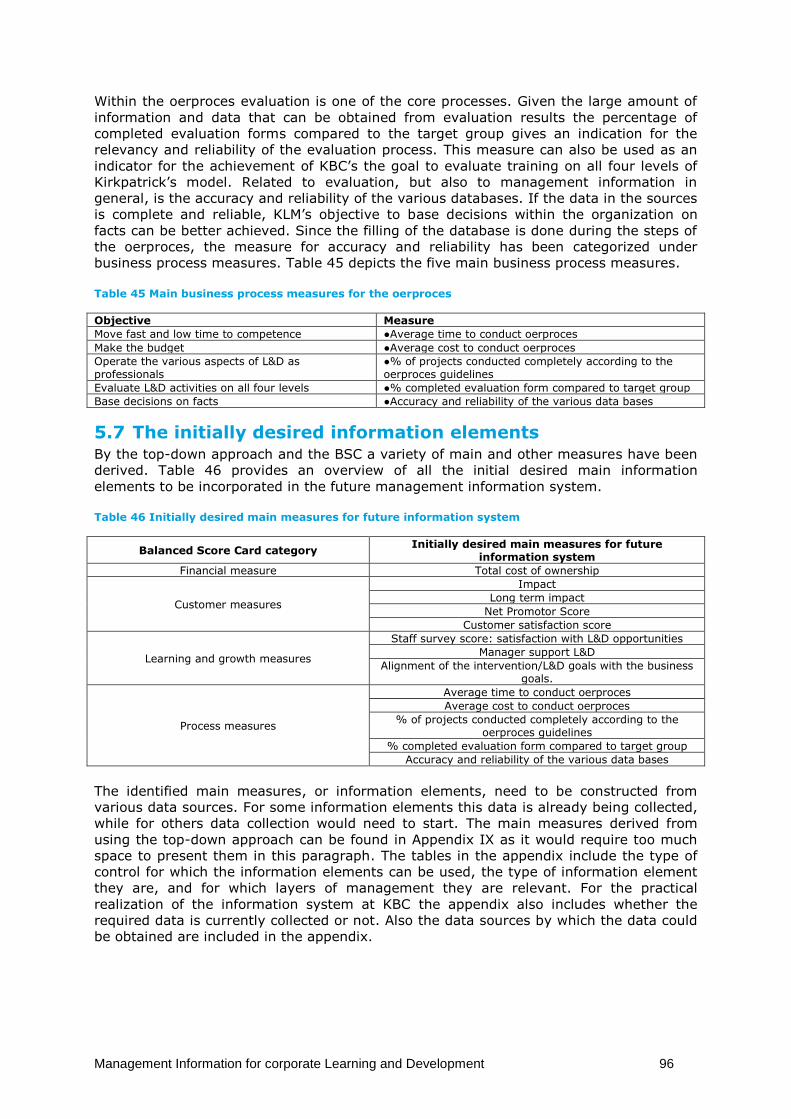
Management Information for corporate Learning and Development 96
Within the oerproces evaluation is one of the core processes. Given the large amount of
information and data that can be obtained from evaluation results the percentage of
completed evaluation forms compared to the target group gives an indication for the
relevancy and reliability of the evaluation process. This measure can also be used as an
indicator for the achievement of KBC’s the goal to evaluate training on all four levels of
Kirkpatrick’s model. Related to evaluation, but also to management information in
general, is the accuracy and reliability of the various databases. If the data in the sources
is complete and reliable, KLM’s objective to base decisions within the organization on
facts can be better achieved. Since the filling of the database is done during the steps of
the oerproces, the measure for accuracy and reliability has been categorized under
business process measures. Table 45 depicts the five main business process measures.
Table 45 Main business process measures for the oerproces
Objective Measure
Move fast and low time to competence ●Average time to conduct oerproces
Make the budget ●Average cost to conduct oerproces
Operate the various aspects of L&D as professionals
●% of projects conducted completely according to the oerproces guidelines
Evaluate L&D activities on all four levels ●% completed evaluation form compared to target group
Base decisions on facts ●Accuracy and reliability of the various data bases
5.7 The initially desired information elements By the top-down approach and the BSC a variety of main and other measures have been
derived. Table 46 provides an overview of all the initial desired main information
elements to be incorporated in the future management information system.
Table 46 Initially desired main measures for future information system
Balanced Score Card category Initially desired main measures for future
information system
Financial measure Total cost of ownership
Customer measures
Impact
Long term impact
Net Promotor Score
Customer satisfaction score
Learning and growth measures
Staff survey score: satisfaction with L&D opportunities
Manager support L&D
Alignment of the intervention/L&D goals with the business goals.
Process measures
Average time to conduct oerproces
Average cost to conduct oerproces
% of projects conducted completely according to the oerproces guidelines
% completed evaluation form compared to target group
Accuracy and reliability of the various data bases
The identified main measures, or information elements, need to be constructed from
various data sources. For some information elements this data is already being collected,
while for others data collection would need to start. The main measures derived from
using the top-down approach can be found in Appendix IX as it would require too much
space to present them in this paragraph. The tables in the appendix include the type of
control for which the information elements can be used, the type of information element
they are, and for which layers of management they are relevant. For the practical
realization of the information system at KBC the appendix also includes whether the
required data is currently collected or not. Also the data sources by which the data could
be obtained are included in the appendix.
Management Information for corporate Learning and Development 97
5.8 Summarizing conclusion The goal of this chapter was to provide an answer to the question what information
elements can be derived from the operation? The answer to this question can be seen as
the thirteen main measures derived using a top-down approach and the balanced score
card. In the development process of KBC’s management information system, the
department could first apply these main measures to steer and control its operation and
evaluate, with the stakeholders, whether the use of management information enhances
the managerial practices. The desired other measures could be implemented later.
The next chapter will first compare the main results, the information elements, from the
bottom-up and top-down approaches. Thereafter the various research findings presented
throughout this thesis will be clustered in order to provide an overview of the answers to
the sub-questions. Based on the answers to the sub-questions an answer to the main
research question can be constructed.
Management Information for corporate Learning and Development 98
6 Conclusions This chapter concludes the research conducted at KBC and presented in the previous
chapters of this thesis. The objective of this research was to determine the desired
management information elements for a corporate learning and development
department. The bottom-up and the top-down approaches led to the main results of this
research: two sets of information elements (6.1). To get these results the previous
chapters gave answers the various sub-questions. Since the findings are spread over
different parts this chapter will consolidate them based on their related sub-questions
(6.2). From all these findings a conclusion can be framed which provides an answer to
the main research question (6.3).
6.1 The information elements as the main research results The information elements derived by the bottom-up and the top-down approach can be
seen as the main results of this research. First the elements were derived using the
bottom-up approach, which practically means that the management information of six
corporate L&D departments, obtained by semi-structured interviews, has been analyzed
in order to find commonly used information elements. To conduct the top-down approach
the case study example of KBC was used to derive their specific information elements.
During the top-down derivation the Balanced Score Card of Kaplan & Norton (2007) was
used as a support tool and in order to derive the processes measures the steps
suggested by Rummler & Brache (1990) have been taken.
The findings of the bottom-up approach showed that corporate L&D departments have
generally included the following eight concepts in their management information:
effectiveness, impact, performance, satisfaction, time, quality, cost and efficiency. The
interpretation of these high-level elements, i.e. the definitions of the concepts and how
they are measured, differs per organization/L&D department. As a result a relative
unstructured, yet more concrete in terms of what should be measured, set of related
lower level information elements was presented in Table 35 alongside the eight high level
elements.
Practically, the main reason to identify the commonly used information elements using
the bottom-up approach was to incorporate the findings as the desired information
elements in the future management information. However, the eight commonly used
high level elements give no definite answer to the question what is measured and which
data should be obtained. This is because the high level elements can be defined and
measured in too many ways. To illustrate these latter problem: where the high level
element cost is measured at one department as the total cost of ownership, another
department monitors the investment cost per region and yet another department uses
the cost of non-productivity. As a result, the high level measures cannot directly be set
as desired elements, since the system developers would first require a company specific
interpretation of the concepts. Hereafter they can let a system obtain data and use it to
construct information. To incorporate the lower level elements as an alternative to the
high level elements would be questionable given the discussed dangers of using
management information of others.
The thirteen information elements as presented in Table 46 can be seen as the main
result of the top-down approach. Alongside a relative large set of so called other
measures and metrics has also been identified. Since these top-down elements are
derived from the vision and strategy via critical processes they better fit KBC's specific
context than the lower level elements of the bottom-up approach. A main difference
between the top-down elements and the high-level elements of the bottom-up approach
is that the first mentioned set has already been defined in terms of what to measure.
Therefore the top-down elements can be implemented and evaluated earlier in practice.
As said the high-level bottom-up elements would first require more context, e.g. KBC's
Management Information for corporate Learning and Development 99
specific definitions, before they can be constructed, communicated and tested during the
future development phases of the information system.
6.2 Answering the sub-questions Chapter 1 first introduced KBC and their request for research into management
information for corporate L&D. By the means of a preliminary literature review their
specific request could be framed as a general business need for corporate L&D
management information systems. Based on this general business need the research
objective was set, one main and three sub-questions were formulated, and a research
strategy was determined. Thereafter chapters 2 till 5 tried to formulate the answers to
the three sub-questions. The upcoming paragraphs (6.2.1, 6.2.2 and 6.2.3) consolidate
the various findings related to the sub-questions and thereby summarize the answers to
these sub-questions.
6.2.1 What is management information and how can information
elements be determined?
The main goal for chapter 2 was to answer the first sub-question and create an
understanding of management information as the desired artefact. Therefore chapter 2
first defined management information as a set of information elements used, by the
management of an organization, to obtain insight in the performance of an organization
and to support decision making needed to steer and control the organization. Thereafter
the various usages, types and levels of (management) information were presented.
The other part of question asking how information elements could be determined was
answered by the two identified approaches. The bottom-up approach selects information
elements from all the possible measures and metrics and the top-down approach derives
information elements based on vision, strategy and core processes. In the development
of an information system the determination of the required information elements (i.e.
measures and metrics) that will from the management information is one of the crucial
steps. Without the right information, managers are no able to steer and control their
organization in a proper manner and the management information system will most likely
not support the managerial practices around corporate L&D.
One of the sections in chapter 2 explained what (management) information systems are.
What can be concluded about these systems is that once the desired information
elements are known, the current technology should no longer be the bottleneck to
further develop and implement a user-friendly management information system for
corporate L&D. Assumed that the (technologies of the) system are/is further developed,
implemented, tested and maintained by the right (IT) experts, current technology allows
to construct and communicate any desired information for a variety of audiences.
6.2.2 How does a corporate learning and development department operate and what information elements can be derived from the
operation?
The answer to this sub-question was obtained in two parts. First chapter 3 provided an
answer on the question how a corporate learning and development department operates.
Later in the thesis chapter 5 answered which information could be derived from the
operation for which the top-down approach was used.
Proper development of any information system requires its developers to have an
understanding of the environment for which the system is developed, i.e. in this case the
organization, people and technology of a corporate L&D department. The three
components of the environment have a large effect on the vision, mission, strategy,
operation, employees, roles, responsibilities, culture, resources, processes, and
development capabilities of any organization. Without an general understanding of the
environment it would be almost impossible to develop an artefact which viable, feasible
Management Information for corporate Learning and Development 100
and desired. In order to better understand the corporate L&D environment chapter 3
elaborated on the case of KBC and on the operation of corporate L&D departments in
general, using the systems perspective of Rummler & Brache (1990). The ten elements
of the systems perspective allowed to see KBC as a separate business entity within AFKL,
having its own processes, people and technologies. The instructional design process, at
KBC the called the oerproces, was identified as the core process of an L&D department.
In general this process consists of the steps: analysis, design, development,
implementation and evaluation.
During the top-down derivation of management information, presented in chapter 5, it
turned out that the ten elements of systems perspective were helpful in determining the
information elements. To derive the information elements the balanced score card was
used as a tool, since its four sections (finance, customer, learning & growth and business
processes) help to tap the multidimensional conceptualization of performance and give
the information elements a theoretical foundation. The information elements derived by
the top-down approach as presented in chapter 5 form a milestone for the further
practical development, testing and implementation of the management information
system of KBC.
6.2.3 What management information elements are currently used in
theory and practice to manage corporate L&D departments and evaluate their value?
In chapter 3 it turned out that within the L&D environment evaluation plays a rather big
role since it is, together with analysis, design, development and implementation, part of
the core-process of most L&D departments. The main idea behind evaluation in the L&D
core-process is to assess how effective and efficient the L&D related activities were
performed. Evaluation allows a corporate L&D department, its customers, and the
organization to determine whether the learning goals have been achieved and if the
corporate resources have been allocated in a proper fashion. In chapter 3 various
methods of training evaluation have been discussed, showing the various ways of how
the value of corporate L&D could be determined according theory. Kirkpatrick (1998)
evaluates the value brought by learning on four levels: reaction, learning, behaviour and
results. Phillips (1997) adds the monetary value of training outcomes, as the return on
invest, to the four levels of Kirkpatrick. Brinkerhoff (2005) uses a more qualitative
approach to evaluate the value of brought by learning as he suggests to construct
success case stories besides quantitative evaluation data.
To find out which information elements are most commonly used in practice, chapter 4
presented a cross-case analysis in which the management information of six other L&D
departments was assessed. The cross-case analysis can be seen as a bottom-up
approach to select information elements from a large pool of used measures and metrics.
The interviews showed that each corporate L&D department is subject to its own
environment and as a result each department has developed its own specific measures
and metrics. From a high-level perspective the eight concepts of cluster 1 (effectiveness,
impact, performance, satisfaction, time, quality, cost and efficiency) can be indicated as
the main elements incorporated in L&D management information of most organizations.
The differences in the environment do not only influence the used measures and metrics,
but also cause that many organizations use their own technologies and systems to obtain
data and to communicate the information elements to a variety of audiences. Based on
the use of their information the departments can be placed along the different stages of
the maturity model. While the departments at the lower stages are often struggling with
the technology and correctness of data, the departments of the higher stages have the
technologies and systems in place and can use their information in a more advanced
way. The departments finding themselves at the higher stages struggle with determining
what information is actionable and finding out which analytical findings show correlation
and which causalities.
Management Information for corporate Learning and Development 101
6.3 Answering the main question The main question of this research was: Which information elements evaluate the value
of corporate learning and development activities? To formulate an answer to this
question it is first of all needed to understand what can be defined as the value of
corporate L&D activities. Thereafter the appropriate information elements can be linked
to this value.
From the findings presented in the preliminary literature review one can conclude that a
corporate L&D department has a supportive function within an organization. The main
task of most L&D departments is to enhance the human capital within their organization.
That is, the L&D department tries to improve the knowledge, skills, habits, capabilities,
attitudes and competences of the employees. The organization on its term can utilize its
human capital as a strategic resource to enhance its performance and even gain a
competitive advantage. As a result the alignment of the L&D operation, its products, and
the learning goals of its products with the learning and growth needs of the business can
be seen as a measure to express the value brought by the L&D activities.
This is where the bottleneck of corporate L&D management information reveals itself.
Most managers would like to have actionable and quantifiably measures to monitor and
steer their business. However, the value brought by corporate L&D lies in the ability to
develop skills and competences required by the business. This alignment is a complex
construct, not to grasp by a single quantitative measure or metric. Various researchers
tried to construct a quantitative value to express the value/alignment of corporate L&D.
The most commonly used example is the level four measure of Kirkpatrick (1998):
business impact. However, this business impact is a subjective measure, constructed
during the development and design process by the L&D department and its customers. In
fact, the level four score measures the customer satisfaction about how well the learning
intervention contributed to the earlier defined business/learning need. It implies that the
score, and so the value of corporate L&D which is expressed by that score, is just as
good as the ability of the business and L&D department to express the learning and
growth needs of their organization. Moreover, the soundness of the business impact
score in measuring the value of corporate L&D is only as good as the measures and
metrics used to evaluate the impact. Even if the business learning and growth needs are
properly defined, formulated, measured and monitored, it is still hard to proof causality
between the learning intervention and the impact on the business. The latter is due to
the high number of variables influencing business performance.
However, the complexity to measure and express the value of corporate learning in
terms of alignment does not imply that corporate L&D management information or
evaluation results are useless. As the cross-case analysis and the top-down approach
revealed various measures and metrics can be constructed and are used in practice to
monitor the operations and steer the L&D department as a business. The efficiency and
effectiveness of an L&D department can still be expressed in objective and quantifiable
measures. Examples are the cost to operate the department, the number of people
trained and the time to develop and design the learning product. The difficulty however is
that these kinds of objective, almost factory like, measures are not satisfactory for the
information needs of all managerial audiences. To illustrate: for L&D managers objective
measures are hard to be used to support their decision making, as for instance the time
it took to develop a learning product does not say much about how well it will satisfy the
learning needs and the number of hours that a trainer was in front of the class says
nothing about how well he teaches. On the other hand, for business managers the
objective measures like a cost breakdown of percentage learning budget spent, illustrate
how their resources have been allocated and used. To satisfy their information needs
most managers in the L&D environment include subjective measures in their
management information, like the satisfaction with learning and growth opportunities,
the managerial support for learning, the top 10 most popular training or the learning
impact scores.
Management Information for corporate Learning and Development 102
If an L&D department collects a combination of objective and subjective quantitative
measures, metrics, graphs, figures and facts, it will at least be enabled to communicate
these findings and to use the management information as a support tool in the
managerial practices around corporate L&D. Without management information the
department and the involved managers are more or less flying blind. The managerial
desire to express the performance of the L&D department or the impact/value brought by
corporate L&D in single quantitative measures seems unrealistic. This is supported by the
fact that the impact measurement framework as presented in Figure 18 already identifies
nine measurement areas to be monitored and tracked. To assess the value of L&D
activities a variety of measures and metrics, as suggested in literature or derived by the
bottom-up and top-down approaches, is required. Besides quantitative impact measures,
preferably also qualitative information, like obtained by using the success cases method
of Brinkerhoff (2005), should be considered as useful management information.
Management Information for corporate Learning and Development 103
7 Discussion and future work The previous chapter summarized the main results of this research and provided the
conclusions to the sub and main research question(s). This final chapter will reflect upon
the work done and give suggestions for future work. First the various moments of
evaluation that took place during the research will be discussed (7.1). The second section
reflects upon the work done and discusses whether the objectives have been achieved,
whether the questions have been answered and whether the used methods were
appropriate and conducted properly (7.2). The third section will discuss the main
implications of this research for practice, theory and for Management of Technology
(7.3). The final section will provide suggestions for further practical development and
implementation of the system and suggestions for future research (7.4).
7.1 Evaluation of the management information systems and
information elements during the research For the readers of this thesis it might appear as if the steps taken to arrive at the results
have been conducted in a linear fashion. However, inherent to the development and
design of an information system the process towards the results was iterative in nature.
This is for instance caused by the fact that during the research from time-to-time the
desirability, feasibility and viability of the future management information system have
been evaluated with some key stakeholders within and around KBC. These evaluations
have not been presented earlier in this thesis, but since they had an impact on the
research process and its outcomes, they will be discussed in this section. The evaluations
were done relatively early in the total development process of the information system, in
order to define and adjust the system requirements (i.e. required information elements)
before large investments in the development of the system have to be made. The main
stakeholders who were involved in these evaluations are: the director of Ecole des Ventes
(KBC’s counterpart), the management team of KBC, KLM’s commercial division Human
Resource manager, and the financial controller. The upcoming paragraphs (7.1.1 till
7.1.4) shortly describe who these stakeholders are, why they were involved in the
development process and what their contribution/influence was to/on the final results
presented in this research. The evaluations were conducted in a relative unstructured
fashion and a final evaluation on the found information elements did not take place,
which can be seen as two limitations of this research (7.1.5).
7.1.1 Evaluation with the director of Ecole des Ventes
The director of Ecole des Ventes [EDV] can be seen as the counterpart of KBC’s general
manager. Since EDV is supervised by the same EVPs as KBC it made sense to involve this
stakeholder in this research in order to jointly develop the future management
information elements. Jointly developed and defined information elements should allow
the EVPs to assess the two L&D departments within the commercial division on the same
information and make comparisons.
First of all the desirability of a joint management information system has been discussed
with the director of EDV and the general manager of KBC. From this discussion can be
concluded that such a joint systems is desired by both L&D managers, in order to deliver
comparable information. The desire for comparable information implies practically that
KBC and EDV will have to agree upon the definitions of the suggested information
elements. In order make comparable information technically feasible, it would be helpful
if the two departments can rely on the same systems and methods of evaluation, as
these methods would ease the generation of comparable data.
Besides the desire for a joint system also some desired information elements were
discussed. EDV’s initially desired information elements were: the number of trained
people, classroom occupation, which training has been followed most, the number of
provided training hours, a cost breakdown of the L&D department, a measure of non-
productivity caused by training, the response rate of evaluation, ratio
Management Information for corporate Learning and Development 104
preparation/development time versus face-to-face (trainers) and the ratio between e-
learning development time versus the time these solutions are used. Some of these
measures can be found in the suggested measures of chapters 4 and 5, the others could
be included if still desired.
7.1.2 Evaluation with the Management Team of KBC
The following roles are part of the internal Management Team [MT] of KBC: the general
manager, the head of the training coordination centre, a representative of program
development and the manager trainers. Halfway through the research the management
team has been updated about the progress. At this moment most of the other L&D
departments of the cross-case analysis had been interviewed and feedback was needed
on the desirability for, and feasibility of, a management information system. To obtain
the feedback the concept of information systems was made tangible using the five
prototypes which were presented during a MT-meeting. The feedback provided on the
first prototypes and included information elements is presented in the upcoming sub-
paragraphs.
General Manager
Looking at the measures and metrics used at the other L&D departments the general
manager remarked that the implementation and use of a management information
system should not lead to a command and control culture/environment within the
department. Practically this implies that for instance the evaluation scores given to a
trainer should never become a standalone measure to assess performance and judge a
trainer. The score should be used to indicate and monitor the learner satisfaction. A
structural low score can be used as an indication that something might be wrong and it
can open a conversation with the trainer about the causes of this low score.
Head of the training coordination centre
The head of the training coordination centre is currently assigned with the task to obtain
the data from the LMS required to construct the CSR and CBS reports. Currently the
processes to obtain data and construct tables and graphs are time consuming. There is
also a relative high chance that the obtained data contains errors, making the measures
and metrics constructed from the data less reliable. For a future information system it
would be desired that the processes to construct the information requires less effort and
that data collection is less prone to mistakes. Practically, it would mean that the software
behind the systems allows an easy construction of measures and metrics, like the
sandbox construction of prototype 3. Another option to reduce the workload would be to
outsource (preferably within AFKL) the collection of data and the construction of the
desired information elements to parties with more expertise.
Representative of development and design
As due to the current technology the feasibility of a management information system
should no longer be the bottleneck, the main remark of this MT-member was to assure
that KBC gets a good vision on which information it desired and how the measures and
metrics are defined.
Manager trainers
Related to his role, the manager of the trainers remarked to be interested in information
about trainers, both internal and external. For example how they scored in the evaluation
surveys. This information can be of use in order to open conversations with trainers
about their performance and to support decision making about which trainer to hire for a
certain training.
Management Information for corporate Learning and Development 105
7.1.3 Evaluation with the financial controller
Once it became clear that financial measures and metrics play an important role in
performance measures and management information, the feasibility to construct these
measures for KBC and the possibility to make a cost breakdown have been evaluated
with the financial controller. He remarked that if KBC knows which financial measures
and metrics it desires and how it wants to allocate and break down the cost, it would be
possible to construct the information.
7.1.4 Evaluation with the manager KLM Human Resources
KBC envisions future communication of the information elements towards the human
resource manager and the EVPs of the commercial division. Therefore the KLM Human
Resource manager has been involved in the evaluation of the information elements after
these were derived for the first time by the top-down approach. The main conclusion
form this evaluation moment was to make more explicit which information elements are
desired and how these are linked to the strategies and visions of KBC, the commercial
division and AFKL. Therefore the links between the mission, vision, the objectives and the
measures and metrics have been presented more explicit in chapter 5.
7.1.5 Reflection on evaluation approach
Evaluation and early feedback of the various stakeholders is important in the
development process of an information system in order to get a feeling for their desires
and requirements of the system. During this research the evaluations as described in the
previous paragraphs took place during meetings. These meetings were planned and
prepared, but still the course of the conversation was often different than expected. This
made it hard to obtain explicit and structured feedback, useful to assess the stakeholder
requirements. Due to time constraints the information elements, the main results of this
research, are still to be evaluated with the various stakeholders before the next steps in
the development of the information system should be taken. All in all it would have been
better to use structured tools, like surveys, to conduct the evaluation and to include an
evaluation of the final results. This would also better strive with the third guideline for
information systems design science research, which prescribes that the utility, quality,
and efficacy of a design artefact must be rigorously demonstrated via well-executed
evaluation methods.
7.2 Reflection on work The upcoming paragraphs will reflect upon the work and discuss whether the research
questions have been answered (7.2.1), the objectives have been achieved (7.2.2), the
guidelines of the research strategy were met (7.2.3) and if the appropriate methods have
been used in a proper manner (7.2.4).
7.2.1 Have the questions been answered?
The following questions were included in KBC's research request.
How many and which employees have we trained?
How much have we spent on L&D?
How can the performance/ productivity of our department be measured?
How can the added value of this corporate L&D department be evaluated?
On the basis of which Key Performance Indicators [KPIs] could/should the
department be managed?
The identified measures and metrics differ from the expressed practical information
needs like How many and which employees have we trained? and How much have we
spent on L&D?. In fact, this research has not tried to directly answer these practical
questions for KBC. Instead, the main focus has been on answering the second of the
three other questions, given the main research question Which information elements
evaluate the value of corporate learning and development activities?. The results of this
research provide answers to these two questions and to the three research sub-
Management Information for corporate Learning and Development 106
questions. The questions How can the performance/ productivity of our department be
measured? and On the basis of which Key Performance Indicators [KPIs] could/should
the department be managed? have been indirectly answered. The productivity of a L&D
department can be seen as the delivered and provided products and services, these
numbers can be measured. Performance can be seen as how well the departments
produces its outcomes, which can be monitored using the evaluation results and the
process information elements. KPIs are nothing more than properly selected measures
and metrics, therefore the metrics identified by the top-down approach could serve as
KPIs for KBC.
7.2.2 Have the objectives been achieved?
At the start of this research there was KBC's request to draft and determine (key)
performance indicators, determine the required data, information and (IT) systems
needed to report these performance indicators and to (re) structure the internal
administrative processes. These practical objectives were translated into the research
objective to generate the requirements for a management information system in relation
to corporate learning, with a specific attention to the desired information elements.
The identified information elements obtained by the top-down approach can be seen as
the desired information elements and thus as the requested indicators. The information
elements derived by the bottom-up approach can be seen as a benchmark pool of
possible information elements. For the thirteen main elements derived by of the top-
down approach has been identified which data is required for their construction. In
chapter 2 the general architecture of a management information system has been
discussed and the five prototypes presented in chapter 4 can be seen as examples of how
KBC could communicate its information. The internal processes needed to generate and
obtain the data required for construction of the information element have not been (re)
structured during this research.
During this research the main focus has been on the identification of the desired
information elements for three levels of management involved in corporate L&D. As a
result the user- and functional requirements of other information audiences and the
system requirements of other information system users have not been taken into account
so far. This could be seen as one of the limitations of this research with respect to the
design and development of an information system. Before further development and
implementation of such as system, so before setting up the structural specifications, it
would be required to make all the functional, user, and contextual requirements and the
assumptions more explicit.
7.2.3 Have the guidelines been followed?
In the research strategy presented in chapter 1 seven guidelines to execute and evaluate
design research were introduced. The first guideline prescribed that a viable artefact has
to be produced. The artefact produced by this research is formed by the identified
information elements and the five prototypes. An IT-artefact, that is a management
information systems or parts of it have not been build.
The second guideline, the relevancy of this research problem, has been presented in the
findings of the preliminary literature review. To summarize the relevancy, most large
organization have an L&D department and as seen during the interviews these
departments, like KBC, use or want to use management information to enhance their
operation.
The third guideline prescribes that the utility, quality and efficacy of the designed artefact
must be rigorously demonstrated via evaluation. As mentioned in 7.1.5 this is where the
research has some limitations, since the conducted evaluations where relative
unstructured and the final elements still have to be evaluated. Despite the limitations
concerning the evaluation of the information elements, they still contribute to the
Management Information for corporate Learning and Development 107
development of the management information system for corporate L&D as part of the
design requirements.
The upcoming paragraph will discuss the fifth guideline in more detail and reflect whether
the right methods were used and if they were used rigorously.
The sixth guideline prescribed to use the available means to arrive at the desired end.
Where various research means where used to determine the desired information
elements, there was less focus on the real construction of these information elements
and testing their feasibility and the feasibility of a management information system at
KBC. It would have been interesting to construct the suggested information elements
with the current available data, or even collect new data, and test whether this
information aids the managers involved in L&D. In this way more of the available means
would have been exploited and more insight would have be obtained in the viability and
feasibility of the information system.
To meet the final guideline this thesis should contain enough information for IT-
developers to understand the L&D environment, the derived information elements and
how to proceed with the development of an information system. For the management
audience this thesis should show what value information systems and the suggested
information elements can add, in order to have arguments to proceed with the
development and implementation of such a system for the L&D department.
7.2.4 Were the right methods used and were the methods applied properly?
The research was conducted in four steps: understanding the artefact, understanding the
environment, deriving management information elements using the management
information of others and deriving management information elements from own
operation, before the previous chapter could answer the main question.
Literature review to understand the research request as a general problem
To get an understanding for the business and research problem a literature review was
conducted. The result of this review was a conceptual framework. This framework
showed how the concepts of L&D and management information are related based on
what was found in various literature sources. The framework can however not be seen as
a conceptual model, which might be one of the limitations of this research. To test the
impact of an information system it would have been interesting to have a conceptual
model, including the relationship between variables. However, with the results of the
review only a framework could be constructed.
Understand the environment
To describe the operation of an L&D department the systems perspective and its ten
elements were used as a framework. A combination of observations and interviews at
KBC and the other L&D departments and various literature sources were used to explain
each of these ten elements. Combination of the various information sources should
ensure that the description of the L&D departments operation is specific enough to fit
KBC, yet general enough to be useful for other L&D departments as well. Bersin and
other practical sources like Bakx (2013) have been used as the main sources to obtain
general information about corporate L&D operation and products. The fact that the
information to describe the L&D operation was often not obtained from scientific articles
could be seen as a limitation of this research.
Deriving the management information elements
Several remarks can be made about how the two approaches to derive management
information elements could have been conducted better. First of all, only six interviews
with other corporate L&D departments were used for the bottom up approach, which is a
relative small sample. The small sample size lowers the generalizability of the interview
Management Information for corporate Learning and Development 108
outcomes. It would have been interesting to have interviewed more L&D managers, or
even other stakeholders involved in L&D in order to make the findings more reliable and
general. Another remark about the interviews is that during these interviews handwritten
notes were made instead of audio records. If there would have been records of the
interviews better content analysis would have been possible. Currently the content
analysis was conducted using word-count and Excel, which is not a very rigorous and
reliable method. It would have been better to use a data analysis tool like ATLAS.ti
instead. A final remark about the content analysis is that the coding of the commonly
occurring concepts and the clustering of these concepts were only done by this and no
other researcher. To rise the validity and reliability of the results it would have been
better if more people would have coded and clustered the concepts.
The first remark on the used strategy to derive the information elements from the top
down is that only the balanced score card has been used as a supporting tool while in
theory and practice various methods exist. It would be interesting to use some kind of
triangulation and see whether other methods would lead to the same or comparable
information elements. A limitation concerning the steps taken with BSC is that only the
first two columns are filled, leaving the targets and the initiatives columns open. A final
remark about the top-down approach concerns the generalizability of its results. Since
the information elements are based on the company specific strategy and critical
processes it is questionable if all these elements are of importance for L&D departments
in general.
7.3 Implications of the research results The research findings and the results present throughout the thesis have several
implications for the practice of corporate L&D (7.3.1), for theory (7.3.2), and for
management of technology and high-tech firms (7.3.3).
7.3.1 Implications for practice
As stated in the beginning of this thesis, the environment around corporate L&D is
changing and managers become more and more focused on the contribution of their
department. As a result they desire management information to monitor and steer the
operation of the department and evaluate whether the right investments have been
made. As stated in the previous chapter the main value contribution of a L&D department
lies in the ability to identify the learning needs of a business and translate these in the
right learning products: alignment. For the operation of a corporate L&D it implies that a
fair amount of time should be spend on, collaboratively, identifying the corporate human
development needs, required to keep the organization one step ahead of its competitors.
If later in the evaluation phase the contribution to the organization can be expressed in
the terms like the organizational learning needs and how well the learning goals were
achieved, a large part of the contribution is already made explicit. Alongside, a
management information system including process data could be used to meet the other
information needs, like the number of people trained or the amount of budget spent.
If an L&D department wants to use its information and data for more advanced purposes
other than just generating reports, it should first of all ensure to have the right experts.
Without the right experts the foreseen analyzes could lead to all kinds of irrelevant,
insignificant or even wrong conclusions. The department should also realize that well
performed analyzes often require significant investments in terms of time and money.
Therefore a L&D manager should assess whether the investments for evaluation and
analysis are reasonable compared to the cost of the learning intervention.
During the interviews was seen that the roles and operations of other corporate L&D
departments do in essence not differ much from KBC. Therefore can be said that most of
the identified (process) measures and metrics and other research findings could be useful
for other corporate L&D departments as well. The managers of other L&D departments
should be aware that the information elements indentified by the top-down approach
Management Information for corporate Learning and Development 109
were derived for the specific case of KBC. The findings of the bottom-up approach can
serve as a reference for others, however these concept based elements require
definitions in terms of measures and metrics before they can be implemented.
A final practical implication of the top-down method is that the indentified measures and
measure should be kept up-to-date. This is because the strategies and visions are likely
to change over time and the accompanying measures and metrics should be changed
accordingly.
7.3.2 Implications for theory
From the preliminary literature review was concluded that theory lacks a commonly
accepted set of management information elements for corporate L&D. The, mainly
explorative, results of this research provide some indication of what kind of information
elements are commonly used in the corporate L&D environment. Thereby the findings of
the bottom-up approach can be seen more useful for science in general than those of the
top-down approach. This is because the latter category of findings are too company
specific as they are derived from the strategy, vision and processes of KBC.
The use of multiple theories and methods to derive the information elements for
corporate L&D could be seen as a contribution to science since it serves the call for
research that should appropriately align the research context (L&D) with performance
measurement and the call to practically develop information systems. With respect to the
design-science research framework can be said that the use of various methods and
theories enables additions to the knowledge base.
7.3.3 Implications for Management of Technology
The master Management of Technology strives to teach its students to understand
technology as a corporate resource. A management information system can be seen as
such a technology, used to support decision making and enhance organizational
efficiency and effectiveness. While these systems are already longer at use in for
instance production environments, supportive departments like corporate L&D often
seem not to use its full potential. Given the possibilities that these information systems
offer, like making predictive analytics, they can be useful for L&D and human resource
development in general. Human capital is an important corporate resource which many
organizations use as their strategic advantage. Especially innovative firms, developing
new products and services, strongly rely on the knowledge, skills and capabilities of their
employees. Also the rapid changes in for instance technologies require employees to
constantly update their knowledge and skills. As a result, learning is at the heart of many
innovative firms, for which the results of this research might also be useful.
Management Information for corporate Learning and Development 110
7.4 Suggestions for future work Practically the derived information elements form a good starting point for further
development and implementation of the management information system (7.4.1). Finally
some suggestions for further research are presented (7.4.2).
7.4.1 Further development and implementation of the information system
In this research the desired information elements have been identified for the three
layers of management involved in L&D at KBC. As mentioned earlier in this chapter these
information elements still need to be evaluated with most of these stakeholders. The
evaluation of the desired information elements can be seen as the first next step in the
further development and implementation of the information system. After the evaluation
of the desired elements, KBC could continue the development processes with rapid
prototyping. By constructing the suggested elements from the current available data,
KBC can make the ideas tangible and the identified measures and metrics assessable.
Once this information is obtained, for instance the NPS scores become available, KBC
could test whether this information helps them in managerial decision making and
whether actions can be found to alter the scores. If it seems that a metric or measure
does not aid as foreseen or desired, it can be adapted or removed. If, after the rapid
prototyping, KBC and the other stakeholder agree upon the desired information elements
a next step would be to complete the BSC procedure by setting the norm scores for the
remaining or new measures. Thereafter, IT experts will require the remaining system
requirements before they can build and implement the management information system.
7.4.2 Future research
Normally a complete design-science research is conducted in two complementary phases:
development/building and justification/evaluation. The main focus of this research has
been on the development part and the determination of the required information
elements. A first suggestions for further research is therefore to proceed with the design
science research and thus the development and implementation of the management
information system. In this way the systems and the suggested information elements can
be tested in practice.
Another suggestion for research is to more or less repeat this research, starting with an
evaluation to determine whether all the suggested information elements indeed possess
a strong theoretical rationale on the nature of performance. It could be that another
research, using other methods to derive information elements from the top-down or
more cases for the bottom-up approach, concludes that that the performance of a L&D
department could/should be measures differently than suggested by this research.
A third suggestion for research is to use L&D and other company data for analytical
purposes and see whether certain trends, correlations or relations can be found. For
instance whether L&D investments correlate with the performance of the core business.
As a starting point departments that find themselves in the higher stages of the maturity
model could be used. What can be concluded from all the data of a corporate L&D
department? Which trends, correlations and causalities occur? and What corrective
actions can managers take? are interesting research questions.
Since the intake process can be seen as one of the key process steps in corporate L&D a
final suggestion for research is to find a method to properly conduct learning needs
assessments and intakes. Since the performance consulting role of L&D departments
becomes more and more important a future research could focus on how a corporate L&D
department should analyze the learning and growth needs of its organization and assure
that it provides the right learning solutions or advice.
Management Information for corporate Learning and Development 111
References Air France-KLM. (2015, January). Commercial Division Organogram. PC.DX.
Air France-KLM. (2012, April). Human Resources KLM International & the Netherlands division
Organogram. CI.TX.
Bakx, A. (2013). Bevindingen haalbaarheidsstudie KLM KBC. Bloomville.
Barnett, K., & Vance, D. (2012). Talent Development Reporting principles Whitepaper Full Version.
Denver: Center for Talent Reporting Inc.
Bersin & Associates. (2009, May 24). Modernize Corporate Training: The Enterprise Learning
Framework. Retrieved March 19, 2015, from Bersin by Deloitte:
http://www.bersin.com/blog/post/Modernize-Corporate-Training--The-Enterprise-Learning-
Framework.aspx
Bersin, J. (2007, March 12). The Challenge of Training Measurement. Retrieved June 3, 2015, from
Bersin by Deloitte: http://joshbersin.com/2007/05/the-challenge-of-training-measurement/
Bersin, J. (2013, October). The Datafication of HR. Presentation . Bersin by Deloitte.
Bramley, P., & Kitson, B. (1994). Evaluating Training against Business Criteria. Journal of European
Industrial Training, Vol. 18 Iss 1 , 10-14.
Brinkerhoff, R. (2005). The Success Case Method: A Strategic Evaluation Approach to Increasing the
Value and Effect of Training. Advances in Developing Human Resources , 7 (1), 86-101.
Brown, T. (2008, June). Design Thinking. Harvard Business Review , 84-92.
Chochard, Y., & Davoine, E. (2011). Variables influencing the return on investment in management
training programs a utility analysis of 10 Swiss cases. International Journal of Training and
Development 15:3 , 225-243.
Colquitt, J., LePine, J., & Noe, R. (2000). Toward an Integrative Theory of Training Motivation: A meta-
analystic path analysis of 20 years of research. Journal of applied Psychology Vol.85 No.5 , 678-707.
Commercial Division Air France-KLM. (2015). Business Plan 2015. Commercial Division Air France
KLM.
Gill, S. (2009). Creating a learning culture. In S. Gill, Developing a learning culture in nonprofit
organizations (pp. 27-52). Thousand Oaks: SAGE Publications.
Griffin, R. (2011). Seeing the wood for the trees: workplace learning evaluation. Journal of European
Industrial Training, Vol. 35 Iss 8 , 841-850.
Grohmann, A., & Kauffeld, S. (2013). Evaluating training programs:development and correlates of the
Questionnaire for Professional Training Evaluation. International Journal of Training and
Development 17:2 , 135-155.
Management Information for corporate Learning and Development 112
Grossman, R., & Salas, E. (2011). The transfer of training: what really matters. International Journal of
Training and Development 15:2 , 103-120.
Harsh, S. B., Connor, L., & Schwab, G. (1981). Managing The Farm Business. Englewood Cliffs:
Prentice-Hall Inc.
Harvard Business Review analytic services. (2014, July). HR Joins the Analytics Revolution. Harvard
Business Review .
Hevner, A., March, S., Park, J., & Ram, S. (2004). Design Science in Information Systems Research. MIS
Quarterly , 75-105.
Jennings, C. (2010, April 7). Five Barriers to Effective Learning in Organisations. Retrieved May 18,
2015, from Charles Jennings Workplace Performance: http://charles-
jennings.blogspot.nl/2010/04/five-barriers-to-effective-learning-in.html
Kaplan, R., & Norton, D. (2007). Using the Balanced Scorecard as a Strategic Management System.
Harvard Business Review , 150-+.
Kaufman, R., Keller, J., & Watkins, R. (1995). What works and what doesn't: Evaluation beyond
kirkpatrick. Performance + Instruction , 35 (2), 8-12.
KBC. (2014, January). Evaluation model of KBC. KLM Business Campus.
Keller, R. (1998, March 3). Chapter 1 Introduction to Information Systems. Introduction presentation
to Information Systems . University of Kentucky.
Kirk, J. J. (2014, August 7). Program Evaluation. Presentation about training Program Evaluation in
Human resource Development . USA: Western Carolina University.
Kirkpatrick, D. (1998). Evaluating Training Programs. San Francisco: Berrett-Koehler Publishers, Inc.
KLM Business Campus. (2014, May 6). KLM Business Campus, een introductie.
KLM Business Campus. (2015, February 16). Organogram KBC feb 2015. Schiphol Noord, The
Netherlands.
KLM Business Campus. (2014). Stageomschrijving. KLM Business Campus.
KLM. (2014, September 23). Company Profile. Retrieved May 19, 2015, from About KLM:
http://www.klm.com/corporate/en/about-klm/profile/index.html
KLM Corporate Communicatie AMS/DR. (2015, February 10). Overzich Perform 2020. Hoe zit het ook
alweer? Amstelveen, The Netherlands: KLM Corporate Communicatie AMS/DR.
KLM. (2015). KLM FLIGHT PLAN 2015. KLM.
Laudon, K., & Laudon, J. (2007). Management Information Systems: Managing the Digital Firm (10th
ed.). Upper Saddle River: Pearson Prentice-Hall.
Management Information for corporate Learning and Development 113
Malone, S. (1997). How to set up and manage a corporate learning centre. Hampshire, England:
Gower Publishing Limited.
Marsick, V., & Watkins, K. (2003, May). Demonstrating the value of an organization's learning
culture:The dimensions of the learning organization questionnaire. Advances in developing human
resources , 132-151.
McLeod, R., & Schell, G. (2007). Part I: Essential Concepts Chapter 1. In R. McLeod, & G. Schell,
Management Information Systems. Virginia: Prentice Hall.
Molenda, M. (2003). In search of the elusive ADDIE model. Performance Improvement , 42 (5), 34-26.
O' Leonard, K., Blackstrom, W., & Payne, K. (2014, May). Presentation: How talent analytics can help
you maximize our HR strategy. Bersin by Deloitte.
Ott, B. (2007). Reinventing the training function. International Conference and Exposition (pp. 1-14).
St. Louis: American Society of Training & Development.
Parmenter, D. (2015). Chapter 1 The great KPI misunderstanding. In D. Parmenter, Key Performance
Indicators developing, implementing and using winning KPIs (3rd ed., pp. 3-24). Chichester: John
Wiley.
Passionned Group. (2014, April 9). De 5 grootste KPI-blunders. Retrieved March 10, 2015, from
Passionned Group: https://www.passionned.nl/de-5-grootste-kpi-blunders/
Phillips. (1997). Handbook of Training Evaluation and measurement methods. Houston, Texas: Gulf
Publishing Company.
Phillips, J. (1997). Communicating Program Results. In J. Phillips, & 3rd (Ed.), Handbook of training
evaluation and measurement methods (pp. 337-359). Houston: Gulf Publishing Company.
Phillips, J. (1991). Determining Program Cost. In J. Phillips, Handbook of training evaluation and
measurement methods (3rd ed., pp. 217-236). Houston: Gulf Publishing Company.
Phillips, J. (1997). Developing a Results-Based Approach. In J. Phillips, Handbook of Training
Evaluation (pp. 35-50). Houston: Gulf Publishing Company.
Phillips, J. (1997). Return on Investment in training and performance improvement programs.
Houston: Gulf Publisshing Company.
Phillips, P., & Phillips, J. (2002, May). How to measure the return on your HR investment. Stratgic HR
review . Birmingham: ROI Institute.
Poel, K. v. (2013). Lagging and leading indicators. Retrieved February 24, 2015, from KPI Library:
http://kpilibrary.com/topics/lagging-and-leading-indicators
Porter, M. (1996). What is Strategy? Harvard Business Review , 61-78.
Ramesch Babu, A., Sigh, Y., & Sachdeva. (1997). Chapter 18: Establishing a management information
system. In B. Swansom, R. Bentz, & A. Sofranko, Improving agricultural extension. A reference manual
(pp. 202-213). Rome: Food and Agriculture Organization of the United Nations.
Management Information for corporate Learning and Development 114
Rees, D. (2012, May 12). Alternative’s to Kirkpatrick: Brinkerhoff’s Success Case Method. Retrieved
May 15, 2015, from Instructional Design Fusions:
https://instructionaldesignfusions.wordpress.com/2012/05/12/alternatives-to-kirkpatrick-
brinkerhoffs-success-case-method/
Reichheld, F. (2003, December). The One Number You Need to Grow. Harvard Business Review on
Point .
Richard, P., Devinney, T., Yip, G., & Johnson, G. (2009). Measuring Organizational Performance:
Towards Methodological Best Practice. Journal of Management Vol. 35 No. 3 , 718-804.
Robbins, S., & Judge, T. (2012). Organizational culture. In S. Robbins, & T. Judge, Essentials of
Organizational Behaviour (pp. 242-257). Essex: Pearson Education Limited.
Rummler, G., & Brache, A. (1990). Improving performance How to manage the white space on the
organizational chart. San Francisco: Jossey-Bass Inc., Publishers.
Saks, A., & Burke, L. (2012). An investigation into the relationship between training evalution and
training effectiveness. International Journal of Training and Development 16:2 , 118-127.
Savkin, A. (2015, January 11). The Difference Between Quantification, Measure, Metric, and KPI.
Retrieved February 24, 2015, from Business Score Card Designer:
http://www.bscdesigner.com/quantification-measure-metric-kpi.htm
Slack, N., Brandson-Jones, A., Johnston, R., & Betts, A. (2006). Chapter 13: Improvement. In N. Slack,
A. Brandson-Jones, R. Johnston, & A. Betts, Operations and process management principles and
practice for strategic impact (pp. 432-433). Essex: Pearson Education Limited.
Unilytics. (2015). KPI Karta® – Actionable Key Performance Indicators. Retrieved March 16, 2015,
from Unilytics KPI Analysis: http://unilytics.com/services/kpi-karta/
Veen-Dirks, P. V., & Wijn, M. (2004). Kritieke succesfactoren en de balanced scorecard. In
Praktijkboek Financieel Management Afl.73 (pp. 20.01-20.20). Deventer: Kluwer.
Velaction. (2013, June). Key Performance Indicator. Retrieved March 10, 2015, from Velaction
Performance Improvement: http://www.velaction.com/key-performance-indicator/
Werquin. (2007, October 3). Terms, concepts and models for analysing the value of recognition
programmes . Vienna: Organisation for Economic Co-operation and Development.
Wheelock, J., & Oughton, E. (2011). The household in the Economy. In S. Himmelweit, R. Simonetti, &
A. Trigg, Microeconomics neoclasical and institutionalist perspectives on economic behaviour (pp.
126-128). UK: Cengage Learning EMEA.
Yin, R. (1994). Designing Case Studies . In R. Yin, Case Study Research Design and Methods (2nd ed.,
pp. 18-53). Thousand Oaks, London, New Delhi : Sage Publications.
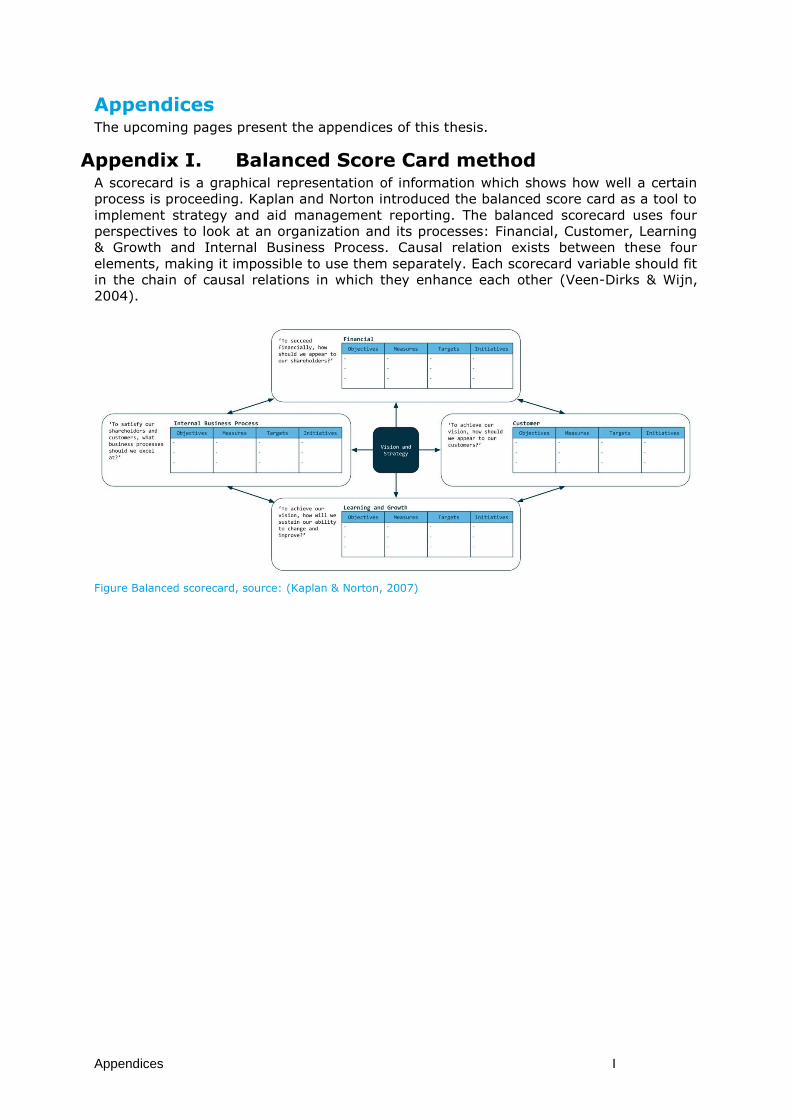
Appendices I
Appendices The upcoming pages present the appendices of this thesis.
Appendix I. Balanced Score Card method A scorecard is a graphical representation of information which shows how well a certain
process is proceeding. Kaplan and Norton introduced the balanced score card as a tool to
implement strategy and aid management reporting. The balanced scorecard uses four
perspectives to look at an organization and its processes: Financial, Customer, Learning
& Growth and Internal Business Process. Causal relation exists between these four
elements, making it impossible to use them separately. Each scorecard variable should fit
in the chain of causal relations in which they enhance each other (Veen-Dirks & Wijn,
2004).
Figure Balanced scorecard, source: (Kaplan & Norton, 2007)
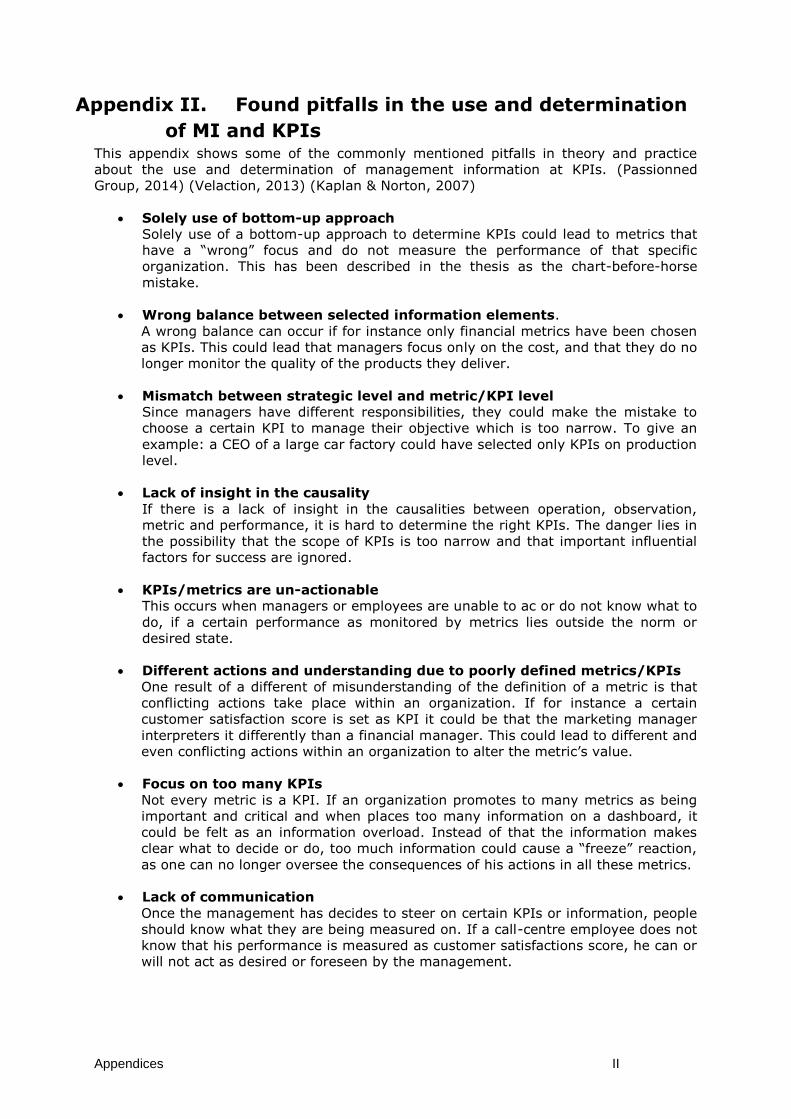
Appendices II
Appendix II. Found pitfalls in the use and determination
of MI and KPIs This appendix shows some of the commonly mentioned pitfalls in theory and practice
about the use and determination of management information at KPIs. (Passionned
Group, 2014) (Velaction, 2013) (Kaplan & Norton, 2007)
Solely use of bottom-up approach
Solely use of a bottom-up approach to determine KPIs could lead to metrics that
have a “wrong” focus and do not measure the performance of that specific
organization. This has been described in the thesis as the chart-before-horse
mistake.
Wrong balance between selected information elements.
A wrong balance can occur if for instance only financial metrics have been chosen
as KPIs. This could lead that managers focus only on the cost, and that they do no
longer monitor the quality of the products they deliver.
Mismatch between strategic level and metric/KPI level
Since managers have different responsibilities, they could make the mistake to
choose a certain KPI to manage their objective which is too narrow. To give an
example: a CEO of a large car factory could have selected only KPIs on production
level.
Lack of insight in the causality
If there is a lack of insight in the causalities between operation, observation,
metric and performance, it is hard to determine the right KPIs. The danger lies in
the possibility that the scope of KPIs is too narrow and that important influential
factors for success are ignored.
KPIs/metrics are un-actionable
This occurs when managers or employees are unable to ac or do not know what to
do, if a certain performance as monitored by metrics lies outside the norm or
desired state.
Different actions and understanding due to poorly defined metrics/KPIs
One result of a different of misunderstanding of the definition of a metric is that
conflicting actions take place within an organization. If for instance a certain
customer satisfaction score is set as KPI it could be that the marketing manager
interpreters it differently than a financial manager. This could lead to different and
even conflicting actions within an organization to alter the metric’s value.
Focus on too many KPIs
Not every metric is a KPI. If an organization promotes to many metrics as being
important and critical and when places too many information on a dashboard, it
could be felt as an information overload. Instead of that the information makes
clear what to decide or do, too much information could cause a “freeze” reaction,
as one can no longer oversee the consequences of his actions in all these metrics.
Lack of communication
Once the management has decides to steer on certain KPIs or information, people
should know what they are being measured on. If a call-centre employee does not
know that his performance is measured as customer satisfactions score, he can or
will not act as desired or foreseen by the management.
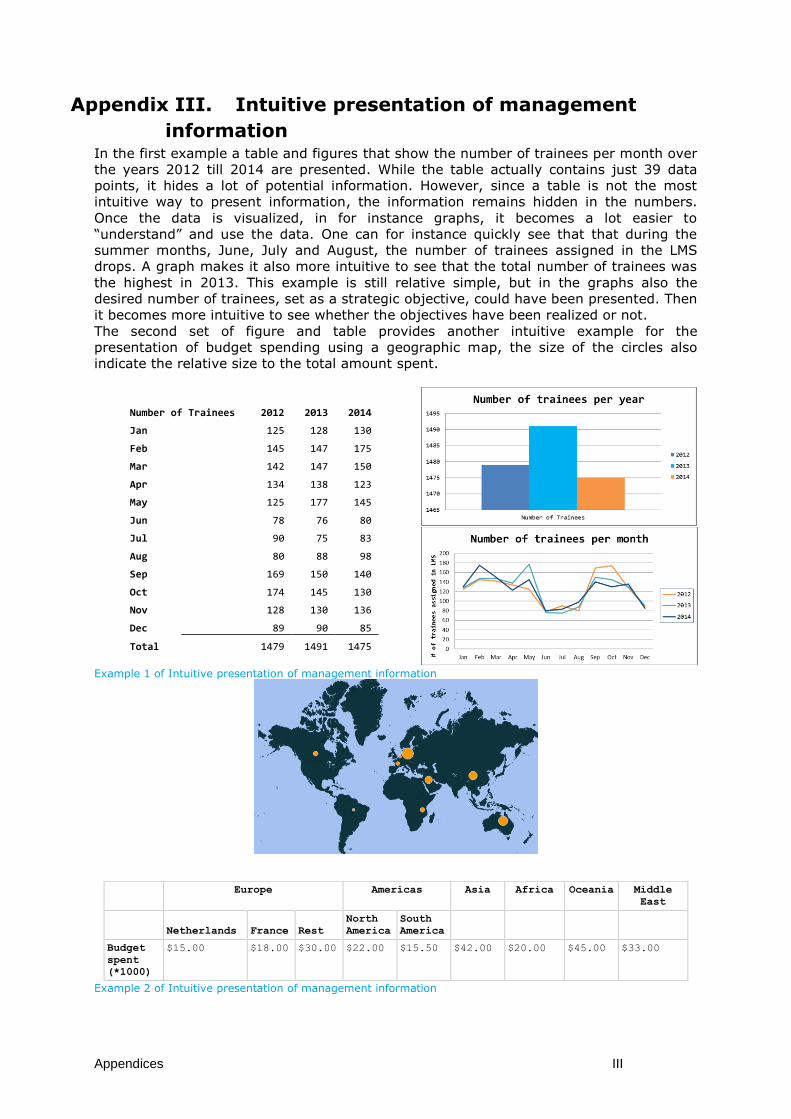
Appendices III
Appendix III. Intuitive presentation of management
information In the first example a table and figures that show the number of trainees per month over
the years 2012 till 2014 are presented. While the table actually contains just 39 data
points, it hides a lot of potential information. However, since a table is not the most
intuitive way to present information, the information remains hidden in the numbers.
Once the data is visualized, in for instance graphs, it becomes a lot easier to
“understand” and use the data. One can for instance quickly see that that during the
summer months, June, July and August, the number of trainees assigned in the LMS
drops. A graph makes it also more intuitive to see that the total number of trainees was
the highest in 2013. This example is still relative simple, but in the graphs also the
desired number of trainees, set as a strategic objective, could have been presented. Then
it becomes more intuitive to see whether the objectives have been realized or not.
The second set of figure and table provides another intuitive example for the
presentation of budget spending using a geographic map, the size of the circles also
indicate the relative size to the total amount spent.
Number of Trainees 2012 2013 2014
Jan 125 128 130
Feb 145 147 175
Mar 142 147 150
Apr 134 138 123
May 125 177 145
Jun 78 76 80
Jul 90 75 83
Aug 80 88 98
Sep 169 150 140
Oct 174 145 130
Nov 128 130 136
Dec 89 90 85
Total 1479 1491 1475
Example 1 of Intuitive presentation of management information
Europe Americas Asia Africa Oceania Middle
East
Netherlands France Rest
North
America
South
America
Budget
spent
(*1000)
$15.00 $18.00 $30.00 $22.00 $15.50 $42.00 $20.00 $45.00 $33.00
Example 2 of Intuitive presentation of management information
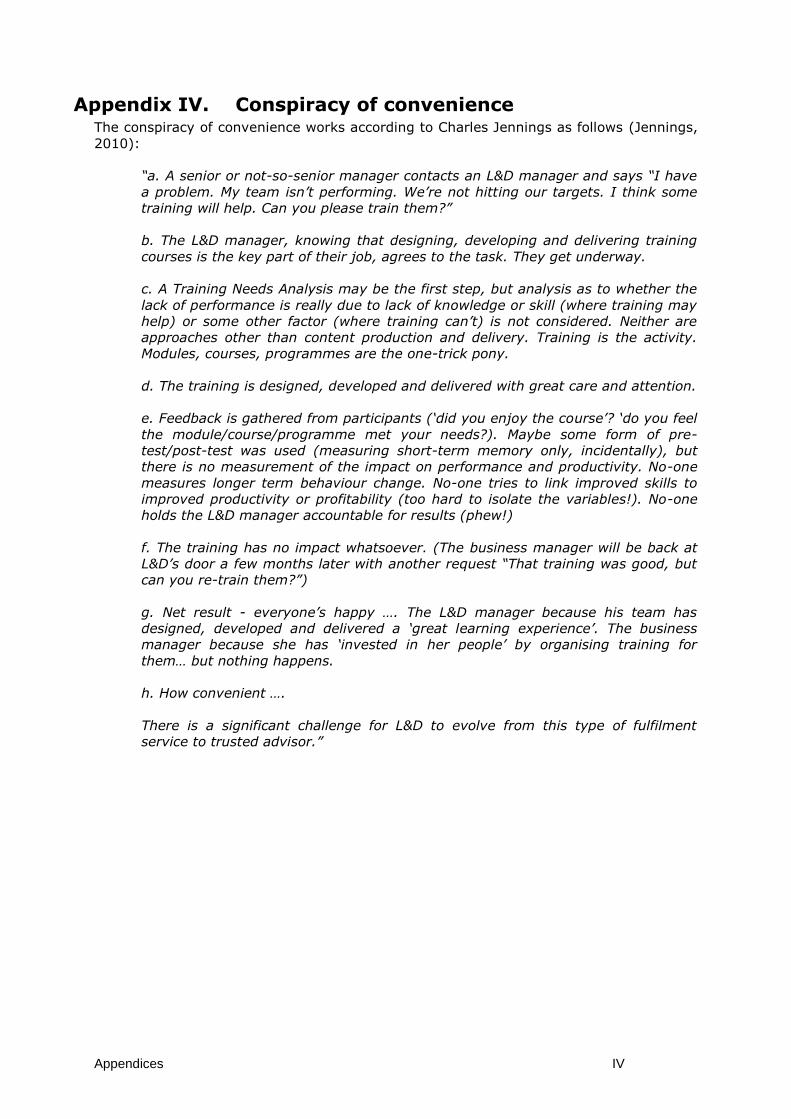
Appendices IV
Appendix IV. Conspiracy of convenience The conspiracy of convenience works according to Charles Jennings as follows (Jennings,
2010):
“a. A senior or not-so-senior manager contacts an L&D manager and says “I have
a problem. My team isn’t performing. We’re not hitting our targets. I think some
training will help. Can you please train them?”
b. The L&D manager, knowing that designing, developing and delivering training
courses is the key part of their job, agrees to the task. They get underway.
c. A Training Needs Analysis may be the first step, but analysis as to whether the
lack of performance is really due to lack of knowledge or skill (where training may
help) or some other factor (where training can’t) is not considered. Neither are
approaches other than content production and delivery. Training is the activity.
Modules, courses, programmes are the one-trick pony.
d. The training is designed, developed and delivered with great care and attention.
e. Feedback is gathered from participants (‘did you enjoy the course’? ‘do you feel
the module/course/programme met your needs?). Maybe some form of pre-
test/post-test was used (measuring short-term memory only, incidentally), but
there is no measurement of the impact on performance and productivity. No-one
measures longer term behaviour change. No-one tries to link improved skills to
improved productivity or profitability (too hard to isolate the variables!). No-one
holds the L&D manager accountable for results (phew!)
f. The training has no impact whatsoever. (The business manager will be back at
L&D’s door a few months later with another request “That training was good, but
can you re-train them?”)
g. Net result - everyone’s happy …. The L&D manager because his team has
designed, developed and delivered a ‘great learning experience’. The business
manager because she has ‘invested in her people’ by organising training for
them… but nothing happens.
h. How convenient ….
There is a significant challenge for L&D to evolve from this type of fulfilment
service to trusted advisor.”
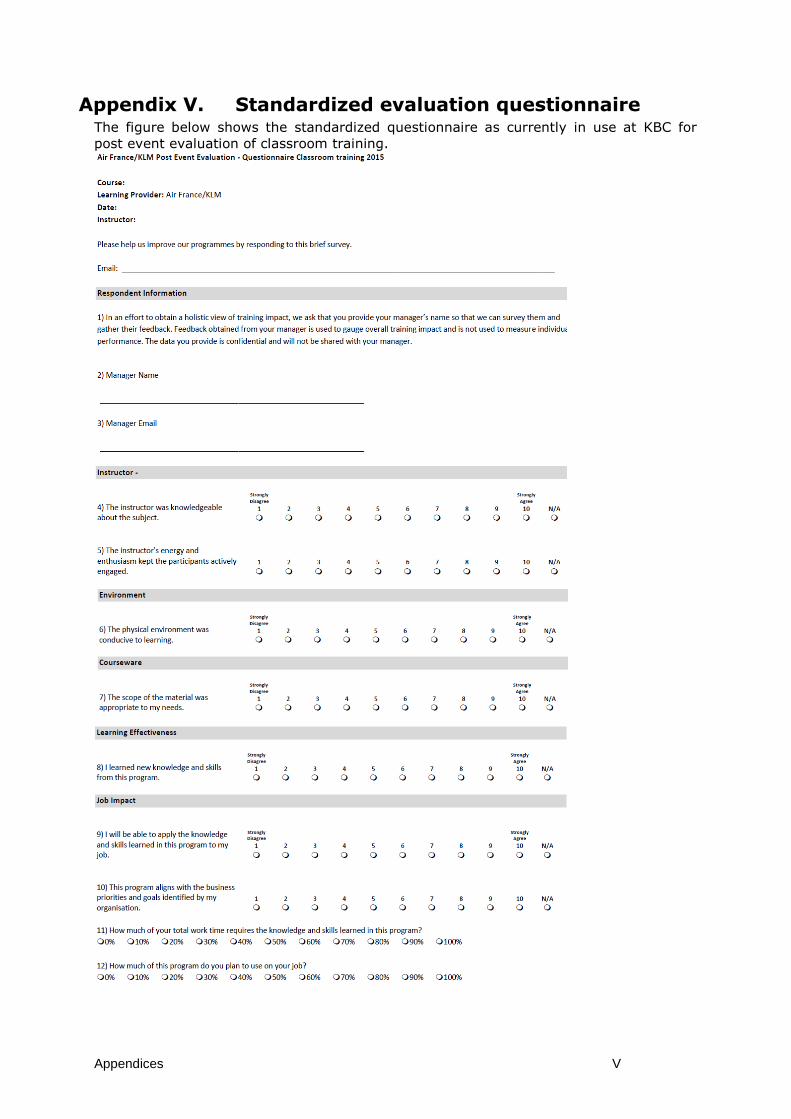
Appendices V
Appendix V. Standardized evaluation questionnaire The figure below shows the standardized questionnaire as currently in use at KBC for
post event evaluation of classroom training.
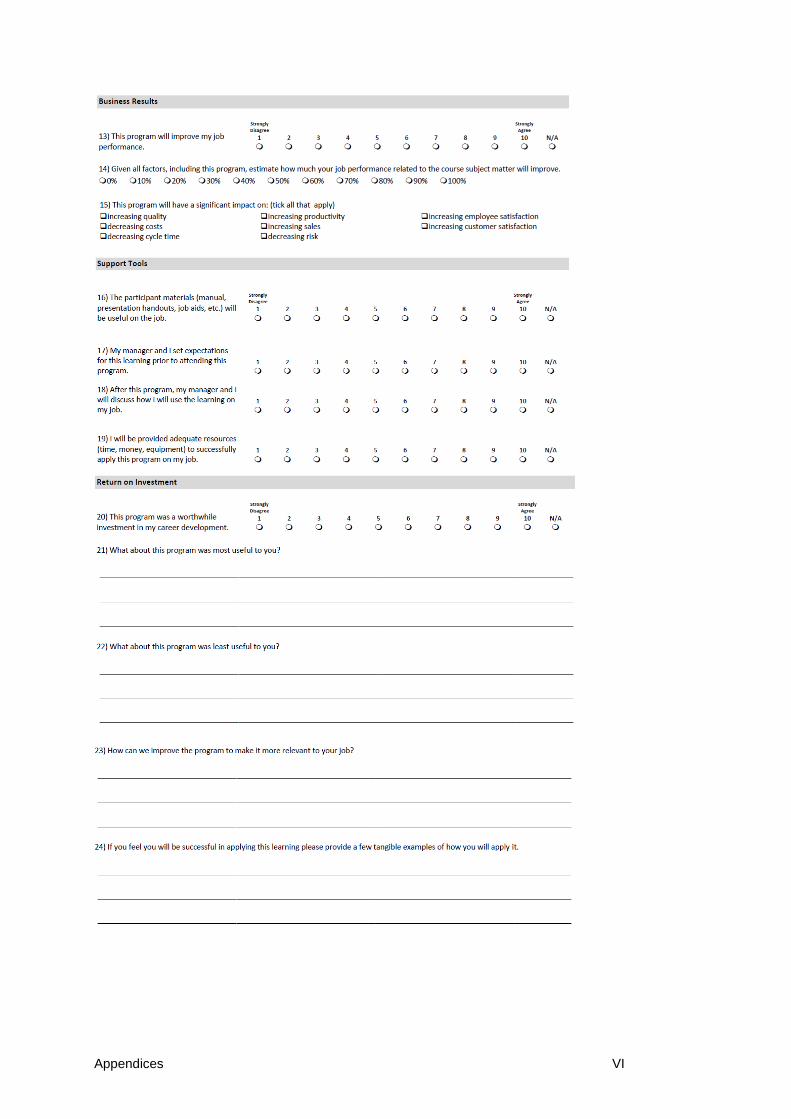
Appendices VI
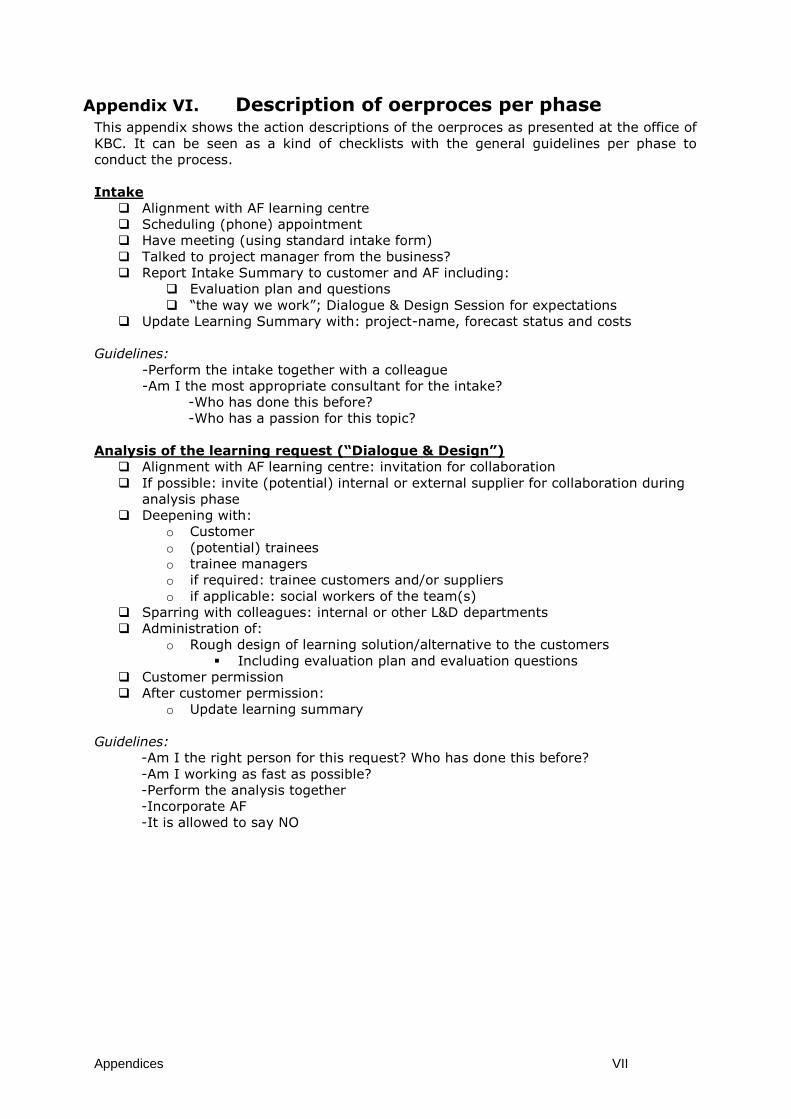
Appendices VII
Appendix VI. Description of oerproces per phase
This appendix shows the action descriptions of the oerproces as presented at the office of
KBC. It can be seen as a kind of checklists with the general guidelines per phase to
conduct the process.
Intake
Alignment with AF learning centre
Scheduling (phone) appointment
Have meeting (using standard intake form)
Talked to project manager from the business?
Report Intake Summary to customer and AF including:
Evaluation plan and questions
“the way we work”; Dialogue & Design Session for expectations
Update Learning Summary with: project-name, forecast status and costs
Guidelines:
-Perform the intake together with a colleague
-Am I the most appropriate consultant for the intake?
-Who has done this before?
-Who has a passion for this topic?
Analysis of the learning request (“Dialogue & Design”)
Alignment with AF learning centre: invitation for collaboration
If possible: invite (potential) internal or external supplier for collaboration during
analysis phase
Deepening with:
o Customer
o (potential) trainees
o trainee managers
o if required: trainee customers and/or suppliers
o if applicable: social workers of the team(s)
Sparring with colleagues: internal or other L&D departments
Administration of:
o Rough design of learning solution/alternative to the customers
Including evaluation plan and evaluation questions
Customer permission
After customer permission:
o Update learning summary
Guidelines:
-Am I the right person for this request? Who has done this before?
-Am I working as fast as possible?
-Perform the analysis together
-Incorporate AF
-It is allowed to say NO
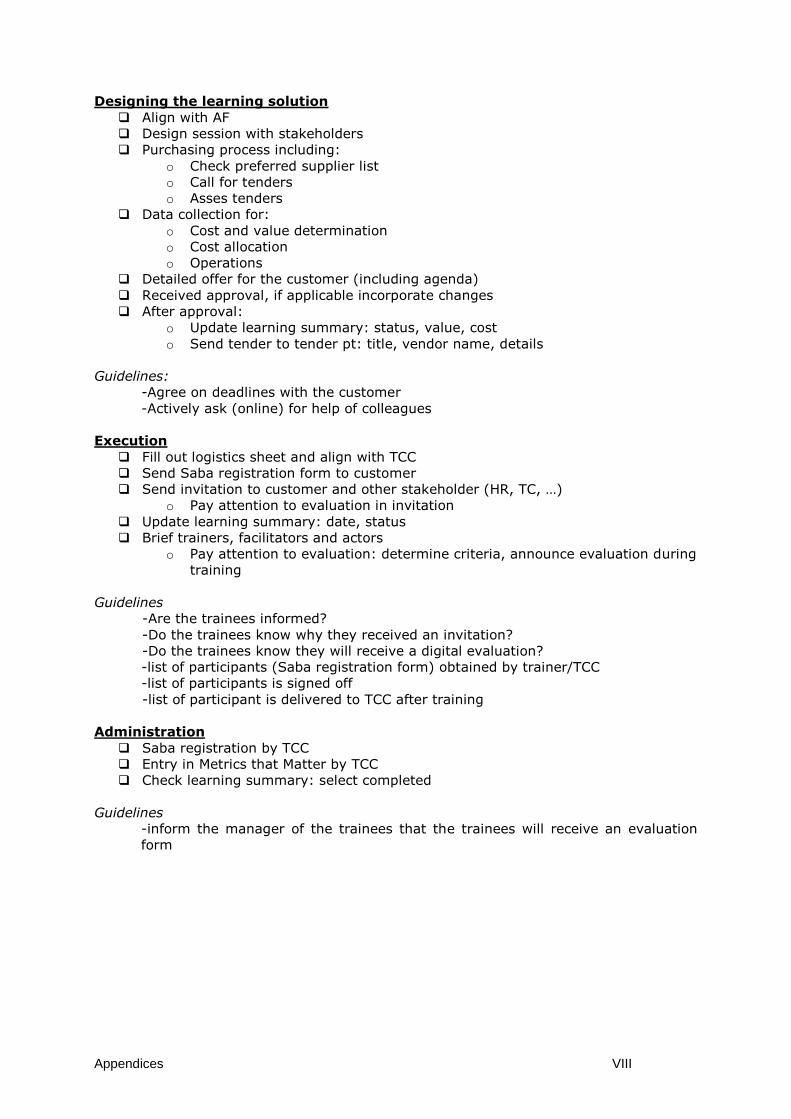
Appendices VIII
Designing the learning solution
Align with AF
Design session with stakeholders
Purchasing process including:
o Check preferred supplier list
o Call for tenders
o Asses tenders
Data collection for:
o Cost and value determination
o Cost allocation
o Operations
Detailed offer for the customer (including agenda)
Received approval, if applicable incorporate changes
After approval:
o Update learning summary: status, value, cost
o Send tender to tender pt: title, vendor name, details
Guidelines:
-Agree on deadlines with the customer
-Actively ask (online) for help of colleagues
Execution
Fill out logistics sheet and align with TCC
Send Saba registration form to customer
Send invitation to customer and other stakeholder (HR, TC, …)
o Pay attention to evaluation in invitation
Update learning summary: date, status
Brief trainers, facilitators and actors
o Pay attention to evaluation: determine criteria, announce evaluation during
training
Guidelines
-Are the trainees informed?
-Do the trainees know why they received an invitation?
-Do the trainees know they will receive a digital evaluation?
-list of participants (Saba registration form) obtained by trainer/TCC
-list of participants is signed off
-list of participant is delivered to TCC after training
Administration
Saba registration by TCC
Entry in Metrics that Matter by TCC
Check learning summary: select completed
Guidelines
-inform the manager of the trainees that the trainees will receive an evaluation
form
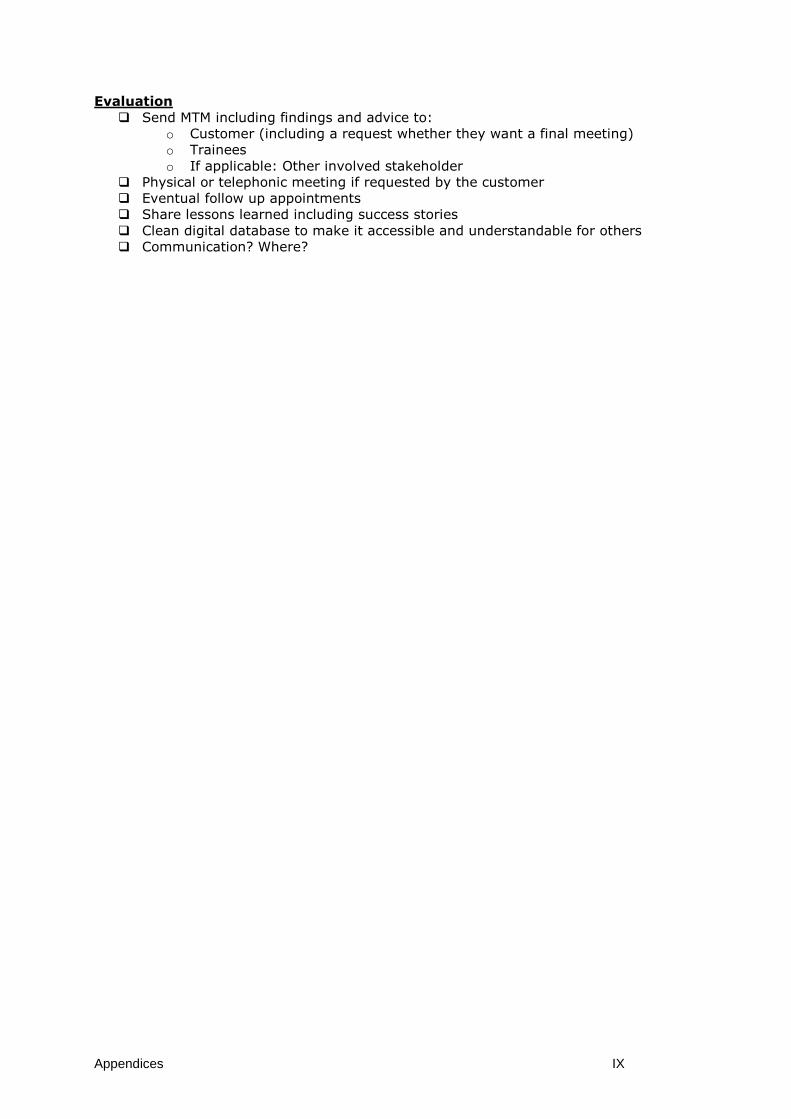
Appendices IX
Evaluation
Send MTM including findings and advice to:
o Customer (including a request whether they want a final meeting)
o Trainees
o If applicable: Other involved stakeholder
Physical or telephonic meeting if requested by the customer
Eventual follow up appointments
Share lessons learned including success stories
Clean digital database to make it accessible and understandable for others
Communication? Where?
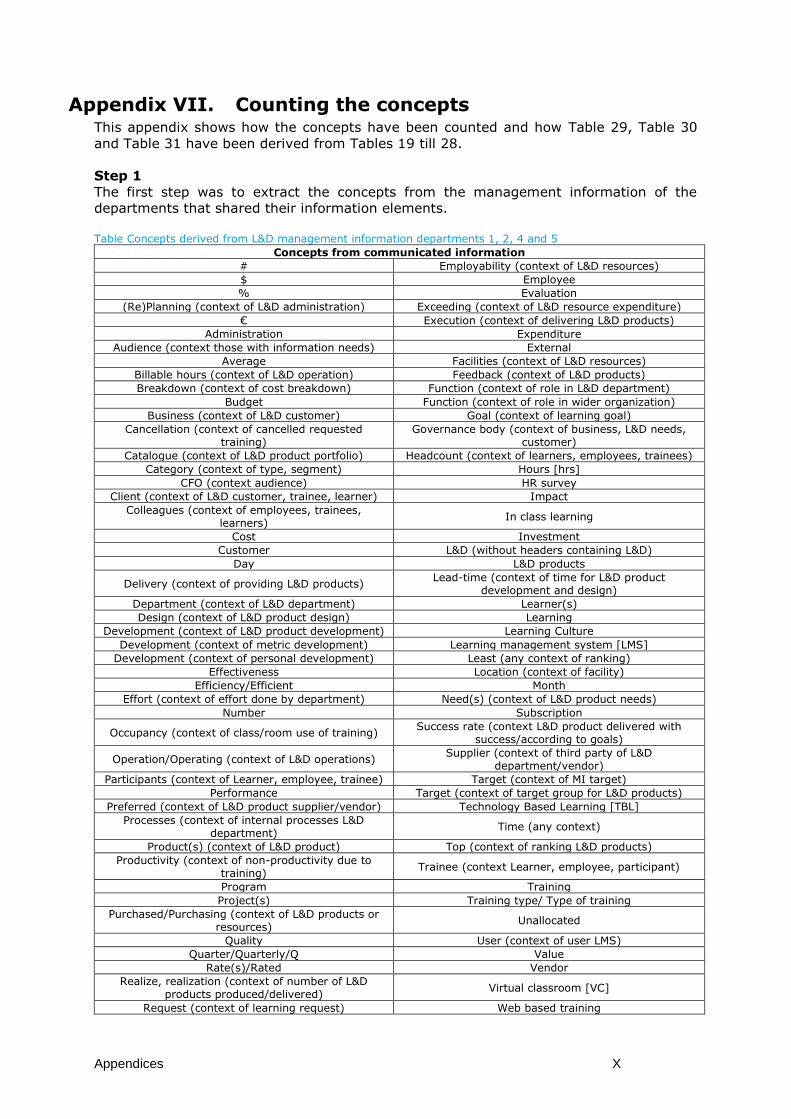
Appendices X
Appendix VII. Counting the concepts This appendix shows how the concepts have been counted and how Table 29, Table 30
and Table 31 have been derived from Tables 19 till 28.
Step 1
The first step was to extract the concepts from the management information of the
departments that shared their information elements.
Table Concepts derived from L&D management information departments 1, 2, 4 and 5
Concepts from communicated information
# Employability (context of L&D resources)
$ Employee
% Evaluation
(Re)Planning (context of L&D administration) Exceeding (context of L&D resource expenditure)
€ Execution (context of delivering L&D products)
Administration Expenditure
Audience (context those with information needs) External
Average Facilities (context of L&D resources)
Billable hours (context of L&D operation) Feedback (context of L&D products)
Breakdown (context of cost breakdown) Function (context of role in L&D department)
Budget Function (context of role in wider organization)
Business (context of L&D customer) Goal (context of learning goal)
Cancellation (context of cancelled requested training)
Governance body (context of business, L&D needs, customer)
Catalogue (context of L&D product portfolio) Headcount (context of learners, employees, trainees)
Category (context of type, segment) Hours [hrs]
CFO (context audience) HR survey
Client (context of L&D customer, trainee, learner) Impact
Colleagues (context of employees, trainees, learners)
In class learning
Cost Investment
Customer L&D (without headers containing L&D)
Day L&D products
Delivery (context of providing L&D products) Lead-time (context of time for L&D product
development and design)
Department (context of L&D department) Learner(s)
Design (context of L&D product design) Learning
Development (context of L&D product development) Learning Culture
Development (context of metric development) Learning management system [LMS]
Development (context of personal development) Least (any context of ranking)
Effectiveness Location (context of facility)
Efficiency/Efficient Month
Effort (context of effort done by department) Need(s) (context of L&D product needs)
Number Subscription
Occupancy (context of class/room use of training) Success rate (context L&D product delivered with
success/according to goals)
Operation/Operating (context of L&D operations) Supplier (context of third party of L&D
department/vendor)
Participants (context of Learner, employee, trainee) Target (context of MI target)
Performance Target (context of target group for L&D products)
Preferred (context of L&D product supplier/vendor) Technology Based Learning [TBL]
Processes (context of internal processes L&D department)
Time (any context)
Product(s) (context of L&D product) Top (context of ranking L&D products)
Productivity (context of non-productivity due to training)
Trainee (context Learner, employee, participant)
Program Training
Project(s) Training type/ Type of training
Purchased/Purchasing (context of L&D products or resources)
Unallocated
Quality User (context of user LMS)
Quarter/Quarterly/Q Value
Rate(s)/Rated Vendor
Realize, realization (context of number of L&D products produced/delivered)
Virtual classroom [VC]
Request (context of learning request) Web based training
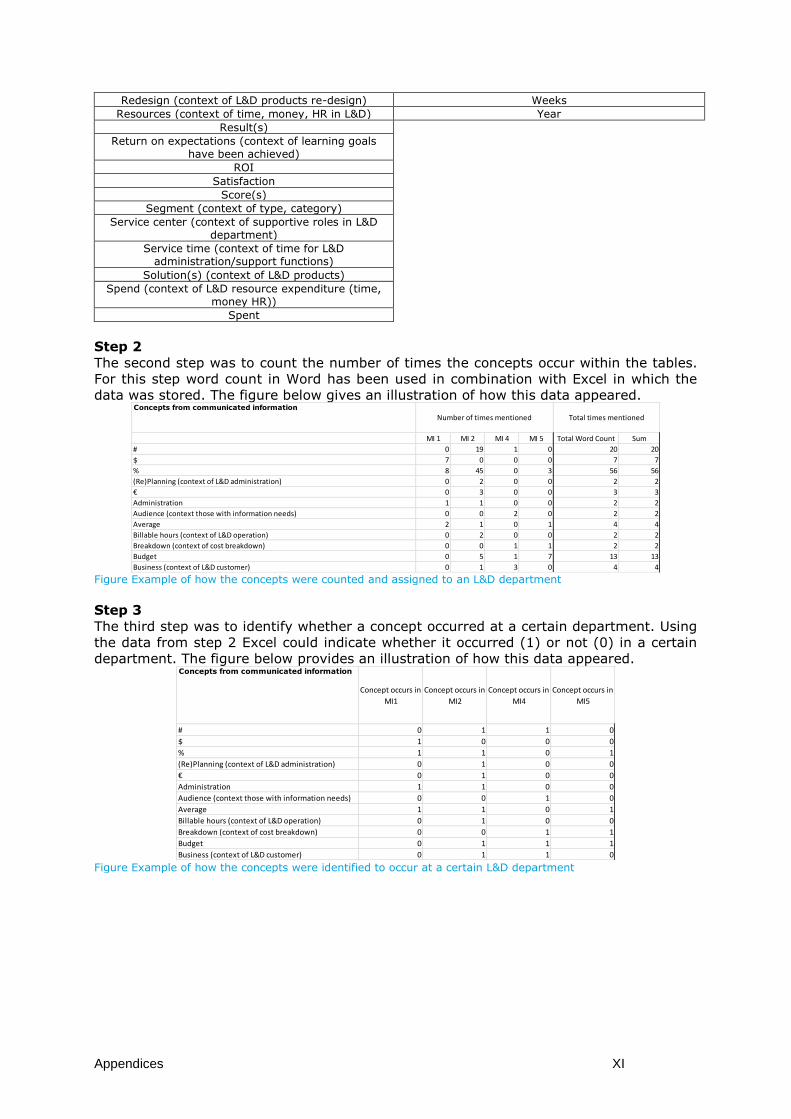
Appendices XI
Redesign (context of L&D products re-design) Weeks
Resources (context of time, money, HR in L&D) Year
Result(s)
Return on expectations (context of learning goals have been achieved)
ROI
Satisfaction
Score(s)
Segment (context of type, category)
Service center (context of supportive roles in L&D department)
Service time (context of time for L&D administration/support functions)
Solution(s) (context of L&D products)
Spend (context of L&D resource expenditure (time, money HR))
Spent
Step 2
The second step was to count the number of times the concepts occur within the tables.
For this step word count in Word has been used in combination with Excel in which the
data was stored. The figure below gives an illustration of how this data appeared.
Figure Example of how the concepts were counted and assigned to an L&D department
Step 3
The third step was to identify whether a concept occurred at a certain department. Using
the data from step 2 Excel could indicate whether it occurred (1) or not (0) in a certain
department. The figure below provides an illustration of how this data appeared.
Figure Example of how the concepts were identified to occur at a certain L&D department
Concepts from communicated information
MI 1 MI 2 MI 4 MI 5 Total Word Count Sum
# 0 19 1 0 20 20
$ 7 0 0 0 7 7
% 8 45 0 3 56 56
(Re)Planning (context of L&D administration) 0 2 0 0 2 2
€ 0 3 0 0 3 3
Administration 1 1 0 0 2 2
Audience (context those with information needs) 0 0 2 0 2 2
Average 2 1 0 1 4 4
Billable hours (context of L&D operation) 0 2 0 0 2 2
Breakdown (context of cost breakdown) 0 0 1 1 2 2
Budget 0 5 1 7 13 13
Business (context of L&D customer) 0 1 3 0 4 4
Number of times mentioned Total times mentioned
Concepts from communicated information
Concept occurs in
MI1
Concept occurs in
MI2
Concept occurs in
MI4
Concept occurs in
MI5
# 0 1 1 0
$ 1 0 0 0
% 1 1 0 1
(Re)Planning (context of L&D administration) 0 1 0 0
€ 0 1 0 0
Administration 1 1 0 0
Audience (context those with information needs) 0 0 1 0
Average 1 1 0 1
Billable hours (context of L&D operation) 0 1 0 0
Breakdown (context of cost breakdown) 0 0 1 1
Budget 0 1 1 1
Business (context of L&D customer) 0 1 1 0
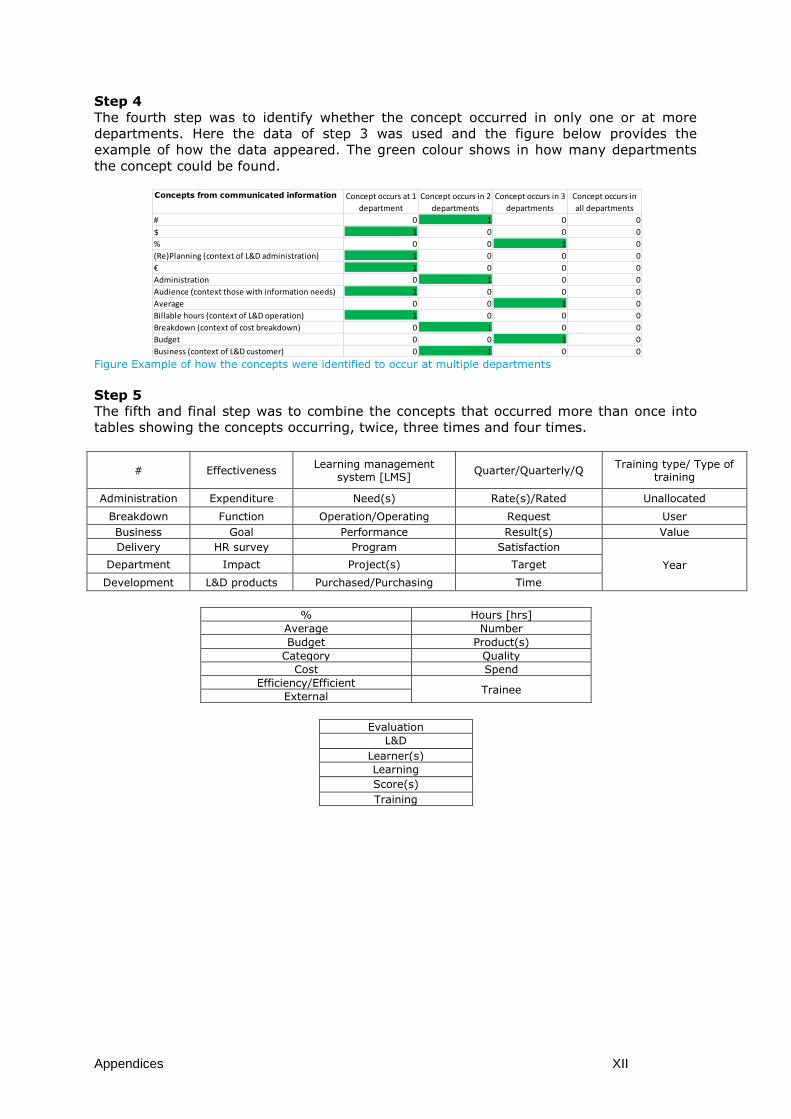
Appendices XII
Step 4
The fourth step was to identify whether the concept occurred in only one or at more
departments. Here the data of step 3 was used and the figure below provides the
example of how the data appeared. The green colour shows in how many departments
the concept could be found.
Figure Example of how the concepts were identified to occur at multiple departments
Step 5
The fifth and final step was to combine the concepts that occurred more than once into
tables showing the concepts occurring, twice, three times and four times.
# Effectiveness Learning management
system [LMS] Quarter/Quarterly/Q
Training type/ Type of training
Administration Expenditure Need(s) Rate(s)/Rated Unallocated
Breakdown Function Operation/Operating Request User
Business Goal Performance Result(s) Value
Delivery HR survey Program Satisfaction
Year Department Impact Project(s) Target
Development L&D products Purchased/Purchasing Time
% Hours [hrs]
Average Number
Budget Product(s)
Category Quality
Cost Spend
Efficiency/Efficient Trainee
External
Evaluation
L&D
Learner(s)
Learning
Score(s)
Training
Concepts from communicated information Concept occurs at 1
department
Concept occurs in 2
departments
Concept occurs in 3
departments
Concept occurs in
all departments
# 0 1 0 0
$ 1 0 0 0
% 0 0 1 0
(Re)Planning (context of L&D administration) 1 0 0 0
€ 1 0 0 0
Administration 0 1 0 0
Audience (context those with information needs) 1 0 0 0
Average 0 0 1 0
Billable hours (context of L&D operation) 1 0 0 0
Breakdown (context of cost breakdown) 0 1 0 0
Budget 0 0 1 0
Business (context of L&D customer) 0 1 0 0
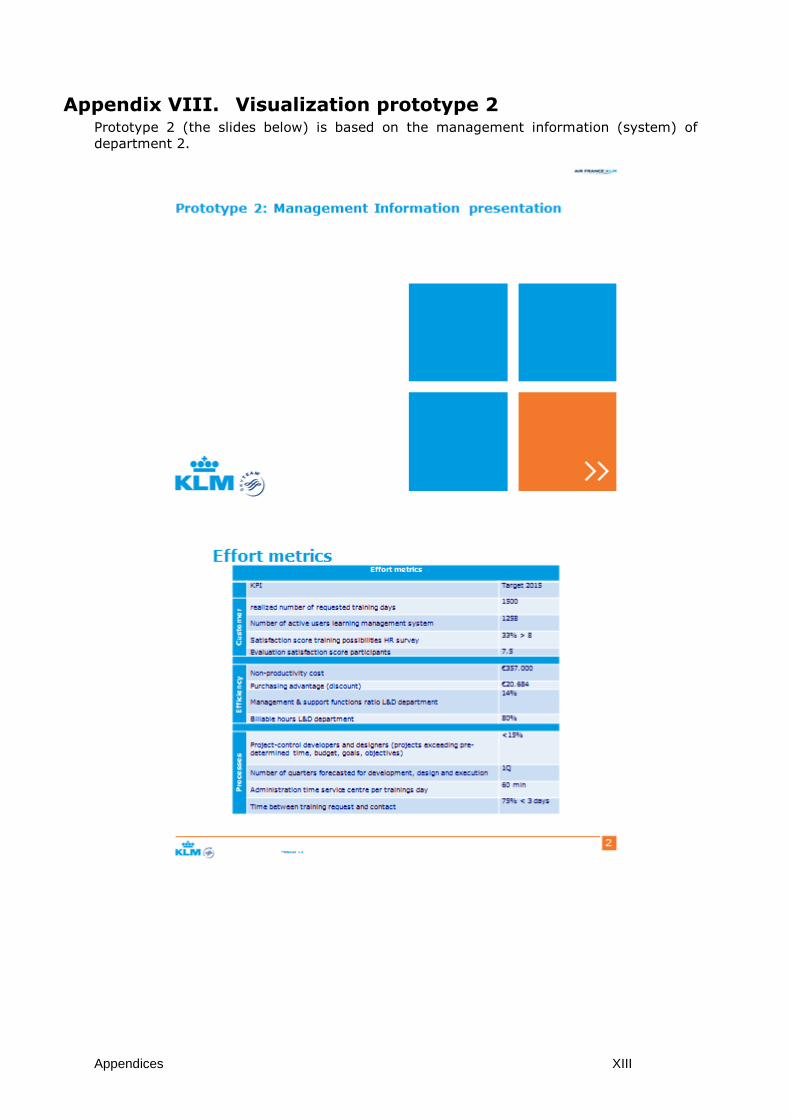
Appendices XIII
Appendix VIII. Visualization prototype 2 Prototype 2 (the slides below) is based on the management information (system) of
department 2.
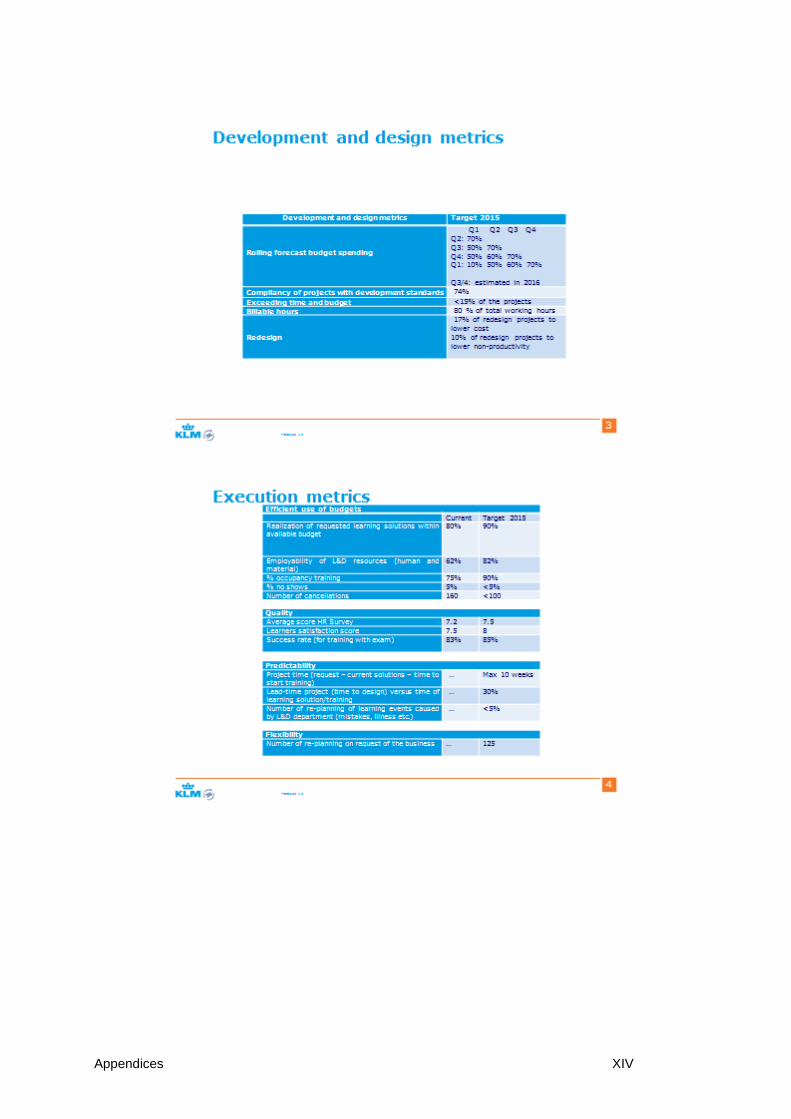
Appendices XIV
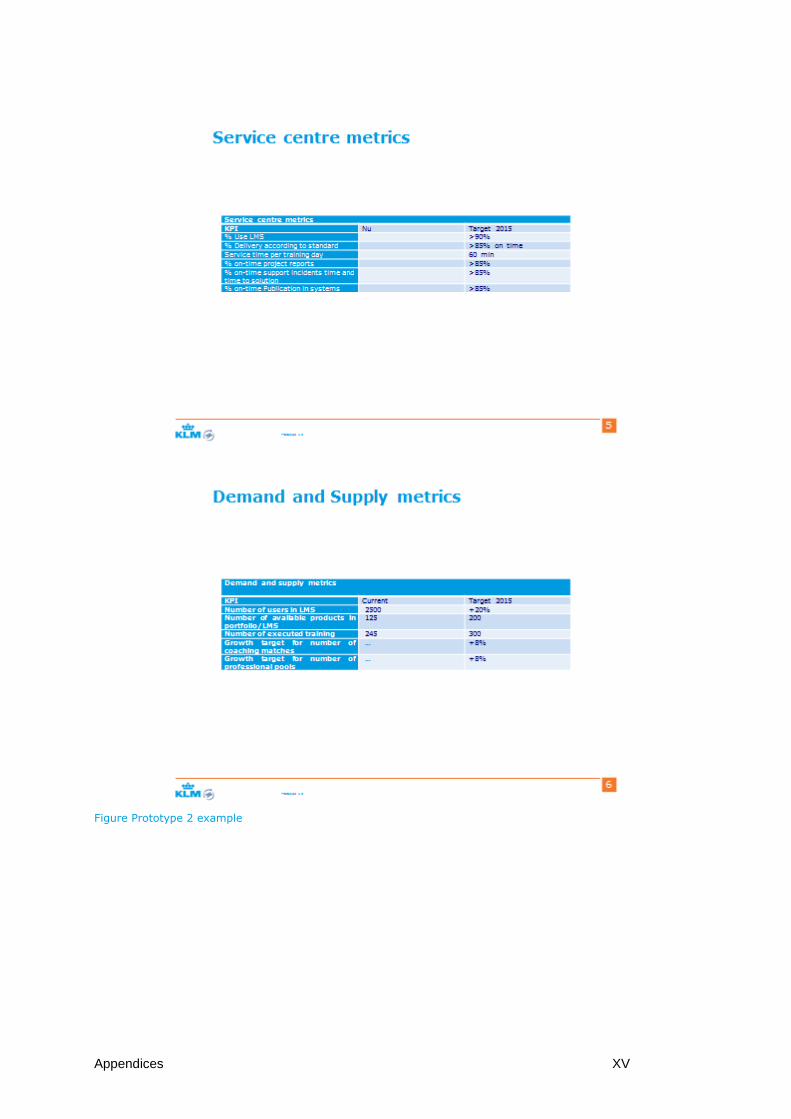
Appendices XV
Figure Prototype 2 example
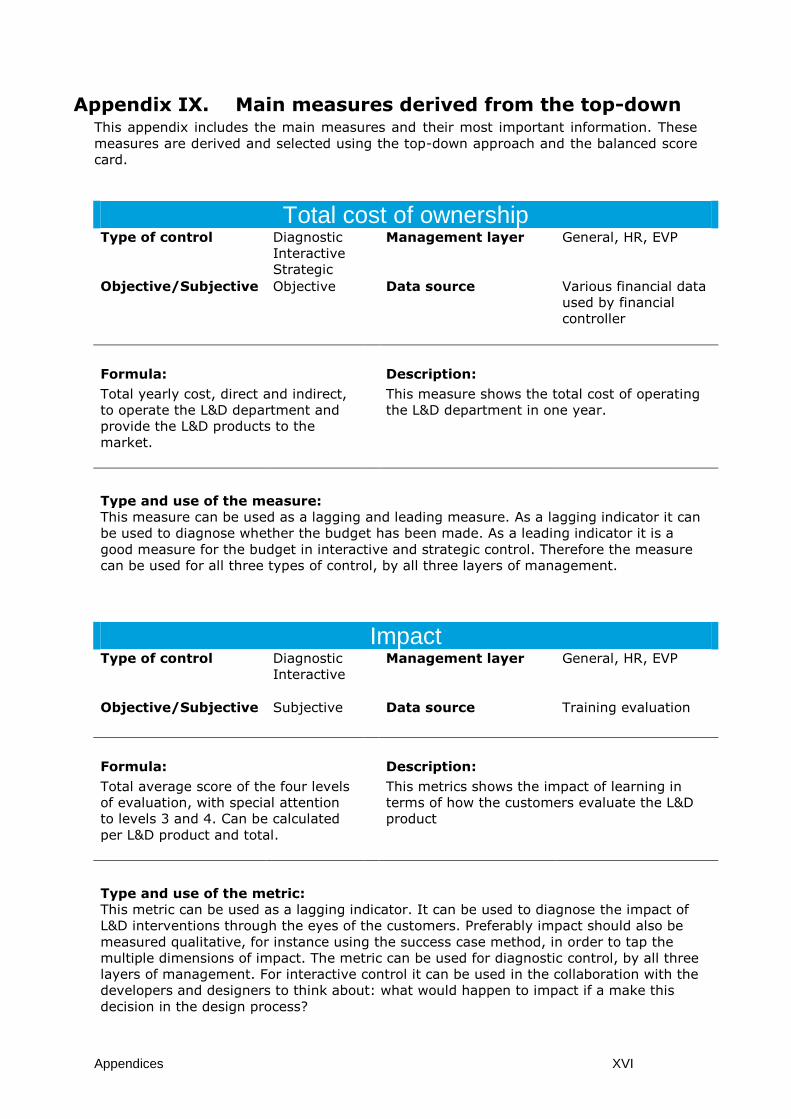
Appendices XVI
Appendix IX. Main measures derived from the top-down This appendix includes the main measures and their most important information. These
measures are derived and selected using the top-down approach and the balanced score
card.
Total cost of ownership Type of control Diagnostic
Interactive
Strategic
Management layer General, HR, EVP
Objective/Subjective Objective Data source Various financial data
used by financial
controller
Formula: Description:
Total yearly cost, direct and indirect,
to operate the L&D department and
provide the L&D products to the
market.
This measure shows the total cost of operating
the L&D department in one year.
Type and use of the measure: This measure can be used as a lagging and leading measure. As a lagging indicator it can
be used to diagnose whether the budget has been made. As a leading indicator it is a
good measure for the budget in interactive and strategic control. Therefore the measure
can be used for all three types of control, by all three layers of management.
Impact Type of control Diagnostic
Interactive
Management layer General, HR, EVP
Objective/Subjective Subjective Data source Training evaluation
Formula: Description:
Total average score of the four levels
of evaluation, with special attention
to levels 3 and 4. Can be calculated
per L&D product and total.
This metrics shows the impact of learning in
terms of how the customers evaluate the L&D
product
Type and use of the metric: This metric can be used as a lagging indicator. It can be used to diagnose the impact of
L&D interventions through the eyes of the customers. Preferably impact should also be
measured qualitative, for instance using the success case method, in order to tap the
multiple dimensions of impact. The metric can be used for diagnostic control, by all three
layers of management. For interactive control it can be used in the collaboration with the
developers and designers to think about: what would happen to impact if a make this
decision in the design process?
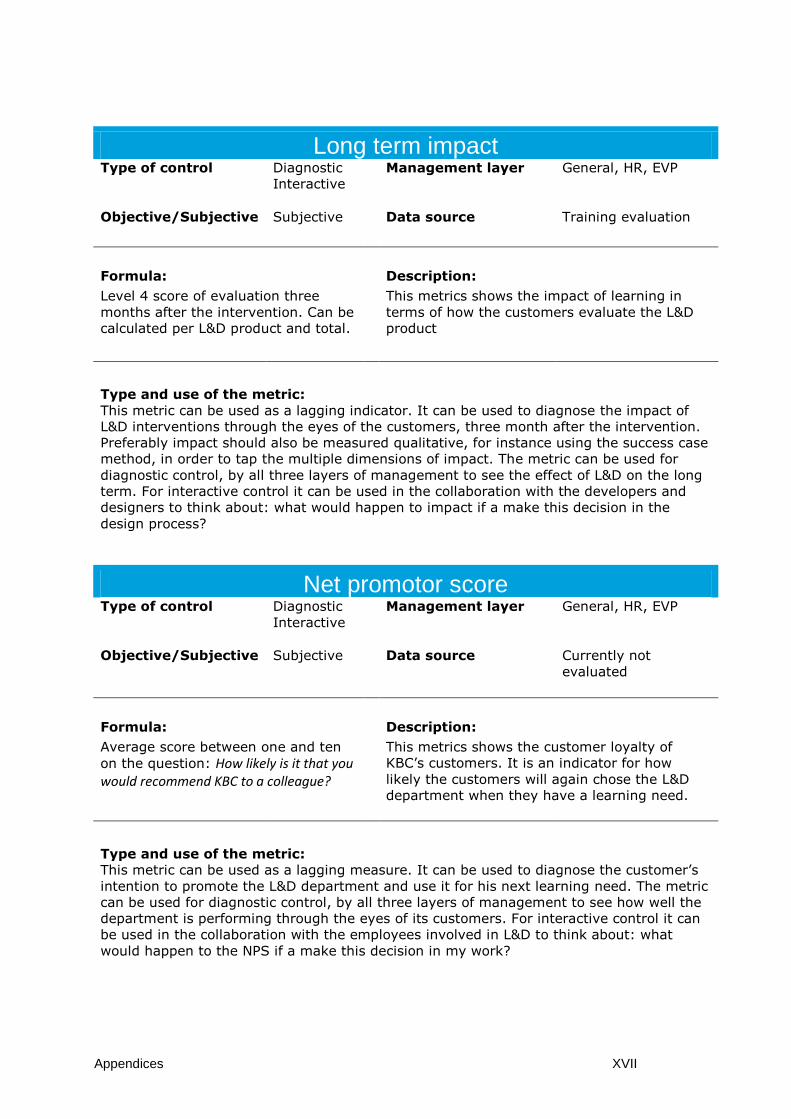
Appendices XVII
Long term impact Type of control Diagnostic
Interactive
Management layer General, HR, EVP
Objective/Subjective Subjective Data source Training evaluation
Formula: Description:
Level 4 score of evaluation three
months after the intervention. Can be
calculated per L&D product and total.
This metrics shows the impact of learning in
terms of how the customers evaluate the L&D
product
Type and use of the metric: This metric can be used as a lagging indicator. It can be used to diagnose the impact of
L&D interventions through the eyes of the customers, three month after the intervention.
Preferably impact should also be measured qualitative, for instance using the success case
method, in order to tap the multiple dimensions of impact. The metric can be used for
diagnostic control, by all three layers of management to see the effect of L&D on the long
term. For interactive control it can be used in the collaboration with the developers and
designers to think about: what would happen to impact if a make this decision in the
design process?
Net promotor score Type of control Diagnostic
Interactive
Management layer General, HR, EVP
Objective/Subjective Subjective Data source Currently not
evaluated
Formula: Description:
Average score between one and ten
on the question: How likely is it that you would recommend KBC to a colleague?
This metrics shows the customer loyalty of
KBC’s customers. It is an indicator for how
likely the customers will again chose the L&D
department when they have a learning need.
Type and use of the metric: This metric can be used as a lagging measure. It can be used to diagnose the customer’s
intention to promote the L&D department and use it for his next learning need. The metric
can be used for diagnostic control, by all three layers of management to see how well the
department is performing through the eyes of its customers. For interactive control it can
be used in the collaboration with the employees involved in L&D to think about: what
would happen to the NPS if a make this decision in my work?
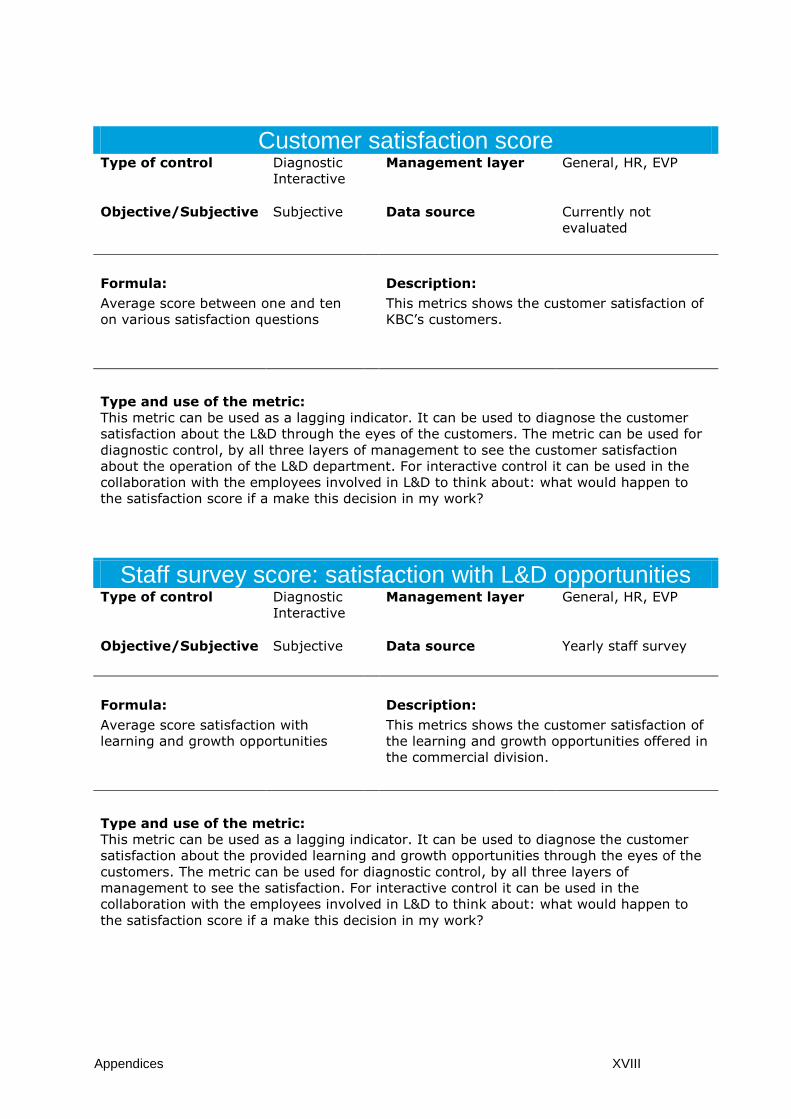
Appendices XVIII
Customer satisfaction score Type of control Diagnostic
Interactive
Management layer General, HR, EVP
Objective/Subjective Subjective Data source Currently not
evaluated
Formula: Description:
Average score between one and ten
on various satisfaction questions
This metrics shows the customer satisfaction of
KBC’s customers.
Type and use of the metric: This metric can be used as a lagging indicator. It can be used to diagnose the customer
satisfaction about the L&D through the eyes of the customers. The metric can be used for
diagnostic control, by all three layers of management to see the customer satisfaction
about the operation of the L&D department. For interactive control it can be used in the
collaboration with the employees involved in L&D to think about: what would happen to
the satisfaction score if a make this decision in my work?
Staff survey score: satisfaction with L&D opportunities Type of control Diagnostic
Interactive
Management layer General, HR, EVP
Objective/Subjective Subjective Data source Yearly staff survey
Formula: Description:
Average score satisfaction with
learning and growth opportunities
This metrics shows the customer satisfaction of
the learning and growth opportunities offered in
the commercial division.
Type and use of the metric: This metric can be used as a lagging indicator. It can be used to diagnose the customer
satisfaction about the provided learning and growth opportunities through the eyes of the
customers. The metric can be used for diagnostic control, by all three layers of
management to see the satisfaction. For interactive control it can be used in the
collaboration with the employees involved in L&D to think about: what would happen to
the satisfaction score if a make this decision in my work?
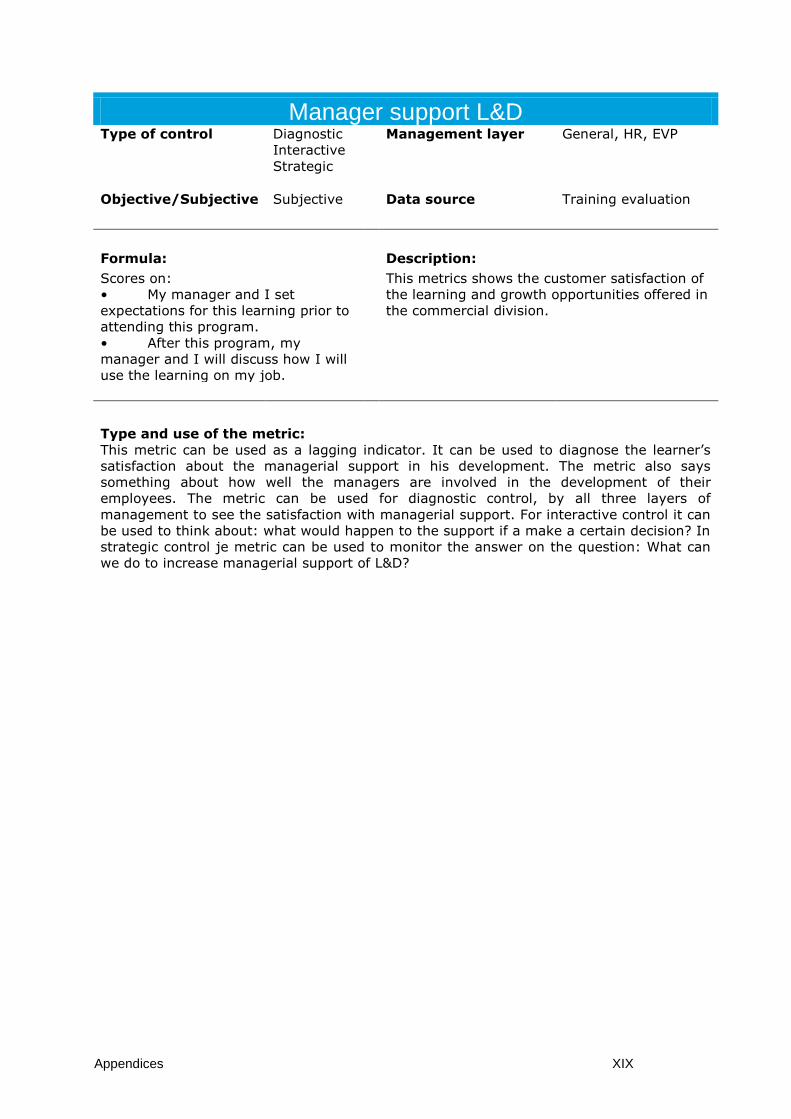
Appendices XIX
Manager support L&D Type of control Diagnostic
Interactive
Strategic
Management layer General, HR, EVP
Objective/Subjective Subjective Data source Training evaluation
Formula: Description:
Scores on:
• My manager and I set
expectations for this learning prior to
attending this program.
• After this program, my
manager and I will discuss how I will
use the learning on my job.
This metrics shows the customer satisfaction of
the learning and growth opportunities offered in
the commercial division.
Type and use of the metric: This metric can be used as a lagging indicator. It can be used to diagnose the learner’s
satisfaction about the managerial support in his development. The metric also says
something about how well the managers are involved in the development of their
employees. The metric can be used for diagnostic control, by all three layers of
management to see the satisfaction with managerial support. For interactive control it can
be used to think about: what would happen to the support if a make a certain decision? In
strategic control je metric can be used to monitor the answer on the question: What can
we do to increase managerial support of L&D?
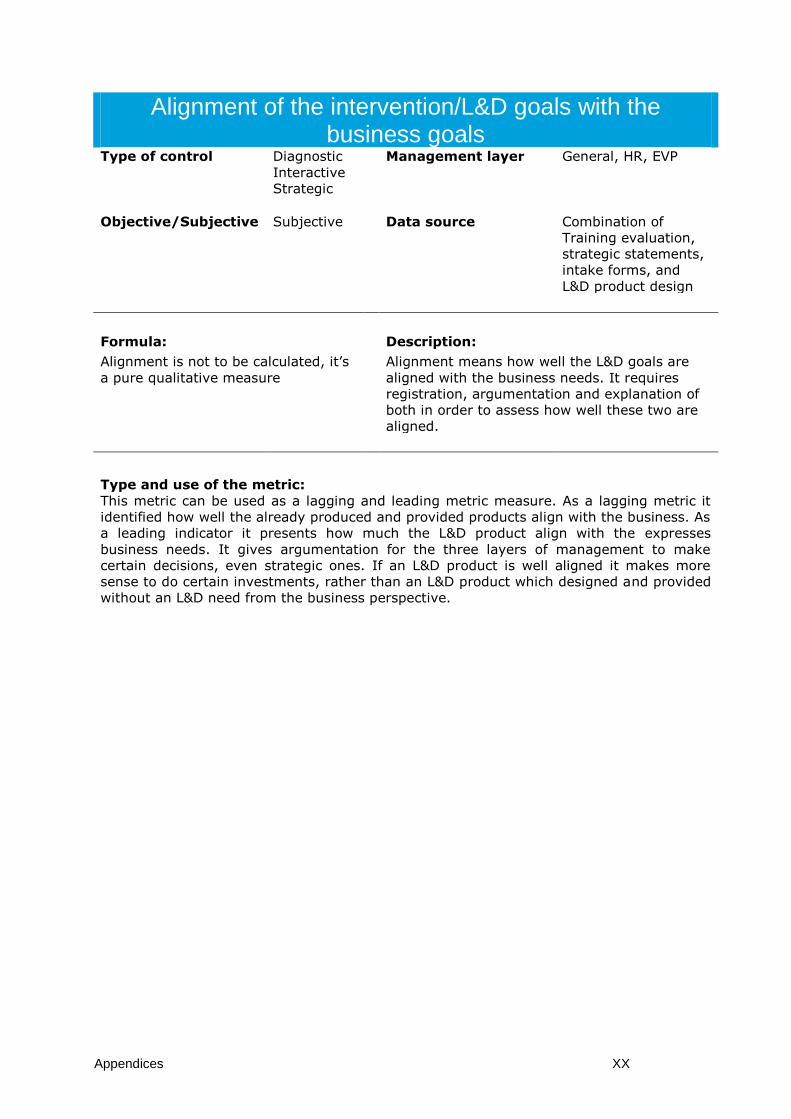
Appendices XX
Alignment of the intervention/L&D goals with the business goals
Type of control Diagnostic
Interactive
Strategic
Management layer General, HR, EVP
Objective/Subjective Subjective Data source Combination of
Training evaluation,
strategic statements,
intake forms, and
L&D product design
Formula: Description:
Alignment is not to be calculated, it’s
a pure qualitative measure
Alignment means how well the L&D goals are
aligned with the business needs. It requires
registration, argumentation and explanation of
both in order to assess how well these two are
aligned.
Type and use of the metric: This metric can be used as a lagging and leading metric measure. As a lagging metric it
identified how well the already produced and provided products align with the business. As
a leading indicator it presents how much the L&D product align with the expresses
business needs. It gives argumentation for the three layers of management to make
certain decisions, even strategic ones. If an L&D product is well aligned it makes more
sense to do certain investments, rather than an L&D product which designed and provided
without an L&D need from the business perspective.
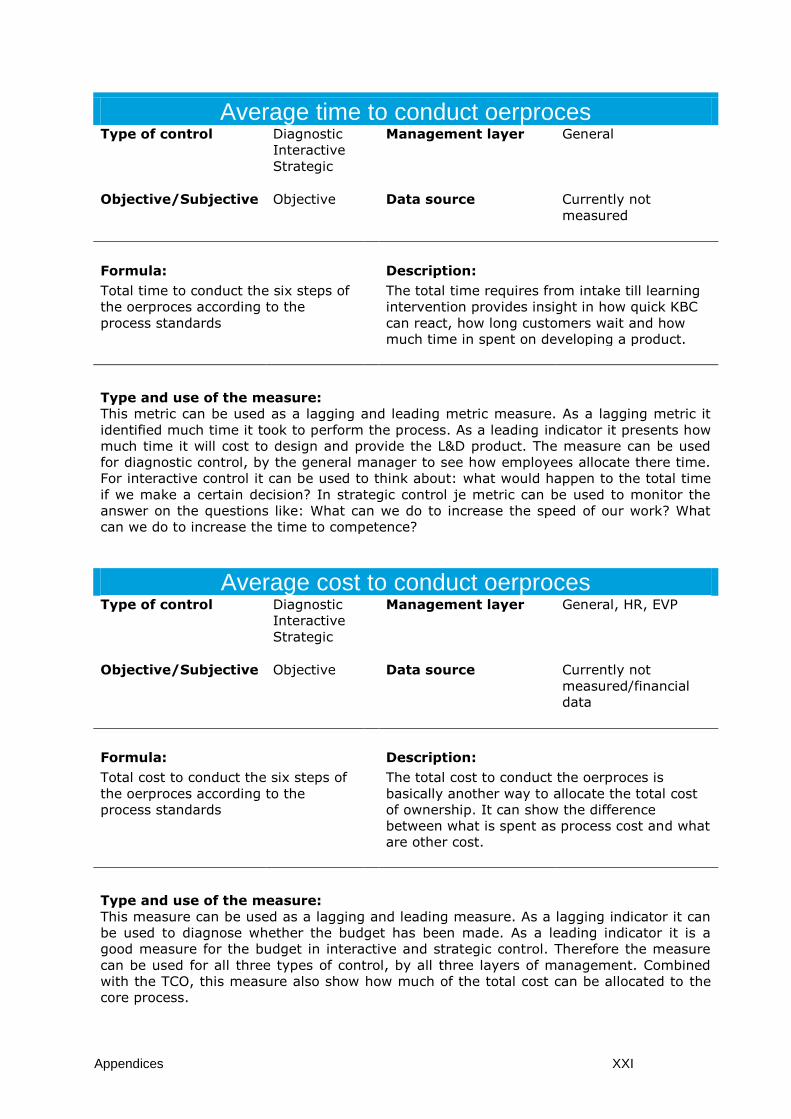
Appendices XXI
Average time to conduct oerproces Type of control Diagnostic
Interactive
Strategic
Management layer General
Objective/Subjective Objective Data source Currently not
measured
Formula: Description:
Total time to conduct the six steps of
the oerproces according to the
process standards
The total time requires from intake till learning
intervention provides insight in how quick KBC
can react, how long customers wait and how
much time in spent on developing a product.
Type and use of the measure: This metric can be used as a lagging and leading metric measure. As a lagging metric it
identified much time it took to perform the process. As a leading indicator it presents how
much time it will cost to design and provide the L&D product. The measure can be used
for diagnostic control, by the general manager to see how employees allocate there time.
For interactive control it can be used to think about: what would happen to the total time
if we make a certain decision? In strategic control je metric can be used to monitor the
answer on the questions like: What can we do to increase the speed of our work? What
can we do to increase the time to competence?
Average cost to conduct oerproces Type of control Diagnostic
Interactive
Strategic
Management layer General, HR, EVP
Objective/Subjective Objective Data source Currently not
measured/financial
data
Formula: Description:
Total cost to conduct the six steps of
the oerproces according to the
process standards
The total cost to conduct the oerproces is
basically another way to allocate the total cost
of ownership. It can show the difference
between what is spent as process cost and what
are other cost.
Type and use of the measure: This measure can be used as a lagging and leading measure. As a lagging indicator it can
be used to diagnose whether the budget has been made. As a leading indicator it is a
good measure for the budget in interactive and strategic control. Therefore the measure
can be used for all three types of control, by all three layers of management. Combined
with the TCO, this measure also show how much of the total cost can be allocated to the
core process.
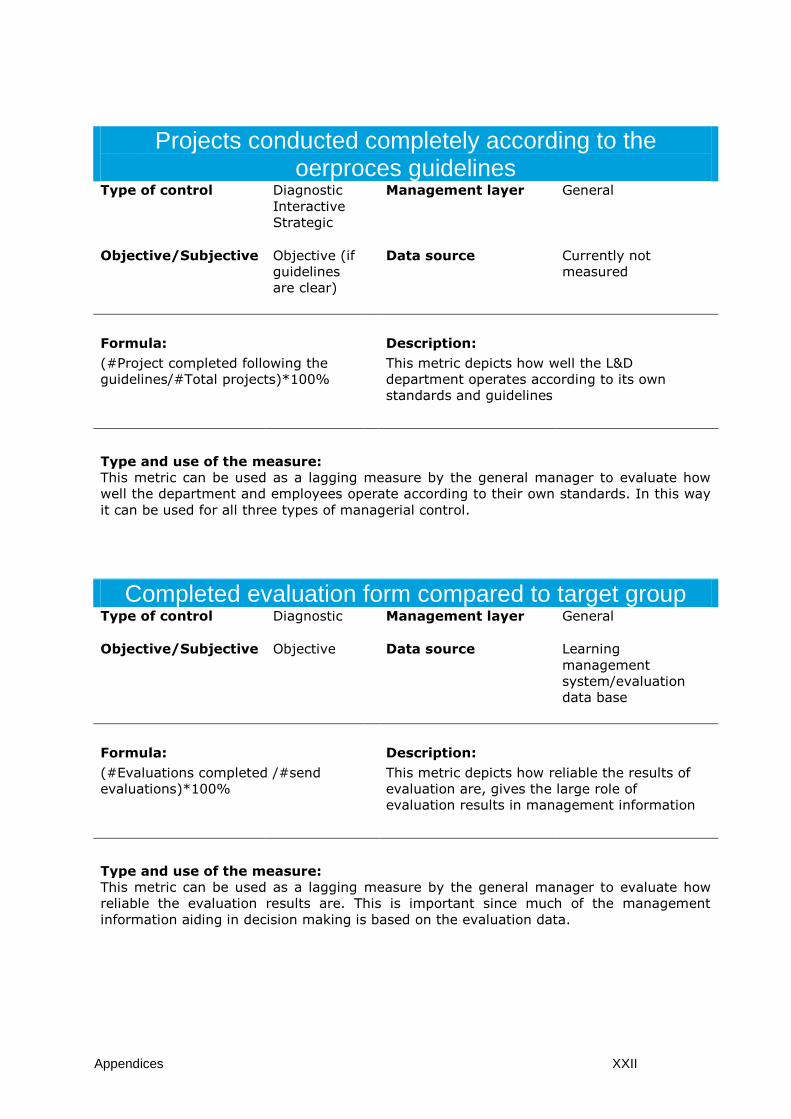
Appendices XXII
Projects conducted completely according to the oerproces guidelines
Type of control Diagnostic
Interactive
Strategic
Management layer General
Objective/Subjective Objective (if
guidelines
are clear)
Data source Currently not
measured
Formula: Description:
(#Project completed following the
guidelines/#Total projects)*100%
This metric depicts how well the L&D
department operates according to its own
standards and guidelines
Type and use of the measure: This metric can be used as a lagging measure by the general manager to evaluate how
well the department and employees operate according to their own standards. In this way
it can be used for all three types of managerial control.
Completed evaluation form compared to target group Type of control Diagnostic
Management layer General
Objective/Subjective Objective Data source Learning
management
system/evaluation
data base
Formula: Description:
(#Evaluations completed /#send
evaluations)*100%
This metric depicts how reliable the results of
evaluation are, gives the large role of
evaluation results in management information
Type and use of the measure: This metric can be used as a lagging measure by the general manager to evaluate how
reliable the evaluation results are. This is important since much of the management
information aiding in decision making is based on the evaluation data.
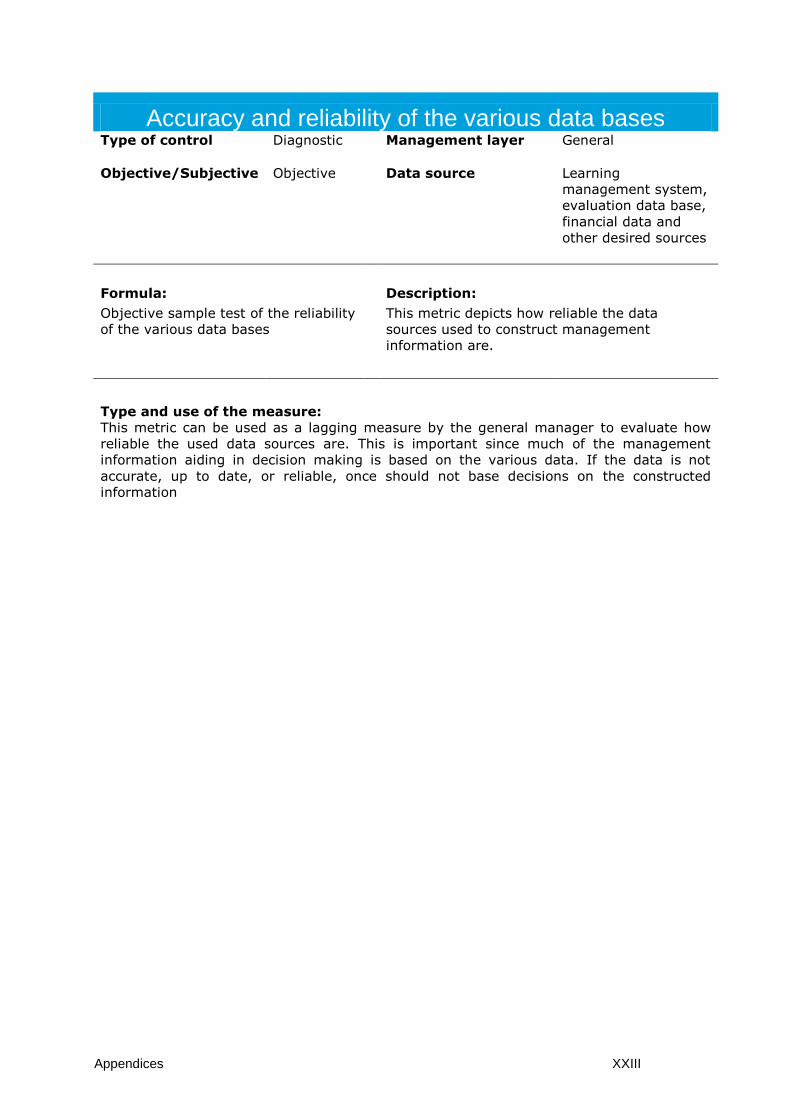
Appendices XXIII
Accuracy and reliability of the various data bases Type of control Diagnostic
Management layer General
Objective/Subjective Objective Data source Learning
management system,
evaluation data base,
financial data and
other desired sources
Formula: Description:
Objective sample test of the reliability
of the various data bases
This metric depicts how reliable the data
sources used to construct management
information are.
Type and use of the measure: This metric can be used as a lagging measure by the general manager to evaluate how
reliable the used data sources are. This is important since much of the management
information aiding in decision making is based on the various data. If the data is not
accurate, up to date, or reliable, once should not base decisions on the constructed
information