Corporate Information Strategy and Management
318
This book cannot be ~xported from the country to whlch it is sold by McGrsw-Hill. The InternaUonal Editbn is not available in North America. AddMcd MeGraw-Hitl Intwnationd MRim are available In the fdlowlng subjects: AccourPtlng Agrlcultum Biological Sciencas Bud- and Industrial Management Chemistry and Chemical Engineering C Civil Engineering Economics Education Oectrical Engineering El&& and Computer Science Finance Geology and Mineralogy Industrial Arts and Vocatianal Education Mathematics Mechanicat Engineering Medlclne Meteomlogy Physics Polftical Science PSY~rosy Socblogy . .
-
Upload
independent -
Category
Documents
-
view
8 -
download
0
Transcript of Corporate Information Strategy and Management

This book cannot be ~ x p o r t e d from the country to whlch it is sold by McGrsw-Hill. The InternaUonal Editbn is not available in North America.
AddMcd MeGraw-Hitl Intwnationd MRim are available In the fdlowlng subjects:
AccourPtlng
Agrlcultum
Biological Sciencas
Bud- and Industrial Management
Chemistry and Chemical Engineering C Civil Engineering
Economics
Education
Oectrical Engineering
El&& and Computer Science
Finance
Geology and Mineralogy
Industrial Arts and Vocatianal Education
Mathematics
Mechanicat Engineering
Medlclne
Meteomlogy
Physics
Polftical Science
P S Y ~ r o s y
Socblogy
. .

i -
1! 'qO00 Qa\
I 'f
i
Corporate Information
I Strategy and Management
I 1'-
The challenges of Managing Sixth Edition b ,/ in'a Network Economy_ 7 - ---___ __.
l;, <-- I - ~ I ~ I G A i , I
N.I.O.C. Lymda M. Applegate .- . . - ~ o b e r t D. Austin
*:,! :.! * * * * - . L2 > 8 ? L,.~,~S&:,~D ,z$~%, '..~~F:''Warren McFarlan 462 qi - '+ . - - - - .. . . . ,+oJ\.~ . .. All of the Harvard Business '
School
McGraw-Hill I . / Irwin.
Boston Burr Ridge, lL Dubuque, lA Madison, WI New York San Francisco St. Louis Bangkok Bogota Caracas KualaLumpur Lisbon London Madrid MexicoCity Milan Montreal NewDelhi Santiago Seoul Singapore Sydney Taipei Toronto
i

McGraw -Hill Higher Education .4 Ltivision of The m a w - H i l l Companies
CORPORATE INFORMATION STRATEGY AND MANAGEMENT: THE CHALLENGES OF MANAGING IN A NETWORK ECONOMY
Published by McGraw-Hill/Irwin, a business unit of The McGraw-Hill Companies, Inc., 1221 Avenue of the Americas, New York, NY, 10020. Copyright 8 2003, 1999, 1996, 1992, 1988, 1983 by The McGraw-Hill Companies, Inc. All rights reserved. No part of this publication may be reproduced or distributed in any form or by any means, or stored in a database or retrieval system, without the prior written consent of The McGraw-Hill Companies, Inc., including, but not limited to, in any network or other electronic storage or transmission, or broadcast for distance learning.
Some ancillaries, including electronic and print components, may not be available to customers outside the United States.
This book is printed on acld-free paper.
domestic 1 2 3 4 5 6 7 8 9 O F G R / F G R O 9 8 ' 7 6 5 4 3 2 international 1 2 3 4 5 6 7 8 9 O F G R F G R O 9 8 7 6 5 4 3 2
ISBN 0-07-245665-5
Publisher: George Werthman Senior sponsoring editor: Rick Williamson Editorial assistant: Jennie Yates Marketing manager: Gretrr Kleinert Media producer: Greg Bares Senior project manager: Xari Geltemeyer Production supervisor: Debra R. Sylvester Design team leader: M a p L. Christianson Senior supplement producer: Rose M. Range Senior digital content specialist: Brian Nacik Typeface: 10.5/12 Times > J e w Roman Compositor: Carlisle Con~munications, Ltd. Printer: Quebecor World Ibirfield Inc.
Library of Congress Cataloging-in-Publication Data Applegate, Lynda M.
Corporate informatic~n strategy and managerrlent : the challenges of managing in a network economy / Lynda M. Applegate, Robert D. Austin, F. Warren McFarlan.-4th ed.
p. cm. Rev. ed. of: Corporaie information systems management : the challenges of managing
in an information age. 5th ed, c1999. Includes bibliographical references and index. / ISBN 0-07-245665-5 (alk. paperCISBN 0-07-1 12291-5 (international : alk. paper) 1. Management information systems. I. Austin, Robert D. (Robert Daniel), 1962- 11.
McFarlan, F. Warren (Franklin Warren) 111. Applegate, Lynda M. Corporate information systems management. n! Title HD30.2 .A653 2003 648.4'038'0 1 1--dc2 1 2002026560
INTERNATIONAL EDITION ISBN 0-07-1 1229 1-5
Copyright O 2003. Exclusive rights by The McGraw-Hill Companies, Inc. for manufacture and export. This book cannot be re-exported from the country to which it is sold by McGraw-Hill. The International Edition is not available in North America.

Dedicated to our colleague and mentor of many years, James L. McKenney.


Preface
Corporate Information Strategy and Management examines how information tech- nology (IT) enables organizations to conduct business in radically different and more effective ways. The commercialization of the Internet has created a seismic change in the business environment. New channels of supply and distribution are emerging. New electronic marketplaces and exchanges are being created. The infra- structures of firms and the industries within which they operate have been perma- nently altered.
This is a fast-moving and global phenomenon. For established companies, the re- sulting challenges have been deep and pervasive. In many cases, the changes have threatened not just a firm's competitiveness but also its survival. Executives bear an enormous burden as they attempt to understand the challenges, keep abreast of events, and make intelligent decisions and plans.
The objective of this book is to provide readers with a better understanding of the influence of 21 st-century technologies on business decisions. The book discusses to- day's challenges from the point of view of the executives who are grappling with them. It recounts stories of success and failure, focusing on the issues faced and the decisions made by executives in companies around the world.
The information presented here is organized in an Introduction, four modules, and a Conclusion. The first module is aimed at understanding the impact of IT on industries and markets. It discusses issues of strategic positioning and explains how 2 1 st-century IT provides opportunities to alter markedindustry structure, power, and relationships. The second module shifts the focus from the external environment to the internal organization. It explores new organizational capabilities, manage- mendleadership principles, and sources of value that arise within networked com- panies. The third module turns the reader's attention to operational issues at the in- terface of business and technology as it examines approaches to designing and managing open-standard, networked technology infrastructures. The fourth module concentrates on leadership and management of IT activities, focusing on the issues that arise at the boundary as four key constituents-business executives, IT execu- tives, users, and IT partners-work together to leverage technology to create a sus- tainable advantage. The Conclusion summarizes key frameworks, insights, and themes.
The material presented here is the outgrowth of field-based research we have con- ducted at the Harvard Business School since the early 1970s. To both Dean John McArthur and Dean Kim Clark we express our appreciation for making the time and resources available for us to complete this work.
We are particularly indebted to the executives who provided so much time and in- sight during the course of our research. Without the cooperation of many executives, the preparation of this book would not have been possible.

vi Preface
We are grateful as well for the many valuable suggestions and insights provided by our Harvard Busxness School colleagues, especially Jim Cash, Alan MacCor- mack, Andrew McAfee, Jim McKenney, Richard Nolan, Kash Rangan, and David Upton. In addition, we acknowledge the valued work of our doctoral students, fel- lows, and research assistants. Our heartfelt thanks go to Nancy Bartlett, Alastair Brown, Meredith Collura, Mark Cotteleer, Melissa Dailey, LeGrand Elebash, Cedric Escalle, Evelyn Golclman, Kristin Kohler, David Lane, Marc Mandel, Felipe Mon- teiro, Tom Rodd, Mary Rotelli, Deb Sole, George Westerman, and Fred Young. We also acknowledge the support of the directors of Harvard Business School research centers, including Christina Darwall of the California Research Center; Gustavo Herrero, Director of the Latin America Research Center; Camille Tang Yeh, Direc- tor of the Asia Pacific Center; and Carln Knoop, Executive Director of Global Re- search. Thanks go ta Alan Murray, a superlative friend and former colleague, who provided important reviews of technical details, especially in the chapter on com- puter security. Finally, we express our appreciation to our editor, Tom Cameron, and to Jennifer Chalfin, Jvlaureen Donovan, Brooke Spangler, and Maurie SuDock, who provided administralive support.
Lynda M. Applegate
Robert D. Austin
E: Warren McFarlan

Introduction: Challenges of Managing in Value Chain Analysis 2 7
a Network Economy 1 - Industry and Competitive Analysis 30
Theme 1 : Market structure and Industry Dynamics 4 Theme 2: Evolving Business Models 6 Theme 3: IT Impact 7 Theme 4: Prioritizing IT Investments 8 Theme 5: Assimilation and Organizational Learning 11
Phase 1. Opportunity Identification and Investment 12 Phase 2. Organizational Learning and Adaptation Phase 3. Rationalization and Continuous Evolution
Theme 6: Buy versus Make 13 Theme 7: Partnership among Key Constituencies as IT Evolves 14 Theme 8: Protecting IT Assets and Managing Risks 16 Theme 9: Pervasive Computing: Opportunities and Risks 17 Summary 17 Appendix A: Analyzing the Strategic Impact ofIT 19 Support 19 Turnaround 19 Factory 20 Strategic 20
MODULE ONE BUILDING THE NETWORK ECONOMY: MARKETS AND MODELS 21
Chapter 1 Creating Business Advantage with IT 23'
Forces That Shape Business Strategy 27
Strategic Grid Analysis 31 Analyzing the Impact of IT on Strategic Decision Making 32
Can IT Be Used to Reengineer Core Value Activities and Change the Basis of Competition? 32 Can IT Change the Nature of Relationships and the Balance of Power among Buyers and Suppliers? 34 Can IT Build or Reduce Barriers to Entry? 3 6 Can IT Increase or Decrease Switching Costs? 39 Can ITAdd Value to Existing Products and Services or Create New Ones? 40
Summary 4 1
.Chapter 2 Crafting Business Models 43
Business Models: Something Old and Something New 44 Classifying Business Models 46 Businesses Built on a Networked Infrastructure 48
Focused Distributors 48 Portals 51 Producers 53
Businesses That Provide Networked Infrastructure 57
Infrastructure Distributors 57 Infrastructure Portals 58 Infrastructure Producers 60 Infrastructure Service Providers 63
Evolving Business Models 63 Evolving the American Express Interactive Business Model 64 Evolving the Amazon.com Business Model 68
Summary 72 Appendix 2A Business Model Revenue, Cost, and Asset Options 74
vii

viii Contents I
MODULE 2 BUILDING THE NETWORK ECONOMY: CAPABILITIES AND ORGANIZATION 77
Chapter 3 Building Networked Businesses 79
The Need for New Capabilities 80 Is History Repeating Itself! 8 1 Blueprint for a Networked Organization 83
Operating and Innovating 84 Managing and Learning 88 Leading and Engaging 93
Building Value Networks 97 Where Should Activities Be Performed? 97 How Should We Relate to Market Participants? 99 Evolving Market Structure and Relation?:hips 100
Summary 107 Appendix 3A Characteristics of the Hierarchy, Entrepreneurial Organization, and Networked Organization 110
Chapter 4 Making the Case for Networked Business 115
Changing Economics 1 16 Comparing Industrial and Networked Economics 11 6
Linking Strategy to Execution to Results 12 1 Analyzing Performance Drivers 122
Developing the Business Case for IT 125 Benefits from Investments in lnfrastructt~re I25 Benefits fmm Doing Business on a Networked Infrastructure 130
Summary 134 Appendix 4A Analyzing Business Models 136 Appendix 4B Analyzing Financial Performance 143 Appendix 4C Approaches to Valuing Public Companies 145
MODULE 3 MANAGING NETWORKED INFRASTRUCTURE AND OP ERGTIONS 149
Chapter 5 Understanding Internetworking Infrastructure 151
The Drivers of Change: Better Chips, Bigger Pipes 153 The Basic Components of Internetworking Infrastructures 157
The Technological Elements of Networks 159 The Technologrcal Elements of Processzng Systems 162 Zhe Technological Elements of Faczlitres 165 Operatzonal Characterzstics of Internetworks 167
The Rise of Internetworking: The Business Implications 169
The Emergence of Real-Time 1nfrastructur.e~ 170 Broader Exposure to Operational Threats 172 New Models of Servrce Delivery 173 Afanagzng Legacies 175
The Future of Internetworking Infrastructure 175 Summary 176
Chapter 6 Assuring Reliable and Secure IT Services 179
Availability Math 1 8 1 The Availability of Components in Series I81 The Effect of Redundancy on Availability 183 High-Availability Facilities 184 PJ+ I and N+N Redundancy 186
Securing Infrastructure against Malicious Threats 188
(:lasszjkation of Threats 189 Defensive Measures 194 A Security Management Framework 199 Risk Management ofAvailability and Security 200 Incident Management and Disaster Reco~~ery 202 lwanaging Incidents before They Occur 202

Managing during an Incident 203 Managing after an Incident 203
Summary . 204
Chapter 7 Managing Diverse IT Infrastructures 207
New Service Models 209 Managing Risk through Incremental Outsourcing 2 14
An Incremental Outsourcing Example: Hosting Managing Relationships with'service Providers 2 19
Selecting Service Provider Partners 21 9 Relationship Management 222
Managing ~egacies 225 Managing IT Infrastructure Assets 228 sum&a6 230
MODULE 4
Contents ix
Users'Desire to Control Their Own Destiny 239 Fit with the Organization 239
Drivers toward a Centralized IT Structure 240 Staff Professionalism 240 Standard Setting and Ensuring System Maintainability 240 Envisioning Possibilities and Determining
MANAGING AND LEADING A NETWORKED IT ORGANIZATION 231
Chapter 8 Organizing and Leading the IT Function 233
Organizational Issues in the Control of IT Activities 233 /
I. From Centralized, IT-Driven Innovation to Decentralized, User-Driven Innovation 234 2. User-Driven Innovation over IT Department Protests 234 3. From Decentralized, User-Driven Innovation to Centralized IT Management 236 4. From Decentralized, User-Driven Innovation to Unexpected Centralized Innovation 236
Implications and Conclusions 237 Drivers toward User Dominance 237
Pent-Up User Demand 238 , , The Need for StaffFlexibility 238
Growth in the IT Services Industry 238
Feasibility 241 Corporate Data Management 242 Cost Estimation and Analysis 242
Coordination and Locationof IT Policy 243 215 IT Responsibilities 244
User Responsibilities 245 General Management Support and Policy Overview 246
IT Leadership and the Management of Budgets 248 Summary 249
Chapter 9 Managing IT Outsourcing 251
Why Outsourcing Alliances Are So Difficult 252 Outsourcing in Retrospect 253 Outsourcing in the 2 1 st Century 254
Acceptance of Strategic Alliances 254 IT5 Changing Environment 254
What Drives Outsourcing? 256 General Managers 'Concerns about Costs and Quality 256 Breakdown in ITPerformance 257 Intense Vendor Pressures 25 7 Simplified General Management Agenda 258 Financial Factors 258 Corporate Culture 259 Eliminating and Internal Irritant 259 Other Factors 259
When to Outsource 259 Position on the Strategic Grid 260 Development Portfolio 261 Organizational Learning 261 A Firm k Position in the Market 262 Current IT Organization 262
Structuring the Alliance 262 Contract Flexibility 262 Standards and Control 263

x Contents
Areas to Outsource 263 Cost Savings 264 Supplier Stability and Quality 264 Management Fit 265 Conversion Problems 265
Managing the Alliance 265 The CIO Function 265 Performance Measurement 266 Mix and Coordination of Tasks 267 Customer- Vendor Interface 267
Summary 268
Chapter 10 A Portfolio Approach to IT Projects 269
Sources of Implementation ~ i s k 270 Product Categories and Degree of Risk 271
Assessing Risk for Individual Projects 271 Portfolio Risk 275
Project Management: A Contingency Approach 276
Management Tools 276 Influences on Tool Selection 278 Relative Contribution of Management Tools 281 Emergence ofAdaptive Project Management Methods 282 Software D&elopinent Li& Cycles 283 Adaptive Methodologies 284 Adaptive Methods and Change Managemtrnt 286
Process Consistency and Agility in Project Management 287 A Nlinimalist Approach to Process Formalization 287 Sununary 288
Conclusion: The Challenges of Managing in a Network Economy Revisited 291
Annotated Bibliography 295
Indlex 301

Introduction Challenges of Managing in a Network Economy
Information technology (IT) has always been a wild card in business, a source of opportunity and uncertainty, advantage and risk. Business executives have often viewed the IT fbnction with apprehension, seeing it as the province of technocrats primarily interested in new features that may have little relevance to real-world busi- ness problems. Technology executives have often considered business managers to be shortsighted, lacking the vision to exploit all that technology has to offer. Both struggle as they attempt to implement increasingly complex systems in the face of rapid change in business and technology.
And yet we have, since the inception of business computing, tightened our em- brace of IT, and for good reason. Despite exasperating moments, technology has be- come embedded in the way we define and execute strategy, the way we organize and lead businesses, and the way we define a unique value proposition.
Indeed, the pace of IT evolution has been both dramatic and disconcerting (see Figure I. 1). The coevolution of technology, work, and the workforce over the last 40 years has dramatically influenced our concept of organizations and the industries within which they compete. No longer simply a tool to support "back-office" trans- actions, IT has become a strategic part of most businesses, enabling the redefinition of markets and industries and the strategies and designs of firms competing within them. Today's supersonic jets cross the Atlantic in three hours or less, and global communication networks carry information around the world in seconds. Distance and time have become much less significant determinants of market and organiza- tional structures and processes.' Moreover, information has become a major eco- nomic good, frequently exchanged in concert with, or even in place of, tangible goods and services.
'R. Miles and C. Snow, "Organizations: New Concepts for New Forms," California Management Review, 28:62-73, 1986; T. Malone, J. Yates, and R. Benjamin, "Electronic Markets and Electronic Hierarchies: Effects of Information Technology on Market Structure and Corporate Strategies," Communications of the ACM 30(6):484-497, 1987 R. Johnston and P. Lawrence, "Beyond Vertical Integration-The Rise of the Value- Adding Partnership," Harvard Business Review, July-August, 1988; W. Powell, "Neither Market nor Hierarchy: Network Forms of Organization," Research on Organizational Behavior 12:295-336, 1990.
Davood
Highlight
Davood
Highlight
Davood
Highlight

1 2 Introduction Challenges of Managing in $1 Network Economy
FIGURE 1.1 Evolution of Computing Performance
Source: Adapted from I. McKe~mey, Waves of Change: Business Evolution through Information Technology (Boston: Haward Business School Press, 1995).
The last decade has added considerably to the mystique and magic of IT. Some- thing dramatic happened to technology in the 1990s, although it is probably too early to discern the full itnpact. Many of us remember the first time we opened i i browser and gained access to the World Wide Web (WWW). For some executives who had lived their lives avoiding technology, a light went on, and they glimpsed the poten- tial of what previously had lain deep within the silicon switches that processed data in the basement of the organization. Others ventured forth only to become mired in a sea of useless information and broken links that convinced them that although the technology was more appealing to the eye, the same old flaws remained.
Then came the boom of the late 1990s, when the capital markets cilught the fever. Stories of "20-something" billionaires who only a few years earlier had plot- ted their business ideas on napkins grabbed our attention. Stories of investors who pushed entrepreneurs to take more money and spend it more quickly challenged our view of the blood, sweat, and tears that used to define how a new business was built from the ground up. Stories of newly public firms with market capitalizations in the billions of dollars, yet with no discernible path to profitability, caused us to question the fundamental economic principles that guided how we built and man- aged companies.
As the new centu~y dawned, the "bubble" burst. The tech-heavy Nasdaq lost more than half its value within months, and spending for IT equipment and services
Davood
Highlight
Davood
Highlight
Davood
Highlight
Davood
Highlight

lntrod uction Challenges of Managing in a Network Economy 3
dropped. The world economy headed into a downward spiral that, when this book was written in early 2002, threatened to continue into 2003.
Some young executives began their careers during the boom, and for a time it seemed they would have an advantage. When the dot-com bubble burst, executives young and old found themselves in pretty much the same situation as they attempted to understand which opportunities were real and which were nothing more than the hype that surrounds all new inventions.
Some things are clear. The world is forever changed. IT has burst forth from its safe containment in the basements of corporations. Business executives have begun to wrest control from IT executives who have failed to step up to the challenge of entering the boardroom. Technology has become a core enabler and, in some cases, the primary channel through which business is done. The world is smaller, and the "global village" is quickly becoming a reality. Physical location matters less than it once did. Borders and boundaries, ownership and control have become less rigid. The last decade has offered examples of IT-enabled "virtual" organizations in which many small, independent agents (or firms) band together as nodes on an informa- tion network to achieve dramatic increases in scope and scale. Such arrangements challenge both our legal and our social definitions of an organization as business practice outpaces legal and regulatory policy--especially in areas such as interna- tional competitiveness and trade, intellectual property, privacy, security, family, community, education, and culture. And yet there are still new frontiers to explore, new challenges to meet, and new magic in store.
Because so much has changed so quickly, because the ups and downs have come in such a short interval, this is a difficult time to engage in sense making. Yet that is precisely what we are doing in this book. We're attempting to relate what we know from decades of study to what we are learning from those who are creating the fu- ture. The last five years have provided the richest vein of potential learning we have ever been positioned to mine. It has been a period of intense experimentation. Many new models have been tried, and many of them have failed. We would be remiss if we did not attempt to understand it all-the successes and the failures.
Our objective is to help business executives who find themselves paralyzed by confusion and uncertainty to begin to take the important first steps on the path of transformational change. At the same time, we wish to help IT executives assume leadership positions, not just in defining and executing technology strategy but also in defining and executing business strategy. As we work toward these dual objec- tives, we draw on years of research and experience, much of it in the field with ex- ecutives who have accepted the challenge and are venturing forward into uncharted waters.
The insights presented in Corporate Information Strategy and Management ex- pand the thinking presented in a companion book, Creating Business Advantage in the ~nformation ~ ~ e . ~ These insights are organized around the following key themes,
'L. M. Applegate, R. D. Austin, and F. W. McFarlan, Creating Business Advantage in the Information Age (New York: McGraw Hill, 2002). Visit the website http://www.rnhhe. corn/catalogs/0072523~.rnhtrnl for more information.
Davood
Highlight
Davood
Highlight

4 Introduction Challenges of Managing in a Nefwork Econon~y
which are introduced briefly in the remainder of this Introduction and then expanded upon throughout the book.
1. As 2 1 st-century [T expands processing capacity; enables convergence of voice, video, and data; encourages real-time transactions and interactivity; and dramat- ically increases connectivity and access, we are confronted with new claoices for designing and building industries, markets, and organizations.
2. The business models that dominated the Industrial Economy are evolving to take advantage of the capabilities of the new technologies and business practices of the Network Economy, giving rise to new sources of power and differentiation.
3. The types of opportunities pursued and the technology employed strongly influ- ence the approach taken to developing, operating, and managing IT.
4. As IT infrastructure becomes more standardized, modular, and scalable, we see a shift in IT investment priorities and decisions from a cost-avoidance, project- centered approach to an asset-based, strategic option approach.
5. The time required for successful organizational learning and assimilation of rapidly changing technologies limits the practical speed of change.
6. External industry, internal organizational, and technological changes are increas- ing the pressure on organizations to "buy" rather than "make" IT applications and services.
7. The ability to exploit 2lst-century technology successfully demands high levels of engagement and cooperation among four key constituencies: business execu- tives, IT executives, users, and technology providers/partners.
8. The ability to ensure high levels of security, privacy, reliability, and availability is a core capability that determines an organization's ultimate success anti survival.
9. Over the past decade there has been a fundamental shift in IT that has dramati- cally changed the way people access and use technology, the way organizations
I exploit it, and the way it is developed and managed.
Theme 1: Market Structure and Industry Dynamics
Every day managers hear claims about how the new technologies of the 2 1 st century (for example, the Internet, the WWW, browsers, and wireless devices) are radically changing the way we work, play, interact, learn, and build businesses. While these new technologies hive dramatically expanded the opportunities that can be pursued, the fundamental economic theories that define how markets, industries, and organ- izations are built cc~ntinue to guide executive decision making and actions.
In fact, most 2lst-century organizations continue to operate as they always have-as members of a business network of suppliers, producers, distributors, and partners that work together to design, deliver, market, and sell products and services for business custoniers and consumers. Yet while the basic roles remain u.nchanged, executives today have numerous options for how to organize these activities and manage relationships among multiple parties.
Davood
Highlight
Davood
Highlight
Davood
Highlight
Davood
Highlight
Davood
Highlight
Davood
Highlight
Davood
Highlight
Davood
Highlight
Davood
Highlight
Davood
Highlight

Introduction Challenges of Managing in a Network Economy 5
FIGURE 1.2 The Value Chain Defines Industry Structure and Relationships
The primary value activities that define how raw materials, information, and la- bor are used to create products and services for business customers and consumers used to be structured as a sequential "value chain" (see Figure 1.2). Value chain activities inside most Industrial Economy firms were organized within functional units (for example, R&D, procurement, production, marketing, sales, and service), and relationships among those functional units were often "transactional" in nature (for example, when R&D finished a new product design, it was "thrown over the wall" to production, and so on down the chain). These well-defined roles, responsi- bilities, and relationships were governed by standardized policies, procedures, and agreements. Because of the difficulty of managing and controlling all but the most routine activities, Industrial Economy executives traditionally chose to locate every- thing except the most routine activities within their organizational boundaries, and this resulted in the rise of vertically integrated firms as the key power broker within most industries.
Today's executives are faced with a myriad of organizational and market choices. They may continue to operate within industries with clearly defined boundaries and relationships. Alternatively, they may operate within an industry in which bound- aries are becoming fluid and relationships are increasingly based less on structured transactions and contracts and more on partnerships that require trust and coopera- tion. Many believe that the ability to conduct business electronically, integrating supply and distribution channels by using IT systems that enable access to the real- time information needed to closely monitor core activities that take place outside organization boundaries, will give rise to virtually integrated industries. Yet the same benefits also can be achieved inside the organization.
Davood
Highlight

6 Introduction Challenges of Managing in u Network Economy
Consider the merger of America Online (AOL) and Time Warner, which is dis- cussed in Module 1. The newly merged company is testing the limits of "virtual in- tegration" inside a vertically integrated governance structure. The AOL Time Warner networked model stands in sharp contrast to that of Covisint-the collabo- rative partnership between auto industry manufacturers, suppliers, distributors, and technology providers. Covisint demonstrates how executives across an industry have chosen to cooperate on the design of a networked infrastructure upon which all par- ties in the industry will do business while simultaneously competing on pnce, qual- ity, and product innovation. The choices facing executives as they organize to con- duct business within market networks and the frameworks that can be used to inform those choices are discussed in depth in Chapters 1 through 3.
I Theme 2: Evolving Business Models
As technolog; redefines opportunities and the choices executives make to exploit those opportpnities, the business logic traditionally used to frame how executives made decisibns and look actions has been called into question. When asked the ques- tion "Whatbusiness are you in?' executives in established firms often reply with the name of the industry within which their company competes and the role or roles the firm plays within the industry. For example, they might say: "We're a telecornmuni- cations service provider" or "We're a consumer products manufacturer." For most people, these industries and roles have become so familiar that this shorthand de- scription is all that is needed to communicate what the firm does, its position within an industiy, and how it makes money.
On the other hand, most executives have a very hard time answering the question "What is your business model?" This is especially true if a company has adopted one of the emerging online business models (for example, portals or application service providers; also called ASPS). After some prodding, these executives begin to provide a more detailed picture of the activities that their company performs, the customers to'whom they sell, and the suppliers from whom they buy. They talk about channels to market, competitors, and the econonlics of the business (including the cost struc- ture and revenue models). These details are the components of a business model (see Figure 1.3).
.Why is a focus on business models so important today? If you think about it, we spent nearly a century building and perfecting the Industrial Economy business models that defined how companies conducted business throughout most of the 1900s. The Internet and the associated technologies of the Network Economy are en- abling us to exploit ]new opportunities and build new capabilities. As a result, we are able to evolve current business models and, in some cases, build new ones. We have not yet developed a shorthand way to describe the emerging networked business models that are revolutionizing business and society in the 21st century. Chapter 2 provides this shorthand system as it examines changes in structure, relationships, and power among players in the persolla1 financial services, business log~stics, and entertaintnerdmedia industries.

Introduction Challenges of Managing in a Nehvork Economy 7
FIGURE 1.3 Components of a Business Model
Theme 3: IT Impact The goal for technology use strongly influences the approach to developing, op- erating, and managing technology. Two key dimensions must be considered: (1) the impact of IT on core operations and (2) the impact of IT on core strategy. These dimensions help frame the decisions that executives,make in organizing and managing IT.
The first dimension assesses the impact of IT on core oper'ktions. In some firms, such as Nasdaq, reliable, zero-defect operation of IT is critical to performing core value activities inside the firm and across the global securities industry. Failure-for even a few seconds can bring the entire securities industryto its knees. In other firms, for example, some law firms, the impact of a day-long IT failure would be much less immediate and severe. -
The second dimension assesses the strategic impact of IT on the core strategy of a firm. In some firms, such as PSA and ~ m e r i c a n Express, a steady stream of technological innovations drives strategy evolution. In these firms, IT develop- ment activities are inextricably linked to the strategy of the firm and IT invest- ment decisions are made in the boardroom by those charged with assuring the success and survival of the firm. In other firms, IT development priorities are tar- geted toward incremental, operational improvements that may improve a firm's cost profile but do little to change its position or power in the industry. The "strategic grid" depicted in Figure 1.4 defines four categories of IT impact that

8 Introduction Challenges ofManaging in CI Network Economy
FIGURE 1.4 High The Impact of IT
Goal: Improve pnrformance of Goal: Transform organization or core proce::ses industry
Leadership: Business unit executives Leadership: Senior executives & board Project Management: Process Project Management: Change
reengineering management
Goal: Improve local performance Leadership: Local level oversight Project Management: Grassroots
Goal: Identify and launch new ventures
Leadership: Venture incubation unit experimentation Project Management: New venture
development
Low High IT Impact on Core Strategy
help determine the approach used to identify opportunities, define and imple- ment IT-enabled business initiatives, and organize and manage IT assets and pro- fessionals. (Appendix A provides a more detailed description of the four cate- gories of IT impact depicted on the strategic grid.)
IT-enabled activities that fall squarely within the "Support" quadrant of the grid are often designed, implemented, and managed by IT specialists with the help of end users. IT-enabled activities that fall within the "Factory" quadrant are designed, im- plemented, and managed by business unit executives in partnership with IT execu- tives. IT-enabled activities that are designed to exploit opportunities that represent emerging strategic opportunities (the "Turnaround" quadrant) are often designed, implemented, and managed through partnerships between business development and emerging technologies groups inside an organization or within technology part- ner firms. Finally, firms that have moved into the "Strategic" quadrant have made a commitment to use IT to enable both core operations and core strategy. In these firms, IT initiatives are often defined, implemented, and managed at the top levels of the corporation. These four approaches to IT investment decision making and management are examined throughout Modules 1 through 4.
Theme 4: Prioritizing IT Investments
Few would dispute the fact that 2lst-century technologies are pervading and shap- ing industries, markets, and organizations. Yet many managers treat IT as a budgeted expense to be justified on a project-by-project basis and are then disappointed with the returns. They would do better, we argue, to think of IT as an investment that must deliver benefits today and in the future. These benefits are of two main types and may be targeted inside or outside the firm (see Table I. 1).

Introduction Challenges ofManaging in a Network Economy 9 1
TABLE 1.1 Making the Case for IT
Goals and Measures / Categories of . a * j
Benefits Internal External I ~ ' ' ~ ~ ~ e " l : ~8ne f i e from lnvestmentr in NetworkedJT Infrastructure a I*
6Eunctionality and , ,, Imp[ove,infrastructure, Cre*ate aan efficient, flexible flexibility performance; increase the onlineloffline platform for'doing - " f~nctionality~and range of . , . business,with customers,
strategic options that can be suppliers, and partners
I pursued a
Sample measures: Decrease the Sample measures: Decrease the cost andlor improve tKe cost andlor improve the perfor-
- b . performance of internal IT mance of doing business online; operations; enable new IT decrease the time, cost, and applications to be created at risk of launching new online lower cost, in less time, and with business initiatives; expand the '
e @ less risk; expand the range of . reach of existing IT-enabled busi- internal IT initiatives nesses and the range of business - p19g I* a 1X rY opportunities that can be
pursued * " v - * b 4 a % . %
Type If: Benefits from Doing Business on a ~etworked IT lnfrastruchre
/'~onimer& A ' '' ' Improve internal operating. - * a efficiency and quality
" a - * S "
Sample measures: Internal process performance and work flow improve- - - ments; cost savings or: cost avoidance; increased quality; decreased cycle time - "
'3 b. ) I P
Content/knowledge jr
k %
" knowledge workersand " enhance organizational learning
) Streamline and integrate - channels to market, create new
" channels, and integrate multiple onlineloffline channels Sample measures: Supply chain or distribution channel perfor- mance improvements; cost savings or cost avoidance foAhe organization and i t s customers, suppliers, of: partners; decrease time to market or just-in-time order replenishment; enable
, new channels to market andlor ' extend the reach and range of" existing channels ,
lmprove the performance of knowledge workers in customer, supplier, and partner organi- zations; add "information value" to existing products and services; create new information- based products and services
(continued)

10 Introduction Challenges of Managing in a Network Economy
TABLE I. 1 (continued)
Categories of Goals and Measures
I Benefits Internal External
Contentlknowledge Sample measures: Enable Sample measures: Provide (continued) individuals t o achieve and exceed information to customers, 1
personal performance goals; suppliers, and partners that I increase 1:he speed and effective- enables better decision making; ness of decision making; increase charge a price premium for the ability of the organization to products and services based on
i I respond cjuickly and effectively information value added; launch
to threats and opportunities new information-based products and services; increase revenue
streams
I per user and add new revenue 1
I
Community Attract and retain top talent; Attract and retain high-quality increase satisfaction, engagement, customers, suppliers, partners, and loyalty; create a culture of and investors; increase external involvement, motivation, trust, stakeholders' satisfaction, and shared purpose engagement, and loyalty I
1
Sample measures: Length of time Sample measures: Customer, t o fill key positions; attrition rate, supplier, partner satisfaction and trends in hiring and retaining top lifetime value; average revenue talent (over time, by industry, by per customer and trends over region) time; level of personaliz6tion
available and percentage that use it; churn rate
Type I benefits arise from improvements in IT infrastructure, including comput- ers, databases, and networks. Most large, established companies assembled their IT infrastructure in a piecemeal fashion over the last 20 to 30 years. They adopted new technologies as they became available and added them to their existing IT infra- structure without considering how the different technologies might need to work to- gether in the future.
By the early 1990s, the IT infrastructure in most established companies had be- come a hodgepodge of incompatible and inefficient technologies that were costly and difficult to manage and maintain. At the same time, managers recognized that the ability to integrate these technologies had become a competitive necessity. These trends converged and stimulated the transition to the network era.
Today's networked technology infrastructures are built around open standards. They are more flexible and scalable, are easier to access and use, have signifi- cantly expanded reach, and yet cost less to run. These new infrastructures enable executives to shift I'T investment priorities from a project-centered, one-time cost avoidance approach to an ongoing stream of investments in the development and

Introduction Challenges of Managing in a Network Economy 11
exploitation of "reuseable information assets" that we call the "strategic option" value of IT.
With a flexible and robust IT networked platform in place, a company is poised to pursue the type I1 benefits that accrue when an organization exploits new IT- enabled business opportunities that take advantage of the infrastructure.
Commerce benefits are created when a company uses IT to improve its internal and external operations. Internally, a company can use IT to streamline, integrate, and synchronize key operating processes such as procurement, order fulfillment, and customer service. Then it can extend these IT-enabled processes to improve the efficiency and effectiveness of supply or distribution channels.
Content benefits are created when a company harnesses information and knowl- edge located inside or outside an organization to improve the performance of individ- uals and groups as they make decisions and take actions. The individuals and groups may belong to the same organization or may be customers, suppliers, or business part- ners. As well as helping people "work smarter," information and expertise can be used to create new products and services or to add value to existing ones, thus increasing the flow of revenues and improving a company's competitive position.
Community benefits are created when a company uses networked technologies to increase the commitment and loyalty of internal and external stakeholders. Inside the organization, e-mail, groupware, and intranets can be used to link employees around the world to information resources and expertise, improve the performance of virtual work teams, and create communities of interest. Outside the company, the same technologies can be used to establish a position at the center of an electronic market around which a "virtual community" of customers, suppliers, and business partners can grow.
The ideal IT project, at least to begin with, often streamlines highly leveraged, re- source-intensive processes while layering in important components of reusable infrastructure to produce measurable results within a short period of time. These projects often have a clearly defined scope. As the project unfolds, however, astute managers must be on the lookout for follow-on projects that leverage reusable com- ponents of the infrastructure (e.g., databases, networks, processing power, user ac- cess devices) to increase the value of IT assets and enable a steady flow of value- creating IT-enabled business opportunities. Chapter 3 discusses the organizational capabilities required to exploit a robust and flexible networked IT infrastructure. Chapter 4 discusses the IT investment framework. Chapters 5 through 7 address the design, operation, and management of the networked IT infrastructure required to achieve these benefits.
Theme 5 : Assimilation and Organizational Learning I
Successful implementation of a new technology often requires that users learn new ways of interacting and working. When strategic technologies transform organiza- tions and industries, the need for individuals to assimilate and learn how to use them to achieve the intended benefits extends throughout an organization to encompass

12 Introduction Challenges of Managing jn a Network Economy
FIGURE 1.5
and Investment
I I Success
Lack of 1 attention and commitment
Stagnation Block A
I Success Narrowly
I Success 1
Block C
users within customer, supplier, and partner firms. To achieve the benefits of IT, users must adopt new mental models that frame decision making and behavior. Chris Argyris calls the process of organizational adaptation to new ideas, inventions, and technologies "double loop learning."3 Jim Cash and Poppy McLeod apply this or-
\
ganizational learni~ig thw&the.technology innovation and diffusion process.4 Three phases of the process are depicted in Figure 1.5.
Phase 1. Opportunity Identification and Investment This phase involves identifjmg an IT-enabled business opportunity and funding pilot projects. Often this requires "grassroots" experimentation by local business and IT pro- fessionals who are in the best position to identify the potential uses and benefits of the new technology. Because the implementation remains local, so does the risk. The challenge is to identify those technologies that show promise beyond the local level.
3 ~ . Argyris, "Double-.Loop Learning in Organizations," Harvard Business Review, September-October 1977. 4 ~ . Cash, and P. McLeod, "Managing therlntroduction of Information Technology in Strategically Dependlent Companies," Journal o f Management o f lnformatiorr Systems 1 :5-23, 1985.

Introduction Challenges of Managing in a Network Economy 13
Phase 2. Organizational Learning and Adaptation
This phase occurs when stories of the success of grassroots efforts catch the atten- tion of senior executives, who then fund broader levels of investment. Opportunities for follow-on investment often occur along two evolutionary paths. Technologies that have enabled streamlining and simplification of work often evolve into full- scale business process redesigns that will extend across organizational boundaries inside and outside the firm. As will be seen in later modules,~his was a key approach dsed by Cisco. American Express followed an altGG& evolutionary path as its grassroots experimentation efforts evolved into a new business unit, American Ex- press Interactive, and several joint ventures.
Phase 3. Rationalization and Continuous Evolution This phase occurs when a new technology becomes embedded within the core opera- tions or strategy of the business. The challenge during this phase is to develop appro- priate organizational structures and controls to ensure efficient widespread deployment and management while not stifling further experimentation and innovation. Chapters 3, 5,7, and 10 address the assimilation of IT-enabled business opportunities.
Theme 6: Buy versus Make During the mid-1980s and early 1990s, business professionals and executives at all levels in a firm adopted personal computers (PCs) and user-friendly personal soft- ware packages (e.g., word processing, spreadsheets). As the use of personal tech- nologies increased, IT professionals were commonly asked: "If I can buy a word- processing package, why can't I buy an order fulfillment package?' During this same period, pressure to shed nonperforrning assets and focus on core capabilities caused executives to ask a second question: "Do I really need to keep all these IT as- ? .
/-
sets on my books? Can I putsource my data centers, networks, help desks, and PC ' d -- support?' As standardized, modular, open-access networks and software became 0 - '
."--r available during the late 1990s, a third question was asked: "Can I replace many of my off-the-shelf IT applications with subscriptions to IT services run by network and hosting services and ASPS?"
By the late 1990s, the preference of most executives had shifted from make to buy, rent, or subscribe. This significantly influenced how IT systems and assets were implemented, operated, and managed. In so doing, it also dramatically changed the role of IT professionals and executives. When strategic IT systems are outsourced, relationships with IT vendors and service providers must be managed as strategic al- liances. Alignment of short-term and long-term goals and incentives becomes insti- tutionalized within interorganizational structures such as executive governance boards, advisory boards, and cross-boundary liaison positions and operating teams. At times, shared equity in joint ventures helps align incentives and controls. At other times, short-term service-level agreements and contracts are combined with real- time online and face-to-face information sharing, coordination, and control. Given high levels of uncertainty and the rapid pace of technological and business change, the decision to enter into a long-term strategic relationship involves long periods of

14 Introduction Challenges of Managing in a Network Economy
"due diligence," focusing on the intents, interests, capabilities, and viability of all the parties. Formal contracts contain provisions for joint planning processes that are '
5 terms to designed to identifj and address strategic uncertainties and for changinl, deal with unforeseen opportunities and risks. Provisions for "death" and "divorce" become critical in outsourcing strateg~c IT system development or operat~on. More recently, the move loward standardized, modular, open access technology has been making it easier to change vendors, which is putting pressure on vendors to reduce the length of contracts and provide more favorable terms. Factors to consider as executives struggle with outsourcing decisions are presented in Table 1.2.
Chapters 5 through 7 address the ~ssues faced in outsourcing the 2 1 st-century networked infrastructures and applications delivered by service providers. Chap- ter 9 examines the issues and challenges of outsourcing major segments of the IT function.
Theme 7 : Partnership among Key Constituencies as IT Evolves
Much &the complexity of managing IT arises from the conflicting pressures of dealing with four different and vitally concerned stakeholder groups: business ex- ecutives, IT executives, users, and 17' vendorslpartners. All may have conflicting goals, interests, and incentives. All use a different language to define opportunities, describe implementation approaches, and manage benefits and risks. The ability to align goals, incentives, and activities must begin with the development of a shared understanding and a shared language.
The task of business executives and users is to develop acworking knowledge of the capabilities and management challenges of today's technology. They must un- derstand how these technologies differ from past technologies and the expected tim- ing and trajectory of their future evolution. Comfort with technology can come only when business executives become active players rather than delegating technology decisions to IT executives or vendors. An appropriate analogy is as follows: While many executives would not consider themselves finance professionals, they would never delegate all oversight and control of the financial performance of the organi- zation to the chief financial office (ClFO). Instead, they must be actively involved, questioning experts when they don't understand highly technical details until they have sufficient understanding to make informed business decisions.
Lou Gerstner, chief executive officer (CEO) and chairman of IBM, provides an excellent example of how a senior executive ensured that he had sufficient knowl- edge of IT to lead IBM successfully through a difficult transition. Upon assuming control of the company, Gerstner immediately asked that all senior executives be provided with the latest model of IBM PC, connected to the most sophisticated IBM network, utilizing state-of-the-art executive information-reporting and communica- tion software. The firsthand view of the company's technology, from the perspective of an executive use:r, provided the senior executive team with important data that were used to evolve the company's products, services, and business strategy, which included the purchase of Lotus.

TABLE 1.2 Factors to Consider in Make versus Buy Decisions
Reliable, competent, and appropriately motivated partners that cou vendors (or other partners) are available.
-. There is sufficten The time required to develop internal resources
and expertise andlor to implement the IT applica- n or infrastructure project exceeds the organiza- n's demand for the produfl or service.

16 Introduction Challenges ofManaging in a Network Economy
FIGURE 1.6 Three Eras of
Administrative Framework
Era I
Target for IT Use Justification1 Benefits
Mainframe
Era I1 Microcomputer
. . Era I11 Electronic integration , , Shared partnership Business advantage I Internetworking and learning '4 7
Many IT executives, having progressed through the ranks over the last several decades, have facet1 the same steep leaning curve as their business counterparts. As they moved higher in the organization, IT executives often lost touch wit11 the latest technologies. Adherence to outdated mind-sets blinded them to the potential oppor- tunities and risks presented by emerging technologies and at times delayed dialogues with new IT partners. Figure 1.6 provides an overview of the three eras of technol- ogy evolution and the 'mind-sets' that accompany each one. At the time of'this book, IT executives in many large, established firms needed to simultaneously manage IT resources and relationships within all three eras.
Chapters 5, 7, 8, and 9 focus on the challenges of creating and managing part- nerships among mliltiple constituencies within evolving IT paradigms.
Theme 8: Protecting IT Assets and Managing Risks
In the age of the Internet and broadband, Customers expect "always on" service per- formance. Fully capturing the econoniic advantages of new technologies requires "always up," reliable, secure IT infrastructures. Open access networks such as the Internet dramatically increase our ability to share information, commmiicate, and transact business. They also dramatically increase the risk of doing business online. These risks include accidents as well as sophisticated and malicious cyberterrorism and attacks.
Success in embedding IT in core operations has brought with it a host of new and challenging issues For a number of firms, an interruption of service means imme- diate and significant economic loss. When e-Bay's systems failed three times in 2000, in each case for a period of six or more hours, the company's plight made the front page of The Wall Street Journal. Within hours, the stock price began to drop and the company's market value declined.

1 lntrod uction Challenges of Managing in a Network Economy 17
Just like electricity, we now expect and demand that network and information services be available 24 hours per day, 7 days per week. Once we design our lives and work around technology, we can no longer tolerate even short failures. Chapters 6 and 10 address issues of security, reliability, privacy, and risk management.
Theme 9: Pervasive Computing: Opportunities and Risks
~ Not long ago it was rare that anyone but technology specialists ever bothered to use IT. While some futurists envisioned a world where IT devices and networks would
1 become commonplace in the home, in schools, and in offices around the world, most never gave IT technology a thought. The widespread belief was that IT was for those who crunched data or crunched numbers. Executives might receive reports gener- ated bjr IT systems or enter data into them, but the majority of us never thought that IT would dramatically influence our lives.
As we enter the 2 1 st century, that picture has changed. By year end 2001, over 350 million people around the world were connected to the Internet and in the United States people spent more on personal computers than they did on televi- sions, a ubiquitous household appliance.5 Teenagers in Japan conversed regularly on i-mode phones that enabled them to stay in touch and stay connected to friends and online acquaintances anytime, anywhere, and anyplace. Advertisers and retail store owners found that this geographic connectivity enabled the delivery of tar- geted promotions designed to draw those most likely to purchase into nearby stores. Executives found that they could carry PCs and Internet-enabled personal digital assistants (PDAs) with them and connect to information and people on air- planes, in hotels, and during the morning and evening commute. Truly, IT had be- come both mobile and pervasive.
The next 10 years promise to bring equally profound changes. Indeed, predicting what the future user interface will be is difficult. Some see a "television-like" device that will connect to a broadband network that integrates voice, video, data, and ser- vices to enable individuals to access vast stores of information, entertainment, and e-commerce/cornmunication services. Others see the evolution of $ell phones, pagers, and network devices in cars, airplanes, and trains that will render us constantly on- line and constantly in touch in an increasingly boundaryless world. Whether we will find ubiquitous technology helpful or intrusive in our daily lives remains to be seen; we expect it will be both. These issues are discussed in Chapters 5 through 7.
Summary In combination, these themes create a very complex and challenging managerial envi- ronment. They form the backdrop for the discussions of specific frameworks and man- agerial approaches in the succeeding chapters of this book (see Table 1.3). Below are questions that senior executives can ask to assess the health of their IT activity.
Statistics on worldwide Internet penetration are available from Jupiter Research Center (www.jup.com).

TABLE 1.3 Summary of Key Themes
i Protecting Assimitation Partnership If Assets Pervasive
Market Structure Evolving Prioritizing and Buy among Key and Computing: and Industry Business IT IT Organizational versus Constituencies Managing Opportunities
Dynamics Models Impact Investments Learning Make as IT Evolves Risks and Risks
: Chapter 1: Creating J J ; Business Advantage i with IT 1 Chapter 2: Crafting .! 1 :/ 1 Business Models ' Chapter 3: Building J J J J / Networked Businesses 1 Chapter 4: Making J J i the Case for Digital ; Business / Chapter 5: J J J J J J 1 'Jndcrstanding i Internetworking j Infrastructure / Chapter 6: Assuring J J d' J J ! Reliable and Secure IT
Services
I Chapter 7: Managing J J J J J J J J Diverse IT Infrastructures
1 Chapter 8: Managing J J 1 and Leading the IT 1 Organization
J " a i Chapter 9: Managing IT J J 1 Outsourcing
Chapter 10: A Portfolio J J J Approach to IT Projects - -

Introduction Challenges of Managing in a Network Economy 19
1. How important is IT to our success and survival? Are we missing opportunities that, if properly executed, would give us a sustainable advantage?
2. Are we prioritizing IT investments and targeting our development efforts in the right areas? Are we spending money efficiently and effectively?
3. Are we managing IT assets and infrastructure efficiently and effectively? Is lead- ership of the wide range of IT activities at the right level, given the goals for its use? Are we organized to identify, evaluate, and assimilate emerging technologies on a timely basis?
4. Is our IT infrastructure sufficiently insulated against the risks of a major opera- tional disaster? Are the appropriate security, privacy, and risk management sys- tems in place to ensure "always on" and "always up" service?
5. Are IT and business leaders capable of defining and executing IT-enabled strate- gies? Have we opened an effective dialogue among business executives, IT exec- utives, users, and partners?
We hope you enjoy the book and find it useful as you attempt to leverage the op- portunities and address the challenges of managing in a network economy.
Analyzing the Strategic Impact of IT
The "strategic grid" depicted in Figure 1.4 and discussed under Theme 3 defines four categories of IT impact. These four categories help frame the approach used to identify opportunities, define
{ and implement IT-enabled business initiatives, and organize and manage IT assets and profes- sionals. Examples of firms operating in each of the four categories are discussed in this Appendix.
n
Support
Until recently, the impact of IT on the core oper- ations and strategy of most professional services firms (e.g., law firms and consulting firms) was quite small. For example, despite a consulting company spending $30 million in the early 1990s to equip each of its 2,000 consultants with laptop computers, consultants in the firm were able to continue serving the needs of their clierifs'. during a major IT failure that lasted over 24 hours. In addition, IT had little impact on the
firm's strategy. By the late 1990s, this picture had changed. The same consulting firm had be- gun to use IT to provide consulting advice to its global customers. Consulting reports were ad- vertised and sold on Arnazon.com. Clearly, IT had moved from the back office to the front of- fice, offering new channels to previously n_ tapped markets and generating new revenue streams. These new IT initiatives shifted the im- pact of IT within this consulting firm toward the Turnaround quadrant on the strategic grid.
Turnaround
As seen in the consulting firm example, while some firms do not depend on uninterrupted, highly reliable IT service to ensure strategic success, new IT projects can cause a firm to
'-' ' move from the Support to the Turnaround quad- rant of the strategic grid. A rapidly growing manufacturing firm provides a good example.
-%

20 Introduction Challenges ofManaging in a Network Econo,
Until the mid-1990s, the IT used in this mid- size company, although important, was not ab- solutely vital to the firm's success and survival. In the late 1990s, however, the company began the development of a new IT system that would coordinate all aspects of the firm's operations, including how supplies were ordered, products were manufactured and sold, orders were h l - filled, and customers were served. The new sys- tem was required to enable executives and local business managers to gain control oif the com- pany's operations as it launched new products and rapidly expanded into multiple international locations. Another new IT applicatiivn enabled the company to centralize key customer data and integrate those data with production scheduling information from over 60 plants and two cus- tomer service call centers. These new applica- tions enabled the firm to improve service dra- matically, lower administrative costs sharply, and decrease the cost of operations significantly.
With the launch of these new projects, the com- pany entered the Turnaround quadlmt of the strategic grid. As it did this, the approach to run- ning the IT h c t i o n changed. A senior business unit executive was appointed to head the IT h c - tion, and involvement in IT planning by the firm's executive committee increased substantially. Once implemented, the new IT-enabled operations be- came critical to the firm's success, shifting the fo- cus from the Turnaround to the Factory quadrant.
Factory
By the 1990s, a growing number of firms had in- vested in IT to ensure cost-effective, totally reli-
able operations. Even minutes of system down- time caused major organizational disruption that in lurn generated customer dissatisfaction and significant financial problems.
The CEO of an investment bank, for exam- ple, became fully aware of the high level of op- erational dependence of his firm on IT when a flood above the data center brought all securi- ties trading to a halt. Failure to ensure the pres- ence of an off-site redundant data center crip- pled the bank's trading operations and caused massive financial losses. Needless to say, the CEO developed a new appreciation for the im- portance of IT in running critical areas of busi- ness operations, and a redundant data center was constructed shortly after the incident. The devastation caused at the World Trade Center on September 1 1,200 1, and the subsequent IT- enabled operating challenges faced by many fi- nancial services firms brought global attention to the importance of IT security, reliability, and availability for organizational success and sur- vival.
Strategic
As we enter the 21st century, most executives recognize that IT is an essential component of current and future strategy and operations. Going forward, banks, insurance companies, auto manufacturers, and major retail chains have embedded IT in their core operations and core strategy. Within strategically IT-depend- ent firms, IT executives are members of the executive committee.

Building the Module
Network Economy: .# ' a "
X " ° i e 2Gk4~A~tpvas a Markets and Models as
,.~"+a~~~~g:~..pfi" 8 " , .", a . . , ,-s",*d8.'~*',q1Ik 1," , , a aCl*@$j l (&+b,Rx, ( p ~ I P l ~ t ~ * r '~*~pdl~i*e~";$811:a~~I;"i"1x.: P
, a i a ' i n
r*l O h e~***a 6 b e .*Iw
.+ :isi*ke$$&pk : * " * - S t
.=czoe, q ~ e b a ! ~ by Lynda M. ApplegatL !ter:$2sw;5 c ~ : b 6 @ Q $ ~ $ 3 % r i e *.s,* rs a " "
" ,$$ " "=%" 1 % * 0 4 *
Today's Internet technologies build upon and revolutionize computing and commu- nication platforms introduced decades earlier. As we enter the 21st century, we are experiencing an intense period of technology-enabled innovation, creativity, and ex- citement that has been spurred by the commercialization of several core technolo- gies and associated changes in work and society. Exploiting these opportunities while avoiding the pitfalls requires vision, sound execution, and the ability to re- spond quickly. It also requires imagination-and a little luck.
The chapterskin this module enable discussion of the approaches executives use, t'ie decisions thgi make, and the issues they face as they build businesses for a Net-
si t d l i
work Economy:The focus of the module is on understanding the impact of IT on industries and markets. It discusses issues of strategic positioning and how 21st- century IT provides opportunities to alter marketfindustry structure, power, and re- lationships.


Chapter
Creating Business Advantage with IT'
As the century closed, the world became smaller. The public rapidly gained access to new and dramatically faster communication technologies. Entre- preneurs, able to draw on unprecedented scale economies, built vast empires. Great fortunes were made. . . Every day brought forth new technological advances to which old business models seemed no longer to apply. . . . A prophecy for the 21st century? No. You have just read a description of what happened orie hundred . , years ago when the 20th century industrial giants emerged.2
As this quote implies, new technologies sometimes can catch us off guard. In fact, when Rutherford B. Hayes, the 19th president of the United States, saw a demon- stration of the telephone in the late 1800s, he reportedly commented that while it was a wonderful invention, businessmen would never use it. Hayes believed that people had to meet face to face to conduct substantive business affairs, and he was not alone in that assessment.
Few of Hayes's contemporaries could foresee the profound changes that would be ushered in by the telephone and other technologies of the day, including steam engines and production machinery; railroads, automobiles, and other transporta- tion technologies; and communication technologies such as the telegraph and tele- phone (see Figure 1.1). The exodus of people from rural to urban areas, the shift
his chapter is adapted from papers and materials for Professor Applegate's course, Building Business in a Network Economy. The chapter draws on earlier work by Professor F. Warren McFarlan and James L. McKenney, which is summarized in F. W. McFarlan, J. L. McKenney, and P. Pyburn, "lnformation Archipelago: Plotting a Course," Harvard Business Review, January 1983. *c. Shapiro and H. Varian, lnformation Rules: A Strategic Guide to the Network Economy (Boston: HBS Press, 1998).

24 Module One Building the Network Ecorromy: Markets and Models
FIGURE 1.1 The Impact of Technology on Business and Society during the Industrial Revolution
Source: Reprinted with perkission from Duke University Rare Book, Manuscript, arid Special Collections Library.
from craft-based work to mass production, and the decline of small, owner-oper- ated firms in favor of large, vertically integrated multinationals-these transitions marked the shift from an agricultural to an industrial economy. In fact, while tech- nological innovati011 served as one of many stimuli to change, it was the confluence of technological, business, and social changes that enabled passage from the agri- cultural era to the industrial era.
In retrospect, these changes were revolutionary, but they evolved incrementally through periods of evolution punctuated by intense periods of rev~lut ion.~ Similarly, the shift from an industrial economy to an information economy began with a period of intense technological innovation during the 1940s, 1950s, and 1960s that built upon, yet significantly altered, the technologies of the industrial revolution .4 ~ o d a ~ ' s Internet techno log it:^ both build upon and revolutionize computing and communi- cation platforms introduced decades earlier. For example, the Internet servers that power Network Economy businesses evolved from early mainframe computers and microprocessors that were commercialized in the mid-1950s and the 1960s. In ad- dition, the new computing and communication devices used to access the Internet to shop, pay bills, trade stocks, do business, and communicate with others around the
3 ~ . Gersick, "Rev~lut~ionary Change ~heories: A Multilevel Exploration of Punctuated Equilibrium Paradigm," Academy of Management Review, 16:lO-36, 1991 and L. M. Applegate, "In Search of a New Organizational Model," Shaping Organization Form ed. DeSanctis and Fulk (Sage Publications, 1999). 41nterestingly today's sophisticated computers actually trace their roots to the mechan- ical tabulating machines and typewriters that heralded the start of the industrial revo- lution during the 1800s.

Chapter 1 Creating Business Advantage with IT 25
FIGURE 1.2 Social and Business Evolution Technology, L7 J-? Er-~ 'k
Q "->/ EA+
Business, and Societal Evolution during the 20th Century
Agricultural Network Economy Economy Economy 1
Qpical mathematical formula: D=B'-~AC Equivalent FORTRAN statement: D=B**Z-I*A*C -
Technology Evolution
world evolved from personal computers and cell phones introduced in the 1970s and 1980s (see Figure 1.2).
As we enter the 2 1 st century, we are once again experiencing an intense period of technology-enabled innovation, creativity, and excitement that has been spurred by the commercialization of several core technologies and associated changes in work and society. The technological changes include the following:
The Internet and broadband networks-low-cost, standardized, global alterna- tives to the expensive, specialized, and proprietary communication platforms of the 1970s and 1980s. These technologies enable the transmission of multimedia digital information on a common communication channel.
The World Wide Web (WWWJ and high-performance sewers-flexible, stan- dardized, powerful platforms for creating and, storing information in all its many forms (for example, text, data, voice, and video) on high-performance computers that can be located anywhere in the world.
The Uniform Resource Locator (u&) and browser--common approaches for identifying and locating information anywhere on the Internet and easy-to-use tools for accessing, packaging, and displaying multimedia information.
Multimedia digital devices-portable Internet access devices that provide a sin- gle point of entry to voice, television, and information. Today's new devices in- clude laptop computers, palm pilots, interactive television set-top boxes, and game consoles. ' 1 ,
/
Wireless networks and protocols-the technology and supporting business infi-a- structure to enable access to the Internet, untethered by physical wires. While ini- tially limited by a lack of c o h o n st&dard~;~erformance, and useful applications,

26 Module One Building the Network Economy: Markets and Models
this ."go anywhere" form of access Is rapidly becoming a reality, especially in Eu- - rope and Asia. In Finland, for example, cell phone users can send e-mail., pay bills,
check stock quotes, get traffic reports, and buy gas from a gas pump or buy a cup of espresso at a local cafk-all through a cell phone or wireless device. In Japan, the hottest6ew accessory for teens is the i-mode phone.
Java, Jini, X M L , and other object-oriented programming language and data- base technologies-powefil new approaches to developing information sys- tems that take full advantage of the flexibility, modularity, connectivit): and mul- timedia features of the Internet.
L
Just as we saw during the technological revolution that gave rise to the Industrial Economy, entrepreneurial firms, unfetlered by the need to satisfy the expectations of entrenched shareholders, led the way as they defined innovative business models for the Network Economy. In fact, during 1999, over $32 billion-90 percent of the total invested by venture capitalists-was invested in technology (including Internet- related) venture^.^ As we entered the 21st century, investor confidence had hit an all- time high. But as annual and-first quarter earnings reports for newly public "dot-com" businesses hit the streets$ momentum buylng was replaced by momentum selling and stock prices Venture capital investments in business-to-consumer (B2C) e-commerce, which had garnered 40 to 50 percent ofprivate equity dollars dur- ing 1999,~ declined to less than 3 percent of venture investments by the second quar- ter of 2000.~ E-commerce companies that only months earlier had been awarded val- uations in excess 01' $1 billion went out of business in record numbers. In fact, over 780 Internet firms went out of business between January 2000 and January 2002.'
While most were slow to get started, by 2001 established firms began lo take ad- vantage of the decreased strength of new entrants and take a lead role in defining the Network Economy for the 2 1 st century. Pioneering high-tech firms such as Cisco, IBM, Microsoft, and Intuit and established players in non-high-tech industries such as General Electric, Charles Schwab, American Express, and Ford aggressively pur- sued Internet business initiatives, often building on online business foundations that had begun decades earlier. Non-U.S. firms (such as France Telecom, Vivendi Uni-
5 ~ . Mowrey, "Financial Spotlight: Inside the Dot-Com VC Billions," The Standard (www.thestandard.com), February 21, 2000. This study reports the findings of three venture capital studies conducted by Price Waterhouse (www.pwcglobal.com), Venture Economics (www.ventureeconomics.com), and Venture One (www.ventureone.com). '"NASDAQ's Near Meltdown," The Standard (www.thestandard.com), April 4,2000; J. Boudreau, "New Economy Reality Check," SiliconValley.com (www.sjmercury.comlsvtech/newslindepth), April 16, 2000; 5. Lorh, "Stocks' Slide May Spark Dot-Com Shakeout," New York Times on the Web, (www.nytimes.com), April 17, 2000; P. Wallace, "The Dog Days of E-Commerce," The Standard (www.thestandard.com), June 1, 2000 7 ~ o w r e y , op cit. 'P. Bonanos, "Net VC: Past Its Prime?" The Standard (www.thestandard.com), August 28, 2000. 'see webmergers.com (www.webmergers.com) for a detailed report of dot-corn mergers, acquisitions, and failures. The data presented here were collected on April 4,2002.

Chapter 1 Creating Business Advantage with IT 27
versal, and Bertelsmann in Europe; Li & Fung, Cosco, and PSA in Asia; and Tele- fonica and UOL in Latin America, to name just a few) were also actively creating the global Network Economy.
' This chapter draws on over two decades of research on the impact of information technology (IT) on industries, markets, and the organizations that operate within them. It examines the forces that shape strategic decision making in the 2 1 st century and presents frameworks to analyze the impact of the Internet and associated tech- nologies on competitive and market forces.
Forces That Shape Business Strateev
Companies that have deployed Internet technology have been confused by distorted market signals, often of their own creation. It is understandable, when confronted with a new business phenomenon, to look to marketplace outcomes for guidance. But in the early stages of the rollout of any important new technology, market signals can be unreliable. New technologies trigger rampant experimentation, by companies and their customers, and the experimentation is often economically unsustainable. As a result, market behavior is distorted'and must be interpreted with caution.1°
When the business environment is stable, strategic decision making is like a game of chess. One player' studies an opponent's moves and then makes countermoves. During periods of business innovation, however, a competitor's moves may not nec- essarily reflect rational and reasonable business thinking. It then becomes necessary
I to return to the fundamental analyses of the forces that shape strategy. In this section, we present three frameworks that can be used to guide analysis of
the impact of IT on strategy. Michael Porter's "value chain" and "industry and com- petitive analysis" (ICA) frameworks, although not originally developed to examine the impact of the Internet and IT on strategic decision making, have proved very use- ful in this regard.'!'I2 The third framework, Warren McFarlan's strategic grid (also discussed in the Introduction to this book), is a tool for characterizing the roles the Internet and IT may play in specific firms and industries and for deriving appropri- ate IT-related strategies and management practices.
Value Chain Analysis For decades, the value chain framework (see Figure 1.3) has been a powerful tool for identifying and analyzing the stream of act,ivities through which products and serv- ices are created and delivered to customers. Once activities are defined, it becomes
'OM. Porter, "Strategy and the Internet," Harvard Business Review, March 2001. "M. Porter, Competitive Advantage: Creating and Sustaining Performance (New York: Free Press, 1985). See Porter, op cit., for a value chain analysis of Internet opportunities. ' *~ar ly pioneering work on the use of Porter's frameworks for analyzing the impact of IT on industries, markets, and firm strategies was conducted by Professors Jim Cash, Warren McFarlan, Jim McKenney, and Mike Vitale. The work was summarized in: J. I. Cash, F. W. McFarlan, and J. L. McKenney, Corporate Information Systems Management: The Issues Facing Senior Executives, 3rd ed. (New York: McGraw Hill-Irwin, 1988).
Davood
Highlight

28 Module One Building the Network Ec:onomy: Markets and Models
FIGURE 1.3 The Value Chain
& Equipment
possible to analyze the economics at each step in the chain by identifying both the costs incurred and the value created. 'These activities can be located inside a firm or across firm boundaries. In the latter case, activities may involve customers, suppli- ers, par'tners, or other stakeholders. Accompanying the physical value chain is a re- lated information value chain through which the involved parties coordinate and control activities.
Participants within a business market assume one or more of four primiuy roles to carry out these value-creating activities (see Figure 1.4). The point within a valuechain where maximum economies of scale and scope are created determines market power. Economies of scalc are achieved when a market participant or a network of partici- pants is able to leverage capabilities and infrastructure to increase its revenues and profitability within a single product line or market. Economies of scope are achieved when a market participant or a network of participants is able to leverage capabilities and infrastructure to launch new product lines or businesses or enter new markets.
Industr&l con lo my business innovations favored producers. The innovations included physicalhnalog production and distribution technologies (machines, rail- roads, steam engines, telephones), an operating model (the assembly line, market- ing, sales, and after-sales service channels), a management model (the hierarchy), and a social/regulatory system (specialized work, pay-for-performance incentives, worker education, imions, antitrust laws).
As we enter the 2 1st century, Network Economy pioneers such as eBay, covisint, and AOL Time Warner are defining new business models that are reshaping the global business landscape and redefirdng power. Once again, emerging models ex- ploit the power of rechnological, business, and social innovations within a regula- tory and policy framework that emerges over time. a
Davood
Highlight

Chapter 1 Creating Business Advantage with IT 29
Example: Auto Industry FIGURE 1.4 Market Roles
Create component products or provide services, raw materials or talent.
Design and build products, services, and, most importantly, solutions that meet a specific customer or market need.
Enable buyers and sellers to connect, communicate, and transact business.
Consumers or businesses willing to pay for a product, service, or solution.,
Network Economy business innovations include digital production and distribu- tion technologies (broadband and wireless networks, multimedia content creation, flexiblelreal-time knowledge access and managemeit), a networked operating model (integrated supply chains and buy chains), a networked management model (teams, partnerships, consortia), and sociallregulatory systems (ownership incen- tives, freelancing, virtual work, distance learning, digital copyright laws).
Although Industrial Economy markets and power bases were built on proprietary infrastructure, participants in Network Economy markets leverage a shared digital business infrastructure to enable new entrants and established firms to create and exploit network economies of scale and scope. Network economies of scale are achieved when a "community" of firms shares its infrastructure, capabilities, and customer base to produce and distribute products faster, better, and cheaper than competitors can. Network economies of scope are achieved when the community uses its shared infrastructure to produce and distribute new products and services, enter new markets, or launch new businesses more quickly, at less cost, and more successfully than competitors can.
As we will see later in this section, the interorganizational IT systems of the 1980s and early 1990s (e.g., American Airlines' Sabre reservation system and Amer- ican Hospital Supply Corporation's ASAP system) foreshadowed how network eco- nomics could create value. Because they were built using proprietary technologies, access, reach, and flexibility were limited. Table 1.1 compares Industrial Economy and Network Economy models.
Davood
Highlight
Davood
Highlight
Davood
Highlight
Davood
Highlight
Davood
Highlight
Davood
Highlight
Davood
Highlight
Davood
Highlight

30 Module One Building the Network Economy: Markets and Models
TABLE 1.1 Comparison of the Industrial Economy and Network Economy
Characteristics Industrial Economy Network Economy
Criteria for economic success
Technological innovations
Operating innovations %
Management innovations
Internal, proprietary, and specialized economies of scale and scope; economies of scope are limited by the level of infra- structure specialization required
Production, communication, and distribution technologies
Standardization of work; job specialization; assembly line operations; value chain industry structure
Hierarchical coordination and supervision; compliance-based control; pay-for-performance incentives; centralized planning and control
External, networked, and shared economies of scale and scope; economies of scale and scope are increased dramatically by the ability to build new businesses on the nonproprietary, clexible, shared, and ubiquitous Internet infrastructure Distribution, communication, and information technologies; the ability to "assemble?" component pieces Knowledge work; job expansion; work teams (face to face and virtual); extended enterprise; outsourcing and partnerships; value networks Networked coordinating and supervision; ownership incen- tives; information-based ("lear~ing") mo,dels of control; distributed planning and control
Societal/regulatory Urban growth; mass transporta- Work at home; self-employ- innovations tion; social security and welfare; ment; personal pension and
unions, federat regulations; savings programs; global domestic economy economy
Length of time to Decades Uncertain achieve economies of scale and scope Dominant industry Producers Solution assemblers and power channel managers
Industry and Competitive Analysis Porter's ICA framework postulates that economic and competitive forces in an in- dustry are the result of five basic forces: (1) bargaining power of suppliers, (2) bar- gaining power of buyers, (3) threat of new entrants, (4) threat of substitute products . or services, and (5) competitive intensity and positioning among traditional business rivals. Figure 1.5 presents the ICA framework.
Porter describes three generic strategies for achieving proprietary advantage within an industry: cost leadership, difyerentiation, and focus. Each generic strategy embodies two key choices: (1) Should we lower cost or differentiate our products
Davood
Highlight
Davood
Highlight
Davood
Highlight
Davood
Highlight
Davood
Highlight
Davood
Highlight
Davood
Highlight
Davood
Highlight
Davood
Highlight
Davood
Highlight
Davood
Highlight

Chapter 1 Creating Business Advantage with IT 31
FIGURE 1.5 Forces Influencing Industry and Competitive Advantage
Suppliers. , .
C
C
and services (this is known as the "competitive mechanism"); and (2) Should we tar- get a broad market or a narrow one (this is known as "competitive scope")? Specific actions required to implement each generic strategy vary widely from industry to in- dustry, as do feasible generic strategies within a particular industry. Selecting and implementing the appropriate strategy are central to achieving long-term competi- tive advantage in an industry.
1 Strategic Grid Analysis I
The value chain and industry competitive analyses discussed above help frame strategic decision making along the two dimensions depicted on McFarlan's strate- gic grid in Figure 1.6.
Along the vertical axis, executives assess the impact of IT on operations. As was discussed in the Introduction of this book, for some organizations, the second- by-second, utterly reliable, precision execution of IT operations is crucial to sur- vival. Even small interruptions in service or disruptions in quality have a profound impact. For other organizations, it would take a significant disturbance in IT op- erations over an extended period to have a major impact on an organization's abil- ity to execute.
Along the horizontal axis of the strategic grid, executives assess the strategic im- pact of IT on market forces that influence fbture sustainable business advantage. For some organizations, 1~:enabled business initiatiires are critical to future strategic positioning. For others, new IT applications provide local improvements but do not affect business strategy.
Davood
Highlight
Davood
Highlight
Davood
Highlight
Davood
Highlight
Davood
Highlight
Davood
Highlight
Davood
Highlight

32 Module One Building the Network Economy: Markets and Models
IT on Strategy Goal: Improve p~:rformance of Goal: Transform organization or and Operations
* core processes industry Leadership: Business unit executives Leadership: Senior executives & board 8 Project Management: Process Project Management: Change
ieengineering 1 management
P I Goal: Improve local performance Goal: Identify and launch new Leadership: Local level oversight ventures I
Analyzing the Impact of IT on Strategic Decision Making
experimentation
Plotting the portfolio of IT applications and their impact within the strategic grid enables executives to choose the appropriate approach to organizing and managing IT-enabled business activities. Five key questions can be used to guide strategic de- cision making when one is evaluating the impact of networked IT on core operations and core strategy.
Leadership: Venture incubation unit Project Management: New venture
development
Can IT be used to reengineer core value activities and change the basis of competition?
Low High IT Impact on Core Strategy
Can IT change the nature of relationships and the balance of power anzong buy- ers and suppliers?
Can IT build or reduce barriers to entry?
Can IT increase or decrease switching costs?
Can IT add value to existing products and services or create new ones'?
Can IT Be Used to ReengineeKore Value Activities and Change the Basis of Competition? At their core, IT systems are used to automate activities whether thoseactivities take place inside an organization or across its boundaries. In the 1950s and 1960s, when IT was first introduced for commercial use, the primary target of IT applications was to automate routine, information-intensive "back-office" transactions such as pay- roll processing, accounting, and general ledger postings. The primary goal was to increase efficiency and productivity.
Businesses quickly learned to apply those benefits to "front-office" activities that involved transactions with suppliers, distributors, customers, and other value chain
Davood
Highlight
Davood
Highlight
Davood
Highlight
Davood
Highlight
Davood
Highlight
Davood
Highlight

Chapter 1 Creating Business Advantage with IT 33
participants. In fact, benefits increased dramatically when businesses used IT not just to automate but also to transform and inform. A streamlined and integrated value chain helped businesses eliminate redundancies, reduce cycle times, and achieve even greater efficiency and productivity. Information, a by-product of automation, also en- abled executives, employees, partners, and other stakeholders to better understand fast-cycled operations. Moreover, real-time information could be used to improve co- ordination and control, personalize products and services, add value to--and differ- entiate--existing products and services, and create IT-enabled products and services that would attract new market participants and generate new revenue streams.
American Hospital Supply Corporation (AHSC) and American Airlines (AA) are two early examples of using IT to reengineer value activities and transform the ba- sis of ~ o m ~ e t i t i o n . ' ~ The story began during the late 1960s when an entrepreneurial sales manager at AHSC created a system that enabled hospital purchasing clerks to order supplies over telephone lines by using punch cards and primitive card-reading computers. At about the same time, enterprising sales managers at AA were paving new ground by giving large travel agencies computer terminals that allowed them to check airline schedules posted within American's internal reservation systems. In- deed, from these entrepreneurial actions grew two legendary strategic IT applica- tions that changed the basis of competition in their respective industries.
Both AHSC and AA built their strategic systems upon internal systems that origi- '
nally were designed to automate back-office transaction processing. AHSC, for ex- ample, first installed computers to manage internal inventory and order processing ac- tivities; AA used computers to manage its internal reservation process. In both cases, the value of these early systems came from the ability to structure, simplify, and unify internal operations. But once they had simplified and structured activities inside the firm, both AHSC and AA recognized that they could allow customers to "self-serve" without fear of reducing quality. Because each firm had built its system with propri- etary technology, AHSC and AA owned the platform on which business was con- ducted, and they also owned the information flowing from the automated transaction systems. This information enabled executives and front-line workers in both firms to coordinate and control activities whether those activities took place inside or outside the firm. By harnessing the power of the information, both firms were able to differ- entiate existing services and offer new information-based services.
The benefits of conducting business online were so great that AHSC gave hospi- tals the card readers required to do business electronically and taught hospital sup- ply clerks how to use thein.14 AHSC even helped hospital personnel redesign their internal purchasing processes to fit the new online process. AA did the same thing when it gave travel agents the computer reservation system terminals. Neither AHSC
13see J. L. McKenney and D. G. Copeland, Waves o f Change (Boston: HBS Press, 1995), and L. M. Applegate, "Electronic Commerce," in The Technology Management Handbook, ed. Richard C. Dorf (CRC Press, 1999), for an in-depth discussion of the evolution of early strategic systems. 14By 1985, AHSC saved over $1 1 million per year through online ordering and generated $4 million to $5 mibon per year in additional revenue.

34 Module One Building the Network Eccjnomy: Markets and Models
nor AA charged its customers for the computer equipment or the training. Why? The benefits of self-service more than offset the cost of giving away the terminals.
The AHSC and A4 examples demonstrate how two firms used IT to f'undamen- tally alter the basis of competition in their respective industries. This occurred when executives implemented strategies that radically changed the cost structure for the industry and at the same time differentiated the product/service offering, causing massive shifts in market share and demand.
As we enter the 2 1st century, Internet pioneers are using today's technological in- novations to reengineer value chains and fhdamentally change the basis of competi- tion. Charles Schwab provides an example of how a firm built upon existing capabil- ities and technology infrastructure to radically transform the financial services industry. Founded in 1975, Schwab accomplished this feat not once but twice. Initially Schwab executives placed a bet that a growing number of individual invesrors would prefer to save money and time by using low-cost local branch office brokerage serv- ices rather than high-priced personal brokers. They were correct, and by 1997 revenues for Schwab's discount brokerage business had reached $2.3 billion. The intlustry was forced to adjust its practices in reaction to this new entrant, although full-service bro- kerages remained strong.
When the commercial Internet appeared in the mid- 1990s, Schwab was poised to segment the market again. Routine customer service requests (quotes, balances, positions) already had migrated from Schwab branches to the telephone and a pro- prietary online service. By the time Schwab rolled out its Internet online brokerage capabilities in January 1998, only 5 percent ofroutine customer service was handled at a brokerage office. The Web-based service provided access to online and offline brokerage services for a single fee of $29.95 per trade (compared to an average of $80 per trade for full-service brokerage commissions). Within less than a year, sales were up 19 percenl, and since the onlline self-service business lowered costs dra- matically, profits were up 29 percent.
Full-service brokers such as Merrill Lynch were initially skeptical. 13ut as the market penetration (and market value) of Charles Schwab soared, even the most stal- wart critics were forced to launch their own onlineloffline integrated channels.
Can IT Change the Nature of Relationships and the Balance of Power among Buyers and Suppliers? As was mentioned earlier, AHSC rose to power within the hospital supplies indus- try by streamlining channels, dramatically decreasing cost, improving order accu- racy, and increasing speed of fulfillment between suppliers (for example, Johnson & Johnson, Baxter, and Abbott) and hospital buyers. Initially, AHSC used traditional offline processes to buy supplies from manufacturers and store them in AHSC- owned warehouses. But once it succeeded in getting a large number of customers to buy online, AHSC sought to streamline the supply chain further. Sensing that they were at risk of being excluded from the market and lacking the money, expertise, and time to respond, suppliers succumbed to the pressure to put their catalogs online and

Chapter 1 Creating Business Advantage with IT 35
join the electronic market. Once electronic links to suppliers had been established, AHSC customers could order directly from supplier inventory. This enabled further reductions in cost and cycle time for all the members of the online market.
Customers encouraged channel consolidation. They recognized the value of a multivendor marketplace but were unwilling to put up with the problems of using multiple different supplier systems to conduct business. Within a short time, AHSC became a powerful channel manager within the hospital supply industry, controlling both the physical and information channels for.conducting business. In fact, this neutral, third-party distributor created such a significant shift in the balance of power away from hospital suppliers that in 1985 it was bought by Baxter Healthcare Corporation, a hospital supplier in the industry. A few years later, responding to pressure from market participants, Baxter was forced to spin out the distribution business it had purchased.
Initially, many believed that the Internet might similarly shift power from producers (manufacturers and service providers) to channel players (wholesalers, distributors, and retailers). Indeed, during the late 1990s, Internet-based channel players flourished, es- pecially within fragmented markets and industries. Chemdex, for example, attracted much attention (and investment) by establishing a neutral, third-party virtual market- place for the life sciences industry.'5 Likewise, software services firms such as Com- merceone, Oracle, and Ariba developed and operated electronic marketplaces that linked buyers and suppliers across multiple industries. By mid-2000, however, many in- dependent marketplaces, such as Chemdex, were struggling or had closed, and software services firms were suffering from weakened demand. As neutral, independent chan- nel players faltered, established players, including both suppliers and buyers, exploited the shared Internet online business infrastructure to launch initiatives to defend their respective positions. Once again, the health-care industry provided an excellent view into these shifting power dynamics.
In March 2000, five of the largest health-care suppliers-Abbott, Baxter, GE Medical, Johnson & Johnson, and Medtronic-launched the Global Healthcare Ex- change, LLC (GHX). '~ GHX promised to eliminate inefficiencies in every step in
15chemdex was launched in November 1998 to serve as an independent marketplace through which buyers and suppliers in the life sciences business could conduct business. In March 2000, the founders of Chemdex created a new corporate parent, Ventro, with the goal of creating multiple marketplaces. By late 2000, Chemdex had been forced to shut down and Ventro was struggling. See M. Collura and L. M. Applegate, Ventro Corporation: Builder o f B2B Businesses (HBS Publishing) (Order No. 801-042). 161n addition to sewing as a leading producer: within.a number of industries (for example, medical, appliances, lighting, power systems, capitallfinancial services), General Electric sewed as an online marketplace software and services firm through its Global Exchange business. GE Global Exchange assumed responsibility for building, deploying, and hosting the Global Healthcare Exchange. Learn more about the Global Healthcare Exchange by visiting the company website at www.ghx.com.

36 Module One Building the Network Ecorromy: Markets and Modtzls
the health-care supply chain, from placing orders to tracking delivery. These ineffi- ciencies accounted for an estimated $1 1 billion in unnecessary purchasing costs." The five founding companies supplied over 70 percent of all the products and serv- ices purchased by hospitals and health-care providers and did business with over 90 percent of the potential buyers. By early 2001, over 70 additional suppliers had signed on. As participation grew and the network expanded, GHX greatly increased the bargaining power of suppliers.
Even before the launch of GHX, however, health-care buyers had begun to form technology-enabled coalitions called Group Purchasing Organizations (GPOs). Healthcare Purchas'ngPZrtners International (HPPI) was an example of a GPO es- tablished to provid Veteran' Health P,dministration (VHA) and Universilty Health s System (UHS) merhbedealth-care providers with the highest-quality supplies, equipment, and other services at the most competitive prices. During 2001, HPPI managed over $1 8 hillion in annual purchases for over 6,200 hospitals and health- care providers around the world. Purc:hasing through HPPI was reported to have saved member firms over $750 m i l l i ~ n . ' ~
As we entered the 21st century, the race was on to determine whether buyer-led or supplier-led coalitions would achieve a dominant position within health-care electronic commerce markets. Interestingly, by 2001, buyer-led coalitions such as HPPI had begun to do business with supplier-led coalitions such as GHX. In fact, GHX executives publicly stated that they considered the new GPOs to be ~mportant members of the exchange not just as customers but also as partners.
Several actions in late 2001 clarified GHX's strategic intent to grow through part- nerships with other coalitions. On August 29, 2001, GHX and Neoforma signed a definitive agreement to provide comprehensive, integrated supply chain solutions for the global health-care industry. At the time of the agreement, Neoforma operated marketplaces for some of the largest buyer-led group purchasing organizations in the health-care industry, including MedBuy, a Canadian GPO that united over 100 hospitals in 1 1 regicms across Canada, and Healthcare Purchasing Partners Interna- tional, described above. How buyer-seller power relationships will eventually stabi- lize in the health-care industry and other industries is not yet clear. What is abun- dantly clear, however, is that enabling technologies have had a significant impact on buyer-supplier power and that executives around the world are being forced to re- think strategic priorities, relationships, and decisions.
Can IT Build or Reduce Barriers to Entry? Companies erect entry barriers by offering customers and other market participants attractive products and services at a prrce and level of quality that competitors can- not match. Before the rise of the commercial Internet, first movers such as AHSC and AA spent hundreds of millions of dollars over decades to establish a dominant
17 R. Winslow, "Baxter International, Others Plan Net Concern for Hospital Purchases," Wall Street Journal Interactive, March 30, 2000. or more information on HPPI, visit the website at www.hppigo.com. Data obtained on March 10, 2002.

Chapter 1 Creating Business Advantage with IT 37
, position within electronic markets. The sheer magnitude of the investment to build and operate proprietary networks, transaction systems, and databases created sig- nificant barriers to entry. For example, American Airlines a n G c G v a 1 United Air- lines each spent hundreds of millions of dollars during the late 1970s and early 1980s to build the proprietary networks and computer systems required to launch and run online customer reservation systems. By the time other airlines recognized the situation, they were forced to ffe into those two dominant online channels or risk
I being cut off from customer^.'^ Over time, however, these technology-based advantages decreased. The more
sustainable advantage came from second-order barriers to entry created by exploit- ing the value of information generated by the technology and the value of the loyal community of suppliers, customers, and partners that did business by using the com- pany's proprietary digital infrastructure.
Today many believe that the overall impact of Internet technologies will be to lower entry barriers for all players in online markets." This belief arises from the fact that Internet technologies dramatically lower the cost of participating in an electronic market. In addition, the shared, nonproprietary nature of the Internet makes it easy for market participants to link to a common, shared platform for conducting business online and, more important, to sever ties with one firm and link to another.
Indeed, the low cost and ease of penetration decrease the benefits to any one par- ticipant unless people within the firm are capable of learning and responding more quickly and more effectively than others, are able to build proprietary capabilities that are not easily replicable, and can attract a large, loyal community that remains
; connected despite the availability of seemingly comparable alternatives. As we saw in the past, these "knowledge and community barriers" provide a more sustainable entry barrier within Internet-based electronic markets. In most cases, we see that in- cumbent firms with large investments in proprietary infrastructure and channels to market are at a particular disadvantage relative to new entrants when they attempt to create and quickly deploy second-order barriers to entry.
Amazon.com, one of the most celebrated new entrants of the dot-com era, pro- vides an example of how new technology can lower entry barriers in an estab- lished industry. But as we will see, while entry barriers were initially low, Amazon's e-retail business model required the company to take ownership of physical i ueq- tory. This in turn required significant investment in building a "click an mortar ' r",i onlineloffline retail infrastructure. While building and deploying the i n f r a sh ure delayed profitability, by January 2002 the company had found ways to capitalize
l g~ur ing the late 1980s and early 1990s, new entrant Southwest Airlines offered a regional service that provided a significant decrease in price and a corresponding increase in the number of flights to popular destinations within a local area. This niche market strategy enabled it to achieve a sustainable competitive advantage without tying into online reservation systems. By early 2000, Southwest was able to offer its own online reservation system that enabled customers to bypass travel agents and buy directly from Southwest. ''porter, op cit. ,

38 Module One Building the Network Economy: Markets and Models
on the infrastructure it had built, the community it had connected, and what it had learned.
In July 1995, Jeff Bezos, Amazon's chief executive officer (CEO) and founder, launched his online bookstore from a 400-square-foot warehouse (about the size of a one-car garage) with only a few servers and a high-speed connection to the Inter- net. The company quickly became the nurnb~r one online bookstore. Just two years after launch, sales had reached $148 million and the number of customers exceeded 2 million.
During its third year, Amazon executives demonstrated that the initial success in quickly dominating the online book market could be repeated. During the summer and fall of 1998, Amazon opened new online music and video "stores" and achieved the number one position in online music sales within four months and the number one position in online video sales within a record 45 days.21
At that point, Amazon had demonstrated how the Internet could lower entry barriers to the detriment of established players. But there was also a deeper lesson. Established competitors, such as Barnes & Noble, Borders, and Bertelsmann (in Europe), were not blind to Amazon's early success; they invested heavily but were unable to catch up. Why? Many erroneously believed that Amazon's dominance came from its first-mover advantage. While this was important, in other instances first movers have been crushed quickly. CDNow, for example, was overtaken by Amazon.com in short order.
The secret to Amazon's success in entering and dominating multiple industries was the transaction, information, and community infrastructure that Amiizon.com executives built behind its website. In fact, during 1999 and 2000, Amazon execu- tives spent almost $500 million building a sophisticated, Web-based order fulfill- ment capability that enabled the company to fulfill orders for over 3 1 million units during the six-week 2000 holiday period from mid-November to the end of Decem- ber. Over 99 percent of orders arrived on time.
The transaction infrastructure fed valuable information into a sophisticated knowledge management infrastructure that allowed executives and employees at all levels to develop a real-time understanding of the dynamics of the marketplace and the needs of market participants. Amazon used that knowledge to coordinate and control operations not only inside the firm but also across organizational bound- aries. More important, it used its growing understanding of customer preferences to personalize its online services in a way that could not be matched by competitors and to feed valuable information to suppliers. The number of loyal customers in- creased quickly, and by late 2000 over 25 million people shopped on Amazon. These proprietary transaction, knowledge, and community infrastructures (which united people and technology) enabled Amazon to develop powerful barriers to entry that, to date, competitors have been unable to match.
By mid 2001, however, many wondered whether those proprietary advantages would be enough. Aiter the rapid decline in the price of Internet stocks durlng 2000
"see L. M . Applegate; Amazon.com 2000 (HBS Publishing) (Order No. 801-194).

chapter 1 Creating Business Advantage with IT 39
and the loss of investor confidence in online business models, the company found that sources of financing for growth had dried up. Amazon executives moved the company's strategy and business model away from a dependence on retail product sales and toward a services model in an effort to reach profitability more quickly. This new strategy paralleled the approach used by AHSC and AA during the 1980s, as both firms shifted from selling products to selling services and expertise.
By early 2002, Amazon had successfully attracted a number of established "brick and mortar" retailers (including ToysRus, Borders, Egghead.com, Circuit City, Target, and Catalogcity) that wished to tap into online markets while avoiding the risk and time required to develop, deploy, and manage equivalent capabilities. Those firms signed multiyear outsourcing contracts that over time began to shift the @azon.com business model from a pure-play e-retailer to an onlineloffline logistics services provider. As evidence of the value of Amazon's proprietary networked business infra- structure, in summer 2001, AOL Time Warner, anticipating a need to dramatically ex- pand its e-commerce capabilities, invested $100 million in Amazon.com. While it was still unclear whether Amazon would be able to successfully integrate these multiple established company operations before it ran through its rapidly dwindling cash re- serves, the company posted its first profit in the fourth quarter of 2001.
Can IT Increase or Decrease Switching Costs? To provide a sustainable source of revenues, an IT system ideally should be easy to start using but difficult to stop using. Customers drawn into the system through a se- ries of increasingly valuable enhancements should willingly become dependent on the system's functionality. Once the use of the system becomes ingrained within day- to-day activities, switching to another system becomes difficult and costly.
In the past, when proprietary technologies were the norm, switching costs were high because switching usually required buying into different proprietary networks and systems owned and operated by an online channel manager, such as American Airlines in the travel services industry, American Hospital Supply-iii-the hospital supplies industry, or Wal-Mart in the retail industry. On the arrowban )public In- IC /4 ternet, however, the cost to connect is relatively low and the technologies required to participate are not proprietary.22 Switching costs are, therefore, substantially re- duced. For example, the cost to a customer of switching from shopping at Ama- zon.com to shopping at the Barnes & Noble online store is merely a few keystrokes of effort. Easy switching makes for easy price comparisons, which suggests that over time it will be difficult to achieve strong customer loyalty.
While there appears to be a certain inevitability to this logic, savvy executives, for example, Scott Cook at Intuit, have identified ways to exploit the power of the Inter-
I net to increase, rather than decrease, switching costs. Launched in 1983, Intuit pro- vided low-cost financial services software (Quicken, TurboTax, and QuickBooks) de-
1 signed to be easy to use by individuals with little on no background in finance or 1
"lt is important to note that over the next few years, switching costs for broadband Internet channels are expected to be much higher than those associated with the narrowband, public Internet.

40 Module One Building !he Network Economy: Markets and Models
technology. Initially, the products "hooked" the user by providing a much simpler and easier way to complete time-consuming and repetitive tasks. By also providing a sim- ple way to store personal information, which would have to be reentered if a customer switched to a different product, the company kept users hooked over time. Intuit quickly became the market leader for individual and small business financial software, with over 80 percent market share across its product line and over 90 percent retention rates. The company continues to maintain this position despite aggressive competition from Microsoft.
A decade after lilunching its first software product, the company launched an on- line financial services portal, Quicken.com, to complement and extend its packaged software offerings. By linking its Internet business to the company's traditional desktop software, Intuit has been able to transition users from its desktop product line to its Internet product line while also offering an even easier to use and more useful set of services. By 2001, consumers and small business owners could pay bills and bank online, calculate and pay taxes, and manage a portfolio of invest- , ments. Small business owners also could manage payroll, inventory, and customer accounts and purchase supplies. As these features were added to the service and as customers gained from their value and convenience, switching became more diffi- cult. Changing an online bill-paying service, for example, involved setting up rela- tionships between the new online bill-paying service and each company lo be paid.
Intuit used the 1e:ssons learned from its successful software business to guide the I
launch and evolution of its Internet business. Careful attention was paid to creating a service offering that provided a unique value proposition for customers and then "hooked" them to the company by providing a simple and easy-to-use way to com- plete time-consumnng and repetitive tasks. Once users invested the effort to store personal information and set up onlii~e transaction relationships, it became much harder to switch. Using these principles, within less than one year of launch, Intuit's online version of its TurboTax software gained over 80 percent market share in the highly competitive market for online lax preparation and filing.
Can IT Add Value to Existing Products and Services or Create New Ones? In addition to lowering cost, improving quality, and changing power dynamics, IT can add value to existing products or services and create new ones. For example, grocery stores used to be in the business of selling packaged goods and fresh food, but now they are al!jo in the business of selling information. Many market research firms purchase scanner data on consumer shopping behavior from large super- market chains, analyze the data, and then sell information back to the supermar- kets along with aggregate competitor: industry, and demographic data from a wide variety of sources.
The information content of existing products has also increased markedly. Many are unaware that b]. 2000 there were more computer chips in a late-model car than there had been in the entire U.S. National Defense Department in 1960. Not only do these chips control everything from internal air temperature to the braking system,

Chapter 1 Creatrng Business Advantage with IT 41
they also provide valuable information to service mechanics and auto manufactur- ers to guide after-sales service and future product design.
Information technologies can alter or even completely transform a product from an analog to a digital form. Products particularly well-suited to digitization include books, magazines, and other printed materials, such as music, video, and games. Over the last two years, established firms such as Sony and Bertelsmann, Internet start-ups such as ~ e a l ~ e t w o r k s ~ ~ and Amazon.com's e-books, and new coalitions of firms such as MusicNet and Duet have suggested that digital distribution of books, music, and video will dramatically alter existing publishing and entertainment i ndu~ t r i e s .~~
Summary Exploiting the opportunities afforded by IT in the 21st century while avoiding the pit- falls requires vision, sound execution, and the ability to respond quickly. It also requires imagination and a little luck. This chapter has presented frameworks for analyzing the impact of IT on the core operations and core strategy of a firm. Executives are encour- aged to ask five key questions as they assess potential strategic uses of IT: (1) Can we use IT to reengineer key value activities ?nd change the basis of competition? (2) Can we use IT to change the nature of relationships and the balance of power among buy- ers, suppliers, business partners, and competitors? (3) Can we use IT to build or reduce barriers to entry? (4) Can we use IT to increase or decrease switching costs? (5) Can we use IT to add value to existing products and services or create new ones?
An understanding of strategic opportunities must be combined with an under- standing of strategic risks. Risks increase when executives (1) have a poor under- standing of sources of competitive dynamics in the industry within which their firm competes, (2) fail to fully understand the long-term implications of a strategic sys- tem that they have launched or one launched by a competitor or another industry participant, (3) launch a system that brings on litigation or regulation to the detri- ment of the innovator, and (4) fail to account for the time, effort, and cost required to ensure user adoption, assimilation, and effective utilization.
When an organization invests in a new technology, it is important to assess can- didly whether the investment will result in a sustainable advantage or will simply maintain the current industry and competitive dynamics at an increased level of cost. Finally, the movement of IT personnel between firms often results in rapid prolifer- ation of strategic ideas. This can put the pioneering firm under pressure to keep in- novating and evolving the IT-enabled strategy. The following questions can be used by executives to assess IT-enabled business opportunities and risks:
2 3 ~ . M. Applegate, RealNetworks: Converging TechnologieslExpanding Opportunities (HBS Publishing) (Order No. 399-025). 240n April 2, 2001, AOL Time Warner, Bertelsmann, EM1 Group, and RealNetworks announced the formation of MusicNet, a joint venture that would create a "break- through platform" for an online music subscription service. On April 6, 2001, Yahoo! announced a nonexclusive partnership arrangement with Sony and Universal to make those companies' Duet online music service available through Yahoo!. See M. Cavallaro, "Yahoo and Duet: Deja Vu All Over Again," The Standard (www.thestandard.com), April 6, 2001.
Davood
Highlight
Davood
Highlight
Davood
Highlight
Davood
Highlight
Davood
Highlight

42 Module One Building the Network Economy: Markets and Models
1. What business are we in? Who are our customers, suppliers, and business part- ners? What value do we provide to these key constituencies (including employ- ees and owners)? What are the competitive dynamics and balance of power within the industry? Can IT be used to create value and change the basis of competition?
2. Who are our biggest competitors today? Who will they be in the future? How easy (or difficult) is it for new players to enter our markets, offering a unique value proposition and'or substitute products and services? How easy (or difficult) would it be for customers, suppliers, or partners to switch?
3. How efficient anid effective are our core operating activities and processes? How easy (or difficuh) is it for customers, suppliers, and partners to do business with us? How easy (or difficult) is it for employees to exceed performance standards and continuously improve our products and services and the way we do business?
4. Are there any big changes looming on the horizon? Are we in a position to capi- talize on these changes? Do we want to lead the industry or be a fast follower?
5. Will changes in related industries (or even in unrelated industries) influence our industry? Can we not only enhance what we do today but also expand into new products or markets and extend into new businesses?
6. Have we accurately identified the strategic risks the organization faces today and in the future? Do we have the systems and processes in place to manage risks?
7. Have we appropriately prioritized our business investments? Does our planning and budgeting process enable us to identify and effectively respond to strategic opportunities and threats?

Crafting Business
Some of the best innovations involve a paradigm shift, a real mental change of assumptions and certainties. In fact, the process of innovating and entre- preneuring is much less about invention or new ideas. It's much more about rethinking and questioning the assumptions people already make . . . The ability to rethink fundamental assumptions and take what people accept as certain and question it [is the central] talent of being a great entrepreneur.'
Few would dispute the fact that the rapid technological advancements of the sec- ond half of the 20th century have spawned dramatic worldwide socioeconomic changes. By the mid-1990s, a new economic paradigm was emerging that many called the Network Economy. Its promise caused established firms to embark upon business transformation designed to shed the static, rigid structures, processes, and mind-sets that remained as a legacy of the Industrial Economy. Today, as we stand at the gateway to a new millennium, the Internet and its associated tech- nologies form the foundation on which new businesses are being built. Initially, entrepreneurs and executives in established firms approached the Internet in much the same way that fortune seekers of the 1800s prospected for gold. Although there are still frontiers to explore, the "gold rush" mentality has given way to a search for frameworks and analytic tools to guide us in building successful-and sus- tainable-Network Economy businesses. I
his chapter is adapted from papers and materials from Professor Applegate's course entitled Building Businesses in a Networked Economy. '~cot t Cook, founder of Intuit Inc., address . to . executives, September 15, 1998.
43

44 Module One Building the Network Econotny: Markets and Models
This chapter analyzes how emerging Network Economy business models are rev- olutionizing the conduct of business around the world. Portals, aggregators, ex- changes, and marketplaces are only a few of the models examined hS%?Tlie'in-depth analysis provides the foundation for a discussion of business strategy, capabilities, value creation, and business model evolution in a number of companies, including a long-established firm-American Express-and a more recently launched inde- pendent Internet venture-Amazon.com.
Business Models: Something Old and Something New
If there is one lesson we can learn from continuing evolution of work and competi- tion in the new economy, it's this . . . Change the question and you change the game . . . The old cluestion was "What business am I in?" The new question is "What is my business m ~ d e l ? " ~
Why is a focus on business models so important today? If you think about it, we spent nearly a century building and perfecting Industrial Economy models that de- fined how companies conducted business through most of the 1900s. As a result, we knew what it meant if someone said, "I sell insurance" or "I sell cars." We had de- veloped a shorthand way of describing how a business was structured, what types of people were needed and what roles they filled. That shorthand told us how our com- pany interacted with others in the industry and, most important, how it made money and delivered value to customers, suppliers, partners, employees, and owners. It also told everyone who did business with us what to expect. The Industrial Economy business models became so familiar that they no longer required explanation.
In contrast, emerging networked technologies enable us to create new business models and redefine existing ones. Technology can provide a flexible channel for procuring and distributing products artd services as well as the tools to create and package content in all its many forms, including data, voice, and video. This highly interactive and engaging channel offers new opportunities and enables the develop- ment of new capabilities that were difficult to achieve before the commercialization of the Internet. Figure 2.1 shows the building blocks of a business model and the re- lationships among them. These components link to the financial model of an organ- ization (see Figure 2.2). Appendix 2A summarizes revenue, cost, and asset options.
As you review the business model framework, it is important to recognize that the components and relationships depicted here are not new. Indeed, this basic approach has been used for decades to analyze a wide variety of Industrial Economy business models. What is new are the business rules and assumptions that form the mental models that guide how we make decisions and take actions. As we define new mod- els, we do not immediately throw out the old ones. In fact, the best inventions lever- age old paradigms, relaxing assumptions to define new models that are familiar yet decidedly superior to the old ones.4
3 ~ . Slywotsky and D. Morrison, Profit Patterns (New York: New York Times Business, 1999). 4 ~ . Kuhn, The Structure of Scientific Revolution (Chicago: University of Chicago Press, 1970).

FIGURE 2.1 Business Model Components
--
An organizat~on's business concept defines its strategy. The concept is based on analysis of:
Market opportunity Product and services offered Competitive dynamics Strategy for capturing a dominant position Strategic options for evolving the business
Attract a large and loyal community? Deliver value to all community members? Price our product to achieve rapid adoption? Become #I or #2? Erect barriers to entry? Evolve the business to "cash in on strategic options?" Generate multiple revenue streams?
*.Manage risk and growth?
An organization's capabilities define re- sources needed to execute strategy. Capabil- ities are built and delivered through its:
People and partners Organization and culture operations Marketinglsales Leadershiphlanagement process Business developmentnnnovation process InfrastmcturelAsset efficiency
Achieve best-in-class operating performance? Develop modular, scalable. and flexible infrastructure? Build and manage strong partnerships with employees .and the community? Increase the lifetime value of all members of the community? Build, nurture, and exploit knowledge assets? Make informed decisions and take actions that increase value? Organize for action and agility?
A high-performing organization returns value to all stakeholders. This value is measured by:
Benefits returned to stakeholders Benefits returned to the firm and its owners Market share and performance Brand and reputation Financial performance
Deliver value to all stakeholders? Claim value from stakeholder relationships and transactions? Increase market share and drive new revenues off existing customers? Increase brand value and reputation? Generate confidence and trust? Ensure strong growth in earnings? Generate positive equity cash flow? Increase stock price and market value?

46 Module One Building the Network Ecc~nomy: Markets and Models
FIGURE 2.2 Linking Strategy to Value
Classifying ~ u s i n e s s Models
Consumers are looking for the ability to bundle the products they want in a fashion unique to each indlividual, and the Web will provide this capability . . . We believe that vertical portal3 will do the best job of providing the consumer empowerment that the Internetmakes possible . . . Not only will vertical portals have a profound effect on traditional distribution networks, but in information industries like financial services, they may also pose a threat to specialty [producers] that choose to downplay the significance of the Internet channel.'
For decades, executives have used the value chain framework discussed in Chapter 1 to describe the set of activities through which a product or service is created and delivered to customer^.^ These customers may be either individuals or businesses willi~.ig to pay for a product, service; or solution. In selling to business
5 ~ . ~ . lnternet and Financial Services Equity Research Team, "The lnternet and Financial Services," Morgan Stanley Dean Witter, August 1999. 6 ~ . Porter, Competitive Advantage: Creating and Sustaining Superior Performance (New York: Free Press,, 1985).

Chapter 2 Crafting Business Models 47 I customers, individual consumers-the actual end users-are often located inside the customer firm. Often this fact creates a two-stage adoption cycle: First the business must decide to purchase a product or service, and then individuals must decide to use it.
There are two key value chain roles that market participants may assume. Pro- ducers design and build products and services that meet specific customer or mar- ket needs. They may sell, service, and support the product or may leave selling and maintaining to others within an industry or outside traditional industry boundaries. Sometimes producers function as suppliers, selling parts, components, or services to other businesses. Alternatively, producers may sell finished equipment or solu- tions to business users or consumers, in which case they sometimes are called orig- inal equipment manufacturers (OEMs).
The second key value chain role is that of a distributor: Distributors enable buy- ers and sellers to connect, communicate, and transact business. Distributors may as- sume control of inventory and resell a product, solution, or service (retailers, whole- salers). Or they may simply act as agents, connecting buyers and suppliers but not assuming control of inventory (aggregators, marketplaces, and exchanges).
A company need not confine itself to operating within a specific role. A vertically integrated industry structure results when a single player adopts multiple roles within an industry.
Although networked business models adopt the same basic roles, the classifica- tion framework presented here extends producer and distributor roles in some im- portant ways (see Figure 2.3).
First, the framework distinguishes between the networked business models for companies that do business on the Internet and associated networks. We then dis- cuss businesses that provide the networked infrastructure. While these two classes of models are separated for simplicity, we recognize that the lines between them are becoming increasingly blurred. For example, Microsoft used to be solely in the business of delivering technology infrastructure. Today it is also a consumer por- tal and,an online fiiiancial services provider; at one time it was even an online travel service.
The networked business model framework also distinguishes between focused distributors and portals. While both can be classified as distributors, the business
\
model for online focused distributors is much like the business model of offline dis- tributors. Portals, in contrast, serve as gateways offering access to a broad array of content, products, services, and solutions through online or multichannel distribu- tion networks. For example, as an independent company, InsWeb is a focused dis- tributor for the insurance industry. InsWeb also operates as the insurance distributor within the Yahoo! Finance vertical portal.
Because companies gained the most far-reaching economic benefits of the Inter- net and its associated technologies by connecting with customers, suppliers, and business partners, many of the earliest networked business models redefined the roles of distributors, including focused distributors and portals. As a result, we be- gin with a discussion of focused distributors and portals before moving on to pro- ducer models.

48 Module One Building the Network Economy: Markets and Models
FIGURE 2.3 Classifying Network Business Models
Create and package products, I ~ n a b l e buyers and sellers to c o n n e c t , A services, and solution:; communicate, and transact business
- - - - - - - - - - - - - - - - - - - - - - - - - - - - - - - - - - - - - - - - - - - - - - - - - . . - - - - - - -
Create and package Enable technology Enable consumers and ~echnology-based products, buyer and sellers to businesses to access onlint
services, and solutions transact business services and information
Businesses Built on a Networked Infrastructure
Focused Distributors Focused distributors provide products and services related to a specific industry or market niche. For example, in 2000, InsWeb and E-Loan operated as focused dis- tributors offering products and services within the financial services industry and Staples.com was a focused distributor for office products and supplies. The five types of focused-dissbutor business models-retailers, marketplaces, aggregators,
/' exchanges, and infc~mediaries-are differentiated from each other by the following -- --- -, characteristiJs-(see Table 2.1):
Does the business assume control of inveiitory?
Does the bu'siness sell online?
Is the price set outside the market, or is online price negotiation and bidding permitted?
Is there a physicill product or service that must be distributed?
Retailers such as ToysRus.com and Staples.com assume control of inventory, set a nonnegotiable price to the consumer, and sell physical products online.' The pri- mary revenue model is based on product/service sales, and the cost model includes procurement, inventory management, order fulfillment, and customer service (in- cluding returns). Because e-retailers assume control of physical goods, their ratio of
'See M. Collura and I.. M. Applegate, Amazon.com: Exploiting the Value o f a Digital Business Infrastructure (HBS Publishing) (No. 800-330), for a more detailed analysis of the evolution of the online retailer business model.

L TABLE 2.1 Focused Distributor Business Models
1 i Model Differentiators
& .=* : - s
Price " physical I Model and Own a Sell , Set Product . 1 ~xamples lnvlntory Online Online or service
! Retailer - C*
1 ToysRus.com Yes No ! Sta~les.com i I 1 8 9 ' = i =
9 i / ~ = r k e t ~ i a c e 1 Eloan.com ,+ .; Possibly Yes No *,No i InsWeb.com A
I 1 Pa .== ' * a " +
1 Aggregator :~~utoweb.com 2- -* No - No No B P ~ ~ ~ i b l y
I 3 + w4" i" -
i Infomediary $ Internet Securities **. No": Yes Yes -NO n
4
Likely ' Revenues
" 1:
Product/service sales
Transaction fees; service fees; commissions -
Referral fees; advertising and marketing fees
Subscription fees;- advertising fees
4 % r ~ d v e r t i s i n ~ and marketing; physical facileies; inventory and customer service; R&D; Iginfrastructure ;
" s
Advertisingland marketing; . R&D; IT infrastructure
?aa " 9
Advertising and marketing; R&D; IT infrastructure; content aquisition
Exchange eBay.com a Possibly Possibly ~ Yes- Possibly Depends on Advertising and marketing; Freemarket.com model staff support for auctions " %:
a + (especially BZB); inventory and logistics if inventory control; R&D; technical infrastructure
Focused distributor business model trends" a a@6. isn a
Focused distdhutors that do not allow customers and the busin&s community t o transact business online are losing power. Aggregators are evolving into marketplaces and/or vertical portals. "- -3 -# . Multiple business models are required t o ensure flexibility and sustainability. Focused distributors are aligning closely with vertical and horizovtal portals or are evolving their model t o become
c . vertical portals. *

50 Module One Building the Network Economy: Markets and Models
tangible to intangible assets often is much higher than that which would be found in a firm that does not assume control of physical inventory.
Marketplaces such as E-Loan and Insweb sell products and services--loans and insurance, respectivelys-but do not take control of physical inventory. They do, how- ever, sell products with a nonnegotiable price and complete sales online. Their revenue model is based on a commission or transaction fee on each sale. Because sales trans- actions take place online, e-marketplaces often electronically link to supplier data- bases and transaction systems to ensure that transactions can be completed and rev- enue can be recognized. This is reflected in the cost model; for example, in 2001 it took a team of information technology (IT) professionals up to two months to integrate Ins- Web's transaction systems and databases with those of its insurance carrier partners.9 Because marketplace companies do not assume control of physical inventory, pro- curement and inventory management costs often are lower than those of retailers.
Aggregators such as ~utoweb" provide information on products or services for sale by-others in the channel. While a comparison of features and pricing is often provided, aggregators do not enable buyers and sellers to complete the final trans- action. Therefore, the revenue model for these sites often is based on referral fees and advertising. Because transactions are not completed online, some aggregators, especially aggregators of physical products and services, find that consumers use the site to comparison shop but then go offline to make the purchase. As a result, ag- gregators-may not he able to claim referral fees, which makes them highly depend- ent on advertising and other supplemental revenue sources.
Infomediaries such as Internet securities1 ' are a type of aggregator that unites sell- ers and buyers of in,formation-based products, such as news, weather, sports, and fi- nancial information. Because no physical product is involved, the transaction can be completed online. Infomediaries, especially those that cater to business professionals, may charge individual users a subscription fee for the service. Business-to-business (B2B) infomediaries often charge a company a corporate subscription fee. Business-to- consumer (B2C) infomediaries may provide the information service free to consumers and make money h m advertising revenues collected fi-om sponsors or affihates.
Because information is available elsewhere and the cost of packaging and deliver- ing the information is relatively low, barriers to entry also may be low. As a result, in-
'see L. M. Applegate, Quickenlnsurance: The Race to Click and Close (HBS Publishing) (No. 800-295), for a n~ore detailed analysis of the evolution of the online marl;etplace business model. he decision to provide system integration services and to host the online insurance quoting, application, and sales transaction systems for carriers has enabled Insweb to add two digital infrastructure provider models-application service provider (ASP) and system integrator and developer-which are discussed later in this chapter. These two models provide new revenue streams: IT consulting and development fees and ongoing hosting and maintenance fees. They also change the cost and asset models. ''A portion of the AwtoWeb website enables dealers and consumers to auction cars. As a result, AutoWeb has adopted a hybrid business model that combines an aggregator model and an exchange model. "see L. M. Applegate, Internet Securities: Building a Business in Internet Time (HBS Publishing) (No. 398-007). for a more detailed analysis of the infomediary business model.

Chapter 2 Crafting Business Models 51 1
fomediaries must do more than simply broker information. Some choose to develop unique value-added content and analytic tools; others extend their businesses by in- corporating new models. Within the limits of privacy, ethics, and regulation, infome- diaries must also leverage the economic value of the information they collect about market and how they do business. Over time, these intangible information Assets become a major source of strategic differentiation and sustainability. 1
Exchanges such as eBay and FreeMarket may or may not take control of inven- tory-the tendency is to try to avoid assuming inventory carrying costs whenever feasible-and may or may not complete the final sales transaction online. The key differentiating feature of this model is that the price is not set; it is negotiated by the buyer and the seller at the time of the sale. The revenue, cost, and asset models vary depending-on whether the online exchange assumes control of inventory and com- pletes the transaction. B2B a;ction exchanges such as FreeMarket charge transac- tion fees and supplement revenues with fees for consulting services. B2C and con- sumer-to-consumer (C2C) exchanges often supplement transaction revenues with advertising revenues.
Portals The American Heritage Dictionary of the English Language defines the term portal as "a doorway or gate-specially one that is large and imposing."12 To many, this def- inition seems a fitting description of the portal business model that has emerged on the Web. Although the terminology is rather recent, the earliest online business portals (for example, American Hospital Supply's ASAP and American Airlines' Sabre) were first launched in the late 1960s and 1970s.13 Online consumer portals (fir example, Amer- ica Online and CompuServe) emerged in the 1980s with the adoption of the personal computer. Built upon proprietary technology, these pre-Internet portals provided lim- ited access. In fact, in late 1993, AOCs proprietary consumer portal had only 500,000 members. By mid-2001, the number had grown to over 30 million.I4 Three types of portal business models-horizontal, vertical, and affinity portals-are differentiated from each other by the following characteristics (see Table 2.2):
Does the business provide gateway access to a full range of online information and services, including search, calendar, e-mail, instant messaging, chat, and other community-building tools?
Does the business provide access to deep content, products, and services within a vertical industry (e.g., financial services, travel)?
Does the business provide information and services for all types of users, or are the information and services specific to a well-defined affiliation group (e.g., women, people selling or buying a home).
12~merican Heritage Dictionary of the English Language (Boston: Houghton Mifflin, 1971). 13see L. M. Applegate, F. W. McFarlan, and J. L. McKenney, "Electronic Commerce: Trends and Opportunities," in Corporate Information Systems Management (New York: McGraw-Hill Irwin, 1999). 14visit the AOL Time ~ a r n e r ' c o ~ m ~ a n ~ website (www.aoltimewarner.com) to examine a timeline of events in the evolut~on of the AOL Time Warner family of companies.

TABLE 2.2 Portal Business Models
Model Differentiators
Deep Affinity I Model and Gateway Content and Group
Examples Access Solutions Focus Likely Revenues Likely Costs
I Horizontal portals ; AOL.com Yes Possibly; often Possibly; often Advertising, affiliation Advertising, marketing I Yahoo.com through part- through and $?tting)fees; and sales; content/ ' Quicken.com nerships with partnerships possib~u6scription information asset ' Small Business vertical and or access fees management; R&D;
affinity portais IT infrastructure
Vertical portals .
WebMD.com Limited Yes No Transaction fees; Advertising, marketing, Covisint.com commissions; advertising, and sales; content1
I affiliation, and slotting information asset fees management; R&D; IT
infrastructure; fegacyl \z system integrattm to
support transactions
Affinity portals Realtor.com Possibly Focused on Yes Referral fees; Advertising, marketing, iVillage.com affinity group advertising, affiliation, and sales; content/
and slotting fees information asset management; R&D; IT
i I
infrastructure
Portal business model trends Horizontal and vertical portals are emerging as dominant sources of power within consumer and business markets. Horizontal portals are joining forces with horizontal infrastructure portals to provide not just access to content and services but also access to network and hosting services. 1 arge m e d l and entertainment pertals that represent thc convcrgcncc of data, telephone, television, and rddio networks are emerging in the consumer space. These portals unite content development, packaging, and distribution
/ components of the value chain. I B2B portals provide both horizontal access to business networks and vertical industrywide solutions.

Chapter 2 Crafring Business Models 53
Horizontalportals such as AOL.com, Yahoo!, and Quicken.com Small Business provide gateway access to the Internet's vast store of content and services. They also provide a broad rarige of tools for locating information and websites, communicating with others, and developing online communities of interest. Like the broadcast net- works on which they were modeled, pure-play horizontal portals such as Yahoo! ini- tially depended on advertising as the primary revenue source. Development, mainte- nance, and operation of infrastructure and content were the primary costs. But the "pure-play" horizontal portal model proved hard to sustain. As a result, Yahoo! and others have extended their models to include multiple vertical solution "channels" in an attempt to derive increasing revenues from transaction fees. In addition, horizontal portals that do not provide Internet access often form strategic alliances with dial-up and broadband Internet service providers (ISPs) to enable revenue sharing on access fees.I5 Reflecting its heritage as a proprietary online information provider, AOL.com operated as both a content portal and a network service provider before the Internet and maintained that model when it launched its Internet service in 1995. By 2000, AOL was generating approximately 70 percent of its $6.9 billion in revenue from sub- scription and access fees.16 It also generated revenues from advertising (29 percent of ,
2000 revenues) and, with its purchase of Netscape, from software licensing, sales, and , maintenancelintegration fees (7.3 percent of 2000 revenues).
Vertical portals such as Covisint in the automobile industry and WebMD in the health-care industry provide deep content; a place to conduct business, learn, and shop; and communications and community-building tools. Like other networked busi- nesses, vertical portals are often composed of a variety of business models, all of which generate separate revenue streams. The business models adopted by the verti- cal portal determine its revenue and cost models. For example, if the vertical portal does not allow individuals to complete transactions, revenues will be generated pri- marily through advertising and referral fees. However, if transactions are completed online, sales revenues, service fees, or transaction fees may be generated. Additionally, if the port@ includes unique content, subscription revenues inay be generated.
Affini@portals provide deep content, commerce, and community features such ' as those found in a vertical portal, but these offerings are targeted toward a specific
market segment. Some, such as iVillage.com, are targeted toward a specific gender. Others, such as Realtor.com, are targeted toward a specific event, in this case, sell- ing or buying a home. As with other vertical portals, the revenue, cost, and asset models are based on the business models adopted by the portal.
Producers 'producers design and make and also may directly market, sell, and'distribute prod- ucts, services, and solutions. Since the key technologies that created economic wealth in the Industrial Economy were production technologies, producers often
150n November 14, 2001, Yahoo! announced that it had entered into a strategic alliance with SBC Communications to develop a cobranded high-speed Digital Subscriber Line (DSL) broadband Internet service. See Yahoo! press release, November 14, 2001 (www.yahoo.com). '=AOL annual report, 2000.

54 Module One Building the Network Economy: Markets and Models
held the position of power in traditional business markets." In contrast, the Internet and associated networked technologies of the Network Economy create wealth by connecting buyers and suppliers. Given these basic economic facts, many believed that distributors would become the dominant players in the Network: Economy. While gaining colitrol of distribution channels remains a key success factor in the 21 st century, producers in a variety of industries have taken steps to reestablish po- sitions of power. 111 some instances, producers are forming coalitions to tlevelop on- linelomine supply or distribution channels to market. Examples of producer coali- tions include Covisint in the automobile industry and Global Healthcare Exchange in the health-care industry. In others, vertically integrated megacorporations such as AOL Time Warner are uniting producers and distributors within the same firm. The six categories of producer business model-manufacturer, service provider, educa- tor, adviser, information and news se:rvice, and producer portal-are differentiated from each other by the following characteristics (see Table 2.3):
Does the busint:ss sell physical products and/or provide face-to-face services?
Does the business sell inforination-based products and/or services?
Does the:business provide customized products and/or services?
Manufacturers such as Ford Motor Company and Procter & Gamble design, pro- duce, and distribute physical producrs. Manufacturers include component or parts manufacturers that serve as suppliers to an industry and OEMs that produce finished goods. Given the physical nature of the product, the primary effect of the Internet and the associated networked technologies has been to streamline, integrate, coordinate, and control physical channels of production and distribution. These IT-enab led process redesign efforts often begin inside the firm and then extend to connect customers, sup- pliers, and partners.
Sewiceproviders such as American Express and Singapore Airlines offer a wide range of service offerings that may be delivered through multiple channels. Like manufacturers of physical products, service providers that offer physical services (e.g., car rental agencies, restaurants) often use IT to streamline, integrate, coordi- nate, and control service delivery and to connect and share information with cus- tomers, suppliers, and partners. Service providers that offer primarily information- based services (e.g., financial services) can use IT to digitize service delivery.
Educators such as Harvard University and Virtual University create iind deliver online educational programs, products, and services. The ability to use the Internet and associated technologies to define new multimedia educational offeri.ngs and to customize those ofrerings to meet the learning needs of individuals and businesses is revolutionizing education. While community features of emerging networked technologies enhance interactive learning, it is widely believed that distance learn- ing will never totally replace face-to-face education.
171t i s important to note that communications technologies (for example, the telephone and telegraph) and distribution technologies (for example, the.train and truck) were also key technologic:al drivers of the Industrial Economy.

scription fee 4 >- Z bii -.. -a* IB .,*L -- . a / i
(continued)
TABLE 2.3 Producer Business Models
I
a v = +S - ~i -iii = - a -*# -$, Model ~ { f f ereiitators =
Sell Sell , 1 -I . eb : & " , < "-"-" " Physical information- *
Model and Product/ Based Product/ Level o f ,
Examples a" Service - service -:y Cusfomization i. ekely @veni$s * Likely Costs C 1 Manufacturers
4
4 6
Ford Motor Yes Possibly.;: -:fq Low,sto a
fees " sales; content/ "Productsale$; servib;e :!: Advertising, marketing~and i
Company - moderate Procter & Gambje
A w +"&, .s * -** . informati~n asset manasge- * = . , e8d ." megt; R&D; IT infrastructure
Service providers ** d s I American Express Yes Possibly-:2 -2 ratesfo ~ '~ommiss ion~se~ iE6 Y ~dvertisincfi, marketing: I and 1 Singapore Airlines or transaction fees* sales; content/information
a r = - . * "li = ". ."%i* a i ip & _* , '.. * _ *:*a q; :& * + asse; management; R&?; IT g
infrastructure 1 Ed~cators ,- .:a4 -gsd . & = w4 ;3 43 A .I - 1 ~aharduniver<ity bossib$ po&ibly ~oderate'to '~e~is&atior?irevent ' Contentiiforrnationa;et . Virtual .University "..
*" "-"* high fee; subscription fee; management; R&D; IT
a* 'B *- * z ", - = 3 . "d *
7 j b = 4jhosti$g fee 2: -12 infiistruct6re 5:
Advisers MeKinsey
I 1
Yes Ye3 q3. -2 Moderate t o a Service .fee;eregistr&ion *$'e content/information asset i
Accenture high or event fee; member- management; IT
A 3, Gab dl &ship fee; commission, , , h infrastructyre ,= transaction, or suba * I

TABLE 2.3 Producer Business Models (continued)
I Model Differentiators + 1 1
Sell Sell 1 1 Physical tnformation- , Model and I
Product1 Based Product1 Level of ; Examples Senrice Service Customization Likely Revenues Likely Costs I
I Information and news services Dow Jones Yes Yes Moderate to Subscription fee; Contenffinformation asset
' Euromoney high ! commission, transaction, management; advertising, , or service fee marketing, and sales; IT ;
infrastructure 1 I
Producer portals Covisint Possibly Yes High Transaction or service Contenffinformation asset;
I Giobai Heaithcare fee; subscription or IT infrastructure and R&D; , Exchange membership fee; consult- software development
ing and integration fee; logistics hosting fee
I Producer business model trends Producers must be best in class-the number one or number two brand-to survive.
-Some large full-service producers, such as American Express and Citigroup in the financial services industry and AOL Time Warner in the entertainment and media industry, are acquiring a full range of products and services and then integrating them to provide vertical solutions required by customers. These solutions are offered through company-owned portals and also through a wide variety of distribution agreements. Industry supplier coalitions are forming to enable virtually integrated B2B commerce within and across industry groups.

Chapter 2 Crafting Business Models 57
1 Advisers such as McKinsey and Accenture provide consulting and coaching~erv-
ices to businesses and individuals. These firms have found that online c ~ n n e l s can be used to extend the nature of the relationship with customers from a one-time con- sulting-project to an'ongoing education and advisory service. Online channels can be used to disseminatd knowledge, connect consultants with their clients, and create
\ communities of interest. Information and nkws services such as Dow Jones and Euromoney create, pack-
age, and deliver information through both online and offline channels and across multiple media formats. Because information in all its many forms can be digitized, stored, and delivered to meet personalized needs, we see convergence among pub- lishing, television, radio, and information services industries.
Producer portals such as Covisint and Global Healthcare Exchange use the In- ternet and associated technologies to support all aspects of the production and dis- tribution process.
Businesses That Provide Networked Infrastructure
Until recently, there was a distinct separation between businesses that were built us- ing a digital technology infrastructure and businesses that primarily developed and sold the technology infrastructure, the latter of which were often referred to as the high-tech industry. As we century, digital infrastructure was be-
: coming embedded within how organizations create, produce, and distribute products and it hasbecome increlsingly difficult to clearly categorize organizations as members of the high-tech industry. David Pot- truck, co-CEO of Charles Schwab, emphasized this point:
\
[Charles Schwab] is a technology company that just happens to be in the brokerage business. Everything we think about as we run our business has technology-in the
, center of it with the goal of engineering costs down and service up . . . If you want to constantly increase service while decreasing the cost structure and the cost of .
service, then technology is the play. You have to be great at it. If we are going to be successful [against our competitors], technology will have to be built into our DNA in a way that's different."
Networked infrastructure provider business models are classified by using the same producer/distributor categories that define digital businesses built on the Internet. Once again, powerfid channel players-horizontal infrastructure portals (for example, AT&T and British Telecom) and vertical infrastructure portals (for example, IBM's E-Business Solutions and GE's Global exchange Services)-are emerging.
Infrastructure .Distributors Infrastructure distributors enable technology buyers and sellers to transact business. The four categories of infrastructure distributor-infrastructure retailers, infrastructure
resentat at ion by David Pottruck at a Harvard Business School executive program, October 22, 1999.

58 Module One Building the Network Economy: Markets and Models
marketplaces, infrastructure aggregators, and infrastructure exchanges-are differenti- ,ated by the following characteristics (see Table 2.4):
Does the business assume control of inventory?
Does the business sell online?
Is the price set outside the market, or is online price negotiation and bidding permitted? Is there a physical product or service that must be distributed?
Like their nontechnology counterparts, infrastructure retailers such as Comp- USA and Egghead assume control of inventory, set a nonnegotiable price to the con- sumer, and sell pllysical products online. Therefore, the primary revenue model often is based on product/service sales and the cost model includes procurement, in- ventory management, order fulfillment, and customer service (including returns).
Infrastructure marketplaces such as Ingram Micro and Tech Data sell computer and network hardware and software. lJnlike many low-tech counterparts, these mar- ketplaces are-often required by suppliers to take control of physical inventory and often offer custom configuration for large business customers. Given the competi- tive nature of the technology industry and the short useful life of technology prod- ucts, product pricing may be negotiated with sales representatives. Alternatively, the price may be set for the duration of a contract. The revenue model includes product sales and may include a commission or transaction fee on each sale. Because sales transactions take place online, infrastructure marketplaces must often electronically link to supplier databases and transaction systems to ensure that transactions can be completed and revenue can be recognized. This is reflected in the cost model.
Infrastructure aggregators such as Cnet.com and ZDNet provide information on high-tech products and services that are sold by others in the channel. They enable comparison of feamres and pricing and provide product reviews and technical re- ports but do not enable users to complete the final transaction.
Infrastructure exchanges such as Converge (formerly NECX) auction new and used electronic, computer, and network equipment, software, and solutions.
Infrastructure Portals Infrastructure portals provide consumers andlor businesses with access to a wide range of network, computing, and application hosting services. Before the commer- cialization of the Internet, many large firms developed and ran their own networks and data centers, often leasing telephone services and data lines from network serv- ice providers that were called common carriers or value-added network services (VANS) providers. Small to midsize businesses often bought low-endlcom puters and packaged software from local retailers, national distributors, or a networlc of value- added resellers (VARs) that also provided services such as installation, integration,
,' and help desk repair and trouble shooting. In the network era of the 2 1st century,,a new option has emerged: An mcreasing
number of small to midsize and even large organizations are choosing to "rent," rather than lease or buy, their digital infrastructure, which is hosted by an infrastructure

TABLE 2.4 Infrastructure Distributor Business Models " " .;*," % ,",";== Y " odd biff&&ntia& "' -
Physiql j - a *-A my . + qs3 mv
'" 8ze ' * ~ ~ c e s=$ h o d u d b r
Online Service Revenues * , ,t
*;a mi " * " b*e -2;s ;a ins - c ' C
Ni$ usuaily Yes ~rodu~lales:.<ervice ~ v e r t i i i n ~ and marketing5 fees physical facilities, inventory A * .;:;. and cu%tomer
siS r A* -bi
A. \$? IT infrshrua&e " == - Infrastructure - j s e
a-
* C r .>*Z 2 .% .*%, ,;<* " * + .&# a; ..* rnaiketplaces f e b ysi. lngram Micro Usu Yes ~rarisadion fe&; service Advertising and marketing; Tech Data fees; commi~si~on; R&D; I~ianfrastructure, i
* channel assembly fee
Infrastruqure v, * A - - $ nab b
a* a;*, .,q A- a 3 .:s2 + s &a + >:- @> i b
aggregatbrs " 9
*%
UNet a No No No Referral fees; Advertising and marketing; ZD,Net a,. ,a J1 advertising and* : & $R&D; 1T:infrastructure
marketing fees
Inftastru$ure - * m a = a *I .. a * .*,a .S 2: "$6 a%"
exchanges %
Converge Possibly Possibly Yes Depends on model Advertising and marketing; '," 4 "J e *, s a -is s , a - 9" -@% +es * &aff support for auctions ip.
+ (especially BZB); inventory
m * b n *.
r* I -, - 2 and logistics i f invenfory ?ontrols~&~; t~chniclal "' infrastructure
i I a .;* * * $ "3- 1nf;astructure distributor business miidel t$;nds ' - . p 'I
The speed of otisolexence of the technology, coupled with the co xity of the solution and slim margins, has forced s*massive tonso~idation in ne=Work and co~puting technology channels. For many, s_epice revenue2 are ddiving ~rofitability. , Those distributors that take ownership of invefkory are searching for inventoryl~ss, just-in-time business models. "
Distributors that have the capability for custom configuration of productsand services are gaining power. - $a 64 " A *a iP a A a s,m

60 Module One Building the Network Economy: Markets and Models
portal player. Infraistructure portals, like their business portal counterparts, may be either horizontal or vertical. They are differentiated by the following characteristics (see Table 2.5):
Does the firm provide "gateway access" to networks, data centers, or Web services?
Does the firm host, operate, and maintain networks, data centers, or Web services?
Does the firm provide access to hosted application services?
Horizontal infrastructure portals include ISPs (for example, America Online and Earthlink), network service providers (for example, AT&T, British Telecom, NTT Docomo, and Time Warner Cable), data center outsourcing providers (for example, IBM and EDS), and Web hosting service providers (for example, Digex). Horizontal infrastructure portals provide gateway access to a wide range of network, data center, and hosting.services. The revenue model includes access and mainte- nance fees, subscription services, and in some cases transaction fees. If combined with an online cont.ent business (e.g., AOL), the portal also may generate advertis- ing revenues. The key costs include data and network operations, software develop- ment and maintenance, marketing, sales, and administration.
Vertical infrastructure portals such as IBM's E-Business Solutions and General Electric's Global exchange Services may also be called ASPS. ASPS host and main- tain software applications (rather than selling or licensing them), enabling busi- nesses and individuals to log in and conduct business online. Because ASPS often operate as a business portal rather than a consumer portal, advertising is a less sig- nificant source of revenue. Instead, ASPS may generate revenues through hosting and maintenance fees, consulting fees, and system integration fees. Key costs are similar to those incurred by horizontal portals.
Infrastructure Producers Infrastructure producers design, build, market, and sell technology hardware, soft- ware, solutions, ancl services. Producers may sell and provide after-sales service di- rectly or may share this responsibility with onlineloffline channel partners, includ- ing retailers, distributors, and portals (:see Table 2.6):
Does the business manufacture computer or network components or equipment?
Does the business develop packaged software?
Does the business provide infrastructure services or consulting?
Equipmendcomponent manufacturers such as IBM, Sony, Lucent, and Intel de- sign, produce, and distribute compute:r and network hardware. Component manu- facturers such as Intel serve as suppliers to the industry, and original equipment manufacturers (OEMs) produce the computers and networks that are purchased by individuals and business customers. Cost categories are similar to those of other manufacturers of physical products, but costs are magnified by the rapid pace of ob- solescence (with correspondingly high levels of R&D cost) and the need for highly specialized, "clean'' factories.

TABLE 2.5 Infrastructure Portal Business Models
Model3 Differentiators
. "3% Intgrnet/Network Hosted s'~od=ls and eAccess and 'Applications and Examples A Hosting Solutions
.a: "s L *
Horizontal infrastru&re i "* portals % "&' ve~:* "p * / America 0"line .* w~hrough ' British Telecom
2 . " z *= partnership with / Digex "nonirifrastiuctuie
. portalsand ASPS 1.- * $ 2 -z4 e
Likely~ Revenues - ,ai. % ,*
- r .-- 4 - 4 8 r r St
. commissiy, service, &or tsnsaction fees; subscription fees;
*";hosting fe%s %
Likely Cos * ""- "" i '
R ~ D ; l~infrcktru6"re; "" advertising. marketing,
28 - =
and sales . a*
- I Yerti~lal infrastructure. b,
h* ;8% =gPi 9a' * ' =% - 1 bortals IBM E-Business Solutions Licensing fees; service Advertising, marketing, GE Global exchange >ndT€ransaction fees; and salk; contenti'
Services maintenance and information asset L~ a - *update fees; managemeng; R&p;
hosting fees IT infrastructure m i
-Infrastructure portal bus e CW *:I B- I a- v b "
Horizontal infrastructure portals (ISPs, netw-ork service providers, and Web hosting providers) are merging or-partnering with horizontal content portals to idcrease value created through intangible assets such as information;communi, and brand.
=m Horizontal content-portals such as AOL are vertically integrating withhorizijnta1fnfrastructu"re providers suchpas Time Warner Cable. (Note: Before the AOL and Time Warner merger, AOL was both a horizontal portal and a horizontal infra- - structure portal4 As Internet advertising revenues fall, horizontal portals such as%Yahoo! that do not provide other, sources of revenue are evolving their business models to include transaction-oriented services and revenue-sharing part- nerships,with infrastructure portals.+ s s*' (Cb A 9
Convergence of voice, data, and video channels and global acceptance of a common set of standards are leading to global industry conyergence at the <ontent and infrajtructure levels. asa
Aggressive pursuit of a growing market for hosted application services is legding to cckfusion as players with markedly .different business model: converge fn a common competitive space. a
T&O competing vertical infrastructure portal (ASP) models are ernergi'"g: ~ A d u c e i - ~ ~ ~ s (for example, oracle, ~iebel, SAP) 1 p~ovide-on~ e access to Internet-enabled versions of their brand-name software; distributor-ASPS (for example, US Inter- 2. / ** (networking and Jamcracker) 6ffec application fosting of many softwzre bra"nds. -

TABLE 2.6 Infrastructure Producer Business Models
I Model Differentiators
Models and Manufacture Develop Services1 I Examples Equipment Software Consulting Likely Revenues Likely Costs
I component I manufacturers / IBM Yes Possibly Possibly Product license or sales; R&D; advertising, marketing, I j Sony installation and integration and sales; production; ; Lucent fees; maintenance, update, physical facilities and infra- 1
and service fees structure; specialized ,
equipment, materials, and suppiies; iT infrastructure
I Software firms I
SAP Rarely Yes Possibly Product license or sales; R&D; advertising, marketing, Siebel installation and integration and sales; production; physical ' Oracle fees; maintenance, update, facilities and infrastructure;
! Microsoft and service fees specialized equipment, materials and supplies; IT , infrastructure I
z Custom software and integration ! service providers
i Accenture Possibly Possibly Yes Commission, service, or Access t o specialized talent; I Scient transaction fee professional development 1 1 Value-added resellers and training; travel I
infrastructure ! : services I i i i Agency.com Rarely Possibly Yes Commission, service, or content/information asset 1 Federal Express transaction fee; hosting fee management; R&D; IT
infrastructure i
Infrastructure producer business madel trends r
Many hardware and software producers were early adopters of online commerce, selling directly t o Internet-say I
customers and through online distributors. For example, in 1999, over 80 percent of Cisco's sales were through online channels, most of which was through online distribution partners.

Chapter 2 Crafting Business Models 63
Softwarefirms such as SAP, Siebel, Oracle, and Microsoft design, produce, and distribute operating system and packaged software. Operating system software, which provides the instructions that power computers and networks, often is sold with a computer system or network. Software applications sold by firms such as SAP, Siebel, and Oracle often include both transaction systems that automate a set of activities or processes (for example, inventory management, accounting, and or- der fulfillment) and database systems that enable access, storage, and packaging of information and reports. Traditionally, software was sold through direct and indirect channels and revenues came primarily from product sales. Over time, firms selling enterprise and database software developed their own consulting and integration services businesses to enable them to capture the value of the-service fees associated with customizing and installing complex packages. These service fees were often at least double the cost of the software package. More recently, software firms have shifted toward a hosted ASP business model (discussed above).
Custom software and integration service providers such as Accenture and Sci- ent provide consulting and custom system development and integration services, primarily for large firms undertaking large projects. VARs provide similar services for small to medium-size firms. Revenues come primarily from consulting and serv- ice fees. Recruiting, training, providing incentives for, and retaining highly skilled professionals represent the largest cost categories.
1 Infrastructure Service Providers Infrastructure service' providers such as Agency.com and Federal Express provide onlineloffline services to support logistics, marketing, and other shared services. Revenues are often generated through a combination of subscription fees, service fees, and transaction fees. Costs are based on the level of physical infrastructure and skilled professionals required.
The business model classification presented above provides a standard language for describing the various roles that an organization may play within increasingly networked worlds. It is important to note that there is no universally accepted stan- dard classification. As a result, executives must clarify the key features of the busi- -
ness model or models that, their organization has adopted or is adopting. It is also important to recognize that businesses are built and evolve over time. ,The next sec- tion discusses approaches to business model evolution.
I
Evolving Business Models I
Networked businesses are built by artfully combining a variety of business models. These businesses are then linked with others across multiple value chain networks to create what Frank Getman, chief executive offiqer (CEO) and president of Hous- tonstreet Exchange, refers to ,as a "web for the web."19 By incorporating multiple
i , t n 8 I
'g "~ouston~treet Exchange Weaves New-Round of Investments and Strategic Partner- ships into Its 'Web for the Web.' HoustonStreet press release, March 23, 2000.

64 Module One Building the Network Economy: Markets and Models
FIGURE 2.4 Approaches to Business Model Evolution
Enhance Add functionality or features
to current producdservrce offerings or improve
performance of existing business
Exit Exit a business or market or drop a productlservice
offering
Extend Enter new line of
business andlor add new business
models
Expand " Add new producdservice
I offerings or enter new geographic markets
business models that generate separate revenue streams from the same infrastruc- ture, a network of businesses can more efficiently use resources, more effectively meet customer needs for integrated solutions, and drive additional value from the same level of investment. When the network of businesses inside a firm is linked with a business network composed of a much larger network of businesses, an or- ganization can leverage the resources of the community to further enhance the value delivered to all the members.
The four approaches to evolving a business model that are shown in Figure 2.4 serve as a road map for evolving networked businesses. The evolution of the Amer- ican Express and Amazon.com business models provides an excellent example of these four mechanisms in action.
Evolving the American Express lnteractive Business Model American'~xpress had its roots in the: "Wild West" of the 1850s.~' The company started as the Wells Fargo Stagecoach Company and then evolved into the Pony Ex- press. Over the next 150 years, American Express continued its pioneering spirit, in- venting Travelers Cheques for the business traveler and the corporate card and the purchase card to help corporate custorners manage and control travel and other ex- penses. In 1995, the company set out to use the Internet and associated networked technologies to transform its business yet again (see Figure 2.5).
American Express (AXI) recognized the potential of the Internet and started to explore the launch of an online travel service that would complement its face-to-face
'OL. M . Applegate, American Express Interactive ( H B S Publishing) (No. 802-022).

Chapter 2 Crafting Business Models 65
FIGURE 2.5 The Idea Evolving Takes American Shape
Express Interactive: Timeline of Events
AX1 Expense AX1 Purchasing American MarketMile
Travel Management Solutions Express@Work Launched Launched Launched Launched Launched
services as early as 1995. Internal research at that time indicated that the profitabil- ity ofAXI's traditional business would continue to erode because of decreased com- missions from airlines and, the increased cost of recruiting, training, and retaining the company's 12,000 travel counselors located in offices around the world. It was expected that an online travel service would reduce-but not replace-the cost of human travel counselors and physical brick and mortar and administrative infra- structure. It also would help solve the problem of industrywide shortages of travel counselors.
In addition, while it was impossible to quantify the value of the "strategic op- tions" that could be pursued once an online channel to corporate customers was in place, all agreed that the follow-on business opportunities would be a significant component of the company's strategy in the years to come. In a stirring 1997 speech, an AX1 senior executive called on corporate customers to work with the company to transform corporate travel:
Some people think that the new Internet technologies will be harmful to the industry. Some of you have raised the question that, given our investment in the current way of doing business, why do we want to change? Well, the answer is simple. When change is inevitable, you have a choice: you can either follow or lead. And we all know that 9 times out of 10, the leader will get a disproportionate share of the gains. So we intend to lead. We know that we are better off working with you [our customers] to define the game rather than respond to someone else's standards.
Product/Sewice Enhancement
Planning for AXlT;avel-the name of the online travel service-started in sum- mer 1996. AX1 Travel Version 1 .O was officially launched in November 1997. By February 1998, 50,000 business travelers in 225 corporations were using the on- line service to book $4.8 billion in travel. Enhancements were launched in March 1998 and June 1998 to respond to customers' and travel counselors' requests. This marked the beginning of a period of continuous enhancements that continued to Feb- ruary 2001. (See Figure 2.6 for a summary of the business model and evolutionary

66 Module One Building the Network Economy: Markets and Models
FIGURE 2.6 Evolving American Express Interactive: Product/Service Enhancements
approach followed during late 1997 and early 1998.) An AX1 executive explained the benefits:
We found that AX1 Travel decreased the cost of booking a travel reservation by over 50 percent. Thirty percent of the savings come from streamlining the process before adding the Internet reservation system, and the additional 20 percent come directly from AX1 Travel. To realize the savings, we need to encourage our customers to shift at least 30 percent of their travel arrangements to AX1 Travel.
Product/Sewice Ca:tegory Expansion
The success of AX11 Travel convinced executives that they could leverage the infra- structure and capabilities built for the online travel service and expand into new product categories (:see Figure 2.7). An executive explained:
VETravel was the perfect lead product because it was built from the beginning to be a hybridqroduct. Customers could still call up on the phone to make a travel resenration >' o hey could use the computer. We've tried to make the barriers to using and adopting A X Travel very low, because we think the leverage is in getting AX1 Travel on as many desktops as possible and then launching additional products and services.
In 1998, AX1 launched Expense Management, which enabled AX1 corporate card users to integrate online expense data with internal expense managemenl and gen- eral ledger systems. Because the expense management process was automated, cor- porate clients could further reduce their administrative costs. Expense Management also encouraged greater use of the AX1 corporate card.
In May 1999, the company launched an enhanced Purchasing Solution to facili- tate corporate procurement. A 1999 AYIIErnst andYoung study found that on aver- age, firms that used manual purchasing processes spent approximately $90 to process a routine purchasing transaction, with some firms spending as much as $200 on certain transactions. In comparison, companies that used Internet-based,and other electronic procurement systems to buy supplies, combined with a pi.irchasing card for payment, spent from $4.44 to $15 per purchase. AX1 Purchasing sd~utions enabled AXI's corporate customers to capture those savings while also reducing AXI's costs for process transactions. At the same time, use of the new online serv- ice increased adoption and use of the AX1 purchasing card.

Chapter 2 Crafting Business Models 67
FIGURE 2.7 Evolving American Express Interactive: ProductlService Category Expansion
FIGURE 2.8 Evolving American Express Interactive: Business Model Extension
Business Model Extension
As corporate customers gained experience using AXI's online services, they asked for a "gateway" through which they could access travel, expense, and purchasing services and reports. The fall 1999 launch of American Express @Work, an admin- istrative services vertical portal, extended AXI's business model and provided the in- tegrated view customers demanded. Word of its availability spread quickly through the travel agent network, and within the first quarter after launch, several hundred corporate customers had asked to gain access to the portal. (This is an excellent ex- ample of "viral marketing" within a B2B e-commerce network.)
By mid-1999, customers once again were encouraging AX1 to offer new online services. This time they requested a robust, vendor-neutral one-stop shop through which buyers and sellers could conduct business. After attempting to launch a hl l- service B2B commerce portal inside AXI, the company determined that the scope of the new business justified the launch of a new company. MarketMile, a joint ven- ture with Ventro Corporation; was announced in August 2000 to provide companies online procurement solutions. In addition to equity, Ventro brought several years of experience running multiple online vertical marketplaces2' (see Figure 2.8).
* 'on January 15, 2002, Ventro changed its name to NexPrise, Inc. See M. Collura and L. Applegate, Ventro: Builder o f B2B Businesses (HBS Publishing) (No. 801-042).

68 Module One Building the Network Ecot~omy: Markets and Models
FIGURE 2.9 A Evolving American Express Interactive: An Integrated View
Summarizing AXI I?volution In late 1997, even before American Express began to evolve AXI, a senior executive commented on its evolutionary potential:
Once we have an electronic relationship, we have a great communication channel with a corporate customer. It allows us to create additional icons on our webs~te through which we can present driving directions and travel information. We can enable business travelers to make hotel, restaurant, and car service reservations, and we can even help them obtain passports. More importantly, it also allows us to offer other American Express products and services to provide a one-stop shop for expense'management, purchasing, and a wide variety of other business services. The possibilities are limitless.
Between 1997 and 2001, as AX1 gained experience in running an online busi- ness and listened to the marketplace-especially its customers-new opportuni- ties emerged, and the company capitalized on those opportunities (slee Figure 2.9).22 Early in 2002, it was clear that the opportunities would continue. For ex- ample, on February 18, 2002, IBM and MarketMile announced an ii 11' iance-
. E-Business on Demand-designed to help customers quickly reap the benefits of ' 7
e-procurement-and manage indirect expense spending via the 1nterne1.~~ Under the terms of the agreement, MarketMjle would provide new applications and a net- work of over 60 srr~all to midsize suppliers for use on IBM's Leveraged Procure- ment Service.
Evolving the Amazon.com Business Model The American Express story shows how an established company launched its first online product and then evolved it and its business model over time. Amazon.com
2 2 ~ t the time of the writing of this book, American Express Interactive had made no public announcements of exits from a product/service category or business. * 3 ~ . n february 25, 2002, American Express and IBM announced a technology services seven-year alliance worth more than $4 billion. Under the terms of the agreement, IBM would provide Amerlcan Express with "utility-like" access to its vast computing resources. At the time of the agreement, IBM's computing operations were available in over 200 countries around the world and processed over 1 billion transactions daily (see American Express press release, February 25, 2002).

Chapter 2 Crafting Business Models 69
FIGURE 2.10 New Categories Auctions & living.com Amazon.com ToysRus.com
Evolving Launched & Commerce Network Declares Launched Partnership 1 Amazon.com Entered Europe Launched Bankruptcy
FIGURE 2.1 1 Evolving Amazon.com: ProductlSewice Enhancements
followed a similar pattern, launching its initial online bookstore in 1995, which then evolved to a full-service, horizontal portal and ASP (see Figure 2.10).
Product/Sewice Enhancement
From the moment it launched its online bookstore, Amazon.com immediately began enhancing its product/service offering and e-retailing capabilities (see Figure 2.11). It added new features, such as 1-Click shopping (which was later patented), sophis- ticated personalization, wish lists, and greeting cards. In 1999, it was one of the first online retailers to enable shopping through wireless devices.
Product/Sewice Category Expansion
Beginning in 1998, Amazon.com began aggressively expanding into new product categories (see Figure 2.12). It launched rrmsic and DVDIvideo in mid-1998, be- coming the number one online music store within the first quarter of the launch and the number one DVDIvideo store within six weeks. Arnazon.com also expanded in- ternationally, acquiring British and German online bookstores to enter Europe in fall 1998. By early 2000, the company was not just an online bookstore but an online su- perstore, selling seven categories of products, from books, music, and videos to home furnishing, in over 160 countries.

70 ' Module One Building the Network Economy: Markets and Models
FIGURE 2.12 Evolving Amazon.com: Category and Geographic Expansion .
FIGURE 2.13 Evolving Amazon.com: Business Model Extension
Business Model Extension In 1998, Amazon:com e~tended its business model by launching'two online auc- tion stores-one low end and one high-end-and an online marketplace for small - merchants ( c a l l e d . z ~ - h o ~ s ) ~ ~ (see Figure 2.13). In early 2000, Amazon.com ex- tended its model once again, entering into a number of equity partnerships with brand-name online retailers such as Drugstore.com (health and beauty), Della.com (wedding and gift registry), Ashford.com ('jewelry, watches, and gifts), furniture (living.com), and automobiles (Greenlight.com). It was estimated that these equity partnerships, which Arrtazon.com executives called its Commerce Network, would generate $1 billion in co-marketing revenues by 2 0 0 5 . ~ ~
Exit Before summer 2000, the majority of ,4mazon.com's partnerships were with newly launched dot-coms that had yet to generate earnings.26 With the bursting of the
240ver 100 small merchants could "rent" space in Amazon.com zShops. As of late 1999, zShop merchants paid the company $9.99 a month to open a web store, selling up to 3,000 items, or 8.10 per individual item. In addition, the merchants paid Amazon a transaction fee of 5 percent for items priced less than $25, 2.5 percent for itenis worth $29 to $999, and 1.25 percent for items aver $1,000. 2 5 ~ . Becker, "Amazon.com," Salomon Smith Barney Research, December 8, 1999. 26~riday, April 14, ZOCOO, ended a week of major downslides for both technology and blue-chip stocks. The Nasdaq Composite tumbled 355.46 points (9.7 percent) and closed at 3321.32 (its largest one-day point decline and second-largest percentage drop since

Chapter 2 Crafting Business M o d e 71
dot-com bubble in spring 2000, the alliances faltered. On August 30, 2000, Ama- zon.com partner 1iving.com filed for Chapter 1 1 bankruptcy. Shortly thereafter, liv- ing.com executives,announced their intention to seek an outright liquidation. Rather than find another partner, Amazon.com shut the doors of its Home Living online store and exited the product category. The company immediately informed its cus- tomers that their orders would be honored by other online retailers and redesigned its website to remove the "Home Living" tab. Anticipating the need for flexibility in the future, the new Amazon.com look downplayed the product categories offered on the site.
Evolution Continues
1n ~ h ~ u s t 2000, Arnazon.com extended its model again with the announcement of a strategic alliance with ToysRus.com to create and operate a co-branded toy and video game store, which was launched in fall 2000.~' With this move, Amazon.com adopted both marketplace and ASP business models. Under the terms of the 10-year agreement, ToysRus.com, in collaboration with its majority shareholder, Toys "R" Us, Inc., agreed to identify, buy, and manage inventory; Amazon.com handled site development, order fulfillment, and customer service. Adopting a business model similar to that of Federal Express, Amazon also managed ToysRus.com's inventory in its U.S. distribution centers. The agreement allowed for global expansion of the arrangement. Amazon.com was compensated through a combination of periodic fixed payments, per-unit transaction fees, and a "single-digit" percentage of rev- enue. Amazon.com also, received warrants entitling it to acquire 5 percent of Toys- Rus.com. All the parties, including T O ~ S "R" Us, Inc., marketed the co-branded store to their respective customers (see Figure 2: 14).
FIGURE 2.14 Evolving Amazon.com: An Integrated View
i t s inception in 1971). Amazon.com (stock symbol AMZN) was listed on Nasdaq. The Dow Jones Industrial Average slipped 616.23 points (5.6 percent) to 10,307.32, its worst ever one-day point loss. Amazon's stock price closed at $46.875 per share, down from its 52-week high of $1 13.00 on December 9, 1999. A. Task, "Ruthless Selloff Hits All Sectors: This Was One for the Record Books," www.theStreet.com (April 14, 2000). Declines continued throughout 2000, and by year end Amazon.comls stock price had sunk to less than $10 per share. 2 7 ~ . Albright and L. Baker "Amazon.com," Salomon Smith Barney Research, February 5,2001.

7 2 Module One Building the Network Economy: Markets and Models
The economics of its ASPJmarketplace business model were so favorable that many analysts expected that Amazon.com would continue to expand this model into new categories. Indeed, during 2001, Amazon.com signed partnership agreements with other established retailers and catalog merchants of physical products, adding new ASPJmarketplace alliances28 with All-Clad Metalcrafters, AT&T Wireless, Borders, Catalog City, Circuit City, Egghead.com, Target, Waterstone, ancl Wusthof. Amazon.com also extended its model to include the sale of digitally downloadable products, including a document delivery service, an e-books service, a magazine subscription service, a music download service, an online travel service (in partner- ship with Expedia), and a software download service. The flexibility of its platform enabled Amazon.com to respond to local trends quickly. For example, with the increasing popularity of the Seattle Mariners baseball stars Ichiro Suzuki and Kazuhiro Sasaki, Major League Baseball and Amazon.com teamed up in fall 2001 to sell Mariners teim products in Japan. Seeking to capitalize on the powerful re- tailing franchise that Amazon.com had built, AOL Time Warner invested $100 mil- lion in Amazon.corn to co-develop a powerful new shopping portal for its AOL.com and emerging broadband and wireless portals.29
During the first six years of its existence, Amazon.com evolved rapidly from an online bookstore to a multicategory/multimodel horizontal portal that offered a wide variety of niche businesses built using a variety of business models. By early 2001, its domestic books, music, and video stores were profitable on a pro forma basis.30 During the fourth quarter of 2001, despite the economic downturn, Amazon.com announced its first quarter with over $1 billion in revenues and posted its first com- pany profit of $5 million (in accordance'with Generally Accepted Accounting Prac- tices, or GAAP).~'
Summary It is just an incredible time to be in business and have the rules of business changing . . . For many years we operated under a pretty consistent set of rules. They evolved maybe . . . but now they're morphing and that presents a situation that challenges en- trepreneurs to figure out: Are these rules real, or are they temporary? Should we re- spond to them? Do we create new rules? How do we run a company in a world like this when we have 13,000 employees trying to figure out where we are going and what we
do?32
If you think about it, we spent most of the 20th century creating the business rules that were used to build and run a successful company in the Industrial Economy and
any of these alliance partners allowed online customers to pick up and return physical products at the store. 2 9 ~ ~ ~ Time Warner press release, July 23, 2001. 301n i t s annual report: and SEC reporting, Amazon.com states that its pro forma accounting excludes stock-based compensation, amortization of goodwill, and certain other intangibles, restructuring charges, and other noncash costs. 3'~mazon.com press release, January 22, 2002. 32~av id Pottruck, president and co-CEO of Charles Schwab, address to executives at the Harvard Business School, October 1999.

Chapter 2 Crafting Business Models 73
spent the last two decades breaking those rules. As we stand at the threshold of the 21st century, we are searching for new business models that enable a company to achieve the efficiency, power, resources, and reach of being big and the speed, agility, and responsiveness that come from being small.
As executives attempt to sort through the options available for building firms that can compete and succeed in the 2 1 st century, they are finding that it is becoming less important to watch the actions of competitors and more important then ever to make decisions based on a deep understanding of the "business fundamentals" that define the structure and dynamics of markets, industries, and the organizations that com- pete within them. The following steps can be used to help guide business model analysis.
A Step-by-step Approach to Analyzing Business Models Step 1: Profile your current business models. Identify the generic models being used today. Analyze revenue and cost models. Determine strengths, weaknesses, and opportunities for improvement.
Step 2: Determine how you might evolve your current model andlor identifj new models topursue. Check out the business models used by your suppliers, cus- tomers, partners, and competitors. Check out business models of other companies outside your industry. Talk with customers, suppliers, partners, and industry ex- perts.
Step 3: Use the business model analysis framework to prioritize new models and initiatives.
Evaluate the concept (opportunity): Assess market opportunity and dynamics, industry and competitive dynamics, business context and risk, product/service posi- tioning, basis of differentiation, and evolutionary potential (strategic options). The analysis of the concept provides the foundation for developing a pricing model and a revenue forecast.
Evaluate the capabilities and resources required: Assess your ability to attract, engage and retain customers, suppliers, partners, and employees. Do you have the expertise and leadership needed to execute your short-term strategy and long-term strategy? Assess the appropriateness of operating and marketing plans and the in- frastructure requirements. The capability and resource analysis provides the foun- dation for developing cost forecasts. Do you have the capabilities and resources that you need today and in the future? How will you build capabilities and acquire the resources required to reduce gaps?
Evaluate the value proposition (returns to all stakeholders): Evaluate benefits to all stakeholders; revenue, cost, and asset models; a profit model; cash flow pro- jections; break-even timing; and financing needs. Check the consistency of the as- sumptions used to build the financial model with the opportunity and resource analysis.
Step 4: Use the analysis in Step 3 as a benchmark to develop real-time per- formance monitoring systems.
Step 5: Revise your strategy, implementation plan, and performance measure- ment systems on an ongoing basis.

74 Module One Building the Network Economy: Markets and Models
The following questions can be used by executives to evaluate current and evolv- ing business models.
1. What business nlodeYmodels is your organization using today?
2. Does your business infrastructure enable you to evolve your business model to increase revenues generated per customer and to respond quickly to opportuni- ties and threats?
3. Do you have the capabilities and resources that you need today and in I he future? How will you build capabilities and acquire resources to reduce gaps?
4. Are you delivering benefits to all stakeholders? Can you demonstrate and communicate those benefits in wqys that are objective and easy to evaluate and measure?
Business Model Revenue, Cost, and Asset Options
Sample Revenue Options
Commerce Revenues 1 I
Revenue Category Description 1 Product sales Sell or license physical or information-based products I
Commission, service, Charge a fee for services provided; can be a set fee or a percentage of 1 or transaction fees the cost of a product or service I
Content Revenues -7 Revenue Category Description I
Subscription fees Charge for receipt of updated information on a particular topic or a broad range of topics for a specified period of time (e.g., annualj I
I Registration or Charge a fee for attendance at an online event, workshop, or course event fees
Community Revenues
Revenue Category Description I
Advertising, slotting, Collect a fee for hosting a banner advertisement or special promotion affiliate, and Collect a fee for an exclusive or nonexclusive partnership relatiorship referral fees Collect a fee each time a visitor clicks through from your site to another 1
company's site
Membership fees Charge a fee to belong to a private group or service I

Chapter 2 Crafting Business Models 75
! Revenue Category v:c 2". a a& .:a, .:P Deq~fiption-~ * a ,-, P h - e ,X / ~oftwarelhardwaFe Sell o; license a technology product I sales
**i*sh @'+:a, aa$:v $zeb. +..*:*, m"e -62 !a&:. A
Installatio'dand" @* *& Charge e ~ t h e ~ a set 6r a viiieble fk&br servlces prov~ded??arge-scale
integration fees fixed-price projects are often broken into a series of discrete projects with
I n,dt,. ,q:. is::,. ,q,welI-defined,time frames ant$deliverable~;~variablq fees are often;based4# on time, materials, and expenses incurred while working on a project
Maintenance and;; softwarelhardware maintenance and updates update fe%s " -. ."" 6 *X " e " *: h *
Hosting fees Charge a fee for hosting a software application, website, data center, P* P: d:* or nefwork e , * d8ic T % * a - A * e ' a @by ( s *
Access fees Charge a fee for providing access to a network andlor an Internet
I Sample Cost Categories I
I
I 1 cost Category *:- am.%. &* A:+. "::: ,+. Des;ription"" , .: a;= t,ima &:# 1 I People & partners Cost to acquire, develop and retain skills,and expertise needed to
--* a * a ,, execu3e strategy; includes employees and-partnerships I, w %+ + '*"
Advertising, marketing, Cost of offline and online advertising, marketing, and sales sales
q* "." aiY p:
~uiiness development Cost dt desi&ing la<n;hing n;w businesses.developing alliances, and acquiring partners
Materials & supplies '"Cost of physi"cal matirials ised in productibn of products and delivery -,' of services; includes general purpose and specialized supplies and
:C. components. a r2ha +&*'a g e e m a#& + ,"i bq:a 13 % < $ * 4
a * Specialized equipment Cost of equipment-especidly capital equipment-used in design, (does not include IT) production, delivery, and distribution
8' :".. $piesi$"ing a ~ ~ ~ ~ ~ < $ f b p i n ~ $ r o d " & { and f&vices$may d&tlap"$$* development with IT infrastructure costs
I I Physical facilities Cost of corporate and regional headquarters, sales offices, factories, . I and infrastructure warehouses, distribution centers, retail stores, service centers etc. I
Information technology *,Cost of computers and equipment (e.g., printers, data storage device^)^ (l~)"infrastructure~'
**_ " Cost to operate and'maintain data\enter?' i*
Cost to design, develop, implement, and maintain software 1 $ ,:,Cost of voice, data and video network equjpment (e.g., physical,gables,
*S
routers) Cost to design, operate, and maintain networks
Lr---~---s"--.----&.- A- -_--- _I ~ (continued) I

Sample Asset Categories
i Current Assets
Asset Category Description / Financial assets Accounts receivable I , Cash and convertible notes 1 Marketable securities lnvestments made as part of a cash management program
I j Tangible Assets
i Asset Category Description j Property, plant and Physical facilities i equipment Fixed assets required to produce goods and services / Inventory Assets held for sale I
I lnvestments
I Asset Category Description / Securities Stock held by one firm to enable joint control over shared business activities I Stock held by one firm in anticipation of a return at some time in the future ! Real Estate I
Investment in property in anticipation of a future return
I Intangible Assets 1 Asset Category Description / Relationships Breadth and depth of relationships with customers and the business 1 community I Loyalty and commitment of customers and business community members I Strength of online Strong brand recognition among business and consumer communities I and offline brand (includes corporate brand, business unit brands, product brands, and
I global brand)
i Ability to generate strong personal identification with brand Ability to leverage "Internet" brand image Reputation and image
1 Knowledge and Experience, skills, and intellectual capabilities of employees and partners j expertise Understancing of market and business dynamics i Scope and granularity of stored information I Flexibility andsase of accessing, customizing, and distributing information
Information literacy Understanding of technical and business evolution and ability to identify
I opportunities and threats Agility and Ability to q ~ickly recognize and act on new opportunities and threats
1 responsiveness Ability to access and efficiently utilize resources required to execute strategy Ability to capture the attention and mobilize the commitment of customers
l
and members of the business community to implement new strategies Intellectual property Patents, copyrights, etc., for which an objective measure of value can be
assessed Goodwill Value of an acquired company over and above current and tangible assets
I The value of an acquired company's "franchisen-e.g., loyalty of i t s ! customers, expertise of i t s employees-that can be objectively measured
at the time of a sale or change of control I
76

a- t
Module Building d x the d2 -2 .6. @Network := "8 - I, n d Economy:
* d i n ' Capabilities and t , & *
Organization % by Lynda M. Applegate
L a m a R ~ I * l
v$* ; i:pe be %ss +
Few would disputd thai the 1990s wasea period of dramatic change. That decade ,b +$ %* dawnednas a time of retrenchment as large, established firms struggled to shed the
static, rigid structures, processes, and technologies that remained as a legacy of the " 9'
* ' Industrial Economy. As the decade drew to a close, we found ourselves in a period of unparalleled business innovation led by bold entrepreneurs with a vision of a
1 "- global Networked Economy. While the early days of the Internet revolution were I @ a " characterized* by what many have called "irrational exuberance," the year 2000
marked a shift to a search for analytics and frameworks that could be used to build * successful-and profitable-businesses.
The two chapters in this module discuss the design principles required to build successkul2lst-century networked organizations. The module provides frameworks
I d a - to guide executives in analyzing opportunities and in the design, launch, and growth tures inside established firms or as independent, venture-funded start-
* 2 ,


Building Networked Businesses1
Our dream and our plan well over a decade ago was simple. We set out to shape a global enterprise that preserved the classic big company advantages while elimi- nating the big company drawbacks. What we wanted to build was a hybrid enterprise with the . . . body of a big company and. . . the soul of a small company.2
Today's executives are both fascinated by and often skeptical of the new organizational models that they read about in the business press. But no matter what their position on any given model, most agree that traditional Industrial Economy designs will not work in a networked world. Large, established firms are trying to "act small" while not los- ing the advantages of "being big,'' and start-ups must act big to survive in a fast-paced, global Internet economy. As a result, all organizations must be designed to be big and small simultaneously. To accomplish this, new capabilities must be developed and new approaches to building and growing a company must be implemented.
This chapter examines the hybrid "big-small" organization design that is emerging as entrepreneurs and executives in established firms attempt to build businesses that can survive and prosper in today's fast-paced and uncertain envi- ronment. As the quote that starts this chapter implies, the challenges of building a big-small company are not new. Indeed, the insights presented in this chapter have emerged from over 15 years of research within hundreds of large firms that strug- gled throughout the 1980s and 1990s to transform their organizations to cope with
h his chapter is adapted from papers and materials published in L. M. Applegate, "Building Networked Organizations," in Building Businesses in a Networked Economy (Harvard Business School Publishing No. 802-063). Clipart used in the figures is reprinted with permission of Art Today (www.arttoday.com). 'J. Welch, "Letter to Shareholders," General Electric Annual Report, 1995.

80 Module Two Building the Network Economy: Capabilities and Organization
the demands of a rapidly changing global economy.3 The research insights from this study suggest that the new models that are emerging draw on many of the fun- damental design principles that guided the way we built successful businesses in the past. (See appendix 3A for organization design characteristics.)
The Need for New Capabilities
If you think about it, we spent most of the 20th century building and perfecting In- dustrial Economy organization designs and the last two decades tearing them down. During the 198 and 1990s, executives in large companies were obsessed with downsizing, d layeriy, and reengineering Rigid organizational bo~nd~aries were shattered to ena < ' lefirms to focus on core competencies while expanding into global markets. Strategic partnerships and alliances were formed to ensure access to capa- bilities and expertise that could not be built and managed inside.
The vision of elilminating hierarchy was compelling, and the change initiatives- many of them enabled by emerging information technologies-shook established organizations to their foundations. But if you took a walk around most firms in the mid-1990s, it was clear that the hierarchy was far from dead. Yet when asked what their companies should look like, most executives continued to express the need for a new design that would enable an organization to function as if it were both big and small4 The problem confronting these managers was that they could not sacrifice efficiency for speed and could not abandon the need for control as they empowered employees to make decisions addressing real-time customer needs.
Jack Welch, foriner chief executive officer (CEO) of General Electric;, summed up this dilemma when discussing the challenges that his company faced when he as- sumed control in the early 1980s' (see Figure 3.1). "[When we entered the 1980~1, we saw two challenges ahead of us, one external and one internal," he said. "Exter- nally, we faced a world economy that would be characterized by slower growth, with stronger global co~npetitors going after a smaller piece of the pie. Internally, our challenge was even bigger. We had to find a way to combine the power, resources, and reach of a large company with the hunger, agility, spirit, and fire of a small one."
In the early 1990s, Percy Barnevik, CEO of Asea Brown Boveri (AB13), echoed Welch's comments "ABB is an organization with three internal contradictions. We want to be global and local, big and small, and radically decentralized with central- ized reporting and control. If we resolve those contradictions, we create real com- petitive advantage.'16
i'
3 ~ . M. Applegate, "In Search of a New Organization," in Shaping Organization Form: Communication, Cor~nection and Community, eds. G. DeSanctis and J. Fulk (Newbury Park, CA: Sage, 1999); L. M. Applegate, "Time for the Big-Small Company," Financial Times Mastering Information Management, April 1999. 4 ~ . M. Applegate, B~csiness Transformation Self-Assessment-1992-1993 (Harvard Business School Publishing, No. 194-013). 'J. Welch, "Managing in the 90s," GE Report to Shareholders, 1988. 'R. Simons and C. Bartlett, Asea Brown Boveri (Harvard Business School Publishing NO. 192-139).

Chapter 3 Building Networked Businesses 81
FIGURE 3.1 A The Complex Organization & Global F ' ? Design Challenge Hierarchy i
Stable & Dynamic & Certain Uncertain
Environment
In the age of the Internet and associated networked technologies it is not just large established companies that are coping with the challenge of being big and small si- multaneously. Entrepreneurial start-ups are also struggling with the problems that come from getting very big very fast. Consider the success-and challenges- experienced by Yahoo! and eBay. Those two Internet powerhouses grew from a handful of entrepreneurs in 1995 to multibusiness global companies in a few short years. While the pace of growth for entrepreneurial start-ups slowed during 2000 and 2001, executives leading small firms must still expand product lines and geographic reach quickly if they hope to keep pace and do business with the large firms that dominate most markets.
IS History Repeating Itself?
As timely as it seems, the management dilemma depicted above is not new. In fact, descriptions of "hybrid" organizations designed to enable companies to act big and small simultaneously were common in the 1950s and 1960s.~ (Interestingly, these new organizational models were pioneered by rapidly growing technology start-ups in the aerospace and computer industries.) One of these hybrid designs- the matrix-was originally billed as the "obvious organizational solution" to the
'T. Burns and G. M. Stalker, The Management of Innovation (London: Tavistock, 1961); J . Woodward, Industrial Organization, Theory and Practice (London: Oxford University Press, 1965); J . D . Thompson, Organizations in Action (New York: McGraw-Hill, 1967; P. Lawrence and J . Lorsch, Organization and Environment (Boston: Harvard Business School Press, 1967, 1986); L. Greiner, "Evolution and Revolution as Organizations Grow," Harvard Business Review 50(4):37-46, 1972; 1. Galbraith, Designing Complex Organizations (Reading, MA: Addison-Wesley, 1973).

82 Module TWO Building the Network Economy: Capabilities and Organization
need for control and efficiency while simultaneously enabling flexibility and speed of response.8 Decades ago, proponents of the matrix argued for an "adaptive, information-intensive, team-based, collaborative, and empowered" organization-all characteristics of today's 2 1 st-century organizations.
But companies that adopted the hybrid designs of the 1960s and 1970s soon learned that the new structures and systems bred conflict, confusion, information overload, and costly duplication of resources. Bartlett and Ghoshal discuss why many firms adopted the matrix only to abandon it several years later: "Top-level managers are losir~g control of their companies. The problem is not that they have misjudged the demands created by an increasingly complex environmenl and an ac- celerating rate of environmental change, nor that they have failed to develop strate- gies appropriate to the new challenges. The problem is that their companies are or- ganizationally incapable of carrying out the sophisticated strategies they have developed. Over the past 20 years, strategic thinking has outdistanced organizational ~a~abi l i t ies . "~
Given such problems, one might legitimately ask, "If these hybrid organizations failed in the past, why are we trying them again?" Interestingly, one of the major sources of difficully with the matrix was the dramatic increase in the need for timely information to manage it suc~essful l :~. '~ While the hierarchy managed complexity by minimizing it, the matrix demanded that managers deal with complexity directly. Product managers had to coordinate their plans and operations with functional man- agers. Country managers had to coordinate activities with headquarters. And senior managers, attempting to reconcile overall organization performance ant1 plan cor- porate strategy, were faced with a dizzying array of conflicting information.
In the large hierarchical companies of the 1960s and 1970s, paper-based and word-of-mouth iniormation moved slowly and channels of communication were limited. While the mainframe computer systems of the day helped process some of that information, they were designed, like the hierarchy itself, to support centralized decision making and hierarchical communication. The microcomputer revolution of the 1980s provided tools to decentralize information processing, which helped im- prove local decision making, but the technology to support both local and enter- prisewide information sharing and communication was inadequate.
Only recently has information technology (IT) become capable of meeting this challenge (see Figure 3.2). The "networked IT revolution" of the late 1990s-re- flected in the emergence of the Internet, electronic commerce, and increasingly in- tegrated, powerful, and flexible databases and business systems-has made possible information processing and communication infrastructures that match the needs of companies that wish to operate as if they were both big and small.
\
'c. Bartlett and 5. Ghoshal, ~ a n a g i n ~ across Borders: The Transnational Solution (Boston: Haward Business School Press, 1991). 'lbid. /
'O~esearch in the mid-1960s suggested that successful firms operating in uncertain and complex environments developed systems to improve vertical and lateral information processing in the firm. See Galbraith, op. cit., and Lawrence and Lorsch, op. cit.

Chapter 3 Building Networked Businesses 83
FIGURE 3.2 Networked Organizational Models Are Enabled by Complex Networked & Global Technologies
Simple & Local
Hierarchical 0r.anization Networked
& Mainframe Organization A Technology & Neiworked
Technology
I intelligence Shared intelligence
Entrepreneurial Organization &
PC & LAN Technology
+ -ci Local intelligence
b Stable & Dynamic & Certain Uncertain
Business Decision Making Environment
But,improved technology is not the complete answer. Although the networked IT infrastructure can provide important tools, it cannot define the information that needs to be in the system. In addition, while the networked infrastructure can enable new organizational structures and systems, it cannot motivate people to use the in- formation to make decisions and take actions on behalf of the organization. New or- ganizational capabilities are required to execute the sophisticated network strategies and business models.
Blueprint for a Networked Organization
Designing, implementing, and constantly evolving the structures and systems that I
enable an organization to execute its strategies and accomplish its goals is one of the most formidable tasks facing 2 1 st-century business executives. Architects understand that a poor building design leads to inefficiencies, cost overruns, and construction delays. A well-conceived architectural blueprint, by contrast, helps prevent such problems. Likewise, executives must have a well-conceived "business blueprint" to design a successful company. Each floor in the business blueprint depicted in Fig- ure 3.3 represents a category of business design. The three categories-operating and innovating, managing and learning, and leading and engaging-build upon one another to provide the organization and technological infrastructure required to build a networked organization for the 2 1 st century.

84 Module TWO Building the Network Ecnnomy: Capabilities and Organization
FIGURE 3.3 Blueprint for a "Big-Small" Business
Sample Organizational Sample Technology Con~ponents Component8
. Supply Chain Management Business Venturing Order Fulfillment
New Product Development
In the past, managers learned to create and use business blueprints as they pro- gressed up the management ladder. [n the Network Economy, old blueprints are not adequate and new ones are only beginning to be developed. The bu,siness de- sign represented in the business blueprint must unite organizational and techno- logical capabilities to enable a network of organizations and individuals to ac- complish shared goals. To simplify our discussion, we begin by defining new management principles from the pe:rspective of a single organizational entity. Later sections of this chapter expand the discussion to examine emerging net- worked models of organization.
Operating and Innovating The operating processes of a firm include all the activities a firm and its suppliers and partners underlake to design, build, market, sell, and deliver products and serv- ices as well as serve and "care for" customers, suppliers, and business partners. The key to success for companies operating in turbulent, rapidly changing environments is the ability to flexibly adapt these operating activities to address customer, market, competitive, regulatory, or environmental requirements or to adapt to business in- novations or changes in strategy.
Hierarchical Operations Traditional hierarchical firms define rigid procedures that structure how operat- ing activities must be performed and then group them within the functional units that will be responsible for them. Strategy and performance goals are set at the top and cascade down to all employees. At lower levels in the organization, de- tailed policies, procedures, and job descriptions ensure that everyone has the skills needed and knows exactly what needs to be done to ensure smooth, effi- cient operations.

Chapter 3 Building Networked Businesses 85
Entrepreneurial Operations
Entrepreneurial companies do not depend on well-defined policies and procedures or structured jobs. Entrepreneurial work is defined, coordinated, and performed in real time by founders and employees who are in constant contact with each other and the marketplace. Employees may be chosen on the basis of specific skills and expe- rience, but once hired, they are expected to play multiple, changing roles as the com- pany grows and evolves. While hierarchical firms use structure, systems, and the scale'that comes from being big to ensure efficiency and precision execution, entre- preneurial firms use their small size, ready access to information, and capability for direct and continuous interactions to operate in real time, responding quickly to cus- tomer needs, opportunities, and competitive threats.
Networked Operations
Big-small companies must ensure both precision execution and fast-cycled innova- tion. This requires that operating processes be designed to fully exploit the power of both people and technology-whether these assets are in your firm or in someone else's. When embedded within a digital operating infrastructure, technology can be used to ensure precision execution and coordination of routine tasks while people use real-time information generated by technology-enabled transaction systems to deal with unforeseen problems or opportunities and to personalize and continuously improve operations. '
To prevent digital operations from being encased in rigid technology, executives must ensure that systems and the processes they support are designed from the be- ginning with change in mind. This requires careful attention to modular design with standardized interfaces between modules.12 In addition, information required to co- ordinate activities and improve them continuously must be siphoned into flexible, powerful, and robust enterprise information management systems (often called data warehouses). Finally, easy-to-use information access and analysis tools can be used to put executives, employees, and partners directly in touch with the real-time in- formation and expertise needed to manage the business. This flexible, robust, fully networked digital operating infrastructure-combined with big-small company structures, processes, and incentives-is a key tool for building the networked busi- ness capabilities summarized in Figure 3.4.
"ln computer programming, a transaction refers to a sequence of computer code that is used to perform a specific task. In business, the exchange of information, goods, and/or services is also called a transaction. Uniting these technical and business defini- tions, a transaction system is one that enables one or more individuals or organiza- tional entities to perform a task or exchange information, goods, and/or services. Th? "transaction layer" of an IT archjtecture forms the core of an organization's IT. infra- structure. . . "c. Baldwin and K. Clark, Design Rules: The Power of Modularity (Cambridge, MA: MIT Press, 2000).

86 Module Two Building the Network Economy: Capabilities and Organization
FIGURE 3.4 Operating and Innovating Capabilities
Precision Execution
Hierarchy - - Fast-Cycled Innovation
Entrepreneurial
Capabilities i Precision execution
: Fast-cycled innovation
j Customer and i community j connected
(All key stakeholders, including suppliers and
I partners, are considered "customers" of an e-business.)
Business Design Requirements
0 Streamlined, integrated, and efficient operations seamlessly link activities performed inside the firm with those performed by customers, partners, and suppliers.
0 Cost, cycle time, and quality levels are benchmarks witbin the ir dustry and exceed customer-stakeholder requirements.
0 Flexible, modular designs enable customization, personalization, and continuous improvement.
0 Change processes are embedded within the company's day-to- day operations.
0 Einployees are rewarded for devising new, innovative ways to serve customers.
0 Resources for change are available. 0 There is a standardized and widely accepted process used to
develop and present the "business case" and implementation plan for a potential idea.
0 Dtecutives and employees in all parts of the organizaticn have the information required to understand the lifetime value of customers, suppliers, and partners and have the ability and authority to make decisions and take actions to improve satisfaction and loyalty.
0 Incentive systems reward success in attracting and retaining pirofitable customers, suppliers, and partners and in increasing t+e frequency and level of engagement.

Chapter 3 Building Networked Businesses 87
PSA is an excellent example of a company that has exploited the power of digi- tal technologies to build the operating and innovating capabilities required to suc- ceed in the Network cono om^.'^ The compaiiy;which calls itself "The World's Port of Call," operates and manages transshipment ports for the country of Singapore and 10 other ports in eight countri'es-around the world, including China, Italy, India, Yemen, Brunei, and Portugal. PSA began building its digital operating capabilities in the mid-1980s with the automation of both its internal port operations and routine transactions with external stakeholders, including freight forwarders, shipping com- panies, and government agencies. By 2000 the company had launched a fully inte- grated and streamlined Internet-based netwoiked operating infrastructure that pro- vided the small country of Singapore with the distinction of being the number one transshipment port in the world.
Between 1993 and 1999 the company exploited the operating capabilities it had built to (1) increase the total transshipment volume handled in PSA's ports in Sin- gapore from 9 million to over 17 million 20-foot equivalent units (TEUS),'~ (2) in- crease the number of ships able to unload over 100 containers per hour from 59 to
c almost 800, (3) increase the number of ports connected from 374 to over 509, and (4) increase the number of airport passengers from 2.4 million to over 6.2 million. In addition, productivity increased from 1,200 TEUs per employee in 1993 to over 2,300 TEUs per employee in 1999.
PSA not only increased the precision with which it executed port operations, it also dramatically increased the pace of innovation, launching two new product/service offerings and two new businesses in the late 1990s. Each new venture leveraged the infrastructure and capabilities PSA had built for use inside its organization to enter new markets and generate new sources of revenue. In the early 1990s, PSA launched a consulting service to assist ports around the world in streamlining and automating operations. The second venture enabled distant ports to outsource port operations to PSA. The third, a wholly owned subsidiary called Portnet.com (www.portnet.com), was a software company that licensed PSA's software to ports, shippers, and other members of the shipping community. Alternatively, the software could be hosted by Portnet.com and delivered as a service. The fourth new venture, Port Care Services, provided distribution, logistics, inventory management, and asset management serv- ices for members of the shipping community.
In 2001, in recognition of the precision execution, quality, and innovation of its operations, the Asian Freight Industry voted PSA as the "Best Container Terminal Operator (Asia)" for the 1 lth consecutive time, and Singapore was voted "Best Sea- port (Asia)" for the 12th consecutive time. PSA's subsidiary, Changi International Airport Services Pte Ltd., was voted the "Best Air Cargo Terminal Operator" for the second time. In addition, PSA Corporation scored a "Double First" at the prestigious
13privatized in 1997, PSA originally operated as a unit within the government of Singapore. See L. M. Applegate, Neo Boon Siong, Nancy Bartlett, et al., PSA: The World's Port o f Call (Harvard Business School Publishing No. 802-003). Visit PSA at www.psa.com. 14~he shipping industry measures the volume of work performed by a port in terms of 20-foot equivalent units. Each unit represents one 20-foot container ship.

88 Module Two Building the Network Economy: Capabilities and Organization
Lloyd's List Maritime Asia Awards organized by Lloyd 5 List, an international ship- ping daily. In the same competition, PSA Corporation won the "Best Container Terminal Award," while its flagship project in China, Dalian Container Terminal, won the "Best Emerging ContainerTerminal Award."
Managing and Learning The management processes and structures of a firm include all the activities that a firm and its business community (including customers, suppliers, and partners) un- dertake to
Plan strategy and how it will be executed
Allocate resources
Organize people into groups and coordinate work
Monitor and measure performance
Adjust strategies, plans, budgets, and organizations based on learning
Traditional Management Process
In traditional hierarchies, planning, budgeting, and perforAance monitoring are of- ten driven from the top of the firm. Given that fact, until recently, major strategic ini- tiatives usually were planned well in advance of execution (before the 1990s, 10- year strategic plans were typical), policies, procedures, and organization design changed slowly. As a result, most planning and budgeting processes focused prima- rily on setting incremental goals and allocatingthe resources required to carry them out. These formal planning and budgeting systems have formed the basis for routine performance monitoring and reporting systems that in public firms often are tied to quarterly reporting requirements.
Accompanying this routine reporting process is daily monitoring and control of local operations. At the most fundamental level, hierar.chies control operations through detailed policies and procedures that tell employees inside and outside the firm exactly what needs to be done to perform routine operations." Once everyone knows what to do, local on-site supervisors are placed in the hierarchy to watch and make sure everyone performs efficiently and effectively. When something unex- pected happens or a problem occurs (and the solution to the problem is within a lo- cal supervisor's accountability and authority), a decision can be made on the spot. If the decision requires coordination with others at a higher level or in other parts of the organization, the problem or opportunity is passed up the line until someone (or a group of people) is willing and able to make a decision. These decisions ~nust unite the vision and goals of senior executives with the reality of the business environ- ment. Without a clear understanding of strategic direction and detailed and timely information from the field, these dec~sions take time. Thus, hierarchical manage-
151t is important to note that. structured outsourcing contracts enable an organization to extend hierarchical control across organizational boundaries.

Chapter 3 Building Networked Businesses 89 I ment is effective only in relatively 'stable business environments where change hap- pens slowly and there is sufficient time to gather information, analyze and make sense of it; define what needs to be done, and then hire, train or redeploy the people required to implement the necessary solutions.
Entrepreneurial Management Process In traditional entrepreneurial organizations information and management decision making are timed to the rapidly changing business environment. This enables founders and employees to keep in close touch with each other and the market. As a result, planning, decision making, action, and performance management are infor- mal and ad hoc. Real-time sharing of information and perspective and the ability to
, respond quickly on the basis of what is being learned are fundamental to effective entrepreneurial management. As an entrepreneurial firm grows larger and more complex, this learning model of management breaks down and more structured op- erating and management processes are required. Therefore, the evolution of a suc- cessful entrepreneurial firm often results in its passage through a series of stages, during which the organization evolves divisionally from a team to a simple func- tional structure to a multitiered hierarchy.16
Networked Management Process "Big-small" companies must unite the high levels of control and integration achieved through hierarchical planning, monitoring, and performance measurement systems with the fast-cycled "learning by doing" approach that is characteristic of an entrepre- neurial organization. Twenty-first-century IT enables this vision by providing access to a shared source of real-time information on market dynamics, operations, and per- formance that enables real-time planning and performance monitoring. Tools to sup- port analysis, interaction, and collaboration enable perspectives to be shared and deci- sions to be made by people who work in distant locations and even different companies. Broadband communication systems can be used to help share the "vision" of senior management with employees in the parts of an organization. When flexible Internet technologies are embedded within a company's day-to-day operations and its organi- zation design and managementprocess, a firm's routine activities can operate smoothly and efficiently. At the same time, improved access to information enables employees, customers, and partners to invent new ways of working and to respond quickly.
But technolog? is not sufficient. In a constantly changing and complex global firm, information comes from many sources. Learning requires that people get to- gether to debate the meaning of the information and its implications for decisions and actions. Even when insights have been translated into actionable plans, no sin- gle individual can make change happen. As a result, the ability to learn while we ex- ecute today's business and invent tomorrow's also requires that people be organized and motivated to take what they learn and share those insights with others. These ca- pabilities are summarized in Figure 3.5.
l 6~re iner , op. cit.

90 Module Two Building the Network Economy: Capabilities and Organization
FIGURE 3.5 Managing and Learning Capabilities
Efficiency & Integration
Hierarchy L
// I
Learning by Doing
Entrepreneurial
I Capabilities Business Design Requirements I
Control and * Coordination and control of routine operations are embedded within the j integration digital operating infrastructure.
Early-warni~g systems enable close monitoring and immediate response to I I
threats and opportunities. , "Critical failure factors" have been identified, and "disaster recovery" procedures are in place.
Learning by doing
Real-time information and interactive management systems-a mix of I
face-to-face decision making supplemented by high-bandwidth communi- , cation systems-enable large dispersed teams of people (not all oF whom 1 may work in the same company) to make informed decisions, take action, i and receive mmediate feedback. Key operating metrics are directly linked to financial and market results to I
provide real-time feedback. Shared, actionable goals provide direction and the framework within which decisions can be made and evaluated. 1
Flexible and ! well-managed 1 boundaries i
Employees and partners have a clear understanding of the role they play and how to *work with others to get things done. But these clearly defined roles must not limit people's ability to work across boundaries- inside the firm and with suppliers, partners, and customers. In a networked organization, companies are highly skilled at forming and successfully managing strategic alliances and partnerships. If a company is growing by acquisition, companies must be highly skilled at identifying and effectively integrating the people, processes, ard systems that unite acquired companies.
.- -- - - -" - -. --- - . - - -- - - . - . -

Chapter 3 Building Networked Businesses 91
FIGURE 3.5 Managing and Learning Capabilities (continued)
Capabilities Business Design Requirements
Flexible and 8 y #Formalnand informal,"communication systems support frequent two-way well-manacred interactions inside and outside the firm.
1 boundarie; Coordinating mechanisms (for example, advisory councils, governing I
1 (continued) ' boards, liaison roles, and information systems) enable effective coordina-
@ s Privacy and co@nfiden$iality y e safeguarded, and security procedures are strictly enforced.
.
Founded in 1994, Internet Securities, Inc., provided business professionals with re- liable, timely financial, business, and political information on emerging markets. Its information service was launched on the Internet in 1995, and it was one of many en- trepreneurial firms in the late 1990s that faced the challenge of building the manage- ment systems and organization required to succeed in the ~ e t w o r k ( ~ c o n o m ~ . ' ~ By the time of its sale to Euromoney PLC in 1999, Internet Securities was providing infor- mation on 26 emerging markets as widely dispersed as Bulgaria, Croatia, Hungary, Poland, Romania, Russia, Argentina, Chile, Colombia, Ecuador, China, Malaysia, and vietnam.I8 The company connected over 650 information suppliers to thousands of business professionals in over 600 global firms, including General Electric, JP Mor- gan, Deutsche Morgan Grenfell, KPMG, and ING Barings. CEO and founder Gary Mueller explained: "[In a few short years] we built this company from a few people working together out of a third-floor walk-up apartment to over 250 people with highly specialized expertise located in 18 country offices around the world."
During the early days, the company was structured as a single, self-managing team. But as the company began to sell its service and collect revenues, functional
tion and control of activities that cross internal and external boundaries.
A&isia,$. .3:, *';fie , a"*" infbrma{& nd$ed t$&ak$f&isi&s and8i&e $$jons $ rele&nt, ' knowledge timely, and readily available to those who need it. It is pre assets -; 3 : I form that is immediately aqionabl-e. .-;,, , ui+us *-:?
People are information-liteiate and have the skills and inc to turn information into action that is consistent with the
f .* the organization and i t s stakeholders. " c dl_ &-
Information and best practices are openly shared. * s ; Politics,,burea~cracy,~and poorly aligned incentives doenot get in the way ,&
of sharing and learning from information. l Processes are in place to ensure that information is accurate and reliable
d and that employees: partners, customers~and suppliers trust the informa- '" tion thev receive.
''L. M. Applegate, lnternet Securities Inc.: Building a Business in lnternet Time (Harvard Business School Publishing No. 398-007). I 8 ~ h e data in this case example were collected in late 1999. In April 2002, lnternet Secu- rities provided information from over 4,400 local information sources on 35 emerging markets. Visit the company website a t www.securities.com for up-to-date information.

92 Module Two Building the Network Economy: Capabilities and Organization
specialists such as accountants, salespeople, and operations professionals were hired. -
As the company added country offices, regional headquarters offices were opened and experienced executives were hired. Along with the structure came formal man- agement processes, but the cycle time of those processes was much faster than would be expected in a hierarchical firm. For example, senior management met (either face to face or through/teleconferencing) weekly rather than quarterly to plan and review performance, and everyone-received daily information on critical busi- ness measures. Formal budgeting syst.ems were implemented. Chief Financial Offi- cer (CFO) Jack Hanna explained:
We roll up the entire company's books within ten days of month-end and then formally close the books. Considering that we are in 18 different emerging markets, each of which has its own currency, this requires a significant amount of staff time as well as integrated and reliable information systems. Most entrepreneurial firms do not have strong systems and processes until much later in their development. We put these systems in ahead of the curve. We believe that it provides a tremendous level of disci- pline in the firm and also enables us to better understand our business. We catch problems much earlier and can take actions to solve them before they escalate. We can also spot opportunities much faster. A well-designed budgeting system is the most basic form of control in companies; it'sthe blueprint that outlines the strategy and business plan, and it gives everyone a way to measure progress toward business goals.
But Mueller and Hanna recognized that formal systems could not replace the real-time learning and interactions that had enabled the company to respond quickly when the firm was small:
We report sales and detailed information on operations on a weekly basis. Everyone in the firm can review online sales charts and drill down so we know exactly which
- of our information products is selling to individual users within each customer site. We know who is using our service and how they are using it. We also have very detailed information on all of our information providers. We know exactly what type of information they provide and how well, and where, it is selling. A country manager and local salespeople can tell exactly how well our information products are selling and can work with information providers to help them target and deliver the most valuable infclrmation. They can see what local customers are viewing an:d can
, use this information to help increase subscription revenues. They can also see what information is selling in distant market:^ and can coordinate with salespeople in nearby country offices to identify changes that might be needed to meet a specific customer's requirement. For example, if certain types of information on Russia or Brazil are not selli,ng well in Poland, the information analysts in Russia or Brazil will know immediately. They can talk to local salespeople in Poland, who in turn can talk with customers to find out why. The information analysts in Russia and Brazil can
. then talk with their local information providers to create new information or to package existing information to meet the needs of distant customers. Access to this detailed, timely operating data provides direct benefits to local employees. Their bonuses are tied to increasing revenues from customers and information providers in their market. It also benefits senior management since it helps us understand the dynamics of the biisiness and enables us to participate as full partners in making business decisions.

chapter 3 Building Networked Businesses 93
b
Leading and Engaging Leadership is a buzzword,,like empowerment, that everyone uses yet most people still struggle to define. Many believe that leadership is just a matter of charisma and vision-either you have it or you don't. Nothing is further from the truth. Leader- ship skills, like the management skills discussed above, can be acquired and honed. While management is all about coping with complexity, leadership is all about at- tracting and mobilizing the resources for change.I9 As can be seen below, both in- volve complementary activities:
While management involves planning and budgeting, leadership involves defin- ing a clear, compelling vision and ensuring that it is translated into a set of ac- tionable strategies and initiatives.
While management involves organizing and staffing, leadership involves attract- ing, motivating, energizing, and retaining top talent inside an organization and within partner, supplier, and customer networks.
While management involves control and problem solving, leadership creates a culture and ensures that values, beliefs, and behaviors are deeply ingrained and reflected in the decisions made and the actions taken.
Hierarchical Leadership In traditional hierarchical firms, the emphasis at most levels was on managing complexity by minimizing it. Thus, management process overshadowed leader- ship. Much of the problem was due to the fact that information moved slowly and inefficiently. Thus, the cost of coordinating activities and decisions across or- ganization boundaries increased significantly. Risks were minimized by central- izing decision making, segregating activities, and structuring work rigidly. Deep hierarchical chains of command enabled direct monitoring and supervision of work. Segmentation of work and authority, together with direct supervision, en- sured that, short of sabotage, no one had the authority-or opportunity-to per- form an action that would threaten the entire company. But this consistency and control came at a cost.
In large, established companies, employee self-interest (usually motivated by pay for performance) and compliance replaced the commitment and engagement found in entrepreneurial firms. Real-time understanding of business and market dynamics and the ability to respond quickly to change were also lost. But as long as the busi- ness environment remained stable, there was time for scores of analysts and con- trollers in corporate headquarters to provide senior executives with the information needed to set the direction, attract and train employees, and implement performance management systems and incentives to ensure that the strategy was executed effi- ciently and effectively.
lgSee J. Kotter, "What Leaders Really Do," Harvard Business Review, 2001 (HBR On Point No. 3820).

94 Module TWO Building the Network Economy: Capabilities and Organization
Entrepreneurial Lsadership
Howard Stevenson, professor of business administration and longtime head of the entrepreneurial management unit at Harvard Business School, defined entrepre- neurship as the ability to "create or seize an opportunity and pursue it regardless of the resources currently c ~ n t r o l l e d . " ~ ~ Thus, entrepreneurial leadership requires that founders be able to attract, motivate, and engage people, partners, and in- vestors in the task of working together to create a new venture. To accomplish this, entrepreneurs must be able to create a clear and compelling vision that cxcites and deeply engages all involved. While the vision may include a monetary incentive, often it is so vague and far off in the future that it cannot serve as a primary mo- tivator.*l Thus, entrepreneurial leadership must be capable of energizing and in- spiring others, ancl entrepreneurial cultures drive this engagement and motivation toward a common vision throughout an organization and into its dealings with cus- tomers, suppliers, and partners. Shared goals, beliefs, and values provide the guid- ing principles that enable people to make decisions and take actions to execute strategy and meet shared objectives.
Networked Leader,ship In the Network Economy, the free flow of information throughout the conipany (and with customers, suppliers, and business partners) enhances the ability of employees, customers, partners, and executives to share in defining both a clear and compelling vision for change and the necessary tactical initiatives required to achieve business goals. When this is aligned with incentives and motivations that foster commitment rather than simply compliance, large companies can adopt entrepreneurial-style decision-making structures and entrepreneurial leadership can be infused through- out the organization.
What keeps entrepreneurial, self-managing teams from doing things that will harm the company" In entrepreneurial organizations, the close proximity and shared perspective among founders, employees, customers, and partners enables everyone to be involved in key decisions and actions and to monitor results closely. Small size also enables a fast response when problems occur.
In complex globul organizations senior executives cannot oversee every decision or action taken by eml~owered teams. As a result, it is more important for them to iden- tify key strategic risks-whlch we call critical failure factors-and ensure that they have effective control systems in place. The availability of real-time infonnation can assist with risk management, but senior managers should not delude themselves that online monitoring is all that is required. Direct supervision and segregation of author- ity may be required to manage areas of extreme vulnerability. Figure 3.6 illustrates the capabilities required to effectively engage employees, partners, customers, and sup- pliers in achieving shared goals.
'OH. Stevenson, "A New Paradigm for Entrepreneurial Management," Proceedings of the 7th Anniversary .Symposium on Entrepreneurship, July 1983 (Boston: Harvard Business School, 1984). 2'lt is important to note that in the late 1990s, the promise of quick returns on invest- ment distorted the entrepreneurial leadership process.

Chapter 3 Building Networked Businesses 95
FIGURE 3.6 Leading and Engaging Capabilities I
Strategic Focus & Resource Allocation
Hierarchy
U
Shared Culture & Comm~tment
Entrepreneurla1
I
Business Design Requirements
attract and retain high-quality partners and talented employees.
1(*s * . "Visions" are trantlated into actionable strategies that can be executed and,,deliver result# while the wjqdow of oppyJunity is still _open. ,~:9%& 3
t-3: r *18js Leaders are able"%o'set tangible>oals and make focused d2;isions. Executives are directly involved in the business; they ensure that barriers are removed, resources are available, and employees have the skills and motivation to accomplish growth.
ignergized ,*2* Culture and incenlives foster ignovation ~hile~ensuring a sT(ong eparticipation commitment to delivering results. This requires that large projects be
broken into smaller, more focused deliverables and that senior manage- ment break down barriers and realign goals.
I Employees, customers, suppliers, and partners believe that .- ",f -, ~ '6; a ot&! leaders possess the knowledge,
t L ~ g ~ g * ~ r ruwthe business:. $!.a
"Stretch targets" energize action and motivate everyone toeachieve peak" b i performance. Leaders display a strong commitment to career development and learning 1
b s * : . ,?bee fttjay. *:a
?*,*?:3:;:,&:- " %.,*t,:," ". J".""- *:s -be,. b;- " ,bk",.".:. ': " :: X . U * ni41, i m :" : :3:3: -.,g$,&c".
in codflict ~ro"?e";ses are in place to ensure that conflicting opinions are"discussed resolution, openly without becoming destructive. hegotitiation, and Employees and partners are skilled at negotiating "win-win" agreements. consensus
B* - 8 % ~ * ."> e I:-.- e e

96 Module TWO Building the Network Economy: Capabilities and Organization
FIGURE 3.6 Leading and Engaging Capabilities (contintred)
i
I Capabilities Business Design Requirements
Ingrained Shared values are widely communicated, routinely reevaluated, and values evident in how everyone in the organization treats customers, suppliers,
i partners, aqd each other.
i The strategy of the firm and its organization design are consistent with i ts espoused mission and values. The organization considers the interests of-and fulfills i ts obligations
i I
to-all of i t s stakeholders, including customers, suppliers, partners, I employees, and investors. 1 The organization fulfills i t s obligations to society and contributes posi- 1 tively to the communities in which it op8fates.
i The company is consistently ranked as "highly admired" by industry
I analysts, business and government leaders, and the general public.
PepsiCo is a firm that built a big-small company long before it became fashion- able.22 As early as the 1960s PepsiCo executives had emphasized divisional auton- omy and decentralization. During the 1980s, the newly appointed CEO, Wayne Cal- loway, pushed the concept further as he embraced the idea that success would come only if all employees experienced the same sense of ownership and excitement in growing the business that senior executives had always felt. In his words, "all 450,000 employees must be chief executive of their corner of our world."
The organization Calloway created combined (1) a shared and highly compelling vision for the future of the company, (2) a culture that stressed entrepreneurial deci- sion making and action, and (3) incentives that rewarded aggressive growth. As Pepsi- Co's spans of control increased to provide the desired organizational agility, younger, "empowered" employees were pressured to deliver on grueling growth goals with low levels of supervision. The potential for problems was exacerbated by PepsiCo's global expansion.
As the organization grew and changed duiing the late 1980s and early 1990s, Cal- loway relied increasingly on leadership and shared values to hold the company to- gether. "All the changes, the empowerment, and the growth . . . employees hear a lot about that," he state:d. "But it's all pulled together by leadership and integrity."
What we mean by integrity is not just honesty; it's openness, trust, sharing rewards, and sharing respolisibility . . . We spend a lot of time taking out layers, taking out reporting structure, and talking about empowerment. . . As we do, the traditional structures and sysrems for holding our company together are gone. With 450,000 employees located all over the world and our spans of control and commitment to decentralization, you need [something to hold the company together]. All the auditors in the world can't ensure control-and even if they could, you'd never be
22~ee L. Applegate and L. Schlesinger, PepsiCo: A View from the Corporate OlYice (Harvard Business School Publishing No. 694-078).

Chapter 3 Building Networked Businesses 97
able to afford them. With empowerment you need shared values, integrity, and trust. I consider leadership of [PepsiCo's] value and integrity systems to be my most important role. This is not soft stuff-it's hard stuff; it will determine our future survival.
The blueprint for a big-small business discussed in this section describes the or- ganizational capabilities required to build and grow successful 2lst-century organ- izations. In the Network Economy, this blueprint often extends across organizational boundaries to enable a network of organizations and individuals who work together to accomplish shared goals and create value for all the participants. The next section describes emerging models for building and running value networks.
Building Value Networks
As was mentioned in Chapter 1, most organizations operate within a network of sup- pliers, producers, distributors, and retailers that work together to design, make, mar- ket, sell, and deliver products and services. These activities often are referred to as a value chain since they describe the steps through which the inputs from sup hers are transformed into outputs for customers that have an intrinsic market value! Ac- companying the physical value chain is a related information value chain through which the involved parties coordinate and control activities and an infrastructure on which firms do business.
As executives build the business blueprint for an organization, they must also consider the business blueprint for the value network within which they will oper- ate. As they do, they are confronted with two fundamental questions:
1. Which activities should we perform ourselves and which should we source from the outside?
2. How should we relate to outside parties, including customers, suppliers, distrib- utors,, business partners, and others?
Where Should Activities Be Performed? Value chain activities can be organized in three basic ways24 (see Table 3.1). First, all but the most routine value chain activities can be incorporated within a single "vertically integrated" firm. Second, one or more selective activities can be sourced from an external party. Finally, a collection of highly specialized independent firms can work together to perform, coordinate, and control value chain activities. This op- tion is often called virtual integration.
2 3 ~ . Porter, Competitive Strategy (New York: Free Press, 1995). 240. Williamson, Markets and Hierarchies (New York: Free Press, 1975); 0. Williamson, "Comparative Economic Organization: The Analysis of Discrete Structural Alternatives," Administrative Sciences Quarterly 36: 269-296, 1991; W . Powell, "Neither Market nor Hierarchy: Network Forms of Organization," Research in Organizational Behavior, 12:295-336, 1990.

98 Module Two Building the Network Economy: Capabilities and Organization
TABLE 3.1 Options for Structuring Market Activities
i Options Description
i Vertical integration Locate all but the most routine, transaction-oriented activities inside I the firm. a Selective sourcing Source selected activities from the outside. Traditionally, sourced activ-
ities were controlled through short-term contracts. I Virtual integration Become part of a network of highly specialized, independent parties I I that work together t o perform, coordinate, and control value chain
activities. 8
Traditionally, managers chose to locate an activity within organizational boundaries (i.e., vertically integrate) when a significant cost (or risk) was involved in managing it on the outside.25 Costs and risks increased when (1) a firm was required to make a sig- nificant investment in physical facilities, people, or management systems to integrate operations and coordinate and control activities with customers, suppliers, or partners, (2) the services or activities were critical to the effective and efficient delivery of the firm's products and services, or (3) a high degree of uncertainty surrounded the on- going nature of the relationship with outside parties, which in turn made it difficult to develop a comprehensive, structured contract to govern the partnership.
Eastman Kodak, for example, was highly vertically integrated well into the 1 9 8 0 s . ~ ~ The company was founded in the 1800s on the principle of .'commit- ment to quality," and its executives believed that the costs and risks associated with managing actxvities on the outside were greater than the benefits that would be achieved through sourcing. General Motors followed a similar strategy throughout the first half of the 1990s; many recall its familiar slogan: "Genuine GM Parts."
During the 1970s and 1980s visionary firms within a number of industries found that they could use IT to help manage the risks and cost of performing in- terorganizational transactions and ensuring interorganizational coordination and control of those transactions2' By establishing electronic linkages with suppli- ers, distributors, customers, and even competitors, electronic commerce pioneers were able to integrate and coordinate. cross-boundary activities much more effi- ciently, monitor operations more closely, and communicate with external organ- izations more interactively.
250. E. Williamson arid 5. G. Winter, The Nature o f the Firm (New York: Oxford Univer- sity Press, 1993). 2 6 ~ . M. Applegate and R. Montealegre, Eastman Kodak Co.: Managing lnformation S stems through Strategic Alliances (Haward Business School Publishing No. 192-030). "T. Malone, J . 'fates, and R. Benjamin, "Electronic Markets and Electronic Hierar- chies," Communications o f the ACM 484-497, vol. 6, 1987; J. L. McKenney and D. 0. Copeland, Waves o f Change: Business Evolution through lnformation Technology (Boston: HBS Press, 1995).

Chapter 3 Building Networked Businesses 99
TABLE 3.2 Relationship Options
1 Transaction Contract Partnership 1 -Basis o f Discrete exchange 3 Priopagreem'ent governs e,15haredgoals and processes interaction of goods, services, exchange (e.g., service for achieving them (e.g.,
and payments contract, lease, purchase collaborative product "CR @ s (simGle b~yer/seller'$~; agredeement):$t 4:~~ $development) a f
exchange) I
' Duration o f Immediate Usually short-term and Usually long-term and interaction defined by the contract defined by the
I relationship
integration
.Coordination .Supplya and;;&., a;$;> ~ernj",of contract .&.{$ and control demand (market) define procedures,
monitoring, and ;:c ..;- a+ repoping a * t G:*!
In forma tion Primarily one-way; One- or two-way; . f low limited in scope scope and amount XI 5 and arn0unt4~ " ~ 5 usu$ll"ydefiried a*:.
low level of in the contract customization a&s
' r r 7~ w*: " - " p i *CU i a i r " i r : c a
I;GJnterorganizationaI structures, processes, and systems;
a ~Lmutual~adjustment ,, Two-way (interactive); extensive exchange of
'gZgrich, ddtailed 4
information; dynamically changing; customizable
,..g ~3 a
How Should We Relate to Market Participants? All firms also make choices about the nature ofthe relationships that they develop with customers, suppliers, and other external industry participants. These choices fall along a continuum from transactions to contracts to partnerships28 (see Table 3.2).
Transactions involve the simple exchange of goods, services, and payments, usu- ally during a specific time period and with limited interaction or information shar- ing between the parties involved. The act of purchasing a brand-name item from a grocery store or retail outlet is an example of a transaction relationship.
In contractual relationships, the products or services to be provided by each party and the length of the relationship are well defined and clearly documented at the time the relationship is struck. The formal "terms of the contract" become the basis for coordinadng and controlling the exchange of goods, services, payments, and in- formation throughout the length of the contract.
Partnerships are required when the activities that are to be jointly managed are com- plex, uncertain, and critical to the success of the firms involved. Partnerships require
2 8 ~ . Granovetter, "Economic Action and Social Structure: The Problem of Ernbedded- ness," American Journal of Sociology 1:481-510, 1985; A. Stinchcornbe, "Contracts as Hierarchical Documents," in Organizational Theory and Project Management, ed. A. Stinchcornbe and C. Heirner (Bergen, Norwegian University Press, 121-171, 1985; J. Bradach and R. Eccles, "Price, Authority and Trust," Annual Review of Sociology 15:97-118, 1989.

100 Module Two Building the Nerwork Econorn)~: Capabilities and Organization
FIGURE 3.7 Impact of Information Technology on Virtual 2000s Market Integration
Evolution
2 $ Selective
1 9 8 0 ~ 1 8 ~ Early 1990s Sourcing w I
I I
Vertical Integration
I I
Transactions Contracts Partnerships
Relationships
shared goals, comp~lementary expertise and skills, and integration of processes and work across organizational boundaries. The exchange of goods and services is ongo-
' ing, and the interactions and relationships must adapt to the changing priorities of the parties involved. Partnerships often require significant investments in interorganiza- tional governance and management systems for carrying out, coordinating, and con- trolling shared activities. An example of an interorganizational governance system is the establishment of'an advisory board or joint equity board of directors. Ax1 example of an interorganizational management system is the joint development of service-level agreements (SLAs) and ongoing performance monitoring and management.
The framework depicted in Figure 3.7 integrates this analysis of market structure and market relationships into a single framework.29 Trends in market evolution over the second half of the 20th century are highlighted. These trends are discussed in the next section.
Evolving Market Structure and Relationships In the Industrial Economy organizations were built on proprietary capabilities and infrastructure. This made it difficult to integrate operations, share information, and coordinate and control activities across organizational boundaries, whether those
2 9 ~ e e L. M. Applegate, "Electronic Commerce," in The Technology Management Handbook, ed. Richard C. Dorf, (New York: CRC Press, 1999), for a more in-depth discus- sion of this framework.

Chapter 3 Building Networked Businesses 101
FIGURE 3.8 Proprietary Capabilities and Infrastructure Create Walls inside an Organization and among the Members of a Value Chain Network
I Capabilities and Infrastructure I
boundaries were between units within a firm or between market participants in a value chain network. In effect, the specialized "brick and mortar" infrastructure cre- ated "walls" that isolated groups within organizations and market participants within an industry (see Figure 3.8).
As firms grew and became more complex, it became harder and harder to coor- dinate and control multiple market relationships. Over time, many large, growing firms vertically integrated: They bought or built the capabilities and infrastructure required to perform all but the most routine market transactions and structured con- tractual relationships.
But specialized infrastructures and capabilities continued to isolate functional units within organizations as activities were brought inside. Corporate headquarters expanded dramatically during the mid-1900s as information analysts, controllers, and staff attempted to coordinate and control the increasingly complex set of value chain activities performed inside the organization. So too did hierarchical reporting structures as deep layers of middle managers were added to ensure that strategic ob- jectives, plans, and work procedures were passed down the organization and per- formance information was passed up.
By the late 1970s the giants of the Industrial Economy had grown to become multinational conglomerates, which were plagued with deep management hierar- chies, loated corporate headquarters, and costly duplication of resources. During
\J the 1980s, everaged buyout firms stepped in to break apart these sluggish industrial giants and release the value trapped within them. To prevent breakup by an outside party, many companies hastened to shed noncore assets. This enabled an increased focus on, and improved productivity of, the "core competencies" that remained in- side. Over time, selective sourcing replaced vertical integration.
As organizational assets and businesses were spun out, companies sought better ways to improve the ability to do business with outside parties. Proprietary information and communication systems were often built to coordinate and control transactions and the flow of information among market participants. Enterprise resource planning (ERP) systems and related enterprise integration software packages were implemented to co- ordinate'and control transactions and the flow of information within organizational boundaries. As they automated internal and external operating and management
102 Module TWO Building the Network Economy: Capabilities and Organization
processes, large companies began to evolve the capabilities associated with a big-small organization.30
While it created windows within the walls that separated organizational units and market participants, the impact of IT-enabled operations and management during the 1980s and early 1990s was limited. The technology infrastructure was costly to de- velop, took years to build, and, most important, was built on a proprietary and spe- cialized technology infrastructure. Therefore, organizations were able to apply this ap- proach only to the most critical processes and strategic relationships (for example, Wal-Mart's use of information technology to link key suppliers and enable them to co- ordinate and control inventory ordering, fulfillment, and replenishment). Another fac- tor that limited the use and benefits of electronic integration was the fact that early sys- tems achieved virtual business integration by "hard-coding" operating procedures and rules into the technology. This made the resultant systems and IT-enabled processes exceedingly difficult and costly to operate, maintain,' and change. Finally, the special- ized nature of the systems limited the ability to reuse technology and capabilities built for one process when redesigning and virtually integrating another process.
As we enter the 2 1st century, networked technologies, including the Internet, the World Wide Web, intelligent agents, and modular system designs, are providing a densely connected, flexible, yet robust infrastructure for sharing information and co- ordinating work. The shift to an all-digital standard for creating, packaging, storing, and sharing voice, video, and data and the accompanying shift to mobile communi- cations are enabling people to connect to this infrastructure any way, any place, and any time. This nonproprietary and shared internetworked infrastructure dramati- cally decreases the cost and time needed to connect, transact business, share real- time information, and, when necessary, disconnect. It also increases the range of ac- tivities and transactions that can be performed online and the ease with which those activities are managed and maintained across organizational boundaries.
Until recently, most people believed that these new capabilities and infrastruc- tures would cause consolidated industries to fragment as neutral third-part y players entered the market to provide the platform on which participants within an industry and across industries would do business. It was believed that the dominant impact of the Internet would be to create a shift toward virtually integrated market struc- tures within which many small, specialized participants would relate through a se- ries of market transactions and short-te:rm contracts. Indeed, during the late 1990s, new entrants such as eBay and Amazon.com quickly assumed positions of power as channel facilitators, connecting sellers and buyers within disaggregated, virtually in- tegrated consumer-to-cdnsumer (C2C) Internet markets.
In the late 1990s, new entrants such as ComerceOne (www.comerceone.com) and Ventro, now called NexPrise ( m ~ . n e x ~ r i s e . c o m ) , ~ ~ announced their intent to become channel fac~~litators within disaggregated business-to-business (B'B) mar- kets. But the dot-con1 demise of 2000 and 2001 caused these independent players to
3 0 ~ . M . Applegate, Emerging Network Business Models: Lessons from the Field (Harvard Business School Publishing No. 801-172); 1. M . Applegate, "Time for the Big Small Company," Financial Times: Mastering Information Management, March 29, 1999. 3 ' ~ e e L. M. Applegate and M . Collura, Ventro: Builder of B2B Businesses (Harvard Business School Publishing No. 801-042).

Chapter 3 Building Networked Businesses 103
lose power. By 2002, established players had stepped in to fill the void, launching jointly owned industry coalitions to coordinate global, industrywide supply andlor distribution channel activities. In many industries, these coalitions coordinated with e-commerce network infrastructure providers, but ultimate power usually rested with the established industry players rather than the infrastructure providers.
Global Healthcare Exchange (GHX) and Healthcare Purchasing Partners Inter- national (HPPI), which were discussed in Chapter 1, are examples of B2B Internet market facilitators that use a combination of transactions, short-term contracts, and partnerships to coordinate and control operations within a virtually integrated mar- ket structure. Covisint, formed in February 2000 through a joint venture between Ford Motor Company, General Motors, DaimlerChrysler, Oracle, and Com- merceone, is an example of a channel facilitator within a virtual supply chain mar- ket for the global automobile industry. By January 2002, l l automobile manufac- turers and over 5,000 suppliers from around the world were participating in the Covisint network.32 During 2001, over $50 billion worth of online bids flowed through Covisint's Online Auction service and over $100 billion in future program contracts flowed through its Quote Manager service.33 The potential scope of these virtual B2B marketplaces is staggering when one considers that in May 2002, Cov- isint managed a four-day auction during which DaimlerChrysler purchased approx- imately $2.6 billion worth of auto parts.34 By comparison, eBay reported gross mer- chandise sales of $2.7 billion during the entire fourth quarter of 2001.~'
While we are seeing increasing virtual integration in the global automobile in- dustry, we are not seeing a corresponding shift to a more egalitarian power base. Thus, it is unclear at this time whether B2B automobile markets will experience in- creasing consolidation or increasing fragmentation over time. Over the last year we have seen market structures emerge to link networks of industry players. But unlike the health-care original equipment manufacturer (OEM) networks that link to sup- plier networks, the automobile industry continues to maintain its "tiered" industry structure. For example, in 2001 Covisint launched the Ford Supplier Network (an au- tomobile manufacturer portal), which connected Ford Motor Company to its large and midsize suppliers. In 2002 Covisint announced that it would build similar por- tals for two top-tier suppliers, Delphi and Johnson Controls. These supplier portals eventually would connect thousands of "Tier 2 and 3" suppliers. These coalition- based B2B markets differ from the C2C (peer-to-peer) markets, yet all are examples of the increasing trend toward virtually integrated markets. Figure 3.9 depicts the Covisint network.
While we see a shift toward increasing virtual integration in some industries, we also see examples of increasing vertical integration, especially in industries where there is a need for the deployment of a new capital-intensive platform upon which the industry will conduct business (for example, the cable industry and mobile
1
32~peech made by Covisint CEO, Kevin English, at the Automotive News Congress, January 16, 2002. 3 3 ~ . Loftus, "Making it Work," Wall Street Journal Online, February 12, 2002. 341bid. 3 5 e ~ a y press release, January 15, ZOO2 (www.ebay.com).

104 Module Two Building the Network Economy: Capabilities and Organization
FIGURE 3.9 Covisint's Role in the Virtually Integrated Global Automobile Market
$ A contracts j Partnerships Contracts & j ' , Transactions i Transactions I
3rd Party Logistics Technology Partners (2) ; Providers (thousands) em i ! i Contracts cF:
Other +--i Transacriorrs
telecommunications). The historic AOL Time Warner merger provides a glimpse of the extent of vertical integration that can occur within and across previously distinct market segments.
With the completion of the merger in January 2001, the new AOL Time Warner rep- resented a vertically integrated megacorporation that owned content, packaging, and distribution businesses within the publishing, filmed entertainment, music, sports, and news industries, to name just a few. While expansion of its cable franchise required significant capital, its Internet network infrastructure required little change to enable it to support the packaging and distribution needs of its content businesses. As a result, rather than vertically integrate its businesses inside the corporation, AOL Time Warner was able to leave them separate.
Each AOL Time Warner business was able to focus its resources and energy to- ward building best-in-class products and services for customers in its tiistinct in-

Chapter 3 Building Networked Businesses 105
FIGURE 3.1 0 AOL Time Warner's Virtually Integrated Organization within a Vertically Integrated Market
Content Businesses Consumers Distribution Businesses
I
Market Facilitation
Intranet a, AOL ~ i k e Warner
Interactive
EiI Shared Leadership
-. w * Shared Management
Ekd Shared Operations
H Shared Infrastructure
New Media
Traditional Dial-up/ISP
Traditional Cable
Intranet c=
dustry segment. In addition, each unit of the merged company continued to distrib- ute its products and services across traditional channels. If the company had stopped there, it would have resembled one of the large conglomerates of the 1980s within which synergies (if they were achieved) came from traditional market mechanisms (e.g., transactions-supported by complex transfer pricing-and structured con- tracts). But AOL Time Warner executives developed a new unit-AOL Time Warner Interactive-that was charged with integrating the media channels and content that would transform the industry. This new unit mirrored the role and actions of inde- pendent channel facilitators such as eBay and Yahoo! and coalition channel facilita- tors such as Covisint and GHX. The result was a virtually integrated market within a vertically integrated industry (see Figure 3.10).

106 Module TWO Building the Network h'conomy: Capabilities and Organization
FIGURE 3.11 Four irtual ~ e e L t o -
Networked &y Peer Networks
Market Models Virtual Integration Virtual Coalition
2 Selective
3 Sourcing rn
) -*- ~ e ~ e c t i v e Sourcing I Networks
Vertical Integration
Networked Organizations within Vertically
Transactions Contracts Partnerships
Relationships
In summary, in 2002 we are seeing the emergence of four network market mod- els (see Figure 3.11). Virtual peer-to-peer networks are composed of individuals, teams, and small businesses that relate to one another primarily through market- h v e n transactions on publicly owned networks operated by neutral lhird-party channel facilitators (e.g., eBay and Yahoo). Virtual coalition networks are composed of businesses of varying size that relate to one another through a combination of market-driven transactions, short- and long-term contracts, and partnerships across a combination of public and privately owned networks operated by joint equity coalitions (e.g., Covisint and GHX). Virtually integrated organizations w~thin verti- cally integrated markets are composed of independent, focused businesses and units within an organizalion that relate to one another through a combination of internal market-driven transactions, contracts, and partnerships across privately owned net- works operated by corporate headquarters or one of the units. Finally, many compa- nies continue to do business within selective sourcing networks composed of a com- pany's key suppliers, customers, or partners that relate to one another through a combination of internal and external market-driven transactions, contracts, and part- nerships across privately owned networks that often are maintained by one of the parties. All four of these value network. models develop shared infrastructure and ca- pabilities that unite the three levels of a business blueprint--operating and innovat- ing, managing and learning, and leading and engaging-across a network of entre- preneurial units insilde and outside a f ~rm.

Chapter 3 Building Networked Businesses 107
Summary Executives made significant efforts during the last decade to reorganize to meet the challenges of operating in a more dynamic, hypercompetitive world. But as we entered the 2 1 st century, it became clear that even more radical change is required. As the In- ternet transforms markets, industries, and the organizations that compete within them, executives are being forced to respond even more quickly, deliver higher-quality and more customized products and services, and cut costs even more deeply. In large com- panies during the 1980s and 1990s, layers of management were cut and spans of au- thority were increased to the point where many worried that their organizations would spin out of control. Entrepreneurial start-ups of the middle to late 1990s were required to "get big fast" without losing their agility, speed, and responsiveness to local needs. In short, the assumptions behind traditional organizational models, such as the hierar- chy and the entrepreneurial model, were pushed to the limit and were found lacking.
It has been shown time and time again in history that crisis is a precondition for the emergence of a new theory or But when presented with crisis, most people do not immediately reject existing models. Instead, they attempt incremental adjust-
- ments that over time begin to blur the fundamental structure and assumptions on which the old models were based. Practitioners are often the first to lose sight of old models as the familiar rules for solving problems become ineffective. At some point, total re- construction is required. During the transition, however, there is frequently an overlap between the problems that can be solved by the old and new models. But no matter which is used, there is a decisive difference in the modes of solution.
This appears to be the point at which we now find ourselves. A crisis, largely driven by a fundamental mismatch between environmental demands and organiza- tional capabilities, has called into question many of the assumptions of traditional organizational models. Academic thinking in this area is being led by practice. The lessons from managers in the field suggest that a new organizational model is emerging that puts the power of today's technologies in the hands of a more knowl- edgeable workforce to create networks of organizations that can act big and small at the same time. But these new models and capabilities are built on design principles we already know. The steps listed below can be used to guide you as you build suc- cessful big-small busine~ses.~'
A Step-by-step Approach to Analyzing Markets and Capabilities Step 1: Define the stream of value-creating activities required to execute strategy.
Determine which activities you will perform inside your organization and which can be performed by outside parties.
Step 2: Determine the nature of the relationship you will have with customers, sup- pliers, partners, and other external market participants.
3 6 ~ . Kuhn, The Structure o f Scientific Revolution (Chicago: University of Chicago Press, 1970). 3 7 ~ e e M. Collura and L. M. Applegate, "Capability Assessment Tool," in Building E-Businesses Online (Haward Business School Publishing, No. 801-232).

108 Module Two Building the Network Economy: Capabilities urrd Organization
Step 3: Define the network market model that is most appropriate for your business and industry.
Step 4: Conduct a high-level audit of the capabilities required at the three levels specified in your business blueprint.
Operating and znnovating capabilities: Assess your ability to operate with preci- sion while innovating and personalizing to ensure a best-in-class experience for customers, suppliers, partners, and other members of the markets wi.thin which you do business,.
Managing and learning capabilitit!~: Assess your ability to manage routine oper- ations with control and efficiency while enabling individuals and teams inside your firm and across firm boundaries to "learn by doing."
Leading and en,gaging capabilities: Assess your ability to develop visionary yet pragmatic leaders and to filly engage individuals, teams, partners, customers, and suppliers to partrcipate energetically in defining direction and accomplishing goals.
Step 5: Review findings and identify strengths and weaknesses. Discuss the find- ings with elmployees, customers, suppliers, partners, and industry experts.
Step 6: Develop a set of initiatives and prioritize. Define an agenda for change.
The following questions can be used by executives to evaluate an organization's capabilities.
1. What are your organization's core capabilities? In general, do your colleagues, customers, business partners, and other interested parties share your beliefs about your core capabilities, strengths, and weaknesses?
2. What operating processes, policies, structures, and systems must be changed to enable you to operate efficiently while also improving your ability to innovate quickly and successfully?
3. What management systems (e.g., planning and budgeting, performance man- agement, human resource management, business development, and alliance management) must be changed to enable you to ensure that the company is in control yet is able to "learn by doing"?
4. Is leadership stressed throughout the company? What organizational structures, incentives, and cultural changes need to be made to enable the company to act both big and small simultaneously?
5. Within which market or markets do you currently participate? Are you partici- pating in the right markets? What is the structure of the markets within which you currently do business? How do market participants relate? How have these markets evolved over time? How do you expect them to evolve in the future?
6. Given your current and future strategy, what is the stream of activities that must be accomp1ishe:d to develop products and services that create value for all stake- holders? Which of these activities should you perform and which should you source from the outside?

Chapter 3 Building Nehvorked Businesses 109
7. How should you relate to outside parties, including customers, suppliers, dis- tributors, business partners, and others?
8. Are you and your customers, suppliers, and partners capturing the full value that can be achieved by streamlining and integrating value chain activities inside and outside your respective organizations? Are there opportunities to eliminate in- termediaries, simplify and streamline product or service delivery, dramatically improve quality, or decrease costs?
9. Is there an opportunity for you to become a channel facilitator, coordinating and controlling the flow of transactions, information, and interactions among mar- ket participants? Should you own the infrastructure upon which market partici- pants do business?
10. Are you at risk for disintermediation? Are your products and services at risk for potential~commoditization andlor obsolescence? What actions should you take to prevent these-risks and protect market share and price?
1 1. Is your firm's technical infrastructure appropriate for the new types of e-commerce you are considering? Do you maintain an appropriate balance between experi- mentation and control? Have you instituted appropriate levels of security and reliability? Are your systems flexible enough to respond to dramatic changes in capacity requirements and service offerings?
12. What are key areas of improvement that must be addressed immediately? Who needs to address these problems? What additional weaknesses or gaps should be improved in the longer term?

Characteristics of the Hierarchy, Entrepreneurial and Networked Organization ' Characteristic Hierarchy Fvtrepreneuria! Networked
Process Process activities segregated Process activities defined on an Process activities integrated and integration and into distinct tasks managed by ongoing basis by the people synchronized through the flow of I
synchronization functions. doing the work. information in IT systems. Activities are synchronized Activities synchronized through Changes discussed and planned during yearly planning sessions. ad hoc discussion (face-to-face, through frequent interactions among - e-mail, phone). those doing the work (face-to-face,
e-mail, phone). In the case of unstructured and uncertain activities, teams may meet
, daily or weekly t o plan activities.
1 Process cycle Operating cycle time based on The operating cycle time based Information on the market, industry, time organization's management on the cycle time of changes in and operations available and acted
cycle time. the business environment. on in real time. l
a For highly structured, routine, Operating activities not The cycle time of operating activities
i automated processes (e.g.. structured; as a result, all approaches the cycle time of changes , factory operations), cycle time activities managed in the same, in the business environment.
I can be shortened. unstructured way. I
In unstructured situations, time 1 and inventory buffers used t o
I . manage uncertainty. I
. - -. -- - -. __ __ . - - -_ ._ _- -- _ . .__ - _ _^ ___I ._____- .- . - - -8

I j Characteristic*
i P ~ O C ~ S S
1 complexity i i
I Management 1 cycle fiine 3
i I I .
i C .
I Scope and a
granularity o f business
i understanding * %
Hierarchy
The inherent complexity of the business environment finimized through structure andslow response t o change. a
Standard products and services mass;produced for mass markets to reduce business complexity. Processes structured,to reduce
a operating c~rnplexiiy;~ - %
- ", , -*a
Defined around yearly planning and budgeting systems. Yearly and quarterly performance monitoring and reporting dictated by country-level regulations for public and private firms.
Understanding of business limited to specific job:an 'a
employee is hired to do. At operating levels, scope is limited
j: t o a specific task. Only,top management team understand; business dynamics across scope
; of e?terprise,,byt depth of " understanding of any h e
portion of the business is limited. Employees at all levels unable to link s~ecific decisions and actions to the firm's overall performance. Planning targets and goals set
: on a yearly basis andmonitored and adjusted quarterly. This results in quarterly cycles of feedback/feedforward Understanding of business dynamics predicated on the organization operatipg as , . origiGally str@tured. ?' P"
Entrepreneurial ,","$I. %a *.,Networked
Start-up firms offer a limited Despite siqnificant business com~lexitv. / set t o a limited parket. _ real-time ~nformation and . '
Within this simple busing& +**:* sophisticated analytical t ~o l~enab le - " - ! environment, significant * products and servkes t o be customized customization provided t o for increasingly smaller customer ensure that products meet the '%?:* segments. -, - a
requirements of individual ~t the limit:a company can ' customers. personalize for a "market of one."
P a *: ;, Rea!;time information and sophisticat~d
v s : analytics enable a large firm t6'manage complexity directly rather than
i d managing through complexity 4- ";, B~A. % reduction. *:
Management processes defined Real-time information and reporting by the founder, often ad hoc. enables the management cy5lStime a
Direct involvement of Me-" ' t o b"e*tied diiectly to"the opkrating
founder in most decisions and cycle, which in turn has been timed activities causes the management . to the inherent cycle time cycle time t o be timed ditectly business environment. t o the business cycle.
Because of their direct i Detailed information on the market, ment in all activities and*". ind6stry and business performance, +=
decisions, founders and and operations enables operating employees have an in-dep teams (which may include customers, understanding o f the busi suppliers, and business partners) t o : Business performance mon refine and adjust goals and activities and communicated in real time. within the scope o f their authoritv. $nabling founders and .g bf& basgd on changes in,the business- , employees t o link actions"to a~ environment. performance in al-eataime cycle Operating teams rather than individ- of feedbacvfeedforwar,d> + uals,have authority vver a broader set "Operatidns c6ntinually adjusted"?? o f bisiness %ivities (procesies), and : and refined in an ad hoc- senior management, like the founders
in an entrepreneurial venture, takes a a- " . more active role in monitoring business
operations and participating in high- risk decisions.
*&-& $3 a:+ 8 a:
J
(continued)

Characteristic Hierarchy
Information and Employee understanding of business literacy business dynamics and
information limited to specific assigned tasks.
Boundaries and Activities and authority values segmented so that no one
individual has the power or authority (short of sabotage) to cause irreparable harm to company (even the CEO reports to a board of directors). In areas of high risk, special security precautions (e.g., re- stricted access, direct supervision) prevent sabotage. Since broad decision-making authority is limited to upper levels of management, company- wide value systems are not crucial.
Units of work and Work.highly segregated by chain of c o m ~ n d function with duplication of
resources within each operating unit. Deep chain of command with functional supervisors reporting to several layers of functional managers, who report through business unit heads to corporate headquarters.
Span of Each manaqer su~ewises five management to seven direct reports.
Entrepreneurial Networked
Employees and founders have access to all information required to run the company and are , expected to use that information to solve problems, make decisions, and take actions to accomplish firm's goals.
Employees at all levels have access to I information on business goals and operations across a wide range of ! activities and. working in teams within the scope of their collective authority, are expected to use that information to make decisions and take actions to accomplish firm's goals.
Boundaries and values created As decision authority is pushed down, in real time and transmitted shared values become an important directly by founders. component of strategic control. Founders directly involved in 1 most decisions and actions. The size of the company limits s 1 risk to the founders and a 1 small number of investors. 1
Simple, functional chain of Flat, team-based chains of command. command. Market-focused operating teams Flat chain of command (three composed of functional managers or less) with functional report to business unit managers, who manages reporting directly to report to corporate headquarters. the founder. Broad chains of authority with work
teams reporting to operating management teams.
Varies with the size and stage Spans of 30 or more are cnmrnnn I of development. Spans of more than 10 are common.

,+=. i Characteristic$;Er
s - # m
I Corporate 1 headquarters
i
m 8
3:~ Hierarchy
Large corporate headquarters staff assumes major responsibility for planning, budgeting, and performance management. Large staff of analysts required to plan,erfronitor, and coo~d~inate work. "
-a 7 *
2, Entrepreneurid - * ~ingl; site for headquarters and operations. Little formal planning, budgeting, and performance monitoring. Operations planned, : coordinated, and mana"gd by those who do the work.
Work is coordinated primarily through direct supe~ision and the chain of comman
Work is coordinated through ad hoc adjustments by those directly invoivld in the wo
- d
levels of firm, roles bility defined in scriptions.
koles based on functional expertise and skills.
~mp^lo~ees advan'ce through functional hierarchical progression. Seniority is as important as (and in some organizations more important than) expertise-and performance as a criterion for advancement.
+. * r Bi " "8 *
Minimal to no form specification of roles. Emphasis on hiring innovators ("pioneers").
Career progression is often lateral. In a rapidly growing firm, employees may move down in rank as senior managers are hiredto ensure the leadership required by the more complex organization. Original employees may leave at this point.
- 7 . -
+a*;<as * * a - ~etvii$&$d f - 1
small corporate heaJquarters with minimal responsibility for planning, 1 performance monitoring, and orga- nizationwide resource management.
- place, planning, coo<dtnating, and
While formal plannihg budgeting, , andperFormance*e:i+ring still take. I
managing operating activities take place in operating units.
Work coordinated through the integrated flow of information. ~out ine work coordinated through real-time feed backea,Gd adjustment. "+ Important decision~~and actions coor- dinated through meetings of operating managers and employees who analyze real-time operating infor- mation to adjust and refine goals theic execution con%jnually.
*&* All:organizations. Pe"&rdless of si require innov-i(lneersr') and operators ("settlers"). Senior executive~~must be skilled at leading and engaging. Sekf;managing wo$$eams define wb7k and how it ge5s:done. -
Minimal opportunities for advancement within flat hierarchical chains of command. Innovators may ha$ean opportunity-e5%- to launch and grow new businesses. Expanded jobs, increased lateral movement, and ownership incentives make work environment more chal- lenging and rewarding. 1


Making the Case for Networked Business1
The valuation of New Economy players represents a bet by the world's financial markets that a few companies will leverage the Internet to fundamentally change the competitive game in their industries. It is a gamble that powerful, low-cost business models will emerge, that new businesses will rise from disintermediated value chains, and that some companies will exert such influence that they will generate extraordinary long-term shareholder returns. [While] we cannot predict the winners of the e-races . . . we can be sure that the winners will be few and the losers will be many.2
Have you found it difficult to separate fact from hype when attempting to assess the value of networked business opportunities? Rest assured that you are not alone.
It's tough to make decisions and'take actions when the world is changing at warp speed. We knew how to build a company and create value in the Industrial Economy, but we are just beginning to define what makes a successful business in the Network Economy. This chapter examines how the Internet is redefining the fundamental economics on which successful businesses are built. New approaches and'metrics for measuring value are required to take advantage of the new opportunities.
his chapter is adapted from papers and materials published in L. M. Applegate, "Analyzing Business Value," in Building Businesses in a Networked Economy (Haward Business School Publishing No. 802-101). *c. Lucier and J. Torsilieri, "The Trillion-Dollar Race to E," Business &Strategy 18:6-8 and 13-14, first quarter 2000.

11 6 Module TWO Building the Network E,.-onomy: Capabilities and Orgunizution
The chapter begins with a discussion of the changing economics that drive busi- ness value. It then presents a framework for linking strategy to execution to results and ends with a discussion of how to develop the business case for evaluating and prioritizing digital business opportunities.
Changing Economics
Industrial Economy businesses were built on internal economies of scale and scope. In contrast, Network Economy businesses are built on network economies of scale and scope. This shift from internal, specialized, and proprietary to external, net- worked, and shared economies of scale and scope has driven a very different ap- proach to building businesses and creating value.
Comparing Industrial and Netvvork Economics Successful Industrial Economy firms created economies ofscale-the ability to pro- duce and distribute products and services faster, better, and cheaper than competi- tors can-by building specialized plants, creating specialized jobs, and hiring spe- cialized worken3 Vet the launch of a new product category or business often meant building new plants, training new workers, and hiring new salespeople. As a result, economies of scope-the ability to leverage an existing business infrastructure to produce and distribute new products or launch new businesses-were limited to en- hancements in product design or features (see Figure 4.1). Because success was tied to proprietary and highly specialized brick and mortar infrastructures and face-to- face interactions, the capabilities thal enabled economies of scale and scope were built and closely guarded within a company's walls.
As we saw in earlier chapters, the key technological innovations of the Industrial Economy were production technologies such as the assembly line and mechanically operated machines. As firms grew, new management innovations such as job spe- cialization, hierarchical supervision, and pay-for-performance incentive systems were developed to exploit those techr~ologies. The 20th century entrepreneurs who successfully created businesses around those innovations flourished, and over time a dominant business model-the hierarchy-emerged.
The companies that were able to use those innovations to achieve economies of scale and scope the fastest created significant value and assumed a position of power in an industry. Over time, industries consolidated and several 1;xrge firms came to dominate, erecting powerful barriers to entry. Lacking the ability to share information with others, small suppliers, distributors, and consumers were dis- connected, doing business on the margins in industries dominated by large play- ers. Economists called these unconnected spaces in an organization, market, or
3~ more comprehensiv/e.discussion of Industrial Age economies of scale and scope can be found in A. D. Chandler, Scale and Scope: The Dynamics o f lndustrial Capitalism (Cambridge, MA: Ha~rvard University Press, 1990).

Chapter 4 Making the Case for Networked Business 1 17
FIGURE 4.1 Industrial Economies of Scale and Scope
Example of Industrial Economies of Scale: In the early 1900s, Ford Motor Company executives demonstrated that industrial technologies and management principles could enable the company to dramatically lower the cost and increase the output of cars in its assembly plants.
Example of Industrial Economies of Scope: Because of the specialized nature of the technology and processes used, Ford Motor Company executives found that economies of scope were limited. The decision to introduce new products, such as trucks, required that new plants 6e built. In fact, assembly plants were closed for several weeks each summer to enable new models of cars or trucks to be built in existing plants.

118 Module TWO Building the Networkl?conomy: Capabilities and Organization
industry network Those "holes" became a prime target for Internet entre- preneurs in the late 1990s.
While the key technological innovations of the Industrial Economy enabled economies of scale and scope in production, the technological innovalions of the Network Economy are improving economics of distribution, especially in relation to coordination, communication, and information sharing. Successful entrepreneur- ial organizations of the late 1990s such as America Online and eBay built businesses that leveraged a nonproprietaiy, shared Internet infrastructure to unite buyers and sellers in fragmented markets. By offering a compelling value propos~tion and a low-cost way to ccmnect, transact business, and share information, these Internet pi- oneers were able to create network economies of scale and scope.
Network economies of scale are achieved when a "community" of firms uses a common infrastructure and capabilities to produce and distribute products and serv- ices faster, better, and cheaper. Network economies of scope are achieved when a community of finns uses a common infrastructure and capabilities to launch new products and services, enter new markets, or build new businesses. For example, we saw in Chapter 3 that as a network market facilitator, Covisint provides a nonpro- prietary, shared infrastructure for the global automobile industry.
In early 2002, Covisint united its eight equity partners (the auto manufacturers DaimlerChrysler, Ford Motor Company, General Motors, Nissan, Renault, and PSA Peugeot Citroen and the technology firms CommerceOne and Oracle) with over 19 "Tier 1" suppliers (including Arvin Meritor, Delphi, Faurecia, Johnson Controls, and Siemens) and thousands of smaller (e.g., "Tier 2" and "Tier 3") suppliers. This "network of networks" all shared access to Covisint's Internet-enabled infrastructure and ~ a ~ a b i l i t i e s . ~ Community members used this infrastructure to conduct routine business and develop and execute proprietary strategies and capabilities.
Demonstrating its ability to dramatically increase network economies of scale, in spring 2001, Covisint hosted a four-day auction at which DaimlerChrysler pur- chased $2.6 billion worth of parts and components from suppliers located around the world6 (see Figure 4.2). Before Covisint, auto-supply auctions could take several days or weeks. Purchasing managers would invite a few suppliers to bid for a con- tract or order and suppliers would ma1 1 or fax bids without knowing which other sup- pliers were bidding. The process was costly, paper-intensive, and biased. . 4R. Burt, Structural Holes: The Social Structure of Competition (Cambridge, MA: Haward University Press.'1992). 'while it was built on the Internet's open standards, it is important to recognize that Covisint created proprietary technologies and organizational capabilities that were then shared by all the members of the Covisint networked community. As we will see, the members of the community were then able to use the shared infrastructure to develop and execute proprietary strategies for their firms. Understanding th~s important distinctic~n between what is proprietary to one member of the network and what is shared among all network members is critical to identifying and prioritizing opportunities and executing strategy in the Network Economy. 6 ~ . Loftus, "Making It Work," Wall Street Journal Online, February 11, ZOO2 (www.wsj.com).

Chapter 4 Making the Case for Networked Business 11 9 1 FIGURE 4.2 Network Economies of Scale and Scope 1
contracts & j Partnerships Contracts & Transactions , 1 Transactions 1
3rd Party egistics Technolo~y Partners (2) i Providers (thousands)
I
I 1 j Contracts & Other c--i Transactions
Example of Network Economies of Scale: Using Covisint's networked auction services, DaimlerChrysler dramatically lowered the cost and decreased the time for purchasing supplies.
Example of Network Economies of Scope: Covisint leveraged the infrastructure, capabilities, and community that it built for its first two network services (auctions and catalogs) to launch eight new services in less than one year.
Demonstrating its ability to dramatically increase network economies of scope, Covisint leveraged the infrastructure, capabilities, and community membership that it built for its initial online auction and catalog Web services to launch asset control services, collaboration services (including shared design collaboration and quote management), supply chain services (including fulfillment, supplier connections, and document exchange services), and quality services (including advanced quality

120 Module Two Building the Network Economy: Capabilities and Organization
FIGURE 4.3 Dave Perry's View of How Network Economics Enable Market Makers to Create Value
planning and problem solving). In addition, Covisint developed and hosted private- label automaker and supplier portals that operated within closed membership virtual private networks. By taking advantage of the nonproprietary, modular Internet tech- nology infrastructure, Covisint was able to launch these new products and services in less than one year, dramatically increasing the range of new business 'opportuni- ties that could be pursued while dramatically decreasing the cost and time to pursue them. In addition, Covisint provided its community members with a shared infra- structure on which each member of the community could dramatically increase net- work economies of scale and scope for its firm.
As we enter the Llst century, the Internet's flexible, robust, and ubiquitous platform for conducting business, sharing information, and coordinating work is opening win- dows in the brick aid mortar walls that separated people and work inside and outside a firm. By taking advantage of the shared platform, multiple firms can work together to produce and distribute products within markets that transcend geography and time.
In the Industrial Economy, the evolutionary process through which successful firms built new industries took decades to play out. In the Network Economy, we see new industries being created and established industries being transformcd within a few years. Dave Perry, chief executive officer (CEO) and founder of Chemdex and Ventro (the latter is now called Nexprise), explained the challenges that he faced in building businesses that would leverage network economies of scale and scope to transform markets and industries (see Figure 4.3):
Business-to-business e-commerce is about taking all the existing buyers and all the existing sellers who are already doing business together and putting yourself in

Chapter 4 Making the Case for Networked Business 121
between them and creating an Internet solution that allows them to do business together more effectively. The nice thing about it is that you don't have to get rid of the players in the market. You can go from 0 percent market share to, theoretically, 100 percent market share.
The hard thing about it is that you haven't done anything worthwhile until you have a critical mass of both buyers and sellers. You have no value whatsoever to a buyer until you have most of the sellers they need. Unfortunately, you're of no value to the sellers until you have the buyers they need . . . It quickly becomes obvious to most people that the more buyers and sellers you have, the more usefbl you are to both sides. Unfortunately, the path doesn't progress linearly. It's in fact very expo- nential. If you have 10 percent of the suppliers a buyer needs, you've created no value whatsoever. The same is true at 20 percent, the same is true at 30 percent, the same is true at 40 percent, and so on. You have to have the vast majority of what somebody needs as a buyer before they're going to find you useful, 80-plus percent in most markets. This is fundamental economies of scale-network economies of scale. The really powerful thing about it is that once you've created that critical mass of buyers and sellers [and the platform upon which they can do business], you have a very valuable entity and a very valuable asset, but until you get there, you've created nothing worthwhile and you can go out of business tomorrow and nobody cares.
As 2 1 st-century organizations such as Covisint and Ventro begin to test the full po- tential of network economies of scale and scope, the business logic that k e d invest- ment decision making in the Industrial Economy is being radically redefined. New ap- proaches to measuring performance and analyzing business value are required.
Linking Strategy to Execution to Results
For decades we have known that a single set of performance measures will not suf- fice when industries, markets, and the companies that compete within them are un- dergoing massive upheaval and change. In fact, decades ago the management guru Peter Drucker spoke of the need for a deep understanding of business fundamentals when one is managing in a turbulent en~ironment .~ "In turbulent times," he said, "an organization has to be managed to withstand sudden blows and avail itself of sud- den unexpected opportunities. This means that, in turbulent times, the fundamentals have to be managed-and managed well."
Today even the most seasoned managers reel at the rate of disruptive change. In today's turbulent environment, everyone involved in making decisions and taking actions must have access to a common set of performance measures that link strat- egy to execution and results. When linked together, these measures enable execu- tives to define a unique value proposition and manage for superior performance.
In Chapter 2 we presented a framework for building businesses and analyzing busi- ness models. That framework highlighted the fact that a business model consists of three key components: (1) a concept that defines the opportunity and strategy, (2) ca- pabilities that identify the resources required to exploit the opportunity and execute the
'P. Drucker, Managing in Turbulent Times (New York: Harper & Row, 1980).

122 Module TWO Building the Network E~:onomy: Capabilities and Organization
FIGURE 4.4 Linking Strategy to Execution to Results
PERFORMANCE FINANCIAL DRIVERS RESULTS
MARKET RESULTS
I EBITDA Free Cash Flow Market Value
Cost Drivers
Intangible Assets Employee Loyalty Customer Loyalty Partner Loyalty
Tangible/Financial Assets Net Working Capital Capital Expenditures (CAPEX)
C
strategy, and (3) a value proposition that identifies the benefits returned to all stake- holders and the results executives have achieved or expect to achieve. This business model framework provides the foundation for linking strategy to execution to results (see Figure 4.4).
Analyzing Performance Drivers As shown in Figure 4.4, the three components of a business model enable a broad- based approach to measuring the drivers of business performance that begins with analysis of the market opportunities, business capabilities, and value created. These three categories of measures link directly to revenues, costs, and assets, which in turn

Chapter 4 Making the Case for Networked Business 123
drive financial performance and, in the case of publicly held companies, capital mar- ket valuation. Executives in public sector agencies and nonprofit companies can use the framework by limiting measurement to the performance driver portion of the framework. Best practices and sample measures are summarized in Appendix 4A.
A firm's business concept defines the opportunities a firm will pursue and its strategy for capturing a dominant position in its industry and markets. Opportunity analysis includes a market assessment, analysis of product/service offerings and pricing, assessment of competitive and industry dynamics, and plans for evolution and growth of the business. The business conceptframes the assumptions used to forecast revenues.
Jeff Timrnons, a leading expert on entrepreneurship and an investor and board member in many new ventures, explained that an attractive opportunity is the foun- dation of successful entrepreneurship.'
An opportunity [should be] attractive, durable, and timely . . . For an opportunity to have these qualities, the "window of opportunity" must be opening and remain open long enough . . . An attractive new venture [must] sell to a market that is large and growing . . . [and should be] anchored in a product or service that creates or adds value for the buyer or the end user.
Paul Maeder, founder and managing general partner of Highland Capital Part- ners, explained the evaluation criteria that his venture capital firm uses to screen op- port~nit ies .~
When we invest in [early-stage] businesses, [we always ask]: Is this a unique [oppor- tunity]? Do we have a real shot at being first in the market? Is it a compelling enough proposition that people are going to be drawn to it, initially employees and managers, and ultimately customers? Are there barriers to entry that we can erect so that when other people see our good ideas they don't pile in? Can we build it with a reasonable amount of capital in a reasonable period of time? If the answers to those questions are satisfactory, we'll typically fund it.
Once the business concept has been defined and a strategy is in place to provide direction and focus, capabilities must be built to execute the strategy. Capability analysis begins with an assessment of resource requirements and availability (in- cluding leadership, people, partners, expertise, time, and money). It also includes an assessment of the organization and infrastructure that have been (or will be) created to enable efficient and effective use of those resources to enable the organization to accomplish its goals and execute its strategy. Analysis of an organization 5 capabil- ities frames the assumptions used to forecast costs.
As was discussed in Chapter 3, three levels of organizational capabilities and in- frastructure must be built. As will be seen in the next section, these three levels of capability provide the foundation for the development of an information technology
'J. Timmons, New Venture Creation (New York: McGraw-Hillllrwin, 1999), Part 1, pp. 3-21 1. ' ~ u t h o r interview with Paul Maeder, March 14, 2000.

124 Module TWO Building the Network E<,onomy: Capabilities and Organization
(IT) business value scorecard that can be used to forecast the benefits from invest- ments in building digital business capabilities.
Operating and innovating capabilititls include: (1) the core processes through which an organization converts inputs to outputs that create value for customers, suppliers, and partners (e.g., procurement, product development, service delivery, order fulfillment, marketing, and brand management), (2) the processes through which an organization continuously improves existing operations and launches new products, services, and businesses (e.g., new product development, business development, continuous im- provement, and quality management), and (3) the IT infrastructure that supports these processes (e.g., distributed information processing and transaction systems).
Managing and learning capabilities include: ( 1 ) the processes through which a firm plans, budgets, and monitors performance, (2) the organization design (e.g., units and di- visions, reporting structure, authority structure, and governance), (3) information, knowledge management, and decision-making processes, and (4) the IT infiastructure that supports these processes (e.g., management reporting and business intelligence sys- tems, decision support systems and tools, and databaseldata warehouse manligement).
Leading and engaging capabilities include: (1) human resource management sys- tems, (2) alliance and partnership management, (3) customer and supplier relationship management systems, and (4) the IT infrastructure that supports these processes (e.g., communication infrastructure and tools such as e-mail and voice mail, wireline and wireless communication systems, human resource management and customer rela- tionship management software, personalization systems, and services).
In the Network Economy, capability analysis extends across boundaries inside and outside the organization to inclucle shared resources, infrastructure, and capa- bilities made available by partners, suppliers, customers, and even competitors.
Value refers to the benefits delivered to investors and other stakeholders in an or- ganization. Value analysis begins with an assessment of the subjective and objective benefits delivered t'o customers, suppliers, partners, and employees. These benefits, in combination with an organization j. concept and capabilities, create the assets that drive financial and market performance.
The framework ior linking strategy to execution to results that is discussed in this section enables a broad-based approach to measuring performance that unites per- formance drivers with traditional financial measures and market value. (See Ap- pendix 4B for a discussion of traditional financial performance measures.) Perfor- mance drivers form the foundation for the assumptions used to forecast the impact of strategy and its execution on short-term and long-term earnings and market value. Table 4.1 presents ;m approach that executives can use to implement this approach to forecasting firm value.
When industries and organizations are stable and predictable, performance driv- ers and assumptions can be based on historical performance and comparisons with
'OT. Copeland, T. Koller, and J . Murrin, Valuation: Measuring and Managing the Value of Companies (New 'fork: Wiley, 2000); R. Brealy and 5. Myers, Principles of Corporate Finance (New York: IvlcGraw-Hill, 1984).

Chapter 4 Making the Case for Networked Business 125
TABLE 4.1 A Scenario-Based Approach to Valuation
/ Step 1: Define the purpose for the value assessment (e.g., seeking funding, buying a company, -investing in an established business).
Step 2ff?pick a point in the future when you expect your business strategy to deliver value (most venture capitalists choose three to five years, birt you may wish to shorten the time frame).
Step 3: Analyze the business concept and strategy and forecast market size, your share, and revenues. ldentify yearly changes that reflect how your firm and the market would reach this future state. List key assumptions used in constructing revenue forecasts. Talk with others and adjust assumptions.
Step 4: Analyze the capabilities and resources required to reach the future state and forecast the cost of building those capabilities and those acquiring resources. ldentify yearly costs and the resources that will be required by you and your partners, suppliers, and
2 3;sustomers: List key assumptions used in constructing cost forecasts. Talk with others and \ *"*:adjust assumptions. = U * * 6 / 1 - e
* , * a " : e
~tdpa5~$$8as<d~on this analysis, construc?@itimates of financial perforrhanc6 and market value P r k ~ a "a:gthat'reflect the "most likely" assum"ptions. Clearly state the performance drivers that
"form the foundation for the assumptions in your model. Step 6: Factor in the uncertainty in your assumptions by developing several scenarios that
represent upper and lower bounds on key variables in your forecasts. Most plans include scenarios that reflect the "most realistic case," "best case," and "worst case."
based on changes in key assumptions. Step 7: When appropriate, validate your model by using alternative approaches such as
discounted cash flow and comparable company analysis. Step 8: , Discuss the value analysis scenarios you have constructed with others and critique the
a >
:.findings and assumptions not just once but on a regular basis. Keep in mind that this * .'i * * * ( ..,$afialysis is based on highly un~ektain business judgments. As a resul$,,it is important to
2 g p,"$B@d*lh's" R
mBl*b@&Staydformed about what isthappenihQ in the market and indust$vour company, and 1 s, a, % $ a $,&&,
s:~" *~b~Z:b~ouc~community. - s l . Use the analys'is'as a baseline and update it often based on what you -" learn as you execute strategy and conduct business. Finally, be sure to set yp a djlnamic
and broad-based measurement system that collects real-time metrics of company and
I
I industry performance.
However, additional scenarios may be needed. Test the sensitivity of your forecasts
"comparable c ~ m ~ a n i e s . " ' ~ (See Appendix 4C for a discussion of commonly used valuation approaches.) Yet even in the most stable of times, the assumptions used to forecast organizational performance and value creation are, by their very nature, un- certain. The more volatile the business context, the more uncertain the assumptions. In the presence of disruptive technologies or rapidly changing business models, val- uations become highly suspect and must be evaluated and adjusted frequently.
Needless to say, traditional financial measures have been highly unreliable over the last few years. The difficulty that executives at AOL Time Warner and the ana- lysts that follow the company have had in providing realistic estimates of business performance highlights the need for a more comprehensive approach to measuring business value.

126 Module TWO Building the Network Economy: Capabilities and Organization
Developing the Business Case for IT
While the framework in Figure 4.4 has been shown to be useful for analyzing a busi- ness model and the links to shareholder value, it also can serve as the foundation for analyzing and prioritizing IT investments. Table 4.2 presents an IT business value scorecard that can be used to forecast benefits or conduct a postimplementation au- dit of IT projects. The scorecard distinguishes between two major categories of ben- efits. Type I benefits are delivered through investments in a networked IT infra- structure. Type I1 benefits are delivered through investments in digital business opportunities that lower cost, increase revenues, or increase on-balance-sheet or off- balance-sheet assets.
Benefits from Investments in Infrastructure Type I benefits arise from improvements in IT infrastructure, including computers, databases, data centers, Web hosting services, networks, and IT professionals. Most large, established companies assembled their IT infrastructure in a piecemeal fash- ion over the last 20 to 30 years. They adopted new technologies as they became avail- able and added them to the existing IT infrastructure without considering how the different technologies might have to work together in the future.
By the early 1900s, most companies' IT infrastructures had become a hodge- podge of incompatible and inefficient technologies that were costly and difficult to manage and maintain. At the same time, executives recognized that the ability to in- tegrate those technologies had become a competitive necessity. These trends con- verged and stimulated the transition to the Network Era of technology. (See Table 4.3 for an overview of the three eras ~Ftechnology evolution.)
The transition to the Network Era began not with the Internet but with the early "client-server" technologies of the late 1980s (examples include systcms from SAP and PeopleSol't). While this new approach promised network conmctivity, it did so at a tremendous cost. In fact, by 1997, a Gartner Group survey estimated that the cost of maintaining a client-server system was over $10,000 per worksta- tion per year.' '
The increase in the cost and complexity of IT infrastructure came at a time when senior managers were ruthlessly eliminating costs. Business managers complained loudly that they were paying too much for IT with too little business benefit. It took too long, they said, to realize new IT-enabled business opportunities, and systems were out of date before the projects had been fully implemented. Few non-IT pro- fessionals understood that the cost of maintaining and managing the IT infrastruc- ture often represented 80 percent or more of the yearly IT budget, leaving few re- sources to be directed toward creating business value.
By the mid-1990s the IT infrastructure in most companies had become an "un- derperforming asset" that needed to t ~ e cut with surgical precision and then made
"w. Kerwin, "TOC: New Technologies, New Benchmarks," Gartner Group Research Note (No. K-TOC-252), December 5, 1997.

TABLE 4.2 The I T Business Value Scorecard
a* >;a *,:qoals and Measures am;- / Categorib of *' v 4 . i
1 Benefits Internal External
/ lype I: Benefits from lnvekments in a Networked IT Infrastructure
FunctioKality lmprove infrastructure performance: "acreate an efficient, flexible onlineloffline and flexibility increase the functionality and range of platform for doing business with
'strategic options that can be pursued customers, suppliers, and partners
s$apmple measures: Decrease the cosf and10 measures: Decrease the cost and/ :ri"i. 8
A * , 4 ' *irhprove thTperformantd of internal IT ovegthe performance of doing bus-
operations; enable new IT applications ss online; decrease the time, cost, and t o be created at lower cost, in less time, risk of launching new online business and with less risk; expand the range of initiative~;~expand the reach of existing
a a m p ~ e m 6 s'e'pima' . ;@IT-enable(ag~usinesses acd the rangkiof 1, rir4, .-$internal IT i$i$iatives~.$$:. . . . . , g' " &am la@ 2 * @*
I business opportunities that can be "pursued.
I Type II: Benefits from Doing Business on a Networked IT Infrastructure 1 Commerce
a .g., 4
b-
+ lmprove internal operating efficie~@:>and : ; jtreamline and integrate channe(sfo .g:$d"ality O1l:q$:a
* l p *# *I ""market, c%%e new ch"annels, anam$" Sample measures: Internal process integrate multiple onlineloffline channels performance and work flow improvements; Sample measures: Supply chain or cost savings'or cost avo9\dance; increased - 4:
distribution channel performance .*:. quality; decieased cycle time " ~m~rovemehts; cost savings or cost
avoidance for the organization and i t s customers, suppliers, or partners; decreased time to market or just-in-time
"order replenishment; enabling of new channels to market andlor extending the reach and range of existing channels
!mprove th? performance of knowledge Improve the performance of knowledge , 3:workers and@enhan~e~$ganizationaI;~ flworkers in;customer, supplier, and.
learnina partner organizations; add "information - Sample measures: Enable individuals value" to <xisting products and services;
. , t o achieve tand exceed personal create new information-based products CS~W-. $pi" o n - @*;and seryicef., a \ In*
l a c performak$poals; inc?$&e the spe$d8 *,*, 2 a@% - and effectiveness of decision making; Sample deasures: Provide information increase the ability of the organization to customers, suppliers, and partners that to respond quickly and effective1 enables better decision making; charge a
a threats and,opportunitiesm &,.price premium for products and services based on information value added; launch new information-based products and services; increase revenue per user
satisfaction, engagement, and loyalty; create a culture of involvement, motivation, trust, and shared purpose I h I b
Sample measures: ena ah of time to fil l key positions; attrition rate; trends in hiring and retaining top talent (over time, by industry,,$y region),:, ."
d w a j 4
add ne<w revenuestreams
ttract and retain high-quality customers, suppliers, partners, and investors;
, increase external stakeholders' satisfactio?, engagement, and loxalty
* a
Sample deasures: Customer, supplier, and partner satisfaction and lifetime value; average revenues per customer and trend over time;,level of personalization available and percent that use it; churn rate"

128 Module TWO Building the Network Economy: Capabilities and Organization
TABLE 4.3 Comparing the Three Eras of IT Evolution
Mainframe Era Microcomputer Era Network Era Time Frame 1950s t o 1970s 1980s to Early 1990s 1990s t o Present
I Dominant Mainframe, stand-alone Stand-alone microcomputer Client-sewer, Internet, technology applications, datatases and end-user tools (e.g., browser, and hypertext
word processing, spreadsheets)
I
Organization "Data management" "Information management" "Knowledge management" metaphor Hierarchy Entreprenec~rial organization Networked business
community I
Primary ITrole "Centralized intelligence" "Decentralized intelligence" "Shared intelligence"
Automate back-office Provide information and tools Transform organizations and activities to improve decision making markets to create business ,
and knovvledge worker value performance
1 Typical users IT specialists IT-literate business analysts Everyone
Location o f use Computer room
Planning process
Justification
Desktop Everywhere
Yearly budgeting Individual expense Business development and strategic planning
Cost savings Increased decision quality and Business v a l ~ e personal performance
a Implementation Independent projects Ad hoc Strategic initiatives (See Appendix A4)
capable of greater flexibility and performance. Infrastructure benefits are designed to achieve this goal. The shift to networked IT infrastructure dramatically reduces the cost of maintaining and running the IT infrastructure of a company or industry while simultaneously improving the functionality needed to support critical busi- ness operations.
In many cases, moving to a new networked IT infrastructure makes it possible to pursue new IT-enabled business opportunities more quickly than was possible with the old platform and at less cost. And if industry-standard Internet technologies are used, managers can extend the scope of the business opportunities that can be pur- sued to reach new markets and launch new digital businesses without haling to in-

Chapter 4 Making the Case for Networked Business 129
FIGURE 4.5 Benefits of Investments in Infrastructure
Increased Number of Strategic Options That Can Be Pursued
A
I
B I I I
initial investment t
Increased cumulative benefit from IT portfolio
vest in a new platform. Thus, the financial risk of pursuing new business-building opportunities can be minimized. The increased flexibility and speed with which such opportunities can be pursued expand the "options value" of investments in infra- structure and enable a networked organization such as AOL Time Warner or a net- work of organizations such as Covisint to achieve network economies of scale and scope (see Figure 4.5).
Thinking of IT investments as grodth options challenges conventional wisdom about IT budgeting. In financial terms, a securities option gives the owner the right

130 Module TWO Building the Network Economy: Capabilities and Organization
(as distinct from the obligation) to buy a security at a fixed, predetermined price (called the exercise price) on or before some fixed date (the maturity date). Impor- tant features of securities options that determine value include: (1) the nature of fu- ture benefits (risky projects often generate the highest returns), and (2) the length of time one has to exercise the option (the longer the time frame, the greater the pres- ent value of the option).
Similarly, an IT option provides managers with the right (as distinct from the obligation) to pursue value-added IT-enabled business opportunities a t a lower cost, more quickly, and with less inherent risk throughout the useful life of the technology. Features of an IT option that determine value include: (1) potential benefits from value-creating business opportunities that could be pursued (the value of these benefits depends on the number, type, and range of business op- portunities), (2) the ability to pursue riskier opportunities where there is a higher potential return, and (3) the length of time for capturing value (keeping in mind that IT options can be exercised over and over throughout the useful life of the technology).
Benefits from Doing Business on a Networked Infrastructure With a flexible and robust IT networked infrastructure in place, a company is poised to pursue the Type I1 benefits that accrue when an organization exploits new IT- enabled business opportunities that take advantage of the infrastructure. There are three categories of Type I1 benefits, which can be further subdivided based on whether the primary target of the benefit will be delivered inside or outside the or- ganization (refer to Table 4.2).
Commerce benefits are created when a company uses IT to improve its internal and external operations. Internally, a company can use IT to streamline, integrate, and synchronize key operating processes such as procurement, order fulfillment, and customer service. Then it can extend these IT-enabled processes to improve the efficiency and effectiveness of supply or distribution channels.
Content (or knowledge) benefits are created when a company harnesses infor- mation and knowletlge located inside or outside an organization to improve the per- formance of individuals and groups as they make decisions and take actions. The in- dividuals and groups may belong to the same organization or may be customers, suppliers, or business partners. As well as helping people "work smarter," informa- tion and expertise can be used to create new products and services or to add value to existing ones, thus increasing the flow of revenues and improving a company's competitive position.
Community benefits are created when a company uses networked technologies to increase the commitment and loyalty of internal and external stakeholders. Inside the organization, e-mail, groupware, and Intranets can be used to link employees around the world to information resources and expertise, improve the performance of virtual work teams, and create communities of interest. Outside the company, the same technologies can be used to establish a position at the center of an electronic market around which a "virtual community" of customers, suppliers, and business partners can grow.

Chapter 4 Making the Case for Networked Business 131
The ideal IT project, at least to begin with, often streamlines highly leveraged, resource-intensive processes while layering in important components of reusable infrastructure to produce measurable results in a short period of time. These proj- ects often have a clearly defined scope. As the project unfolds, however, astute hanagemmust be on the lookout for follow-on projects that leverage reusable'components of the infrastruc- ture (e.g., databases, networks, process- ing power, user access devices) to in- crease the value of IT assets and enable a steady flow of value-creating IT-enabled business opportunities.
A Fortune 100 global manufacturing company which we call "BigCo" pro- vides an excellent example of the IT business value scorecard in action.
Improve Infrastructure
Like most companies, BigCo's IT infra- structure had been assembled in a piece- meal fashion over the last 20 to 30 years. Responding to a serious decline in mar- ket share, in 1993 a new CEO initiated a massive. restructuring and cost-cutting initiative. As part of that project, the chief information officer . (CIO) launched a two-year project to consoli- date the company's 155 stand-alone data centers into 18 regional data centers that would feed three global megacenters. At the same time, the CIO embarked on a project to consolidate BigCo's network infrastructure from numerous incompat- ible country-based and local networks to a single global Internet-based network.
Launch a New IT Services Business
The state-of-the-art infrastructure quickly became a benchmark in the industry. BigCo us'ed the-internal infrastructure as the foundation to launch a new IT ser- vices business that would host and maintain e-business infrastructure and applications for large, medium, and small businesses.

132 Module TWO Building the Network Eco~fotnj~: Ctrpubilities und Orgcrnizution
Launch and Continually Enhance Internal Web Servicczs
Building on the new Internet-based global information processing and com- munication platform, BigCo launched an Intranet that gave employees access to company, industry, and market infor- mation and collaboration and workflow tools (e.g., e-mail, project management tools, online travel and benefits sys- tems). Employees and teams used this internal portal to c~istomize a personal work environment that would enable them to make better decisions and im- prove productivity and performance. 1ln addition, an innovative program that combined 75 percent e-learning with 25 percent face-to-face learning was used to improve the performance of all em- ployees at BigCo.
Improve Knowledge Worker Performance
Using the information and personaliza- tion tools available on the Intranet, a key account consultant in the IT services business unit developed a customized portal to manage his key accounts. In- terest spread among other key account consultants, and a portal was developed to enable all consullants to access infor- mation available on the public Internet, in company databases, and in files lo- cated throughout the company. Using the portal, consultants shared consulting methodologies ant1 frameworks, en- gagement summaries, expertise, and best practices.

Chapter 4 Making the Case for Networked Business 133
Launch E-Procurement In 1997, the U.S. procurement group began a project to implement e-procurement. By 2000, the entire global buying process, including the ability to select suppliers, negotiate contracts, place or- ders, and handle payments, took place online.
Launch Customer-Focused E-Commerce As BigCo streamlined and integrated supply chains, the company also de- ployed an integrated web-and-call cen- ter distribution channel that enabled customers and distribution partners to buy and receive ongoing support for over 14,000 products and services.
Generate Increasing Returns Like all public companies, BigCo's success or failure ultimately will be measured by the firm's ability to gener- ate increasing returns to shareholders and earn their trust and confidence in the company's future success. As can be seen in the table on page 134, finan- cial performance increased signifi- cantly during the period covered in the study. Driven by strong revenue growth and improved operating margins, earn- ings per share (EPS) rose from $0.91 in 1994 to $4.22 in 2000, and the stock price rose from $18.37 per share at year end 1994 to $85 in 2000. (In 2001, EPS increased to $4.42 and stock price rose to $120.96 per share.)

134 Module Two Building the Network Economy: Capabilities and Organization
The CEO of BigCo attributed a major portion of the company's success to the se- ries of digital business initiatives that the company implemented during the 1990s:
If there is a lesson to be extracted from the dot-com crash, it may be this: There is no shortcut to e-business. And if 2000 comes to be seen as a watershed, it will be because this was the year the world's established enterprises awoke to the true possi- bilities of e-business. I believe a broad consensus has emerged that e-business is just . . . real business. And real business is serious work.
Summary As we enter the 2 1st century, excitement concerning the potential of IT to transform business and drive improved performance has never been higher. But the fascination with IT business innovation comes at a time of significant uncertainty and change in the industry as both entrenched players and new entrants struggle to position themselves for success in the emerging global Network Economy. While most agree that Internet-based technologies have progressed at lightning speed since they were introduced to the business world in the early to middle 1990s, developing common standards and robust commercial technologies takes time.
The challenge of integrating new technologies into the "legacy" of computers, networks, and systems already in place within companies adds to the problem. To achieve the grand vision of the Nemork Economy, a new approach to building busi- nesses and measuring performance is needed.
This chapter explored the challenges that executives face as they attempt to de- velop the business case for digital business in the context of increasing volatility and

Chapter 4 Making the Case for Networked Business 135
uncertainty. Executives should consider the following questions as they attempt to forecast the value of digital business strategies and the ability of their organizations to execute them.
1. How well do you understand the link between your strategies, the capabilities and infrastructure built to execute those strategies, and the value created for all stake- holders (e.g., customers, suppliers, partners, employees, investors)?
2. What are the key performance drivers for your business, including revenue and cost drivers? How do the benefits delivered to stakeholders create financial, phys- ical, and intangible assets?
3. What are the key areas where a change in strategy or an improvement in infra- structure and organizational performance could create significant short-term and long-term value?
4. Conduct an audit of your digital business infrastructure. How much are you spending to operate computing and network operations? On average, how long does it take and how much does it cost to implement a new digital business ini- tiative? What are the key bottlenecks that slow the process and the key activities that increase the cost?
5. How could a shift to an open standard, global networked infrastructure improve network economies of scale and scope by lowering operating cost, increasing functionality, and increasing the range of digital business solutions (strategic op- tions) that can be pursued?
6. Create a list of digital business strategies and solutions that could be developed to leverage an open standard networked infrastructure. Are there opportunities to a. Improve internal operating efficiency and quality? b. Streamline and integrate channels to market, create new channels, and inte-
grate multiple onlineloffline channels? c. Improve knowledge worker performance and enhance organizational learning? d. Add "information value" to existing products and services or create new
information-based products and services? e. Attract and retain top talent? f. Increase employee satisfaction, engagement, and loyalty while creating a cul-
ture of motivation, commitment, and trust? g. Attract and retain high-value-added customers, suppliers, and partners? h. Increase customer/supplier satisfaction, engagement, and loyalty? i. Increase investor satisfaction and loyalty?
7. From the above list, identify one or more simple yet powerful "big wins" where a digital business solution could significantly improve business performance. What are the realistic business goals you expect to achieve? Define measurable performance improvements that can be achieved quickly (usually within one year) and the follow-on benefits that will accrue as you pursue strategic options. How will these performance drivers link to financial and capital market per- formance? Validate your analysis by talking with others who have implemented

136 Module TWO Building the Network Econonl Capabilities and 13rganization
similar systems. Ask for lessons learned and areas of high risk that must be managed closelj. Collect benchmark data on the benefits that can be expected.
8. Do you have the resources, expertise, and skills required to complete these proj- ects successfully? Can outside partners be identified when the organization's re- sources are not sufficient?
9. Do you have the political support required to ensure that the project can be com- pleted quickly and effectively? Do project leaders have the resources, authority, and accountabilhty required to get the job done?
10. Have you considered ways to limit the scope of the project? Keep in mind the "80120 rule": You can often achieve 80 percent of the benefit with 20 percent of the effort. Don't push to include hard-to-implement features and functions that are not critical to overall project success.
1 1. Has an effective change control process been implemented? Can you ruthlessly manage "projecl. creep" while not losing sight of the good ideas that emerge dur- ing implementation? To assist with this task, create two task forces to search for follow-on "options" benefits. One task force can be charged with identifying new IT-enabled business building opportunities to improve operating and chan- nel performance, build and leverage knowledge assets, strengthen and leverage the community, and launch new ventures. The second task force can be charged with searching lbr ways to enhance infrastructure performance continuously.
Analyzing Business Models Analyzing the Business Concept
Categories of Analysis and Best Practices Sample Measures
I Market opportunity Size of markets served today and in the I
Large and growing market future (number of customers, units sold, High levels of demand and market revenues, etc.)
1
readiness Anticipated rate of market growth by I Opportunity is large enough to enable product category and customer segment
evolution of the business model and Total size and length of the "window generation of multiple revenue streams 13f opportunity" I
I Window of opportunity is long enough to Current and forecasted market share and
support time required for development "share of wallet" (total spending across and growth of business but shart enough categories) 1 I to build barriers to entry Current revenue (and revenue projections) 1
by product category and customer segment I
Committed revenues for future business 1 -- . ._ _ _ ___.___I_--- - ,

Chapter 4 Muking the Case for Networked Business 137
Analyzing the Business Concept
i Categories of Analysis and Best Practices Sample Measures ! Productlservice offerings
Solves a very reai problem for a large customer base
Compelling benefits for all members of the community
Short, straightforward purchase decision and ease of adoption
Personalized products and services
/ ~roducttservice offerings satisfy an unmet need
Competitive dynamics and strategy Opportunity to be number one or number two
in a structurally attractive industry No one player or group of players exerts
significant influence and power a
a'
:-;Defensible position.vis-a-vis competitors and substitutes
Ease of entry, but barriers can then be erected
1 Business context and risk I Favorable business context i Manageable risks
I
Subjective and objective benefits for channel customers and end consumers
Importance of product/service features to the buyer and the user (if different from the buyer)
Differentiation from alternatives Price position vis-a-vis alternatives Price premium related to producttservice
features and attributes Adoption cycle time and decision-
" -*sb%g process am,", .
Key competitors and substitutes today and in the future
Number, concentration, and power of competitors
Amount of excess versus scarce cap today and in the future
Basis for competition and differentia Propensity to collaborate and compete Entry and exit barriers today and in the future
Nature and magnitude of risks and strategies for managing them
Pres*ence or absence of "fatal flaws" in the bhsiness model
Strategic options Profile of business initiatives, project Leader in leveraging business infrastructure activities, and investments
to expand the customer base and increase Revenue growth from new and existing revenues from existing customers customer base
-,Leader in increasing the range of products and umber of new prodyc$, services, and . b, , a Q a a ::3"."$: iervices offereqapd in decreasin9"he cost :"b$\ihesses introddced versus indust#4$'"*
and time of launching new products and average services Cost and time to develop and launch new
Leader in ability to modularize business products and services and to enter new initiatives, projects, and investments business or geographic markets versus
Leader in the ability to decrease the cost and industry average time required to stop a project or exit a Average,time to achieve profitability in a business that does not meet profitability new product, service, or businesses *"
expectations and return hurdles Length of time and cost to stop a project and exit a business
Dollar savings from delaying an investment and/or exiting a business
(continued) , I

138 Module TWO Building the Network Economy: Capabilities and Organization
Analyzing Capabilities *
Categories of Analysis and Best Practices Sample Measures
Operating Capabilities
Operating performance Cycle time of key processes and activities ' Streamlined, integrated processes and channels Operating cost by activity, product, customer ' Efficient operations segment
Recognized leader in asset utilization Sales per employee Savings from headcount reduction Costs of supplies, parts, and service and
, . yearly savings from improved management I and operations
Cost of inventory, frequency of inventory turns, and estimated savings
Customer and community-focused quality Quality measures (e.g., defect levels, rework, Recognized quality leader returns, compliance with standards, waste) Ability to charge a price differential and/or Cost of poor quality
attract customers and commun ty Administrative costs for managing quality members based on reputation for high Price differential and community penetration1 quality loyalty based on quality
Cost savings and improved asset ~til~ization Sates per employee vis-a-vis previous Best-in-class operating costs performance and competitor performance Recognized leader in efficient and effective Yearly savings from headcount redudions
capital asset utilization Cost of paper-based processes and cornmuni- cations and yearly savings from the shift xo electronic distribution
Cost of supplies, parts, and service and yearly savings from improved supply chain management and operations
Cost of inventory, frequency of inventory turns, and estimated savings
Current asset utilization and estimated ~mprovements
Fast-cycled innovation Cost and time to pursue follow-on initiatives
is lower than industry average Cost and time to stop a project or exit a
business are lower than industry average
Increased range of new opportunities that can be pursued
Cost and time to develop and launch new products and services and to enter new business or geographic markets versus industry average
Average time to achieve profitability in a new product, service, or business
Length of time and cost to stop a project and/or exit a business -- - - - - - - -

Chapter 4 Making the Case for Networked Business 139
Analyzing Capabilities
1 Categories of Analysis and Best Practices Sample Measures
tion and Knowledge Capabilities ;La? ** ls
e capitil" arki it" value/book'~alue d em't
zed leader in m knowledge Number of and value of pat and intellectual capital Percent of earnings related to knowledge
Effective and efficient processes for acquiring, capital* creating, packaging, and distributing data, Ratio of knowledge capital earnings to information, and knowledge Ratio of knowledgecapital earnhgs to
operating income
Strong leadership Experienced and committed leaders with a
demonstrated'track recordJdf.success infthe industry and business
Leaders are well connected within the industry and business community
Executive, director, and adviser profiles and qualifications
Executive achiever$;ents and performance in :$ ' i s
current firm and*grevious positions Ability t o create a compelling vision for the
business that attracts top tal partners, and investors) and customers and suppliers
I Expertise and skills Partner and key employee profiles I Recognized leader in attracting and retaining Number of offers made and accepted I top talent Average number of positions open I Ability t o attract and retain key people at a Average length of !ime and cost t o fill a ' rate that exceeds industry and geography key position or sign a key partnership ' average
Development and retention of employees and partners ~e?o~n ized leader in providing high-quality.j;~
career development, expertise, and motivation Recognized leader in creating a culture that
rewards career development of employees
1 Readily available, easilyaccessible, and ' relevant information I
High levels of information literacy throughout
1 the firm and within customer, supplier, and , partner communities , Recognized leader in fostering a culture of 1 information sharing and knowledge building
Development resources available and percent utilization
~atio,of developmebt resources used to employeelpartner performance
Career trajectory for key employees Attrition rate versus historical, geographic,
and industry averages - * I * * w s *;'aS. s .w ' ,a:"
t?ele"&ce and cur;=ncy of infoikation and expertise delivered face-to-face and through online channels
Employee computer and information lite Ease of use and functionality of technical
systems Patterns of information sharing and use of
information stored on lntranets (for internal employees) and Extranets (for partners, supplie~s, and customers)
(continued)

140 Module Two Building the Network Economv: Capabilities a ~ i d Orgunizution
Analyzing Capabilities
Categories of Analysis and Best Practices Sample Measures I
Information and Knowledge Capabilities (continued) I
I
Information-based products and services Number and profile of information-based Price premium due to information value added products and services
Revenuesfearnings generated through information-based products and services ,
Price comparison and market share 1 Community Penetration, Loyalty, and Value
Community penetration Number of customers, suppliers, and partners Dense, well-connected network of customers, Profile of key customers, suppliers, and
suppliers, employees, and busiress partners partners Profile of interactions among commurlity
members
Personalization Level of personalization available I
Multiple opportunities for persoralization are Percentage of community members that 1 available, and community members take choose to use personalization features I
advantage of them to improve experience I
of doing business with you I I
Engagement and loyalty Frequency of interactions among customers, Highly engaged community members interact suppliers, and partners
and do business on a regular bdsis Average amount of money generated per Community members choose to do business transaction, per month, etc.
with you despite readily accessible alternatives Frequency of return visits and repeat interactions
Percentage of first-time versus repeat customers (or other community melnbers)
Satisfaction with products, services, and "experience" while doing business
Conversion rate: percentage first-time versus repeat visitors over time
Lifetime value Recognized leader in the cost of acquiring and
serving community members Recognized leader in maximizing lifetime
value of a community member (The calculations presented at the right are
specific t o customers but also can be used t o calculate the value of suppliers or other community members)
Cost to serve = (operating expenses -- cost of 1 sales)/number of customers
Expenses related to acquiring and retaining an , individual customer or group of customers
Customer value = (number of customers attracted to your business through all channels) x (average monetary value of each visit) - (costs t o acquire, retain, and serve)
Lifetime value = (current value of a community member) x (estimated length of relationship) x (expected percent change in value over time)
- - -- . - -- . - - - - -. - . - .-

Chapter 4 Making the Case for Networked Business 141
Analyzing Capabilities
I Categories of Analysis and Best Practices Sample Measures
i Infrastructure Capabilities
lnfibrtructure functional~ty and flexibility .$,$ih+ , ~dministrative.&$ (total dollar amqunt as a 9 s g aF@-*
Cast advantage due to!infrastructure effi~ieE$<~ percentage of;total expenses versus: Recognized leader in introducing successful" competitors)
new products, entering new markets, and Average time to launch new products or launching new businesses business or enter a new market
Average time to achieve profitability, scale, and market dominance
- ,." .. " Number of successful new products, market .:I.,. * 4 * )i l ade8djags
entries, or businesses during a given period is l ;hiis 3 * Wr83
~ . ! i l ~ C i n * * * i ,
, asa@#~ay t ; (over time:dndsersus , d . : e ~ $ ~ . . competitors)~~a~ ** L LP
Analyzing Value
Categories of Analysis and Best Practices Sample Measures
Benefits to community members a, . subjective and ~bjective benefits for ~r i ique value proposition,attracts loyal * f.)?.; customers, suppliers, and partners , r' '" Market share and "share of wallet" * customers, s~ppliers,~and partners
t
Pricing benchmarks and comparisons Current revenue (and revenue projections)
by product category and customer segment
Committed revenues for future business
.5~4 i4 ,Bq~ i t~ b ~ ~ $ , m ~ $ A t p .I >:+ga;*r : a Advertising dolla4 to sales ratio a. . -Leader in brand awaregess - .p , rg* l% . a*a 6 Level of brandzavvqreness inside and$tside
: d f g ~ levels of loyalty and trust M q t your business community High brand value Strength of brand relative to competitors
Overall brand perception (positive, negative, neutral)
Price premium andlor community IoyaFy related to knowledge of and trust in '
8 1 i " 3
2 ' investor loyalty and trust
Investors exhibit confidence and trust in business and i t s management equity shares outstanding)
Increasing stock price and market value Pricelearnings ratio (PIE) despite minor fluctuations in business . performance
., . (continued)

142 Module TWO Building the Network Economy: Capabilities and Organization
Analyzing Value
/ Categories of Analysis and Best Practices Sample Measures
Returns to company and investors Net income (or profits) Increasing returns to investors while Earnings before interest, taxes, depreciation,
maintaining long-term viability of the amortization (EBITDA) (reflects profitability business of ongoing operations)
Earningdshare ratio (EPS) Working capital = (current assets) - (current
liabilities) Invested capital = working capital + capital
expenses (reflects the money put it-ito a company to build and maintain it)
Frtee cash flow = EBIAT - (invested capital + depreciation) + (net change in working capital) + (net change in other long-term capital)
Current ratio = current assetslcurrent liabilities (reflects company's ability to pay current obligations from current assets)
Investor dividends (if paid) Value of stock options to executives,
employees, and partners I
Profitability ratios Return on sales (ROS) = net incomelsales Recognized leader in generating returns to Return on equity (ROE) = net income/equity
investors (especially compared with invest- Return on assets (ROA) = net incomelassets ; ments in other companies or investment Return on investments (ROI) alternatives) Return on invested capital (ROIC) = net I
incornelinvested capital I
Rate of return (ROR) 1 Performance ratios
Recognized leader in converting revenues into Gross margin = gross profitlnet sales !
earnings Operating margin = earnings before interest I and taxedrevenues
Fixed asset turnover = revenues/(cost of property, plant, and equipment, or PPE) i
Capital turnover = revenueslinvested capital 1
*This approach to measuring knowledge, capital earnings, and associated ratios is discu:;sed in B. Lev, "Seeing Is Believing: A Better Approach to Estimating Knowledge Capital," CFO, February 1999; and A. Webber, "New Math for a New Economy," Fast Company, January-February 2000.

Chapter 4 Making the Casefor Networked Business 143 ~
Analyzing Financial Performance
The financial performance of a public com- pany is most commonly measured through an assessment of its earnings. These measures provide various views of the cash that "flows through" a company to investors. In growing firms, especially those that require a high level of capital investment, analysts commonly be- gin with an assessment of earnings before in- terest, taxes, depreciation, and amortization (EBITDA). In essence, EBITDA provides an assessment of operating performance minus nonoperating income and expenses (e.g., inter- est and taxes) and noncash charges (e.g., de- preciation and amortization).
When evaluating a company's performance, it sometimes makes sense to ignore nonoperat- ing cash flows and accounting conventions that could complicate an assessment of the effi- ciency and effectiveness of ongoing opera- tions. However, there are problems with look- ing solely at EBITDA that must be kept in mind.12 First, EBITDA leaves out many ex- penses and, as a result, cannot be used to mea- sure profitability. Second, it cannot be consid- ered a proxy for cash flow since it does not measure actual cash generated (or used) during a given period. Specifically, EBITDA neglects the following:
or or more information on measuring financial '
performance, see Motley Fool (www.motleyfool. corn). Articles of special interest include P. Weiss, "The Earnings Game," www.motleyfool.com, February 4, 1999; P. Weiss, "Tying It All Together with the Flow Ratio," www.motleyfool.com, Part 1, December 10, 1999, and Part 2, December 14, 1999; and M. Richey and P. Weiss, "Ignore EBITDA," www.motleyfool.com, September 6, 2001.
Cash required for working capital13
Debt payments and other fixed expenses
Capital expenditures
Finally, aggressive accounting practices can make it difficult to calculate true revenues and expenses, which can invalidate EBITDA.
While EBITDA provides a measure of how much money a business generates when operat- ing at its current scale, it does not measure the cash investments required to accomplish a spe- cific strategy and grow the business. Better measures for cash flow are available by looking at the cash flow statement, which breaks out cash flow from operations (true cash profits from ongoing operations), from financing (div- idend payments and stock repurchases), and from investing (capital expenses, purchase and sale of businesses, and equity investments). Al- ternatively, it is helpful to calculate free cash flow (FCF), a measure of the cash that a com- pany makes (or uses) to support existing oper- ations and to fund growth. FCF is calculated as follows:
Earnings before interest but Plus after taxes (EBIAT)
(Depreciation + noncash . Minus expenses) 1
Total capital expenditures Minus
13working capital is simply current assets minus current liabilities and can be positive or negative. Working capital-defines the value of a company's liqu,id assets-those that can be readily converted into the cash needed to build the business, fund i t s growth, and produce shareholder value.

144 Module Two Building the Network Economy Capabilities and Organization
Change in net working Plus1 capital minus
Change in other net long-term capital. l4
If FCF is positive, the extra cash flow can be used for other purposes (for example, payment of dividends to shareholders, payment of interest, re- payment of debt, repurchase of stock, or other in- vestments). If FCF is negative, the coinpany must make up the difference by borrowing money (thus increasing debt) or issuing new equity. It is important to keep in mind that many terrific companies have been EBITDA-positive and cash- flow-negative in their formative stages. In fact, Wal-Mart reported negative FCF for years while it built its retail empire. Thus, focusidlg on FCF alone can lead investors to miss oppo~tunities.
Another useful measure of financial perform- ance is return on equity (ROE). ROE measures the efficiency and effectiveness of management in controlling the three main levers of business performance: profitability, asset management, and financial leverage. It is calculated by divid- ing earnings by shareholders' equity (liabilities minus assets). To better highlight the three man- agement levers, a more expanded calculation can be performed:
ROE = (earningstsales) X (salestassets) X (as~tslshareholders' equity)
where
Earningslsales = an organization's profit margin
14See C. Baldwin, Fundamental Enterprise Valuation: Free Cash Flow (Harvard Business School Publishing NO. 801-126).
;Sales/assets = asset turnover
Assetslshareholders' equity = financial leverage
'These and other measures of financial per- formance can be used by investors, analysts, and executives to make decisions on whether and at what price to invest in a company. The cumula- tive result of these decisions is called 1 he market value of a company. In publicly held compa- nies,15 the market value is determined as indi- vidual and institutional investors16 buy and sell stock, The price of a publicly traded stock is in- fluenced by a company's current and historical financial performance, predictions of' future fi- nancial performance (especially in relation to other types of investments), availability of eq- uity for sale at any given time, and the confi- dence and trust of investors in the company's strategy, capabilities, and management. The price of a privately held stock is based on simi- lar decisidns made by private investors: high- wealth individuals (often called angels), banks, venture capitalists, and companies (often called strategic investors). The market value of a firm is calculated by multiplying the stock price at any given time by the number of equity shares outstanding.
'S~ublicly held firms offer stock for sale to the public, usually on a stock exchange such as the New York Stock Exchange, the London Stock Exchange, or the Nasdaq Stock Exchange. 161nstitutional investors are organizations (for example, banks, insurance companies, pension funds) that invest in a company's stock.

Chapter 4 Making the Casefor Networked Business 145
Approaches to Valuing Public Companies
Formal valuation models provide a disciplined era1 approach to conducting a DCF analysis is approach to thinking about perforinance and presented below. value that can help executives make decisions Decide how far in the future to project per- and take action based on "informed intuition." This intuition is dramatically improved when formance drivers and financial performance.
performance drivers are used to explicitly define the assumptions on which financial forecasts are based. When used to analyze a business operat- ing in highly uncertain and rapidly changing markets, industries, and organizations, these as- sumptions must be tested continually against real-time data on strategic and operating per- formance. Scenarios and the ability to triangu- late using multiple valuation approaches help account for uncertainty in assumptions and the lack of historical earnings data.
This appendix presents two commonly used valuation methods: discounted cash flow (DCF) and comparable company valuation. In addition, it shows how a "sum-of-parts" valuation approach can be used with either DCF or comparable com- pany valuation to calculate the value of independ- ent cash flow streams and then add the partial company valuations to determine total value.
Discounted Cash Flow
, The value of a mature business in a stable indus- try is most often measured by using DCF meth- ods. Typically, forward-looking financial projec- tions drive the analysis. The analyst, investor, or executive identifies anticipated cash flows and then discounts them back to their net present value (NPV). The terminal value that best re- flects the effects of hture years is then calcu- lated and added to the present value of the cash flows in the model. While details vary, the gen-
Analyze the assumptions that underlie projec- tions of future revenues, costs, and working capital and construct a spreadsheet that proj- ects free cash flow.
Determine a discount rate that reflects the op- portunity cost of the investment.
Discount each year's'free cash flow to the cur- rent year and add them together.
Calculate the terminal value of free cash flow streams in future years and add this to the pre- vious sum.
If a firm has multiple business units, each of which employs a different business model, a sum-of-parts analysis can be performed. Using this technique, DCF streams from the different business units are calculated. Different as- sumptions are used to forecast revenue growth, costs, and cash flow, and different discount rates may be used to determine present value. Then the DCF streams are added together to calculate total value. If desired, weightings can be applied to each of the DCF streams. For ex- ample, analysts used different assumptions to forecast revenue growth and EBITDA for AOL Time Warner's publishing, music, filmed enter- tainment, cable systems, cable networks, and AOL.com businesses.
Valuation purists often argue that the sole de- terminant of company value is the ability of the business to generate cash for investors. Thus, they often view DCF as the only acceptable

146 Module TWO Building the Network Ecl~nomy: Capabilitie *s and Organization
method to determine the value of a business. While it is essentially true that all valuiation tech- niques attempt to capture future cash flow either explicitly or implicitly, there are prol~lems with applying the DCF approach indiscriminately. First, estimating the cash flow rate for high- growth companies operating in a highly unstable industry is a somewhat speculative process. This is illustrated by comparing the DCF valuations of the AOL Time Warner merger that were per- formed by the same Salomon Smith Barney (SSB) analysts in 2000 and 2001. The earnings calculated by the SSB analysts were based on as- sumptions for filture revenues, costs, and work- ing capital. Given the rapid fall in investor con- fidence in Internet stocks, coupled with a significant decline in the economy and an asso- ciated decline in advertising revenues, predic- tions of revenue growth, costs, and market value in March 2000 proved highly unreliable when viewed in April 2001.
A second and equally important problem with DCF valuations is that the appropria~te discount rate to use is not always immediately apparent. Traditionally, analysts might choose to use the capital asset pricing modelI7 (CAPM) to esti- mate cost of capital. The CAPM equation is given be1ow:l8
Cost of capital = P X risk premium + risk- free rate
where beta is a number derived from the price variations of the stock, the risk-free rate is typi- cally the interest rate that could be earned by in- vestment in a relatively low-risk government
17R. A. Brealey and 5. C. Meyers, Principles o f Corporate Finance (New York: McGraw-Hill, 2000). 's~t r ic t ly speaking, analysts should calculate a weighted average cost o f capital that takes into account the different risks based on a company's financing strategy. For example, much 01 Amazon's financing comes from debt, which carrie:; a lower cost of capital.
bond, and the risk premium is the difference be- tween the expected return from the stock market and the risk-free rate. Once again, volatility of the stock market and the lack of certainty con- cerning the strength of the global economy in the future can lead to a significant margin of error in calculating the cost of capital.
A third problem with using the DCF approach is that it fails to directly measure the value of in- tangible assets such as brand, knowledge, and customer loyalty. At the time when the AOL Time Warner merger was announced, it was assumed that access to over 25 million unique customers and over 70 percent market share would enable ACIL.com to continue to grow at rates much higher than those of other competitors. In the ab- sence of reliable, objective performance meas- ures, decisions to increase the market value of a firm to account for intangible assets involve even more risk than decisions made on the basis of his- torical financial performance. Once again, these risks are magnified during times of rapid change ant1 high levels of uncertainty.
As a result of these and other di.fficulties, many analysts, executives, accountants, venture capitalists, and investment bankers turn to other valluation techniques to complement or substi- tute for DCF valuations.
Comparable Company Valuation
Another popular technique that is employed by many analysts is to examine key multiples for sev- eral companies in the same industry. The price/ earnings ratio is perhaps the most prevalent of the multiples used. At times, analysts will compare companies across more than one set of'criteria.
The comparable company valuation approach is different from DCF in that instead of asking, "What should the business be worth, based on its cash flows?'an investor, analyst, or executive aslcs, "What is the market willing to pay for a business like this?" There is some validity to this

Chapter 4 Making the Case for Networked Business 147
approach as long as the right set of companies is chosen and historical performance is a good in- dicator of future value. Using comparable valu- ations provides a ,fast, easy-to-understand valua- tion framework that does not require complex financial modeling. It can also, in theory, cap- ture the effect of intangible assets and investor confidence by factoring in the premium or dis- count within an investment category or across categories. Unfortunately, there are also prob- lems with this approach.
First, complex companies with multiple busi- ness models may not fit neatly into a single cat- egory. As we saw with DCF analysis, sum-of- parts valuations can help mitigate this problem. Second, the choice of comparable companies may not be clear when the company's products, services, and/or business model are innovative or unique. Third, even if a valid set of compara- ble companies can be identified, the range of values for multiples of companies within a given category or across different categories may be quite large. Fourth, an analyst must determine which multiple to use to calculate his or her es- timates. This is often driven by the purpose of the valuation. For example, earnings multiples reflect the performance of the company during the time period under study and often are used to value a "going concern." Asset multiples capture the value of underlying-assets and may be used alone or in conjunction with earnings multiples to analyze an acquisition. Finally, no matter which category of company or multiple is cho-
sen, an analyst who chooses to use a comparable company valuation approach must assume that investors have the information they need to make valid and rational investment decisions.
Dealing with Uncertainty c L , ,
. J
As has been clearly stated in this chapter, valua- tions are based on assumptions about the futurh performance of a business. Triangulation-the practice of using multiple different valuation techniques and multiple different measures- can help increase confidence but does not take the place of frequent comparisons between fore- casted and actual performance. Finally, scenar- ios can be used to test the sensitivity of the valu- ation model to changes in key assumptions. At a minimum, most analysts routinely examine the best, worst, and most likely cases.
While all these approaches can help validate a financial model, the real test of the model comes only as executives implement strategies and operate their businesses. Access to detailed, timely, and accurate information enables them to measure the impact of business decisions and actions as they occur and to compare actual per- formance to forecasted performance. The ability to make sense of the information and implement correctional actions based on the insights gained is the essence of designing "learning" organiza- tions that can link strategy, actions, and deci- sions to assessments of value.


2 . : 3 4 a % Module Managing 9 3 -
Ne rk e*de * d**
,:a& *$* " * 4 $:R pi* " :: ) "2
" &. > ,+3 -en Irifra-s tr r nd
' 0 *
Operations' by Robert D. Austin -
0"e; tEe last'decgde, a dramatic c6ange in computihg infrastructure has led to fun- W e n i a l changesin how businessq operate. As a result, today's infrastructure man- agers must deal with new challenges and new threats. Fortunately, ever-improving technology offers,a growingnumber of problem-solving options. Indeed, entirely new businesses and industries have emerged to help operational managers realize greater efficiencies and capabilities.
The chapters in this module provide a basis for discussing how changing informa- tion technology (IT) infrastructure affects business, how management priorities must shift, and how the risks that affect day-to-day operations can be reduced. The focus of the mddule <s on Gontline operational issues. Without management frameworks that deliver# real .operational results, the best-laid plans, the greatest ideas, and the shrewdest strategies cannot create value. 2% u *


Chapter 5 Understanding Internetworking
Seventy-five percent of all IT dollars go to infrastructure. Isn't it time you learned what it is?'
Information technology (IT) infrastructure3 lies at the heart of most companies' op- . erating capabilities. For that reason, changes in information technologies lead to fundamental changes in how businesses operate. Because many companies in fact depend on these technologies, no longer is IT infrastructure just nice to have; no longer is it just value-adding. It is vital.
Recent technological advances have led to majbr changes in how IT services are delivered. For some time now, low-cost computing power has driven a shift to- ward more distributed processing. The rise of Internetworking technologies, which provide a low-cost way to connect virtually everyone on the same network, offers new possibilities for addressing business computing needs. As a result, the operational mechanisms at the heart of many businesses continue to evolve. New technologies add to, improve, and interconnect older systems to yield infrastruc- tures with new and complex operational characteristics, which are discussed in de- tail in this chapter.
I his chapter is adapted from materials in Professor Robert D. Austin's Managing Infor- mation Technology Infrastructure course module, Harvard Business School Publishing NO. 601-181. 'IBM advertisement in The Wall Street Journal, November 19, 2001. 31n this and ttie following chapters, we use the word infrastructure to refer to the entire layered fabric of hardware, software, systems, and media that collectively deliver IT-based services.

152 Module Three Managing Networked Infrastructure and Operations
This infrastructure evolution brings with it many benefits. IT services few envi- sioned several years ago have become commonplace. Older services can be deliv- ered in new, more customer-responsive ways, and the cost structures underlying new service delivery methods are superior to those of older methods. New business mod- els enabled by the new service possibilities have emerged. Industries restructure to realize greater efficiencies and capabilities as part of a long-term trend that will con- tinue and accelerate regardless of occasional technology market slumps.
Along with bqnefits, however, come challenges. In this chapter and the next two, we address the challienges associated with new service possibilities and consequent shifts in infrastructures. Our focus is on frontline issues of execution. Grand visions are of little use unless they can be translated into reality. New business models and systems cannot succeed unless they can be relied on to operate at key moments. New
, technologies provide less value if they cannot interoperate effectively with the older techpologies in which most companies still have major investments. Most seriously, IT infrastructure greatly determines a company's differentiating capabilities; effec- tive infrastructure enhances those capabilities, while ineffective infrastructure de- stroys them. In today's environment, a seemingly minor IT decision made two or three years ago by a low-level technical employee can turn out to be the decisive fac- tor in defining a winning strategy, closing a sale or deal, or surviving a competitive challenge.
Consider the experiences of a U.S. consumer products company in the late 1990s. The company adopled a Web server technology that was highly regarded for its abil- ity to support graphics. Developers built product websites by using this leading-edge technology. A few years later, early in the 21st century, the company performed an experiment to see how its products would show up if consumers performed Web searches on product categories such as "paper towels." The marketing stafThoped to see its products in those categories near the top of lists that resulted from consumer searches. Instead, the searches turned up little sign of the company's products. An investigation was launched to determine why. As it turned out, the leading-edge Web server technology chosen by this company did not lend itself readily to text-based searches because of its advanced graphics-based design. The IT and marketing staffs, working together, began an eff'ort to remedy the situation, but their options were limited by the server technology selected a few years earlier that now supported almost all the firm's websites. The solution was more expensive and time-consuming than expected.
This example illustrates a critical point: Infrastructure decisions can come back to haunt companies. In this case, the problem was not serious and the company was able to remedy it. But the constraints ofpast IT infrastructure decisions can be much more severe, for example, when a company deploys a technology that PI-oves to be a loser in the marketplace; such a company can be left with poor (or no) vendor sup- port, inferior business capabilities, and costly-to-maintain infrastructure that cannot easily be shut down or replaced. Infrastructure decisions are difficult because they arise in a dimly illuminated realm halfivay between business and technology. In this realm, technology issues are tightly ~ntenvoven with business issues, and it is un- clear who should be making the decisions. Often general managers are tempted to

Chapter 5 Understanding Internetworking Infastructure 153
leave it to the "techies," but that is a formula for disaster. Technology elements of decisions may 'seem alien to nontechnical managers, but technologists see some business issues in similar terms. The deepest challenges of infrastructure manage- ment, then,-are in understanding and assigning responsibility for making these not just technical, not just business decisions, in bridging .the gap between the business and technology domains. Only when we are successful in this will we see clearly how evolving technologies affect business, how management priorities should evolve, and how we can reduce the risks that affect day-to-day operations.
The Drivers of Change: Better Chips, Bigger Pipes
In 1965, Gordon Moore, who would later cofound Intel, noted that the performance of memory chips doubled every 18 to 24 months, whereas their size and cost re- mained roughly constant. He predicted that the trend would continue and that its im- pact on the world would be profound. Nearly four decades later, most people are fa- miliar with changes wrought by the continuing downward slope in the cost of processing power predicted by Moore's "law." The computing power in a 2 1 st-century desktop, laptop, or even handheld computing device far exceeds that of machines the size of large rooms at the time of Moore's observation (see Figure 5.1). Equally significant is the low cost of modern devices. Once scarce, expensive, and therefore centrally controlled computing power is now abundant, inexpensive, and widely dis- tributed in everything from general-purpose computers to toaster ovens.
Centralized computing architecture prevailed during the 1960s and 1970s (see Figure 5.2). Specialized data processing staffs presided over large mainframe com- puters accessed via awkward punch card, Teletype, and terminal machines. Dealings
FIGURE 5.1 A Graphical Representation of Moore's Law
Source: Adapted by Mark Seager from Microprocessor Report 9(6), May 1995, and Aad Offerman, "ChipList 9.9.5," July 1998, hnp://einstein.et.nrdew. nu-offerman/chiplisr. html. See http://www. physics.udel.edu/www users/watson/scen l03/ inrelhtml, April 20, 2000, George Watson, University of Delaware, 1998.


Chapter 5 Understanding Internetworking Infrastructure 155 I between humans and computers were not very interactive; programs ran infre- quently, in batches, often only once each day, which made modifying and testing programs time-consuming and difficult. Access devices were "dumb"; they had lit- tle inherent capability but served merely as murky windows into complex main- frames. Mainframes provided all computational and storage capabilities. The occa- sional need to share information between mainframes led to the development of early networks. These early networks were simple because they only had to handle traffic between a few large mainframe computers.
The impacts of Moore's law disrupted the mainframe paradigm. An advertisement for the Intel 4004 in the fall 1971 issue of Electronic Navs exaggerated when it an- nounced "a new era in integrated electronics," a "computer on a chip.'74 But this new era was not long in coming. The immediate successors of the programmable 4004 were the basis for the first general-purpose desktop computing machines capable of real business functionality: personal computers (PCs). When the IBM PC appeared in late 1981, few realized how radically it would change business computing.
With the emergence of PCs, computing that had resided in centralized enclaves staffed by data processing specialists spread throughout an organization and into the eager hands of business users. Financial analysts embraced spreadsheets. Marketers designed and analyzed their own databases. Engineers adopted computerized draw- ing packages and programmed their own PCs for more specialized purposes. For a growing number of computing tasks, response time delays and extensive reliance on techies became distant memories.
As newly empowered computer users sought to share work, new communications infrastructures emerged. Local area networks (LANs) allowed business users to share spreadsheets, word processing, and other documents and to use common print- ers to obtain hard copies of their work. PCs and LANs became more sophisticated as users7 computing needs evolved and as underlying technologies that were funda- mentally different from earlier mainframe technologies advanced. The client-server movement was the culmination of this model: higher-powered but still distributed computers (servers) combined with more elaborate networks and desktop PCs (clients) to provide IT services (i.e., payroll, order management, sales support, and beyond) formerly delivered by mainframe.
In the early 1990s, the rise to prominence of the commercial Internet, the Web, I
and underlying protocols (rules for how data would be moved across networks) led 7 to new stages of ev~lu t ion .~ Transmission Control Protocol and Internet Protocol,
together known as TCPIIP, provided a robust standard for routing messages between LANs and created the potential to connect all computers on an ever-larger wide area network (WAN). These Internetworking technologies were the legacy of U.S. De- partment of Defense (DOD) research conducted in the 1960s against the backdrop
4 ~ a u l Frieberger and Michael Swaine, Fire in the Valley: The Making of the Personal Computer (New York: McGraw-Hill, ZOOO), p. 20. he Internet was not new in the 1990s. It had been in use by the military and by researchers since the 1960s. But commercial uses of these technologies accelerated dramatically in the 1990s.

156 Module Three Managing Networked Infrastructure and Operations
FIGURE 5.3 A Graphical Illustration of Metcalfe's Law
of the Cold War with the Soviet Union that sought to develop communication net- works without critical communication lines or nodes that could be targeted by an en- emy. Because of their publicly funded origins, TCPIIP and other Internet protocols and technologies were open standards. not owned by any person or company. Com- puters, therefore, could be connected at low cost and with minimal central orches-
1 tration. Self-service hookup facilitated rapid growth in the worldwide Internet. At first, the Internet was useful primarily for exchanging e-mail and Large data
files, but the Web, with its graphical user interfaces, made Internet communication very valuable to those who were not computer specialists. Just as PCs had made computing accessible to a wide variety of nontechnical users, the Web made network resources (such as distant databases) and capabilities (such as over-the-Net collab- oration) accessible. The number of connected computers shot upward, and the value of the network increased according to Metcalfe's law: "The usefulness of a network increases with the square of the number of users connected to the network" (see Fig- ure 5 .3 ) .6~s the number of users grew, commercial potential mounted and network capacity expanded. Network capacity followed a curve steeper than the one that ap- plied to chips (see Figure 5.4). The combination of powerful chips and large com- munication "pipes," both at low cost, fueled a process that would lead to qualita- tively different computing infrastructures.
These related exponential trends-reduction in the cost of computing power and reduction in the cost of exchanging information between computers-have been fundamental drivers of changes in the business landscape that we continue to expe- rience and try to understand. Because changes have been rapid, many business en-
6~etcalfe's law is commonly attributed to Robert Metcalfe, one of the inventors of the Ethernet standard and the founder of 3Com Corporation.

Chapter 5 Understanding Internetworking Infrastructure 157
FIGURE 5.4 The Bandwidth Explosion
Source: Adapted from http://www.stanford.
Challenges htm
IWAW
FIGURE 5.4 The Bandwidth Explosion
Source: Adapted from http://www.stanford. edul-yzarolid ' . Challenges.htm.
vironments contain a mix of technologies from various computing eras. Some com- panies still rely heavily on mainframes; as recently as 1997, for example, Ford Mo- tor Company had over 300 million lines of COBOL software running vital company functions on mainframe computers, and it 'is likely that much of that code remains in use today.7 At the same time, companies have moved boldly to seize the benefits of newer technologies. Mainframes have been redefined and reborn as enterprise servers. The constant intermingling of old and new technologies adds to the com- plexity of infrastructure management problems. Understanding how shifting tech- nology might combine with "legacy" systems to result in changes in business capa- bilities, the choices facing businesses, and the structures of industries is a prerequisite for understanding how to manage IT infrastructures.
The Basic Components of Internetworking Infrastructures
For our purposes, Internetworking infrastructures can be conceptually divided into three categories: network, processing systems, and facilities. Network refers to the medium and supporting technologies (hardware and software) that permit
7 ~ o r more details on this, see Robert D. Austin and Mark Cotteleer, "Ford Motor Company: Maximizing the Business Value of Web Technologies," Harvard Business School Case No. 198-006. I

158 Module Three Managing Networked Infrastructure and Operations
TABLE 5.1 Fundamental Components of Internetworking Infrastructure
I Core Technologies Key Management Issues I 1 Pdetwork Fiber optics, cable systems, DSL, 0 How to select technologies and 1 i satellite, wireless, Internetworking standards
I hardware (routers, switches, firewalls), 0 How to select partners i I content delivery sof-tware, identity and 0 How t o manage partner 1
: policy management, net monitoring relationships 0 How to assure reliability
i 1 0 How to maintain security
1 Processing Transaction software (enterprise 0 What to keep internal and what t o ; systems systems offered by companies such as outsource I I
SAP and Oracle or more targeted 0 How to deploy, grow, and modify
I solutions offered by companies such as 0 Enterprise system or best-of-breed 1 I
Trilogy and iZ), servers, server appliances, hybrid? I client devices (PCs, handhelds) 0 Relationships with legacies
i I
I 0 How t o manage incidents I i
0 How t o recover after a "disaster" 1 ! Facilities Corporate data centers, collocation
l 0 Internal or external management?
I data centers, managed services data 0 Choosing a facilities model suited to : centers, data closet!. one's company I
i 0 How to assure reliability
1 0 How to maintain security 1 2
exchange of informatiqn between processing units and organizations. As network capacity increases, the network takes on greater importance as a cornpollent of IT infrastructure. Processing systems encompass the hardware and software that to- gether provide an organization's ability to handle business transactions. They are newly interesting in the age of Internetworking because they are being redesigned to better capitalize on the advantages offered by Internetworking technologies. Facilities, the physical systems that house and protect computing and network devices, are perhaps the least glamorous infrastructure components. But they too are growing in importance as demand increases for high levels of availability, re- liability, and security and as greater network capacity makes new facilities mod- els possible.
Each of these infrastructure components generates opportunities and issues man- agers must understand and be able to address effectively. Table 5.1 lists some of the supporting core tecllnologies and identifies some of the key management ~.ssues that arise for each component. A major theme underlying the evolution of these compo- nents is that Internetworking creates nzany more degrees of freedom in how compo- nents can be arranged and managed. Having more degrees of freedom creates pos- sibilities for cost reduction, new capabilities, and new business models but also poses challenges in understanding the implications of possible infrastn.~cture de- signs and management actions.

Chapter 5 Understanding Internetworking Infrastructure 159
FIGURE 5.5 A Simple LAN
I \ I /
8 0 8 8 0 0 8 ~ 0 0 0 0
8808.88
Pnnter
Server , 7 , / - rid--- ? !
q u 1 Ih I - i I = !
Printer
The Technological Elements of Networks The network component of IT infrastructure can be decomposed into several tech- nological elements; these are the key components that managers must understand, arrange, and maintain. Although the underlying technologies that constitute these el- ements vary, anyone involved in managing networks will need to make decisions about the design, management, and improvement of the following.
Local Area Networks I Local area networks (LANs), as the name implies, provide a way for computers that are physically close together to communicate (see Figure 5.5). LAN technologies I define the physical features of technolog~cal~s~utions to local communication prob- lems and needs (e.g., should we use coaxial br unshielded twisted pair cabling? i- should we go wireless?) and also the pro ocols-the rules-for "conversations" be- tween computers (e.g., should we use Ethernet or Token Ring standards?). Choices between different technologies and standards involve trade-offs, often in terms of cost versus capabilities but sometimes also, as in the case of wireless technologies, in terms of convenience versus data capacity or even information security.
Hubs, Switches; and NetworkAdapters I Hubs, switches, and network adapters allow computers to be connected in LANs. Hubs and switches serve as central junctions into which cables from the computers

160 Module Three Managing ~etworked ~nfrastructure and Operations
The problem of computers "conversin~g" on a LAN is much like the problem of studentsconversing in a classroom. In a classroom, the air in the room (the "ether") readily supports students in speak- ing to each other. But if two people rpeak at the same time, they cannot be sure of ~:ommunica- tion. To avoid such problems in the classroom we employ protocols-rules-that govern our inter- actions. One possible set of rules might require that students speak in turn. To keep track of whose turn it is, we might pass a small object (a "token") in a pattern (maybe a "ring") around the room. Whoever has the token at the moment has speaking rights; everyone else must listen.
These rules are very much like those used by com- puters as they speak onto the captive ether of LAN network cables by using the Token Ring pro- tocol. The popular Ethernet protocol is a little dif- ferent. With Ethernet, computers speak out whenever they (1) have something to say and (2) hear silence on the network for a moment. If two or more computers speak at the same time, the computers notice this-they detect the "colli- sion"-and stop talking. Each waits a random amount of time and tries again. The Ethernet pro- tocol works well as long as the amount of time it takes a computer to say something is small rela- tive to the time available.
on a LAN are connected. Hubs are simple connection devices, but switches vary in complexity and capability from very simple to very large and sophisticated. Sophisticated switches connect LANs and larger networks to each other. Network adapters that are physically fitted into the computers on a LAN translate the com- puter's communications into a language that can be broadcast over the LAN and understood by listening computers. Network adapters also listen for communica- tions from other computers and translate them into terms that can be understood by the connected computers (see the accompanying feature).
Wide Area Networks
Wide area networks (WANs), as the name implies, provide a way for computers physically distant from each other to communicate (see Figure 5.6). WANs are net- works of networks, which enable multiple LANs and smaller WANs to connect and communicate. WAN technologies define the physical features of technologi- cal solutions and the standards for conducting conversations between computers and communicatior~ devices over long distances (e.g., should we use gigabit Eth- ernet or Asynchronous Transfer Mode: to transmit large volumes of data over long distances?). A WAN inside the boundaries of a company's physical premises is sometimes called an Intranet. A WAN that extends outward from a company's physical premises to business partners is sometimes called an Extranet. Choices between different technologies and standards in building Internetworks, whether they are Intranets or Extranets, involve trade-offs of cost versus data capacity, re- liability, and security.

Chapter 5 understanding Internetworking Infrastructure 161
FIGURE 5.6 An Example of a WAN
Remote
Routers Routers are the devices that enable Internetworking, the means by which messages are relayed across large distances. A router listens in on LAN conversations and rec- ognizes messages intended for computers that are not on that LAN. The listening router relays those messages to other routers. Each router has some notion of the ap- proximate direction of the message's destination across the larger network. As a message makes its way through a series of between-router "hops," it gradually ar- rives at routers that know more details about the location of the destination com- puter. Eventually a message finds a router that knows the destination machine's LAN and can complete the delivery of a message. Like switches, routers come in simple and sophisticated varieties. They are the glue with which networks are con- nected to each other and provide many degrees of freedom in network design (see the accompanying feature).
Firewalls and Other Security Systems and Devices As we discuss in more detail in the next chapter, managers of computing infrastructure have reason to worry about the security and confidentiality of the information that trav- erses networks. A variety of network systems and devices addresses these worries. Fire- walls act as security sentries at the boundaries of an organization's internal network to protect it from intrusion from the outside. Because firewalls are imperfect, network managers employ intrusion detection systems (IDSs) composed of a variety of software tools such as network monitoring software and hardware devices such as sensors and probes. Other network security devices help users open secure virtual "tunnels7' across public and private networks to create virtual private networks (VPNs). The complexity

162 Module Three Managing Nehvorked Infastructure and Operalions
Imagine a complex highway system on which mil- lions of cars are always moving. There are groups of cars that belong to the same travel party and are heading to the same place. But individual drivers know only the address where they are heading. They have no maps and no sense of di- rection. Members of groups make no attempt to stay together. At junctures along the highway network there are routing stations where cars
stop, show their destination addresses, and are told, "Try going that way." A single routing sta- tion may send cars heading for the same destina- tion in different directions. Eventually, though, a car arrives at i t s destination. It waits for other members of the travel party to arrive, and then they all do something useful together. This is an overly simple but fairly accurate analogy for how messages traverse Internetworks.
of the configurations of security systems and devices increases with the changing na- ture and escalating magnitude of security threats.
- Caching, Content Acceleration, and Other Specialized Network Devices
As the commercial uses of Internetworks proliferate, so do devices aimed at ac- complishing specialized network functions. Some devices help accelerate the deliv- ery of information across the network, sometimes by "caching" (e.g. storing) infor- mation in a location close to the destination machine. This approach is used for information that does not change often. Other specialized devices help assure the ef- ficient transmission of time-dependent information such as the sound and image data that accompany Internetwork-based video delivery or video teleconferencing. As infrastructure e\,olves, there will be continuing growth in specializect network systems and devices for metering and management of messages and transactions to assure timely and error-free quality of services (QoS), facilitate information-based transactions, and accomplish a variety of other functions.
The Technological Elements of Processing Systems The processing systems component of IT infrastructure can be decomposed into tech- nological elements managers must understand, arrange, and maintain. Although there is tremendous variety in the underlying hardware and softyare that constitute these el- ements, anyone involved in managing a company's processing systems will need to make decisions about the design, management, and improvement of the following.
Client Devices and Systems Until quite recently it was safe to think of client devices as PCs; in the last few years, however, variety in client devices has exploded to include handheld devices, cell phones, and even automotive compone:nts. Client systems are the software that runs on these devices to perform business hc t ions , manage interactions with other com- puters, and handle certain low-level client machine operations (such as storing saved

Chapter 5 Understanding Internetworking Infrastructure 163
information). As the name implies, clients are often on the receiving end of IT ser- vices delivered from elsewhere in the network. Business users experience Internet- working infrastructure primarily through client devices and systems. Unlike the ter- minals of the mainframe era, modern clients are not dumb; often they are capable of performing significant business functions even when separated from a network. Mo- bile users often use clients in both network-connected and unconnected modes; client software must manage intermittently connected devices and systems in a way that provides business advantage to users.
I Sewer Devices and Systems
Servers occupy a role in Internetworking infrastructure roughly equivalent to that of mainframe computers in an earlier era. Although based on microcomputer technol- ogy, servers handle the heavy processing required for high-volume business trans- actions and permit sharing of information across a large number of computer users. Servers are the source of many of the IT services that clients receive from across the network. Server systems consist of software to carry out mainline business functions (such as order or inventory management), manage transactions from other comput- ers (such as those that update inventory information), and handle low-level machine operations (such as storing saved information). In essence, clients perform front-end processing (interaction with users) while servers perform back-end processing (heavy computation or interaction with other back-end computers). Servers are of- ten physically located in data centers and managed by central staffs, as their main- frame ancestors were. Servers and their systems are increasingly designed as spe- cialized appliances targeted at specific functions: database servers, Web servers, and application servers, for example (see Figure 5.7). Software systems that run on dis- tributed, specialized architectures must be designed very differently from those of mainframe systems in which all processing happens on the same machine.
Mainframe Devices and Systems Mainframe computers remain very much a part of modern Internetworking infra- structure. In many companies, mainframes still do the vast majority of business-critical transaction processing. Some of these mainframes are modern, high-performance machines, the equivalent of very powerful servers that interoperate well with Inter- networks. Others are relics of an earlier era that are still performing vital business functions. As computing infrastructures become more interconnected, legacy main- frame systems pose complications. The open protocols of the Internetworking world are not the native language of older mainframe computers. Mainframe manufactur- ers have developed systems that enable interaction between legacy mainframes and Internetworks. These advanced systems allow users to access information on main- frames via new technologies, such as Web browsers. But interfaces between legacy mainframes and Internetworks sometimes cannot overcome the problems associated with the interaction of such different technologies. For example, some mainframe systems still process jobs in batches. Native Internetworking systems and more mod- ern mainframe systems, in contrast, usually are designed to operate in real time, to process new orders at the time they occur. Overcoming fundamental operational

164 Module Three Managing Networked lnfrastructure and Operations
FIGURE 5.7 Sewers in a qpica l E- Commerce Configuration
Source: Robert D. Austin, Larry Leibrock, and Alan Murray, "The iPremif Company: Denial of Service Attack (A):' Hanard Business School Case No. 9-601-1 14.
/ QcIata Private Network
Internet 1 outer -Cust.. Router I VPN Premier Company ,
Ethernet Switch
Network Management
iPremier Co Cage I I_
I Web ~ c c e l e z o r
I Ethernet Switches I
I Web Server ~ l u s t e ~ j SMTPPOP Network Server Management Database Server I Diagram simpl$ed for illustration purpose
I
incompatibilities often eventually necessitates the replacement of a legacy system. This takes time and money, though, and cannot be accomplished overnight. Where mainframes remain in more modern renditions, their mission has changed so that they function effectively as real-time transaction processors.
1 , I . Middleware
Middleware is the hodgepodge of enabling utilities, message handling and queuing systems, protocols, standards, software tool kits, and other systems that help clients, servers, mainframes, and their systems coordinate activities in time and across net- works. Middleware., which often runs on servers, could be considered a category of server system, but it is important enough in orchestrating the aotivities of Internet- working infrastructure to deserve its own category. Many managers know little and understand less about middleware; it is a classic example of difficult-to-manage in- frastructure. Few people know enough about both the technology and the business needs to make intelligent decisions in this area.

Chapter 5 Understanding Internetworking Infrastructure 165
Infrastructure Management Systems A company must have systems for managing its computing infrastructure. These sys- tems monitor the performance of systems, devices, and networks. They include sys- tems that support the help desks when users are having trouble with computers or net- works and the systems that deliver new software to computers throughout an organization. The quality of infrastructure management systems influences how effi- ciently a company obtains value from its computing assets. Without strong systems management, expensive Internetworks may become tied in knots; for example, too many transactions may flow to one computer while another is underused.
Business Applications Computer users interact with the business applications layer of infrastructure con- stantly and directly. Most companies house an immense variety of installed business applications. Many applications are custom built by the IT staffs in the companies that use them. Others are off-the-shelf packages ranging from small client applica- tions, such as a spreadsheet program, up to huge packages that cost tens of millions of dollars and take years to install, such as enterprise resource planning (ERP) sys- tems. As the name suggests, business applications deliver actual business function- ality. In a real sense, it is the job of the rest of an Internetworking infrastructure to make possible the delivery of business functionality by this top layer.
The Technological Elements of Facilities The facilities component of IT infrastructure also can be decomposed into technolog- ical elements. Once a backwater left to real estate managers, facilities management has become an important aspect of infrastructure management, primarily due to the de- mands for always on, 24-hour, 7-days-a-week (24 X 7) operations. Consequently, any- one involved in managing a company's processing systems eventually will face deci- sions about the design, management, and improvement of the following.
Buildings and Physical Spaces The physical characteristics of the buildings and rooms that house computing infra- structure strongly influence how well devices and systems Qnction and how effi- ciently and effectively they can be managed (see Figure 5.8). The size of a facility, its physical features, how readily it lends itself to reconfiguration, and how well it protects its contents from external disruptions are important factors to consider in managing physical structures.
Network Conduits and Connections The way in which systems within a facility are connected to wider networks also influences IT infrastructure performance. Among the factors managers must con- sider are the amount of redundancy in physical network connections, the number and selection of partners who will provide "backbone" connectivity to external net- works, and the capacity of the data lines leased from service providers. All these

166 Module Three Managing Networked Infrastructure and Operarions
FIGURE 5.8 Private Transport A Modern Data Center
Source: Allegiance Telecom.
factors involve trade-offs in terms of cost, performance, availability, and security. At stake in trade-off decisions are nothing less than relationships with customers, suppliers, and other business partners.
Power Computers do not run without power, and many businesses do not run without com- puters. Assuring that firms will have power when they need it is, then, a major con- cern for infrastructure managers. Decisions in this area involve trade-offs between cost and redundancy. Systems can obtain power from multiple power grids and util- ities, uninterruptible power supplies (UPSs), backup generators, and even privately owned power plants. Determining which measures are worth their cost is a manage- ment decision.
Environmental Controls Computers are delicate devices (although less so than in the past). They do not tol- erate wide variations in temperature or combine well with moisture. Shielding com- puters from environmental hazards is another effort that can be pursued more or less thoroughly and at varying cost. As with power, how much should be paid for addi- tional degrees of protection is a management decision.
Security Computer devices and systems also must be protected from malicious attacks, both physical and network-based. Physical se:curity requires facilities and methods that con- trol access to machines, such as security guards, cages, and locks. Network security- a field of growing complexity-has numerous facilities implications. The tlzreat from hacker attacks and intrusions is a growing problem. As with other facilities elements, security involves trade-offs, in this case between cost and level of protection.

Chapter 5 Understanding Internetworking Infrastructure 167
First the information is divided into packets. A "header" is then attached to each packet; the header contains a "sequence number" and the packet's origin and destination " i P addresses." IP addresses are composed of four numbers, 0 to 255, separated by decimal points (19.67.89.134, for example). Packets are then transmitted via a router-a specialized computer that keeps track of addresses-across an available communica- tion line to other computers in the rough direc- tion of the destination address. The process is
repeated until a packet finds its way to its desti- nation. A packet waits at its destination for the arrival of the other information packets sent with it. When all the packets in a group arrive, the sent information is reconstructed by using the sequence numbers in packet headers. If a packet has not arrived after a certain period of time, the receiving machine transmits a resend request to the origin address found in the head- ers of other packets in the group.
Operational characteristics of lnternetworks8 Taken together, Internetworking technologies have operational characteristics that distinguish them from other information technologies. In many ways, these charac- teristics determine the challenges of managing infrastructures based on Internet- working technologies. Important operational characteristics of Internetworking technologies that make them different from the technologies of previous eras in terms of how they perform and should be managed include the following (see the accompanying feature).
Internetworking Technologies Are Based on Open Standards We have already mentioned this, but it bears repeating because of its importance. TCPIIP is the primary common language of Internetworking technologies. TCPIIP standards define how computers send and receive data packets. Because the stan- dards were developed using public funds, they are public, not owned by anyone; they are open, not proprietary. The fact that TCPIIP can be freely used by anyone makes Internetworks less dependent on solutions developed and marketed by private com- panies. Decreased reliance on proprietary technologies has generated huge eco- nomic benefits for purchasers of new technology by making systems from different vendors more interoperable and thus increasing competition. Prices are lower and performance better than they might have been if these technologies had remained proprietary. Insistence on open standards and solutions has become part of the ethos of the Internetworking community of administrators and developers. This ethos has
&This section is based in part on Thomas Rodd and Robert D. Austin, "The Worldwide Web and Internet Technology: Technical Note," Harvard Business School Case No. 198-020.

168 Module Three Managing Networked Infastructure and Operations
TABLE 5.2 Measuring Network Bandwidth
led to development of other important open standards, such as Hypertext Transport Protocol (HTTP), used to deliver Web content.
i
Internetworking Technologies operate ~s~nchronous l~ \ Information sent over an Internetwork does not employ dedicated, bidirectional
connections between sender and receiver, as for example, a telephone call. In- stead, packets of inlormation with accompanying address information are sent to- ward a destination, sometimes without any prior coordination between the sender and the receiver. Network services that exchange information quickly, sinch as the Web, require the sender and the receiver to be connected to the Internetwork at the same time. But such communication is still asynchronous in that no dedicated link is established. For other services, such as e-mail, the receiver's computer need not even be switched on at the time the message is sent. As with postal mail, an e-mail recipient has a mailbox where mail can accumulate until it is accessed. Unlike regular mail though, e-mail messages can be sent around the globe almost instantaneously.
Internetwork Communications Have Inherent Latency The computers that make up Internetworks are connected by links of varying ca- pacity (see Table 5.2). As packets carry information along different paths toward a common destination, some packets flow quickly through wide links while others move more slowly through narrow links. Packets that together constitute a single message do not arrive at the destination in the same moment. Thus, there is variable wait time between the sending of a message and the arrival at the destination of the last packet in a message. Because trafiic volume is somewhat unpredictable, wait time---often called latency-an be difficult to predict. Managers can talie actions to make it likely that latency will be within certain tolerances. At the very least, they can assure that network capacity between two points is great enough to avoid unac- ceptable wait times. New routing technologies provide more options; some make it possible to move high-priority packets to the top of the queues that form at narrow network links. But some degree of latency, and hence unpredictability, is inherent in

Chapter 5 Understanding Internetworking Infrastructure 169
Internetworking technologies and must be taken into account in the design and man- agement of Internetworking systems.
Internetworking Technologies Are Naturally Decentralized
Largely due to their Defense Department heritage, which dictated that computer networks contain no single points of failure, Internetworks have no central traffic ,. control point. Computers connected to the network do not need to be defined to a central control authority, as is the case with some networking technologies. There is, in fact, no central authority that oversees or governs the development or administra- tion of the public Internet except the one that assigns TCPIIP addresses. As a result, individuals and organizations are responsible for managing and maintaining their own facilities in a way that does not hinder the operation of the network as a whole.
Internetworking Technologies Are Scalable
Because communication is intelligently routed along multiple paths, adding to an In- ternetwork is as simple as connecting to another machine. An Internetwork as a whole is not affected significantly when a path is removed (packets simply get routed a different way). Additional paths can be added in parallel with overworked paths. Furthermore, Internetworking technologies allow relatively easy reorganiza- tion of subnetworks; if a network segment has become overloaded, the network can be split up into more manageable subnetworks. In general, these new technologies allow more flexible expansion than do most other network technologies.
The Rise of Internetworking: Business Implications
Dr. Eric Schmidt, Google chief executive officer (CEO), former Novel1 CEO, and former Sun Microsystems chief technology officer (CTO), has observed that high- capacity networks enable a computer to interact just as well with another physically distant computer as with one that is only inches away. Thus, given excess bandwidth, the physical location o f computers ceases to matter much. Operationally, the com- munication pathways inside a computer become indistinguishable from the path- ways that connect computers. The network itself becomes part of a larger processor composed of the network and all of its connected computers. To paraphrase a Sun Microsystems slogan: The network becomes a computer.
For business computer users who do not have access to this level of network bandwidth, Schmidt's observation remains largely theoretical (see Table 5.3). Nevertheless, the idea of an increasingly connected network, both inside and be- yond the boundaries of organizations, in which the physical location of proces- sors matters less and less is of great practical importance. Improved connections between machines, departments, companies, and customers mean quicker real- ization of economic value when parties interact; Internetworking infrastructure is the means by which value is created and captured in real time. Transactions are
'
initiated and consummated quickly. Activities that once were sequential occur si- multaneously. Because the physical location of processing is less important, new

170 Module Three Managing Networked Infrastructure and Operations
TABLE 5.3 Communication Technology, Bandwidths, and User Groups
I Communication Technology Bandwidth* User Groups
Telephone modem 33.6-56 kbps Individuals and small businesses
I
Integrated Services Digital 128 kbps Individuals and srrall Network (ISDN) businesses 1
Cable modem 128-512 kbps Individuals and small businesses I
Digital subscriber line (DSL) 128 kps-1.5 mbps Individuals and small businesses
Ethernet LAN 10-1 00 mbps Most businesses atid , organizations
Leased Lines (TI, T3) 1.544-45 mbps Government, universities, i medium-size and large businesses
I Asynchronous Transfer Mode 155 mbps-25.6 gbps Government, universities, (ATM)/ Gigabit Ethernet and large corporations
*We have listed the typical bandwidth performance. Some of the technologies are theoretically capable of higher bandwidths. Additionally, some t-chnologies perform at different speeds upstream and downstream.
possibilities for outsourcing, partnerships, and industry restructuring emerge. Along with these beneficial outcomes come drawbacks: rising complr:xity, un- predictable interactions, and new types of threats to businesses and consumers. As a result, executives must understand the business implications of these pow- erful and pervasive networks.
The Emergence of Real-Time Infrastructures In the mainframe era, scarcity of processing capacity required business transactions to be accumulated and processed in batches. A telephone calling card accol~nt might, for example, be updated by a batch run once each day. A stranded traveler who needed to reactivate a mistakenly deactivated card might have to wait for the once- a-day batch run for the card to be reactivated. As processing and communication ca- pacity became more abundant, however, batch processing became less necessary. Delays between initiating a transaction and completing its processing have been greatly reduced. With real-time Internetworking infrastructures, customers are ser- viced and economic value is realized immediately rather than over hours, days, or weeks. The potential benefits of real-time infrastructures are discussed below.
Better Data, Better Decisions In most large orgariizations, people in different locations need access to the same data. Until recently, organizations had to keep copies of the same data in many places. But keeping the data synchronized was difficult and frequently did not hap-

pen. Discrepancies between copies of data led to errors, inefficiencies, and poor de- cision making. Abundant communication capacity has not completely eliminated the need for multiple copies, but it has reduced it. In addition, it has made it much easier to keep copies synchronized. For the first time it is becoming possible to run a large business based on a set of financial and operational numbers that are con- sistent throughout an enterprise.
Improved Process Visibility Older IT systems based on proprietary technologies often communicated poorly with each other. Consequently, viewing the progress of orders or other transactions across system boundaries was difficult. People in a company's sales organization could not access data in manufacturing, for example, to obtain information about the status of an order. New technologies based on open standards and compatible back- office transaction systems let users instantaneously view transactions with each step in procurement and fulfillment processes, beyond specific system boundaries, and even beyond the boundaries of a company into partners' systems.
Improved Process Eficiency Many efficiency improvements result directly from enhanced process visibility. In manufacturing, workers who can see what supplies and orders are coming their way tend to hold less buffer stock ("just-in-case" inventory) to guard against uncertainty. Holding less buffer stock reduces working capital, shortens cycle times, and im- proves return on investment (ROI).'A manager in charge .of supplying plastic cases for portable radios, for example, can notice that orange radios are not selling well and quickly reduce orange in the color mix.
From Make-and-Sell to s ense -and-~es~ond~ Real-time infrastructures are a prerequisite for achieving highly responsive opera- tions, those based on "sense-and-respond" principles rather than make-to-sell prin- ciples. The fundamental insight here is that if operating infrastructures can come close enough to real time, value-adding activities can be performed in response to actual customer demand rather thanforecasted customer demand. Sense-and-respond organizations avoid losses caused by demand-forecasting errors. The most cele- brated example is Dell Computer Corporation's make-to-order manufacturing process, which makes computers only in response to actual customer orders. But many other companies in both manufacturing and service industries are seeking ways to move to sense-and-respond models, including some with very complex products, such as automobiles.
In many companies, especially older ones, moving to real-time systems in- volves reengineering transaction systems to take advantage of greater processing and network capacities. Some companies have renewed transaction infrastructures by implementing large enterprise systems made, for example, by SAP, Oracle, and
'see Richard L. Nolan and Steven P. Bradley, Sense and Respond: Capturing Value in the Network Era (Boston: Harvard Business School Press, 1998).

172 Module Three Managing Networked lnfrasiructure and Operations
Peoplesoft. Others have designed best-of-breed transaction infrastructures by con- necting what they consider the best products from a variety of niche vendors. Whichever approach a company takes, the objective is to remove elements from the transaction infr;istructure that do not operate in real time, thereby realizing al- most immediate economic value from transactions.
A company that succeeds in reengineering transaction and communication sys- tems to operate more or less in real time has ascended to a new and important stage of evolution. When a company achieves real-time IT operations, it not only creates value more quickly, it also creates options for fully leveraging a shared public infra- structure, the Internet, for that company's private gain. But there are drawbacks in how real-time infrastructures operate. The same characteristics that allow immedi- ate value creation also allow crisis acceleration. The connections to public networks that create leverage also increase exposure to external threats. While the drawbacks do not outweigh the benefits, they must be understood and managed.
Broader Exposure to Operational Threats On October 19, 1987, the Dow Jones Industrial Average plummeted more than 500 points in the 20th century's single largest percentage decrease. The 22.6 per- cent plunge was almost double the 12.9 percent drop in 1929 that foreshadowed the Great Depression. Unlike 1929, the market in 1987 quickly recovered, post- ing major gains in the two days after the crash and regaining its precrash level by September 1989. Kevertheless, the suddenness of these events prompted a search for explanations.
Many singled out the role of computerized program trading by large institutional investors as a primary cause of the 1987 crash. In program trading, computers initi- ate transactions automatically, without human intervention, when certain triggering conditions appear in the markets. What no one anticipated was that automatic trades could lead to a chain reaction of more automatic trades. Automatic trades tlzemselves created market conditions that set off more automatic trades, which created condi- tions that set off more automatic trades, and so on, in a rapid-fire progression that was both unexpected and difficult to understand while it was in progress.
This example reveals a dark side of real-time computing that extends to Internet- working infrastructures. As batch-processing delays are eliminated and more trans- actions move from initiation to completion without intervention by human opera- tors, the potential grows for computerized chain reactions that produce unanticipated effects. Favorable effects such as value creation happen more imme- diately, but so do ill effects. Malfunct~ons and errors propagate faster ancl have po- tentially broader impacts. Diagnosis and remediation of problems that result from fast-moving, complex interactions present major challenges to organizational and, indeed, human cognitive capabilities. .rust figuring out what is going on during or in the immediate aftermath of an incident is often difficult.
IT infrastructures of the 2 1 st century therefore must be less prone to ma Ifunctions and errors that might trigger a chain reaction and more tolerant of them when they occur. Real-time operations demand 24 X 7 availability. Because some unintended effects will occur d~espite the best intentions and plans, responsible managers need to think in advance and in detail about how they will respond to incidents Effective

Chapter 5 Understanding Internetworking Infastructure 173 I
I
"disaster recovery" requires anticipating that incidents will occur despite the fact that one cannot anticipate their exact nature and practicing organizational responses. The range of incidents that require detailed response plans also includes those of a more sinister sort: malicious attacks. Infrastructure managers must anticipate and protect systems from the many exploits creative individuals-hackers-use.
Technologies of the past were designed to deny access to systems unless some- one intervened specifically to authorize access. Internetworking systems are differ- ent. Because they evolved in an arena not oriented toward commerce but intended to support communities of researchers, Internetworking technologies allow access unless someone intervenes to disallow it. Security measures to support commercial relationships, therefore, must be retrofitted onto the base technologies. Moreover, the universality of Internet connections-the fact that every computer is connected to every other computer-makes every computer a potential attack target and a po- tential base from which to launch attacks.
The average computer is connected to the Internet for only a few minutes before it is "port scanned," or probed for vulnerability to intrusion or attack. Many at- tempted incursions are the electronic equivalent of school kids playing a prank. But recent evidence shows that more serious criminals have begun to explore the possi- bilities presented by the Internet. The threat is real, even from pranksters. Damag- ing attacks are alarmingly simple to initiate.
In February 2000, the business community received a wake-up call concerning its vulnerability to electronic attack (see Table 5.4). Total damages from a series of high-profile, centrally orchestrated "denial of service" attacks were estimated to be in excess of $100 million; the estimated costs incurred in more recent attacks reached into the billions of dollars. As the Internet and the Web have risen to com- mercial prominence, computer security problems have progressed from being tacti- cal nuisances that could be left to technicians into strategic infrastructure problems that require the involvement of business executives at the highest levels.
New Models of Service Delivery In the early days of electric power generation, companies owned and managed their own power plants. Later, as standardization and technological advances made it pos- sible to deliver power reliably via a more centralized model, companies began to pur- chase electric power from external providers. A similar shift is under way in the IT industry.
In today's companies, as increasingly reliable networks make the physical loca- tion of computers less important, services traditionally provided by internal IT de- partments can be acquired externally, across Internetworks, from service providers. Fundamental economic forces such as the scarcity of IT specialists and the desire to reduce costs are driving this shift. The shift, which parallels the maturation of other industries, reveals a common pattern: Standardization and technology advances per- mit specialization by individual firms in value chains, resulting in economies of scale and higher service levels.
The transition under way is analogous to the move from telephone answering ma- chines to voice mail. Telephone answering machines were purchased by companies and attached to individual telephones. When they broke, it was the company's job to

174 Module Three Managing Networked Imfastructure and Operations
TABLE 5.4 Wake-Up Call: Denial of Service Attacks in February 2000*
/ Date Target Company Results of Attack
February 7 Yahoo!
February 8
February 9
Overwhelming spike in traffic that lasted 3 hours. Network availability dropped from 98% to 0%. Attack originated from 50 different I
locations and was timed to occur (luring / middle of business day. I
Stock was down 3.2% for a week in which Nasdaq rose almost 3%.
Attack occurred within an hour of the company's initial public offering (IPO). i Stock was down at week's end mctre than 20% from IPO price. Stock was down 7.3% for a week in which
I I
Nasdaq rose almost 3%. I Service disrupted. I
I
Attacked during peak trading hours. I
Stock was down 7.6% for a week In which Nasdaq rose almost 3%. Service disrupted. I
February 18 Federal Bureau of Service disrupted. lnvestigatior~ (FBI)
I February 24 National Discount Brokers Attacked during peak trading hours. Group (NDB) * Operators accidentally crashed site as
they attempted to defend against the attack. I
'Overall performance of the Internet degraded by as much as 25% during the peak of the attacks as computers resent messages repeatedly and automatically, trying to recover interrupted transactions. Source: Adapted from NetworkWorldFusion, www.nfusion.com, compiled by LeGrand Elebash.
fix or replace the machines. Messages were stored on magnetic tape inside the ma- chine. In contrast, companies acquire voice mail from service providers for a monthly fee. The hardware that supports the service is owned by the provider and physically resides m a central location unknown to most voice mail users. When voice mail breaks, the service provider is responsible for fixing it. Fixing it is easier and less expensive because the infrastructure that delivers the service is centralized and easily accessible. The potentially sensitive contents of voice mail messages no longer reside on the end user's desk; instead, the service provider is entrusted with their care and security.
The move to over-the-Net service delivery has been gradual. As supporting in- frastructure matures, however, the economic advantages become more compelling. Even if actual software functionality is not acquired externally, external infrastruc-

Chapter 5 Understanding Internetworking Infastructure 175 1
ture management may still make sense. For example, a company may rent space in a vendor-owned IT hosting facility rather than incur the capital expenses required to build a data center even as it retains internal management of the software.
As IT service models proliferate, service delivery depends on a growing number of service providers and other partners. One implication is that the reliability of vi- tal services is only as good as the weakest link in the service provider chain. Select- ing strong partners and managing relationships are vital to reliable service delivery.
New service models that offer new capabilities and cost reduction cannot real- ize their full potential without being integrated into the rest of a company's IT in- frastructure. Ideally, over-the-Net services would exchange data seamlessly, in real time, with a company's installed base of systems. Unfortunately, this is not easily accomplished. The questions involved in deciding how new services should interact with existing IT and organizational systems leads to the subject of man- aging legacies.
Managing Legacies Few companies are so new that they have no artifacts left over from earlier eras that must be managed even as the companies move forward with new technologies. Legacy systems present one set of challenges. They are often based on outdated, ob- solete, and proprietary technologies. Yet they are vital to the business as it operates from day to day. Fitting new infrastructure into complex legacy infrastructure, or vice ~ersa, '~resents formidable challenges and uncertain outcomes.
But systems are not the only legacies companies must manage. Even more sig- nificant are legacy processes, organizations, and cultures. Changing the IT infra- structure has unavoidable effects on nontechnical elements of a company's opera- tions. New technologies change how people work and interact. Managers must decide how much they want the company's culture to drive the design of its infra- structure or vice versa. In some companies, managers go to great lengths to make sure the IT infrastructure does not constrain culture or process. In others, managers use IT systems as "sledgehammers" to bring about organizational change. Both ap- proaches can work, but the issues and decisions involved are complex.
The Future of Internetworking Infrastructure
The basic technology that supports moving data packets around an Internetwork has existed in something like its present form since the late 1960s. The technologies we use to access Internetworks-PCs, e-mail packages, and Web browsers, for example- have been appearing and maturing over the last 20 or so years. Although Internet- working infrastructure continues to evolve significantly in both of these areas, there is a third area in which Internetworking technologies are evolving even more rapidly.
The smooth functioning of markets and other kinds of business interactions pre- sumes prerequisites that Internetworking infrastructure still does not perfectly ful- fill. We have mentioned some of these already. Markets do not tolerate the uncer- tainties of unreliable or unavailable infrastructure. Customers of a financial services

176 Module Three Managing Networked Infrastructure and Operations
firm, for example, will not abide loss of access to stock market trading. Similarly, business transactions cannot flourish when infrastructure is not highly secure. As we have seen, Internetworks already are reasonably good at reliability, availability, and security, and they are getting better. But there are other, more subtle aspects of busi- ness support for which these technologies are not yet mature.
Ultimately, Internetworking technologies must support all or nearly all the ele- ments of business transactions that can occur in face-to-face transactions. If you are videoconferencing, for example, you need to be able to purchase guaranteed net- work bandwidth sufficient to make the conference approximate a productive face- to-face work experience; this is not yet possible everywhere. Consider another ex- ample: In business, you need to be sure the party you are interacting with is who he says he is so he cannot later say, "That was not me you contracted with." This "non- repudiation" requirement still presents difficulties between some Internetworks. In general, the elements of infrastructure that support financial transactions are works in process; they constitute the above-mentioned third area in which infrastructure is evolving most rapidly. How we transport information within Internetworks and how we access network resources are well #defined, if continually changing, at this point in history. How companies will in the long run engage each other in real-time trans- actions, negotiate the terms of transactions, establish business linkages, and settle accounts depends on standards and technologies not yet fully developed.
Summary Internetworking infrastructures include the totality of existing client-serve r systems, new externally provided services, and older legacy systems. They interact with liv- ing organizations and have distinctive characteristics that are coming into clear view in the 21st century. They offer many more degrees of freedom in designing organi- zations and contain larger numbers of smaller components that interact in complex ways. Some of the components exist outside a firm's boundaries and thus are not fully under the control of internal executives. The overall effect on a company's busi- ness is that there is more inherent uncertainty in the operational environment. This is at least partially offset by more incremental options for managing that urrcertainty. Our ability to predict how a planned system will perform is limited, but options for experimenting to improve our understanding of emerging infrastructures are be- coming more numerous and less expensive. Not surprisingly, our management frameworks are evcllving in a way that reflects the uncertain and incremental nature of emerging infrastructure.
In this chapter we have described the technologies, functions, and components of Internetworking infrastructure and how they are changing. We have explained how the changes at work generate new benefits, challenges, and threats. Approximately 75 percent of most companies' IT dollars go to infrastructure investments. If you are like many companies, that 75 percent approaches half of all your capital expendi- tures. Executives can use the following questions to assess the implications of the emergence of new technologies and ir~frastructures for their companies' operational capabilities:

Chapter 5 Understanding Internetworking Infrastructure 177
1. What does the public infrastructure of the Internet mean to our business opera- tions? Are we leveraging this infrastructure to maximum advantage? How de- pendent are we still on proprietary technologies?
2. How close do our company operations come to running in real time? What value creation opportunities can still be obtained by moving more in the direction of real-time value capture?
3. Has our company taken appropriate advantage of the many degrees of architec- tural and operational freedom offered by Internetworking technologies? Have we thought through the inherent complexities and risks in those additional degrees of freedom?
4. Are we'exploring new service delivery models aggressively enough? 5. Have we reexamined our management frameworks in light of the new and more
adaptive capabilities that Internetworking technologies offer? Most important, do senior business managers play an active and informed role in infrastructure de- sign and planning decisions?


Assuring Reliable and Secure IT Services1
The emergence of Web-based commerce has accelerated the expansion of a world- wide network capable of transmitting information reliably and securely across vast distances. The inherent reliability of modern Internetworks is a legacy of U.S. De- partment of Defense research in the 1960s that led to technologies robust enough to withstand a military attack. The key to this inherent reliability is redundancy: the ex- ceptionally large number of potential paths a message can take between any two points in a network. Because Internetworking technologies automatically route mes- sages around network problems, transmissions are highly likely to be successful.
Unfortunately, some components of a firm's infrastructure are not inherently re- liable. The reliability of processing systems, for example, is a function of how they are designed and managed. As with Internetworks, the key to reliable systems is re- dundancy; however, reliability through redundancy comes at a price. It means buy- ing extra equipment (computers, switches, software, electric generators, etc.) to guard against failures. Every increment of additional redundancy makes outages less likely, but every increment increases expenses as well.
How much reliability to buy is a management decision highly contingent on nu- merous, mostly business, factors. How costly is a 15-minute failure of the order management system? How costly is a 3-hour failure or a 12-hour failure? How likely are these failures? How about the e-mail system and the human resources system? Answers to these questions differ across businesses. Some costs of failures are in- tangible and hard to quantify. It may be possible to estimate, for example, the direct revenues your company will lose if your Web-based retail site goes down for two hours in the middle of the day, but it is much harder to gauge how many customers
his chapter is adapted from materials in Professor Robert D. Austin's Managing Infor- mation Technology Infrastructure course'module, Harvard Business School Publishing NO. 601-181.
179

180 Module Three Managing Networked Infrastructure and Operations
frustrated by the outage will never return. In addition, it is difficult to estimate the probabilities of such events.
Redundant systems are more complex than nonredundant systems, and this com- plexity must be managed. Businesses need policies that determine how to integrate re- dundant elements inro a company's overall infrastructure: how backup systems and equipment will be brought online, how problems will be diagnosed and triage4 and who will be responsible for responding to incidents. Since the efficacy and efficiency of incident response improve with practice, the frequency and structure of rehearsals are also managemem decisions. Charles Perrow suggests in,Normal Accidents: Living with High Risk Techrzologies that failures are inevitable in "tightly coupled" complex systems (as real-time infrastructures are by definition). Typical precautions, Perrow writes, such as adding redundancy, help create new categories of accidents l y adding complexity.2 Thus, our efforts to make infrastructure designs more robust also make operational management more difficult.
Managers also must guard against malicious threats to computing infrastructure. Malicious threats, which are similar to accidental failures in their potential cost and unintended ripple ef'fect, are designed specifically to damage a company's business. Attacks, intrusions, viruses, and worms have no legitimate uses when perpetrated against others' systems. Their designers, who are often extremely creative, are mo- tivated by a desire to cause mayhem.
Instigators of malicious threats, who often are called hacker^,^ range from pranksters to organized criminals and even international terrorists. Securing sys- tems against malicious threats is an arms race, a high-stakes contest requiring con- stantly improving defenses against increasingly sophisticated weaponry. Some businesses have particular reason to fear being targeted. But even the most unob-
. trusive firms cannot count on low profiles (security through obscurity'~ as a de- fense. Increasingly, attacks are automated and systematic, carried out by wrecking routines turned loose on the Internet to probe for vulnerabilities and inflict dam- age wherever they find them.
In an age of real-time systems, global operations, and customers who expect always* on performance, reliability and security have taken on new importance. Technologies to assure 24 X 7 operations4 get better all the time, but every increment of capability comes with additional infrastructure complexity and additional management chal- lenges. Add new malicious threats to the mix and we see that 21st century infrastruc- ture managers indeed have their hands hl l . Making the wrong decision in designing or maintaining infrastructure or in responding to incidents can severely harm a business.
'~harles Perrow, Normal Accidents: Living with High Risk Technologies (Princeton, NJ: Princeton University Press, 1999). 3 ~ h e term hacker is c:ontroversial. Although the word is now used to describe a computer expert with malicious intent, it originally had no negative connotations. UNlX programming enthusiasts, beginning in the 1960s, called particularly excellent programmers hackers. Some have tried to preserve the positive interpretation by proposing the word cracker to describe malicious hackers. In the popular perception, however, this battle seems largely lost; to most people, hacker implies malicious intent, so that is how we use it in this book. We extend our apologies to purists on this point. 4 ~ h a t is, operations that run 24 hours per day, 7 days per week.

'-. Chapter 6 Assuring Reliable and Secure IT Services 181
Availability Math --
The reliability of computing infrastructure is often discussed in terms of the avail- ability of a specific information technology (IT) service or system. A system that is 98 percent available is on average up and ready to be used 98 percent of the time. It is down, or not available for use, 2 percent of the time. In a day, 98 percent avail- ability translates into just under one-half hour of downtime, which might be fine for some systems and businesses.
A business's tolerance for outages varies by system and situation. Downtime that occurs in large chunks, say, a two-hour outage every four days, might be more of a problem than the same total amount of downtime occurring in increments that never exceed three minutes in a single outage. Whether outages occur at predictable times matters too. A half-hour outage that always happens at 3:00 A.M. may not be a prob- lem. Some systems require planned outages; for example, a system might need to be shut down each night to have all its data files copied to a backup tape. But planned outages are increasingly rare in the world of real-time infrastructures, and unplanned outages are not usually well behaved.
In modern contexts, a 98 percent availability rating for a system usually mkans that its probability of being up and running at any given time is 98 percent-period. A strong underlying presumption is that planned outages will be minimized, if not elim- inated. Moreover, for real-time infrastructure 98 percent is not nearly good enough. In fact, the availability of today's IT infrastructure is often expressed in terms of a num- ber of "nines." "Five nines" means 99.999 percent availability, which equates to less than a second of downtime in a 24-hour day, or no more than a minute in three months, on average. Not surprisingly, keeping systems available at such a high level requires much redundancy and highly sophisticated operations management.
We can better appreciate how difficult it is to achieve very high levels of relia- bility if we consider how rates of availability for components combine into overall system or service availability. Most IT services are not delivered by a single com- ponent but by a number of components working together. For example, a service that sends transactions from one server to another via a corporate Internetwork might re- quire two or more routers, one or more switches, and both servers-all up and run- ning at the same time. Each of these devices has its own individual availability. Thus, overall sewice availability is generally lower than the availability of individual com- ponents. Many managers do not appreciate how rapidly service availability de- creases as components are added in series. Let's consider how this works.
The Availability of Components in Series Suppose you have five components connected in series that together deliver an IT service (see Figure 6.1). Assume that each component has an availability of 98 per- cent, which means, as we have noted, a half hour per day of downtime for each com- . ponent on average. Computation of service availability is straightforward.
For the service to be up and running, all five components must be up and running. At any given time the probability that a component is up and running is .98 (that's what 98 percent availability means), and so the probability that Component 1 and

182 Module Three Managzng Networked lrlfmsfructure and Operations
FIGURE 6.1 Five Components in ava~ lab~ l~ ty ava~ lab~ l~ ty ava~ lab~ l~ ty ava~lab~l ~ t y
Series (Each 98 percent 98 x 98 x 98 x 98 x 98 = servlce ava~ lab~ l~ ty of 90% Available)
FIGURE 6.2 Combining Components in Series Decreases Overall Availability
Component 2 and C:omponent 3 and Component 4 and Component 5 are all up and running is .98 X .98 X .98 X .98 X .98 = .9.
The overall serkice availability is 90 percent, which means the service is un- available 10 percent of the time, or almost two and a half hours a day. If we take into account the fact that most services rely on many more than five devices operating in series, we can see that service availability degrades quite severely as we add com- ponents in a chain.
Figure 6.2 shows how service availability falls as we add components, assuming that individual com,ponents are 98 percent available. Notice that by the time we get to 15 devices in series-which is no1 hard to imagine in a modern IT infrastruc- ture--downtime exceeds 25 percent. Reversing this logic leads to an important con- clusion: If we neecl overall service availability of 99.999 percent (five nines) and service provision relies on 10 components, the availability of the individual compo- nents must average 99.9999 percent. For each of the 10 individual components, that equates to about 30 seconds of downtime per year. Thirty seconds is not enough time

Chapter 6 Assuring Reliable and Secure IT Services 183
FIGURE 6.3 Five Components in Parallel (Each 98 percent Available)
Component 1
availability
Component 2
availability
Component 3 - r l & availability - I
Component 5
availability
.02 x .02 x .02 x .02 x .02 = .0000000032 Probability of Failure
to restart most servers. If only one server needs rebooting in a year, that blows a five nines availability rating. Unfortunately, many popular server operating systems need to be rebooted much more often than once a year. How, then, can we achieve five nines of availability? The answer to this question is redundancy.
The Effect of Redundancy on Availability Suppose you have five components connected in parallel involved in the provision of an IT service (see Figure 6.3). The components are identical, and any one of them can perform the functions needed to support the service. As in the earlier example, each individual component has an availability of 98 percent and each component ex- periences outages randomly. The computation for the overall availability of these parallel components is also straightforward. -
Because any of the individual components can support the service, all five must fail at the same time to render this combination of components a failure. At any given time, the probability that a component is down is .02 (98 percent availability means 2 percent downtime), and so the probability that Component 1 and Compo- nent 2 and Component 3 and Component 4 and Component 5 will all fail at the same time is .02 X .02 X .02 -X .02 X .02 = .0000000032.

184 Module Three Managing Networked Infrastructure and Operarions e
FIGURE 6.4 Redundancy Increases Overall Availability
The overall availability of these components combined in ptrallel therefore is 99.99999968, which is eight nines of availability. Figure 6.4 shows how availability increases when components that are 98 percent available are combined in parallel. Of course, these components in parallel cannot deliver a service by themselves. To deliver a service, we must place the parallel combination in series with other com- ponents. From this example and the previous one, however, we can see that even if a component does not satisfy our five nines availability requirement, several con- nected in parallel may.
High-Availability Facilities A close look at modern data centers provides a concrete sense of the availability de- cisions faced by infrastructure managers. Data centers physically house Web, appli- cation, database, and other servers; storage devices; mainframes; and networking equipment in a robust environment that enables them to function reliably. They sup- ply space, power, and Internet connectivity as well as a range of supporting services. Although there is considerable variatilon in designs, today's state-of-the-art facilities tend to offer the following features.
Uninterruptible Electric Power Delivery High-availability facilities provide redundant power to each piece of computing equipment housed in them, literally two power cables for each computer (high- availability computing equipment accepts two power inputs). Power distribution

Chapter 6 Assuring Reliable and Secure ITSewices 185
inside the facility is fully redundant and includes uninterruptible power.supplies (UPSs) to maintain power even if power delivery to the facility is interrupted. Con- nections to outside sources of power are also redundant; usually facilities access two utility power grids. Diesel generators stand by for backup power generation; on-site fuel tanks contain fuel for a day or more of operation. Facilities managers have a plan for high-priority access to additional fuel in case of a long-lasting pri- mary power outage (e.g., delivery by helicopter). High-end data centers may ob- tain primary power from on-site power plants, with first-level backup from local utility power grids and second-level backup from diesel generators; UPSs may employ batteryless, flywheel-based technologies.
Physical Security Security guards posted in bulletproof enclaves protect points of entry and patrol the facility regularly. Closed-circuit television monitors critical infrastructure and pro- vides immediate visibility into any area of the facility from a constantly attended se- curity desk. Access to internal areas requires photo ID and presence on a prearranged list. Entry is through a buffer zone that can be locked down. Guards open and inspect the items (e.g., boxes, equipment) people bring into the facility. The building that houses the data center is dedicated to that use, not shared with other businesses. In some high-end facilities, the building is "hardened" against external explosions, earth- quakes, and other disasters. Advanced entry systems force everyone through multiple, single-person (hostageproof) buffers with integrated metal and explosive detection. Biometric scanning technologies such as retinal scanners, palm readers, and voice recognition systems control access to zones within data centers. Motion sensors sup- plement video monitoring, and perimeter fencing surrounds the facility.
< ,'-' Climate Control and Fire Suppression -
Facilities contain redundant heating, ventilating, and air-conditioning (HVAC) equipment capable of maintaining temperatures in ranges suitable for computing and network equipment. Mobile cooling units alleviate hot spots. Integrated fire suppression systems include smoke detection, alarming, and gas-based (i.e., no equipment-damaging water) fire suppression.
Network Connectivity External connections to Internet backbone providers5 are redundant, involve at least two backbone providers, and enter the building through separate points. The com- pany that owns the data center has agreements with backbone providers that permit significant percentages, say, 50 percent, of network traffic to travel from origin to destination across the backbone company's private network, avoiding often- congested public Internet junctions. A 24 X 7 network operations center (NOC) is staffed with network engineers who monitor the connectivity infrastructure of the facility; a redundant NOC on another site is capable of delivering the same services
'~ackbone providers own the very large data transmission lines through which large quantities of data are moved long distances.

186 Module Three Managing Networked Infrastructure and Operations
of equal quality as those provided by the primary NOC. High-end facilities have agreements with three or more backbone providers that allow even more traffic, up to 90 percent, to stay on private networks.
Help Desk and Incident Response Procedures Customers can contact facility staff for assistance at any time during the day or night. The facility has procedures for responding to unplanned incidents. Automated problem-tracking systems are integrated with similar systems at service delivery partner sites, and so complex problems involving interactions between services can be tracked down and quickly solved.
N + 1 and N + N Redundancy Most modern data centers try to maintain an "N + 1" level of redundancy of mission- critical components. N + 1 means that for each type of critical component there should be at least one unit standing by. For example, if a facility needs four diesel generators to meet power demands in a primary power outage, N + 1 redundancy requires five such generators, four to operate and one to stand by. N + 1 redundancy provides a higher level of availability if the underlying number of components, the N in the N + 1, is small (you can verify this for yourself by using probability calculations such as those that we demonstrated earlier).
Some companies aspire to higher levels of infrastructure redundancy. "N + N redundancy requires twice as many mission-critical components as are necessary to run a facility at any one time. For example, a facility that needs four diescl genera- tors to meet its power demands needs eight generators to achieve N + N retlundancy. Where N + 1 facilities are able to commit to service levels in the 99.9 percent avail- ability range, N + N facilities can ensure availability levels at the 99.999 percent (five nines) level. Facilities are sometimes categorized according to the level time they support. Level 1 data centers, which employ N + 1 redundancy, are avail- able 99 to 99.9 percent of the time. Level 2 and level 3 centers feature more redun- dancy. They guarantee availability at 99.9 to 99.99 percent and 99.99 to 99.999 percent levels, respectively. Level 4 data centers, the highest level of avai lability in current common usage, have N + N or better redundancy and achieve uptlme in the range of 99.999 to 99.9999 percent. Downtime at a level 4 facility, literally seconds per year, is unnoticeable by most user!;.
Not surprisingly, high levels of availability are costly. Forrester Research esti- mates that increasing the availability of a single website from 99 percent to 99.999 percent would require additional initial spending of $3.7 million and add~tional an- nual fees of $1.8 n i i l l i ~ n . ~ According to Morgan Stanley Dean Witter, the cost of building a 99.999 percent availability data center in 2000 was $400 to $550 per square foot; a data center capable of 99 to 99.9 percent uptime costs about $150 per square foot to build.'
6 ~ a n d y K. Souza wi th Harley Manning, Hollie Goldman, and Joyce Tong, "The Best o f Retail Site Design," Forrester Research white paper, October 2000. ' ~ e f f Camp, April Helnry, Jamie Gomez Surado, and Kristen Olsavsky, Morgan Stanley Dean Witter, November 2000.

Chapter 6 Assuring Reliable and Secure IT Services 187
FIGURE 6.5 A Representative E-Commerce Infrastructure
Server 1 Server 2 Server 1 Server 2
- - Firewall 1
Router Switch
- Firewall 2
I I
web Server Web Server Database 1 2 Server
Disk
Indeed, management decisions about the design of IT infrastructures always involve I trade-offs between availability and the expense of additional components. Figure 6.5 depicts an e-commerce infrastructure used by a real company for delivering a basic Web-based IT service. Notice that many infrastructure elements are redundant: the firewall devices, the Web servers, the application servers, and the policy servers. No- I tice, though, that the switch and the database server are not redundant. Why?
Although you cannot tell from the diagram, both the switch and the database . . 'I) servers have built-in redundancy. Both have redundant power supplies. In addition,
the switch hhs-redundant modules. The database server is shown connected to an ar- I ray of disks that is set up in a 'RAID' (redundant array of inexpensive disks) con- figuration to write data to at least two separate disks at the same time.8 Neverthe- less, there are single points of failure in these two components. Thus, the question remains: Why would managers leave these two obviously central components with- out redundancy when they have made all the other components redundant?
'~otice that there are usually many options for adding redundancy, some more expensive than others. For most high-availability equipment, redundancy is a matter of degree and can be purchased incrementally. Note also that redundancy does not necessarily mean purchasing another instance of exactly the same technology platform; cheaper platforms are sometimes used as temporary backups for expensive system components.

188 Module Three Managing Networked I~fiastructure and Operations
The answer boils down to one word: money. The two nonredundant compo~lents rep- resent approximately half the cost of this several hundred thousand dollar setup. Mak- ing the switch and database server redundant would add about 50 percent to the overall cost. Managers of this infrastructure have made a deliberate decision to rely on the re- dundancy built into these two devices. Depending on the company's business, this de- cision might be reasc~nable or it might not be. Such choices are not unusual, however.
Securing Infrastructure against Malicious Threats
In February 2002 Richard Clarke, the U.S. national coordinator for security, infra- structure protection. and counterterrorism, told an audience at a San Jose, Califor- nia, security conference that both the private and public sectors had much work to do before they would have secure computing infrastructures. In particular, he chided companies for spending an average of 0.0025 percent of their budgets on informa- tion security. "That's less than most companies spend on coffee," he observed. He continued: "If you spend as much on information security as you do on coffee, you will be hacked, and you'll deserve to be ha~ked."~
Despite Clarke's ominous words, there are indications that business leaders are becoming more interested in security. According to a Booz Allen Hamilton study re- leased in January 2002,90 percent of chief executive officers (CEOs) at companies with yearly revenues of $1 billion or more had personally reviewed disaster-planning documents in the last three months. Two-thirds of the 72 CEOs surveyed suggested that spending on security would increase in 2002." The September 11, 2001, ter- rorist attacks against the United States seem to have prompted much of the new vis- ibility for information security, but even before that a series of high-profile attacks, viruses, and worms had been drawing attention to security concerns.
The threat is grc~wing. Ninety-one percent of companies and government agen- cies that responded to a 2001 survey conducted by the Computer Security Institute (CSI) and the U.S. Federal Bureau of I[nvestigation (FBI) said they had detected se- curity breaches in the last 12 months. Sixty-four percent acknowledged security- related financial losses. Only 35 percent, or 186 respondents, were willing to quan- tify their losses, bul those alone totaled about $378 million; in 2000, by comparison, 249 respondents reported losses of about $266 million. Thirty-six percent of 2001 respondents said they had been targets of attacks intended to take down computing infrastructure components during the year. "
Who are the attackers? Some are thrill seekers with too much time on their hands, people who like the challenge of defeating defenses or getting in where they are not supposed to be. Even if they intend no damage, they are unknown elements inter-
glnformation~eek Daily, February 20, 2002, http://update.informationweek.com. 10lnformation~eek Daily, January 24, 2002, http://update.informationweek.com. ""2001 CSIIFBI Crime and Security Survey," Computer Security Issues & Trends, VII, no. 1, Spring 2001. Note that these estimates probably underrepresent the problem to a large degree. There are many reasons why firms fail to disclose or underreport losses from security incidents.

Chapter 6 Assuring Reliable and Secure ITServices 189
acting with the complexity of IT infrastructure in unpredictable ways, which can pre- cipitate accidents. Other attackers have taken a specific dislike to a company and in- tend to do it harm. Attackers of this kind are a significant problem because every de- fense has cracks and persistent attackers eventually will find one. Another sinister type of attacker attempts to steal a company's proprietary data, such as information a company is storing in confidence for others (e.g., credit card numbers). Industrial espionage and terrorism are a concern, especially for high-profile corporations.
All attackers represent serious threats. Even a thrill seeker who gains access but does no damage can harm a company's reputation if word of the breach gets out. And even apparently harmless breaches must be investigated to determine that nothing more se- rious has occurred. Many hackers who penetrate a company's defenses set up routes through which they can return, opening doors that they hope company managers will not notice. Many also share information with each other about how to break in to cer- tain companies or open doors they left behind after their own break-ins. A thrill seeker who intends no real harm may pass information to people with more malevolent aims.
Responsible managers must build defenses to secure a company's information- related assets-its data, infras ucture components, and reputation-against this es- calating threat. When it comes t securing IT infrastructure, one size does not fit all, and so defenses must be custo 1 ized to a company's situation, business, infrastruc- ture technologies, and objectives. Sound approaches to securing IT infrastructure begin with a detailed understanding of the threats.
Classification of Threats Hackers are always inventing new ways to make mayhem. There are many kinds of attacks, and there aresabtle variations on each kind. Some threats are common, only too real in actual experience, while others are hypothetical, theoretically possible but never yet observed. Despite the variety, threats can be divided (very roughly) into categories: external attacks, intrusions, and viruses and worms.
External Attacks
External attacks are actions against computing infrastructure that harm it or degrade its services without actually gaining access to it. The most common external attacks are "denial of service" (DoS) attacks, which disable infrastructure devices (usually Web servers) by flooding them with an overwhelming number of messages. Attack- ers send data packets far more rapidly than the target machine can handle them. Each packet begins what appears to be an authentic "conversation" with the victim com- . puter. The victim responds as it usually does to the beginning of a conversation, but the attacker abruptly terminates the conversation. The resources of the website are consumed by beginning a very large number of bogus conversations. Figure 6.6 compares how a normal and DoS conversation proceed between network-connected computers (also see the accompanying feature).
If attacks always came from a single location on the Internet, defeating them would be easy. Network monitoring software can automatically read the origin IP address from incoming packets, recognize that the flood is coming from a single address, and

190 Module Three Managing Networked 1,~frastructure and Operations
FIGURE 6.6 Normal and DoS Handshakes
Source: Robert D. Austin, "The iPremier Company, (A), (B), and (C): Denial of Service Attack," Harvard Business School Teaching Note 602-033.
Normal Handshake
SYN: User's PC says "hello" . ACK-SYN: Server says "Do you want to t a lk Website
Server
- ACK: User's PC says "Yes, let's talk" ___C
. - - - - - - - - - - - - - - - - - - - - - - - - - - . . - - - - - - - - - - - - - - - - - - - - - - - - . . - - - - DoS Handshake
SYN: User's PC savs "hello" re~eatedlv
Web User's Webcite
Server says "Do you want to talk" repeatedly
C-
No Response: User's PC waits for server to "timeout"
FIGURE 6.7 A Distributed Denial of Service Attack
Source: Roben D. Austin, "The iprernier Company, (A), (B), and (C): Denial of Service Attack." Harvard Business School Teaching Note 602-033.
I Attack Leader facilitates SYN floods from multiple sources
filter out flood traffic before it reaches its target. Attackers counter this defcnse, how- ever, by sending packets that originate from multiple locations on the Internet or ap- pear to originate from multiple locatic~ns (see Figure 6.7). Distributed denial of ser- vice (DDoS) attacks are carried out by automated routines secretly deposited on Internet-connected computers whose owners have not secured them against intrusion (a large percentage of DSL and cable modem-connected PCs fall into this unsecured category). Once implanted on the computers of unsuspecting users, these routines

A normal "conversation" between a Web user's example, sending a,page image to the Web user's .. ,* computer and a website begins with a Rhree-part computer from the website).
.% exchange of greetings common!~.~e~G~ed to as a In a common fo$mjof DoS attack called a SYN
.h7:b>2i$a:>;:'three-way handshake." The Webfusers computer flood, the attacker;sepdsd swarms of SYN packets r , t S + k 6 -"p+ae~~;,q: ;a;b' i:e,"i~$b:'~:q 9 % e says "Hello" (actually " S y n c h ~ o n i z e ~ ~ o ~ , ~ ~ ~ ~ " ) ..,s3ib r a to (that say, in* e f f e ~ g ~ ~ ~ - 8 ~ e ~ l o " to the website). The
-:" the website. The website replies,bI$ y@ou want to website responds W~~KSYN:ACKS ("Do you want to start talking?" ("Synchronize ~cknowledged" or start talking?"), but the attacker never completes "SYN-ACK") back to the Web user's machine. Fi- the handshake by sending the final ACK. The con- nally, the Web user's computer responds, "Yes, let's tacted site will devote a certain amount of i t s re- start talking" ("Acknowledged" or "ACK"). At this sources to waiting for the final ACK before giving point, the two ordinarily consider communications up on it. This use of resources, multiplied thousands to be established and move to the next step of in- of times in a few seconds, is what the attacker is teraction, whjch is usually more content-based (for counting on to paralyze the website.
FIGURE 6.8 "Spoofing"
Source: Robert D. Austin, "The iPremier Company, (A), (B), and (C): Denial of Service Attack." Harvard Business School Teaching Note 602-033.
Address: 12345
12345 54321 Target server correctly interprets sender address
launch packets at targeted websites for a predefined duration or during a predeter- mined interval. Because the flood comes ffom many different addresses, network- monitoring software cannot easily recognize the flood as an attack. Clever attackers can simulate a distributed attack by inserting false origin information into packets to mislead filtering software at a target site (providing packets with false origin addresses is called "spoofing;" see Figure 6.8).
191

Have you ever stopped for fast food while driving were standing in line, interacting with the cashier on a major highway only to discover that a full tour at the front of the line, and then decid ng not to bus has just unloaded i t s passengers at the restau- buy anything. Customers who really intend to buy rant?The restaurant is overwhelmed by the sudden food are stuck at the back of the line. The restau- burst of business. A Do5 attack is like this, only rant wastes resources on fake customer?; who are worse. In a DoS attack, i t i s as if tour bus customers indistinguishable from real c~stomers.'~
Unfortunately, DoS attacks are extremely easy to execute. Attack routines are available for downloading from sources on the Internet. Using the routines is almost as easy as sending e-mail. Attackers need not be programming experts; many, in fact, are "script kiddies," relatively unsophisticated computer users who run routines that others have written. Although DDoS and spoofing attacks are more difficult, they require no great technical skill. Computer users who do not secure their computers against mischievous use provide unintended assistance to attackers.
DoS attacks are very difficult to defend against. Most defensive methods rely on monitoring that can detect recognizable attack patterns, but it is relatively simple for at- tackers to vary their patterns of attack. Patterns of attack can be very similar to legiti- mate e-commerce traffic. A slow-motion DoS attack-recently observed attacks of this kind have been called "degradation of service" attacks-looks almost exactly like real e-commerce traffic. Although these attacks do not cause outages, they do affect infra- structure performanc:e, waste company resources, and reduce customer satisfilction (see the accompanying feature).
Intrusion
Unlike external attackers, intruders actually gain access to a company's internal IT infrastructure by a variety of methods. Some methods involve obtaining user names and passwords. Most people's user names and passwords are not hard to guess; user names usually are constructed by using a consistent convention (e.g., John Smith's user name might be jsmith). An informal scan of student passwords at a ma'or-I5 universit revealed that more than half' had something to do with sex, d r u g s , e k
1 l 4 'n' roll. Many people use birthdays or children's names for passwords; many more use the same password for numerous applications, which means an intruder can gain access to many systems with the-same password. Few people change passwords fre- quently, and it is not uncommon to find passwords taped to computer monitors or sent out in the trash to dumpsters behi.nd high-tech buildings. The term social engi-
12we first heard this analogy from Dr. Larry Liebrock of the University of Texas at Austin. 1 3 ~ r . Larry Leibrock is the source of this amusing fact.

Chapter 6 Assuring Reliable and Secure IT Services 193
neering describes low-tech but highly effective hacker techniques for getting people to freely divulge privileged information. Many people will reveal a password to an official-sounding telephone caller who pretends to be a company network engineer.
There are also high-tech ways to get inside a company's defenses. Hackers who gain physical access to a network can acquire passwords by eavesdropping on network con- versations by using "sniffer" software; because network traffic often traverses many local area networks (LANs), a sniffer need not be attached to the LAN where traffic originates to get a password. Or intruders can exploit vulnerabilities left in software when it was developed to gain access to systems without first obtaining passwords. In some cases, software development mistakes allow hackers to trick a company's com- buter into executing their own code or to cause a failure that leaves them in control of the computer. Such vulnerabilities in software are common. New vulnerabilities in widely deployed software systems are discovered daily, sometimes by good guys, who notify vendors so that they can fix the problem, and sometimes by bad guys, who take advantage of the opening. Computers are "port scanned-probed for vulnerability to intrusion-within a few minutes of connecting to the Internet. Hackers use automated routines that systematically scan IP addresses and then report back to their masters which addresses contain exploitable vulnerabilities.
Once inside, intruders have the same rights of access and control over systems and resources as legitimate users. Thus empowered, they can steal information, erase or alter data, or deface websites (internal and external). Or they can use a location inside a company to'pose as a representative of the company. Such an imposter
. could, for example, send a message canceling an important mgeting or send scan- dalous information (e.g., racist or pornographic) that appeared to originate from of- ficial sources inside the company. Intruders also can leave behind routines that use the company's computers as a base for attacks against other companies. Or they can deposit time bombs, seemingly innocuous bits of code scheduled to explode unex- pectedly into catastrophic action at a future date.
One of the most difficult problems arising from intrusion is figuring out what exactly intruders might have done while they were inside company defenses. It can take compa- nies a long time to discover trespassing on their systems or networks. Hackers generally try to cover their tracks. They may qake subtle changes in a system, opening obscure doors, adding a small file to a disk drive, or slightly altering some data. Finding out what intruders have done, or whether they have done anythmg, can be very costly for victim companies, yet it must be done. A company that does not know exactly how its systems have been compromised may have difficulty deciding what to tell customers, business partners, and others about the security of data entrusted to the company. There is a very high public relations penalty for not knowing something consequential about your in- frastructure that you should have known or, perhaps worse, for issuing assurances about the security of your systems that turn out to be spectacularly inaccurate.
Viruses and Worms Viruses and worms are malicious software programs that replicate, spreading them- selves to other computers. The damage they do may be minor, such as defacing a website, or severe, such as erasing the contents of a computer's disk drive. Although

194 Module Three Managing Networked Infrastructure and Operarions
On Friday the 13th in July 2001, computer system administrators around the world began to notice that their websites had been defaced with a mes- sage: "Welcome to http://www.worm.com! Hacked by Chinese!" Subsequent investigation revealed that this message was the work of a worm named Code Red. It was not immediately obvious what other damage the worm might do.
Over the next several days investigators learned that the worm infected only Microsoft's popular Internet Information Server (11s) through a point of weakness accidentally left in the software. The worm spread by st?lecting 100 random IP addresses, scanning the computers associated with them for vulnerability, and then migrating to vulnerable machines. In this way, it
spread to 15,000computers by July 18 and an es- timated 350,000 by July 31. Ironically, systems were vulnerable only if their administrattnrs had failed to administer a "patch" that Microsoft had made available on June 18.
Close study of Code Red revealed that it was programmed to launch a DoS attack on .luly 20 from every machine i t had infected against the U.S. White House webgte. The White House changed i t s IP address i n time to dodge the at- tack. The worm became dormant again on the 28th. A second version of the worm, Code Red II, appeared in August but lacked the DoS attack feature. Instead, i t installed "back doors" in sys- tems i t infected-openings that intruders could return to later.
people disagree about the exact definitions of viruses and worms, they often are dis- tinguished by their degree of automation and ability to replicate across networks. Simply put, viruses require assistance (often inadvertent) from users to replicate and propagate (e.g., opening a file attached to an e-mail message or even opening a Web page), whereas worms replicate and move across networks automatically.
What is perhaps most alarming about viruses and worms is that they increasingly incorporate and automate other kinds of attacks. The Code Red Worm, for example, which caused widespread consternation in July 2001 (see the a c c ~ m ~ a l ~ ~ i h ~ fea- ture), moved across networks, automatically invaded systems with certain vulnera- bilities, deposited a program to launch a DoS attack against another computer, and replicated itself across the Internet at an exponential rate. Although Code Red did little damage to infected systems (it defaced their websites), it is significant for the possibilities it suggests. Human hackers can attack companies at huqan speeds only, but self-propagating, automated attackers can potentially wreak havoc much faster and against arbitrary targets.
Defensive Meas'ures Defense against hackers is difficult. The threats are varied, sophisticated and ever- evolving, and security is a matter of degree rather than absolutes. There is no mas- ter list against which a company can compare its defenses and, after checking off everything, declare its infrastructure secure. There are defensive measures that are effective in combination, elements of fortification that companies can erect around

Chapter 6 Assuring Reliable and Secure ITServices 195
vital networks, computers, and systems. Like the fortifications of ancient castles, they must be able to repel hostile forces while admitting friendly parties. Elements of information security,often-marshaled for this task include security policies, fire- walls, authentication/encrypt&, patching and change management, and intrusion detection and network-monitoTing.
Security Policies
To defend computing resources against inappropriate use, a company must first specify what is meant byf'inappropriate." Good security policies specify not only what people should avoid doing because it is dangerous but also what people should do to be safe. A good policy also explains company decisions not to offer certain services or features because the security risks more than outweigh the benefits.
Security policies address questions such as the following:
What kinds of passwords are users allowed to create for use on company systems, and how often should they change passwords?
Who is allowed to have accounts on company systems?
What security features must be activated on a computer before it can connect to a company network?
What services are allowed to operate inside a company's network?
What are users allowed to download?
How is the security policy enforced?
Because a security policy cannot anticipate everything users might want or all sit- uations that might arise, it is a living document. It must be accessible to the people who are expected to comply with it and not be written in overly technical language. And it must be reasonable from the standpoint of a user; a policy people perceive as unreasonable usually is ignored or subverted.
Firewalls A firewall is a collection of hardware and software designed to prevent unauthorized access to a company's internal computer resources. Computer users outside a com- pany's physical premises 'often have a legitimate need to access the company's com- puters. An employee who is traveling, for example, may need to access a system he or she often uses at work. A grimary.function of a firewall, then, is to facilitate le- gitimate interactions between computers inside and outside the company while pre- venting illegitimate interactions. 0
Firewalls usually are located at points of maximum leverage within a network, typically at the point of connection between a company's internal network and the external public network. Some work by filtering packets coming from outside the company before passing them along to computers inside the company's production facilities. They discard packets that do not comply with security policies, exhibit at- tack patterns, or appear harmful for other reasons. Others use a sentry computer that

196 Module Three Managing Nemorked Infrastructure and Operarions
relays information between internal andexternal computers without allowing exter- nal packets direct entry.
Firewalls are also useful in other ways. They enforce aspects of a security policy by not allowing certain kinds of communication to traverse the internal network. They have a limited ability to filter out viruses as they enter company networks. Because they are located at the boundary of company systems, firewalls are excellent points at which to collect data about the traffic moving between inside and outside networks. They sometimes are used between segments of an internal network to divide it into re- gions so that an intruder who penetrates one part will not be able to access the rest. Firewalls also conceal internal network configurations from external prying and thus serve as a sort of electronic camouflage that makes breaking in harder.
Firewalls do not provide perfect protection. Every design has weaknesses, some of which are not known at any point in time. They provide no defense against mali- cious insiders or against activity that does not traverse the firewall (such as traffic that enters a network via an unauthorized dial-up modem behind the firewall). It is best to think of a firewall as part of an overall strategy of defense. Although it re- duces risks, it does not eliminate them.14
Authentication Authentication describes the variety of techniques and software used to control who accesses elements of computing infrastructure. Authentication can occur at many points. Host authen~tication controls access to specific computers (hosts); network authentication controls access to regions of a network. Host authentication and net- work authenticatior~ almost always are used in combination. When used with so- phisticated and well-managed directory technologies, which keep track of user iden- tities and access rights, access control can be very granular, allowing many layers of access control throughout the infrastructure.
Strong authentication takes as given that passwords expire regularly and that forms of passwords are restricted to make them harder to guess. For example, a com- pany might require that passwords be changed weekly and be composed of a com- bination of at least eight alphanumeric characters. What minimally c,onstitutes strong authentication is a matter of debate, but simple user name and password au- thentication does not meet the test for many security experts. A common definition holds that strong authentication requires user namelpassword authentication plus one other factor, such as certificate authentication (see the accompanying feature) or biometric verification of identity (e.g., iris scanning).
Encryption ~ n c r ~ ~ t i o n renders 1he contents of electronic transmissions unreadable by anyone who might intercept thern. Modern encryption technologies are very good and provide a high degree of protection against the vast majority of potential attackers. Legitimate
14~lizabeth D. Zwicky, Simon Cooper, and D. Brent Chapman, Building Internet . Firewalls, 2nd ed. (Sebastapol, CA: O'Reilly, 2000), is an excellent reference on firewalls
and their capabilities.

Digital certificates are analogous t o the official physical doc~~ments people use to establish their identity in :!,ice-t~-f@~e, businejsq,intera@?ns. When someoiie writes4a check at a retail stor'e, the store may ask for proof of identity. To provide proof, people often offer a driver's license.,~usi- nesses trust addriver's Iieense bedhse thep$trust the issuing authority (the state agency that regu- lates motor vehicle use) t o verify identity by using a rigorous procedure a?$ because driver's li5enses are difficult tb-forge. K'digital cehificate ismuch
like the driver's license, a signed document that a I
trusted third-party &organization stands ,behind . ;:&at provi* evide$ of identity. Digit$!certifi- .a ,
cates are in fact much harder t o forge than phys- ical documents, although it is possible t o trick peo"pl6 into issuing real certificates in error. Also, :a* r *,d~gital ckdificates *are "beiirer instruments," ; rather like driver's licenses with no photo on them; it is possible that the person presenting a certificate js not the person the certificate repre-
* *i "e'sents her%? him to be. iQ
I ",
recipients can decrypt transmission contents by using a piece of data called a "key" (see the accompanying feature). The recipient typically possesses the key for decryp- tion as a result of a previous interaction. Like passwords, keys must be kept secret and protected from social engineering, physical theft, insecure transmission, and a variety of other techniques hostile forces use to obtain them. Encryption does little good if the key that decrypts is available to attackers. Nevertheless, modern encryption techniques provide excellent concealment of the contents of messages if the key is secret regard- less of what else hackers might know about the encryption algorithm itself. By setting up encryption at both ends of a connection across public networks, a company can in
'
effect extend its secure private network (such network extensions are called virtual pri- vate networks; see the accompanying feature).
Encryption does not conceal everything about a network transmission. Hackers still can gain useful information from the pattern of transmission, the lengths of messages, or their origin or destination addresses. Encryption does not prevent at- tackers from intercepting and changing the data in a transmission. The attackers may not know what they afe changing, but subtle changes can still wreak havoc, espe- cially if the intended recipient is a computer that expects data to arrive in a particu- lar format.
Patching and Change Management -
A surprising number of attacks exploit weaknesses in systems for which "patches" already exist at the time of the attack. Successful attacks of this kind sometimes represent administrative failures, but there are also a large number of contributing factors, such as shortage of IT staff to apply fixes to existing systems, or legiti- mate concerns about the unintended negative consequences of a system patch. I
15~alal Feghi, Jalil Feghi, and Peter Williams, Digital Certificates: Applied Internet I
Security, (Reading, MA: Addison-Wesley, 1999), is an excellent reference on the subject , of encryption and digital certificates.

198 Module Three Managing Networked Infrastructure and Operations
Public-private key encryption uses a mathemati- cal algorithm with an interesting characteristic: If one unique key is used to transform a plain text message into encrypted form, a different unique key must be used to decrypt the message back into plain text at its destination. Typically, one key is made public and the other is kept private. A message can be sent confidentially if i t is en-
crypted using the public key; then only a person possessing the private key can decrypt the mes- sage. A message can be "signed" by usirig the same process in reverse; if the public key can suc- cessfully decrypt the message, only the person in possession of the private key could have en- crypted it; hence, it must have come from the person known to possess the private key.
Keeping track of the variety of systetr~s in a company's infrastructure, their secu- rity weaknesses, the available patches, and whether patches have been applied is nontrivial. Consequently, attacks against known and presumably patched weak- nesses often are successful.
Knowing exactly what software is running and whether it is patched is important for another reason: After an attack this knowledge is essential to discerning whether attackers have changed anything within a company's infrastructure. Detecting a change in a file size or finding a file that "should not be there" would be an obvious sign of intruder activity. Best practice calls for keeping detailed records of all files that are supposed tct be on production computers, including file sizes or even file "fingerprints."16 Sadly, many companies fall short of this practice, sometimes for what seem to managers like good business reasons. For example, managers hurry- ing to fix a customer-impacting problem may be tempted to shortcut formal change management procedures. The result is a gap in formal knowledge about what files and programs ought to be present on company systems.
Intrusion Detection and Network Monitoring Intrusion detection and network monitoring work together to help network adminis- trators recognize when their infrastructure is or has been under attack. Network monitoring automatically filters out external attack traffic at the boundary of com- pany networks. Sophisticated intrusion detection systems include combinations of hardware probes arid software diagnostic systems. They log activity throughout company networks and highlight patterns of suspicious activity for further investi- gation. Along with formal change management, which provides a baseline descrip- tion of company system configurations, the information logged by intrusion detec- tion systems can help companies reconstruct exactly what an intruder did its quickly as possible.
16~here are technologies available to capture images of disk drives that act as a sort of fingerprinting.

\
Chapter 6 Assuring Reliable and Secure ITSewices 199
Virtual private networks (VPNs) use encryption to create a connection across public networks that extend a company's private network. Traffic be- tween two points-for example, a remote user 'and a computer inside a company's network-is encrypted at one end of the transmission, encap- sulated inside new packets, and sent on to a des- tination where the packets are unencapsulated
and decrypted. VPNs allow a secure private net- work to be extended securely across a public net- work to arbitrary points. There is'a dark side to this, however. If an attacker can gain access to a remote VPN node, a company's network can be attacked as if from the inside. Thus, although VPNs extend security usefully, they also add to the complexity of the security management task.
A Security Management Framework Securing a company's infrastructure involves design decisions, operating policy and procedure development, and steely execution. Information security is an evolving ,field with an evolving state of the art. Nevertheless, the following principles of se- curity management remain relevant.
Make Deliberate Security Decisions This may seem obvious, but too many companies rely on a combination of blissfil ig- norance and security through obscurity. These are not reasonable approaches for com- panies seeking to connect to and leverage the public Internet. Ignorance is neither a strategy nor an excuse. General managers must educate themselves on security-related subjects and take responsibility for decisions in this area.
Consider Security a Moving Target
The forces of digital darkness are constantly searching for new ways to attack. Com- panies must maintain a solid defense, attack their own systems (do a safety check), and hire outside firms to audit their defenses for vulnerability to new threats on a regular basis. Indeed, companies must stay plugged in to sources of information about threats, such as the Computer Emergency Response Team (CERT) (www.cert.org). Information security is not something a company can do once and then forget about.
Practice Disciplined Change Management The fix that needs to be rushed into production may be important, but if shortcutting formal procedures makes reconstructing the facts of a subsequent attack impossible, the costs of informality ultimately may be far greater. Companies need to know what they have running at all times and need adisciplined process for migrating infiastruc- ture changes through testing and into production use. Not following such procedures represents reckless behavior for which general managers are ultimately responsible.

200 Module Three Managing Networked Infrastructure and Operations
Conversely, failure to promptly install available patches to counter known threats also risks unnecessary incidents. Best practice requires the prompt installation of patches while remaining within change management procedures.
Educate Users Make sure users understand the dangers inherent in certain activities, such as shar- ing passwords and connecting behind-the-firewall dial-up modems to their desktop computers. Help them understand the reasons for security measures that may in- convenience them in some situations. Enlist them as allies in maintaining security.
Deploy Multilevel Technical Measures, as Many as You Can Afford
Use security at the host and network levels. Acquire defensive technologies as they develop. No company can afford an infinite amount of security, but mana,gers need to be sure they have thought through the consequences of a breach of security. Man- agers must prioritize security measures appropriately.
Risk Management of Availability and Security Companies cannot afford to address every threat to the availability and security of IT infrastructure with equal aggressiveness. Even if they could, doing so would not make business sense. Instead, risks must be characterized and addressed in propor- tion to their likelihood and potential consequences. Management actions to mitigate risks must be prioritized with an eye to, their costs and potential benefits. The prom- ise of new capabilities adds another wrinkle to availability and security management challenges. New capabilities usually entail new risks, and so decisions about what capabilities should be supported and when they should be introduced are also mat- ters of risk management.
Figure 6.9 suggests a way of thinking about potential failures in terms of their probabilities and consequences. Incidents in the upper right corner are both likely and costly; mitigating these risks is obviously important. Risks in the other quad- rants must be prioritized. One method of prioritizing involves computi~lg the ex- pected loss associated with incidents in these quadrants by multiplying 1 he proba- bility of an incident and its cost if it occurs. Incidents with higher expected losses get higher priorities. Needless to say, incidents in the upper left and lower right quad- rants receive higher priorities than do the low-probability, low-cost incidcnts in the lower left quadrant.
For most compa,nies, however, the logic of risk management is more compli- cated. Managers' attitudes toward risk may be too complex to be summarized by simple probabilities and costs. For example, managers may dread high-cost inci- dents so much thal they prefer to address high-cost incidents first even if those incidents are very unlikely to occur and their associated expected loss iprobabil- ity X cost) is small. Or managers may fear specific events for reasons that go be- yond cost. A further complication arises from the difficulty of estimating costs and probabilities in some situations. As we have suggested, the intangible costs of some incidents are exceedingly difficult to predict, and estimating probabili- ties often is no easier.

Chapter 6 Assuring Reliable and Secure IT Services 201
FIGURE 6.9 Managing Infrastructure Risks: Consequences and Probabilities
In addition, not all risks can be countered with well-defined management actions. Most companies choose between courses of action that vary in cost and address risks to varying degrees. Sometimes none of the possible actions address some serious risks. Sometimes addressing a serious risk is prohibitively expensive. Thus, after as- signing priorities to risks, most companies perform an additional assessment step to decide which actions to take. This step takes into account not only the expected losses from incidents but also the costs of actions to reduce or eliminate risks.
New capabilities that come with new technologies generate another wrinkle in risk management thinking. Although new capabilities provide, benefits, they often require taking on new risks to availability or security. Thus, managers also engage in risk man- agement as they decide which new services to offer. A new service to support the busi-
' ness-for example, a collaborative videoconferencing technology-increases the com- plexity of infrastructure, which generates challenges for both availability and security.

202 Module Three Managing Networked infrastructure and Operations
There is almost a1w;iys a trade-off between performance or richness of features of a technology and infrastructure robustness. For example, running software withL high lev- els of "logging" so that the details of activity are meticulously recorded will help a com- pany detect intrusiolis more quickly. But logging degrades system performance, per- haps to a point where users complain or additional hardware must be purchased.
Consider the infrastructure configuration example introduced earlier: an e- commerce company that purchased some redundant components but left single points of failure in its infrastructure (Figure 6.5). Should this company buy another $65,000 switch? We could estimate the relevant costs and probabilities, and we could compute the expected loss from the failure of the current single switch. A sec- ond switch dramatically reduces the probability of a loss of switching, which in turn reduces the expected cost due to a loss of switching. If the improvement in expected loss from buying the second switch exceeds the $65,000 that the extra switch would cost, the company ought to buy it-in theory. In reality, however, other factors may intervene. The company may not have an extra $65,000, managers may not believe the cost and probability estimates, or there may be more urgent places to ripend that $65,000. Whatever managers decide, deliberately thinking through the logic of risk management improves a company's chances of realizing business objectives.
Incident Management and Disaster qecovery No matter how available and secure they make a company's infrastructure, man- agers can expect incidents. Infrastructure incidents present a rare business chal- lenge: a need to solve problems under the pressure of a ticking clock. Though they are rare, the stakes are often high when real-time incidents occur. Managers' ac- tions in a crisis car1 make a huge difference to the well-being of a company. We consider incident management in terms of actions that need to be taken before, during, and after an incident.
Managing Incidents before They Occur The range of options available to managers in the middle of a crisis is largely deter- mined by decisions made before the crisis. Precrisis practices that make incidents more manageable iliclude the following:
Sound infrastructure design. If infrastructure has been designed with an eye to recoverability and tolerance for failures, the losses associated with an incident are more likely to be contained.
Disciplined execution of operating procedures. Change management proce- dures make the diagnosis of problems more effective byhmaintaining a baseline of knowledge about infrastructure configurations. Data backup procedures preserve data in case the data are lost. Scheduled infrastructure health audits uncover lurking problems or vulnerabilities. ,
Careful documr:ntation. If procedures and configurations are carefully docu- mented, crisis managers need not guess about crucial details. Reliable docu- mentation saves time and increases certainty in dealing with a crisis.

Chapter 6 Assuring Reliable and Secure ITSewices 203
Established crisis management procedures. Procedures for managing incidents guide the diagnosis of problems, help managers avoid decision-making traps, and specify who should be involved in problem-solving activities. Managing in a crisis is difficult enough without having to make up every response as you go. Crisis management always involves creativity, but familiar and useful procedures serve as bases from which managers can innovate under fire effectively.
Rehearsing incident response. Rehearsing responses to incidents makes decision makers more confident and effective during real crises. Even if the way an incident unfolds is different from the way it was practiced, practice makes the situation more familiar and better prepares managers to improvise solutions.
These preparations may seem basic, but a large number of companies do not make them. There is a tendency for other urgent business concerns, such as growing
a
revenues, profits, product functionality, and the customer base, to take priority over hypothetical problems nobody wants to think about. In most companies, staff mem- bers who execute responses to incidents have no training in that area and are not nec- essarily trained in the nature of threats. Nevertheless, managers clearly bear respon- sibility when they do not foresee exposure to availability and security incidents. Good infrastructure managers find the time to plan for high-cost events.
Managing during an lncident When faced with a real-time crisis, human decision makers have numerous psycho- logical obstacles to surmount in addition to the usually very serious technical diffi- culties inherent in the crisis. These obstacles include the following:
Emotional responses, including confusion, denial, fear, and panic
Wishful thinking and groupthink
Political maneuvering, diving for cover, and ducking responsibility
Leaping to conclusions and blindness to evidence that contradicts current beliefs
Awareness of psychological traps helps decision makers avoid them when situa- tions turn dire.
Another difficulty managers face in crises is "public relations inhibition." Some- times managers are reluctant to admit the seriousness of a problem because they do not want to take actions that communicate to others (customers, the public) that a serious incident has occurred. For example, the managers of an e-commerce company might not want to shut down their online retail site to confound a hacker until they have de- finitive proof of an intrusion. A shutdown would have to be explained to the press and might alarm customers. Obviously, the stakes of such a decision are very high.
Managing after an lncident After an incident, infrastructure managers often need to rebuild parts of the infra- structure. Sometimes erasing and rebuilding everything from scratch is the only way to be sure the infrastructure is restored to its preincident state. If configurations and

204 Module Three Managing Networked l.tfrustructure and Operntions
procedures have been carefully documented in advance, recovery can happen swiftly. But if records of how systems should be put together are not exact, rebuild- ing can run into hiccups: problems that must be solved under the time pressure of getting the business back online. Rebuilding processes may have to be reinvented "on the fly." Furthermore, if there have been change management lapses-for ex- ample, if changes made to systems have not been documented-a rebuild can result in lost functionality (a problem solved earlier by an informal change in production may reappear).
To avoid future incidents of the same type, managers need to understand what happened. Figuring out exactly what caused an incident is sometimes difficult, but it must be done regardless of the cost. Typically, a company owes business partners information about the nature of a failure so that those partners can determine the consequences that might flow to them as a result. There is no one best way to explain or disclose an incident to partners, customers, or the press and public. In formulat- ing actions after an ~ncident, however, ~t is essential to communicate the seriousness with which a company protects the information entrusted to it. A possible intrusion need not be a public relations disaster if subsequent steps to secure infrastructure are framed as "taking no chances."
Summary The rate of adoption of Internetworking technologies has outrun efforts to establish effective frameworks and policies for managing them. In no area is this truer than availability and security. The challenges of keeping real-time infrastructures always operational are formidable and evolving. Nevertheless, in this chapter we have out- lined management ilctions and frameworks that will, if applied with discipline and effort, improve the chances of success. The economic consequences of ignoring or failing to take effective action in these areas may be dire indeed (see the accompa- nying feature).
We have demonstrated how the arithmetic of availability calls for increasing so- phistication in infrastructure design artd how redundancy, the primary means of in- creasing robustness, also adds operational complexity and management challenges. We have outlined a series of new and serious malicious threats to IT infrastructure and proposed frameworks for reducing the threats and for managing incidents when they occur. Executives can use the following questions to access their own pre- paredness for these 2 1 st-century challenges:,
1. How available do the systems in our application portfolio need to be? Are our in- frastructure investments in availability aligned with requirements?
2. Are we taking security threats seriously enough? How secure is our current in- frastructure? How do we assess information security on an ongoing basis? Have IT staff members received adequate training? How do we compare with infor- mation security best-in-class organizations?
3. Do we have a solid security policy in place? Were business managers .as well as IT managers involved in creating il:? Do users know about it and understand it? Do they accept it? How is the policy enforced?

There are over two billion lnternet enabled de- vices in the United States now in 2009, each with its own lnternet protocol, or IP, address. World- wide the number of devices is six billion. . . . El- evators, appliances, cars, trucks, manufacturing machinery, photocopiers and traffic lights all have IP addresses. All are connected in some way to the single global network of networks loosely known as the Internet. . . .
In the private sector, IT security and reliabil- ity spending accounts for almost one in every three dollars spent on information systems. De- spite that expenditure, there are chronic secu- rity problems and system outages.
The routing tables for the six billion IP ad- dresses are immense and unmanageable. Pack- ets of messages routinely are lost in transmis- sion, especially messages sent to large numbers of addressees. The result is that messages are frequently retransmitted, slowing already over- burdened routers.
In addition to slowdowns and failures caused by the size of the system, malicious activity fre- quently confuses or corrupts the servers and routers that maintain IP addresses and pathway information, resulting in parts of the lnternet (and on seven occasions by 2009, all of it) not working for days. During those "Down Days," clean copies of the address tables were distrib- uted around the country on special military flights that were allowed to fly using visual flight rules (since the new air traffic system shuts down when the lnternet does). . . .
Most of the attention to malicious activity in 2009 is.. .focused on Affinity Worms.. . [which en- ter] an lnternet enabled device using a vulnerabil- ity in an operating system and then branch out in a "chain letter" fashion. . . . A major brokerage house was attacked in 2004 by an Affinity Worm that entered the wireless connection of the CEO's home security alarm system (from a laptop in a car two blocks away) and then wormed its way to the CEO's home PC and then through the Virtual Pri- vate Network to the brokerage house's trading records, which it hopelessly scrambled. The Market closed for three days that time. . . the power grid collapses of 2005 were the result of an Affinity
Worm that infected devices throughout the power grid (probably through wireless connections) and then had the devices simultaneously launch mes- sage traffic every second to flood the key routers supporting the grid. This technique was originally called a Distributed Denial of Service attack when it first surfaced in February, 2000. In the 2005 at- tack, the network operators had a choice of block- ing traffic from their own devices (thereby collaps- ing the grid) or letting the flood of messages, or tsunami as it is now known, crash the routers. They chose the latter, which collapsed the grid.
After the success of that attack, a similar technique collapsed the key routers in the Tier 1 backbone providers in 2006 during the interna- tional crisis. No one could ever prove the attack was connected to the crisis because the IP ad- dresses of the attackers were spoofed and anonymous accounts were used. Whoever did the attack, i t did halt the rail and air traffic sys- tems, causing the US military buildup to slow. A diplomatic solution was quickly found, although not one favorable to US interests.
How much had all of this cost the US? The Fed- eral Reserve Bank published an econometric analy- sis toward the end of 2009 that attempted to esti- mate the effects on GDP growth overthe last seven years caused by the cyber attacks on the markets, the power grids, and the telecommunications sys- tems. The report concluded that in the absence of those attacks and their cascading effects on the economy, growth colild have averaged between 2.1 % and 2.8%, instead of the seven-year average of 0.3%.. Two days later the Fedwire was hit with a Data Base Scrambler attack that corrupted data on the Fed's main transaction data base and its two geographically separated backups. The resulting Bank Holiday caused the seven-year average to be readjusted to 0.28% growth in GDP.'~
"~xcerpt from Richard Clarke's "Straight Line Scenario: 2009." Presented by Howard A. Schmidt, vice chair, President's Critical Infrastructure Protec- tion Board at the 2002 Internet2 Conference on May 8, 2002, in Arlington, VA. Reprinted by permission.

206 Module Three Managing Networked Irfrastructzire and Operations
4. Do we have plans for responding to infrastructure incidents? Do we practice them on a regular basis? Are staff members trained in incident response? What are our plans and policies for communicating information about incidents to external parties such as customers, partners, the press, and the public?
5. Do we practice risk management in availability and security decisions? 1s our ap- proach to dealing with hypothetical problems deliberate, structured, and well rea- soned? Have the company's general managers embraced responsibility for avail- ability and security?

Chapter 7 Managing Diverse IT
Before the emergence of the commercial Internet in the 1990s,~ companies accom- plished much that they now achieve through public Internetworks entirely on their own by using proprietary technologies installed and managed inside each firm. For several reasons, this approach was expensive and unsatisfactory:
To reach business partners and customers, every company had to develop its own communication infrastructure, a process that led to massive duplication in infra- structure investment. Often the multiplicity of technologies confused and con- founded the partners and customers businesses wanted to reach.
The technologies did not interoperate well. Many companies maintained complex software programs that had no purpose except to serve as a bridge between oth- erwise incompatible systems.
Reliance on proprietary technologies meant that companies were locked in to specific vendor technologies. Once locked in, firms had little bargaining power and were at the mercy of the margin-maximizing inclinations of their technology providers.
Companies that installed hardware and software from many vendors suffered per- formance and reliability difficulties. IT managers, seemingly trapped in a losing game, were perennially blamed by business managers for delivering expensive sys- tems that performed poorly or, worse, never worked at all.
h his chapter is adapted from materials in Professor.Robert D. Austin's Managing Infor- mation Technology Infrastructure course module, Harvard Business School Publishing NO. 601-181. h he lnternet itself arose much earlier, of course, but the commercial lnternet really took off only with the introduction of Web browsers in the early 1990s. Some companies were using the lnternet productively in the 1980s, but not very many.

208 Module Three Managing Networked Ynfrastructure and Operations
The emergence of an accessible public Internet based on open standards has changed the way coinpanies build IT capabilities. Corporate systems now gain lever- age from their connections to public infrastructure. The new approaches campare fa- vorably with and in many cases enhance previous approaches in numerous ways. To- day, for example,
Companies can share a communication infrastructure common to all business partners and customers. Customers and business partners can interact via com- mon interfaces (usually Web browsers). This seamless interaction driimatically reduces complexity and confusion.
Because of the open Transmission Control ProtocolIInternet Protocol (TCPIIP) standard, communication technologies interoperate very well. Software that bridges systems is simple, standardized, and inexpensive. In some cases it can be acquired for free.
Companies are much less locked in to specific vendor technologies, a fact that creates more competition among vendors. More competition leads to lower prices and better-performing technology.
At last, companies can combine technologies from numerous vendors and expect them to interconnect seamlessly. Although the job of the information technology (IT) manager remains formidable, it is not the losing game it once was.
As we have seen, reliable and secure conriections to public networks provide new options for delivering IT services. Services historically provided by IT departments now can be acquired in real time from service providers. This is outsourcing, but of a kind different frc~m large-scale outsourcing programs (those still very important programs are discussed in Chapter 9). As communication technologies improve and become more compatible and modular, firms can obtain smaller and smilller incre- ments of service from outside vendors, with shorter lead times and contract dura- tions. Futuristic "Web services" visions take incremental service ideas to a logical extreme, depicting a world in which hnctions as narrow as, say, currency conver- sion will routinely be obtained externally for prices and from sources automatically negotiated in real time whenever a currency conversion is needed.
Although the standards and infraaructure necessary to bring this vision to real- ity are not yet available, major IT vendors such as IBM and Microsoft profess a com- mitment to it. In any case, the underlying trend toward external acquisition of in- creasingly incremental services is irresistible. Infrastructure that lends itself to incremental improvement enjoys favorable management attributes; for example, in- vestment management and implementation risks are easier when improvements involve a series of many small steps rather than a few large "all-or-nothing" steps. Incremental improvement also facilitates experimentation and learning.3
3 ~ a v i d Upton has written extensively on the benefits of incremental improvement strategies, especially the need to design operational infrastructures so that they can be incrementally improved. See, for example, Designing, Managing, and Improbping Opera- tions (Upper Saddle River, NJ: Prentice-Hall, 1998).

Chapter 7 Managing Diverse ITInfrastructures 209
Incremental service delivery also makes new business models possible, and those models act as catalysts for restructuring in service delivery industries. In general, the trend is toward providers that specialize in particular aspects of IT service delivery and collaborate with other providers to deliver services. More and more, IT services are delivered by chains of service partners, each of which must perform well to de- liver the service reliably and securely. Having many service providers means that IT managers must be especially careful in selecting and managing relationships with these business partners. Managing service provider relationships means sharing in- formation-"virtually integrating," if you will-which requires surmounting tech- nical communication challenges as well as challenges of incentive design. Service- level contracts provide a vital foundation for aligning incentives between parties collaborating in service delivery, but successful relationship management, as we will see, goes beyond mere contract administration.
When evolving service models connect to corporate systems, diverse IT infra- structure is the result. In many companies, legacy systems still perform vital functions and must be supported. In most companies, there is an accelerating trend toward heterogeneity in supported client devices. Increasingly, cell phones and personal digital assistants (PDAs), not personal computers (PCs), are the tools people use to interact with IT systems to conduct business. The variety of service delivery models and technologies creates complexity, which, as we have seen, generates management challenges. Not surprisingly, new ways of thinking are needed to manage diverse, distributed, and complex information and tech- nology assets.
New Service Models
Since the emergence of PC and client-server computing, end-user software has been designed to execute on PCs or on servers that are housed locally. Saved work--doc- uments and other forms of data-usually remains on a PC's hard drive or on storage devices connected to a nearby server or mainframe. In this scenario, when the soft- ware malfunctions, the user contacts his or her IT department, which owns and op- erates most, if not all, of the IT infrastructure.
With the advent of reliable, high-capacity networks, however, local software ex- ecution no longer is the only alternative, nor is it necessarily the best alternative. In- creasingly, software is designed to operate in geographically distant facilities that belong to specialized service providers, each of which deliver software services across the Internet to many different customers. In this scenario, data are stored in a distant location, and the end user's company owns little of the infrastructure involved in service delivery. The end user's company pays a monthly fee for a service bundle, which usually includes technical support services as well.
Even if actual software applications are not acquired externally, other incre- ments of outsourcing may make sense. A company, for example, can rent space in a vendor-owned hosting facility rather than incur the capital expenses required to build a data center even when it retains internal management of the software

210 Module Three Managing Nehvorked Infrastructure and Operations
that delivers services to users. The benefits of incremental outsourcing include the following:
Managing the shortage of skilled IT workers. According to the U.S. govern- ment, there may be as many as 4 million unfilled IT jobs in the United States by 2003. Incremental outsourcing helps individual firms overcome the shortage of skills by reducing the need for internal staff a firm must hire. This benefit is especially important to small and medium-size businesses that have difficulty attracting and retaining IT talent.
Reduced time to market. With the rise of the Web, companies can use IT to enhance revenues by rapidly creating new business models, products, and services. New revenue opportunities sometimes offer early mover advantages. Seizing these advantages depends on rapid deployment. Network-based service delivery models help companies develop new capabilities quickly. For example, existing companies can use externally hosted retailing packages to sell over the Web without the delays involved in having to purchase equipment or develop soha re .
The shift to 24 X 7 operations. As: we discussed in Chapter 6, consumers expect company websites and supporting systems to be always available. Real- time operations require that computers always be on. But in many enterprises, facilities and equipment are not designed for such high levels of availability. High availability requires large capital investments in a highly redundant infra- structure. Because specialized vendors are able to spread capital invesrments across many customers, they can achieve economies of scale that justify large investments. In hct, specialized vendors often can invest in levels of avail- ability and security that individual Firms cannot afford. In addition, by acquiring services externally, companies can skip painful start-up diff~culties. The reliability of the core services vendors offer usually is already proven; service delivery kinks have been worked out on other customer^.^ Favorable cash flow profiles. Traditionally, IT investments required large up- front cash outlay s that only yielded deferred and often uncertain (because of high IT project failure rates) benef~ts. Subscription-based IT services have a different cash flow profile. Firms pay a monthly fee to acquire services equiva- lent to those provided by internal systems in the past. With limited up-front purchases, payback flows in more quickly. This benefit is particularly important to small and medium-size companies that cannot afford the large up-fiont investments associated with some IT services. Figure 7.1 compares the cash flow profile of a traditional IT investment with that of a subscription-based service delivered through a prebuilt external infrastructure.
4~ corollary observation here is that if you are the first customer or even an early customer of a servicc? provider, you have some chance of being the company that expe- riences the start-up pain on behalf of other companies. Clearly, this is a factor that should be taken into account in deciding whether to acquire a service externally or from a certain vendor.

Chapter 7 Managing Diverse IT Infrastructures 21 1
FIGURE 7.1 Purchase versus Subscribe Cash Flows
enefi&~infrastructure"~a~read~ in place)

21 2 Module Three Managing Networked hfrastrucrure and Operations
FIGURE 7.2 An IT Sewice Chain
Cost reduction in IT service chains. Centralized service delivery can reduce support costs in many ways. With business functionality delivered from central- ized servers, upgrades to new versions of the software are done centrally, elimi- nating the need For support personnel to upgrade individual client computers. This service delivery approach also reduces the risk (and costs) of software piracy, because the software is never physically distributed. In addition, there is no inventory of physical media (e.g., CD-ROMs) for distributors and systems administrators to manage because services are distributed in real time to users. Also, vendors realize savings from economies of scale in using staff, which may be passed along to customers in the form of reduced prices.
Making applications globally accessible. When IT services are delivered over the Net, the geographic location of a computer is unimportant. Services are available at any computer with a Web browser for any user who has the authority to access the service. Traveling employees can access the same virtual workspace regardless of where they are in the world. Because the IT infrastruc- ture is geography-neutral, much of the cost of moving a worker from one '
location to another is eliminated. This advantage combines with the continuing evolution in client devices (cell phones and PDAs, for example) to create new value opportunities.
Figure 7.2 shows a service chain for over-the-Net service delivery. Independent software vendors (ISVs) develop software that operates across networks. This software operates in vendor-owned, secure 24 >: 7 availability facilities. Aggregators (distribu- tors) collect the ofixings of ISVs and hosters into coherent packages, which they sell

Chapter 7 Managing Diverse IPInfrastructures 21 3
Suppose a software program needs to convert euros into U.S. dollars. The software program is not designed to perform this conversion inter- nally and therefore must request conversion functionality from an external source. In a Web services model, the process might go something like this:
1. The software program sends out a request for the service over the lnternet to a known "registry" that lists service providers. The registry sends back information about cur- rency conversion routines that vendors have listed with the registry. Information about each routine includes details of its function- ality, the price charged by the vendor for use of the routine, and the quality of service ex- perienced by others that have used it.
2. The software program automatically evalu- ates the criteria provided by the registry and chooses a routine to use.
3. The software program contacts the provider of the chosen routine across the lnternet and
contracts with the provider for one-time use of the routine.
4. The provider sends a description across the lnternet telling the software program how to interact with the routine: the format in which the program should send its amount in euros and the format in which the program will receive the U.S. dollar amount back.
5. The software sends the request for conver- sion and the conversion data to the provider; the provider's routine responds.
6. The provider and the user of the conversion service exchange the information necessary to assure payment reconciliation.
All this happens automatically as the pro- gram runs, and all interactions are across the In- ternet. The next time this program needs cur- rency conversion, it might choose a different provider for any of a number of reasons. The price of the service might have changed, or there might be updated information in the reg- istry about the quality of service of the routine.
through resellers (retailers) that offer additional value-added services (such as tech sup- port and consulting). In addition, supporting players include network providers and out- sourcing partners that specialize in back-office businesses such as billing or help desk services, and of course communication carrier providers, such as backbone providers, telephone companies, DSL services, and wireless providers.
Figure 7.2 shows one possible version of an IT services chain. An interesting varia- tion is the Web services model that, unlike the previously described service chain, al- lows for highly dynamic provision and aggregation of services. Rather than establish- ing long-term relationships with retailers and aggregators, customer firms using Web services negotiate and acquire services in real time from a dynamic and fluid market for those services. For example, a user in need of currency conversion might obtain it from one vendor at 11:OO A.M. and from a different vendor at 1 1 : 15 A.M., perhaps be- cause the 1 1 : 15 A.M. vendor has lowered its price for the service. All the negotiating and contracting would be automatic and behind the scenes, seamless to the user, who would never know the two conversions hid bekn done by different vendors. Reliability and quality of service are automatically factored in to protect companies from services that do not work well (see the accompanying feature).

21 4 Module Three Managing Networked Infrastructure and Opertrtions
The advantage in a service chain of specialized players is that each player focuses on what he or she does well, thereby realizing economies of scale and scope. Re- sellers focus on managing relationships with end customers. Aggregators focus on combining the offerings of different software vendors so that they interoperate. Hosters focus on the reliable and secure operation of a type of system (e.g., e-mail). ISVs focus on developing software.
This is not a hypothetical model; players already conduct business in this way. For example, Microsoft (an ISV) has cooperated with Personable (a hoster) to develop an over-the-Net version of Microsoft's Office productivity suite. In the spring of 2002, Personable offered this version of Office to customers for $19.95 per month. Microsoft Great Plains Business Solutions (a hoster) provides IT services for finan- cial and service management to small and medium-size businesses also via a sub- scription model. Jamcracker (an aggregator) combines the offerings of hosters such as Employease (which offers IT services for human resources management) and Connected (which offers automated PC backup services) into coherent packages. Accenture resells Jamcracker's packages and technology.
Managing Risk through Incremental Outsourcing
As IT service chains proliferate and mature, companies often face the question of which services to outsource. Figure 7.3 outlines the steps many companies consider in making this decision. IT services that are unique to a company and provide it with significant advantages over competitors tend not to be outsourced, at lcast not to vendors that are trying to sell similal- services to all of their customers. Such ser- vices are so core tc~ a company's business that an internal capability to manage and extend them must be maintained. The exception to this rule arises when companies find themselves unable to develop a vital capability internally and must therefore rely on outsourcing to acquire the capability.
Many IT services do not provide competitive advantage. These services are es- sential in running a modern business, but there may be no reason one company's service must be different from that of its competitors. A company probably needs, for example, e-mai1,and word processing software, but the success or failure of a company usually has little to do with the features of these products. For these commodity-like services, the priorities are reliability and low cost (or a more fa- vorable cash flow profile).
The logic of incremental outsourcing decisions parallels the logic of outsourcing large segments of the IT function, which we discuss hlly in Chapter 9. But there are also differences. With incremental outsourcing, the economic stakes are not as high and the potential consequences of mismanagement are not as far-reaching. When a firm outsources ocly its travel expense reporting, for example, as opposed to its en- tire IT organization, risk is contained. Mistakes are more reversible and less painful. Also, because mistakes cost less, more experimeptation is feasible. Trying some- thing does not mean managers must suffer its effects for the duration of a long-term contract.

Chapter 7 Managing Diverse ITInfvastructures 21 5
FIGURE 7.3 Internal versus External Service Delivery
However, incremental outsourcing decisions cannot be taken lightly. A decision to outsource hosting or network management can have serious across-the-company implications if there are service problems. Furthermore, many individually correct incremental decisions can add up to a significant negative overall impact. Incre- mental decisions made in isolation must not add up to an incoherent or inconsistent business strategy.
Incremental outsourcing, however, offers new and attractive choices to managers seeking to improve IT infrastructure. In the past, managers often felt they faced two equally unpleasant choices: (1) do nothing and risk slipping behind competitors or (2) wholesale replacement of major components of computing infrastructure, which risks huge cost overruns and potential business disruptions as consequences of an implementation failure. Decisions to replace wholesale legacy networks with TCPIIP-based networks have run this second risk, as have decisions about whether to implement enterprise systems. With the TCPIIP networks installed today, how- ever; managers have intermediate options that lie between all-or-nothing choices. The importance of these options cannot be overemphasized. For perhaps the first time in the history of IT, it is possible to imagine incremental improvement paths, ways of getting from A to B and then to C and capturing significant economic ben- efits without putting the entire future of the firm at stake each time.
An Incremental 0utso.urcing Example: Hosting Outsource hosting of a company's &stems involves deciding where they should be located physically. Although on the surface this may seem like an all-or-nothing choice, a company can in fact precisely determine which management functions it turns over to a vendor when moving computers to a vendor's site. Some basic sup- port functions, such as electrical power, are necessarily ceded, but beyond those, managers can choose the size of the increment of outsourcing. By doing so, man- agers exercise control over the risks that executing the outsourcing initiative entails. In this chapter, we consider hosting as an illustration of the incremental nature of modern service delivery options even in cases when at first glance outsourcing seems to present all-or-nothing options.

21 6 Module Three Managing Networked infrastructure and Operations
The Hosting Service Provider Industry
Proponents of service provider-based infrastructures describe a world in which companies routinely obtain a majority of the IT functionality needed for day-to-day business from over-the-Net service chains. Hosting companies play a vital role in this picture. They, omm and manage the facilities that house the computers that pro- vide over-the-Net services. In some industry segments the vision already is reality. In online retailing, back-office functions (shopping cart, checkout, and credit card processing, for example) that enable Web-based consumer purchases often reside on computing platforms in hosting facilities rather than on the selling company's prem-
1 - ises or local to the consumer. J. Crew, for example, hosts its online retailing infra- structure with Digex.
The benefits of outsourcing hosting are many. An International Data Corporation (IDC) study in 2000, for example, found that companies reduce downtime by an av- erage of 87 percent when they move Web servers into vendor-owned hosting facili- ties. IDC also calculated that the return on investment (ROI) from outsourcing host- ing can reach 300 percent, with a payback time on the investment of only 120 days.5 Morgan Stanley Dean Witter estimates that outsourcing hosting and data center management can reduce costs by as much as 80 to 90 percent.6
Although the hosting industry (and in fact the entire telecommunications sector of the world economy) recently has been beset by a downturn, including spectacu- lar bankruptcies, the fundamental economic advantages of hosting remain. The suc- cesses of hosting providers such as Digex in attracting enterprise customers suggest that large companies eventually will provide the most significant customer base for the industry.'
Incremental Sewicr! Levels in ~ o s t i n ~ ~ Table 7.1 shows the layers of services a hosting provider can offer. The base service level-real estate slervices-is similar to the business of leasing office space. Al- though this level of outsourcing provides robust facilities, it leaves the management and ownership of networks, computers, and software applications to the customer. All that has changed is the physical location of the computers delivering IT services. The same development and maintenance staff members care for the computers, and the customer continues to own all application computing equipment.
In addition to space and utilities, most hosting providers can manage networks, physical computing, equipment, application performance, and even applications. As
' ~ e l a n i e Posey, Beryl Muscarella, and Randy Perry, "Achieving Rapid Return on'lnvest- ment in Outsourced Web Hosting," IDC white paper, 2000. 6 ~ e f f Camp, April Henry, Jaime Gomezjurado, and Kristen Olsavsky, "The Internet Hosting Report," Morgan Stanley Dean Witter, November 2000. 7 ~ u c h of the economic malaise experienced by so-called new economy hosting companies such as Exodus can be traced to the high density in their client base of dot-coms. 'some of the material in this section is adapted from Robert D. Austin, "Web and IT Hosting Facilities: Technology Note," Harvard Business School Publishing Note No. 601-1 34.

Chapter 7 Managing Diverse IT Infras!ruc!ures 21 7
we move up the levels of service in Table 7.1, the outsourcing increment-the dol- lars the customer spends and the percentage of effort outsourced-grows larger.
Hosting industry models align with customer requirements for different service levels. Some providers specialize in particular models. For example, some focus on lower real estate and network management service levels only. But the trend' is to- ward supporting higher levels of service as well. Hosting models can be roughly cat- egorized along service level lines, as follows:
TABLE 7.1 Levels of Service from Hosting Providers
Colocation hosting. Colocation hosting companies provide no-frills access to a facility and its infrastructure. Customers rent floor space, connectivity, and power.
s Everything beyond these basics is provided a la carte and not necessarily by the , hosting provider. Customer space is usually enclosed inside floor-to-ceiling cages, and the customer owns and retains responsibility for all the servers and equipment inside the cages. Often the hosting company knows little about the equipment or business operations inside customers' cages. This model requires customers to have (or acquire from a third party) the expertise to design, maintain, and operate the equipment inside the cages. This model, which supports a wide range of archi- tectural possibilities, generally offers high availability.
\
Shared hosting. In shared hosting, servers are owned and operated by the hosting provider and customers purchase space on servers. Multiple customers share a single physical server. Some providers use sophisticated clustering tech- nologies to achieve highly secure and reliable performance. This model, however, is considered best suited to non-mission-critical hosting for small companies or individuals when low cost is an important requirement. Some customers are wary of the degree of sharing implicit in this model because of its perceived negative implications for security and reliability.
Level of Service Description of Service
Business,opeiating services Administering and operating an application I
Application support services Support for software above the opera'aiing system level; application support; application performance monitoring and tuning; design of applications for scalability, relia- bility, security
Platform'services Support for hardware, operating system; reboot services; data backup and disaster recovery services; URL monitoring
Network services Connectivity within the facility and externally to the public Internet and to privateepeering networks; moni- toring of-network traffic at the transport layer; service- level assurances at the packet loss and network
B t * i l
""i% 1 : 4 aviilgbility layers; network secudty *-;
.Real estate.services (lowest level! ; w% u a 8 q % B a 6;*# r;**ql 9%
~ukableYloor space and physical facilities; maintenance : v r '.-"s'*%@'i% ~q,,~l*~:
* A;;;&&' * e t a ,* pi ofatheqspacs and facilities a ' " """ "' . .."i:~;.&" 4
9- 3 2 r**u* l . i ( % * .

21 8 Module Three Managing Networked Infrastructure and Operations
Dedicated hosting. Just as with shared hosting, in dedicated hosting, servers are owned and operated by the hosting provider. Unlike a shared model, however, customers do not share servers; the servers are "dedicated" to indi- vidual customer:;. Other infrastructure components that provide network, storage, and some other services are shared across customers. Usually, dedicated hosting providers offer a complete managed services package that includes everything needed to run the customer's systems at the required level of security and availability. Dedicated servers, in fact, support high levels of security and availability.
IDC separates the dedicated hosting category into three subcategories, in which service offerings are divided into even smaller increment^:^
t
Simple dedicated hosting. This option relies on server "appliances" (i.e., sim- plified Web servers) to deliver a narrow menu of highly standardized functions such as basic Web hosting. Server appliances, which do not require coniplex con- figurations, are simple and inexpensive to operate. In this dedicated hosting model, server appliances are typically allocated one per customer. Although it is inexpensive, dedicated hosting supports a limited range of functions only.
Complex dedicated hosting. This option uses two or more servers with different functions (e.g., Web, application, database servers) to meet a single customer's business needs. It supports a wider range of functions than does simple dedicated hosting, but standardized hardware and software configurations are still empha- sized. The hosting company partners with the manufacturers and developers of the components that constitute the hoster's standard offerings, and the hosting provider's staff becomes vendor-certified to support those components. By fo- cusing on more complex standard configurations than those in simple dedicated hosting, this model facilitates reliable and economical operation of larger com- puter systems whose functions are still somewhat limited.
Custom dedicated hosting. As the name suggests, hosting offerings in t h~s category are designed specifically to support custom hctionality. Custom configured archi- tectures involve multiple servers beyond the hosting company's established stan- dards. To reliably design, build, and operate custom architectures, hosting providers often have to team with systems integrators and other service providers: who work and bill on a one-time, project basis, to design and deploy the custom infrastructure. This hosting model provides, in essence, a completely c'ustomized service offering composed of exactly the service level increments a customer wants to purchase.
It should be apparent from this vilriety of hosting model alternatives that out- sourcing data center infrastructure management is not an all-or-nothing choice. Connectivity service providers-to take another example-offer increasingly incre- mental service 1eve:ls with much more attractive risk and expense management pro-
' ~e lan ie A. Posey a'nd Courtney Munroe, "Web Hosting Service: US Web Hosting Market Forecast, 1999-2004," IDC Research Report, December 2000.

Chapter 7 Managing Diverse IT Infrastructures 21 9 C
. , , ( ' , I G ( ( , - , ' ? , '
files for customers. Do you want 1 megabit per second (mps) of connectivity to the Internet backbone? Ten mps? How about 1 mps ccburstable"'o to 10 mps? Gigabit Ethernet? The options in service provision are multiplying, and infrastructure man- agers now often can purchase exactly the service increments they want.
Managing Relationships with Service Providers
When they acquire IT services externally, companies inevitably find themselves en- gaged in relationships with a growing number of service providers. As the opera- tions of service providers and their customers become intertwined, the customer firm comes to rely on the provider's capabilities as a basis for its own capabilities. Consequently, as with all outsourcing of important business functions, whether sup- plying just-in-time parts to a manufacturing assembly line or managing computing platforms, healthy relationships with vendors are critical to how well a company per- forms its primary business mission. Mistakes by vendors can be costly. Services are only as good as the weakest link in the service provider chain. Choosing reliable service providers and managing strong vendor relationships therefore are critical skills for an IT manager.
Selecting Service Provider Partners The most critical step in assembling an IT service chain is the selection of providers. Providers differ greatly in the service increments they offer, how they charge for services, the guarantees they can make, and the guarantees they are willing to make. No expertise in relationship management can overcome choosing an unreliable ser- vice provider. Infrastructure managers therefore must take tremendous care in se- lecting business partners that perform vital service chain functions.
The most common process for selecting service providers involves writing a "re- quest for proposal" (RFP) and submitting it to a set of apparently qualified vendors. An RFP asks prospective providers for information relevant to their service capabili- ties across a spectrum that includes financial, technical, and operational information. Responses become a primary basis for deciding between vendors. Companies, how- ever, rarely rely entirely on RFP responses but instead gather additional information from industry analysts, from other companies that have used providers' services, and from visits to service provider sites. Many companies employ elaborate scoring mech- anisms for combining information gathered from all sources into comparable bases. But selection always comes down to the judgment of management.
There is no single format for RFPs, nor are there universally agreed on categories of information or sources that should be consulted in selecting providers. RFPs, however, typically request information in the following categories:
Descriptive information. How it describes its business reveals much about a service provider's priorities and likely future direction. Descriptive information
'O~urstable bandwidth options allow customers to use extra bandwidth if they need it for short periods in return for a higher per megabit price.

220 Module Three Managing Networked lTnfrastructure and Operations
is equally relevant in evaluating the prospective provider's capacity to provide services (e.g., is it big enough to meet your demands?).
Financial infornaation. A service provider's financial strength is a critical factor in evaluating the continuity of service and service quality a vendor is likely to provide. Providers that struggle financially may have trouble maintaining service quality or may require financial assistance that reduces or eliminates the economic benefits of acquiring a service externally. Worse, they may fai I and shut down, leaving the customer firm to navigate the provider's bankruptcy.
Proposed plan for meeting service requirements. How the provider offers to meet the requirements laid out in the RFP indicates whether it truly understands the requirements. The plan for meeting the requirements can be evaluated on its merits and compared with proposed plans from other vendors. Partner firms that will be involved in the vendor's plan should be identified so that the customer firm c;m be assured of the qualifications of all the parties involved in service provision.
Mitigation of critical risks. A good RFP asks specific questions about potential service risks. Availability and security are two areas where it pays for customers to be sure they understand a service provider's approach.
Service guarantees. A service provider's guarantees (the levels of performance it is willing to back with penalty clauses in a contract) are important signals of the real level of confidence vendor managers have in their services. Often there is a substantial gap between what the performance service providers claim is their norm and what they are willing to guarantee. If the gap is too witle, often the services will not be as robust as advertised. Service guarantees are essential to aligning incentives between service providers so that overall, the service chain performs well.
Pricing. Pricing usually includes one-time and variable components and may be structured in other ways as well. Although pricing is important for most companies, it usually is not the most important factor in deciding between vendors.
Table 7.2 shows a summary of information about three hosting providers that might be gathered fkom an RFP and other sources." A close look at the information demonstrates that often choices between vendors are nontrivial. Providers that are strong in one area may be weak in another, and often no clear choice emerges.
For example, in Table 7.2 the fact that Provider 1 seems unwilling to supply fi- nancial information is probably a red flag that signals further investigation. Even if Provider 1's funding sources are gold-plated, customers need specific assurance that a service provider has a viable business model and will be a strong partner well into the future. Similarly, infrastructure managers might reasonably be worried about
his example is taken from Robert D. Austin, "Selecting a Hosting Provider," Harvard Business School Exercise No. 601-171.

TABLE 7.2 Summary Grid for Comparing Hosting Providers
I Comparison Dimension
4 .z Provider 1 ovider 2
i Company description Regional hosting and National hosting 1 broadband (backbone, services provider
Financial profile Declined to provide After-tax loss $180
rn >
(private company) million on sales of . : d 2. ' P l a * B pa- * s*& ,% - ,a + $600:million; strong
cash position; new facilities buildinq offered as explanation
lib
$ h u . naw:a:a k s for lack-of profirability umbero of data 3 d 28 data centersll.6 centers managed1 160,000 sq. ft. million sq. ft. total square feet Space offered (R 3 8'xa"cages (1 92"sq. 3 8'x7' cages (1 68 sq. specified space f ft.), partitions ft.), partitions racks of equipment) removed to provide removed to provide
contiguous space contiguous space
Provider 3
Regional telco, backbone and broadband service provider :-
28,000
After-tax profit of $1 .I billion on sales of $13 6?1lion (mo~t :~o t from hosting business)
220,000 sq. ft. (45,000 operational) 280 sq. ft. enclosed room
1 Physical security ~ u l l ~ m e e t s Some concerns (see I I requirement notes from site visit)
1 power Fully meets Fully meets I requirement requiremen
E; - F. $ a .J- a a4* B @
?$P *ee ~8 3
1 Connectivity Fully meets Fully meets requirement
q *a, e * s + t
Connetted to only one power grid; two promised with'in 6 weeks
Not redundant to backbone; promised re"dundancy in 6 weeks
Service-level Fully meets Fully meets Partially meets guarantees requirement requirement requirement
4
a one-time setup $6,500 - $7,800 $10,800 cost, space
Monthly space rental 3 x $6,500 3 x $6,800 $9,800
I One-time setup cost, $1,200. $1,500 $1,600 . I connectivity
Variable connectivity $1,200 per month plus $1,500 per month plus $900 per month plus cost $525 per month for $589 per month for $412 per month for
B each mbps above 10 eachzmbps above 10 . ,each mbps above 10
Source: Adapted from Robert D. Austin, "Selecting a Hosting Provider," Haward Business School Exercise No. 601-171. Although based on real cases, these data are fictitious and do not pertain to any real hosting provider.

222 Module Three Managing Networked Irfrastructtrre and Operations
Provider 2's lack of profitability. Provider 2 relates the losses to its expansion plans, but prospective customers might wonder if the comph~iy can transition as easily to profit-making as its managers suggest. In this scenario, Provider 3 looks like the solid choice because it is large and profitable and its fees are lower.
Unfortunately, there are reasons to worry about Provider 3. Most of the com- pany's revenues come from business other than hosting services. This situation may translate into a lack of focus on the hosiing business. Furthermore, Provider 3 seems to have some serious operational problems. Table 7.3 shows a discouraging report from a team that visited Provider 3's data center. In light of the report, one wonders whether Provider 3's lower prices are a miscalculation and perhaps evidence of the company's inexperience in hosting services. If so, the low prices eventually may be- come a problem for Provider 3's customers as well, especially if low profitability in the hosting business causes that provider's managers to further reduce their attention to hosting. Worse yet, if Provider 3 discovers it is losing money on hosting, it may seek to reduce costs in ways that affect service levels or even discontinue its hosting business.
We have stumbled here onto a general truth of outsourcing that we will return to in Chapter 9: An outsourcing deal that is too one-sided, too favorable to one party at the expense of thrl other, usually endh up as a bad dealfor both sides. As they re- alize the deal is a loser, the managers of a disadvantaged vendor almost always di- vert resources away from the relationship. This realization brings us to the next sub- ject: managing relationships with providers once they are in place.
Relationship Management Relationships with service provider partners require ongoing attention. Processes must be in place so that partners can share information and problems in the senrice chain can be solved quickly even when they result from complex interactions of infrastruc- ture components owned by different players. Problem-tracking and customer relation- ship systems, for example, must be able to exchange problem-tracking infolmation as well as, sometimes, customer account information. Procedures and technical inter- faces between partner systems must be properly designed and maintained.
More significani than problems with information-sharing systems, though, are the many incentive problems that attend collaborative service chain rela tionships. The most formidable obstacles are sometimes not technical but "political." When avoiding responsibility for a problem intrudes into the process of solving it, the ser- vice collaboration becomes less effective. A key to effective relationships is aligned incentives among partners.
A service-level agreement (SLA) is the prevalent contractual tool used to align incentives in relationships with service providers. SLAs describe the specific con- ditions by which the service provider is held liable for a service interruption and the penalties that the service provider will incur as a result. Table 7.4 illustrate:; the kinds of contractual term!; one finds in an SLA. In keeping with our earlier examples, this SLA is for a hosting provider. Notice that failure is specifically defined, penalties apply only when the service provider is responsible for the service interruption, and

TABLE 7.3 Sample Facility Visit Report for Hosting Provider 3
Initial walk Bround exterior:qRenovated warehouse building (conven!ional brick, not hardened) shared with a delivery service. Urban setting amid a complex of warehouses. City workers doing roadwork near the facility, with heavy-duty digging (potentially fiber cable slicing) equipment. Data center on third floor. First floor and basement include aigarageaused by the delivery service. Panel trucks come and go on the lower levels on the north side. Second floor includes offices and appears to be empty. Never spoke to anyone who could tell us definitively how the second floor would be built out or if even~that was the plan. . a " .:* C C N cameras visible around the perimeter of the facility. Diesel generators enclosed in 12-foot- high chain link, HVAC on roof. West side of building composed of a series of loading doors. Onfday of v,\sit, three-loading doors,yere op$p. We $ucceeded,in climbing up,onto the loading . dock and walking right into a power"infrastructure room where many UPSs were housed. Waited there, expecting C C N or alarm to summon security; no one ever showed up. (Staff later expl,ained this laps~iby sayi~g~that t&adoo~,vyas opegJo faqi[$ate coeos;ructi$~*,and {$novation. mi=& - and'that thgaguard hho wasbosted there ha8 been reprimarided.) . .Entering facility: Fir~t-level security is building security. Guard appeared not to realize that there wasea data:<enter inslthe buiiding. Usfiered ddup to tt?e"thirdlRoor, where webencountered an',." unoccupied security desk behind a sliding glass partition. One CCTV console visible at desk. It would have* been easy to climb through the opening to the security desk and let ourselves into the facility.~Biometric palm reader visible butvust-covered atadoor. Sckurity guard who had , walked us up called someone on radio, and someone came to let us in. Person who let us in came from somewhere outside the data facility, then let us in by leaning through the opening and hitting the buzzer, which was in reach. We stood inside the door while he inade out visitor .. badges for us. He did ask to see picture IDS, but security was kind of a farce by this point and everyone was a little embarrassed (including us for them). The room we were standjng in while he preparedffbadgesiapproximated a<jman trap in tha$ there was anqther doorpabout 20 feet :%
away that opened into the data center proper. Unfortunately, that door was propped open. . .d
Cages: No cages. ~$ppne gets an ev~<losed~pom ?ifh $eypad:accesi.'~o raised floor; power".# iod2s"in frpm abovk: as dd~~%ms.~olt-inara"cks and82helOes provid6il?~alls*f rood%fdo notSam extend to roof, so possible to climb over walls or to toss something into enclosed room.
~er i f ica t ion~~f redundaniy, sprity2etc.: Reddyda~t~power agd connpctivity.iot yet in place,As although promised within six weeks. Network hardware for facility was exposed in an open atea anyone walking to his or her own enclosed space would need to pass. No on-site NOC, although they expressed willingness to provide, specific network monitqring on,site on a contract basis; noted too that network operations were monitored from a regional NOC. Guy giving tour kept apologizing for the construction.
Concerns: This facility is not5fully built yet, althoughsome customers-are operational. Provider I promises to have it in shape in time consistent with our project, but fact is that we cannot compare this facility on an equal basis with the ot ing under construction did not , explain all the lapses we saw. C. .;. : I
I Overall assessment: These guys don't appear to have the hosting business figured out yet. Maybe it's just that they are in a constru~tion~phase. But there was liftle that we saw that offered warm feelings during our tour. . @ ,
- - ~
Source: Robert D. Austin, "Selecting a Hosting Provider," Haward Business School Exercise No. 601-171. lnfokation in this report is fictitious and not intended to pertain to real hosting provider.

224 Module Three Managing Networked Infrastructure and Operations
TABLE 7.4 An SLA Offered by a Hosting Provider
/ 0 Downtime-defined as sustained packet loss in excess of 50% for 15 consecutive minutes due , I , to the failure of the hosting provider to provide services for that period (does not include scheduled maintenance time).
/ 0 Excess latency-defined as transmission latency in excess of 120 milliseconds round-trip time , 1 between any two points within the hosting provider's U.S. network.
1 0 Excess packet loss-defined as packet loss in excess of 1 % between any two points in the I
hosting provider's network. I
1 0 Each downtime period entitles customer to receive a credit equal to one day's recurring 1 connectivity charge.
j 0 Hosting provider guarantees two-hour response time in diagnosing problems within hosting I provider and customer network. 1 0 If problem is not within hosting provider and customer network, hasting provider will I
determine source within an additional two hours. / 0 Customer will be advised of reason for problem within one hour of hosting provider's
I
I
i discovery of the reason for the problem. I i
1 0 If problem is within control of hosting provider, remedy for problem is guaranteed in t * ~ o / hours from diagnosis of the problem. I
i 0 Inability to deliver diagnosis or remedies within the times stated above entitles customer to an I
additional service credit for each two-hour period of delay.
1 0 Customer can collect credits for no more than seven days1 charges in a calendar month. 1
0 Customer must request credits in writing within seven days of the event for which credits are i compensation. 1 0 Credits are granted at the sole discretion of the hosting provider. !
penalties are prespecified and limited. Why a service provider insists on c;nreful def- initions is clear: to limit its liability for problems not under its control. But the spe- cific nature of the agreement comp1ic:ates service quality assurance. What matters to the client company is any failure regardless of which service provider causes it.
Managers of customer firms must therefore manage a web of SLAs with many service providers. SLAs in the web must interlock so that penalty payn-ients flow through the service chain in a way that provides appropriate incentives. Suppose, for example, a company offering over-the-Net software functionality agrees to an SLA with a customer firm that requires the software company to pay a penalty if the sys- tem is not available for a period longer than 10 minutes. Suppose also that the actual cause of a failure is a different vendor, say, an Internet service provider (ISP). In that case an SLA in place between the software company and an ISP should specify that the ISP will reimburse the software company for the penalty it owes to the client company. Althougt~ the SLA arrangement between the software company and the ISP might seem a matter best left to those two entities, it is to the customer com- pany's advantage to ensure that incentives are aligned. Disputes between partners in a service chain can have dire implicat'ions for the user of the service.

Chapter 7 Managing Diverse ITInfrastructures 225
The conventional wisdom in defining SLAs calls for designing them with "teeth," that is, so that service providers feel pain when failures occur. In practice, however, it is difficult to determine appropriate penalty levels. SLAs provide service providers with both incentives and a way to credibly express their intention to de- liver reliable service, and so it is important that they be in place. But setting penal- ties too low has little impact. Setting them too high is detrimental to a provider's willingness (and, if penalties are high enough, ability) to be a strong partner. Thus, whereas SLAs are important, it is a mistake to consider them the only means by which partners are managed. The most successful relationships emphasize shared objectives and helping all the partners earn a reasonable return.
Since many outsourced services involve entrusting data to service providers, contractual relationships need to contain provisions about a customer firm's rights to control its own data. The concern here is not that a vendor might try to claim ownership of customer data but that the vendor might try to lock the cus- tomer into a relationship by making it inconvenient to switch vendors. A com- pany needs to retain its right to move data to another vendor. In its contract, the service provider must guarantee the customer's right to transfer data back to the company or to another vendor. Such a contractual provision addresses a common case, but the point is more general: The interests of service providers and their customers are poorly aligned when it comes to the degree of entanglement in their relationship. Regardless of the type of service, managers who use IT service providers must work to preserve service delivery options. Managers who take in- sufficient care in avoiding unnecessary entanglements will find themselves at the mercy of service providers, forfeiting a principal benefit of incremental out- sourcing: the ability to alter and improve IT infrastructure in small steps in an on- going manner.
Managing Legacies
Not too long ago, tax accountants at a major U.S. company discovered they were not taking full advantage of a benefit they could claim under the U.S. tax code. The tax law details of this story are unimportant, but the benefit was worth a substantial amount of money to the company if the accountants could claim it. But to claim the tax benefit, the company needed to process receivables in a very specific way. The tax accounting managers therefore convened a large meeting of all the people in the company who might have something to say about a change in how receivables were processed.
The meeting was nearly two-thirds finished when a relatively young, relatively junior employee seated near the back of the room interrupted the smooth flow of the meeting to the mild irritation of the senior manager from tax accounting.
"Excuse me," the young man said. Everyone knew he was from the IT depart- ment. "Can you help me . . . do I understand . . . ?" the young man stuttered as the glare of the room's attention turned entirely to him. "What you are proposing? Is it . . . 1" He then summarized his understanding of the proposal.

226 Module Three Managing Networked Infrastructure and Operations
"Yes," the senior tax accounting manager answered. "That is the proposal, al- l
though we are working it through in detail with everyone here to make sure no one sees any issues with the change."
The young man smiled. "I've got news for you," he said. All those in the room braced themselves, expecting an explanation in incomprehensible IT terms of why the change could never be made within the company's IT infrastructure, at least not at a reasonable cost. What he said surprised everyone:
"We've been processing our receivables that way for the last 20 years. That's the way the system does it. That's how the program logic works."
The meeting was quickly adjourned as the tax accountants returned to their of- fices to see if they could figure out a way to apply for the benefit retroactively.
This story illustrates two very serious points. First and most obvious, company operations often are constrained by the way legacy systems process information. Old computer code often dishubingly manifests what have been called "core rigidities," the ossified remains of what were once capabilities.12 Second, business managers often do not even know how their company performs certain vital business functions because the details are buried in how legacy systems operate. In thifstory, the man- agers' discovery about their company's operations was a happy one; more often, though, such discoveries are less welcome.
The difficulties that arise from legacy systems can be roughly categorized as follows:
Technology problems. Sometimes the constraints embedded in legacy systems result from inherent incompatibilities in older technologies. As we have seen, proprietary technologies that predate the Internetworking era were not designed to converse easily with technologies from other vendors. This kind of problem must be worked around in modern Internetworking infrastructures.
Residual process complexity. Some difficulties with legacy systems arise because the systems address problems that no longer exist. One example is the substantial amount of batch processing some companies still perform. Legacy systems were designed to operate in batch mode because processing power needed to be rationed and because the bandwidth available at that time did not allow computers to operate in real time. Now computing power and bandwidth are relatively abundant, but many batch systems have not been redesigned or replaced because of other priorities.
Local adaptation. Many legacy systems were developed for very focused business purposes within functional hierarchies. When such systems were designed, their architects had little i.nkling of the enterprise systems and real- time architectures of the then-distant future. Instead, systems were intended to solve a particularly narrow business problem. Not surprisingly, a system
12~or a deeper discurlsion of core rigidities, see Dorothy A. Leonard, Wellsprings of Knowledge: Building and Sustaining the Sources of Innovation (Boston: Haward Business School Press, 1998, paperback edition).

Chapter 7 ManagingDiverseITInfiastructures 227
TABLE 7.5 Key Questions in Managing Legacies - s * / Legacy syst<ms . U :- HOW wilknbw infrastructurefexchange data with
legacy"systems? Will new infrastructure obtainSneeded real-time inter- action with legacy systems? What work-arounds are necessary? Are they sustainable? What is long-term strategy for renewing legacy systems?l;'
e t . :* Legacy org&izations and cultGres How billmh&v infrastructuhfiffect ways of wgrking
and communicating? Are anticipated changes acceptable? Should technology drive organizational and cultural change? Should organization and culture be protected from
u s e technology effects? 1 d
a 8' il :*I r p I* 6 a v ~ h a ~ ~ ~ ~ ~ o r ~ a n i z a t i o n a l . ~ x * $ ~ ~ t a t i o n s - re*W% 8r about c"$fmon d @ * % i d f i g * * i s " in different parts 8f the organization? ' "
What are criteria for deciding whether systems or process will change when the two are not compatible?
designed for order processing of replacement parts for the aftermarket in the 1970s, for example, does not facilitate global uniform parts management in 2002, although it still may do its narrowly defined job very well.
Nonstandard data definitions. Throughout most companies, business units and divisions have used different conventions for important data elements. For example, the parts division might use a 15-character part number whereas the product development organization uses a 13-character part number. This may seem like a small difference (only two characters), but the legacy system impli- cations are far-reaching. Differences in fundamental data definitions are built into a company's IT infrastructure in many specific places. They are difficult to change not only because they touch so many elements of the IT infrastructure but because making definitions common requires an expensive and difficult to achieve companywide consensus.
Because of the tremendous variety in legacy systems across companies, it is not possible to develop a prescriptive approach to dealing with legacy issues. Tactics for solving legacy problems must fit individual companies and their specific situations. However, there are questions managers should think through carefully before they contemplate growing infrastructure by adding new systems or services on top of ex- isting systems.
Table 7.5 lists questions managers might ask about legacy systems that will have to interact with a new system or service. The first issue is whether legacy systems

228 Module Three Managing Networked rnfrastrucrure and Operations
can, in any modified or enhanced form, perform consistently with real-time infra- structure objectives If the answer is no, replacement may be the only option. Often, though, the answer is not definitively negative. Questions then focus on e7 arounds," contrivances needed to facilitate interaction between new and old-infia-
I I
structure-elements: whether they are sustainable and whether they represent reason- able cost/functionality trade-offs.
Many businesses have succeeded in adding interfaces to legacy systems that en- able them to interact with Internetworking systems. This interfacing appro;nch some- times is called enterprise application integration (EAI). EAI practitioners recom-
t- mend "noninvasive" interfaces that mrnimize changes to the internal operations of legacy systems. Even EAI enthusiasts, however, acknowledge limits to how well legacy systems can perform as components of real-time infrastructure. Sooner or
, later the problems of getting work-arounds to operate satisfactorily become more difficult and more expensive to solve than just replacing the old systems. Infra- structure managers always must ask whether the complexity of work-arounds is un- reasonable.
When installing new infrastructure or acquiring new services, infrastructure man- agers also run up against organizational rather than technical legacies. Changing IT infrastructure unavc~idably affects nontechnical elements of a company's operations, especially how people work and interact. A complex interrelationship exists between core rigidities that manifest themselves in ossified legacy systems and a firm's so- cial systems and processes. Sometimes the rigidity of workers' attachment to how a system works (the process it follows) is as much or more of an obstacle to change as any technology factor. Moreover, changes in how systems work almost always force changes in how people work to a grealer or lesser degree. The degree to which sys- tems force cultural and process changes is a key management decision. The second half of Table 7.5 suggests questions that managers should ask as they confront or- ganizational legacies that interact with system legacies.
Managing IT Infrastructure Assets
In the mainframe era, keeping track of the assets that made up a company's IT in- frastructure was relatively easy. The majority consisted of a small number of large mainframe machines in the corporate data center. A company's investment in IT had a tangible presence. Senior business managers could point to it, even rap their knuckles against it if they wished. Because a company's infrastructure wils central- ized and because services were deployed from mainframe assets, companies found it relatively easy to lrack how systems were being used and estimate how much value they were providing.
After the emergence of PCs; clients and servers, the Web, portable devices, and distributed network infrastructure, a company's investments in IT became much more diffuse. Computing assets were scattered in a large number of small machines located in different buildings. Some (i.e., laptops) moved around with their users and

Chapter 7 Managing Diverse IT Infrastructures 229
left the company's premises on a regular basis. As we look forward, some new ser- vice delivery models could cause assets (e.g., servers) to migrate back to the corpo- rate data center, which might seem to herald a return to centralized management models. Other model variations, such as outsourced hosting, make it clear, though, that complexity of infrastructure and distribution of IT assets are here to stay. As service delivery models proliferate and improve, the variety of IT asset configura- tions will increase.
The variety of asset configurations in modern IT infrastructures makes certain business questions hard to answer: How are IT investments deployed across business lines or units? How are IT assets being used? Are they being used efficiently? Are they deployed to maximum business advantage? How can we adjust their deploy- ment to create more value? Although never easy to answer, these questions were at least reasonable when assets were centralized. Some of the thinking about IT man- agement frameworks over the past decade or so has focused on reclaiming manage- ment control over IT assets.
One approach to this problem has been called total cost of ownership (TCO) analysis. IT services are analyzed in terms of the costs and benefits associated with service delivery to each client device. For example, the total cost of delivering of- fice productivity services to a PC desktop within an enterprise might be expressed as "$250 per client per month." Arriving at this number requires a detailed study to determine the total monthly costs associated with the delivery of each service avail- able on that client, including costs shared with other clients and costs not necessar- ily accounted for as line items in budgets or accounting systems. Once monthly costs are computed, they must be allocated on a per client basis. Totaling costs without missing any that are material is difficult, as is allocating costs to clients in a way that preserves the management usefulness of the information.
Completing the analysis on the benefit side of the equation is also difficult but essential if IT assets are to be used efficiently. Many who attempt TCO analyses settle for usage information-what services are used and with what frequency- on the benefit side of the equation rather than attempting to estimate the actual benefits to each user. Usage information on a per client, per month basis can be helpful compared with cost of service delivery on a per client, per month basis. Usage information also may be useful when computed on the basis of other plat- form types. For example, usage information on a per server basis might be useful in server-to-server comparisons, in planning for growth in server capacity, or in discovering opportunities for consolidating underused servers into a smaller num- ber nearer their capacities.
Cost and benefit analysis for IT assets and platforms provides a basis for evalu- ating a company's current IT services against new service alternatives. Outsourcing vendors often are asked to bid on a per platform basis. These prices can be compared to study results to evaluate a company's options and identify incremental opportu- nities for service delivery improvement. Where a firm's costs of delivering an IT service are out of line with the price at which it can be acquired externally, out- sourcing becomes comparatively appealing.

230 Module Three Managing Networked Iiifrastructure and Operations
Summary This chapter has explored the increasingly diverse nature of the infrastructure used to deliver IT services in 2 1 st-century companies. We have described how more avail- able and secure network connections are creating more service delivery options and how new options have led to the creation and restructuring of the service provider industry. Today companies acquire services externally from chains of service providers and integrate those external services into their internal legacy infrastruc- tures. The shift toward incremental outsourcing and multiple, collaborating service delivery partners dictates a shift in management emphasis. The following questions should help a company assess the opportunities and the risks:
1. What services within our IT infrastructure are candidates for incremental out- sourcing? Where are there opportunities to convert large up-front IT inwestments into spread-over-time subscription services?
2. Are our service delivery partners technically and financially capable enough to support our evolving IT service needs? Do we have well-defined processes for partner selection to ensure that we will continue to have highly capable partners?
3. Do we have detailed service-level agreements in place with our service providers? Have we made sure that the SLAs in our service delivery chains in- terlock and that incentives are aligned up and down the chain? Do we have sys- tems in place for virtually integrating with service delivery partners? Have we specified contract terms with service providers that preserve our options for in- crementally improving our infrastructure?
4. What are our short-term and long-term strategies for dealing with legacy system issues? What systems should we replace, and when should we replace them?

d "
Module Managing and
/ %
Organization by F. Warren McFarlan
' # * * * i 4 I 'ar, L xe 4 r-6 + iP ' 8
Although much has changed as information technology (IT) organizations have be- 9% c
"Via .;. come networked, some core management issues have persisted. How should IT staff be organized to support business activities? Which IT functions should be performed inside the firm and which should be performed outside? How should we manage IT projects, especially megaprojects that have increased in size beyond anything in our past experience? We have inherited these questions from the past, but they have changed somewhat in this new era. Spme of the answers are also changing.
The chapters in this module provide a basis for discussing these questions in their 21 st-century form. We adopt a contingency approach intended to identify the factors
6 that differ between organizations, business situations, and projects and to make rec- ommendations appropriate to specific markets, firms, and projects. The overall re- sult of our analysis is a portfolio framework that allows questions and recomrnen- dations to'be formu1ated"into policies consistent with a company's overall strategic direction.


Chapter 8 Organizing and Leading the IT Function The management structures needed to introduce new technologies into a company are quite different from those needed to maintain older, established technologies. A guiding principle is to encourage the information technology (IT) staff and business users to innovate with newer technologies while simultaneously focusing on control and efficiency of the existing systems. In the early 2 1 st century, as we shift into the world of Internetworking, technology innovation is probably the more important of these concerns. In this chapter we discuss the range of alternatives in assigning re- sponsibility and roles to business users, the IT staff, IT suppliers, and general man- agers in conducting IT activities and formulating IT policy.
Organizational Issues in the Control of IT Activities
Two sets of tensions guide policies for developing, deploying, and managing IT sys- tems. The first set is between innovation and control. The emphasis a firm should place on aggressive innovation depends on a broad assessment of the potential strategic impact of IT on a firm and on management's willingness to take risks. If IT can greatly help a firm achieve its strategic objectives and managers are not too risk- averse, a significantly greater investment in innovation is called for than is the case if IT is considered merely helpful or if managers want to avoid all unnecessary risks. In today's IT environment the benefits promised by real-time Internetworking sys- tems have shifted the emphasis toward more innovation.
As a company selects priorities and enlists resources to pursue its objectives, a second set of tensions may develop between the IT staff and business users. Users

234 Module Four Managing and Leading a Networked IT Organization
often are inclined to focus on short-term need fulfillment, solving today's problems right now, frequently at the expense of long-term IT architectural concerns, mainte- nance needs, or orderly deployment. The IT department, in contrast, tends to be pre- occupied with standudization of solutions, mastery of technology, maintenance dif- ficulties, and orderly deployment at the cost of a slow response, or no response, to legitimate business needs. Balancing the tension between the two groups is difficult and must take into account many factors, including corporate culture, IT'S potential strategic impacts, and the urgency of short-term problems.
Table 8.1 illustrates the consequences when either the IT staff or business users in- appropriately dominate IT resource allocation and project priorities. Very diflferent ap- plication portfolios and operating problems emerge in the two circumstances. Because it is difficult to anticipate the implications of the introduction of new technology, nei- ther the IT perspective nor the user perspective is more correct. Decisions about the proper balance between innovation and stability and the degree of IT or user control of priorities and resources are highly contingent on the business situation. In particu- lar, when rapid inno~~ation is required, managers must be sure that rigid policies do not interfere with experimentation and learning. As the following four examples demon- strate, there is no perfect prescription for successful IT innovation.
1. From Centralized, IT-Driven Innovation to Decentralized, User-Driven Innovation Over a four-year period in the early 1990s a major textile company invested heavily in new systems for electronic commerce and order management. By executing a few very large, centrally managed projects, the company's IT department assured adher- ence to companywide standards for software', computing platforms, and communi- cations. The new systems were considered a success by all involved. In 1998, how- ever, management moved systems development activity from the central IT department to the divisions, a change that involved some 80 people. The goal was to align the development of new applications more quickly and effectively with the needs of senior divisional management. With IT standardization problems largely solved, the company- was able to install a new organizational structure that enabled the divisions to innovate more rapidly around individual agendas. The results since the reorganization suggest that it has been extremely effective. In addition, IT stan- dards have not yet been eroded.
2. User-Driven Innovation over IT Department Protests The number one priority in a large machine-tool manufacturer's engineering de- partment was implementing computer-aided design (CAD). Early success led the company to expand the CAD system scope significantly: Engineers modified the digital output from the system so that department personnel could feed it directly to computer-driven machine tools. To maximize the speed of deployment, engineers deliberately kept the project separate from concurrent work by the IT depa.rtment on a related bill of material system. Although the CAD project was a major success, in- tegration into the bill of material system remained an outstanding requirement.

Chapter 8 Organizing and Leading the ITFunction 235
TABLE 8.1 Possible Implications of Excessive IT and User Dominance
1 IT Dominance User Dominance 1 i Too mxsh emphasis ??,database !?dye
system maintenance" rFa",*e I 1 All new systems must fit data structure of / existing system
i All requests for service require system study ; with benefit identification - i Standardization dominates with f 1 exceptions
i IT designs/constructs everything I 1 Benefits of user control over development ' are discussed but n$ver implemen$ed 1 study always shows construction cosk less
than outside purchase Headcount of distributed minis and
development staff growing surreptitiously IT spe$qlizing in tech$i$al frontiers:$ot
user-oriented markets ' IT spending 80% on maintenance and 20% / on development , IT thinks it is in control of everything
1 i Users express unhappiness 1 Portfolio of development opportunities 1 firmly under IT control
/ No strong user group exists
.-.Too much emphasis on probjem foc h%8igi$~ .%r$4 *.b
* IT feels out of~control " Explosive growth in number of new systems and supporting staff Multiple suppliers deliver services; frequent
change in su~plier of specific service ;;;
Lack of standardization and control over data and systems Hard evidence of benefits nonexistent Soft evidence of benefits not organize
'2* Few measurements/objectives for new system Technical advice of IT not sought; i f received, considered irrelevant '
4. User buying design, construction, mainte-mBee: / * a x * B. u *pynance, and operations services from outside"
User building netivorks to own unique needs, not to corporate need Some users growing rapidly in experience
e, while others feel nothing is t becduse they do not understand' :
o coordinated effort between users for tech- nology transfer or learning from experience Growth in duplication of technical staffs
I General management is not involved but tically rising communications co , i e of redundancy *
uplication of effort and input every because different data, hardware, and communications will not allow seamless movement 51
i B * I * R X
Because it'was short-staffed, the IT department delayed the integration with the bill of material system. Emboldened by their success with the CAD system, the engineers proceeded with the integration on their own over the objections of IT management. IT managers feared that the engineers would not adhere to standards and, consequently, major operational problems would result. Nevertheless, be- cause of the project's potential to immediately affect the company's product de- velopment life cycle, the engineering department received full support from se- nior management.

236 Module Four Managing and Leading J Networked IT Organizcztion
The enthusiastic engineers made the project work: The project slashed new prod- uct development time by half. The IT department remained decidedly unenthusias- tic throughout the project. Although some integration issues remained after com- pletion, the project .was judged a great success.
3. From Decentralized, User-Driven lnnovation to Centralized IT Management A division of a large consumer products company made a substantial investment in desktop services with modest up-front cost justification. Even though it had only cursory direction and training, the IT department encouraged managers and adrnin- istrative support personnel to "use" desktop systems. In the first year a number of uncoordinated projects emerged within the user community, including several sales force support applications and a number of spreadsheet applications. Users gained confidence and pursued new programs with enthusiasm.
Six months later the IT departmenl: was asked to develop a program lo support these "experienced" users and bring some commonality and order to their disparate activities. By then business user applications were so fragmented that an IT manager estimated that it wc~uld take roughly two years to deploy an effective sul~port pro- gram. Two years seemed like a long time to company managers. They asked them- selves whether they should have developed the support program in advance and de- ployed desktop sen,ices with more centralized IT control in place.
The consensus answer to that question was no. Both IT and business management felt that an IT-driven desktop services project would have been viewed as an IT ini- tiative and therefore would not have been embraced enthusiastically by business users. The two years it would take to gain management control of distributed user initiatives was a price the company was willing to pay for the zeal with which users had embraced the new technology. This decentralized approach stood in marked contrast with the company's traditionally centralized approach to managing its ma- ture data processing technologies.
4. From Decentralized, User-Driven lnnovation to Unexpected Centralized lnnovation A large South African retail chain instilled a point-of-sale (POS) inventory tracking system in each of its 50-plus stores. The company's retail division initially funded the project for a narrow business purpose: to assist store managers in controlling in- ventory. POS infonnation was to be used inside individual stores exclusively in or- der to accumulate daily sales totals and trigger reorders. The project was successful, and stores quickly achieved significant inventory savings.
Later, senior business managers asked the IT department to link store POS sys- tems with central systems at corporate headquarters. The proposed links would feed data to new corporate software designed to measure product performance across stores and help manage warehouse stock levels throughout the retail chain. Because the communication protocols used by POS systems were incompatible with the pro-
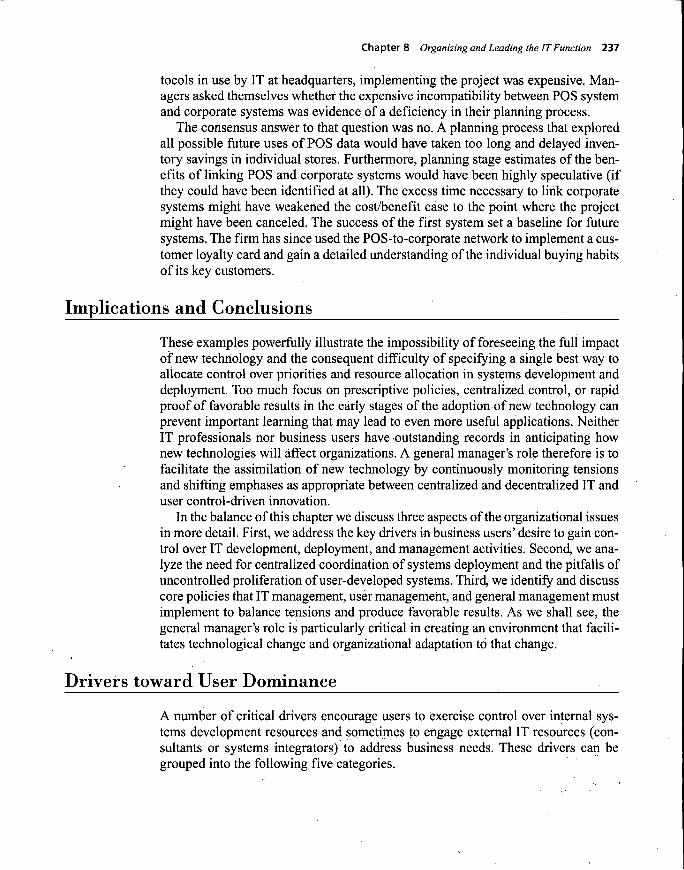
Chapter 8 Organizing and Leading the ITFunction 237
tocols in use by IT at headquarters, implementing the project was expensive. Man- agers asked themselves whether the expensive incompatibility between POS system and corporate systems was evidence of a deficiency in their planning process.
The consensus answer to that question was no. A planning process that explored all possible future uses of POS data would have taken too long and delayed inven- tory savings in individual stores. Furthermore, planning stage estimates of the ben- efits of linking POS and corporate systems would have been highly speculative (if they could have been identified at all). The excess time necessary to link corporate systems might have weakened the cost/benefit case to the point where the project might have been canceled. The success of the first system set a baseline for future systems. The firm has since used the POS-to-corporate network to implement a cus- tomer loyalty card and gain a detailed understanding of the individual buying habits of its key customers.
Implications and Conclusions
These examples powerfully illustrate the impossibility of foreseeing the full impact of new technology and the consequent difficulty of specifying a single best way to allocate control over priorities and resource allocation in systems development and deployment. Too much focus on prescriptive policies, centralized control, or rapid proof of favorable results in the early stages of the adoption of new technology can prevent important learning that may lead to even more useful applications. Neither IT professionals nor business users have .outstanding records in anticipating how new technologies will affect organizations. A general manager's role therefore is to facilitate the assimilation of new technology by continuously monitoring tensions and shifting emphases as appropriate between centralized and decentralized IT and user control-driven innovation.
In the balance of this chapter we discuss three aspects of the organizational issues in more detail. First, we address the key drivers in business users' desire to gain con- trol over IT development, deployment, and management activities. Second, we ana- lyze the need for centralized coordination of systems deployment and the pitfalls of uncontrolled proliferation of user-developed systems. Third, we identify and discuss core policies that IT management, user management, and general management must implement to balance tensions and produce favorable results. As we shall see, the general manager's role is particularly critical in creating an environment that facili- tates technological change and organizational adaptation to that change.
Drivers toward User Dominance
A number of critical drivers encourage users to exercise control over internal sys- tems development resources and sometimes to engage external IT resources (con- sultants or systems integrators) to address business needs. These drivers can be grouped into the following five categories.

238 Module Four Managing and Leading a Networked IT Organization
Pent-Up User Demand IT departments and suppliers often do not have the staff and budget needed to han- dle the volume of IT activities and projects. There are a number of causes for this disparity. Existing systems, for example, require sustained maintenance to accom- modate changing regulatory and busmess requirements. As the number of auto- mated systems in a firm increases and as systems age, the total volume of change requests increases. Ongoing customization of existing systems increases system complexity and maltes enhancements more difficult. In addition, systems need to be adapted to major changes in IT archite:cture, such as the transition to enterprise and Internetworking systems.'
Bringing about these conversions, which are increasingly urgent as we move to real-time infrastructures, has been very expensive. They strain IT staff resources and at the same time effectively starve other departments of resources. It also is common for IT departments to expend significant resources to maintain and enhance exist- ing systems but keep only a few resources available for developing and deploying new systems. To make matters worse, the most challenging, high-status, and high- paying IT jobs in the industry tend to be with computer vendors and software houses. The most talented members of a company's in-house IT staff are tempted to move to more glamorous jol~s. Consequently, sometimes it is easier for IT departments to se- cure budget money than to find qualified staff. Delays caused by these factors have led to frustration and a strong desire by users to take matters into their own hands. As we shall see, tht: same factors act as drivers toward outsourcing.
The Need for Staff Flexibility When an IT department and its vendors appear unresponsive to users' demands, the users see developing systems themselves as a nonconfrontational way to get work done. By deploying their own staff in [T roles or engaging services from outside in- tegration or application service companies, business users significantly speed the process of meeting their requirements for IT functionality. There are benefits from closely linking both physical and operational IT resources and end users. Basing IT staff in the business user's department helps educate users to IT'S value-adding po- tential. It reduces communication problems between developers/deployers and users. It makes eml~loyee promotions that involve rotating IT staff to other (non-IT) jobs within the department easier, thus enhancing user-IT coordination, and it facil- itates moving end users to IT positions.
Growth in the IT Services Industry Thousands of comrnercial off-the-shelf software packages are now available for spe- cific IT applications. These packages range from simple accounts payable products to complete enterprise systems products. As we have seen, over-the-Net aloplications
his problem began to emerge in the 1970s, when systems design philosophy shifted from incorporating data into programs to separating data from the processes that use the data.

Chapter 8 Organizing and Leading the ITFunction 239 l and other outsourcing options are proliferating as well. To frustrated business users with urgent short-term business needs, these options appear beguiling. These sys- tems are marketed by hardware and software vendors to business managers, and their functional features are emphasized; vendor sales representatives soft-pedal in- compatibilities with the firm's existing infrastructure and software upgrade or main- tenance problems. Frequently, a proposed point solution to a short-term business problem appears more cost-effective than having the work done or purchased by a central IT department. Often vendors quote a simple up-front price. Such projects seem to hold out the promise of freedom from red tape. Vendors argue, with some justification, that they are able to bring people into the project who are more skilled in current technologies than are those in the IT department.
Users' Desire to Control Their Own Destiny The idea of regaining control over a part of their business operations, particularly if IT has become mission-critical, greatly appeals to business users. Control in this context has at least two dimensions.
First, users can exercise direct control over systems development priorities. By using either their own staff or software and services companies they select, users hope to obtain a system with vastly improved features in less time than it would take to navigate the priority-setting process in the corporate IT department. Additionally, development and deployment errors made by a user-managed group are sometimes easier to excuse than those made by a distant, centralized group. As a result, project difficulties may be more openly discussed, which can facilitate experimentation and learning during development.
Second, as business conditions change, business users often wish to control systems maintenance priorities. At the time of installation, users may not have weighed the im- portance of ongoing systems maintenance sufficiently. When they discover how re- lentlessly business changes drive system change requests, users become less willing to place their maintenance request in the queue with those of other business groups. If managers are being evaluated by how well their business units perform, the desire to have more complete control over change priorities is not altogether unreasonable.
Fit with the Organization As companies become more global and their operations become more geographically dispersed, users sometimes feel compelled to control systems development and deploy- ment. Their local concerns increasingly diverge from corporate IT initiatives. ~ h i l a r l ~ , when divisions adopt highly specialized business models that differ from those of other divisions, choices made by corporate IT staffs seem less consistent with the needs of the division. For example, a division of a pharmaceuticals firm focused on cost leadership in commodity products (such as IV fluid bags or other hospital supplies) will take a dif- ferent approach to IT than will a division with a more traditional research and develop- ment (R&D)-intensive, high-margin business model. If corporate IT is driven by high- margin assumptions, inherent priorities may be poorly suited to a more cost-conscious division. Decentralized IT activities may then gain appeal. Decentralized development,

240 Module Four Managing and Leading o Networked IT Organization
deployment, and management avoid the high levels of coordination effort required to keep centralized IT departments attuned to local needs. Finally, if a company tlecides to divest a unit, the process will be easier if lIT activities are not completely integrated with the rest of the company.
Together, these five drivers represent a powerful argument for a strong user role in systems development and suggest when that role might be dominant. Although benefits sometimes can be achieved, as the earlier examples demonstrated, when business users control development, deployment, and management of IT resources, there also may be a tlownside. As one might expect, the downside of a decentralized IT structure alternative supports the argument for centralized control of IT projects and resources, to which we now turn our discussion.
Drivers toward a Centralized IT Structure
A number of pressures encourage firms to consolidate IT development resources into a more centralized unit. These pressures can be grouped into the following categories.
Staff Professionalism Maintaining a cenkil IT department evhances an organization's ability to recruit and retain specialized technical personnel by providing more obvious career paths for tal- ented IT employees. In addition, it is easier to keep centralized staff up to date on the latest technologies and develop the necessary skill sets. Moreover, an IT department serves as the focus of deliberate efforts to maintain certain areas of technical compe- tence or expertise. The employees of a centralized IT group have fewer concerns, there- fore, about losing pace with the advance of technology or getting lost in the organiza- tion when it comes to career development. The inability of some firms to manage the . personal development of the IT staff is a key driver for outsourcing IT activities.
Standard Setting and Ensuring System Maintainability Many organizations experience periodic swings of the centralize/decentralize pen- dulum because over time the benefits of change often give way to new problems. As we have seen, standardized computing infrastructure pays dividends by reducing the complexity and cost of maintaining a firm's IT capabilities. When IT resources are centrally concentrated, developing and enforcing standards in infrastructure and in IT management pralctice are easier. Indeed, if IT resources are not centralized but re- port directly to business user organizations, setting companywide standards almost always takes a backseat to short-term business concerns. Inefficiency in maintain- ing the IT infrastructure is the cumulative long-term effect of consistently sacrific- ing standards in favor of short-term concerns. Ironically, inefficiency is a major rea- son why IT resources are sometimes not available to address short-term business needs. Conversely, centralized IT management activities can increase efficiency dramatically. For example, a recent study at a manufacturing firm showed that cen- tralizing control of its $16 million investment in networked personal computers yielded maintenance cost savings of 40 percent.

Chapter 8 Organizing and Leading the ITFunction 241
In 1988, a large chemical company faced deteriorating relationships between its central IT department and key business user constituencies. When the situation grew chronic, company managers responded by redistributing 80 percent of IT develop- ment staff to four divisions, changing both reporting responsibilities and physical lo- cations. Although the change stimulated new ideas and better relationships with users, by 1993 the need for standards to control the costs associated with proliferat- ing user-driven systems development became so intense that the company instituted significantly tighter standards and management practices. In 1997 company man- agers outsourced the crash development of Intranets and Extranets. The basic de- centralized structure, however, was still in place in mid-2001.
Central staff expertise is particularly important for reviewing user-designed sys- tems before they go live. Lacking practical systems design experience, users often ignore data management and security policies, corporate standards, and costing practices that incorporate the full cost of running an application. The managers at a large financial firm learned this lesson the hard way when they discovered that all the user employees who had developed an essential system had left the company without creating any documentation or operating instructions. Even worse, the sys- tem had not been subjected to any version control, and the source code was nowhere to be found. All that remained were machine-readable object programs. The system ran, but no one knew exactly what it was doing, and the managers could not change the system.
Envisioning Possibilities and Determining Feasibility Not surprisingly, most business users are not adept at envisioning the possibilities in- herent in new technologies or expert in judging the feasibility of technical applica- tions. Users often focus on obtaining a specific service to address an immediate need without recognizing the fact that successful first applications tend to generate unan- ticipated second applications (and then third applications, etc.). Their limited experi- ence with IT makes it difficult for business users to see the full implications of the ap- plication of a technology; an example is planning that fails to account for possible growth or future expansion of applications. This problem caused some users to see the Web at first as merely a better way to manage documentation. Inability to envision what a system may someday become and to make choices consistent with those pos- sibilities can make future expansion expensive or even infeasible.
User-driven feasibility studies may contain major technical mistakes. Typical consequences include a system that does not handle growing processing require- ments or is not cost-effective in operation. Users are often inclined to acquire prod- ucts with attractive visible features from unstable vendors. Indeed, users may be un- able to see the technological drawbacks of an IT product that may predispose its vendor to fail. Accurate assessment of vendor stability is critical because many sys- tems eventually insinuate themselves into the heart of a company's operations. In many cases, extracting unsupported systems from a company's infrastructure is ex- pensive and exceedingly difficult, as is converting applications to new systems and platforms. A single experience with a failed vendor can be a painful learning process.

242 Module Four Managing and Leading a Networked IT Organization
Corporate Data Management As we have seen in earlier chapters, the Internetworking capabilities of today's cor- porations make it possible to synchronize databases across an enterprise. A modern data management strategy requires central coordination of physically distributed databases so that users, regardless of their physical location, can access data files as needed. A central IT staff provides a focal point for conceptualizing and dcveloping the architecture of these systems.
The need for data sharing varies widely with the nature of a company's activities. A conglomerate uslially has much less need for data sharing across the firm than does a functionally organized, one-product company. Most firms, however, need companywide, fully interoperable e-mail, videoconferencing, video streaming, and financial systems, to name only a few. All these applications employ datahase com- ponents. Increasingly, enterprisewide rnteroperability and data exchange are a part of new IT projects. Only a central IT department can cost-effectively develop and distribute such systems to users or coordinate distributed development pr~~jects in a way that assures interoperability.
Whenever the subject of decentralized development within individual business units is broached, a competent IT manager's first concern is that the company may lose its ability to rrianage and control data flows between disparate applications. The narrow perspective of development driven by the short-term problems of a particular business unit may produce data definitions, structures, and systems that lock up data in a nonstandardized format and in inaccessible locations so that they cannot be used enterprisewide. Modern data management and communication standards make it easier to avoid such outcomes. In fact, effective data manage- ment policies and standards make it possible for a company to achieve the best of both organizational worlds: responsive decentralized development and products that interoperate through centralized data management hubs. Databases con- structed to be consistent with corporate data standards can exchange data period- ically or, in some cases, continuously with physically distant databases, keeping the company's data in sync.
In recent years, finding ways to keep data secure has been a growing concern. Se- curity issues are best addressed through centralized control. And security standards are more easily achieved with centrally organized electronic files. In a world of in- creasingly clever hackers, a company needs to be sure its data are secure and cer- tainly needs to know where all data stores are located. Indeed, some data are so sen- sitive that they are best kept off the network entirely.
Cost Estimation and Analysis Because it has practical experience in a broad range of systems efforts, a centralized IT group usually has a better chance of producing realistic systems development and deployment estimates than do decentralized user-based groups. This is not always the case; estimation is often difficult a.nd poorly done even in the best conditions. In- experienced estim;itors tend to be too optimistic. Additionally, during the project

Chapter 8 Organizing and Leading the ITFunction 243
changes, they approve insufficient accounts of possible complications that add over- head time and cost to the project.
. Users seldom understand the true costs of operating the existing services. In many companies, complicated charge-back schemes for allocating the centralized costs of IT services and facilities back to business user departments add to the con- fusion about costs. Many charge-back niethods are historical remnants of frame- works convenient for cos~accountants. Often they present measurements of com- puter resource use that are unfathomable to the busines's user; for example, each month an unintelligible bill arrives with an unpredictable amount due. In manage- ment control environments, where the business user is responsible for variance from budgets, the unpredictability of the true costs causes frustration. In comparison, a locally developed system exhibits understandable and predictable costs. Because corporate charge-back systems are designed to allocate all centralized costs and be- cause overhead allocation methods are often problematical, charges often appear un- fairly distributed and sometimes very high to business users. Disproportionately high allocations provide some business users with strong but corporately subopti- mal incentives for local development.
In the short run much of a company's IT cost is fixed, but it appears to the in- dividual user, because of the charge-back system, as if it were a variable cost that could be reduced. This representation, especially for overhead allocation, is not accurate and sometimes encourages individual user cost reductions that actually generate cost increases for the company as a whole. Cost analysis and manage- ment, using an activity-based computing utility framework, is the only way to as- sure that local decision making is consistent with overall company objectives. This kind of cost management is best mounted from within a centralized IT group ori- ented toward corporate rather than local objectives.
Long-term perspectives and methodical deployment of architectural ideals char- acterize pressures toward centralized IT control. The benefits of central control are long-term cost avoidance and technological risk reduction. The downside of this ap- proach, however, is lack of short-term responsiveness to local business issues and problems. In this age of Internetworking, stand-alone systems and business units tend to become part of a centralized network. Thus, the tensions involved in man- aging IT development and deployment are fully in play. Policies for managing the trade-offs between the obvious short-term benefits and the long-term risks are nec- essary but delicate to administer.
Coordination and Location of IT Policy
The tension between IT staff and business users can be managed by establishing clear policies that specify the user domain, the IT domain, and senior management's role. Senior management must play a'significant role in ensuring that these policies are developed and evolve appropriately over time. Both IT staff and users must un- derstand the implications of their roles and the conflicts that may arise as they work together. . .

,244 Module Four Managing and Leading a Nehvorked IT Organizarion
IT Responsibilities The following tasks constitute the central core of IT responsibilities-the minimum for managing the long-term IT needs o:F an organization.
1. Develop and manage the long-term, architectural plan and ensure that new proj- ects fit within the plan. Periodically review and revise the plan and be sure IT stakeholders agree about the objectives and details of the plan. In today's world of enterprise systems and real-time Internetworking, stakeholder agreement and backing are critical.
2. Develop a process to establish, maintain, and evolve company standards in the following areas:
Telecommunication protocols and platforms
Client devices and client software configurations
Server devices, middleware, and. database management systems
Programming and configuration languages
Documentation procedures and formats
Data definitions, especially for data elements used throughout the company
Storage redu~idancy, backup, and disaster recovery proc.edures
Information security policy and incident response procedures
This process and the resulting standards must accommodate innovation by business users, experimentation that can lead to important learning, and real dif- ferences in the business requirements of particular business units.
3. Establish procedures that consider outsourcing options when new IT projects are proposed. Ensure that outsourced or user-executed projects adhere closely to corporate standards, are consistent with overall corporate objectives, and take into account interfaces to corporate systems.
4. Maintain an inventory of installed and planned systems and services. To the degree possible, periodically reexamine the total benefits and costs of operating and main- taining these systems and services for consistency with business objectives.
5. Identify career paths for IT staff. Include lateral transfers within and between IT units, upward movement within the IT organization, and outward movement from IT to other functional units. When [T activities are decentralized, this task takes on special importance because career paths for IT personnel may not seem obvious.
6. Establish internal marketing efforts that help business users understand the challenges of IT support and the hidden costs of maintaining IT systems. En- cour?ge-bTsiness units to modernize when their systems become expensive to run'because ofige. Also encourage business units that are pushing too fast into
I le6ding-edgg)echnologies to slow down or at least take account of th.eir full ex- p & ~ . h s k r and costs.

Chapter 8 Organizing and Leading the ITFunction 245
7. Incorporate, as a standard part of the request for proposal (RFP) process when acquiring new hardware or software, a detailed checklist that includes questions about compatibility with existing architecture and standards. For example:
Is the proposed new hardware or software technology consistent with corpo- rate standards? If not, where are the points of departure? Do they have seri- ous consequences?
Will the new technology support future growth and does it support informa- tion exchange within the company's evolving real-time infrastructure?
Is the new technology maintainable over the long term?
8. Identify and maintain relationships with preferred systems suppliers. In enter- ing a relationship with a vendor, be sure that the client company's standards en- forcement efforts have a basis in the contract with the vendor and that vendor pricing and planning take into account the need to comply with standards.
9. Establish education programs for business users that introduce the benefits and pitfalls of new technologies. Define users' roles in ensuring the successful in- troduction of new technology in their departments.
10. Set up a process for ongoing review of legacy systems to determine when they should be redesigned andlor replaced.
The tasks for which IT is responsible are particularly important for systems that will become deeply embedded in a company's day-to-day operations. For less operationally critical systems, IT managers can afford more flexibility with respect to standards and responsibilities, although the increasingly integrated nature of infrastructure imposes additional demands even on systems traditionally considered less rnission-critical.
If a company's situation warrants it, these core responsibilities can be expanded significantly to impose much tighter and more formal controls. As we have seen, though, because of the uncertain implications of new technology and the resulting difficulty in fully foreseeing impacts, users must apply standards and responsibili- ties intelligently. A company (or a division or smaller organizational group) might reasonably choose to depart from standards as it tries a new technology. Because standards and responsibilities are not ends in themselves, they should be reviewed frequently. The tendency in IT is to weigh long-term issues more heavily than short- term business needs. Often this is reasonable, but in some cases, if short-term needs are not addressed adequately, there may not be long-term benefits. IT managers therefore must remain flexible as they carry out their duties.
User Responsibilities To identify IT opportunities, implement new IT services, and understand the uses, costs, and impacts of IT on an organization, business users should take on the fol- lowing responsibilities:
1. Seek to understand the scope of all IT activities supporting business users. As much as possible, figure out the IT charge-back system and pressure the IT department to

246 Module Four Managing and Leading a Networked IT Organization
establish an activity-based overhead allocation system that users can understand and use in decision making.
2. Develop realistic estimates of the amount of user personnel investment required for new projects both during development/deployment and in ongoing operation and use. Businesls users have a tendency to underestimate or even ignore new project costs of this type.
3. Ensure comprehe~lsive user input for all IT projects that support vital aspects of the unit's operations. 'Take a strong interest in how the service will operate, how it will be introduced, and the level of user training required for both staff and managers.
4. Ensure that the nature of staffing interfaces is consistent with a new technology's strategic relevance to a business unit. If a new technology project is very impor- tant, the staffing interface must be close, customized, and based on personal re- lationships. If the new project is not strategically important, staffing interfaces can be more arm's-length and standardized.
5. Periodically audit system reliability standards, communications services per- formance, and security procedures.
6. Participate in developing and maintaining IT plans that set new technology pri- orities, schedule the transfer of IT among groups, and evaluate projects in light of the company t overall strategy.
These responsibilities represent the minimum advisable level of user involvement in a company's IT activities. Depending on a firm's geography, corporate manage- ment style, degree of reliance on IT capabilities, stage of IT evolution, mix of tech- nologies, and a vanety of other factors, more extensive levels of user involvement may be appropriate. In general, more user involvement is preferable to less. Many companies have come to associate the assignment of full-time user staff f o IT proj- ects with expectatic~ns of project success.
General I . Management Support and Policy Overview In most companies there is a cluster of IT policy and directional activities that re- quire a senior management perspective. In the past these activities were carried out within a central IT organization. Today, because IT has become so critical a part of strategy and day-to-day operational capabilities for so many companies, these ac- tivities are carried out at a higher level, in the context of a broader business discus- sion. In many companies, then, long-range IT planning activities are separated from day-to-day operational activities. Increasingly, the long-range discussions involve senior general managers supported by talented technology specialists.
A chemical conipany, for example, reorganized in 1990 to establish a 500-per- son systems and operations department reporting directly to the head of adminis- trative services. This department oversees the company's implementation and op- erational IT work on a month-to-month, year-to-year basis. At the same time, a 25- to 30-person IT policy group, which reports directly to the head of research, works

Chapter 8 Organizing and Leading the IT Function 247
on overall IT policy and long-range IT strategy for the firm. Similarly, a major con- glomerate whose development staff and hardware are distributed in business units still maintains a small but important policy-oriented group at the headquarters level. Even firms that outsource most or all of their IT development and operations need such a policy group to facilitate senior management involvement in vital IT strategy issues.
The key responsibilities of a corporate IT policy group include the following:
1. Ensure an appropriate balance between IT and business users to prevent one group's perspective from dominating. Transfer personnel, reorganize, or create new organizational bodies to keep tensions in balance. For example, an executive steering committee might provide more user input and thus might rectify a situ- ation where the balance had tipped too far toward IT control.
2. Make sure the company has a comprehensive corporate IT strategy. Base the strategy on an overview of technology trends, assessment of the company's cur- rent IT capabilities, and the potential of IT initiatives to support overall corporate goals: Such a strategy is particularly important in companies with decentralized IT resources.
3. Manage the inventory of hardware and software systems and services and assure that a corporate orientation extends to purchasing relationships and contracts. In most companies a corporate group is the appropriate place to identify and man- age standard policies for relationships with vendors.
4. Establish standards for acquisition, development, and IT systems operation. En- sure that the standards are applied appropriately. With standards adherence, cor- porate policy groups sometimes play a combined role as consultant and auditoi. Hence, a corporate policy group needs to have a technically competent and in- terpersonally sensitive staff. , .
I / ' ,,,*
5. Facilitate the transfer of technology from one unit to another. Successful corpo- rate policy groups will develop a, knack for spotting synergistic technology and system opportunities. The tools the policy group can use to facilitate technology transfer include staff visits across business units, periodic corporate conferences on IT themes, and other communication means, such as newsletters and streamed audio or video programs. .
6. Actively encourage technical experimentation. A limited program of research is a very appropriate part of the IT function. An important role of the corporate pol- icy group is to ensure that research and scanning for new technology opportuni- ties do not get swept aside by urgent operational issues. Further, a corporate pol- icy group is in a position to encourage and coordinate patterns of experimentation that smaller units might consider too risky without corporate support.
7. Develop an appropriate planning and control system to link IT to a company's goals. The policy group should monitor planning, system appraisal, charge-back, and project management processes.


Chapter 8*r~rganizing and Leading the IT Function 249
cording to IT priorities and the aging platform might be retired. In the company in question, IT successfully lobbied senior management for a larger portion of budget allocation in one year, which it used to retire the obsolete platform. Senior managers, by controlling the portions of budget under the control of these two constituencies- IT and users--can seek a balance of control that is best for the company as a whole.
Summary This chapter focused on key issues surrounding the organization and leadership of IT activities over the next decade. What is considered good managerial practice in this field is undergoing a revolution. Changes in recommended management prac- tice are driven by new technologies and possibilities and by the accumulation of management experience with IT. As we have seen, new technologies have the po- tential for different types of services that will be delivered in a wide variety of ways. The revolution seems likely to continue. Organizational structures put in place in the 1970s were found wanting in the 1990s. Those that worked well in the early 1990s show signs of serious strain as we embrace an Internetworked early 21st century.
Determining the appropriate distribution of IT resources within an organization is a complex task. The way a general manager manages the tensions involved de- pends a great deal on many non-IT aspects of the corporate environment. The lead- ership style of the person at the top of a company, especially that person's view of the company's future, provides important guidance. A management vision ideal of strong central control presents a different context for IT organization, resource allo- cation, and prioritization of decisions than does a vision emphasizing the autonomy of business units. Corporate organizational structure and culture matter, as does the geographic dispersion of business units. The corporate headquarters of a large do- mestic insurance company imposes a different decision context than do the world- wide plants and sales companies of an international automobile manufacturer.
The quality and location of existing IT resources are the basis for future change. According to business users, how responsive and competent are existing IT re- sources? If the answer to this question is "not very," some adjustments may be needed whether or not the complaint is fair or accurate. Similarly, the existing and perceived appropriate roles of IT on the strategic grid dimensions have important or- ganizational implications. If a firm is in the "support" quadrant, for example, the IT policy unit must be placed lower in the organization's hierarchy to deal with its per- ceived lack of urgent relevance to corporate strategy.
In dealing with these forces, managers must seek an appropriate balance between innovation and control and between the perspectives of IT specialists and those of business users. There are questions that can be asked, but there are no right answers to them. An identifiable but very complex series of forces, if well analyzed, will de- termine for each organization the direction in which the correct answer lies-for now, anyway. Executives can answer the following questions to assess whether they are adequately addressing issues of leadership and organization of IT activities:
1. What is the appropriate balance of emphasis between innovation and control in your organization? Do your IT budgets and organizational structures fit well with that balance? /

250 Module Four Managing and Leading a Networked IT Organization
2. To what degree is the success of your company's business driven by factors local to geographies or business units? Conversely, to what extent is success driven by common factors across geographies and business units? Does the degree of cen- tralization/decentralization of your IT activities fit well with the nature of your business? I
I
3. Have the IT staff or business user perspectives become too dominant in the or- ganization? Is senior management engaged in maintaining an appropriate balance of power between these two perspectives?
4. Are there standards and processes in place to assure efficient data interchange be- tween different business units regardless of the degree of centralization or de- centralization of [T resources now or in the future?
5. Does your company have a central [T policy group? Is it successful in enlisting senior managers in IT policy discussions?

Managing IT
Increasingly, companies are outsourcing all or significant parts of their management of information technology (IT). The reasons include concern for cost and quality, lagging IT performance, supplier pressure, access to special technical and applica- tion skills, and other financial factors. From a relatively unusual entrepreneurial ac- tivity in the past, IT outsourcing has in the last five years exploded across the global corporate landscape. Xerox, United Technologies, Commonwealth Bank (Aus- tralia), Nortel, and Nedcor are just a few megaalliances. Like marriages, however, outsourcing arrangements are much easier to enter than to sustain or dissolve. The special economic technology issues surrounding outsourcing agreements necessar- ily make them more complex and fluid than an ordinary contract. For outsourcing to be successful, both parties must make a sustained effort to work together. Indeed, in the long term the management of a strategic alliance is the dominant challenge of effective IT outsourcing.
In this chapter we identify the characteristics of situations where outsourcing major portions of a firm's IT activities or infrastructure makes sense and discuss how to struc- ture and manage the resulting alliance. Moreover, we provide a concrete framework to help senior managers think about IT outsourcing. Although many aspects of the frame- work are relevant to incremental outsourcing, as was discussed in Chapter 7, we con- centrate here on programs that 'involve major, long-term alliances between customer and vendor firms. Major outsourcing programs typically involve larger investments, higher stakes, and greater overall management complexity than does'incremental out- sourcing. Usually they are born of strategic rather than operational motivations, and their impacts on outsourcing customers are much broader. However, the two approaches are complementary and ofien are used together. Ultimately, the distinction between
h his chapter is adapted from F. Warren McFarlan and Richard L. Nolan, "How to Manage an IT Outsourcing Alliance," Sloan Management Review 36, no. 2 (Winter 1995).

252 Module Four Managing and Leading 11 Networked IT Organization
major programs and incremental outsourcing may blur, but in today's business settings, the unique challenges posed by strategic alliance-based programs consitute a subject deserving of its own discussion.
Why Outsourcing Alliances Are So Difficult
Many major outsourcing contracts are structured to expand over long periods of time. However, these agreements exist in a world of fast-moving technical and busi- ness change. Eight to 10 years is the normal length of a contract in an environment in which computer chip performance is improving by 20 to 30 percent per year. The standard contract length addresses the customer's difficulties in switching vendors as well as economic: issues. But a deal that made sense at the beginning of the con- tract may not make economic sense three years later and may require adjustments to function effectively.
The timing of benefits to the customer and the vendor exacerbates the situation. Benefits in the first year are clear to the customer, who often receives a one-time capital payment in exchange for assets that are being transferred to the vendor. Hav- ing been paid and having shifted problems and issues to the vendor, the customer firm may feel relie1 ed. Moreover, the tangible payments in the first year occur in an environment where the outputs most closely resemble those anticipated in the con- tract. In each subsequent year, however, the contract payment stream becomes less and less tied to the initial set of planned outputs (as the world changes) and thus more subject to negotiation and posstble misunderstanding between the customer and the vendor.
From the outsourcing vendor's perspective, the situation is the reverse. The first year may require a heavy capital payment followed by the extraordinary costs of tak- ing on responsibility for the customer's IT operations and executing agreed-upon cost reduction and quality control initiatives. All this is completed in anticipation of a back-loaded profit flow. At precisely the time the vendor is finally moving into its planned profit stream, the customer, perhaps feeling the need for new services, is chafing under the rnonthly charges and anxious to move to new IT archilectures. If the customer is not experienced in partnering activities, profound tensions may de- velop in the relationship.
A further complication is the fact that only a few outsourcing vendors have the critical mass and access to capital markets to undertake large contracts. Electronic Data Systems (EDS), Computer Sciences Corporation (CSC), and IBM constitute the bulk of the current market. A much larger group of firms, such as Lock.heed Mar- tin, Perot Systems, Cap Gemini, and a whole group of application service providers (ASPs), specialize in certain niches in the outsourcing market. ASPs provlde special industry skills, small contracts, or specific subfunctions such as network operations. If an alliance is not working, a customer company's options for resolving the situa- tion are limited, pa~ticularly because outsourcing is relatively easy but insourcing is very difficult. The most common situation is typified by a major international pack- aging company that was forced on short notice to transfer its relationship to another

Chapter 9 ana aging IT 0utso;rcing 253
outsourcing vendor when the original arrangement no longer fit the strategy of that outsourcing vendor.
Finally, the evolution of technologies often changes the strategic relevance of IT to a firm. From the customer's viewpoint, assigning a commodity service to an out- sider is very attractive if the price is right. But delegating a firm's service differen- tiator is another matter (this, however, is increasingly being done, as will be de- scribed later).
Outsourcing: in Retrospect
Outsourcing IT has been used by organizations for a long time. In the mid-1960s, for example, computer services bureaus ran a variety of programs whose applica- tions focused heavily on the financial and operations support areas (general ledger, payroll, inventory control, and so on). The programs were both customized and gen- eral-purpose, and the individual firm had to accommodate its operations to the stan- dard options in the package. Service bureau customers were mostly small and medium-size firms, although some large firms used them for specialized needs or highly confidential items such as executive payroll.
ADP is a good example of a provider in the outsourcing industry. In 1949 ADP began as a small punch card payroll company. By 2001 it had grown into a $7 bil- lion organization that specialized in large-volume, standard transaction-type activi- ties such as payroll and handling proxy solicitations (almost 100 percent of the in- dustry). Other categories include software contracting companies such as Accenture in the private sector and CSC in the public sector. These firms developed large turnkey applications for organizations that required either a large or a specialized staff, either of which the organization deemed inconvenient, imprudent, or impossi- ble to retain. EDS, in the state and local government sector, provided full outsourc- ing for organizations whose cultures and salary scales made it impossible to attract people with the necessary skills in a competitive job market.
Despite these examples, before 1990 the general trend was in-house development of IT. At that time, the major drivers for outsourcing were primarily
cost-effective access to specialized or occasionally needed computing power or systems development skills. .
Avoidance of building in-house IT skills, primarily an issue for small and very low-technology organizations.
Access to special functional capabilities. Outsourcing during this period was im- portant but in retrospect largely peripheral to the main IT activities that took place in midsize and large organizations.
In 1990, Kodak's decision to outsource IT was the seminal event that legitimized the idea of allowing a vendor to provide major components of IT services. Kodak's chief information officer (CIO), who had been a general manager rather than a computer pro- fessional, took an aggressive position in outsourcing mainframes, telecommunications,

254 Module Four Managing and Leading o Networked IT Organization
and personal computer (PC) maintenance and service. Until then, outsourcing for mid- size to large companies had been mostly a sideshow, and outsourcing generally was re- served for small and medium-size companies with problematic, grossly mismanaged informations systems (IS) departments.
Outsourcing in the 2 1st Century
As we enter the 21~1: century, it has become abundantly cleai that'IT outsourcing is not 'a transitory management fad. IT outsourcing, a harbinger o'f traditional IT de- partment transformation, provides a glimpse at the emerging organizational struc- tures of the networked economy. By 1995, more than half of midsize to large firms had outsourced or were considering outsourcing significant IT activities. And this phenomenon is not limited to the United States. Novartis (Switzerland), British Aerospace (the United Kingdom), and the AMP Insurance Company in Australia, for example, have all outsourced substantial parts of their IT a~tivi t ies .~
Two factors affect the growth of IT outsourcing: acceptance of strategic alliances and changes inthe technological environment.
Acceptance of Strategic Alliances The value of strategic alliances is widely recognized, and interrelated forces moti- vate their creation. On one level, finding a strong partner to complement an area of weakness gives an organization an island of stability in a turbulent world. Alliances allow a company to simplify its management agenda safely and gain access to higher-quality resources. On another level, alliances allow a firm to leverage a key --- --, part of its value chain by bringing in a strong partner that comple ents its skills.
t' Such a partner may create an opportunity to innovat: synergisticall. 7 , with the two companies working together so that the whole becom&s-greater# the sum of the
I parts. Also, early and successful experiences with alliances increase a firm's confi- dence in undertaking new alliances in other parts of the value chain as a profitable way to do business. The early experience provides insight into ways to increase the likelihood of a successful alliance.
For an alliance to be successful and eiidure for the long term, both firms must be- lieve they are winners because they benefit from the synergistic potential of the re- lationship and the opportunity to specialize. As we suggested in Chapter 7, a vendor that concludes that a deal has become a loser will, reasonably enough, divert re- sources to other, more promising opportunities. The mutually beneficial economics of a successful alliance therefore must outlast the careers of the participants who put the deal together.
IT'S Changing Environment As we have observed throughout this book, today's firms are not limiting IT only to internal transaction processing systems. Instead, they are integrating internal sys-
' ~ c ~ a r l a n and Nolarr, op. cit.

Chapter 9 Managing IT Outsourcing 255
TABLE 9.1 IT Markets
Location Physical Aspects Information
lnt~rnal ~"toma&ng: &mp"terizing phyiical bfoim~ting~~eveVagincj knodedgd Q'i 1 and clerical processes *workers with computers
+i" " B. '91, a n 3 8 ;it i- u , *- I) I _
Data Processing (DP) era (1960-1980) ~ e t w d r k i n ~ era (1990-2) I I
Dominant use of mainframes and Userftasks leveraged through direct minicomputers use of microcomputers enabled by Operational-level systems automated ., graphical user interfaces (GUI) and primarily with COBOL purchased software such as word
,:,a erocesssontrols automated pgimarily 4%
processing, spreadsheet, graphics, and Zith machin"i!anguage . computer-aided design and ~ t a n d ~ r d pa$kages for payroll and manufacturing ,*
if x", * generdl tb ledger 8; ' . . "2 LO&I areb"iietw6rks (~~~s) -user i * Applications po-hfolio consists,of oriented software for e-mail, database
21 "3- 0% "&jillio6; of liiies odkode$with350%"3 8- sharing, file transfer, and groupware " typically purchased from outside for work teams *
I% -$ .$ :? $ $ . 3 :*.a "9 ~icrocomputer~software consists of . millions of lines of code, almost 100%
i , 1 * a . purshase~,from, ~ther~companies ! External Embedding: Integrating com "The Information Highway"
, products and services. P w
Micro era (1980-1 995) Network era (1990-?) :* * " a* '1.
~~ecial ized code embedded in . Wide area networks (WANs) I networkipg workers, suppliers, and I ~rodu$s and services t~~pnhaqce
function -' :" cirstdmers 1 Microcomputers in physjcal products 0 . Internet for commercial use
8 ,% ,- Obch a~'autohobil"e ande'"smeFZ ' 5." "a' Millions of linesof code, almost " cards" in seryices 100% purchased from and
b~ qn2 ' ** $hou<ands o f line5,of coae developed * < maintained byeoutside @r by both specialized internal software firms
, , programmer,^ andJkoutside coqJract7,~ -5. S: 44
programmers I
tems with those of their customers and suppliers and in the process changing their organizational structure to compete efficiently in the global marketplace. As we also have seen, this integration places extraordinary pressures on firms trying to keep the old services running while developing the interconnections and services demanded by the new environment. Thus, outsourcing has become a viable way for firms to ac- cess appropriate skills and speed fhe trangition reliably and cost-effectively.
In fact, as shown in Table 9.1, the development of most of the code that compa- nies now use is already outsourced. A distinct minority of the code in operating sys- tems, e-mail systems, word processing packages, and spreadsheet software actually

256 Module Four Managing and Leading a Networked IT Organization
has been developed within the firm (with a much smaller percentage expected in the future). This trend, which occurred for obvious reasons of economies of scale and scarcity of competent staff, will contirme. Currently, Computer Associates, IBM, Microsoft, and a few enterprise software vendors are the de facto software providers to most companies. I'he internal IT organization is already a selector and integrator of code rather than a developer.
In addition, many organizations see outsourcing as a means to transfonn legacy applications so that they interact effectively as part of real-time Internetworking in- frastructure. Compa~iies look to vendors for low-cost maintenance of the old sys- tems to ensure that they operate reliably as well as for access to the new skills that permit their transformation to the new model. Some companies outsource the oper- ation of old systems and use internal staff to develop new IT capabilities; others do the opposite. This shift toward outsourc:ing as a major source of new capabilities is as significant today ;IS the move from tabulating equipment was 40 years ago.
What Drives Outsourcing?
Despite the mix of factors that sugges1.s outsourcing varies widely from one com- pany to another, a series of themes in the aggregate explains most of the l~ressures to outsource.
General Managers' Concerns about Costs and Quality The same questions about IT costs and responsiveness come up repeatedly when managers consider outsok-cing: Can we get our existing services for a reduced price at acceptable quality standards? Can we get new systems developed faster? An out- sourcing vendor can save money for a customer in several ways:
Tighter overhead cost control of fringe benefits. On balance, outsourcing vendors run much leaner overhead structures than do many of their customers.
More aggressive use of low-cost labor pools by using geography creatively. Fre- quently, the outsourcing vendor moves data centers and gives portions i:)f the de- velopment activity to low-cost areas such as India and Northern Ireland (modern telecommunications make this possible).
Tough world-class standards applied to the company's existing staff, all of whom have to requalify for appointment at the time of outsourcing. Maintaining high standards keeps employees from losing their skills in leading-edge IT practices.
More effective bulk purchasing and leasing arrangements for all aspects of the hardwarelsoftware configuration through discounts and better use of capacity.
Better management of excess hardware capacity. By combining many firms' work in the same operations center, an outsourcing vendor actually can use less hardware. One small firm's online operations (a $27 million, 10-year contract) were transferred to a larger data center at no extra cost to the outsourcing vendor. Capacity was simply better used.

Chapter 9 Managing IT Outsourcing 257
Better control over software licenses through both negotiation and realistic examination.
More aggressive management of service and response time to meet, but not wildly exceed, corporate standards. Tighter control over inventories.
, Hustle. Outsourcing vendors are professionals. Outsourcing is their only busi- ness, and their success is measured by satisfied customers who recommend them to others, bottom-line profitability, and stock market performance.
The ability to run with a leaner management structure because of increased com- petence and critical-mass volumes of work.
The ability to access higher levels of IT staff skills, IT application skills (such as SAP, Oracle, and People Soft), or special customer industry skills.
Creative and more realistic structuring of leases.
While the cumulative impact of these savings can be significant, there are a few caveats. Unless several knowledgeable bidders closely analyze an existing operation be- fore proposing an alliance, the true picture will not be revealed. An IT efficiency study funded by the IT department and performed by a consulting company hoping to get fu- ture business is self-serving and inadequate. Equally important is assessing whether the outsourcing vendor can mobilize its staff rapidly for quick-response development jobs when a customer needs to get products and services to market much faster.
Breakdown in IT Performance Failure to meet service standards forces general management to find other ways to achieve reliability. As we reflect on the last 30 years of computer growth in most companies, it is not unusual to find a.company in which cumulative IT management neglect eventually culminated in an out-of-control situation. For example, Massa- chusetts Blue Cross and Blue Shield's decision to outsource to EDS was triggered by the failure of three major systems development projects (and losses in the tens of millions of dollars). It saw outsourcing as a way to fix a broken department. Simi- larly, a midsize bank's interest in outsourcing came after a one-day total collapse of its automated teller machine (ATM) network. Faulty software patches, which had been designed internally, caused the failure.
An additional driving factor toward outsourcing is the need for companies to rap- idly retool backward IT structures in order to remain competitive. In one firm gen- eral managers thought the internal IT culture was both frozen and backward; it needed to leap forward in performance. The general managers, who lacked both the time and the inclination to undertake the task personally, found outsourcing a good choice for making a rapid transition.
Intense Vendor Pressures Kodak's decision tb outsource its data center and telecommunications to IBM, DEC, and Businessland was, as we have noted, a flash point. Suddenly many

\
258 Module Four Managing and Leading a Networked IT Organization
general managers saw outsourcing as a highly viable, if often misunderstood, alter- native. At the same time, IBM was lookling for new value-added services to reach its customer base and compensate for declining hardware margins and sales. It moved aggressively into the field with an expanded and highly energetic sales force. EDS, the largest independent firm in the field, uied its General Motors operations center to demonstrate its expertise. CSC, whlch was strong in the federal sector, built a bridge to the commercial sector with its General Dynamics contract. The visibility of these and other arrangements, combined with the vendors' aggressive sales forces, enabled vendors to approach general managers with compelling reasons to outsource. Today numerous large and small vendors serve the industry.
Simplified General Management Agenda A firm under intense cost or competitive pressures which does not see IT as its core competence may find outsourcing a way to delegate time-consuming, messy prob- lems. The firm then can focus its energy on other competitive differentiators. If man- agers perceive the outsourcing vendor as competent and are able to transfer a non- core function to reliable hands, they will not hesitate to choose outsourcing. These IT activities must perform reasonably well, but the firm's long-term competitive dif- ferentiation does not come from these activities.
Financial Factors Several financial issues make outsourcing appealing. One is the opportunity to liq- uidate the firm's intangible IT asset and thus strengthen the balance sheet and avoid a future stream of sporadic capital investments. An important part of many arrange- ments has been the significant up-front capital paid by the outsourcing vendor to the customer for both the real value of the: hardwarelsoftware assets and the intangible value of its IT systems. General Dynamics, for example, received $200 million for its IT asset.
Outsourcing can turn a largely fixed-cost business into one with variable costs. This change is particularly important for firms whose activities vary widely in vol- ume from year to year or which face significant downsizing. The outsourcing ven- dor can make the change much less painful to a downsizing firm. It can broker the slack more effectively and potentially provide greater employment stability for the company's IT employees (who are there because of the outsourcing vendor's ability to handle multiple operations). In fact, staff members transferred to a ventlor as part of an outsourcing deal often view the deal positively for some of the same financial reasons. They see themselves leaving a cost-constrained environment with limited potential for promotion and entering a growth environment where IT (their core competence) is the firm's only business.
A third-party relationship also brings an entirely different set of dynamics to a firm's view of IT expenditures. The company is now dealing with a hard-dollar ex- penditure that all users must take seriously (it is no longer soft-dollar allocation). There is a sense of discipline and tough-mindedness that even an arm's-length, fully charged-back internal IT department has trouble achieving. Further, finns that do

Chapter 9 Managing IT Outsourcing 259 I not see IT as a high-leverage function may perceive outside professionals as adding special value.
For a firm considering divestiture or outright sale of one or more of its divisions, outsourcing liquidates and gets value for an asset,unlikely to be recognized in the di- vestiture. It gives the acquirer fewer problems to deal with in assimilating the firm. Also, the outsourcing contract may provide a very nice dowry, particularly if the firm is small in relation to the acquirer. With little or no additional expense, the firm can phase out the contract neatly and add the IT transaction volume to the firm's in- ternal IT activities.
Corporate Culture 1 Sometimes a company's values make it hard for managers to take certain actions that make business sense. Consider, for example, a firm with several internal data cen- ters and an obvious and compelling case for consolidating them. The internal IT de- partment simply lacked the clout to pull off a centralized strategy in what was a highly decentralized firm built up over the years by acquisitions. The firm saw the decentralized culture as a major strength, not subject to reconsideration. Outsourc- ing, driven by very senior management, provided the hlcrum for overcoming this impasse, since it was not directly associated with any division or corporate staff.
Eliminating an Internal Irritant I No matter how competent and adaptive a firm's IT management and staff are (and usually they are very good), tension often exists between the end users of the re- sources and the IT staff. The different language IT professionals use, lack of career paths for IT staff across the organization, perceived high IT costs, perceived unre- sponsiveness to urgent requests, and perceived technical obsolescence frequently exacerbate this tension. In this context the notion of a remote, efficient, experienced outsourcing vendor is particularly compelling even though the internal perceptions are not necessarily realistic.
Other Factors A variety of other drivers for outsourcing appear in specific situations. At one mid- size high-tech firm, for example, outsourcing provided access to skills the company needed to run a series of critical applications. The firm's managers felt that out- sourcing had substantially reduced their corporate risk while providing needed ac- cess to specialized knowledge. In another example, a large firm received a level of commitment and energy that it felt would not have been forthcoming from an in- house unit. Still another firm obtained an infrastructure modernization "adrenaline boost" from outsourcing that netted a two-thirds improvement in time to market.
When to Outsource
When do the benefits of outsourcing~outweigh the risks? Five factors tip the scale one way or the other.

260 Module Four Managing and Leading a Networked IT Organiza/ion
Position on the Strategic Grid As shown in Figure 9.1, for companies in the support quadrant, the outsourcing pre- sumption is yes, particularly for large firms. For companies in the factory quadrant, the presumption is yes unless they are huge and are perceived as exceptionally well managed. For firms in the ynaround quadrant, the presumption is mixed; it may represent an unnecessary, unacceptable delegation of competitiveness, although conversely, it may he the only way to acquire those skills. For companies in the strategic quadrant, the presumption also is mixed. Not facing a crisis of IT compe- tence, some companies in the strategic quadrant find it hard to justify outsourcing; others find it indispensable for gaining access to otherwise unavailable skills. Also, having a subcritical mass in potentially core differentiating skills for the firm is an important driver that has moved companies to outsourcing.
FIGURE 9.1 Strategic Grid for Information Resource Management
High Factory-uninterrupted service-oriented Strategic information resource management information resource matzagement
Outsourcingpresumption: Mixecl Outsourcing presumption: Yes, unless company is huge: and well managed Reasons to consider outsourcing:
Rescue an out-of-control internal IT unit Reasons to consider outsourcing: Tap source of cash
Possibilities of economies of scale for Facilitate cost flexibility small and midsize firms Facilitate management of divestiture I Higher-quality service and backup Provide access to technology Management focus facilitated applications and staffing skills otherwise ~iber-optic and extended channel not available technologies hcilitate international IT solutions
Support-oriented information resource Turnaround information resource management management
Outsourcing presumption: Yes Outsourcingpresumption: Mixed
I Reasons to consider outsourcing: Reasons to consider outsourcing: I Access to higher IT professionalism Internal IT unit not capable in required Possibility of laying off is of low priority technologies and problematic Internal IT unit not capable in required
I ~ c c e s s to current IT technologies project management skills I Risk of inappropriate IT architecture Access to technology applicai.ions and
staffing otherwise not
Low IT Impact on Core Strategy High

Chapter 9 ManagingITOutsourcing 261
For larger multidivisional firms, this analysis suggests that various divisions and clusters of application systems can be treated differently. For example, an interna- tional oil company outsourcedits operationally troubled Brazilian subsidiary's IT activities but kept in-house theIT activities of a subsidiary in another country. Sim- ilarly, because of the dynamic nature of the grid, firms under ptofit pressures after a period of sustained strategic innovation (in either the turnaround or the strategic quadrant) are good candidates for ou'tsourcing as a means to clean up their shop and procedures. This was true for one large high-technology organization that saved over $100 million per year by outsourcing.
4
Development Portfolio The higher the percentage of IT resources working on maintenance or high-struc- tured projects is, the more the portfolio is a candidate for outsourcing. By high- structured projects we mean those in which the end outputs are clearly defined; there is little opportunity to redefine them and little or no organizational change involved in implementing them. Outsourcing vendors with access to high-quality cheap labor pools (in, for example, Russia, India, or Ireland) and good project management
, skills consistently outperform, on both cost and quality, local units that are caught ' ; in a high-cost geographic area but still have the contacts, skills? and confidence to
manage extended relationships. The growth of global fiber-optic networks has made conventional thinking on where work should be placed obsolete. For example, Citibank, based in New York, does much of its processing work in South Dakota. Further, literally hundreds of thousands of programmers are working in India on software development for U.S. and European firms.
High-technology, highly structured work (e.g., building a vehicle-tracking sys- tem) is also a strong candidate for outsourcilig because this type of work requires staff with specialized, leading-edge technical skills. These skills are widely available in Ireland, India, and the Philippines.
Conversely, large, low-structured projects pose difficult coordination problems ! for outsourcing. In low-structured projects the end outputs and processes are sus- , ceptible to significant evolution as the project unfolds. Design is iterative because /"
users discover what they really want by trial and error. Design work requires that key elements of the design infrastructure be physically closer to consumers. It can, of course, be outsourced, but that requires more coordination to be effective than do the projects described above. One firm outsourced significant design work to a very standards-oriented outsourcing vendor as a way of bringing discipline to an undis- ciplined organization.
Organizational Learning A firm's organizational learning ability influences whether it can manage an out- sourcing arrangement effectively. Many firms' development portfolios include a large number of projects aimed at process reengineering and organizational trans- formation. Process reengineering seeks to install very different procedures for han- dling transactions and doing the firm's work. Organizational transformation tries to

262 Module Four Managing and Leading c Networked IT Organization
redesign where decisions in the firm are made and what controls are used. The suc- cess of both types of projects depends on having the internal staff radically change the way it works. It often involves significant downsizing as well.
Responsibility folr development work is the hardest to outsource. In gauging the responsibility for success, a firm with substantial experience in restructuring will have less difficulty thawing a dividing line between the outsourcing vendor and the customer. Firms that have not yet worked on these projects will find that outsourc- ing significantly complicates an already difficult task.
A Firm's Position in the Market The world of real-time infrastructure is so different from the large COBOI., systems and stand-alone PCs of the 1980s and earlier that it is often prohibitively challeng- ing for a firm to modernize by itself. Firms that are far behind their peers often do not have the IT leadership, staff skills, or architecture to upgrade quickly to state-of- the-art technology. 'The outsourcing vendor, in contrast, cannot afford to keep old systems running but must go forward with contemporary practice and technology. For a firm whose 11' capabilities have become obsolete, it is not worth dwelling on how the firm got where it is but vital to determine how it can extricate itself.
Current IT Organization The more IT activities are already segregated in organizational and accounting terms, the easier it is to negotiate an enduring outsourcing contrilct. A stand-alone IT unit has already developed the fundamental integrating and control mechanisms necessary for an outsourcing contract. Where such mechanisms do not exist, devel- oping an enduring contract is much more complex because the firm must establish . both the framework for resolving issues and the specific technical approaches.
Structuring the Alliance
Successful outsourcing begins by carefully crafting the structure of an outsourcing arrangement. The right structure is not a guarantee of success, but the wrong struc- ture will make the governance process almost impossible. Several factors are vital to a successful alliance.
Contract Flexibility Most outsourcing deals change over time, often radically. Kodak, for example, re- peatedly altered its outsourcing contracts because both business circumsf:ances and technologies changed. Evolving technology, changing economic conditions, and new service options make change inevitable. Outsourcing contracts therefore must .be written to allow for evolution. Because contracts often need adjustments, the non- contractual aspects of the relationship are extremely important. If there is mutual in- terest in the relationship and if there are shared approaches to problem solving, the alliance is more likely to be successful. If this is not the case, trouble may arise.

Chapter 9 Managing IT Outsourcing 263
No matter how much detail and thought go into drafting a contract, it will not provide total protection if things go wrong. Indeed, the process of drafting the contract, which of- ten takes six to eight months, is likely to be more important than the contract itself. Dur- ing the process each side gains insights into the other's values. When the process is suc-
- cessful, it is a basis for personal relationships that go beyond the written contract.
Standards and Control Companies are understandably concerned about the prospect of handing control over an important part of a firm's operations to a third party (such as an outsourcing vendor), particularly if IT innovation is vital to the firm's success or if the firm is very dependent on IT for smooth operations. The outsourcing agreement must ad- dress these concerns.
Control is in part a state of mind. Most organizations are accustomed to lacking direct control over certain segments of the business. Vendors already control many vital aspects of a firm's day-to-day operations. For example, third parties normally provide electricity and telephone services, and the interruption of those services can cripple an organization in a short time. Providing sustained internal backup for these services is often impractical or impossible. As we have seen in some cases, vendors are better able to provide highly reliable services than are their customers.
Putting innovation and responsibility for new services and products in the hands of a third party is correctly seen as more risky and high-stakes than outsourcing op- erations. Concerns about outsourcing responsibility for new services and products are more easily resolved for firms in the factory and support quadrants of the strat- egy grid, where innovation is much less important, than they are for firms inthe turn- around and strategic quadrants. Whatever a firm's grid location, however, it must carefully develop detailed performance standards for systems response time, avail- ability of service, responsiveness to systems requests, and so on. These standards must be explicitly written into the contract.
Areas to Outsource A company can outsource many aspects of IT activities. Broken Hill, for example, outsourced all of its IT activities. Kodak kept systems development but outsourced data center operations, communications, and PC acquisition, each to a different ven- dor. As we noted earlier, significant portions of firms' IT activities have been out- sourced for years. What is at stake here is a discontinuous shift to move additional portions of a firm's IT activities outside the firm. Between the current situation and total outsourcing lie a variety of scenarios. When assessing incremental outsourc- ing, managers should ask the following questions:
Can the portion of IT proposed for outsourcing be separated easily from the rest of the firm, or will the complexities of disentangling systems absorb most of the savings?
Do the activities proposed for outsourcing require particular specialized compe- tencies that we do not possess or lack the time to build?

264 Module Four Managing and Leading a .Vetworked IT Organization
How central are the activities to be outsourced to the strategy of our firm? Are they more or less significant to the firm's value chain than the other IT activities?
In outsourcing smaller portions of IT activities, it is important to take into ac- count coordination costs. companies whose outsourcing approaches over time be- came fragmented experience enormous coordination costs as they attempt to man- age relationships with a large number o:f vendors.
Cost Savings Some CIOs believe that the firm's IT activities are so well managed or so unique that there is no way to achieve savings through outsourcing or for the vendor to profit. Skepticism about such beliefs is often warranted, however. The IT department often has a vested interest in status quo organizational arrangements and may resist out- sourcing at every turn. Thus, carrying out an objective assessment of the benefits of outsourcing can be very difficult. At one company an internally initiated study done by a consultant retained by the IT department showed that the firm's IT operations were 40 percent more efficient than the average in its industry. The results from a subsequent study rehted that claim.
If properly engaged by a firm's senior managers, however, outsourcing consult- ants can make a real contribution to efforts to evaluate cost savings as well as in ne-' gotiating a contract with an outsourcing vendor. Customer firms outsource infre- quently, in some cases only once. Outsourcing vendors are more practiced at negotiating outsourcing deals. Without outside assistance, a customer finn can be overmatched in an unbalanced negotiating process.
Supplier Stability and Quality During the typical 1 @-year term of an outsourcing contract, technologies will evolve. A supplier that pays insufficient attention to ongoing modernization and retraining will become a liability as a strategic partner. The stability of the outsourcing ven- dor's financial structure is also critical. Vendor cash crunches, Subchapter 11, and worse situations are nightmares for customers. Once a firm outsources, it is very hard to bringcthe ap1)lications back to the company. Key aspects of the firm's tech- nical and managerial competence will have evaporated since the outsourcing deal was consummated. Although it is difficult to move quickly from one outsourcing vendor to another (usually the only practical alternative), if it considers the possi- ' bility in advance, a firm can mitigate the risks.
Problems are intensified if the way a firm uses technology becomes incompati- ble with the outsourc:ing vendor's skill base. For example, a firm in the factory quad- rant that selects an operationally strong outsourcing vendor may be in trouble if it suddenly moves toward the strategic quadrant and its partner (the outsourcing ven- dor) lacks the necessary project management and innovation skills to operate there.
The firm and the outsourcing vendor must manage any potential conflict of in- terest carefully so that it does not rum the relationship. The outsourcing vendor makes money by lengthening leases, driving down operational costs, and charging premium prices for new value-added services. The outsourcing customer has little

Chapter 9 ManagingITOutsourcing 265
interest in harvesting old technology benefits; old technology is usually one reason the firm outsourced in the first place. The mechanisms for managing potential ten- sions must be written into the contract. Both firms must make a profit. The more the customer moves to the strategic quadrant, however, the more challenging it is to de- sign a good fit with an outsourcing vendor.
Management Fit Putting together a 10-year, flexible evolving relationship requires more than just technical skill and contract wizardry. A shared approach to problem solving, similar values, and good personal chemistry among key staff people are critical determi- nants of long-term success. Outsourcing vendors have very different management cultures and styles. It is often worthwhile for a customer firm to give up something in price to engage an outsourcihg partner that will work well over the long term. The information gained in a tortuous six- to eight-month process of putting an alliance together is crucial for identifying the likelihood of a successful partnership. Personal chemistry is a necessity, but it is an insufficient condition for success. Corporate cul- ture-fit.is the most important factor. Years after the people key to establishing the ini- tial relationship have moved to other assignments, the outsourcing relationship will remain in place.
Conversion. Problems The period of time during an outsourcing study and conversion is one of great stress for a company's IT staff. Uncertainties about carZer paths and job security contribute to the potential for problems. The sooner plans and processes for dealing with staff career issues, outplacement processes, and separation pay are addressed, the more effective the results will be. Fear of the unknown is almost invariably worse than any reality.
Managing the Alliance
The ongoing management of an alliance is the single most important aspect of the success of outsourcing. There are four critical areas that require close attention.
The CIO Function The customer firm must retain a strong, active CIO function. The heart of the CIO's job is planning-ensuring that IT resources are at the right level and are appropri- ately distributed. This role has always been distinctly separate from the active line management of networks, data centers, and systems development, although this has not always been recognized. Line activities can be outsourced, but sustained inter- nal CIO responsibility for the following critical areas must be maintained even in a company that has fully outsour'ced its IT function.
Partnership/contract management. An informed CIO who monitors perfor- mance against the contract and plans for and deals with issues that arise helps

266 Module Four Managing and Leading lr Networked IT Organization
an outsourcing alliance adapt to change. The outsourcing experiences of Kodak and J. P. MorganIChase provide clear evidence of the need for this ongoing role.
Architecture planning. A CIO's staff must visualize and coordinate a 1,ong-term approach to networks, hardware and software standards, and database architec- tures. The firm can delegate execution of these areas but not its assessment of what it needs to support the firm in the long term. A staff roughly 5 percent the size of the outsourced IT organization is the norm, although in practice the per- centage may vary in either direction. In general, organizations should err on the side of too much coordinating staff.
Emerging technologies. A company must develop a clear grasp of emerging tech- nologies and their potential applications. To understand new technology, man- agers must attend vendor briefings and peer group seminars and visit firms that currently are using the new technology. Assessing technology alternatives cannot be delegated to a third party. At one large pharmaceutical organization, the CIO's staff was vindicated when it became clear that it had first spotted business process redesign as an emerging area, funded appropriate pilot projects (which were skill- fully transferred to line management), and finally repositioned the firm's entire IT effort. Users and an outside systems integrator executed the project, with the CIO playing the crucial initiator role. An outsourcing vendor has an incentive to suggest new ideas that lead to additional work. Delegating responsibilaty for IT- enabled innovation in strategic and turnaround firms is risky because this is such an important part of the firm's value chain.
Continuous learning. A firm should create an internal IT learning environment to bring users up to speed so that they are comfortable in a climate of continuous change. An aerospace firm felt this was so important that, when outsourcing, it kept the internal learning environment in-house.
Performance Measurement Realistic measurement of outsourcing success is generally difficult, and so compa- nies must develop performance standards, measure results, and then interpret them continuously. Indivrdual firms bring entirely different motivations and expectations to the table. In addition, many of the most important measures of success are intan- gible and play out aver a long period of time. Concrete, immediate cost savings, for example, may be measurable, at least in the short run, but simplification of the gen- eral management agenda is impossible to assess.
The most celebrated cases of outsourcing have evolved in interesting ways. Whereas Kodak's major vendor remains intact, another vendor has gone through several organizatio~lal transformations triggered by financial distress. In its first 18 months of outsourcing General Dynamics spun off three diGisions along with their contracts. EDS and General Motors (GM) took years to work out an acceptable agreement; ultimately, EDS was spun out as a separate company, and its share of GM's internal IT work has been shrinking.

Chapter 9 Managing IT Outsourcing 267
A major power company postponed an outsourcing study for a year. Its general managers believed their internal IT staff and processes were so bloated that while outsourcing IT would clearly produce major savings, they would still be leaving money on the table. Consequently, they reduced their IT staff from 450 to 250 and reduced the total IT expenditure level by 30 percent. With the "easy" things done, they then entertained several outsourcing proposals to examine more closely what additional savings and changes in their method of operation would be appropriate and then proceeded to outsource.
Mix and Coordination of Tasks As we noted earlier, the larger the percentage of a firm's systems development port- folio devoted to maintaining legacy systems, the lower the risk of outsourcing the portfolio. The question becomes: Can we get these tasks done significantly faster and less expensively? The bigger the percentage of large, low-structured projects in the systems development portfolio is, the more difficult it becomes to execute a pru- dent outsourcing arrangement because the necessary coordination work to be done is much more intense. Large systems development projects using advanced tech- nology play directly to outsourcing vendors' strengths. Conversely, issues relating to structure (and thus close, sustained give-and-take by users) require so much extra coordination that many outsourcing benefits tend to evaporate.
If not carefully managed, both the contract and the different geographic locations of the outsourcing vendor's development staff may inhibit discussion and lead to ad- ditional costs. Managing the dialogue across two organizations with very different financial structures and motivations is both challenging and, at the core, critical to the alliance's success. Concerns in this area led J. I? Morgan and Dupont not to out- source significant portions of their development activity.
Customer-Vendor. Interface The importance of the sensitive interface between the customer and the outsourcing vendor cannot be overestimated. First, outsourcing cannot.imply delegation of final responsibility to the outsourcing vendor. The reality is that oversight cannot be en- trusted to someone outside the firm, and as we have mentioned, a CIO and the sup- porting staff need to manage the agreement and relationships. Additionally, the in- terfaces between the customer and the outsourcing vendor are very complex and usually must occur at multiple levels. At the most senior levels there must be links to deal with major issues of policy and relationship restructuring, whereas at lower levels'there must be mechanisms for identifying and handling more operational and tactical issues. For firms in the stl'ategic quadrant, these policy discussions occur at the CEO level and occasionally involve the board of directors.
Both the customer and the outsourcing vendor need regular full-time relationship managers and coordinating groups lower in the organization to deal with narrow op- erational issues and potential difficulties. These integrators are crucial for managing

268 Module Four Managing and Leading a Networked IT Organization
different economic niotivations and hction. The smaller the firm is in relationship to the outsourcing ventlor's total business, the more important it is that these arrange- ments be specified in advance before they get lost among other priorities.
During the last 10 years an entirely different way of gaining IT support for out- sourcing has emerged. While outsourcing is not for everyone, a number of \~ery large and sophisticated organizations have made the transition successfully, and the prac- tice is growing rapidly. What determines success or failure is managing the rela- tionship less as a contract and more as a strategic alliance.
Summary In this chapter we described a framework for managing large outsourcing programs. The framework identifies the characteristics of situations in which outsourcing makes sense and the issues involved in structuring and managing outsol.~rcing al- liances. Many aspects of the framework are relevant to the earlier discuss~on of in- cremental outsourcing, but the unique challenges posed by strategic alliance-based programs require special attention. Executives can use the following questions to as- sess whether they are seizing the opportunities provided by outsourcing and man- aging the associated risks:
1. Have you assessed the case for outsourcing some or all of your company's IT ac- tivities? If past studies indicated that outsourcing did not make sense, how con- fident are you of the objectivity of those studies?
2. If you are engaged in outsourcing relationships, have you built the need to change the relationship over time into the contract? Do you have specific mechanisms in place to indicate when an adjustment to the contract might be called for?
3. Do your outsourcing arrangements provide profits for both parties to the agreement? 4. Have you retained an internal CIO function to perform the IT planning and con-
tract monitoring functions that cannot be delegated? Have you adequately funded and staffed this internal group?
5. Do you have practices in place to nurture and maintain the health of the out- sourcing relationship?

A Portfolio Approach to IT Projects A division of a major chemical company halts its SAP installation and takes a ma- jor write-off. Although the company had successfully implemented SAP before, this time an inexperienced project manager misjudges the amount of change manage- ment nec,essary. The company starts over with an experienced project manager and a change management consultant. Losses are in the millions.
A major credit card company underestimates processing requirements by more than tenfold as it moves its online credit card processing to a new service provider. The system crashes. One and one-half million accounts are at risk. Service levels plunge. Both the chief information officer (CIO) and one of his direct reports lose their jobs.
A manufacturing company consolidates activities from more than 50 plants, field offices, and order entry points into a national service center. Only after consolida- tion is well under way does the company realize that wait time to confirm orders av- erages 25 seconds. In the estimation of firm managers, any wait longer than 2 sec- onds makes the system unusable.
Two major insurance companies attempt to install the same software package to solve an identical problem with their field sales forces. In one company, the new technology generates a 46 percent increase in sales from one year to the next. In the other, all the money is wasted; $600 million is written off with no benefit.
Horror stories from the late 1960s and early 1970s? Hardly. These examples are disturbingly recent.'Most date from the end of the 1990s, and some from the 21st century. Despite 40 years of accumulated experience in managing information tech- nology (IT) projects, the day of the big disaster on a major IT project has not passed. Why? An analysis of these examples and a preponderance of research over the last 10 years suggest three serious deficiencies that involve general and IT management: (1) failure to assess the implementation risk of a project at the time it is funded,

270 Module Four Managing and Leading o Networked IT Organization
(2) failure to consider the aggregate implementation risk of a portfolio of projects, 'and (3) failure to recognize that different projects require different managerial ap- proaches. In this chapter we examine the sources of implementation risk and sug- gest strategies for managing and mitigating it.
Sources of Im~lementation Risk
In discussing implementation risk, we assume that IT managers have brought ap- propriate methods and tools to bear on a project. Implementation risk, as we define it here, is what remains after the application of the proper methods and tools. While mismanagement is another source of risk, it is not included in our notion of imple- mentation risk because it is not inherent in the nature of a project. Risk, however, is a necessary part of a project experience. It follows that risk itself is not ~nherently bad; rather, it is an essential characteristic of projects that promise benefits. The idea of taking on higher risk for a higher return is basic to business thinking. All benefi- cial business activities undertake risk, and project management is no different.
Project feasibility studies typically provide estimates of financial benefits, qual- itative benefits, iml~lementation costs, target milestone and completion dates, and staffing levels. Developers of estimates often provide voluminous 'supporting docu- mentation. Only rarely, however, do they deal frankly with the risks of slippage in time, cost overruns, technical shortfal~ls, and outright failure. Usually they deny or ignore such possibilities. Ignoring project risk is a profound error with significant consequences, such as the following:
Failure to obtain anticipated benefits due to implementation difficulties
Higher than expected implementation costs
Longer than expected implementation time
Resulting systenis whose technical performance is below plans and requirements
System incompatibility with selected hardware and software
Three important project dimensions influence inherent implementation risk:
Project size. The larger the project in monetary terms, staffing levels, duration, and number of departments affected, the greater the risk. Multimillion-dollar projects obvious,ly carry more risk than do $50,000 efforts and tend to affect the company more if the risk is realized. Project size relative to the normal size of an IT development group's projects is also important. A $1 million project in a department whose average undertaking costs $2 million to $3 million usually has lower implicit risk than does a $250,000 project in a department whose projects have never cost more than $50,000.
Experience wit11 the technology. Project risk increases when.the project team and organization are unfamiliar with the hardware, operating systems, database systems, and other project technologies. New technology projects are intrinsically

Chapter 10 A Portfolio Approach to IT Projects 271 b
more risky for a company than are projects that use familiar technologies. A project posing a slight risk for a large, leading-edgesystems development group may be highly risky for a smaller, less technically advanced group. By hiring systems integration consultants with expertise in those technologies, a company can potentially reduce the risk associated with unfamiliar technologies. Accenture, CSC, EDS, LBM, and a host of smaller competitors offer services of this kind.
Project structure. In some projects, which we term high structure, the nature of the task fully and clearly defines project outputs. From the project's beginning throughout its duration, outputs remain fixed. Inherent stable requirements make these projects easier to manage. Similarly, projects that require little organizational change are much less risky than are projects that require substantial modification of the organization and employee work habits. We contrast high-structure projects with low-structure projects, which do not have such convenient characteristics. Requirements for low-structure projects are difficult to determine, and they tend to evolve throughout the project. To realize benefits, they typically require organizational change.
An insurance company's project to create a laptop computer-based version of an agent's rate book provides an example of a highly structured project. At the begin- ning of the project, the planners reached an agreement on the product lines to be in- cluded, the layout of each page screen, the process of generating each number, and the type of client illustration that would be possible. Throughout the life of the proj- ect these decisions were never altered. Consequently, the team organized itself to reach a stable, fixed output rather than to cope with a potentially mobile target. The key risk, effectively managed, was training the agents to operate in these new ways.
project Categories and Degree of Risk
Figure 10.1, which combines in a matrix the various dimensions influencing risk, iden- tifies eight distinct project categories with varying degrees of implementation risk. Fig- ure 10.2 gives examples of projects that fit in those categories. ~ v e n at this grossly in- tuitive level, this classification is useful to separate projects for different types of management review. Innumerable IT organizations have used the matrix successhlly for understanding relative implementation risk and for communicating that risk to users and senior executives. he matrix helps address the legitimate concern about whether all the people viewing a project will have the same understanding of its risks.
~sseks in~ Risk for Individual Projects Figure 10.3 shows excerpts from a questionnaire one company developed for, as- sessing project implementation risk. In total, the project manager1 must answer 42
'~ctually, both the project leader and the key user answer these questions, and then they reconcile the differences in their answers. Of course, the questionnaire data are no better than the quality of thinking that goes into the answers.

272 Module Four Managing and Leading a Networked IT Organization
FIGURE 10.1 Effect of Degree of Structure, Company-Relative Technology, and Project Size on Project Implementation Risk
Low Structure High Structure I I
Low Company-Relative Technology
High Company-Relative Technology
Large Low risk Project (very susceptible to
mismanagement)
Low risk
Small Very low risk Very low risk Project (very susceptible to
mismanagement)
Large Very high risk Project
Medium risk
Small Project
High risk Medium-,low risk
FIGURE 10.2 Project Examples by Implementation Risk Categories
Low Structure High Structure
Low Company-Relative Technology
Spreadsheet supporl: for Year 2000 compliance work budgeting
Online graphic support for Artificial intelligence (Al)- advertising copy driven bond trading
High Company-Relative Technology L

Chapter 10 A Portfolio Approach to ITProjects 273
FIGURE 10.3 Project Implementation Risk Assessment Questionnaire (Sample from a Total of 42 Questions) I / ~ i s k Factor wekht 1 1
1. Total development work-hours for system* 5 1 100 to 3,000 Low 1 3,000 to 15,000 Medium 2
I / 15,000 to 30,000 Medium 3 / More than !O,OOq High " 4 I
b i S - &
2. ~stimited projed impI&ne6ati I
" 4 1 12 monthsor les;, .I 4: - Lgw % 1 13 months to 24 honths """' - Med~um a2 More than 24 months High 3
3. Number of "dpa&ments (oth'er than IT) hvol;ed with *' -+" ?% ' * ,n
system 4
4 One ." '. ", "a "- Lijw $1' a.
Two Medium 2 Three or more i High 3
Structure Risk Assessment
~ i s k Factor ' Weight
1. If replacement system is proposed, what percentage of . existing functions are replaced on a one-to-one basis? 5 0-25% High 3 25-50% Medium 2 L / 50-100% Low 1
2. What is the severkv of bser department oroc:dural' / Fanges caured byihe,propoied systemj edr a b s a@ @ I he
1 Low " " 1 a , E: I
I I Medium 1. Hig,, 'aB ""f - g 4% 2% 'D ;i * 81 3 I '
3. What is the degree of needed user organization structural changkto meet requirement3 of the new system? I - None Minimal a i.
Somewhat Major -
4. What is the general attitude of the user? Poor, against IT solution ~
Fair, sometimes reluctant Good, understands value of IT solution
5. How committed is upper-level user management to the - system? / Somewhat reluctant or unknown Adequate Extremely enthusiastic
6. Has a joint IT-user team been established? No "i
Part-time user representative appointed Full-time user representative appointed -
"ow Medium
High - High
Medium
High Medium
LOW
" HiQh Low

274 Module Four Managing and Leading a Networked IT Organization
FIGURE 10.3 Project Implementation Risk Assessment Questionnaire (Sample from a Total of 42 Questions) (continued)
I Technology Risk Assessment
: Risk Factor
1 1. Which of the hardware is new to the ~ompany?~ None
i CPU I / Peripherals and/or additional storage 1 Terminals i Mini or macro 1 2. Is the system software (nonoperating system) new to IT i project team?t
i Rgramming language I 1 Database
Data communications I Other (please specify) 1 3. How knowledgeable is user in area of IT? i First exposure i Previous exposure but limited krowledge 1 High degree of capability 1 4. How knowledgeable is user representative in proposed
application area? 1 Limited I Understands concept but has no experience
1 Has been involved in prior implementation efforts 5. How knowledgeable is IT team in proposed application area?
I Limited , Understands concept but has no experience / Has been involved in prior implementation efforts
High High High High
High High High High
High Medium
Low
High Medium
Low
High Medium
Low
Weight
5 1
Note: Since the questions vary in importance, the company assigned weights to them subjectively. The numerical answer to a question is multiplied by the question's weight to calculate the question's contribution t#) the project's risk. The numbers are then added to produce a risk score for the project. Projects with risk scores within 10 points of each other are indistinguish;lble in their relative risk, but those separated by 100 points or more are very different in their imple- mentation risk to even the casual observer. 'Time to develop includes system design, programming, testing, and installation. his question is scored by multiplying the sum of the nunbers attached to the positive rssponses by the weight. Source: This questionnaire is adapted from "Dallas Tire," Case No. 180-006 (Boston: Harvard Business School Case Services, 1980).
questions about a project before senior managers will approve it. The company drew up these questions after analyzing its experience with successful and unsuccessful projects. Although these questions may not be appropriate for all companies, they provide a good starting point for thinking about implementation risk. A number of other companies have used the questionnaire in developing their own instruments for measuring risk.
The questions not only highlight the sources of implementation risk but also sug- gest alternative routes to conceiving the project and managing it to reduce risk. If

Chapter 10 A Portfolio Approach to IT Projects 275 I the initial aggregate risk score seems high, analyses of the answers can suggest ways of reducing the risk, for example, by reducing project scope, using more familiar technology, or breaking the project into multiple phases. Managers should not con- sider risk unalterable; instead, its presence should encourage better approaches to project management. Questions 5 and 6 in the "Structure Risk Assessment" section are good examples of questions that could trigger changes.
The higher the assessment score, the greater the need for very senior approval. In the company that developed this questionnaire, only the executive committee can ap- prove projects with very high scores. This approach ensures that top managers are aware of significant hazards and are making appropriate trade-offs between risk and strategic benefits. Managers should ask themselves the following questions:
1. Are the benefits great enough to offset the risks?
2. Can the affected parts of the organization survive if the project fails?
3. Have the planners considered appropriate alternatives?
The questionnaire is readministered several times during the project to reveal any major changes in risks as it unfolds. Ideally, risk assessment scores decline through- out implementation as the number and size of the remaining tasks dwindle and fa- miliarity with the technology increases.
When senior managers believe a project has low implementation risk yet IT man- agers know it has high implementation risk, horror stories sometimes result. The questionnaire helps prevent potential misunderstandings by encouraging a common understanding among senior management, IT managers, and user managers about a project's relative implementation risk.
Portfolio Risk In addition to determining relative risk for single projects, a company should de- velop a profile of aggregate implementation risk for its portfolio of systems proj-
. .' ects. Different portfolio risk profiles are appropriate to different companies and strategies.
For example, in an industry where IT is strategic (such as retailing or catalog sales), managers should be concerned if there are no high-risk projects in the proj- ect portfolio. Such a cautious stance may open a product or service gap through which the competition may seize advantage. A portfolio loaded with high-risk proj- ects, however, suggests that the company may be vulnerable to operational disrup- tions if projects are not completed as planned. Referring back to the strategic grid discussed in earlier chapters, for "support" companies, heavy investment in high- risk projects may not be appropriate; they should not be taking strategic gambles in the IT arena. Yet even these companies should have some technologically challeng- ing ventures to ensure familiarity with leading-edge technology and maintain staff morale and interest.
These examples suggest that the 'aggregate implementation risk profiles of the portfolios of any two companies can legitimately differ. Table 10.1 lists the issues that influence companies toward or away from high-risk efforts. The risk profile

276 Module Four Managing and Leading a Networked IT Organization
TABLE 10.1 Factors that Influence Innplementation Risk Profile of Project Portfolio
i Portfolio Risk Focus .- I Factor Low High
Stability of IT development group Perceived quality of IT development group by insiders IT critical t o delivery of current corporate services IT an important decision support aia Experienced IT systems developmen: group Major IT fiascoes in last two years New IT management team IT perceived as critical t o delivery of future corporate services IT perceived as critical t o future dec sion support aids Company perceived as backward in use of IT
High High No No Yes No No No No No
Low ISW I Yes Yes i No Yes Yes Yes Yes Yes
should include projects executed by outside systems integrators as well as those of the internal systems, development group. As the table shows, IT'S aggregate impact on corporate strategy is an important determinant of the appropriate amount of im- plementation risk to undertake.
Project Management: A Contingency Approach
Conventional wisdom and much of the literature on how to manage projects suggest that there is a single right approach to project management. The implication of this way of thinking is that managers should apply the same tools, project management methods, and organizational linkages to all such efforts. We disagree.
Although there rnay indeed be a set of general-purpose tools that can be used in managing IT implementation (we describe some later), the contribution each makes to project planning and control varies widely according to the project's characteris- tics. Further, the means of involving the user-through steering committees, repre- sentation on the team, or as a team leader-should also vary by project type; in short, there is no universally correct way to run all projects.
Management Tools The general methods (tools) for managing projects are of four principal types:
External integration tools include organizational and other communication devices that link the project team's work to users at both managerial and lower levels.
Internal integration devices, which include various personnel controls, ensure that the project team operates as an integrated unit.
Formalplannin,p tools help structure the sequence of tasks in advance and estimate the time, money, and technical resources the team will need for executing them.

Chapter 10 A Porrfolio Approach to ITProjects 277
TABLE 10.2 Tools for Project Management
/ * lntegratiob ~ooli l~erhri lquer External Integration ToolslTechniquer, Internal 1 Selection of user as project manager a Selection of experienced IT professional to h e r st8eringkommittee (whicH meets dead team "
frequently) Team meetings User-managed change control process y.i +$ Distribution within team of information Distribution of project team information to on key design decisions -,key users* ,> , , Teshnical status reviewslinspections ., selection of users as team members " HQman resources techniques to maintain User a~prova\~pro$gss for system
d"" --."a# I,."."." , 3#* low turnover of team members 'specificati&s b": iix '" ~8ectidii" of hibh ptikentaie of team "I" ' ? Prototyping with users members with significant previous work ~~o~ ress - re~o r t s JC /*": #2$ 4 5%' v :relationships 18:
User involvem'ent/respon~ibility in other key Participation of team members i n goa;" ''I :, deci5i8pns a ~ d actions ..;. ..: & getting and*deadline establishment
Obtaining outside technical assistance 1 / Formal Planning Tools 2. *a Formal ~esufis Control Tools 1
Project management software Status-versus-plan reports PERT, CPM " Change contrdl disciplines and systems Milestone selection Milestone review meetings Systems specifications Analysis of deviations from plan Project approval processes Postproject audit procedures
i al"
Formal results-control mechanisms help managers evaluate progress and spot potential discrepancies so that corrective action can be taken.
Results controls have been particularly effective in project settings with the fol- lowing characteristics:?
1. There is clear knowledge in advance of the desired results.
2. The individuals whose actions are influenced by the formal mechanisms can con- trol the desired result, at least to some extent.
3. Results can be measured effectively.
Highly structured projects involving a low degree of technology satisfy these con- ditions very well; formal results-control mechanisms are very effective in these set- tings. For low-structure projects involving a high degree of technology, none of the above conditions apply; consequently, results control can make only a limited con- tribution. In those settings, major contributions can be derived from internal inte- gration devices (personnel controls). Table 10.2 provides examples of commonly used types of integration and control tools. .
'~enneth A. Merchant, Control in Business Organizations (Marshfield, MA: Pitrnan Publishing, 1985).

278 Module Four Managing and Leading a Nehvorked IT Organization
Influences on Tool Selection Different project types call for the use of different management tools. Using the project categories in Figure 10.1, we describe the tools most suitable for each proj- ect type below.
High-Structure/Low- Technology Projects
Highly structured projects that present familiar technical problems have the lowest risk and are the easiest to manage of the projects described in Figure 10.1. Unfortu- nately, they are the least common. High structure implies that the nature ofthe task defines its outputs, the possibility of users changing their minds about the desired outputs is practicallq nonexistent, and significant change management issues are not present. Project leaders do not have to create extensive administrative processes just to get a group of users to agree to maintain commitment to a design. External inte- gration practices such as assigning IT systems analysts to user departments, man- dating heavy representation of users on the design team, and requiring formal user approval of design specifications are cumbersome and unnecessary for this type of project. Other integrating actions, however, such as training users how to operate the system, remain important.
Since the system's concept and design are stable throughout the duration of this type of project and since the technology involved is familiar to the company, the project can be staffed with people with average skill levels. The project leader does not need extraordiniu-y IT skills. This type of project readily provides opportunities to the IT department's junior managers, who can gain experience that will be appli- cable to more ambitious tasks in the future.
With their focus on defining tasks and budgeting resources against them, formal planning tools (such as program evaluation and review technique [PERT] and crit- ical path method [CPM]) are likely to work well on this type of project. They force the team to develop a thorough and detailed plan that exposes areas of "soft" thinking. Such projects are lihely to meet the resulting milestone dates and adhere to the target budget. Moreover, the usual results-control techniques for measuring progrt:ss against dates and budgets provide reliable data for spotting discrepancies and building a de- sirable tension within the design team in regard to working harder to avoid slippage.
A portfolio in which 90 percent of the projects are of this type should produce lit- tle unplanned excitement for senior and user managers. It also requires a much more limited set of skills for the IT organization than would be needed for portfblios with a different mixture of project types.
High-Structure/Hiph-Technology Projects
Projects in this category are vastly more complex than the high-structure!low-tech- nology projects just discussed. Projects with high structure and high technology call for significant elaboration on the practices outlined in most project mimagement handbooks. Converting a mainframe system to run on client-server archilecture is a good example of a high-structurelhigh-technology project so long as the objective is replicating the same functions on the new platform. Another example is a firm's

Chapter 10 A Portfolio Approach to ITProjects 279
initial efforts at Web-enabling access to key content for internal use by company employees.
For this type of project to succeed, interaction between the project team and the users is not crucial. The outputs are so well defined by the nature of the undertaking that obtaining user input and dealing with changes that users request are unimpor- tant. Interaction with users, however, is important in two respects: (1) to ensure co- ordination on any changes in inputloutput or any other manual procedure changes necessary for project success and (2) to deal with any systems restructuring that must follow from unexpected shortcomings in the project's technology.
In this kind of project, it is common to discover during implementation that the selected technology is inadequate for the task, which forces a long postponement while new technology is chosen or vital features of the system are modified to make the task fit the available technology. This was true of the firm described at the be- ginning of the chapter that consolidated activities from over 50 plants into a national call center. In a similar experience, an industrial products company temporarily re- turned to processing some order-entry procedures manually so that the rest of an in- tegrated materials management system could be shifted to purchased hardware.
For this type of project, technical complexity drives the characteristics of a suc- cessful manager. The manager should have a strong background in high-technology projects (preferably, but not necessarily, in an IT environment) and should be able to "connect" with the deep technologists the project will require. The ideal manager will foster an atmosphere of communication within the project that will help antic- ipate difficulties before technologists understand they have a problem. When man- aging large projects in this category, an effective project leader must establish and maintain teamwork, develop a record of all key design decisions, and call subpro- ject meetings as needed.
Formal planning methods that identify tasks and set completion dates will have much less predictive value. The team will not understand key elements of the tech- nology in advance. All too often seemingly minor bugs will have major financial consequences. # \ At one company an online banking system generated "garbage7' (0 s and Xs) across all the computer screens roughly once each hour. One keystroke erased the "ghost," but it remained a disdoncerting aspect of a banking-system. Four months and more than $200,000 were dedicated to eliminating the mysterious quirk. Solv- ing the problem involved uncovering a complex interaction of hardware features, op- erating system functions, and application traffic patterns. Indeed, a vendor ulti- mately had to redesign several microprocessor chips to solve the problem once and - for all. Formal results-control mechanisms have limits in monitoring the progress of such projects, and personnel controls become more important.
In summary, technical leadership and internal integration are the keys in this type of project; external integration plays a distinctly secondary role. Formal planning tools yield estimates that may contain major inaccuracies, and great danger results when neither IT managers'nor high-level executives recognize this. Managers who do not acknowledge the inherent level of uncertainty may believe they have precise planning and close controls in place when in fact they have neither.

280 Module Four Managing and Leading a Nehvorked IT Organization
Low-Structure/Low -Technology Projects When low-structure/low-technology projects are well managed, they present low- risk profiles. Too often, though, such projects fail because of inadequate under- standing and focus on business requirements. Indeed, the key to operating this kind of project lies in effective efforts to involve the users in design, development, and implementation.
Developing substantial user support for a system design and keeping the users com- mitted to that design are critical. Such projects therefore benefit from the following:
1. A user as project leader or as the number two person on the team.
2. A user steering committee to evaluate the design periodically.
3. Breaking the project into a sequence of small, discrete subprojects.
4. Formal user review and approval on all key project specifications.
5. Distributing minutes of all key design meetings to the users.
6. Adhering, when possible, to all key subproject time schedules. Low turnover among users is important here; a consensus reached with a user manager's pred- ecessor is of dubious value. I
The SAP debacle described in the beginning of the chapter illustrates what can happen when a project in this category does not benefit from adequate user in- volvement. End-user requirements for the system were unclear from the beginning. The project manager and his staff paid little heed to communications with users or to change management. In the middle of the project people with limited technical backgrounds and nu familiarity with the division's operations replaced key users. Al- though the technology was familiar to the company, a mismatch grew between the design of the system and the needs of the organization. Eventually the mismatch be- came impossible to ignore. At a cost of millions of dollars, the project was halted, restaffed, and restarted.
Once the design is finalized, the importance of user leadership increases. At some point after the design is finalized, users almost always come up with "great new ideas." Unless the alternatives they suggest are critical to the business (a judgment best made by a responsible user-oriented project manager), the change requests gen- erated by great ideas must be addressed in a formal change-control process. Unless change control follows a disciplined process, users will make change after change. When this happens, a project evolves rapidly into a state of permanent deferral, its completion forever six months in the future.
If the project is well integrated with users, formal planning tools are very helpful in structuring tasks and removing the remaining uncertainties. Target completion dates can be quite firm as long as the system's target remains fixed. Similarly, the formal results controls afford clear insight into progress to date, flagging both ad- vances and slippages (as long as the systems target remains fixed). Personnel con- trols also are vital here. If integration with user departments is weak, for example, excessive reliance on results controls will produce an entirely unwarranted feeling

Chapter 10 A Portfolio Approach to ITProjects 281
of confidence in the project team. By definition, however, the problems of technol- ogy management are usually less difficult in a low-structure/low-technology project than in high-technology ventures, and a staff with a normal mixture of technical backgrounds should be adequate.
In almost every respect a low-structure/low-technology project differs from other types. The key to success is close, aggressive management of external integration, supplemented by formal planning and control tools. Leadership must flow from users rather than from technologists.
Low-Structure/High-Technology Projects Projects in this category have outputs not clearly defined at the project's start. Such projects are also technically complex. Managers therefore require technical expert- ise and an ability to communicate with users about business needs. The same inten- sive external integration needed for low-structure/low-technology projects is neces- sary here. Total user commitment to a particular set of design specifications is again critical. At the same time, strong technical leadership and internal project integra- tion are vital. This effort requires highly experienced project leaders, and those lead- ers need wholehearted support from the users. Before undertaking such a project, managers should seriously explore whether the project can be divided in smaller parts or can employ less innovative technology. Low-structurelhigh-technology projects are extremely difficult and should not be undertaken lightly.
Although formal planning and results-control tools are useful here, in the early stages they contribute little to reducing uncertainty or highlighting problems. Planning tools do allow the manager to structure the sequence of tasks. Unfortunately, new tasks crop up with regularity, and-those that appear simple and small can suddenly become complex and protracted. Further, unsuspected interdependencies between tasks often become apparent. Time, cost, and the resulting technical performance are almost im- possible to predict simultaneously. In NASA's Apollo moon project, for example, tech- nical performance was key and cost and time were secondary. In the private sector, cost and timing usually cannot be considered secondary.
Relative Contribution of Management Tools Table 10.3 shows the relative contribution each of the four groups of project manage- ment tools makes to maximizing potential project success. It reveals that different management styles and approaches are needed for managing the different types of projects. The usual corporate handbook on project management, with its single- minded prescriptive approach, fails to deal with the realities of the tasks facing today's managers, particularly those dealing with information technology. The right approach to managing a project flows from the specific characteristics of the project.
Additionally, the need to deal with the corporate culture within which both IT and the project team operate further complicates the project management problem. Formal project planning and results-control.tools are much more likely to produce successful results in highly formal environments than they are in companies where the prevailing culture is more informal. Similarly, selecting and effectively using integrating mecha- nisms is very much a h c t i o n of the corporate culture. Too many former IT managers

282 Module Four Managing and Leading a Networked IT Organization
TABLE 10.3 Relative Contribution of Tools to Ensuring Project Success by Project 'Qpe
Project i Type I I
Project Description
High structure-low techno ogy, large High structure-low technobogy, small High structure-high technology, large High structure-high technology, small Low structure-low technology, large Low structure-low technology, small Low structure-high technology, large Low structure-high technclogy, small
External Integration
Low
Low
Low
Low
High
High
High.
High
Internal Integration
Medium
Low
High
High
Medium
Low
High
High
Formal Planning
High
Medium
Medium
Low
High
Medium
Low +
Low
Forma[ Results Control
High
High
Medium
Low
High
High
Law +
Low
have made the fatal assumption that they were in an ideal position to refonn the cor- porate culture.
Emergence of Adaptive Project Management ~ e t h o d s ~ The trend in the last decade has been toward projects that challenge traditional tools for project management and entail very high implementation risk. Business re- quirements for many enterprise systems are not well defined in advance and also in- volve new technologies. As investments, these systems have unattractive profiles. They require large iwestments, most of which must be spent up-front, to a~hieve un- certain (because of their inherently high implementation risk) benefits.
As we have noted, results-control tools and traditional planning methodologies do not work well in the presence of so much outcome uncertainty. Project managers who are expert in communicating with the user and in project technologies can help mediate the risks. Increasingly, however, outcome uncertainty and difficulty in de- termining system requirements in advance are leading to evolution in the project management process.
An emerging response to these conditions is adaptive methods: approaches to de- sign, deployment, implementation, and investment that assume a need to gather in- formation and to learn as one goes. To be used successfully, adaptive methods re- quire that project staff be able to experiment during a project without incurring prohibitively high costs. Although evolving prototyping technologies allow low-cost project experimentation, adaptive methods are not yet universally applicable. To un- derstand adaptive methods, consider the methodologies they are intended to replace.
3 ~ h e materials on "adaptive methods" are based on work by Professor Austin.

Chapter 10 A Portfolio Approach to ITProjects 283
Software Development Life Cycles Traditionally, the activities necessary to design, implement, and operate information systems have been combined into a methodology that is sometimes called the sys- tem development life cycle (SDLC).~ SDLC represents IT projects in a sequence of phases. The names of the phases vary across SDLC examples, but most are more or less consistent with the following:
Analysis and design. The traditional process begins with a comprehensive analysis of requirements, followed by documentation of the desired capabilities of the system in a form that can be used by system developers to code and implement the system. Either a user request or a joint IT departmentluser proposal which includes a formal statement of costs and benefits often initiates the process. IT professionals typically manage the design process. Today business users and technology specialists-often supported by vendors and/or consultants-determine the requirements for developing a new system or adapting a software package or in-place system.
Construction. Once requirements, costs, and benefits are defined and specifi- cations are developed, the system can be coded. Traditionally, construction was a highly specialized activity that combined high levels of technological skill with a large dose of art, experience, and logic. Today, system construction involves selecting appropriate computer equipment and then creating, buying, and adapting the computer programs needed to meet system requirements. The final step is to test the system both in the laboratory (often called alpha testing) and in the real-world user environment (often called beta testing). Intense coor- dination and control are required to assure that the project remains on track, within budget, and focused on user requirements. Even the best designs require numerous interdependent decisions that must be made in real time as the system is being constructed. Large, often dispersed project teams must coordi- nate closely to ensure that the system components will work together flawlessly. The decision to outsource portions of the project or the entire project markedly increases coordination and control costs, because all technical decisions and tasks still must be managed, but this time across firm boundaries.
Implementation. Implenienting a new IT system involves extensive coordina- tion between the user and the technologist as the transition is made from the predominantly technical IT-driven task of construction to user-driven ongoing management of the completed system. Whether the system is bought or made, the implementation phase is very much a joint effort. Extensive testing, which may disrupt normal business operations, must be performed; training is
41t is worth noting that the list of responsibilities inherent in this methodology remains with the firm regardless of whether all or a portion of the system development process and IT operationslmanagement is outsourced. The job of IT and business management i s t o ensur'e that those tasks are performed in the most effective and efficient manner regardless of where or by whom they are performed.

I 284 Module Four Managing and Leading ir Nehvorked IT Organization
required; and work procedures and communication patterns may be disrupted. Often achieving the benefits of the system is dependent on the ability of indi- viduals and groups to learn to use information from the system to make better decisions and add value to the business. It is essential to shape the org;miza- tion's operational and management structure, processes, and incentives to exploit the potential of an IT system. In this world of electronic commerce, the impact of the system often extends to groups and individuals outside the organ- ization, which further complicates implementation.
Operation and maintenance. To avoid ongoing problems, operation and maintenance are planned in advance, ideally during the early stages of requirements de.finition and design. Maintenance is complex, particularly for
, older systems. 11: requires highly competent professionals to perform the necessary changes safely and in a way that does not bringthe system (and the firm) to a crashing halt.
. .
Adaptive Methodologies Adaptive and prototyping intensive methodologies call for quickly building a rough preliminary version of the system without going through a leng1,hy or for- mal requirement definition or design phase. Interacting with an early prototype makes the system easier to visualize for both users and developers. Thus, adap- tive approaches iterate quickly through the traditional phases of design, con- struction, implementation, and operation, improving the performance of the product each time. Instead of moving slowly and deliberately through develop- ment phases, adaptive projects try to loop through each phase every week or even every day. Early prototypes are typically crude, but they are an excellent basis for discussions about system requirements between developers and users throughout development.
Companies that have implemented large enterprise systems successfully, such as Cisco and Tektroni~, have tended to restructure projects to formally incorporate the idea of in-progress learning and midcourse adjustment. Although adaptive projects are carried out in a variety of ways, they share five basic characteristics:
1. They are iterative. Design, construction, and implementation occur in small in- crements that result from each iteration so that outcomes and interactions can be tested as they appear.
2. They rely on fast cycles and require frequent delivery of value so that incremen- tal implementation does not slow down a project. Long lead times and variable delivery timing are discouraged.
3. They emphasize early delivery to end users of functionality, however limited, so that feedback can be incorporated into learning and improvement cycles.
4. They require skilled project staff capable of learning and making midcourse ad- justments in the middle of deployment.

Chapter 10 A PorEfolio Approach to IT Projects 285
5. They often resist return on investment (ROI) and other similar tools for in- vestment decision makiGg that implicitly assume predictability of outcomes, instead emphasizing "buying of information" about outcomes as a legitimate expenditure.'
Although Cisco's managers did not explicitly identify their project manage- ment approach as "adaptive," they explicitly emphasized "rapid, iterative proto- typing" as the basis for their approach. Tektronix divided its project into more than 20 "waves" that provided formal opportunities for delibedtion, adjustment, and learning.
In recent years adaptive methods have made significant inroads into the ways in which developers create systems and software. As more off-the-shelf system compo- nents and more over-the-Net IT services become available, manyefirms are doing less . and less software development internally. But even installing vendor software requires systems development. "Extreme programming" (or X P ) ~ and "adaptive software developmentw7 are examples of popular adaptive development approaches. Open- source software development, a technique that has led to the development of widely used infrastructure components such as the Linux operating system and the Apache Web server, also has adaptive characteristics.*
Adaptive methods emphasize low-cost experimentation and rapid delivery of sys- tem prototypes. They deemphasize up-front planning intended to "get it right the first time." In essence, the adaptive approach is to create something that works roughly as quickly as possible, begin to experience unexpected effects as soon as possible, and then change and improve the system rapidly. Adaptive Aethods are de- signed to offset the inevitability of unexpected outcomes. - -
It is worth noting that formal results-oriented controls not only work badly for large, risky projects but also can lead to dysfunction and disaster. For example, hold- ing tightly to early schedule and functionality promises can provide project man- agers with incentives to downplay or ignore complicating factors that come to light as a project unfolds. Within an adaptive framework, unexpected complications are learning inputs that prompt midcourse adjustments. In a traditional results-oriented
'~ober t D. Austin and Richard L. Nolan have suggested in the paper "Manage ERP Initiatives as New Ventures, Not IT Projects" (Harvard Business School Working Paper 99-024) that very large IT projects have risk profiles that resemble those of new ventures more than those of traditional IT projects. Venture investors cope with risky venture profiles by using a variety of adaptive techniques that legitimize the notion of buying information aboutJhe new venture. Large IT projects must adopt a similar approach that recognizes the impossibility of knowing everything in advance and the importance of in-progress learning. ' ~ e n t Beck, Extreme Programming Explained: Embrace Change ( ~ e a d i n ~ , MA: Addison- Wesley, 1999). 7~ames A. Highsmith Ill, Adaptive Software Development: A Collaborative Approach to Managing Complex Systems (New York: Dorset House, 1999). * ~ r i c 5. Raymond, Cathedral & the Bazaar Musings on Linux & Open Source by an Acci- dental Revolutionary (O'Reilly & Associates, 2001).

286 Module Four Managing and Leading a Networked IT Organiza~ion
framework, complications often are swe:pt under the rug because they interfere with the achievement of preset project milestones and because implementation team members-are reluctant to admit that they failed to anticipate the complications. This dysfunctional dynamic can be especially significant if a company has hired expert consultants to assist with implementation. Consultants hired as experts dread ad- mitting that they did not foresee complications, and client company managers often assume that experts must have anticipated all the possible complications. 111 this sit- uation an unexpected complication can translate into systemic lack of communica- tion between consultants, who do not want to admit what they did not anticipate, and client managers, who have unrealistic expectations about what the consultants should have'foreseen.
Adaptive Methods and Change Management Earlier in this chapter we noted the importance of exercising discipline when con- sidering the system changes that users suggest once a design is finalized. ,4daptive methods do not aspire to finalize a design in a discrete early phase of a project; in- stead, adaptive methods call for an acceptable design to emerge gradually during the development process. It would be a serious mistake, however, to conclude that change management is less important fbr adaptive projects.
Adaptive projects achieve change management in part by intensely involving users in evaluating the outcome of each development iteration and deciding on the next enhancement to be introduced into the system. Users are forced to confront at every iteration trade-offs between delay in obtaining useful results and implementa- tion of their "great ideas." When the development process is i n active collaboration between users and the IT staff, a natural discipline evolves to control unreasonable user requests.
But change management becomes important for adaptive projects in a different sense as well. Adaplive methods are an emerging response to outcome uncertainty in systems develop~nent. Rigorous change management is the corresponding re- sponse to the same ltind of uncertainty when one changes existing systems vital to a company's operations. The approaches are two halves of a management system for balancing IT systems agility with rigorous operational control.
The essence of sound change management is to strictly control the migration of system features from development, through testing, into production with a clear un- derstanding of the benefits and the potential for unanticipated problems at each stage. Successful change managers introduce new system features into production infrastructure with high confidence in the clianges. They know at all timcs exactly what is running in their production environment and are therefore better able to di- agnose problems and respond to incidents quickly. Effective change management in fact makes adaptive development possible by insulating the production environment from adaptive experimentation. Adaptive methods make sense only when the exper- iments do not result in catastrophic consequences, and effective change manage- ment prevents that situation.

Chapter 10 A Por?folio Approach to ITProjects 287
Process Consistency and A&ty in Project ~ a n a ~ e m e n t ~ I In practice, project management always involves balancing a tension between process consistency and process agility. Project managers need to ensure a thorough and disciplined approach to make sure that no balls are dropped, all requirements are met adequately, and no important details go unnoticed. This usually is accomplished through formal specification of project steps, required documentation, and compli- ance mechanisms (such as reviews or progress reports). At the same time, however, companies need to retain an ability to change direction, in the middle of a project if necessary, when business conditions require it. The tension arises from the fact that the tools used to improve consistency-specifications, documentation, compliance mechanisms--often are perceived as encumbrances that work against project re- sponsiveness and agility. A firm that is well practiced and expert in its established routines may have trouble changing them. A firm that has grown accustomed to us-. ing certain tools may continue to try to use them in business conditions in which they are less appropriate.
In the last decade many companies have struggled with this issue, including many technology companies for which responsiveness to market and time to market were over- riding concerns. For the most part, these companies resisted full-fledged adoption of tra- ditional project methodologies because they perceived that adoption-as too damaging to project agility, In place of traditional project management methodologies, many Network Economy companies have attempted to develop "light" methodologies that contain the essential e1,ements of "heavy" methodologies but are not as cumbersome.
A Minimalist Approach to Process Formalization
The companies that have been most successhl in balancing discipline and agility have neither eschewed process formalization altogether nor let process formalization efforts . I overwhelm them. Rather, they have developed simple process management tools based on the idea that the best balance is one that includes the minimum formal specification critical to the success of a project. These simple tools fall into three categories:
Flow. People working on projects need to hnderstand the relationships between their activities and those of others. That is, they'need to understand the overall process "flow." Process tools in this category can be simple depictions of the . process context that are intended to give decision makers at specific points in the process a sense of the overall business picture. Deep detail is not required or recommended. Simple schedules and flowcharts work well here.
Completeness. People working on projects need to be sure that everything is being done, that no Gall is being dropped. This is where detail comes into the picture. Tools in this category can be simple lists to convey what needs to be
he materials in this section are based on a note by Professor Austin. 1 . I . '

288 Module Four Managing and Leading a Networked IT Organization
done, when it needs to be done, by whom, and whether it is complete. Simple checklists work well here.
Visibility. People working on projects need to be able to review processes while they are being executed to get status information. Ideally anyone, whether from engineering, marketing, or elsewhere, can review the same "picture" and come away with the rnformation he or she needs. Visibility is not easy to achieve. Computerized status-reporting systems can provide this kind of visibility, but some of the best solutions are simple wall charts that allow status to be tracked in a way that everyone (in one physical location, anyway) can see.
In some contexts. another category of tools must be added: tools to ensure that project activities are auditable. This may be true of projects that will result in gov- ernment systems or safety-related systems.
Managing the tension between consistency and agility is for most conlpanies a general process issue that extends well beyond project management. Process frame- works from earlier times, when systems were proprietary and the common Internet platform was not available for commerce, significantly encumber many Industrial Economy firms. As these companies work to make the transition to the Network Economy, they face the difficult task of distilling processes down to essential ele- ments to reclaim lost project and organizational agility.
Summary The last decade has brought new challenges to IT project management and new in- sights into the management process. Our research in these areas leads us to three conclusions:
1. Firms will continue to experience major disappointments as they push into new application areas and technologies. Today, however, the dimensions of imple- mentation risk can be identified in advance, and this information can be included in the decision process. If a firm implements only high-risk projects, sometimes it will fail.
2. A firm's IT development projects in the aggregate represent a portfolio. Just as financial fund managers calculate and manage the risks within their portfolios, general management must make critical strategic decisions on the aggregate im- plementation risk: profile of the IT portfolio.
3. Project management in the IT field is complex and multidimensional; different types of projects require different clusters of management tools.
As we have seen: progress in understanding how to manage projects continues. The emergence of adaptive methods is an interesting development, but we are still evaluating its ultimate applicability. Executives can use the following ques- tions to assess whether they are managing the risks inherent in IT projecls to max- imize gain:

Chapter 10 A Portfolio Approuch to IT Projects 289
1. Have you established risk assessment procedures (such as the questionnaire in Figure 10.3) to evaluate the risk of individual projects? Is such a procedure a stan- dard part of project approval and status reporting at the company?
2. Do our project planning, tracking, and control processes account adequately for differences in types of projects (higwlow structure, higwlow technology)? Are our management expectations about projects sufficiently contingent on inherent project risk factors?
3. Have we performed a risk analysis on our portfolio of application projects? If so, is the portfolio risk profile appropriate to the quadrant of the strategic grid in which we operate? Is it a good fit with our business objectives and strategies?
4. Are we exploring emerging project management methodologies to determine their applicability to our business?


Conclusion The Challenges of Managing in a Network Economy Revisited
Prediction is hard, especially of the future. -Yogi Berra, hall of fame baseball player and manager
In 1943 Thomas Watson, the venerable chairman of the IBM Corporation, pre- dicted that there would be a world market for "maybe five computers." Today there are hundreds of millions of computers worldwide. The magnitude of the error in this "expert's" forecast stands as a reminder that it is difficult to see far into the future. A quick glance backward reinforces the point. In 1992 there were no Web browsers. Before 1995 Amazon.com was but a glimmer in Jeff Bezos's eye. Five years ago who would have foreseen the rapid rise-and fall-of the "dot-com bubble"? Much has changed very quickly, and nothing has happened to suggest that the IT industry is on the verge of slowing down its pace of evolution and change. There is surely more excitement ahead.
The objective of this book has been to provide its readers with a better under- standing of the influence of 2lst-century technologies on executive decisions. While this kind of understanding may help sharpen our predictions, our aim has not been to arm you to engage in future thinking for prediction's sake alone. In- stead, we have focused on providing analytic frameworks and an overview of the issues involved in using those frameworks to identify opportunities, design and ddploy new technology-based businesses, and create business value in the Net- work Economy. These frameworks are based on concepts and theory that have withstood the test of time and remain relevant despite radical changes in the busi- ness environment. We have dealt with enduring practical questions from the point of view of the executives who are grappling with them. Not long ago, many pre- dicted the death of traditional economic and management pyinciples. The subse- quent fall in technology market stocks suggests that we should not be too quick to throw out fundamental management principles as we embrace the new.
291

292 Conclusion The Challenges of Managing in a Network Economj~ Revisited
Markets and models, capabilities and organization, networked infrastructure and operations, and leadership of the IT organization are core subject areas that can be used to organize the .management issues discussed in this book. Within these subject areas we explored the following key themes:
1. The continuous pace of technology evolution requires that we confront new choices for designing and building industries, markets, and organizations.
2. The business moclels that dominated the Industrial Economy are evolving to take advantage of the new technologies and business practices of the Network Econ- omy, giving rise to new sources of power and differentiation.
3. The types of opportunities pursued and the technology employed strongly influ- ence the approacll to developing, operating, and managing IT.
4. As IT infrastructure becomes more standardized, modular, and scalable, we are seeing a shift in IT investment priorities and decisions from a cost-avoidance, project-centered approach to an asset-based, strategic option approach.
5. The time required for successful organization learning and assimilation of rap- idly changing technologies limits the practical speed of change. '
6. External industry,, internal organizational, and technological changes are increas- ing the pressure on organizations to buy rather than make IT applications and . - services.
7. The ability to exploit 2lst-century technology demands high levels of engage- ment and cooperation among four key constituencies: business executives, IT ex- ecutives, users, and technology providerslpartners.
8. The ability to ensure high levels of security, privacy, reliability, and availability is a core capability that determines an organization's ultimate success and. survival.
I
9. Over the last decade there has been a fundamental shift in IT that has dramati- cally changed the way people access and use technology, the way organifitions exploit it, and the way it is developed and managed.
As we have demonstrated, the effect of the new technologies on markets and in- dustries will be to alter competitive positions and frame new strategic imperatives that require new capabilities. The new technologies have enabled new business mod- els and improved the viability of old ones; executives in established firms that do not seize the business model opportunities presented by new technologies will find their market positions threatened.
New networked infrastructures interweave complex business-technical issues that general managers dread but that ultimately make the difference between a rigid and constraining IT capability and a flexible and dynamic one. These infrastructures come with many layers of relationships, technology models, and risk management processes that ultimately determine the IT possibilities that dramatically affect the ability to compete today and the busir~ess opportunities that can be pursued in the

Conclusion The Challenges of Managing in a Network Economy Revisited 293
future. Finally, there are the challenges of executing technology-based strategic ini- tiatives, an area that many companies cannot seem to master. The projects grow larger and harder, and decisions must be made ever more quickly. Most executives express concern that this relentless change is occurring much too fast to enable them (and their organizations) to learn. Yet this is an area that must be mastered if disas- ters are to be averted and returns are to be realized from IT investments.


Annotated Bibliography
General Management Bookshelf
Ackoff, Russell L. Creating the Corporate Future: Plan or Be Planned For. New York: Wiley, 1981.An important book that provides a broad context for IT planning.
Anthony, Robert N. The Management Control Function. Boston: Haward Business School Press, 1988. This book introduces the framework of opera- tional control, management control, and strategic planning relative to the area of IT application and its management problems.
Argyris, Chris. On Organizational Learning. Cambridge, MA: Blackwell Business, 1993. Explores how to achieve organizational effectiveness by managing through improved communication processes.
Bartlett, Christopher A., and Sumantra Ghoshal. Managing across Borders: The Transnational Solution. Boston: Harvard Business School Press, 1991.A succinct and mind-expanding discussion of the impact, true costs, and strategic value of computer systems and their notable future influence.
Beer, Michael, Russell A. Eisenstat, and Bert A. Spector. The Critical Path to Corporate RenewaL Boston: Haward Business School Press, 1990? Through an in-depth analysis of six companies that have undergone fundamental changes, the authors describe what works and what does not in corporate renewal.
Bower, Joseph L. Managing the Resource Allocation Process: A Study of Corporate Planning and Invest- ment. Boston: Division of Research, Harvard Business School Classics, 1986. This in-depth analysis of corporate planning and capital budgeting provides critical insights relevant to both the role of steering committees and how IT planning can be done effectively.
Bradley, Stephen P., and Richard L. Nolan, eds. Sense and Respond: Capturing the Value in the Network Era. Boston: Harvard Business School Press, 1998. This book captures the tremendous shift in the adaptiveness of management control systems and organizations in an information- mediated world.
Brealey, Richard, and Stewart C. Myers. Principles of Corporate Finance, 6th edition. New York: McGraw-Hill, 2000. Describes the theory and practice of corporate finance. Discusses why companies and financial markets behave the way they do.
Brynjolfsson, Erik, and Brian Kahin, eds. Under- standing the Digital Economy: Data, Tools and Research. Cambridge, MA: MIT Press, 2000. Considers new types of data collection and research that might help public and private organi- zations analyze the economic impact of the Internet and electronic commerce in the United States and internationally. Main areas of discussion include market structure, competition, and organi- zational change.
Bunnell, David, and Adam Brate. Making the Cisco Connection: The Story behind the Real Internet Superpower. New York: Wiley, 2000. A detailed story of the most Internet-enabled company in the world. It both describes its accomplishment in great detail and identifies what it did to get there.
Burgleman, Robert A., and Modesto A. Maidique. Strategic Management of Technology and Innovation. New York: McGraw-Hill Higher Education, 1992. Using a combination of text, readings, and cases, this book discusses how general managers can augment and develop a firm's capabilities for managing tech- nological innovation.
Burt, Ronald S. Structural Holes: The Social Structure of Competition. Cambridge, MA: Harvard University Press, 1992. The basic element

296 Annotated Bibliography
in this account is the structural hole: a gap between two individuals or organizations that have complementary resources or information. When the two are connected through a third inldividual, an entrepreneur, or an organizational market, the gap is filled, creating important advantages for the intermediary. Competitive advantage is :I matter of access to structural holes in relation to market transactions.
Cairncross, Francis. The Death of Distance: How the Communications Revolution Will Change Our Lives. Boston: Haward Business School Press, 1997. This far-reaching book describes the societal transforma- tion that is being enabled by cheap, ubiquitous global bandwidth.
Champy, James, and Michael Hammer. Reengi- neering the Corporation. New York: Harper Collins, 1993. This pathbreaking book discusses the practical barriers and problems in achieving reengi- neering success.
Chandler, Alfred D., and James W. Cortada, eds. A Nation Transformed by Information: How Informa- tion Has Shaped the United States from Colonial Times to the Present. New York: Oxford University Press, 2000. A 250-yeai* history of the information revolution. It is perhaps the most thoughtful book written on the roots of the information economy.
Christensen, Clayton M. The Innovator's .Dilemma: When New Technologies Cause Great Firms to Fail. Boston: Haward Business School Press, 1.997. An explosive best-seller that highlights the perils of slow-moving change-resistant corporate cultures in a fast-moving technical world.
Copeland, Tom, Tim Koller, and Jack Murrin. Valuation: Measuring and Managing the Value of Companies. New York: Wiley, 2000. Provides insights and information on value creation and measurement, valuing start-ups and other hyper- growth companies, valuing cyclical companies and companies in emerging markets, and calculating the cost of capital and option pricing methods to value flexibility.
Davenport, Thomas H., and John C. Beclc. The Attention Economy: Understanding the New Currency of Business. Boston: HarVard Business School Press, 2001. A thoughtful book that captures
the importance of knowlidge nianagement in an information-overloaded world.
Hamel, Gary, ahd C. I. Prahalad. Competing for the Future. Boston: Haward Business School Press, 1994. How to develop core competencies to implement a future-oriented strategy.
Kuhm, Thomas S. The Structure of Scientific Revo- lution. Chicago: University of Chicago Press, 1970. Thomas Kuhn (1922-1996) argued that scientific advancement is not evolutionary but rather is a "series of peaceful interludes punctuated by intel- lectually violent revolutions." In those revolutions "one conceptual world view is replaced by another."
Leonard, Dorothy A. Wellsprings of Knowledge: Building and Sustaining the Sources of Innovation. Boston: Harvard Business School Press, 1998. Focuses on the knowledge-creating activities and behaviors that managers guide, control, and inspire: developing problem-solving skills, experi- menting to build for the future, integrating infor- mation across internal project and functional boundaries, and importing expertise from outside the firm.
Nolan, Richard L., and David C. Croson. Creative ~estruction: A Six-Step Process for Transforming the Organization. Boston: Haward Business School Press, 1995. This book analyzes the very different organization structures that are made poss.ible by new information technology and the problems involved in implementing those structures.
Nolan, Richard. Dot Vertigo: Doing Business in a Permeable World. New York: Wiley, 2001. A fast- moving book on the special issues of doing business in an Internet-linked customer-supplier world.
Porter, Michael. Competitive Strategy. New York: Free Press, 1995. This widely read book provides a disciplined structure to the question of how firms achieve superior profitability. Porter's rich frame- works and deep insights provide a sophisticated view of competition.
Porter, Michael. Competitive Advantage: Creating and Sustaining Performance, New York: Free Press, 1985. A complement to Competitive Strategy, this

Annotated Bibliography 297
book explores the underpinnings of competitive advantage in the individual firm. Now an essential part of international business thinking, Competitive Advantage takes strategy from broad vision to an internally consistent configuration of activities. Its powerful framework provides the tools needed to understand the drivers of cost and a company's relative cost position.
Shapiro, Carl, and Hal R. Varian. Information Rules: A Strategic Guide to the Network Economy. Boston: Harvard Business School Press, 1998. The first book to distill the economics of information and networks into practical business strategies.
Shell, G. Richard. Bargaining for Advantage: Nego- tiation Strategies for Reasonable People. New York: Viking Penguin, 1999. This book provides a realistic, powerful framework for business and consumer negotiations that will help everyone from the inexperienced anxious negotiator to the seasoned veteran.
Simons, Robert. Levers of ControL Boston: Harvard Business School Press, 1995. Provides a refreshing and new way to think about management control.
Slywotsky, A., and D. Morrison. Profit Patterns: 30 Ways to Anticipate and Profit from Strategic Forces Reshaping Your Business. New York: New York Times Business, 1999. Extrapolating from the painter Pablo Picasso's work, the authors theorize that by recognizing industry patterns-by seeing the order beneath the surface chaos-managers, investors, and entrepreneurs can prepare for change before it occurs.
Tapscott, Don, David Ticoll, and Alex Lowy. Digital Capital: Harnessing the Power of Business Webs. Boston: Harvard Business School Press, 2000. A book on the implications of a digitized, totally wired world.
Timmons, Jeffry A. New Venture Creation: Entrepre- neurship for the 21st Century. New York: McGraw- HilVIrwin, 1999. Covers the process of getting a new venture started, growing the venture, successfully harvesting it, and starting again.
Treacy, Michael, and Fred Wiersema. Disciplines of Market Leaders: Choose Your Customers, Narrow Your Focus, Dominate Your Market. Reading, MA:
Addison-Wesley Publishing Co., 1994. This book presents a view of what needs to be done for firms to be successful in the market.
Williamson, 0. E., and Sidney G. Winter, eds. The Nature of the Firm: Origins, Evolution, and Develop- ment. New York: Oxford University Press, 1993. Develops Ronald H. Coase's theory, first presented in his 1937 article "The Nature of the Firm," that raised fundamental questions about the concept of the firm in economic theory. The book contains the original article as well as a series of lectures by Williamson and Coase's Nobel Prize in Economics acceptance speech.
Yoffie, David B., ed. Competing in the Age of Digital Convergence. Boston: Harvard Business School Press, 1997.An important set of essays on the impli- cations for corporate strategy of computing in a digitized world.
Technology Management Bookshelf
Baldwin, Carliss Y., and Kim Clark. Design Rules: I
The Power of Modularity. Cambridge, MA: MIT Press, 2000. Argues that the computer industry experienced previously unimaginable levels of inno- vation and growth because it embraced the concept of modularity, building complex products from small subsystems that could be designed indepen- dently yet function together as a whole.
Beck, Kent. Extreme Programming: Embrace Change. Reading, MA: Addison-Wesley, 1999. Provides an intriguing high-level overview of the author's Extreme Programming (XP) software development methodology, a controversial approach to software development which chal- lenges the notion that the cost of changing a piece of software must rise dramatically over the course of time.
Brooks, Frederick. The Mythical Man-Month: Essays on Software Engineering. Reading, MA: Addison-Wesley, 1995. One of the classics in the field of program management. The author draws on his experience as the head of operating systems development for IBM's famous 360 mainframe computer and distills his wisdom in an easily acces- sible form.

298 Annotated Bibliography
DeMarco, Tom, and Timothy Lister. Peopleware: Productive Projects and Teams. New York: Dorset House, 1999. Using a conversational and straight- forward style, the authors assert that most projects fail because of failures within the teams running them.
Feghi, Jalal, Jalil Feghi, and Peter Williams. Digital Certificates: Applied Internet Security. Reading, M A : Addison-Wesley, 1999. An excellent reference on the subject of encryption and digital certificates.
Forcht, Karen A. Computer Security Management. Danvers, MA: Boyd & Fraser, 1994. A practical book that describes the multiple aspects of computer security and the steps to be taken to gain good results.
Highsmith, James 111. Adaptive Software Devefop- ment: A Collaborative Approach to Managing Complex Systems. New York: Dorset House, 1999. Provides a series of frameworks to help an organiza- tion employ adaptive principles, establish collabora- tion, and provide a path toward using an adaptive approach on large projects.
Hoch, Detlev J., Cyriac R. Roeding, Gerr Purkett, and Sandro K. Lindner. Secrets of Software Success: Management Insights from 100 Software Firms around the World Boston: Hamard Business School Press, 1999.A practical book that focuses on the issues that must be resolved for a successful software implementation.
Lawrence, Paul R., and Jay W. Lorsch. Organiza- tion and Environment: Managing Integration and Differentiation. Boston: Harvard Business School Classics, 1986. This classic presents the underlying thinking of the need for specialized departments and how they should interface with the rest of the organization. I t is relevant for all IT organizational decisions.
Lucas, Henry C., Jr. Information Technology and the Productivity Paradox: Assessing the Valuv of Investing in IT. New York: Oxford University Press, 1999. An interesting analysis of how one goes about justifying IT investments.
McKenney, James L. Waves of Change: Business Evolution through Information Technologv. Boston: Hamard Business School Press, 1995. This book
captures the long-term dynamics of an evolving information architecture as it traces more than 30 years of the history of information technology in four organizations.
Perrow, Charles. NormalAccidents: Living with Hig,h Risk Technologies. Princeton, NJ: Princeton University Press, 1999. Looking at an array of real and potential technological mishaps- including the Bhopal chemical plant accident of 1984, the Challenger explosion of 1986, and the possible disruptions ofY2K and genetic engineering-Perrow concludes that as our technologies become more complex, the odds of tragic results increase.
Raymond, Eric S., and Bob Young. The Chthedral and the Bazaar: Musings on Linux and Open Source by an Accidental Revolutionary. Sebastapol, CA: O'Reilly and Associates, 2001. A text defining the open source revolution in computing, discussing the advantages of open source computing with such technologies as Perl, Linux, and Apache. Offers a glimpse into the future of these types of technologies and their uses in the digntal age.
Smith, H. Jeff. Managing Privacy Informat!ion Tech- nology and Corporate America. Chapel Hill: Univer- sity of North Carolina Press, 1994.A very practical book that talks about information technology privacy, current practices, and issues for the future.
Upton, David. Designing, Managing, and Improving Operations. Upper Saddle River, NJ: Prentice-Hall, 1998. An example of Upton's writings on the benefits of incremental improve- ment strategies and especially the need to design operational infrastructures so that they can be improved incrementally.
Utterback, James. Mastering the Dynamics of Inno- vation: How Companies Can Seize Opportrrnities in the Face of Technological Change. Boston: Hamard Business School Press, 1994.An analysis of the forces to manage in developing new products and processes as a strategic force.
Wheelwright, Steven C., and Kim B. Clark. Leading Product Development. New York: Free Press, 1995. A focused view on senior management's role in shaping strategy based on continuous product

Annotated Bibliography 299
development as a competitive means. Time from 20th century through a focus on innovative concept to market is the critical success factor. companies such as DuPont.
Yates, Joanne. Control through Communication: Zwicky, Elizabeth D., Simon Cooper, and D. Brent The Rise of System in American Management. Chapman. Building Internet Firewalls, 2nd edition. Baltimore: Johns Hopkins University Press, 1993. Sebastapol, CA: O'Reilly, 2000. An excellent Traces the evolution of internal communication reference on firewalls and their capabilities. systems through the late 19th century and into the


Index
A AT&T, 60 analyzing, 1 16 Auction exchanges, 5 1 approaches to business model
Accenture, 57,63,214,271 Austin, Robert D., 3n, 15 1 n, 157n, evolution, 63-64 Accessible knowledge assets, 91 16711, 179n, 207n, 216n,220n,221, asset options, 75-76 Adaptive methodologies, 282,284-286 223,285n, 287n classifying, 46-48 Adaptive software development, 285 Authentication, 196 components, 7,47 ADP, 253 Autoweb, 50 focused distributors, 48-5 1 Advisers, 57 Availability, 18 1-186 infrastructure distributors, 57-58 Affinity portals, 53 infrastructure portals, 58, 60, 61 Agency.com, 63 infrastructure service providers, Aggregators, 50 B 60-63 Albright, T., 71n portals, 5 1-53 Amazon.com, 37-39,41,68-72, 102 Back-office transactions, 32 producers, 53-57 America Online, 60, 1 18 Backbone providers, 185 revenue options, 74-75 American Airlines, 33-34, 37, 39 Baker, L., 71 step-by-step analysis, 73-74 American Express, 7, 13,26,54,64-68 Baldwin, C., 85n Business-to-business (B2B) auction American Express Interactive (AXI), Bandwidth, 168, 170 exchange, 5 1
64-68 Barnes &Noble, 38 Business-to-business (B2B) American Hospital Supply Corporation Barnevik, Percy, 80 infomediaries, 50
(AHSC), 33-34,39 Barriers to entry, 36-39 Business-to-consumer (B2C) AMP Insurance Company, 254 Bartlett, C., 80n, 82n exchange, 5 1 Analyzing business models, 136-142 B2B, 5 1 Business-to-consumer (B2C) Analyzing capabilities, 138-141 B2B infomediaries, 50 infomediaries, 50 Analyzing financial performance, B2C, 5 1 Buy versus make decision, 13-15
143-144 B2C infomediaries, 50 Buyer-supplier relationships, 34-36 Analyzing marketslcapabilities, Beck, Kent, 285n
107-108 Benjamin, R., In, 98n Analyzing the business concept,
136-137 Analyzing value, 141-142 Annotated bibliography, 295-299 AOL-Time Warner, 28,39,51n AOL-Time Warner mergers, 6,24,
104-105 AOL.com, 53 Applegate, Lynda M., 3n, 24n, 33n,
35n, 38n, 41n,43n, 48n, 50n, 5111, 64n,67n, 7 9 4 80n, 87n, 9111,9611, 98n, loon, 10211, 10711, 115n
Application service provider (ASP), 60,97n
Argyris, Chris, 12 Ariba, 35 Ashford.com, 70 Asynchronous transfer mode
(ATM), 170
Berra, Yogi, 291 Bertelsmann, 27, 38, 41 Bibliography, 295-299 Bonanos, P., 26n Book, overview, 18 Borders, 38 Brand equity, 14 1 Brealey, R. A,, 146n British Aerospace, 254 British Telecom, 60 Broadband communication systems, 89 Budget, 248 Burns, T., 8 ln Burstable bandwidth, 2 19n Burt, R., 118n Business concept, 45, 123 Business models, 6,43-76
Amazon.com, 68-72 American Express, 64-68
Cable modem, 170 Caching, 162 Calloway, Wayne, 96 Camp, Jeff,J86n, 216n Cap Gemini, 252 Capabilities, 45 Capability analysis, 123, 124 Capital asset pricing model
(CAPM), 146 Cash, Jim, 12,29n Cash flow profile, 210 Cavallaro, M., 41n C2C exchanges, 5 1 Centralized computing architecture, 153 Centralized IT management, 240-241 Chandler, A. D., 116n Change management, 197-199,286

302 Index
Channel consolidation, 35 Charles Schwab, 26,34 Chemdex, 35 Cisco Systems, 13,284 Citibank, 261 Clark, K., 85n Clarke, Richard, 188, 205n Client-server computing, 154 Client systems, 162-163 Climate control, 185 Closed-circuit television monitors, 185 Cnet.com, 58 Code Re4 194 Collura, Meredith, 35n, 3811,4811, 67n,
102n, 107n Colocation hosting, 2 17 Commerce benefits, 9, 11, 127, 130 Commerce Nehvork, 70 CommerceOne, 35, 102 Common carriers, 58 Commonwealth Bank, 251 Community benefits, 10, 11, 127, 130 Community penetration, 140 Comparable company valuation,
146147 Competitive dynamics and strategy, 137 Competitive mechanism, 33 Competitive scope, 33 Complex dedicated hosting, 218 Component manufacturers, 63 CompUSA, 58 CompuServe, 5 1 Computer Associates, 256 Computer Sciences Corporation (CSC),
252,253,258,271 Connected, 2 14 Consumer-to-consumer (C2C)
exchanges, 5 1 Content benefits, 9-1 1, 127, 130 Control and integration, 90 ,
Converge, 58 Cook, Scott, 39,43n Copeland, D., 33n,98n Copeland, T., 124n Corporate data management, 242 Cost estimation/analysis, 242-246 Cotteleer, Mark J., 157n Covisint, 6, 53, 54, 57, 103-105,
118-121 Cracker, 180n Creating Business Advantage in the
Information Age (Applegate et al.), 3
Critical failure factors, 94 CSC, 252,253,258,271 Current ratio, 142 Custom dedicated hosting,.218 Custom software and integration
service providers, 63
DaimlerChrysler, 118 DCF valuation, 145-146 DI)oS attacks, 190 Dedicated hosting, 2 18 Defensive measures, 194-1 98 Degradation of service attacks, 192 Della.com, 70 Denial of service (DoS).attack,
189,192 DaSanctis, G., 80n Digex, 60,216 Digital business infrastructure, 29 Digital certificates, 197 Digital subscriber line (DSL), 170 Disaster recovery, 202-204 Discounted cash flow (DCF) valuation,
145-146 Distributed denial of service (DDoS)
attacks, 190 I
Distributors, 47 Dorf, Richard C., 33n DIIS attack, 189, 192 DIIS handshake, 190 Dot-com bubble, 2-3 Duw Jones, 57 Drucker, Peter, 12 1 Drugstore.com, 70 Duet. 41
E..Business on Demand, 68 E-Business Solutions, 60 E-Loan, 48, 50 E-retailers, 48 E.41,228 Earthlink, 60 Eastman Kodak, 98 el3ay, 16,51,81, 102, 118 EBITDA, 143 Economies of scale, 28, 1 16 Economies of scope, 28, 1 16
EDS, 271 Educators, 54 Egghead, 58 Elebash, LeGrand, 174 Electronic Data Systems, 252,253,
257,258,266 Employease, 214 Encryption, 196-198 Energized participation, 95 . Engagement, 140 English, Kevin, 103n Enterprise application integration
(EAI), 228 Entrepreneurial leadership, 94 Entrepreneurial management
process, 89 Entrepreneurial operations, 85 Entrepreneurial organization, 1 10-1 1.3
manufacturers, 60 Eras of IT evolution, 128 Eras of technology evolution, 16 Ethernet LAN, 170 Ethernet protocol, 160 Euromoney, 57 Exchanges, 5 1 Exodus, 2 16 External attacks, 189.-192 External integration tools, 276,277 Extreme programming (p), 285
Facilities, 158, 165-166 Facility visit report (hosting
provider), 223 Factory quadrant of strategic grid, 8, 20 Fast-cycled innovation, 138 FCF, 142-144 Feasibility studies, 241, 270 Feghi, Jalal, 197n Feghi, Jalil, 197n Fingerprints, 198 Fire suppression, 185 Firewalls, 161, 195-196 Focused distributors, 48-5 1 Ford Motor Company, 26, 54, 1 17, 157 Formal control tools, 277 Formal planning tools, 276, 277 Formal results-control
mechanisms, 277 France Telecom, 26

Index 303
Free cash flow (FCF), 142-144 FreeMarkets, 5 1 Freiberger, Paul, 155n Front-office transactions, 32 Fulk, J., 80n
Galbraith, J., 81n, 82n General Dynamics, 258,266 General Electric, 26 General Motors, 98, 258,266 Gersick, C., 24n Gerstner, Lou, 14 Getman, Frank, 63 Ghoshal, S., 82n Gigabit Ethernet, 170 Global Crossing, 2 16 Global exchange Services, 60 Global Healthcare Exchange (GHX), . .
35-36,57, 103 Goldman, Hollie, 186n Gomezjurado, Jaime, 2 16n GPOs, 36 Granovetter, M., 99n Greiner, L., 81n, 89n Group purchasing organizations
(GPOs), 36
Hackers, 180, 189 Handshake, 190 Hanna, Jack, 92 Harvard University, 54 Hayes, Rutherford B., 23 Healthcare Purchasing Partners
International (HPPI), 36, 103 Help desk, 186 Henry, April, 2 16n Hierarchical leadership, 93 Hierarchical operations, 84 Hierarchy organization, 1.10-1 13 High-availability facilities, 184-1 86 High-structurehigh-technology
projects, 278-279 High-structure/low-technology
projects, 278 Highsmith, James A,, 111, 28511 Horizontal infrastructure portals, 60 Horizontal portals, 53
Host authentication, 196 Hosting, 2 15-219 Hosting providers, 221 Hosting service provider industry, 216 HPPI, 36, 103 Hubs, 159-160
IBM, 26,60,68,252,256,258,271 ICA framework, 30-33 IDSs, 161 Implementation risk, 270-275 Incident management, 202-204 Incident response procedures, 186 Incremental outsourcing, 2 14-2 19 Independent software vendors
(~svS), 212 Industrial economies of scale, 117 Industrial economies of scope, 1 17 Industrial economy, 30 Industrial/economy business
innovations, 28 Industrial/network economies,
compared, 1 16-121 Industry and competitive analysis,
30-33 Industry dynamics, 4-6 Infomediaries, 50 Information and knowledge
capabilities, 139-140 Information and news services, 57 Information economy, 30 Information technology. See IT Information technology (IT)
inkrastructure, 15 1 Infrastructure aggregators, 58 Infrastructure distributors. 57-59 Infrastructure exchanges, 58 Infrastructure functionality and
flexibility, 141 Infrastructure management
systems, 165 Infrastructure marketplace, 58 Infrastructure portals, 58, 60, 61 Infrastructure producers, 60-63 Infrastructure retailers, 58 Infrastructure service providers, 63 Ingrained values, 96 Ingram Micro, 58 Institutional investors, 144n InsWeb, 47,48,50
Integrated Services Digital Network (ISDN), 170
Integration tools, 276, 277 Internal integration tools, 276,277 Internal vs. external service ,
delivery, 2 15 Internet Securities, Inc., 50, 91 Internetwork-based computing, 154 Internetworking infrastructure,
151-177 asynchronous operation, 168 business implications, 169 components, 157-1 58 decentralization, 169 future of, 175-176 latency, 168 legacy systems, 175 open standards, 167 operational characteristics, 167-1 69 operational threats, 172-1 73 real-time infrastructure, 170-1 72 scalability, 169 service delivery, 173-1 75 technological elements of facilities,
165-166 technological elements of networks,
159-i62 technological elements of
processing systems, 162-165 Interorganizational governance
system, 100 Interorganizational management
system, 100 Intrusion, 192-1 93 Intrusion detection, 198 Intrusion detection systems (IDSs), 161 Intuit, 2 6 , 3 9 4 0 Investor loyalty and trust, 141 IP address, 167 ISVs, 212 IT
barriers to entry, 36-39 benefits, 9-1 1, 126-134 buyer-supplier relationship, 34-36 eras, 16, 128 impact, 7-8 prioritizing investments, 8-1 1 products/services, 40-41 reengineer core value activities,
32-34 strategic impact, 19-20 switching costs, 39-40
IT budget, 248-249

304 Index
IT dominance, 235 IT infrastructure, 15 1 IT infrastructure assets, 228-229 IT policy groups responsibilities, 247 IT responsibilities, 244-245 IT service chains, 212 iVillage.com, 53
J. Crew, 2 16 J. P. MorganIChase, 266 Johnston, R., In
Kenvin, W., 126n Key themes. See Themes Knowledge and community barriers, 37 Knowledge benefits, 127, 130 Knowledge capital, 139 Kodak, 253,266 Koller, T., 124n Kotter, J., 93n Kuhn, T., 44n, 107n
LAN, 159 LAN protocols, 160 Latency, 168 Lawrence, P., In, 82n Leadership, 93 Leading. See Organizing and
leading Leading and engaging capabilities,
93-97, 124 Learning by doing, 89,90 Leased lines (TI, T3), 170 Legacy systems, 175,225-228 Leonard, Dorothy A,, 226n Lev, B., 142n Li & Fung, 27 Liebrock, Larry, 192n Lifetime value, 140 Local area network (LAN), 159 Lockheed Martin, 252 Loftus, F!, 103n, 1 1811 Lorh. S., 26n Lorsch, J., 8111, 82n
Low-structurehigh-technology projects, 28 1
Low-structure/low-technolc~gy projects, 280-281
Loyalty, 140 Lucent, 63 Lucier, C., 1 15n
McFarlan, F. Warren, 3n, 23x1, 27n, 5111, 251n, 254n
McKenney, James L., 2,23n,27n,33n, 5111,9811
McKinsey, 57 McLeod, Poppy, 12 Mueder, Paul, 123 Mainframe-based centralized
computing, 154 Mainframe era, 128 Mainframes, 163 Make versus buy decision, 13-15 Malicious threats, 188-1 9:! MaIone, T., In, 98n Management tools, 276-277,28 1-282 Managing and learning capabilities,
88-92, 124 Manning, Harley, 186n Manufacturers, 54 Market capitalization, 146 Market opportunity, 136 Market structure, 4 4 MarketMile, 67, 68 Marketplaces, 50 Massachusetts Blue Cross and Blue
Shield, 257 MedBuy, 36 Mental models, 12,44 Merchant, Kenneth A,, 277n Merrill Lynch, 34 Metcalfe, Robert, 156n Metcalfe's law, 156 Neyers, S. C., 146n
I
Microcomputer era, 128 Microsoft, 26,40,47,63,214,256 Wficrosofi Great Plains Business
Solutions, 214 hliddleware, 164 Ivliles, R., In Minimalist approach to process
formalization, 287-288 hiontealegre, R., 98n
Moore, Gordon, 153 Moore's law, 153 Morrison, D., 44n Mowrey, M., 26n Mueller, Gary, 91,92 Multimedia digital devices, 25 Munroe, Courtney, 2 18n Murrin, J., 124n Muscarella, Beryl, 2 16n MusicNet, 4 1
N + l redundancy, 186 N + N redundancy, 186 Nasdaq, 7 National Logistics Management, 24 NECX, 58 Nedcor, 25 1 Neo Boon Siong, 87n Network adapters, 160 Network authentication, 196 Network bandwidth, 168, 170 Network conduits/connections,
165-166 Network connectivity, 185 Network economies of scale, 29,
118, 119 Network economies of scope, 29,
118, 119 Network economy, 30 Network economy business
innovations, 29 Network era, 128 Network holes, 118 Networklindustrial econon~ies,
compared, 11 6-12 1 Network monitoring, 198 Network monitoring software, 189 Network operations center (NOC), 185 Network security devices, 161 Networked businesses, 79.--147
benefits, 130-134 blueprint, 83-97 industrial/nehvork economies,
compared, 1 16-1 2 1 leading and engaging capabilities,
93-97 managing and learning capabilities,
88-92 operating and innovating capabili-
ties, 84-88

Index 305
performance drivers, 122-126 relationships, 99-106 value networks, 97-106
Networked infrastructure provider business models, 57-63
Networked leadership, 94 Networked management process, 89 Networked market models, 106 Networked operations, 85 Networked organization, 110-1 13 NexPrise, 102 1987 market crash, 172 NOC, 185 Nolan, Richard L., 171n,251n, 254n,
28511 Nonproprietary and shared networked
infrastructure, 102 Normal Accidents: Living with High
Risk Technologies (Perrow), 180 Nortel, 25 1 Novartis, 254 NTT Docomo, 60
Off-the-shelf software packages, 238 Olsavsky, Kristen, 216n Online consumer portals, 5 1 Operating and innovating capabilities,
84-88, 124 Operating capabilities, 138 Operating performance, 138 Operating system software, 63 Operational threats, 172-173 Opportunity analysis, 123 Oracle, 35,63, 171 Organizational learning, 13,26 1-262 Organizational transformation, 261 Organizing and leading, 233-250
centralized IT structure, 240-241 corporate data management, 242 cost estimationlanalysis, 242-246 general management support and
policy overview, 246-249 organizational issues, 233-237 user dominance, 237-240
Outsourcing, 251-268 areas to outsource, 263-264 CIO, 268-269 contract flexibility, 262-263 conversion problems, 265 cost savings, 264
customer-vendor interface, 267-268 difficulties, 252-253 incremental, 2 14-2 19 management fit, 265 managing the alliance, 265-268 mix/coordination of tasks, 267 performance measurement,
266-267 standardslcontrol, 263 structuring the alliance, 262-265 supplier stabilitylquality, 264-265 what drives it, 256-259 when to do it, 259-262
Overview of book. 18
Partnerships, 99-100 Passwords, 192-193 Patching, 197-198 PC-based distributed computing, 154 Pent-up user demand, 238 Peoplesoft, 126, 172,257 PepsiCo, 96 Performance drivers, 122-126 Performance ratios, 142 Perot Systems, 252 Perrow, Charles, 180 . Perry, Dave, 120 Perry, Randy, 2 16n Personalization, 140 Pervasive computing, 17 Physical security, 185 Portals, 5 1-53 Porter, Michael, 27,46n, 9711 Porter's ICA framework, 30-33 Portfolio approach to IT projects,
269-289 adaptive methodologies, 282,
284-286 change management, 286 high-structurelhigh-technology
projects, 278-279 high-structure/low-technology
projects, 278 implementation risks, 270-275 low-structurehigh-technology
projects, 28 1 low-structure/low-technology
projects, 280-281 management tools, 276-277,
281-282
minimalist approach to process formalization, 287-288
portfolio risk, 275-276 process consistencylagility, 287 project management, 276-286 SDLC, 283-284
Portfolio risk, 275-276 Posey, Melanie A., 2 16n, 2 18n Pottruck, David, 57 Powell, W., In, 97n Primary value activities, 5 Process consistencylagility, 287 Processing systems, 158, 162-165 Procter & Gamble, 54 Producer portals, 57 Producers, 53-57 Productlsewice offerings, 137 Production technologies, 1 16 Productslservices, 4 W 1 Profitability ratios, 142 Project feasibility studies, 270 Project implementation risk assessment
questionnaire, 273-275 Project management, 276-286 PSA, 7,27,87-88 Public-private key encryption, 198 Publicly held firms, 14411 Pyburn, P., 23n
Raymond, Eric S., 28511 Real-time infrastructure, 170-1 72 Real-time sharing of information, 89 RealNetworks, 41 Realtor.com, 53 Redundancy, 179, 183-1 84, 186 Redundant NOC, 185 Reengineer core value activities, 32-34 Reference books (bibliography),
295-299 Relationship management, 222-224 Relationship options, 99 Relationships, 99-106 Reliability. See Security and reliability Request for proposal (RFP), 219 Results controls, 277

306 Index
Retailers, 48 Return on assets (ROA), 142 Return on equity (ROE), 142,144 Return on invested capital (ROIC), 142 Return on sales (ROS), 142 Returns to company and investors, 142 RFP, 2 19 Risks, 41 ROA, 142 Rodd, Thomas, 167n ROE, 142, 144 ROIC, 142 ROS, 142 Routers, 161
SAP, 63,126, 171,257 Scalability, 169 Scale economies, 28, 116 Schlesinger, L., 96n Schmidt, Eric, 169 Schmidt, Howard A,, 205n Scient, 63 Scope economies, 28,116 Script kiddies, 192 SDLC, 283-284 Security and Reliability, 179-206
authentication, 196 availability, 181-186 defensive measures, 194-198 DOS attacks, 189-192 encryption, 196-197 firewalls, 195-196 high-availability facilities, 182-1 86 incident management/di:aster
recovery, 202-204 malicious threats, 188-192 N+ l/N+N redundancy, 186 patching, 197-198 redundancy, 183-1 84 risk management, 200-202 security management framework,
199-200 security policies, 195 vimseslworms, 193-194
Security guards, 185 Security management framework,
199-200 Security policies, 195 Selective sourcing, 97, 98,99 Selective sourcing networks, 106
Server systems, 163 Service delivery, 173-175, 2'15 Service-level agreement (SLA),
2!22-225 S e n ice models, 209-2 14 Senice providers, 54,219-225 Shapiro, C., 23n Shared hosting, 2 17 Shortage of skilled IT workers, 210 Siehel, 63 Simons, R., 80n Simple dedicated hosting, 2 1.8 Singapore Airlines, 54 Siong, Neo Boon, 87n SLk, 222-225 Slyvotsky, A., 44n Snifer, 193 Snow, C., In Software firms, 63 Sony, 41,63 Southwest Airlines, 37n Souza, Randy K., 186n Spoofing, 19 1 Staff flexibility, 238 Staff professionalism, 240 Stalker, G. M., 81n Staples.com, 48 Step-by-step procedures
analyzing marketslcapabilities, 107-108
valuation, 125 Stevenson, Howard, 94 Stilichcombe, A., 99n Stock market crash of Oct187, 172 Strategic alliances. See Outsourcing Strategic decision making, ,3241 Strategic grid, 260 Strategic grid analysis, 33 Stmtegic options, 137 Strategic quadrant of strategic grid, 8,20 Strategic risks, 41 Strong authentication, 196 Structured outsourcing contracts, 88n Subscription-based IT services, 2 10 Sum-of-parts valuations, 147 Support quadrant of strategic grid, 8, 19 Saraine, Michael, 155n Switches, 159-160 Switching costs, 39 sln flood, 191 System development life cycle (SDLC),
283-284 System patch, 197-198
TCPIIP, 155, 167 Tech Data, 58 Technological changes, 25 Tektronix, 284 Telefonica, 27 Telephone modem, 170 Themes
assimilation/organizatio~l learning, 11-13
business models, 6 buy versus make decision, 13-15 IT impact, 7-8 market stmcture/industry dynamics,
4 4 partnership among key constituen-
cies, 14, 16 pervasive computing, 17 prioritizing IT investments, 8-1 1 protecting IT assetslmanaging risks,
16-17 Thompson, J. D., 81n Three-way handshake, 191 Time Warner Cable, 60 Timmons, Jeffrey, 123 Token Ring protocol, 160 Tong, Joyce, 186n Torsilierim J., 1 15n ToysRUs, 48 ToysRUs.com, 71 Traditional management process, 88 Transaction, 85n Transaction layer, 85n Transaction system, 85n Triangulation, 147 Turnaround quadrant of strategic grid,
8, 19-20 24x7 operations, 180,2 10 Type I benefits, 9, 10, 126, 127 Type I1 benefits, 9-1 1, 127, 128
Uncertainty, 147 Unintermptible power supply (UPS), 185 United Airlines, 37 United Technologies, 25 1 Universal, 26 UOL, 27 UPS (unintermptible power .supply), 185 Upton, David, 20811

Index 307
User dominance, 235,237-240 User-driven feasibility studies, 241 User names, I92 User responsibilities, 245-246
Valuation, 125 Valuation models, 145-147 Value, 45, 124 Value-added network service (MN), 58 Value analysis, 124 Value chain, 28,97 Value chain activities, 5,97 Value chain analysis, 27-29 Value chain roles, 47 Value networks, 97-1 06 Valuing public companies, 145-147 VAN, 58 Varian, H., 23n Ventro Corporation, 67 Vertical infrastructure portals, 60 Vertical integration, 97, 98, 99 Vertical portals, 53 Virtual coalition networks, 106 Virtual integration, 97, 98, 102
Virtual peer-to-peer networks, 106 Virtual private network (VPN), 199 Virtual University, 54 Virtually integrated organizations
within vertically integrated markets, 106
Viruses, 193-1 94 Visionary yet pragmatic leadership, 95 Vitale, Mike, 27n Vivendi, 26 VPN, 199
Wal-Mart, 39, 102,144 WAN, 160, 16 1 Watson, Thomas, 291 Web for the Web, 63 Web services, 208,213 Webber, A., 142n Webmergers.com, 2611 Weiss, P., 143n Welch, Jack, 79n, 80 Wide area network (WAN), 160, 161 Williams, Peter, 197n
Williamson, 0. E., 97n, 98n Winslow, R., 36n Winter, S. G., 98n Wireless networks/protocols, 25-26 Woodward, J., 8 1n Working capital, 142, 143n Worms, 193-1 94
Xerox, 25 1 XP, 285
Yahoo!, 53,81 Yahoo! Finance, 47 Yates, J., 98n