Malinda S Smith. "Equity, Diversity and Inclusion at the University of Alberta"
26
Equity in Employment at the University of Alberta, 2001 and 2007 to 2011 Page | 1 Equity, Diversity and Inclusion at the University of Alberta 24 Years On Employment Equity Audit, 2001, and 2007-2011 Report of the AASUA Standing Committee on Equity Malinda S. Smith, PhD (Political Science) Chair of the Standing Committee on Equity Association of Academic Staff University of Alberta University of Alberta – Edmonton 13 November 2012
Transcript of Malinda S Smith. "Equity, Diversity and Inclusion at the University of Alberta"
Equity in Employment at the University of Alberta, 2001 and 2007 to 2011
Page | 1
Equity, Diversity and Inclusion at the University of Alberta 24 Years On
Employment Equity Audit, 2001, and 2007-2011
Report of the AASUA Standing Committee on Equity
Malinda S. Smith, PhD (Political Science) Chair of the Standing Committee on Equity
Association of Academic Staff University of Alberta University of Alberta – Edmonton
13 November 2012

Equity in Employment at the University of Alberta, 2001 and 2007 to 2011
Page | 2
Table of Contents
I. Background: Institutional Commitment to Equity and Diversity ..…3
II. Are We More Diverse Now? Summary of the Data, 2001, 2007-11 ….....4
III. Representation and Status of Women, 2007-2011 …..6
IV. Representation and Status of Aboriginal Peoples, 2007-2011 …..9
V. Representation and Status of Visible Minorities/Non-Whites, 2006-11…12
VI. Representation and Status of Persons with Disabilities, 2007-2011 ……15
VII. Appendices
A. Table 1 – U of A Equity Data, 2001 and 2007-2011 – Continuing and Recurring
Term Positions – Operating
B. Table 2 – Representation of Women at the U of A vs 2006 Census Canada
Availability Data
C. Table 3 – Representation of Aboriginal Peoples at the U of A vs 2006 Census
Canada Availability Data
D. Table 4 – Representation of Persons with Disabilities at the U of A vs 2006
Census Canada Availability Data
E. Table 5 – Representation of Visible Minorities at the U of A vs 2006 Census
Canada Availability Data
F. Employment Equity Census Response Rate
Equity in Employment at the University of Alberta, 2001 and 2007 to 2011
Page | 3
I. Background on Equity and Diversity at the University of Alberta The Royal Commission on Employment then chaired by Justice Rosalie Silberman Abella identified “systemic discrimination” in employment that impacted four groups, variously called “designated groups” and “equity-seeking groups.”1 In the 1984 final Report of the Commission on Equality in Employment, Justice Abella argued that we needed pro-active policies to ameliorate condition of systemic social inequity. The Employment Equity Act and the Federal Contractors Program were the government’s initial responses to the Commission. At the University of Alberta President Myer Horowitz (1979-1989) made the first institutional commitment to equity in employment in 1987, when the University became a signatory to the Federal Contractors Program. The University President established a Commission and, in 1990, the Report of the President’s Commission for Equality and Respect2 issued its final report. The Commission advanced core principles of diversity, equity, inclusiveness and respect and called for policies, objectives and processes to demonstrate institutional commitment to achieve results. In the spring of 1991, the Faculty of Arts’ Dean Patricia Clements (1989-1999) responded to the University’s Report of the President’s Commission for Equality and Respect by constituting a Dean’s Advisory Taskforce on Equity to develop what would become the Faculty’s – and the University’s – first equity plan. Arts’ “Developing and Implementing Department Employment Equity Plan in the Faculty of Arts,”3 was approved by Arts Faculty Council on 29 April 1992. Under then President Paul T. Davenport (1989-1994), a consultative process led to ‘Opening Doors –The University of Alberta’s Employment Equity Plan’,4 which was approved by the General Faculties Council on 29 March 1993, and the Board of Governors on 7 January 1994. “Opening Doors was based on the central idea that qualitative changes were fundamental. In other words, it was hoped that the number of designated group employees [women, Aboriginal people, visible minorities, and persons with disabilities] would increase as barriers were removed.”5 It anticipated that the implementation of employment equity principles would give rise to a future of equitable hiring, faculty renewal, a respectful and inclusive workplace and especially a more diverse academy. Under President Roderick D. Fraser (1995-2005) a 1996
1 Rosalie S. Abella, Report of the Commission on Equality in Employment. (Ottawa: Government of Canada, 1984) 2 U of Alberta’s Report of the President’s Commission for Equality and Respect on Campus, 1990. 33 “Developing and Implementing Department Employment Equity Plans in the Faculty of Arts: Report and Recommendation of the Dean’s Advisory Task Force on Employment Equity” [Chair, Graham Lowe], rev. 16 March, 1992 4 University of Alberta, “Opening Doors – A Plan for Employment Equity at the University of Alberta,” approved by General Faculties Council in March 1993 and the Board of Governors, 7 January 1994: 1-94, [online], http://www.hrs.ualberta.ca/en/About/Dept/HRCS/~/media/hrs/AboutUs/Departments/OpeningDoors.pdf 5 Cathy Anne Pachnowski, Employment Equity Advisor, “Opening Doors – The University of Alberta’s Employment Equity Plan,” 26 June 1996 [online], http://www.ualberta.ca/~dpreston/fcp2.htm
Equity in Employment at the University of Alberta, 2001 and 2007 to 2011
Page | 4
equity update stated that, “Faculty renewal represents a significant opportunity to implement equity principles and hire a more diverse faculty.” 6 The University’s Employment Equity Advisory Committee, with AASUA and NASA representatives, is updating ‘Opening Doors’. This AASUA Equity report assesses the representation and status of women, Aboriginal people, visible minorities/non-whites, and persons with disabilities at the University.
II. Are We More Diverse Now?: What the Data Tells Us 24 Years On On the eve of the 25th anniversary of the University of Alberta’s support for employment equity, this equity audit analyzes the employment data to answer the following question: How diverse are we? The University of Alberta has had an institutional commitment to diversity for 24 years. It adopted a formal employment equity policy 18 years ago when Opening Doors – A Plan for Employment Equity at the University of Alberta was approved by the University’s Board of Governors in January 1994. A review of the data from 2001 and 2007-2011 reveals some progress, some reversals, and some areas of little change. While this equity audit analyzes the data, it cannot fully answer why efforts to diversify the workforce, particularly the professoriate, have been so slow. What the data does suggest, however, is that a system-wide analysis – and a new Presidential Taskforce on Equity and Diversity – is needed to advance a more invigorated approach to equity and diversity in a 21st century University. The current University workforce does not reflect the diversity of the Canadian population or the student body. Appendix A-F provides the full data. In brief, in 2011 there were 4,976 people in the University’s workforce. Combined, Aboriginal people (87/4976) and visible minorities (657/4976) constituted only 14.9% of the workforce; the overwhelming majority – 85.1% (4233/4976) – were white. The lack of diversity is especially evident in senior management (88.9% white) and middle management (88.3% white), where there were few Aboriginal people and visible minorities. Second, what does the data say about the status of women? Of the total University workforce in 2011, 52.2% (2,592) were women and 47.9% (2,381) were men. While the University has achieved gender parity in the overall workforce, the glass ceiling persists in senior management (66.7% male), middle management (67% male) and among University professors (65.1% male). Among women, almost 50% were in clerical positions, and only 19% were University professors. The percentage of women professors has grown slowly, from 28.2% in 2001 to 32%
6 Pachnowski, ,“Opening Doors: The University of Alberta’s Employment Equity in Action: Federal Contractors Program Second Compliance Review” 26 June 1996 [online], http://www.ualberta.ca/~dpreston/fcp2.htm

Equity in Employment at the University of Alberta, 2001 and 2007 to 2011
Page | 5
in 2007 to 34.9% in 2011. In the decade between 2001 and 2011, the percentage of women increased by only 6% (from 28.2% to 34.9%). Women constitute only one-third of the University professors, which is lower than the 2006 Census’s availability (39.5%) data. Third, what does the data say about efforts to increase diversity by hiring and promoting non-white/visible minorities and Aboriginal people? In 2011 there were only 657/4,976 (13.2%) of visible minorities and only 86/4,976 (1.7%) of Aboriginal people in the University’s workforce. Of the 36 people in senior management only 4 (11.1%) were visible minorities and the number for Aboriginal people was suppressed (meaning less than 3). Of the 657 visible minorities working on campus, 233 (33%) were University professors. Of the 86 Aboriginal people working on campus, 22 (25%) were University professors. Fourth, the number of persons with disabilities working on campus has grown. However, overall the percentage remains very low and significantly lower than workforce availability as benchmarked against the dated 2006 Census. In 2011 only 2.4% (117/4976) of the University’s workforce was made up of people with disabilities; the overwhelming majority (97.6%) did not self-identify as having a disability. In the decade between 2001 and 2011, there has been little change. In 2001 persons with disabilities constituted 19/1.6% of faculty; in 2011 persons with disabilities constituted 22/1.5% of the professoriate. The data shows some progress in hiring women, visible minorities, Aboriginal people and persons with disabilities. However, the overall picture gives reason for pause. The University needs a new Taskforce on Equity and Diversity to address the stalled progress on equity and diversity, and it should incorporate institutional commitment to lesbian, gay, bisexual, transgender and Two-Spirited people. The remainder of this report includes a detailed assessment of the employment equity data at the University of Alberta, 2001 and 2007-2011. Part II offers a detailed assessment of the status of women at the University of Alberta. Part III offers a detailed assessment of the status of Aboriginal people at the University of Alberta. Part IV offers a detailed assessment of the status of visible minorities or non-white people at the University of Alberta. Part V offers an analysis of the status of persons with disabilities, 2007-2011. This report also includes six comprehensive data tables. Appendix A includes Table I is University of Alberta Equity Data, 2001 and 2007-2011 for continuing and recurring term positions. Appendix B includes Table 2 – Representation of Women at the U of A vs 2006 Census Canada Availability Data. Appendix C includes Table 3 – Representation of Aboriginal People at the U of A vs 2006 Census Availability Data. Appendix D includes Table 4 – Representation of Persons with Disabilities at the U of A vs 2006 Census Canada Availability Data. Appendix E includes Table 5 – Representation of Visible Minorities at the U of A vs 2006 Census Canada Availability Data.
Equity in Employment at the University of Alberta, 2001 and 2007 to 2011
Page | 6
III. Representation and the Status of Women in the Workforce, 2007-20117 Women constituted 51.6% of the University of Alberta’s workforce in 2007. By 2011 this percentage had increased to 52.2% (2595/4976). Of these, 34.9% (499) were women in the professoriate. The majority of women (2096) were in non-academic administrative, clerical and managerial positions. Over the past decade, and longer, considerable attention has been placed on women and leadership, and increasing the number of women professors. In the past five years, the percentage of women deans, directors and chairs has declined, from 35% (103/300) in 2007 and 35.1% (114/325) in 2009 to 34.4% (118/343) in 2011. If we look at women in senior management/leadership, there has been a significant decline, from 40.7% in 2007 to 33.0% in 2011. There has been a modest increase of women in the professoriate, from 32% in 2007 and 33.3% in 2009, to 34.9% in 2011. This means that in 2011 the University’s leadership (65.6%) and professoriate (65.1%) remained overwhelming male.
A. Women in Senior Management * There was a 7.4% decline from 40.7% in 2007 to 33% (12/36) in 2011 of women in senior management positions (President, Vice-President, APOs, Vice-Provosts, Associate Vice-Presidents, Chief Librarians, and Deputy Provosts).
B. Women in Middle and Other Managers * There was a 0.4% decline from 33.4% in 2007 to 33% (107/324) in 2011 of women in these middle and other manager positions (Deans, Department Chairs, Directors, APOs). * An October 2012 review of Deans of the Faculties, Schools, Campuses and Colleges at the University of Alberta show that women Deans make up 6/21 (28.6%) of the total. There are women Deans or Interim Deans in Arts, Education, Extension, Nursing, Pharmacy and Public Health.8
C. Professoriate - Women in Tenure-Track Positions * There was a 2.9% increase from 32.0% in 2007 to 34.9% (499/1429) in 2011 of women in the categories full, associate and assistant professors.
7 Source: University of Alberta Employment data, Employment Equity Advisor, 18 October 2012. 8 The units examined include the following: Agriculture, Life and Environmental Science, Alberta School of Business, Arts, Augustana Campus, Campus Saint Jean, Education, Engineering, Extension, Graduate Studies and Research, Law, School of Library & Information Studies, Medicine & Dentistry, Native Studies, Nursing, Pharmacy and Pharmaceutical Sciences, Physical Education & Recreation, School of Public Health, Rehabilitation Medicine, Science, St. Joseph’s College, and St. Stephen’s College.
Equity in Employment at the University of Alberta, 2001 and 2007 to 2011
Page | 7
D. Women 'Other Professionals'
* There was a 2.8% increase from 49.1% in 2007 to 51.9 % (388/748) in 2011 of the number of women in positions as FSOs, APOs, Librarians, Systems Analysts, Student Service Assistants, Program Coordinators, Nurses, LAN/NET Administrators.
E. Women Semi-Professionals and Technicians * There was a 3.5% decline from 48.7% to 45.2% (189/418) of women in semi-professional and technician positions (APOs, photographers, dental assistants, chemical technologists, drafting technicians, library assistants).
F. Women Supervisors * There was a 7.9% decline from 79.8% to 71.9% (97/135) of women supervisors (administrative services, accounting administrators, financial officers, housekeepers, parking administrators).
G. Women Supervisors: Crafts & Trades
* There was a 0.5% decline from 2.5% in 2007 to 2.0% (1/49) in 2011 of women supervisors-crafts and trades (APOs, maintenance worker supervisors, horticulturalists, aquaculture technicians, heating plant supervisors).
H. Women Administration & Senior Clerical * There was a 2.4% decline from 86.4% in 2007 to 84.0% (725/863) of women in administration and senior clerical positions (library assistants, administrative secretaries, medical secretaries, buyers, conference coordinators, sales coordinators).
I. Women in Skilled Crafts & Trades * There was a 1.5% decline from 3.3% in 2007 to 1.8% (2/109) of women in skilled crafts and trades (pipe-fitters, electricians, carpenters, glassblowers, machinists, locksmiths, plant operators).
J. Women Clerical Personnel * There was a 0.9% increase from 89.1% in 2007 to 90% (378/420) of women in clerical positions (office clerks, secretaries, course coordinators, switchboard operators, personnel assistants, receptionists, mailroom clerks).

Equity in Employment at the University of Alberta, 2001 and 2007 to 2011
Page | 8
K. Women in Intermediate Sales & Service
* There was a 1.1% increase from 92.9% in 2007 to 94.0% (47/50) of women in Intermediate Sales & Service positions (dental assistants, health care assistants, sales clerks).
L. Women Semi-Skilled Manual Workers * There was a 1.5% decline from 5.0% in 2007 to 3.5% (2/57) in 2011 of women in semi-skilled manual workers' category (vehicle operators, instrument technicians, maintenance workers - heavy equipment, photographer assistants).
M. Women in Other Sales & Service Personnel * There was a 1.5% decline from 50.9% in 2007 to 49.6% (141/284) of women in other sales and service personnel positions (cashier, lab assistant, security officer, building service superintendents, and parking attendants).
N. Women in Other Manual Workers * There was a 5.2% increase from 8.0% in 2007 to 13.2% (7/53) of women in the other manual workers' category (maintenance workers, machine operator assistants, general services lab technicians). -------------------------------------- 2011 Response Rate = 89.6% (4458/4976) (4976 = 2595 (52.2%) women + 2381 (47.9%) men0 Decline/refusal rate = 13.5% (673/4976) Of the 89.6% 2011 cumulative completion rate, 3.1% declined to self-identify. 2007 Response Rate = 63.0% (2999/4764) (4764 = 2456 (51.6%) women + 2308 (48.4%) men) 2007 Cumulative Completion Rate = 60.5% (2881/4764) Of the 63.0% 2007 cumulative completion rate, 2.5% declined to self-identify.

Equity in Employment at the University of Alberta, 2001 and 2007 to 2011
Page | 9
III. Representation and Status of Aboriginal People in the Workforce, 2007-20119
This report assesses the diversity of the University workforce and, specifically, the representation and status of Aboriginal people10. Aboriginal people constituted 0.9% of the University of Alberta’s workforce in 2007, and this percentage increased to 1.7% (86/4976) in 2011. Of the latter only 16/1429 (1.1%) are in the professoriate as full, associate and assistant professors. The majority of Aboriginal people at the University are non-academic staff in administrative and senior clerical (19/863) and other clerical personnel (12/420) positions.
A. Senior Management * There were fewer than three (*) Aboriginal people in senior management positions in 2007 and this remains true (*/36) in 2011 (President, Vice-President, APOs, Vice-Provosts, Associate Vice-Presidents, Chief Librarians, and Deputy Provosts).
B. Middle and Other Managers * There were fewer than three Aboriginal people in 2007 and also in 2011 (*/324) in middle and other manager positions (Deans, Department Chairs, Directors, APOs). An Equity Committee October 2012 review of Deans of the Faculties, Schools, Campuses and Colleges at the University of Alberta revealed there were too few Aboriginal people to identify.11
C. Professoriate – Aboriginal People in Tenure-Track Positions * There was an increase from 0.4% in 2007 to 1.1% (16/1429) in 2011 of Aboriginal people in the categories full, associate and assistant professors. Almost half of these faculty members are concentrated in the Faculty of Education.
D. Aboriginal People - 'Other Professionals' * There was an increase from 1.1% in 2007 to 1.6% (12/748) in 2011 of the number of Aboriginal people in positions classified as ‘other professionals’ (FSOs, APOs, Librarians,
9 Source: University of Alberta Employment data, Employment Equity Advisor, 18 October 2012. 10 Aboriginal people are persons who identify as North American Indian (Status, non-Status, and Treaty), Inuit and Métis. 11 The units examined include: Agriculture, Life and Environmental Science, Alberta School of Business, Arts, Augustana Campus, Campus Saint Jean, Education, Engineering, Extension, Graduate Studies and Research, Law, School of Library & Information Studies, Medicine & Dentistry, Native Studies, Nursing, Pharmacy and Pharmaceutical Sciences, Physical Education & Recreation, School of Public Health, Rehabilitation Medicine, Science, St. Joseph’s College, and St. Stephen’s College.
Equity in Employment at the University of Alberta, 2001 and 2007 to 2011
Page | 10
Systems Analysts, Student Service Assistants, Program Coordinators, Nurses, LAN/NET Administrators.)
E. Aboriginal Semi-Professionals and Technicians * There was an increase from 0.5% in 2007 to 1.0% (4/418) in 2011 of Aboriginal people in semi-professional and technician positions (APOs, photographers, dental assistants, chemical technologists, drafting technicians, and library assistants).
F. Supervisors * There were fewer than three (*) Aboriginal people in 2007 and also in 2011 (*/135) in positions as supervisors (administrative services, accounting administrators, financial officers, housekeepers, parking administrators).
G. Supervisors: Crafts & Trades
* There were fewer than three Aboriginal people in 2007 and also in 2011 (*/49) in positions as supervisors-crafts and trades (APOs, maintenance worker supervisors, horticulturalists, aquaculture technicians, heating plant supervisors).
H. Administration & Senior Clerical * There was an increase from 0.8% in 2007 to 2.2% (19/863) in 2011 of Aboriginal people in administrative and senior clerical positions (library assistants, administrative secretaries, medical secretaries, buyers, conference coordinators, sales coordinators).
I. Skilled Crafts & Trades * There were fewer than three Aboriginal people in 2007 and an increase to 5.5% (6/109) in 2011 in skilled crafts and trades positions (pipe-fitters, electricians, carpenters, glassblowers, machinists, locksmiths, plant operators).
J. Clerical Personnel * There was an increase from 1.7% in 2007 to 2.9% (12/420) in 2011 of Aboriginal people in clerical positions (office clerks, secretaries, course coordinators, switchboard operators, personnel assistants, receptionists, mailroom clerks).
K. Intermediate Sales & Service * There were fewer than three Aboriginal people in 2007 and also in 2011 (*/50) in Intermediate Sales & Service positions (dental assistants, health care assistants, sales clerks).

Equity in Employment at the University of Alberta, 2001 and 2007 to 2011
Page | 11
L. Semi-Skilled Manual Workers
* There were fewer than three Aboriginal people in 2007 and also in 2011 (*/57) in semi-skilled manual workers' positions (vehicle operators, instrument technicians, maintenance workers - heavy equipment, photographer assistants).
M. Other Sales & Service Personnel * There was an increase from 2.9% in 2007 to 3.5% (10/284) in 2011 of Aboriginal people in other sales and service personnel positions (cashier, lab assistant, security officer, building service superintendents, and parking attendants).
N. Other Manual Workers * There were fewer than three Aboriginal people in 2007 and also in 2011 (*/53) in the other manual workers' category (maintenance workers, machine operator assistants, general services lab technicians). 2011 Response Rate = 89.6% (4458/4976) (4976 = 2595 (52.2%) women + 2381 (47.9%) men0 Decline/refusal rate = 13.5% (673/4976) Of the 89.6% 2011 cumulative completion rate, 3.1% declined to self-identify. 2007 Response Rate = 63.0% (2999/4764) (4764 = 2456 (51.6%) women + 2308 (48.4%) men) 2007 Cumulative Completion Rate = 60.5% (2881/4764) Of the 63.0% 2007 cumulative completion rate, 2.5% declined to self-identify.
Equity in Employment at the University of Alberta, 2001 and 2007 to 2011
Page | 12
IV. Representation and Status of Visible Minorities in the Workforce, 2007-201112
This report assesses the diversity of the University of Alberta’s workforce and, specifically, the representation and status of visible minorities/non-whites in the workforce. In 2011, visible minorities constituted 13.2% (657/4976) of the University’s workforce. This represented an increase from 2007, when visible minorities constituted 8.0% of the University’s workforce. Overall the 2011 University’s workforce was made up of 13.2% (657) visible minorities. When the 13.2% of visible minorities/non-whites is combined with the 1.7% (86) of Aboriginal people this made up less than 15% of the University workforce. After 24 years the University’s workforce – 85.1% (4233/4976) – remains overwhelmingly white.
A. Visible Minorities in Senior Management
* There was an increase from 3.7% in 2007 to 11.1% (4/36) in 2011 of visible minorities in senior management positions (President, Vice-President, APOs, Vice-Provosts, Associate Vice-Presidents, Chief Librarians, and Deputy Provosts).
B. Visible Minority Middle & Other Managers There was an increase from 4.9% in 2007 to 11.7% (38/324) of visible minorities in positions of middle and other managers (Deans13, Department Chairs, Directors, and APOs).
C. Professoriate – Visible Minority Professors There was an increase from 10.3% in 2007 to 15.6% (223/1429) of visible minorities among university professors (full, associate and assistant professors)
D. Other Professionals
12 Source: University of Alberta Employment Equity data, Employment Advisor, 18 October 2012. 13 The units examined include the following: Agriculture, Life and Environmental Science, Alberta School of Business, Arts, Augustana Campus, Campus Saint Jean, Education, Engineering, Extension, Graduate Studies and Research, Law, School of Library & Information Studies, Medicine & Dentistry, Native Studies, Nursing, Pharmacy and Pharmaceutical Sciences, Physical Education & Recreation, School of Public Health, Rehabilitation Medicine, Science, St. Joseph’s College, and St. Stephen’s College.
Equity in Employment at the University of Alberta, 2001 and 2007 to 2011
Page | 13
There was an increase from 6.6% in 2007 to 14.2% (106/748) in 2011 of visible minorities in the ‘other professional’ category (FSOs, APOs, librarians, systems analysts, student service assistants, program coordinators, nurses, LAN/NET Administrators).
E. Semi-Professionals & Technicians There was an increase from 11.1% in 2007 to 12.4% (52/418) in 2011 of visible minorities in the semi-professional & technicians (APOs, photographers, dental assistants, chemical technologists, drafting technicians, and library assistants)
F. Supervisors There was an increase from 10.1% in 2007 to 11.9% (16/135) in 2011 of visible minorities in supervisors (administrative service persons, accounting administrators, financial officers, housekeepers, and parking administrators)
G. Supervisors: Crafts & Trades There were fewer than three visible minorities in 2007 and also in 2011 (*/49) in supervisor-crafts and trade positions (APOs, maintenance worker, supervisors, horticulturalist, aquaculture technicians, and heating plant supervisors).
H. Administrators & Senior Clerical There was an increase from 3.9% in 2007 to 9.5% (82/863) in 2011 of visible minorities in administrative & senior clerical positions (Library Assistants, Administrative Secretaries, Medical Secretaries, Buyers, Conference Coordinators, and Sales Coordinators).
I. Skilled Crafts & Trades There were fewer than three visible minorities in 2007 and also in 2011 (*/109) in skilled crafts & trade positions (Pipe-fitters, electricians, carpenters, glassblowers, machinists, locksmiths, and plant operators)
J. Clerical Personnel There was an increase from 6.9% in 2007 to 13.6% (57/420) in 2011of visible minorities in clerical personnel positions (office clerks, secretaries, course coordinators, switchboard operators, personnel assistants, receptionists, and mailroom clerks)

Equity in Employment at the University of Alberta, 2001 and 2007 to 2011
Page | 14
K. Intermediate Sales & Service There were fewer than three visible minorities in 2007 and an increase to 8.0% (4/50) in 2011 among intermediate sales & service positions (dental assistants, health care assistants, and sales clerks)
L. Semi-skilled Manual Workers There was an increase from 3.3% in 2007 to 10.5% (6/57) in 2011 of visible minorities in semi-skilled manual workers (vehicle operators, instrument technicians, maintenance workers-heavy equipment, and photographer assistants)
M. Other Sales & Service Personnel There was an increase from 14.3% in 2007 to 20.8% (59/284) in 2011 of visible minorities in other sales & service personnel positions (cashier, lab assistant, security officer, building services superintendents, and parking attendants)
N. Other Manual Workers There was a decline from 12.0% in 2007 to 9.4% (5/53) in 2011 of visible minorities in ‘other manual workers’ positions (maintenance workers, machine operator assistants, general services lab technicians). 2011 Response Rate = 89.6% (4458/4976) (4976 = 2595 (52.2%) women + 2381 (47.9%) men0 Decline/refusal rate = 13.5% (673/4976) Of the 89.6% 2011 cumulative completion rate, 3.1% declined to self-identify. 2007 Response Rate = 63.0% (2999/4764) (4764 = 2456 (51.6%) women + 2308 (48.4%) men) 2007 Cumulative Completion Rate = 60.5% (2881/4764) Of the 63.0% 2007 cumulative completion rate, 2.5% declined to self-identify.
Equity in Employment at the University of Alberta, 2001 and 2007 to 2011
Page | 15
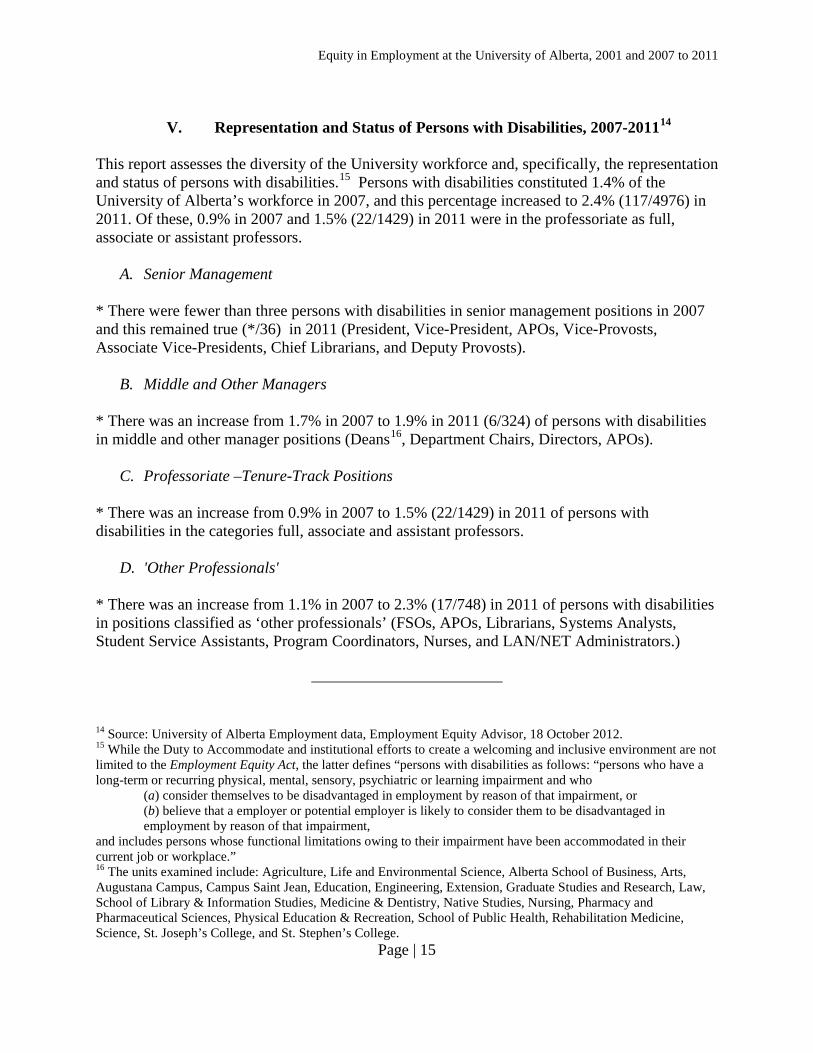
V. Representation and Status of Persons with Disabilities, 2007-201114 This report assesses the diversity of the University workforce and, specifically, the representation and status of persons with disabilities.15 Persons with disabilities constituted 1.4% of the University of Alberta’s workforce in 2007, and this percentage increased to 2.4% (117/4976) in 2011. Of these, 0.9% in 2007 and 1.5% (22/1429) in 2011 were in the professoriate as full, associate or assistant professors.
A. Senior Management * There were fewer than three persons with disabilities in senior management positions in 2007 and this remained true (*/36) in 2011 (President, Vice-President, APOs, Vice-Provosts, Associate Vice-Presidents, Chief Librarians, and Deputy Provosts).
B. Middle and Other Managers * There was an increase from 1.7% in 2007 to 1.9% in 2011 (6/324) of persons with disabilities in middle and other manager positions (Deans16, Department Chairs, Directors, APOs).
C. Professoriate –Tenure-Track Positions * There was an increase from 0.9% in 2007 to 1.5% (22/1429) in 2011 of persons with disabilities in the categories full, associate and assistant professors.
D. 'Other Professionals' * There was an increase from 1.1% in 2007 to 2.3% (17/748) in 2011 of persons with disabilities in positions classified as ‘other professionals’ (FSOs, APOs, Librarians, Systems Analysts, Student Service Assistants, Program Coordinators, Nurses, and LAN/NET Administrators.)
14 Source: University of Alberta Employment data, Employment Equity Advisor, 18 October 2012. 15 While the Duty to Accommodate and institutional efforts to create a welcoming and inclusive environment are not limited to the Employment Equity Act, the latter defines “persons with disabilities as follows: “persons who have a long-term or recurring physical, mental, sensory, psychiatric or learning impairment and who
(a) consider themselves to be disadvantaged in employment by reason of that impairment, or (b) believe that a employer or potential employer is likely to consider them to be disadvantaged in
employment by reason of that impairment, and includes persons whose functional limitations owing to their impairment have been accommodated in their current job or workplace.” 16 The units examined include: Agriculture, Life and Environmental Science, Alberta School of Business, Arts, Augustana Campus, Campus Saint Jean, Education, Engineering, Extension, Graduate Studies and Research, Law, School of Library & Information Studies, Medicine & Dentistry, Native Studies, Nursing, Pharmacy and Pharmaceutical Sciences, Physical Education & Recreation, School of Public Health, Rehabilitation Medicine, Science, St. Joseph’s College, and St. Stephen’s College.

Equity in Employment at the University of Alberta, 2001 and 2007 to 2011
Page | 16
E. Semi-Professionals and Technicians * There was an increase from 2.9% in 2007 to 4.1% (17/418) in 2011 of persons with disabilities in semi-professional and technician positions (APOs, photographers, dental assistants, chemical technologists, drafting technicians, and library assistants).
F. Supervisors * There was an increase from 4.0% in 2007 to 4.4% (6/135) of persons with disabilities in positions as supervisors (administrative services, accounting administrators, financial officers, housekeepers, parking administrators).
G. Supervisors: Crafts & Trades
* There were fewer than three persons with disabilities in 2007 and also in 2011 (*/49) in positions as supervisors-crafts and trades (APOs, maintenance worker supervisors, horticulturalists, aquaculture technicians, heating plant supervisors).
H. Administration & Senior Clerical * There was an increase from 0.8% in 2007 to 1.4% (12/863) in 2011 of persons with disabilities in administrative and senior clerical positions (library assistants, administrative secretaries, medical secretaries, buyers, conference coordinators, sales coordinators).
I. Skilled Crafts & Trades * There were fewer than three persons with disabilities in 2007 and also in 2011 (*/109) in skilled crafts and trades positions (pipe-fitters, electricians, carpenters, glassblowers, machinists, locksmiths, plant operators).
J. Clerical Personnel * There was an increase from 1.7% in 2007 to 4.8% (20/420) in 2011 of persons with disabilities in clerical positions (office clerks, secretaries, course coordinators, switchboard operators, personnel assistants, receptionists, mailroom clerks).
K. Intermediate Sales & Service * There were fewer than three persons with disabilities in 2007 and also in 2011 (*/50) in Intermediate Sales & Service positions (dental assistants, health care assistants, sales clerks).
Equity in Employment at the University of Alberta, 2001 and 2007 to 2011
Page | 17
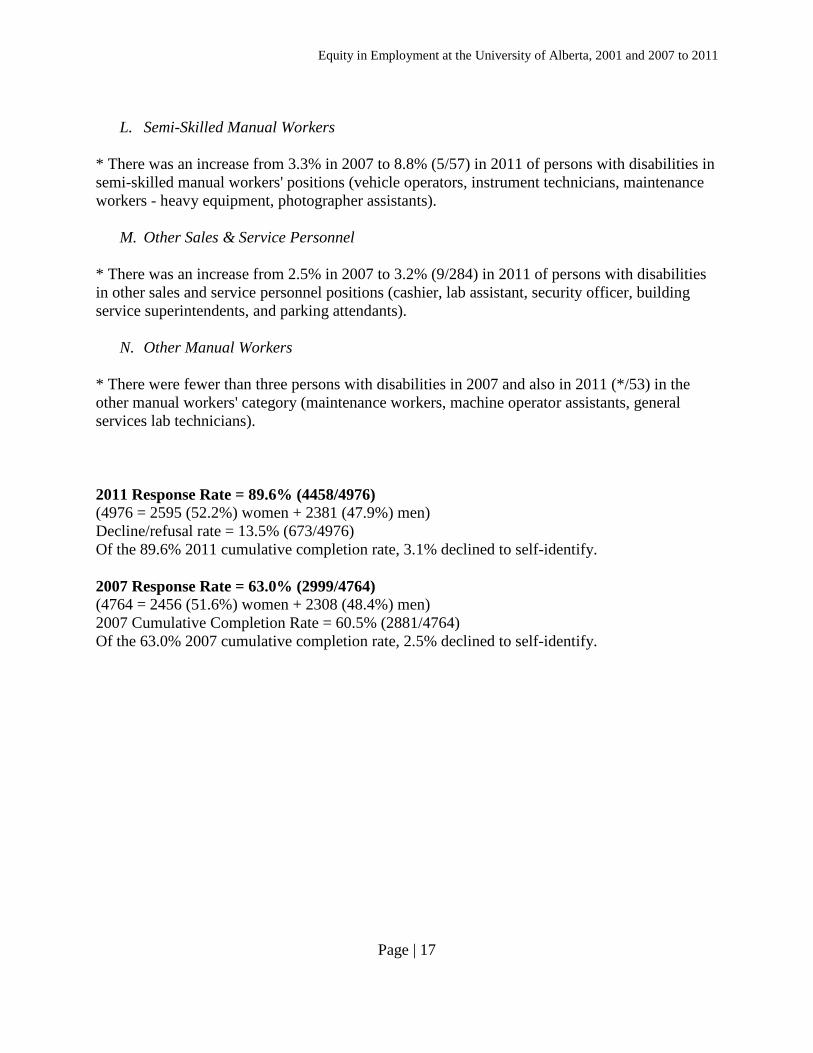
L. Semi-Skilled Manual Workers * There was an increase from 3.3% in 2007 to 8.8% (5/57) in 2011 of persons with disabilities in semi-skilled manual workers' positions (vehicle operators, instrument technicians, maintenance workers - heavy equipment, photographer assistants).
M. Other Sales & Service Personnel * There was an increase from 2.5% in 2007 to 3.2% (9/284) in 2011 of persons with disabilities in other sales and service personnel positions (cashier, lab assistant, security officer, building service superintendents, and parking attendants).
N. Other Manual Workers * There were fewer than three persons with disabilities in 2007 and also in 2011 (*/53) in the other manual workers' category (maintenance workers, machine operator assistants, general services lab technicians). 2011 Response Rate = 89.6% (4458/4976) (4976 = 2595 (52.2%) women + 2381 (47.9%) men) Decline/refusal rate = 13.5% (673/4976) Of the 89.6% 2011 cumulative completion rate, 3.1% declined to self-identify. 2007 Response Rate = 63.0% (2999/4764) (4764 = 2456 (51.6%) women + 2308 (48.4%) men) 2007 Cumulative Completion Rate = 60.5% (2881/4764) Of the 63.0% 2007 cumulative completion rate, 2.5% declined to self-identify.
Appendices A – F: Equity Data at U of A, 2001 and 2007-2011
Report of the AASUA Equity Chair – 26 October 2012
Appendix A – Table 1 – U of A Equity Data, 2001 and 2007-2011– Continuing and Recurring Term Positions – Operating
Appendix B – Table 2 – Representation of Women at the U of A vs 2006 Census Canada Availability Data
Appendix C – Table 3 – Representation of Aboriginal Peoples at the U of A vs 2006 Census Canada Availability Data
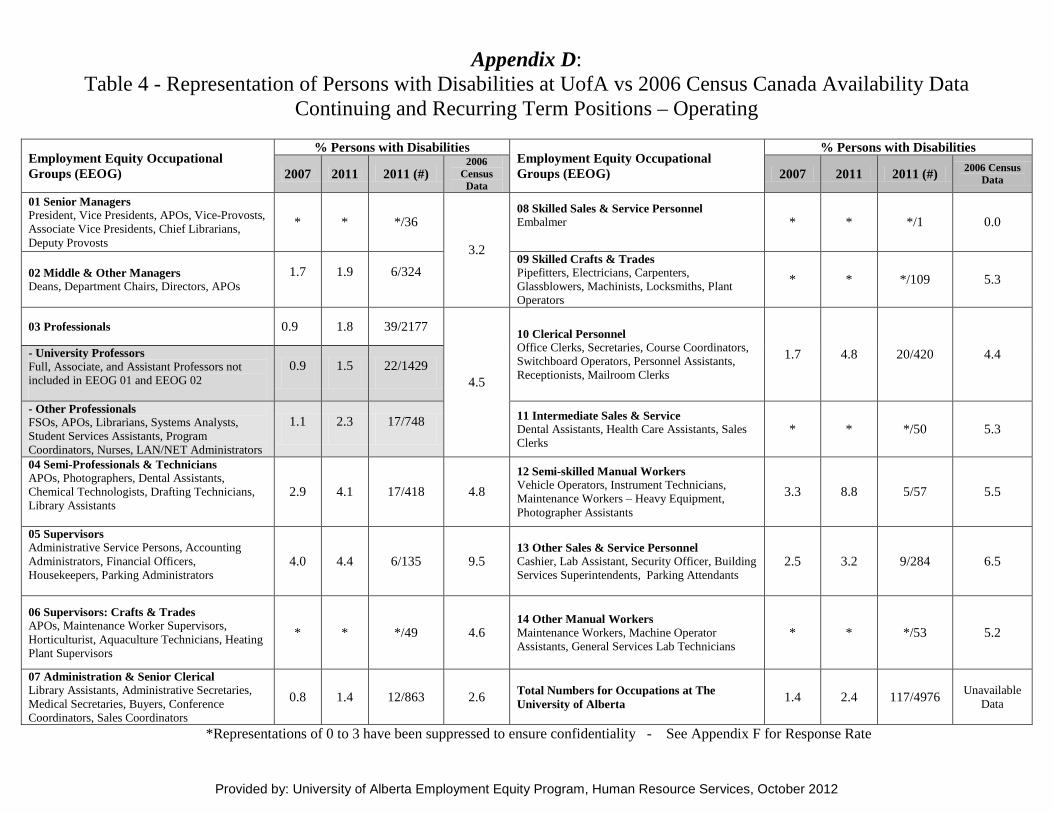
Appendix D – Table 4 – Representation of Persons with Disabilities at the U of A vs 2006 Census Canada Availability Data
Appendix E – Table 5 – Representation of Visible Minorities at the U of A vs 2006 Census Canada Availability Data
Appendix F – Equity Census Response Rate, 2007, 2011
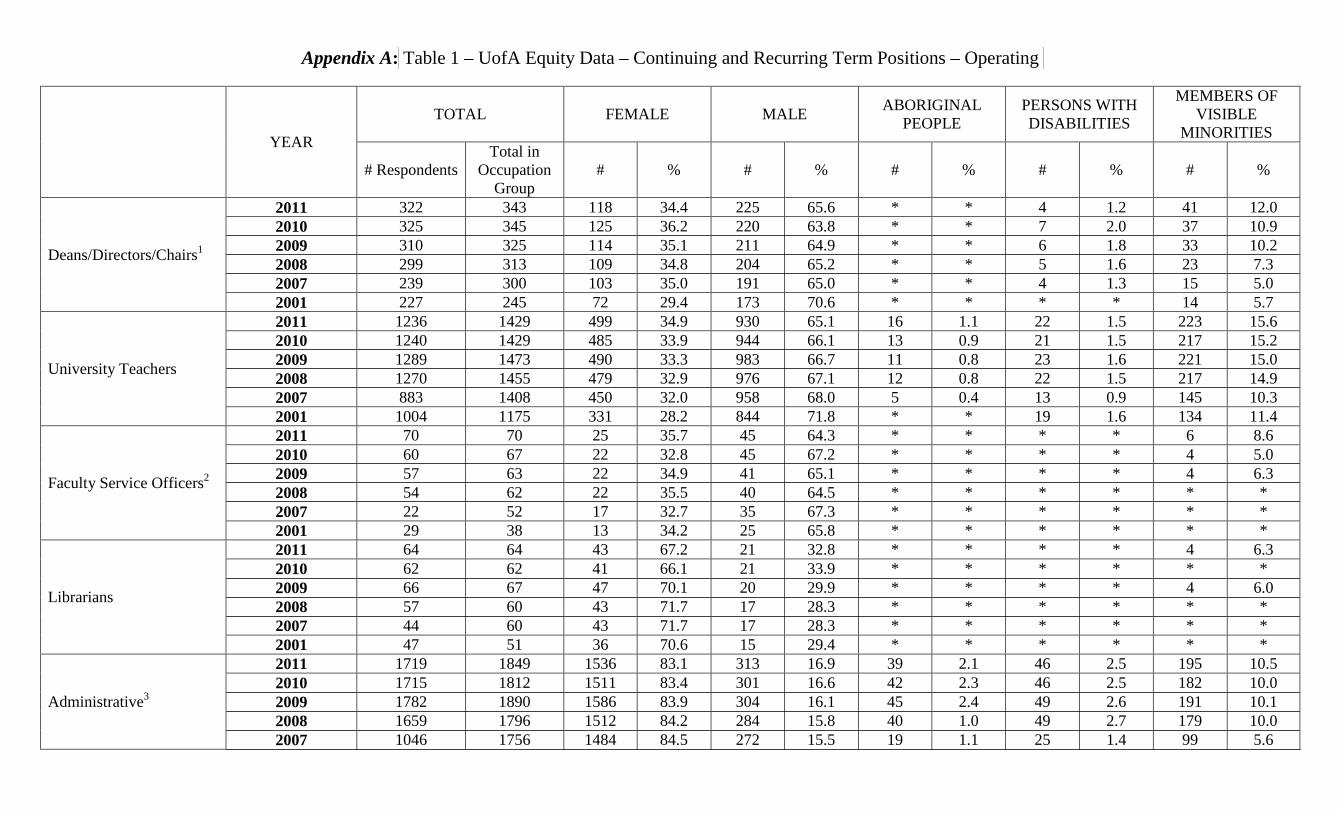
Appendix A: Table 1 – UofA Equity Data – Continuing and Recurring Term Positions – Operating
YEAR
TOTAL FEMALE MALE ABORIGINAL PEOPLE
PERSONS WITH DISABILITIES
MEMBERS OF VISIBLE
MINORITIES
# Respondents Total in
Occupation Group
# % # % # % # % # %
Deans/Directors/Chairs1
2011 322 343 118 34.4 225 65.6 * * 4 1.2 41 12.0 2010 325 345 125 36.2 220 63.8 * * 7 2.0 37 10.9 2009 310 325 114 35.1 211 64.9 * * 6 1.8 33 10.2 2008 299 313 109 34.8 204 65.2 * * 5 1.6 23 7.3 2007 239 300 103 35.0 191 65.0 * * 4 1.3 15 5.0 2001 227 245 72 29.4 173 70.6 * * * * 14 5.7
University Teachers
2011 1236 1429 499 34.9 930 65.1 16 1.1 22 1.5 223 15.6 2010 1240 1429 485 33.9 944 66.1 13 0.9 21 1.5 217 15.2 2009 1289 1473 490 33.3 983 66.7 11 0.8 23 1.6 221 15.0 2008 1270 1455 479 32.9 976 67.1 12 0.8 22 1.5 217 14.9 2007 883 1408 450 32.0 958 68.0 5 0.4 13 0.9 145 10.3 2001 1004 1175 331 28.2 844 71.8 * * 19 1.6 134 11.4
Faculty Service Officers2
2011 70 70 25 35.7 45 64.3 * * * * 6 8.6 2010 60 67 22 32.8 45 67.2 * * * * 4 5.0 2009 57 63 22 34.9 41 65.1 * * * * 4 6.3 2008 54 62 22 35.5 40 64.5 * * * * * * 2007 22 52 17 32.7 35 67.3 * * * * * * 2001 29 38 13 34.2 25 65.8 * * * * * *
Librarians
2011 64 64 43 67.2 21 32.8 * * * * 4 6.3 2010 62 62 41 66.1 21 33.9 * * * * * * 2009 66 67 47 70.1 20 29.9 * * * * 4 6.0 2008 57 60 43 71.7 17 28.3 * * * * * * 2007 44 60 43 71.7 17 28.3 * * * * * * 2001 47 51 36 70.6 15 29.4 * * * * * *
Administrative3
2011 1719 1849 1536 83.1 313 16.9 39 2.1 46 2.5 195 10.5 2010 1715 1812 1511 83.4 301 16.6 42 2.3 46 2.5 182 10.0 2009 1782 1890 1586 83.9 304 16.1 45 2.4 49 2.6 191 10.1 2008 1659 1796 1512 84.2 284 15.8 40 1.0 49 2.7 179 10.0 2007 1046 1756 1484 84.5 272 15.5 19 1.1 25 1.4 99 5.6
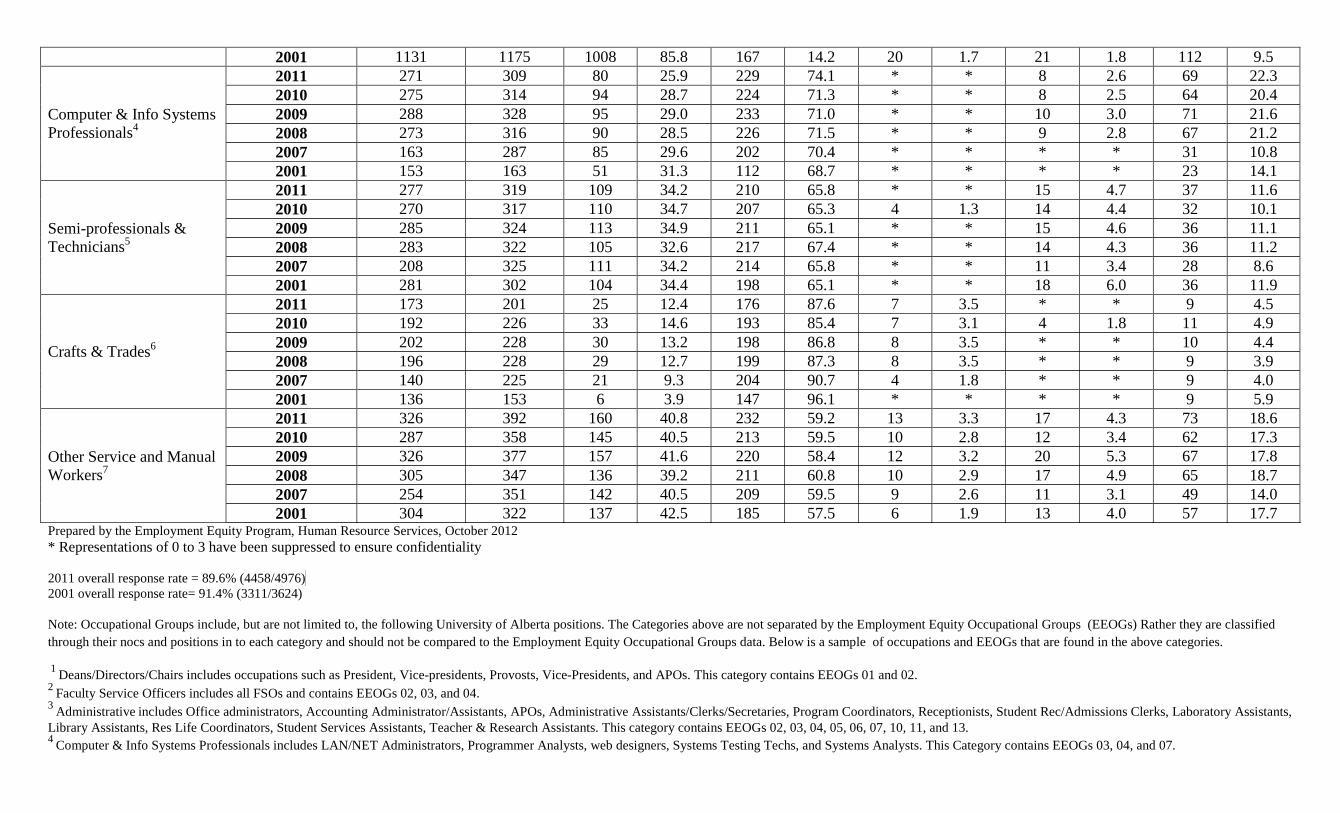
Prepared by the Employment Equity Program, Human Resource Services, October 2012 * Representations of 0 to 3 have been suppressed to ensure confidentiality 2011 overall response rate = 89.6% (4458/4976) 2001 overall response rate= 91.4% (3311/3624) Note: Occupational Groups include, but are not limited to, the following University of Alberta positions. The Categories above are not separated by the Employment Equity Occupational Groups (EEOGs) Rather they are classified through their nocs and positions in to each category and should not be compared to the Employment Equity Occupational Groups data. Below is a sample of occupations and EEOGs that are found in the above categories.
1 Deans/Directors/Chairs includes occupations such as President, Vice-presidents, Provosts, Vice-Presidents, and APOs. This category contains EEOGs 01 and 02. 2 Faculty Service Officers includes all FSOs and contains EEOGs 02, 03, and 04. 3 Administrative includes Office administrators, Accounting Administrator/Assistants, APOs, Administrative Assistants/Clerks/Secretaries, Program Coordinators, Receptionists, Student Rec/Admissions Clerks, Laboratory Assistants, Library Assistants, Res Life Coordinators, Student Services Assistants, Teacher & Research Assistants. This category contains EEOGs 02, 03, 04, 05, 06, 07, 10, 11, and 13. 4 Computer & Info Systems Professionals includes LAN/NET Administrators, Programmer Analysts, web designers, Systems Testing Techs, and Systems Analysts. This Category contains EEOGs 03, 04, and 07.
2001 1131 1175 1008 85.8 167 14.2 20 1.7 21 1.8 112 9.5
Computer & Info Systems Professionals4
2011 271 309 80 25.9 229 74.1 * * 8 2.6 69 22.3 2010 275 314 94 28.7 224 71.3 * * 8 2.5 64 20.4 2009 288 328 95 29.0 233 71.0 * * 10 3.0 71 21.6 2008 273 316 90 28.5 226 71.5 * * 9 2.8 67 21.2 2007 163 287 85 29.6 202 70.4 * * * * 31 10.8 2001 153 163 51 31.3 112 68.7 * * * * 23 14.1
Semi-professionals & Technicians5
2011 277 319 109 34.2 210 65.8 * * 15 4.7 37 11.6 2010 270 317 110 34.7 207 65.3 4 1.3 14 4.4 32 10.1 2009 285 324 113 34.9 211 65.1 * * 15 4.6 36 11.1 2008 283 322 105 32.6 217 67.4 * * 14 4.3 36 11.2 2007 208 325 111 34.2 214 65.8 * * 11 3.4 28 8.6 2001 281 302 104 34.4 198 65.1 * * 18 6.0 36 11.9
Crafts & Trades6
2011 173 201 25 12.4 176 87.6 7 3.5 * * 9 4.5 2010 192 226 33 14.6 193 85.4 7 3.1 4 1.8 11 4.9 2009 202 228 30 13.2 198 86.8 8 3.5 * * 10 4.4 2008 196 228 29 12.7 199 87.3 8 3.5 * * 9 3.9 2007 140 225 21 9.3 204 90.7 4 1.8 * * 9 4.0 2001 136 153 6 3.9 147 96.1 * * * * 9 5.9
Other Service and Manual Workers7
2011 326 392 160 40.8 232 59.2 13 3.3 17 4.3 73 18.6 2010 287 358 145 40.5 213 59.5 10 2.8 12 3.4 62 17.3 2009 326 377 157 41.6 220 58.4 12 3.2 20 5.3 67 17.8 2008 305 347 136 39.2 211 60.8 10 2.9 17 4.9 65 18.7 2007 254 351 142 40.5 209 59.5 9 2.6 11 3.1 49 14.0 2001 304 322 137 42.5 185 57.5 6 1.9 13 4.0 57 17.7
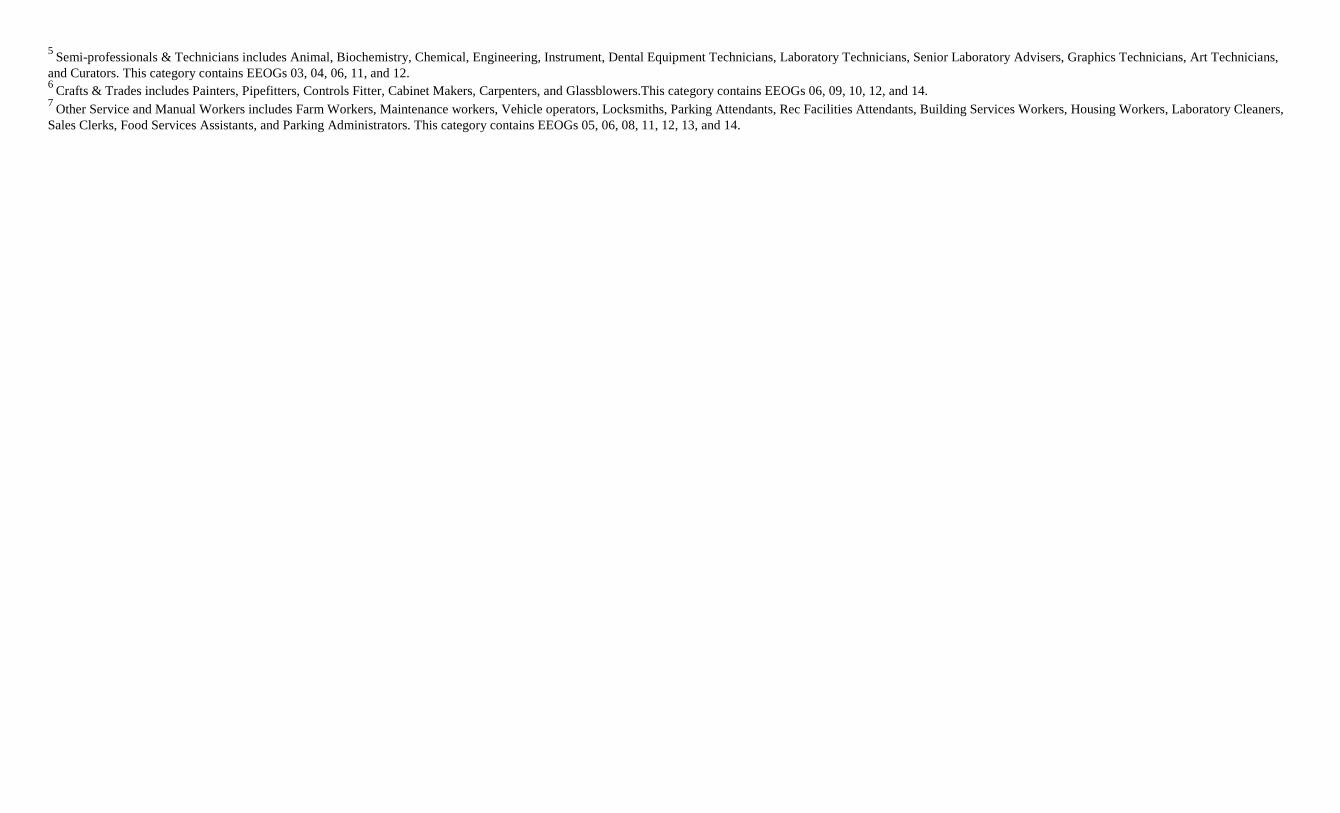
5 Semi-professionals & Technicians includes Animal, Biochemistry, Chemical, Engineering, Instrument, Dental Equipment Technicians, Laboratory Technicians, Senior Laboratory Advisers, Graphics Technicians, Art Technicians, and Curators. This category contains EEOGs 03, 04, 06, 11, and 12. 6 Crafts & Trades includes Painters, Pipefitters, Controls Fitter, Cabinet Makers, Carpenters, and Glassblowers.This category contains EEOGs 06, 09, 10, 12, and 14. 7 Other Service and Manual Workers includes Farm Workers, Maintenance workers, Vehicle operators, Locksmiths, Parking Attendants, Rec Facilities Attendants, Building Services Workers, Housing Workers, Laboratory Cleaners, Sales Clerks, Food Services Assistants, and Parking Administrators. This category contains EEOGs 05, 06, 08, 11, 12, 13, and 14.
Provided by: University of Alberta Employment Equity Program, Human Resource Services, October 2012
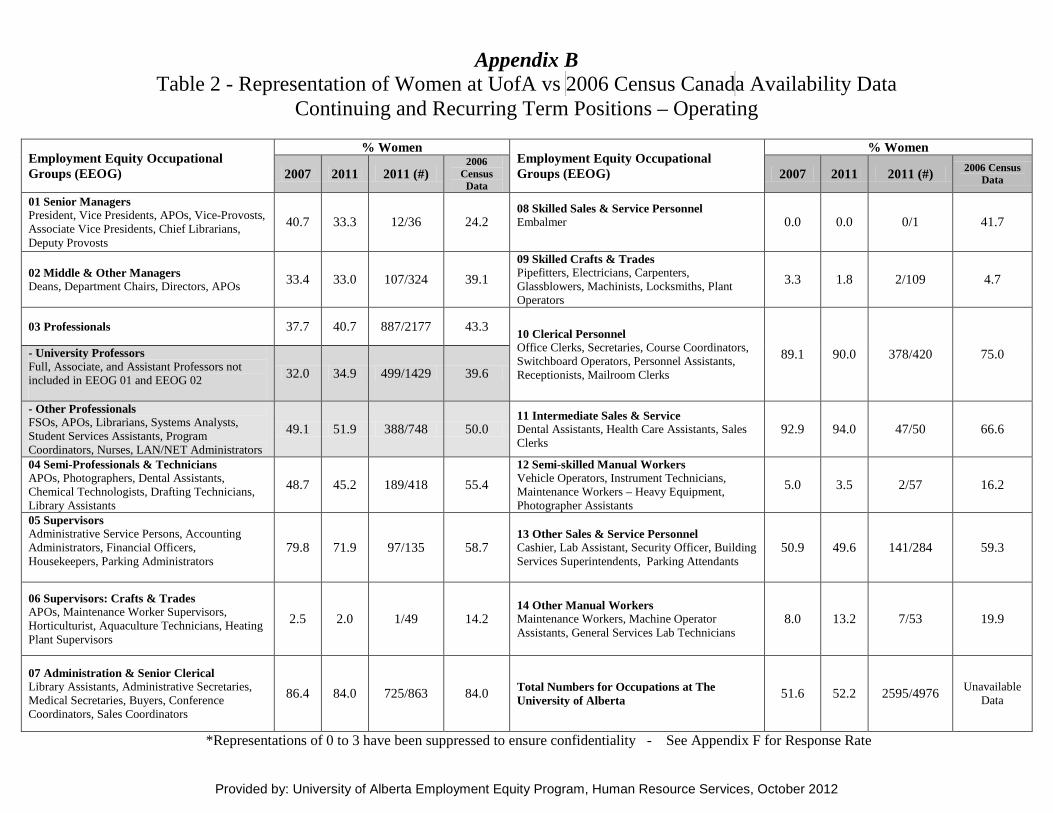
Appendix B Table 2 - Representation of Women at UofA vs 2006 Census Canada Availability Data
Continuing and Recurring Term Positions – Operating
Employment Equity Occupational Groups (EEOG)
% Women Employment Equity Occupational Groups (EEOG)
% Women
2007 2011 2011 (#) 2006
Census Data
2007 2011 2011 (#) 2006 Census Data
01 Senior Managers President, Vice Presidents, APOs, Vice-Provosts, Associate Vice Presidents, Chief Librarians, Deputy Provosts
40.7 33.3 12/36 24.2 08 Skilled Sales & Service Personnel Embalmer
0.0 0.0 0/1 41.7
02 Middle & Other Managers Deans, Department Chairs, Directors, APOs 33.4 33.0 107/324 39.1
09 Skilled Crafts & Trades Pipefitters, Electricians, Carpenters, Glassblowers, Machinists, Locksmiths, Plant Operators
3.3 1.8 2/109 4.7
03 Professionals 37.7 40.7 887/2177 43.3 10 Clerical Personnel Office Clerks, Secretaries, Course Coordinators, Switchboard Operators, Personnel Assistants, Receptionists, Mailroom Clerks
89.1 90.0 378/420 75.0 - University Professors Full, Associate, and Assistant Professors not included in EEOG 01 and EEOG 02
32.0 34.9 499/1429 39.6
- Other Professionals FSOs, APOs, Librarians, Systems Analysts, Student Services Assistants, Program Coordinators, Nurses, LAN/NET Administrators
49.1 51.9 388/748 50.0 11 Intermediate Sales & Service Dental Assistants, Health Care Assistants, Sales Clerks
92.9 94.0 47/50 66.6
04 Semi-Professionals & Technicians APOs, Photographers, Dental Assistants, Chemical Technologists, Drafting Technicians, Library Assistants
48.7 45.2 189/418 55.4 12 Semi-skilled Manual Workers Vehicle Operators, Instrument Technicians, Maintenance Workers – Heavy Equipment, Photographer Assistants
5.0 3.5 2/57 16.2
05 Supervisors Administrative Service Persons, Accounting Administrators, Financial Officers, Housekeepers, Parking Administrators
79.8 71.9 97/135 58.7 13 Other Sales & Service Personnel Cashier, Lab Assistant, Security Officer, Building Services Superintendents, Parking Attendants
50.9 49.6 141/284 59.3
06 Supervisors: Crafts & Trades APOs, Maintenance Worker Supervisors, Horticulturist, Aquaculture Technicians, Heating Plant Supervisors
2.5 2.0 1/49 14.2 14 Other Manual Workers Maintenance Workers, Machine Operator Assistants, General Services Lab Technicians
8.0 13.2 7/53 19.9
07 Administration & Senior Clerical Library Assistants, Administrative Secretaries, Medical Secretaries, Buyers, Conference Coordinators, Sales Coordinators
86.4 84.0 725/863 84.0 Total Numbers for Occupations at The University of Alberta 51.6 52.2 2595/4976 Unavailable
Data
*Representations of 0 to 3 have been suppressed to ensure confidentiality - See Appendix F for Response Rate

Provided by: University of Alberta Employment Equity Program, Human Resource Services, October 2012
Appendix C: Table 3 - Representation of Aboriginal Peoples at UofA vs 2006 Census Canada Availability Data
Continuing and Recurring Term Positions – Operating
Employment Equity Occupational Groups (EEOG)
% Aboriginal Peoples Employment Equity Occupational Groups (EEOG)
% Aboriginal Peoples
2007 2011 2011 (#) 2006
Census Data
2007 2011 2011 (#) 2006 Census Data
01 Senior Managers President, Vice Presidents, APOs, Vice-Provosts, Associate Vice Presidents, Chief Librarians, Deputy Provosts
* * */36 2.4 08 Skilled Sales & Service Personnel Embalmer
* * */1 0.0
02 Middle & Other Managers Deans, Department Chairs, Directors, APOs
* * */324 1.9 09 Skilled Crafts & Trades Pipefitters, Electricians, Carpenters, Glassblowers, Machinists, Locksmiths, Plant Operators
* 5.5 6/109 3.7
03 Professionals 0.6 1.3 28/2177 1.4 10 Clerical Personnel Office Clerks, Secretaries, Course Coordinators, Switchboard Operators, Personnel Assistants, Receptionists, Mailroom Clerks
1.7 2.9 12/420 4.4 - University Professors Full, Associate, and Assistant Professors not included in EEOG 01 and EEOG 02
0.4 1.1 16/1429 0.9
- Other Professionals FSOs, APOs, Librarians, Systems Analysts, Student Services Assistants, Program Coordinators, Nurses, LAN/NET Administrators
1.1 1.6 12/748 2.3 11 Intermediate Sales & Service Dental Assistants, Health Care Assistants, Sales Clerks
* * */50 4.1
04 Semi-Professionals & Technicians APOs, Photographers, Dental Assistants, Chemical Technologists, Drafting Technicians, Library Assistants
0.5 1.0 4/418 2.8 12 Semi-skilled Manual Workers Vehicle Operators, Instrument Technicians, Maintenance Workers – Heavy Equipment, Photographer Assistants
* * */57 5.4
05 Supervisors Administrative Service Persons, Accounting Administrators, Financial Officers, Housekeepers, Parking Administrators
* * */135 4.1 13 Other Sales & Service Personnel Cashier, Lab Assistant, Security Officer, Building Services Superintendents, Parking Attendants
2.9 3.5 10/284 6.8
06 Supervisors: Crafts & Trades APOs, Maintenance Worker Supervisors, Horticulturist, Aquaculture Technicians, Heating Plant Supervisors
* * */49 3.5 14 Other Manual Workers Maintenance Workers, Machine Operator Assistants, General Services Lab Technicians
* * */53 9.7
07 Administration & Senior Clerical Library Assistants, Administrative Secretaries, Medical Secretaries, Buyers, Conference Coordinators, Sales Coordinators
0.8 2.2 19/863 3.2 Total Numbers for Occupations at The University of Alberta 0.9 1.7 86/4976 Unavailable
Data
*Representations of 0 to 3 have been suppressed to ensure confidentiality - See Appendix F for Response Rate
Provided by: University of Alberta Employment Equity Program, Human Resource Services, October 2012
Appendix D: Table 4 - Representation of Persons with Disabilities at UofA vs 2006 Census Canada Availability Data
Continuing and Recurring Term Positions – Operating
Employment Equity Occupational Groups (EEOG)
% Persons with Disabilities Employment Equity Occupational Groups (EEOG)
% Persons with Disabilities
2007 2011 2011 (#) 2006
Census Data
2007 2011 2011 (#) 2006 Census Data
01 Senior Managers President, Vice Presidents, APOs, Vice-Provosts, Associate Vice Presidents, Chief Librarians, Deputy Provosts
* * */36
3.2
08 Skilled Sales & Service Personnel Embalmer
* * */1 0.0
02 Middle & Other Managers Deans, Department Chairs, Directors, APOs
1.7 1.9 6/324 09 Skilled Crafts & Trades Pipefitters, Electricians, Carpenters, Glassblowers, Machinists, Locksmiths, Plant Operators
* * */109 5.3
03 Professionals 0.9 1.8 39/2177
4.5
10 Clerical Personnel Office Clerks, Secretaries, Course Coordinators, Switchboard Operators, Personnel Assistants, Receptionists, Mailroom Clerks
1.7 4.8 20/420 4.4 - University Professors Full, Associate, and Assistant Professors not included in EEOG 01 and EEOG 02
0.9 1.5 22/1429
- Other Professionals FSOs, APOs, Librarians, Systems Analysts, Student Services Assistants, Program Coordinators, Nurses, LAN/NET Administrators
1.1 2.3 17/748 11 Intermediate Sales & Service Dental Assistants, Health Care Assistants, Sales Clerks
* * */50 5.3
04 Semi-Professionals & Technicians APOs, Photographers, Dental Assistants, Chemical Technologists, Drafting Technicians, Library Assistants
2.9 4.1 17/418 4.8 12 Semi-skilled Manual Workers Vehicle Operators, Instrument Technicians, Maintenance Workers – Heavy Equipment, Photographer Assistants
3.3 8.8 5/57 5.5
05 Supervisors Administrative Service Persons, Accounting Administrators, Financial Officers, Housekeepers, Parking Administrators
4.0 4.4 6/135 9.5 13 Other Sales & Service Personnel Cashier, Lab Assistant, Security Officer, Building Services Superintendents, Parking Attendants
2.5 3.2 9/284 6.5
06 Supervisors: Crafts & Trades APOs, Maintenance Worker Supervisors, Horticulturist, Aquaculture Technicians, Heating Plant Supervisors
* * */49 4.6 14 Other Manual Workers Maintenance Workers, Machine Operator Assistants, General Services Lab Technicians
* * */53 5.2
07 Administration & Senior Clerical Library Assistants, Administrative Secretaries, Medical Secretaries, Buyers, Conference Coordinators, Sales Coordinators
0.8 1.4 12/863 2.6 Total Numbers for Occupations at The University of Alberta 1.4 2.4 117/4976 Unavailable
Data
*Representations of 0 to 3 have been suppressed to ensure confidentiality - See Appendix F for Response Rate

Provided by: University of Alberta Employment Equity Program, Human Resource Services, October 2012
Appendix E: Table 5 - Representation of of Visible Minorities at UofA vs 2006 Census Canada Availability Data
Continuing and Recurring Term Positions – Operating
Employment Equity Occupational Groups (EEOG)
% Members of Visible Minorities Employment Equity Occupational Groups (EEOG)
% Members of Visible Minorities
2007 2011 2011 (#) 2006
Census Data
2007 2011 2011 (#) 2006 Census Data
01 Senior Managers President, Vice Presidents, APOs, Vice-Provosts, Associate Vice Presidents, Chief Librarians, Deputy Provosts
3.7 11.1 4/36 8.7 08 Skilled Sales & Service Personnel Embalmer
* * */1 0.0
02 Middle & Other Managers Deans, Department Chairs, Directors, APOs 4.9 11.7 38/324 14.0
09 Skilled Crafts & Trades Pipefitters, Electricians, Carpenters, Glassblowers, Machinists, Locksmiths, Plant Operators
* * */109 13.0
03 Professionals 9.1 15.1 329/2177 16.0 10 Clerical Personnel Office Clerks, Secretaries, Course Coordinators, Switchboard Operators, Personnel Assistants, Receptionists, Mailroom Clerks
6.9 13.6 57/420 13.6 - University Professors Full, Associate, and Assistant Professors not included in EEOG 01 and EEOG 02
10.3 15.6 223/1429 15.1
- Other Professionals FSOs, APOs, Librarians, Systems Analysts, Student Services Assistants, Program Coordinators, Nurses, LAN/NET Administrators
6.6 14.2 106/748 17.6 11 Intermediate Sales & Service Dental Assistants, Health Care Assistants, Sales Clerks
* 8.0 4/50 18.4
04 Semi-Professionals & Technicians APOs, Photographers, Dental Assistants, Chemical Technologists, Drafting Technicians, Library Assistants
11.1 12.4 52/418 11.6 12 Semi-skilled Manual Workers Vehicle Operators, Instrument Technicians, Maintenance Workers – Heavy Equipment, Photographer Assistants
3.3 10.5 6/57 16.7
05 Supervisors Administrative Service Persons, Accounting Administrators, Financial Officers, Housekeepers, Parking Administrators
10.1 11.9 16/135 14.2 13 Other Sales & Service Personnel Cashier, Lab Assistant, Security Officer, Building Services Superintendents, Parking Attendants
14.3 20.8 59/284 24.3
06 Supervisors: Crafts & Trades APOs, Maintenance Worker Supervisors, Horticulturist, Aquaculture Technicians, Heating Plant Supervisors
* * */49 4.4 14 Other Manual Workers Maintenance Workers, Machine Operator Assistants, General Services Lab Technicians
12.0 9.4 5/53 14.8
07 Administration & Senior Clerical Library Assistants, Administrative Secretaries, Medical Secretaries, Buyers, Conference Coordinators, Sales Coordinators
3.9 9.5 82/863 9.7 Total Numbers for Occupations at The University of Alberta 8.0 13.2 657/4976 Unavailable
Data
*Representations of 0 to 3 have been suppressed to ensure confidentiality - See Appendix F for Response Rate
Provided by: University of Alberta Employment Equity Program, Human Resource Services, October 2012
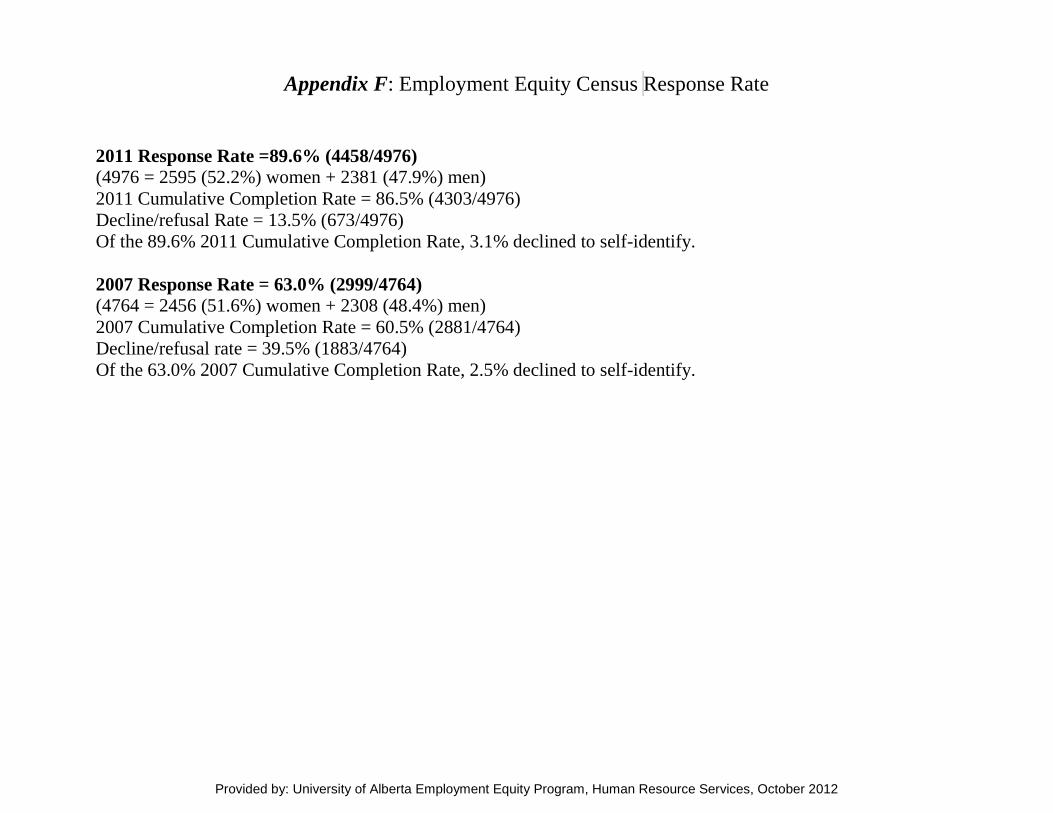
Appendix F: Employment Equity Census Response Rate
2011 Response Rate =89.6% (4458/4976) (4976 = 2595 (52.2%) women + 2381 (47.9%) men) 2011 Cumulative Completion Rate = 86.5% (4303/4976) Decline/refusal Rate = 13.5% (673/4976) Of the 89.6% 2011 Cumulative Completion Rate, 3.1% declined to self-identify. 2007 Response Rate = 63.0% (2999/4764) (4764 = 2456 (51.6%) women + 2308 (48.4%) men) 2007 Cumulative Completion Rate = 60.5% (2881/4764) Decline/refusal rate = 39.5% (1883/4764) Of the 63.0% 2007 Cumulative Completion Rate, 2.5% declined to self-identify.