Malaysian Economy in Figures 2011
20
-
Upload
terengganu -
Category
Documents
-
view
3 -
download
0
Transcript of Malaysian Economy in Figures 2011
THE MALAYSIAN ECONOMY IN FIGURES
2011
Economic Planning UnitPrime Minister’s Departmenthttp://www.epu.gov.my

The Malaysian Economy
in Figures 2011
Prepared by Economic Planning Unit, Prime Minister's Department
13 December 2011
The Malaysian Economy in Figures 2011
P a g e | ii
Table of Contents
1. KEY ECONOMIC INDICATORS .................................................................................................................................................. 1
2. AREA, POPULATION AND LABOUR FORCE ........................................................................................................................... 3
2.1 Area & Population .............................................................................................................................................................. 3
2.2 Population Age Structure ................................................................................................................................................... 3
2.3 Population by Ethnic Group ............................................................................................................................................... 3
2.4 Labour Force ..................................................................................................................................................................... 3
2.5 Employment....................................................................................................................................................................... 3
3. GROSS DOMESTIC PRODUCT .................................................................................................................................................. 4
3.1 Supply ............................................................................................................................................................................... 4
3.2 Demand ............................................................................................................................................................................. 4
3.3 Savings & Investment Gap ................................................................................................................................................ 5
3.4 Production of Major Products ............................................................................................................................................ 5
3.5 Distributive Trade .............................................................................................................................................................. 5
3.6 Manufacturing Production Index ........................................................................................................................................ 6
4. PUBLIC SECTOR ACCOUNTS ................................................................................................................................................... 7
4.1 Federal Government Finance ............................................................................................................................................ 7
4.1.1 Total revenue ......................................................................................................................................... 7
4.1.2 Operating Expenditure ............................................................................................................................ 7
4.1.3 Development Expenditure ........................................................................................................................ 7
4.1.4 Overall Surplus/Deficit ............................................................................................................................. 7
4.1.5 Sources of Finance ................................................................................................................................. 7 4.2 Consolidated Public Sector Finance .................................................................................................................................. 7
4.2.1 General Government ........................................................................................................................................... 7
4.2.2 Non-Financial Public Enterprises ........................................................................................................................ 7
4.2.3 Total Public Sector Current ................................................................................................................................. 7
4.2.4 Development Expenditure ................................................................................................................................... 7
4.2.5 Overall Surplus/Deficit ......................................................................................................................................... 7
4.2.6 External Debt ...................................................................................................................................................... 7
5. BALANCE OF PAYMENTS ......................................................................................................................................................... 9
5.1 Goods ................................................................................................................................................................................ 9
5.2 Services ............................................................................................................................................................................. 9
5.3 Income ............................................................................................................................................................................... 9
5.4 Current Transfers .............................................................................................................................................................. 9
5.5 Current Account Balance ................................................................................................................................................... 9
5.6 Capital & Financial Account Balance ................................................................................................................................. 9
5.7 Overall Balance ................................................................................................................................................................. 9
6. BURSA MALAYSIA ................................................................................................................................................................... 10
6.1 Composite Index .............................................................................................................................................................. 10
6.2 Market Valuation .............................................................................................................................................................. 10
6.3 Selected World Stock Market Indices .............................................................................................................................. 10
6.4 New Listings .................................................................................................................................................................... 10
6.5 Listed Companies ............................................................................................................................................................ 10
6.6 Turnover .......................................................................................................................................................................... 10
7. APPROVED INVESTMENT PROJECTS ................................................................................................................................... 11
7.1 Approved Investment Projects ......................................................................................................................................... 11
7.2 Foreign Investment in Approved Projects ........................................................................................................................ 11
7.3 Proposed Capital Investment in Approved Projects ......................................................................................................... 11
The Malaysian Economy in Figures 2011
P a g e | iii
8. EXTERNAL SECTOR ................................................................................................................................................................ 12
8.1 Exports ............................................................................................................................................................................ 12
8.2 Imports ............................................................................................................................................................................ 12
8.3 Direction of Exports ......................................................................................................................................................... 13
8.4 Sources of Imports .......................................................................................................................................................... 13
8.5 Trade Prices & Terms of Trade ....................................................................................................................................... 13
8.6 Trade Balance by Main Trading Partners ........................................................................................................................ 14
8.7 Tourist Arrivals by Region ............................................................................................................................................... 14
9. PUBLIC PRIVATE PARTNERSHIP ........................................................................................................................................... 15
9.1 Public Private Partnership Achievement .......................................................................................................................... 15
10. ENERGY AND INFRASTRUCTURE ......................................................................................................................................... 15
10.1 Primary Commercial Energy - Final Demand .................................................................................................................. 15
10.2 Electricity - Demand & Supply ......................................................................................................................................... 15
10.3 Roads by Surface Type ................................................................................................................................................... 16
10.4 Railway Statistics ............................................................................................................................................................. 16
10.5 Air Traffic Statistics .......................................................................................................................................................... 16
10.6 Port Statistics ................................................................................................................................................................... 16
11. QUALITY OF LIFE ..................................................................................................................................................................... 16
11.1 Area Indices & the Malaysian Quality of Life Index .......................................................................................................... 16
11.2 Selected Social Indicators ............................................................................................................................................... 17
11.3 Poverty ............................................................................................................................................................................ 18
11.4 Female-Related Information ............................................................................................................................................ 18
12. INTERNATIONAL COMPARISON ............................................................................................................................................ 19
12.1 Real Gross Domestic Product ......................................................................................................................................... 19
12.2 Consumer Price Index ..................................................................................................................................................... 19
12.3 Structure of Output .......................................................................................................................................................... 20
12.4 Structure of Demand ....................................................................................................................................................... 20
12.5 Current Account of Balance of Payments ........................................................................................................................ 21
12.6 Savings & Investment ...................................................................................................................................................... 21
12.7 Government, Debt & Resource Flows ............................................................................................................................. 22
12.8 GNI Per Capita ................................................................................................................................................................ 22
12.9 Population, Urbanisation & Population Density ............................................................................................................... 23
12.10 Structure of Employment ................................................................................................................................................. 23
12.11 Quality of Life................................................................................................................................................................... 24
12.12 Information Age ............................................................................................................................................................... 25
12.13 Science & Technology ..................................................................................................................................................... 26
12.14 The Knowledge-based Economy Development Index ..................................................................................................... 27
13. MALAYSIA’S COMPETITIVENESS POSITION ........................................................................................................................ 27
14. INVESTOR’S GUIDE ................................................................................................................................................................. 28
14.1 Income Tax Rate ............................................................................................................................................................. 28
14.2 Promotion of Investment Act, 1986 .................................................................................................................................. 28
14.3 Income Tax Act, 1967 ...................................................................................................................................................... 28
14.4 Others .............................................................................................................................................................................. 28
14.5 Website Link .................................................................................................................................................................... 28
15. FOREIGN EXCHANGE ADMINISTRATION POLICY ............................................................................................................... 28
15.1 Foreign Exchange Administration Rules Applicable to Residents ................................................................................... 28
15.1.1 Investments in Foreign Currency Assets by Residents ..................................................................................... 29
15.1.2 Rules for Residents by Other Subject ............................................................................................................... 30
15.2 Foreign Exchange Administration Rules Applicable to Non-Residents ............................................................................ 30
15.2.1 Foreign Direct & Portfolio Investments by Non-Residents ......................................................................... 31
15.2.2 Rules for Residents by Other Subject ..................................................................................................... 31

The Malaysian Economy in Figures 2011
P a g e | i
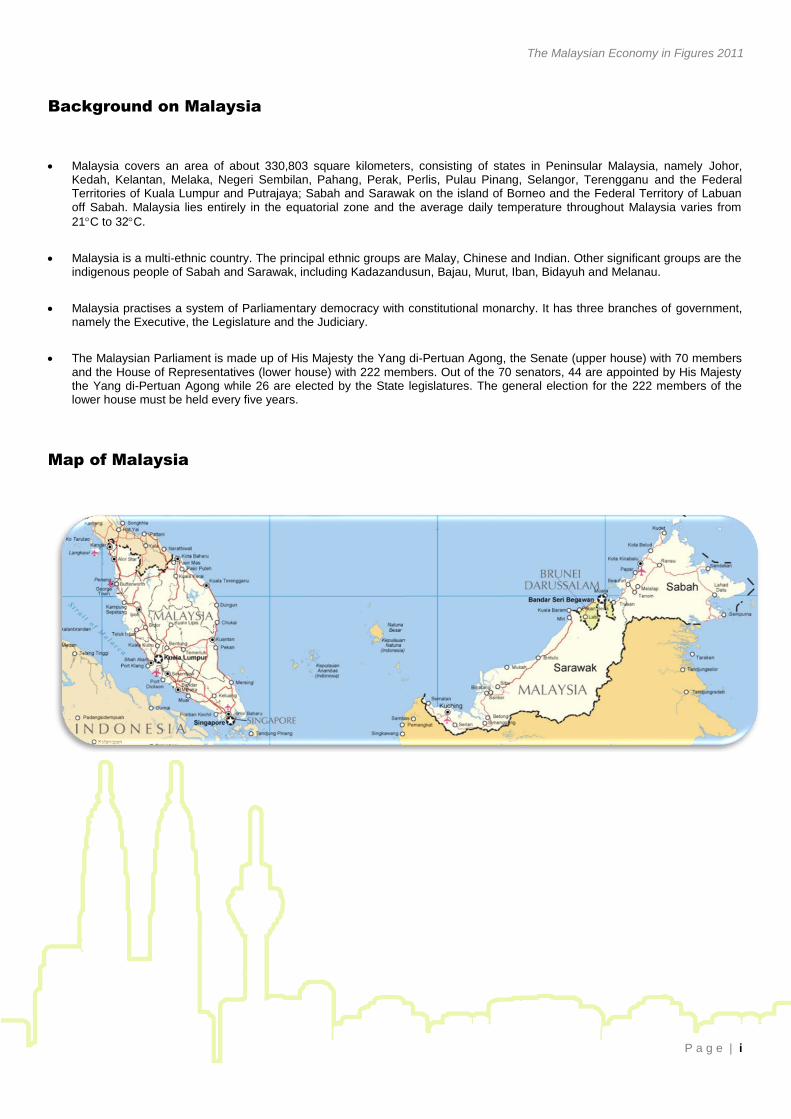
Background on Malaysia
Malaysia covers an area of about 330,803 square kilometers, consisting of states in Peninsular Malaysia, namely Johor, Kedah, Kelantan, Melaka, Negeri Sembilan, Pahang, Perak, Perlis, Pulau Pinang, Selangor, Terengganu and the Federal Territories of Kuala Lumpur and Putrajaya; Sabah and Sarawak on the island of Borneo and the Federal Territory of Labuan off Sabah. Malaysia lies entirely in the equatorial zone and the average daily temperature throughout Malaysia varies from
21C to 32C.
Malaysia is a multi-ethnic country. The principal ethnic groups are Malay, Chinese and Indian. Other significant groups are the indigenous people of Sabah and Sarawak, including Kadazandusun, Bajau, Murut, Iban, Bidayuh and Melanau.
Malaysia practises a system of Parliamentary democracy with constitutional monarchy. It has three branches of government, namely the Executive, the Legislature and the Judiciary.
The Malaysian Parliament is made up of His Majesty the Yang di-Pertuan Agong, the Senate (upper house) with 70 members and the House of Representatives (lower house) with 222 members. Out of the 70 senators, 44 are appointed by His Majesty the Yang di-Pertuan Agong while 26 are elected by the State legislatures. The general election for the 222 members of the lower house must be held every five years.
Map of Malaysia
The Malaysian Economy in Figures 2011
P a g e | i
Background on Malaysia
Malaysia covers an area of about 330,803 square kilometers, consisting of states in Peninsular Malaysia, namely Johor, Kedah, Kelantan, Melaka, Negeri Sembilan, Pahang, Perak, Perlis, Pulau Pinang, Selangor, Terengganu and the Federal Territories of Kuala Lumpur and Putrajaya; Sabah and Sarawak on the island of Borneo and the Federal Territory of Labuan off Sabah. Malaysia lies entirely in the equatorial zone and the average daily temperature throughout Malaysia varies from
21C to 32C.
Malaysia is a multi-ethnic country. The principal ethnic groups are Malay, Chinese and Indian. Other significant groups are the indigenous people of Sabah and Sarawak, including Kadazandusun, Bajau, Murut, Iban, Bidayuh and Melanau.
Malaysia practises a system of Parliamentary democracy with constitutional monarchy. It has three branches of government, namely the Executive, the Legislature and the Judiciary.
The Malaysian Parliament is made up of His Majesty the Yang di-Pertuan Agong, the Senate (upper house) with 70 members and the House of Representatives (lower house) with 222 members. Out of the 70 senators, 44 are appointed by His Majesty the Yang di-Pertuan Agong while 26 are elected by the State legislatures. The general election for the 222 members of the lower house must be held every five years.
Map of Malaysia
The Malaysian Economy in Figures 2011
P a g e | 1
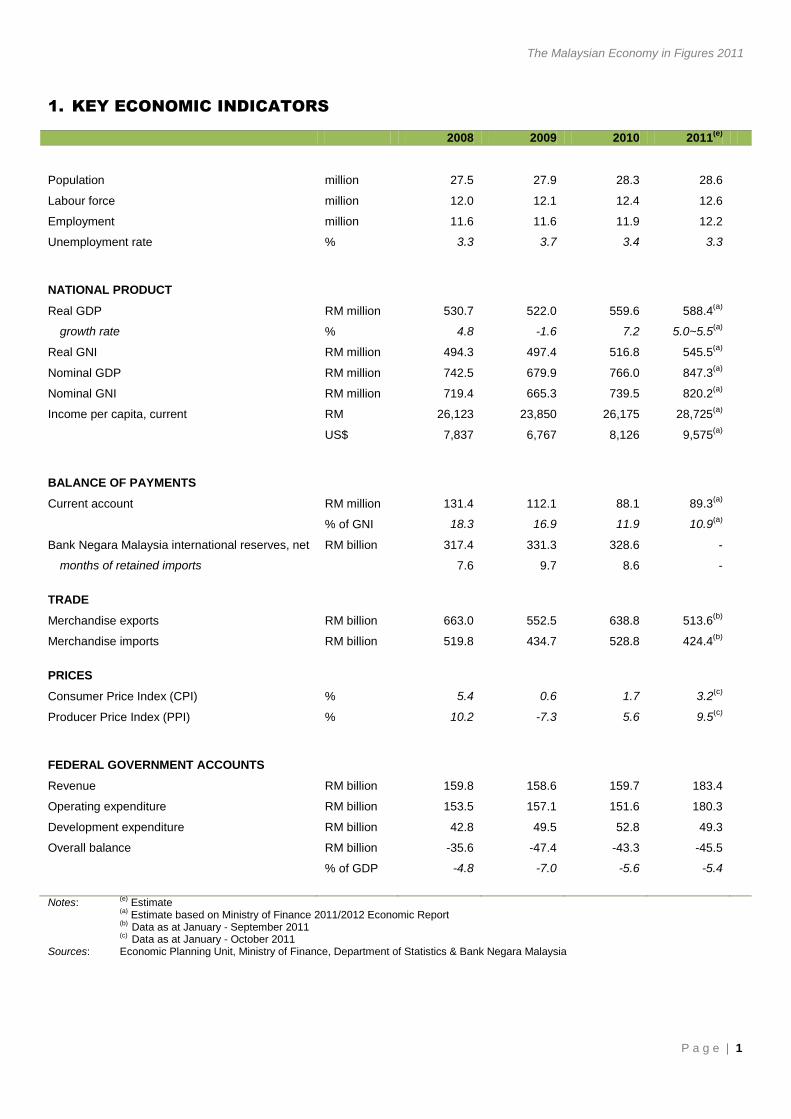
1. KEY ECONOMIC INDICATORS
2008 2009 2010 2011
(e)
Population million 27.5 27.9 28.3 28.6
Labour force million 12.0 12.1 12.4 12.6
Employment million 11.6 11.6 11.9 12.2
Unemployment rate % 3.3 3.7 3.4 3.3
NATIONAL PRODUCT
Real GDP RM million 530.7 522.0 559.6 588.4(a)
growth rate % 4.8 -1.6 7.2 5.0~5.5(a)
Real GNI RM million 494.3 497.4 516.8 545.5(a)
Nominal GDP RM million 742.5 679.9 766.0 847.3(a)
Nominal GNI RM million 719.4 665.3 739.5 820.2(a)
Income per capita, current RM 26,123 23,850 26,175 28,725(a)
US$ 7,837 6,767 8,126 9,575(a)
BALANCE OF PAYMENTS
Current account RM million 131.4 112.1 88.1 89.3(a)
% of GNI 18.3 16.9 11.9 10.9(a)
Bank Negara Malaysia international reserves, net RM billion 317.4 331.3 328.6 -
months of retained imports 7.6 9.7 8.6 -
TRADE
Merchandise exports RM billion 663.0 552.5 638.8 513.6(b)
Merchandise imports RM billion 519.8 434.7 528.8 424.4(b)
PRICES
Consumer Price Index (CPI) % 5.4 0.6 1.7 3.2(c)
Producer Price Index (PPI) % 10.2 -7.3 5.6 9.5(c)
FEDERAL GOVERNMENT ACCOUNTS
Revenue RM billion 159.8 158.6 159.7 183.4
Operating expenditure RM billion 153.5 157.1 151.6 180.3
Development expenditure RM billion 42.8 49.5 52.8 49.3
Overall balance RM billion -35.6 -47.4 -43.3 -45.5
% of GDP -4.8 -7.0 -5.6 -5.4
Notes:
(e) Estimate
(a)
Estimate based on Ministry of Finance 2011/2012 Economic Report
(b) Data as at January - September 2011
(c)
Data as at January - October 2011 Sources: Economic Planning Unit, Ministry of Finance, Department of Statistics & Bank Negara Malaysia
The Malaysian Economy in Figures 2011
P a g e | 2
2008 2009 2010 2011
(e)
EXCHANGE RATES
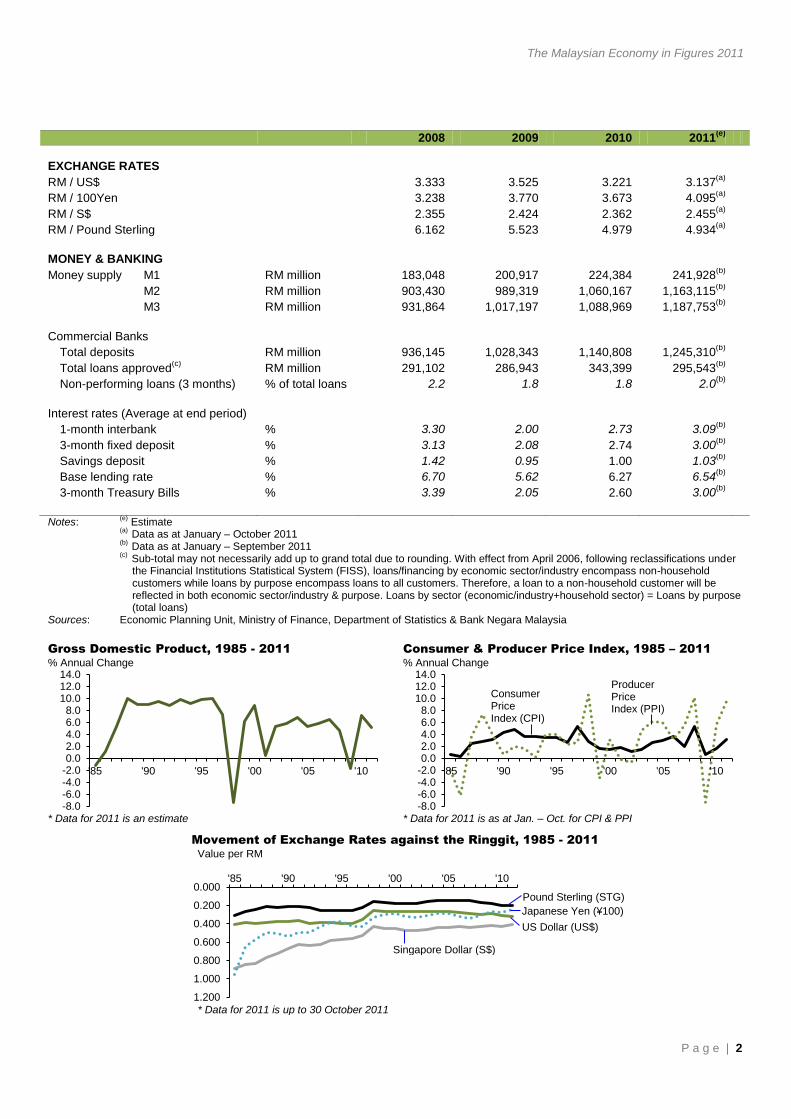
RM / US$ 3.333 3.525 3.221 3.137(a)
RM / 100Yen 3.238 3.770 3.673 4.095(a)
RM / S$ 2.355 2.424 2.362 2.455(a)
RM / Pound Sterling 6.162 5.523 4.979 4.934(a)
MONEY & BANKING
Money supply M1 RM million 183,048 200,917 224,384 241,928(b)
M2 RM million 903,430 989,319 1,060,167 1,163,115(b)
M3 RM million 931,864 1,017,197 1,088,969 1,187,753(b)
Commercial Banks
Total deposits RM million 936,145 1,028,343 1,140,808 1,245,310(b)
Total loans approved(c)
RM million 291,102 286,943 343,399 295,543(b)
Non-performing loans (3 months) % of total loans 2.2 1.8 1.8 2.0(b)
Interest rates (Average at end period)
1-month interbank % 3.30 2.00 2.73 3.09(b)
3-month fixed deposit % 3.13 2.08 2.74 3.00(b)
Savings deposit % 1.42 0.95 1.00 1.03(b)
Base lending rate % 6.70 5.62 6.27 6.54(b)
3-month Treasury Bills % 3.39 2.05 2.60 3.00(b)
Notes:
(e) Estimate
(a)
Data as at January – October 2011
(b) Data as at January – September 2011
(c)
Sub-total may not necessarily add up to grand total due to rounding. With effect from April 2006, following reclassifications under the Financial Institutions Statistical System (FISS), loans/financing by economic sector/industry encompass non-household customers while loans by purpose encompass loans to all customers. Therefore, a loan to a non-household customer will be reflected in both economic sector/industry & purpose. Loans by sector (economic/industry+household sector) = Loans by purpose (total loans)
Sources: Economic Planning Unit, Ministry of Finance, Department of Statistics & Bank Negara Malaysia
Gross Domestic Product, 1985 - 2011
% Annual Change
* Data for 2011 is an estimate
Consumer & Producer Price Index, 1985 – 2011
% Annual Change
* Data for 2011 is as at Jan. – Oct. for CPI & PPI
Movement of Exchange Rates against the Ringgit, 1985 - 2011
Value per RM
* Data for 2011 is up to 30 October 2011
-8.0-6.0-4.0-2.00.02.04.06.08.0
10.012.014.0
'85 '90 '95 '00 '05 '10
-8.0-6.0-4.0-2.00.02.04.06.08.0
10.012.014.0
'85 '90 '95 '00 '05 '10
0.000
0.200
0.400
0.600
0.800
1.000
1.200
'85 '90 '95 '00 '05 '10
Pound Sterling (STG)
Consumer Price Index (CPI)
Producer Price Index (PPI)
Japanese Yen (¥100)
US Dollar (US$)
Singapore Dollar (S$)
The Malaysian Economy in Figures 2011
P a g e | 3
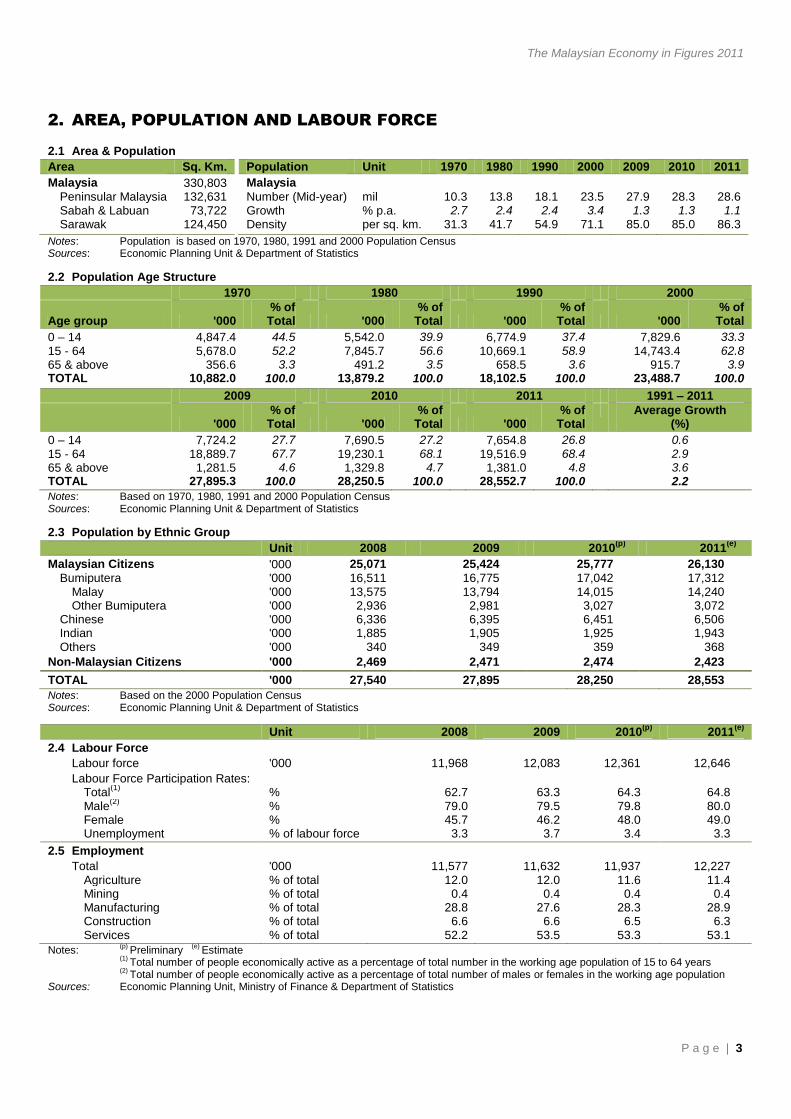
2. AREA, POPULATION AND LABOUR FORCE
2.1 Area & Population
Area Sq. Km. Population Unit 1970 1980 1990 2000 2009 2010 2011
Malaysia 330,803 Malaysia Peninsular Malaysia 132,631 Number (Mid-year) mil 10.3 13.8 18.1 23.5 27.9 28.3 28.6 Sabah & Labuan 73,722 Growth % p.a. 2.7 2.4 2.4 3.4 1.3 1.3 1.1 Sarawak 124,450 Density per sq. km. 31.3 41.7 54.9 71.1 85.0 85.0 86.3
Notes: Population is based on 1970, 1980, 1991 and 2000 Population Census Sources: Economic Planning Unit & Department of Statistics
2.2 Population Age Structure
1970 1980 1990 2000
Age group '000 % of
Total '000 % of
Total '000 % of
Total '000 % of
Total
0 – 14 4,847.4 44.5 5,542.0 39.9 6,774.9 37.4 7,829.6 33.3
15 - 64 5,678.0 52.2 7,845.7 56.6 10,669.1 58.9 14,743.4 62.8 65 & above 356.6 3.3 491.2 3.5 658.5 3.6 915.7 3.9 TOTAL 10,882.0 100.0 13,879.2 100.0 18,102.5 100.0 23,488.7 100.0
2009 2010 2011 1991 – 2011
'000
% of Total '000
% of Total '000
% of Total
Average Growth (%)
0 – 14 7,724.2 27.7 7,690.5 27.2 7,654.8 26.8 0.6
15 - 64 18,889.7 67.7 19,230.1 68.1 19,516.9 68.4 2.9 65 & above 1,281.5 4.6 1,329.8 4.7 1,381.0 4.8 3.6 TOTAL 27,895.3 100.0 28,250.5 100.0 28,552.7 100.0 2.2
Notes: Based on 1970, 1980, 1991 and 2000 Population Census Sources: Economic Planning Unit & Department of Statistics
2.3 Population by Ethnic Group
Unit 2008 2009 2010(p) 2011
(e)
Malaysian Citizens '000 25,071 25,424 25,777 26,130
Bumiputera '000 16,511 16,775 17,042 17,312 Malay '000 13,575 13,794 14,015 14,240 Other Bumiputera '000 2,936 2,981 3,027 3,072
Chinese '000 6,336 6,395 6,451 6,506 Indian '000 1,885 1,905 1,925 1,943 Others '000 340 349 359 368
Non-Malaysian Citizens '000 2,469 2,471 2,474 2,423
TOTAL '000 27,540 27,895 28,250 28,553
Notes: Based on the 2000 Population Census Sources: Economic Planning Unit & Department of Statistics
Unit 2008 2009 2010(p) 2011
(e)
2.4 Labour Force
Labour force '000 11,968 12,083 12,361 12,646
Labour Force Participation Rates: Total
(1) % 62.7 63.3 64.3 64.8
Male(2)
% 79.0 79.5 79.8 80.0 Female % 45.7 46.2 48.0 49.0 Unemployment % of labour force 3.3 3.7 3.4 3.3
2.5 Employment
Total '000 11,577 11,632 11,937 12,227 Agriculture % of total 12.0 12.0 11.6 11.4 Mining % of total 0.4 0.4 0.4 0.4 Manufacturing % of total 28.8 27.6 28.3 28.9 Construction % of total 6.6 6.6 6.5 6.3 Services % of total 52.2 53.5 53.3 53.1
Notes: (p)
Preliminary (e)
Estimate (1)
Total number of people economically active as a percentage of total number in the working age population of 15 to 64 years (2)
Total number of people economically active as a percentage of total number of males or females in the working age population Sources: Economic Planning Unit, Ministry of Finance & Department of Statistics
The Malaysian Economy in Figures 2011
P a g e | 4
3. GROSS DOMESTIC PRODUCT
3.1 Supply
2008 2009 2010 2011(e)
RM million
% growth
RM million
% growth
RM million
% growth
RM million
% growth
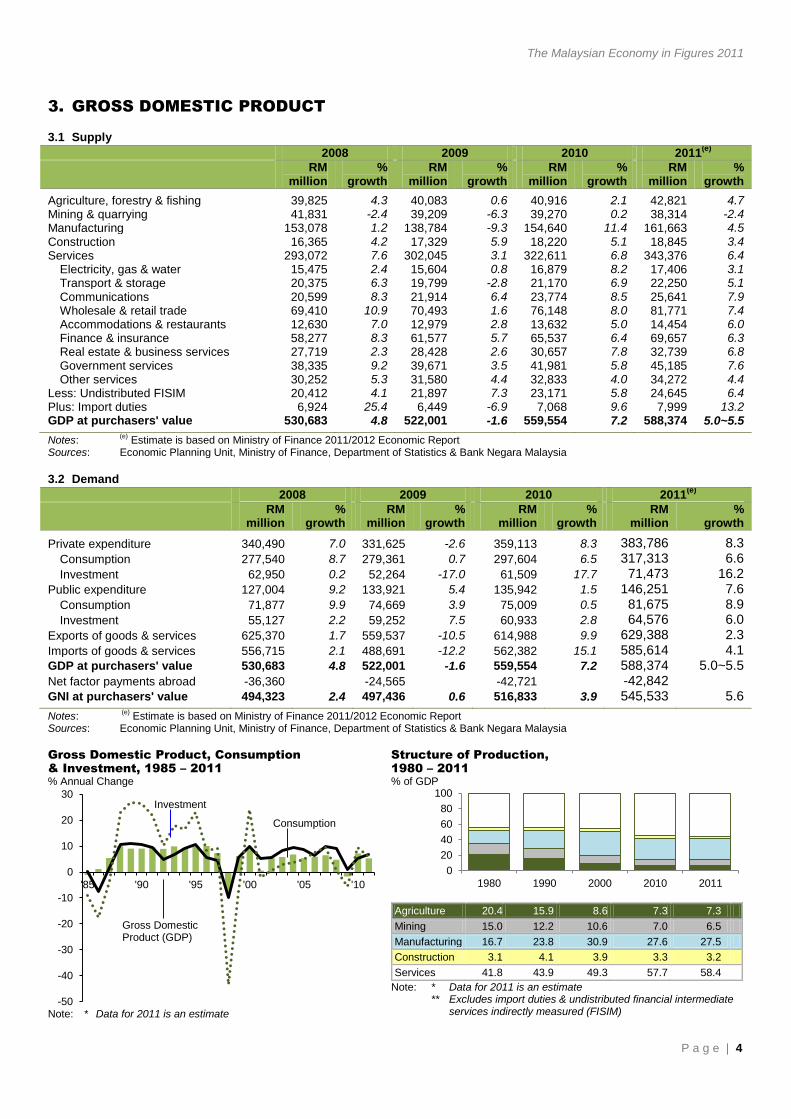
Agriculture, forestry & fishing 39,825 4.3 40,083 0.6 40,916 2.1 42,821 4.7 Mining & quarrying 41,831 -2.4 39,209 -6.3 39,270 0.2 38,314 -2.4 Manufacturing 153,078 1.2 138,784 -9.3 154,640 11.4 161,663 4.5
Construction 16,365 4.2 17,329 5.9 18,220 5.1 18,845 3.4 Services 293,072 7.6 302,045 3.1 322,611 6.8 343,376 6.4
Electricity, gas & water 15,475 2.4 15,604 0.8 16,879 8.2 17,406 3.1 Transport & storage 20,375 6.3 19,799 -2.8 21,170 6.9 22,250 5.1
Communications 20,599 8.3 21,914 6.4 23,774 8.5 25,641 7.9 Wholesale & retail trade 69,410 10.9 70,493 1.6 76,148 8.0 81,771 7.4 Accommodations & restaurants 12,630 7.0 12,979 2.8 13,632 5.0 14,454 6.0 Finance & insurance 58,277 8.3 61,577 5.7 65,537 6.4 69,657 6.3 Real estate & business services 27,719 2.3 28,428 2.6 30,657 7.8 32,739 6.8
Government services 38,335 9.2 39,671 3.5 41,981 5.8 45,185 7.6 Other services 30,252 5.3 31,580 4.4 32,833 4.0 34,272 4.4
Less: Undistributed FISIM 20,412 4.1 21,897 7.3 23,171 5.8 24,645 6.4 Plus: Import duties 6,924 25.4 6,449 -6.9 7,068 9.6 7,999 13.2 GDP at purchasers' value 530,683 4.8 522,001 -1.6 559,554 7.2 588,374 5.0~5.5
Notes: (e)
Estimate is based on Ministry of Finance 2011/2012 Economic Report Sources: Economic Planning Unit, Ministry of Finance, Department of Statistics & Bank Negara Malaysia
3.2 Demand
2008 2009 2010 2011(e)
RM million
% growth
RM million
% growth
RM million
% growth
RM million
% growth
Private expenditure 340,490 7.0 331,625 -2.6 359,113 8.3 383,786 8.3
Consumption 277,540 8.7 279,361 0.7 297,604 6.5 317,313 6.6
Investment 62,950 0.2 52,264 -17.0 61,509 17.7 71,473 16.2
Public expenditure 127,004 9.2 133,921 5.4 135,942 1.5 146,251 7.6
Consumption 71,877 9.9 74,669 3.9 75,009 0.5 81,675 8.9
Investment 55,127 2.2 59,252 7.5 60,933 2.8 64,576 6.0
Exports of goods & services 625,370 1.7 559,537 -10.5 614,988 9.9 629,388 2.3
Imports of goods & services 556,715 2.1 488,691 -12.2 562,382 15.1 585,614 4.1
GDP at purchasers' value 530,683 4.8 522,001 -1.6 559,554 7.2 588,374 5.0~5.5
Net factor payments abroad -36,360 -24,565
-42,721
-42,842
GNI at purchasers' value 494,323 2.4 497,436 0.6 516,833 3.9 545,533 5.6
Notes: (e)
Estimate is based on Ministry of Finance 2011/2012 Economic Report Sources: Economic Planning Unit, Ministry of Finance, Department of Statistics & Bank Negara Malaysia
Gross Domestic Product, Consumption
& Investment, 1985 – 2011
% Annual Change
Note: * Data for 2011 is an estimate
Structure of Production,
1980 – 2011
% of GDP
Agriculture 20.4 15.9 8.6 7.3 7.3
Mining 15.0 12.2 10.6 7.0 6.5
Manufacturing 16.7 23.8 30.9 27.6 27.5
Construction 3.1 4.1 3.9 3.3 3.2
Services 41.8 43.9 49.3 57.7 58.4
Note: * Data for 2011 is an estimate ** Excludes import duties & undistributed financial intermediate
services indirectly measured (FISIM) -50
-40
-30
-20
-10
0
10
20
30
'85 '90 '95 '00 '05 '10
0
20
40
60
80
100
1980 1990 2000 2010 2011
Gross Domestic Product (GDP)
Consumption
Investment
The Malaysian Economy in Figures 2011
P a g e | 5
3.3 Savings & Investment Gap
2008 2009 2010 2011(e)
RM million
% growth
RM million
% growth
RM million
% growth
RM million
% growth
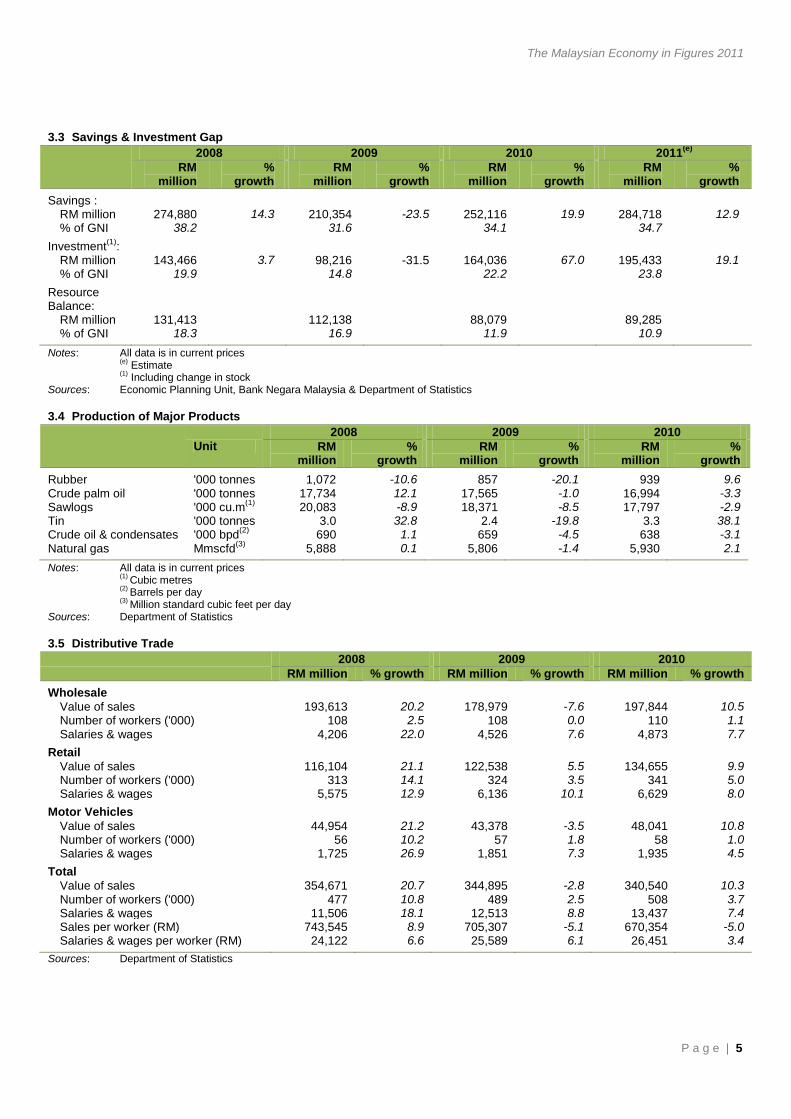
Savings : RM million 274,880 14.3 210,354 -23.5 252,116 19.9 284,718 12.9
% of GNI 38.2
31.6
34.1
34.7
Investment(1)
: RM million 143,466 3.7 98,216 -31.5 164,036 67.0 195,433 19.1
% of GNI 19.9
14.8
22.2
23.8
Resource Balance:
RM million 131,413
112,138
88,079
89,285 % of GNI 18.3
16.9
11.9
10.9
Notes: All data is in current prices
(e) Estimate
(1)
Including change in stock Sources: Economic Planning Unit, Bank Negara Malaysia & Department of Statistics 3.4 Production of Major Products
Unit
2008 2009 2010
RM million
% growth
RM million
% growth
RM million
% growth
Rubber '000 tonnes 1,072 -10.6 857 -20.1 939 9.6
Crude palm oil '000 tonnes 17,734 12.1 17,565 -1.0 16,994 -3.3 Sawlogs '000 cu.m
(1) 20,083 -8.9 18,371 -8.5 17,797 -2.9
Tin '000 tonnes 3.0 32.8 2.4 -19.8 3.3 38.1 Crude oil & condensates '000 bpd
(2) 690 1.1 659 -4.5 638 -3.1
Natural gas Mmscfd(3)
5,888 0.1 5,806 -1.4 5,930 2.1
Notes: All data is in current prices
(1) Cubic metres
(2)
Barrels per day
(3) Million standard cubic feet per day
Sources: Department of Statistics 3.5 Distributive Trade
2008 2009 2010
RM million % growth RM million % growth RM million % growth
Wholesale Value of sales 193,613 20.2 178,979 -7.6 197,844 10.5
Number of workers ('000) 108 2.5 108 0.0 110 1.1 Salaries & wages 4,206 22.0 4,526 7.6 4,873 7.7
Retail
Value of sales 116,104 21.1 122,538 5.5 134,655 9.9 Number of workers ('000) 313 14.1 324 3.5 341 5.0 Salaries & wages 5,575 12.9 6,136 10.1 6,629 8.0
Motor Vehicles Value of sales 44,954 21.2 43,378 -3.5 48,041 10.8
Number of workers ('000) 56 10.2 57 1.8 58 1.0 Salaries & wages 1,725 26.9 1,851 7.3 1,935 4.5
Total Value of sales 354,671 20.7 344,895 -2.8 340,540 10.3
Number of workers ('000) 477 10.8 489 2.5 508 3.7 Salaries & wages 11,506 18.1 12,513 8.8 13,437 7.4 Sales per worker (RM) 743,545 8.9 705,307 -5.1 670,354 -5.0 Salaries & wages per worker (RM) 24,122 6.6 25,589 6.1 26,451 3.4
Sources: Department of Statistics
The Malaysian Economy in Figures 2011
P a g e | 6
3.6 Manufacturing Production Index
Selected Industries 2008 2009 2010
Index %
growth Index %
growth Index %
growth
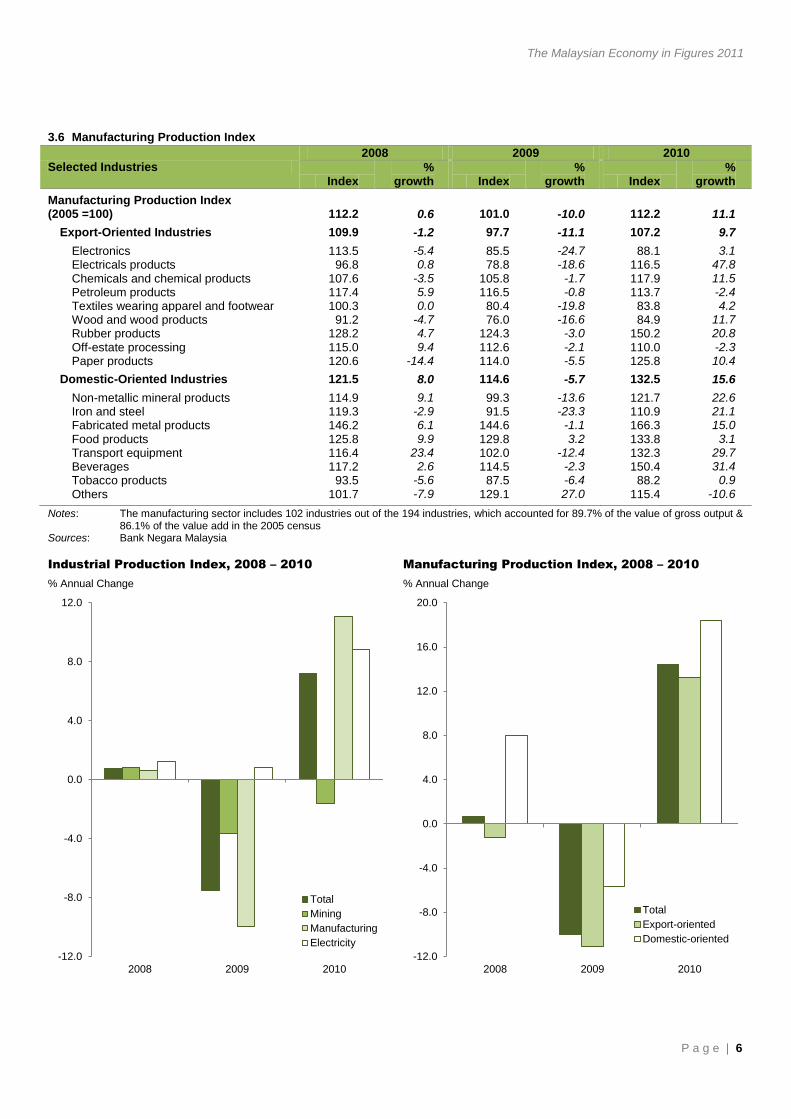
Manufacturing Production Index (2005 =100) 112.2 0.6 101.0 -10.0 112.2 11.1
Export-Oriented Industries 109.9 -1.2 97.7 -11.1 107.2 9.7
Electronics 113.5 -5.4 85.5 -24.7 88.1 3.1 Electricals products 96.8 0.8 78.8 -18.6 116.5 47.8
Chemicals and chemical products 107.6 -3.5 105.8 -1.7 117.9 11.5 Petroleum products 117.4 5.9 116.5 -0.8 113.7 -2.4 Textiles wearing apparel and footwear 100.3 0.0 80.4 -19.8 83.8 4.2 Wood and wood products 91.2 -4.7 76.0 -16.6 84.9 11.7 Rubber products 128.2 4.7 124.3 -3.0 150.2 20.8
Off-estate processing 115.0 9.4 112.6 -2.1 110.0 -2.3 Paper products 120.6 -14.4 114.0 -5.5 125.8 10.4
Domestic-Oriented Industries 121.5 8.0 114.6 -5.7 132.5 15.6
Non-metallic mineral products 114.9 9.1 99.3 -13.6 121.7 22.6 Iron and steel 119.3 -2.9 91.5 -23.3 110.9 21.1 Fabricated metal products 146.2 6.1 144.6 -1.1 166.3 15.0
Food products 125.8 9.9 129.8 3.2 133.8 3.1 Transport equipment 116.4 23.4 102.0 -12.4 132.3 29.7 Beverages 117.2 2.6 114.5 -2.3 150.4 31.4 Tobacco products 93.5 -5.6 87.5 -6.4 88.2 0.9
Others 101.7 -7.9 129.1 27.0 115.4 -10.6
Notes: The manufacturing sector includes 102 industries out of the 194 industries, which accounted for 89.7% of the value of gross output & 86.1% of the value add in the 2005 census
Sources: Bank Negara Malaysia Industrial Production Index, 2008 – 2010
% Annual Change
Manufacturing Production Index, 2008 – 2010
% Annual Change
-12.0
-8.0
-4.0
0.0
4.0
8.0
12.0
2008 2009 2010
Total
Mining
Manufacturing
Electricity
-12.0
-8.0
-4.0
0.0
4.0
8.0
12.0
16.0
20.0
2008 2009 2010
Total
Export-oriented
Domestic-oriented
The Malaysian Economy in Figures 2011
P a g e | 7
4. PUBLIC SECTOR ACCOUNTS
4.1 Federal Government Finance
Unit 2008 2009 2010 2011
(e)
4.1.1 Total revenue
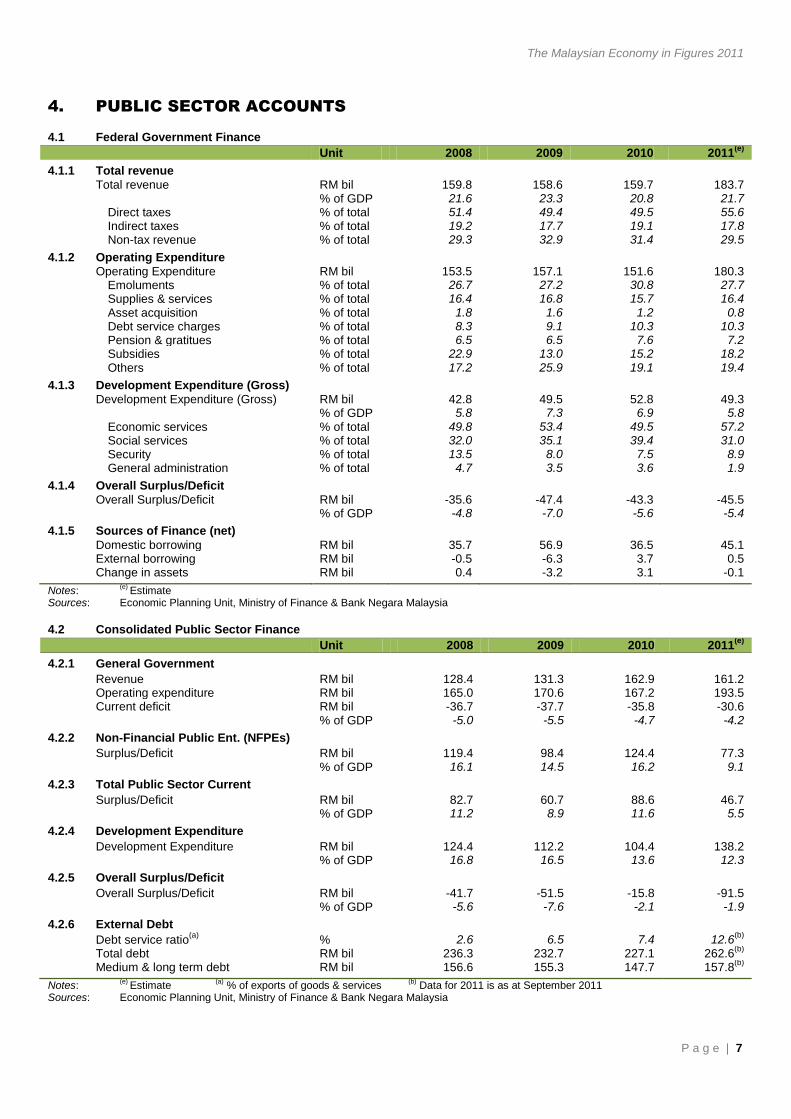
Total revenue RM bil 159.8 158.6 159.7 183.7
% of GDP 21.6 23.3 20.8 21.7
Direct taxes % of total 51.4 49.4 49.5 55.6 Indirect taxes % of total 19.2 17.7 19.1 17.8 Non-tax revenue % of total 29.3 32.9 31.4 29.5
4.1.2 Operating Expenditure
Operating Expenditure RM bil 153.5 157.1 151.6 180.3
Emoluments % of total 26.7 27.2 30.8 27.7 Supplies & services % of total 16.4 16.8 15.7 16.4
Asset acquisition % of total 1.8 1.6 1.2 0.8 Debt service charges % of total 8.3 9.1 10.3 10.3 Pension & gratitues % of total 6.5 6.5 7.6 7.2 Subsidies % of total 22.9 13.0 15.2 18.2
Others % of total 17.2 25.9 19.1 19.4
4.1.3 Development Expenditure (Gross)
Development Expenditure (Gross) RM bil 42.8 49.5 52.8 49.3
% of GDP 5.8 7.3 6.9 5.8
Economic services % of total 49.8 53.4 49.5 57.2 Social services % of total 32.0 35.1 39.4 31.0 Security % of total 13.5 8.0 7.5 8.9 General administration % of total 4.7 3.5 3.6 1.9
4.1.4 Overall Surplus/Deficit
Overall Surplus/Deficit RM bil -35.6 -47.4 -43.3 -45.5
% of GDP -4.8 -7.0 -5.6 -5.4
4.1.5 Sources of Finance (net)
Domestic borrowing RM bil 35.7 56.9 36.5 45.1 External borrowing RM bil -0.5 -6.3 3.7 0.5 Change in assets RM bil 0.4 -3.2 3.1 -0.1
Notes: (e)
Estimate Sources: Economic Planning Unit, Ministry of Finance & Bank Negara Malaysia
4.2 Consolidated Public Sector Finance
Unit 2008 2009 2010 2011
(e)
4.2.1 General Government
Revenue RM bil 128.4 131.3 162.9 161.2 Operating expenditure RM bil 165.0 170.6 167.2 193.5 Current deficit RM bil -36.7 -37.7 -35.8 -30.6
% of GDP -5.0 -5.5 -4.7 -4.2
4.2.2 Non-Financial Public Ent. (NFPEs)
Surplus/Deficit RM bil 119.4 98.4 124.4 77.3
% of GDP 16.1 14.5 16.2 9.1
4.2.3 Total Public Sector Current
Surplus/Deficit RM bil 82.7 60.7 88.6 46.7
% of GDP 11.2 8.9 11.6 5.5
4.2.4 Development Expenditure
Development Expenditure RM bil 124.4 112.2 104.4 138.2
% of GDP 16.8 16.5 13.6 12.3
4.2.5 Overall Surplus/Deficit
Overall Surplus/Deficit RM bil -41.7 -51.5 -15.8 -91.5
% of GDP -5.6 -7.6 -2.1 -1.9
4.2.6 External Debt
Debt service ratio(a)
% 2.6 6.5 7.4 12.6(b)
Total debt RM bil 236.3 232.7 227.1 262.6
(b)
Medium & long term debt RM bil 156.6 155.3 147.7 157.8(b)
Notes: (e)
Estimate (a)
% of exports of goods & services (b)
Data for 2011 is as at September 2011 Sources: Economic Planning Unit, Ministry of Finance & Bank Negara Malaysia
The Malaysian Economy in Figures 2011
P a g e | 8
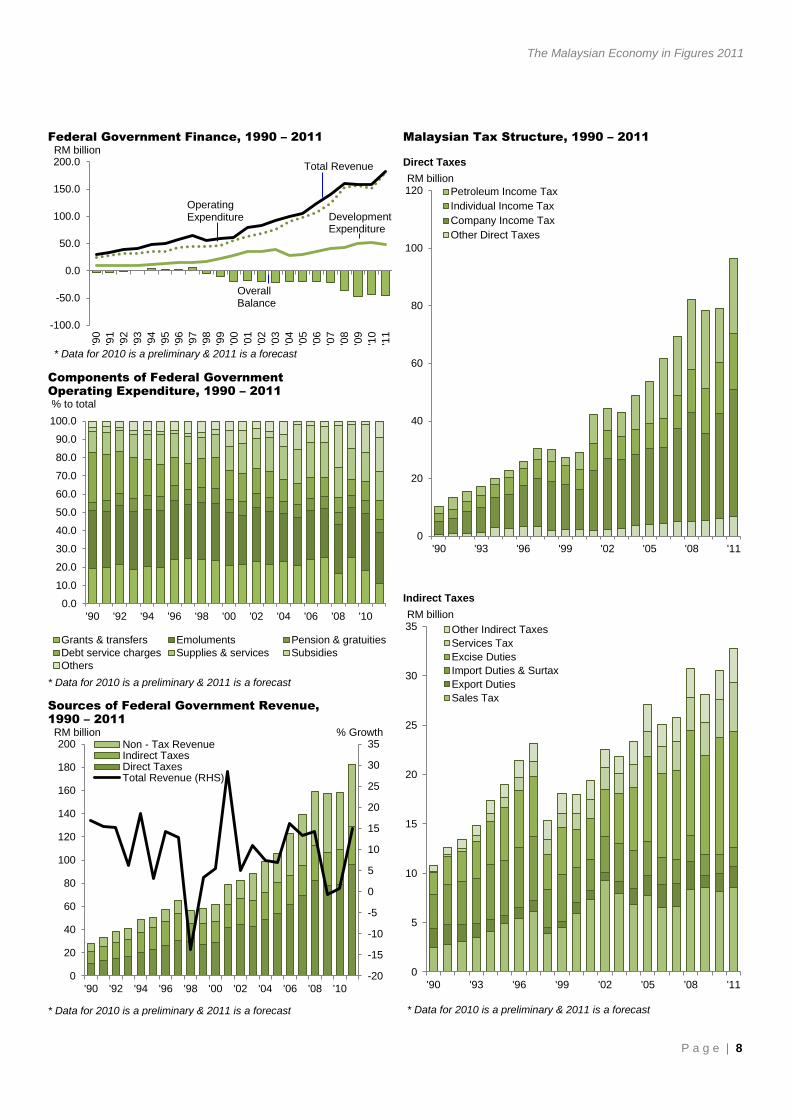
Federal Government Finance, 1990 – 2011
RM billion
* Data for 2010 is a preliminary & 2011 is a forecast
Malaysian Tax Structure, 1990 – 2011
Direct Taxes
RM billion
Indirect Taxes
RM billion
* Data for 2010 is a preliminary & 2011 is a forecast
Components of Federal Government
Operating Expenditure, 1990 – 2011 % to total
* Data for 2010 is a preliminary & 2011 is a forecast Sources of Federal Government Revenue,
1990 – 2011
RM billion % Growth
* Data for 2010 is a preliminary & 2011 is a forecast
-100.0
-50.0
0.0
50.0
100.0
150.0
200.0
'90
'91
'92
'93
'94
'95
'96
'97
'98
'99
'00
'01
'02
'03
'04
'05
'06
'07
'08
'09
'10
'11
0
20
40
60
80
100
120
'90 '93 '96 '99 '02 '05 '08 '11
Petroleum Income Tax
Individual Income Tax
Company Income Tax
Other Direct Taxes
0
5
10
15
20
25
30
35
'90 '93 '96 '99 '02 '05 '08 '11
Other Indirect Taxes
Services Tax
Excise Duties
Import Duties & Surtax
Export Duties
Sales Tax
0.0
10.0
20.0
30.0
40.0
50.0
60.0
70.0
80.0
90.0
100.0
'90 '92 '94 '96 '98 '00 '02 '04 '06 '08 '10
Grants & transfers Emoluments Pension & gratuities
Debt service charges Supplies & services Subsidies
Others
-20
-15
-10
-5
0
5
10
15
20
25
30
35
0
20
40
60
80
100
120
140
160
180
200
'90 '92 '94 '96 '98 '00 '02 '04 '06 '08 '10
Non - Tax RevenueIndirect TaxesDirect TaxesTotal Revenue (RHS)
Total Revenue
Development Expenditure
Overall Balance
Operating Expenditure
The Malaysian Economy in Figures 2011
P a g e | 15
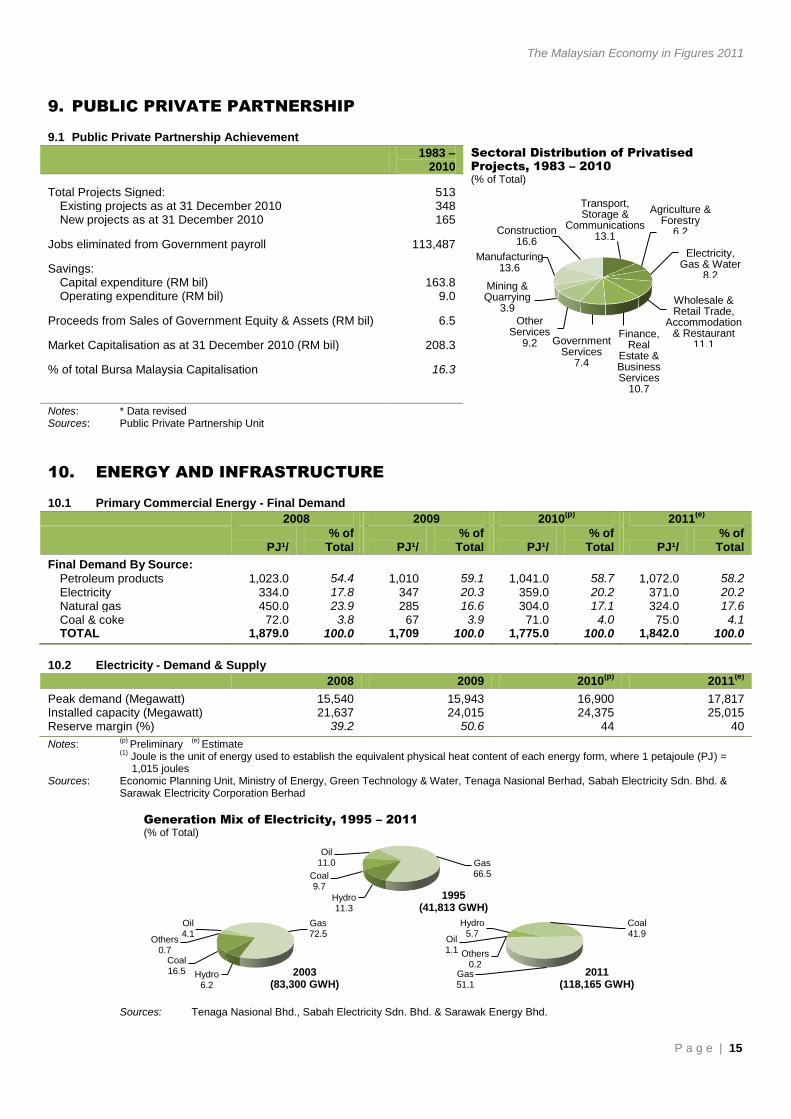
9. PUBLIC PRIVATE PARTNERSHIP
9.1 Public Private Partnership Achievement
1983 –
2010 Sectoral Distribution of Privatised
Projects, 1983 – 2010
(% of Total)
Total Projects Signed: 513 Existing projects as at 31 December 2010 348 New projects as at 31 December 2010 165
Jobs eliminated from Government payroll 113,487
Savings: Capital expenditure (RM bil) 163.8
Operating expenditure (RM bil) 9.0
Proceeds from Sales of Government Equity & Assets (RM bil) 6.5
Market Capitalisation as at 31 December 2010 (RM bil) 208.3
% of total Bursa Malaysia Capitalisation 16.3
Notes: * Data revised
Sources: Public Private Partnership Unit
10. ENERGY AND INFRASTRUCTURE
10.1 Primary Commercial Energy - Final Demand
2008 2009 2010
(p) 2011(e)
PJ¹/
% of Total PJ¹/
% of Total PJ¹/
% of Total PJ¹/
% of Total
Final Demand By Source: Petroleum products 1,023.0 54.4 1,010 59.1 1,041.0 58.7 1,072.0 58.2
Electricity 334.0 17.8 347 20.3 359.0 20.2 371.0 20.2 Natural gas 450.0 23.9 285 16.6 304.0 17.1 324.0 17.6 Coal & coke 72.0 3.8 67 3.9 71.0 4.0 75.0 4.1 TOTAL 1,879.0 100.0 1,709 100.0 1,775.0 100.0 1,842.0 100.0
10.2 Electricity - Demand & Supply
2008 2009 2010
(p) 2011(e)
Peak demand (Megawatt) 15,540 15,943 16,900 17,817 Installed capacity (Megawatt) 21,637 24,015 24,375 25,015 Reserve margin (%) 39.2 50.6 44 40
Notes: (p)
Preliminary (e)
Estimate
(1) Joule is the unit of energy used to establish the equivalent physical heat content of each energy form, where 1 petajoule (PJ) = 1,015 joules
Sources: Economic Planning Unit, Ministry of Energy, Green Technology & Water, Tenaga Nasional Berhad, Sabah Electricity Sdn. Bhd. & Sarawak Electricity Corporation Berhad
Generation Mix of Electricity, 1995 – 2011
(% of Total)
Sources: Tenaga Nasional Bhd., Sabah Electricity Sdn. Bhd. & Sarawak Energy Bhd.
Transport, Storage & Comunicat
ions 13.1
Agriculture & forestry
6.2
Electricity, Gas & Water
8.2
Wholesale & Retail Trade,
Accommodation &
Restaurant 11.1
Finance, Real
Estate & Bussiness Services
10.7
Government Services
7.4
Other Services
9.2
Mining & Quarrying
3.9
Manufacturing 13.6
Construction
16.6
Hydro 11.3
Coal 9.7
Oil 11.0 Gas
66.5
1995 (41,813 GWH)
Hydro 6.2
Coal 16.5
Others 0.7
Oil 4.1
Gas 72.5
2003 (83,300 GWH)
Others 0.2
Oil 1.1
Hydro 5.7
Coal 41.9
Gas 51.1
2011 (118,165 GWH)
Construction 16.6
Transport, Storage &
Communications 13.1
Agriculture & Forestry
6.2
Electricity, Gas & Water
8.2
Wholesale & Retail Trade,
Accommodation & Restaurant
11.1 Finance,
Real Estate & Business Services
10.7
Government Services
7.4
Other Services
9.2
Manufacturing 13.6
Mining & Quarrying
3.9

The Malaysian Economy in Figures 2011
P a g e | 16
Unit 2008 2009 2010 2011
(e)
10.3 Roads by Surface Type
Paved km 73,419 99,999 111,377 n.a. Unpaved km 18,593 24,653 25,842 n.a. TOTAL km 92,011 124,653 137,219 n.a.
10.4 Railway Statistics
Inter-city daily ridership '000s 10.2 11.7 11.6 10.8 KTM Komuter daily ridership '000s 100.1 95.0 96.0 97.0 Light Rail daily ridership '000s 347.2 345.3 360.9 383.0 Total freight traffic '000 tonnes 4,824 5,231 5,432 7,600 Container handling TEU's* 334,099 328,888 326,503 386,000
10.5 Air Traffic Statistics
No. of Passengers
Domestic million 27.5 29.1 31.1 33.2 International million 21.4 23.5 28.0 29.9 TOTAL (including transit) million 48.9 52.6 59.1 63.1
Cargo Handled
Domestic tonnes 160,770 144,735 172,496 181,983 International tonnes 776,116 664,888 754,918 796,438 TOTAL (including transit) tonnes 936,886 809,623 927,414 978,421
10.6 Port Statistics
Composition of Cargo Throughput
General cargo mil tonnes 19.9 36.3 39.8 41.8 Dry bulk cargo mil tonnes 23.6 32.7 35.9 37.7 Liquid bulk cargo mil tonnes 43.6 85.8 94.8 99.5 Containerized cargo mil tonnes/TEU's* 6.4* 231.2 254.1 266.8 TOTAL mil tonnes 87.1** 386.0 424.6 445.8
Notes: (e)
Estimate n.a. (not available) * Twenty-foot Equivalent units (million) ** Total exclude containerized cargo Sources: Economic Planning Unit, Department of Statistics, Ministry of Transport, Ministry of Works, Malaysian Communications & Multimedia
Commission & Malaysia Airports Holdings Berhad
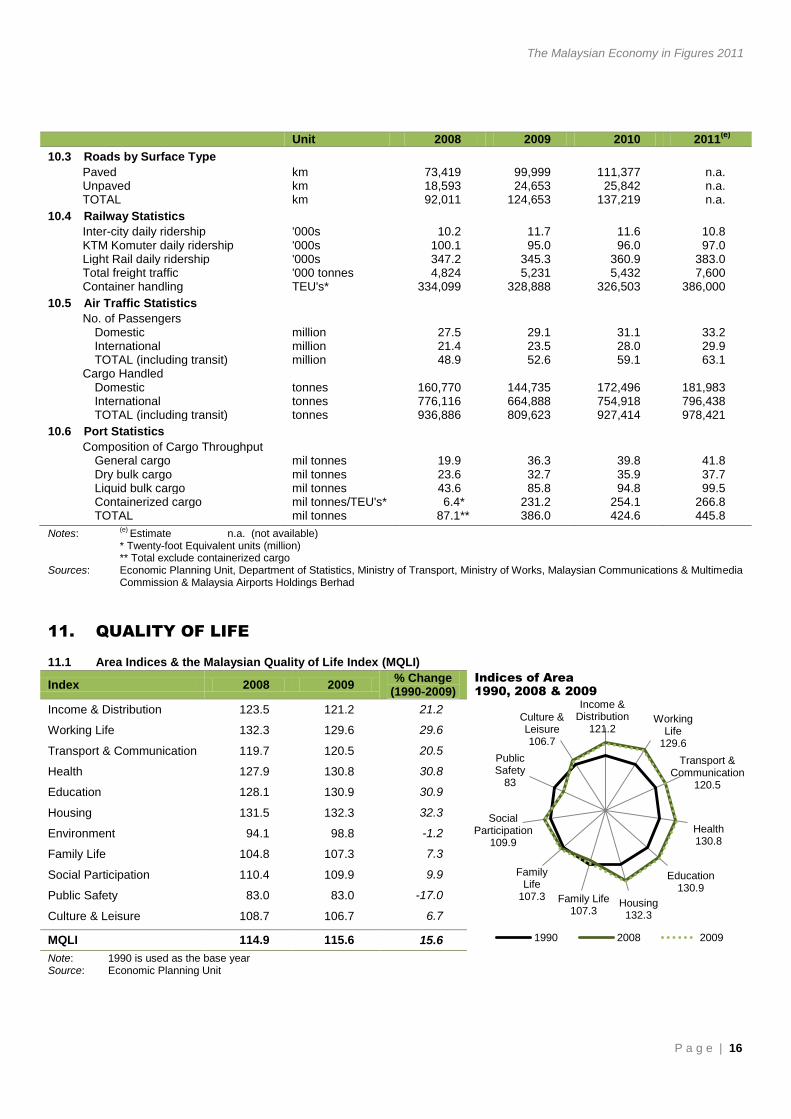
11. QUALITY OF LIFE
11.1 Area Indices & the Malaysian Quality of Life Index (MQLI)
Index 2008 2009 % Change
(1990-2009) Indices of Area
1990, 2008 & 2009
Income & Distribution 123.5 121.2 21.2
Working Life 132.3 129.6 29.6
Transport & Communication 119.7 120.5 20.5
Health 127.9 130.8 30.8
Education 128.1 130.9 30.9
Housing 131.5 132.3 32.3
Environment 94.1 98.8 -1.2
Family Life 104.8 107.3 7.3
Social Participation 110.4 109.9 9.9
Public Safety 83.0 83.0 -17.0
Culture & Leisure 108.7 106.7 6.7
MQLI 114.9 115.6 15.6
Note: 1990 is used as the base year Source: Economic Planning Unit
Working Life
129.6
Health 130.8
Housing 132.3
Family Life
107.3
Public Safety
83
Culture & Leisure 106.7
1990 2008 2009
Income & Distribution
121.2
Transport & Communication
120.5
Education 130.9
Family Life 107.3
Social Participation
109.9
The Malaysian Economy in Figures 2011
P a g e | 16
Unit 2008 2009 2010 2011
(e)
10.3 Roads by Surface Type
Paved km 73,419 99,999 111,377 n.a. Unpaved km 18,593 24,653 25,842 n.a. TOTAL km 92,011 124,653 137,219 n.a.
10.4 Railway Statistics
Inter-city daily ridership '000s 10.2 11.7 11.6 10.8 KTM Komuter daily ridership '000s 100.1 95.0 96.0 97.0 Light Rail daily ridership '000s 347.2 345.3 360.9 383.0 Total freight traffic '000 tonnes 4,824 5,231 5,432 7,600 Container handling TEU's* 334,099 328,888 326,503 386,000
10.5 Air Traffic Statistics
No. of Passengers
Domestic million 27.5 29.1 31.1 33.2 International million 21.4 23.5 28.0 29.9 TOTAL (including transit) million 48.9 52.6 59.1 63.1
Cargo Handled
Domestic tonnes 160,770 144,735 172,496 181,983 International tonnes 776,116 664,888 754,918 796,438 TOTAL (including transit) tonnes 936,886 809,623 927,414 978,421
10.6 Port Statistics
Composition of Cargo Throughput
General cargo mil tonnes 19.9 36.3 39.8 41.8 Dry bulk cargo mil tonnes 23.6 32.7 35.9 37.7 Liquid bulk cargo mil tonnes 43.6 85.8 94.8 99.5 Containerized cargo mil tonnes/TEU's* 6.4* 231.2 254.1 266.8 TOTAL mil tonnes 87.1** 386.0 424.6 445.8
Notes: (e)
Estimate n.a. (not available) * Twenty-foot Equivalent units (million) ** Total exclude containerized cargo Sources: Economic Planning Unit, Department of Statistics, Ministry of Transport, Ministry of Works, Malaysian Communications & Multimedia
Commission & Malaysia Airports Holdings Berhad
11. QUALITY OF LIFE
11.1 Area Indices & the Malaysian Quality of Life Index (MQLI)
Index 2008 2009 % Change
(1990-2009) Indices of Area
1990, 2008 & 2009
Income & Distribution 123.5 121.2 21.2
Working Life 132.3 129.6 29.6
Transport & Communication 119.7 120.5 20.5
Health 127.9 130.8 30.8
Education 128.1 130.9 30.9
Housing 131.5 132.3 32.3
Environment 94.1 98.8 -1.2
Family Life 104.8 107.3 7.3
Social Participation 110.4 109.9 9.9
Public Safety 83.0 83.0 -17.0
Culture & Leisure 108.7 106.7 6.7
MQLI 114.9 115.6 15.6
Note: 1990 is used as the base year Source: Economic Planning Unit
Working Life
129.6
Health 130.8
Housing 132.3
Family Life
107.3
Public Safety
83
Culture & Leisure 106.7
1990 2008 2009
Income & Distribution
121.2
Transport & Communication
120.5
Education 130.9
Family Life 107.3
Social Participation
109.9
The Malaysian Economy in Figures 2011
P a g e | 17
11.2 Selected Social Indicators
Indicators Unit 2008 2009 2010(p)
Trade disputes number 267 330 344
Working days lost number of days 273 1,139 181
Strike number 2 4 2
Number of workers involved in strike number 170 393 71
Industrial accidents number ('000) 63.2 61.2 60.4
Private motorcars & motorcycles number ('000) 1,080.2 955.5 1,083.3
Telephone fixed lines per 1,000 population 153 151 155
Cellular phones per 1,000 population 989 1,054 1,176
Broadband subscribers per 1,000 household 211 317 556
Total road mileage km 92,011 124,653 137,219
Total railway tracks km 2,266 2,266 2,603
Average daily newspaper circulation per 1,000 population 136.8 128.1 131.9(1)
Doctor-population ratio persons 1,105 927 857
Crude birth rate per 1,000 population 18.4 17.9(p)
18.8
Crude death rate per 1,000 population 4.7 4.8(p)
4.9
Infant mortality rate per 1,000 live births 6.2 7.0(p)
6.3
Maternal mortality rate per 100,000 live births 27.3 28.0(p)
n.a
Life expectancy at birth
Male years 71.6(p)
71.7(p)
71.7
female years 76.4(p)
76.5(p)
76.6
Beds in hospitals(2)
number 38,004 38,057 37,793
Literacy rate
15 years & above % 92.1 92.7 93.1
10 years & above % 92.9 93.3 93.7
Enrolment
primary school*/ % 94.0 94.3 94.2
lower secondary school % 86.3 86.5 86.8
upper secondary school % 77.7 77.3 77.2
tertiary**/ total ('000) 824.0 912.7 992.3
Pupil-teacher ratio
primary pupils 14.2 13.3 13.0
secondary pupils 13.9 13.7 13.4
Electricity coverage: rural housing units % of population 91.7 92.3 93.7
Water coverage: total population served % of population 90.9 91.6 92.4
Low-cost house & flat completed units number 16,760 10,553 12,407
Air quality % of stations with API < 51 76.0 72.0 81.0
Water quality(3)
% of clean rivers 53.1 53.0 n.a
Forested land % of total land 55.2 55.4 56.3
Marriages(4)
number 194,240 196,093 135,659
Divorces(4)
number 26,432 31,624 20,238
Average household size number 4.4 4.4 4.3
Membership in residents’ associations number 3,245 3,604 3,846
Crimes(5)
per 1,000 population 7.7 7.5 n.a
Road accidents (Fatality Index) per 10,000 vehicles 3.63 3.55 3.39
Notes: (p)
Preliminary n.a. not available */ Excluding pre-school enrolment in primary schools **/ Excluding pre-university (e.g. matriculation, pre-diploma & certificate) enrolment
(1) Data as at October 2010
(2)
Include government hospitals & special medical institutions (3)
Starting from 2009 data is upon rivers instead of river-basins previously
(4) Data for 2010 is excluding muslims in Selangor, Johor, Pahang, Sabah, Sarawak & Labuan Federal Territory
(5)
Does not portray overall crime in Malaysia as it’s only covered selected crime under crime index Sources: Economic Planning Unit, Department of Statistics, Ministry of Works, Ministry of Health, Ministry of Transport, Industrial Relations
Department, Malaysian Communications & Multimedia Commission & National Registration Department, Ministry of Education, Ministry of Higher Education, National Registration Department, Department of Islamic Development Malaysia, Royal Malaysian Police, Road Safety Department Malaysia, National Water Services Commission, Registrar of Society & Valuation and Property Services Department

The Malaysian Economy in Figures 2011
P a g e | 18
11.3 Poverty
Unit 1999 2002 2004 2007 2008 2009
Incidence of poverty:
overall % of households 8.5 6.0 5.7 3.6 3.8 3.8
rural % of households 14.8 13.5 11.9 7.1 7.7 8.4
urban % of households 3.3 2.3 2.5 2.0 2.0 1.7
Incidence of hardcore poverty:
overall % of households 1.9 1.0 1.2 0.7 0.8 0.7
rural % of households 3.6 2.6 2.9 1.4 1.8 1.8
urban % of households 0.5 0.3 0.4 0.3 0.3 0.2
Notes: Based on Household Income Survey which is done once in a 2 years
Sources: Economic Planning Unit 11.4 Female-Related Information
Unit 2006 2007 2008 2009 2010
Female population % 49.7 49.7 49.7 49.7 49.7
Female labour force % 35.6 36.0 35.7 36.2 36.1
Total female employed % 35.6 36.1 35.7 36.2 36.1
Female unemployed rate % 3.4 3.4 3.7 3.8 3.6
Female labour force participation % 45.8 46.4 45.7 46.4 48.0
Female primary schools enrolment % 48.6 48.6 48.6 48.5 48.5
Female secondary schools enrolment % 51.0 50.9 49.8 49.9 49.9
Female university enrolment % 61.4 61.7 61.7 54.6 55.2
Female members in Parliament(1)
% 14.2 13.4 13.5 14.0 14.4
Notes: (1)
Including the Senate Sources: Economic Planning Unit, Ministry of Education, Ministry of Higher Education and Parliament of Malaysia