Major ion chemistry, weathering processes and water quality assessment in upper catchment of Damodar...
14
ORIGINAL ARTICLE Major ion chemistry, weathering processes and water quality assessment in upper catchment of Damodar River basin, India Abhay Kumar Singh G. C. Mondal Suresh Kumar T. B. Singh B. K. Tewary A. Sinha Received: 21 July 2005 / Accepted: 25 May 2007 / Published online: 22 June 2007 ȑ Springer-Verlag 2007 Abstract The chemical characteristics of surface, groundwater and mine water of the upper catchment of the Damodar River basin were studied to evaluate the major ion chemistry, geochemical processes controlling water com- position and suitability of water for domestic, industrial and irrigation uses. Water samples from ponds, lakes, rivers, reservoirs and groundwater were collected and analysed for pH, EC, TDS, F, Cl, HCO 3 , SO 4 , NO 3, Ca, Mg, Na and K. In general, Ca, Na, Mg, HCO 3 and Cl dominate, except in samples from mining areas which have higher concentra- tion of SO 4 . Water chemistry of the area reflects continental weathering, aided by mining and other anthropogenic im- pacts. Limiting groundwater use for domestic purposes are contents of TDS, F, Cl, SO 4 , NO 3 and TH that exceed the desirable limits in water collected from mining and urban areas. The calculated values of SAR, RSC and %Na indi- cate good to permissible use of water for irrigation. High salinity, %Na, Mg-hazard and RSC values at some sites limit use for agricultural purposes. Keywords Major ion chemistry Damodar River basin Water quality SAR RSC Anthropogenic India Introduction Water is a natural resource to basic human need and a pre- cious national asset. India accounts for 2.2% of the global land and 4% of the world water resources, but must support 16% of the world population. Water bodies are continuously in natural dynamic state and are sometimes upset by human activities. More than half of India’s water resources are ei- ther polluted or under pollution threat. Rapid growth in population, haphazard industrialization and sprawl of urban centers coupled with lack of adequate resources in rural areas, have created critical situations for water resources. Quality is of equal importance to quantity in water resource evaluation and pollution threatens to reduce the quantity of usable waters. One of the oldest records of water pollution is direct dumping of human wastes into water bodies. Mining is also a major activity causing water pollution (Allen et al. 1996; Choubey 1991; Galero et al. 1998; Ratha and Venk- ataraman 1997). Damage to quality and quantity of surface and groundwater due to mining and dumping of overburden and spoils; sometimes on the surface water body itself, spreading of overburden through rolling and washing causes chemical pollution. The Damodar River, one of the most polluted rivers of India and flows through the country’s richest coal mining belt (Tiwary and Dhar 1994; Dey 1981, 1985; Dey et al. 1987). Industries, thermal power plants, mining machineries and vehicular sources are added point and non-point sources of pollution. Damodar River basin The Damodar River basin extends from 22Ŷ45¢N to 24Ŷ30¢N and 84Ŷ45¢E to 88Ŷ00¢E and circumscribes parts of Jharkhand and West Bengal. It is about 11.7 and 8.5% of the total area of these two states (Fig. 1). Damodar is a small rain-fed river (541 km long) flowing through the cities of Ramgarh, Bokaro, Dhanbad, Asansol, Durgapur, Bardwan and Hawrah, before joining the lower Ganga A. K. Singh (&) G. C. Mondal S. Kumar T. B. Singh B. K. Tewary A. Sinha Central Institute of Mining and Fuel Research, (Council of Scientific and Industrial Research), Barwa Road, Dhanbad 826 001, India e-mail: [email protected] 123 Environ Geol (2008) 54:745–758 DOI 10.1007/s00254-007-0860-1
-
Upload
independent -
Category
Documents
-
view
1 -
download
0
Transcript of Major ion chemistry, weathering processes and water quality assessment in upper catchment of Damodar...

ORIGINAL ARTICLE
Major ion chemistry, weathering processes and water qualityassessment in upper catchment of Damodar River basin, India
Abhay Kumar Singh Æ G. C. Mondal Æ Suresh Kumar ÆT. B. Singh Æ B. K. Tewary Æ A. Sinha
Received: 21 July 2005 / Accepted: 25 May 2007 / Published online: 22 June 2007
� Springer-Verlag 2007
Abstract The chemical characteristics of surface,
groundwater and mine water of the upper catchment of the
Damodar River basin were studied to evaluate the major ion
chemistry, geochemical processes controlling water com-
position and suitability of water for domestic, industrial and
irrigation uses. Water samples from ponds, lakes, rivers,
reservoirs and groundwater were collected and analysed for
pH, EC, TDS, F, Cl, HCO3, SO4, NO3, Ca, Mg, Na and K. In
general, Ca, Na, Mg, HCO3 and Cl dominate, except in
samples from mining areas which have higher concentra-
tion of SO4. Water chemistry of the area reflects continental
weathering, aided by mining and other anthropogenic im-
pacts. Limiting groundwater use for domestic purposes are
contents of TDS, F, Cl, SO4, NO3 and TH that exceed the
desirable limits in water collected from mining and urban
areas. The calculated values of SAR, RSC and %Na indi-
cate good to permissible use of water for irrigation. High
salinity, %Na, Mg-hazard and RSC values at some sites
limit use for agricultural purposes.
Keywords Major ion chemistry � Damodar River basin �Water quality � SAR � RSC � Anthropogenic � India
Introduction
Water is a natural resource to basic human need and a pre-
cious national asset. India accounts for 2.2% of the global
land and 4% of the world water resources, but must support
16% of the world population. Water bodies are continuously
in natural dynamic state and are sometimes upset by human
activities. More than half of India’s water resources are ei-
ther polluted or under pollution threat. Rapid growth in
population, haphazard industrialization and sprawl of urban
centers coupled with lack of adequate resources in rural
areas, have created critical situations for water resources.
Quality is of equal importance to quantity in water resource
evaluation and pollution threatens to reduce the quantity of
usable waters. One of the oldest records of water pollution is
direct dumping of human wastes into water bodies. Mining
is also a major activity causing water pollution (Allen et al.
1996; Choubey 1991; Galero et al. 1998; Ratha and Venk-
ataraman 1997). Damage to quality and quantity of surface
and groundwater due to mining and dumping of overburden
and spoils; sometimes on the surface water body itself,
spreading of overburden through rolling and washing causes
chemical pollution. The Damodar River, one of the most
polluted rivers of India and flows through the country’s
richest coal mining belt (Tiwary and Dhar 1994; Dey 1981,
1985; Dey et al. 1987). Industries, thermal power plants,
mining machineries and vehicular sources are added point
and non-point sources of pollution.
Damodar River basin
The Damodar River basin extends from 22�45¢N to
24�30¢N and 84�45¢E to 88�00¢E and circumscribes parts of
Jharkhand and West Bengal. It is about 11.7 and 8.5% of
the total area of these two states (Fig. 1). Damodar is a
small rain-fed river (541 km long) flowing through the
cities of Ramgarh, Bokaro, Dhanbad, Asansol, Durgapur,
Bardwan and Hawrah, before joining the lower Ganga
A. K. Singh (&) � G. C. Mondal � S. Kumar �T. B. Singh � B. K. Tewary � A. Sinha
Central Institute of Mining and Fuel Research,
(Council of Scientific and Industrial Research),
Barwa Road, Dhanbad 826 001, India
e-mail: [email protected]
123
Environ Geol (2008) 54:745–758
DOI 10.1007/s00254-007-0860-1
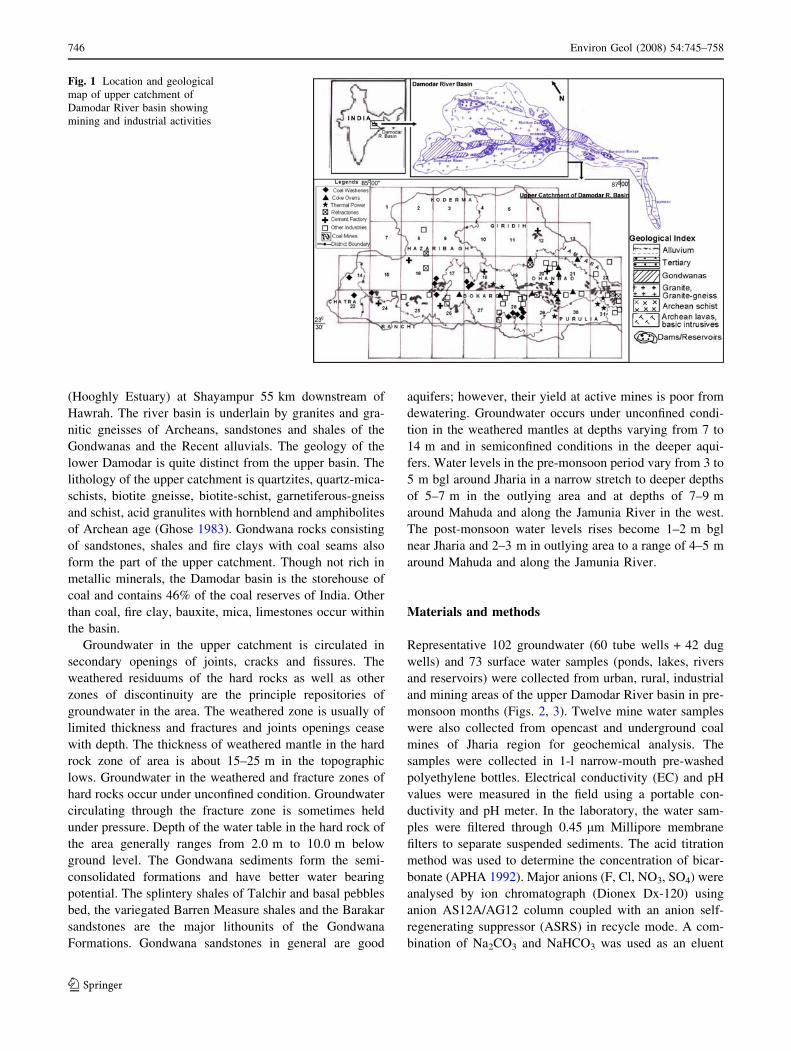
(Hooghly Estuary) at Shayampur 55 km downstream of
Hawrah. The river basin is underlain by granites and gra-
nitic gneisses of Archeans, sandstones and shales of the
Gondwanas and the Recent alluvials. The geology of the
lower Damodar is quite distinct from the upper basin. The
lithology of the upper catchment is quartzites, quartz-mica-
schists, biotite gneisse, biotite-schist, garnetiferous-gneiss
and schist, acid granulites with hornblend and amphibolites
of Archean age (Ghose 1983). Gondwana rocks consisting
of sandstones, shales and fire clays with coal seams also
form the part of the upper catchment. Though not rich in
metallic minerals, the Damodar basin is the storehouse of
coal and contains 46% of the coal reserves of India. Other
than coal, fire clay, bauxite, mica, limestones occur within
the basin.
Groundwater in the upper catchment is circulated in
secondary openings of joints, cracks and fissures. The
weathered residuums of the hard rocks as well as other
zones of discontinuity are the principle repositories of
groundwater in the area. The weathered zone is usually of
limited thickness and fractures and joints openings cease
with depth. The thickness of weathered mantle in the hard
rock zone of area is about 15–25 m in the topographic
lows. Groundwater in the weathered and fracture zones of
hard rocks occur under unconfined condition. Groundwater
circulating through the fracture zone is sometimes held
under pressure. Depth of the water table in the hard rock of
the area generally ranges from 2.0 m to 10.0 m below
ground level. The Gondwana sediments form the semi-
consolidated formations and have better water bearing
potential. The splintery shales of Talchir and basal pebbles
bed, the variegated Barren Measure shales and the Barakar
sandstones are the major lithounits of the Gondwana
Formations. Gondwana sandstones in general are good
aquifers; however, their yield at active mines is poor from
dewatering. Groundwater occurs under unconfined condi-
tion in the weathered mantles at depths varying from 7 to
14 m and in semiconfined conditions in the deeper aqui-
fers. Water levels in the pre-monsoon period vary from 3 to
5 m bgl around Jharia in a narrow stretch to deeper depths
of 5–7 m in the outlying area and at depths of 7–9 m
around Mahuda and along the Jamunia River in the west.
The post-monsoon water levels rises become 1–2 m bgl
near Jharia and 2–3 m in outlying area to a range of 4–5 m
around Mahuda and along the Jamunia River.
Materials and methods
Representative 102 groundwater (60 tube wells + 42 dug
wells) and 73 surface water samples (ponds, lakes, rivers
and reservoirs) were collected from urban, rural, industrial
and mining areas of the upper Damodar River basin in pre-
monsoon months (Figs. 2, 3). Twelve mine water samples
were also collected from opencast and underground coal
mines of Jharia region for geochemical analysis. The
samples were collected in 1-l narrow-mouth pre-washed
polyethylene bottles. Electrical conductivity (EC) and pH
values were measured in the field using a portable con-
ductivity and pH meter. In the laboratory, the water sam-
ples were filtered through 0.45 lm Millipore membrane
filters to separate suspended sediments. The acid titration
method was used to determine the concentration of bicar-
bonate (APHA 1992). Major anions (F, Cl, NO3, SO4) were
analysed by ion chromatograph (Dionex Dx-120) using
anion AS12A/AG12 column coupled with an anion self-
regenerating suppressor (ASRS) in recycle mode. A com-
bination of Na2CO3 and NaHCO3 was used as an eluent
Fig. 1 Location and geological
map of upper catchment of
Damodar River basin showing
mining and industrial activities
746 Environ Geol (2008) 54:745–758
123

maintained at flow rate of 1.15 ml min–1. Major cations
(Ca, Mg, Na, K) were also measured by ion chromatograph
by using cation column (CS12A/CS12G) and cation self-
regenerating suppressor (CSRS) in recycle mode. The
analytical precision was maintained by running a known
standard after every ten samples. An overall precision,
expressed as percent relative standard deviation (RSD),
was obtained for the entire samples. Analytical precision
for cations (Ca, Mg, Na, and K) and anions (F, Cl, NO3,
HCO3 and SO4) was within 10%. Cationic and anionic
charge balance (<10%) is an added proof of the precision
of the data.
Results and discussion
Major ion chemistry
Major ion chemistry of groundwater, surface water and
mine water are given in Table 1. The results of the phys-
ico-chemical analysis of groundwaters collected from
different locations of Hazaribagh, Koderma, Giridih, Bo-
karo and Dhanbad districts of upper Damodar River
catchment are summarized in Table 2. The salient features
of the major ion chemistry of the area are as follows:
Groundwater
• The pH of the analysed samples varies from 6.46 to
8.49 in tube wells and 6.69–8.87 in dug wells. In
general, pH of water samples was slightly acidic to
alkaline in nature and the mean value of pH of
groundwater of the area was 7.71.
• The EC values vary from 170 to 1,846 lS cm–1 for
tube well water and 218–1,918 lS cm–1 for dug wells.
The average conductivity value (892 lS cm–1) for dug
wells was slightly higher as compared to tube wells
(844 lS cm–1).
• Total dissolved solids (TDS), varied from 123 to
1,323 mg l–1 (avg. 639 mg l–1) in tube wells and
144–1,552 mg l–1 (avg. 741) in dug wells.
Fig. 2 Sampling location for
groundwater
Fig. 3 Sampling location for
surface water
Environ Geol (2008) 54:745–758 747
123
• Shallow aquifer (dug wells) water has higher concen-
tration of dissolved ions as compared to the deep tube
wells and surface water.
• Spatial distribution of TDS concentration in the
groundwater is illustrated in Fig. 4. Higher concentra-
tion of TDS was observed in the samples collected from
active mining and industrial sites especially from the
south of Dhanbad, Chas-Bokaro, Nirsa, Koderma and
Giridih sites.
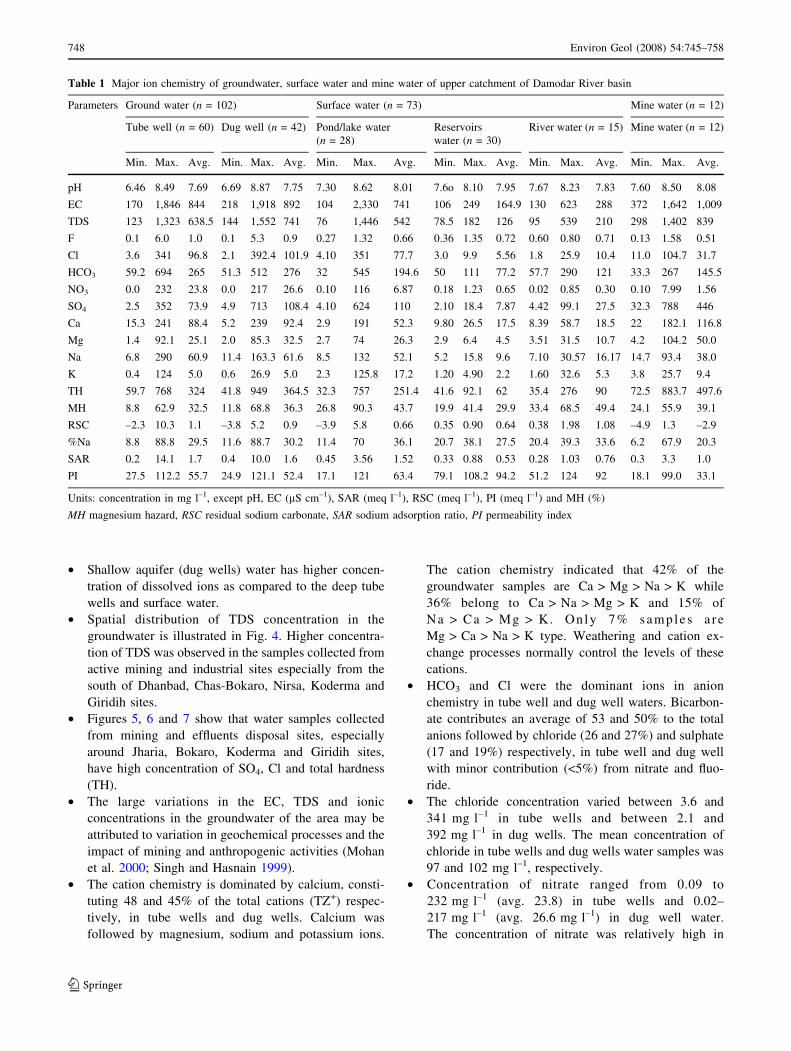
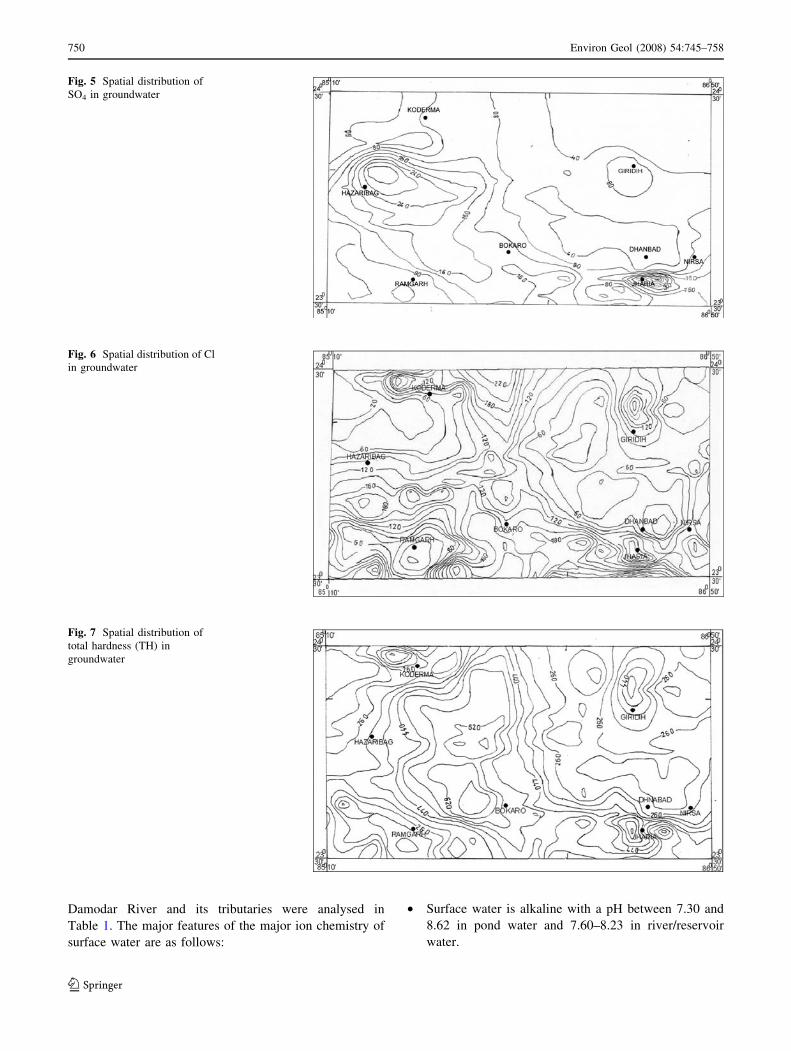
• Figures 5, 6 and 7 show that water samples collected
from mining and effluents disposal sites, especially
around Jharia, Bokaro, Koderma and Giridih sites,
have high concentration of SO4, Cl and total hardness
(TH).
• The large variations in the EC, TDS and ionic
concentrations in the groundwater of the area may be
attributed to variation in geochemical processes and the
impact of mining and anthropogenic activities (Mohan
et al. 2000; Singh and Hasnain 1999).
• The cation chemistry is dominated by calcium, consti-
tuting 48 and 45% of the total cations (TZ+) respec-
tively, in tube wells and dug wells. Calcium was
followed by magnesium, sodium and potassium ions.
The cation chemistry indicated that 42% of the
groundwater samples are Ca > Mg > Na > K while
36% belong to Ca > Na > Mg > K and 15% of
Na > Ca > Mg > K. Only 7% s amp le s a re
Mg > Ca > Na > K type. Weathering and cation ex-
change processes normally control the levels of these
cations.
• HCO3 and Cl were the dominant ions in anion
chemistry in tube well and dug well waters. Bicarbon-
ate contributes an average of 53 and 50% to the total
anions followed by chloride (26 and 27%) and sulphate
(17 and 19%) respectively, in tube well and dug well
with minor contribution (<5%) from nitrate and fluo-
ride.
• The chloride concentration varied between 3.6 and
341 mg l–1 in tube wells and between 2.1 and
392 mg l–1 in dug wells. The mean concentration of
chloride in tube wells and dug wells water samples was
97 and 102 mg l–1, respectively.
• Concentration of nitrate ranged from 0.09 to
232 mg l–1 (avg. 23.8) in tube wells and 0.02–
217 mg l–1 (avg. 26.6 mg l–1) in dug well water.
The concentration of nitrate was relatively high in
Table 1 Major ion chemistry of groundwater, surface water and mine water of upper catchment of Damodar River basin
Parameters Ground water (n = 102) Surface water (n = 73) Mine water (n = 12)
Tube well (n = 60) Dug well (n = 42) Pond/lake water
(n = 28)
Reservoirs
water (n = 30)
River water (n = 15) Mine water (n = 12)
Min. Max. Avg. Min. Max. Avg. Min. Max. Avg. Min. Max. Avg. Min. Max. Avg. Min. Max. Avg.
pH 6.46 8.49 7.69 6.69 8.87 7.75 7.30 8.62 8.01 7.6o 8.10 7.95 7.67 8.23 7.83 7.60 8.50 8.08
EC 170 1,846 844 218 1,918 892 104 2,330 741 106 249 164.9 130 623 288 372 1,642 1,009
TDS 123 1,323 638.5 144 1,552 741 76 1,446 542 78.5 182 126 95 539 210 298 1,402 839
F 0.1 6.0 1.0 0.1 5.3 0.9 0.27 1.32 0.66 0.36 1.35 0.72 0.60 0.80 0.71 0.13 1.58 0.51
Cl 3.6 341 96.8 2.1 392.4 101.9 4.10 351 77.7 3.0 9.9 5.56 1.8 25.9 10.4 11.0 104.7 31.7
HCO3 59.2 694 265 51.3 512 276 32 545 194.6 50 111 77.2 57.7 290 121 33.3 267 145.5
NO3 0.0 232 23.8 0.0 217 26.6 0.10 116 6.87 0.18 1.23 0.65 0.02 0.85 0.30 0.10 7.99 1.56
SO4 2.5 352 73.9 4.9 713 108.4 4.10 624 110 2.10 18.4 7.87 4.42 99.1 27.5 32.3 788 446
Ca 15.3 241 88.4 5.2 239 92.4 2.9 191 52.3 9.80 26.5 17.5 8.39 58.7 18.5 22 182.1 116.8
Mg 1.4 92.1 25.1 2.0 85.3 32.5 2.7 74 26.3 2.9 6.4 4.5 3.51 31.5 10.7 4.2 104.2 50.0
Na 6.8 290 60.9 11.4 163.3 61.6 8.5 132 52.1 5.2 15.8 9.6 7.10 30.57 16.17 14.7 93.4 38.0
K 0.4 124 5.0 0.6 26.9 5.0 2.3 125.8 17.2 1.20 4.90 2.2 1.60 32.6 5.3 3.8 25.7 9.4
TH 59.7 768 324 41.8 949 364.5 32.3 757 251.4 41.6 92.1 62 35.4 276 90 72.5 883.7 497.6
MH 8.8 62.9 32.5 11.8 68.8 36.3 26.8 90.3 43.7 19.9 41.4 29.9 33.4 68.5 49.4 24.1 55.9 39.1
RSC –2.3 10.3 1.1 –3.8 5.2 0.9 –3.9 5.8 0.66 0.35 0.90 0.64 0.38 1.98 1.08 –4.9 1.3 –2.9
%Na 8.8 88.8 29.5 11.6 88.7 30.2 11.4 70 36.1 20.7 38.1 27.5 20.4 39.3 33.6 6.2 67.9 20.3
SAR 0.2 14.1 1.7 0.4 10.0 1.6 0.45 3.56 1.52 0.33 0.88 0.53 0.28 1.03 0.76 0.3 3.3 1.0
PI 27.5 112.2 55.7 24.9 121.1 52.4 17.1 121 63.4 79.1 108.2 94.2 51.2 124 92 18.1 99.0 33.1
Units: concentration in mg l–1, except pH, EC (lS cm–1), SAR (meq l–1), RSC (meq l–1), PI (meq l–1) and MH (%)
MH magnesium hazard, RSC residual sodium carbonate, SAR sodium adsorption ratio, PI permeability index
748 Environ Geol (2008) 54:745–758
123

some dug well and tube well water samples. However,
in majority of the samples, nitrate was below the
threshold value of WHO (1997) and BIS (1991).
• Concentration of fluoride was low in major part of the
river basin, except in some samples where it exceeded
1.5 mg l–1 limit. Concentration of fluoride was high in
the water from Koderma and some wells of north-
eastern part of Giridih districts (Fig. 8). Low concen-
tration of fluoride in the major part of the study area
indicated limited lithogenic input of this ion.
Surface water
For physico-chemical characterization of surface water, 28
samples from ponds/lakes, 30 from Tilaiya, Konar,
Tenughat, Panchet and Mainthon reservoirs and 15 from
Table 2 Geochemical characteristics of groundwater collected from different districts in the upper Damodar River basin
Parameters Ground water (n = 102)
Hazaribagh (n = 24) Koderma (n = 14) Giridih (n = 14) Bokaro (n = 19) Dhanbad (n = 31)
Min. Max. Avg. Min. Max. Avg. Min. Max. Avg. Min. Max. Avg. Min. Max. Avg.
pH 6.76 8.49 7.65 6.8 8.48 7.77 6.46 8.87 7.70 6.86 8.43 7.50 6.52 8.42 7.87
EC 170 1,691 622 217 1,918 923 224 1,415 807 405 1,841 1,064 364 1,600 926
TDS 122 1,170 470 196 1,552 725 206 1,110 633 313.6 1,488 834.4 282 1,412 712
F 0.09 2.61 0.74 0.25 6.0 2.6 0.43 3.16 1.00 0.2 2.3 0.8 0.17 2.8 0.6
Cl 2.0 321 68 4.5 392 125 5.1 237 96.5 4.5 341 145 9.7 206 83.9
HCO3 51 416 193 115 512 304 122.4 371 242.6 163.2 694 358 102 675 269
NO3 0.1 30.6 6.5 1.4 158 54.3 0.7 232 69.8 0.1 217.2 32.9 0.0 55.0 13.6
SO4 4.9 425 55 6.8 115 45.6 2.5 177 71.6 19 223 80.6 10.6 713 150.4
Ca 5.2 165 59 24.4 239 84 20.9 163.5 85.1 52.5 241 126 15.3 197 97.8
Mg 3.2 65 20 1.4 92 28.4 6.1 51.9 25.0 10.5 55.6 33.5 10.1 79 31.3
Na 6.8 149 41 26 179 86.3 16.8 245 74.7 16.8 155.2 66.6 17.8 290 60.9
K 0.7 124 9.74 0.7 11.8 3.6 0.9 5.5 2.5 1.3 5.6 2.8 0.40 26.9 4.3
TH 42 622 229 67 948 328 81 615 320 175 768 452 80 817 373
MH 15.0 68.8 36.7 8.8 54.9 30.9 20.8 42.0 32.9 13.0 50.2 30.9 10.5 52 35.1
RSC –2.4 5.2 0.9 –1.5 4.8 1.7 –2.0 2.7 1.1 –1.4 3.7 1.2 –3.8 10.2 0.7
%Na 8.8 88.7 30.7 15.4 72.4 40.9 15.5 68.5 31.6 12.7 34.4 23.5 12.6 88.8 27.1
SAR 0.2 10.0 1.4 0.7 6.4 2.4 0.7 6.8 1.7 0.4 2.6 1.3 0.5 14.1 1.6
PI 26.5 121 60.7 27.3 105 67.9 33.3 91.4 59.8 35.3 57.1 45.7 24.9 112.2 48.9
Units: concentration in mg l–1, except pH, EC (lS cm–1), SAR (meq l–1), RSC (meq l–1), PI (meq l–1) and MH (%)
MH magnesium hazard, RSC residual sodium carbonate, SAR sodium adsorption ratio, PI permeability index
Fig. 4 Spatial distribution of
total dissolved solids (TDS) in
groundwater
Environ Geol (2008) 54:745–758 749
123
Damodar River and its tributaries were analysed in
Table 1. The major features of the major ion chemistry of
surface water are as follows:
• Surface water is alkaline with a pH between 7.30 and
8.62 in pond water and 7.60–8.23 in river/reservoir
water.
Fig. 5 Spatial distribution of
SO4 in groundwater
Fig. 6 Spatial distribution of Cl
in groundwater
Fig. 7 Spatial distribution of
total hardness (TH) in
groundwater
750 Environ Geol (2008) 54:745–758
123

• EC, TDS and ionic concentration of dissolved species
are relatively higher in ponds/lake water as compared to
the river and reservoir water.
• Calcium was the dominant cation, contributing 37 and
45%, respectively, in water from ponds/lakes and river/
reservoir. The relative contribution of sodium was
higher in pond water (30%) as compared to river/
reservoir water (26%). Potassium was the least dom-
inant cation (4 and 5%) in water of ponds and river/
reservoirs.
• Anion chemistry was dominated by HCO3 constituting
47 and 75% of the total anions, respectively, in ponds/
lake and river/reservoir. SO4 was the dominant anion in
the pond water samples collected near the mining and
industrial sites and its concentration varied between 2.1
and 624 mg l–1. SO4 constitutes 24 and 13% of the total
anions in the ponds and river/reservoirs. Contribution
of chloride in anionic budget is high (28%) in ponds/
lakes as compared to the river/reservoirs (10%).
• Concentration of NO3 and F was low in the analysed
surface water of the area, except in some of the ponds.
Mine water
• pH of the mine water of the area was alkaline in nature
(7.60–8.50) and conductivity varied between 372 and
1 ,6 4 2 lS cm – 1 . T he ave rage c onduc t i v i t y
(1,009 lS cm–1) and TDS (839 mg l–1) values for mine
water are higher as compared to the groundwater
(864 lS cm–1 and 669 mg l–1) and surface water
(411 lS cm–1 and 303 mg l–1).
• SO4 was the most dominant ion in the mine water,
constituting 30% of the TDS and contributing 69% to
total anionic balance in equivalent unit.
• Contribution of HCO3 and Cl to the total anionic
balance (TZ–) was low as compared to the ground and
surface water, indicating different geochemical pro-
cesses controlling the water composition.
• Calcium and magnesium are the dominant cations in the
mine water contributing 48 and 32% of the total cations
(TZ+) followed by sodium (18%) and potassium (2%).
Weathering and solute acquisition processes
The major ion chemistry of the aquatic system was mainly
controlled by weathering of rock forming minerals with
minor contribution from atmospheric and anthropogenic
sources (Berner and Berner 1987; Sarin et al. 1989; Singh
and Hasnain 2002). The dissolution of CO2 and oxidation
of sulphides are the two major reactions providing the bulk
of the protons used to chemically weather carbonates, sil-
icates and aluminosilicate minerals. The dissolution of
carbonate rocks proceeds more rapidly than silicate
breakdown and was the likely mechanism of solute
acquisition in aquatic systems. However, the solution
products of silicate weathering are difficult to quantify
because the degradation of silicates incongruently gener-
ates a variety of solid phases (mostly clays) along with
dissolved species. The relative proportions of the various
ions in solution depend on their relative abundance in the
host rock as well as on their solubility (Sarin et al. 1989).
The abundance of various ions can be modeled in terms
of weathering of various rock forming minerals (Sarin et al.
1989; Singh and Hasnain 1998; Pandey et al. 1999). The
proportion of HCO3 and SO4 in the water reflects the rel-
ative dominance of the two major sources of protons, i.e.,
carbonation and sulphide oxidation, during chemical
weathering. The ternary anion diagram relating HCO3, SO4
and Cl shows that most of the samples of groundwater and
surface water contain a high amount of HCO3 and plotted
points cluster towards the alkalinity apex with secondary
Fig. 8 Spatial distribution of
fluoride in groundwater
Environ Geol (2008) 54:745–758 751
123

trends towards Cl and SO4 (Fig. 9a). The relative high ratio
of HCO3/(HCO3 + SO4) in most of the surface and sub-
surface water (>0.5) signified that carbonic acid weathering
was the major proton producer in these waters (Pandey
et al. 2001). The bicarbonates are derived mainly from the
soil zone CO2 and weathering of parent minerals. The soil
zone in the subsurface contains elevated CO2 pressure
(produced by decay of organic matter and root respiration),
which in turn combines with rainwater to form bicarbonate
(Drever 1988).
CO2 þ H2O ¼ H2CO3
H2CO3 ¼ Hþ þ HCO3:
Bicarbonate may also be derived from the dissolution of
carbonates and/or silicate minerals by the carbonic acid:
The plotted points in the ternary anion diagram for mine
water and surface and subsurface water collected near the
mining sites cluster towards the SO4 apex with minor
contribution from HCO3 and Cl (Fig. 9a). The low ratio of
HCO3/(HCO3 + SO4) for mine water (0.22) and water
collected near coal mining areas (<0.5) suggests that either
sulphide oxidation and/or coupled reactions (involving
carbonic acid weathering and sulphide oxidation) control
the solute acquisition process in the affected mining areas.
On a global basis, one third of the SO4 in aquatic systems is
derived from rock weathering and about 60% from fossil
fuel burning with minor amounts from volcanism (5%) and
cycling salts (2%). Rock weathering sources typically
contribute two major forms of sulphur in sedimentary
rocks, pyrite—FeS2 and gypsum—CaSO4 (Berner and
Berner 1987). Pyrite (FeS2) occurs as a secondary mineral
in the Gondwana coals and associated sediments. The ob-
served high values of sulphate in waters of the affected
mining area may be attributed to the oxidative weathering
of pyrites by reaction sequence (Lowson et al. 1993):
2FeS2 þ 7O2 þ 2H2O ¼ 2Feþ2 þ 4SO2�4 þ 4Hþ
4Fe2þ þ O2 þ 4Hþ ¼ 4Fe3þ þ 2H2O
FeS2 þ 14Fe3þ þ 8H2O ¼ 15Fe2þ þ 2SO2�4 þ 16Hþ:
High concentration of sulphate in ground and mine
water from the mining belt of Jharia and other coal mining
regions of India are also reported by other workers
(Choubey 1991; Tiwary 2001).
The bulk of the chloride in water is assumed to be
either from atmospheric sources or from sea water.
Abnormal concentrations of chloride may also result from
pollution by sewage wastes and leaching of saline resi-
dues in the soil (Appelo and Postma 1993). A rough
estimate of the atmospheric contribution of Cl to the
aquatic system can be assessed by comparing the chem-
ical composition with the local rainwater chemistry
(Pandey et al. 1994; Sarin et al. 1989). The low con-
centration of Cl in the rainwater of the study area indi-
cates limited atmospheric contribution (Singh et al. 2005,
2007). Further the large lateral variations and high con-
centrations of chloride in some surface and groundwater
may be attributed to the local recharge and contamination
by anthropogenic sources such as domestic waste efflu-
ents and untreated industrial discharge.
There are three major sources of nitrogen in the
water—biological fixation, precipitation, and the applica-
tion of fertilizers (Berner and Berner 1987). Human
activities have also influenced the nitrogen load consid-
erably. Anthropogenic sources of nitrogen include (1)
point source including industrial sewage, refuse dumps
etc, discharged directly into the surface water, (2) diffuse
source including runoff and leaching from rural and urban
land and (3) precipitation (Kumar and Anderson 1993).
The concentration of nitrate was relatively high in some
dug well and surface water samples attributed to the
anthropogenic sources. The fluoride was usually derived
from the weathering of fluoride bearing rock forming
minerals like muscovite, biotite, fluorite, fluoro-apatite,
etc. Koderma district is rich in mineral deposits and was
famous for its mica production worldwide. The Great
Mica-Belt of Jharkhand and Bihar extends for a distance
of 160 km with an average width of 25 km passing
through this and adjoining districts of Hazaribagh and
Giridih. The observed high values of fluoride around
Koderma may be attributed to the weathering product of
the fluorite bearing minerals associated with the rock
formation of the area.
The cation diagram (Fig. 9b) relating Ca, Mg and
(Na + K) shows that although in the majority of samples
(Ca + Mg) exceeds (Na + K); however in some samples
CaCO3Limestone
þH2CO3 ¼ Caþ 2HCO3
CaMgðCO3Þ2Dolomite
þ2H2CO3 ¼ CaþMgþ 4HCO3
2NaAlSi3O8Albite
þ2H2CO3 þ 9H2O ¼ Al2Si2O5ðOHÞ4Kaolinite
þ2Naþ 4H4SiO4 þ 2HCO3:
752 Environ Geol (2008) 54:745–758
123

contribution of alkalies (Na + K) exceeds alkaline earths
(Ca + Mg). Further, the observed low ratio of (Ca + Mg)/
(Na + K) i.e., 4.12 and relatively high contribution of
alkalies (30%) towards the total cations suggest that cou-
pled reactions involving carbonate and silicate weathering,
control the solute acquisition process. High concentration
of Ca and Mg is attributed to the weathering of crystalline
dolomitic limestones and Ca–Mg silicates (amphiboles,
pyroxenes, olivine, biotite). The dolomitic limestones
usually occur as isolated bands and lenticles of varying
dimensions in the study area, while the basic rocks occur as
Archean lavas and are intrusive at some places (Ghosh
1983). The sodium and potassium in the aquatic system is
derived from the atmospheric deposition, evaporite disso-
lution and silicate weathering. The weathering of Na and K
silicate minerals like albite, anorthite, orthoclase and
microcline are the major possible sources of Na and K. In
addition, dissolution of Na/K salts developed in the
drainage basin due to cycling wetting and drying phases
during high and low flow regimes of Damodar River may
also contribute sodium and potassium (Sarin et al. 1989;
Singh et al. 2005). The high concentration of K in some
groundwater and pond water may be attributed to anthro-
pogenic activities.
Saturation indices and dissolution/precipitation
of carbonates
The potential for a chemical reaction can be determined by
calculating the chemical equilibrium of the water with the
mineral phase. The equilibrium state of the water with
respect to a mineral phase can be determined by calculating
a saturation index (SI) using analytical data (Garrels and
Mackenzie 1971; Stumm and Morgan 1981). The SI is
defined as the logarithm of the ratio of ion activity product
(IAP) to the mineral equilibrium constant at a given tem-
perature and given as:
SI ¼ log10ðIAP=KspÞ IAP ¼ ion activity product
Ksp ¼ solubility product at given temperature.
A positive SI specifies that the water being supersat-
urated with respect to the particular mineral phase and
therefore incapable of dissolving more of the mineral and
under suitable physico-chemical condition, the mineral
phase in equilibrium may precipitate. A negative index
(SI) indicates undersaturation condition and dissolution of
mineral phase, while neutral SI is in equilibrium state
with the mineral phase. The plot of saturation indices of
calcite (SIc) versus dolomite (SId) demonstrate that most
of the waters are supersaturated with respect to dolomite
and calcite and the SId values are higher than the SIc
values (Fig. 10). The supersaturation indicates the pre-
cipitation of calcium as Ca and/or Ca–Mg carbonate. This
may signify the presence of calcareous nodules (kankar),
which contain a mixture of calcite and dolomite in the
area. About 25% of the analysed water samples are
undersaturated with calcite and dolomite. An analysis
plotting in this field represents water that has come from
an environment where calcite and dolomite are impover-
ished or where Ca and Mg exist in other forms. Waters of
this type will dissolve calcite and/or dolomite if the water
comes in contact with source rocks.
Quality assessment
The data obtained by chemical analyses were evaluated in
terms of suitability for drinking and general domestic use,
irrigation, livestock and industrial use.
0 25 50 75 100
25
50
75
100 0
25
50
100
75
HCO3 Cl
SO4
Surface WaterGround Water
Mine Water
Surface WaterGround Water
Mine Water
Mg
Ca Na+K
a
b
Fig. 9 a Anion diagram relating SO4, HCO3 and Cl. b Cation
diagram relating Mg, Ca and (Na + K)
Environ Geol (2008) 54:745–758 753
123

Suitability for drinking and general domestic use
To assess the suitability for drinking and public health, the
hydrochemical parameters of the groundwater of the study
area were compared with the prescribed specification of
WHO (1997) and Indian standard for drinking water (BIS
1991). Table 3 shows that most of the parameters exceed
the desirable limits of WHO (1997) and BIS (1991), though
it is within the maximum permissible limits. The EC and
concentration of TDS is more than the desirable limits of
750 lS cm–1 and 500 mg l–1, respectively, in 55 and 63%
of the total groundwater samples. The higher EC and TDS
values may cause a gastrointestinal irritation in the con-
sumers. The TH of the analysed water samples varies be-
tween 60 and 768 mg l–1 (avg. 324 mg l–1) in tube wells,
42–949 mg l–1 (avg. 365 mg l–1) in dug wells indicating
soft to very hard types of water. Hardness of the water is
attributable to the presence of alkaline earths, i.e., Ca and
Mg. The data indicate that 52% of the total samples have
TH beyond the safe limit of 300 mg l–1 for drinking water
(BIS 1991). Hardness has no known adverse effect on
health but it can prevent formation of lather with soap and
increases the boiling point of water. The high TH may
cause encrustation on water supply distribution systems.
There is some suggestive evidence that long term con-
sumption of extremely hard water might lead to an in-
creased incidence of urolithiasis, anecephaly, parental
mortality, some types of cancer and cardio-vascular dis-
orders (Agrawal and Jagetia 1997; Durvey et al. 1991). The
recommended limit for sodium concentration in drinking
water is 200 mg l–1. A higher sodium intake may cause
hypertension, congenial heart diseases and kidney prob-
lems. Concentrations of sodium are within the prescribed
limit of 200 mg l–1 in 99% of the analysed groundwater
samples. Concentration of Ca, Mg and K is also found
within the highest permissible limits with few exceptions.
The contents of HCO3 and Cl have no known adverse
health effects; however it should not exceed the safe limits
of 300 and 250 mg l–1, respectively, in drinking water. The
analytical data show that HCO3 exceeds the safe limits in
about 40% and Cl in 6% of the samples. Higher concen-
tration of Cl in drinking water causes a salty taste and has a
laxative effect in people not accustomed to it. Concentra-
tion of sulphate exceeds the desirable limits of 200 mg l–1
in about 9% of the samples, collected near active and
abandoned coal mining areas. Higher concentration of
sulphate in drinking water is associated with respiratory
problems (Maiti 1982; Subba 1993). High sulphate con-
centration may have a laxative effect with excess of Mg in
eticlaC
eticlaC
DolomiteDolomite
SaturationUndersaturation
noitarutasrednU
n oitarut aS
Ground WaterSurface WaterMine Water
Fig. 10 Saturation indices for calcite (SIc) and dolomite (SId)
Table 3 Range in values of
geochemical parameters in
ground water and WHO (1997)
and Indian Standards (IS-10500)
for drinking water
Units: mg l–1 except pH and EC
(lS cm–1)
S.No. Parameters Range Mean WHO (1997) BIS (1991) IS:10500
Max.
desirable
Highest
permissible
Max.
desirable
Highest
permissible
1 pH 6.46–8.87 7.71 7.0–8.5 6.5–9.2 6.5–8.5 8.5–9.2
2 EC 170–1,918 863.5 750 1,500 – –
3 TDS 123–1,552 669 500 1,500 500 2,000
4 HCO3 33.3–694 270 200 600 200 600
5 SO4 2.5–713 87.7 200 600 200 400
6 Cl 2.1–392 98.8 250 600 250 1,000
7 NO3 0.0–232 24.9 – 50 45 100
8 F 0.1–6.0 1.0 0.6–0.9 1.5 1.0 1.5
9 Ca 5.2–241 90.0 75 200 75 200
10 Mg 1.4–92.1 28.1 30 150 30 100
11 Na 6.8–290 61.1 50 200 – –
12 K 0.4–124 5.2 100 200 – –
13 TH 41.8–949 340 100 500 300 600
754 Environ Geol (2008) 54:745–758
123

water. Sulphate may also cause corrosion of metals in the
distribution system, particularly in waters having low
alkalinity.
Nitrate has undesirable effects when present in drinking
water. High concentrations of nitrates can cause methane-
moglobinaemia, gastric cancer, goiter, birth malformations
and hypertension (Majumdar and Gupta 2000). About 14%
of the groundwater samples have NO3 concentration higher
than the recommended level of 45 mg l–1 (BIS 1991).
Fluoride is an essential element for maintaining normal
development of teeth and bones. The concentration of
fluoride exceeds the permissible limits of 1.5 mg l–1 in
about 18% of the groundwater samples.
Suitability for livestock
Water for livestock should be of high quality to prevent
livestock diseases, salt imbalance, or poisoning by toxic
constituents. Most of the water quality variables for live-
stock are the same as for human drinking-water resources
although the total permissible levels of total suspended
solids and salinity may be higher. Irrigation canals, ponds,
rivers, reservoirs and groundwater may serve as water
supplies for livestock. The data in Ayers and Wescot
(1985) and Shuval et al. (1986) indicate that water having
salinity <1,500 mg l–1 and Mg <250 mg l–1 is suitable for
drinking by most livestock. Surface and groundwater of the
area meet these standards and are suitable for livestock
with some exceptions.
Suitability for irrigation uses
On irrigated lands, salinization is the major cause of loss of
production and is one of the most prolific adverse envi-
ronmental impacts associated with irrigation. Saline con-
ditions severely limit the choice of crops, adversely affect
crop germination and yields, and can cause soils to be dif-
ficult to work. Careful management can reduce the rate of
salinity build up and minimize the effects on crops. Man-
agement strategies include: leaching, altering irrigation
methods and schedules, installing sub-surface drainage,
changing tillage techniques, adjusting crop patterns and
incorporating soil ameliorates. All such actions, which may
be very costly, would require careful study to determine
their local suitability. It is important that all evaluation
regarding irrigation water quality is linked to the evaluation
of the soils to be irrigated (Ayers and Wescot 1985). Low
quality irrigation waters might be hazardous on heavy,
clayey soils, while the same water could be used satisfac-
torily on sandy and/or permeable soils. The important
hydrochemical properties of ground, surface and mine wa-
ter used to determine its suitability for irrigation are:
EC and sodium percentage (Na%) EC and sodium
concentration are very important in classifying irrigation
water. The salts, besides affecting the growth of the plants
directly, also affect soil structure, permeability and aera-
tion, which indirectly affect plant growth. The sodium
percentage (Na%) in the water samples is calculated by the
equation:
Na% ¼ Naþ K=ðCaþMgþ Naþ KÞ � 100:
The sodium percentage (%Na) in the area ranges be-
tween 8.8 and 88.8% (avg. 26%) in tube wells, 11.6–88.7%
(avg. 28%) in dug wells water and 11.4–70% (avg. 34%) in
surface water. A high sodium percent causes deflocculation
and impairment of the tilth and permeability of soils (Ka-
ranth 1987). As per the Indian Standard (BIS 1991),
maximum sodium of 60% is recommended for irrigation
water. The plot of analytical data on the Wilcox (1955)
diagram relating EC and sodium percent shows that the
Damodar River basin waters are excellent to good and
good to permissible quality and may be used for irrigation
purposes (Fig. 11).
Alkali and salinity hazard (SAR) The total concentra-
tion of soluble salts in irrigation water can be categorized as
low (EC = <250 lS cm–1), medium (250–750 lS cm–1),
high (750–2,250 lS cm–1) and very high (2,250–5,000
0 500 1000 1500 2000 2500 3000 3500
Electrical Conductivity (EC) µS/cm
0
20
40
60
80
100
muidoS tnecre
P
0 5 10 15 20 25 30 35
Total Concentration (meq/l)
doog ot tnellecxE
elbissim rep ot doo
G
elbatius nu ot luftuoD
Permissible to doutful
Unsuitable
Doutful to unsuitable
elbiatusnU
Ground WaterSurface WaterMine Water
Fig. 11 Plot of sodium percent versus electrical conductivity (after
Wilcox 1955)
Environ Geol (2008) 54:745–758 755
123

lS cm–1). While a high salt concentration in water leads to
formation of saline soil, a high sodium concentration leads
to development of an alkaline soil. Excessive solutes in
irrigation water are a common problem in semi-arid areas
where water loss through evaporation is maximal. Salinity
problems encountered in irrigated agriculture are most
likely to arise where drainage is poor, which allows the
water table to rise close to the root zone of plants, causing
the accumulation of sodium salts in the soil solution through
capillary rise following surface evaporation. The sodium or
alkali hazard in the use of water for irrigation is determined
by the absolute and relative concentration of cations and is
expressed in terms of sodium adsorption ratio (SAR). It can
be estimated by the formula:
SAR ¼ Na=½ðCaþMgÞ=2�0:5:
There is a significant relationship between SAR values
of irrigation water and the extent to which sodium is
adsorbed by the soils. If water used for irrigation is high
in sodium and low in calcium, the cation-exchange
complex may become saturated with sodium. This can
destroy the soil structure due to dispersion of clay parti-
cles. The calculated value of SAR in the study area
ranges from 0.37–3.56 in surface water, 0.23–14.1 in
groundwater and 0.35–3.33 in mine waters. The plot of
data on the US salinity diagram, in which the EC is taken
as salinity hazard and SAR as alkalinity hazard, shows
that most of the water samples fall in the category C1S1
and C2S1, indicating low to medium salinity and low
alkali water, and it can be used for irrigation in most soil
and crops with little danger (Fig. 12). However, about
30% of the water samples of the area fall in C3S1 class
and show high salinity hazard and low alkali hazards
(Richards 1954). High salinity water cannot be used on
soils with restricted drainage and requires special man-
agement for salinity control. Plants with good salt toler-
ance should be selected for such areas.
Residual sodium carbonate (RSC) The quantity of
bicarbonate and carbonate in excess of alkaline earths
(Ca + Mg) also influence the suitability of water for irri-
gation purposes. When the sum of carbonates and bicar-
bonates is in excess of calcium and magnesium, there may
be possibility of complete precipitation Ca and Mg
(Raghunath 1987). To quantify the effects of carbonate and
bicarbonate, residual sodium carbonate (RSC) has been
computed by the equation:
RSC ¼ ðCO3 þ HCO3Þ � ðCaþMgÞ in meq l�1.
A high value of RSC in water leads to an increase in the
adsorption of sodium in soil (Eaton 1950). Waters having
RSC values greater than 5 meq l–1 are considered harmful
to the growth of plants, while waters with RSC values
above 2.5 meq l–1 are not considered suitable for irrigation
purpose. In most of the analysed water samples, RSC
values are below 2.5 meq l–1; only three samples exceed
5.0 meq l–1 limits. This indicates that water is suitable for
irrigation uses.
Permeability index (PI) Doneen (1964) classified irri-
gation waters based on the permeability index (PI). PI is
defined by
PI ¼ NaþpHCO3
CaþMgþ Na� 100
where concentration in meq l�1.
Sixty-six percent of the water samples fall in Class-I and
32% in Class-II in the Doneen’s chart (Domenico and
Schwartz 1990), implying that the water is of good quality
for irrigation purposes with 75% or more of maximum
permeability. However, 35 surface water and 8 ground-
water samples belong to Class-III, i.e., unsuitable category
(Fig. 13).
Magnesium hazard (MH) Szabolcs and Darab (1964)
proposed magnesium hazard (MH) value for irrigation
water as given below
0
2
4
6
8
10
12
14
16
18
20
22
24
26
28
30
32
0
10
20
30
itprosdA
muidoS
)R
AS( oita
R no
100 250 750 2250
1S
4S
3S
2S
muideM
woLhgi
Hhgi
H .V
DR
AZ
AH )IL
AKL
A( M
UID
OS
SALINITY HAZARD
C1 C2 C3 C4Low Medium High Very High
Ground WaterSurface WaterMine Water
Fig. 12 US salinity diagram for classification of irrigation waters
(after Richards 1954)
756 Environ Geol (2008) 54:745–758
123

MH ¼ Mg=ðCaþMgÞ � 100:
MH > 50 are considered harmful and unsuitable for
irrigation use. In the analysed waters, 8 groundwater, 12
surface water and 2 mine water have MH > 50.
Suitability for industrial use The water quality require-
ment for industries varies considerably between areas, kind
of industries and processes. One useful parameter to assess
quality for industrial purposes is the SI of minerals (Rhades
and Bernstein 1971). The SI of the present study water is
positive for calcite and dolomite in most samples, indi-
cating the possibility of precipitation (Fig. 11). The
supersaturation restricts the safe use of water for industrial
purpose, particularly in electrical power stations, industrial
boiler houses, etc. The high TDS, hardness and sulphate
concentration in some samples also make this water unsafe
for textiles, paper and allied industries. Food industries
such as dairying, brewing and carbonated beverage canning
must comply with drinking water standards with disinfec-
tions and treatment before use.
Conclusions
Weathering of rock-forming minerals and anthropogenic
contribution from domestic and coal-based industries are
the major controlling factors for water chemistry. High
concentration of TDS, SO4 and Cl in surface and
sub-surface water samples collected from the mining and
effluents disposal sites indicated the impact of mining and
allied activities on water quality of the area. Excavation
and dumping processes associated with the mining activi-
ties expose fresh surfaces for weathering and accelerated
the dissolution processes and rate of release of ions in
solution, causing increase in concentration of TDS and
other dissolved ions. The calculated saturation indices for
calcite (SIc) and dolomite (SId) demonstrate that most of
the waters are supersaturated, signifying the presence of
calcareous nodules (kankar). The quality assessment shows
that in general, the water is suitable for domestic purposes.
However, high values of EC, TDS, TH, NO3 and SO4 at
some sites make it unsafe for drinking and demand detailed
regional groundwater investigations. The assessment of
water for irrigation use shows that the water is of good to
permissible quality. However, high values of salinity, Mg-
hazard and permeability index (PI) at certain sites restrict
suitability for agriculture.
Acknowledgments Dr. Abhay Kumar Singh is thankful to Depart-
ment Science and Technology, Government of India for financial
assistance in the form of Fast Tract Project (SR/FTP/ES-99/2001).
Support extended by Dr. P. K. Singh, Dr. S. Singh, Mr A. Barat and
Mr K. K. Singh is gratefully acknowledged. Thanks are due the
anonymous referee of the journal, who helped immensely in rewriting
the paper in terms of content and language.
References
Agrawal V, Jagetia M (1997) Hydrogeochemical assessment of
groundwater quality in Udaipur city, Rajasthan, India. Proceed-
ings of National conference on dimension of environmental
stress in India, Department of Geology, MS University, Baroda,
India, pp 151–154
Allen SK, Allen JM, Lucas S (1996) Concentration of contaminants in
surface water samples collected in west-central Indiana impacted
by acid mine drainage. Environ Geol 27:34–37
APHA, AWWA, WPCF (1992) Standard methods for the examina-
tion of water and waste water, 16th edn. APHA, Washington DC
Appelo CAJ, Postma D (1993) Geochemistry, groundwater and
pollution. AA Balkema, Rotterdam
Ayers RS, Wescot DW (1985) Water quality for irrigation. FAO
Irrigation and Drainage Paper No. 20, Rev 1, FAO, Rome
Berner EK, Berner RA (1987) The global water cycle: geochemistry
and environment. Prentice-Hall, Englewood Cliffs
BIS (1991) Bureau of Indian Standards—Indian standard specifica-
tion for drinking water IS: 10500
Choubey VD (1991) Hydrological and environmental impact of coal
mining, Jharia coalfield, India. Environ Geol 17:185–194
Dey AK (1981) The Damodar River water quality—upstream and
down stream of Durgapur barrage. J IPHE India 3:57–60
Dey AK (1985) The saga of the Damodar River. J Ind Chem Soc
IXII:1038–1042
Dey AK, Sen AK, Modak DP, Karim MR (1987) Some industrial
waste effluents in Asanasol-Ranging region and their impact on
the Damodar River water quality. J Geol Soc India 30:386–392
Domenico PA, Schwartz FW (1990) Physical and chemical hydro-
logeology. Wiley, New York
020406080100120
Permeability Index (PI)
0
5
10
15
20
25
30
35
40
45
50
l/qem noitartnecno
C latoT
CLASS - I
CLASS - IICLASS - III
ytilibaemre
P mu
mixaM fo
%52
ytilibaemre
P mu
mixaM
%57
Ground Water
Mine WaterSurface Water
Fig. 13 Doneen (1964) classification of irrigation water based on the
permeability index
Environ Geol (2008) 54:745–758 757
123

Doneen LD (1964) Notes on water quality in agriculture. Water
science and engineering paper 4001, Department of Water
Sciences and Engineering, University of California, California
Drever JI (1988) The geochemistry of natural waters. Prentice Hall,
Englewood Cliffs
Durvey VS, Sharma LL, Saini VP, Sharma BK (1991) Handbook on
the methodology of water quality assessment. Rajasthan Agri-
culture University, India
Eaton FM (1950) Significance of carbonates in irrigation waters. Soil
Sci 39:123–133
Galero DM, Pesci HE, Depetris PJ (1998) Effects of quarry mining
and of other environmental impacts in the mountainous Chicam-
Toctina drainage basin (Cordoba, Argentina). Environ Geol
34:159–166
Garrels RM, Mackenzie FT (1971) Gregor’s denudation of the
continents. Nature 231:382–383
Ghose NC (1983) Geology, tectonics and evolution of the Chotanag-
pur granite–gneiss complex, eastern India. Recent Res Geol
Hindustan Publ Corp Delhi 10:211–247
Karanth KR (1987) Groundwater assessment, development and man-
agement, Tata McGraw-Hill Publ. Com. Ltd. New Delhi, India
Kumar SC, Anderson HW (1993) Nitrogen isotopes as indicators of
nitrate sources in Minnesota sand plane aquifers. Groundwater
31:260–271
Lowson RT, Reedy BJ, Beattie JK (1993) The chemistry of acid mine
drainage. Chem Aust 60:389–391
Maiti TC (1982) The dangerous acid rain. Sci Rep 9:360–363
Majumdar D, Gupta N (2000) Nitrate pollution of groundwater and
associated human health disorders. Indian J Environ Health
42:28–39
Mohan R, Singh AK, Tripathi JK, Chaudhary GC (2000) Hydrochem-
istry and quality assessment of groundwater in Naini industrial
area, District Allahabad, Uttar Pradesh. J Geol Soc India 55:77–89
Pandey K, Sarin MM, Trivedi JR, Krishnaswami S, Sharma KK
(1994) The Indus River system (India–Pakistan): major ion
chemistry, uranium and strontium isotopes. Chem Geol
116:245–259
Pandey SK, Singh AK, Hasnain SI (1999) Weathering and geochem-
ical processes controlling solute acquisition in Ganga headwater-
Bhagirathi River, Garhwal Himalaya, India. Aquat Geochem
5:357–379
Pandey SK, Singh AK, Hasnain SI (2001) Hydrochemical character-
istics of meltwater draining from Pindari glacier, Kumon
Himalaya. J Geol Soc India 57:519–527
Raghunath HM (1987) Groundwater. Wiley Eastern Ltd., Delhi
Ratha DS, Venkataraman G (1997) Application of statistical methods
to study seasonal variation in the mine contaminants in soil and
groundwater of Goa, India. Environ Geol 29:253–262
Rhades JD, Berstein L (1971) Chemical physical and biological
characteristics of irrigation and soil water. In: Ciaccio LL (ed)
Water and water pollution. Marcel Dekker Inc., New York
Richards LA (1954) Diagnosis and improvement of saline and alkali
soils, US Department of Agri. Hand Book, No. 60
Sarin MM, Krishnaswamy S, Dilli K, Somayajulu BLK, Moore WS
(1989) Major ion chemistry of the Ganga–Brahmaputra river
system: weathering processes and fluxes to the Bay of Bengal.
Geochim Cosmochim Acta 53:997–1009
Shuval HI, Adin A, Fiatal B, Raawitz E, Yekuterl P (1986)
Wastewater irrigation in developing countries. Health effects
and technological solutions. World Bank Technical Paper 52.
Washington DC
Singh AK, Hasnain SI (1998) Major ion chemistry and control of
weathering in a high altitude basin, Alaknanda, Garhwal
Himalaya, India. Hydrol Sci J 43:825–845
Singh AK, Hasnain SI (1999) Environmental geochemistry of
Damodar River basin, east coast of India. Environ Geol
37:124–136
Singh AK, Hasnain SI (2002) Aspects of weathering and solute
acquisition processes controlling chemistry of sub-alpine pro-
glacial streams of Garhwal Himalaya, India. Hydrol Process
16:835–849
Singh AK, Mondal GC, Singh PK, Singh S, Singh TB, Tewary BK
(2005) Hydrochemistry of reservoirs of Damodar River basin,
India: weathering processes and water quality assessment.
Environ Geol 8:1014–1028
Singh AK, Mondal GC, Kumar S, Singh KK, Kamal KP, Sinha A
(2007) Precipitation chemistry and occurrence of acid rain over
Dhanbad, coal city of India. Environ Monit Assess 125:99–110
Stumm W, Morgan JJ (1981) Aquatic chemistry. Wiley Interscience,
New York
Subba Rao N (1993) Environmental impact of industrial effluents in
groundwater regions of Visakhapatnam Industrial Complex.
Indian J Geol 65:35–43
Szabolcs I, Darab C (1964) The influence of irrigation water of high
sodium carbonate content of soils. In: Proceedings of 8th
International Congress of Isss, Trans, vol II, pp 803–812
Tiwary RK (2001) Environmental impact of coal mining on water
regime and its management. Water Air Soil Pollut 132:185–199
Tiwary RK, Dhar BB (1994) Effects of coal mining and coal based
industrial activities on water quality of the river Damodar with
specific reference to heavy metals. Int J Surf Mining Reclam
Environ 8:111–115
WHO (1997) Guidelines for drinking-water quality, V.1, recommen-
dations. World Health Organisation, Geneva
Wilcox LV (1955) Classification and use of irrigation waters. US
Dept of Agricul Cir 969, Washington DC
758 Environ Geol (2008) 54:745–758
123