EMR: India: Shongtong-Karchham Hydroelectric Project (450 ...
Upload
khangminh22Category
view
5download
0
•
TEXAS WATER DEVELOPMENT BOARD
REPORT 81
MAJOR HYDROELECTRIC POWERPLANTS IN TEXAS
Historical and Descriptive Information
8y
F. A. Godfreyand
C. L. Dowell
August 1968

Mills Cox, ChairmanRobert B. GilmoreMilton T. Potts
TEXAS WATER DEVELOPMENT BOARD
Marvin Shurbet, Vice ChairmanGroner A. PittsW. E. Tinsley
Howard B. Boswell, Executive Director
Authorization for use or reproduction of any material contained in this publication,i.e., not obtained from other sources, is freely granted without the necessity of securingpermission therefor. The Board would appreciate acknowledgement of the source oforiginal material so utilized.
Published and distributedby the
Texas Water Development BoardPost Office Box 12386Austin, Texas 78711
ii
•
•

TABLE OF CONTENTS
DEFINITIONS AND ABBREVIATIONS
INTRODUCTION ...
Purpose and Scope
Organization of Report
Sources of Data
Personnel
MAJOR HYDROELECTRIC POWERPLANTS IN TEXAS THROUGH DECEMBER 31, 1967
DESCRIPTIONS OF HYDROELECTRIC POWERPLANTS
1. Austin
2. Cuero
3. Gonzales
4. Dunlap (TP·l)
5. McQueeney (TP·3)
S. Nolte (TP·5)
7. Devils Lake
8. Lake Walk
9. H-4 Dam
10. H-5 Dam
11. Seguin (TP-4)
12. Buchanan
13. Eagle Pass
14. Red Bluff
15. Inks ...
16. Marshall Ford
17. Morris Sheppard
iii
Page
vi
2
4
4
10
16
19
22
26
30
34
38
41
44
48
53
58
59
62
66

TABLE OF CONTENTS (Cant'd.)
18. Denison
19. Whitney
20. Granite Shoals
21. Marble Falls
22. Falcon ...
23. Sam Rayburn
24. Amistad ..
25. Toledo 8end
REFERENCES .....
FIGURES
Page
70
74
77
80
83
86
89
90
93
1. Austin Dam and Hydroelectric Powerplant before 1900
2. Austin Dam and Hydroelectric Powerplant in 1915 ..
3. Tom Miller Dam and Austin Hydroelectric Powerplant after reconstruction in 1939
4. Cuero Hydroelectric Powerplant .
5. Generators at McQueeney (TP·3) Hydroelectric Powerplant
7. Generators at Nolte (TP·5) Hydroelectric Powerplant
8. Devils Lake Dam and Hydroelectric Powerplant . . .
9. Exciter mounted above the generator at Devils Lake Hydroelectric Powerplant
10. Lake Walk Hydroelectric Powerplant and Dam
11. Seguin (TP-4) Hydroelectric Powerplant and Dam
12. Generator at Seguin ITP-4) Hydroelectric Powerplant
13. 8uchanan Hydroelectric Powerplant and Dam . . . .
14. Two generators and pump motor at Buchanan Hydroelectric Powerplant
15. Eagle Pass Hydroelectric Powerplant .
16. Generators at Eagle Pass Hydroelectric Powerplant
17. Generators at Marshall Ford Hydroelectric Powerplant
18. Morris Sheppard Dam and Hydroelectric Powerplant
6. Nolte (TP·5) Hydroelectric Powerplant
5
5
7
13
23
27
27
31
31
35
45
45
50
50
55
55
63
67
iv

TABLE OF CONTENTS (Cant'd.)
Page
19. Denison Dam and Hydroelectric Powerplant ... 71
20. Generators at Denison Hydroelectric Powerplant 71
21. Whitney Hydroelectric Powerplant, Dam, and switchyard 75
22. Generators at Whitney Hydroelectric Powerplant 75
23. Generators at Granite Shoals Hydroelectric Powerplant 78
24. Generators at Marble Falls Hydroelectric Powerplant 81
25. Generators at United States Falcon Hydroelectric Powerplant 84
26. Sam Rayburn Hydroelectric Powerplant and water control structure 87
27. Generators at Sam Rayburn Hydroelectric Powerplant 87
28. Turbine runner at Toledo Bend Hydroelectric Powerplant 91
v

DEFINITIONS AND ABBREVIATIONS
Definitions and abbreviations in this list areintended to explain terms as used in this report.
actuator, or governor. A hydraulic (oil) system ofcontrol of a steam or hydro turbine, which controls thespeed of the prime mover and its power output.
application. A written request to the Texas Water RightsCommission for a permit to appropriate public watersfor beneficial use.
average load. The sum of the hourly generation dividedby the number of hours designated.
base load. A definite proportion of a power system loadallotted to a generating unit or powerplant.
capability. The maximum load which a machine, station,or system can carry under specified conditions for agiven time interval.
capacity. The load for which a machine, station, orsystem is rated.
draft tube. The discharge portion of a water turbine,usually of metal or concrete, which enables water from aturbine to create a partial vacuum.
energy. That which does work. Power efficiently andforcibly exerted. Electrical energy is usually measured inkilowatthours.
exciter. A small direct-current generator, belt driven ordirect connected on the main shaft, or a motar·generatorset, whose function is to energize the field magneticpoles of an alternating·current generator.
firm power. Power available at all times to meet loadrequirements.
generator. A rotating electrical machine for convertingmechanical energy into electrical current.
gross generation. The total power produced in a powerstation. (See Net Generation and Plant Use.)
gross head. The difference in elevation, in feet, betweenstill water surface in the reservoir and in the tailrace.
headgate. A hoist operated vertical lift gate installed atthe entrance of a penstock or wheelpit to control thef low of water to the turbine.
headwater. Water behind a dam.
hp horsepower. A unit of power equal to 550 footpounds per second.
- vi -
kva kilovolt-ampere (s). A unit of electrical power inalternating-current circuits. (See Power Factor.)
kw kilowatt (s). A unit of electrical power, equal to1,000 watts or about 1.34 horsepower.
kwhr kilowatthour (s). A unit of work or energy, equalto that expended in 1 hour at a rate of 1 kilowatt.
megawatt. A unit of electrical power, equal to 1,000,000watts.
megawatthour. A unit of work or energy, equal to thatexpended in 1 hour at a rate of 1 megawatt.
nameplate rating. The continuous capability of a generator, turbine, motor, etc., under conditions specified bythe manufacturer, indicated on the nameplate. Nameplate rating may be greater or less than the demonstratedcapability.
net generation. Gross generation less plant use.
normal headwater elevation. The crest of the spillway,top of control gates, or an arbitrarily selected water·surface elevation. Because headwater is subject tovariation, daily, monthly, and seasonally, the term"design headwater elevation" is preferable.
normal tailwater elevation. Intended water-surface eleva·tion in the turbine discharge channel. Because the actualtailwater elevations are extremely variable, the term"design tailwater elevation" is preferable.
peak load. The maximum load in a stated period of time.
penstock. A metal, concrete, or wooden pipe carryingwater under pressure.
Permit. The specific authorization to make an appropriation of water which is issued by the Texas Water RightsCommission to one whose Application for a Permit hasbeen granted.
plant use. Station service; the electric power used in apowerplant, for lights, heat, fans, motors, pumps, etc. Inlarge plants it is provided for by separate small generators.
power factor. The ratio of true power in kilowatts (kwlto apparent power in kilovolt-amperes (kva) in analternating·current circuit, expressed as a percentage.
power output. The amount of power or energy deliveredfrom one generator or the total from a power station.
primary energy. Energy available from firm power.
•

rpm revolutions per minute. A measure of rotatingspeed.
run-of-river powerplant. A powerplant that uses the flowof the river as it occurs without benefit of storage.
scrollcase. Spiral waterway of converging aperture thatdelivers water from a penstock to a turbine, or from apump to a penstock or pipe.
secondary power. Power that is available only part of thetime. Secondary power may be interrupted at thediscretion of the producer within limits set out in thepower contract. Off-peak power is related to this, but isavailable during certain hours of low system demands.
sediment reserve space. That part of a reservoir capacityallocated for storage of sediment expected to bedeposited over a certain period of time.
storage. Water impounded for supply during periods oflow river flow.
- vii -
synchronous. In order for generators to functiontogether they must be "in step" or synchronous in theirvoltage cycles.
synchronous condenser. An alternating-current generator"on the line" (connected with transmission lines) but atno load, whose field poles are over-excited to boosttransmission line voltages.
tailwater. Water in channel or tailbay below a dam.
Tainter (or tainter or taintor). A certain type of gatepatented by Mr. Jeremiah Burnham Tainter in 1886. Asa descriptive term the "T" is often used as lower caseand in some books the spelling is taintor.
turbine (hydraulic). A machine that transforms thepotential energy of water into useful work.
watt. One watt is produced when an electric current of 1ampere flows at an electromotive force of 1 volt.


MAJOR HYDROELECTRIC POWERPLANTS IN TEXAS
Historical and Descriptive Information
INTRODUCTION
Purpose and Scope
This report compiles historical and descriptiveinformation about the major hydroelectric powerplantsin Texas. and presents a record of power generation ateach plant where available. Records here are currentthrough December 31, 1967.
Descriptions of 25 powerplants are included.Nineteen of these plants were in operation at the end of1967, two were under construction, and four had beenclosed. Descriptions of the four closed plants areincluded because of their historical value.
Many small hydroelectric powerplants, nowclosed, were of considerable importance to their ownersand operators and to the communities they served, butare not detailed in this report. The better known plantswere located as follows:
San Marcos River at San Marcos, Atvord,Martindale, Staples, Fentress, Luling, and Ottine.
Guadalupe River at Kerrville, Center Point,Comfort, New Braunfels, Seguin, and Oak Forest.
Comal River at New Braunfels.
Concho River at San Angelo.
Colorado River at Marble Falls.
Llano River at Llano.
San Antonio Rrver near San Antonio.
San Felipe Creek at Del Rio.
Leon River at Belton.
Lampasas River at Lampasas.
The early settlers used water power to operategrain mills, cotton gins, saw mills, water pumps, and
other equipment in many locations, but description ofthese plants is outside the scope of this report. Many ofthem are described in The Water Powers of Texas(Taylor, 1904).
Organization of Report
Descriptions of major hydroelectric powerplantsare given chronologically to show their historical development through December 31, 1967. A list of thesepowerplants by the year construction began follows theintroduction. The record of electrical energy generationat each plant, where available, follom the description ofthe plant. Photographs of some of the plants areincluded.
Sources of Data
Information on the water right applicable to eachhydroelectric powerplant described was obtained fromthe files of the Texas Water Rights Commission. Recordsof hydroelectric power generation for the plants oper·ated by the agency named were furnished by the BrazosRiver Authority; Central Power and Light Company;Guadalupe-Blanco River Authority; InternationalBoundary and Water Commission, United States andMexico; Lower Colorado River Authority; and the U.S.Army Corps of Engineers. Other information on thepowerplants was obtained from the operating agencyand from visits of Water Development Board personnelto the plants. Also, the Sabine River Authority of Texasfurnished data on the Toledo Bend project which wasunder construction at end of 1967.
Personnel
This report was prepared under the generaldirection of John J. Vandertulip, Chief Engineer. Thedata were compiled and the text was written by F. A.Godfrey and C. L. Dowell under the immediatesupervision of S. D. Breeding.

'"
Major hydroelectric p~lerplants in Texas through December 31, 1967
(Listed in chronological order by year construction was started)
DESCRIP- RIVER YEAR YEAR GENERAT INGTIDN HYDRDELECTR IC PAGE OWNER RESERVO IR STREAM BASIN CONSTRUCTION CONSTRUCTION CAPACITYNO. POIJERPLANT NO. STARTED COHPLETEQ (KW)
1 Austin ~ City of Austin* Lake McDona Id Colorado Colorado 1890 1893 5.227 (hp)do' Lake Austin do do 1911 1915 6.000(hp)
Lower Colorado River do do do 1937 1939 13 .500Authority, Lessee.
2 Cuero.!J 10 Central Power and -- Guadal upe Guadalupe 1896 1898 1,100Light Company
3 GonzalesY 16 do -- do do 1925 1925 1,200
~ Ounlap (TP-I) 19 Guadalupe-Blanco River Lake Dunlap do do 1927 1928 3,600Authori ty
5 "cQueeney (TP-3) 22 do Lake McQueeney do do 1927 1928 2,800
6 Nolte (TP-5) 26 do Lake No Ite do do 1927 1927 2,~80
7 Dev i Is Lakell 30 Central Power and Devi Is Lake Devi Is Rio Grande 1927 1928 1,800Light Company
8 Lake lJalk1l 3~ do Lake Walk do do 1928 1929 1.350
9 H-4 Dam 38 Guadalupe~Blanco River H-4 Reservoi r Guadalupe Guadalupe 1929 1931 2,400Authori ty
10 H~5 Dam OJ do H-S Reservoi r do do 1929 1931 2,400
II Segu in (TP~4) ~~ do TP-4 Rese rvo i r do do 1930 1932 2,400
12 Buchanan ~8 Lower Colorado River Lake Buchanan Colorado Colorado 1931 1938 33.750Authorl ty Authori ty
13 Eagle Pass 53 Central Power and Canal Rio Grande Rio Grande 1931 1932 9,600Light Company
I~ Red Bluff 58 Red Bluff Water Power Red BI uff Pecos do 193~ 1937 2,300Control District
15 Inks 59 Lower Colorado River Inks Lake Colorado Colorado 1936 1938 12.500Authori ty
16 Marshall Ford 62 do Lake Travis do do 1937 19~2 67,500
17 Morris Sheppard 66 Brazos River Authority Possum Ki ngdom Brazos Brazos 1938 19~1 22,500
18 Den i son 70 U.S. Army Corps of Lake Texoma Red Red 1939 19~3 70,000Engineers
See footnotes at end of table.

w
Major hydroelectric powerplants in Texas through December 31. 1967--Continued
DESCRIP- YEAR YEAR GENERATINGTlON HYDROElECTR IC PAGE OWNER RESERVOIR STREAM RIVER CONSTRUCT t ON CONSTRUCT IOtl CAPAC lTVNO. POWERPLANT NO. BASIN STARTED COHPLETED (KW)
19 \Ih i tney 7\ U.S. Army Corps of Whitney Brazos Brazos 19\7 1951 30,000Engineers
20 Granite Shoals 77 Lower Colorado River Lake Lyndon B. Colorado Colorado 19\9 1951 \5,000Authority Johnson
21 Marble Falls 80 do Marble Falls do do 19\9 1951 30,000Lake
22 Falcon 83 International Boundary International Rio Grande Rio Grande 1950 1954 31,500and Water Commission Falcon
23 Sam Rayburn 86 U.S. Army Corps of Sam Rayburn Angelina Neches 1956 1966 52,000(HcGee Bend) Engineers
24 Ami stad 89 International Boundary Amistad Rio Grande Rio Grande 1963 under 80,000and Water Commission construction
25 Toledo Bend 90 Sabine River Toledo Bend Sabine Sabine 1964 under 83,000Authorities of Texas constructionand Louisiana
Total active generating capacity December 31, 1967 ..•.•.•••••••••••••••• !I36.230 kw
*Same project site. First dam and powerplant destroyed by flood April 7. 1900 ..!J Discontinued October 1965.2/ Discontinued November 1965.11 Discontinued December 1965.

DESCRIPTIONS OF HYDROELECTRIC POWERPLANTS
1. Austin Hydroelectric Powerplant
Location
Austin Hydroelectric Powerplant is at Tom MillerDam (Lake Austin) on the Colorado Aiver at Austin,Travis County.
Ownership and History of Development
The powerplant is owned by the city of Austinand is operated by the Lower Colorado River Authori tvunder a term lease as one of a series of six hydroelectricpowerplants on the Colorado Aiver and is the sixth andlowest in elevation of the series. The other five areBuchanan, Inks, Granite Shoals, Marble Falls, andMarshall Ford Hydroelectric Powerplants. All of thesewere built and are operated by the Lower ColoradoRiver Authority and are described in this report (Clay.1948; Dowell and 8reeding. 1967).
Lake Buchanan is the upstream project and wasthe first built (1938) including significant storage tosustain river flow for power generation at the downstream powerplants. Additional storage is provided byLake Travis. The provision of this upstream storagemade feasible the reconstruction of the Austin Dam andHydroelectric Powerplant.
The present (1968) project was constructed underauthority of the water right claimed by the city ofAustin under Certified Filing No. 330 filed June 30,1914, with the State 80ard of Water Engineers. Priorrights were said to be established before 1890 when thefirst Austin Dam was started. The prior water rightsrenewed by this certified filing were for the purposes offurnishing water, lights, and power to the inhabitants ofAustin and State institutions; appropriating the flow andunderflow and the storm and rainwaters of the ColoradoRiver; and storing the flood and rainwaters of theColorado River for generating power, for domestic uses,and for general municipal and State purposes. Thecertified filing further states that water may be divertedfrom the river or sand beaches at various places along theriverbank for domestic purposes and for general municipal and State uses through certain filtration systemslocated upon a described "Sandy Beach Reserve."
The history of attempts to develop the water andhydropower resources of the Colorado River of Texas islong, varied, and sometimes tragic. A summary of thishistory is found in the book Flood to Faucet, by WalterE. Long (19561.
·4·
Navigation was a primary concern in early dayson a river plagued by floods and log jams whicheffectively prevented navigation.
A State program was impossible on a State grossbudget of 5115.372 per annum (1851). Federal aid of$20,000 (18531 was expended to clear the log jams anda period of navigation existed from 1854 to 1860.
The War Between the States practically stoppedthe navigation program and the log jams built up again.The railroads came to Austin on Christmas Day, 1871,and the railroad era stopped all serious attempts torenew river navigation. But the flood problem remained.
Construction of the Austin Dam and HydroelectricPowerplant was begun by the city of Austin November5, 1890, and was completed May 2, 1893, at a cost ofover one million dollars. The dam was 60 feet high witha total length of 1,275 feet, with an overflow crest 1.091feet long, and was said to be the largest masonry dam inthe world across a flowing stream (Figure 1). Elevationof overflow crest was 490,0 feet above msl (mean sealeveil as described by McDonough (1940). The reservoirformed by the dam was named Lake McDonald in honorof the then mayor of Austin and the dam was known asthe Austin Dam until 1937 when its name was changedto the Tom Miller Dam in honor of another Austinmayor. Lake McDonald was one of the first man·madelakes in the nation with a length of over 30 miles. Thisdam and reservoir provided no effective flood control,however.
The first Austin Hydroelectric Powerplant wasdesigned on an assumption that the minimum flow ofthe Colorado Aiver at the site would be 1,000 cfs (cubicfeet per second). On the basis of this assumed minimumflow, a continuous supply of hydroelectric poweramounting to 5,227 hp (horsepower) was to be availablefor a gross head of 60 feet and net head of 57.5 feet.This expectation of continuous power production wasnot reached as the river flow was much less than 1,000cfs many times during the short life of this first AustinDam (Taylor. 19001.
On April 7, 1900, floodwater destroyed nearlyone-half of the Austin Dam and part of the hydroelectricpowerplant (Taylor. 1900. p. 42-44).
On September 22, 1911, the city of Austinentered into a contract with William O. Johnson to

Figure l.··Austin Dam and Hydroelectric Powerplant before 1900 (Mead, 1917). The excursion boat BenHur is in upper left. The dam and powerplant were partly destroyed by flood April 7, 1900.
Figure 2.··Austin Dam and Hydroelectric Powerplant in 1915, after reconstruction and before theSeptember 1915 flood (Mead, 19171.
·5·

rebuild the dam and hydroelectric powerplant. Thereconstructed dam was to raise the water level 5 feethigher than the spillway crest of the original dam by theuse of floodgates. In rebuilding the dam about one-halfof the old masonry dam was used with automaticwooden floodgates 6 feet high installed on the crest. Therebuilt part of the dam was concrete with crest 9 feetlower than crest of the old dam. Automatic woodenfloodgates 15 feet high were installed on top of thisconcrete section (Mead, 1917). The contract requ iredJohnson also to supply the equipment of the powerplantto include three vertical turbines of not less than 2,400hp each when operating under a head of 60 feet; three6,600 volt, 3-phase, 60-cycle electric generators to bedirectly connected to the 2,400 hp vertical turbines andcapable of generating not less than 6,000 hp of electricalenergy; and two direct current exciting generators ofsuch capacity that either one shall be able to furnish thenecessary full load exciting current for all three of the3-phase generators (Mead, 1917, p. 58). (The rebuiltpowerplant was not accepted by the city of Austin andwas never operated to supply power).
Johnson in turn assigned the contract to the CityWater Power Company, which sublet it to the William P.Carmichael Company, which started work on the projectalmost immediately.
Floodwater in 1913 did much damage to thereconstruction contractor's coffer dams on the project.Reconstruction was nearly complete when, in September1915, a flood destroyed 20 of the large automatic crestgates and most of the small ones. The tailrace at thepowerplant was filled with rock, gravel, and debris,effectively plugging the draft tubes. The reconstructeddam and powerplant are shown in Figure 2 before theSeptember 1915 flood.
The contractor and the city of Austin were incontroversy over the contractor's failure to complete thecontract to the satisfaction of the city and the city'srefusal to accept responsibility. Thus came to an end thisfirst effort to rebuild the dam.
The dam was damaged further by the great floodof June 15, 1935, which destroyed most of theremaining gates and gate piers, and part of the concreteogee spillway.
Reconstruction of the old dam into the present(1968) dam and powerplant was started in 1937 by theLower Colorado River Authority, and generation ofelectricity began March 31, 1940. The uncontrolledspillway crest of present dam is 2.8 feet higher thanspillway crest of the dam that failed in 1900. The AustinDam was renamed Tom Miller Dam in 1937 and wasdedicated April 6, 1940, just one day less than 40 years
- 6-
after the original dam was destroyed by flood in 1900.The name "Austin Hydroelectric Powerplant" has beencontinued. The present dam and hydroelectric powerplant are shown in Figure 3.
Physical Description
Two 6,750 kw capacity generators at AustinHydroelectric Powerplant provide a total capacity of13.500 kw.
Each of the vertical generators is a 6,750 kw, 3phase, 60 cycle. 11,500 volt, 200 rpm unit manufactured by the Westinghouse Electric Corporation.
Each of the turbines is a Newport NewsShipbuilding and Drydock Company automatic adjustable blade propeller type, 200 rpm unit with a capacityof 10,500 hp at 64.8-foot head.
The two turbines at the Austin HydroelectricPowerplant are equipped with mechanically automaticadjusted blades for the purpose of getting the greatestoutput of power for any gate position. This is obtainedby a cam arranged on a wicket gate arm in such a waythat a sliding collar on the vertical turbine shaft willmove vertically with changes of wicket gate openings onthe turbine. The sliding collar carries with it a shaftinside the hollow turbine shaft and is connected to amechanism that rotates the blades of the turbine runnerto the required angle.
Design headwater elevation for the powerplant isat 492.8 feet above msl (crest of uncontrolled spillway);minimum tailwater elevation is at 428.0 feet above msl,giving a gross head of 64.8 feet.
The powerhouse is water sealed (to prevent flooding) to elevation 476.0 feet above msl, which is higherthan the maximum known flood stage at this site.
The facilities of the Lower Colorado RiverAuthority, including an extensive system of transmissionlines, have become an integral part of the South Texasinterconnected system, comprising private powersystems as well as large municipal and other publicenterprises. The Lower Colorado River Authority powerplants provide power not only for local consumption,but for peaking loads of interconnected systems.
Records of gross monthly generation of electricalenergy at the Austin Hydroelectric Powerplant for theyears 1943-67 have been furnished by the LowerColorado River Authority and are given in the tablefollowing. Records for the years before 1943 are notavailable.

- 7 -

CD
Gross generation of electrical energy at Austin Hydroelectric Powerplant. in Megawatthours
YEAR JANUARY FEBRUARY HARCH APRIL HAY JUNE JULY AUGUST SEPTEHBER OCTOBER tlOVEHBER OECEHBER TOTAL
1943 8,591 6,940 6,276 7,937 6,400 6,816 5,984 5,874 2,768 4,343 3,678 4,239 69,846
1944 3,797 3,531 2,975 3,235 5,128 7,644 9,504 8,837 8,178 7,522 4,402 6,143 70,896
1945 5,331 5.567 6,203 6.522 6,901 6,108 9,192 6,721 7,708 6,028 6,554 6,382 79,217
1946 6,192 4,124 4.823 5,136 7.443 6,044 5.851 8,754 7,252 7,249 5,926 6,420 75,214
1947 7,742 6,496 6.067 4,121 5,368 6.643 6,938 6,022 4,378 3,343 3,357 2.715 63,190
1948 3,071 3.368 2,705 2,990 3.998 5,676 6,265 6,286 3,404 2.611 1,907 1,873 44,154
1949 1.965 1,802 3,524 3,168 3,572 5,574 6,270 5,825 4.584 3.749 3,690 3.476 47,199
1950 2,418 2,264 1,936 1,931 4.558 4,562 5.486 4,834 2,431 1,283 1,648 1.947 35,298
1951 2.463 1,621 404 1,834 4,698 4,234 5.766 5,236 1,736 734 475 532 29,733
1952 459 430 463 1.152 2,898 4,845 4.836 4,835 2,368 662 539 572 24,059
1953 2,149 2,487 833 2.550 3,836 5.468 5,482 3,888 1,047 655 421 857 29,673
1954 939 231 1,114 3.051 5,926 6. III 6,447 4.616 1.283 651 598 620 31,587
1955 620 1.022 I ,255 2.800 4,875 8.590 7,863 6,159 4,177 5,946 4,792 1,498 49,597
1956 850 1,274 1,363 2,932 6,856 6,074 6,372 4,416 1,500 556 320 360 32,873
1957 344 317 356 2,480 9,371 9,606 10,114 7,444 6,553 8,430 10,821 10,902 76,738
1958 9,888 7,585 11,162 10,678 10,039 10.341 10,619 8,291 4,383 3,631 1,856 744 89,217
1959 2,098 1,739 1,820 4,247 6.828 4,897 6,474 9,638 7,241 9,346 10,220 10,165 74,713
1960 9,059 7,129 8,962 8,719 8.186 8,130 7,873 5,701 3,293 2,752 884 456 71 ,144
1961 1,206 7,699 10,496 9.288 7,008 6.702 10.171 10,047 6.272 2,206 8,002 8,729 87,826
1962 4,503 553 416 1,111 4,418 5.201 5.725 5.064 2.366 /185 1,136 I ,699 32,677
1963 1,420 1,600 381 2,924 4,752 5,633 5,367 5,106 3,971 389 0 8 31,551
1964 35 4 0 3,202 4.724 5,045 4.770 3,614 2,959 159 14 30 24,556

<D
Gross generation of electrical energy at Austin Hydroelectric Powerplant, in Megawatthours--Continued
YEAR JANUARY FEBRUARY MARCH APRIL MAY JUNE JULY AUGUST SEPTEMBER OCTOBER NOVEMBER DECEMBER TOTAL
1965 212 616 16~ 1,976 6,761 10,518 ~,963 ~,162 3,~75 I ,939 4,561 4,488 43,835
1966 1,508 107 338 5,148 9,971 6,098 5,347 3,704 2,974 1,447 1,664 35 38,341
1967 0 ~25 1,682 5,123 6,220 6,434 4,228 6,197 2,98~ 224 162 72 33,751
Total 76,860 68,931 75,718 104,255 150,735 162,994 167,907 151,271 99,285 76,3~0 77,627 74,962 1,286,885
Monthly andannual average 3,074 2,757 3,029 4,170 6,029 6,520 6,716 6,051 3,971 3,054 3,105 2,999 51,475
1943-67
Monthly averagein percent of 6.0 5.4 5.9 8.1 11.7 12.7 13.0 11.8 7.7 5.9 6.0 5.8 100annual average
1943-67

2. Cuero Hydroelectric Powerplant
Location
Cuero Hydroelectric Powerplant was on theGuadalupe River 5 miles north of Cuero, DeWittCounty.
Ownership and History of Development
The Cuero Hydroelectric Powerplant was shutdown October 20, 1965, by owner, the Central Powerand Light Company. The story of this plant is includedin this report because its operation was typical of manyearly small run-ot-river powerplants.
The following document brings to light many ofthe problems experienced in the early days of the powerbusiness in Texas. O. T. McAlister wrote this history,evidently in 1948. The original document was on thewall of the office at the Cuero Hydroelectric Powerplantof the Central Power and Light Company, H. A. Taylorof Cuero supplied a copy of the document, which readsas follows:
A stock company was organized by the principle
business men of Cuero in the early part of 1891.The purpOse of this company was to build a light
[plant I to furnish lights to the town of CUeto. This
company was given the name of Cuero Light andPower Company. The plant consisted of low
pressure boilers fired by wood, of which there was
an abundance near the edge of town, a slide valve
steam engine, and a Heisler dynamo. This was a
series system generating 1100 volts.
This plant was operated in this manner until the
early part of 1896 when the Buchel Power and
Irrigation Company was organized for the purpose
of developing a hydro-electric plant on the
Guadalupe River for pOwer and irrigating purposes.
The original dam of the Buchel Power and Irriga
tion Company was constructed at a cost of
approximately one hundred thousand dollars. The
Cuero Light and Power Company then offered to
sell its holdings to the promoters of the Buchel
Power and Irrigation Company, but it being old
and obsolete, it is said by their manager who is yet
living in Cuero 119481, that the Buchel Power and
Irrigation Company offered them practically
nothing-which was said to be practically what it
was worth-and they installed "The Warn", a
multiple system. This was the first alternating
current that Cuero ever knew.
This gave Cuero some better electric service. In
March 1898, the Buchel Power and Irrigation
Company energized their lines which were built
- 10 .
parallel and on opposite sides of the street to those
of the Cuero Light and Power Company. These
two companies operated at that time in sharp
competition to each other. The Cuero Light and
Power Company was then issuing assessments each
month to supplement their earnings to pay the
operating expenses. This information was given to
us by the manager of the Cuero Light and Power
Company, and one of the stockholders who is
living in Cuero today [19481. This continued for a
period of twelve months when the Cuero Light and
Power Company sold its holdings to the Buchel
Power and Irrigation Company, at which time the
Buchel Power and Irrigation Company [installed] a
higher rate which they conceived to be a reason
able rate and one under which they could exist.
They also promised to install an auxiliary steam
plant to ensure good service when the river was
high enough to render it impossible to run the
hydro plant. The Buchel Power and Irrigation
Company then installed a steam plant with approx·
imately 300 H.P. [horsepower! capacity.
At this time the Buchel Power and Irrigation
Company's machinery consisted of two new Amer
ican Turbine Wheels, with a ten foot working water
pressure which gave them approximately 400 H.P.,
water power, and a steam plant consisting of one
Lane Badly Corliss engine with 300 H,P, capacity.
The first lighting meter oontract was signed by the
BucheI Power and Irrigation Company in 1900.
This was for fifteen C.P, [candlepowerl lights or
its equivalent, the rate being 15¢ per K.W.H.
straight, with a minimum of $2.50 per month plus
25(: meter rental. Such contracts must be signed
for twelve months. During this year the Buchel
Power and Light Company got into the power
business and made a contract with the Cuero
Cotton Mills to furnish pOvwr at $19.00 per H.P.,
per year consisting of 306 working days. They also
made power contracts at ~¢ per mechanical H.P.
At this time the city was served on a flat rate of
$2.25 for three-16 C.P. (candlepower! lights. All
over three lamps became cheaper, being 2S¢ each
per month. There was also an agreement that they
should burn the lights only until midnight.
In 1903, the penstocks were enlarged, three fifty
inch Samson turbines were added to increase the
power, also at the same time. two feet were added
to the crest of the dam. This added height proved
to be a very expensive experiment as the additional
fall of water undermined the foundation of the
dam and was only stopped at great expense by
shipping in stone and filling in the hole.

In 1905 there was a day service during the hot
summer months for a circuit that ran up town
during the fan season. This was the first twenty
four hours per day service that was ever known in
Cuero.
In t he spring of 1908. t he plant was burned to the
water's edge.
When W. M. Ratcliffe and his associates bought the
dam :-ite in July 1908 he organized a corporationunder the name of Cuero Light and Power
Company. and revamped the old plant, starting the
plant again on December 28. 1908. This company
immediately put in a meter system all over Cuero
and from that day on, Cuero has operated on a
meier system, twenty·four hours a day. They at
that time. made a minimum charge of $1.25 and
25¢ meter rental. This continued under this
management unti I 1914 during which time various
power contracts vvere signed. the lowest: having
been with the present Guadalupe Valley Cotton
Mills. at .0134 per K.W.H. [1.34 cents per
K.W.H.I. This rate was in effect for about five
years and was raised to .02)1, per K.W.H. (2)1, cents
per K.W.H.I with a rigid fuel clause.
In 1911 this same company installed three fifty-six
inch Samson Turbines to replace the American
Wheels and at the same time raised the crest of the
dam. three feet, three inches, making a total height
of t he dam fifteen feet, three inches.
In 1914 the property was purchased by the Texas
Southern Electric Company. which company built
a concrete penstock (wheelpitl at a 0051 of
approximately $30,000.00 and was reorganized as
the Texas Gas and Electric Company. Thisoompany owned the following properties: Cuero.
Memphis. Childress. Claredon, Yorktown, Victoria.
Beeville. Kingsville. Bishop. Wharton. Del Rio.
Center. and Vernon. On February 24. 1920. the
Texas Gas and Electric Company went into the
hands of receiver. The receiver immediately raised
the rates to 20¢ per K.W.H. and minimum of
$2.00. They operated this plant at this rate for
about tvventy months after which time it was sold
under the hammer to Morrison and McCall.
A few weeks after Morrison and McCall had
acquired this property and during an extreme high
river. a barrage of driftwood, several miles long,
l(lnded against the dam and pushed off a section,
<;even feet-eight inches high which left the water
plant without any power. Morrison and McCall
then operated their steam ptant which, at this time,
- 11 -
consisted of one 500 H.P. Bates Corliss Engine, and
450 [horsepower! boiler capacity. and gave Cuero
an uninterrupted electric service. Arrangements
were quickly made. and a section of reinforced
concrete was anchored on top of this masonry, and
in less than sixty days the plant was operatingbetter than ever.
Again on April 3, 1922, during another period ofhigh water. the flood water cut around the westend of the dam, opening up a new channel one
hundred and twenty-five feet wide.
The present dam was then extended across this new
channel, which doubled the length of the dam;
thus proportionately increasing its stability and
safety. The water-wheels and generating units of
the station were replaced by larger and more
modern equipment which included three Allis·
Chalmers Umbrella Type Generators.
Morrison and McCall operated this property until it
was taken over as a subsidiary of Middle West
Utilities in July. 1925. This company immediately
began to entrench itself more substantially in the
larger towns and to spread its wings of high lines
[high voltage transmission lines! and distribution
systems until it is now hovering and nurturing. by
dependable and unlimited electric service. every
village and town within anything like a reasonable
distance.
Cuero, itself. has grown from a very insignificant
series system light plant. until now it is the center
of a netvvork of high lines (high voltage linesl. We
have a connected load in power and light of 2130.2
K.W. (kw) and are distributing over our lines
approximately 200.000 K.W.H. per month. Almost
100% of our people are satisfied with the service
that they are getting and are continually compli·
menting and praising our service. A great percent
of them also are satisfied with the rates.
The names of the electric light companies of Cuero
have been changed many times. It first operated
under the name of Cuero Light and Power
Company, then Buchel Power and Irrigation
Company. Texas Southern Electric. Texas Gas and
Electric Company, Texas Central Power Company,
and now Central Power and Light Company.
(Signed) O. T. McAlister 11948)
The electric distribution system of Cuero andsurrounding rural area is now owned by the city of

Cuero. Electric requirements are purchased from lowerColorado River Authority through delivery contractswith Central Power and Light Company.
The Cuero hydroelectric powerplant was typical ofearly Texas power developments in being a low-headrun·of·river installation. The flow of the river at theCuero plant was partly regulated by releases fromCanyon Reservoir near New Braunfels after impoundment of water in that reservoir began June 16, 1964.
A special act of the Texas legislature granted theCuero Light and Power Company (now owned by theCentral Power and Light Company) a 50-year leaseeffective January 1, 1914, to all water rights in and tothe Guadalupe River, in DeWitt County, belonging tothe State of Texas. The lease was granted "provided theCompany will not construct a greater number of dams insaid river than is sufficient to generate 1,800 horse·power."
The Cuero plant, because of its small capacity, wasshut down October 20, 1965, by the Central Power andLight Company, which became owner of the plant underthat name when the company was formed from TexasCentral Power Company on June 11, 1926.
At the time of shutdown, the capacity of theCuero plant was 1,100 kw. This capacity was so small
compared to the system capacity that it was no longereconomical to operate the powerplant.
Physical Description
Each of the three vertical generators was a 375 kw,3 phase, 60 cycle, 2,300 volt, 200 rpm unit manu·factured by Allis-Chalmers Manufacturing Company(Figure 4). Each of the three vertical turbines manufactured by Allis-Chalmers Manufacturing Company wasa fixed blade, propeller type, 200 rpm unit with acapacity of 550 hp at 15·foot head. The turbines werecontrolled by Allis-Chalmers governors. The turbineswere located in an open wheelpit with the flow of waterfrom the forebay controlled by headgates protected bytrashracks.
The design gross head at the Cuero plant was 15feet, and the design water discharge per unit was 360 cfs.
Records of gross monthly generation of electricalenergy at the Cuero Hydroelectric Powerplant for theperiod January 1929 to October 1965 have beenfurnished by the Central Power and Light Company andare given in the table following. Records for years before1929 are not available.
·12·

- 13 -
"C:J-.,

-l>
Gross generation of electrical energy at Cuero Hydroelectric Powerplant. in Hegawatthours
YEAR JANUARY FEBRUARY MARCH APRIL MAY JUNE JULY AUGUST SEPTEMBER OCTOBER rlOVEMBER DECEMBER TOTAL
1929 310 284 256 320 342 342 470 463 305 214 356 336 3,998
1930 346 351 295 315 375 438 382 240 197 393 397 383 4.112
1931 377 504 433 596 474 569 459 378 248 268 280 346 4.932
1932 397 424 524 470 446 371 432 480 448 482 399 373 5,246
1933 510 494 417 439 384 410 243 325 336 282 263 255 4,358
1934 383 518 360 540 443 326 219 321 233 231 281 340 4,195
1935 327 340 313 350 252 228 535 549 420 460 543 454 4,771
1936 520 496 472 431 386 413 105 510 442 332 562 555 5.224
1937 595 602 446 574 486 442 490 350 31\ 319 336 388 5,339
1938 344 505 510 444 207 551 450 382 330 286 333 333 4.675
1939 394 371 310 319 365 291 300 224 199 251 279 272 3.582
1940 287 327 304 410 360 413 387 213 182 225 283 218 3,609
1941 509 424 372 448 71 254 479 547 513 543 524 477 5,161
1942 454 453 374 400 523 520 362 442 400 441 572 582 5.532
1943 580 534 436 530 405 519 400 358 376 346 329 344 5,157
1944 471 523 426 585 522 408 558 421 489 454 444 502 5.803
1945 488 474 452 403 592 576 490 390 350 509 419 451 5.594
1946 499 498 448 576 545 543 445 332 384 429 455 520 5,674
1947 460 551 504 556 586 509 463 374 356 304 322 355 5,340
1948 346 386 351 307 358 257 383 183 202 220 222 229 3,443
1949 261 315 374 364 432 509 371 348 302 276 382 373 4.307
1950 368 423 320 367 390 382 307 212 201 199 196 219 3.584

'"
Gross generation of electrical energy at Cuero Hydroelectric Powerplant, in Hegawatthours--Continued
YEAR JANUARY FEBRUARY HARCH APRIL HAY JUNE JULY AUGUST SEPTEHBER OCTOBER tlOVEHBER DECEHBER TOTAL
1951 235 240 211 284 277 332 172 101 134 136 159 178 2,459
1952 177 187 173 244 217 334 240 93 201 388 300 412 2,966
1953 458 418 338 310 365 202 165 130 343 245 336 353 3,663
1954 325 277 203 223 251 146 58 32 44 41 98 110 1,808
1955 148 210 174 144 179 218 97 82 45 25 28 91 1,441
1956 94 119 66 50 78 6 3 3 2 0 2 102 525
1957 36 128 300 230 373 373 336 158 119 315 383 552 3,303
1958 402 369 404 537 412 531 526 371 384 560 518 567 5,581
1959 536 492 528 378 490 412 481 368 315 429 498 510 5,437
1960 568 537 547 509 453 290 522 480 488 245 332 456 5,427
1961 360 302 533 571 519 345 507 484 368 437 407 543 5,377
1962 430 380 388 397 349 372 246 133 311 328 308 398 4,040
1963 342 326 333 348 262 187 154 85 99 128 230 244 2,738
1964 244 348 389 302 222 254 134 108 267 384 373 280 3,305
1965 248 154 396 405 195 265 280 106 105 65 -- -- 2,219
Total 13,830 14,284 13,689 14,674 13,586 13,538 12,651 10,775 10,449 11,190 12 ,149 13,101 153,916
Monthly andannual average 377 393 369 396 372 369 344 296 287 309 338 364 4,214
1929-64
Monthly averagEin percent of 9.0 9.3 8.8 9.4 8.8 8.8 8.2 7.0 6.8 7.3 8.0 8.6 100annual averagE
1929-64
Location
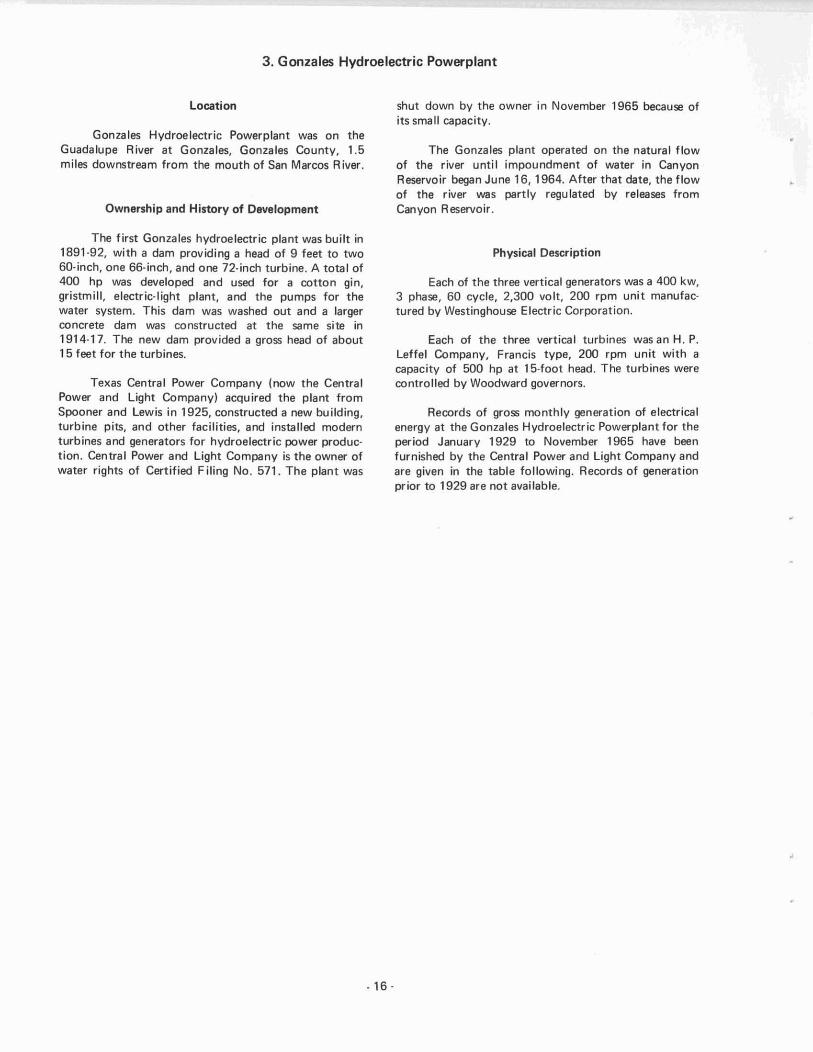
3. Gonzales Hydroelectric Powerplant
shut down by the owner in November 1965 because ofits small capacity.
Gonzales Hydroelectric Powerplant was on theGuadalupe River at Gonzales, Gonzales County. 1.5miles downstream from the mouth of San Marcos River.
Ownership and History of Development
The first Gonzales hydroelectric plant was built in1891·92. with a dam providing a head of 9 feet to two50-inch, one 56·inch, and one 72·inch turbine. A total of400 hp was developed and used for a cotton 9in.gristmill, electric-light plant, and the pumps for thewater system. This dam was washed out and a largerconcrete dam was constructed at the same site in1914-17. The new dam provided a gross head of about15 feet for the turbines.
Texas Central Power Company (now the CentralPower and Light Company) acquired the plant fromSpooner and Lewis in 1925, constructed a new building,turbine pits, and other facilities, and installed modernturbines and generators for hydroelectric power production. Central Power and Light Company is the owner ofwater rights of Certified Filing No. 571. The plant was
- 16 -
The Gonzales plant operated on the natural flowof the river until impoundment of water in CanyonReservoir began June 16, 1964. After that date. the flowof the river was partly regulated by releases fromCanyon Reservoir.
Physical Description
Each of the three vertical generators was a 400 kw,3 phase. 60 cycle. 2,300 volt. 200 rpm unit manufactured by Westinghouse Electric Corporation.
Each of the three vertical turbines was an H. P.Leffel Company. Francis type, 200 rpm unit with acapacity of 500 hp at 15-foot head. The turbines werecontrolled by Woodward governors.
Records of gross monthly generation of electricalenergy at the Gonzales Hydroelectric Powerplant for theperiod January 1929 to November 1965 have beenfurnished by the Central Power and Light Company andare given in the table following. Records of generationprior to 1929 are not available.

'"
Gross generation of electrical energy at Gonzales Uydroelectric Powerplant, in Hegawatthours
YEAR JANUARY FEBRUARY MARCH APRIL MAY JUNE JULY AUGUST SEPTEMBER OCTOBER NOVEMBER DECEMBER TOTAL-
1929 275 251 242 309 321 233 475 435 347 277 325 302 3,792
1930 301 230 262 282 348 384 334 205 179 336 345 335 3,541
1931 346 458 444 445 290 540 484 369 289 239 271 371 4,546
1932 383 412 526 431 462 348 412 444 408 443 370 355 4,994
1933 493 453 401 420 360 390 236 310 321 268 254 239 4,145
1934 338 490 361 488 387 308 218 288 210 189 244 240 3,761
1935 242 318 266 283 301 271 478 467 403 433 453 406 4,321
1936 474 44D 413 388 361 424 215 514 399 338 526 547 5,039
1937 550 554 423 533 431 408 462 330 298 313 363 415 5,080
1938 538 548 538 475 337 578 444 407 373 328 355 355 5,276
1939 412 385 336 337 369 298 301 265 228 272 297 280 3,780
1940 314 329 309 399 374 426 412 275 236 220 284 323 3,899
1941 561 454 428 400 150 399 516 576 525 547 524 472 5,552
1942 468 454 378 435 553 507 376 423 386 413 543 585 5,521
1943 584 515 435 520 405 499 406 360 394 352 344 352 5,166
1944 468 565 428 566 505 390 541 421 473 467 440 480 5,744
1945 529 447 409 394 560 592 466 402 368 526 458 490 5,541
1946 549 569 493 556 518 520 433 352 388 403 458 505 5,744
1947 462 559 535 544 552 490 427 368 303 288 310 335 5,173
1948 341 357 334 300 312 253 364 160 207 226 225 232 3,311
1949 258 303 361 367 446 480 366 331 291 250 371 338 4,162
1950 339 402 314 346 396 372 294 196 209 211 190 211 3,480

!Xl
Gross generation of electrical energy at Gonzales Hydroelectric PO\"lerplant, in tleoawatthours--Continued
YEAR JANUARY FEBRUARY MARCM APRI L MAY JUNE JULY AUGUST SEPTEMBER OCTOBER IlOVEMBER DECEMBER TOTAL
1951 227 231 201 270 259 310 161 102 138 138 13. 1.9 2,3'9
1952 172 175 160 231 196 312 180 9. 193 3.9 270 .03 2.735
1953 .65 39. 309 288 329 165 147 110 328 238 306 316 3.395
1954 292 255 186 182 208 72 59 38 3D 49 109 122 1.602
1955 146 188 155 125 173 171 98 68 43 38 35 83 1,323
1956 96 106 67 43 64 14 12 15 7 1 16 65 506
1957 35 102 229 206 375 375 294 149 129 318 385 507 3,104
1958 .32 360 369 382 382 476 476 333 373 529 470 538 5,120
1959 514 455 509 429 524 373 471 57 298 .36 442 485 4,993
1960 558 511 517 470 452 286 489 429 451 266 340 376 5.145
1961 407 266 483 506 469 322 468 432 352 382 363 406 •• 856
1962 385 347 354 358 314 336 229 139 133 413 257 329 3.594
1963 298 284 235 307 246 160 124 69 89 131 177 202 2.372
1964 209 286 318 265 198 212 125 100 209 309 383 149 2.763
1965 2.8 269 478 439 294 .07 .15 220 189 188 165 -- 3.312
Total 13.709 13,722 13.254 13.719 13.221 13.101 12.408 10.253 10.197 11.020 11,817 12.316 148.737
110nth I y and324 342 ',0.0annual average 374 374 355 369 359 352 333 279 278 301
1929-64
Monthly averagein percent of
9.2 9.3 8.8 9.1 8.9 8.7 8.2 6.9 6.9 7.5 8.0 8.5 100annua I ave rage1929-6.

location
4. Dunlap (TP-l) Hydroelectric Power plant
Physical Description
Dunlap (TP-l) Hydroelectric Powerplant is about2 miles below Tp·1 Dam (Lake Dunlap) on theGuadalupe Aiver and 7 miles northwest of Seguin,Guadalupe County.
Ownership and History of Development
The project is one of six hydroelectric powerplantsthat are owned and operated by the Guadalupe-BlancoRiver Authority on the Guadalupe River. These powerplants are Dunlap (TP-l), McOueeney (TP-3), Seguin(TP·41, Nolte (TP·5), H-4 Dam, and H·5 Dam.
The powerplants were authorized by the followingwater rights from the State Board of Water Engineers:Permit No. 21 (Application No. 21), dated July 25,1914, which granted an appropriation not to exceed1,300 cfs, continuously, from the Guadalupe River, forthe purpose of hydroelectric power development, to theGuadalupe Water Power Company (now owned by theGuadalupe-Blanco River Authority); and Permit No.1096 (Application No. 1163), dated June 12, 1929,which granted an appropriation not to exceed 941,200acre·feet of water per annum for power developmentpurposes to the Hunt Development Company (nowowned by the Guadalupe-Blanco River Authority).
Construction of TP-l Dam began in 1927 and wascompleted in 1928, with impoundment of water andgeneration of power beginning at that time.
The output from this and the other five plants issold to Central Power and Light Company and deliveredthrough necessary switches and transformers to the highvoltage transmission system supplying power to the area.
At the end of December 1967, this plant was inthe process of conversion to complete automatic opera·tion. The control center and necessary equipment arelocated in the office building of the Guadalupe-BlancoRiver Authority in Seguin.
·19·
Two 1,800 kw generating units at Dunlap (TP.1)Hydroelectric Powerplant provide a total generatingcapacity of 3,600 kw.
Each of the two vertical generators is a 1,800 kw,3 phase, 60 cycle, 2,400 volt, 180 rpm unit with a directconnected exciter. The generators and control equipment were furnished by the General Electric Company.
Each of the two vertical turbines is a James Leffeland Company, 180 rpm, Francis type, with a capacity of2,800 hp at 46.0·foot head.
At this plant, each turbine is installed in an openwheelpit equipped with trashracks and headgates.
Water discharged from the Dunlap HydroelectricPowerplant is subsequently used by downstream plants,each plant storing water during low-flow periods for useduring the time of peak power requirements. Maximumwater discharge per unit at full load is 625 cfs.
An intake structure at the dam controls flow tothe 2-mile long diversion canal to the powerhouse.Additional powcrhead is gained by the use of this canal.
Forebay water level is at elevation 573 feet abovemsl. Tailwater elevation is 527 feet above msl. Grosshead for the turbine is 46 feet. One-foot high flashboards provide additional head.
The Dunlap powerplant was a run-of-river plantuntil June 16, 1964, when storage began in CanyonReservoir near New Braunfels. After that date, the flowof the river was partly regulated by releases fromCanyon Reservoir. Water releases from Lake Dunlap areoontrolled by the operation of the turbines whilegenerating power, and by spillway gates.
Records of gross monthly generation of electricalenergy at the Dunlap (TP-l) Hydroelectric Powerplantfor the years 1929·67 have been furnished by theGuadalupe-Blanco River Authority and are given in thetable following.

'"o
Gross generation of electrical energy at Dunlap (TP-I) Hydroelectric Powerplant, in Hegawatthours
YEAR JANUARY FEBRUARY MARCH APRIL MAY JUNE JULY AUG~ST SEPTEMBER OCTOBER rlOVEMBER DECEMBER TOTAL
1929 821 647 773 909 1,189 1,566 1,617 874 739 714 746 814 11,409
1930 775 709 759 707 1,560 1,328 863 639 581 1,432 1,043 1,112 11,508
1931 1,528 1,995 2,198 1,984 2,169 1,644 1,490 1,215 921 898 948 1,059 18,049
1932 1,383 1,330 ',729 1,347 1,500 992 100 0 1,185 1,462 1,159 1,285 13,472
1933 1,602 1,263 1,388 1,190 1,271 985 898 870 833 814 797 844 12,755
1934 1,135 1,031 1,379 1,505 1,056 755 867 774 691 682 761 855 11,491
1935 832 965 874 820 1,825 1,636 2,070 1,598 2,000 1,929 1,487 1,705 17,741
1936 1,533 1,274 1,390 1,172 1,558 1,724 2,294 1,643 1,735 2,291 2,078 2,061 20,753
1937 1,964 1,660 2,036 1,638 , ,328 1,794 1,277 974 922 1,015 955 1,439 17,002
1938 1,843 1,818 1,641 1,705 2,185 1,465 1,136 974 901 893 869 929 16,359
1939 1,036 851 922 868 877 714 906 796 666 971 772 807 10,186
1940 825 836 976 1,291 1,290 1,394 1,132 799 689 747 1,102 1,756 12,837
1941 1,419 2,056 2,436 2,266 2,571 1,992 2,114 1,537 1,525 1,876 1,429 1,357 22,578
1942 1,259 1,108 1,147 1,686 2,146 1,378 1,366 1,017 1,782 2,075 1,874 1,751 18,589
1943 1,546 1,236 1,320 1,319 1,198 1,484 1,276 953 1,038 966 882 966 14,184
1944 1,442 1,547 2,341 1,855 2,295 2,073 1,573 1,234 1,617 1,362 1,281 1,990 20,610
1945 2,196 2,356 2,603 2,471 1,952 1,524 1,349 1,094 1,011 1,760 1,203 1,/197 21,016
1946 1,536 1,566 1,958 1,528 1,861 1,588 1,127 948 1,538 2,065 2,328 2,298 20,341
1947 2,258 2,322 2,192 1,974 1,915 1,477 1,266 1,122 934 903 889 967 18,219
1948 926 900 943 849 887 899 863 614 619 708 632 683 9,523
1949 744 843 1,324 1,425 1,801 1,236 939 986 837 984 860 897 12,876
1950 900 1,022 942 954 1,087 964 813 608 618 618 588 640 9,754

'"~
Gross generation of electrical energy at Dunlap (TP-l) Hydroelectric Powerplant. in 'lega\vatthours--Continued
YEAR JANUARY FEBRUARY MARCH APRIL MAY JUNE JULY AUGUST SEPTEMBER OCTOBER /lOVEMBER DECEMBER TOTAL
1951 639 599 710 677 908 864 472 384 412 419 443 514 7,041
1952 515 462 512 745 851 912 447 309 1,181 768 718 1,217 8,637
1953 1,320 829 804 729 575 353 359 326 1,091 785 699 838 8,70B
1954 685 528 485 427 570 301 224 163 155 249 324 320 4,431
1955 383 454 359 265 565 298 411 182 128 137 145 245 3,572
1956 251 256 185 96 73 10 9 7 24 0 43 122 1,076
1957 121 162 539 1,035 1,964 1,835 791 381 357 1,799 2,320 2,169 13,973
1958 2,581 2,342 2,701 2,371 2,556 2,027 1,622 1,093 1,183 1,761 2,315 1,867 24,419
1959 1,655 1,532 1,582 1,755 1,516 1,310 1,506 1,099 920 1,921 1,498 1,481 17,775
1960 1,805 1,738 1,588 1,577 1,455 1,195 1,276 1,898 1,407 1,418 2,564 2,612 20,533
1961 2,743 2,423 2,697 2,009 1,520 1,644 1,696 1,315 1,090 1,189 1,215 1,180 20,721
1962 1,103 965 1,008 1,031 961 1,033 661 476 694 775 787 931 10,425
1963 836 770 822 976 723 507 439 324 335 451 630 632 7,445
1964 640 879 1,054 804 625 700 436 381 686 1,312 1,206 800 9,523
1965 821 1,116 1,343 1,146 1,736 1,610 1,439 886 1,053 1,072 1,134 1,234 14,590
1966 1,547 1,559 1,735 1,571 1,381 1,542 1,331 1,059 1,390 1,384 1,104 861 16,464
1967 846 704 758 699 608 357 356 400 1,148 1,693 1,997 1,425 10,991
Total 47,994 46,653 52,153 49,376 54, lOB 47,110 1"0,811 31,952 37,136 44,298 43,825 46,160 541,576
Monthly and1,184 13 ,886annual average 1,231 1,196 1,337 1,266 1,387 1.208 1,046 819 952 1,136 1,124
1929-67
Monthly averagein percent of 8.9 8.6 9.6 9.1 10.0 8.7 7.5 5.9 6.9 B.2 8.1 8.5 100annua I ave rage
1929-67

5. McQueeney (TP-3) Hydroelectric Powerplant
Location
McQueeney (TP·3l Hydroelectric Powerplant is atAbbott Dam (Lake McQueeney) on the Guadalupe River5 miles northwest of Seguin, Guadalupe County.
Ownership and History of Development
The project is one of six hydroelectric powerplantsbeing operated by the Guadalupe-Blanco RiverAuthority on the Guadalupe River. These powerplantsare Dunlap (TP-1J, McQueeney (TP-3I, Seguin ITP-4I,Nolte ITP-5). H-4 Dam. and H-5 Dam_
The powerplants were authorized by the followingwater rights from the State Board of Water Engineers:Permit No_ 21 (Application No. 211, dated July 25,1914, which granted to the Guadalupe Water PowerCompany (now owned by the Guadalupe-Blanco RiverAuthority) an appropriation not to exceed 1,300 cfs,continuously, from the Guadalupe River, for the purpose of hydroelectric power development; and PermitNo_ 1096 (Application No_ 11631. dated June 12, 1929.which granted to the Hunt Development Company (nowowned by the Guadalupe-Blanco River Authority) anappropriation not to exceed 941,200 acre-feet of waterper annum for power development purposes.
Construction of Abbott Dam began in 1927 andwas completed in 1928, with impoundment of water andbeginning of power generation occurring at that time.
The output from this and the other five plants issold to Central Power and Light Company and deliveredthrough necessary switches and transformers to the highvOltage transmission system supplying power to the area.
At the end of December 1967, this plant was inthe process of conversion to complete automatic operation. The control center and necessary equipment islocated in the office building of the Guadalupe-BlancoRiver Authority in Seguin.
- 22-
Physical Description
Two 1,400 kw generating units at McQueeneyITP-31 powerplant give a total capacity of 2,800 kw(Figure 5)_
Each of the two vertical generators is a 1,400 kw,3 phase. 60 cycle, 2,400 volt. 164 rpm unit with a directconnected exciter. The generators and control equip·ment were furnished by the General Electric Company.
Each of the two vertical turbines is a James Leffeland Company, 164 rpm, Francis type, with a capacity of2.200 hp at 31.0-foot head_ Each unit is controlled by aWoodward governor.
At this plant, each turbine is installed in an openwheelpit equipped with trashracks and head gates.
Forebay water level is at elevation 528.7 feetabove msl and tailwater is at elevation 497.7 feet abovemsl, giving gross head of 31.0 feet.
Maximum water discharge per unit at full load is650 cfs_
Water release is controlled by operation of theturbines and by spillway gates. McQueeney was arun-of-river plant until June 16, 1964, when storagebegan in Canyon Reservoir near New Braunfels. Afterthat date, the flow of the river was partly regulated byreleases from Canyon Reservoir. Water dischargedthrough the McQueeney plant is stored by the down·stream powerplants during low-flow periods for useduring the time of peak power requirements.
Records of gross monthly generation of electricalenergy at the McQueeney (TP-3) Hydroelectric Powerplant for the years 1929·67 have been furnished by theGuadalupe-Blanco River Authority and are given in thetable following_

·23·

'"A
Gross generation of electrical energy at McQueeney (TP-3) Hydroelectric Powerplant, in Megawatthours
YEAR JANUARY FEBRUARY MARCH APRIL MAY JUNE JULY AUGUST SEPTEMBER OCTOBER tlOVEHBER DECEMBER TOTAL
1929 462 354 444 554 768 957 1,087 526 476 398 428 459 6,913i
1930 433 398 409 369 1,011 822 475 328 286 919 637 689 6,776
1931 956 1,238 1,371 I ,269 1,417 1,081 1,075 819 621 606 627 706 11,786
1932 919 880 1,175 881 990 643 1,359 864 872 976 774 855 11,188
1933 1,052 833 909 785 836 648 585 566 562 549 530 551 8,406
1934 739 673 880 965 696 505 574 413 467 469 509 581 7,571
1935 563 645 572 548 1,078 1,074 1,354 1,034 1,193 I ,259 975 1,132 11,427
1936 1,014 840 922 778 921 1,150 1,330 1,082 1,068 1,459 1,440 1,390 13,394
1937 1,304 1,091 I' ,349 1,073 860 1,182 858 677 633 693 662 967 11,349
1938 1,299 I .246 I 1,099 1,169 1,494 990 775 668 630 598 596 643 11,207
1939 705 581 627 585 600 479 608 534 454 649 526 546 6,894
1940 556 561 650 855 855 926 763 523 453 487 755 1,056 8,440
1941 938 1,253 1,290 1,384 1,166 1,481 1,307 1,000 970 1,203 946 903 13,841
1942 837 734 756 1,065 1,338 903 892 682 1,145 1,295 1,253 1,166 12,066
1943 1,034 818 877 867 773 969 835 610 684 633 586 645 9,33 I
1944 958 1,023 1,590 1,213 1,454 1,3 I3 1,040 801 1,038 890 860 1,333 13.513
1945 1,302 1,123 1,202 1,231 1,298 1,014 890 722 666 1,118 794 1,000 12,360
1946 1,039 1,028 1,282 1,044 1,242 1,075 748 645 981 1,354 1,245 1,340 13,023
1947 1,377 1,154 1,408 1,272 1,271 988 843 742 605 594 602 657 11,513
1948 631 609 642 569 586 592 573 403 412 478 432 468 6,395
1949 512 586 915 983 1,2 J3 834 644 669 562 683 591 619 8,811
1950 612 692 635 655 735 641 546 406 419 421 405 440 6,607

'"'"
Gross generation of electrical energy at McQueeney (TP-3) Hydroelectric Powerplant, in Megawatthours--Continued
YEAR JANUARY FEBRUARY MARCM APRil MAY JUNE JULY AUGUST SEPTEMBER OCTOBER NOVEMBER DECEMBER TOTAL
1951 442 415 489 461 611 577 302 250 273 279 296 343 4,738
1952 340 306 339 489 510 593 292 197 759 521 483 827 5,656
1953 874 563 543 519 390 242 239 225 720 532 471 563 5,881
1954 469 362 337 299 384 203 149 108 104 171 221 220 3,027
1955 262 315 258 186 376 204 275 120 89 96 104 173 2,458
1956 178 179 133 72 54 12 8 10 19 4 3D 112 811
1957 91 127 377 651 1,280 1,157 509 249 550 1,060 1,254 1,342 8,647
1958 1,723 1,549 1,826 1,550 1,662 1,361 1,059 713 1,064 1,377 1,566 1,248 16,698
1959 1,107 1,029 1,055 1,180 1,019 872 998 723 606q 1,238 957 971 11,755
1960 1,193 1,144 1,058 1,038 960 790 889 1,249 934 1,189 1,703 1,754 13,901
1961 1,840 I ,632 1,789 1,323 1,001 1,080 1,120 859 722 788 817 799 13,770
1962 756 659 688 705 652 687 439 320 477 523 531 630 7,067
1963 575 529 557 658 502 344 439 210 218 299 427 427 5,185
1964 433 592 708 536 413 463 269 243 461 855 861 526 6,360
1965 539 779 900 775 I ,161 1,074 951 592 696 726 765 875 9,833
1966 1,023 1,030 1,135 1,031 912 1,004 869 701 909 904 724 573 10,815
1967 563 474 509 461 401 226 225 259 774 1,116 1,313 936· 7,257
Total 31,650 30,044 33,705 32,048 34,890 31,156 28,193 21,842 24,572 29,409 28,696 30,465 356,670
Honthly andannual average 811 770 864 822 895 799 723 560 630 754 736 781 9,145
1929-67
Monthly averagEin percent of 8.9 8.4 9.5 9.0 9.8 8.7 7.9 6.1 6.9 8.2 8.1 8.5 100annual average
1929-67

Location
6. Nolte (TP-5) Hydroelectric Powerplant
Physical Description
Nolte (TP·5) Hydroelectric Powerplant is about2.5 miles (channel distance) below Tp·5 Dam (LakeNolte) on the Guadalupe River. and 3 miles southeast ofSeguin, Guadalupe County.
Ownership and History of Development
The project is one of six hydroelectric powerplantsbeing operated by the Guadalupe·Blanco RiverAuthority on the Guadalupe River. These powerplantsare Dunlap (TP-1), McQueeney (TP-31. Seguin (TP·41.Nolte (TP-5), H·4 Dam, and H-5 Dam.
The powerplants were authorized by the followingwater rights from the State Board of Water Engineers:Permit No. 21 (Application No. 21), dated July 25.1914, which granted an appropriation to the GuadalupeWater Power Company (now owned by the GuadalupeBlanco River Authority) of not more than 1,300 cis,oontinuously, from the Guadalupe River, for hydroelectric power development; and Permit No. 1096(Application No. 11631, dated June 12, 1929, whichgranted an appropriation to the Hunt DevelopmentCompany (now owned by the Guadalupe-Blanco RiverAuthority) of not more than 941,200 acre-feet of waterper annum for hydroelectric power development.
Construction began early in 1927 and was com·pleted in November 1927, with impoundment of waterand generation of power beginning at that time (F igure6).
The output from this and the other five plants issold to Central Power and Ught Company and deliveredthrough necessary switches and transformers to the highvoltage transmission system supplying power to the area.
At the end of December 1967, this plant was inthe process of conversion to complete automatic operation. The control center and necessary equipment arelocated at the office building of the Guadalupe-BlancoRiver Authority in Seguin.
Two 1,240 kw generating units at Nolte (TP-5)Hydroelectric Powerplant provide a total capacity of2,480 kw (F igure 7).
Each of the two vertical generators is a 1,240 kw,3 phase, 60 cycle, 2,400 volt, 150 rpm unit with a directconnected exciter. The generators and control equipment were furnished by the General Electric Company.
Each of the two vertical turbines is a James Leffeland Company, 150 rpm, Francis type, with a capacity of1,950 hp at 27.0-foot head. Each unit is controlled by aWoodward governor. At this plant, each turbine isinstalled in an open wheelpit equipped with trash racksand headgates.
Water releases from Lake Nolte are controlled bythe operation of the turbines while generating power,and by spillway gates. Water discharged from upstreamplants may be stored during periods when the powerload is light and used during the time of peak powerrequirements. Maximum water discharge per unit at fullload is 650 cis.
An intake structure on the left bank of the damoontrols flow to the 1.5-mile long diversion canal to thepowerhouse. Additional power head is gained by the useof this canal.
Design headwater elevation (without flashboards)is at elevation 457.6 feet above msl and the tailwaterelevation is at 430.6 feet above msl, giving a gross headof 27.0 feet. Two-foot high flashboards can be added for2 feet more head.
The Nolte plant was a run-of-river plant until June16, 1964, when impoundment of water began in CanyonReservoir near New Braunfels. After that date, the riverflow was partly regulated by releases from CanyonReservoir.
Records of gross monthly power generation at theNolte Plant for the years 1929-67 were furnished by theGuadalupe-Blanco River Authority and are given in thetable following.
·26·

Figure 5.··Nolte (TP·5) Hydroelectric Powerplant.
Figure 7.··Two 1,240 kw generators at Nolte ITP·5) Hydroelectric Powerplant.
- 27·

'"<Xl
Gross generation of electrical energy at Nolte (TP-S) Hydroelectric Powerplant, in Megawatthours
YEAR JANUARY fEBRUARY MARCH APRIL MAY JUNE JULY AUGUST SEPTEMBER OCTOBER tlOVEMBER DECEMBER TOTAL
1929 _35 333 399 -9- 508 752 866 _63 397 377 38_ _13 5,821
1930 392 371 389 360 8_7 705 "0 315 281 7_6 551 583 5,980
1931 8_1 1,1_5 1,227 1,021 1,167 863 8_9 619 _50 _58 _78 561 9,679
1932 756 686 9'" 698 79- -95 68_ 663 668 732 595 670 8,355
1933 8_5 668 7-9 606 662 502 382 361 379 3_D 3" 365 6,200
193_ 588 552 725 818 521 288 3_8 299 252 227 322 392 5,332
1935 382 -99 _06 370 889 9_8 1,062 791 950 979 761 899 8,936
1936 798 677 738 613 73- 876 1,032 833 751 997 1,077 1,085 iO ,211
1937 1,022 8_0 1,058 852 860 932 665 _89 ..- 506 _8_ 788 8,9_0
1938 1,077 1,01_ 915 917 987 799 589 -79 "3 393 "7 _67 8,_97
1939 539 _2_ -55 "3 _07 281 396 321 2_9 ..8 351 383 _,667
19_0 392 "6 _81 695 672 730 578 322 268 312 60_ 879 6,3_9
19" 767 929 1,076 869 939 1,0_1 1,860 800 79- 1,006 760 726 11,567
19_2 670 602 592 920 1,16_ 738 719 529 913 1,13_ 1,009 93- 9,92-
19_3 831 659 699 696 63_ 801 682 _69 59-_83 _50 _9 _
7,492
19" 807 856 1,381 1,006 1,21_ l,i87 835 65_ 877 7_0 686 1,125 11,368
19_5 1,0_2 925 1,000 1,015 1,065 809 703 5-7 _90 926 639 819 9,980
19_6 8_0 8_5 1,065 8_4 1,044 910 588 510 832 1,178 1,017 1,136 10,809
19_7 1,248 968 1,219 1,045 1,071 810 682 60\ _63 456 460 508 9,531
1948 489 479 493 435 450 446 _28 252 273 350 320 357 4,772
1949 _03 48_ 783 845 1,0_0 700 525 513 449 573 488 509 7,312
1950 506 579 517 545 596 527 422 258 279 277 268 301 5,075
•

'"<D
Gross generation of electrical energy at Nolte (TP-S) Hydroelectric Powerplant, in Megawatthours--Continued
YEAR JANUARY FEBRUARY MARCH APRIL MAY JUNE JULY AUGUST SEPTEMBER OCTOBER NOVEMBER DECEMBER TOTAL
1951 312 298 364 332 477 451 172 124 159 149 174 232 3.244
1952 236 217 239 379 385 473 188 103 608 409 366 650 4,253
1953 692 441 413 401 283 142 133 136 585 422 372 445 4,465
1954 360 273 246 202 297 116 73 38 42 85 117 119 1.968
1955 159 234 185 113 266 131 176 56 36 39 52 96 1.543
1956 95 96 66 26 24 0 0 0 I 0 30 32 370
1957 32 73 286 492 1.076 932 395 161 425 858 1,018 1,108 6,856
1958 1.474 1,290 1.563 1,302 1.329 1.112 830 554 849 1.136 1.268 980 13.687
1959 869 814 829 947 817 683 826 577 476 951 749 781 9.319
1960 947 901 830 827 752 603 709 997 721 ]14 1.401 1.498 10.900
1961 1.596 1.382 1,511 1.063 797 862 934 692 577 637 651 643 11.345
1962 607 528 547 571 504 545 312 215 344 399 406 472 5.450
1963 431 405 426 509 384 251 196 128 137 210 341 340 3.758
1964 350 484 579 431 317 366 194 186 378 700 692 427 5,104
1965 454 684 732 636 926 841 740 462 541 593 618 731 7.958
1966 855 868 966 883 775 842 700 570 736 735 595 467 8.992
1967 455 382 412 367 305 150 116 155 617 920 1.049 772 5.700
Total 25.594 24,321 I:n .475 5.558 27.979 24.640 2,029 16.242 18,728 22,595 22.361 24,187 281,709-
Monthly andannual average 656 624 705 655 717 632 565 417 480 579 573 620 7,223
1929-67
Monthly averagein percent of 9.1 8.6 9.8 9.1 9.9 8.8 7.8 5.8 66.6 8.0 7.9 8.6 100annual average
1929-67

Location
7. Devils Lake Hydroelectric Powerplant
Physical Description
Devils Lake Hydroelectric Powerplant was atDevils Lake Dam on the Devils River in the Rio Grandebasin, 16 miles northwest of Del Rio, Val Verde County.
Ownership and History of Development
The powerplant was built, owned, and operated byCentral Power and Light Company. The plant was shutdown by owner December 20, 1965, because ofapproaching inundation by Amistad Reservoir on theRio Grande.
The project was authorized by Permit No. 1049(Application No. 1125), dated November 2, 1927,granted by the State Board of Water Engineers to JamesC. Kennedy and subsequently transferred to the CentralPower and Light Company. The permit authorized theuse of water for hydroelectric power development at arate not to exceed 550 cfs. The usual flow of DevilsRiver is less than this amount most of the time.
In the 1920's, the Central Power and LightCompany decided to develop the power potential of theDevils River, and built two dams and two powerplants:the Devils Lake project completed in 1928 and the LakeWalk project completed in 1929.
Construction of the Devils Lake Dam was begun in1927 and was completed in December 1928, withimpoundment of water and power generation beginningat that time.
The Devils River, a tributary of the Rio Grande,has perennial streamflow in its lower reaches. The DevilsLake plant used the total flow of the river except duringflood runoff. Although the Devils River watershed is inan area of relatively light annual rainfall, extremely largefloods have occurred, notably in 1932,1948, and 1954.Each of these floods damaged the powerplant.
- 30·
The Devils Lake Hydroelectric Powerplant had one1,800 kw generating unit. The generator was connectedto the transmission system supplying the area withelectric service.
The vertical generator with a direct connectedexciter was a 1,800 kw, 3 phase, 60 cycle, 2,300 volt,180 rpm unit manufactured by the Westinghouse Electric Corporation.
The vertical turbine was an S. Morgan Smith, 180rpm, Francis type unit with a capacity of 2,520 hp at42.25-foot head. The unit was controlled by aWoodward governor.
Forebay design water level was at elevation1,042.25 feet above msl. Design tailwater elevation was1,000.0 feet above msl. Gross head for the turbine was42.25 feet. During the early period of operation,5·foot·high wood flash boards were installed on thedam to increase the operating head. Due to frequentdestruction by floodwater these flash boards were notused during the later period of operation.
The only outlet from Devils Lake was a penstockto the turbine, controlled by headgate operated from aplatform upstream from the powerhouse. This plantdischarged water into Lake Walk immediately downstream and the Lake Walk plant regulated the requireddownstream flow.
Figure 8 is a view of the dam and the plant onDecember IS, 1964. The powerhouse was rebuilt shortlyafter being partly destroyed by the 1932 flood. Figure 9is a view of the interior of the powerplant.
Records of gross monthly power generation at theDevils Lake plant for the years 1930.65 were furnishedby the Central Power and Light Company and are givenin the table following.

Figure B.--Devils Lake Dam and Hydroelectric Powerplant,December 15, 1964. Note masonry construction.
Figure 9.--Direct connected exciter mounted above thegenerator at Devils Lake Hydroelectric Powerplant.
- 31 -

w
'"
Gross generation of electrical energy at Devils lake Hydroelectric Powerplant, in Hegawatthours
YEAR JANUARY FEBRUARY MARCH APRIL MAY JUNE JULY AUGUST SEPTEMBER OCTOBER rlOVEMBER OECEMBER TOTAL
1930 545 525 415 587 189 529 591 438 399 887 1,158 1,118 7,381
1931 1,086 1,225 931 924 1,093 1,282 1,168 1,086 952 899 909 854 12,409
1932 808 752 621 607 702 596 722 646 163 768 I ,060 1,029 8,474
1933 1,062 1,070 966 1,059 1,006 1,050 938 885 833 820 778 719 11,186
1934 726 662 561 654 598 780 610 589 632 536 518 480 7,355
1935 485 474 382 504 623 636 963 957 1,007 1,045 1,076 1,031 9,183
1936 1,051 1,028 925 911 899 I ,020 I ,028 988 963 1,040 998 910 11,761
1937 890 850 719 738 672 765 575 576 581 575 586 567 8,094
1938 661 701 571 595 558 526 529 940 780 715 726 703 8,005
1939 714 672 583 600 682 665 593 605 530 534 606 549 7,333
1940 558 536 468 664 654 692 657 708 654 551 568 508 7,218
1941 487 482 412 470 689 629 604 556 596 779 725 634 7,063
1942 618 574 480 560 491 478 484 512 883 807 913 854 7,654
1943 828 725 609 658 657 884 712 620 655 613 57~ 590 8,125
1944 617 545 559 516 503 574 436 406 728 652 558 494 6,588
1945 491 451 383 928 354 333 412 364 337 690 672 562 5,977
1946 522 441 355 409 421 464 600 422 416 647 503 461 5,661
1947 546 505 412 404 425 372 354 374 462 389 386 354 4,983
1948 321 319 276 267 374 314 0 87 776 709 700 621 4,764
1949 578 540 802 729 I ,026 992 889 1,017 1,032 819 0 0 8,424
1950 0 802 679 666 590 579 682 686 614 668 587 527 7,080
195 I 491 447 368 380 383 437 287 308 297 292 332 302 4,324

ww
Gross generation of electrical energy at Devi Is lake Hydroelectric Powerplant. in Mega\O/atthours--Continucd
YEAR JANUARY FEBRUARY MARCM APRIL MAY JUNE JULY AUGUST SEPTEMBER OCTOBER tlOVEMBER DECEMBER TOTAL
1952 300 2B7 253 273 237 406 263 245 244 232 247 250 3,237
1953 246 242 237 216 204 191 IB2 211 396 )54 331 300 3,110
1954 302 276 228 429 5B7 700 21 841 930 827 703 659 6,503
1955 591 462 445 382 393 327 463 526 534 808 646 611 6,18B
1956 535 414 373 306 271 226 207 238 235 289 263 266 3,623
1957 255 236 260 419 956 1,027 984 91B 871 969 939 B63 8,697
1958 B54 757 975 823 B27 854 1,020 953 968 1,045 1,025 1,044 11,145
1959 1,033 913 909 837 922 806 910 856 706 95B 866 799 10,515
1960 760 664 660 5BO 576 517 609 673 5B9 670 669 637 7,604
1961 638 563 54B 458 427 685 914 B64 751 762 699 674 7,QS3
1962 601 482 469 4B7 438 546 509 436 522 666 632 579 6,367
1963 504 421 394 346 534 508 422 36B 333 329 304 303 4,766
1964 321 379 253 276 252 228 205 203 414 1,043 977 926 5,477
1965 B48 683 686 615 512 494 497 439 327 467 412 242 6,222
Total 21,873 21,105 19,167 20,277 20,725 22,112 21,049 21,541 22,110 24, B54 23,646 22,020 260,479
t-tonthly andannual avera~e 608 586 532 563 576 614 585 59B 614 690 657 612 7,235
1930-65
~tonthly averagein percent of 8.4 8.1 7.3 7.8 8.0 8.5 B.l 8.3 8.5 9.5 9.1 8.4 100annual averag,e
1930-65

8. lake Walk Hydroelectric Powerplant
Location
Lake Walk Hydroelectric Powerplant was at LakeWalk Dam on the Devils River in the Rio Grande basin,11 miles northwest of Del Rio, Val Verde County.
Ownership and History of Development
The powerplant was owned and operated by theCentral Power and Light Company. The plant was shutdown by owner December 17, 1965, because ofapproaching inundation by Amistad Reservoir on theRio Grande. The project was named in honor of Sam H.Walk, long time local manager at Del Rio for the CentralPower and Light Company.
The project was authorized by Permit No. 1077(Application No. 1149). dated September 17, 1928,granted by the State Board of Water Engineers to JamesC. Kennedy and subsequently transferred to the CentralPower and Light Company. The permit authorized theuse of water at a rate no t to exceed 550 cfs for thepurpose of hydroelectric power development. The rateof flow of Devils River is less than 550 cfs most of thetime.
The project was started in December 1928, andwas completed in May 1929. Impoundment of waterbegan with closure of Lake Walk Dam in May 1929, andthe generation of power started May 17, 1929. Thepowerplant was damaged by large floods in 1932, 1948,and 1954.
Physical Description
One 1,350 kw generating unit was installed atLake Walk Hydroelectric Powerplant. The turbine usedthe total flow of the river except during flood runoff.The supply of water to this lake was partly regulated bythe operation of the Devils Lake HydroelectricPowerplant upstream. The plant was connected to thetransmission system supplying the area with electricservice. The S. Morgan Smith turbine in this plant wasthe first automatic adjustable blade turbine installed in
·34·
the United States, and was still giving good service at thetime the plant was closed (Dowell, 1929; Dowell and8reeding, 1967). The turbine will be on display atAm istad Dam along with a model of that project andinteresting rocks and Indian relics discovered duringconstruction of Amistad Dam. (The display will be in amuseum to be operated by the National Park Service.)
The adjustable blade settings vary directly andautomatically with gate-opening, resulting in high efficiency at all loads. The main shaft is bored out to permita small shaft, which also has a vertical movement, torotate with it. The lower end of this shaft connects bylevers to the runner blades, rotating them as it moves upor down. The upper end of the shaft connects to apiston in a Servo-motor operated by oil pressure and isin synchronism with the Servo-motor controlling thegate opening. This causes the blade angle to vary witheach change of gate opening.
This generating unit was automatically controlledby a system of relays stopping and starting the unitwhen anyone of a series of events, such as low water,overload, over-voltage, under-voltage, or heating ofbearings, might take place.
The vertical generator was a 1,350 kw, 3 phase, 60cycle, 2,300 volt, 277 rpm unit with a direct connectedexciter manufactured by the Westinghouse ElectricCorporation.
The vertical turbine was an S. Morgan Smithautomatic adjustable blade Kaplan type, 277 rpm, with acapacity of 1,900 hp at 33.0-foot head. The unit wascontrolled by a Woodward governor.
The operating tailwater elevation was 968.0 feetabove msl. Gross head for the turbine was 33.0 feet.
Figure lOis a view of the Lake Walk HydroelectricPowerplant and Dam, December 1964.
Records of gross monthly generation of hydroelectric power at the Lake Walk Plant for the years1930-65 were furnished by the Central Power and LightCompany and are given in the table following.

"'5.~L1.
\
\\
•
·35·

w
'"
Gross generation of electrical energy at Lake \.Jalk Hydroelectric Powerplant, in /1e!1avlatthours
-YEAR JANUARY FEBRUARY HARCH APRIL HAY JUNE JULY AUGUST SEPTEHBER OCTOBER 1l0VE/IBER DECEHBER TOTAL
1930 369 338 290 500 145 410 445 356 257 737 945 830 5,622
1931 797 943 693 697 894 976 873 802 721 691 691 647 9,425
1932 602 568 449 436 515 413 552 486 123 358 1,108 1,035 6,645
1933 1,073 1,037 893 924 844 898 768 739 708 696 636 578 9,794
1934 583 525 440 531 463 656 484 450 529 427 407 366 5,861
1935 375 362 283 406 544 786 797 830 906 I ,000 1,034 986 8,309
1936 955 896 789 767 782 912 959 827 876 957 822 734 10,276
1937 716 698 634 631 547 712 510 460 476 469 379 460 6,692
1938 580 630 500 490 478 414 462 830 675 618 630 593 6,900
1939 612 557 458 478 593 556 468 506 412 411 502 440 5,993
1940 451 411 341 545 552 579 536 590 521 427 430 379 5,762
1941 368 367 314 399 590 497 511 425 491 693 622 525 5,802
1942 499 456 372 430 428 384 367 413 778 719 771 691 6,308
1943 524 444 511 532 543 769 589 520 524 482 437 465 6,340
1944 489 428 445 391 322 0 0 244 616 540 444 396 4,315
1945 420 377 309 335 269 252 316 274 255 609 566 435 4,417
1946 413 340 274 350 334 375 472 316 308 553 387 353 4,475
1947 443 391 323 310 339 280 270 296 371 285 291 278 3,877
1948 248 239 211 180 271 234 0 313 598 547 561 486 3,888
1949 429 417 621 564 820 788 726 806 848 816 859 752 8,446
1950 754 666 525 524 466 414 530 515 471 513 442 382 6,202
1951 368 329 255 274 280 324 192 180 168 171 216 198 2,955

w...
Gross generation of electrical energy at Lake Walk Hydroelectric Powerplant, in Megawatthours--Continued
YEAR JANUARY FEBRUARY HARCH APRIL HAY JUNE JULY AUGUST SEPTEMBER OCTOBER NOVEMBER DECEMBER TOTAL
1952 171 172 147 166 96 224 143 115 132 116 135 142 1,759
1953 133 129 155 103 93 78 65 104 303 245 213 190 1,811
1954 185 150 126 315 424 561 15 40 321 605 529 492 3,763
1955 429 316 298 242 264 194 313 376 390 614 465 431 4,332
1956 374 264 238 190 158 117 94 100 106 141 130 124 2,036
1957 119 118 141 277 794 766 760 713 678 752 731 650 6,499
1958 653 574 737 637 650 640 772 744 727 748 742 768 8,392
1959 790 692 725 645 731 629 701 692 568 778 692 663 8,306
1960 635 543 564 501 447 377 455 512 454 496 149 286 5,419
1961 478 431 395 330 311 518 726 695 613 630 565 544 6,236
1962 495 435 390 375 192 414 364 306 386 510 458 411 4,736
1963 335 279 260 230 382 353 280 260 239 231 215 212 3,276
1964 203 309 216 231 201 176 142 143 306 755 737 726 4,145
1965 656 563 541 458 526 644 583 558 502 498 449 245 6,223
Total 17,724 16,394 14,863 15,394 16,288 17,320 16,240 16,536 17,357 19,838 19,390 17,893 205,237
Monthly andannual average 492 455 413 428 453 481 451 459 482 551 539 497 5,701
1930-65
Monthly averagein percent of 8.6 8.0 7.2 7.5 7.9 8.4 7.9 8.1 8.5 9.7 9.5 8.7 100annual average
1930-65

Location
9. H-4 Dam Hydroelectric Powerplant
Physical Description
H-4 Dam Hydroelectric Powerplant is at H·4 Dam(H-4 Reservoir) on the Guadalupe River, 4 milessoutheast of Belmont, Gonzales County.
Ownership and History of Development
The project is one of six hydroelectric powerplantsbeing operated by the Guadalupe·Blanco RiverAuthority on the Guadalupe River. These powerplantsare Dunlap (TP-1), McQueeney (TP-3l, Seguin (TP-4l,Nolte (TP-5l, H-4 Dam, and H-5 Dam.
The powerplants were authorized by the followingwater rights from the State Board of Water Engineers:Permit No. 21 (Application No. 21), dated July 25,1914, which granted an appropriation not to exceed1,300 cfs, continuously, from the Guadalupe River, forthe purpose of hydroelectric power development, to theGuadalupe Water Power Company (now owned by theGuadalupe-Blanco River Authority); and Permit No.1096 (Application No. 1163), dated June 12, 1929,which granted an appropriation not to exceed 941,200acre-feet of water per annum for power developmentpurposes to the Hunt Development Company (nowowned by the Guadalupe-Blanco River Authority).
Construction of the project was begun in 1929 andcompleted in August 1931, with impoundment of waterand generation of power beginning at that time. Theoutput from this and the other five plants is sold toCentral Power and Light Company and deliveredthrough necessary switches and transformers to the highvoltage transmission system supplying power to the area.
At the end of December 1967, this plant was inthe process of conversion to complete automatic operation. The control center and necessary equipment arelocated in the office building of the Guadalupe·BlancoRiver Authority in Seguin.
- 38-
The one vertical generator is a 2,400 kw, 3 phase,60 cycle. 2,400 volt, 180 rpm unit with a directconnected exciter. The generator and control equipmentwere furnished by the General Electric Company.
The one vertical turbine is an S. Morgan Smith,180 rpm, Kaplan propeller type with a capacity of 3,800hp at 27.0·foot head. The unit is controlled by aWoodward governor.
At this plant, the turbine is installed in an openwheelpit equipped with trashracks and headgates.
Headwater elevation (crest of the spillway withbear trap gates raised) is elevation 331.0 feet above msland the tailwater elevation is 304.0 feet above msl,giving a gross head for the turbine of 27.0 feet.
Maximum water discharge through the plant at fullload is 1,300 cfs. Water release is controlled byoperation of the turbine while generating power, and byspillway gates.
Water discharged from the powerplant is subsequently used by H-5 Hydroelectric Powerplant. Somewater is stored during periods of low river flow for useduring the time of peak power requirements.
The H-4 plant was a run-of-river plant until June16.1964, when impoundment of water began in CanyonReservoir near New Braunfels. After that date, the riverflow was partly regulated by releases from CanyonReservoir.
Records of gross monthly power generation at theH-4 plant for the years 1935-67 were furnished by theGuadalupe-Blanco River Authority and are given in thetable following. Records before 1935 are not available.

w'"
Gross generation of electrical energy at H-q Dam Hydroelectric Powerplant, in Megawatthours
. -,----YEAR JANUARY FEBRUARY MARCH APRIL MAY JUNE JULY AUGUST SEPTEMBER OCTOBER IIOVEMBER DECEMBER TOTAL
_.-r-1935 550 661 430 521 833 g91 1,149 1.012 1.070 1.145 927 1.017 10.306
1936 961 857 815 712 697 1.142 1,058 1.031 908 1.178 1,400 1.168 11.927
1937 1.129 1,060 1.103 I .005 756 1.049 686 522 550 550 573 763 9.746
1938 1.088 1.279 904 1,002 1.310 953 646 577 545 484 540 541 9.869
1939 626 575 511 513 518 432 516 437 380 477 511 437 5.933
1940 491 511 508 756 659 787 724 269 373 358 674 949 7.059
1941 939 1.247 1.250 1.460 957 1.399 1.250 885 816 1.007 757 752 12.719
1942 723 707 601 938 1.315 912 759 626 921 748 663 976 9,889
1943 950 818 686 827 622 921 673 552 583 537 499 546 8,214
1944 726 942 1.246 1,182 1.216 1.282 916 554 996 748 743 1.095 11.646
1945 1.175 1,448 1.350 1,450 1.133 889 710 563 559 1,015 720 844 11.856
1946 871 852 1.040 1,023 1.048 1.070 666 494 944 1,282 1.329 1.279 11,898
1947 1.387 1,504 1.103 1.160 1,145 882 816 607 589 468 318 556 10.535
1948 489 582 531 468 506 376 650 300 343 379 375 380 5.379
1949 440 487 792 793 1.115 780 592 546 485 528 671 q65 7.694
1950 567 673 526 630 629 662 460 322 337 336 290 372 5,804
1951 396 404 342 491 454 608 236 157 194 195 247 250 3.974
1952 300 300 287 407 354 686 244 146 481 519 405 699 /',828
1953 815 583 455 453 463 196 176 157 684 417 536 492 5.427
1954 410 368 276 268 347 198 98 51 38 87 162 198 2,50 I
1955 216 302 236 142 303 192 179 84 37 46 50 164 1,951
1956 Iq5 155 106 37 56 9 20 6 0 0 0 86 620

"o
Gross generation of electrical energy at H-4 Dam Hydroelectric Powerplant, in Hegawatthours--Continued
YEAR JANUARY FEBRUARY MARCH APRIL MAY JUNE JULY AUGUST SEPTEMBER OCTOBER rlOVEMBER DECEMBER TOTAL
1957 28 121 413 515 1,141 1,036 426 180 450 992 1.360 1,240 7,902
1958 1,412 1,154 1,445 1,308 1 ,308 1,098 900 571 809 1,172 1,277 1,009 13 ,463
1959 903 818 758 992 857 620 903 607 471 970 794 772 9,465
1960 920 877 843 824 801 554 771 953 622 761 1,386 1,433 10,745
1961 1,536 1,251 1,475 1,093 824 845 1,021 753 631 706 739 707 11,581
1962 666 583 599 626 548 585 356 247 412 436 459 537 6,054
1963 490 482 483 547 428 258 202 125 147 218 392 370 4,142
1964 391 534 639 449 313 378 189 168 432 728 739 466 5,426
1965 547 782 761 682 925 886 751 481 564 656 668 840 8,543
1966 876 921 1,014 915 857 862 721 487 756 772 638 513 9,332
1967 504 424 453 396 338 173 165 197 647 951 1,092 850 6,190
Total 23,667 24,262 23,981 24,585 24,776 23,711 19,629 14,667 17,774 20,866 21,934 22,766 262,618
Monthly andannual average 717 735 727 745 751 718 595 444 539 632 665 690 7,958
1935-67
Monthly averagein percent of 9.0 9.2 9.1 9.4 9.4 9.0 7.5 5.6 6.8 7.9 8.4 8.7 100annual average
1935-67

10. H-5 Dam Hydroelectric Powerplant
Location
H·5 Dam Hydroelectric Powerplant is at H-5 Damon the Guadalupe River, upstream from the San MarcosRiver, and 4 miles southwest of Gonzales, GonzalesCounty.
Ownership and History of Development
The project is one of six hydroelectric powerplantsbeing operated by the Guadalupe-Blanco RiverAuthority on the Guadalupe River. These powerplantsare Dunlap (TP-l). McQueeney (TP-31. Seguin (TP-41.Nolte ITP-51. H-4 Dam. and H-5 Dam.
The powerplants were authorized by the followingwater rights from the State Board of Water Engineers:Permit No. 21 (Application No. 21), dated July 25,1914, which granted an appropriation not to exceed1,300 cfs, continuously. from the Guadalupe River forthe purpose of hydroelectric power development, to theGuadalupe Water Power Company (now owned by theGuadalupe-Blanco River Authority); and Permit No.1096 (Application No. 1163), dated June 12, 1929,which granted an appropriation not to exceed 941,200acre-feet of water per annum for power developmentpurposes to the Hunt Development Company (nowowned by the Guadalupe-Blanco River Authority).
Construction began the latter part of 1929.Generation of power began in October 1931. Part of the.earthen section of the dam was destroyed by a flood inJuly 1932.
The output from this and the other five plants issold to Central Power and Light Company and deliveredthrough necessary switches and transformers to the highvoltage transmission system supplying power to the area.
At the end of December 1967, this plant was inthe process of conversion to complete automatic operation. The control center and necessary equipment are
- 41 -
located in the office building of the Guadalupe-BlancoRiver Authority in Segu in.
Physical Description
The one vertical generator is a 2,400 kw, 3 phase,60 cycle, 2,400 volt, 180 rpm unit with a directconnected exciter. The generator and control equipmentwere furnished by the General Electric Company.
The one vertical turbine is an S. Morgan Smith,180 rpm, Kaplan propeller type. with a capacity of3,700 hp at 29_0-fool head. The unit is controlled by aWoodward governor.
At this plant, the turbine is installed in an openwheelpit equipped with trashrack and headgate.
Headwater elevation (crest elevation with gatesclosed) is 290.9 feet above msl and the tailwaterelevation is 261.9 feet above msl, giving a gross head of29.0 feet.
Maximum water discharge through the plant at fullload is 1,300 cfs. Some water is stored during periods oflow streamflow for use during the time of peak powerrequirements.
The H-5 plant was a run-of·river plant until June16, 1964, when impoundment of water began in CanyonReservoir near New Braunfels. After that date, the riverflow was partly regulated by releases from CanyonReservoir.
Records of gross monthly power generation at theH-5 plant for the years 1935·67 were furnished by theGuadalupe-Blanco River Authority and are given in thetable following. Records before 1935 are not available.

'"'"
Gross generation of electrical energy at H-5 Dam Hydroelectric Powerplant, in Megawatthours
YEAR JANUARY FEBRUARY HARCH APRIL HAY JUNE JULY AUGUST SEPTEHBER OCTOBER rmVEHBER DECEHBER TOTAL
1935 561 676 450 539 817 977 1,136 977 991 1,085 895 936 10,040
1936 902 795 747 690 671 1,035 983 1,012 875 1,075 1,367 1,150 11,302
1937 1,196 1,044 1,055 1,024 742 965 772 550 543 472 587 722 9,582
1938 1,039 1,215 896 979 1,168 970 646 582 547 482 531 529 9,584
1939 613 563 489 484 514 412 482 397 342 458 477 429 5,660
1940 467 493 491 735 626 763 709 357 353 349 658 904 6,905
1941 956 1,200 1,193 1,421 767 1,323 1,245 907 834 882 856 745 12,329
1942 703 695 589 935 1,293 905 749 630 903 1,118 1,140 979 10,640
1943 972 815 671 822 616 936 657 557 588 527 514 546 8,221
1944 718 994 1,180 1,1]1 1,183 1,190 919 556 970 779 728 1,080 11,469
1945 1,192 1,404 1,281 1,344 1,120 888 706 536 508 996 691 816 11,392
1946 848 850 991 1,003 1,037 1,070 620 432 836 1,155 1,282 1,260 11,385
1947 1,347 1,485 1,210 956 1,1]1 890 821 587 554 449 500 513 10,483
1948 541 573 530 462 512 376 660 275 315 358 364 376 5,342
1949 432 479 751 603 1,087 810 599 538 492 500 676 553 7,520
1950 518 670 520 631 627 619 432 288 302 213 316 364 5,500
1951 372 396 335 484 442 594 221 128 188 177 240 250 3,827
1952 296 295 278 400 349 706 240 126 554 543 422 723 4,932
1953 862 603 467 462 464 203 165 136 679 417 546 482 5,486
1954 417 364 271 262 330 191 76 42 37 43 148 207 2,388
1955 222 338 262 166 323 213 163 84 50 37 37 114 2,009
1956 143 155 99 30 47 24 13 36 4 0 0 44 595

...w
Gross generation of electrical energy at H-S Dam Hydroelectric PO\"erplant. in Hegawatthours--Continued
YEAR JANUARY FEBRUARY MARCH APRIL MAY JUNE JULY AUGUST SEPTEMBER OCTOBER NOVEMBER OECEMBER TOTAL-~
1957 16 134 457 538 1,226 1,048 417 160 373 931 1,378 1.314 7,992
1958 1,389 1,124 1,379 1,349 1,250 1,117 462 576 815 1,210 1,317 1,072 13,060
1959 960 886 927 1,052 804 670 936 620 495 973 827 821 9,971
1960 988 923 865 829 803 515 817 988 828 708 1.361 1,410 11,035
1961 1,522 1,162 1.480 1,122 848 816 1,054 780 536 730 752 727 11,529
1962 690 609 626 655 566 594 353 231 426 444 475 566 6.235
1963 513 508 503 562 429 248 191 100 129 208 396 386 4,173
1964 412 571 688 500 342 376 188 151 448 750 769 490 5,685
1965 570 720 793 570 897 858 794 483 579 694 718 853 8,529
1966 920 970 I ,079 962 917 897 739 550 751 779 656 526 9,746
1967 524 434 467 404 341 166 154 192 643 1,016 1,085 892 6,318
Total 23,641 24,143 124,020 24,146 24,329 23,365 19,119 14,565 17,489 20,558 22,709 22,780 260,864
Monthly andjannual average 716 732 728 732 737 709 579 441 530 623 688 690 7,905
1935-67
~onthly averagein percent of 9.1 9.3 9.2 9.3 9.3 8.9 7.3 5.6 6.7 7.9 8.7 8.7 100annl!a r average
1935-67

Location
11. seguin (TP-4) Hydroelectric Powerplant
Physical Description
Seguin (TP-41 Hydroelectric Powerplant isat Tp·4 Dam on the Guadalupe River, 3 miles southwestof Seguin, Guadalupe County.
Ownership and History of Development
The project is one of six hydroelectric powerplantsbeing operated by the Guadalupe-Blanco RiverAuthority on the Guadalupe River. These powerplantsare Dunlap (TP-l), McQueeney (TP-31. Seguin (TP-41.Nolte (TP-51. H-4 Dam, and H-5 Dam.
The powerplants were authorized by the followingwater rights from the State Board of Water Engineers:Permit No. 21 (Application No. 211. dated July 25,1914, which granted an appropriation not to exceed1,300 cfs, continuously, from the Guadalupe River, forthe purpose of hydroelectric power development, to theGuadalupe Water Power Company (now owned by theGuadalupe-Blanco River Authority); and Permit No.1096 (Application No. 11631. dated June 12, 1929,which granted an appropriation not to exceed 941,200acre-feet of water per annum for power developmentpurposes to the Hunt Development Company (nowowned by the Guadalupe-Blanco River Authority).
Construction began in 1930. Generation of powerbegan in March 1932. The output from this and theother five plants is sold to Central Power and LightCompany and delivered through necessary switches andtransformers to the high voltage transmission systemsupplying power to the area.
At the end of December 1967, this plant was inthe process of conversion to complete automatic operation. The control center and necessary equipment arelocated in the office building of the Guadalupe-BlancoRiver Authority in Seguin.
- 44-
An exterior view of the Seguin (TP-41Hydroelectric Powerplant and Dam is shown in Figure11. The one vertical generator is a 2,400 kw, 3 phase, 60cycle, 2,300 volt, 180 rpm unit with a direct connectedexciter (Figure 12). The generator and control equipment were furnished by the General Electric Company.
The one vertical turbine is an S. Morgan Smith,180 rpm, Kaplan propeller type, with a capacity of3,750 hp at 29.0-foot head. The unit is controlled by aWoodward governor.
At this plant, the turbine is installed in an openwheelpit equipped with trashracks and headgates.
Forebay water level is 497.4 feet above msl andthe tailwater elevation is 468.4 feet above msl giving agross head of 29.0 feet.
Maximum water discharge through the turbine atfull load is 1,300 cfs. The plant stores some water duringlow-flow periods for use during the time of peak powerrequirements. Water releases are subsequently used bythe downstream powerplants.
The Seguin plant was a run-of-river plant untilJune 16, 1964, when impoundment of water began in'Canyon Reservoir near New Braunfels. After that date,the river flow was partly regulated by releases fromCanyon Reservoir.
Records of gross monthly power generation at theSeguin plant for the years 1935-67 were furnished bythe Guadalupe-Blanco River Authority and are given inthe table following. Records before 1935 are notavailable.

Figure 11.··Seguin ITP·4) Hydroelectric Powerplant and Dam.
Figure 12...The 2,400 kw generator at Seguin (TP·4) Hydroelectric Powerplant.
·45·

..a>
Gross generation of electrical energy at Seguin (TP-4) Hydroelectric Powerplant. in Hegawatthours
YEAR JANUARY FEBRUARY MARCH APRIL MAY JUNE JULY AUGUST SEPTEMBER OCTOBER NOVEMBER DECEMBER TOTAL
1935 .8. 589 ',86 .72 1,079 I, ,"6 1,256 959 1,150 1,179 920 1.053 10,773
1936 929 778 8'5 707 823 1,036 1,286 983 967 1.280 1,310 1.25' 12, Iy8
1937 1,170 980 1,233 98. 776 1.09' 556 591 536 609 575 861 9,965
1938 1,16. 1,109 996 1,0.8 1.319 910 682 57. 535 50. '9' 5.1 9,876
1939 607 .87 5," .86 .88 370 .82 .26 33' 5'9 397 .16 5,556
19.0 .51 .73 550 775 7'7 831 662 '01 357 39' 67' 1,017 7,332
19", 855 1,230 1,368 1,301 1,328 1,3.2 1,267 882 7.2 1,121 8.0 800 13,076
19.2 7", 652 667 I ,022 1,31. 796 797 579 1,0'9 1,26. 1,061 1,0•• 10,986
19.3 928 729 766 782 702 873 359 526 612 5'5 • 76 5.6 7.8••
19" 88. 95' 1,519 1,102 1,37' 1,285 921 695 980 825 770 1,238 12,5'7
19.5 1,262 1,261 1,377 1,359 1,178 901 790 619 567 1,051 698 895 II ,958
19.6 881 937 1,170 920 1,123 97' 638 225 639 1,310 1,322 1,3.8 11,.87
19'7 1,398 1,281 1,356 1,179 1,189 882 760 677 532 513 522 573 10,862
19.8 .87 5.0 5.6 .85 '99 519 505 366 375 .0. 318 301 5,3'5
19'9 399 '78 820 899 1,110 736 538 536 ••8 5.0 .89 520 7,513
1950 512 59' 525 552 616 555 '30 267 290 28. 2.8 318 5,191
1951 322 309 368 3" '92 • 67 217 155 208 212 239 251 3,58•
1952 281 252 278 .11 ••• '98 211 126 671 391 361 712 ',636
1953 7", ••9 ",8 .11 302 167 163 161 618 '39 331 "6" •. 66.
195' 337 281 257 228 303 12" 88 56 58 109 15" ,"8 2, '"3
1955 190 2"2 189 128 291 ,"7 207 7" 51 57 66 115 1,757
1956 117 118 87 "3 32 5 5 • 9 I 3 88 512

.....,
Gross generation of electrical energy at Seguin (TP-4) Hydroelectric Powerplant. in Hegawatthours--Continued
YEAR JANUARY FEBRUARY MARCM APRIL MAY JUNE JULY AUGUST SEPTEMBER OCTOBER flOVEMBER OECEMBER TOTAL
1957 58 99 338 614 1.220 1.094 403 186 497 I 1,018 1,311 1.276 8,114
1958 1.634 1.385 1.712 1.367 1,501 1.204 900 560 912 1,237 1,386 1,071 14.869
1959 933 549 498 1.006 870 730 860 585 483 1.078 801 839 9,232
1960 1,036 978 900 877 791 640 730 1,075 779 1,043 1,546 1.628 12,023
1961 1.718 1,508 1,646 1,150 856 944 979 722 608 653 687 661 12,132
1962 624 537 549 578 500 540 332 244 390 1'32 410 511 5,647
1963 452 423 429 539 392 269 223 162 98 247 351 350 3,935
1964 364 502 597 424 329 389 220 205 415 758 742 477 5,422
1965 477 73' 802 675 1.042 945 811 476 575 606 643 790 8.575
1966 926 941 1,041 936 819 898 736 584 794 790 624 457 9,546
1967 445 376 414 374 332 180 181 215 699 1,026 1.190 853 6,285
Total 23,807 22,754 25,261 24.178 26,181 23.491 19,195 14,896 17,978 22,469 21,959 2,,416 265.585
Monthly andannual average 721 690 765 733 793 712 582 451 545 681 665 710 8,048
1935-67
Monthlv averaqein percent of 9.0 8.6 9.5 9.1 9.8 8.8 7.2 5·6 6.8 8.5 8.3 8.8 100annual average
1935-67

12. Buchanan Hydroelectric Power plant
Location
Buchanan Hydroelectric Powerplant is atBuchanan Dam (Lake Buchanan) on the Colorado River,11 miles west of Burnet. Burnet County.
Ownership and History of Development
The powerplant is owned and operated by theLower Colorado River Authority as one of a series of sixhydroelectric powerplants on the Colorado River. Theother five are Inks, Granite Shoals, Marble Falls,Marshall Ford, and Austin Hydroelectric Powerplants.All of these are described in this report.
The project was authorized by Permit No. 1259(Application No. 1345). dated May 25,1938, granted bythe State Board of Water Engineers to the LowerColorado River Authority. This permit authorizes allannual appropriation of 1,391,530 acre-feet of water fordomestic, municipal, industrial, irrigation, mining, andhydroelectric power uses.
Several other water rights that are included inPermit No. 1259 recognize earlier water rights of theLower Colorado River Authority (Dowell and Breeding,19671.
The project was started by the Samuel Insul!interests in April 1931 under the name Central TexasHydro-Electric Company. Work was stopped April 20,1932, because of financial difficulties. Construction wasresumed by the Lower Colorado River Authority in1935 and was completed in 1938. Deliberate impoundment of water in Lake Buchanan began May 20, 1937.The flood of July 1938 filled the reservoir for the firsttime, resulting in a large floodflow discharge from thereservoir. The first electric generating unit was placed inoperation in January 1938.
Buchanan Hydroelectric Powerplant is upstream offive other projects. Water released through the powerplant is subsequently used for generation of power atInks, Granite Shoals, Marble Falls, Marshall Ford, andAustin Hydroelectric Powerplants,
Physical Description
Each of the three vertical generators is an 11,250kw, 3 phase, 60 cycle, 7,200 volt, 171.4 rpm unitmanufactured by Westinghouse Electric Corporation.
Two of the three vertical turbines are NewportNews Shipbuilding and Drydock Company, Francis type,171.4 rpm units, with capacities of 17,300 hp at
131-foot head. The third turbine, installed in 1950, is anI. P. Morris Division of Baldwin Manufacturing Companyunit with the same characteristics as the first two. Allthree turbines are controlled by Woodward cabinet typegovernors located on the generator floor level.
A 12-foot diameter steel penstock connects fromthe lake to each turbine. Each penstock is equipped witha fixed-wheel type headgate, The number three penstockhas a wye and butterfly-type valve for controllinq theflow from the pump-back unit described below. Theoriginal plant design in 1932 called for valves in eachpenstock, which were on order at the time constructionstopped. When a butterfly·type valve was needed in1950 for this pump installation, S. Morgan SmithCompany, the low bidder, found one of these unfinished1932 cast iron valve bodies in stock. So, the valve finallyarrived at the place of original intent 18 years late.
The centerline of the turbine wheels is at elevation896.5 feet above msl. These units, therefore, can beoperated as synchronous condensers with the turbineblades above tailwater. Maximum lake elevation is1,020.5 feet above msl (crest elevation of uncontrolledspillway) and tailwater elevation is 889.0 feet above msl,providing a maximum gross head of 131.5 feet.
Buchanan Hydroelectric Powerplant has a pumpback unit, placed in operation in May 1950, by whichturbine discharge into the tailrace or Inks Lake is in partpumped back to Lake Buchanan_ Pumping takes placeduring off-peak hours of system electrical requirements.The water is then used for power generation duringsystem peaks. A ratio of about 1_8 kwhr off-peak powerat Buchanan will pump water back to the lake togenerate 1.0 kwhr of peak power, depending on theoperating head. Expressed in amount of water, using thepump for 8 hours each day for a year is equivalent toabout 10 feet of water in Lake Buchanan. The pumpback unit is an 84 inch, vertical 163.7 rpm WorthingtonCorporation centrifugal pump with a capacity of 840cfs, driven by a direct-connected 13,450 hpWestinghouse Electric Corporation vertical motor_ Tostart the unit, electrical connection is made to one of thegenerator units and both are brought to synchronousspeed, then connected to the transmission system. Themotor load is then transferred from the generator to thesystem and the generator shut down. This prevents asurge on the system that would be created by startingsuch a large motor.
The operating center is located off the generatorroom and contains the necessary controls for the threegenerators and the pump motor. The Inks generatingunit, 4 miles downstream, is also controlled from thiscenter. The control wires are contained in a cablesuspended from poles along the transmission power line.
·48·

The Buchanan Hydroelectric Powerplant, transformer station, and part of the downstream side ofBuchanan Dam are shown in Figure 13. Two generatorsand the pump motor in the plant are shown in Figure14.
- 49-
Records of gross monthly hydroelectric powergenerated at the Buchanan plant for the years 1943-67were furnished by the Lower Colorado River Authorityand are given in the table following. Records of powergeneration before 1943 are not available.

Figure 13.-Buchanan Hydroelectric Powerplant, transformer station,and downstream side of Buchanan Dam. Courtesy ofLower Colorado River Authority.
Figure 14.··Two 11,250 kw generators and the pump motor at BuchananHydroelectric Powerplant.
·50-

~
Gross generation of electrical energy at Buchanan Hydroelectric Powerplant, in Megawatthours
YEAR JANUARY FEBRUARY HARCH APRIL HAY JUNE JULY AUGUST SEPTEHBER OCTOBER tlOVEHBER OECEHBER TOTAL
Iq43 3,955 7,296 9,175 7,311 4,955 6,290 2,707 2,396 855 3,288 4.021 S,047 57,296
1944 2,401 2,2 43 8,360 5,492 11,616 11,512 6,070 9,677 8.15" 4,252 ,,351 I .965 77 ,093
1945 3,287 2,664 4,167 2,135 3,704 5,003 12,809 7,309 4,751 2,673 4,086 6,500 59,088
1946 6,477 8,Sql 9,814 8,148 1,121 3,295 8,590 5,74" 3.292 5,364 6,960 5,881 73 ,277
1947 1.546 1,352 4.482 3.461 1.960 4,056 5,929 5,423 5,443 6,779 5,970 4,479 50,880
1948 3,535 4,978 4,514 4,114 2,728 4,228 5,676 6,039 4,883 2,544 1,854 3,927 49,020
1949 3.266 2.431 116 2,263 15.315 10,083 8,474 6,173 7,394 3,975 4.431 252 64,173
1950 0 0 3,425 3,355 2.795 5.432 3,183 4.714 3,227 1,773 3,897 2,069 33 .870
1951 2,304 3,384 1,231 2,873 9.086 12,432 10.862 13,837 7,744 3,192 1,956 979 69,880
1952 1.478 2,292 413 649 2,205 5,462 9,831 9.149 1.676 1,773 2.513 2,289 39.730
1953 2,995 3.246 1,271 1,665 1,417 4,432 1,407 2,382 5.484 4,763 2,036 2,410 33,508
1954 3, 109 1,213 1,534 2,011 21,781 10.699 8,198 3,155 2,255 2,846 1.549 1.659 60,009
Iq55 3.330 913 1,857 2,821 8,413 IQ.387 16,560 II. Q44 6,294 11,769 6,065 2.896 92,249
1956 3,554 1,200 1,092 2,066 18,494 7,825 3.291 2,863 4,141 2.284 1.261 2,430 50,501
1957 3,226 4.019 1,751 3.685 25,811 19,387 6,342 12,482 4,123 15,730 11,718 8,438 116,712
1958 11,258 7.734 9,958 9,058 11,807 10,357 11,334 3,532 2,459 736 2,421 5.227 85.881
1959 3.943 383 759 1,249 1.647 2.443 17.900 11.915 3,357 17,337 7 128 8,010 76.071
1960 11,620 II ,133 6.166 7.824 6.246 10,456 6,277 4,912 2,811 760 315 1,471 69,991
1961 1.128 386 7,701 6,338 6.138 12.505 11,575 10,35" 8.129 9,286 5,936 7,306 86,782
1962 7,322 2,083 657 353 1,136 1,779 5,185 7,225 9,345 13,516 1,154 299 50,054
1963 8.015 10.294 4,591 13,182 18,436 21.350 21,971 21,753 15,056 2,494 3,612 5,903 146.657
1964 1,573 2,132 1.041 2,325 7,566 7,502 4,784 3.540 2,986 I 276 821 34,547

~
Gross generation of electrical energy at Buchanan Hydroelectric Powerplant, in Megawatthours--Continued
YEAR JANUARY FEBRUARY MARCH APRil HAY JUNE JULY AUGUST SEPTEHBER OCTOBER NOVEHBER OECEHBER TOTAL
1965 270 47 108 64 16,631 10,416 1,907 5,919 1,754 0 518 963 38,597
1966 1,375 1,405 1,147 3,811 11,352 4,527 4,913 2,178 9,970 4,897 0 981 46,556
1967 494 3,135 3,784 16 982 5,319 7,418 6,896 5,529 1,614 353 819 36,359
Total 91,461 84,554 89,114 96,269 213,342 216,177 ~03,193 181.51 I 131,112 123,646 85,381 83,021 1,598,781
Monthly andannual average 3,658 3,382 3,565 3,851 8,534 8,647 8,128 7,260 5,244 4,945 3,415 3,321 63,951
1943-67
~onthly averagein percent of
5.7 5.3 5.6 6.0 13.4 13.5 12.7 11.4 8.2 7·7 5.3 5.2 100annual average1943-67

13. Eagle Pass Hydroelectric Powerplant
Location
Eagle Pass Hydroelectric Powerplant is in the RioGrande basin in Maverick County on the MaverickCounty Canal about 10 miles upstream from Eagle Pass,Maverick County.
Ownership and History of Development
The plant is owned and operated by the CentralPower and Light Company.
Water used for generating electric power is pur·chased from the Maverick County Water Control andImprovement District No.1 which was granted PermitNo. 1086 (Application No. 11601 dated October 8.1928, by the State 80ard of Water Engineers for thepurpose of hydroelectric power development. The district has a separate permit for irrigation water.
This combined irrigation and power developmentis known generally as the Eagle Pass Project. Its historybegan in 1895 when surveys were made and feasibilitywas determined. Significant progress was not made until1927 when a bond issue of $4,800,000 was voted forfinancing construction of an irrigation system. Later,power development was added to the project through acontract between the district and Central Power andLight Company to supply water for power generation atthe Eagle Pass Hydroelectric Powerplant. This furtherdevelopment required a larger canal with a capacity of1,500 cfs for transporting water to the powerplant siteand for irrigation along its 31.5-mile length from thedistrict's point of diversion in Kinney County to thepowerplant in Maverick County. An additional bondissue of $1,600,000 was necessary to finance theenlarged canal project (Dowell, 1932).
Construction of the powerplant was started in1931 and completed in April 1932. Generation of powerbegan April 11, 1932, but the plant was shut down inSeptember 1932 because of flood damage to the canalthat diverted water from the Rio Grande. The powerplant returned to operation March 19, 1937.
Physical Description
A special feature of this project is that no dam isrequired to divert water from the Rio Grande. Instead, achannel was cut in the riverbed of the Rio Grande 10feet below normal low water to divert flow to the mainMaverick County Canal by gravity. The flow to the canalis controlled by three gates installed in a concrete intakestructure.
- 53-
Eagle Pass Hydroelectric Powerplant is at the endof a high ridge on the bank of the Rio Grande. Thedistrict delivers water at the end of their 31.5-mile maincanal at a control structure. (A smaller canal of 350 cfscapacity continues from this point to supply water forirrigation.)
From the control structure, Central Power andLight Company constructed a canal 1,370 feet long witha capacity of 1,500 cfs to a concrete headworksstructure. This structure provides transition from thecanal to three 11-foot diameter penstocks with verticalheadgates and hoisting equipment for control of waterto the turbines in the powerhouse. In addition, there isataintor gate 12 feet wide by 12 feet high to control theflow to a concrete chute discharging to a weir structureand on to the Rio Grande. This spillway is necessary toprevent buildup and surges in the canal in case of suddeninterruption to plant operation.
The water level in the powerplant canal at theheadworks is at elevation 796.0 feet above msl, which is83 feet above the normal river level in the tailracechannel. The operating tailrace elevation is 715.0 feetabove msl, giving a gross head of 81.0 feet with threeunits operating and normal river conditions.
Three 3,200 kw generating units at Eagle PassHydroelectric Powerplant provide a total capacity of9,600 kw. The power is delivered through necessaryswitches and transformers to the high voltage transmission system supplying the local area, interconnectedplants, and service areas of Central Power and LightCompany.
Each of the three vertical generators is a 3,200 kw,3 phase, 60 cycle, 6,900 volt, 225 rpm unit with a directconnected exciter. The generators, switchboard, andcontrol equipment were furnished by the WestinghouseElectric Corporation.
Each of the three vertical turbines is a JamesLeffel and Company, 225 rpm, Francis type, withcapacity of 4,500 hp at 81.0·foot head. Each unit iscontrolled by a Woodward governor.
As the contract is based on amount of water used,the turbines were tested using the Gibson method tomeasure the flow and calibrate the Simplex indicatingand recording meters. These meters use the differentialpressure of Winter·Kennedy taps installed in the scrollcase calibrated to read cfs. In addition, the electricoutput of each generator is recorded each hour.

An exterior view of the Eagle Pass plant is given inFigure 15. The interior view, Figure 16, shows the threegenerators with exciters and Woodward governors.
- 54-
Records of gross monthly generation of hydroelectric power at the Eagle Pass plant were furnished bythe Central Power and Light Company. These recordsfor the period March 1937 to December 1967 are givenin the table following.

Figure 15.--Eagle Pass Hydroelectric Powerplant. The Rio Grande atflood stage is in background, September 23, 1964.
Figure 16.··Three 3,200 kw generators with Woodward governors atEagle Pass Hydroelectric Powerplant.
- 55·

~
Gross generation of electrical energy at Eagle Pass Hydroelectric Powerplant. in Megawatthours
YEAR JANUARY FEBRUARY MARCM APRIL MAY JUNE JULY AUGUST SEPTEMBER OCTOBER ,jOVEHBER DECEMBER TOTAL
1937 -- -- 97 379 790 1,521 1,180 1,771 1,068 9~0 1,040 745 9,521
1938 782 752 606 650 805 1,309 1,477 968 598 556 789 870 10,162
1939 921 974 811 1,073 1,139 1,247 1,211 I .296 1.138 1,099 736 970 12,615
1940 I 905 1,090 1,080 1,033 1,052 1,032 1,132 I ,388 1.132 1,467 867 941 13,119
1941 I ,02~ 1,095 1,076 1,716 1,432 1,199 1.344 1,436 1,229 1,416 1,630 1,588 16,184
1942 1,239 1,244 1,092 913 1,793 1,805 1,029 1.573 1,436 1,549 1,708 1,542 16,923
1943 1,515 1,808 1,974 1,509 1,607 1,996 1,815 2,359 1,653 2,176 2.041 1,976 22 ,429
1944 1,985 I ,865 1,570 1,489 1,368 1,998 1,270 1,564 1,775 2,035 1,829 2,023 20,771
1945 2,182 2.249 1,886 2,055 1,547 1,618 1,597 1,702 1,273 1,788 1,861 1,768 21,526
1946 1,961 1.893 1,655 1,495 1,691 1.527 1,619 817 1.192 1,622 I ,7°9 1,656 18,927
1947 1,934 1,899 1,623 1,364 1,604 956 842 686 1,178 766 904 1,03 I 14,787
1948 988 1,207 852 435 702 1,312 987 1,763 3,183 3,024 3,167 3,181 20,801
1949 3,578 3,606 3,777 3,769 4,145 3,930 3.666 4,518 4.674 4,524 4,751 4,328 49,266
1950 4,516 4.446 3,853 4,128 4,142 4,689 4,105 4,512 4,290 4,367 3,846 3,759 50,653
1951 4,277 4,332 3,891 3,540 3,164 4,564 2,879 3,770 3,715 2,854 3,401 2,966 43,3S3
1952 2,921 2,517 1,817 1,434 1,757 3,273 3,425 2,057 718 803 I ,448 2,001 24,171
1953 2,269 1,680 1,910 333 81 0 548 2,194 4,355 2,117 2,329 2.176 19.992
1954 2,335 2,448 995 2,081 3,029 3,920 344 1,986 1,955 4,081 3.181 3.409 3I , ry6~
1955 3.210 2,515 1,903 858 1,859 1.151 2, 100 2,939 2.755 2,776 2,854 2.960 27,880
1956 3,041 2,354 1,457 854 852 580 492 1,090 2,020 1,518 1,582 2,096 17,936
1957 2,592 2,424 2,558 1,968 3,014 2,885 1,570 2,227 2,956 4.120 3.940 3,960 34,214
1958 4,319 3,799 3,861 2,614 3,188 2,896 1.035 3,382 3,434 3,456 3,9 15 3,956 42,057

'"...
Gross generation of electrical energy at Eagle Pass Hydroelectric Powerplant. in Hegawatthours--Continued
YEAR JANUARY FEBRUARY MARCH APRIL MAY JUNE JULY AUGUST SEPTEMBER OCTOBER 1l0VEMBER DECEMBER TOTAL,
1959 3,978 3,683 3,257 3,275 3, 9~7 3,52~ 3,901 3,889 3,791 ~ ,077 ~ .011 3,717 ~5,050
1960 3,708 3,831 3,580 2,803 3,212 2,231 3,368 3. q85 3,529 3,726 ~, 162 ~ ,418 ~2,5~~
1961 ~.510 ~ ,I ~6 3.693 2,757 3.50~ 3,703 3.905 ~ ,1~8 3,817 ~ ,122 3,830 3.91 ~ ~6,O~9
1962 3,888 3,302 3.286 3,078 2,639 3.359 3,~81 2,768 3.7~2 ~ ,12~ 3,851 ~,137 41 ,655
1963 3,901 3,I ~ I 2,516 2,~36 3,822 3,3~9 2,832 3, 5~8 3,890 3,515 3,513 3,837 ~O,300
196~ 3, ll5 3,280 2,83~ I ,9~9 2,322 2,912 I ,~50 2,9~3 2,95~ ~,6~~ 3.750 3.913 36,286
1965 3.301 3,527 3,125 3,O~0 2,880 3,370 1,925 2,655 3,~50 ~ ,022 3,703 ~ ,673 39,671
1966 ~,363 3,50~ 2,812 2,503 ~ ,~73 3,2~7 2, 72~ 3,816 ~,752 ~ ,136 3,~60 3,7~7 ~3,517
1967 3,770 3,o~8 2,979 3,038 1,316 2,155 2,898 3,039 ~ ,071 ~ ,12~ 3,92~ 3,87~ 38,236
Total 83,2~7 77,659 8,~28 60,569 69,076 73.258 6~, 151 76,789 83, 71 ~ 85,53~ 8~ ,022 86, 132 912.579
Monthly and~nnual average 2,775 2,589 2,278 2.006 2,276 2,391 2,099 2,501 2,755 2,820 2,766 2,8~6 30,102
1938-67
J'1onthly averagein percent of 9.2 8.6 7.6 6.7 7.6 7.9 7.0 8.3 9.1 9.~ 9.2 9.~ 100annual average
1938-67

Location
14. Red Bluff Hydroelectric Powerplant
Physical Description
Red Bluff Hydroelectric Powerplant is at RedBluff Dam (Red Bluff Reservoir) on the Pecos River inthe Rio Grande basin, 5 miles north of Drla, ReevesCounty.
Ownership and History of Development
The powerplant is owned and operated by the RedBluff Water Power Control District under the authorityof Permit No. 1217 (Application No. 1295). datedJanuary 15. 1934. granted by the State Board of WaterEngineers to the district. The permit authorized theconstruction of a reservoir and annual use of 300,000acre·feet of water for hydroelectric power generationand irrigation of 145,000 aaes of land in Reeves, Loving,Ward, and Pecos Counties.
Irrigation along the Pecos River downstream fromthe New Mexico-Texas state line was begun in themiddle 1870'5. By 1914. consideration was being givento constructing a reservoir. This culminated in the RedBluff Project and, in 1933, construction was approved asa project of the U.S. Public Works Administration.Actual construction began in November 1934 and wascompleted in September 1936. Power generation beganJune 6. 1937.
- 58·
Number one vertical generator is a 1,000 kw, 3phase. 60 cycle. 2.400 volt. 360 rpm unit. Number twovertical generator is a 1.300 kw, 3 phase, 60 cycle. 2.400volt, 277 rpm unit. 80th generators were manufacturedby the General Electric Company.
80th of the turbines are S. Morgan SmithCompany vertical, Francis type. Number one unit has acapacity of 1,200 hp at 60·foot head and operates with aspeed of 360 rpm. Number two unit has a capacity of1.600 hp at 60-foot head and operates at a speed of 277rpm.
Water is supplied to turbine number one by a5.5·foot diameter steel penstock and to turbine numbertwo by a 6.5-foot diameter steel penstock. A butterflyvalve is installed on each penstock.
Irrigation releases from Red Bluff Reservoir normally are discharged through the operation of thehydroelectric powerplant. During much of the time,however, the water supply has been limited and generation curtailed. The bypass valves are used when thewater requirement is small. No releases are made solelyfor power generation. The electric output of the plant isused at Grand Falls for local distribution to supplementgeneration by diesel engine generating units.
Records of generation of hydroelectric power atthis plant are not available.

15. Inks Hydroelectric Powerplant
location
Inks Hydroelectric Powerplant is at Inks Dam(Inks Lake) on the Colorado River, 4 miles belowBuchanan Dam, and 10 miles west of Burnet, BurnetCounty.
Ownership and History of Development
The powerplant is owned and operated by theLower Colorado River Authority as the second of aseries of six hydroelectric powerplants on the ColoradoRiver. The other five are Buchanan, Granite Shoals,Marble Fails. Marshall Ford, and Austin HydroelectricPowerplants. All of these are described in this report.
The project was authorized by Permit No. 1259A(Application No. 13451, dated May 25, 1938, granted bythe State Board of Water Engineers to the LowerColorado River Authority. This permit authorizes anannual appropriation of 1,391,530 acre-feet of water forhydroelectric power production.
Several other water rights included in Permit No.1259A recognize earlier water rights of the LowerColorado River Authority. These are described in TexasWater Development 80ard Report 48 (Dowell andBreeding, 19671.
Not long after work had been resumed onBuchanan Dam in 1935, a smaller dam was started at theArnold site about 4 miles downstream from Buchanan(Clay, 1948). This new dam is known as the Inks Dam inmemory of Roy B. Inks, one of the originators of the
·59·
Lower Colorado River Authority. It is designed primarily as a power dam. Construction of the Inks project wasbegun in 1936 and was completed in June 1938.Impoundment of water in Inks Lake began at that time.The power unit began operation in June 1938.
Physical Description
The one 12,500 kw generating unit at InksHydroelectric Powerplant is operated by remote controlfrom Buchanan Hydroelectric Powerplant. Output iscoordinated with the discharge from that plant.
The vertical generator is a 12,500 kw, 3 phase, 60cycle, 6,900 volt, 112.5 rpm unit manufactured byGeneral Electric Company.
The vertical turbine is an S. Morgan Smith Francistype 112.5 rpm unit with a capacity of 19,700 hp at63.5-foot head.
Design headwater elevation at Inks plant is 888.0feet above msl and the tailwater is 824.5 feet above msl,giving a gross head of 63.5 feet for the turbine.Centerline of the turbine is at elevation 834.0 feet abovemsl.
Records of gross monthly hydroelectric powergenerated at the Inks plant for the years 1943-67 werefurnished by the Lower Colorado River Authority andare given in the table following. Records of powergeneration before 1943 are not available.

eno
Gross generation of electrical energy at Inks Hydroelectric Powerplant, in Hegawatthours
YEAR JANUARY FEBRUARY MARCM APRIL MAY JUNE JULY AUGUST SEPTEMBER OCTOBER NOVEMBER DECEMBER TOTAL
1943 1,840 3,482 4,437 3,700 2,558 3,264 1,364 1,235 4,795 1,660 2,145 2,762 33 ,242
1944 1,383 1,336 4,521 2,969 6,416 5,768 3,098 5,060 4,236 2,231 2,821 1,161 41,000
1945 1,812 1,436 2,154 1,202 1,725 2,401 5,837 3,466 2,302 1,159 1,947 3,219 28,660
1946 3,273 4,348 4,916 4,276 594 1,694 4,551 3,116 1,746 2,786 3,733 3,292 38,325
1947 1.005 751 2,458 1,876 900 1,985 2,890 2,728 2,829 3,623 3,268 2,418 26,73 1
1948 1.863 2,742 2,580 2,443 1,574 2,470 2,996 3,188 2,497 1,351 951 2,143 26,798
1949 1,811 1,432 269 775 7,544 4,932 4,041 2,997 3,680 1,976 2,235 299 31,991
1950 43 14 1,409 1,662 1,598 2,666 1,438 2,299 1,516 459 1,212 487 14,803
1951 0 931 355 1,233 4,680 6,089 5,301 7,453 4,231 1,386 377 43 32,079
1952 190 640 44 389 1,332 2,880 5,401 5,664 870 520 905 407 19,242
1953 934 1,085 160 458 521 2,156 698 1,199 2,672 2,167 1,010 1,028 14,088
1954 1,467 603 758 975 6,834 4,681 3,909 1,494 920 710 6 37 22,394
1955 716 429 109 792 3,205 6,568 7,203 5,625 2,449 5,406 2,823 1,433 36,758
1956 1,673 210 232 817 7,694 3,091 1,582 1,419 2,075 665 629 642 20,729
1957 99B 1,344 343 1,228 7,832 7,111 3,032 6,051 2,031 5,321 5,517 3.931 44,739
1958 5,227 3,675 4,493 4,245 5,444 4,855 5,365 1,775 1,299 362 1,167 2.624 40,531
1959 1,981 297 465 681 863 1,253 7,682 5,353 1,598 5,818 2,028 2,403 30,422
1960 5,272 5,174 2,939 3,803 3,009 5,049 3,274 1,851 1,255 430 266 907 33,229
1961 679 243 3,606 3,011 2,882 5,017 5,258 4,647 3,748 4,412 2,817 3,561 39,881
1962 3,646 1,379 1 246 619 956 2,679 3,865 5,111 7,374 672 214 26,762
1963 410 1,015 4 198 10 12 457 681 302 2 7 807 3,905
1964 159 427 598 1,285 4,005 4,012 4,468 2,197 1,918 43 166 16 19,294

'"
Gross generation of electrical energy at Inks Hydroelectric Powerplant, in Megawatthours--Continued
YEAR JANUARY FEBRUARY MARCH APRil MAY JUNE JULY AUGUST SEPTEMBER OCTOBER NOVEMBER DECEMBER TOTAL
196~ 0 0 0 40 5,081 4,875 920 2,782 902 96 428 164 15,288
1966 101 162 62 1,380 4,360 2.207 2.347 \,101 4.543 2.253 0 531 \9,047
1967 226 949 1,684 51 569 2,496 3,584 3,397 2,779 853 254 435 17,277
Total 36,709 34,104 8,597 39,735 81,849 88,488 89,375 80,643 62.304 53,063 37,384 34,964 677,215
Month Iy andannual averaae 1,468 1,364 1,544 1,589 3,274 3.540 3,575 3,226 2,492 2,123 1,495 1,399 27,089
1943-67
Monthly averaqtin percent of 5.4 5.0 5.7 5.9 12. 1 13.1 13.2 11.9 9.2 7.8 5.5 5.2 100annual averagt
1943-67

location
16. Marshall Ford Hydroelectric Powerplant
Physical Description
Marshall Ford Hydroelectric Powerplant is atMansfield Dam (Lake Travis) on the Colorado River. 12miles northwest of Austin, Travis County.
Ownership and History of Development
The powerplant is owned and operated by theLower Colorado River Authority as one of a series of sixhydroelectric powerplants on the Colorado River. Theother five are Buchanan, Inks. Granite Shoals, MarbleFalls, and Austin Hydroelectric Powerplants. All of theseare described in this report. The dam was built by theU.S. Bureau of Reclamation. The Lower Colorado RiverAuthority built the power facility. The Marshall Fordplant is the fifth hydroelectric powerplant downstreamfrom Lake Buchanan.
The project was authorized by Permit No. 1260(Application No. 1346), dated May 25, 1938, granted bythe State Board of Water Engineers to the LowerColorado River Authority. The permit grants the right toappropriate 1,500,000 acre·feet of water annually formunicipal, irrigation, mining, recreation, and hydroelectric power purposes.
Several other water rights included in Permit No.1260 recognize earlier water rights of the LowerColorado River Authority (Dowell and 8reeding, 1967).
Construction began in March 1937, followingplans for a dam much lower than the existing dam. Firststages of the low dam were completed in July 1939. OnMay 10, 1939, Congress approved more money, and acontract was awarded to the same builder for additionalfoundation and a higher dam. The present structure wascompleted May 17, 1942. Deliberate impoundmentbegan on September 9, 1940. The first generating unitwas placed in operation January 27, 1941. Dn February21, 1941, the dam was named Mansfield Dam in honorof Congressman J. J. Mansfield, who had been of muchhelp in the project. The powerplant, however, has keptthe name Marshall Ford.
·62·
Three 22,500 kw generating units at Marshall FordHydroelectric Powerplant provide a total capacity forthe powerplant of 67,500 kw. Due to higher operatinghead than originally designed, the units can be overloaded for peak power requirements to 29,000 kweach.
Each of the three vertical generators is a 22,500kw, 3 phase, 60 cycle, 13,800 volt, 144 rpm unit,manufactured by General Electric Company (Figure 17).
Each of the three vertical turbines is an I. P. MorrisCompany, Francis type, 144 rpm unit, with the capacityvarying with the operating head. Each of the units iscontrolled by a Woodward cabinet type governor.
A 16-foot diameter steel penstock connects fromthe lake to each turbine. Each penstock is equipped witha fixed·wheel type headgate.
The operating room is on the top floor andcontains the necessary controls for the generators andtransmission line circuits.
The elevation of the water in the forebay of thepowerplant at maximum power storage space is 681.1feet above msl. The tailbay elevation is 495.0 feet abovemsl, giving a gross head of 186.1 feet. The crest of theuncontrolled spillway of the dam is at 714.1 feet abovemsl, and the capacity above 681.1 feet above msl isreserved for flood control. In special cases where dangerof flooding downstream is not present, the water instorage between elevation 681.1 and 691.1 feet abovemsl may be released by operating the turbines togenerate power instead of discharging the water throughflood gates.
Records of gross monthly hydroelectric powergenerated at the Marshall Ford plant for the years1943·67 were furnished by the Lower Colorado RiverAuthority and are given in the table following. Recordsof power generation before 1943 are not available.

Figure 17.-Three 22,500 kw generalors al Marshall Ford Hydroelectric Powerplanl.Courtesy of Lower Colorado River Authority.
·63·

'"...
Gross generation of electrical energy at Marshall Ford Hydroelectric Powerplant, in Mcgawatthours
YEAR JANUARY FEBRUARY MARCH APRIL MAY JUNE JULY AUGUST SEPTEMBER OCTOBER tlOVEHBER OECEMBER TOTAL
1943 23,954 18,804 16,926 20,961 16,359 17,928 15,710 14,786 6.~25 10,276 8,714 10,288 181,331
1944 8,781 8,198 6,660 7,975 13,657 22,257 29,250 25,870 23,902 20,976 11,134 15,310 193,970
1945 13 ,107 13,880 16,053 15,808 18,229 16,099 29,638 29,689 18,706 14,221 16,649 16,157 218,236
1946 15,565 9,961 11,919 13,349 18,845 15,673 16,344 24,132 19,138 18,654 13,489 15,326 192,395
1947 18,177 16,256 15,056 10,137 13,478 16,498 17,370 14,351 10,825 7,982 7,755 6,236 154,121
1948 6,964 7,573 5,574 7,670 8,912 13 ,219 16,371 15,966 8,444 6,341 4,835 4,584 106,453
1949 4,766 4,249 8,253 6,919 9,044 16,955 17,030 15,196 12,504 9,896 9,327 8,772 122,911
1950 6,129 5,460 4,978 4,513 10,674 13,573 13,596 11,496 5,877 3,568 4,290 4,634 88,788
1951 5,616 3,518 904 4,073 9,683 8,655 11,407 10,798 4,157 2,386 1,319 1,019 63,535
1952 1,013 945 996 2,420 6,200 10,061 10,408 10,383 6,297 1,836 1,219 1,441 53,219
1953 5,260 5,439 3,833 7,517 10,525 15,561 15,570 10,217 2,392 1,495 978 1,796 80,583
1954 422 739 6,163 7,972 17,094 16,929 18,829 13,243 3,596 1.195 2,138 2,349 90.669
1955 2,007 3,355 4,001 7,523 13,546 36,783 26.196 18.834 15,446 19,626 13,964 4,352 165,633
1956 2.356 1,711 6,413 8,009 20.578 18,499 19,177 12,382 4,380 1,905 910 1,077 97,397
1957 1,267 941 1,018 11,110 51,892 50,310 42,873 22.149 17,633 34,540 51,902 40,458 326,093
1958 27,954 26,637 53.182 37,170 31,604 38,566 38,874 23,750 10.760 8,417 4,249 2,081 303,244
1959 4,754 8,224 5.233 11 ,458 18.868 13,841 18.509 28,422 20,048 45,528 40,546 29,129 244.560
1960 24.831 24,879 30,094 25,279 22,931 23,105 22,289 15,568 9,295 7,197 2,287 0 207,755
1961 487 32,463 30.673 26,846 19.065 18,533 31,298 31,046 17,712 5,724 22,193 23,743 259,783
1962 10,065 3,367 1,052 2,420 11,448 13,485 15,079 13 ,485 5,957 1,067 2,410 3,810 83,645
1963 3,540 2,018 3,622 7,821 12,723 14,965 13,504 12.198 8,408 1,055 96 30 79,980
1964 54 0 1 7,179 10,482 11,407 10,085 7,589 5,802 480 0 14 53,093
•

'"'"
Gross generation of electrical energy at Marshall Ford Hydroelectric Powerplant. in Megawatthours--Continued
YEAR JANUARY FEBRUARY MARCH APRIL MAY JUNE JULY AUGUST SEPTEMBER OCTOBER NOVEMBER DECEMBER TOTAL
1q65 0 13 0 4,655 28,570 53,305 14.816 11,488 9.308 4.862 12.321 9,082 14~.420
1966 5.041 2.003 215 16.385 45.444 17.999 15,301 Q.593 7.814 4.047 4.449 206 128.497
1967 0 203 ,.010 16.404 16.770 17,387 11 .324 16.605 7.322 437 0 0 91,462
Total 197.110 200.836 ~37.829 91,573 456.621 511,593 ~90,848 419.236 262,348 233.711 237.174 201.894 3,735.773
Monthly andlannua 1 average 7.684 8,033 9.513 11,663 18.265 20.464 19.643 16.769 10.494 9.34q 9,487 8.076 149.431
1943-67
~onthlv averaQein percent of 5.1 5.4 6.4 7.8 12.2 13.7 n.l 11.2 7.0 6.3 6.4 5.4 100annual average
1943-67

17. Morris Sheppard Hydroelectric Powerplant
(Also known as Possum Kingdom)
Location
Morris Sheppard Hydroelectric Powerplant is atMorris Sheppard Dam (Possum Kingdom Reservoir) onthe Brazos River in Palo Pinto County. 11 milessouthwest of Graford and 18 miles northeast fromMineral Wells.
Ownership and History of Development
The project is owned and operated by the BrazosRiver Authority. It was authorized by Permit No. 1262(Application No. 1351). dated May 9, 1938, and grantedby the State Board of Water Engineers to the BrazosRiver Authority. The permit authorizes an appropriationof 1,500,000 aae-feet of water annually for municipal,industrial, mining, irrigation, recreation, and powergeneration uses.
Construction of the dam was started May 29,1938. The dam was completed and deliberate storagewas begun March 21, 1941. Power generation beganApril 17, 1941.
This project was bu i1t in 1938 with the help of$4,500,000 from the U.S. Public Works Administration.Total cost of the project was $9,000,000. Officially, thedam and reservoir are both named for the late U.S.Senator Morris Sheppard. Locally. the more familiarname is Possum Kingdom. Figure 18 is an aerial view ofthe dam and powerplant.
·66·
Physical Description
The powerplant building is a concrete structurehousing two hydroelectric units with a total capacity of22,500 kw. The operating room is on the top floor andcontains the switchboard, relays, instruments, and otherequipment for controlling the units and flow of electric·ity to the transmission system. The power generated issold to the Brazos River Transmission ElectricCooperative, Inc., for use in its service area.
Each of the two vertical generators is an 11,250kw, 3 phase, 60 cycle, 6,900 volt, 171.4 rpm unitfurnished by the General Electric Company.
Each of the two vertical turbines is anAllis·Chalmers Manufacturing Company, 171.4 rpm,Francis type, with a capacity of 17,000 hp at 125-foothead.
Two 12·foot diameter penstocks made of steelimbedded in concrete convey water from the reservoir tothe turbines. Headgates are installed at the intakestructure to stop the flow of water to the penstockswhen necessary.
Forebay water level with full reservoir is atelevation 1,000.0 feet above msl. The tailwater elevationis 875.0 feet above msl, giving a gross head for theturbine of 125 feet.
Records of gross monthly generation of electricalenergy at the Morris Sheppard Hydroelectric Powerplantfor the period May 1942 to December 1967 have beenfurnished by the Brazos River Authority and are given inthe table following.

·67·
o~t::Jou
E.g'".s'"E~~c:~o~
5l:e-c:.!J!0.
~o"-
'5u.!!.,e"C>
I"C:;E'"o
"E'"0.
~.r;;Vl
.,5.~u.

enCO
Gross generation of electrical energy at Morris Sheppard Hydroelectric Powerplant, in Megawatthours
YEAR JANUARY FEBRUARY MARCH APRIL MAY JUNE JULY AUGUST SEPTEMBER OCTOBER NOVEMBER DECEMBER TOTAL
1942 -- -- -- -- 329 415 790 681 498 597 466 465 4,241
1943 3,720 6,655 7,454 7,081 3,227 4,215 5,060 3,555 704 292 73 55 42,091
1944 532 342 230 151 670 1,112 1,138 2,151 562 1,646 1,596 1,913 12,043
1945 1,842 1.810 2,077 1,789 2,467 3,568 3,445 3,650 1,486 906 701 1,369 25,110
1946 5,010 874 459 1,298 982 1,116 3,506 3,988 5,351 12.263 5,698 5,015 45,560
1947 4,892 2,365 1,082 1,621 5,601 7,105 4,342 3,453 3,106 1,491 941 1,565 37,564
1948 2,106 2,127 1,539 2,410 1,169 3,052 4,212 5,356 2,194 830 931 897 26,823
1949 1,148 1,179 635 368 6,593 14,430 4,573 6,553 6,182 6,257 2.723 1,584 52,225
1950 799 919 1,477 916 4,093 6,985 10,935 10,357 12,924 4,575 1,580 2,185 57,745
1951 4,144 2,040 372 2,050 1,486 4,161 8,250 6.479 3,129 1,652 940 897 35,600
1952 1,438 275 154 526 235 3,223 4,150 3,257 118 17 8 98 13,499
1953 13 0 28 64 221 1,580 3,182 3,221 4,104 4,189 5,106 2,093 23,801
1954 1,286 904 1,367 3,9JJ 15,677 10,726 5,746 4,694 987 480 111 33 45,944
1955 1,199 JJ6 197 366 4,004 11,980 4,886 3,561 5,027 9,461 1,939 745 43,701
1956 3,175 3.965 4,780 2,705 4,683 1,906 6,555 3,122 216 129 475 806 32,5 17
1957 1,478 1,246 524 2,773 17,766 16,348 3,285 2,960 1,906 7,700 8,753 4,490 69,229
1958 2,887 2,064 405 1, JJ2 11.638 3,788 8,762 4,005 1,649 3,622 1,793 1,068 43,013
1959 1,191 284 287 410 1,171 5,995 9,991 1,004 1,071 6,799 1,559 1,668 31,430
1960 2,514 4,272 698 1,501 2,100 1,014 9,148 2,523 2,151 8,887 5,646 4,676 45. 110
1961 2,977 1,934 3,834 3,868 1,046 10,941 16,257 7,811 5,531 2,837 I,OIl 1,929 59,978
1962 2,391 1,880 1,777 636 201 6,067 6,386 8,590 12,030 4,528 4,321 5,836 54,643
1963 4,441 2,037 464 272 4,679 17,342 6,175 3,572 1,234 200 29 285 40,730

0><0
Gross generation of electrical energy at Morris Sheppard Hydroelectric Powerplant, in Megawatthours--Continued
YEAR JANUARY FEBRUARY HARCH APRIL HAY JUNE JULY AUGUST SEPTEHBER OCTOBER 1I0VEHBER DECEHBER TOTAL
1964 745 371 548 I 301 147 2,300 4,450 2,742 1,033 306 414 198 13,555
1965 964 680 490 779 8.047 2.438 2,928 2,47 1 2,717 1,898 1,621 1,298 26,331
1966 1,392 590 2.030 3,846 7,095 780 3.545 1,972 17.722 3,697 0 1,824 44.493
1967 542 374 257 2,288 420 6,204 9,586 3,056 1.706 624 1,764 458 27.279
Total 52,826 39,523 33,165 43,284 105,747 148,791 151,283 104,784 95,338 85,883 50,201 43,450 954.275
Monthly andannua I averaqe 2. \13 1,581 1,327 1,731 4,217 5,935 6,020 4,164 3,794 3,411 1,989 1,719 38.001
1943-67
Monthly averaQein oercent of 5.6 4.2 3.5 4.5 11.1 15.6 15.8 11.0 10.0 9.0 5.2 4.5 100annual averaae
1943-67

18. Denison Hydroelectric Powerplant
Location Physical Description
Denison Hydroelectric Powerplant is at DenisonDam (Lake Texoma) on the Red River between GraysonCounty. Texas, and Bryan County, Oklahoma, 5 milesnorthwest of Denison, Texas.
Two gate controlled penstocks, each 20 feet indiameter, carry the water from Lake Texoma to t\NO56,000 hp turbines. (Three additional penstocks areinstalled for future use.) These turbines are directconnected to 35,000 kw generators giving a totalcapacity of 70.000 kw.
Electric service for the powerhouse and projectarea is provided by two 600 kw hydroelectric unitscompletely isolated from the main power system.
Each of the two vertical generators is a 35,000 kw,3 phase. 60 cycle. 13.800 volt. 90 rpm unit manu·factured by Westinghouse Electric Corporation.
Normal tailwater elevation is about 511.0 feetabOJe msl, giving a maximum operating head for theturbine of 106 feet when the lake is at top of the powerpool.
Each of the two vertical turbines is an S. MorganSmith Company, Francis type, 90 rpm unit with acapacity of 56.000 hp at 102.5-foot net head. Theturbines are controlled by governors manufactured byWoodward Governor Company.
aerial view of DenisonFigure 20 shows the interior
Figure 19 is anHydroelectric Powerplant.of the powerhouse.
The powerhouse contains equipment necessary forthe plant operation located at various floor levels. Theoperating room with switchboard, relays, recordinginstruments, and other control equipment is located inthe south end of the powerhouse overlooking thegenerator floor area.
At top of power storage at elevation 617.0 feetabove msl, the reservoir capacity is 2,722,000 acre-feet,and at bottom of power pool at elevation 590.0 feetabove msl, the power head and sediment storagecapacity is 1.049.000 acre·feet. This gives a storagecapacity of 1.673.000 acre-feet for the production ofhydroelectric power. (Elevation of top of power storagewas raised to 617.50 feet above msl early in 1968.)
The first unit of the Denison HydroelectricPowerplant was placed in service June 10, 1944, andstarted commercial power production July 17, 1944, onan emergency basis at reduced head, due to the shortageof electric power caused by World War II industrialrequirements. The reservoir was filled in March 1945,and operation changed from emergency to normal. Thesecond unit was placed in service September 15, 1949,and commercial production began September 19, 1949.
Ownership and History of Development
Construction started in 1939 and was completedin 1943, with deliberate impoundment in Lake Texomabeginning October 31. 1943.
The project is owned by the U.S. Government andwas built and put in operation by the U.S. Army Corpsof Engineers, Denison District, in 1943. Following WorldWar II, the Denison District was deactivated and theDenison project became part of the Tulsa District. It wasauthorized by the Flood Control Act of June 28.1938.for flood control, power generation, water conservation,and recreational purposes. Public Law 868,Seventy-Sixth Congress, Third Session, designates thebeneficial uses for the project.
Power generated by unit one is sold to the TexasPower and Light Company and distributed by its systemcontrol center in Dallas. The output of unit two is soldto electric cooperatives and utility companies inOklahoma. by the Southwestern Power Administration.the marketing agency for federal power in this area.Power distribution is controlled from the operatingcenter of the Public Service Company of Oklahoma atTulsa, Oklahoma. Generation is normally during thehours of peak power requirement of the two systems.
Records of net monthly generation of power atthe Denison Hydroelectric Powerplant for the periodJune 1944 to December 1967 were furnished by theU.S. Army Corps of Engineers. These records are givenin the table following.
·70·

Figure 19.--Denison Dam and Hydroelectric Powerplant.Courtesy of U.S. Army Corps of Engineers.
Figure 20.··Two 35,000 kw generators at Denison Hydroelectric Powerplant.Courtesy of U.S. Army Corps of Engineers.
·71 .

-J
'"
Net generation of electrical energy at Denison Hydroelectric Powerplant, in Megawatthours
YEAR JANUARY FEBRUARY MARCM APRIL MAY JUNE JULY AUGUST SEPTEMBER OCTOBER tlOVEMBER OECEMBER TOTAL
1944 -- -- -- -- -- 1,021 279 2,025 229 281 245 2,136 6,216
1945 879 1,467 17,061 26,855 27,573 23,438 25,909 27,339 13,917 27,520 11,412 5,391 208,761
1946 22,503 20,430 25,641 21,410 19,571 21,689 21,323 10,988 10,182 16,062 25,261 28,509 243,569
1947 27,799 20,165 10,706 18,396 29,722 28,450 21,825 12,122 11,533 11,000 6,294 11,427 209,439
1948 12,025 11,862 14,343 17,875 14,909 20,753 22,765 13,553 10,548 9,057 10,229 9,322 167,241
1949 11,574 9,500 13,887 10,876 19,048 25,330 11,919 12,255 11,225 13,416 12,475 13,384 164,889
1950 10,998 11,924 7,640 10,215 28,263 30,680 33,944 34,910 31,041 22,429 13,196 13,308 248,548
1951 12,851 13,299 10,229 9,506 22,812 37,061 30,207 14,722 10,858 7,738 6,932 7,706 183,921
1952 11 ,445 7,320 8,150 13,013 11,615 12,854 12,995 14,618 7,236 10,423 6,122 5,373 121,164
1953 6,048 4,518 2,576 7,086 6,451 8,962 11,251 13,322 11,717 9,588 5,008 10,291 96,818
1954 9,349 9,272 11,857 12,234 39,820 48,720 23,244 15,071 10,708 4,681 8,690 8,662 202,308
1955 1,062 3,714 3,433 5,126 15,979 39,749 18,843 17,031 11,414 38,538 24,602 20,873 200,364
1956 17,444 18,058 10,046 4,352 9,353 6,435 7,220 6,364 6,148 49 III 2,945 88,525
1957 9,502 6,022 6,431 14,861 44,266 40,583 23,130 11,906 13,755 28,672 41,283 26,611 267,022
1958 7,709 20,043 7,837 15,591 37,711 11,138 15,056 12,623 8,090 9,121 9,172 6,800 160,891
1959 10,423 3,246 11 ,405 9,880 3,248 10,252 19,774 23,423 13,691 20,239 13,218 30,525 169,324
1960 42,256 36,724 20,914 15,004 13,439 17,736 19,663 11,641 9,842 30,790 16,878 27,345 262,232
1961 27,258 10,784 14,739 30,490 10,815 13,558 16,385 12,956 16,772 25,739 24,365 23,621 227,482
1962 16,005 8,205 6,215 10,014 6,376 46,668 23,541 22,528 18,771 22,952 20,674 30,904 232,853
1963 21,431 4,340 6,710 13,223 12,292 13,443 13,804 10,385 5,961 4,846 3,270 4,870 114,575
1964 5,539 5,973 4,853 7,229 7,414 8,433 11,394 10,451 4,652 4,706 3,731 4,259 78,634
1965 9,047 9,147 8,077 9,148 10,535 13,740 17,111 15,675 13,436 10,707 13,582 10,458 140,663

"w
Net generation of electrical energy at Denison Ilydroelectric Powerplant, in Megawatthours--Continued
YEAR JANU.ARY FEBRUARY MARCH APRIL MAY JUNE JULY AUGUST SEPTEMBER OCTOBER tlOVEMBER OECEMBER TOTAL
1966 16,475 9,337 6,630 14,069 29,060 18,009 18,462 11,084 17,604 20,750 12,443 12,377 186,300
1967 7,497 7,899 3,732 5,270 11,248 14,757 13,754 14,587 13,549 10,277 7,585 4,805 114,960
Total 317,119 253,249 33,112 301,723 431,520 513,459 433,798 351,579 282,879 359,581 296,778 321,902 4,096,699
Monthly andnnual average 13,788 11,011 10,135 13,118 18,762 22,280 18,848 15,198 12,289 15,622 12,893 13,903 177,847
1945-67
onthly averageI n percent of 7.8 6.2 5.7 7.4 10.6 12.5 10.6 8.5 6.9 8.8 7.2 7.8 100annual average
1945-67

Location
19. Whitney Hydroelectric Powerplant
Physical Description
Whitney Hydroelectric Powerplant is at WhitneyDam (Whitney Reservoir) on the Brazos Aiver in Hill andBosque Counties. 7 miles southwest of Whitney and 38miles upstream from Waco.
Ownership and History of Development
The project is owned by the U.S. Government andis operated by the U.S. Army Corps of Engineers. FortWorth District. It was built under authority of the FloodControl Act of August 18.1941. (Public Law 228. 77thCongress. First Session) and of December 22. 1944.(public Law 534. 78th Congress. Second Session).
Construction of the project began May 12. 1947.The main dam and spillway were completed in April1951, and deliberate impoundment in Whitney Reservoirbegan December 10. 1951. The first of two 15.000 kwgenerating units was placed in operation June 25, 1953.However, due to lack of water and a permanent powercontract, the plant was operated on an emergencycontract until June 1. 1955. The Whitney Powerplant.Dam, and switchyard are shown in Figure 21. Thegenerating units and part of Whitney Dam are shown inFigure 22.
The power generated at Whitney HydroelectricPowerplant is sold to the Brazos Electric PowerCooperative, Inc., by the Southwestern PowerAdministration, marketing agency for federal power inthis area. The power distribution to the service area iscontrolled from the operating center in Waco. Generation is normally during the hours of peak powerrequirement of the system.
·74·
Two gate controlled penstocks, each 16 feet indiameter, carry the water from Lake Whitney to two20,700 hp turbines. These turbines are direct connectedto 15,000 kw generators giving a total capacity of30.000 kw.
Each of the two vertical generators is a 15,000 kw,3 phase. 60 cycle. 13.800 volt. 128.6 rpm unit manu·factured by Allis-Chalmers Manufacturing Company.
Each of the two vertical turbines is a NewportN~ws Shipbuilding and Dry Dock Company, Francistype. 128.6 rpm unit. with a capacity of 24.000 hp at88-foot head. The turbines are controlled by governorsmanufactured by Woodward Governor Company.
The powerhouse equ ipment necessary for theplant operation is located at various floor levels. Theoperating room with switchboard, relays, recordinginstruments, and other control equipment is at elevation475.0 and the generator floor elevation is 458.0 feetabove msl.
Of the reservoir capacity. 131.700 acr..feet isallocated to the production of hydroelectric power. Thisregulated discharge through the turbines may be useddownstream for agriculture, municipal, and industrialpurposes. The maximum elevation of this power storageis 520.0 feet above msl and the normal tailwaterelevation is 431.2 feet above msl. giving an operatinghead for lhe turbines of 88.8 feet. (Effective January 24.1968, the power storage elevation was changed from520.0 to 522.0 feet above msl.l
Records of net monthly generation of electricalenergy at the Whitney Hydroelectric Powerplant for theperiod June 1953 to December 1967 have been fur·nished by the U.S. Army Corps of Engineers. Theserecords are given in the table following.
•
•

Figure 21.·-Whitney Hydroelectric Powerplant, Dam, and switchyard.Courtesy of U.S. Army Corps of Engineers.
Figure n.--Two 15,000 kw generators (in foreground) at WhitneyHydroelectric Powerplant. Part of downstream side ofWhitney Dam is seen through the window. Courtesy ofU.S. Army Corps of Engineers.
- 75-

....'"
Net generation of electrical energy at Whitney Hydroelectric Powerplant, in Hegawatthours
YEAR JANUARY FEBRUARY HARCH APRIL MAY JUNE JULY AUGUST SEPTEMBER OCTOBER IIOVEMBER DECEMBER TOTAL
1953 -- -- -- -- -- 367 1,531 1,222 3~ 33 208 21 3,~16
195~ ~7 ~2 36~ 2,506 7,257 6,959 ~, 725 3,~55 1,072 1,139 23 -71 27,518
1955 -72 -60 28 50 4,~37 15,330 ~,392 2,939 6,350 12,26~ 1,931 1,788 ~9 ,377
1956 2,376 2,~0~ 2,319 2,~73 6,90~ 2,~~8 6,533 2,922 2,236 2, 4~6 -66 -83 32,912
1957 2,350 2,353 2,~33 5,298 22,28~ 22,~~6 6,6~9 2,416 2,~76 8,773 10,676 7,330 95, 48~
1958 6,732 4,~03 6,920 6,922 15,119 ~,810 9,038 ~, 128 2,~93 2,~99 2,517 2,~35 68,016
1959 2,398 2,47~ 2,~~~ 2,311 2,~91 2,~50 6,952 2,973 2,~69 12,692 2,9~9 5,997 ~8,600
1960 11,563 8,073 3,680 3,98~ 5,6~~ 2,~57 7,7~6 2,463 2,~65 9,208 7,166 5,~61 69,910
1961 10,792 12,359 8,226 3,8~1 2,~6~ 10,791 17,~82 7,~19 3,2~8 8,677 3,O~8 3,562 91,909
1962 2,33~ 2,501 2,377 2,~96 2,365 8,832 5,297 10,786 13,389 8,793 ~ ,197 5,~92 68,859
1963 3,637 2,~68 2,~92 2,~52 5,364 15,939 6,209 2,709 2,~~7 2,~3~ 1,145 776 ~8,O72
196~ 7~0 760 809 1,126 2,508 2,81~ 2,870 2,658 1,256 836 1,192 2,~30 19,999
1965 2,~13 6,907 2 ,~51 2,375 15,106 2,939 2,500 2,289 1,956 2,235 3,29~ 2,18~ ~6,6~9
1966 2,~50 2,127 2,58~ 3,193 13,739 3,759 3,196 1,733 16,8~2 6,187 2,~7~ 2,~18 60,702
1967 985 558 565 2,522 2,582 3,812 5,528 5,128 I,~OO 716 2,845 2,705 29,346
Note. -- egative f gures s ow stat i n requi r ments i excess f gene rat on
Total ~8,7~5 ~7,369 37,692 ~1 ,5~9 108,26~ 106,153 90,6~8 55,2~0 60,133 78,932 ~3,599 ~2,~~5 760,769
Monthly andannual average 3,~82 3,38~ 2,692 2,968 7,733 7,556 6,366 3,858 4,293 5,6)6 3,099 3,030 54,097
195~-67
Monthly averagein percent of
6.~ 6.3 5.0 5.5 1~, 3 I~,O 11.8 7. I 7.9 10.~ 5.7 5.6 100annual average1954-67
•

Location
20. Granite Shoals Hydroelectric Powerplant
Physical Description
Granite Shoals Hydroelectric Powerplant is atWirtz (Alvin J.) Dam (Lake Lyndon B. Johnson) on theColorado River, 4 miles southwest of Marble Falls,Burnet County.
Ownership and History of Development
The powerplant is owned and operated by theLower Colorado River Authority as one of a series of sixhydroelectric powerplants on the Colorado River. Theother five are Buchanan, Inks, Marble Falls, MarshallFord, and Austin Hydroelectric Powerplants. GraniteShoats is the third plant downstream from LakeBuchanan and uses the controlled discharge of waterfrom the Buchanan Hydroelectric Powerplant togetherwith the added flow of the llano A iver for powergeneration.
The project was authorized by Permit No. 953(Application No. 1023). dated May 15. 1926, granted bythe State Board of Water Engineers to the SyndicatePower Company. The permit allocates 1,305,000 acrefeet of water for conservation, irrigation, and powergeneration uses. The ownership of this permit eventuallywas vested in the Lower Colorado Aiver Authority(Dowell and Breeding, 1967).
Construction of the project was begun inSeptember 1949 and was completed in November 1951,with deliberate impoundment of water in Lake LyndonB. Johnson in May 1951. Power generation started June27, 1951.
Water released from Lake Lyndon B. Johnsonthrough the powerplant is subsequently used forgeneration of power at Marble Falls, Marshall Ford, andAustin Hydroelectric Powerplants.
- 77·
Two 22,500 kw generating units at Granite ShoalsHydroelectric Powerplant provide a total capacity of45,000 kw.
Each of the two vertical generators is a 22,500 kw.3 phase, 60 cycle, 13,600 volt, 100 rpm unit manufactured by General Electric Company (Figure 23).
Each of the vertical turbines is an I. P. Morris,Francis type, 100 rpm unit, with a capacity of 35,400hp at the design head of 83.0 feet. The turbines arecontrolled by Woodward cabinet type governors.
Normal lake elevation is 825.0 feet above msl. andthe tailwater varies from no load elevation 738.0 to fullload 842.0 feet above msl.
A concrete intake structure guides the flow ofwater to the penstock and turbine scrollcase. The flow isover a weir section with a taintor gate 29 feet high by 45feet long for controlling the flow to the penstock.
As the water is taken from near the surface of thelake, a trashrack is installed ahead of the gate.
When these generators are used as synchronouscondensers for voltage regulation, the water in the drafttube is depressed below the turbine runner by injectionof compressed air.
Records of gross monthly power generation forthe Granite Shoals plant through December 1967 werefurnished by the Lower Colorado River Authority andare given in the table following.

....'"
Figure 23.-·Two 22.500 kw generators at Granite Shoals HydroelectricPowerplant. Control room is at upper right.
• • •

"<D
Gross generation of electrical energy at Granite Shoals Hydroelectric Powerplant, in Megawatthours
YEAR JANUARY FEBRUARY MARCH APRIL MAY JUNE JULY AUGUST SEPTEHBER OCTOBER UOVEMBER DECEMBER TOTAL
1951 -- -- -- -- -- 141 6,268 7,775 4,361 2,189 862 308 21,904
1952 597 7 124 135 1,911 3,523 8,084 7,954 4,002 234 824 3,541 30,936
1953 2,915 1,734 751 871 4,971 2,509 620 1,571 3,467 3,177 1,470 1,056 25, \12
1954 2,236 838 814 1,353 17,644 6,054 4,454 1,483 1,084 837 188 267 37,252
1955 679 1,235 294 670 \1,136 16,471 11,435 8,676 8,278 7,576 3,945 I ,898 72,293
1956 2,623 179 153 1,034 15,756 4,677 1,470 1,620 2,272 624 1,428 1,004 32,840
1957 1,052 1,292 977 8,530 30,991 17,634 4,638 7,272 2,573 15,346 12,070 7,268 109,643
1958 10,053 12,571 11,056 7,944 10,321 9,770 7,922 2,879 4,473 2,203 2,800 4,697 86,689
1959 3,599 1,079 1,604 2,284 1,863 6,749 13,084 6,862 2,483 17,675 5,185 7,269 69,736
1960 9,821 10,129 5,534 6,990 4,235 6,566 5,258 8,105 2,130 2,090 1,611 5,032 67,501
1961 4,767 6,275 6,607 4,987 4,342 15,615 9,145 7,136 5,628 6,800 4,666 5,643 81,611
1962 5,214 2,890 383 1,356 1,149 1,979 3,314 4,812 6,810 10,443 1,226 632 40,208
1963 1,303 1,425 17 842 226 67 423 660 644 0 1,269 1,344 8,220
1964 755 1,615 1,857 2,105 5,548 5,339 5,257 3,276 9,762 1,658 1,971 706 39,849
1965 683 5,752 1,030 813 17,872 8,000 1,247 3,541 1,706 954 1,224 1,463 44,285
1966 754 856 587 5,478 10,758 2,903 3,480 1,683 10,302 3,620 434 982 41,837
1967 818 3,172 649 206 2,969 3,253 5,197 4,109 3,929 1,731 1,257 942 28,232
Total 47,869 51,049 32,437 45,598 141,692 111,250 91,296 79,414 73 ,904 77,157 42,430 44,052 838,148
Monthly andannual average 2,992 3,191 2,027 2,850 8,856 6,944 5,314 4,477 4,346 4,686 2,598 2,734 51,015
1952-67
Monthly averagein percent of
5.9 6.2 4.0 5.6 17 .4 13.6 10.4 8.8 8.5 9.2 5.1 5.3 100annual average1952-67

Location
21. Marble Falls Hydroelectric Powerplant
Physical Description
Marble Falls Hydroelectric Powerplant is atStarcke (Max) Dam (Marble Falls Lake) on the ColoradoRiver, 1.5 miles southeast of Marble Falls, BurnetCounty.
Ownership and History of Development
The powerplant is owned and operated by theLower Colorado River Authority as one of a series of sixhydroelectric powerplants on the Colorado A iver. Theother five are Buchanan, Inks, Granite Shoals, MarshallFord, and Austin Hydroelectric Powerplants. MarbleFalls is the fourth plant downstream from LakeBuchanan. It uses the controlled discharge fromBuchanan Hydroelectric Powerplant. together with theadded flow of the Llano River and further regulation bythe Granite Shoals Hydroelectric Powerplant. for powergeneration. The turbines discharge into Lake Travis.
The project was authorized by Permit No. 998(Application No. 1022). dated November 4. 1927,granted by the State Board of Water Engineers toSyndicate Power Company. The ownership of the permitlater was vested in the Lower Colorado River Authority(Dowell and Breeding. 1967). The permit allocates1,305,000 acre-feet of water for conservation, irrigation,and power generation.
Construction was begun in November 1949, andwas completed in October 1951. Deliberate impoundment of water began in July 1951. Power generationstarted September 25, 1951.
Two 15,000 kw generating units at Marble FallsHydroelectric Power plant provide a total capacity of30.000 kw.
This plant is operated during the same time periodas Granite Shoals and its turbines are rated for the samewater requirements as those at Granite Shoals, so there islittle change in the lake elevation.
Each of the two vertical generators is a 15,000 kw,3 phase, 60 cycle. 6,900 voit. 120 rpm unit manufactured by Westinghouse Electric Corporation (Figure24).
Each of the vertical turbines is an S. MorganSmith, fixed blade propeller type. 120 rpm unit, with acapacity of 22,500 hp at the design head of 57 feet. Theturbines are controlled by Woodward cabinet typegovernors.
Normal lake elevation is 738.0 feet above msl andthe tailwater is about elevation 681.0 feet above msl(unless Lake Travis is above this elevation).
A concrete intake structure gu ides the flow ofwater to the penstock and turbine scrollcase. The flow isover a weir section with a taintor gate, 29 feet high by45 feet long, for contrOlling the flow to the penstock. Asthe water is taken from near the surface of the lake, atrashrack is installed ahead of the gate.
Records of gross monthly power generation forthe Marble Falls plant through December 1967 werefurnished by the Lower Colorado River Authority andare given in the table following.
- 80-
•

- 81 -
~
'"~~"c:"'"~oo0,
'"

co'"
Gross generation of electrical energy at Marble Falls Hydroelectric Powerplant, in Megawatthours
YEAR JANUARY FEBRUARY MARCH APRIL MAY JUNE JULY AUGUST SEPTEMBER OCTOBER NOVEMBER DECEMBER TOTAL
1951 -- -- -- -- -- -- -- -- 180 871 533 222 1,806
1952 393 19 0 105 1,276 2,243 5,026 5,409 679 124 471 2,274 18,019
1953 1,726 966 397 537 2,964 1,430 325 962 1,947 1,909 270 571 14,004
1954 1,191 410 477 674 10,831 3,507 2,539 817 553 470 70 84 21,623
1955 355 685 140 325 6,676 7,569 6,800 5,244 5,011 4,223 2,166 1,020 40,214
1956 1,398 52 SO 553 9,552 2,695 762 921 1,279 335 782 521 18,900
1957 561 691 572 5,102 14,362 8,169 2,557 4,139 1,475 8,656 6,649 3,986 56,919
1958 6,052 7,400 6,209 4,552 5,950 5,629 4,660 1,581 2,476 1,123 1,522 2,639 49,793
1959 1,985 666 902 1,325 1,051 4,237 7,839 4,123 1,376 9,257 2,878 4,561 40,200
1960 6,016 6,041 3, II 0 4,125 2,499 3,938 3,027 4,891 1,162 1,248 841 2,892 39,790
1961 2,797 3,300 3,825 2,852 2,472 9,423 5,467 4,188 3,247 3,957 2,566 3,124 47,218
1962 3,006 1,662 196 751 578 1,002 1,780 2,524 3,899 6,112 698 355 22,563
1963 729 841 10 482 136 31 193 315 359 0 754 725 4,575
1964 406 910 1,066 I ,151 3,098 2,864 2,952 1,727 6,052 965 1,098 352 22,641
1965 324 3,532 521 409 9,886 3,794 632 1,856 916 648 720 869 24,107
1966 401 484 315 3,217 5,956 1,484 1,891 883 5,735 1,840 239 546 22,991
1967 424 1,896 230 96 1,602 1,696 2,761 2,314 2,218 992 665 476 15,370
Total 27,764 29,555 8,020 26,256 78,889 59,711 49,211 41,894 38,564 42,730 22,922 25,217 460,733
Monthly and 1,562nnual average 1,735 1,847 1,126 1,641 4,931 3,732 3,076 2,618 2,400 2,616 1,399 28,683
1952-67
Monthly averagEin percent of
6.1 6.4 3.9 5.7 17.2 13.0 10.7 9.1 8.4 9.1 4.9 5.5 100annual averagE1952-67

22. Falcon Hydroelectric Power plant
Location
Falcon Hydroelectric Powerplant is at Falcon Dam(International Falcon Reservoir) on the Rio Grande, 3miles west of Falcon Heights, Starr County. Texas.
Ownership and History of Development
The project is owned by the United States andMexico and is operated by the International Boundaryand Water Commission, United States and Mexico.
The Falcon project was authorized by the WaterTreaty of 1944 between the United States and Mexico.The project was built by the International Boundary andWater Commission, United States and Mexico, forconservation, irrigation, hydroelectric power, recreation,and flood-control uses. Under the terms of the treaty.the United States receives 58.6 percent of the conservation storage and Mexico receives 41.4 percent.
Plans for the dam and two powerplants, one in theUnited States and one in Mexico, were approved in thefall of 1949, construction began in 1950, and the damwas completed April 18, 1954. Deliberate impoundmentbegan August 25, 1953, and the project was dedicated inOctober 1953. Generation of electricity began October11, 1954. Power generation is divided equally betweenthe United States and the Mexico powerplants, Powerfrom the United States plant is distributed by CentralPower and Light Company.
Physical Description
There are two powerplants at Falcon Dam-one onthe United States side and one on the Mexico side. Eachplant has three 10,500 kw generating units, withprovision for a fourth unit when justified. The presenttotal capacity for both plants is 63,000 kw. Each planthas an operating room with all the necessary controlequipment. The two plants are interconnected for thetransfer of electric energy from one to the other or froman outside supply.
Each of the three vertical generators in each plantis a 10.500 kw, 3 phase, 60 cycle, 6,900 volt, 163.6 rpmunit with a direct connected exciter (Figure 25). Thegenerators and control equipment were furnished by theGeneral Electric Company.
Each of the three vertical turbines is anAllis-Chalmers Manufacturing Company, 163.6 rpm,Francis type, with a capacity of 14,750 hp at 100-foothead. Each turbine is controlled by a Woodwardgovernor.
Four 13·foot diameter steel penstocks (one forfuture use) are imbedded in the intake structure at theUnited States plant, with trashracks and provisions forstop logs. The flow to the penstocks is controlled byvertical fixed wheel type gates.
The Mexico powerplant equipment is identical tothe United States plant except for penstock arrange·ment. Here, one 22-foot diameter steel penstock fromthe reservoir branches into four 13-foot diameter steelpenstocks at the power house. The flow to each of the 3turbines is controlled by butterfly valves.
Forebay water level is at elevation '301.2 feetabove msl when reservoir is full to top of winterconservation storage space. No-load tailwater elevation is175.0 feet above msl; with full load, six units, thetailwater rises to elevation 181.0 feet above msl.
International Falcon Reservoir has a summerstorage capacity (April to September) of 2,371,200acre·feet at a level of 296.4 feet above msl (top ofsummer conservation storage space). Above this level,there is 909,500 acre-feet of flood control storagecapacity. During the winter (October to March), anadditional 400,000 acre· feet are allowed for conservation storage, with a corresponding loss of flood-controlstorage capacity.
Discharges of water from International FalconReservoir are made only when required by downstreamdemands for water or to release water in flood-controlstorage. No discharge is made for power generationalone.
Power generation is divided between the twopowerplants on a basis of water demands downstream.Meters record the flow in cubic feet per second and alsoconvert it to acre-feet. Each powerplant is equipped withtwo valve-controlled low-flow outlets for water releaseswhen the turbines are not operating.
Records of gross monthly power generation at theUnited States Falcon Hydroelectric Powerplant werefurnished by the International Boundary and WaterCommission, United States and Mexico, through 1'967and are given in the table following.
- 83·

- 84-

00rn
Gross generation of electrical energy at the United States Falcon Hydroelectric POvlerplant, in Megawatthours
YEAR JANUARY FEBRUARY MARCM APRIL MAY JUNE JUL Y'[ AUGUST SEPTEMBER OCTOBER tIOVEI~BER DECEMBER TOTAL
1954 -- -- -- -- -- -- -- -- -- 2,528 2,431 7,867 12,826
1955 15,378 10,679 6,535 15,088 18,780 14,630 2,064 9,059 100 183 7,635 7,262 107,393
1956 13,142 13,008 6,557 5,062 7,127 5,943 323 562 1,902 715 809 4,949 60,099
1957 3,410 0 43 504 5,929 6,661 4,938 9,152 6,623 8,716 4,228 5,246 55,450
1958 1,992 620 I ,068 10,433 11,346 17,059 3,586 5,907 6,837 27,315 23,438 20,739 130,340
1959 10,635 17,364 17,702 9,178 15,957 12,147 11,176 5,592 12,457 4,672 1,915 6,348 125,143
1960 17,641 12,349 3,236 7,413 12,018 21,092 8,215 4,075 1,855 4,250 I ,908 1,609 95,661
1961 3,446 4,484 17,021 12,216 19,516 9,758 6,649 9,483 9,156 4,213 2,468 6,253 104,663
1962 13,875 17,455 3,027 10,564 15,894 14,180 3,187 3,125 1,661 3,243 2,864 2,453 91,528
1963 5,200 8,964 6,799 16,528 1,133 9,651 3,481 4,848 1,275 2,115 958 2,262 63,214
1964 2,453 1,705 4,566 10,743 10,036 4,433 3,318 2,832 1,753 7,060 4,928 5,698 59,525
1965 18,256 6,438 5,620 17,625 16,043 13,369 10,464 3,927 6,602 1,775 1,964 I ,998 104,081
1966 2,545 1,999 2,277 4,397 2,383 8,674 7,693 9,692 20,852 3,587 4,631 5,533 74,263
1967 7,439 7,132 7,463 18,374 13,339 8,045 5,861 6,499 15 15,861 388 3,301 93,717
Total 115,412 102,197 81,914 138,125 149,501 145,642 70,955 74,753 71,088 86,233 60,565 81,518 ,177,903
Monthly andannual average 8,878 7,861 6,301 10,625 11,500 11,203 5,458 5,750 5,468 6,439 4,4]2 5,665 89,621
1955-67
Monthly averagein percent of 9.9 8.8 7.0 11.9 12.8 12.5 6.1 6.4 6.1 7.2 5.0 6.3 100annual average
1955-67

Location
23. Sam Rayburn Hydroelectric Powerplant
Physical Description
Sam Rayburn Hydroelectric Powerplant isat Sam Rayburn Dam (Sam Rayburn Reservoir) on theAngelina River in the Neches River basin in JasperCounty, 11 miles northwest of Jasper.
Ownership and History of Development
The project is owned by the U.S. Government, andis operated by the U.S. Army Corps of Engineers, FortWorth District. It formerly was called the McGee Bendproject.
The project was authorized by the River andHarbor Act approved March 2, 1945, 79th Congress,First Session, and modified by River and Harbor Act ofJune 30, 1948, Public Law 858, 80th Congress, SecondSession. The Lower Neches Valley Authority paid$3,000.000 toward the construction of Sam RayburnDam and has agreed to pay an additional $10.000.000for water supply benefits at the rate of $200.000annually for a period of 50 years after completion ofproject. The first payment was made in December 1965.
Construction started in September 1956 and wascompleted July 1. 1966. Deliberate impoundment ofwater began March 29, 1965. Power generation began inSeptember 1965 with limited output during the equipment testing period. Commerical power productionbegan July 1, 1966.
Water released through the hydroelectric powerplant is used for municipal, industrial, and irrigationpurposes by the Lower Neches Valley Authority underPermit No. 2124 (Application No. 2298), dated October13,1964, granted by the Texas Water Commission to theLower Neches Valley Authority.
The power generated at Sam Rayburn hydroelectric plant is sold to the Sam Rayburn Dam ElectricCooperative, Inc., by the Southwestern PowerAdministration, marketing agency for federal power inthis area. The power is supplied, through the transformers and switch station, to the transmission systemof the Gulf States Utility Company. Power distributionto the service area is controlled from the operatingcenter in Beaumont. Generation is normally during thehours of peak power requirement of the system.
The powerhouse and water control structure islocated near the right abutment of the dam. This oneconcrete structure, consisting of the powerhouse, intakestructure, outlet works, and roadway, was built on aheavy concrete foundation which rests on a sandformation (Figure 26). Two gates in the intake structurecontrol the flow of water from the reservoir to eachturbine scrollcase.
Each of the two vertical generators is a 26,000 kw,3 phase. 60 cycle. 13.800 volt. 120 rpm unit manu·factured by Westinghouse Electric Corporation (Figure27).
Each of the two vertical turbines is anAllis-Chalmers Manufacturing Company, Kaplan pro·peller type, 120 rpm unit with a capacity of 41,000 hpat 70-foot head. The turbines are controlled by governors manufactured by Baldwin-lima-HamiltonCorporation (Pelton Division).
The dam, powerhouse, and switchyard equipmentis manually operated from a central control roomlocated at elevation 1,350 feet above msl. The operatorhas surveillance of the outside areas by wired television.
At the top of the power pool. elevation 164.0 feetabove msl, the reservoir has a capacity of 2,852,600acre·feet with 1,400,600 acre·feet allocated to theproduction of hydroelectric power with a 15-footdrawdown. The storage below elevation 149.0 feet abovemsl is for power head and sediment reserve.
With both units operating with full load, thetailwater elevation is about 94.0 feet above msl, giving agross head of 70.0 feet when the reservoir is at powerpool elevation 164.0 feet above msl. Under theseconditions, with full head each turbine discharges about5,650 cfs.
Records of net monthly generation of electricalenergy at the Sam Rayburn Hydroelectric Powerplantfor the period September 1965 to December 1967 werefurnished by the U.S. Army Corps of Engineers. Theserecords are given in the table following.
·86·

Sl:-i:!~ ' .. - . .
Figure 26.--Sam Rayburn Hydroelectric Powerplant and water control structure.Courtesy of U.S. Army Corps of Engineers.
Figure 27.--Two 26.000 kw generators at Sam Rayburn HydroelectricPowerplant. Courtesy of U.S. Army Corps of Engineers.
- 87-

&3
Net generation of electrical energy at Sam Rayburn Uydroelectric Powerplant, in Hegawatthours
YEAR JANUARY FEBRUARY MARCH APRIL MAY JUNE JULY AUGUST SEPTEMBER OCTOBER NOVEMBER DECEMBER TOTAL.
1965 -- -- -- -- -- -- -- -- 2 -38 -93 -92 -221
1966 -64 -60 -80 -79 142 263 4,029 3.556 3.158 3.641 3,524 1,803 19,833
1967 909 -113 473 964 534 2,476 2,188 4.330 2.229 1.119 35 756 15,900
INote. -Negative figures how sta ion requ rement i excess pf genera ion.
• , •

24. Amistad Hydroelectric Powerplants
Location
Two hydroelectric powerplants, one in the UnitedStates and the other in Mexico, are proposed at AmistadDam (Amistad Reservoir) on the Rio Grande in ValVerde County, Texas. and Estado de Coahuila, Mexico,12 miles northwest of Del Rio, Val Verde County,Texas.
Ownership and History of Development
The dam is under construction. It will be ownedby the United States and Mexico, and will be operatedby the International Boundary and Water Commission.United States and Mexico. At the end of 1967,penstocks were being installed for an ultimate generatingcapacity of 80,000 kw at each of the two proposedpowerplants, one in the United States and the other inMexico. However, no construction plans had been madefor a powerplant on the United States side at that time.
Agreement with Mexico for joint construction ofAmistad Dam by the governments of the United Statesand of Mexico, in accordance with the provisions of theWater Treaty of 1944, was authorized by the Congressof the United States in Public Law 86-605, July 7. 1960.
Construction of Amistad Dam is handled by thetwo governments through their respective sections of theInternational Boundary and Water Commission, UnitedStates and Mexico.
The project will provide for water conservation,irrigation, hydroelectric power, flood control, and recreation.
Under terms of the treaty, the United States willget 56.2 percent of the conservation storage and Mexicowill get 43.8 percent. Power generation, when developedat two plants at the Amistad Dam, one in the United
- 89-
States and the other in Mexico, will be divided equallybetween the two countries. Of all the sites studied forpossible location of Amistad Dam, the BoundaryCommission found the Diablo site (Amistad), one milebelow Devils River and 12 miles upstream from the cityof Del Rio, to be the most suitable (International80undary and Water Commission, 1958, p. 59). With adam at Amistad of the height contemplated, powerreleases of water at a head of 138 feet or higher can bemade 80 percent of the time. With a head of 104 feet orhigher, releases can be made 90 percent of the time, foran average of 1,126,000 acre-feet annually (International80undary and Water Commission. 1958. p. 85).
The International Boundary and WaterCommission, in a study of Rio Grande streamflow at theAmistad site covering a 57-year period, indicated there isa water supply sufficient for a hydroelectric generatingcapacity of 75.000 kw (United States share) durin9 81percent of the time studied. Also, that 100,000 kwcould be developed 62 percent of the time.
Releases of water at Amistad for production ofhydroelectric energy will be subordinate to the releasesfor domestic and irrigation use. The general plan ofoperation will be that demands for capacity and energywould be met first to the extent available at the FalconHydroelectric Powerplant, with any additional capacityand energy needed being supplied by the AmistadHydroelectric Powerplant when built (InternationalBoundary and Water Commission. 1958, p. 87).
The preliminary work of relocating highways,railroads, pipelines, and other facilities began in October1961. The first actual construction at the site began inAugust 1963 with the drilling and pressure grouting ofthe rock foundation. Construction of the dam began inJanuary 1965 and is scheduled for completion in March1969.

location
25. Toledo Bend Hydroelectric Powerplant
Physical Description
Toledo Bend Hydroelectric Powerplant will be atToledo Bend Dam (Toledo Bend Reservoir) on theSabine River in Newton County. Texas, and SabineParish, Louisiana, about 14 miles northeast ofBurkeville, Texas.
Ownership and History of Development
The project will be owned and operated by theSabine River Authorities of Texas and Louisiana.
The Texas share of the water to be appropriatedfrom Toledo Bend Reservoir is authorized by Permit No.1994 (Application No. 2191). dated September 23,1961, granted by the Board of Water Engineers to theSabine River Authority of Texas. The permit authorizesa maximum appropriation of 750,000 acre-feet of waterannually. Of this, 600,000 acre-feet is for industrial use,100,000 acre-feet for municipal use, and 50,000 acrefeet for irrigation use. The permittee is authorized to usewater for generation of hydroelectric power at a rate offlow not to exceed 16,000 cts_ The use of water forhydroelectric power generation is subordinate to the useof water for municipal, industrial, and irrigation purposes. Power generation will be coordinated with theseother requ irements to obtain the max imum use of water.
Power production will be sold to electric utilitycompanies serving the area, to supplement steam powergeneration.
Construction of the project began May 11, 1964,and was 98.6 percent complete at the end of December1967.
- 90-
The powerplant will contain two 41,500 kwgenerating units providing a total capacity of 83,000 kw.The installation of power equipment was nearing com·pletion at the end of December 1967.
Each of the two vertical generators will be a41,500 kw, 3 phase, 60 cycle, 13,800 volt, 100 rpm unitfurnished by Allis-Chalmers Manufacturing Company.
Each of the two vertical turbines will be an EnglishElectric Company, 100 rpm Kaplan propeller type, witha capacity of 58,500 hp at 68-foot head_ Each unit willbe controlled by a high pressure actuator type governorfurnished by Baldwin-Lima-Hamilton Corporation. Theturbine runner is shown in Figure 28.
Water to each turbine will be supplied through anintake structure consisting of three reinforced concretepassages. The flow of water will be controlled by electrichoist operated Broome type gates.
Headwater (top of conservation storage space) willbe at elevation 172.0 feet above msl. With one unitrunning, the tailwater will be at elevation 91.0 feetabove msl, giving gross head of Bl.0 feet. With bothunits running, the tailwater will be at elevation 102.0feet above msl, giving a gross head of 70.0 feet. •

Figure 28.--Turbine runner being lowered into position at ToledoBend Hydroelectric Powerplant. Courtesy of SabineRiver Authority of Texas.
·91 .


REFERENCES
Clay. Comer, 1948, The Lower Colorado RiverAuthority, a study in politics and public administration: Thesis, Univ. Texas at Austin, 397 p.
Dowell, C. L., 1929. At last America accepts the Kaplanturbine: Power Plant Eng., v. 33, p. 757-760.
__1932, Eagle Pass hydro development featuresirrigation and power projects: Electrical South, Apr.,p. 34·36, 62.
Dowell, C. L., and Breeding, S. D., 1967, Dams andreservoirs in Texas, historical and descriptive information, December 31, 1966: Texas Water Devel.Board Rept. 48, 268 p.
International Boundary and Water Commission, UnitedStates and Mexico, 1958, Rio Grande international
- 93-
storage dams project-report on proposed DiabloDam and Reservoir: El Paso, Texas, 119 p.
Long, W. E., 1956, Flood to faucet: Austin, Texas, TheSteck Co., 116 p.
McDonough, Clarence, 1940, Historic Austin Damrebuilt: Eng. News·Rec., v. 124, no. 23, p. 844-847.
Mead, D. W" 1917, Report on the dam and water powerdevelopment at Austin, Texas: Madison, Wisconsin,Daniel W. Mead and Charles V. Seastone, ConsultingEn9ineers, 205 p.
Taylor, T. U., 1900, The Austin Dam: U.S. Goo!. SurveyWater·Supply and Irrigation Paper No. 40, 52 p.
__1904, The water powers of Texas: U,S, Geol.Survey Water-Supply and Irrigation Paper No. 105,116 p.

•
Copyright © 2022 FDOKUMEN