Maina_Unpublished (MSc)_2016.pdf - Ubrisa Home
136
i UNIVERSITY OF BOTSWANA FACULTY OF SCIENCE DEPARTMENT OF CHEMISTRY USE OF MORINGA OLEIFERA (MORINGA) SEED PODS AND SCLEROCARYA BIRREA (MORULA) NUTSHELLS FOR METAL REMOVAL FROM WASTEWATER AND BOREHOLE WATER BY IRENE WANGARI MAINA A DISSERTATION SUBMITTED TO THE SCHOOL OF GRADUATE STUDIES IN PARTIAL FULFILLMENT OF REQUIREMENTS FOR THE DEGREE OF MASTERS OF SCIENCE IN ANALYTICAL CHEMISTRY AUGUST 2016 Supervisors: Dr.V.Obuseng and Dr. F. Nareetsile
-
Upload
khangminh22 -
Category
Documents
-
view
2 -
download
0
Transcript of Maina_Unpublished (MSc)_2016.pdf - Ubrisa Home

i
UNIVERSITY OF BOTSWANA
FACULTY OF SCIENCE
DEPARTMENT OF CHEMISTRY
USE OF MORINGA OLEIFERA (MORINGA) SEED PODS AND SCLEROCARYA
BIRREA (MORULA) NUTSHELLS FOR METAL REMOVAL FROM WASTEWATER
AND BOREHOLE WATER
BY
IRENE WANGARI MAINA
A DISSERTATION SUBMITTED TO THE SCHOOL OF GRADUATE STUDIES IN
PARTIAL FULFILLMENT OF REQUIREMENTS FOR THE DEGREE OF MASTERS OF
SCIENCE IN ANALYTICAL CHEMISTRY
AUGUST 2016
Supervisors: Dr.V.Obuseng and Dr. F. Nareetsile

i
CERTIFICATION
The undersigned certifies that they have read and hereby recommend, for the acceptance by the
Department of Chemistry, the University of Botswana, a thesis entitled “USE OF MORINGA
SEED PODS AND MORULA NUTSHELLS FOR METAL REMOVAL FROM
WASTEWATER AND BOREHOLE WATER” as part of the work recommended in fulfilment
of the requirements for a Master’s degree in chemistry at the University of Botswana.
Supervisors
1. Date: ---------------------------- Signature ----------------------------
2. Date: ---------------------------- Signature ----------------------------
Internal examiner
Date: ------------------------------ Signature----------------------------
External examiner
Date: -------------------------------- Signature ---------------------------

ii
DECLARATION
I hereby declare that this dissertation submitted for the degree of Master of Science in Analytical
Chemistry to the University of Botswana, is original ecxept where due to reference is made. This
work has not been submitted wholly or in part for the award of a degree or diploma to this or any
other insitution of higher learning.
_________________________________
Maina Irene Wangari
__________________________
Date

iii
DEDICATION
In memory of my late dad Peter Maina Muchai,
And
I dedicate this work to my beloved family.

iv
ACKNOWLEDGEMENTS
I would like to thank the Almighty God for good health and strength to complete my work. My
sincere gratitude goes to my supervisors Dr. V.Obuseng and Dr. F.Nareetsile for tirelessly helping
me and guiding me throughtout my research work. I greatlly appreciate their effort in guidance
during the writing of my dissertation. Am thankful to other members of the advisory committee
Dr.Nadiye and Dr.Sichilongo for patiently guiding me towards the right direction. I feel
priviledged to have learnt from all of you.
My sincere gratitude goes to my sponsors DAAD, for continous financial support to pursue my
Master degree. I am grateful to the department of chemistry and the staff for providing a conducive
environment for my studies and helping with any necessary help.
I extend my thanks to my collegues for moral support at difficult moments, Phatsimo Mogkweetsi,
Scotch Ndlovu, Mohau Moshoeshoe, Mashuub Abibu, Freedom Gondo, Fortunate Sejie, Ratsatsi
Lesedi and Elliot Mwando. Thank you for making Botswana a home away from home.
Lastly, I would like to thank my family for continously praying for me, Morlu Stevens for his
support, encouragement and unconditional love during my study and my friend Hawa Mukami for
encouragement and love. Thank you very much.
v
ABSTRACT
A study to investigate the possible use of non-edible seed pods of Moringa Oleifera (moringa) and
Sclerocarya birrea (morula) nutshells for removal of metal ions from wastewater and borehole
water samples was carried out. One variable at a time method was used to optimize parameters
that affect sorption capacity of both sorbents. Contact time, pH, temperature, particle size, sorbent
dose and initial metal concentration were the parameters investigated. Removal of seven selected
metal ions were studied including lead (Pb), cadmium (Cd), copper (Cu), manganese (Mn), iron
(Fe), zinc (Zn) and magnesium (Mg). Determination of residual metal ions after employing sorbent
was done using flame atomic absorption spectroscopy (FAAS). Using 200 ng metal ion mixture in
50 mL of water sample, the optimized parameters for Moringa seed pods were 60 min contact
time, 1 g of sorbent dose, pH 8, 100 µm sorbent particle size and extraction temp 35°C. While
using Morula nutshells, the optimized conditions were 120 min contact time, 2 g sorbent dose, pH
8, 100 µm sorbent particle size and extraction temp 35°C. The percentage removal of Fe, Zn, Cu,
Cd, Mg, Mn and Pb from water samples using treated MNS was 79.6, 52.9, 78.2, 58.6, 90.3, 100.0
and 93.4 while using treated MSP was 80.9, 57.6, 89.0, 65.5, 88.2, 100.0 and 94.7 respectively.
Moringa seed pods was found to be a better sorbent in comparison to morula nut shells since the
percentage removal of metals was higher while using Moringa seed pods. The developed methods
were validated and the % removal was found to range between 86.49 ± 4.33 to 99.63 ± 3.36%. The
method indicated good linearity (R2 > 0.99) for all selected metals and also proved to be sensitive
as low LODs were achieved ranging from 0.010 ± 0.003 to 0.067 ± 0.02 mgL-1. Determination of
the functional groups in the sorbents was done using Fourier Transform Infrared spectroscopy
(FTIR). The experiments were done for sorbents before and after metal removal by sorbents. Shift
in transmittance (%) and intensity of the peaks of the different functional groups in the sorbents
was attributed to the metal binding to these functional groups and hence responsible for removal

vi
of metal from water samples. SEM-EDX was used to determine the morphology and the elemental
analysis of the sorbents. Presence of irregular surface and pores showed that the sorbent has
different sites that can act as adsorbing sites. The removal efficiency of acid treated sorbents was
compared to that of untreated sorbents and it was found to be higher for acid treated sorbents for
both Morula nutshells and Moringa Oleifera seed pods. These non-edible plant parts for Morula
and Moringa Oleifera plants are proposed as a cheap, simple and an effective alternative for
purification of water contaminated with heavy metals.

vii
TABLE OF CONTENT
CERTIFICATION ........................................................................................................................... i
DECLARATION ............................................................................................................................ ii
DEDICATION ............................................................................................................................... iii
ACKNOWLEDGEMENTS ........................................................................................................... iv
ABSTRACT .................................................................................................................................... v
LIST OF FIGURES ........................................................................................................................ x
1.0 INTRODUCTION .................................................................................................................. 1
1.1 Heavy metals in wastewater ............................................................................................. 3
1.2 Conventional methods for removal of heavy metal ............................................................ 6
1.2.2 Electrocoagulation/flocculation .................................................................................... 7
1.2.3 Membrane techniques ................................................................................................... 9
1.2.4 Ion-exchange .............................................................................................................. 12
1.3 Biosorption methods for removal of metals ...................................................................... 14
1.3.1 Utilization of nonedible parts from food and multipurpose plants as biosorbents ..... 15
1.3. 2 Moringa Oleifera and Morula trees as multipurpose plants ...................................... 15
1.4 Regeneration Studies ........................................................................................................ 20
1.5 Problem Statement ............................................................................................................ 22
1.6 Significance of Research ................................................................................................... 22
1.7 Aim and Objectives of study ............................................................................................. 22
1.7.1 Specific Objectives ..................................................................................................... 23
2.0 Analytical methods for heavy metal determination .............................................................. 24
2.1 Atomic Absorption Spectroscopy (FAAS and ETAAS) ................................................... 26
2.1.1 Flame atomic absorption spectroscopy (FAAS) ......................................................... 27
2.1.2 Graphite furnace Atomic Absorption Spectroscopy (ETAAS) .................................. 28
2.2 Microwave Plasma-Atomic Emission Spectrometer (MP-AES) ...................................... 29
2.3 Inductively Coupled Plasma Atomic emission Spectroscopy (ICP-AES) ........................ 32
2.4 Inductively Coupled Plasma mass Spectrometry (ICP-MS) ............................................. 34
2.5 CHARACTERISATION OF SORBENTS ....................................................................... 36
2.5.1 Frontier transform infrared Spectroscopy (FTIR) ...................................................... 36

viii
2.5.2 Scanning Electron Microscope-Energy dispersive X-ray Spectroscopy (SEM-EDAX)
............................................................................................................................................... 38
3.0 EXPERIMENTAL ................................................................................................................ 41
3.1 Instrumental analysis ......................................................................................................... 41
3.2 Materials and Reagents ..................................................................................................... 42
3.3 Sampling and treatment of sorbent materials .................................................................... 42
3.3.1 Characterization of Morula nutshells and Moringa seed pods ................................... 43
3.3.2 Determination of metal concentration in sorbent material ......................................... 43
3.3.3 Acid treatment of MSP and MNS sorbents ................................................................ 44
3.4 Batch biosorption studies for metal removal using the two sorbents ............................... 44
3.4.1 Optimization of parameters ....................................................................................... 44
3.5 Application to real samples ............................................................................................ 48
3.5.1 Sampling and sample treatment of water samples...................................................... 48
3.5.2 Determination of initial metal concentration in water samples .................................. 49
3.5.3 Application of the optimized biosorption method to real samples ............................. 50
3.6 Performance of the developed method .............................................................................. 50
3.6.1 Linearity........................................................................................................................ 50
3.6.2 Detection limits........................................................................................................... 50
3.6.3 Recoveries Studies ...................................................................................................... 51
4.0 RESULTS AND DISCUSSION ........................................................................................... 52
4.1 Characterization of the sorbents. ....................................................................................... 52
4.1.1 Metal determination using FAAS ............................................................................... 52
4.1.2 SEM-EDX analysis..................................................................................................... 53
4.1.3 FTIR Analysis............................................................................................................. 57
4.2 Optimization of parameters. .............................................................................................. 63
4.2.1 Effect of Contact time ................................................................................................. 65
4.2.2 Sorbent dose ............................................................................................................... 67
4.2.3 Effect of pH ................................................................................................................ 69
4.2.4 Effect of initial metal concentration ........................................................................... 72
4.2.5 Effect of Particle size .................................................................................................. 74
4.2.6 Effect of Temperature ................................................................................................. 76

ix
4.3 Performance of developed study ....................................................................................... 78
4.3.1 Calibration studies ...................................................................................................... 78
4.3.2 Recoveries studies ...................................................................................................... 79
4.3.3 Detection Limits ......................................................................................................... 79
4.4 Application of optimized conditions to real samples ........................................................ 81
4.4.1 Removal of metal ions from aqueous solution using optimized conditions ............... 81
4.5 Determination of metal concentration in real water samples ............................................ 82
4.5.1 Metal removal from wastewaters and borehole samples ............................................ 85
4.6 Use of treated MNS and MSP for metal removal from wastewater samples .................... 89
5.0 CONCLUSION ..................................................................................................................... 93
5.1 Recommendations ............................................................................................................... 94
6.0 REFERENCES ..................................................................................................................... 96
7.0 APPENDICES: ..................................................................................................................... 115

x
LIST OF FIGURES
Figure 1.1: Moringa Oleifera seed pods (A) and morula nutshells (B). ....................................... 20
Figure 2.1: Schematic diagram of Atomic Absorption Spectroscopy (Elmer 2008) .................... 26
Figure 2.2: Schematic diagram of Micro-wave Plasma Atomic Emission Spectroscopy
(Elemental 2001) ........................................................................................................................... 30
Figure 2.3: Schematic diagram of an ICP-AES technique (Hou Xiandeng 2000) ....................... 33
Figure 2.4: Schematic diagram of processes in ICP-MS from sample introduction to mass
analysis (Agilent Technologies 2005) .......................................................................................... 35
Figure 2.5: Schematic representation of a SEM layout and function (Adopted from Philips XL 30
ESEM manual) .............................................................................................................................. 39
Figure 2.6: X-ray emitted from different electron shells (https://en.wikipedia.org/wiki/Energy-
dispersive_X-ray_spectroscopy .................................................................................................... 40
Figure 3.1 Summary of the optimization procedures for biosorption ........................................... 47
Figure 3.2: Map showing location of Glen valley Waste water Treatment Plant Gaborone,
Botswana (Water Utilities Corporation, 2014. Annual report 2012/13) ....................................... 48
Figure 3.3: Wastewater treatment stages in Glen valley wastewater treatment plant, Gaborone
Botswana (Water Utilities Corporation, 2014. Annual report 2012/13) ....................................... 49
Figure 4.1: Concentration (mg/g) of selected metals in Moringa seed pods and Morula nut shells
....................................................................................................................................................... 52
Figure 4.2: Concentration (mg/g) of Magnesium in Moringa seed pods and Morula nut shells .. 53
Figure 4.3: SEM micrograph of Moringa seed pods (MSP) ......................................................... 54
Figure 4.4: SEM micrograph of Morula nutshells (MNS) ............................................................ 54
Figure 4.5: Spectrum of MSP (a) before metal ion removal (b) after metal ion removal ..... Error!
Bookmark not defined.56
Figure 4.6: Fig: Spectrum of MNS (a) before metal ion removal (b) after metal ion removal .... 60
Figure 4.7: Effect of contact time on metal removal using MSP.................................................. 66
Figure 4.8: Effect of contact time on selected metal removal using Morula nut (MNS) sorbent . 67
Figure 4.9: Effect of adsorbent dose on metal removal using Moringa seed pods ....................... 68
Figure 4.10: Effect of adsorbent dose on metal removal using MNS ........................................... 69
Figure 4.11: Effect of adjusting pH on metal removal by Moringa seed pods (MSP). Other
conditions kept constant (section 4.2.3.) ....................................................................................... 70
Figure 4.12: Effect of pH on metal removal using Morula Nut Shells (MNS) while keeping other
condition constant (section 4.2.3) ................................................................................................. 71
Figure 4.13: Effect of initial metal concentration on metal removal by MNS ............................. 73
Figure 4.14: Effect of initial metal concentration on metal removal by MSP .............................. 73
Figure 4.15: Effect of particle size on metal removal using MSP ................................................ 75
Figure 4.16: Effect of particle size on metal removal using MNS ............................................... 75
Figure 4.17: Effect of Temperature on metal removal using MSP ............................................... 77
Figure 4.18: Effect of Temperature on metal removal using MNS .............................................. 77
Figure 4.19: Concentration (mg/L) of metal in Sewage wastewater samples using FAAS ......... 84

xi
Figure 4.20: Average metal concentration (mgL-1) in borehole water ......................................... 85
Figure 4.21: Metal removal from Borehole water sample using optimized sorption conditions
with MSP ...................................................................................................................................... 88
Figure 4.22: Metal removal from Borehole water sample using optimized sorption conditions
with MNS ...................................................................................................................................... 88
Figure 4.23: Comparison of treated and Untreated MNS for removal of metal from wastewaters
at inlet point .................................................................................................................................. 90
Figure 4.24: Comparison of treated and untreated MSP for removal of metal from wastewaters at
inlet point ...................................................................................................................................... 90
Figure 4.25: Comparison of treated and untreated MSP for removal of metal from wastewaters at
effluent point ................................................................................................................................. 91
Figure 4.26: Comparison of treated and untreated MNS for removal of metal from wastewaters at
effluent point ................................................................................................................................. 92
Figure 7.1: EDAX spectrum analysis of a) Moringa seed pods and b) Morula nutshell ............ 121

xii
LIST OF TABLES
Table 4.1: Moringa seed pods peaks from FTIR before and after metal removal, peak shifts and
group assignment of the peaks ...................................................................................................... 59
Table 4.2: Morula nutshells peaks from FTIR before and after metal removal, peak shifts and
group assignment of the peaks----- ............................................................................................... 62
Table 4.3: A summarized table of effects of factors affecting sorption capacity. ........................ 63
Table 4.4: Linearity data for selected metals using FAAS .......................................................... 78
Table 4.5: Percentage recoveries of the selected metals ............................................................... 79
Table 4.6: Limit of detection and quantification of selected metals. ............................................ 80
Table 4.7: The optimised extraction parameters using 20ppm standard mixture solution. ......... 81
Table 4.8: Percentage removal of metal ions using MNS and MSP ............................................. 81
Table 4.9:Average concentration of metal ions in the borehole samples using FAAS ................ 84
Table 4.10: Percentage removal of selected metals using MNS ................................................... 85
Table 4.11: Percentage removal of selected metals using MSP ................................................... 86
Table 7.1: ANOVA of Mn using different Particle size of MSP ................................................ 115
Table 7.2: ANOVA of Cd using different Particle size of MSP ................................................. 115
Table 7.3: ANOVA of Mg using different Particle size of MNS .............................................. 116
Table 7.4: ANOVA of different sorbent dose using MNS ......................................................... 116
Table 7.5: ANOVA of different sorbent dose using MPS .......................................................... 117
Table 7.6: ANOVA of temperature using MPS .......................................................................... 117
Table 7.7: ANOVA of temperature using MNS ......................................................................... 118
Table 8: EDAX Elemental composition in Moringa see pods (MSP) and morula nut shells
(MNS)………………………………………………………………………………………….124
Table 7.9: Average concentration of metals in wastewater samples…………………………..124

1
1.0 INTRODUCTION
Demands on water resources for households, commercial, industrial and agricultural activities are
increasing on daily basis. Agriculture and domestic sector account for more than 70% of global
freshwater withdrawals (FAO, 2012). For example, in Botswana 80% of the population depends
on groundwater due to poor rainfall and water scarcity (Central Statistics office 2009, unpublished
data).
Wastewater resulting from homes and industries is often discharged into rivers after treatment.
Recycling and reuse of wastewater can be a supplementary source to already existing water
sources, especially in arid and semi-arid regions. The major source of wastewater in sewage
treatment plants is municipal wastewater which may contain pathogens and potentially toxic
elements and organic compounds. For example, diarrhea is responsible for the deaths of 1.8 million
people every year and it mostly affects children in developing countries, because of unsafe water
supplies and poor sanitation facilities. It is also of critical concern that the additional trace
inorganic compounds such as heavy metals (Toze 2007, Lintelmann et al., 2003) could be present
in treated water due to treatment failure or inability to remove them. Wastewater from municipal,
agricultural and industrial activities is normally discharged into designated oxidation ponds,
treated and discharged to rivers. It has been demonstrated, that before being discharged to rivers,
removal of most pollutants can be achieved by treatment technologies employed in wastewater
treatment plants such as screening, primary treatment, secondary and tertiary treatment (Ternes et
al., 2002; Buser et al., 1999; Ternes 1998). For example, in Gaborone, Botswana, Gaborone
sewage treatment plant; (GWTP) treats all sewage that is generated in Gaborone and surrounding

2
areas. This wastewater contains sewage from homes, waste from brewery, chemical industries and
pharmaceutical waste. Below are some of the typical treatment processes that are involved.
Screening and pretreatment
This is the first stage of the wastewater treatment process. It involves filtering debris; removal of
gross, suspended and floating solids from raw sewage. It includes screening to trap any solid
objects that escaped the first screening and sedimentation by gravity to remove suspended organic
and inorganic solids. This level is sometimes referred to as “mechanical treatment”, Primary
treatment can reduce the BOD of the incoming wastewater by 20-30% and the total suspended
solids by some 50-60%.
Tertiary treatment
The water, at this stage is put into large rectangular tanks called aeration lanes. Air is pumped into
the water to encourage bacteria to breakdown the tiny bits of sludge that escaped the sludge
scrapping process. Aeration tanks comprise of aerobic zone for COD removal and anoxic zone.
Secondary treatment
This stage biological treatment is used to remove the dissolved organic matter that escapes primary
treatment. This is achieved by microbes consuming the organic matter as food, and converting it
to carbon dioxide, water, and energy for their own growth and reproduction. The biological process
is then followed by additional settling tanks (“secondary sedimentation") to remove more of the
suspended solids. About 85% of the suspended solids and BOD can be removed by a well running
3
plant with secondary treatment. Secondary treatment technologies include the basic activated
sludge process, the variants of pond and constructed wetland systems, trickling filters and other
forms of treatment which use biological activity to break down organic matter.
The treated wastewater may be used for irrigation, watering parks and possibly recycled for
drinking purposes (Van Haute 1978; Ratanatamskul et al., 1996; Kung 1998; Lazarova et al.,
2003). The nutrients such as nitrogen, phosphorus and potassium, that can be in wastewater are
very essential such that they can assist plant growth (Zhang and Cornel 2005; Lone et al., 2012;
He et al., 2008; Al Salem 1996). Despite the usage of wastewater in several parts of the world, the
safety and quality of wastewater reuse still remains a problem. There is a high probability that the
water discharged to the rivers after treatment in oxidation ponds, potable and ground water as well
could contain heavy metals not benign to the environment.
1.1 Heavy metals in wastewater
Heavy metals occur in aquatic systems from natural sources and anthropogenic activities. Such
activities include metal plating, mining activities, agricultural activities, solid waste from animals,
smelting, battery manufacture, tanneries, petroleum refining, paint manufacture, pesticides,
pigment manufacture, printing and other industrial effluents (Zheng et al., 2007; Kumari et al.,
2005). The human body needs some of these metals at trace levels for correct nutrition, but further
accumulation in the body results in various health effects (Singh et al., 2010; Wang et al., 2005;
Khan et al., 2008). For example, disasters due to pollution by methyl mercury in aquatic streams
have been recorded such as Minimata tragedy in Japan and Cd contamination in in Jintsy river of
Japan (Friberg and Elinder, 1985). In Owino Uhuru Slums, Mombasa Kenya the water, soils and
dust samples from the houses around a Pb acid battery recycling company were found to have high

4
concentration of Pb which was posing a great health risk to the people living in the slums
(Benards, 2012).
Bioaccumulation of heavy metals vary between species, ages, sex and organs. The target tissues
of heavy metals are metabolic active ones which accumulate high level of metal such as liver,
kidney and fish gills, whereas in muscles where the metabolic activity is relatively low
accumulates less level of heavy metals (Sasowsky et al., 2004). Some metals are known to be toxic
even at low concentrations. These include Cr, Pb, Cd, As and Hg (Nguyen et al., 2005;
Yetilmezsoy et al., 2008). Pb causes various severe health problems in vital organs of human
beings even at low concentrations, such as the kidney, liver, blood composition, nervous system
and also retards the reproductive system. It also reduces chlorophyll production and can inhibit
plant cell growth at very high concentrations (Yetilmezsoy et al., 2009; Ronteltap et al., 2007).
Cd is very toxic to both human beings and animals. The International Agency for Research on
cancer classified Cd as a human carcinogen (IARC, 1993). Sources of this metal include cadmium
batteries, metal coating and alloys. However, the concentration in environmental samples is low.
Cd may induce kidney dysfunctions, osteomalacia and reproductive deficiencies. It can also cause
damage to the central nervous system and produce psychological disorder (Strömgren, 1998). It
was found to decrease seed germination, lipid content and growth in plants (Mathew, 2005).
While a number of other metals such as Cu, Fe, Zn, Mn and Co, are known to be essential elements
and play important roles in biological metabolism at very low concentrations and either an excess
or deficit can disturb biochemical functions in both humans and animals (Yilden, 2003). Maximum
allowed limits set by EPA 2004 for contaminants in treated wastewater enforced in developed and
developing countries are 0.01, 0.2, 5.0, 0.2, 5.0 and 2.0 mgL-1 for Cd, Cu, Pb, Mn, Fe and Zn,
respectively. While the Botswana bureau of standards (BOBS) and water utilities company (WUC)

5
drinking water quality standards for Pb, Cu, Cd, Ni, Mn and Zn are 0.1, 1.5, 0.05, 0.4, 0.05 and
1.5 mg L-1 respectively. Intake of higher concentrations more than the allowed of these metals
could cause severe effects.
Fe can contribute to soil acidification and loss of essential elements such as phosphorus and
molybdenum. It can also cause pathological events such as iron oxides deposition in Parkinson’s
disease (Matusch et al., 2010). Mn is toxic to a number of crops at a few-tenths to a few mgL-1 in
acidic soils (USEPA, 2004). Zn on the other hand causes reduction in immune function and the
levels of high density lipoproteins (spears, 2000). Cu has been associated with liver damage and
when it interacts with Zn it produces adverse nutrient interactions (Altamura and Muckenthaler,
2009), disrupts photosynthesis, plant growth and reproductive processes (Mathew 2005).
Heavy metals such as copper Cu, Zn, Ni and Cr, are discharged in wastes (Sun and Shi, 1998;
Fernandez et al., 2005); Cd, Cr, Zn and Pb can be found in agricultural fertilizers (Nicholson et
al., 2003; Otero et al.,2005), and also in manure sewage sludge (Cheung and Wong 1983;Walter
et al., 2006). Pb, Cd, Hg, Pt, Au, Cr, As, Ni and Mn are commonly in electronics (Veglio et al.,
2003), effluent from industries such as alloy and steel industries, electroplating, paints and
pigments industries (Rule et al., 2006; Cheng 2003; Zhao et al., 1999; Alvarez-Ayuso et al., 2003;
Davis and Burns 1999). These numerous application of the heavy metals in industries contributes
a challenge on how to completely eradicate their presence in the environment. Therefore the
biggest predicament is to optimize the benefits of wastewater as water sources and the nutrients it
contains while minimizing negative impacts on human health.

6
Fu and Wang (2011) reported that the trend in heavy metals pollution in the ecosystem was
increasing consistently throughout the world especially among developing countries. Hence, a
need arises for developing means of purifying water, which is effective and also cost effective
even at very low concentrations. Removal of heavy metals from wastewaters has been achieved
through chemical precipitation (Tuenay and Kabdasli, 1994), ion exchange (Baltpurvins et al.,
1999), ion flotation (Garcia-Sanchez and Alvarez-Ayuso, 2003), adsorption (Doyle and Liu,
2003), reverse osmosis (Ozaki et al., 2001) and membrane filtration (Dabrowski et al., 2004),
some of which have been discussed in the following Section 1.2 below.
1.2 Conventional methods for removal of heavy metal
1.2.1 Precipitation Methods
Most soluble metals precipitate when pH is alkaline (8 to 14). Precipitation of metals as insoluble
hydroxides, carbonates or sulphides is used in about 75% of facilities for treating wastewater
(Barakat 2011; Kurniawan et al., 2006). The resultant precipitate is then separated from the water
by sedimentation and/or filtration or flotation (Matis et al., 2004; Zamboulis, 2001). Examples of
precipitating agents include fly ash (Wang and Wu, 2006), lime (Tadesse et al., 2006) and carbon
dioxide (Lee et al., 2005). Lime precipitation was employed for the removal of heavy metals such
as Zn(II), Cd(II) and Mn(II) cations (Charerntanyarak 1999). Lime was successfully used to
remove Cr, Cu, Pb and Zn from industrial wastewater, in the order Cur > Pb > Cr and Zn was least
removed (Tadesse et al., 2006; Kurniawan et al., 2006). The efficiency of metal precipitation was
optimum in the alkaline pH (8 to 10). Lime (CaO) is a preferred precipitant for the removal of
heavy metals from industrial wastewater, however, high amounts are required and heavy metals
may not be reduced to an acceptable level for discharge of water into rivers and ponds; due to poor
7
inadequate settling and the dissolution of precipitates (Tadesse et al.,2006). These chemicals are
expensive to buy and are toxic to human beings (Barakat 2011).
Fly ash gives rise to an alkaline pH of 10 to13 when mixed with water at a solid/liquid ratio of
around 10. Hence, it can be reasonably expected that metal ions can be removed from aqueous
solutions by precipitation and adsorption onto fly ash particles. The optimum pH range for
chromium precipitation using fly ash and lime was 7 to10. The efficiency of fly ash in metal
removal has been found to be affected by presence of CO2 (Alinnor 2007; Cho et al., 2005; Wang
and Wu 2006; Ngah and Hanafiah, 2008). Carbon dioxide was found to neutralize lime and reduce
the solubility of some heavy metal compounds and in the process reducing the leaching of the
heavy metals (Hills et al., 1999; Lee et al., 2005). Chemical precipitation of heavy metals from
acid mine drainage samples using 1, 3-benzenediamidoethanethiol dianion (BDET) has also been
developed to selectively and irreversibly bind heavy metals from aqueous solution. BDET was
found to remove approximately >90% of several toxic or problematic metals from acid waste
waters (Wilmoth and Kennedy, 1979). BDET was found to reduce the concentrations of a wide
variety of divalent metals in water and sediments to very low percentages. Furthermore, it has been
demonstrated that the metal-BDET precipitates are insoluble in aqueous solution and in common
organic solvents and are stable over a wide pH ranges (Sellmann, and Heinemann 2000; Matlock
et al., 2002). However, use of BDET has some limitations. For example, high costs are involved
in the synthesis of the compound, involve use of chemicals that causes secondary pollution to the
environment and high cost on disposal of sludge (Fu and Wang 2011).
1.2.2 Electrocoagulation/flocculation
This is an electrochemical method of treating polluted water whereby sacrificial anodes dissolve
to produce active coagulant precursors into solution (Linares-Hernández et al., 2009). This process

8
normally include adjusting of pH and addition of ferric/alum salts as coagulants in order to
overcome repulsive forces between particles (Licsko 1997). A direct current voltage is applied,
and Al3+ or Fe2+ ions are produced, hydrolyzed and form a series of metal hydroxides at the anode
that are able to destabilize dispersed particles such as heavy metals present in the wastewater. At
the same time, hydrogen bubbles produced at the cathode can float most of the flocks formed from
the destabilized particles (Shammas 2004; Chou 2010). To increase particle size, flocculation of
unstable particles is done, these forms aggregates that can be removed by decantation or flotation
from the wastewater (Semerjian and Ayoub 2003). Plattes et al., (2007) employed precipitation,
coagulation and flocculation processes using ferric chloride to remove tungsten from industrial
wastewater. Tungsten removal was found to be most efficient (98–99%) in acidic conditions (pH
< 6). Bojic et al., (2009) explored spontaneous reduction–coagulation process using micro-alloyed
aluminium composite in a laboratory semi-flow system to treat model heavy metal wastewater.
The residual concentrations of metals were at admissible levels after only 20 minutes of treatment.
This technique can treat inorganic effluents with metal concentration less than 100 mgL-1 or higher
concentration greater than 1000 mgL-1. To treat wastewater contaminated with copper, Li et al.,
(2003) modified a coagulation-flocculation process by using sodium diethyl-dithiocarbamate
(DDTC) as a trapping agent and both poly-ferric sulphate and poly-acrylamide as the flocculants.
DDTC is a used as metal precipitant and forms insoluble metal-sithio salts (Andrus 2000). Using
a 25 mgL-1 coagulant dose at optimum pH of 10 to 11.5, a percentage removal of 99.6% and 95%
of 20 ppm Cu was possible using Poly-ferric sulfate and Poly-acrylamide respectively. 100 mgL-1
of Na2S as a coagulant was also used for removal of 450 ppm Zn (II), 1085 ppm Mn (II) and 150
ppm Cd (II). At pH of 11.0, the removal efficiency was 99.91%, 99.73 % and 99.95% for Zinc,
cadmium and Mn respectively (Charerntanyarak, 1999). For removal of 50 ppm of Cu, Zn and Ni,

9
the iron/iron electrode combination produced a higher percentage of copper and zinc removal
efficiency >95% and > 80%, respectively, while for nickel the aluminum/iron and iron/aluminum
electrode combinations >95 and >85%, respectively (Prica et al., 2015). Besides its good efficiency
this methods has shortcomings that hinder its adoption as a global strategy for wastewater
treatment. Such as large consumption of expensive chemicals, generations of large amounts of
sludge and high cost of disposal of contaminated sludge (Ayoub and Semerjian, 2001; Barakat
2011; Farooq et al., 2010). Generally, coagulation–flocculation cannot remove heavy metals
effectively (Chang and Wang, 2007). Therefore, additional treatment processes are needed.
1.2.3 Membrane techniques
Membrane technologies show great promise for heavy metal removal for their high efficiency,
easy operation and space saving. The membrane processes used to remove metals from the
wastewater are reverse osmosis, electrodialysis, filtration and filtration.
Reverse Osmosis
It is a process where heavy metals are separated by a semi-permeable membrane at a pressure
greater than osmotic pressure which is caused by the dissolved solids in waste waters
(Bohdziewicz et al., 1999). Environmental legislation requires that the membrane used in reverse
osmosis to have small pore sizes (down to 10- 4 µm) (Benito and Ruiz 2002). Reverse osmosis
works effectively at a pH range of 3 to 11 and at 4.5 to 15 bar of pressure; however that depends
on porosity, material, thickness, roughness, hydrophobicity and charge of the membrane. Pressure
is the most significant factor, the higher the pressure, the higher the metal removal efficiency.
Reverse osmosis membranes has been employed for metal removal from industrial wastewater.

10
The initial concentration of 500 ppm of Cu2+ and Cd2+ were reduced to 3 ppm using a 2.5 m2
polyamide membrane, at 45°C (Qdais and Moussa 2004). The removal efficiency was 98% and
99% for copper and cadmium, respectively effectively. In a comparative study, reverse osmosis
was found to be better than resin ion exchange and membrane filtration processes. Over 90% of
As (VI) and 99% of As (V) was removed using reverse osmosis membranes compared to 55%
from the other two methods. However, low efficiencies (25%) were recorded for As (III). This is
due to its neutral molecules that readily pass through the membranes. Therefore a prior oxidation
pretreatment of As (III) to As (V) is needed (Chan et al., 2008).
Reverse osmosis is robust, effective and capable of removing a wide range of dissolved species
from water (Fu and Wang 2011). However, this method has some limitations. Such as membrane
are prone to fouling due to suspended solids, or oxidized compounds for example chlorine oxides,
the small pores of the (Potts et al., 1981). The performance of the membranes decreases over time,
thereby decreasing permeate flow rate (Ning, 2002). Replacing of the membranes, high energy
consumption, and need for experienced personnel to run the process makes this method to be
expensive (Fu and Wang 2011; Kurniawan, et al., 2006)
Electro-dialysis
This is a process where the ions of the heavy metals are separated through the use of semi-
permeable ion selective membranes by applying an electric potential ( Bruggen et al., 2002). When
a solution containing ions passes through the cell compartment, the anions migrate towards the
anode and the cations towards the cathode ( Itoi et al., 1980; Chen 2004; Ebbers et al., 2015).
Electro-dialysis has been used for removal of metal cations from wastewaters (Gering and
Scamehorn 1988; Gnusin et al., 1984; Nichols and Allen 1982; Oka and Takatama 1978; Uosaki

11
1974; Anon 1984) including production of drinking water from black water and seawater
(Sadrzadeha et al., 2009). Cation exchange membranes (Perfluorosulfonic Nafion 117) removed
90% of Co (II) and 69% of Ni (II) from plating wastewater (Tzanetakis et al., 2003) and Nafion
450 removed 13% of Cd(II) (Marder et al., 2003). Increasing voltage and temperature has been
reported to increase the efficiency of an electrodialysis cell (Mohammadi et al., 2004; Lambert et
al., 2006)
Due to the spacing of cation and anion permeable membranes, cells of concentrated and dilutes
salts are formed. This technique is also prone to clogging of the membranes due to formation of
metal hydroxides. It requires careful operation, clean feed and periodic maintenance to prevent
damages of the membranes (Pedersen et al., 2015).
Membrane filtration
They are pressure driven membrane operations that use porous membranes for the removal of
heavy metals. Ultrafiltration uses permeable membranes to separate heavy metals,
macromolecules and suspended solids from inorganic solution on the basis of pore size (5 to 20
nm) and molecular weights of separating compounds. Metal removal through use of membrane
impregnated with chelators has also been documented. For example, wastewaters containing the
ions of Co (II) and those of Ni (II) (a representative of the heavy metals) were treated by a
combination of chelation and ultrafiltration (Geckeler et al., 1996, Geckeler et al., 1999, Baticle et
al., 2000, Vonk et al., 1997 and Marty et al., 2000), the percentage removal was in the range of
63-86% for both metal ions. Pb and As ions were also removed effectively from industrial
wastewaters by surfactant-enhanced ultrafiltration (Fillipi et al., 1999, Purkait et al., 2004, Purkait

12
et al., 2005).The surface active agents used were either anionic (dodecylbenzenesulfonic acid) or
cationic (dodecylamine) surfactants. Nanofiltration has been used for removal of metal ion such
as nickel (Murthy and Chaudhari, 2008; Murthy and Chaudhari, 2009), chromium (Muthukrishnan
and Guha, 2008), copper (Cséfalvay et al., 2009 and Ahmad and Ooi, 2010) and arsenic (Nguyen
et al., 2009 and Figoli et al., 2010) from wastewater. An increase of pH and a decrease of operating
temperature and metal ions feed concentration led to higher removal for of Arsenic using NF90
and N30F membranes (Figoli et al., 2010). Use of membrane filtration process has benefits from
ease of operation, reliability and comparatively low energy consumption as well as high efficiency
of pollutant removal (Erikson, 1988).
The main disadvantages of this process are the resultant sludge, which also poses a problem of its
disposal, fouling of membranes, biodegradation of membranes and high operational costs for the
membrane systems (Kurniawan, et al., 2006).
1.2.4 Ion-exchange
In ion exchange, a reversible interchange of ions between the solid and liquid phases occur. A
resin (insoluble) removes ions of like charge in a chemically equivalent amount without any
structural change of the resin (Rengaraj et al., 2001 and Vigneswaran et al., 2004). Synthetic ion
exchange resins such as Amberlite IR-120 and Dowex 2-X4 are common matrices used in ion
exchange system (Chan, et al., 2006 ; Sapari et al., 1996). These resins were employed to remove
Zn(II), Cr(III) and Cr(VI) and the ion exchange system was found to remove all heavy metal
(100%) from plaiting wastewater. Amberlite IR-120 is a strongly acidic resin with a sulfonic acid
functionality and metal removal in ion exchanger works effectively in acidic conditions with pH
between 2 and 6 ( Lin and Kiang 2003; Kabay et al., 2003). Similarly, Rengaraj et al., 2001

13
reported 100% removal of Cr (III) when using IRN77 and SKN1 from a solution containing
100ppm of the Cr. Comparative study to recover Chromic acid from synthetic plating solution
reported that while using of Ambersep 132 resin, metal exchange capacity in the column operation
(100 mg g-1) was higher than that of batch studies (92.1 mg g-1) at the same concentration of 750
mgL-1 of the contaminated solution (Lin and Kiang 2003). This implied that more cations were
exchanged in the column than in batch studies. This could be attributed to the fact that in batch
studies, concentration gradient decreased with an increasing contact time, while in the column
operation, the resin had continuous physic-chemical contact with fresh feeding solution (Ko et al.,
2001; Kabay et al., 2003; Gode and Pehlivan 2003; Dries et al., 2005). Clinoptilolite, Amberjet
1200h, Ambersep 132, lewatit TP 207 resins have also been used in an ion exchanger to remove
zinc, nickel, and cadmium (Papadopoulos et al., 2004; Alvarez-Ayuso 2003). They were found to
have a removal efficiency of >90% from solution with 100 ppm of the metal ions (Juang et al.,
2003; Kabay et al., 2003; Gode and Pehlivan 2003). The shortcoming of this method is that ion
exchange is nonselective, highly sensitive to the pH of solution, some metal ions are removed
partially and it is an expensive method since the synthetic resins used are expensive to purchase
(Barakat 2011).
Although these conventional methods have higher capacity for the removal of toxic heavy metals,
their utilization may require several pre-treatments as well as additional treatments, thereby
incurring high installation and operating cost (Kam et al., 2002; Kim, 2002; Volesky, 1990). Some
of these processes also produce large volumes of highly concentrated metalliferous sludge that
may be difficult to dewater and dispose of (Sandau et al., 1996; Babel and Kurniawan, 1999). Due
to these challenges, there is need for safer, economical and effective ways for elimination of heavy

14
metals from waters. Use of low cost sorbents has focused attention on use of biological materials
as a considerable potential solution for removal and recovery of pollutants from industrial effluents
(Wang, 2002; Vieira et al., 2010; Bhatti et al., 2007; Kazemipour et al., 2008; Garg et al., 2007;
Mishra and Patel 2009; Vaghetti et al., 2009; Garg et al., 2008; Reddy et al., 2010; Wan Ngah and
Hanafiah 2008; Helen Kalavathy and Miranda 2010; Amuda et al., 2007; Saka et al., 2012; First
et al., 2007; Annadural et al., 2003). Biosorbents are prepared from naturally abundant materials
such as plant-derived materials, algae, bacteria and from by-products or waste biomass from other
industries.
1.3 Biosorption methods for removal of metals
Biosorption has gained important credibility during recent years as a low-cost, readily available
and efficient treatment technology for effective removal of heavy metals from wastewaters
(Chandrasekhar et al., 2001; Basu et al., 2003; Kumar et al., 2006; Fourest and Roux, 1992). Plant
materials normally contain components such as hemicelluloses, lignin, lipids, proteins, simple
sugars, water hydrocarbons and starch (Cafer Saka et al., 2012). This components contains
functional groups like amines, sulphyl, carboxyl, carbonyl, hydroxyl that may be involved in
forming metal complexes and hence helping in removal of metal from the samples. Use of these
materials has the following advantages (Ngah and Hanafiah, 2008): they (i) are readily available,
(ii)require little or no processing, (iii) have got good adsorption capacity for low-level metal
concentrations, (iv) have got selective adsorption for heavy metal ions, and (v) can be easily
regenerated (Gupta and Babu 2009; Nasiruddin Khan and Farooq Wahab 2007; Shukla et al.,
2002; Annadural et al., 2003).

15
1.3.1 Utilization of nonedible parts from food and multipurpose plants as
biosorbents
Some parts of food and indigenous plants are considered to be nonedible and therefore in most
cases they are considered as waste and of less importance. These nonedible parts can be used as
sorbents as will be discussed in the Section 1.3.2 below.
1.3. 2 Moringa Oleifera and Morula trees as multipurpose plants
Botswana is endowed with a variety of indigenous tree including Sclerocarya birrea (morula) and
of recent, many people plant Moringa oleifera (MO) tree. The plant parts of these trees are widely
used locally mostly for medicinal purposes. These plants are essential for food security, health and
nutrition, and economic welfare of rural communities in the developing world (Saka et al., 2007).
For example morula tree is a multipurpose tree with highly nutritive fruits which can be consumed
fresh or commercially processed. Its fruits are used in preparation of juices, jams, jellies and
alcoholic beverages as they contain high amounts of vitamin C. The kernel contains proteins and
oils believed to preserve meat (Mosase and Aganga, 2001; Venter and Venter, 1996; Van-Wyk et
al., 1997), the oil extracted from the seeds is highly beneficial for human health and is used for
cooking, skin and hair (Mojeremane and Tshwenyane 2004; Bhattacharya, 2012). The oils sources
from the seeds of these plants can be used for cosmetics, (Kleiman et al., 2008). However they
have a marked difference in fatty acid and oxidative properties. For example, MO seed oil had less
than 1% polyunsaturated and morula had 6.7% of the unstable materials. Fatty acids in morula nuts
has oils that include palmetic acid (12 g/100 g), stearic acid (9.2 g/100 g), oleic acid (69.9 g/100
g) and linoleic acid (7.8 g/100 g) (Wynberg, 2002)
Morula tree is one of plant species used widely in traditional medicine in different parts of the
world including most African countries. It is used for many diseases and affections such as

16
hypertension, dysentery, stomach aches or gastro-entries (Dimo et al., 2007). The stem bark extract
of Sclerocarya birrea exhibited a significant reduction in blood glucose and increased plasma
insulin levels in diabetic rats (Moatshe et al., 2011). Therefore it was concluded that the stem bark
extract could treat diabetics due to stimulation of insulin secretion. Some of the mineral contents
it contains include Cu, Mn and Zn (Balemtougri et al., 2001; Glew et al., 2004). The nuts of these
trees have high levels of protein (28-31% or 30.9 g/100 g) and energy. They are rich in minerals
like iron (31 mg/g), magnesium (467 mg/100 g), phosphorus (836 mg/100 g), Potassium (677
mg/100 g) and copper (54.8 mg/100 g) which contributes to their importance in diets of some rural
communities (Wynberg et al., 2002). Some of the products of morula have been commercialized
and marketed in Southern Africa over the last 20 years (Hall, 2002). This includes popular morula
liquer-Amarula from South Africa, ‘Marulaan’ wine in Zambia (Leakey, 1999) and pasteurized
juice in Botswana (Taylor and Kwerepe, 1995; Shackleton et al., 2002).The leaves are cooked as
relish (Fox and Young 1982) and also used for hypertension and other infections (Belemtougri et
al.,2001). A study of the fruit pulp and skin volatiles using SPME (Solid phase micro-extraction)
and GC-MS has been reported. The study revealed that the major compounds in the fruit pulp were
β-caryophyllene and α-humulene. (Z)-3-decen-1-ol was the major alcohol detected in the head-
space of the whole fruit (Viljoen et al., 2008).
Moringa Oleifera (MO) is another interesting plant of the developing world, as it can easily be
cultivated and adaptable semi-arid climates. It is a multipurpose plant as it is commonly used plant
worldwide in traditional medicine, and a rich source of nutrients and antioxidants (Coppin et al.,
2015; Katayon, et al., 2006; Stevens et al., 2013). The leaves, the stem bark, flowers and seeds
have been used for medical purposes. The leaves from MO contain elements (micro and macro)
such as Na, Mn, Fe, Zn, Ca and Cu (Szymczycha-Madeja et al., 2014).

17
Moringa Oleifera (MO) seed biomass as biosorbent
MO seed biomass has been promoted for water purification. The flowers are known to be rich in
minerals such as Ca2+, Mg2+ and K+, that were found to improve the breast milk production and
possess in women (Michel et al., 2012). The seeds have been used for water treatment for
generations in countries like China, India, Egypt and Sudan by local communities (Foidl et al.,
2001). The seed are ground, then mixed with water and agitated for few minutes then left for about
an hour. The water is then filtered out using a woven fabric. The purified water is decanted leaving
the coagulated particles on the bottom (Gassenschmidt et al., 1995) . This treatment was found to
reduce turbidity and water hardness (Ghebremichael et al., 2005; Yin 2010). Some studies (Okuda
et al., 2001; Ghebremichael et al., 2005) indicated that the presence of bivalent cations such as
Ca2+ and Mg 2+ significantly enhanced the coagulating properties of MO seeds, where the cations
may have adsorbed the active components to form an insoluble net-like structure to capture
suspended particles of kaolin clay that was in water samples. Tablets made from MO seeds were
able to remove oil from water in petroleum extraction with efficiency ranging from 76 %
(coagulant extracted from aqueous medium) to 96% (coagulant extracted from saline) (Michel et
al., 2010)
MO seed biomass has not only been studied for its coagulating properties but also its removal of
heavy metals from aqueous samples. ((Mataka et al., 2010; Obuseng et al., 2012; Sharma et al.,
2005) . The research indicated that perfomance of this sorbent could work at near neutral to pH 8
and that it was possible to adsorb a mixture of metal ions without affecting sortpion capacity. At a
high pH, the surface charge of the sorbent is negatively charged and therefore the sorption of metal

18
ions on the sorbent is high, at low pH the metals ions compete with the H+ ions for the active sites
therefore decreasing the sorption (Adelaja et al., 2011; Jimoh, T. O. 2012). Arsenic was removed
from aqeous solution. The removal efficiency was 60.21% for As(III) and 85.60% for As (V) at
optimum conditons of 2.0 g of sorbent, 25 mgL-1 metal concentration, pH 7.5 and 2.5 respectively
(Kumnari et al., 2005). Protein/amino acid-metal ion interactions were reported to be responsible
for sorption phenomenon. In a relatively similar study, the bark of MO was used to study the
biosorption of Pb2+ in aqueous solution. Likewise, parameters that influence the biosorption such
as pH, biosorbent dose, contact time and concentration of metal ion were investigated. MO bark
was considered a viable alternative to activated carbon, ion-exchange-resin and other synthetic
adsorbents used for this purpose (Reddy et al., 2010).
In the study of Bhatti et al., (2007), biomass from MO pods was also used to investigate the
removal of Zn(II). It was compared to the biomass treated with NaOH and it was noted that
removal efficiency increased of 10% when treated biomass was used. The experimental results
showed that the maximum pH for efficient sorption of Zn(II) was 7 ± 0.1 at which evaluated
biosorbent dosage and biosorbent particle size, were 0.5 gL-1, <0.255 mm, respectively. Increase
in sorbent dose increases the number of particles and hence increasing the binding sites for sorption
hence increasing removal efficiency and small size of particle increases offers large surface area
for the adsorption of the metal ions on the sorbent (Arunlertaree et al., 2007; Garg et al., 2007;
Garg et al., 2008). The seed pods have also been used to remove organics (benzerne, toluene,
cumene) from aqeous solution (Akhtar et al., 2007). It was noted that the removal of the organic
contaminants onto the pods was in order of cumen > toluene> benzene.
Some parts of these plants that are not edible and are considered as waste, for example MO seed
pods and Morula nut shells (see figure 1). Recycling and use of these plant waste material could

19
offer effective, economic and readily available materials that can be used to remove metal ions
from water samples. This can be beneficial to rural areas where resources to acquire the expensive
and complicated methods are limited. There is limited research on the application of these
nonedible parts as biosorbents for the removal of toxic metal from water samples. However,
literature is available where similar nonedible materials from plants and other materials have been
used in water treatment (Hawrhorne-Costa, Winkler Hechnleitner and Gomez-Pineda 1995;
Maranon and Sastre 1991; Dakiky et al., 2002). Such materials include egg shells from poultry
(Arunlertaree et al., 2007), fly ash (Mishra and Patel 2009) nutshells (Kazemipour, et al., 2008;
Vaghetti et al., 2009) and fruit husks ( Marshall et al., 1999; Ajmal et al., 2006; Agbozu and
Emoruwa 2014 ; Meena et al., 2008 ). Some of these materials have been effective for removing
of heavy metals. For example, untreated Soybean hulls removed >65% of metals (Nagar and Singh
2003; Quadri et al., 2004; Kurniawan, Gilbert Y S Chan, W. Lo, et al., 2006; Rizzuti and Nguyen
2007; Yadav et al., 2008; Ye et al., 2012) and acid treated soybean hulls were used to effectively
remove metal ions (Cd, Ni, Cu, Pb and Zn) from industrial and municipal wastewater, and the
efficiency was increased by 26% (Marshall et al., 1998). Orange peels have also been used for
removal and recovery of Ni2+ ions from electroplating water. The effectiveness of metal removal
was dependent on operational conditions such as temperature, pH, initial concentration and sorbent
dose. The sorbents could be regenerated for reuse with no reduced efficiency (Ajmal et al., 2000).
The current work therefore, seeks to explore the unexploited property of Moringa seed pods
(Figure 1.1 a) and Morula nutshells (Figure 1.1 b) as a bio remedial approach for removal of toxic
metals from aqueous samples.

20
Figure 1.1: Moringa Oleifera seed pods (A) and morula nutshells (B).
Use of non-edible plant parts as biomass to remove metals is gaining interest in many studies.
However, it is very important and economic to develop a method for the regeneration and reuse of
sorbent since the saturated sorbents that contain the metal ions are not safe for disposal as they can
pollute the environment.
1.4 Regeneration Studies
Regeneration of sorbents can give higher efficiencies compared to the untreated material dose, this
could be explained by the fact that all the impurities of the sorbent are removed after regeneration
and therefore increasing surface area for binding (Shukla et al., 2002). In some other cases removal
efficiency can decrease after a couple of cycles of regeneration, since a small fraction of adsorbed
metals not recoverable by regeneration represents the metals which are bound through stronger
interactions. Regenerating biosorbents has the advantages of cheap raw material, low cost,
economical, practical and easy operation.
A B

21
It has been reported that desorbing agent mostly depends on the adsorbate used. Most metals are
desorbed using dilute acids like HCl, HNO3 and H2SO4 (Shiow-Tien et al., 2013 ; Heng et al.,
2012; Mohamed et al., 2012; Ningchuan et al., 2012) from various sorbents, including fruit peels,
sawdust (Annadural et al., 2003). For example, in a study of Moringa Oleifera bark (MOB), as a
biosorbent for the removal of Ni(II) from aqua solutions, the regeneration of the biosorbent was
effected when 0.2 M HCl was used with a 98.02% recovery (Kumar et al., 2011). In another study,
Moringa oleifera leaf biomass showed feasibility of regeneration of the biosorbent for further use
after treating with diluted HCl. The removal efficiency of Pb ions from wastewater was 89-95%
after consecutive cycle (Kumar et al., 2010). Except Cr(VI) which is desorbed from the sorbents
with bases like NaOH, Na2CO3 or NaHCO3 (Mishra, 2014; Annadural et al., 2003). The use of
hydrogen peroxide acts as s strong oxidizing agent in acidic medium has been found to increase
the desorption capacity for Cu ions using a corncob adsorbent (Khan and Wahab 2007).

22
1.5 Problem Statement
Water shortage has led to use of water from different sources that is prone to be contaminated. Use
of possibly contaminated water for domestic and agricultural purposes may cause hazardous
effects on crops, animals and human beings. Therefore there is need to come up with cheap and
effective ways to solve the problem.
1.6 Significance of Research
Mining and industries are part of income generating sectors in Botswana. Due to such activities,
heavy metals may find their way into the water sources that are being used in the various
communities. Many people in the rural areas do not have access to technologies such as ion
exchange, chemical precipitation etc. that can help in purifying of the water that they use in their
households and farming. This could be attributed to the fact that these technologies are costly and
complicated. Hence communities’ health is at risk as a results of consuming water that could be
contaminated with organic and inorganic substances. The findings of this research will be useful
in developing the most efficient means of water purification. With this knowledge apparatus that
are relatively cheaper and affordable may be developed to get rid of heavy metals that are in
wastewater that is used in horticulture industries around Gaborone areas and also in the other
different sources of water that are being used in the rural areas all over Botswana.
1.7 Aim and Objectives of study
The main aim of this study was to utilize non edible (normally treated as waste) biomass Moringa
seed pods biomass and Morula nut shell biomass as possible biosorbents for metal removal from
sewage waste waters and borehole water.

23
1.7.1 Specific Objectives
The specific objectives of the study were as follows:
To characterize the Morula nutshells (MNS) and Moringa seed pods (MSP) using
spectroscopic analyses which consist of identification of functional group with Fourier
Transform Infra-red (FTIR) and morphology analysis using Scanning Electron Microscope
(SEM) coupled with Energy Dispersive X-ray Spectroscopy (EDS).
• To investigate and compare the uptake of heavy metals from aqueous solutions by Moringa
seed pods and Morula nutshells by batch adsorption experiments.
• To study the effects of varying parameters on sorption capacity of Pb, Mn, Cu, Cd, Fe, Zn
and Mg by MSP and MNS. Particularly: pH, Contact time, adsorbent dose, particle size,
temperature and initial metal concentrations.
• To optimize the parameters that affect sorption capacity of MNS and MSP for heavy metal
removal
• To apply the optimized parameters to remove selected heavy metals from sewage waste
water and borehole samples.
• To compare the efficiency of metal removal between acid treated sorbents and untreated
sorbents.

24
2.0 Analytical methods for heavy metal determination
In analytical chemistry, different techniques are used to determine the concentration of a particular
element (analyte) in a sample to be analyzed. Proper selection requires basic understanding of each
technique since each has its individual strengths and limitations. In order to make a decision on
which technique to use, several factors have to be considered (Elemental, 2001; Elmer, 2008;
Piccolo and O’Connor, 2009). Such as sample type (for example solid, liquid or gaseous),
analytical performance of the technique for example detection limits, working range and precision,
a technique that can offer multi-elemental determination and minimal operating cost. It should
reduce overall cost of analysis due to rising costs of instrument supplies, power, labor costs etc.
Several techniques have been employed to determine the amount of metal in different sample
matrices. For example Cu, Fe and Zn were determined in rocks, wastewater and human milk using
Flame Atomic Absorption Spectroscopy (FAAS)(Ma 2012; Silvestre et al., 2000; Ferreira 2000);
Pb content in tilapia and pine pollen was determined using Graphite Furnace Atomic Absorption
Spectroscopy (GFAAS) (Ni and Qu 2010; Zhong and Fan 2011); Cd, Co, Cr, Cu, Hg, Ni and Pb
were determined in leather and fur by Micro-wave Plasma Atomic Emission Spectroscopy (MP-
AES) (Y. Zhao et al., 2015); alloying elements like Mn, Ni, Cr and Cu were determined in silicon
steel and stainless still using Inductively Coupled Plasma Atomic Emission Spectroscopy (ICP-
AES) (Zhang et al., 2012; Ding and Pan 2013); Pb, Cd, As and Hg content in medicinal material
using Inductively Coupled Plasma Mass Spectrometry (ICP-MS) ( Huang et al., 2006). These
techniques have been used for metal determination in food samples such as vegetables (Maeda
and Tanimoto 1988; Znidarsic-Pongrac and Hodnik 2003), animal products like milk and meat
(Ruut and Past 1994; Temerdashev et al., 2000), fish (Zhong and Fan 2011). In pharmaceuticals
such as ciprofloxacin, amoxicillin and diclofenac sodium (Albero et al., 2002; Lewen et al., 2004;

25
Lewen 2011; Wollein et al., 2015), petrochemical industries for example crude oil (Bettmer et al.,
2012; Kawada 2007) and petrochemical sludge (Kumar et al., 2013), environmental samples such
as wastewater (Cosgrove and Bracco 1973; Marshall et al., 1998; He 2008), sediment (Hall 1997;
Yao et al., 2011; Liu et al., 2012; Liang et al., 2015), agricultural soils and crops (Akan et al.,
2013; Yan et al., 2015; Huang et al., 2015; Aidarkhanova et al., 2015; Cao et al., 2015; Alrawiq
et al., 2015), mining samples such as rocks (Ma 2012) and effluents from mines (Smolders et al.,
2003; Kemper and Sommer 2002; Dzhuvelikyan 2002; Qiu et al., 2007), chemical industries for
example in paints (Duffer 1972; Michalke 2002). The principles and application of these
techniques will be discussed in Sections 2.1 to 2.5.
Prior to analysis, sample has to go through sample preparations so as i) to degrade and solubilize
the matrix, ii) to release all metals for analysis, ii) to extract metals from the sample matrix into a
solvent more suitable for the analytical method used, iv) to bring metals present at very low levels
into a concentration range suitable for analysis, v) to separate a single analyte or group of analyte
from other species that may interfere in the analysis (Lubomir et al., 2010). Sample preparation
depends on the analytical techniques to be employed and their capabilities. For metal analysis, the
sample preparation steps mainly include homogenization (size reduction in case of solid samples),
extraction and concentration. For solid samples, sample digestion is normally done as follows i)
wet digestion using strong acids like HCl, HF, HNO3; ii) wet digestion with mixture of strong
acids with oxidizing agents like royal water, HClO4 or H2SO4 with H2O2; iv) dry-ashing:
calcinations followed by solving the ash in an acid; v) Microwave digestion: a modern technique
combining pressure and temperature. Extraction of metal from solid samples can be quite tedious,
involves a lot of random and systematic errors, loss of sample during the numerous sample
preparations steps, possibility of contamination and its time consuming. Liquid samples do not

26
require homogenization and can be aspirated directly to the instrument without need of extraction
therefore low contamination of sample and save time. However, in a case where the total metal
concentration is of interest, then the digestion can be done using acids like HNO3, HCl or extracting
metal from the matrix using chelating agents (Lubomir et al., 2010; Mitra 2003).
2.1 Atomic Absorption Spectroscopy (FAAS and ETAAS)
Figure 2.1 shows a schematic diagram of Atomic Absorption Spectroscopy (AAS) when using
either a flame or graphite furnace as a source of heat.
Figure 2.1: Schematic diagram of Atomic Absorption Spectroscopy (Elmer 2008)
There are five basic components of an atomic absorption spectroscopy:

27
• The light source: that emits the spectrum of element of interest for example hollow
cathode lamps
• Atom source- how atoms are generated from a sample e.g air/acetylene or nitrous-
oxide/acetylene flame
• A monochromator: it isolates the specific wavelength of light to be measured and
disperses it.
• A detector: measures the light intensity and amplifies the signal e.g photomultiplier
tube
• A display that shows the reading after it has been processed by the instrument.
2.1.1 Flame atomic absorption spectroscopy (FAAS)
This is a spectro-analytical procedure that uses absorption of light by free atoms in the gaseous
state. The analyte concentration is calculated based on the Beer-Lambert law by comparing
absorbance of sample against calibration curve (Garcia and Baez 2012).
In the flame AAS, a nebulizer and a spray chamber introduces the sample as an aerosol into the
flame. The high temperature of the flame atomizes and the aerosols are reduced to gaseous metal
atoms. Quantifying the amount of light absorbed determines the amount of analyte in the sample
(figure 2.1). The gases used to produce the flame (26000C) are either air/acetylene or Nitrous
Oxide/acetylene.
FAAS is the cheapest technique for determination of metals in different samples. It is easy to
operate, has low maintenance costs and offers great method recoveries (Ferreira 2000; Silvestre

28
et al., 2000; Knap et al., 2007). However, this technique shows poor efficiency as only 5-10% of
the aerosol reaches the flame (Welz and Sperling 1999) and residence time of analyte atoms in
the flame is short (Matusiewicz 1997; Davies and Berndt 2003). It is time consuming since only
one element can be determined at a time, samples having high concentrations beyond the working
range of the instrument have to be diluted prior to the analysis and this may increase analytical
errors, cannot quantify some metals and it is prone to ionization interferences (Garcia and Baez
2012).
2.1.2 Graphite furnace Atomic Absorption Spectroscopy (ETAAS)
This is also known as Electrothermal Atomic Absorption Spectrometry (ETAAS). This technique
works almost like FAAS except that the source of heat is replaced by graphite tube which is heated
to a temperature of up to 30000C (Elemental 2001). In GFAAS, samples are deposited in a small
heated graphite or pyrolytic carbon that is coated with graphite tube, the sample vaporize and the
analytes atomized (see figure 2.1). The free atoms absorb light at wavelengths characteristic of the
element of interest. The light absorbed is linearly correlated to the concentration of analyte present.
The main three steps of GFAAS are (i) evaporation of solvents, (ii) removal of matrices such as
hydroxides, carbonates and sulfates, and (iii) atomization of the analytes (García et al., 2008).
Some of advantages of this technique is that it offers greater sensitivity and lower detection limit
compared to FAAS. It can accept liquid, slurries or solid samples (Miller-Ihli 1992), has low
spectral interferences (Belarra et al., 2002), ETAAS has been applied in a wide range of matrices,
for example Ni, Co, Cu, Cd, Cr(III) and Pb were determined in wastewater (Yang et al., 2009;
Mirzaei et al., 2011); Cd, Pb, Cu and Zn in sediment and fish (Dalman et al., 2006); Cd, Zn and
Cu in mushroom (Tüzen 2003); Ni in human urine (Wang and Hansen 2001; Saracoglu 2003),

29
Cu, Zn, Cr, Ni and Pb content in soils (Cao et al., 2015), Cd, Cr, Mn, Pb and Cu in vegetables
(Bakkali et al., 2009). Palladium content was determined in a bulk pharmaceutical drugs, the
sample were digested with concentrated nitric acid and compared to microwave digestion. Better
recoveries were observed with microwave digestion (Jia 2001). Use of concentrated nitric acid is
simple, reduces cross-contamination, and is very reliable. However, dissolving organic compounds
with concentrated nitric acid can and sometimes, present a potential explosion hazard. In addition,
concentrated nitric acid shortens the lifespan of graphite furnace tubes, and accelerates the
corrosion of the metal components of the instrument (Wang et al., 1997). The concentration of
mercury, lead, cadmium, tin and arsenic were determined in canned tuna fish and the good
recoveries (91.7% to 99.3% ) were observed using spiked samples were between (Emami Khansari
et al., 2005). In spite its numerous application, this technique has limitations for example chemical
interferences, therefore matrix modifier such as hydrogen peroxide (Viñas et al., 1997), iridium
(Pedro et al., 2006) and nickel-containing chemical modifiers (Acar et al., 1999) are needed to
facilitate removal of interferents and increase sample throughput. GFAAS also has limited
dynamic range and atomized particles may jump to higher energy levels thus lowering precision
(Garcia and Baez 2012)
2.2 Microwave Plasma-Atomic Emission Spectrometer (MP-AES)
MPAES employs microwave energy to produce a plasma discharge using nitrogen, helium or
argon (Figure 2.2). Use of nitrogen extracted from ambient air eliminates the need for sourcing
gases in remote locations. The microwave plasma torch (MPT) can be sustained at atmospheric
pressure and at very low rate (10 mL/min) and low forward power (40–500 W). Samples are
typically nebulized prior to interaction with the plasma in MP-AES measurements. The atomized
sample passes through the plasma and electrons are promoted to the excited state. The light emitted

30
electrons return to the ground state and light is separated into a spectrum and the intensity of each
emission line measured at the detector. Most commonly determined elements can be measured at
trace level concentration range (ppm). The sample aerosol can be introduced into the plasma with
or without desolvation. Since the analyte is forced to pass through the central channel of the
microwave discharge, it is efficiently vaporized, atomized, excited and ionized; and causes
minimal perturbation to the plasma (Kilicgedik, 2012; Jin et al., 1991).
Figure 2.2: Schematic diagram of Micro-wave Plasma Atomic Emission Spectroscopy
(Elemental 2001)
31
This is an analytical technique for elemental analysis that has been designed to improve
performance and productivity while decreasing operating costs. Some of the advantages (Elmer
2008) of this technique include:
Higher performance compared to flame AAS: It has superior detection limits and improved
dynamic range, higher sample throughput with fast sequential measurements
Easy to use: It has software for automated optimization and one torch that requires no
alignment.
Reduced operating costs: It eliminated need for acetylene, Nitrous Oxide and Argon since
it runs on air. It also eliminates need for light sources like hollow cathode lamps.
Improves safety in the labs since flammable gases and cylinder handling is not required.
While the technique is mature, there are a limited number of manufacturers supplying commercial
MP-AES instruments. The performance of MP-AES was compared to that of ICP-AES, for the
determination of Cd, Co, Cr, Cu, Hg, Ni and Pb in leather and fur (Y. Zhao et al., 2015). Under
optimum conditions, recoveries with MP-AES were in the range of 98.1% to 102.6% and the
relative standard deviations were 0.7% to 3.0% and low detection. Multi-elemental analysis was
done on Chinese herbal medicines(Wu et al., 2012). The recoveries of the method were between
90 and 110% and the method detection limits for most elements were less than 3 μg/mL in the
solid sample. The recovery and precision were also excellent. MP-AES is a rapid, simple and
accurate technique that offers low analysis costs and improved operational safety with use of
nitrogen for plasma generation (Wu et al., 2012; Kamala C T et al., 2014; Lima et al., 2015).

32
2.3 Inductively Coupled Plasma Atomic emission Spectroscopy (ICP-AES)
This is a multi-element analysis technique that uses an inductively coupled plasma (ICP) source
to dissociate the sample into its constituent atoms and ions, exciting them to a level where they
emit light of a characteristic wavelength. This technique is based upon spontaneous emission of
photons from atoms and ions that have been excited in a Radio Frequency discharge. Samples are
injected directly into the instrument; the sample is converted into an aerosol by a nebulizer and
directed into the central channel of the plasma. The aerosol are quickly vaporized into free atoms
by the plasma that has a temperature of approximately 10,000K (Hou Xiandeng 2000). High
energy converts the atoms to ions and subsequently promotes ions to excited states. Both atomic
and ionic excited species may relax to the ground state via emission of a photon. The photons emit
characteristic wavelength that can be used to determine the element from which they originated.
Total number of photons is directly proportional to the concentration of the originating element in
the sample (Murray et al., 2000). The photons are collected with a lens or a concave mirror, an
image of the ICP on the entrance aperture of a monochromator. The exiting wavelength is
converted to an electrical signal by the photodetector. The signal is amplified and processed by the
detector electronics, then displayed and stored by a computer (Figure 2.3).

33
Figure 2.3: Schematic diagram of an ICP-AES technique (Hou Xiandeng 2000)
ICP-AES has been used in multi-elemental (Cd, Pb, Zn, Al, Cr, Cu, Fe, Ni, Ba, Ca, Mg, Ti, Se, V,
B and Co) analysis in different matrices such as dusts, ashes, sediments (Paudyn and Smith 1992);
seawater (Willie and Iida 1998); coal fly ash (Iwashita et al., 2006);Tungsten in bulk drugs (Wang
et al., 1999). Good recoveries were obtained for boron in soils, (after microwave extraction using
ICP-AES (de Abreu et al., 1994). In a multi-elemental analysis of copper, iron and nickel in edible
oils, the recoveries ranged from 90% to 110% and low detection limits in the range of µg/l were
found (Murillo et al., 1999). Cu, Fe, Mn, Zn, Cd and Pb were determined in wine samples and

34
ICP-AES was found to be very fast in multi-elemental analysis and the due to its ability to
determine concentration even at µgL-1 levels, it was found to be more sensitive than atomic
absorption spectroscopy (Aceto et al., 2002). However this technique has limitations such as
matrix effects and interferences. For example, to minimize matrix effect, Wang et al., (1999)
reported that the calibration blanks and standards are prepared in the same way as the sample.
Spectral interferences are monitored by using the 224.875 nm and 220.448 nm W-lines
simultaneously in ICP-AES. Another method was developed to compensate for the effects of
varying acid and salt concentrations on the efficiency of sample introduction into the plasma that
does not involve the use of internal references, precise matrix matching, or standard additions
(Botto 1985). The method uses the intensity of a hydrogen emission line at 486.133 nm (H-beta).
The H-beta intensity is proportional to sample introduction rate and to the hydrogen content of the
sample solution. Interference calibration curves are prepared for a specific acid/salt matrix relating
observed H-beta intensities and apparent concentrations for each of the elements (and
wavelengths) in the analytical program. These calibration curves are used to perform the
interference corrections for samples having that acid/salt matrix (Boumans, Tielrooy, and Maessen
1988; F. Zhao, McGrath, and Crosland 1994). ICP-AES also has high operational and maintenance
cost and require a trained personnel (Elemental 2001).
2.4 Inductively Coupled Plasma mass Spectrometry (ICP-MS)
This technique was commercially introduced in 1983 and has gained popularity in many types of
laboratories (Wolf, 2005). It is a multi-element technique that also uses inductively coupled plasma
(ICP) source to dissociate the sample into its constituent atoms or ions. In ICP-MS, Inductively
Coupled Plasma is combined with a mass spectrometer. Unlike in ICP-AES, where the photons
emitted from ions are detected by a photodetector, in ICP-MS the ions are detected themselves by
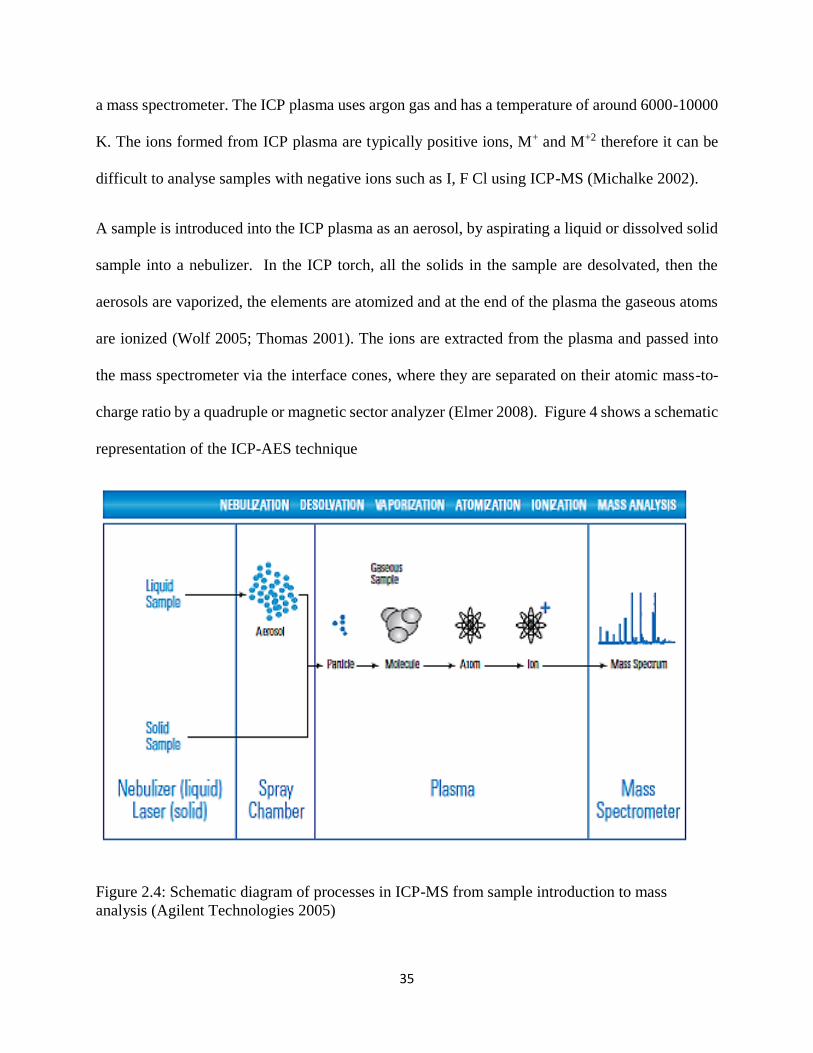
35
a mass spectrometer. The ICP plasma uses argon gas and has a temperature of around 6000-10000
K. The ions formed from ICP plasma are typically positive ions, M+ and M+2 therefore it can be
difficult to analyse samples with negative ions such as I, F Cl using ICP-MS (Michalke 2002).
A sample is introduced into the ICP plasma as an aerosol, by aspirating a liquid or dissolved solid
sample into a nebulizer. In the ICP torch, all the solids in the sample are desolvated, then the
aerosols are vaporized, the elements are atomized and at the end of the plasma the gaseous atoms
are ionized (Wolf 2005; Thomas 2001). The ions are extracted from the plasma and passed into
the mass spectrometer via the interface cones, where they are separated on their atomic mass-to-
charge ratio by a quadruple or magnetic sector analyzer (Elmer 2008). Figure 4 shows a schematic
representation of the ICP-AES technique
Figure 2.4: Schematic diagram of processes in ICP-MS from sample introduction to mass
analysis (Agilent Technologies 2005)

36
The described method has been in use for several years and its versatility has been demonstrated
by successfully applying it to a wide variety of sample matrices. Analysis on numerous sample
matrices investigated indicates that there is no dependence of the various chemical functionalities
contained in the sample matrices on the individual element recoveries. The average recovery for
selected metals (arsenic, selenium, cadmium, indium, tin , antimony, lead, bismuth, silver,
palladium, platinum, mercury, molybdenum and ruthenium) from the various sample matrices
investigated ranged from 89 to 102% (Lewen et al., 2004). ICP-MS has excellent detection limits
(1-10 ppt), it’s a very economic for analyzing many samples and many elements, its sample
throughput is very fast, has wide dynamic range (Gustavsson and Larsson 1992). However it has
high operational and capital costs, has spectral interferences and may require a trained personnel
to operate it (Huang et al., 2006).
2.5 Characterization of sorbents
The physical and chemical properties of a sorbent plays a key role in determining its efficiency.
For instance, the porous nature of the sorbent is an evidence of its adsorptive ability. Therefore,
studying the sorbent’s morphology, porosity and chemical structures assist in evaluating how the
sorbent interacts with analyte of interest. Frontier transform infrared and Scanning electron
Microscope have been used to characterize the sorbents. Their principles and applications are
discussed in Section 2.5.1.and 2.5.2
2.5.1 Frontier transform infrared Spectroscopy (FTIR)
Infrared Spectroscopy belongs to the group of molecular vibrational spectroscopies which are
molecule-specific, and give direct information about the functional groups, their kind, interactions

37
and orientations. It is an effective analytical instrument for detecting functional groups and
characterizing covalent bonding information (Simonescu 2012). Its sampling requirements allow
the gain of information from solids, and in particular from solid surfaces. FTIR offers quantitative
and qualitative analysis for organic and inorganic samples. It measures the frequencies at which
the sample absorbs and also the intensities of the absorptions. The infrared radiation is absorbed
by the sample and while some of the radiation is transmitted. An infrared spectrum is commonly
obtained by passing infrared radiation through a sample and determining what fraction of the
incident radiation is absorbed at a particular energy. The spectrum created represents the molecular
absorption and transmission thus creating a molecular finger print of the sample (Nicolet and All
2001) The energy at which any peak in an absorption spectrum appears corresponds to the
frequency of a vibration of a part of a sample molecule (Stuart 2004).
Using this technique, carbonyl, carboxylic, alkyl, aromatic, amine, and hydroxyl groups can be
analysed and have been found to be involved in metal uptake by different biosorbents (Taha et al.,
2013). In order to understand the sorption process, it is important to characterize the biosorbent
materials. These materials consist of cellulose, hemicellulose, lignin, protein, lipids etc. (Foidl et
al., 2001). Metal removal using plant sorbents is possible through ion exchange or complexation
phenomena which occur on the surface of the plant material through interaction of the metal with
the functional group present. The shift of the bands and the changes in signal intensity allow the
identification of the functional groups involved in metal sorption. For example, in removal of lead
from wastewater using plant biomass, a decrease in intensity and shift in asymmetric stretching
frequencies of hydroxyl, carbonyl and carbonyl groups is presumably due to coordination of lead
to the functional groups. The alkyl, aldehyde, ketonic and carboxylate groups shifted due to

38
coordination of zinc (II) to the different functional groups. (Kalavathy and Miranda 2010; Kumari
et al., 2006; Reddy et al., 2010).
2.5.2 Scanning Electron Microscope-Energy dispersive X-ray Spectroscopy
(SEM-EDAX)
SEM is a useful technique in the study of both the natural sorbent morphology and its modification
derived from sorbate interactions. SEM is an electron microscope, which provides images of the
sample surface by scanning it with a high-energy beam of electrons. It is comprised of an electron
generating component known as the gun, a column through which electron beam travels, a series
of lenses to shape the electron beam, a chamber where the sample is housed and a series of pumps
to keep the system under vacuum as shown in Figure 2. 5. The electron interactions with the atoms
of the sample produce signals that contain information about topography, morphology, and
composition of the sample surface. The samples must be electrically conductive, at least on their
surface, for conventional SEM imaging. Nonconductive samples are coated with an ultra-thin layer
of electrically conducting material; this coating prevents the accumulation of static electric charges
on the sample surface during electron irradiation. Magnification of the imaging can be controlled
over a range of up to 6 orders of magnitude from about x25 to 250,000 times (Ammrf 2014). When
coupled with energy dispersive X-ray analysis (EDAX), the atom concentrations on the sorbent
surface can be determined. This enables the confirmation of a mechanism of ion exchange,
generally investigated by determining the concentration of alkaline and alkaline-earth metal ions
released from the sorbent after metal sorption (Nixon 1971). SEM-EDX has been used to
determine the morphology of plant biomass. Such as ceiba pentadra (L) Gaertn (Abdullah et al.,
2010), grace waste (Hameed 2009), rice (El-Shafey 2010), corncobs( Khan and Wahab 2007),

39
Botrytis cinerea (Akar, et al., 2005), Moringa oleifera seeds (Kalavathy and Miranda 2010), wheat
(Farooq et al., 2010). It has significant advantages like good resolution at high magnification; it
can do microanalysis such as chemical composition, crystallography, magnetic and electrical
characteristics of a sample. However its major drawback is that it operates under vacuum and
therefore in many analytical procedures, the sample must be rendered conducive in order to view.
This is done by coating the sample with either a metal or carbon (Ammrf 2014)
Figure 2.5: Schematic representation of a SEM layout and function (Adopted from Philips XL 30
ESEM manual)
Energy dispersive x-ray (EDX) is used for the elemental analysis or chemical characterization of
a sample. It relies on an interaction of some source of X-ray excitation and a sample. To stimulate
the emission of characteristic X-rays from a specimen, a high-energy beam of charged particles

40
such as electrons or protons or a beam of X-rays, is focused into the sample being studied. At rest,
an atom within the sample contains ground state electrons in discrete energy levels or electron
shells bound to the nucleus. The incident beam may excite an electron in an inner shell, ejecting it
from the shell while creating an electron hole where the electron was. An electron from an outer,
higher-energy shell then fills the hole, and the difference in energy between the higher-energy shell
and the lower energy shell may be released in the form of an X-ray. The characteristic X-ray lines
are named according to the shell in which the initial vacancy occurs and the shell from which an
electron drops to fill that vacancy. There are three electron shells K, L and M. If the initial vacancy
occurs in the K shell and the vacancy filling electron drops from adjacent (L) shell, a K x-ray is
emitted and if an L-shell electron is ejected and an electron from M-shell fills the vacancy, L
radiation will be emitted (Hafner 2006). Figure 2.6 shows how different X-rays are emitted.
Figure 2.6: X-ray emitted from different electron shells (https://en.wikipedia.org/wiki/Energy-dispersive_X-ray_spectroscopy

41
3.0 EXPERIMENTAL
3.1 Instrumental analysis
A Varian 220FS Atomic Absorption spectrometer operated with air/acetylene was used for
determination of seven selected metal ions which included Pb, Mn, Fe, Zn, Cu, Mg and Cd. Varian
hollow cathode lamps for each of the analysed metals were used as radiation source. 1000 mg L-1
ppm stock solutions of metals were used to prepare working standards (in the range 0.0 to 5.0 mg
L-1) in deionized water. The instrument was calibrated manually by aspirating the prepared
working standards of the cations of interest one by one into the flame. The samples were then also
aspirated manually into the flame for atomization. The instrumental condition applied were
according to AAS manual (PerkinElmer 2006)
Perkin Elmer System, Spectrum two Fourier transform infrared (FTIR) spectroscopy was used to
determine the functional groups of sorbents. The FTIR spectra were recorded in the wavenumber
range 400-4000 cm-1 on a Perkin Elmer system 2000 FTIR. The sorbents were kept at ambient
temperature. 1mg seed powder per 200 mg of KBR was weighed. The powder was pressed into
pellets by using a 15 ton hydraulic press. The data were collected at 2.0 cm−1 resolution, and each
spectrum was a result of 256 scans. A Philips XL 30 ESEM model from USA is an Environmental
Scanning Electron Microscope (ESEM), which was used to determine the surface morphology and
determine elemental composition of the sorbents. The instrument resolution was about 142eV at
amplification time of 10microseconds, it uses an Electron Dispersive X-ray (EDX) detector and
Philips GSR v, 3.2 software. The ESEM worked at beam voltage of 20kV, low vacuum (typically
2 to 6 Torr), and utilizes a chamber gas (H2O) for imaging, charge suppression and sample
humidity.

42
A stainless steel Thomas-Wiley laboratory model 4 grinder purchased from Arthur H Company,
USA was used for grinding the sorbents (Moringa Oleifera seed pods and Morula nut shells).
Hanna Instruments HI 991001 pH meter from USA, used for adjusting the pH of the solutions and
a ZNCL-S Intelligent hot plate was used to heat while digesting samples.
3.2 Materials and Reagents
All reagents were of analytical grade. Acids were used for digesting and adjusting pH. HNO3
(69%) purchased from Skylabs and HCl (32%) from Minema Chemicals, South Africa. Glasswares
such as conical flasks, measuring cylinders, volumetric flasks and filter funnels were purchased
from Pyrex companies. They were pre-cleaned, then soaked in water acidified with HNO3 (1:9 v/v)
and rinsed with deionized water prior to use. Double deionized water (Millipore-Q Millipore 18.2
MΩ/cm resistivity) was also used for dilutions of samples to be analysed with FAAS. Elemental
standards solutions used for calibration were prepared from 1000 ppm of stock solutions supplied
by Minema Chemicals, South Africa (Pb and Fe) , Merck Pty Ltd, USA (Cu, Mn, Mg and Zn) and
Sumitomo Metal Mining Instruments (pty) Ltd, South Africa (Cd). NaOH pellets for adjusting pH
were supplied by Rochelle chemicals, South Africa. An agate pestle and mortar was also used for
reducing the particles further. A 100 µm, 200 µm, 500 µm stainless steel sieves were used for
sieving the sorbents. The filter papers used were ash less Whatmann filter paper no.1 from
England. The filter papers were used to filter the mixtures of sorbents and solution.
3.3 Sampling and treatment of sorbent materials
The Moringa Oleifera seed pods (deseeded) and Morula nut shells were obtained from various
sampling points in Block 9 Gaborone, Botswana.

43
Dried Moringa Oleifera seed pods and Morula nut shells were washed with double deionized
water, further dried in an oven at 1050 C for 24 hr. The dried samples were ground then sieved to
different mesh sizes (100, 200, and 500 µm) and stored in glass bottles until further analysis.
3.3.1 Characterization of Morula nutshells and Moringa seed pods
Fourier transform infrared (FTIR) spectroscopy was used to characterize the two sorbents for
possible functional groups responsible for metal uptake. 0.1 mg of sorbent was placed on the plate
of the FTIR spectrometer and analysis conditions were as shown in Section 3.1. The spectra were
observed for each sorbent before being used for removal of metal ions and after exposure to
sample. The spectra are provided and the peak shifts are shown in results and discussion (Chapter
4, Section 4.1.3).
Environmental Scanning Electron Microscope (ESEM), was used to determine the surface
morphology of MSP and MNS and determine elemental composition of the sorbents. The sorbent
was placed on the SEM grid and coated with carbon at high pressure (see Section 3.1).
3.3.2 Determination of metal concentration in sorbent material
2 g of each ground sorbent was weighed and then digested with an aqua regia solution of HCl:
HNO3 in a ratio of 3:1 v/v. Each mixture was placed in 100 mL conical flasks and heated at 85°C
until the volume was reduced to 1 mL. The resulting volume was filtered using a whatman No. 1
filter paper and put into 50 mL volumetric flasks. Deionized water was added to the flasks and
filled up to the mark. The samples were analyzed using FAAS following a modified method
(Mustafa, 2003).

44
3.3.3 Acid treatment of MSP and MNS sorbents
15 g of each sorbent was weighed and put in a conical flask, 200 mL of 0.1M HNO3 was added
and the mixture was soaked for 24 hours as in literature (Annadural et al., 2003.). The mixture was
then filtered and the sorbent washed several times with deionized water until the pH of the sorbent
was neutral (around pH 7). The sorbent was then dried in an oven at 500C overnight and then put
in glass bottle until further use.
Using the optimized sorption parameters (section 3.4), the sorption capacity for the acid treated
and untreated sorbents were compared to remove selected heavy metals from wastewater samples.
3.4 Batch biosorption studies for metal removal using the two sorbents
All experiments were carried out in batches and done in triplicates. The procedures for optimizing
the various parameters were modified from literature as indicated in the text. A 20 ppm standard
mixture of Mg, Mn, Pb, Fe, Zn, Cu, and Cd was prepared from 1000 ppm stock solution of each
of the seven metals. The sorbent used were ground and sieved Moringa Oleifera Seed Pods and
Morula nut shells. One variable at a time method of optimization was used.
3.4.1 Optimization of parameters
3.4.1.1 Effect of extraction time
0.5 g of sorbent was added to 50 mL of the 20 ppm standard mixture at pH 8. The mixture was
shaken for 8 hours using a water bath shaker at an interval of 10 minutes for the first hour and 30
minutes interval for the rest of the time. This was adopted from a modified procedure from
literature (Amuda, et al., 2007). The mixture was then filtered using whatman No. 1 filter paper
and the filtrate was transferred into a 50 mL volumetric flask and filled with deionized water to

45
the mark. The unbound metals were analysed in the filtrate using FAAS as described in Section
3.1.
3.4.1.2 Effect of pH
To study the effect of initial pH on the sorption, a procedure by Akhtar et al., (2007) was modified.
The pH of a 20 ppm standard mixture was adjusted using 0.1M HCl and 0.1 NaOH in the range 2
to 10. 0.5 g of sorbent was added to 50 mL of each of standard mixture (different pH). The resultant
optimized (see section 4.2.3) filtrate mixture was treated and analysed as in Section 3.4.1.1.
3.4.1.3 Effect of Initial metal concentration
A 50 mL standard mixture of the seven metals (Mg, Mn, Pb, Fe, Zn, Cu, and Cd) was prepared
with concentration ranging from 1ppm to 20 ppm in a 100 mL conical flask (Amuda et al., 2007).
The resultant optimized (see section 4.2.4) filtrate mixture was treated and analysed as in Section
3.4.1.1 for each of the different concentration mixture.
3.4.1.4 Effect of temperature
To study the effect of temperature, 0.5 g of sorbent was added to 50 mL of the 20 ppm standard
mixture solution at pH 8. The mixtures were put into four different water baths in the range 25°C
to 60°C. Each optimized (see section 4.2.6) filtrate mixture (at varying temp) was treated and
analysed as in Section 3.4.1.1.
3.4.1.5 Effect of particle size
Particle sizes of 100 µm, 200 µm and 500 µm of each of the sorbents were obtained by sieving the
ground plant material using different sieve mesh. 0.5 g of each of the sorbents (of varying particle

46
sizes) was weighed and added to 50 mL of the 20 ppm standard mixture solution at pH 8 in a
conical flask. The optimized (see section 4.2.5) filtrate mixtures were treated and analysed as
described in Section 3.4.1.1.
3.4.1.6 Effect of adsorbent dose
To study effect of sorbent dose, a modified method by Garg, et al., (2007) was used. Briefly, a
sorbent dose in the range of 0.5 to 2.5 g was added to 50 mL of the 20 ppm standard mixture
solution at pH 8. The optimized (see section 4.2.2) filtrate mixture was treated and analysed as in
Section 3.4.1.1. Figure 3.1 shows summary of the optimization procedure.

47
Figure 3.1: Summary of the optimization procedures for biosorption of metals on morula nut
shells and moringa seed pods

48
3.5 Application to real samples
3.5.1 Sampling and sample treatment of water samples
Water samples were obtained from Glen valley wastewater treatment plant in Gaborone, Botswana
(Figure 3.2) on the 20th February, 2015. At the treatment plant five sampling sites were identified
(Inlet point, primary settling, secondary settling point, aeration point and effluent point) as shown
by figure 3.2.
Figure 3.2: Map showing location of Glen valley Waste water Treatment Plant Gaborone,
Botswana (24.609085 S, 25.965977 E) (Water Utilities Corporation, 2014. Annual report
2012/13)
Grab sampling technique was used to obtain the water samples from individual sampling sites.
Each sample was put in a labeled amber glass bottle and acidified to pH < 2 for preservation and
also to prevent metal ions from adsorbing on the glass container. The water sample was placed in
the cold room at 40C until analysis.

49
Figure 3.3: Wastewater treatment stages in Glen valley wastewater treatment plant, Gaborone
Botswana (Water Utilities Corporation, 2014. Annual report 2012/13)
3.5.2 Determination of initial metal concentration in water samples
Water samples collected from inlet, primary, secondary, aeration and effluent points were acid
digested following a method adopted from EPA 1999 method 200.2 for analyzing wastewater
samples 50 mL water sample was placed in five 250 mL conical flasks. 1mL of 69% HNO3 and
0.5 of 37% HCl was added to each flask to digest the samples. The mixture was heated until the
initial volume was reduced to approximately 0.5 mL. It was then filtered into a 50 mL volumetric
flask and deionized water added to the mark. The samples were then analyzed with FAAS to
determine the concentration of seven selected metals (Pb, Fe, Mn, Mg, Zn, Cu, and Cd). This was
done in triplicate.

50
3.5.3 Application of the optimized biosorption method to real samples
The extraction efficiency for the acid treated sorbents and the untreated sorbents were compared
by applying the optimized parameters (Section 3.4) to water samples collected from sewage
treatment plant (section 3.5.1) and borehole water collected from a borehole in Artesia, Botswana.
Both Moringa Oleifera seed pods and Morula nut shells biomass were used for the metal removal
in the samples. 50 mL of water samples were used and the optimized conditions applied to both
water samples. The analysis was done in triplicates, and the analytes remaining in the water sample
after sorption were determined with FAAS.
3.6 Performance of the developed method
The analytical parameters studied were linearity, detection limits, method precision and recovery
studies
3.6.1 Linearity
The linearity of the analysis was determined using the matrix matched standard mixtures of
varying concentrations (0.0 mgL-1 to 5.0 mgL-1) prepared using de-ionized water. Each
concentration was determined in triplicates. These were analysed using AAS and the linearity of
the calibration curves were obtained and are discussed in chapter 4 Section 4.3.1.
3.6.2 Detection limits
Limit of detection (FAAS) is the lowest quantity of an analyte that can be distinguished from the
absence of a blank value within a stated confidence limit. The LODs are calculated as three times
standard deviation of seven replicates of water samples spiked with low concentration of analytes
(2 mgL-1).

51
LOD= 3 X SD
The limit of quantification (LOQ), which is the lowest concentration at which the analyte can
reliably be detected for precise quantification, was calculated from the equation below (miller and
Miller, 2010). LOQs were calculates as ten times of standard deviation of the replicates (n)
LOQ= 10 X SD
Where:
SD is the standard deviation of the replicates (n)
Water samples were spiked with 2 mgL-1 of each analyte and were taken through the sorption stage
using the optimized parameters. Then the samples were aspirated into the FAAS to determine the
concentration. The standard deviation was calculated from the concentration of seven spiked water
less the initial concentration of analyte.
3.6.3 Removal efficiency of the sorbents
The samples were spiked with 2 mgL -1 standard of each of the metal ions (Pb, Mn, Mg, Fe, Zn,
Cu and Cd) and the optimized parameters were applied to each. Analysis were done in triplicate
using FAAS. The removal efficiency were calculated using the equation:
% Removal =amount added−amount found
added amount × 100 Eqn 1
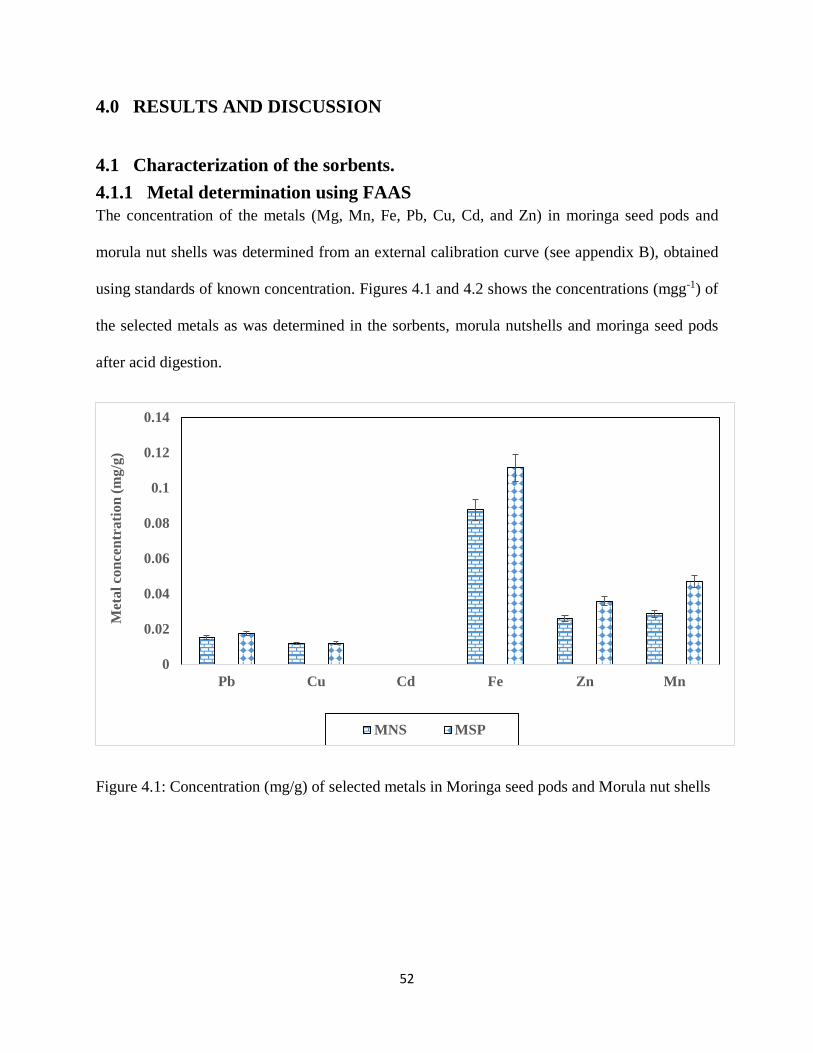
52
4.0 RESULTS AND DISCUSSION
4.1 Characterization of the sorbents.
4.1.1 Metal determination using FAAS
The concentration of the metals (Mg, Mn, Fe, Pb, Cu, Cd, and Zn) in moringa seed pods and
morula nut shells was determined from an external calibration curve (see appendix B), obtained
using standards of known concentration. Figures 4.1 and 4.2 shows the concentrations (mgg-1) of
the selected metals as was determined in the sorbents, morula nutshells and moringa seed pods
after acid digestion.
Figure 4.1: Concentration (mg/g) of selected metals in Moringa seed pods and Morula nut shells
0
0.02
0.04
0.06
0.08
0.1
0.12
0.14
Pb Cu Cd Fe Zn Mn
Met
al
con
cen
trati
on
(m
g/g
)
MNS MSP

53
Figure 4.2: Concentration (mg/g) of magnesium in moringa seed pods and morula nut shells
It was observed that the concentrations of essential elements such as magnesium and iron were
higher. The other metals were in trace levels and cadmium was not detected. All the concentrations
were within the recommended limits for edible plants set by FAO 2012 and WHO 1999. Although
moringa seed pods and morula nut shells are normally considered as waste, they can also be a
source of the mentioned essential elements (Akan et al., 2013).
4.1.2 SEM-EDX analysis
Scanning electron Microscope (SEM) is used to determine the morphology of a sample. It produces
images of a sample by scanning it with focused beam of electrons and produces information about
the sample surface topography and composition (see Section 2.4). Figure 4.3 and 4.4 SEM images
revealing the surface texture and morphology of both MSP and MNS respectively.
0
0.5
1
1.5
2
2.5
3
MNS MSP
Met
al
con
cen
rati
on
(m
g/g
)
Mg
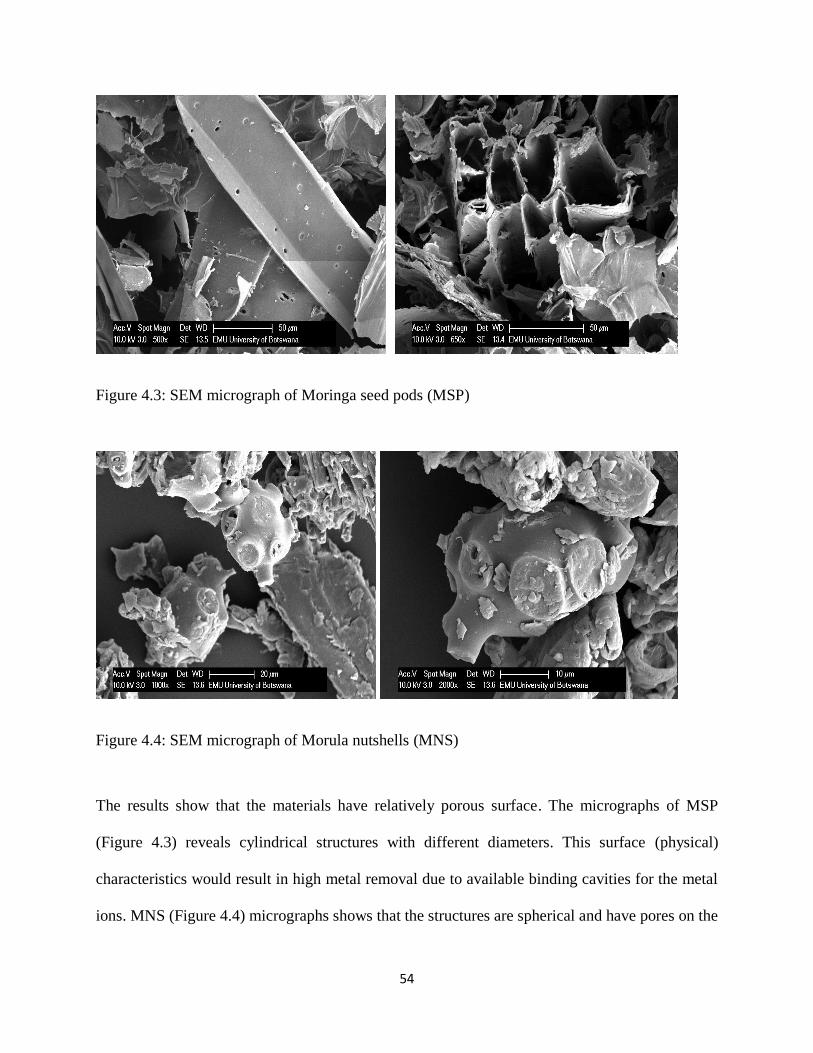
54
Figure 4.3: SEM micrograph of Moringa seed pods (MSP)
Figure 4.4: SEM micrograph of Morula nutshells (MNS)
The results show that the materials have relatively porous surface. The micrographs of MSP
(Figure 4.3) reveals cylindrical structures with different diameters. This surface (physical)
characteristics would result in high metal removal due to available binding cavities for the metal
ions. MNS (Figure 4.4) micrographs shows that the structures are spherical and have pores on the

55
surface offering binding sites for higher adsorption capacity of metal on the sorbent. The pores are
evidence that these materials are efficient for metal removal. The efficiency of a sorbent depends
on available number of pores, pore size and the surface area (Srivastava and Hasan 2011; Ofudje
et al., 2015). The particles with higher surface area and have many pores is expected to be more
efficient for metal removal. Other sorbents have shown similar characteristics for example almond
shells (Demirbas et al., 2004), Moringa oleifera wood ( Kalavathy and Miranda 2010) and fruit
peels (Annadural et al., 2003). However, the efficiency of the sorbent can be increased by
increasing the number of pores and the surface area. This is done by treating the sorbents with
acids or activated with carbons ( Gupta et al., 2010)
Figure 7.1 (see appendix 3) shows the EDX results of MNS and MSP. The amount of the selected
elements in SEM-EDX may show disparities from those of FAAS results. This is because the
SEM-EDX analysis is based on a single particle as compared to that of FAAS that is based on the
total sample. The data on Table 7.8 (appendix 3) shows the elemental composition of MSP and
MNS. The elemental composition of MNS shows that Carbon and Oxygen had higher percentages
(73.06% and 20.69 % respectively), which is expected of plant material. Elements such as Na, Mg,
Al, Si, P, K, Ca, Ba, Fe and Si were in traces. Carbon and oxygen have a higher percentage in MSP
with a 62.53% and 31.98% respectively. Moringa Oleifera tree in general has been reported to
have many essential elements. Foidl et al., (2001) reported that Moringa seed pods had Ca, P, Mg,
Na and K in macro levels while Fe, Mg, Zn and Cu in micro levels. The leaves, back, fruits and
roots of morula tree have also been reported to have high amounts of Ca, Mg and Na and other
metals such as Fe, Cu and Zn are in trace levels (Belemtougri et al., 2001; Adel 2002). As observed
from the elemental composition of the sorbents (Table 7.8), essential elements such as Na, Mg, K,
Ca and Fe are present in MNS and MSP. There is no reported work on the quantities of the essential

56
elements in morula nutshells but it would be expected that the nutshells may have some of the
essential elements found in the other parts of the morula tree. Hence these can be source of the
mentioned essential elements instead of being thrown away.

57
4.1.3 FTIR Analysis
A different way to determine the sites responsible for metal cation interaction with the MSP and
MNS is to check the behavior of the functional groups in the sorbent before and after metal ion
removal. FTIR spectra were used to determine the functional groups responsible for interaction.
The spectrum observed for MNS and MSP were in the range of 500-4000 cm-1 are as shown (Figure
4.5 and 4.6).
The IR spectra of MSP as shown on Figure 4.5a shows broad bands around 3333 cm-1 attributed
to the surface hydroxyl group (Araújo et al., 2013). The bands between 2917 cm-1 and 2840 cm-1
were assigned to stretching vibration of C-H alkene group (Helen Kalavathy and Miranda 2010;
Kumari et al., 2006), The bands between 1736 cm-1 and 1640 cm-1 were attributed to strong C=O
ketonic and aldehyde group. Small peaks observed at 1510 cm-1 and 1468-1300 cm-1 can be
assigned to COO- Carboxylate groups respectively (Bejarano et al., 1994). Around 1250 cm-1 the
band can be assigned to COOH group (Dyer 1991). The bands between 1000 cm-1 and 1250 cm-1
were assigned to be C-O carboxylic acid ether or ester groups (Lin and Rayson, 1998). Bands
below 800 cm-1 can be considered as the finger print regions and any shift in this region could be
due to change in the nature of binding (stretching or bending) (Pradhan, Singh, and Rai 2007).
Figure 4.5b shows the spectrum of MSP after being metal removal (metal loaded MSP). It shows
that some peaks decreased in intensity and also shifted.

58
b
a
4000 500 3500 3000 2500 2000 1500 1000
99
71 72 74
76
78
80
82
84
86
88
90
92
94
96
98
cm-1
%T
1027.66cm-1
1593.97
1373.82
1234.35
3333.98
2917.13
2849.6 1741.4
1510.7
1104.5
896.47
4000 500 3500 3000 2500 2000 1500 1000
100
71 72 74
76
78
80
82
84
86
88
90
92
94
96
98
cm-1
%T
1036.94 1241.58
2901.33 3332.02 1595.04
2976.3
1735
1504.2
1374.2
1156.5
899.72
Figure 4.5: Spectrum of MSP (a) before metal ion removal (b) after metal ion removal

59
Decrease in intensity and shift of the above mentioned peaks as shown in Figure 4.5b is due to
interaction of the metal with the specific functional groups. These interaction could be due to
complex formation of metal with the surface functional groups. Complexation of the metal ions
with the different functional groups is responsible for the removal of metal from the water samples.
Metals forms coordinate bonds with the different functional groups and hence cause a decrease in
peak intensity and also shift in peaks. Altering pH helps in changing the surface charge of the
sorbents thereby improving on the removal efficiency of the sorbent. The functional groups such
as amines, carboxylic, hydroxyl, carbonyls form anionic sites as pH is raised from acidic to basic
conditions. The anionic sites are responsible for binding with the metal cations. The functional
groups responsible for metal removal in MSP are therefore hydroxyl (-OH), C-H of the alkenes,
C=C alkenes and C-O from the carboxylic acids. The peaks from moringa seed pods were assigned
some functional groups and the shifts of the peaks after the sorbent was used for metal removal
were determined as shown in Table 4.1.
Table 4.1: Moringa seed pods peaks from FTIR before and after metal removal, peak shifts and
group assignment of the peaks
Moringa seed pods
Peak wavenumber(cm−1) for
Powder MSP alone
Peak wavenumber(cm−1)
for metal loaded MSP
peak shift group assignment
3333.9 3332.0 1.9 O-H Alcohols, Phenols
2917.1 2976.3 -59.2 C-H Alkenes,
2849.6 2901.0 -51.4 C-H Alkenes
1741.4 1735.0 6.4 C=O Esters
1593.9 1595.0 -1.1 C-C Aromatics
1510.7 1504.2 6.5 C=C alkenes
1234.3 1241.5 -7.2 C-O Carboxylic acid
and esters
1104.5 1156.5 -52.0
1027.6 1036.9 -9.3
896.5 899.7 -3.2 C-H Aromatics

60
Figure 4.6: Fig: Spectrum of MNS (a) before metal ion removal (b) after metal ion removal
a
b
4000 500 3500 3000 2500 2000 1500 1000
99
71 72
74
76
78
80
82
84
86
88
90
92
94
96
98
cm-1
%T
1035.16
1232.78
2922.44
1711.79 3334.03
1505.16
1622.54
899.72
1159.7
1371
2852.8
4000 500 3500 3000 2500 2000 1500 1000
100
81 82
84
86
88
90
92
94
96
98
cm-1
%T
1048.34
1241.64
2988.19
902.97
1156.5
1377.4
1731.7
2895 3327.3
3665.3

61
Figure 4.6a shows the spectrum of MNS before being loaded with the metal and Figure 4.6 b is
after loading with the metals. There is a significant change in intensity of peaks and shift of the
peaks on the metal-loaded sorbent as shown in Figure 4.6b using MNS. The bands around 3300
cm-1 assigned to O-H group in the metal-loaded sorbents decreased in intensity and shifted as
shown in Table 4.1 and 4.2. This is attributed to the fact that the metals were forming bonds with
the OH group and fewer OH groups are present on the surface (Cox et al., 2000). The peak shift
at around 2900 cm -1 assigned is due to metals forming coordinates bonds with the C=C bonds of
the alkenes. Likewise the peaks around 1593cm-1 and 1027cm-1 in metal-loaded MNS is
respectively attributed to stretching of C-C from aromatic rings and C-O from carboxylic acids,
ester and ethers. The peaks around 1711cm-1, 1232cm-1 and 1035cm-1 were respectively attributed
to the stretching of C-O from Ketones, C-N from aliphatic amines and C-O from either carboxylic
acid, esters or ethers(Pradhan et al., 2007;Araújo et al., 2013; Helen Kalavathy and Miranda 2010;
Kumari et al., 2006).
Table 4.2 below shows the assigned peak wavenumber for MNS without the metal, those of MNS
metal loaded, peak shifts and the assigned functional groups
Table 4.2: Morula nutshell peaks from FTIR before and after metal removal, peak shift and
functional group assignment.
morula nut shells
Peak wavenumber(cm−1) for
Powder MNS alone
Peak wavenumber
(cm−1)for metal loaded
MNS
peak shift group assignment
3334.9 3327.3 7.6 O-H Alcohols
2922.4 2988.2 -65.8 C-H alkenes
2852.8 2895.0 -42.2 C-H alkenes
1711.8 1731.7 -19.9 C-O Ketones
1371.0 1377.4 -6.4 COO- Carboxylate
1232.8 1241.6 -8.9 C-N aliphatic amines
1159.7 1156.5 3.2

62
1035.2 1048.3 -13.2 C-O Carboxylic acids,
esters, ether
899.7 903.0 -3.3 C-H Aromatic
The functional groups such as amines, carboxylic, hydroxyl, carbonyls form anionic sites as pH is
raised from acidic to basic conditions. The anionic sites are responsible for binding with the metal
cations. It can be speculated that combination of the following could be the principal mechanism
for metal removal i) electrostatic interactions between the conjugate base of either carboxyl group
or amine group (at pH 8) reacting with metal ions, (ii) Coordination or complex formation (using
empty d-orbitals of metal ions) to interact with the electron pairs from the oxygen in the carboxyl,
hydroxyl and nitrogen of the amine groups, (iii) Ion exchange processes in which the ionisable
hydrogen on the carboxyl and amine groups exchange with metal cations, (iv) Microprecipitation
(especially at higher pH) where the OH- ions forms insoluble hydroxides with the metal ions and
the sorbent here then acts as a filter, (v) Acid-base interactions. Most of these metal ions are hard
acids and the interact with atoms on the functional groups such as oxygen on the carboxyl and
hydroxyl group and nitrogen on the amine groups (vi) Adsorption for example with the presence
of alkenes, the concentration of electron density on them actually creates dipole moments with
negative dipole moment concentrated on the center of the double bond and the positively charged
metal ions will sit on these areas with high electron density. It can be concluded that in the MSP,
the functional groups significant for metal removal is the carbonyls, alcohols and alkenes groups.
While with MNS, the active groups for metal removal are the alcohols, carbonyls, alkenes, amines
and carboxylic acids.

63
4.2 Optimization of parameters.
Different parameters such as pH, biosorbent dosage, initial metal concentration, temperature,
particle size, and contact time affect the sorption capacity of heavy metals onto the sorbent. The
Table 4.3 below shows a summary of the effect of the major factors affecting adsorption of heavy
metals (Chojnacka 2010)
Table 4.3: A summarized table of effects of factors affecting sorption capacity.
Factors Effect
pH Increase in pH enhances biosorptive removal of cationic metals,
but reduces that of anionic metals.(Akhtar et al. 2007)
Biosorbent dosage Increase of sorbent dose increases percentage removal, due to
increase in the number of binding sites.(U. Garg et al., 2008)
Initial metal concentration It affects the quantity of biosorbed pollutant per unit weight of
biosorbent up to a point of sorbent saturation then remains
constant.(Akar, Tunali, and Kiran 2005)
Temperature It usually enhances biosorptive removal of adsorptive pollutant by
increasing surface activity and kinetic energy of the adsorbate, but
may damage physical structure of biosorbent. (M. Nadeem et al.,
2006).
Agitation speed It enhances biosorptive removal rate of adsorption pollutant by
minimizing its mass transfer resistance, but may damage physical
structure of biosorbent.

64
Ionic strength It reduces biosorptive removal of adsorptive pollutant by
competing with the adsorbate for binding sites of biosorbent.
Particle size Small particles are favorable for batch process due to higher
surface area of the biosorbent, but not for column process due to
its low mechanical strength and clogging of its column.
Other competing metal
concentration
If coexisting metal competes with a target pollutant for binding
sites or forms any complex with it, higher concentration of other
pollutants will reduce biosorptive removal of the target pollutant.
Each parameter was varried while others were kept constant.
The removal efficiency was determined by computing the percentage removal using the formula
in equation (1) below
% Removal = 𝐶𝑖−𝐶𝑓
𝐶𝑖 × 100 Equation 2
Where,
Ci – is the initial concentration of metal in water sample before sorbent is added
Cf – is the concentration of metal in water sample after removal of metal ion

65
4.2.1 Effect of Contact time
Contact time is an important parameter for determining the equilibrium time required for the
sorption of metal ions on a sorbent as it is directly proportional to amount of metal ions removed
from aqeous solution. In other studies moringa seeds and seed pods have shown maximum removal
at optimum time of 60minutes (Obuseng et al., 2012; Akhtar et al., 2007) and 40 minutes (Sharma
et al., 2006; Adelaja et al., 2011). It was observed that when MSP sorbent was used for metal
removal, the highest removal was reached within 60 min (Figure 4.7) and for MNS sorbent was
120 min (Figure 4.8), the equilibrium was reached and further increase in time did not show any
significant change. More time was required with MNS and this may be attributed to charactreristics
(particles shape, pore size and the fuctional groups) of the MNS that are different to those of MSP
as seen in section 4.1.2 and 4.1.3. Akhtar et al (2007) found 60 minutes to be the equilibrium time
and while Reedy et al., (2010) used 30 minutes. The extraction efficiency of the selected metals
by MSP was directly proportional to the sizes of the metal ions i.e the order was
Pb>Cd>Fe>Cu>Mn>Zn>Mg (largest to smallest), with exception of Cu and Mg. This trend could
be attributed to the fact that the sorbents have pores of different sizes, (see Figure 4.1 and 4.2) and
therefore offer different binding sites to the different metal ions as explained by Gurgel and Gil
(2009). However, larger metal ions were removed efficiently compared to smaller ions. In sorption
studies, affinity of cations to the sorbent is greater for larger ions compared to smaller ions (Lee
2008). Similar trend has been observed in previous studies (Obuseng et al., 2012). The trend in
metals removal by MNS from the aqueous samples was in the order Cu>Fe>Pb>Zn>Cd>Mn>Mg.
Percentage removal of the metal ions on the MNS increases with increase in contact time. More
time allows the adsorbent particle to intract with the metal ion and increase chances of more
adsorption(Jimoh, 2012). MNS has greater affinity for the metal with higher electronegative
values, i.e Cu (2.00 Pauling), Fe (1.91 Pauling), Pb (2.33 Pauling), Zn ( 1.65 Pauling), Cd, (1.69),

66
Mn (1.55 pauling) and Mg (1.31 Pauling). Higher biosorption of the metals on the sorbents can
also be explained by hard-soft-base theory (Fourest and Roux 1992). Metals belonging to hard
acid like Fe may be removed effectively.
One way-analysis of variance (ANOVA) was used to determine that there was no significant
change after the selected optimum time (see appendix A9) for the two sorbents. Therefore the
subsequent experiments using MSP were performed at the optimum contact time of 60 minutes
while using MNS was 120 minutes.
Figure 4.7: Effect of contact time on metal removal using MSP. (Other conditions kept constant)
0
10
20
30
40
50
60
70
80
90
100
0 30 60 90 120 150 180 210
% R
emoval
Time (minutes)
Cd
Mn
Pb
Zn
Cu
Fe

67
Figure 4.8: Effect of contact time on selected metal removal using Morula nut (MNS) sorbent.
(Other optimized conditions kept constant)
4.2.2 Sorbent dose
It is expected that as the sorbent amount increases, the number of sorbent particles surrounding the
metal ion or ratio of sorbent particle to metal ion increases (Iftikhar et al., 2009). These increases
the surface area on which the metal ions binds to the surface of the sorbents and hence increasing
the removal efficiency (Adelaja et al., 2011). However a further increase beyond the optimum
sorbent dose, decreases the percentage removal and this is attributed to possibility of metal
bbleeding from the material and also the fact that there is possibility of the particle overlapping
and overcrowding resulting in a reduction of the total adsorbent surface area and hence decreases
the percentage removal (Iftikhar et al., 2009; Rahman and Islam 2009; Pehlivan et al., 2009).
Figure 4.9 shows that as the sorbent dose was increased from 0.5 g to 1.0 g of MSP sorbent, the
percentage removal of metal ions increased and the optimum sorbent dose for the removal of Cd,
Mn, Zn, Cu and Fe was 1g except Pb which had its highest removal using 1.5 g sorbent. However
ANOVA showed that there was no significant difference when 1g was used to remove Pb ions
-20
0
20
40
60
80
100
120
0 30 60 90 120 150 180 210 240
% R
emoval
Time (minutes)
Cd
Mn
Pb
Zn
Cu
Fe
Mg

68
(see appendix A5). The results for metal removal using MNS adsorbent at different dosing levels
(0.5 g to 2.5g) showed a slight increase for Cd, Mn and Zn up to 2 g dosing level (Figure 4.10),
but no significant difference was observed for copper,lead and iron at all dosing levels (based on
ANOVA; see appendix A4 and A5). Similar studies have been reported with other low cost
sorbents like moringa seeds (Sharma et al., 2006; Akhtar et al., 2007), sawdust (Shukla et al.,
2002; Gupta and Babu 2009) and corncobs (Nasiruddin and Farooq 2007). While using 0.5 g and
1.0 g of MNS, Mg desorbed into the solution and therefore there was no removal of magnesium
from the aqeous solution. 1.5g of sorbent showed highest removal for magnesium. However there
was no significant difference when using 2.0g.
Therefore 1g of MSP and 2.0g of MNS was taken to be the optimum sorbent dose for the
experiments.
Figure 4.9: Effect of adsorbent dose on metal removal using Moringa seed pods. (Other
optimized conditions kept constant)
0
10
20
30
40
50
60
70
80
90
100
Cd Mn Pb Zn Cu Fe
% R
emoval
metals
0.5g
1 g
1.5 g
2 g

69
Figure 4.10: Effect of adsorbent dose on metal removal using MNS. (Other optimized conditions
kept constant)
4.2.3 Effect of pH
The pH of aqeous solution is very important in sorption processes since it affects the solubility of
metal ions, concentration of the counter ions on the functional groups of the adsorbent and the
degree of ionization of the sorbate during the reaction (Amuda, Giwa, and Bello 2007). An increase
in pH of solution while keeping all other factors (time, temperature,metal concentration, sorbent
dose and particle size) constant, increased the percentage removal (rise of curves) of the selected
metal ions using the MSP (Figure 4.11) and MNS (Figure 4.12 ). This could be due to the surface
charge on the sorbent. The functional groups such as amines, carboxylic, hydroxyl, carbonyls (see
Table 4.1 and 4.2) form anionic sites as pH is raised from acidic to basic conditions. The anionic
sites could be responsible for binding with the metal cations. At low pH, the cations compete with
the hydrogen ion in the solution for the active sites and therefore lower adsorption. But at higher
pH, the surface of the adsorbent has a higher negative charge which aatracts more cations (Helen
0
20
40
60
80
100
Cd Mn Pb Zn Cu Fe Mg
% R
emoval
Metals
0.5g
1 g
1.5 g
2 g
2.5 g
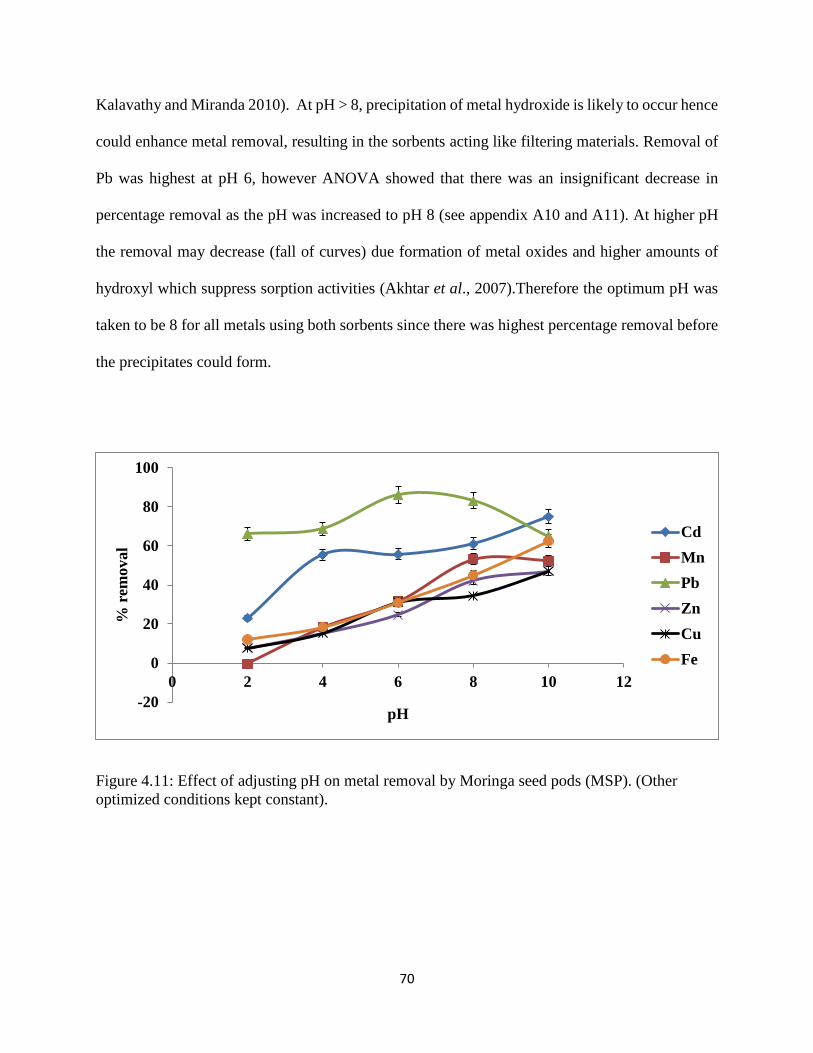
70
Kalavathy and Miranda 2010). At pH > 8, precipitation of metal hydroxide is likely to occur hence
could enhance metal removal, resulting in the sorbents acting like filtering materials. Removal of
Pb was highest at pH 6, however ANOVA showed that there was an insignificant decrease in
percentage removal as the pH was increased to pH 8 (see appendix A10 and A11). At higher pH
the removal may decrease (fall of curves) due formation of metal oxides and higher amounts of
hydroxyl which suppress sorption activities (Akhtar et al., 2007).Therefore the optimum pH was
taken to be 8 for all metals using both sorbents since there was highest percentage removal before
the precipitates could form.
Figure 4.11: Effect of adjusting pH on metal removal by Moringa seed pods (MSP). (Other
optimized conditions kept constant).
-20
0
20
40
60
80
100
0 2 4 6 8 10 12
% r
emov
al
pH
Cd
Mn
Pb
Zn
Cu
Fe

71
Figure 4.12: Effect of pH on metal removal using morula nut shells (MNS) while keeping other
optimized condition constant
-20
0
20
40
60
80
100
0 2 4 6 8 10 12
% r
emoval
pH
Pb
Cd
Mn
Zn
Cu
Fe

72
4.2.4 Effect of initial metal concentration
The initial concentration provides essential driving force to overcome all mass transfer resistance
of metal ions between the aqeuous and the solid sorbent (Malkoc and Nuhoglu 2005). As the initial
metal concentration is increased, the removal efficiency is increased and after saturation, the
percentage removal is constant as shown in Figure 4.13 while using MNS. This could also be
attributed to the saturation of the binding sites as more ions are added in the solution. As the
concentration of metal ion increases, the number of metal ions competing for available binding
sites on the sorbent increases. Therefore, binding sites become quickly saturated as the biomass
amount remained constant (Bhatti et al., 2007; R. Nadeem et al., 2008). The same was observed
using MSP, at lower concentration there was an increase in removal effciency, however after a
threshold (different for each metal) any further increase in the metal concentration resulted in a
reduced removal efficiency for Zn, Mn, Fe, Cu and Cd (See Figure 4.14). Removal of Mg by both
sorbents was poor and these was attributed to limited loading capacity of the sorbents due to
saturation of magnesium binding sites. This is because the concentration of magnesium ions in the
sorbent was higher (see Section 4.1.1) in comparison to the other metals. Therefore increase in
initial concentration led to a decrease in percentage removal of magnesium.
.

73
Figure 4.13: Effect of initial metal concentration on metal removal by MNS. (Other optimized
conditions kept constant)
Figure 4.14: Effect of initial metal concentration on metal removal by MSP. (Other optimized
conditions kept constant)

74
4.2.5 Effect of Particle size
Surface area of the sorbent is significant for sorption process. Exposure of the sorbent sites for
solid-metal ion interaction is high if the surface area of the sorbent is high. As shown in the Figure
4.15 and Figure 4.16 using MSP and MNS respectively, the percentage removal of the metal was
effective at sorbent particles size less than 100 µm as compared to larger particles. The smaller
the particle size the higher the surface area per unit weight of sorbent and hence higher percerntage
removal is expected (Bhatti et al., 2007). Similar trends have been observed by other
researchers(Shukla et al., 2002; Nadeem et al., 2008; Obuseng et al., 2012). An exception was the
Magnesium that showed higher removal at 500 µm while using MNS (Figure 4.16) and this may
be attributed to the fact that magnesium may prefer to adsorbed internally as opposed to external
adsorption. Beside adsorption at the outer surface of the sorbent, there is a possibility of
intraparticle diffussion from the outer surface into the internal surface of the sorbent (Shukla et al.,
2002). A large particle size has larger internal surface area than a small one, and hence Mg showed
higher removal at 500 µm than at 100 µm. However ANOVA (analysis of variance) significant
test was conducted to show if there was any significant change and showed that using 100 µm had
no significant difference(see appendix A1 and A3) resulting to using 100 µm to be the optimum
particle size using both sorbents. It was also observed that while using MSP, there was no removal
of magnesium due to the fact that MSP had higher amounts of magnesium (see Section 4.1.1) and
therefore the adsorbing sites for magnesium were saturated.

75
Figure 4.15: Effect of particle size on metal removal using MSP (Other optimized conditions
kept constant)
Figure 4.16: Effect of particle size on metal removal using MNS (Other optimized conditions
kept constant)
0
10
20
30
40
50
60
70
80
90
100
Cd Mn Pb Zn Cu Fe
% R
emoval
metals
100µm
200µm
500µm
0
20
40
60
80
100
120
Cd Mn Pb Zn Cu Fe Mg
% R
emoval
Metals
100µm
200µm
500µm

76
The ionic sizes trend of the metals is Pb>Cd>Zn>Cu>Mg>Fe>Mn for divalent cations. The larger
ions are expected to be removed first and the order of removal should decrease from Pb to Mn, but
in some case it will be different depending on the environment of the interacting sites. This trend
was not observed completely and this could be attributed to the fact that the metals were interacting
differently with the MNS and MSP adsorbing sites.
4.2.6 Effect of Temperature
An increase of removal efficiency with increase in temperature has been attributed to two factors.
Increase in temperature increases the mobility of the metal ions towards the sorbent and also it
may cause a swelling effect within the internal structure of the sorbents and therefore enabling the
metal ions to penetrate further or increases the surface area for the binding of the metal ions (Asku
2002; Malkoc and Nuhoglu 2005; Nadeem et al., 2006)
Temperature effect on metal removal by the sorbents was investigated using batch experiments
conducted in water bath with temperature range from 25°C to 60°C. There was no significant
change in percentage removal for other metals except for lead where there was increase at 35°C
as depicted in figure 4.17 when using MSP. It was also observed that there was no significant
change (see appendix A) when higher temperatures up to 60°C were used, hence 35°C was used
as optimum temperature. Araújo et al., 2013 discussed that use of Moringa seed pods for removal
of Zn and Pb worked well at a temperature of 30°C to 35°C. Figure 4.18 shows an increase in
percentage removal from 25°C up to 35°C for removal of Zn, Cd, Mn and Mg using MNS. For
removal of Fe, Cu, and Pb was not significantly different when temperature was altered (see
appendix A6 and A7) and hence 35°C was therefore taken to be optimum extraction temperature.

77
Figure 4.17: Effect of Temperature on metal removal using MSP (Other optimized conditions
kept constant)
Figure 4.18: Effect of Temperature on metal removal using MNS (Other optimized conditions
kept constant)
0
20
40
60
80
100
120
20 25 30 35 40 45 50 55 60
% R
emoval
Temperature °C
Fe
Cu
Cd
Mn
Zn
Pb
0
20
40
60
80
100
120
20 25 30 35 40 45 50 55 60
% R
emoval
Temperature °C
Fe
Cu
Cd
Mn
Zn
Pb
Mg

78
4.3 Performance of developed study
After optimization (see Table 4.8), the developed method was validated by studying linearity,
recoveries and detection limits.
4.3.1 Calibration studies
The Table 4.4 below shows the regression equations and correlation coefficients of metal using
FAAS. The linearity was determined from the matrix matched standards spiked at different
concentrations, ranging from 0 to 5mgL-1. The calibration curves were obtained from plotting ratio
of peak areas of individual metal standards against concentration of the individual standard using
Microsoft excel software (see appendix 2). All the metal showed a good linearity with the
correlation coefficients greater than 0.99. These observations are in agreement with other work
when extracting heavy metals from different matrices e.g wastewater (Balarama Krishna et al.,
2005; Ghaedi et al. 2009) and sludge (Jamali et al., 2009).
Table 4.4: Linearity data for selected metals using FAAS
Metal Regression equation R2
Mg y= 0.241x + 0.0189 0.9970
Fe y=0.0424x + 0.0027 0.9997
Cu y= 0.1053x + 0.0059 0.9995
Cd y= 0.1545x + 0.0388 0.9923
Pb 0.0241x + 0.0013 0.9996
Zn y=0.1234x +0.0334 0.9922
Mn y= 0.086x + 0.0092 0.9982

79
4.3.2 Removal efficiency of the sorbent
Table 4.5 shows the average metal removal (%) of the seven selected metals. The method show
efficient removal from the range of 86.49 ± 4.33 to 99.63 ± 1.84%. The limits were within
allowable limit 70-130% set by EPA method 40. Other studies have also shown better efficiencies
in removal of Fe, Cu, Ni, Co, Cr and Zn from environmental samples was between 96.0 ± 1.4% to
106 ± 1.1%. (Ghaedi et al., 2007).
Table 4.5: Percentage removal of the selected metals
Metal
Removal (%) ± RSD
(MSP)
Removal (%) ± RSD
(MNS)
Pb 92.54 ± 1.85 89.01 ± 3.59
Cu 89.86 ± 2.01 90.33 ± 2.11
Cd 99.63 ± 3.36 93.61 ± 1.97
Fe 92.14 ± 1.84 87.06 ± 2.07
Zn 95.95 ± 1.92 91.66 ± 1.37
Mg 86.49 ± 4.33 88.04 ± 1.49
Mn 94.11 ± 1.88 95.07 ± 3.89
4.3.3 Detection Limits
The limit of detection (LODs) and Limit of quantification (LOQs) were investigated as per section
3.61. The limit of detection and quantification of the selected metals using FAAS is shown on
Table 4.6

80
Table 4.6: Limit of detection and quantification of selected metals.
Metal LOD(mgL-1) LOQ(mgL-1)
Pb 0.031 ± 0.010 0.098 ± 0.01
Cu 0.010 ± 0.003 0.030 ± 0.003
Cd 0.015 ± 0.005 0.048 ± 0.005
Fe 0.036 ± 0.010 0.114 ± 0.010
Zn 0.015 ± 0.005 0.048 ± 0.005
Mg 0.067 ± 0.020 0.223 ± 0.020
Mn 0.011 ± 0.003 0.035 ± 0.003
The LODs were calculated as three times the standard deviation of 7 replicates runs of blank plant
samples spiked with low concentration of analytes. For calculating the LOQs, the standard
deviations were multiplied by ten. The detection limits were lower than 0.1 mgL-1. Detection limits
may vary depending on several factors such as; type of the matrix, instrument type and condition.
Similar results were observed in different studies, detection limits for removal of Cu, Ni, Co and
Pb were recorded to be ranging from 0.08 to 0.26 mgL-1 (Duran et al., 2007). However other studies
have shown lower detection limits and others higher detection limits(Balarama Krishna et al.,
2005)

81
4.4 Application of optimized conditions to real samples
4.4.1 Removal of metal ions from aqueous solution using optimized
conditions
After determining the optimum parameters as shown in Table 4.7, the parameters were applied in
a 50 mL aqeous solution in similar procedure as section 3.5.3. The percentage removal of metal
ions was as shown in the Table 4.8
Table 4.7: The optimised extraction parameters using 20 ppm standard mixture solution.
MATERIAL
CONTACT
TIME
(min) PH
TEMP
(°C)
ADSORBENT
DOSE (g)
PARTICLE
SIZE (µm)
Morula nut shells 120 8 35 2 100
Moringa seed pods 60 8 35 1 100
Morula nutshell sorbent showed a higher metal removal compared to Moringa seed pods as shown
in Table 4.8.
Table 4.8: Percentage removal of metal ions using MNS and MSP
Average (%) removal of metal ions
Fe Cu Cd Mn Zn Pb Mg
Moringa seed pods 70.5 45.3 66.0 32.6 34.4 92.5 -
Morula nut shells 99.0 98.7 72.5 48.9 65.9 99.6 21.9
Higher percentage removal using morula nut shells could be attributed to a number of factors like
(i) possibility of more binding sites on the surface of morula nutshells as compared to Moringa

82
seed pods; (ii) there was more interaction of the metal to the functional groups in Morula nutshells
(See Table 4.2) as compared to those of Moringa seed pods (Table 4.1) and (iii) some functional
groups present in Morula nutshells, were not available in Moringa seed pods for example C-N
aliphatic amines (see Figure 4.5 and 4.6). Hence, Morula nut shell performed as a better sorbent.
Similar trend was observed during optimization of the parameters affecting sorption process (see
sections 3.2.1 to 3.2.6). Morula nut shells showed higher percentage removal as compared to
Moringa seed pods during optimization process.
Magnesium desorbed from the MSP sorbent into the solution, therefore it was not possible to
remove magnesium when using the Moringa seed pods biomass. However, a 21% removal was
recorded when MNS were used. This could be attributed to higher initial concentration of
magnesium in the sorbents in comparison to other selected metals (see Figure 4.2).
4.5 Determination of metal concentration in real water samples
The main water source for local people in Botswana is ground waters from local boreholes but
most of the boreholes have low capacity (The World bank, 2009). The supply does not meet the
demands for irrigation. Around the Glen Valley Wastewater treatment plant, irrigation schemes
using the wastewater from the plant have been set up (Nkegbe, 2005). Due to these factors,
borehole and wastewater samples were ideal to be used as the real water samples in this work. Five
sampling sites from wastewater treatment plant were considered while analyzing for heavy metals
in the wastewater samples. The samples were collected from inlet point, primary settling tank,
secondary settling tank, aeration tank and effluent storage tank (Section 3.5.1). The initial total
metal concentrations (mgL-1) from the digested wastewater samples and borehole water samples
were determined as shown in Table 7.9 (appendix 4).

83
The metal concentrations in all the sampling points in the wastewater treatment plant were found
to be within the allowed levels which are set by waste water specification-BOBS 93:2012 in
Botswana and US EPA (United States Environmental Agency, 1992), except for Mn at effluent
point that were higher than the allowed limits of 0.1mgL-1 by BOBs and 0.2mgL-1 by the
EPA,1992.
Figure 4.19, shows the trend of the concentration of the selected metals from the inlet point to the
effluent point. It was noted that in the treatment plant, the concentration decreased from inlet point
until the secondary tank, then increased at the aeration tank then decreased at the effluent tank. A
decrease in concentration of metal from inlet point up to secondary tank could be due to the
treatment processes at the plant, where the metal ions are removed from the water through adhesion
of the ions on organic and inorganic waste that is screened and removed at the different stages. An
increase at aeration tank could be due to continuous accumulation of the metal ions in tank over
time. At aeration tank, air is pumped into the water to encourage bacteria to breakdown the tiny
bits of sludge that escaped the sludge scrapping process. The breakdown of the sludge increases
the particles and hence increasing the surface area onto which the metal ions can adsorb on.
Therefore the waste water that is transferred from aeration to effluent tank has lower metal
concentration as seen depicted by the trend below.

84
Figure 4.19: Concentration (mg/L) of metal in Sewage wastewater samples using FAAS
The results for the borehole water samples also showed that the water was not highly contaminated
with the selected heavy metals, and therefore was safe for drinking according to WHO 1992 and
BOBS 2009. Figure 4.20 shows the concentration of Mg and Fe to be higher compared to Pb. This
metals are essential and expected to be abundant in borehole water since they are naturally
occurring minerals. All other metals were below detection limit and therefore not detected as
shown on Table 4.9
Table 4.9: Average concentration of metal ions in the borehole samples using FAAS
Average Conc (mg L-1) of metal in borehole water and the standard deviations
Fe Zn Cu Cd Pb Mn Mg
0.3440 ±
0.0036
Not
detected
Not
detected
Not
detected
1.2877 ±
0.0321
Not
detected
0.1133 ±
0.0079
0
0.5
1
1.5
2
2.5
3
3.5
4
Inlet Primary Secondary Aeration Effluent
Met
al
con
cen
trati
on
(m
g/L
Holding tanks
Mn
Pb
Cd
Cu
Zn
Fe
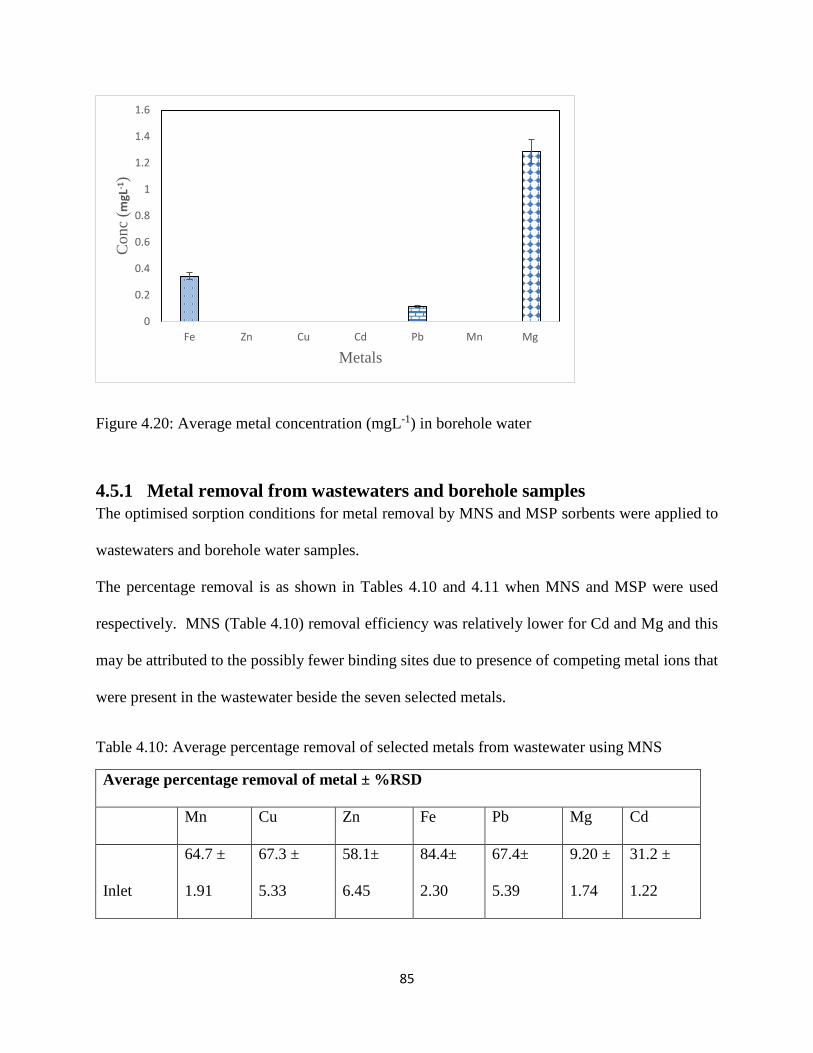
85
Figure 4.20: Average metal concentration (mgL-1) in borehole water
4.5.1 Metal removal from wastewaters and borehole samples
The optimised sorption conditions for metal removal by MNS and MSP sorbents were applied to
wastewaters and borehole water samples.
The percentage removal is as shown in Tables 4.10 and 4.11 when MNS and MSP were used
respectively. MNS (Table 4.10) removal efficiency was relatively lower for Cd and Mg and this
may be attributed to the possibly fewer binding sites due to presence of competing metal ions that
were present in the wastewater beside the seven selected metals.
Table 4.10: Average percentage removal of selected metals from wastewater using MNS
Average percentage removal of metal ± %RSD
Mn Cu Zn Fe Pb Mg Cd
Inlet
64.7 ±
1.91
67.3 ±
5.33
58.1±
6.45
84.4±
2.30
67.4±
5.39
9.20 ±
1.74
31.2 ±
1.22
0
0.2
0.4
0.6
0.8
1
1.2
1.4
1.6
Fe Zn Cu Cd Pb Mn Mg
Conc
(mgL
-1)
Metals

86
Primary
65.8 ±
8.37
62.8 ±
6.83
49.6 ±
4.90
80.3±
2.23
49.4±
2.04
13.4 ±
4.78
36.1 ±
5.07
Secondary
58.6 ±
6.69
61.8 ±
4.90
62.2 ±
4.55
67.6±
4.01
46.5±
4.17
7.60 ±
2.07
48.9 ±
5.46
Aeration
57.9 ±
4.24
77.1 ±
5.75
60.0 ±
2.63
87.8±
3.42
76.5±
3.16
10.9 ±
2.95
51.6 ±
5.75
Effluent
56.8 ±
2.96
60.4 ±
3.63
53.9 ±
5.65
64.6±
5.59
56.6 ±
4.77
8.00 ±
2.18
44.1 ±
5.44
Removal of Zn and Mg was impossible. It was noted that Zn and Mg were desorbed from MSP
into the wastewater samples. This could be attributed to saturation of binding sites for Mg and Zn
in the sorbents. However all the other metals were effectively removed at effluent point and the
percentage removal was ≥ 52% as shown in Table 4.11 below.
Table 4.11: Average percentage removal of selected metals using MSP
Average percentage removal of metal ± %RSD
Mn Cu Fe Pb Cd
Inlet 34.9±2.09 76.7 ± 2.96 73.5± 3.95 78.9± 3.16 53.8 ± 2.60
Primary 35.9 ± 3.19 64.2 ± 2.98 74.0 ±2.01 67.3± 4.32 51.1 ± 3.13
Secondary 54.1 ± 5.38 72.6 ± 3.03 79. 1± 1.33 69.1± 4.27 51.9± 2.14
Aeration 45.8 ± 2.14 78.3 ± 1.94 84.0 ±2.32 76.4± 2.91 54.4 ± 1.59
Effluent 52.0 ± 1.82 73.5 ± 3.43 68.7± 1.64 69.8± 2.80 62.7 ± 3.89

87
Percentage removal of the metal using both sorbents was lower in comparison to optimization
steps as compared to using the real samples. This is due to matrix effect while using the real
samples. During optimization step, aqueous solution used were prepared using standards of the
seven selected metals while the real samples contain other metals and other organic compounds
and therefore the selected metals were competing with other analytes for the same binding sites
and consequently reducing the percentage removal. The method was precise since the calculated
percentage relative standard deviation (RSD) is < 10% in both cases as seen in Table 4.10 and
4.11.
A comparison of the metal concentration in the borehole sample before and after removal using
MSP (Figure 4.21) and MNS (Figure 4.22) was done. Percentage removal of Fe, Mg and Pb was
54.94 ± 2.52, 64.47 ± 2.32 and 100 ± 1.69 respectively when using MNS. Using MSP the removal
was 29.94 ± 3.01 and 91.17 ± 3.44 for Fe and Pb respectively. The method was precise (% RSD
<4%) for all metals. However, Zn and Mg desorbed into the water samples resulting into an
increase in the final metal concentration while using MSP as shown in Figure 4.21. This could be
attributed to the high concentration of the metal ions in sorbent as compared to the borehole
samples.

88
Figure 4.21: Metal removal from Borehole water sample using optimized sorption conditions
with MSP
Figure 4.22: Metal removal from Borehole water sample using optimized sorption conditions
with MNS
0
0.5
1
1.5
2
Fe Zn Cu Cd Mg Mn Pb
Met
al C
on
cen
trat
ion
(mgL
-1)
initial conc Final Conc (MSP removal)
0
0.2
0.4
0.6
0.8
1
1.2
1.4
Fe Zn Cu Cd Mg Mn Pb
Met
al C
on
cetr
atio
n (
mgL
-1)
initial conc Final Conc (MNS removal)

89
4.6 Use of treated MNS and MSP for metal removal from wastewater
samples
Use of untreated plant biomass is capable of directly sorbing metal ionic species from aqueous
solutions ( Volesky and Holan 2003; Singh et al., 2006; Sarin & Pant 2006; Zwain et al., 2014) .
This has also been confirmed in this work. To further enhance metal removal efficiency,sorbents
can be chemically pre-treated using acid. Chemical treatments that are commonly employed are
alkaline solutions, phosphoric and citric acids (Wayne E. Marshall and Johns 1996). This treatment
normally removes organic and inorganic matter from the sorbent surface (G. Yan and
Viraraghavan 2000). Treating the sorbents with acid helps to extract any metals cations on the
sorbents, thereby creating new sorption sites and increasing the surface area of the sorbent and
hence increasing the metal removal efficiency (Kurniawan et al., 2006a; Gupta and Babu 2009).
Acid treated sorbents like maize bran(Singh et al., 2006), teawaste (Mahvi et al., 2005), rice
husks(Singh et al., 2005) and Mucor rouxii (G. Yan and Viraraghavan 2000) have been reported
to have high metal removal efficiency ( >90%).
In this current work, acid (0.4M of HNO3) and untreated MNS and MSP sorbents were compared
in terms of extraction of heavy metals from the inlet and effluent wastewater samples. It was
observed that treated sorbents showed better removal efficiency as compared to the untreated
sorbents as shown by Figures 4.23 to 4.24 using MNS and MSP respectively.

90
Figure 4.23: Comparison of treated and Untreated MNS for removal of metal from wastewaters
at inlet point
Figure 4.24: Comparison of treated and untreated MSP for removal of metal from wastewaters at
inlet point
0
20
40
60
80
100%
Re
mo
val
Metals
Treated Untreated
0
20
40
60
80
100
Fe Zn Cu Cd Mg Mn Pb
% r
em
ova
l
Metals
Treated Untreated

91
There was an increase in removal efficiency of all the metals. This increase was more notable for
Zn and Mg ions which were found to be desorbing before the sorbents were treated but it was
noticed that the removal increased up to 55.6% for Zn and 88.2% for Magnesium. This could be
due to, more binding sites being available after treating the sorbents and hence more ions can bind
to the many adsorption sites.
Figure 4.25: Comparison of treated and untreated MSP for removal of metal from wastewaters at
effluent point
0
20
40
60
80
100
Fe Zn Cu Cd Mg Mn Pb
% R
em
ova
l
Metals
Treated Untreated

92
Figure 4.26: Comparison of treated and untreated MNS for removal of metal from wastewaters at
effluent point
0
20
40
60
80
100
Fe Zn Cu Cd Mg Mn Pb
% R
emo
val
Metals
Treated Untreated

93
5.0 CONCLUSION
Use of nonedible plant parts such as Moringa seed pods and Morula nut shells were used to
successfully remove selected heavy metals from water samples. Optimization of pH, initial metal
concentration, sorbent dose, particle size and temperature helped to achieve desirable extraction
efficiencies. To improve on efficiencies, both Moringa seed pods and Morula nutshells were acid
treated with HNO3 and the percentage removal was increased due to increase of surface area that
ultimately increased the binding sites of the sorbents. The percentage removal of Fe, Zn, Cu, Cd,
Mg, Mn and Pb from water samples using treated MNS was 79.6, 52.9, 78.2, 58.6, 90.3, 100.0 and
93.4 while using treated MSP was 80.9, 57.6, 89.0, 65.5, 88.2, 100.0 and 94.7 respectively.
Moringa seed pods was a better sorbent in comparison to morula nut shells since the percentage
removal of all metals was higher while using Moringa seed pods except magnesium that was
relatively higher when using morula nut shells.
The developed method was found to be simple, cheap, environmental friendly and does not need
trained personnel to use it. It emphasized on importance of recycling all unwanted and useless
materials such agricultural waste for purification of water. It also introduced possibilities of
recycling and reuse of black water for example from industries, wastewater treatment plants etc.
in order to curb the problem of water scarcity. The developed method can be used in rural areas
where there are no resources to obtain the conventional expensive techniques.
In order to determine the functional groups that are present in the sorbents and that could be
responsible or participating in removal of metal ions, FTIR measurements were done. Removal of
the selected metals from the water samples to the sorbents could be through adsorption, ion
exchange or through precipitation where the sorbent would act like a filter. SEM-EDX was used
to determine the morphology and to also give an elemental analysis of the sorbents. The surface

94
of the sorbent had pores of different sizes and had higher surface area that increased their efficiency
in metal removal. Metal ions such as K, Ca and Mg were found to be in higher concentration in
Moringa seed pods and therefore the pods can be a source of these essential elements. Morula nut
shells had relatively high concentration of Na, K, Mg and. Other metals such as Zn, Cu, Fe, Pb
and Mn were in trace levels. All selected metals were within the set limits by WHO and FAO.
Wastewater and borehole samples were used as the real samples in this study. The use of Moringa
seed pods and morula nutshells helped in removal of heavy metals to allowable limits set by US
EPA and thus helping in making the contaminated water recyclable for agricultural and human
consumption. Method detection limits, linearity and efficiency were also validated. The method
was found to have low limits of detection ranging from 0.010 ± 0.003 to 0.067±0.020 mgL-1, good
linearity (R2>0.99) and the removal efficiencies were in the range of 86.49 ± 4.33 to 99.63 ±
3.36%.
5.1 Recommendations
1. Moringa seed pods and Morula nut shells are in large quantities in most parts of Botswana.
The author recommends use of these plant material for removal of heavy metals especially
in rural areas where it may be difficult to acquire other expensive techniques.
2. Regeneration studies should be done to establish the possibilities of recycling the used
sorbents and determine how efficient they can be after several cycles.
3. Multivariate optimization may be used to study the effect of interaction of the optimized
parameters and if the interaction can increase the removal efficiency.
4. Further studies can be done to establish the possibilities of using the developed method on
solid samples such as contaminated soil.

95
5. As much as these plant material are readily available and are efficient, research need to be
done to compare the efficiency of these two sorbents with other biosorbents.

96
6.0 REFERENCES
Abdullah, M A, Anisa Ur Rahmah, and Z Man. 2010. “Physicochemical and Sorption
Characteristics of Malaysian Ceiba Pentandra (L.) Gaertn. as a Natural Oil Sorbent.” Journal
of Hazardous Materials 177 (1-3): 683–91.
Acar, Orhan, Ziya Kiliç, and a. R. Türker. 1999. “Determination of Bismuth, Indium and Lead in
Geological and Sea-Water Samples by Electrothermal Atomic Absorption Spectrometry with
Nickel-Containing Chemical Modifiers.” Analytica Chimica Acta 382 (3): 329–38.
Aceto, Maurizio, Ornella Abollino, Maria Concetta Bruzzoniti, Edoardo Mentasti, Corrado
Sarzanini, and Mery Malandrino. 2002. “Determination of Metals in Wine with Atomic
Spectroscopy (flame-AAS, GF-AAS and ICP-AES); a Review.” Food Additives and
Contaminants 19 (2): 126–33.
Adel, Saskia Den. 2002. “Use of Marula Products for Domestic and Commercial Purposes by
Households in North- Central Namibia Saskia Den Adel Produced by : CRIAA SA-DC PO
Box 23778 Windhoek , Namibia Funded by : DFID / FRP Winners and Losers in Forest
Product Commercialisation , P,” 29 (7): 779–86.
Adelaja, O. a, I. a Amoo, and a. D Aderibigbe. 2011. “Biosorption of Lead ( II ) Ions from Aqueous
Solution Using Moringa Oleifera Pods.” Archives of Applied Science Research 3 (6): 50–60.
Agbozu, I E, and F O Emoruwa. 2014. “Batch Adsorption of Heavy Metals ( Cu , Pb , Fe , Cr and
Cd ) from Aqueous Solutions Using Coconut Husk” 8 (4): 239–46.
Agilent Technologies, Inc. 2005. “ICP-MS Inductively Coupled Plasma Mass Spectrometry – A
Primer,” 1–84.
Aidarkhanova, G S, G E Saspugayeva, K B Massenov, E T Abseitov, and K M Satova. 2015.
“Ecological Assessment of the Quality of Crop Production Supplied to the Markets of Major
Cities in Central Kazakhstan.” Oxidation Communications 38 (2): 900–904.
Ajmal, M, Rak Rao, R Ahmad, and J Ahmad. 2000. “Adsorption Studies On< I> Citrus
Reticulata</i>(fruit Peel of Orange): Removal and Recovery of Ni (II) from Electroplating
Wastewater.” Journal of Hazardous Materials 9 (5): 779–86.
Ajmal, Mohammad, R. a K Rao, Jameel Ahmad, and Rais Ahmad. 2006. “The Use of Testa of
Groundnut Shell (Arachis Hypogea) for the Adsorption of Ni(II) from the Aqueous System.”
Journal of Environmental Science and Engineering 48 (3): 221–24.
Akan, J C, B G Kolo, B S Yikala, and Z M Chellube. 2013. “Levels of Some Agricultural
Pollutants in Soil Samples from Biu Local Government Area of Borno State, Nigeria.” Merit
Research Journal of Environmental Science and Toxicology 1 (3): 71–81.

97
Akar, Tamer, Sibel Tunali, and Ismail Kiran. 2005. “Botrytis Cinerea as a New Fungal Biosorbent
for Removal of Pb(II) from Aqueous Solutions.” Biochemical Engineering Journal 25: 227–
35.
Akhtar, Mubeena, S. Moosa Hasany, M. I. Bhanger, and Shahid Iqbal. 2007. “Sorption Potential
of Moringa Oleifera Pods for the Removal of Organic Pollutants from Aqueous Solutions.”
Journal of Hazardous Materials 141 (2): 546–56.
Al Salem, Saqer S. 1996. “Environmental Considerations for Wastewater Reuse in Agriculture.”
Water Science and Technology 33 (10-11, Wastewater Reclamation and Reuse 1995): 345–
53.
Albero, M.I, J.A Ortuño, M.S Garcıa, C Sánchez-Pedreño, and R Expósito. 2002. “Determination
of Zinc (II) in Pharmaceuticals Based on a Flow-through Bulk Optode.” Journal of
Pharmaceutical and Biomedical Analysis 29 (5): 779–86.
Alinnor, I.J. 2007. “Adsorption of Heavy Metal Ions from Aqueous Solution by Fly Ash.” Fuel 86
(5-6): 853–57.
Alrawiq, Nasser, J Khairiah, M T Latif, and B S Ismail. 2015. “The Distribution and Accumulation
Status of Heavy Metals (Pb, Cd, Cu and Zn) in Soils from the Rice Fields of Mada in Kedah,
Malaysia.” International Journal of Chemical Sciences 13 (1): 265–83.
Ammrf. 2014. “What Is an SEM (Parts of the Machine)? | MyScope.”
http://www.ammrf.org.au/myscope/sem/background/whatissem/#term.
Amuda, O. S., a. a. Giwa, and I. a. Bello. 2007. “Removal of Heavy Metal from Industrial
Wastewater Using Modified Activated Coconut Shell Carbon.” Biochemical Engineering
Journal 36: 174–81.
Annadural, G, R S Juang, and D J Lee. 2003. “Adsorption of Heavy Metals from Water Using
Banana and Orange Peels.” Water Science and Technology : A Journal of the International
Association on Water Pollution Research 47 (1): 185–90.
Araújo, Cleide S T, Dayene C Carvalho, Helen C Rezende, Ione L S Almeida, Luciana M Coelho,
Nívia M M Coelho, Thiago L Marques, and Vanessa N Alves. 2013. “Bioremediation of
Waters Contaminated with Heavy Metals Using Moringa Oleifera Seeds as Biosorbent.”
Applied Bioremediation- Active and Passive Approaches 2 (5): 779–86.
Arunlertaree, Chumlong, Wanvisa Kaewsomboon, Acharaporn Kumsopa, Prayad Pokethitiyook,
and Patra Panyawathanakit. 2007. “Removal of Lead from Battery Manufacturing
Wastewater by Egg Shell.” Songklanakarin Journal of Science and Technology 29 (3): 857–
68.

98
Bakkali, Karima, Natividad Ramos Martos, Badredine Souhail, and Evaristo Ballesteros. 2009.
“Characterization of Trace Metals in Vegetables by Graphite Furnace Atomic Absorption
Spectrometry after Closed Vessel Microwave Digestion.” Food Chemistry 116 (2): 590–94.
Balarama Krishna, M V, K Chandrasekaran, Sarva V Rao, D Karunasagar, and J Arunachalam.
2005. “Speciation of Cr(III) and Cr(VI) in Waters Using Immobilized Moss and
Determination by ICP-MS and FAAS.” Talanta 65 (1): 135–43.
Barakat, M.A. 2011. “New Trends in Removing Heavy Metals from Industrial Wastewater.”
Arabian Journal of Chemistry 4 (4): 361–77.
Belarra, M A, I Belategui, I Lavilla, J M Anzano, and J R Castillo. 1998. “Screening of Antimony
in PVC by Solid Sampling-Graphite Furnace Atomic Absorption Spectrometry.” Talanta 46
(6): 1265–72.
Belarra, M.A., M. Resano, F. Vanhaecke, and L. Moens. 2002. “Direct Solid Sampling with
Electrothermal Vaporization/atomization: What for and How?” TrAC Trends in Analytical
Chemistry 21 (12): 828–39.
Belemtougri, R. G., B. Constantin, C. Cognard, G. Raymond, and L. Sawadogo. 2001. “Effects of
Sclerocarya Birrea (A. Rich) Hochst (anacardiaceae) Leaf Extracts on Calcium Signalling in
Cultured Rat Skeletal Muscle Cells.” Journal of Ethnopharmacology 76 (3): 247–52.
Benards, Okeyo. 2012. “Lead Poisoning in Owino Uhuru Slums in Mombasa- Kenya.” Mombasa.
Benito, Y, and M L Ruiz. 2002. “Reverse Osmosis for Metal Finishing Wastewater.” Membrane
Technology 2002 (8): 15.
Bettmer, Jorg, Jens Heilmann, Daniel J Kutscher, Alfredo Sanz-Medel, and Klaus G Heumann.
2012. “Direct Μ-Flow Injection Isotope Dilution ICP-MS for the Determination of Heavy
Metals in Oil Samples.” Analytical and Bioanalytical Chemistry 402 (1): 269–75.
Bhatti, Haq Nawaz, Beenish Mumtaz, Muhammad Asif Hanif, and Raziya Nadeem. 2007.
“Removal of Zn(II) Ions from Aqueous Solution Using Moringa Oleifera Lam. (horseradish
Tree) Biomass.” Process Biochemistry 42: 547–53.
Bohdziewicz, Jolanta, Michał Bodzek, and Ewa Wasik. 1999. “The Application of Reverse
Osmosis and Nanofiltration to the Removal of Nitrates from Groundwater.” Desalination 121
(2): 139–47.
Bolibrzuch, Edward. 1978. “Principles of Measurements by Flameless Atomic Absorption
Spectrometry with the Use of a Heated Graphite Furnace.” Prace Komisji Naukowych -
Polskie Towarzystwo Gleboznawcze, Komisja Chemii Gleby 9 (Mater. Symp. Zastosow.
Absorpc. Spektrom. At. Glebozn. Chem. Roln., 1977): 19–32.

99
Botto, Robert I. 1985. “Method for Correcting for Acid and Salt Matrix Interferences in ICP-AES.”
Spectrochimica Acta Part B: Atomic Spectroscopy 40 (1-2): 397–412.
Boumans, P.W.J.M., J.A. Tielrooy, and F.J.M.J. Maessen. 1988. “Mutual Spectral Interferences
of Rare Earth Elements in Inductively Coupled Plasma Atomic Emission Spectrometry.”
Spectrochimica Acta Part B: Atomic Spectroscopy 43 (2): 173–99.
Cao, Xue-ying, Sha-na Zhang, Chang-yin Tan, Peng-jie Hu, Xu Cui, Tong Zhou, Long-hua Wu,
and Yong-ming. Luo. 2015. “Heavy Metal Contamination Characteristics in Soils around a
Nonferrous Metal Smelter in Central Southern China.” Turang (Beijing, China) 47 (1). Kexue
Chubanshe: 94–99.
Chan, B.K.C., *, and A.W.L. Dudeney. 2008. “Reverse Osmosis Removal of Arsenic Residues
from Bioleaching of Refractory Gold Concentrates.” Minerals Engineering 29 (5): 779–86.
CHARERNTANYARAK, L. 1999. “Heavy Metals Removal by Chemical Coagulation and
Precipitation.” Water Science and Technology 39 (10-11): 135–38.
Chen, Shuchang, Weiguang Yang, and Jie. Liu. 2011. “Evaluation of Measurement Uncertainty of
Cadmium in Foods by Graphite Furnace Atomic Absorption Spectrometry.” Liangshi Yu
Siliao Gongye, Liangshi Yu Siliao Gongye Bianjibu 10 (3): 60–62.
Cho, Heechan, Dalyoung Oh, and Kwanho Kim. 2005. “A Study on Removal Characteristics of
Heavy Metals from Aqueous Solution by Fly Ash.” Journal of Hazardous Materials 127 (1-
3): 187–95.
Chou, Wei Lung. 2010. “Removal and Adsorption Characteristics of Polyvinyl Alcohol from
Aqueous Solutions Using Electrocoagulation.” Journal of Hazardous Materials 177 (1-3):
842–50.
Communication, Short. 2005. “Sorption Kinetics and Intraparticulate Diffusivities of Cd , Pb and
Zn Ions on Maize Cob” 4 (6): 509–12.
Cosgrove, James F, and Donato J Bracco. 1973. “Determination of Minor Metallic Elements in
the Water Environment.” In Water Water Pollut. Handb., 4:1315–56.
Dalman, Ömer, Ahmet Demirak, and Ahmet Balcı. 2006. “Determination of Heavy Metals (Cd,
Pb) and Trace Elements (Cu, Zn) in Sediments and Fish of the Southeastern Aegean Sea
(Turkey) by Atomic Absorption Spectrometry.” Food Chemistry 95 (1): 157–62.
Davies, Joanne, and Harald Berndt. 2003. “Improvements in Thermospray Flame Furnace Atomic
Absorption Spectrometry.” Analytica Chimica Acta 479 (2): 215–23.
De Abreu, C. A., M. F. de Abreu, B. van Raij, O. C. Bataglia, and J. C. de Andrade. 1994.
“Extraction of Boron from Soil by Microwave Heating for ICP‐AES Determination.”
Communications in Soil Science and Plant Analysis 25 (19-20): 3321–33.

100
Demirbas, Erhan, Mehmet Kobya, Elif Senturk, and Tuncay Ozkan. 2004. “Adsorption Kinetics
for the Removal of Chromium (VI) from Aqueous Solutions on the Activated Carbons
Prepared from Agricultural Wastes.” Water SA 30 (4): 533–39.
Dimo, Théophile, Silvere V. Rakotonirina, Paul V. Tan, Jacqueline Azay, Etienne Dongo, Pierre
Kamtchouing, and Gérard Cros. 2007. “Effect of Sclerocarya Birrea (Anacardiaceae) Stem
Bark Methylene Chloride/methanol Extract on Streptozotocin-Diabetic Rats.” Journal of
Ethnopharmacology 110 (3): 434–38.
Ding, Fei, and Wen-hui. Pan. 2013. “Uncertainty Evaluation of Determination of Nickel Content
in Stainless Steel by ICP-OES.” Xiandai Yejin 41 (4): 20–22.
Duffer, James K. 1972. “Atomic Absorption and Flame Emission Spectroscopy [for Analyzing
Paints].” ASTM Special Technical Publication STP 500: 550–52.
Duran, Celal, Ali Gundogdu, Volkan Numan Bulut, Mustafa Soylak, Latif Elci, Hasan Basri
Sentürk, and Mehmet Tüfekci. 2007. “Solid-Phase Extraction of Mn(II), Co(II), Ni(II),
Cu(II), Cd(II) and Pb(II) Ions from Environmental Samples by Flame Atomic Absorption
Spectrometry (FAAS).” Journal of Hazardous Materials 146 (1-2): 347–55.
Dzhuvelikyan, Kh. A. 2002. “Contribution of Iron Ore Industry to Environmental Pollution by
Heavy Metals.” Ekologiya I Promyshlennost Rossii, 7 (1): 26–29.
E, Shackleton S, Shackleton C M, et al. 2002. “A Summary of Knowledge on Sclerocarya Birrea
Subsp. with Emphasis on Its Importance as a Non-Timber Forest Product in South and
Sourthern Africa.” Southern African Forestry Journal 19 (4): 27–41.
Ebbers, Benjamin, Lisbeth M. Ottosen, and Pernille E. Jensen. 2015. “Electrodialytic Treatment
of Municipal Wastewater and Sludge for the Removal of Heavy Metals and Recovery of
Phosphorus.” Electrochimica Acta, April. 10 (2): 6–8.
Elemental, Thermo. 2001. “ICP or ICP-MS ? Which Technique Should I Use ?,” 12.
Elmer, P. 2008. “Atomic Spectroscopy: A Guide to Selecting the Appropriate Technique and
System.” PerkinElmer Inc., US Available at: Http://www. ….
http://scholar.google.com/scholar?hl=en&btnG=Search&q=intitle:Atomic+Spectroscopy+-
+A+Guide+to+Selecting+the+Appropriate+Technique+and+System#0.
El-Shafey, E.I. 2010. “Removal of Zn(II) and Hg(II) from Aqueous Solution on a Carbonaceous
Sorbent Chemically Prepared from Rice Husk.” Journal of Hazardous Materials 175 (1-3):
319–27.
Emami Khansari, F., M. Ghazi-Khansari, and M. Abdollahi. 2005. “Heavy Metals Content of
Canned Tuna Fish.” Food Chemistry 93 (2): 293–96.

101
Fan, Huiping, Jiansheng Ji, Feng Fu, Jingming Gao, and Yuyu. Zhao. 2011. “Uncertainty
Evaluation for Cadmium Determination in Flour by Graphite Furnace Atomic Absorption
Spectrometry.” Shipin Kexue (Beijing, China) 32 (18). Zhongguo Shipin Zazhishe: 243–45.
Farooq, Umar, Janusz A. Kozinski, Misbahul Ain Khan, and Makshoof Athar. 2010. “Biosorption
of Heavy Metal Ions Using Wheat Based Biosorbents – A Review of the Recent Literature.”
Bioresource Technology 101 (14): 5043–53.
Ferreira, S. 2000. “Copper Determination in Natural Water Samples by Using FAAS after
Preconcentration onto Amberlite XAD-2 Loaded with Calmagite.” Talanta 50 (6): 1253–59.
First, The, International Proficiency, Testing Conference, Cristina Modrogan, Cristina Costache,
and Daniela Oanamari Orbulet. 2007. “Removal of Hexavalent Chromium From Aqueous
Solutions By Adsorption on Peach Kernel and Nutshell,” 12 (1): 371–77.
Foidl, N, H P S Makkar, K Becker, Nikolaus Foild, and Sur Km. 2001. “The Potential of Moringa
Oleifera for Agricultural and Industrial Uses.” What Development Potential for Moringa
Products?, 9 (5):1–20.
Fourest E Serre, Rouz J.C. 1992. “Contribution of Carboxy Group to Heavy Metal Binding Sites
in Fungal Wall.” Toxicology Environment Chemistry 54 (1): 1–10.
Fu, Fenglian, and Qi Wang. 2011. “Removal of Heavy Metal Ions from Wastewaters: A Review.”
Journal of Environmental Management 92 (3): 407–18.
Garcia, R, and A P Baez. 2012. “Atomic Absorption Spectrometry (AAS).” In At. Absorpt.
Spectrosc., 1–12. InTech. 21 (5): 779–86.
García, R., M.C. Torres, and A. Báez. 2008. “Determination of Trace Elements in Total Suspended
Particles at the Southwest of Mexico City from 2003 to 2004.” Chemistry and Ecology 24
(2): 157–67.
Garg, Umesh K., M. P. Kaur, V. K. Garg, and Dhiraj Sud. 2007. “Removal of Hexavalent
Chromium from Aqueous Solution by Agricultural Waste Biomass.” Journal of Hazardous
Materials 140 (6): 60–68.
Garg, Umesh, M. P. Kaur, G. K. Jawa, Dhiraj Sud, and V. K. Garg. 2008. “Removal of Cadmium
(II) from Aqueous Solutions by Adsorption on Agricultural Waste Biomass.” Journal of
Hazardous Materials 154 (8): 1149–57.
Gassenschmidt, Ursula, Klaus D. Jany, Tauscher Bernhard, and Heinz Niebergall. 1995. “Isolation
and Characterization of a Flocculating Protein from Moringa Oleifera Lam.” Biochimica et
Biophysica Acta (BBA) - General Subjects 1243 (3): 477–81.
Gering, Kevin L, and John F Scamehorn. 1988. “Use of Electrodialysis to Remove Heavy Metals
from Water.” Separation Science and Technology 23 (14-15): 1231–67.

102
Ghaedi, Mehrorang, Farshid Ahmadi, and Ardeshir Shokrollahi. 2007. “Simultaneous
Preconcentration and Determination of Copper, Nickel, Cobalt and Lead Ions Content by
Flame Atomic Absorption Spectrometry.” Journal of Hazardous Materials 142 (1-2): 272–
78.
Ghaedi, Mehrorang, Ardeshir Shokrollahi, Khodabakhsh Niknam, Ebrahim Niknam, Asma Najibi,
and Mustafa Soylak. 2009. “Cloud Point Extraction and Flame Atomic Absorption
Spectrometric Determination of cadmium(II), lead(II), palladium(II) and silver(I) in
Environmental Samples.” Journal of Hazardous Materials 168 (2-3): 1022–27.
Ghebremichael, Kebreab A, K R Gunaratna, Hongbin Henriksson, Harry Brumer, and Gunnel
Dalhammar. 2005. “A Simple Purification and Activity Assay of the Coagulant Protein from
Moringa Oleifera Seed.” Water Research 39 (11): 2338–44.
Gnusin, N P, V P Beketova, N P Berezina, and N V Vitul’skaya. 1984. “Extraction of Heavy Metal
Ions from Cation-Exchange Membranes.” Izvestiya Vysshikh Uchebnykh Zavedenii, Khimiya
I Khimicheskaya Tekhnologiya 27 (12): 1468–70.
Godlewska-Żyłkiewicz, Beata. 2003. “Biosorption of Platinum and Palladium for Their
Separation/preconcentration prior to Graphite Furnace Atomic Absorption Spectrometric
Determination.” Spectrochimica Acta Part B: Atomic Spectroscopy 58 (8): 1531–40.
Gupta, Suresh, and B. V. Babu. 2009. “Removal of Toxic Metal Cr(VI) from Aqueous Solutions
Using Sawdust as Adsorbent: Equilibrium, Kinetics and Regeneration Studies.” Chemical
Engineering Journal 150 (2-3): 352–65.
Gupta, Vinod K, Arshi Rastogi, and Arunima Nayak. 2010. “Adsorption Studies on the Removal
of Hexavalent Chromium from Aqueous Solution Using a Low Cost Fertilizer Industry Waste
Material.” Journal of Colloid and Interface Science 342 (1): 135–41.
Gustavsson, Ingemar, and Helena. Larsson. 1992. “Determination of Trace Elements in Steel
Using ICP-MS.” Comm. Eur. Communities, [Rep.] EUR. Swed. Inst. Met. Res. 2 (4): 779–
86.
Hafner, Bob. 2006. “Energy Dispersive Spectroscopy on the SEM: A Primer.” Characterization
Facility, University of Minnesota, 7–10. http://fliphtml5.com/wihc/jzuk/basic
Hall, Gwendy E M. 1997. “Determination of Trace Elements in Sediments.” In Man. Phys.-Chem.
Anal. Aquat. Sediments, 11 (4) 85–145. Lewis.
Hameed, B H. 2009. “Grass Waste: A Novel Sorbent for the Removal of Basic Dye from Aqueous
Solution.” Journal of Hazardous Materials 166 (1): 233–38.
He, Jianfei. 2008. “Analysis of Uncertainty of Flame Atomic Absorption Spectrometry in
Determination of Manganese in Water.” Zhiye Yu Jiankang 24 (4). Zhiye Yu Jiankang Zazhi
Bianjibu: 334–35.

103
He, Yi, Zhicheng Xie, and Lin. Zhu. 2008. “Effects of Reclaimed Water Irrigation on Soil Enzyme
and Soil Microbial Biomass Carbon in Paddy Soil of Wastewater Irrigation Area.” Nongye
Huanjing Kexue Xuebao 27 (6): 2227–32.
Helen Kalavathy, M., and Lima Rose Miranda. 2010. “Moringa Oleifera-A Solid Phase Extractant
for the Removal of Copper, Nickel and Zinc from Aqueous Solutions.” Chemical Engineering
Journal 158 (2): 188–99.
Hou Xiandeng, Jones Bradley T. 2000. “Inductively Coupled Plasma–Optical Emission
Spectrometry.” Spectroscopy Letters 42 (1): 58–61.
Huang, Jianquan, Xin Hu, Junren Zhang, and Dexing. Fu. 2006. “Application of ICP-MS in Drug
Analysis.” Zhongguo Yaofang 17 (8): 624–26.
Huang, Ying, Tingqiang Li, Chengxian Wu, Zhenli He, Jan Japenga, Meihua Deng, and Xiaoe.
Yang. 2015. “An Integrated Approach to Assess Heavy Metal Source Apportionment in Peri-
Urban Agricultural Soils.” Journal of Hazardous Materials 299: 540–49.
Iftikhar, Abdur Rauf, Haq Nawaz Bhatti, Muhammad Asif Hanif, and Razyia Nadeem. 2009.
“Kinetic and Thermodynamic Aspects of Cu(II) and Cr(III) Removal from Aqueous Solutions
Using Rose Waste Biomass.” Journal of Hazardous Materials 161 (2-3): 941–47.
Igarashi, Yasuhito, Kunio Shiraishi, and Yuichi. Takaku. 1991. “The Application of Inductively
Coupled Plasma Mass Spectrometry to the Study of Environmental Radioactivity.”
Radioisotopes 40 (1): 42–52.
Iwashita, A, T Nakajima, H Takanashi, A Ohki, Y Fujita, and T Yamashita. 2006. “Effect of
Pretreatment Conditions on the Determination of Major and Trace Elements in Coal Fly Ash
Using ICP-AES.” Fuel 85 (2): 257–63.
Jamali, Muhammad K, Tasneem G Kazi, Muhammad B Arain, Hassan I Afridi, Nusrat Jalbani,
Ghulam A Kandhro, Abdul Q Shah, and Jameel A Baig. 2009. “Speciation of Heavy Metals
in Untreated Sewage Sludge by Using Microwave Assisted Sequential Extraction Procedure.”
Journal of Hazardous Materials 163 (2-3): 1157–64.
Jia, X. 2001. “Determination of Palladium by Graphite Furnace Atomic Absorption Spectroscopy
without Matrix Matching.” Talanta 54 (4): 741–51.
Jimoh, T. O. 2012. “Utilization of Blighia Sapida (Akee Apple) Pod in the Removal of Lead,
Cadmium and Cobalt Ions from Aqueous Solution.” Journal of Environmental Chemistry and
Ecotoxicology 4 (7): 178–87.
Jin, Qinhan, Chu Zhu, Matthew W. Border, and Gary M. Hieftje. 1991. “A Microwave Plasma
Torch Assembly for Atomic Emission Spectrometry.” Spectrochimica Acta Part B: Atomic
Spectroscopy 46 (3): 417–30.

104
Kamala C T, Balaram V, Dharmendra V, Satyanarayanan M, Subramanyam K S V, and Krishnaiah
A. 2014. “Application of Microwave Plasma Atomic Emission Spectrometry (MP-AES) for
Environmental Monitoring of Industrially Contaminated Sites in Hyderabad City.”
Environmental Monitoring and Assessment 186 (11): 7097–7113.
Kawada, Satoshi. 2007. “Inductively Coupled Plasma - Optical Emission Spectroscopy / Mass
Spectrometry (ICP-OES/ICP-MS): Principle and Characteristics.” Petrotech (Tokyo, Japan)
30 (6): 447–51.
Kazemipour, Maryam, Mehdi Ansari, Shabnam Tajrobehkar, Majdeh Majdzadeh, and Hamed
Reihani Kermani. 2008. “Removal of Lead, Cadmium, Zinc, and Copper from Industrial
Wastewater by Carbon Developed from Walnut, Hazelnut, Almond, Pistachio Shell, and
Apricot Stone.” Journal of Hazardous Materials 150: 322–27.
Kemper, Thomas, and Stefan. Sommer. 2002. “Estimate of Heavy Metal Contamination in Soils
after a Mining Accident Using Reflectance Spectroscopy.” Environmental Science and
Technology 36 (12): 2742–47.
Kilicgedik, Evrim. 2012. “How to Decide Which Is the Right Technique for Your Application ?
2011, The Atomic Spectroscopy Revolution.” 1 (1)1-58
Kleiman, Robert, David a. Ashley, and James H. Brown. 2008. “Comparison of Two Seed Oils
Used in Cosmetics, Moringa and Marula.” Industrial Crops and Products 28 (3): 361–64.
Knap, Marta, Krzysztof Kilian, and Krystyna Pyrzynska. 2007. “On-Line Enrichment System for
Manganese Determination in Water Samples Using FAAS.” Talanta 71 (1): 406–10.
Kumar, Narendra, Kuldeep Bauddh, Sanjeev Kumar, Neetu Dwivedi, D P Singh, and S C Barman.
2013. “Extractability and Phytotoxicity of Heavy Metals Present in Petrochemical Industry
Sludge.” Clean Technologies and Environmental Policy 15 (6): 1033–39.
Kumari, Pushpa, Parul Sharma, Shalini Srivastava, and M. M. Srivastava. 2006. “Biosorption
Studies on Shelled Moringa Oleifera Lamarck Seed Powder: Removal and Recovery of
Arsenic from Aqueous System.” International Journal of Mineral Processing 78: 131–39.
Kung, Tsu-E. 1998. “Improved Water Purification System Apparatus with Waste Water Recovery
Function.” Pat. Specif. (Petty) (Aust.). Weng, Shui-Te, Australia . 2 (5): 77–86.
Kureichik, K P, S L Pisarev, N V Kozlovskii, V I Kharitonchik, and A Z Ibragim. 2003. “Compact
Atomic-Absorption Graphite-Atomizer Spectrometer.” Journal of Applied Spectroscopy
(Translation of Zhurnal Prikladnoi Spektroskopii) 70 (5): 814–16.
Kurniawan, Tonni Agustiono, G. Y S Chan, Wai Hung Lo, and Sandhya Babel. 2006a.
“Comparisons of Low-Cost Adsorbents for Treating Wastewaters Laden with Heavy Metals.”
Science of the Total Environment 366 (2-3): 409–26.

105
Kurniawan, Tonni Agustiono, Gilbert Y S Chan, Wai Hung Lo, and Sandhya Babel. 2006b.
“Physico-Chemical Treatment Techniques for Wastewater Laden with Heavy Metals.”
Chemical Engineering Journal 118 (1-2): 83–98.
Kurniawan, Tonni Agustiono, Gilbert Y S Chan, Wai-hung Lo, and Sandhya. Babel. 2006c.
“Comparisons of Low-Cost Adsorbents for Treating Wastewaters Laden with Heavy Metals.”
Science of the Total Environment 366 (2-3): 409–26.
Lazarova, V, P Sheilds, B Levine, P Savoye, D Hranisavljevic, and P Renaud. 2003. “Production
of High Quality Water for Reuse Purposes: The West Basin Experience.” Water Science &
Technology: Water Supply 3 (3).: 167–75.
Lewen, Nancy. 2011. “The Use of Atomic Spectroscopy in the Pharmaceutical Industry for the
Determination of Trace Elements in Pharmaceuticals.” Journal of Pharmaceutical and
Biomedical Analysis 55 (4): 653–61.
Lewen, Nancy, Shyla Mathew, Martha Schenkenberger, and Thomas Raglione. 2004. “A Rapid
ICP-MS Screen for Heavy Metals in Pharmaceutical Compounds.” Journal of
Pharmaceutical and Biomedical Analysis 35 (4): 739–52.
Liang, Jie, Jiayu Liu, Xingzhong Yuan, Guangming Zeng, Xu Lai, Xiaodong Li, Haipeng Wu,
Yujie Yuan, and Fei. Li. 2015. “Spatial and Temporal Variation of Heavy Metal Risk and
Source in Sediments of Dongting Lake Wetland, Mid-South China.” Journal of
Environmental Science and Health, Part A: Toxic/Hazardous Substances & Environmental
Engineering 50 (1): 100–108.
Lima, Alexandre F., Fernanda F. Lima, Eduardo M. Richter, and Rodrigo A.A. Munoz. 2015.
“Combination of Sonication and Heating for Metal Extraction from Inorganic Fertilizers prior
to Microwave-Induced Plasma Spectrometry Determinations.” Applied Acoustics, April.
Lin, Guan-Chun, Li-Xia Qin, Guang Xu, and Hu. Luo. 2010. “Evaluation of the Uncertainty for
Determination of Lead in Feed Grade Manganous Sulfate by FAAS.” Guangpu Shiyanshi 27
(6): 2227–30.
Linares-Hernández, Ivonne, Carlos Barrera-Díaz, Gabriela Roa-Morales, Bryan Bilyeu, and
Fernando Ureña-Núñez. 2009. “Influence of the Anodic Material on Electrocoagulation
Performance.” Chemical Engineering Journal 148 (1): 97–105.
Liu, Feng, Jiwei Hu, Xianfei Huang, Jingan Chen, Liya Eu, and Jin. Luo. 2012. “Assessment of
Heavy Metals Pollution in Sediments from Aha Lake, China.” Advanced Materials Research
(Durnten-Zurich, Switzerland) 554-556 (Pt. 3, Advances in Chemistry Research II): 1 (9)13–
18.
Lone, F A, Nousheen Qureshi, N A Kirmani, S H Sidiquii, Sabia Zaffar, and R A Shah. 2012.
“Studies on the Growth Performance, Mineral Composition and Yield of Bottle Gourd under
Irrigation with Grey Water.” Nature, Environment and Pollution Technology 11 (2): 249–52.

106
Lubomir I. Simeonov, Mihail V. Kochubovski, Biana G. Simeonova. 2010. Environmental Heavy
Metal Pollution and Effects on Child Mental Development: Risk Assessment and Prevention
Strategies. 54 (3): 38-47.
Ma, Li-li. 2012. “Determination of Gold in Rock by Flame Atomic Absorption Spectrometry and
Its Influencing Factors.” Dangdai Huagong 41 (6): 657–58.
Maeda, Tomiyuki, and Yasuaki. Tanimoto. 1988. “Determination of Heavy Metals in Food by
Atomic Absorption Spectrophotometry with Dithizone Extraction and a Microsample
Injection System.” Shimadzu Hyoron 45 (3): 203–7.
Mahvi, Amir Hossein, Dariush Naghipour, Forugh Vaezi, and Shahrokh Nazmara. 2005.
“Teawaste as An Adsorbent for Heavy Metal Removal from Industrial Wastewaters.”
American Journal of Applied Sciences 2 (1): 372–75.
Malkoc, E, and Y Nuhoglu. 2005. “Investigations of nickel(II) Removal from Aqueous Solutions
Using Tea Factory Waste.” Journal of Hazardous Materials 127 (1-3): 120–28.
Marshall, W E, L H Wartelle, D E Boler, M M Johns, and C A Toles. 1998. “Enhanced Metals
Adsorption by Soybean Hulls Modified with Citric Acid.” Preprints of Extended Abstracts
Presented at the ACS National Meeting, American Chemical Society, Division of
Environmental Chemistry 38 (2): 31–33.
Marshall, Wayne E., and Mitchell M. Johns. 1996. “Agricultural by-Products as Metal Adsorbents:
Sorption Properties and Resistance to Mechanical Abrasion.” Journal of Chemical
Technology and Biotechnology 66 (2): 192–98.
Mathew, Ann Mary. 2005. “Phytoremediation of Heavy Metal Contaminated Soils” 4 (9): 95–97.
Matis, Kostas a., Anastasios I. Zouboulis, George P. Gallios, Torsten Erwe, and Christoph Blöcher.
2004. “Application of Flotation for the Separation of Metal-Loaded Zeolites.” Chemosphere
55 (1): 65–72.
Matlock, Matthew M, Brock S Howerton, and David A Atwood. 2002. “Chemical Precipitation of
Heavy Metals from Acid Mine Drainage.” Water Research 36 (19): 4757–64.
Michalke, B. 2002. “The Coupling of LC to ICP-MS in Element speciation–Part II: Recent Trends
in Application.” Trends in Analytical Chemistry 21 (3): 154–65.
Michel, Paulo, Pinheiro Ferreira, Éverton José, Ferreira De Araújo, Nascimento Silva, Rivelilson
Mendes De Freitas, Nagilla Daniela, et al. 2012. “Safety and Efficacy of Moringa Oleifera
Lamarck ( 1785 ) — Therapeutic and Toxicological Properties,” no. 1785.
Miller-Ihli, Nancy J. 1992. “Solids analysis by GFAAS.” Analytical Chemistry 64 (20). American
Chemical Society: 964A – 968A.

107
Mirzaei, Mohammad, Mansoureh Behzadi, Nasrin Mahmoud Abadi, and Alieh Beizaei. 2011.
“Simultaneous Separation/preconcentration of Ultra Trace Heavy Metals in Industrial
Wastewaters by Dispersive Liquid-Liquid Microextraction Based on Solidification of
Floating Organic Drop prior to Determination by Graphite Furnace Atomic Absorption
Spectr.” Journal of Hazardous Materials 186 (2-3): 1739–43.
Mishra, P. C., and R. K. Patel. 2009. “Removal of Lead and Zinc Ions from Water by Low Cost
Adsorbents.” Journal of Hazardous Materials 168: 319–25.
Mitra, Somenath. 2003. Sample Preparation Techniques in Analytical Chemistry. Edited by J D
Winefordner. 162nd ed. New Jersey: John Wiley & Sons. Copyright.
Moatshe, O G, V E Emongor, and O Oagile. 2011. “Effect of Benzyladenine ( BA ) on Fruit Set
and Mineral Nutrition of Morula ( Sclerocarya Birrea Subspecies Caffra )” 5 (4): 268–72.
Murillo, M., Z. Benzo, E. Marcano, C. Gomez, A. Garaboto, and C. Marin. 1999. “Determination
of Copper, Iron and Nickel in Edible Oils Using Emulsified Solutions by ICP-AES.” Journal
of Analytical Atomic Spectrometry 14 (5): 815–20.
Murray, R W, D Jay Miller, and K a Kryc. 2000. “Analysis of Major and Trace Elements in Rocks,
Sediments, and Interstitial Waters By Inductively Coupled Plasma – Atomic Emission
Spectrometry.” ODP Tech. Note 29.
Nadeem, Muhammad, A. Mahmood, S. A. Shahid, S. S. Shah, A. M. Khalid, and G. McKay. 2006.
“Sorption of Lead from Aqueous Solution by Chemically Modified Carbon Adsorbents.”
Journal of Hazardous Materials 138 (3): 604–13.
Nadeem, Raziya, Muhammad Asif Hanif, Fatima Shaheen, Shahnaz Perveen, Muhammad
Nadeem Zafar, and Tahira Iqbal. 2008. “Physical and Chemical Modification of Distillery
Sludge for Pb(II) Biosorption.” Journal of Hazardous Materials 150 (2): 335–42.
Nagar, B B, and S P Singh. 2003. “Comparison Studies on Removal Efficiency of Heavy Metals
from Hybrid Adsorbent Media Columns.” Asian Journal of Microbiology, Biotechnology &
Environmental Sciences 5 (4): 471–76.
Nasiruddin Khan, M., and M. Farooq Wahab. 2007. “Characterization of Chemically Modified
Corncobs and Its Application in the Removal of Metal Ions from Aqueous Solution.” Journal
of Hazardous Materials 141 (1): 237–44.
Ni, Zhanglin, and Minghua. Qu. 2010. “Evaluation of Measurement Uncertainty for Determination
of Lead in Pine Pollen by Microwave Digestion-GFAS Method.” Guangdong Weiliang
Yuansu Kexue 17 (11).: 55–60.
Nichols, L D, and M B Allen. 1982. “Reuse of Industrial Wastewaters by Electrodialytic
Extraction of Heavy Metals through Poroplastic Bound Liquid Ion Exchange Membranes.”
Proceedings - Water Reuse Symposium, 2: 1433–35.

108
Nicolet, Thermo, and Corporation All. 2001. “Introduction to Fourier Transform Infrared
Spectrometry.” A Thermo Electron Bussines, 1–8.
http://mmrc.caltech.edu/FTIR/FTIRintro.pdf.
Ning, Robert Y. 2002. “Arsenic Removal by Reverse Osmosis.” Membrane Technology 2002 (10):
16.
Nixon, W.C. 1971. “The General Principles of Scanning Electron Microscopy.” Jstor 261 (837):
45–50.
Obuseng, Veronica, Florence Nareetsile, and Habauka M. Kwaambwa. 2012. “A Study of the
Removal of Heavy Metals from Aqueous Solutions by Moringa Oleifera Seeds and Amine-
Based Ligand 1,4-bis[N,N-bis(2-Picoyl)amino]butane.” Analytica Chimica Acta 730: 87–92.
Ofudje, Edwin Andrew, Olubunmi Kolawole Akiode, Opeoluwa Oladipo, Adebusayo Emmanuel
Adedapo, and Olanike Adebayo. 2015. “Application of Raw and Alkaline-Modified Coconut
Shaft as a Biosorbent for Pb 2+ Removal” 10 (2): 3462–80.
Oka, Koichi, and Hideo. Takatama. 1978. “Regeneration of Wastewater from Metal Rinsing.” Jpn.
Kokai Tokkyo Koho. Hitachi Cable, Ltd., Japan 29 (5): 77–86.
Paudyn, a. M., and R. G. Smith. 1992. “Microwave Decomposition of Dust. Ashes and Sediments
for the Determination of Elements by ICP-AES.” Canadian Journal of Applied Spectroscopy.
10 (3): 62–80.
Pedersen, Kristine B., Pernille E. Jensen, Lisbeth M. Ottosen, and Tore Lejon. 2015. “An
Optimised Method for Electrodialytic Removal of Heavy Metals from Harbour Sediments.”
Electrochimica Acta 173 (8): 432–39.
Pedro, Juana, Jorge Stripekis, Adrián Bonivardi, and Mabel Tudino. 2006. “Thermal Stabilization
of Tellurium in Mineral Acids Solutions: Use of Permanent Modifiers for Its Determination
in Sulfur by GFAAS.” Talanta 69 (1): 199–203.
Pehlivan, Erol, Türkan Altun, Serpil Cetin, and M. Iqbal Bhanger. 2009. “Lead Sorption by Waste
Biomass of Hazelnut and Almond Shell.” Journal of Hazardous Materials 167 (1-3): 1203–
8.
PerkinElmer, Inc. 2006. “AAnalyst 200 User’s Guide.”
http://www.quimica.uns.edu.ar/images/stories/descargas/Manuales LIUC/Absorcion
Atomica.pdf.
Piccolo, B, and R T O’Connor. 2009. “Atomic Absorption Spectroscopy.” Journal of the American
Oil Chemists’ Society 45 (11): 789–92.

109
Pradhan, Subhashree, Sarita Singh, and Lal Chand Rai. 2007. “Characterization of Various
Functional Groups Present in the Capsule of Microcystis and Study of Their Role in
Biosorption of Fe, Ni and Cr.” Bioresource Technology 98 (3): 595–601.
Qdais, Hani Abu, and Hassan Moussa. 2004. “Removal of Heavy Metals from Wastewater by
Membrane Processes: A Comparative Study.” Desalination 164 (2): 105–10.
Qin, Xiao-nan, Qing-luan Lu, and Li. Wang. 2012. “Present Situation of Determination of
Phosphorus in Coal and Its Comparison.” Shandong Huagong 41 (7): 47–48,51.
Qiu, Chengshu, Guiyang Liu, Jucheng Zhang, and He. Li. 2007. “Determination of Heavy Metal
in Mining Industry Environment by Flame Atomic Absorption Spectrometry.” Huanjing
Kexue Yu Guanli 32 (1): 147–49.
Quadri, S H, Ahmed Zaheer, and Mazhar. Farooqui. 2004. “Adsorption Studies of Some Metal
Ions on Soybean Husk Powder.” Chemistry: An Indian Journal 1 (6): 483–84.
Rachel Wynberg, Jill Cribbins, Roger Leakey, Cyril Lombard, Myles Mander, Sheona Shackleton,
and Caroline Sullivan. 2002. “Knowledge on Sclerocarya Birrea Subsp . Caffra with
Emphasis on Its Importance as a Non-Timber Forest Product in South and Southern Africa :
A Summary Part 2: Commercial Use, Tenure and Policy, Domestication, Intellectual Property
Rights and Benefit-Shari.” Southern African Forestry Journal, 196 (2): 67–79.
Rahman, M. Safiur, and M. Rafiqul Islam. 2009. “Effects of pH on Isotherms Modeling for Cu(II)
Ions Adsorption Using Maple Wood Sawdust.” Chemical Engineering Journal 149 (1-3):
273–80.
Ratanatamskul, C, K Yamamoto, T Urase, and S Ohgaki. 1996. “Effect of Operating Conditions
on Rejection of Anionic Pollutants in the Water Environment by Nanofiltration Especially in
Very Low Pressure Range.” Water Science and Technology 34 (9, Water Quality
International ’96, Part 5): 149–56.
Reddy, D. Harikishore Kumar, K. Seshaiah, a. V R Reddy, M. Madhava Rao, and M. C. Wang.
2010. “Biosorption of Pb2+ from Aqueous Solutions by Moringa Oleifera Bark: Equilibrium
and Kinetic Studies.” Journal of Hazardous Materials 174: 831–38.
Rizzuti, Anthony M, and Dzung D Nguyen. 2007. “Utilizing Soybean and Rice Hulls as Activated
Carbons to Remove Heavy Metals from Contaminated Water.” In Abstracts of Papers, 233rd
ACS National Meeting, Chicago, IL, United States, March 25-29, 2007, CHED – 1157..
Ruut, J, and V Past. 1994. “Chronopotentiometric Stripping Analysis for Determination of Heavy
Metals in Food.” Tartu Ulikooli Toimetised 975: 229–32.
S.N. Willie*, Y. Iida **, and J.W. McLaren. 1998. “Determination of Cu, Ni, Zn, Mn, Co, Pb, Cd,
and V in Seawater Using Flow Injection ICP-MS.” In The American Journal of Psychiatry,
171:67–104.

110
Saka, Cafer, Ömer Şahin, and Mehmet Maşuk Küçük. 2012. “Applications on Agricultural and
Forest Waste Adsorbents for the Removal of Lead (II) from Contaminated Waters.”
International Journal of Environmental Science and Technology 9: 379–94.
Saracoglu, S. 2003. “Separation/preconcentration of Trace Heavy Metals in Urine, Sediment and
Dialysis Concentrates by Coprecipitation with Samarium Hydroxide for Atomic Absorption
Spectrometry.” Talanta 59 (2): 287–93.
Sarin, Vikrant, and K. K. Pant. 2006. “Removal of Chromium from Industrial Waste by Using
Eucalyptus Bark.” Bioresource Technology 97: 15–20.
Sharma, Parul, Pushpa Kumari, M. M. Srivastava, and Shalini Srivastava. 2006. “Removal of
Cadmium from Aqueous System by Shelled Moringa Oleifera Lam. Seed Powder.”
Bioresource Technology 97: 299–305.
Shukla, Alka, Yu H. Zhang, P. Dubey, J. L. Margrave, and Shyam S. Shukla. 2002. “The Role of
Sawdust in the Removal of Unwanted Materials from Water.” Journal of Hazardous
Materials 95 (1-2): 137–52.
Silvestre, M.D., M.J. Lagarda, R. Farré, C. Martınez-Costa, and J. Brines. 2000. “Copper, Iron and
Zinc Determinations in Human Milk Using FAAS with Microwave Digestion.” Food
Chemistry 68 (1): 95–99.
Simonescu, Claudia Maria. 2012. “Application of FTIR Spectroscopy in Environmental Studies.”
Advanced Aspects of Spectroscopy, 29 (1): 77–86.
Singh, K. K., R. Rastogi, and S. H. Hasan. 2005. “Removal of Cr(VI) from Wastewater Using Rice
Bran.” Journal of Colloid and Interface Science 290 (1): 61–68.
Singh, K. K., M. Talat, and S. H. Hasan. 2006. “Removal of Lead from Aqueous Solutions by
Agricultural Waste Maize Bran.” Bioresource Technology 97 (4): 2124–30.
Smolders, A J P, R A C Lock, der Velde G Van, Hoyos R I Medina, and J G M Roelofs. 2003.
“Effects of Mining Activities on Heavy Metal Concentrations in Water, Sediment, and
Macroinvertebrates in Different Reaches of the Pilcomayo River, South America.” Archives
of Environmental Contamination and Toxicology 44 (3): 314–23.
Sneddon, Joseph. 1997. “Direct and near Real-Time Determination of Metals in Air by Impaction-
Graphite Furnace Atomic Absorption Spectrometry.” Advances in Atomic Spectroscopy 3.
JAI Pres 7 (2): 203–24.
Srivastava, Preeti, and Hadi Syed Hasan. 2011. “Biomass of Mucor Heimalis for the Biosorption
of Cadmium from Aqueouls Solutions: Equlibrium and Kinetic Studies.” Bioresources 6 (4):
3656–75.

111
Stevens G C, Baiyeri K P, Akinnnagbe O. 2013. “Ethno-Medicinal and Culinary Uses of Moringa
Oleifera Lam . in Nigeria” 7 (13): 799–804.
Tadesse, I, S A Isoaho, F B Green, and J A Puhakka. 2006. “Lime Enhanced Chromium Removal
in Advanced Integrated Wastewater Pond System.” Bioresource Technology 97 (4): 529–34.
Temerdashev, Z A, S A Litvinov, T G Tsyupko, and O B Voronova. 2000. “Voltamperometric
Determination of Heavy Metals in Food by Using the BA-5 Analyzer.” Izvestiya Vysshikh
Uchebnykh Zavedenii, Pishchevaya Tekhnologiya, no. 2-3: 75–77.
Thomas, Robert. 2001. “A Beginner‘s Guide to ICP-MS - Part II: The Sample Introduction
System.” Spectroscopy 16 (5): 56–61.
“Treatment of Wastewater from Flue Gas Washing.” 1984. Jpn. Kokai Tokkyo Koho. Asahi Glass
Co., Ltd., Japan . 2 (1): 7–8.
Tüzen, Mustafa. 2003. “Determination of Heavy Metals in Soil, Mushroom and Plant Samples by
Atomic Absorption Spectrometry.” Microchemical Journal 74 (3): 289–97.
Uosaki, Kohei. 1974. “Removal of Heavy Metals from Waste Water by Electrodialysis.” Jpn.
Kokai Tokkyo Koho. Mitsubishi Petrochemical Co., Ltd., Japan . 4(1): 22-27
Vaghetti, J. C P, Eder C. Lima, Betina Royer, Bruna M. da Cunha, Natali F. Cardoso, Jorge L.
Brasil, and S. L P Dias. 2009. “Pecan Nutshell as Biosorbent to Remove Cu(II), Mn(II) and
Pb(II) from Aqueous Solutions.” Journal of Hazardous Materials 162 (5): 270–80.
Van Haute, A. 1978. “Recycling of Waste Water into Drinking Water.” Ingenieursblad 47 (7):
176–87.
Vieira, Angelica Marquetotti Salcedo, Marcelo F. Vieira, Gabriel F. Silva, Álvaro a. Araújo,
Márcia R. Fagundes-Klen, Márcia T. Veit, and Rosângela Bergamasco. 2010. “Use of
Moringa Oleifera Seed as a Natural Adsorbent for Wastewater Treatment.” Water, Air, and
Soil Pollution 206: 273–81.
Viljoen, a. M., G. P P Kamatou, and K. H C Başer. 2008. “Head-Space Volatiles of Marula
(Sclerocarya Birrea Subsp. Caffra).” South African Journal of Botany 74 (2): 325–26.
Volesky, B, and Z R Holan. 2003. “Biosorption of Heavy Metals.” Biotechnology Progress 11 (3):
235–50.
Wan Ngah, W. S., and M. a K M Hanafiah. 2008. “Removal of Heavy Metal Ions from Wastewater
by Chemically Modified Plant Wastes as Adsorbents: A Review.” Bioresource Technology
99: 3935–48.
Wang, Jianhua, and Elo Harald Hansen. 2001. “Coupling Sequential Injection on-Line
Preconcentration by Means of a Renewable Microcolumn with Ion-Exchange Beads with

112
Detection by Electrothermal Atomic Absorption Spectrometry.” Analytica Chimica Acta 435
(2): 331–42.
Wang, Shaobin, and Hongwei Wu. 2006. “Environmental-Benign Utilisation of Fly Ash as Low-
Cost Adsorbents.” Journal of Hazardous Materials 136 (3): 482–501.
Wang, Tao, Sheila Walden, and Richard Egan. 1997. “Development and Validation of a General
Non-Digestive Method for the Determination of Palladium in Bulk Pharmaceutical
Chemicals and Their Synthetic Intermediates by Graphite Furnace Atomic Absorption
Spectroscopy.” Journal of Pharmaceutical and Biomedical Analysis 15 (5): 593–99.
Wang, Tiebang, Zhihong Ge, Jane Wu, Bin Li, and An-shu Liang. 1999. “Determination of
Tungsten in Bulk Drug Substance and Intermediates by ICP-AES and ICP-MS.” Journal of
Pharmaceutical and Biomedical Analysis 19 (6): 937–43.
Wolf Ruth E. 2005. “Crustal Geophysics and Geochemistry Science Center What Is ICP-MS ? ...
and More Importantly , What Can It Do ?” Research Chemist. USGS/CR/CICT.html.
Wollein, Uwe, Bettina Bauer, Renate Habernegg, and Nicholas Schramek. 2015. “Potential Metal
Impurities in Active Pharmaceutical Substances and Finished Medicinal Products - A Market
Surveillance Study.” European Journal of Pharmaceutical Sciences : Official Journal of the
European Federation for Pharmaceutical Sciences 77 (5): 100–105.
Wu, Chunhua, Yuhong Chen, Kun Ouyang, Zhixu Zhang, and Craig Taylor. 2012. “Analysis of
Chinese Herbal Medicines by Microwave Plasma-Atomic Emission Application Note,” 5 (7)
2010: 1–4.
Xie, Chang-hang. 2014. “Uncertainty Evaluation in Determination of Cadmium Migrating from
Stainless Steel Food Containers with Graphite Furnace Atomic Absorption Spectrometry.”
Dangdai Huagong 43 (11). Dangdai Huagong Zazhishe: 2476–78.
Yadav, J S, M Soni, S Verma, and J K Srivastava. 2008. “Removal of Copper Ion (Cu2+) Using
Soybean Hulls.” Pollution Research 27 (2). Enviro Media: 323–26.
Yan, Guangyu, and T. Viraraghavan. 2000. “Effect of Pretreatment on the Bioadsorption of Heavy
Metals on Mucor Rouxii.” Water SA 26 (1): 119–23.
Yan, Hui, Shengyuan Yuan, Manyuan Li, and Jun. Xiao. 2015. “Evaluation of Heavy Metal
Contamination in Agricultural Topsoils in Suburban Xuchang City, China.” Environmental
Earth Sciences 74 (3): 2475–80..
Yang, Guangyu, Weibo Fen, Chun Lei, Weilie Xiao, and Handong Sun. 2009. “Study on Solid
Phase Extraction and Graphite Furnace Atomic Absorption Spectrometry for the
Determination of Nickel, Silver, Cobalt, Copper, Cadmium and Lead with MCI GEL CHP
20Y as Sorbent.” Journal of Hazardous Materials 162 (1): 44–49.

113
Yao, Xiao-fei, Yan-mei Zhou, Xiao-hua Yu, Jin-tao Wu, and Wei-fu. Liu. 2011. “Pollution
Evaluation and Source Identification of Heavy Metals in Surface Sediments of Nansha
River.” Huanjing Kexue Yu Jishu 34 (12): 197–200,216.
Ye, Sheng-quan, Si-yuan Guo, Yi-gang Yu, Hui Wu, and Rui. Han. 2012. “Removal of the Heavy
Metal Ion Cr(VI) by Soybean Hulls in Dyehouse Wastewater Treatment.” Desalination and
Water Treatment 42 (1-3): 197–201.
Yin, Chun-Yang. 2010. “Emerging Usage of Plant-Based Coagulants for Water and Wastewater
Treatment.” Process Biochemistry 45 (9): 1437–44.
Zhang, Liaosheng, and Haiyan. Xue. 2011. “Uncertainty Evaluation of Measurement Results for
the Determination of Copper in Tea by Flame Atomic Absorption Spectrometry.” Fujian
Fenxi Ceshi 20 (4): 37–39.
Zhang, Nan, Gaifeng Xue, Lina Wang, Pu Liu, and Benquan. Fu. 2012. “Several Methods for
Analyzing Alloying Elements in Silicon Steel by Instrument.” Angang Jishu, 7 (4): 9–12.
Zhang, W, and P Cornel. 2005. “A Sustainable Strategy of Water Reuse and Wastewater Treatment
in Some Regions in China.” In Future Urban Wastewater Syst.: Decent. Reuse, Proc. Int.
Water Assoc. Conf., 3 (4):179–87.
Zhao, F., S. P. McGrath, and A. R. Crosland. 1994. “Comparison of Three Wet Digestion Methods
for the Determination of Plant Sulphur by Inductively Coupled Plasma Atomic Emission
Spectroscopy (ICP‐AES).” Communications in Soil Science and Plant Analysis 25 (3-4):
407–18.
Zhao, Yang, Zenghe Li, Ashdown Ross, Zhiding Huang, Wenkai Chang, Kun Ou-yang, Yuhong
Chen, and Chunhua Wu. 2015. “Determination of Heavy Metals in Leather and Fur by
Microwave Plasma-Atomic Emission Spectrometry.” Spectrochimica Acta Part B: Atomic
Spectroscopy 112 (10): 6–9.
Zhong, Xu-qian, and Chun-yan. Fan. 2011. “Evaluation of Uncertainty in Determination of Lead
Content in Tilapia Using Graphite Furnace Atomic Absorption Spectrometry.” Nanfang
Nongye Xuebao 42 (8): 995–98.
Znidarsic-Pongrac, Vida, and Andreja. Hodnik. 2003. “Interlaboratory Comparison of Analytical
Procedures for the Determination of Heavy Metals in Food and Feed.” In Slov. Kem. Dnevi,
21 (4):74–79.
Zwain, Haider M, Mohammadtaghi Vakili, and Irvan Dahlan. 2014. “Waste Material Adsorbents
for Zinc Removal from Wastewater : A Comprehensive Review” 29 (5): 779–86.

114

115
7.0 APPENDICES:
Appendix 1: Analysis of variance (ANOVA)
Table 7.1: ANOVA of Mn using different Particle size of MSP
Anova: Single
Factor Mn MSP
SUMMARY
Groups Count Sum Average Variance
100 3 126.48 42.16 9.318675
200 3 111.84 37.28 5.847075
500 3 109.23 36.41 7.203675
ANOVA
Source of Variation SS df MS F P-value F crit
Between Groups 57.6338 2 28.8169 3.864681 0.083465 5.143253
Within Groups 44.73885 6 7.456475
Total 102.3727 8
F calc < F crit, therefore no significant difference
Table 7.2: ANOVA of Cd using different Particle size of MSP
Anova: Single
Factor Cd MSP
SUMMARY
Groups Count Sum Average Variance
100 3 192.375 64.125 11.54688
200 3 185.65 61.88333 4.050208
500 3 183.6 61.2 20.77
ANOVA
Source of Variation SS df MS F P-value F crit
Between Groups 14.04764 2 7.023819 0.57941 0.588748 5.143253
Within Groups 72.73417 6 12.12236
Total 86.78181 8
F calc < F crit, therefore no significant difference

116
Table 7.3: ANOVA of Mg using different Particle size of MNS
Anova: Single Factor Mg
SUMMARY
Groups Count Sum Average Variance
100µm 4 34.28099 8.570248 28.59313
200µm 4 75.72916 18.93229 150.0457
500µm 4 87.3879 21.84697 192.9567
ANOVA
Source of Variation SS df MS F P-value F crit
Between Groups 389.5184 2 194.7592 1.572348 0.259628 4.256495
Within Groups 1114.787 9 123.8652
Total 1504.305 11
F calc < F crit, therefore no significant difference
Table 7.4: ANOVA of different sorbent dose using MNS
Anova: Single Factor Mg
MNS
SUMMARY
Groups Count Sum Average Variance
1.5 g 3 65.6875 21.89583 0.880208
2 g 3 56.175 18.725 4.27
2.5 g 3 40.2 13.4 58.48172
ANOVA
Source of
Variation
SS df MS F P-value F crit
Between Groups 110.589 2 55.2945 2.606922 0.153176 5.143253
Within Groups 127.2639 6 21.21064
Total 237.8528 8

117
Table 7.5: ANOVA of different sorbent dose using MPS
Anova: Single Factor MSP
Pb
SUMMARY
Groups Count Sum Average Variance
0.5g 3 276.75 92.25 1
1 g 3 282.25 94.08333 2.270833
1.5 g 3 282 94 1
ANOVA
Source of
Variation
SS df MS F P-value F crit
Between Groups 6.430556 2 3.215278 2.258537 0.185682 5.143253
Within Groups 8.541667 6 1.423611
Total 14.97222 8
Table 7.6: ANOVA 0f temperature using MPS
Anova: Single Factor Cu MSP
SUMMARY
Groups Count Sum Average Variance
25 3 123.875 41.29167 0.380208
35 3 122.25 40.75 4.9375
45 3 121.875 40.625 0.4375
60 3 127.125 42.375 0.4375
ANOVA
Source of Variation
SS df MS F P-value F crit
Between Groups 5.722656 3 1.907552 1.232128 0.359883 4.066181
Within Groups 12.38542 8 1.548177
Total 18.10807 11
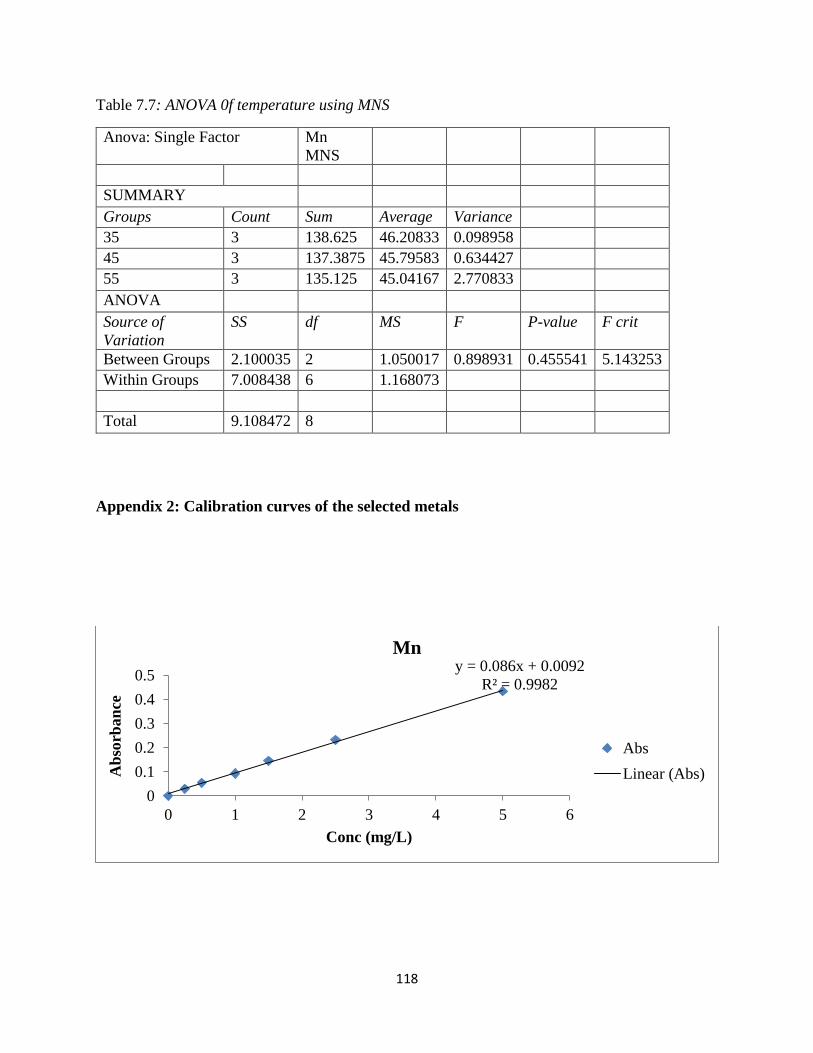
118
Table 7.7: ANOVA 0f temperature using MNS
Anova: Single Factor Mn
MNS
SUMMARY
Groups Count Sum Average Variance
35 3 138.625 46.20833 0.098958
45 3 137.3875 45.79583 0.634427
55 3 135.125 45.04167 2.770833
ANOVA
Source of
Variation
SS df MS F P-value F crit
Between Groups 2.100035 2 1.050017 0.898931 0.455541 5.143253
Within Groups 7.008438 6 1.168073
Total 9.108472 8
Appendix 2: Calibration curves of the selected metals
y = 0.086x + 0.0092
R² = 0.9982
0
0.1
0.2
0.3
0.4
0.5
0 1 2 3 4 5 6
Ab
sorb
an
ce
Conc (mg/L)
Mn
Abs
Linear (Abs)

119
y = 0.1234x + 0.0334
R² = 0.9922
0
0.2
0.4
0.6
0.8
0 1 2 3 4 5 6
Ab
sorb
an
ce
Conc (mg/L)
Zn
Abs
Linear (Abs)
y = 0.1545x + 0.0388
R² = 0.9923
0
0.2
0.4
0.6
0.8
1
0 1 2 3 4 5 6
Ab
sorb
an
ce
Conc (mg/L)
Cd
Abs
Linear (Abs)
y = 0.1053x + 0.0059
R² = 0.9995
0
0.1
0.2
0.3
0.4
0.5
0.6
0 1 2 3 4 5 6
Ab
sorb
an
ce
Conc (mg/L)
Cu
Abs
Linear (Abs)

120
y = 0.0241x + 0.0013
R² = 0.9996
-0.05
0
0.05
0.1
0.15
0 1 2 3 4 5 6
Ab
sorb
an
ce
Conc (mg/L)
Pb
Abs
Linear (Abs)
y = 0.0424x + 0.0027
R² = 0.9997
0
0.05
0.1
0.15
0.2
0.25
0 1 2 3 4 5 6
Ab
sorb
an
ce
Conc (mg/L)
Fe
Abs
Linear (Abs)
y = 0.241x + 0.0189
R² = 0.997
-0.2
0
0.2
0.4
0.6
0.8
1
1.2
0 1 2 3 4 5
Ab
sorb
an
ce
Conc (mg/L)
Mg
Abs
Linear (Abs)

121
Appendix 3: EDAX spectrum analysis
Figure 7.1: EDAX spectrum analysis of a) Moringa seed pods and b) Morula nutshell
a
b

122
Table 7.8: EDAX Elemental composition in Moringa see pods (MSP) and morula nut shells
(MNS)
MSP MNS
Element Wt
% Element
Wt
%
C K 62.52 C K 73.06
O K 31.98 O K 20.69
MgK 0.27 NaK 0.22
AlK 0.1 MgK 0.2
SiK 0.1 AlK 0.63
P K 0.25 SiK 1.3
S K 0.41 P K 0.08
ClK 0.28 S K 0.52
K K 3.61 K K 0.23
CaK 0.48 CaK 0.09
Total 100 BaL 2.78
FeK 0.19
Total 100
Appendix 4:
Table 7.9: Average concentration of metals in wastewater samples
Average concentration of selected metals in water samples in mg/L and ± standard deviations.
Fe Zn Cu Cd Pb Mn Mg
Inlet 1.3610 ±
0.0202
0.2511 ±
0.0103
0.0855 ±
0.0049
0.0125 ±
0.0007
0.2850 ±
0.0212
0.3090 ±
0.0006
12.8667 ±
0.0093
Primary 1.0735 ±
0.023
0.2055 ±
0.0122
0.078 ±
0.0014
0.013 ±
0.0014
0.245 ±
0.0071
0.3040 ±
0.0006
11.5957 ±
0.0025
Secondary 0.2875
±0.046
0.1419 ±
0.0632
0.0285 ±
0.0021
0.0147 ±
0.0012
0.23 ±
0.0424
0.2220 ±
0.0007
13.4873 ±
0.0021
Aeration 2.432 ±
0.0457
0.4045 ±
0.0866
0.1265 ±
0.0120
0.0155
±0.0007
0.3900 ±
0.003
0.3800 ±
0.0007
13.4783 ±
0.0012

123
Effluent 0.2550 ±
0.0283
0.1158 ±
0.0183
0.0275 ±
0.0021
0.0145 ±
0.0007
0.2650 ±
0.0212
0.2110 ±
0.0054
13.6713 ±
0.0025