Mahindra & Mahindra - Google Groups
44
Please refer to the important disclosures and analyst certification on page 2 and the inside back cover of this document, or on our website www.macquarie.com.au/research/disclosures. INDIA MM IN Outperform Price 11 Jun 10 Rs606.70 12-month target Rs 740.00 Upside/Downside % 22.0 Valuation Rs 740.00 - Sum of Parts GICS sector Automobiles & Components Market cap Rsm 350,915 30-day avg turnover US$m 25.8 Market cap US$m 7,465 Number shares on issue m 578.4 Investment fundamentals Year end 31 Mar 2010A 2011E 2012E 2013E Total revenue bn 186.0 223.1 258.2 293.2 EBITDA bn 29.6 34.3 39.3 44.5 EBITDA growth % 170.7 16.0 14.6 13.3 EBIT bn 25.9 29.8 33.7 37.8 EBIT growth % 222.9 15.1 13.2 12.3 Reported profit bn 20.9 23.7 26.3 29.5 EPS rep Rs 36.92 41.81 46.53 52.12 EPS rep growth % 137.6 13.2 11.3 12.0 PER rep x 16.4 14.5 13.0 11.6 Total DPS Rs 6.23 11.00 11.75 12.50 Total div yield % 1.0 1.8 1.9 2.1 ROA % 17.1 17.2 17.1 17.0 ROE % 30.9 27.4 25.3 23.8 EV/EBITDA x 12.0 10.3 9.0 8.0 Net debt/equity % 14.4 21.7 17.0 10.4 P/BV x 4.4 3.6 3.0 2.6 Source: FactSet, Macquarie Research, June 2010 (all figures in INR unless noted) Key ratios excluding listed subsidiaries 2010A 2011E 2012E 2013E PER 12.1 10.3 9.3 8.3 EV/EBITDA 6.3 5.7 4.9 4.2 Price to Book 3.1 2.6 2.2 1.8 ROE 25% 24% 22% 21% ROA 18% 18% 17% 17% Source: Bloomberg, Macquarie Research, June 2010 Sanjay Doshi +91 22 6653 3061 [email protected] 14 June 2010 Mahindra & Mahindra Sowing seeds for next harvest Initiate with Outperform, TP of Rs740, upside of 22% We initiate coverage on Mahindra & Mahindra (M&M) with an Outperform rating and target price of Rs740, providing 22% upside from current levels. We rate M&M as a top pick in the Indian auto space. With leadership in the utility vehicle and tractor segments and a robust estimated 13% CAGR in earnings over the next three years, at 9.3x core auto FY12E PER, we think M&M remains one of the most attractively valued stocks in our coverage universe. Strong brands, new products to drive growth in auto space Strong products catering to all consumer segments, increasing urban demand backed by bank financing and benign competition, should help M&M’s utility vehicle segment to grow at a CAGR of 14% over next couple of years. In the light commercial vehicle (LCV) space, recently launched Gio and Maxximo have garnered good response and should help the segment grow by 40% in the FY11. Tractor segment to benefit from Punjab Tractor merger We expect the farm equipment segment (FES) to see 13-15% p.a. growth in the coming years, supported by rising rural income and increasing agricultural credit. M&M recently launched a new small tractor, targeting the small and marginal farmers. With tractor penetration of only 1%, the segment has strong growth prospects and could provide significant upside to volume assumptions. M&M’s dealer and vendor rationalisation programs post the merger of Punjab Tractor should also improve tractor business profitability in the medium term. New businesses to add value in the medium term M&M has entered into new auto segments — medium and heavy commercial vehicles (M&HCV) and two-wheelers — and has enhanced its presence in the defence space. Given strong growth prospects and a virtual duopoly in the M&HCV space, we believe that the segment could add significant value in the medium term. The company has also invested ~US$1bn in setting up a new plant, which should support its auto business expansion for the next 5 to 7 years. Solid earnings growth, attractive on valuation We forecast M&M’s earnings to grow at a CAGR of 13% over the next 3 years despite a minor decline in margins. Our estimates are 5-7% ahead of consensus, mainly on account of higher volume growth assumptions. The stock trades at a ~28% discount to peers on core auto business valuations. We ascribe a PER multiple of 14x, in-line with sector average, to core auto earnings, valuing it at Rs583 per share (78% of value). We value listed subsidiaries at a 20% discount to current market cap, in-line with our valuation methodology for other auto names. Key risks and catalysts Any material increase in diesel vehicle duties proposed by the Parikh oil sector reform committee will be a key risk for the stock. Other macro risks include a significant jump in raw material prices and a faster-than-expected hardening of interest rates. Stronger-than-expected response to recently launched products, positive response from the US market to the new pick-up planned in the current fiscal year and success in new business initiatives could be key catalysts.
-
Upload
khangminh22 -
Category
Documents
-
view
2 -
download
0
Transcript of Mahindra & Mahindra - Google Groups

Please refer to the important disclosures and analyst certification on page 2 and the inside back cover of this document, or on our website www.macquarie.com.au/research/disclosures.
INDIA
MM IN Outperform Price 11 Jun 10 Rs606.70 12-month target Rs 740.00 Upside/Downside % 22.0 Valuation Rs 740.00 - Sum of Parts GICS sector Automobiles & Components Market cap Rsm 350,915 30-day avg turnover US$m 25.8 Market cap US$m 7,465 Number shares on issue m 578.4
Investment fundamentals Year end 31 Mar 2010A 2011E 2012E 2013E Total revenue bn 186.0 223.1 258.2 293.2 EBITDA bn 29.6 34.3 39.3 44.5 EBITDA growth % 170.7 16.0 14.6 13.3 EBIT bn 25.9 29.8 33.7 37.8 EBIT growth % 222.9 15.1 13.2 12.3 Reported profit bn 20.9 23.7 26.3 29.5 EPS rep Rs 36.92 41.81 46.53 52.12 EPS rep growth % 137.6 13.2 11.3 12.0 PER rep x 16.4 14.5 13.0 11.6 Total DPS Rs 6.23 11.00 11.75 12.50 Total div yield % 1.0 1.8 1.9 2.1 ROA % 17.1 17.2 17.1 17.0 ROE % 30.9 27.4 25.3 23.8 EV/EBITDA x 12.0 10.3 9.0 8.0 Net debt/equity % 14.4 21.7 17.0 10.4 P/BV x 4.4 3.6 3.0 2.6 Source: FactSet, Macquarie Research, June 2010 (all figures in INR unless noted)
Key ratios excluding listed subsidiaries 2010A 2011E 2012E 2013E PER 12.1 10.3 9.3 8.3 EV/EBITDA 6.3 5.7 4.9 4.2 Price to Book 3.1 2.6 2.2 1.8 ROE 25% 24% 22% 21% ROA 18% 18% 17% 17% Source: Bloomberg, Macquarie Research, June 2010
Sanjay Doshi +91 22 6653 3061 [email protected]
14 June 2010
Mahindra & Mahindra Sowing seeds for next harvest Initiate with Outperform, TP of Rs740, upside of 22% We initiate coverage on Mahindra & Mahindra (M&M) with an Outperform rating and target price of Rs740, providing 22% upside from current levels. We rate M&M as a top pick in the Indian auto space. With leadership in the utility vehicle and tractor segments and a robust estimated 13% CAGR in earnings over the next three years, at 9.3x core auto FY12E PER, we think M&M remains one of the most attractively valued stocks in our coverage universe.
Strong brands, new products to drive growth in auto space Strong products catering to all consumer segments, increasing urban demand backed by bank financing and benign competition, should help M&M’s utility vehicle segment to grow at a CAGR of 14% over next couple of years. In the light commercial vehicle (LCV) space, recently launched Gio and Maxximo have garnered good response and should help the segment grow by 40% in the FY11.
Tractor segment to benefit from Punjab Tractor merger We expect the farm equipment segment (FES) to see 13-15% p.a. growth in the coming years, supported by rising rural income and increasing agricultural credit. M&M recently launched a new small tractor, targeting the small and marginal farmers. With tractor penetration of only 1%, the segment has strong growth prospects and could provide significant upside to volume assumptions. M&M’s dealer and vendor rationalisation programs post the merger of Punjab Tractor should also improve tractor business profitability in the medium term.
New businesses to add value in the medium term M&M has entered into new auto segments — medium and heavy commercial vehicles (M&HCV) and two-wheelers — and has enhanced its presence in the defence space. Given strong growth prospects and a virtual duopoly in the M&HCV space, we believe that the segment could add significant value in the medium term. The company has also invested ~US$1bn in setting up a new plant, which should support its auto business expansion for the next 5 to 7 years.
Solid earnings growth, attractive on valuation We forecast M&M’s earnings to grow at a CAGR of 13% over the next 3 years despite a minor decline in margins. Our estimates are 5-7% ahead of consensus, mainly on account of higher volume growth assumptions. The stock trades at a ~28% discount to peers on core auto business valuations. We ascribe a PER multiple of 14x, in-line with sector average, to core auto earnings, valuing it at Rs583 per share (78% of value). We value listed subsidiaries at a 20% discount to current market cap, in-line with our valuation methodology for other auto names.
Key risks and catalysts Any material increase in diesel vehicle duties proposed by the Parikh oil sector reform committee will be a key risk for the stock. Other macro risks include a significant jump in raw material prices and a faster-than-expected hardening of interest rates. Stronger-than-expected response to recently launched products, positive response from the US market to the new pick-up planned in the current fiscal year and success in new business initiatives could be key catalysts.
Macquarie Research Mahindra & Mahindra
14 June 2010 2
Inside
Sowing seeds for next harvest 3
Strong brands, new products to drive
growth in auto space 5
FES to benefit from Punjab Tractor merger10
New initiatives to add value in medium
term 16
Solid earnings growth for coming years 19
Valuation – trading attractively 23
Key risks and catalysts 26
Appendix I: Tech Mahindra 27
Appendix II: M&M Financial Services 29
Appendix III: M&M Systech 31
Appendix IV: Mahindra Holidays & Resorts33
Appendix V: Mahindra Lifespaces 34
Appendix VI: Utility vehicle segment 35
Appendix VII: Tractors 36
Appendix VIII: Light Commercial Vehicles38
Appendix IX: Medium & Heavy
Commercial Vehicles 39
Appendix X: Three-wheelers 40 MM IN rel BSE Sensex performance
Source: FactSet, Macquarie Research, June 2010
(all figures in INR unless noted)
Shareholding pattern
Source: BSE, Macquarie Research, June 2010
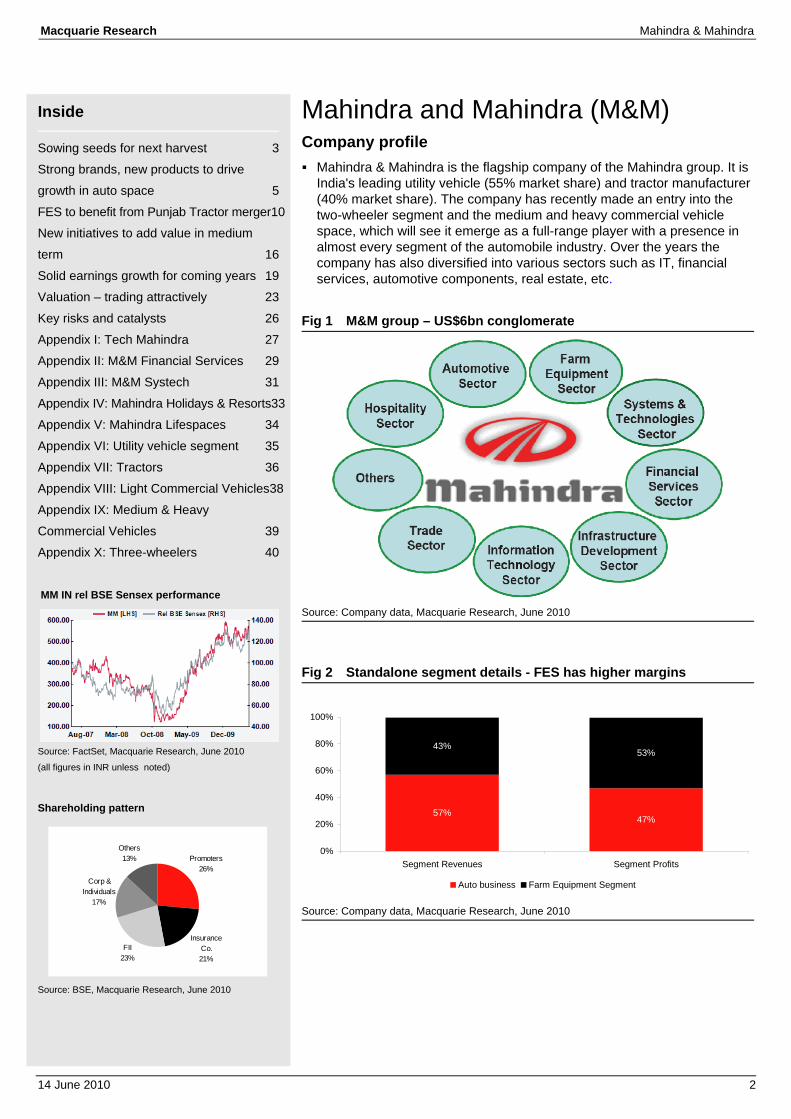
Mahindra and Mahindra (M&M) Company profile Mahindra & Mahindra is the flagship company of the Mahindra group. It is
India's leading utility vehicle (55% market share) and tractor manufacturer (40% market share). The company has recently made an entry into the two-wheeler segment and the medium and heavy commercial vehicle space, which will see it emerge as a full-range player with a presence in almost every segment of the automobile industry. Over the years the company has also diversified into various sectors such as IT, financial services, automotive components, real estate, etc.
Fig 1 M&M group – US$6bn conglomerate
Source: Company data, Macquarie Research, June 2010
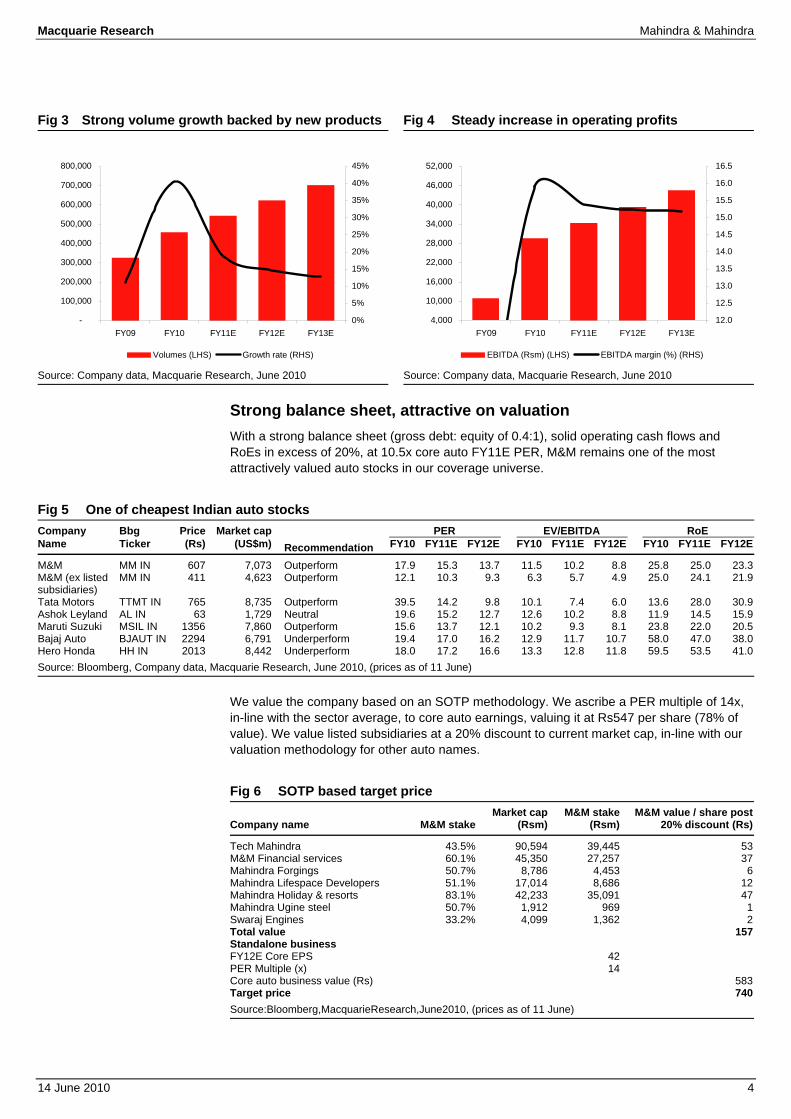
Fig 2 Standalone segment details - FES has higher margins
Source: Company data, Macquarie Research, June 2010
Insurance Co.21%
FII23%
Others13%
Corp & Individuals
17%
Promoters26%
57%47%
43%53%
0%
20%
40%
60%
80%
100%
Segment Revenues Segment Profits
Auto business Farm Equipment Segment

Macquarie Research Mahindra & Mahindra
14 June 2010 3
Sowing seeds for next harvest Initiate with Outperform We initiate on Mahindra & Mahindra (M&M) with an Outperform rating and target price of Rs740, providing ~22% upside from current levels. The company has strong brands in the key bread-and-butter businesses, i.e., utility vehicles and tractors. With a robust 13% CAGR in earnings expected over the next three years, at 9.3x core auto FY12E PER, M&M strikes us as one of the most attractively valued stocks in our coverage universe.
Strong brands, new products to drive growth in auto space M&M has a significant presence in the utility vehicle and the light commercial vehicle segments through its auto division. We expect overall auto volumes to grow at a CAGR of 15.5% for next 3 years. The key factors supporting the growth are:
Strong brands in the utility vehicle space catering to all consumer segments. M&M is the only player with products spread across the spectrum, catering to both the rural populace and high-end urban segments.
Increasing urban demand for auto products, backed by higher bank financing
Key new products, Gio and Maxximo, launched in the LCV segment
Tractor segment to benefit from Punjab Tractor merger Mahindra’s Farm Equipment Sector is one of the world’s top tractor brands and has been the undisputed market leader in India for 25 years (FY10 market share of 41%). The company has consolidated its leadership position in the tractor space (53% of EBIT) with the acquisition of Punjab Tractors. We expect the tractor segment to witness 13-15% p.a. growth in the coming years, supported by the following key factors:
Increasing rural wealth due to rising minimum support prices and larger spending by government on rural development schemes and employment guarantee schemes
Expanding credit availability through private and public sector banks
Rising trend of tractors being used for commercial purposes like transportation of material over short distances, utilization for construction activities, to ferry water tankers etc
M&M has also recently launched a new small tractor, Yuvraj, targeting the bottom of the pyramid, i.e. small and marginal farmers. With tractor penetration of only 1%, the segment has strong growth prospects and can provide significant upside to volume assumptions. Further M&M’s dealer and vendor rationalisation programs post the merger of Punjab Tractor should improve tractor business profitability in the medium term
New businesses to add value in the medium term M&M has recently entered the US$7.5bn Indian M&HCV segment through a JV with US based Navistar Inc (NAV US, US$51, not rated) and has forayed into the two-wheeler space through acquisition of assets of Kinetic Motors (KNH IN, Rs20, not rated). Further it plans to enter the US light truck market with the Scorpio pick-up. Acceptance of the company’s products in these categories, we believe, will drive growth in the medium term. The company has also invested ~US$1bn in setting up a new plant, which should support company’s auto business expansion for the next 5 to 7 years.
Solid earnings growth in coming years We forecast the company’s earnings to grow at a CAGR of 13% over the next three years, backed by volume growth of 15%. The existing strong product portfolio in the tractor and utility vehicle spaces, along with key new product launches (Gio and Maxximo) in the LCV segment should drive this growth.
Initiate Outperform with target price of
Rs740 – implying 22% upside
Macquarie Research Mahindra & Mahindra
14 June 2010 4
Fig 3 Strong volume growth backed by new products Fig 4 Steady increase in operating profits
Source: Company data, Macquarie Research, June 2010 Source: Company data, Macquarie Research, June 2010
Strong balance sheet, attractive on valuation With a strong balance sheet (gross debt: equity of 0.4:1), solid operating cash flows and RoEs in excess of 20%, at 10.5x core auto FY11E PER, M&M remains one of the most attractively valued auto stocks in our coverage universe.
Fig 5 One of cheapest Indian auto stocks Company Bbg Price Market cap PER EV/EBITDA RoE Name Ticker (Rs) (US$m) Recommendation FY10 FY11E FY12E FY10 FY11E FY12E FY10 FY11E FY12E
M&M MM IN 607 7,073 Outperform 17.9 15.3 13.7 11.5 10.2 8.8 25.8 25.0 23.3M&M (ex listed subsidiaries)
MM IN 411 4,623 Outperform 12.1 10.3 9.3 6.3 5.7 4.9 25.0 24.1 21.9
Tata Motors TTMT IN 765 8,735 Outperform 39.5 14.2 9.8 10.1 7.4 6.0 13.6 28.0 30.9Ashok Leyland AL IN 63 1,729 Neutral 19.6 15.2 12.7 12.6 10.2 8.8 11.9 14.5 15.9Maruti Suzuki MSIL IN 1356 7,860 Outperform 15.6 13.7 12.1 10.2 9.3 8.1 23.8 22.0 20.5Bajaj Auto BJAUT IN 2294 6,791 Underperform 19.4 17.0 16.2 12.9 11.7 10.7 58.0 47.0 38.0Hero Honda HH IN 2013 8,442 Underperform 18.0 17.2 16.6 13.3 12.8 11.8 59.5 53.5 41.0Source: Bloomberg, Company data, Macquarie Research, June 2010, (prices as of 11 June)
We value the company based on an SOTP methodology. We ascribe a PER multiple of 14x, in-line with the sector average, to core auto earnings, valuing it at Rs547 per share (78% of value). We value listed subsidiaries at a 20% discount to current market cap, in-line with our valuation methodology for other auto names.
Fig 6 SOTP based target price
Company name M&M stakeMarket cap
(Rsm)M&M stake
(Rsm) M&M value / share post
20% discount (Rs)
Tech Mahindra 43.5% 90,594 39,445 53 M&M Financial services 60.1% 45,350 27,257 37 Mahindra Forgings 50.7% 8,786 4,453 6 Mahindra Lifespace Developers 51.1% 17,014 8,686 12 Mahindra Holiday & resorts 83.1% 42,233 35,091 47 Mahindra Ugine steel 50.7% 1,912 969 1 Swaraj Engines 33.2% 4,099 1,362 2 Total value 157 Standalone business FY12E Core EPS 42 PER Multiple (x) 14 Core auto business value (Rs) 583Target price 740Source:Bloomberg,MacquarieResearch,June2010, (prices as of 11 June)
-
100,000
200,000
300,000
400,000
500,000
600,000
700,000
800,000
FY09 FY10 FY11E FY12E FY13E0%
5%
10%
15%
20%
25%
30%
35%
40%
45%
Volumes (LHS) Growth rate (RHS)
4,000
10,000
16,000
22,000
28,000
34,000
40,000
46,000
52,000
FY09 FY10 FY11E FY12E FY13E12.0
12.5
13.0
13.5
14.0
14.5
15.0
15.5
16.0
16.5
EBITDA (Rsm) (LHS) EBITDA margin (%) (RHS)

Macquarie Research Mahindra & Mahindra
14 June 2010 5
Strong brands, new products to drive growth in auto space M&M’s automotive business (57% of revenues and 47% of EBIT) remains on a strong footing, with leading brands across segments. We expect overall auto volumes to grow at a CAGR of 15.5% for the next 3 years. Recently launched new products in the LCV space and robust demand in the utility vehicle segment, on the back of improving consumer sentiment and easy availability of bank finance, should drive this growth.
M&M has a significant presence in the utility vehicle and the light commercial vehicle segments through its auto division. The company has improved its position in the three-wheeler space through new model launches in the last year. M&M has also entered the two-wheeler space through acquisition of assets of Kinetic Motors, garnering ~6% market share in the scooter segment in the first year of operation. The company has a miniscule share in the car space, where it was present through a JV with Renault (RNO FP, €30.42, Neutral, TP: €41.00, Jens Schattner) until last month with a single product, an entry-level sedan–the Logan.
Fig 7 UV dominates auto business, new products to drive LCV
Product Segment Key brands
FY10 segment market
share (%)
Segment share in M&M total
automotive volume
Macquarie Comments
Utility Vehicles Bolero, Scorpio, Xylo
55.5% 41.3% Strong brands across all segments
Light Commercial Vehicles (LCV) Bolero Maxitruck, Bolero Pick-up, Maxximo, Gio
29.9% 25.3% Key new products in high growth LCV space
Three-wheelers Alpha, Champion 7.4% 12.3% Two-wheelers Rodeo, Duro,
Flyte 4.8% 19.4% Garnering 6%
market share in first year of operation
Cars Logan 0.3% 1.7% Source: SIAM, Company data, Macquarie Research, June 2010
Leader in utility vehicles for over a decade; to maintain market share M&M has been a leader in the Indian utility vehicle space (current ~270k units pa market) for over a decade. On the back of a strong product portfolio, the company has been able to increase its market share in FY10 to 55% from 47% in FY09. M&M is probably the only company which has reasonably successful products in the utility vehicle space for every consumer segment. Key brands in the M&M utility vehicle portfolio are:
Fig 8 Strong brands in utility vehicle portfolio catering to all segments Brand Engine capacity Ex-showroom price Delhi(Rs'000) Macquarie Comments
Bolero 2523cc 550-649 Low end multi purpose vehicle used largely in non-metro and rural areas
Xylo 2498cc 636-848 High end multi utility vehicle having strong acceptance in metros and large cities
Scorpio 2179cc 764-1083 High end sports utility vehicle Source: Company data, Macquarie Research, June 2010
Core automotive business on strong footing with leading
brands for all segments

Macquarie Research Mahindra & Mahindra
14 June 2010 6
Fig 9 Strong market share expected to be sustained Fig 10 Leader by far in utility vehicle space
Source: SIAM, Macquarie Research, June2010 Source: SIAM, Macquarie Research,June2010
Fig 11 Strong brands to cater to all segments in UV space
Brand/Car FY10 domestic
sales %change YoY Ex showroom price
Delhi(Rs.'000)
Mahindra & Mahindra Bolero 80,059 43% 550-649Scorpio 34,173 14% 764-1083Xylo 26,478 265% 636-848 Tata Motors Ltd Sumo 23,049 -6% 520-762Safari 10,482 -29% 782-1197 Toyota Kirloskar Motor Ltd Innova 47,294 24% 794-1166 Maruti Suzuki Ltd Gypsy 3,841 -47% 515-537 General Motors India Ltd Tavera 15,334 14% 622-935Source:CRISIL,MacquarieResearch,June2010
We expect the UV segment to grow by 13-15% over next couple of years. The key reasons why we believe demand will witness good growth in the UV space are as follows:
Revival in overall economic growth outlook and improving consumer sentiment, especially amongst the salaried class
Widening of income tax slabs (rates) should help to offset increase in overall cost of ownership due to a rise in excise duty, raw material prices, increased costs of meeting new emission norms, fuel prices and higher interest rates
Increasing financial penetration, which currently stands at ~70%, should help growth rates as both private and public banks remain focused on the four-wheeler space.
Demand for utility vehicles for commercial use should be supported by improved business confidence and higher profitability of companies. The recovery in the business environment for IT and BPO companies and growth in tourist arrivals should also be positive for UV demand.
-
50,000
100,000
150,000
200,000
250,000
300,000
350,000
400,000
FY01
FY02
FY03
FY04
FY05
FY06
FY07
FY08
FY09
FY10
FY11
E
FY12
E
20.0%
25.0%
30.0%
35.0%
40.0%
45.0%
50.0%
55.0%
60.0%
Domestic UV sales (LHS) M&M market share % (RHS)
M&M55%
Tata Motors13%
Toyota20%
GM India6%
Others6%
Increasing bank financing and lack
of significant competition, key
positive in UV space

Macquarie Research Mahindra & Mahindra
14 June 2010 7
With no significant increase in competition expected for the key models of M&M, we expect the company to easily maintain its leading market share position in the UV space. Further the company is working on an all-new utility vehicle which is likely to hit markets in the next couple of years, and it will be introducing first diesel compact pick-up truck in the US market early next year. Success of these products should help the company to significantly grow its UV business in the medium term.
Fig 12 No major product to be introduced in categories where M&M dominates Company/Model Launch date Price (in Rsm)
Skoda Yeti Jul-10 1.3 - 1.5Hyundai Santa Fe 1st half of 2010 2.3 - 2.6Nissan Murano 1st half of 2010 3.5 - 4.0BMWX1 Dec-10 2.5Volkswagen Tiguan Early 2011 2.5Tata Aria 2nd half of 2010 1.2Toyota Avanza Early 2011 0.7Source: Company data, Macquarie Research, June 2010
New products to drive growth in LCV space Around 95% of the M&M total LCV volumes is accounted for by the less-than-3.5ton category, one of the fastest growing segments in the Indian automobile space over the last five years (~30% CAGR). The segment has witnessed strong growth post the introduction of India’s first mini-truck with a sub one-ton payload, the Tata Ace, in May 2005. The product took away business from three-wheelers as it provided better economies to fleet operators for last mile transport. Further with development of road infrastructure, the hub-and-spoke model gained importance, leading to strong demand in the heavy truck segment on the one hand and for small LCVs for intra-city transport on the other. However, the success of the Ace also meant a decline in market share for M&M.
Fig 13 Sub 3.5T space gains market share in LCV Fig 14 M&M regaining lost market share
Source: Company data, Macquarie Research, June 2010 Source: Company data, Macquarie Research, June 2010
M&M has introduced many new products over the last couple of years to take on competition in the LCV space. The latest product launches, Gio and Maxximo, we believe should help the company increase its market share significantly from current levels and will be the key drivers of growth in the LCV space for M&M.
M&M created a new category, the compact truck segment, with the launch of the ‘Gio’ in October 2009. The product has a payload of 500kg, with maintenance and running costs similar to that of a three-wheeler and safety and comfort of a four-wheeler. The vehicle is also priced attractively at ~Rs170k. Further M&M launched the Maxximo, in direct competition to the segment leader Ace in February 2010. The product has a higher payload of 850kg and relatively better fuel economy at ~20kmpl, but at the same price as the market leader. Both these products have gotten good response and we expect the company’s LCV segment to see growth of 36% next year, driven largely by these new products.
-
30,000
60,000
90,000
120,000
150,000
180,000
210,000
240,000
FY04 FY05 FY06 FY07 FY08 FY09 FY1030%
40%
50%
60%
70%
80%
90%
Domestic volumes (< 3.5T) % in total LCV sales
-
10,000
20,000
30,000
40,000
50,000
60,000
70,000
80,000
90,000
FY04 FY05 FY06 FY07 FY08 FY09 FY1020%
22%
24%
26%
28%
30%
32%
34%
36%
38%
M&M domestic LCV volumes M&M market share
Gio and Maxximo to drive growth in LCV
space

Macquarie Research Mahindra & Mahindra
14 June 2010 8
Fig 15 Gio – First compact truck (0.5T) Fig 16 Maxximo – taking on the Ace
Source: Company data, Macquarie Research, June 2010 Source: Company data, Macquarie Research, June 2010
Three-wheelers to grow in line with industry The domestic three-wheeler market has grown at a 10% CAGR over the last six years, while M&M has been able to grow at over 20% in the same period. Thus the company has increased its market share by over 350bps in the three-wheeler market. Today M&M is the third-largest player in the domestic three-wheeler space, with market share of around 10%.
Fig 17 Driven by passenger three-wheelers Fig 18 M&M a distant third in three-wheeler space
Source: Company data, Macquarie Research, June 2010 Source: Company data, Macquarie Research, June 2010
Growth in the three-wheeler space is largely driven by the passenger segment, a CAGR of 16% over the last six years, as compared to decline of 2% in the goods segment. The decline in the goods segment was mainly due to increasing usage of low tonnage four-wheelers for last-mile transportation. Mahindra’s presence in three-wheeler space was largely in the goods segment till it launched the Alpha range of three-seater passenger vehicles in early 2008. Today around 60% of company’s three-wheeler volumes comes from the passenger space.
100,000
150,000
200,000
250,000
300,000
350,000
400,000
450,000
500,000
FY04 FY05 FY06 FY07 FY08 FY09 FY100.0%
2.0%
4.0%
6.0%
8.0%
10.0%
12.0%
14.0%
Total domestic 3 wheeler M&M Market share
Bajaj Auto Ltd40%
Mahindra & Mahindra Ltd
10%
Piaggio Vehicles Pvt
Ltd41%
Others6%
Atul Auto Ltd3%

Macquarie Research Mahindra & Mahindra
14 June 2010 9
Fig 19 New products drive growth Fig 20 Affected by decline in overall industry
Source:SIAM,MacquarieResearch,June2010 Source:SIAM,MacquarieResearch,June2010
We expect M&M’s three-wheeler business to grow in line with industry for the next couple of years. Thus strong growth in the UV and LCV businesses should drive the company’s automotive business in the medium term.
Fig 21 Automotive volume growth – new products to drive LCV growth FY09 FY10 FY11E FY12E FY13E
Utility Vehicles 108,549 152,736 175,646 198,456 222,271 % change YoY 0.9% 40.7% 15.0% 13.0% 12.0% Three-Wheelers 44,806 45,433 48,408 51,843 55,673 % change YoY 31.5% 1.4% 6.5% 7.1% 7.4% LCV 52,640 83,326 116,527 143,441 167,728 % change YoY -0.9% 58.3% 39.8% 23.1% 16.9%Source: Company data, Macquarie Research, June 2010
100,000
150,000
200,000
250,000
300,000
350,000
400,000
FY04 FY05 FY06 FY07 FY08 FY09 FY100%
1%
2%
3%
4%
5%
6%
7%
8%
9%
10%
Domestic passenger 3W M&M market share
-
20,000
40,000
60,000
80,000
100,000
120,000
140,000
160,000
180,000
FY04 FY05 FY06 FY07 FY08 FY09 FY100%
5%
10%
15%
20%
25%
30%
Domestic goods 3W M&M market share

Macquarie Research Mahindra & Mahindra
14 June 2010 10
FES to benefit from Punjab Tractor merger M&M has consolidated its leadership position in the tractor space (53% of EBIT) with the acquisition of Punjab Tractors. We expect the tractor segment to witness 13-15% p.a. growth in the coming years, supported by rising rural income and increasing agricultural credit. M&M has recently launched a new small tractor, Yuvraj, targeting the small and marginal farmers. With tractor penetration of only 1%, the segment has strong growth prospects and can provide significant upside to volume assumptions.
Mahindra’s Farm Equipment Sector is one of the world’s top tractor brands, and has been the undisputed market leader in India for 25 years (FY10 market share of 41%). It is also the only tractor company to win the Deming Application Prize and the Japan Quality Medal, two of the highest quality accolades that can be won by any organization. Mahindra Tractors has two JVs in China which manufacture tractors for the growing Chinese market, as well as export tractors to the US and other western nations.
Tractor demand supported by rising rural incomes Total Tractor sales volume reached 440k units in FY10, with domestic volumes growing at a 14% CAGR since FY04 to over 402k units in FY10. While there were fears that tractor sales could be affected by severe drought last year, we believe that tractor growth was supported by increasing financial penetration, low growth in last few years and improved farm income supported by rising minimum support prices and higher crop output for the rabi season.
Fig 22 Tractor industry grows 14% over last 5 years
Source: CRISIL, MacquarieResearch,June2010
Some of the key factors that we believe are likely to benefit tractor sales in the medium term are as follows:
Increasing production + Rising MSP = Higher rural wealth: Key wheat and paddy production has seen a steady increase over the last few years, and the government-announced Minimum Support Prices (MSP) for key crops, like paddy, wheat, sugarcane, groundnut etc, have increased at a CAGR of 11-12% from 2003-04. This has significantly contributed to rural wealth. The increase in MSP alone has been more than the increase in tractor realisations, up by ~7-8%, thus making tractor usage more affordable.
50,000
100,000
150,000
200,000
250,000
300,000
350,000
400,000
450,000
FY04 FY05 FY06 FY07 FY08 FY09 FY10-10%
-5%
0%
5%
10%
15%
20%
25%
30%
35%
Domestic tractor sales (LHS) YoY growth rate (RHS)
Increasing rural wealth to support tractor demand in
medium term

Macquarie Research Mahindra & Mahindra
14 June 2010 11
Fig 23 Steady increase in production Fig 24 Strong increase in MSP
Source:Dept of Agriculture & Cooperation, Macquarie Research,June2010 Source:Dept of Agriculture & Cooperation, Macquarie Research,June2010
Government’s rural development initiatives: Increasingly, government policy decisions have been directed at having inclusive growth, and the rural population has been a major beneficiary of various schemes. Key among these initiatives have been:
⇒ NREGS: The National Rural Employment Guarantee Scheme (NREGS) assures a minimum 100 days employment in a year at a minimum wage of INR 100. Up to 2009-10, around 29m households have benefited from the scheme and over Rs920bn have been disbursed.
⇒ Farm loan waiver: The agriculture debt waiver announced by the government in 2008 has helped bring down Non Performing Assets (NPA) levels of banks and has also provided access to valuable credit to the farming sector. Loan waiver disbursements are pegged at Rs710bn.
⇒ Increasing rural development spending under various schemes like Pradhan Mantri Gram Sadak Yojana (PMGSY), Rajiv Gandhi Grameen Viduytikaran Yojana (RGGVY), Indira Awaas Yojana (IAY), etc also have an indirect positive impact on rural income.
Fig 25 Increased spending on rural development Fig 26 NREGS increasing spending
Source: Ministry of Rural Development, Macquarie Research, June 2010
Source: Mahatma Gandhi National Rural Employment Guarantee Act, Macquarie Research, June 2010
NREGS improving feasibility for tractors: The NREGS has indirectly lead to significant increase in wage rates, even for the farming sector, as people in rural areas have better employment opportunities, thus automatically making use of tractors more economical.
40
50
60
70
80
90
100
2004 2005 2006 2007 2008 2009
in m
n to
ns
Wheat production Rice production
400
500
600
700
800
900
1,000
1,100
1,200
FY04 FY05 FY06 FY07 FY08 FY09 FY10
Paddy (MSP per quintal) Wheat (MSP per quintal)
222 240275
315
627
0.0
100.0
200.0
300.0
400.0
500.0
600.0
700.0
FY06 FY07 FY08 FY09 FY10
in R
s. b
n
110143
120
160
391
0
50
100
150
200
250
300
350
400
FY06 FY07 FY08 FY09 FY10
Rs.
bn
NREGS spending (Rsbn)
Government’s rural schemes adding
significantly to rural employment and
income levels

Macquarie Research Mahindra & Mahindra
14 June 2010 12
Increased disbursals by banks for rural credit: Governments emphasis on increasing bank credit through priority-sector lending has played a crucial role in boosting tractor demand, as around 75-80% of tractors are financed. Disbursement to agriculture by banks has increased at a CAGR of over 20% since 2004 and is targeted to reach Rs3,250bn for 2010. Agriculture credit usage for farm mechanisation has been increasing steadily over the years thus improving farmer’s ability to buy tractors. While financing norms were made more stringent over the last few years due to increasing NPAs, norms have been relaxed and rates have been reduced by banks in early FY10.
Fig 27 Increasing agriculture credit supports tractor demand
Source: Reserve Bank of India, Macquarie Research, June 2010
Increasing spend on irrigation: Indian agriculture is still dependant on the monsoon due to low irrigation facilities. Irrigation intensity is estimated to be below 50%. Availability of irrigation facilities is a key driver for tractor demand, as it ensures water supply for harvesting and thereby income. Through the various five-year plans, the government has tried to expand irrigation facilities, along with consolidating existing systems, for increasing the production of food grains. This in turn should lead to greater demand for tractors.
Fig 28 Cumulative irrigation potential utilised Fig 29 Increasing irrigation spending by state & centre
Source: Ministry of Water, Macquarie Research, June 2010 Source: CRISIL, Macquarie Research, June 2010
Use of tractors for commercial activities: In rural areas, tractors are increasingly being utilized in many activities other than farming, including the transport of materials and passengers over short distances, construction activities, to ferrying water tankers etc. Further, with labour costs rising, even farmers that traditionally hired labour rent tractors for a certain period of time. All these factors have helped to increase hourly tractor rentals by 20-25% in the past two years and the number of days a tractor can be employed during offseason periods has increased substantially, thus leading to higher tractor demand.
500
1000
1500
2000
2500
3000
3500
FY05 FY06 FY07 FY08 FY09 FY10 target
Total agriculture disbursements by banks (Rsbn)
58.8
68.6
77.280.1
83.6
99.6
40
50
60
70
80
90
100
110
VIth Plan(1980-85)
VIIth Plan VIIIth Plan IXth Plan Xth Plan XIthPlan(2007-
12)
m h
ecta
res
187
248255 251
275
359
150
200
250
300
350
FY04 FY05 FY06 FY07 FY08 FY09
Rs
bn
Increasing bank financing
supporting tractor growth in near term
Increasing irrigation a key positive for long term tractor
demand

Macquarie Research Mahindra & Mahindra
14 June 2010 13
Infrastructure investments & allied activities aiding rural income: Lastly, increasing investments being made by governments, companies and co-operative societies in improving rural infrastructure, storage etc have lead to better realisation and lowered overall wastage of agriculture produce. Rural wealth has also increased due to income from other occupations like horticulture, poultry, fish farming, floriculture etc.
We believe that all of the above factors will have a positive impact on farmers’ income in the medium to long term. Given the normal monsoon expected in the current year, the tractor industry should see strong growth of ~12-14% in the current fiscal.
New products to drive growth, targeting bottom of pyramid M&M has refurbished its entire range of tractors in the last year and has launched few key models in the domestic and international areas which should support growth in the tractor segment. Key amongst these are:
Yuvraj 215 – targeting farmers with small land holdings
Swaraj 843 – High HP tractors
Export market – compact tractors and high HP tractors
The Yuvraj 215, which has haulage capacity of 1.5tons, is specially designed for farmers with small land holdings. Through this product, M&M is looking to expand the tractor market at the bottom end of the pyramid. It is expected to cater to the demand from small and marginal farmers suffering from a lack of financing options and affordable products and looking to upgrade from power tillers and bullocks. According to a study by the NSSO, small (2.5-5 acres of land) and marginal farmers (<2.5 acres of land) account for 82% of the 82m farm households in India.
Fig 30 Yuvraj–targeting bottom of pyramid
Source: Company data, Macquarie Research, June 2010
M&M is currently test marketing the tractor in small numbers in Gujarat and then plans to sell it across the country in 16-18 months. We believe that this product could lead to strong volume growth in the medium term, as overall tractor penetration in this segment is only ~1%.
Competitive intensity declining, M&M to benefit from PTL acquisition The tractor industry has seen a couple of acquisitions in the last few years, reducing the competitive intensity. M&M has taken over Punjab Tractors (PTL), whilst TAFE has acquired Eicher Motors. Competition is unlikely to increase in the medium term as no major player is expected to enter the space. Also, the impact of foreign players has been fairly limited, as they lack strong products in the lower-horse-power segments that dominate India’s tractor market.
82 m farm households
Small Farmers 2.5-5 acres-19%
Marginal Farmers
<2.5 acres-63%
Large Farmers
>20 acres -1%
Medium Farmers
5-20 acres-17%
38%
18%
1%
Yuvraj – targeting bottom of pyramid,
huge growth option if successful

Macquarie Research Mahindra & Mahindra
14 June 2010 14
Fig 31 Market share in FY05 Fig 32 Lower competitive intensity in FY10
Source: CMIE, Macquarie Research, June 2010 Source: CMIE, Macquarie Research, June 2010
PTL acquisition benefits M&M significantly
M&M acquired Punjab Tractors (PTL) in 2007 by buying out 43% stake from the Actis group and the Burman family for around Rs10bn, later merging the company with its farm equipment division in August 2008. PTL sold its products under the Swaraj brand, which had good a reputation in market and M&M also added products in the 50HP+ category through this acquisition. M&M has improved its market share position post acquisition of Punjab Tractors and currently dominates the domestic tractors market, with ~41% market share. It commands over 50% market share in the South and East markets and enjoys a strong position in West and North India, with respective market shares of 42% and 36%. Further, the company also improved its position in the largest 31-40HP category.
Fig 33 Regional domestic tractor sales (FY10) Fig 34 M&M (incl PTL) regional market share
Source: Crisil, Company data, Macquarie Research, June 2010 Source: Crisil, Company data, Macquarie Research, June 2010
M&M26%
TAFE20%
Escorts13%
Punjab Tractors
12%
International Tractors
11%
Eicher Motors8%
Others10%
M&M & Punjab Tractors
41%
TAFE & Eicher22%
Escorts12%
International Tractors
9%
John Deere8%
Others8%
North43%
East14%
West25%
South18%
31%
41% 41%
48%
36%
51%
42%
51%
0%
10%
20%
30%
40%
50%
60%
North East West South
FY08 FY10
Relatively low competitive
intensity and PTL acquisition to
benefit Tractor division

Macquarie Research Mahindra & Mahindra
14 June 2010 15
Fig 35 Lower HP dominates domestic market (FY10) Fig 36 M&M (incl PTL) HP segment market share
Source: CMIE, Company data, Macquarie Research, June 2010 Source: CMIE, Company data, Macquarie Research, June 2010
Thus the PTL acquisition has strengthened M&M’s position in the key North Indian market, as well as in the lower HP market, where it was weak. The PTL manufacturing plants and foundry facility had lower utilisation, which should help M&M to improve its cost structure. M&M is also looking at dealer and vendor rationalisations, which should improve overall tractor business profitability in the medium term
Up to 30 HP17%
31 - 40 HP51%
41- 50 HP22%
51 HP and above10%
39% 41%
28%
58%
48%44%
28%
56%
0%
10%
20%
30%
40%
50%
60%
Up to 30 HP 31-40 HP 41-50 HP 51 HP & above
FY08 FY10

Macquarie Research Mahindra & Mahindra
14 June 2010 16
New initiatives to add value in medium term M&M has entered into new business areas like Medium and Heavy Commercial Vehicles (M&HCV), two-wheelers, aerospace, etc and has enhanced its presence in defence and auto ancillaries, all of which could add significant value in the medium term. The company has also recently inaugurated a new plant at Chakan which should take care of company’s expansion plans in the automotive business for the next 5 to 7 years.
M&HCV – strong growth prospects in medium term In 2005, M&M and International Truck and Engine Corporation — the operating company of Navistar Inc (NAV US; $53.15; not rated) — entered into a JV to manufacture light, medium and heavy commercial vehicles for India as well as export markets. The joint venture aims to be present in every segment of the commercial vehicle market, from 3.5 tonne Gross Vehicle Weight (GVW) to 49 tonne GVW, with variants of passenger transport, cargo and specialized load applications. These products will be manufactured at M&M’s new Chakan plant, which has initial annual production capacity of 50,000 medium and heavy commercial Vehicles. M&M has a 51% stake in two JV’s, Mahindra Navistar Automotives Ltd and Mahindra Navistar Engines Ltd.
Gradual roll out of product range
M&M Navistar has so far displayed different products in the 25T, 31T, 40T and 49T segments. The company plans to introduce its entire product range in the next couple of years as follows:
Commercial launch of 25T is expected by June 2010 followed by 31T.
40 & 49T products by end of the current fiscal year.
Lower tonnage vehicles will be launched in due course of time from FY12
Thus by FY13 the company plans to have all products in the market right from 9T to 49T in both the trucks and bus segments and to emerge as a full-range commercial vehicle player.
Building distribution network, increasing localisation
The company is setting up an alternative distribution network for the truck venture, after having added ~100 new dealers. It may also look at its existing dealerships in rural/semi-urban areas as points of servicing for its trucks. M&M is also ensuring that designing of the CV product range is done to fulfil the requirements specific to Indian business, with the technological support of Navistar. Further the company aims to have high localisation levels so as to ensure that pricing remains competitive.
Strong growth prospects in medium term
We believe that it will be challenging for M&M to make inroads into the Rs350bn Indian CV space which is currently a virtual duopoly. However with strong economic growth and government’s focus on road development, the space provides strong medium-to-long-term-growth opportunities for M&M. Having a strong technical partner, good understanding of local markets, wide distribution and service networks, and ensuring products meet local needs and aim for high levels of localisation should aid the company’s efforts to gain respectable market share in the CV space in the next 3-5 years.
Mahindra two-wheeler – entry through acquisition of Kinetic M&M entered the Indian two-wheeler market by acquiring the business assets of Kinetic Motor for Rs1.1bn in July 2008. M&M holds an 80% stake in the new company – Mahindra Kinetic Scooters and Motorcycles Ltd, with Kinetic accounting for the remaining 20%. The company has state-of-the-art manufacturing facility at Pithampur, Madhya Pradesh, with a capacity to assemble 500-600k units p.a. on a three-shift basis. Taiwan’s Sanyang Industry Company Limited (SYM) Sanyang Industry Co Ltd (2206 TT, Not Rated) is a technical partner in the alliance. M&M has also recently acquired Engines Engineering, Italy, specialised in designing two-wheelers.
Strong partner, local understanding
should help gain a footing in M&HCV
space
Turnaround in scooter business
post takeover, motorcycle next
target

Macquarie Research Mahindra & Mahindra
14 June 2010 17
Improved market share post new launches in last year
Fig 37 M&M - improving market share in scooter space
Source: SIAM, Macquarie Research, June 2010
Mahindra Two-Wheelers is currently present in scooters segment and has already launched three 125cc scooters since acquisition.
Mahindra Rodeo – specifically for males
Mahindra Duro – targeting the entire family
Mahindra Flyte – specifically for women commuters
Post acquisition and launch of new products, M&M has been able to steadily improve volumes for the scooter business. M&M’s total scooter sales for FY10 stood at over 70k units, more than double of what Kinetic was able to sell in FY08 prior to acquisition. The company’s market share now stands at ~6% in the domestic scooter segment.
Management expects strong growth in coming years
M&M targets double-digit growth for the two-wheeler business for the next couple of years. The company also plans to enter the motorcycle space in the current fiscal year. We expect M&M to take time to find its foothold in the two-wheeler space, especially faced with challenges from well-entrenched players like Hero Honda (HH IN, Rs2013, UP, TP: Rs1630) and Bajaj Auto (BJAUT IN, Rs2284, UP, TP:Rs1850). However, given M&M’s track record of new launches, good understanding of local market in particular rural markets and strong distribution and service networks, the returns on its small investments may be substantial over the medium term.
Renewed focus on defence Mahindra Defence Systems provides total solutions for the entire range of light combat / armoured vehicles and their derivatives for defence and security forces. It also addresses specific segments of the Government's import-substitution programmes like small arms and sea mines. Mahindra’s defence business is targeting revenue of Rs20bn in five years from Rs1 bn currently, which we believe is achievable given India’s huge defence spending. India’s total defence allocation currently standing at ~US$30bn and there is a separate allocation for Para-military and police forces thus providing a huge market. Further, the current offset clause, which mandates 30% of the overall expenditure in defence sector from a foreign company to be sourced from Indian companies, itself provides around US$10bn market over the next five years.
JV’s and new plant to support growth in defence
In March 2009, M&M inaugurated a defence-vehicle manufacturing plant in Haryana’s Prithla region. The Rs400m facility is expected to roll out 200 vehicles in a year’s time. In Nov 2009, M&M (74% stake) entered into a JV with BAE Systems (UK) (BAE LN; not rated; 321p) to focus on the manufacture of up-armoured light vehicles, specialist military vehicles, mine protected vehicles, artillery systems and other selected land system weapons and the upgrades. The JV is focusing on the India’s artillery system requirement which currently is ~US$4bn.
0
2,000
4,000
6,000
8,000
10,000
12,000
14,000
Apr-09 May-09
Jun-09 Jul-09 Aug-09
Sep-09
Oct-09 Nov-09
Dec-09
Jan-10 Feb-10
Mar-10
Apr-100.0%1.0%2.0%3.0%4.0%5.0%6.0%7.0%8.0%9.0%
M&M domestic scooter sales (LHS) scooter market share (RHS)
Defence – a solid growth opportunity
in next 4-5 years

Macquarie Research Mahindra & Mahindra
14 June 2010 18
Entered aerospace, boat manufacturing and electric vehicle space Mahindra Odyssea
M&M entered the fibreglass power boat and catamaran industry through its product offering Mahindra Odyssea in 2009. In Feb 2009, Mahindra Odyssea unveiled its 22-foot and 33-foot fibreglass power boats at the Mumbai International Boat Show. Initially the company is targeting custom-designed fibreglass power boats ranging 20-40 feet and then expand into cabin cruisers and catamarans in the future. Mahindra Odyssea’s products are expected to attract the paramilitary and defence forces.
Mahindra Reva
M&M recently acquired a controlling stake in electric car manufacturer Reva and established Mahindra Reva Electric Vehicle Company. M&M will own 55.2% equity in Mahindra Reva by a combination of equity purchase from the promoters and a fresh equity infusion of over Rs450m into the company. Currently, Reva sells electric cars in 24 countries and has around 3500 vehicle on the road. A new manufacturing facility at Bangalore has expanded company’s production capacity from 6,000 to 30,000 vehicles.
Leveraging Reva’s technology for UV products in medium term
M&M will look to utilising REVA's technology for its products, including UVs, three-wheelers and mini-trucks. Further, M&M’s distribution network will be used to market REVA's products across the globe. This is a small investment from M&M’s overall perspective, but it gives the company a good start in the electric vehicle field, as REVA is a proven leader; in the medium term the company can benefit from leveraging REVA’s technology. The long -erm potential of electric vehicles can be big, and M&M expects the electric car market in India to grow to 80,000 cars by 2020, with Mahindra Reva accounting for at least 20,000.
Chakan to meet capacity needs for the medium term In March 2010, M&M inaugurated its new auto manufacturing plant in the industrial hub of Chakan in Maharashtra. Set up with a phased investment of over Rs40bn, the plant is spread across 700 acres. The plant’s initial capacity is slated at 300k vehicles p.a, 50k units of M&HCV and 250k for the rest of yhe automotive division, and it can be scaled up further to meet future growth. Thus Mahindra Chakan will manufacture Mahindra’s entire range of automotive products, from the 0.75-tonne Maxximo to the 49-tonne Mahindra Navistar truck. The company’s new SUV and Pik-Up range and product line for the US market will also be manufactured at this facility. These investments should help M&M meet all their automotive capacity needs for the next 5-6 years. Also such investments at one single location would provide flexibility to the company to manage production of its various new products and also provide benefits from economies of scale.
Huge investment in new capacities to
meet forecasted growth for next 3-5
years

Macquarie Research Mahindra & Mahindra
14 June 2010 19
Solid earnings growth for coming years We estimate the company’s earnings to grow at CAGR of 13% over the next three years, backed by volume growth of 15% but seeing a minor decline in margins. We are 5-7% ahead of consensus earnings estimates, mainly on account of higher volume assumptions.
Fig 38 Ahead of consensus driven by higher volume growth Net sales Net Profit FY11E FY12E FY11E FY12E
Macquarie 223,111 258,176 23,661 26,330 Consensus 215,433 247,573 22,051 24,977 Difference 3.6% 4.3% 7.3% 5.4%Source: Bloomberg, Macquarie Research, June 2010
Volume growth to be supported by new products We expect M&M volume to grow by 15% over the next three years. We estimate the utility and tractor segments to witness sales growth of ~11-15%, in-line with industry growth rates. The three-wheeler segment is expected to see lower growth as there is a shift to more robust lo- tonnage four-wheelers in the goods segment. With two key new product launches (Gio and Maxximo), we estimate the LCV segment will show solid growth of over 25%. Better-than-expected response to these products and acceptance of the Scorpio pick-up in the US market could be a big driver to our overall volume growth assumptions.
Fig 39 Volume growth across segments FY09 FY10 FY11E FY12E FY13E Macquarie comments
Utility Vehicles 108,549 152,736 175,646 198,456 222,271 In-line with industry % change YoY 0.9% 40.7% 15.0% 13.0% 12.0% Three-wheelers 44,806 45,433 48,408 51,843 55,673 Growth largely from passenger segment % change YoY 31.5% 1.4% 6.5% 7.1% 7.4% LCV 52,640 83,326 116,527 143,441 167,728 New products to drive growth % change YoY -0.9% 58.3% 39.8% 23.1% 16.9% Tractors 119,951 176,328 202,777 229,138 256,635 Growth largely in-line with industry % change YoY 21.3% 47.0% 15.0% 13.0% 12.0% Source: Company data, Macquarie Research, June 2010
Margins to decline due to rising RM costs, earnings growth robust We expect increasing prices of key raw materials like steel, aluminium and tyres to negatively impact margins in the coming fiscal year. However with strong growth in volumes, we expect some of the impact to be negated by the positive effect of operating leverage. Further, with a strong product portfolio in both the UV and tractor space and relatively subdued competition, we believe that some of the cost hikes will be passed on to consumers. Thus, overall we expect operating margins to go down by ~50-60bps in FY11. The impact could be larger if RBI becomes aggressive in tightening interest rates, as this may limit company’s capacity to increase prices. Further, taking into account the increased depreciation on account of the ramp-up of new Chakan plant, we expect overall earnings to grow by ~14% over the next three years.

Macquarie Research Mahindra & Mahindra
14 June 2010 20
Fig 40 Margin to decline incrementally Fig 41 Increasing depreciation, robust earnings
Source: Company data, Macquarie Research, June 2010 Source: Company data, Macquarie Research, June 2010
Robust balance sheet, comfortable cash flows despite huge capex M&M has planned huge capital expenditure of Rs70bn over the next three years (including investments in JVs and subsidiaries). Most of this will be on new plant at Chakan and new product developments. Despite this huge capex spending, we do not see any issue with the cash-flow situation, as the standalone business generates around Rs20-25bn of operating cash flows on annual basis and the company has over Rs17bn in cash and liquid investments. Further, the company’s total debt-to-equity ratio stands at very comfortable 0.4:1, and thus even if there is any significant decline in operating cash flows, the company can easily manage its investments through some additional debt.
Fig 42 Huge capex spending over next three years Fig 43 Strong cash flow despite huge capex
Source: Company data, Macquarie Research, June 2010 Source: Company data, Macquarie Research, June 2010
4,000
10,000
16,000
22,000
28,000
34,000
40,000
46,000
52,000
FY09 FY10 FY11E FY12E FY13E12.0
12.5
13.0
13.5
14.0
14.5
15.0
15.5
16.0
16.5
EBITDA (Rsm) (LHS) EBITDA margin (%) (RHS)
-
5,000
10,000
15,000
20,000
25,000
30,000
35,000
FY09 FY10 FY11E FY12E FY13E1,000
2,000
3,000
4,000
5,000
6,000
7,000
PAT Rsm (LHS) Depreciation Rsm (RHS)
-
5,000
10,000
15,000
20,000
25,000
FY09 FY10 FY11E FY12E FY13E
Capex and investments in JV's (Rsm)
(6,000)
(4,000)
(2,000)
-
2,000
4,000
6,000
8,000
10,000
12,000
FY09 FY10 FY11E FY12E FY13E(0.40)
(0.20)
-
0.20
0.40
0.60
0.80
1.00
FCF (Rsm) (LHS) Net Debt:Equity (RHS)

Macquarie Research Mahindra & Mahindra
14 June 2010 21
Condensed Financial statements
Fig 44 Condensed Profit and loss account (Rs m) Yearto31March FY09 FY10 FY11E FY12E FY13E Macquarie comments
Net sales 131,260 186,041 223,111 258,176 293,208 Supported by strong volume growth and minor increase in realisation
% change YoY 13.9% 41.7% 19.9% 15.7% 13.6% Raw Material expenses 92,742 123,360 150,448 175,308 199,699 Rising prices of steel, aluminium and tyres % of net sales 70.7% 66.3% 67.4% 67.9% 68.1% Manufacturing & other expenses 17,773 21,818 25,381 28,812 32,370 To benefit from higher volumes % of net sales 13.5% 11.7% 11.4% 11.2% 11.0% Total operating costs 120,334 156,466 188,795 218,862 248,665 % of net sales 91.7% 84.1% 84.6% 84.8% 84.8% EBITDA 10,926 29,575 34,316 39,314 44,543 Margins to decline by 60-80bps mainly
on account of rising RM prices Less: Interest 1,341 1,542 1,375 1,350 1,350 Add: Other Income 3,592 3,249 3,578 3,241 3,360 Less: Depreciation 2,915 3,706 4,544 5,623 6,695 Depreciation to increase with ramp up at
new Chakan plant Add: Exceptional Items 410 908 - - - Pre tax profit 10,672 28,484 31,975 35,581 39,858 Less: Tax 1,997 7,591 8,313 9,251 10,363 Net Profit 8,342 20,227 23,661 26,330 29,495 Earnings to grow by ~13% over next 3
years EPS (Rs.) 29.88 35.74 41.81 46.53 52.12 Source: Company data, Macquarie Research, June 2010
Fig 45 Condensed Balance Sheet (Rs m) Yearto31March FY09 FY10 FY11E FY12E FY13E Macquarie comments
Shareholders’ Equity 52,621 78,262 94,626 113,161 134,363 Secured & Unsecured Loans 40,528 28,802 28,802 28,802 28,802 Comfortable debt:Equity of 0.4:1, to decline
further Deferred Tax Liability - 2,403 2,403 2,403 2,403 Accounts Payable 33,368 32,879 38,794 44,972 47,689 Provisions 12,776 17,965 18,960 19,458 19,955 Total Current Liabilities 47,978 51,992 59,017 65,819 69,173 Total Liabilities 93,148 109,467 125,831 144,366 165,568 Net Fixed Assets 32,143 36,937 49,393 58,770 65,075 Chakan project to add significantly in
coming years Investments 57,864 63,980 72,480 80,980 88,980 Significant liquid investments Inventories 10,607 11,838 17,691 20,263 22,806 Strong control on inventories Accounts Receivables 10,437 12,433 16,493 19,110 21,712 Cash & Bank Balances 15,744 17,525 8,243 9,616 14,818 Solid cash balance despite Rs70bn of
capex and investment in JV over next 3 years
Total Current Assets 50,810 60,318 62,750 70,210 80,462 Total Assets 93,148 109,467 125,831 144,366 165,568 Source: Company data, Macquarie Research, June 2010

Macquarie Research Mahindra & Mahindra
14 June 2010 22
Fig 46 Condensed Cash Flow (Rs m) Yearto31March FY09 FY10 FY11E FY12E FY13E Macquarie comments
Cash Flow from Operating Activities Net Profit before Tax 10,262 28,484 31,975 35,581 39,858 Solid auto and tractor business Depreciation 2,915 3,706 4,544 5,623 6,695 Total Working Capital changes 5,918 (8,215) (5,800) 90 (2,332) Good working capital management Direct taxes paid 1,003 6,644 8,313 9,251 10,363 Net cash from operating activities 16,313 19,025 21,027 31,210 32,961 Strong operating cash flows Cash Flow from Investing Activities Purchase of Fixed Assets (Capex) (9,297) (8,500) (17,000) (15,000) (13,000) Huge capex on new capacities and
product development Purchase of Investments (171,186) (6,116) (8,500) (8,500) (8,000) Investments mainly in new JV’s/
business like M&HCV, two-wheeler etcSale of Investments 161,957 - - - - Net cash used in investing activities (19,410) (11,904) (22,632) (21,190) (18,615) 4,408 (4,473) 7,710 11,961 Cash Flow from Financing Activities Dividends paid (3,203) (3,121) (6,302) (7,297) (7,795) Rewarding shareholders through
increased dividends Interest paid (952) (1,542) (1,375) (1,350) (1,350) Net cash used in financing activities 6,969 (5,339) (7,677) (8,647) (9,145) Cash and Cash Equivalents at Beginning of the year
11,746 15,744 17,525 8,243 9,616
Net Increase/(Decrease) in Cash 3,872 1,781 (9,282) 1,373 5,201 Cash and Cash Equivalents at End of the year
15,744 17,525 8,243 9,616 14,818 Pretty comfortable on cash flow situation despite high capex
Source: Company data, Macquarie Research, June 2010
Fig 47 Key Ratios (%) FY09 FY10 FY11E FY12E FY13E Macquarie comments
Growth Revenue 13.9 41.7 19.9 15.7 13.6 Strong growth supported by new productsEBITDA (20.0) 170.7 16.0 14.6 13.3 Margins to decline mainly on account of
rising raw material prices PBT (23.9) 166.9 12.3 11.3 12.0 Net income (13.5) 142.5 17.0 11.3 12.0 Margins EBITDA Margin 8.3 15.9 15.4 15.2 15.2 Operating margins to decline on account of
rising raw material prices EBIT Margin (incl. other income) 8.8 15.7 14.9 14.3 14.1 Pre-tax Margin 8.1 15.3 14.3 13.8 13.6 Tax rate 18.7 26.7 26.0 26.0 26.0 No major change in effective tax rate Net Margin 6.4 10.9 10.6 10.2 10.1 Return Ratios RoNW 15.9 25.8 25.0 23.3 22.0 Solid returns to shareholders from core
business RoCE 12.5 27.2 27.0 26.0 25.3 Source: Company data, Macquarie Research, June 2010

Macquarie Research Mahindra & Mahindra
14 June 2010 23
Valuation – trading attractively Ex-subsidiaries, stock at attractive valuation Excluding valuation of listed subsidiaries (at 20% discount) M&M currently trades at 11.3x FY11E and 10.2x FY12E core EPS. This is at significant ~28% discount to other auto names and one of the least expensive stocks in the Indian auto space coverage universe. This sharp discount in valuation we believe is not justifiable.
Fig 48 Trading cheap ex-listed subsidiaries
Company name Market cap (Rs m) M&M stake (Rs m)
M&M value / share post 20% discount
(Rs)
Tech Mahindra 90,594 39,445 53 M&M Financial services 45,350 27,257 37 Mahindra Forgings 8,786 4,453 6 Mahindra Lifespace Developers 17,014 8,686 12 Mahindra Holiday & resorts 42,233 35,091 47 Mahindra Ugine steel 1,912 969 1 Swaraj Engines 4,099 1,362 2 Total value 157 M&M share price (Rs) 607 Contribution of subsidiaries 26% Net value for standalone auto business 450 Core standalone EPS FY11E 39.7 11.3 Core standalone EPS FY12E 44.2 10.2 Core standalone EPS FY13E 49.5 9.1 Source: Bloomberg, Company data, Macquarie Research, June 2010, (prices as of 11 June)
There are no directly comparable companies with a presence in both the auto and tractor segments; thus, we have taken the entire group of large-cap Indian auto names and also regional players in UV, M&HCV and tractor spaces for comparison. We see that M&M appears very attractively valued not only with respect to Indian auto companies, but also compared to auto companies from China, Korea and Japan,.
Fig 49 One of cheapest Indian auto stock, attractive on regional basis also Market cap PER EV/EBITDA RoE Company Name (US$m) Year ending FY10 FY11E FY12E FY10 FY11E FY12E FY10 FY11E FY12E
M&M 7,073 March 17.9 15.3 13.7 11.5 10.2 8.8 25.8 25.0 23.3 M&M (ex listed subsidiaries)
4623 March 12.1 10.3 9.3 6.3 5.7 4.9 25.0 24.1 21.9
Tata Motors 8,735 March 39.5 14.2 9.8 10.1 7.4 6.0 13.6 28.0 30.9 Ashok Leyland 1,729 March 19.6 15.2 12.7 12.6 10.2 8.8 11.9 14.5 15.9 Maruti Suzuki 7,860 March 15.6 13.7 12.1 10.2 9.3 8.1 23.8 22.0 20.5 Bajaj Auto 6,791 March 19.4 17.0 16.2 12.9 11.7 10.7 58.0 47.0 38.0 Hero Honda 8,442 March 18.0 17.2 16.6 13.3 12.8 11.8 59.5 53.5 41.0 Mazda Motor 4,360 March NA 24.3 10.8 8.6 6.6 5.6 - 1.0 3.3 6.5 Isuzu Motors 5,468 March 62.3 18.3 12.5 15.2 8.2 7.0 2.7 9.2 12.2 Nissan Motors 31,828 March 39.2 13.0 9.2 8.2 7.5 6.6 2.6 6.9 9.2 SAIC 15,463 December 11.1 9.6 8.2 11.0 9.8 7.0 19.9 20.4 20.1 Dongfeng 9,541 December 8.9 7.9 7.3 4.6 4.0 3.6 23.2 21.6 19.3 FAW Car 3,973 December 12.7 10.7 9.1 7.2 6.4 5.6 23.1 23.6 22.9 Jiangling Motors 2,051 December 12.0 10.3 8.6 5.5 5.0 4.3 22.9 22.6 22.3 Hyundai Motor 25,800 December 10.4 9.6 8.9 6.3 6.0 5.7 16.2 15.1 14.0 KIA Motors 10,027 December 8.0 7.4 6.8 7.2 6.8 6.6 20.1 18.7 17.0 Source: Bloomberg, Macquarie Research, June 2010 (prices as of 11 June)
The company also appears to trade very favourably on one-year forward PER basis, given robust growth in earnings and its very sound balance sheet and cash flow.
Trading very attractively in
comparison to domestic auto
companies as well as regional players
Trading very attractively in
comparison to domestic auto
companies as well as regional players

Macquarie Research Mahindra & Mahindra
14 June 2010 24
Fig 50 M&M stands out on earnings growth and relative valuation
Source: Bloomberg, Macquarie Research, June 2010
Fig 51 Trading around historical average – rolling forward PER
Source: Bloomberg, Macquarie Research, June 2010
Value on SOTP basis – 22%potential upside We value M&M based on Sum of the parts (SOTP) methodology and arrive at target price of Rs740, implying 22% upside from current levels. We ascribe a PER multiple of 14x to standalone core earnings (excluding dividend from subsidiaries), in-line with the sector average and valuing the core auto business at Rs583 per share. We value the listed subsidiaries at a 20% discount to existing market cap, in-line with our methodology for other auto names.
Maruti Suzuki
Bajaj AutoHero Honda
M&M
Dongfeng
FAW
Hyundai KIA
SAIC
Tata MotorsJiangling
4%
6%
8%
10%
12%
14%
16%
18%
20%
6 8 10 12 14 16 18 20 22
One year forward PER (x)
FY11
E EP
S gr
owth
-4.0
1.0x
6.0x
11.0x
16.0x
21.0x
26.0x
Apr-0
5
Aug
-05
Dec
-05
Apr-0
6
Aug
-06
Dec
-06
Apr-0
7
Aug
-07
Dec
-07
Apr-0
8
Aug
-08
Dec
-08
Apr-0
9
Aug
-09
Dec
-09
Apr-1
0M&M share price Average PER
SOTP based target price of Rs740 –
implying 22% upside

Macquarie Research Mahindra & Mahindra
14 June 2010 25
Fig 52 SOTP based target price
Company name M&M stakeMarket cap
(Rsm) M&M stake
(Rsm)
M&M value / share post 20%
discount (Rs)
Tech Mahindra 43.5% 90,594 39,445 53 M&M Financial services 60.1% 45,350 27,257 37 Mahindra Forgings 50.7% 8,786 4,453 6 Mahindra Lifespace Developers 51.1% 17,014 8,686 12 Mahindra Holiday & resorts 83.1% 42,233 35,091 47 Mahindra Ugine steel 50.7% 1,912 969 1 Swaraj Engines 33.2% 4,099 1,362 2 Total value 157 Standalone business FY12E Core EPS 42PER Multiple (x) 14Core auto business value (Rs) 583 Target price 740Source: Bloomberg, Macquarie Research, June 2010, (prices as of 11 June)
We also calculate standalone business value through DCF basis and we arrive at a value of Rs551 per share based on 3.5% terminal growth rate and a WACC of 12.4%.
Fig 53 Assumptions for DCF Effective tax rate (Te) 27% CAPM cost of equity (Ke) 14.3%Pre tax cost of debt (r*) 9.0% Debt/(debt+equity) proportion (D/EV) 25.0%Market risk premium (Em) 6.0% Equity/(debt + equity) proportion (E/EV) 75.0%Risk-free rate (Rf) 8.0% Terminal growth rate (g) 3.5%Beta 1.05 WACC (r) = 12.4%Source: Company data, Macquarie Research, June 2010
Fig 54 DCF value Particulars RsmNPVFCF 123,663.6
PV OF TV 184,234.1 PV of (FCF+ TV) 307,897.7 Net Debt (12,775.7)Total Value 320,673.4 Shares Outstanding 582.0 Per share price 550.99 Source: Company data, Macquarie Research, June 2010
Sensitivity analysis
Fig 55 Sensitivity to holding company discount and standalone business multiple Standalone business multiple
13.0 13.5 14.0 14.5 15.0
Hol
ding
co
mpa
ny
disc
ount
(%
)
30% 679 700 721 742 763 25% 689 710 731 752 773 20% 698 719 740 761 782 15% 708 729 750 771 792 10% 717 738 759 780 801
Source: Company data, Macquarie Research, June 2010

Macquarie Research Mahindra & Mahindra
14 June 2010 26
Key risks and catalysts Key risks Increase in taxes on diesel vehicles: The Kirit Parikh committee report on oil sector
reforms has suggested an excise duty of Rs 80,000 on diesel vehicles. If implemented, the recommendation is expected to adversely affect M&M as it would lead to higher costs of diesel-based products and hence impact demand for same. However, the probability of the committee recommendation being carried out in its current form is low, with the industry players opposing it and putting their suggestions through the industry forum to the government for consideration.
Significant jump in raw material prices: An increase in the prices of key raw materials like steel and aluminium would lead to decline in margins and profitability. However with a leadership position in key segments and a strong product portfolio, M&M should be able to pass on most of the rise in prices on to customers and thus reduce the impact on margins.
Faster than expected hardening of interest rates: An increase in interest rates would negatively impact M&M’s sales, since around 70-80% of the tractor and UV sales by the company are purchased via the financing option. Further, this can also limit the company’s ability to increase prices to offset rising raw material prices. However, our economists expect a gradual increase in interest rates, which can be absorbed.
Lower demand due to less than normal monsoon: M&M tractor sales and also sales of key products like Bolero in the automotive division can be affected if the monsoon is less than normal or its distribution affects rural income. While the Indian meteorological department has forecasted a normal monsoon, two continuous years of drought can severely impact rural spending.
Managing diverse business: M&M is well-diversified and is entering new businesses and markets, like M&HCV, two-wheelers and the US. This clearly adds to the complexity of the business and requires strong systems and management band-width. Though the company has so far been able to manage its operations well, a stretch in management band-width remains a risk.
Key catalysts Stronger-than-expected sales in the domestic market: A widening in the direct tax
slabs in India would lead to an increase in disposable income for consumers and might result in higher UV sales. Similarly, a bumper crop or acceptance of the new tractor targeted at the bottom of the pyramid can lead to stronger-than-expected growth in the tractor space.
New LCV products garnering significant market share: With the launch of Gio and Maxximo, M&M has entry into the fast-growing low-tonnage LCV segment. If the company manages to take away around 15-20% market share from the lone player in the segment, it can meaningfully add to overall volumes for the company.
Positive response from the US market: M&M is looking to launch the Scorpio pick up in the US by the end of 2010. The company has already tied up with a US distributor having alliances with around 300 dealers. A positive response from the 4.5m US light truck market will pave the way for an increase in revenue from international operations.
.

Macquarie Research Mahindra & Mahindra
14 June 2010 27
Appendix I: Tech Mahindra Crown gems Tech Mahindra, the ~44% owned IT services subsidiary of M&M, is one of the leading IT services outsourcing firms in India (amongst top 10 IT companies by market cap). It provides Telecom IT Services and Solutions to global communications industry, with a presence across the telecom value chain and operates through 16 regional offices and 11 delivery centres. The company, with a talent pool of ~30,000, has a long history of serving major global telecom service providers, with BT Group (BT/A LN, £1.32, Underperform, TP: £1.10, Guy Peddy) as the key customer. Although dependence on BT for business has reduced over the years (from 64.1% in FY07 to 48.2% in FY10), top ten clients still contribute ~82.3% of the revenue in FY10. We believe that, with continued focus on diversification, the share of non-BT revenue would continue to rise in the coming years.
Fig 56 Tech Mahindra –robust revenue & PAT growth Fig 57 Sales diversification –Non-BT growing faster
Source: Company data, Macquarie Research, June 2010 Source: Company data, Macquarie Research, June 2010
Fig 58 Impressive client ramp-up Fig 59 BT skews geographical sales mix to Europe
Source: Company data, Macquarie Research, June 2010 Source: Company data, Macquarie Research, June 2010
As growing competition impacts profitability, telcos are more inclined towards reduction in time to market and shifting focus from managing services to offering value-added services. This, in turn, is encouraging outsourcing of telecom services and is likely to benefit Tech Mahindra over the medium and long term due to their long-term growth strategy and unique delivery capabilities.
280
648
935985 977
53136
192 224152
0
200
400
600
800
1000
1200
FY06 FY07 FY08 FY09 FY10
US$ mn
Revenue PAT
415596 575
470
339 410506
233
0
200
400
600
800
1000
1200
FY07 FY08 FY09 FY10
US$ mn
BT Non-BT
Non-BT Sales CAGR -30%
2944 44 47 47 49 48
8
13 1315 17 18 18
6
6 88 9 9 11
0
10
20
30
40
50
60
70
80
FY07 FY08 FY09 1Q'10 2Q'10 3Q'10 4Q'11
>=US$ 1mn >=US$ 5mn >=US$ 10mn
Europe56%
North America30%
ROW14%

Macquarie Research Mahindra & Mahindra
14 June 2010 28
Fig 60 Tech Mahindra strategy Fig 61 Tech Mahindra –unique delivery model
Source: Company data, Macquarie Research, June 2010 Source: Company data, Macquarie Research, June 2010
Tech Mahindra has added ~6,000 employees over the last seven quarters with peak utilization rate of ~75% in 2Q’10. With traction of the business ramp-up improving due to a better macro outlook, we believe utilization rates will remain high in the medium term.
Fig 62 Employee growth robust Fig 63 Employee utilization at highest level
Source: Company data, Macquarie Research, June 2010 Source: Company data, Macquarie Research, June 2010
With an eye to diversifying its presence across verticals and expanding client base, the company has acquired 42.7% stake in scandal-ridden Satyam Computers (renamed Mahindra Satyam) in CY09 to gain foothold in the BFSI, manufacturing, healthcare and retail/travel/logistics verticals apart from its traditional stronghold of telecom. Since Satyam was poorly governed, Tech Mahindra is focusing on improving the operating matrix and cost rationalization in order to optimize the full potential of Satyam. As the customer stability and financial restatement concludes, Satyam could be a feather in Tech Mahindra’s cap, given its strong and diverse customer base, coupled with various fast-growing vertical capabilities.
24.4 25.1 25.4 25.0 25.5 26.5
30.433.5
15% 21% 19% 18% 17% 19% 21% 26%
-
5.0
10.0
15.0
20.0
25.0
30.0
35.0
40.0
Q1 09 Q2 09 Q3 09 Q4 09 Q1 10 Q2 10 Q3 10 Q4 10
'000
0%
5%
10%
15%
20%
25%
30%
Headcount Attrition
69%68%
70%71%
75%
73% 73%
64%
66%
68%
70%
72%
74%
76%
FY07 FY08 FY09 1Q'10 2Q'10 3Q'10 4Q'11
%
Employee Utilization % (including trainees)
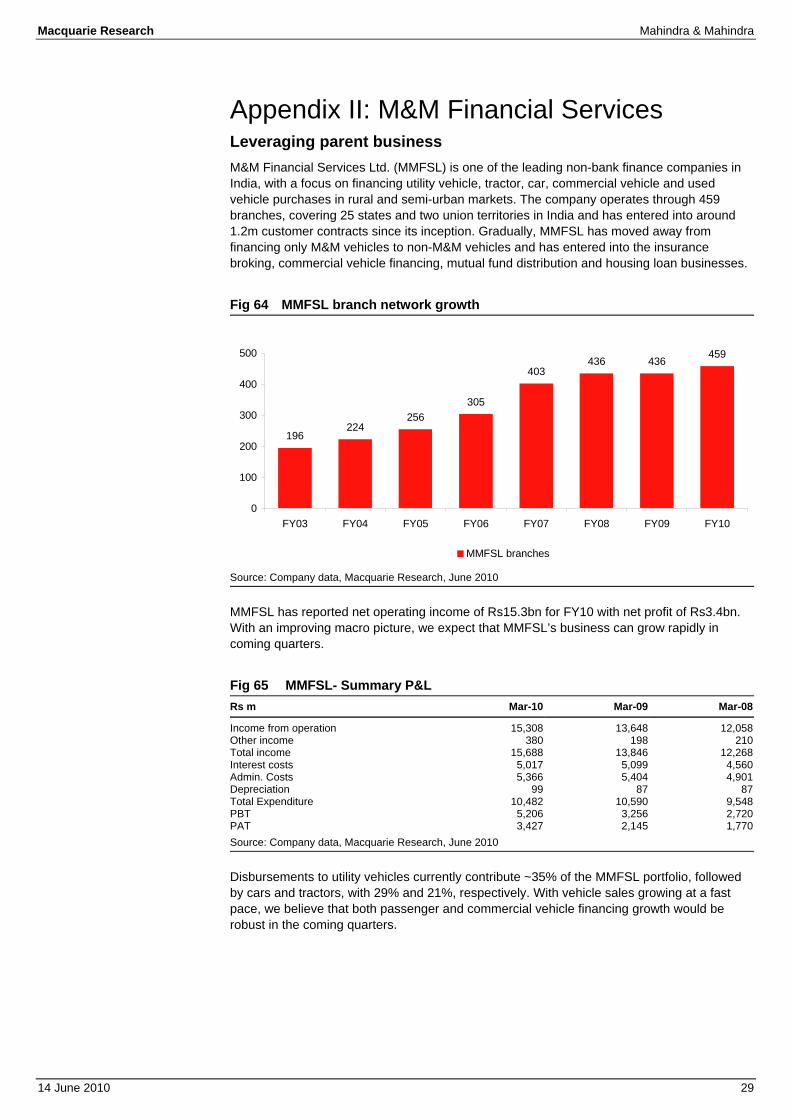
Macquarie Research Mahindra & Mahindra
14 June 2010 29
Appendix II: M&M Financial Services Leveraging parent business M&M Financial Services Ltd. (MMFSL) is one of the leading non-bank finance companies in India, with a focus on financing utility vehicle, tractor, car, commercial vehicle and used vehicle purchases in rural and semi-urban markets. The company operates through 459 branches, covering 25 states and two union territories in India and has entered into around 1.2m customer contracts since its inception. Gradually, MMFSL has moved away from financing only M&M vehicles to non-M&M vehicles and has entered into the insurance broking, commercial vehicle financing, mutual fund distribution and housing loan businesses.
Fig 64 MMFSL branch network growth
Source: Company data, Macquarie Research, June 2010
MMFSL has reported net operating income of Rs15.3bn for FY10 with net profit of Rs3.4bn. With an improving macro picture, we expect that MMFSL’s business can grow rapidly in coming quarters.
Fig 65 MMFSL- Summary P&L Rs m Mar-10 Mar-09 Mar-08
Income from operation 15,308 13,648 12,058 Other income 380 198 210 Total income 15,688 13,846 12,268 Interest costs 5,017 5,099 4,560 Admin. Costs 5,366 5,404 4,901 Depreciation 99 87 87 Total Expenditure 10,482 10,590 9,548 PBT 5,206 3,256 2,720 PAT 3,427 2,145 1,770 Source: Company data, Macquarie Research, June 2010
Disbursements to utility vehicles currently contribute ~35% of the MMFSL portfolio, followed by cars and tractors, with 29% and 21%, respectively. With vehicle sales growing at a fast pace, we believe that both passenger and commercial vehicle financing growth would be robust in the coming quarters.
196224
256305
403436 436
459
0
100
200
300
400
500
FY03 FY04 FY05 FY06 FY07 FY08 FY09 FY10
MMFSL branches

Macquarie Research Mahindra & Mahindra
14 June 2010 30
Fig 66 MMFSL -disbursement mix Fig 67 Break-up of AUM – Segment wise
Source: Company data, Macquarie Research, June 2010 Source: Company data, Macquarie Research, June 2010
The company is comfortably capitalised with low NPA levels. For better and prudent financial management, MMFSL has significantly hiked its NPA coverage to 86% for FY10 from 72% a year ago.
Fig 68 MMFSL- Asset quality Rs m Mar-10 Mar-09 Mar-08
Gross Non - Performing Assets 6,112 6,909 5,572 Gross NPA to Total Assets(%) 6.4% 8.7% 7.6%Net NPA to Total Assets(%) 0.9% 2.6% 2.9%Coverage Ratio(%) 86.4% 71.8% 63.1%Source: Company data, Macquarie Research, June 2010
34%24% 23%
7% 12%
40%
22% 25%
6%7%
35%
21%29%
7%8%
0%
20%
40%
60%
80%
100%
120%
Auto/ Utilityvehicles
Tractors Cars CommercialVehicles
Refinance &Others
Mar-08 Mar-09 Mar-10
38%25% 23%
7% 7%
38%
25% 24%
7% 6%
33%
23% 30%
8% 6%
0%
20%
40%
60%
80%
100%
120%
Auto/ Utilityvehicles
Tractors Cars CommercialVehicles
Refinance &Others
Mar-08 Mar-09 Mar-10

Macquarie Research Mahindra & Mahindra
14 June 2010 31
Appendix III: M&M Systech Leveraging vehicle manufacturing To leverage its auto manufacturing business, the company is backward-integrating into auto component manufacturing to become a fully integrated vehicle manufacturer. Within the auto component segment, forging is the largest business of M&M Systech, contributing ~54% of the total segmental revenue in FY09, followed by the steel & samplings business with ~25% revenue contribution. The company has built up this business through a series of acquisitions and has a large global client base which includes Daimler, Volvo, Tata and Caterpillar. The company is also entering aerospace business with an aim to produce aircraft.
Fig 69 M&M Systech- acquisition history Operational areas Acquisitions
Forgings Amforge (India), Stokes (UK), Jeco Holdings (Germany), Schoeneweiss (Germany)Castings Hinoday (India)Gears SAR (India), Metalcastello (Italy)Engg Services Plexion (India), Engines Engg (Italy)Source: Company data, Macquarie Research, June 2010
Fig 70 FY09 revenue mix by services Fig 71 FY09 revenue mix by geography
Source: Company data, Macquarie Research, June 2010 Source: Company data, Macquarie Research, June 2010
Mahindra Systech is largely driven by M&M’s 60.6%-owned listed subsidiary Mahindra Forgings (MF). The company was incorporated in 1999 as Mahindra Automotive Steels Limited and grew through a series of acquisitions, including the Chakan unit of Amforge Industries in April 2005. The company has a total combined capacity of ~0.26mn tons/ annum with ~77% capacity in Europe.
Fig 72 Mahindra Forgings - Consolidated financials In INR mn FY08 FY09 9M FY10
Net sales 23187 22424 9343EBITDA 1952 1276 -173EBITDA Margin (%) 8.4% 5.7% -1.9%PAT 158 -1166 -1675Source: Company data, Macquarie Research, June 2010
Forgings54%
Steel & samplings
25%
Castings & ferrites
6%
Gears9%
Engg services5%
Others1%
India42%
Germany/UK47%
Italy11%

Macquarie Research Mahindra & Mahindra
14 June 2010 32
Fig 73 Customer distribution Fig 74 Mahindra forgings – sales distribution
Source: Company data, Macquarie Research, June 2010 Source: Company data, Macquarie Research, June 2010
Passenger cars41%
MUVs23%
Tractors13%
LCVs10%
HCVs3%
Non-auto10%

Macquarie Research Mahindra & Mahindra
14 June 2010 33
Appendix IV: Mahindra Holidays & Resorts Packing Indians to nice holiday destinations Mahindra Holidays & Resorts India Limited (MH&R) is one of the leading leisure hospitality providers of India. The company owns 33 resorts across India and Thailand and has 75% ownership in 1,365 apartments and cottages. MH&R, with its flagship brand Club Mahindra, operates through 17 branch offices, 37 retail outlets and 104 franchisees. The company has launched Homestays in the UK and India and added five new resorts and 329 units during last year. The company has dominant market share in its operating segment within India with revenue and new membership growth CAGRs over the last five years in the range of 37% and 35% respectively.
Fig 75 Robust membership CAGR of 31% Fig 76 Revenue grew at 37% CAGR
Source: Company data, Macquarie Research,June2010 Source: Company data, Macquarie Research, June 2010
Fig 77 EBITDA growth Fig 78 Improving EBITDA margin
Source: Company data, Macquarie Research, June 2010 Source: Company data, Macquarie Research, June 2010
28,49138,691
53,113
75,533
92,825
109,884
-
20,000
40,000
60,000
80,000
100,000
120,000
2005 2006 2007 2008 2009 2010
Cagr - 31%
10611567
2406
3750
4443
5164
0
1000
2000
3000
4000
5000
6000
2005 2006 2007 2008 2009 2010
Cagr - 37%
272445
789
14051556
2004
0
500
1000
1500
2000
2500
2005 2006 2007 2008 2009 2010
Cagr - 49%26%
28%
33%37%
35%39%
0%
5%
10%
15%
20%
25%
30%
35%
40%
45%
2005 2006 2007 2008 2009 2010

Macquarie Research Mahindra & Mahindra
14 June 2010 34
Appendix V: Mahindra Lifespaces Real Estate play Mahindra Lifespaces, the real estate arm of the M&M group, is focused on residential, commercial, integrated business park and SEZ developments. The company has completed more than 2,000 acres of land development, along with 5.8m sqft of residential and commercial projects with focus on tier I/II cities. The company is developing a 3000-acre integrated business city at Karla near Pune in partnership with MIDC.
Fig 79 Revenue Fig 80 Net Profit
Source: Company data, Macquarie Research, June 2010 Source: Company data, Macquarie Research, June 2010
Currently, the company holds land of 133 acres in Murud, Maharashtra, and 53 acres in Goa as well as trying to acquire ~6000 acres of land across different parts of India.
Fig 81 EBITDA Fig 82 EBITDA margin(%)
Source: Company data, Macquarie Research, June 2010 Source: Company data, Macquarie Research, June 2010
1,211
1,5551,721 1,654
3,207
-
500
1,000
1,500
2,000
2,500
3,000
3,500
FY06 FY07 FY08 FY09 FY10
110142
654
464
794
-
100
200
300
400
500
600
700
800
FY06 FY07 FY08 FY09 FY10
230 269
858
510
1,098
-
200
400
600
800
1,000
1,200
FY06 FY07 FY08 FY09 FY10
19% 17%
50%
31%34%
0%
10%
20%
30%
40%
50%
60%
FY06 FY07 FY08 FY09 FY10

Macquarie Research Mahindra & Mahindra
14 June 2010 35
Appendix VI: Utility vehicle segment Total UV sales grew by 21% YoY in FY10 to reach 0.27m units in FY10. The market grew at a CAGR of 9% during FY 05 - FY10.
Fig83 India UV sales growth
Source: SIAM, Macquarie Research, June 2010
Though there are 12 utility value manufacturers in India, the top three players account for around 88% of the market share in FY10. M&M has been the market leader in utility vehicles in India since inception, and has managed to increase its market share to 55% by FY10 from 47% in FY04.
Fig 84 Indian UV segment: Market share Fig 85 M&M dominates UV segment (FY10)
Source: SIAM, Macquarie Research, June 2010 Source: SIAM, Macquarie Research, June 2010
-
50,000
100,000
150,000
200,000
250,000
300,000
FY04 FY05 FY06 FY07 FY08 FY09 FY10-10%
-5%
0%
5%
10%
15%
20%
25%
30%
Total UV sales Growth
0%
10%
20%
30%
40%
50%
60%
FY03 FY04 FY05 FY06 FY07 FY08 FY09 FY10
M&M Ltd. Tata Motors Ltd Toyota Kirloskar Motor Pvt Ltd
M&M Ltd.56%
Tata Motors Ltd13%
Toyota Kirloskar Motor
Pvt Ltd19%
Others12%

Macquarie Research Mahindra & Mahindra
14 June 2010 36
Appendix VII: Tractors Tractor sales volumes reached 440,230 in FY10 and have grown at a CAGR of 15% since FY04. Domestic tractor sales growth in FY10 is attributed to lower base in FY09 and rising rural wealth over the years. However, export growth was under pressure due to slow economic revival in developed nations, particularly the US, which accounted for more than 50% of total tractor exports from India.
Fig 86 India tractor sales growth -
Source: CMIE, Macquarie Research, June 2010
There are more than ten players operating in the tractor manufacturing industry, with M&M dominating the market, having increased its market share to 40% in FY10 from around 26% in FY04. The other two key players in the tractor manufacturing industry are Tractor & Farm Equipment Ltd and Escorts Ltd, with market share of 22% and 12%, respectively.
Fig 87 Consistent increase in M&M market share Fig 88 India Tractor Segment: Market share FY10
Source: CMIE, Macquarie Research, June 2010 Source: CMIE, Macquarie Research, June 2010
100,000
200,000
300,000
400,000
500,000
FY05 FY06 FY07 FY08 FY09 FY10-5%
0%
5%
10%
15%
20%
25%
30%
35%
Sales Growth
5%
10%
15%
20%
25%
30%
35%
40%
45%
FY05 FY06 FY07 FY08 FY09 FY10M&M Ltd Escorts Ltd Tractors & Farm Equipment Ltd.
M&M & Punjab Tractors
41%
TAFE & Eicher22%
Escorts12%
International Tractors
9%
John Deere8%
Others8%

Macquarie Research Mahindra & Mahindra
14 June 2010 37
Fig 89 Sales by HP – lower segments have high market share
Source:CMIE,CRISIL,MacquarieResearch,June2010
In terms of HP, the lower HP segment up to 40HP dominates due to small farmsteads in India. The 31-40HP is the largest segment, accounting for 46% of the sales in FY10. Also foreign players have key products in the higher-HP segments and hence account for lower market share in overall tractor sales in India.
In terms of various states, Uttar Pradesh, with its emphasis on agriculture, accounts for 18% of domestic sales in FY10, followed by Andhra Pradesh, Maharashtra and Rajasthan.
Fig 90 Tractor sales by state FY10
Source: CMIE, CRISIL, Macquarie Research, June 2010
0%
20%
40%
60%
80%
100%
FY05 FY06 FY07 FY08 FY09 FY10<30HP 31-40 HP 41-50 HP >51 HP
18%
8%7%
9%7%
8% 8%
6% 6% 6%
16%
0%
2%
4%
6%
8%
10%
12%
14%
16%
18%
20%
UP MP Punjab AP Haryana Maharashtra Rajasthan Karnataka Gujarat Bihar Others

Macquarie Research Mahindra & Mahindra
14 June 2010 38
Appendix VIII: Light Commercial Vehicles The Indian LCV segment recorded sales of 286,794 vehicles in FY10, growing at a CAGR of ~20% during FY04 - FY10. Tata Motors and M&M are the two major players in the segment, together accounting for 88% of the market share in FY10. With greater focus on development of highways and connecting major cities and towns, the hub-and-spoke model has gained prominence, leading to strong demand for high tonnage vehicles on one hand and LCV for the last mile of transport on the other.
Fig 91 Indian LCV segment – robust growth with hub and spoke model
Source: SIAM, Macquarie Research, June 2010
The domestic LCV market is dominated by goods carriers with a tonnage capacity of less than 3.5 tons. Volumes in carriers with capacity of less than 3.5 tons accounted for 84% of the volumes in FY10, as compared to little over 40% in FY03. The segment has grown at a CAGR of 31% since FY05 after the launch of India’s first mini-truck, the Tata Ace.
Fig 92 Domestic LCV volumes: Goods carriers with <3.5 tonnes dominating
Source: SIAM, Macquarie Research, June 2010
-
50,000
100,000
150,000
200,000
250,000
300,000
350,000
FY04 FY05 FY06 FY07 FY08 FY09 FY10-10%
0%
10%
20%
30%
40%
50%
LCV Growth
0%
20%
40%
60%
80%
100%
FY03 FY04 FY05 FY06 FY07 FY08 FY09 FY10
< 3.5 tons 3.5-7 tons

Macquarie Research Mahindra & Mahindra
14 June 2010 39
Appendix IX: Medium & Heavy Commercial Vehicles The domestic MHCV segment recorded sales of 244,596 vehicles in FY10, growing at a CAGR of ~11% during FY03-FY10. The M&HCV space was the worst-affected segment in the Indian auto space during the global credit crisis, with sales declining by over 32% in FY09.
Fig93 Indian M&HCV segment – robust growth
Source: SIAM, Macquarie Research, June 2010
The domestic M&HCV market is subdivided into the goods and passenger segments. Volumes in goods carriers account for ~82% of the total MHCV sales, growing by an 11% CAGR during the period FY03 -10. The bus segment is driven largely by orders from various state transportation units.
Fig 94 Passenger M&HCV space – less volatile Fig 95 Goods M&HCV space – on recovery track
Source: SIAM, Macquarie Research, June 2010 Source: SIAM, Macquarie Research, June 2010
Tata Motors and Ashok Leyland are the two major players in the segment, together accounting for ~86% of the market in FY10.
-
50,000
100,000
150,000
200,000
250,000
300,000
FY04 FY05 FY06 FY07 FY08 FY09 FY10-40%
-30%
-20%-10%
0%
10%
20%30%
40%
50%
MHCV (LHS) Growth (RHS)
-
5,000
10,000
15,000
20,000
25,000
30,000
35,000
40,000
45,000
50,000
FY04 FY05 FY06 FY07 FY08 FY09 FY10-15%-10%-5%0%5%10%15%20%25%30%35%40%
MHCV passenger carrirers(LHS) Growth (RHS)
-
50,000
100,000
150,000
200,000
250,000
300,000
FY04 FY05 FY06 FY07 FY08 FY09 FY10-50%
-40%
-30%
-20%
-10%
0%
10%
20%
30%
40%
50%
MHCV goods carrirers(LHS) Growth (RHS)

Macquarie Research Mahindra & Mahindra
14 June 2010 40
Appendix X: Three-wheelers Three-wheeler domestic sales volumes reached 440,368 in FY10. After seeing a decline in growth in FY08 and FY09, three-wheeler sales volumes grew at a robust pace of 26% YoY in FY10.
Fig 96 India three-wheeler sales growth
Source: SIAM, Macquarie Research, June 2010
Three-wheelers have seen good growth in the passenger segment; however, in the goods space, increasing use of low-tonnage four-wheelers has replaced three-wheelers for intra-city movements. M&M’s market share in the domestic passengers segment has been increasing steadily from 1% in FY07 to 9% in FY10. Volumes have increased at a 44% CAGR during the period FY05-FY10. In the domestic goods segment, M&M accounts for 15% of the market.
Fig 97 Increasing M&M share in passenger three-wheelers
Fig 98 Increasing share in domestic goods three-wheelers
Source: SIAM, Macquarie Research, June 2010 Source: SIAM, Macquarie Research, June 2010
50,000
100,000
150,000
200,000
250,000
300,000
350,000
400,000
450,000
FY04 FY05 FY06 FY07 FY08 FY09 FY10-15%
-10%
-5%
0%
5%
10%
15%
20%
25%
30%
Total domestic 3 wheeler Growth rate
50,000
100,000
150,000
200,000
250,000
300,000
350,000
FY03 FY04 FY05 FY06 FY07 FY08 FY09 FY100%
2%
4%
6%
8%
10%
Domestic Passengers Industry M&M market share
-
20,000
40,000
60,000
80,000
100,000
120,000
140,000
160,000
180,000
FY03 FY04 FY05 FY06 FY07 FY08 FY09 FY100%
5%
10%
15%
20%
25%
30%
Domestic Goods Industry M&M market share

Macquarie Research Mahindra & Mahindra
14 June 2010 41
Mahindra & Mahindra (MM IN, Outperform, Target Price: Rs740.00)Quarterly Results 4Q/10A 1Q/11E 2Q/11E 3Q/11E Profit & Loss 2010A 2011E 2012E 2013E
Revenue m 58,045 47,076 50,200 56,224 Revenue m 186,041 223,111 258,176 293,208Gross Profit m 18,098 14,144 15,083 16,892 Gross Profit m 58,005 67,034 76,345 86,098Cost of Goods Sold m 39,947 32,932 35,117 39,332 Cost of Goods Sold m 128,036 156,077 181,831 207,110EBITDA m 9,228 7,241 7,721 8,648 EBITDA m 29,575 34,316 39,314 44,543Depreciation m 1,156 959 1,022 1,145 Depreciation m 3,706 4,544 5,623 6,695Amortisation of Goodwill m 0 0 0 0 Amortisation of Goodwill m 0 0 0 0Other Amortisation m 0 0 0 0 Other Amortisation m 0 0 0 0EBIT m 8,071 6,282 6,699 7,503 EBIT m 25,869 29,772 33,690 37,848Net Interest Income m -384 -214 -228 -256 Net Interest Income m -1,230 -1,015 -919 -875Associates m 0 0 0 0 Associates m 0 0 0 0Exceptionals m 283 0 0 0 Exceptionals m 908 0 0 0Forex Gains / Losses m 0 0 0 0 Forex Gains / Losses m 0 0 0 0Other Pre-Tax Income m 916 679 724 811 Other Pre-Tax Income m 2,937 3,218 2,810 2,885Pre-Tax Profit m 8,887 6,747 7,194 8,058 Pre-Tax Profit m 28,484 31,975 35,581 39,858Tax Expense m -2,368 -1,754 -1,871 -2,095 Tax Expense m -7,591 -8,313 -9,251 -10,363Net Profit m 6,519 4,993 5,324 5,963 Net Profit m 20,893 23,661 26,330 29,495Minority Interests m 0 0 0 0 Minority Interests m 0 0 0 0
Reported Earnings m 6,519 4,993 5,324 5,963 Reported Earnings m 20,893 23,661 26,330 29,495Adjusted Earnings m 6,311 4,993 5,324 5,963 Adjusted Earnings m 20,227 23,661 26,330 29,495
EPS (rep) 11.52 8.82 9.41 10.54 EPS (rep) 36.92 41.81 46.53 52.12EPS (adj) 11.15 8.82 9.41 10.54 EPS (adj) 35.74 41.81 46.53 52.12EPS Growth yoy (adj) % 139.2 17.0 17.0 17.0 EPS Growth (adj) % 139.2 17.0 11.3 12.0
PE (rep) x 16.4 14.5 13.0 11.6 PE (adj) x 17.0 14.5 13.0 11.6
EBITDA Margin % 15.9 15.4 15.4 15.4 Total DPS 6.23 11.00 11.75 12.50EBIT Margin % 13.9 13.3 13.3 13.3 Total Div Yield % 1.0 1.8 1.9 2.1Earnings Split % 31.2 21.1 22.5 25.2 Weighted Average Shares m 566 566 566 566Revenue Growth % 41.7 19.9 19.9 19.9 Period End Shares m 566 566 566 566EBIT Growth % 222.9 15.1 15.1 15.1
Profit and Loss Ratios 2010A 2011E 2012E 2013E Cashflow Analysis 2010A 2011E 2012E 2013E
Revenue Growth % 41.7 19.9 15.7 13.6 EBITDA m 29,575 34,316 39,314 44,543EBITDA Growth % 170.7 16.0 14.6 13.3 Tax Paid m -6,644 -8,313 -9,251 -10,363EBIT Growth % 222.9 15.1 13.2 12.3 Chgs in Working Cap m -8,215 -5,800 90 -2,332Gross Profit Margin % 31.2 30.0 29.6 29.4 Net Interest Paid m 0 0 0 0EBITDA Margin % 15.9 15.4 15.2 15.2 Other m 4,308 824 1,058 1,114EBIT Margin % 13.9 13.3 13.0 12.9 Operating Cashflow m 19,025 21,027 31,210 32,961Net Profit Margin % 11.2 10.6 10.2 10.1 Acquisitions m -6,116 -8,500 -8,500 -8,000Payout Ratio % 17.4 26.3 25.3 24.0 Capex m -8,500 -17,000 -15,000 -13,000EV/EBITDA x 12.0 10.3 9.0 8.0 Asset Sales m 0 0 0 0EV/EBIT x 13.7 11.9 10.5 9.4 Other m 2,712 2,868 2,310 2,385
Investing Cashflow m -11,904 -22,632 -21,190 -18,615Balance Sheet Ratios Dividend (Ordinary) m -3,121 -6,302 -7,297 -7,795ROE % 30.9 27.4 25.3 23.8 Equity Raised m 118 0 0 0ROA % 17.1 17.2 17.1 17.0 Debt Movements m -11,726 0 0 0ROIC % 24.5 24.6 21.6 21.2 Other m 9,390 -1,375 -1,350 -1,350Net Debt/Equity % 14.4 21.7 17.0 10.4 Financing Cashflow m -5,339 -7,677 -8,647 -9,145Interest Cover x 21.0 29.3 36.7 43.2 Price/Book x 4.4 3.6 3.0 2.6 Net Chg in Cash/Debt m 1,781 -9,282 1,373 5,201Book Value per Share 138.3 167.2 200.0 237.4
Free Cashflow m 10,525 4,027 16,210 19,961 Balance Sheet 2010A 2011E 2012E 2013E Cash m 17,525 8,243 9,616 14,818 Receivables m 12,433 16,493 19,110 21,712 Inventories m 11,838 17,691 20,263 22,806 Investments m 81,993 92,294 101,693 109,599 Fixed Assets m 36,937 49,393 58,770 65,075 Intangibles m 0 0 0 0 Other Assets m 733 733 733 733 Total Assets m 161,459 184,847 210,185 234,741 Payables m 32,879 38,794 44,972 47,689 Short Term Debt m 0 0 0 0 Long Term Debt m 28,802 28,802 28,802 28,802 Provisions m 17,965 18,960 19,458 19,955 Other Liabilities m 3,551 3,666 3,792 3,931 Total Liabilities m 83,197 90,221 97,023 100,377 Shareholders' Funds m 78,262 94,626 113,161 134,363 Minority Interests m 0 0 0 0 Other m 0 0 0 0 Total S/H Equity m 78,262 94,626 113,161 134,363 Total Liab & S/H Funds m 161,459 184,847 210,185 234,741
All figures in INR unless noted. Source: Company data, Macquarie Research, June 2010

Macquarie Research Mahindra & Mahindra
14 June 2010 42
Important disclosures:
Recommendation definitions Macquarie - Australia/New Zealand Outperform – return >5% in excess of benchmark return Neutral – return within 5% of benchmark return Underperform – return >5% below benchmark return Macquarie – Asia/Europe Outperform – expected return >+10% Neutral – expected return from -10% to +10% Underperform – expected return <-10% Macquarie First South - South Africa Outperform – expected return >+10% Neutral – expected return from -10% to +10% Underperform – expected return <-10% Macquarie - Canada Outperform – return >5% in excess of benchmark return Neutral – return within 5% of benchmark return Underperform – return >5% below benchmark return Macquarie - USA Outperform (Buy) – return >5% in excess of Russell 3000 index return Neutral (Hold) – return within 5% of Russell 3000 index return Underperform (Sell)– return >5% below Russell 3000 index return Recommendations – 12 months Note: Quant recommendations may differ from Fundamental Analyst recommendations
Volatility index definition* This is calculated from the volatility of historical price movements. Very high–highest risk – Stock should be expected to move up or down 60–100% in a year – investors should be aware this stock is highly speculative. High – stock should be expected to move up or down at least 40–60% in a year – investors should be aware this stock could be speculative. Medium – stock should be expected to move up or down at least 30–40% in a year. Low–medium – stock should be expected to move up or down at least 25–30% in a year. Low – stock should be expected to move up or down at least 15–25% in a year. * Applicable to Australian/NZ/Canada stocks only
Financial definitions All "Adjusted" data items have had the following adjustments made: Added back: goodwill amortisation, provision for catastrophe reserves, IFRS derivatives & hedging, IFRS impairments & IFRS interest expense Excluded: non recurring items, asset revals, property revals, appraisal value uplift, preference dividends & minority interests EPS = adjusted net profit / efpowa* ROA = adjusted ebit / average total assets ROA Banks/Insurance = adjusted net profit /average total assets ROE = adjusted net profit / average shareholders funds Gross cashflow = adjusted net profit + depreciation *equivalent fully paid ordinary weighted average number of shares All Reported numbers for Australian/NZ listed stocks are modelled under IFRS (International Financial Reporting Standards).
Recommendation proportions – For quarter ending 31 March 2010 AU/NZ Asia RSA USA CA EUR Outperform 50.55% 62.20% 42.25% 42.39% 62.16% 46.74% (for US coverage by MCUSA, 6.53% of stocks covered are investment banking clients) Neutral 36.63% 19.02% 47.89% 50.35% 31.89% 34.78% (for US coverage by MCUSA, 9.62% of stocks covered are investment banking clients) Underperform 12.82% 18.78% 9.86% 7.27% 5.95% 18.48% (for US coverage by MCUSA, 0.00% of stocks covered are investment banking clients)
Company Specific Disclosures: Important disclosure information regarding the subject companies covered in this report is available at www.macquarie.com/research/disclosures.
Analyst Certification: The views expressed in this research accurately reflect the personal views of the analyst(s) about the subject securities or issuers and no part of the compensation of the analyst(s) was, is, or will be directly or indirectly related to the inclusion of specific recommendations or views in this research. The analyst principally responsible for the preparation of this research receives compensation based on overall revenues of Macquarie Group Ltd ABN 94 122 169 279 (AFSL No. 318062) (MGL) and its related entities (the Macquarie Group) and has taken reasonable care to achieve and maintain independence and objectivity in making any recommendations. General Disclaimers: Macquarie Securities (Australia) Ltd; Macquarie Capital (Europe) Ltd; Macquarie Capital Markets Canada Ltd; Macquarie Capital Markets North America Ltd; Macquarie Capital (USA) Inc; Macquarie Capital Securities Ltd and its Taiwan branch; Macquarie Capital Securities (Singapore) Pte Ltd; Macquarie Securities (NZ) Ltd; Macquarie First South Securities (Pty) Limited; Macquarie Capital Securities (India) Pvt Ltd; Macquarie Capital Securities (Malaysia) Sdn Bhd; and Macquarie Securities (Thailand) Ltd are not authorized deposit-taking institutions for the purposes of the Banking Act 1959 (Commonwealth of Australia), and their obligations do not represent deposits or other liabilities of Macquarie Bank Limited ABN 46 008 583 542 (MBL) or MGL. MBL does not guarantee or otherwise provide assurance in respect of the obligations of any of the above mentioned entities. MGL provides a guarantee to the Monetary Authority of Singapore in respect of the obligations and liabilities of Macquarie Capital Securities (Singapore) Pte Ltd for up to SGD 35 million. This research has been prepared for the general use of the wholesale clients of the Macquarie Group and must not be copied, either in whole or in part, or distributed to any other person. If you are not the intended recipient you must not use or disclose the information in this research in any way. If you received it in error, please tell us immediately by return e-mail and delete the document. We do not guarantee the integrity of any e-mails or attached files and are not responsible for any changes made to them by any other person. MGL has established and implemented a conflicts policy at group level (which may be revised and updated from time to time) (the "Conflicts Policy") pursuant to regulatory requirements (including the FSA Rules) which sets out how we must seek to identify and manage all material conflicts of interest. Nothing in this research shall be construed as a solicitation to buy or sell any security or product, or to engage in or refrain from engaging in any transaction. In preparing this research, we did not take into account your investment objectives, financial situation or particular needs. Before making an investment decision on the basis of this research, you need to consider, with or without the assistance of an adviser, whether the advice is appropriate in light of your particular investment needs, objectives and financial circumstances. There are risks involved in securities trading. The price of securities can and does fluctuate, and an individual security may even become valueless. International investors are reminded of the additional risks inherent in international investments, such as currency fluctuations and international stock market or economic conditions, which may adversely affect the value of the investment. This research is based on information obtained from sources believed to be reliable but we do not make any representation or warranty that it is accurate, complete or up to date. We accept no obligation to correct or update the information or opinions in it. Opinions expressed are subject to change without notice. No member of the Macquarie Group accepts any liability whatsoever for any direct, indirect, consequential or other loss arising from any use of this research and/or further communication in relation to this research. Clients should contact analysts at, and execute transactions through, a Macquarie Group entity in their home jurisdiction unless governing law permits otherwise. Country-Specific Disclaimers: Australia: In Australia, research is issued and distributed by Macquarie Securities (Australia) Ltd (AFSL No. 238947), a participating organisation of the Australian Securities Exchange. New Zealand: In New Zealand, research is issued and distributed by Macquarie Securities (NZ) Ltd, a NZX Firm. Canada: In Canada, research is prepared, approved and distributed by Macquarie Capital Markets Canada Ltd, a participating organisation of the Toronto Stock Exchange, TSX Venture Exchange & Montréal Exchange. Macquarie Capital Markets North America Ltd., which is a registered broker-dealer and member of FINRA, accepts responsibility for the contents of reports issued by Macquarie Capital Markets Canada Ltd in the United States and sent to US persons. Any person wishing to effect transactions in the securities described in the reports issued by Macquarie Capital Markets Canada Ltd should do so with Macquarie Capital Markets North America Ltd. The Research Distribution Policy of Macquarie Capital Markets Canada Ltd is to allow all clients that are entitled to have equal access to our research. United Kingdom: In the United Kingdom, research is issued and distributed by Macquarie Capital (Europe) Ltd, which is authorised and regulated by the Financial Services Authority (No. 193905). Germany: In Germany, research is issued and distributed by Macquarie Capital (Europe) Ltd, Niederlassung Deutschland, which is authorised and regulated in the United Kingdom by the Financial Services Authority (No. 193905). France: In France, research is issued and distributed by Macquarie Capital (Europe)
Macquarie Research Mahindra & Mahindra
14 June 2010 43
Ltd, which is authorised and regulated in the United Kingdom by the Financial Services Authority (No. 193905). Hong Kong: In Hong Kong, research is issued and distributed by Macquarie Capital Securities Ltd, which is licensed and regulated by the Securities and Futures Commission. Japan: In Japan, research is issued and distributed by Macquarie Capital Securities (Japan) Limited, a member of the Tokyo Stock Exchange, Inc. and Osaka Securities Exchange Co. Ltd (Financial Instruments Firm, Kanto Financial Bureau (kin-sho) No. 231, a member of Japan Securities Dealers Association and Financial Futures Association of Japan). India: In India, research is issued and distributed by Macquarie Capital Securities (India) Pvt Ltd, which is a SEBI registered Stock Broker having membership with National Stock Exchange of India Limited (INB231246738) and Bombay Stock Exchange Limited (INB011246734). Malaysia: In Malaysia, research is issued and distributed by Macquarie Capital Securities (Malaysia) Sdn. Bhd. (Company registration number: 463469-W) which is a Participating Organisation of Bursa Malaysia Berhad and a holder of Capital Markets Services License issued by the Securities Commission. Taiwan: Information on securities/instruments that are traded in Taiwan is distributed by Macquarie Capital Securities Ltd, Taiwan Branch, which is licensed and regulated by the Financial Supervisory Commission. No portion of the report may be reproduced or quoted by the press or any other person without authorisation from Macquarie. Thailand: In Thailand, research is issued and distributed by Macquarie Securities (Thailand) Ltd, a licensed securities company that is authorized by the Ministry of Finance, regulated by the Securities and Exchange Commission of Thailand and is an exchange member no. 28 of the Stock Exchange of Thailand. The Thai Institute of Directors Association has disclosed the Corporate Governance Report of Thai Listed Companies made pursuant to the policy of the Securities and Exchange Commission of Thailand. Macquarie Securities (Thailand) Ltd does not endorse the result of the Corporate Governance Report of Thai Listed Companies but this Report can be accessed at:http://www.thai-iod.com/en/publications.asp?type=4. South Africa: In South Africa, research is issued and distributed by Macquarie First South Securities (Pty) Limited, a member of the JSE Limited. Singapore: In Singapore, research is issued and distributed by Macquarie Capital Securities (Singapore) Pte Ltd (Company Registration Number: 198702912C), a Capital Markets Services license holder under the Securities and Futures Act to deal in securities and provide custodial services in Singapore. Pursuant to the Financial Advisers (Amendment) Regulations 2005, Macquarie Capital Securities (Singapore) Pte Ltd is exempt from complying with sections 25, 27 and 36 of the Financial Advisers Act. All Singapore-based recipients of research produced by Macquarie Capital (Europe) Limited, Macquarie Capital Markets Canada Ltd, Macquarie First South Securities (Pty) Limited and Macquarie Capital (USA) Inc. represent and warrant that they are institutional investors as defined in the Securities and Futures Act. United States: In the United States, research is issued and distributed by Macquarie Capital (USA) Inc., which is a registered broker-dealer and member of FINRA. Macquarie Capital (USA) Inc, accepts responsibility for the content of each research report prepared by one of its non-US affiliates when the research report is distributed in the United States by Macquarie Capital (USA) Inc. Macquarie Capital (USA) Inc.’s affiliate’s analysts are not registered as research analysts with FINRA, may not be associated persons of Macquarie Capital (USA) Inc., and therefore may not be subject to FINRA rule restrictions on communications with a subject company, public appearances, and trading securities held by a research analyst account. Any persons receiving this report directly from Macquarie Capital (USA) Inc. and wishing to effect a transaction in any security described herein should do so with Macquarie Capital (USA) Inc. Important disclosure information regarding the subject companies covered in this report is available at www.macquarie.com/research/disclosures, or contact your registered representative at 1-888-MAC-STOCK, or write to the Supervisory Analysts, Research Department, Macquarie Securities, 125 W.55th Street, New York, NY 10019. © Macquarie Group Auckland Tel: (649) 377 6433
London Tel: (44 20) 3037 4400
Shanghai Tel: (86 21) 6841 3355
Bangkok Tel: (662) 694 7999
Manila Tel: (63 2) 857 0888
Singapore Tel: (65) 6231 1111
Calgary Tel: (1 403) 218 6650
Melbourne Tel: (613) 9635 8139
Sydney Tel: (612) 8232 9555
Hong Kong Tel: (852) 2823 3588
Montreal Tel: (1 514) 925 2850
Taipei Tel: (886 2) 2734 7500
Jakarta Tel: (62 21) 515 1818
Mumbai Tel: (91 22) 6653 3000
Tokyo Tel: (81 3) 3512 7900
Johannesburg Tel: (2711) 583 2000
Perth Tel: (618) 9224 0888
Toronto Tel: (1 416) 848 3500
Kuala Lumpur Tel: (60 3) 2059 8833
Seoul Tel: (82 2) 3705 8500
New York Tel: (1 212) 231 2500
Available to clients on the world wide web at www.macquarieresearch.com and through Thomson Financial, FactSet, Reuters, Bloomberg, CapitalIQ and TheMarkets.com.
Asia Research Head of Equity Research John O’Connell (Global Co – Head) (612) 8232 7544 David Rickards (Global Co – Head) (44 20) 3037 4399 Chris Hunt (Asia – Head) (852) 3922 1119 Tim Smart (Asia – Deputy Head) (852) 3922 3565 Automobiles/Auto Parts Leah Jiang (China) (8621) 2412 9020 Clive Wiggins (Japan) (813) 3512 7856 Dan Lucas (Japan) (813) 3512 6050 ES Kwak (Korea) (822) 3705 8644 Linda Huang (Taiwan) (8862) 2734 7521 Banks and Non-Bank Financials Ismael Pili (Regional) (813) 3512 5979 Victor Wang (China) (852) 3922 1479 Jemmy Huang (Hong Kong, Taiwan) (8862) 2734 7530 Mudit Painuly (India) (9122) 6653 3044 Suresh Ganapathy (India) (9122) 6653 3042 Ferry Wong (Indonesia) (6221) 515 7335 Chan Hwang (Korea) (822) 3705 8643 Michael Na (Korea) (822) 2095 7222 Matthew Smith (Taiwan) (8862) 2734 7514 Alastair Macdonald (Thailand) (662) 694 7741 Chemicals/Textiles Christina Lee (Hong Kong) (852) 3922 3571 Jal Irani (India) (9122) 6653 3040 Shawn Park (Korea) (822) 3705 8669 Sunaina Dhanuka (Malaysia) (603) 2059 8993 Conglomerates Gary Pinge (Asia) (852) 3922 3557 Leah Jiang (China) (8621) 2412 9020 Consumer and Gaming Gary Pinge (Asia) (852) 3922 3557 Jessie Qian (China, Hong Kong) (852) 3922 3568 Toby Williams (Japan) (813) 3512 7392 HongSuk Na (Korea) (822) 3705 8678 Edward Ong (Malaysia) (603) 2059 8982 Alex Pomento (Philippines) (632) 857 0899 Linda Huang (Taiwan) (8862) 2734 7521 Emerging Leaders Jake Lynch (Asia) (8621) 2412 9007 Minoru Tayama (Japan) (813) 3512 6058 Robert Burghart (Japan) (813) 3512 7853 Industrials Inderjeetsingh Bhatia (India) (9122) 6653 3166 Christopher Cintavey (Japan) (813) 3512 7432 Janet Lewis (Japan) (813) 3512 7475 Chang Han Joo (Korea) (822) 3705 8511 Sunaina Dhanuka (Malaysia) (603) 2059 8993 David Gambrill (Thailand) (662) 694 7753 Insurance Makarim Salman (Japan) (813) 3512 7421 Media Jessie Qian (China, Hong Kong) (852) 3922 3568 Shubham Majumder (India) (9122) 6653 3049 George Hogan (Japan) (813) 3512 7851 Prem Jearajasingam (Malaysia) (603) 2059 8989 Alex Pomento (Philippines) (632) 857 0899
Oil and Gas Laban Yu (Asia) (852) 3922 4691 Christina Lee (Hong Kong) (852) 3922 3571 Jal Irani (India) (9122) 6653 3040 Polina Diyachkina (Japan) (813) 3512 7886 Shawn Park (Korea) (822) 3705 8669 Edward Ong (Malaysia) (603) 2059 8982 Sunaina Dhanuka (Malaysia) (603) 2059 8993 Linda Huang (Taiwan) (8862) 2734 7521 Trevor Buchinski (Thailand) (662) 694 7829
Pharmaceuticals Christina Lee (Hong Kong) (852) 3922 3571 Abhishek Singhal (India) (9122) 6653 3052 Naomi Kumagai (Japan) (813) 3512 7474
Property Callum Bramah (Asia) (852) 3922 4731 Eva Lee (China, Hong Kong) (852) 3922 3573 Hiroshi Okubo (Japan) (813) 3512 7433 Chang Han Joo (Korea) (822) 3705 8511 Tuck Yin Soong (Singapore) (65) 6231 2838 Elaine Cheong (Singapore) (65) 6231 2839 Corinne Jian (Taiwan) (8862) 2734 7522 Patti Tomaitrichitr (Thailand) (662) 694 7727
Resources / Metals and Mining Andrew Dale (Asia) (852) 3922 3587 YeeMan Chin (China) (852) 3922 3562 Graeme Train (China) (8621) 2412 9035 Christina Lee (Hong Kong) (852) 3922 3571 Rakesh Arora (India) (9122) 6653 3054 Adam Worthington (Indonesia) (852) 3922 4626 Riaz Hyder (Indonesia) (6221) 2598 8486 Polina Diyachkina (Japan) (813) 3512 7886
Technology Michael Bang (Asia) (822) 3705 8659 Patrick Yau (Hong Kong) (852) 3922 1264 Zona Chen (Hong Kong) (852) 3922 3578 Nitin Mohta (India) (9122) 6653 3050 Damian Thong (Japan) (813) 3512 7877 David Gibson (Japan) (813) 3512 7880 George Chang (Japan) (813) 3512 7854 Michiko Kakiya (Japan) (813) 3512 7868 Yukihiro Goto (Japan) (813) 3512 5984 Daniel Kim (Korea) (822) 3705 8641 Abraham Leu (Taiwan) (8862) 2734 7511 Chia-Lin Lu (Taiwan) (8862) 2734 7526 Daniel Chang (Taiwan) (8862) 2734 7516 James Chiu (Taiwan) (8862) 2734 7517 Jeffrey Su (Taiwan) (8862) 2734 7512 Samson Yu (Taiwan) (8862) 2734 7532 Jimmy Hsu (Taiwan) (8862) 2734 7533
Telecoms Shubham Majumder (Asia) (9122) 6653 3049 Bin Liu (China) (852) 3922 3634 Tim Smart (China) (852) 3922 3565 Riaz Hyder (Indonesia) (6221) 2598 8486 Nathan Ramler (Japan) (813) 3512 7875 Prem Jearajasingam (Malaysia) (603) 2059 8989
Transport & Infrastructure Anderson Chow (Asia) (852) 3922 4773 Jonathan Windham (Asia) (852) 3922 5417 Wei Sim (China, Hong Kong) (852) 3922 3598 Janet Lewis (Japan) (813) 3512 7475 Chang Han Joo (Korea) (822) 3705 8511 ES Kwak (Korea) (822) 3705 8644 Sunaina Dhanuka (Malaysia) (603) 2059 8993
Utilities Adam Worthington (Asia) (852) 3922 4626 Carol Cao (China, Hong Kong) (852) 3922 4075 Jeff Evans (India) (9122) 3356 3053 Prem Jearajasingam (Malaysia) (603) 2059 8989 Alex Pomento (Philippines) (632) 857 0899
Commodities Jim Lennon (4420) 3037 4271 Max Layton (4420) 3037 4273 Duncan Hobbs (4420) 3037 4497 Bonnie Liu (8621) 2412 9008 Graeme Train (8621) 2412 9035 Rakesh Arora (9122) 6653 3054
Data Services Andrea Clohessy (Asia) (852) 3922 4076 Eric Yeung (852) 3922 4077
Economics Richard Jerram (Asia) (813) 3512 7855 Richard Gibbs (Australia) (612) 8232 3935 Paul Cavey (China) (852) 3922 3570
Quantitative Martin Emery (Asia) (852) 3922 3582 Viking Kwok (Asia) (852) 3922 4735 George Platt (Australia) (612) 8232 6539 Patrick Hansen (Japan) (813) 3512 7876
Strategy/Country Michael Kurtz (Asia) (8621) 2412 9002 Daniel McCormack (Asia) (852) 3922 4073 Mark Matthews (Asia) (852) 3922 3585 Rakesh Arora (India) (9122) 6653 3054 Ferry Wong (Indonesia) (6221) 515 7335 David Gibson (Japan) (813) 3512 7880 Peter Eadon-Clarke (Japan) (813) 3512 7850 Chan Hwang (Korea) (822) 3705 8643 Prem Jearajasingam (Malaysia) (603) 2059 8989 Edward Ong (Malaysia) (603) 2059 8982 Alex Pomento (Philippines) (632) 857 0899 Patrick Yau (Singapore) (65) 6231 2835 Daniel Chang (Taiwan) (8862) 2734 7516 Alastair Macdonald (Thailand) (662) 694 7741 Find our research at Macquarie: www.macquarie.com.au/research Thomson: www.thomson.com/financial Reuters: www.knowledge.reuters.com Bloomberg: MAC GO Factset: http://www.factset.com/home.aspx CapitalIQ www.capitaliq.com TheMarkets.com www.themarkets.com Email [email protected] for access
Sales Regional Heads of Sales Chris Gray (ASEAN) (65) 6231 2888 Justin Crawford (Asia) (852) 3922 2065 Peter Slater (Boston) (1 617) 598 2502 Jeffrey Shiu (China & Hong Kong) (852) 3922 2061 Thomas Renz (Geneva) (41) 22 818 7712 Andrew Mouat (India) (9122) 6653 3200 Stanley Dunda (Indonesia) (6221) 515 1555 Kenneth Yap (Indonesia) (6221) 515 1555 JJ Kim (Korea) (822) 3705 8799 Jason Lee (Malaysia) (603) 2059 8888 Gino C Rojas (Philippines) (632) 857 0761 Greg Norton-Kidd (New York) (1 212) 231 2527 Luke Sullivan (New York) (1 212) 231 2507 Scot Mackie (New York) (1 212) 231 2848
Regional Heads of Sales cont’d Sheila Schroeder (San Francisco) (1 415) 762 5001 Angus Kent (Thailand) (662) 694 7601 Michael Newman (Tokyo) (813) 3512 7920 Charles Nelson (UK/Europe) (44) 20 3037 4832 Rob Fabbro (UK/Europe) (44) 20 3037 4865 Nick Ainsworth (Generalist) (852) 3922 2010
Sales Trading Adam Zaki (Asia) (852) 3922 2002 Mike Keen (Europe) (44) 20 3037 4905 Yat Quan Tan (Hong Kong) (852) 3922 2028 Stanley Dunda (Indonesia) (6221) 515 1555 Mario Argyrides (Korea) (822) 3705 8610 Edward Robinson (London) (44) 20 3037 4902
Sales Trading cont’d Chris Reale (New York) (1 212) 231 2616 Michael Santos (Philippines) (632) 857 0813 Matthew Ryan (Singapore) (65) 6231 2888 Isaac Huang (Taiwan) (8862) 2734 7582 Dominic Shore (Thailand) (662) 694 7707 Phil Sellaroli (Tokyo) (813) 3512 7837
Alternative Strategies Convertibles - Roland Sharman (852) 3922 2095 Depository Receipts - Robert Ansell (852)3922 2094 Derivatives - Wayne Edelist (852) 3922 2134 Futures - Tim Smith (852) 3922 2113 Structured Products - Andrew Terlich (852) 3922 2013