Magnetostratigraphic constraints on the age of the lower Beaufort Group, western Karoo basin, South...
39
Magnetostratigraphic constraints on the age of the lower Beaufort Group, western Karoo basin, South Africa, and a critical analysis of existing U-Pb geochronological data E. Tohver 1 , L. Lanci 2 , A. Wilson 3,† J. Hansma 2 , S. Flint 3 1) School of Earth and Environment, University of Western Australia, 35 Stirling Hwy, Crawley, WA, Australia. 2). DiSBeF, University of Urbino, Via S. Chiara 23, Urbino, Italy 3) School of Earth, Atmospheric and Environmental Sciences, University of Manchester, Williamson Building, Oxford Road, Manchester, M13 9PL, United Kingdom. † Now at Taskfronterra Geosciences, 24 Riseley Street, Ardross,WA, Australia. Key Points: - Primary magnetizations are preserved in the lower Beaufort Group in the Karoo Basin. - The magnetostratigraphy is compatible with a late Permian age for the Beaufort Group. - A re-examination of existing data from the underlying Ecca Gp. indicates a mid- Permian age. Research Article Geochemistry, Geophysics, Geosystems DOI 10.1002/2015GC005930 This article has been accepted for publication and undergone full peer review but has not been through the copyediting, typesetting, pagination and proofreading process which may lead to differences between this version and the Version of Record. Please cite this article as doi: 10.1002/2015GC005930 © 2015 American Geophysical Union Received: May 27, 2015; Revised: Sep 11, 2015; Accepted: Sep 25, 2015 This article is protected by copyright. All rights reserved.
Transcript of Magnetostratigraphic constraints on the age of the lower Beaufort Group, western Karoo basin, South...

Magnetostratigraphic constraints on the age of the lower Beaufort Group,
western Karoo basin, South Africa, and a critical analysis of existing U-Pb
geochronological data
E. Tohver1, L. Lanci2, A. Wilson3,† J. Hansma2, S. Flint3
1) School of Earth and Environment, University of Western Australia, 35 Stirling Hwy, Crawley,
WA, Australia.
2). DiSBeF, University of Urbino, Via S. Chiara 23, Urbino, Italy
3) School of Earth, Atmospheric and Environmental Sciences, University of Manchester,
Williamson Building, Oxford Road, Manchester, M13 9PL, United Kingdom.
† Now at Taskfronterra Geosciences, 24 Riseley Street, Ardross,WA, Australia.
Key Points:
- Primary magnetizations are preserved in the lower Beaufort Group in the Karoo Basin.
- The magnetostratigraphy is compatible with a late Permian age for the Beaufort Group.
- A re-examination of existing data from the underlying Ecca Gp. indicates a mid-
Permian age.
Research Article Geochemistry, Geophysics, GeosystemsDOI 10.1002/2015GC005930
This article has been accepted for publication and undergone full peer review but has not beenthrough the copyediting, typesetting, pagination and proofreading process which may lead todifferences between this version and the Version of Record. Please cite this article asdoi: 10.1002/2015GC005930
© 2015 American Geophysical UnionReceived: May 27, 2015; Revised: Sep 11, 2015; Accepted: Sep 25, 2015
This article is protected by copyright. All rights reserved.

Abstract
We studied 3 partially overlapping sections with a composite thickness of ~600 m in the upper
Permian fluvial siltstones and fine-grained sandstones of the Abrahamskraal Formation, the basal unit
of the Beaufort Group, in the Karoo Basin of Western Cape Province, South Africa. Paleomagnetic
analysis reveals three components of Natural Remanent Magnetization (NRM). Heating to ~180°C
removes a remanent magnetization parallel to the present-day field, which is interpreted as a viscous
overprint. An intermediate unblocking temperature component is removed by heating to 450°C; this
direction is always of normal polarity and is identical to a regional overprint imparted during the Early
Jurassic emplacement of the Karoo Large Igneous Province. A high temperature component isolated
above 450°C is of dual polarity, and is interpreted as primary on the basis of a positive reversals test.
The virtual geomagnetic pole position for the Abrahamskraal Formation computed from the average
high temperature characteristic remanent magnetization direction is in agreement with the late
Permian directions for stable Gondwana and with previous results from the lowermost Abrahamskraal
Formation and Waterford Formation at the Ouberg Pass section. The predominantly normal polarity
of this magnetization is in agreement with either a middle-late Lopingian age (ca. 254-256 Ma) or a
late Guadalupian age (ca. 262 Ma) according to the Global Geomagnetic Polarity Timescale. We
integrate these new results with existing magnetostratigraphic, biostratigraphic, and geochronological
results from the Karoo Basin, with particular emphasis on the controversy over zircon age data
reported from the underlying Ecca Group.
Keywords:
Magnetic stratigraphy, Abrahamskraal Formation, Late Permian, Karoo Basin.
1 Introduction
The Paleo-Pacific or Panthalassan margin of Gondwana is the locus of magmatism, deformation,
and sedimentation, dating from the first Ediacaran-Cambrian assembly of the great southern mega-
continent until its Jurassic break-up. The Cape Fold Belt and the adjacent foreland Karoo Basin of
southern Africa occupy the central segment of this 13,000 km continental margin. Indeed, the
This article is protected by copyright. All rights reserved.

recognition of the common record of punctuated sedimentation and orogeny between the Cape Fold
Belt/Karoo Basin and the Sierra Australes/Chaco-Paraná Basin of South America provided key
evidence for a pre-Atlantic fit of Africa and South America [du Toit, 1937]. In the late Paleozoic,
deformation and orogenic uplift along this margin has been linked by some authors to sedimentary
deposition into the retro-arc foreland basins, i.e. the Karoo Supergroup of the Karoo Basin [Lock,
1978; Winter, 1984; de Wit and Ransome, 1992]. The age of deformation in the Western Cape Fold
Belt is constrained by new 40Ar/39Ar muscovite ages of 275 – 260 Ma [Hansma et al., 2015]. These
new age data provide a firm basis for tectonostratigraphic correlation with the foreland basin deposits,
calling for better age resolution of the Karoo Supergroup itself.
Although the broad lithostratigraphy of the Karoo Supergroup is well established [e.g., Smith et
al., 1993; Catuneau et al., 2005], detailed correlations are complicated by the heterolithic nature of
continental sedimentary rocks. For example, the dynamic fluvial systems that deposited the Beaufort
Group strata generated laterally-variable facies over local and regional scales [e.g., Gastaldo et al.,
2005; Ratcliffe et al., 2015]. Furthermore, present chronostratigraphic constraints reflect a mixture of
vertebrate biostratigraphy [e.g., Rubidge, 1995;Ward et al., 2005], palynological zonation [e.g.,
Barbolini 2014], U-Pb geochronology on volcanic ashbeds [e.g., Fildani et al., 2007, Fildani et al.,
2009; Lanci et al., 2013; Rubidge et al., 2013; Gastaldo et al., 2015], and magnetostratigraphy [de
Kock and Kirschvink, 2004; Ward et al., 2005; Lanci et al., 2013, Gastaldo et al., 2015]. There are
shortcomings inherent to each of these approaches, as well as calibration problems created by the
combination of chronostratigraphic techniques; for example, the geomagnetic reversal pattern for the
late Permian Global Polarity Timescale is not fully resolved, and the geochronologic age for the
boundaries of the magnetochrons is ill-defined [Steiner, 2006, Shen et al., 2011; Gradstein et al.,
2012, Szurlies , 2013]. In this contribution, we present new magnetostratigraphic data from the lower-
middle Beaufort Group, and integrate these results with previous magnetostratigraphic and existing
chronostratigraphic data in order to address contradictory ages reported for the Ecca Group and
overlying Beaufort Group. In particular, we examine the existing SHRIMP U-Pb zircon data from
ashbeds in the Ecca Group to assess the validity of the latest Permian age interpretation for those
rocks [Fildani et al., 2009, McKay et al., 2015].
This article is protected by copyright. All rights reserved.
2. Regional Geology
The Karoo Basin lies north of the Cape Fold Belt, and the Karoo Supergroup comprises the
erosional detritus shed from the uplifting Cape Fold Belt [Hälbich, 1983; Catuneanu et al., 1998]. The
Karoo Supergroup itself overlies the early-to-middle Paleozoic Cape Supergroup, principally
composed of quartzose sandstones and subordinate shale that were deformed and metamorphosed
during the late Permian Cape Orogeny [Hälbich, 1983; Hansma et al., 2015]. The base of the Karoo
Supergroup is defined by glacio-marine diamictites of the Permian-Carboniferous Dwyka Group,
which is overlain by deep-water turbidites to fluvio-deltaic sediments of the Ecca Group. The
Beaufort Group conformably overlies the Ecca Group, and is dominated by fluvial sandstones and
mudstones [e.g., Smith et al., 1993; Catuneau et al., 2005]. The base of the Beaufort Group marks the
sedimentologic shift from deep-water, marine and deltaic facies to fluvial systems with episodic
subaerial exposure, marked in the field by the lowermost occurrences of reddish, oxidized mudstones.
The Abrahamskraal Formation is the lowest unit of the Beaufort Group, and this formation comprises
a ~2 km-thick sequence of mudstones and sandstones [Day and Rubidge, 2014].
The lithostratigraphic divisions of the Karoo Group are well-defined, but the absolute age
information is limited and some degree of diachronism is expected. Biostratigraphic ages for the
Karoo Supergroup are based upon palynologic and faunal vertebrate records. The Ecca Group hosts a
Early to Middle Permian palynologic assemblage [Anderson, 1977; Falcon, 1989; Barbolini, 2014;
Ruckwied et al., 2014], with the occurrence of Mesosaurus fossils in the distinctive Whitehill
Formation [von Huene, 1940] in the lower Ecca Group establishing a clear tie-point to the ca. 278 Ma
Iratí Formation of the Passa Dois Group in the Paraná Basin of South America [Santos et al., 2006].
The contact between the Ecca Group and the Beaufort Group is defined as the boundary between the
Eodicynodon and Tapinocephalus assemblage zones [Rubidge et al., 1999]. The Abrahamskraal
Formation lies within the Tapinocephalus zone [van der Walt et al., 2010; Day and Rubidge, 2014;
Jirah and Rubidge, 2014]. The upper Beaufort Group is interpreted to preserve a record of the
Permian-Triassic mass extinction, which is represented by the boundary between Dyconodon and
Lystrosaurus zones [e.g., Maxwell, 1992; Botha and Smith, 2007; cf. Gastaldo et al., 2015].
This article is protected by copyright. All rights reserved.

To complement this biostratigraphic database, there is a growing body of U-Pb zircon ages from
volcanic ash-beds that are preserved in the Karoo Supergroup. The Dwyka Group is considered to be
about 302-290 Ma in age based on ID-TIMS analysis of zircon [Bangert et al., 1999]. Studies of the
overlying Ecca Group were carried out using the U-Pb SHRIMP method on zircons from volcanic
ashes [Fildani et al., 2007; Fildani et al., 2009; McKay et al., 2015]. These authors jointly interpret an
age range of 252 – 276 Ma for deposition of the Ecca Group. However, the younger portion of this
age range contradicts the 262 – 268 Ma age determined for the uppermost Ecca Group and basal
Beaufort Group by Lanci et al. [2013] using U-Pb SHRIMP zircon geochronology paired with
magnetostratigraphy. These latter authors report the 262 – 268 Ma age range as consistent with the
presence of several normal polarity magnetozones, indicating an age younger than the Permo-
Carboniferous Reverse Superchron (also known as the Kiaman Superchron). The ID-TIMS analysis of
the middle Beaufort Group revealed U-Pb ages of 255 – 268 Ma using the chemical abrasion ID-
TIMS method on zircon [Rubidge et al., 2013]. Notably, these last authors suggested a minimum age
of 261.24 Ma for the top of the Tapinocephalus zone.
3. Sampling locality description.
The studied sections are located at three closely-spaced localities north of the town of Laingsburg
along the Buffels River (Fig. 1). The three sections comprise the entire stratigraphic record exposed
by an open, NNE-SSW oriented syncline that plunges shallowly to the E. The sections were
measured, logged, and sampled from limb to core, i.e., from oldest to youngest. The lowermost “Great
Wall” (GW) river cliff section (GPS coordinates S 33° 00.2’, E 20° 59.4’) crops out along the Buffels
River (Fig. 1) and can be correlated lithologically by walking out beds and using LiDAR data and
Google Earth images (accessed February 2012) with the adjacent “Link” (LK) section (GPS
coordinates S 33° 01.2’, E 20° 58.8’) which is in turn correlated to the uppermost “Bloukrans” (BK)
section (GPS coordinates S 33° 02.9’, E 20° 56.3’) using aerial photos (Google Earth). The three
sections altogether encompass the middle and upper part of the mudstone dominated fluvial
This article is protected by copyright. All rights reserved.

Abrahamskraal Formation [Wilson et al., 2014] for a composite thickness of about 600 m, with gap of
about 5 m between the top of the GW section and the bottom of the LK section.
Evidence of the pervasive tectonic strain affecting the Cape Belt a few km south is shown at the
studied locality by gentle folding, but pervasive rock fabrics are absent [Hälbich, 1994]. A poorly-
developed cleavage is apparent from flat joint surfaces decorated by sub-millimeter thick, bladed
calcite, which we interpret as parting along an incipient cleavage fabric. This incipient cleavage has
an E-W orientation parallel to regional fold-axes. Bedding is sub-horizontal at GW ranging from
035/05 (dip direction/plunge) to 220°/05°; it ranges from 210°/28° to 210°/30° at LK and is 145°/13° at
BK. The base of the GW-LK-BK section was mapped at 340 m stratigraphically above the first red
bed occurring along the Buffels River north of Laingsburg. All three sections expose similar
lithologies and, as discussed later, magnetic properties. Standard 2.5 cm diameter paleomagnetic
samples were taken from all exposed beds at an average stratigraphic interval of ~2m using a
gasoline-powered drill. Samples were oriented using magnetic and solar compasses. Bulk magnetic
susceptibility was measured in the field using a hand-held SM20 magnetic susceptibility meter
manufactured by GF Instruments.
4 Results
4.1 Magnetic Susceptibility and Tectonic Fabric
The bulk magnetic susceptibility measurement shows an aperiodic variation of SI values in the
102 – 104 range, with the highest values associated with cm-scale, black horizons in coarse-grained
sandstone beds. Electron dispersive spectroscopy of polished thin sections of these horizons indicates
the predominance of low-Ca, low-Mn almandine-pyrope garnets and ilmenite, suggestive of a
basement source region that contains amphibolite- to granulite-facies pelitic or mafic rocks [Arosio,
2013]. In contrast, the highest bulk susceptibility values from the Ouberg Pass never exceeded 101 SI
units, indicating increasing values of magnetic susceptibility up-section for the Beaufort Group, with
implications for evolving source area(s). The presence of placer deposits of heavy minerals derived
from metamorphic basement suggest that a significantly exhumed basement source region contributed
This article is protected by copyright. All rights reserved.
to the detrital input, in addition to erosional recycling of the low-grade metasedimentary rocks that
form the Cape Supergroup.
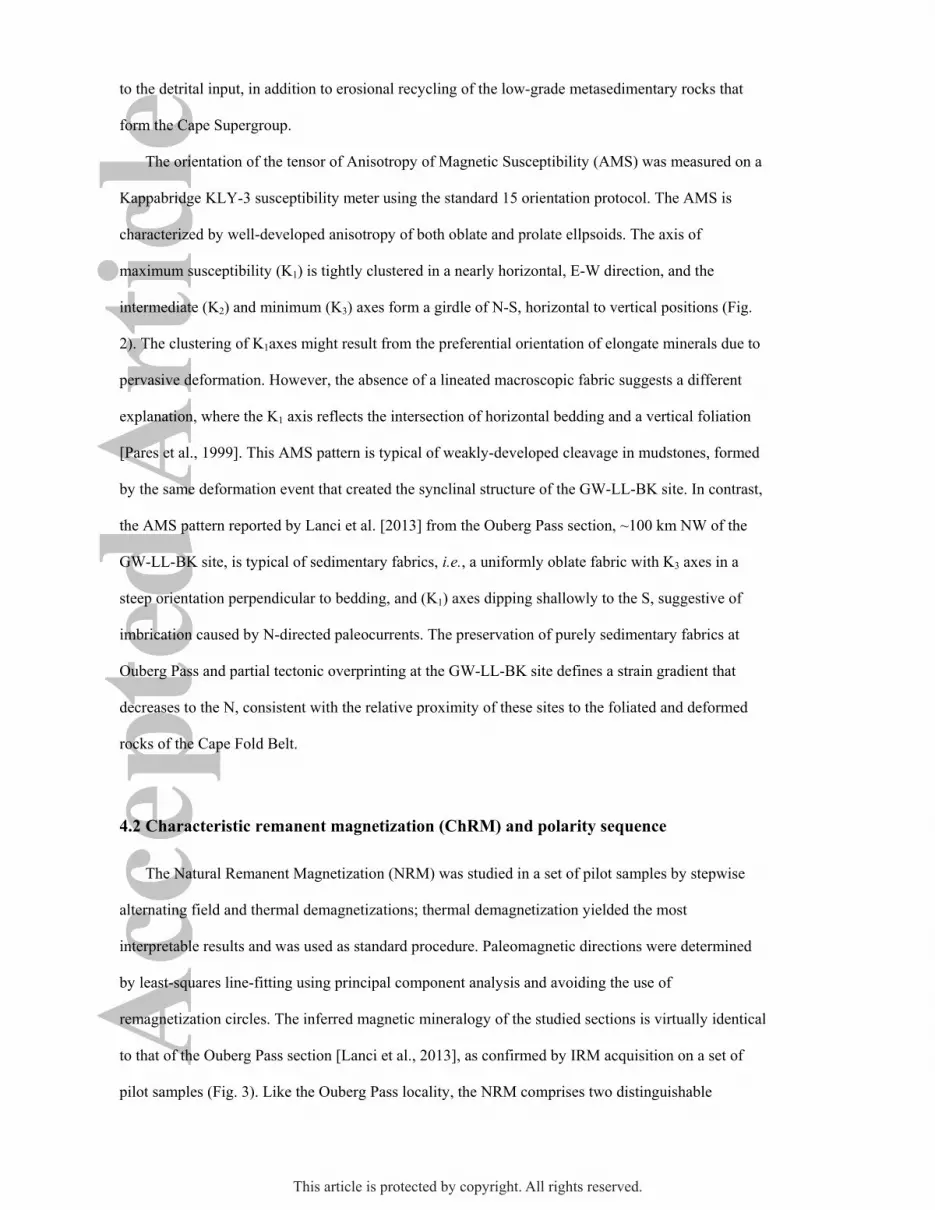
The orientation of the tensor of Anisotropy of Magnetic Susceptibility (AMS) was measured on a
Kappabridge KLY-3 susceptibility meter using the standard 15 orientation protocol. The AMS is
characterized by well-developed anisotropy of both oblate and prolate ellpsoids. The axis of
maximum susceptibility (K1) is tightly clustered in a nearly horizontal, E-W direction, and the
intermediate (K2) and minimum (K3) axes form a girdle of N-S, horizontal to vertical positions (Fig.
2). The clustering of K1axes might result from the preferential orientation of elongate minerals due to
pervasive deformation. However, the absence of a lineated macroscopic fabric suggests a different
explanation, where the K1 axis reflects the intersection of horizontal bedding and a vertical foliation
[Pares et al., 1999]. This AMS pattern is typical of weakly-developed cleavage in mudstones, formed
by the same deformation event that created the synclinal structure of the GW-LL-BK site. In contrast,
the AMS pattern reported by Lanci et al. [2013] from the Ouberg Pass section, ~100 km NW of the
GW-LL-BK site, is typical of sedimentary fabrics, i.e., a uniformly oblate fabric with K3 axes in a
steep orientation perpendicular to bedding, and (K1) axes dipping shallowly to the S, suggestive of
imbrication caused by N-directed paleocurrents. The preservation of purely sedimentary fabrics at
Ouberg Pass and partial tectonic overprinting at the GW-LL-BK site defines a strain gradient that
decreases to the N, consistent with the relative proximity of these sites to the foliated and deformed
rocks of the Cape Fold Belt.
4.2 Characteristic remanent magnetization (ChRM) and polarity sequence
The Natural Remanent Magnetization (NRM) was studied in a set of pilot samples by stepwise
alternating field and thermal demagnetizations; thermal demagnetization yielded the most
interpretable results and was used as standard procedure. Paleomagnetic directions were determined
by least-squares line-fitting using principal component analysis and avoiding the use of
remagnetization circles. The inferred magnetic mineralogy of the studied sections is virtually identical
to that of the Ouberg Pass section [Lanci et al., 2013], as confirmed by IRM acquisition on a set of
pilot samples (Fig. 3). Like the Ouberg Pass locality, the NRM comprises two distinguishable
This article is protected by copyright. All rights reserved.

components, as well as a present-day field overprint, which is completely removed by heating to 150
°C where present. A consistently observed paleomagnetic direction (component-A) is isolated by
stepwise heating to temperatures between 150 °C and 450 °C and AF peak field below 90 mT.
Component-A is well grouped and features a single, normal polarity with a Fisher mean direction of
about Dec. 344.3/ Inc. -56.6. This mean direction is practically identical to the homonymous
component from Ouberg Pass [Lanci et al., 2013], is isolated within the same range of temperatures,
and is consistent with a well-known regional, secondary overprint [e.g., Ballard et al., 1986].
Component-A from this study and from Lanci et al. [2013] are plotted in Fig. 4 for a direct
comparison.
The higher laboratory unblocking temperature magnetization (Component-B), which was
interpreted as Characteristic Remanent Magnetization (ChRM), was isolated by thermal
demagnetization at temperatures ranging from 450 °C to 580 °C. A small number of samples,
probably hematite-bearing, show maximum unblocking temperatures higher than 600 °C. Notably, not
all samples exhibit both components A and B; in particular Component-B was successfully isolated
only in about one-third of the measured samples (n=98, N=261). Most of the specimens that failed to
show component-B were either completely demagnetized by heating to 450 °C or became unstable at
higher temperatures. Samples that preserve both the A-component and a normal polarity B-
components are typically marked by an inflection in declination from a NNW to a NW-WNW
direction, with little change in inclination. The inflection point commonly occurs at ~450°C of
laboratory heating (e.g., samples LS27A in Fig. 8 and sample BK32a in Fig 9). This inflection is
much more obvious for samples that preserve the A-component and a reversed polarity B-component
(e.g., samples GW40C and GW93A in Fig, 7, Sample BK42A in Fig. 9). A group of about 40
samples, mainly from the upper part of the BK section that were sampled up to the ridgeline (meters
190 – 300, stratigraphic height in BK) showed high intensities of magnetization and well-aligned,
single-component NRMs. The directions of magnetization for these ridgeline samples appear to be
random, with highly dispersed declinations and mostly shallow inclinations. This group of samples
were interpreted as remagnetized by lightning and disregarded from further consideration.
This article is protected by copyright. All rights reserved.

Tilt-corrected paleomagnetic directions from Component-B (Fig. 5a) pass a B-class reversal test
(critical angle γc = 9.48°; Table 1). The distributions of ChRM directions from Ouberg Pass and this
study overlap when plotted on the same equal area diagram (Fig. 5b) and the joint set of ChRM
directions shows a dual polarity, antipodal directions that pass a reversal test (Fig. 6).Some
improvement in the critical angle value for the compiled data set (γc = 5.92°) reflects the similar
proportions of normal and reversed directions. ChRM directions (Component-B) from this study are
similar to the results from Oubergpas (Table 2). The latitude of the virtual geomagnetic pole (VGP
Lat.) are plotted in Figs. 7-9 for the GW, LK and BK sections, respectively, together with
representative examples of orthogonal vector plots. In the resulting composite magnetic stratigraphy
(Fig. 9), which has a prevalence of normal polarity magnetizations, we identify three normal and three
reverse polarity zones. Each polarity zone was defined on the basis of two or more stratigraphically
consecutive samples with the same polarity.
5 Discussion
5.1 Stratigraphic correlation and magnetostratigraphic considerations
The rock-magnetic properties, the direction of the magnetic overprint related to the Karoo Large
Igneous Province, and the average ChRM direction from this study are all very similar to those
reported in the uppermost Waterford Formation and lowermost Abrahamskraal Formation at the
Ouberg Pass by Lanci et al. [2013]. However, the composite GW-LK-BK section has a predominance
of normal geomagnetic polarity magnetozones, which contrasts with the dominantly reverse polarity
of Wordian/Capitanian stages, the time interval of deposition of the uppermost Ecca Group and
lowermost Abrahamskraal Fm. at Ouberg Pass [Lanci et al., 2013]. No ash beds were identified in the
GW-LK-BK section, so there is no geochronologic data that we can use to better define the age of
sedimentation and acquisition of a ChRM. In the following discussion, we attempt to place these new
magnetostratigraphic results into the context of both the stratigraphy of the Karoo Basin, current
knowledge of the Global Geomagnetic Polarity Timescale, and existing geochronologic datasets that
serve to define the upper and lower bounds of age of the GW-LK-BK section.
This article is protected by copyright. All rights reserved.

The geochronologic and magnetostratigraphic datasets reported by Lanci et al. [2013] form the
first constraint on the age of the GW-LK-BK section. A physical correlation of strata between these
two localities is impossible because of the ~100 km distance between the section localities, and the
degree to which sedimentation rates vary over this distance is unknown. Our use of the contact
between the Ecca Group (Waterford Fm.) and the Beaufort Group (Abrahamskraal Fm.) as a first-
order datum (marked by a dashed white line in Fig. 1C) places the GW-LK-BK sections
stratigraphically higher than the Ouberg Pass section. The stratigraphic thickness between the base of
the GW section and the top of the underlying Waterford Formation was calculated based on map
relations to be ~340 m. The lowermost Abrahamskraal Formation in the Ouberg Pass section is
dominated by reversed polarity magnetozones, with short, normal polarity magnetozones interpreted
to represent some part of the lower part of the Illawarra series, which post-dates the Permo-
Carboniferous Kiaman Reversed Superchron [Lanci et al., 2013]. This age assignment for the Ouberg
Pass section is in agreement with the 262-268 Ma range in ages of volcanic ashbeds found in this
~600 m thick section [Lanci et al., 2013], and the ca. 260 Ma ID-TIMS zircon age determined for the
upper Koonap Fm., the lateral equivalent of the Abrahamskraal Fm ~500 km east of our study area
[Rubidge et al., 2013].
Following the stratigraphy outlined by Catuneanu et al. [2005], we present two possible
interpretations for the magnetozones observed in the GW-LK-BK section. One possible interpretation
correlates the normal magnetozones of the GW-LK-BK sections with the N1-N3 “Capitanian” normal
zone (ca. 262 – 264 Ma), and indicates an equivalent age of the GW-LK-BK section with the
uppermost portion of the Ouberg Pass section. However, the greater thickness of the Capitanian
normal zone in the GW-LK-BK section implies a sedimentation rate about one order of magnitude
higher than that deduced for the Ouberg Pass section (~70 m/Ma). Such a change in sedimentation
rates may be feasible for fluvial environments associated with mega-fan architecture described for the
study area by Wilson et al. [2014] and Ratcliffe et al. [2015]. The second interpretation involves
correlating the N1-N3 normal polarity intervals to the uppermost part of the Illawarra mixed-polarity
zone, i.e. the middle Wuchiapingian to early Changshingian (ca. 254 – 257 Ma).
5.2 Inclination shallowing and pole position
This article is protected by copyright. All rights reserved.

We applied the Elongation-Inclination methods of Tauxe and Kent [2004] to examine the
GW-LK-BK rocks for the effects of sediment compaction and attending inclination shallowing.
Unlike the results from the Ouberg Pass section [Lanci et al., 2013], the composite BK-LK-GW
dataset does not exhibit significant inclination shallowing for the B paleomagnetic direction despite
the fact that the average direction and pole position is virtually identical to those of Ouberg Pass.
Conversely, the same analysis on the entire set of ChRM directions from Lanci et al. [2013] and this
study, gave again an E-I corrected inclination of -62.9° with a relatively large confidence interval and
a flattening of about 9.6° (Table 2), possibly due to the influence of the Ouberg Pass data on the
overall distribution. No significant inclination shallowing was identified using the E-I technique on
the A-component directions from the joint set of Lanci et al. [2013], as expected given its origin as
post-compaction, thermal overprint. Whether or not the inferred inclination shallowing is a real
feature of the paleomagnetic record cannot be established, but the E-I uncorrected average pole
position for the whole set of samples from the Abrahamskraal and Waterford Formations reported in
Table 2, is consistent with the pole position reported by De Kock and Kirschvink [2004] for sediments
that potentially span the Permian-Triassic boundary.
5.3 U-Pb geochronological data and age controversy
Either of the two correlations proposed for the new magnetostratigraphic data are consistent with
other geochronologic data from the Beaufort Group [Lanci et al., 2013; Rubidge et al., 2013; Gastaldo
et al., 2015]. There exists an outstanding controversy regarding the age of the underlying Ecca Group,
based on the geochronologic results presented by Fildani et al., [2007, 2009] and recently extended by
McKay et al. [2015]. The former two contributions reported U/Pb SHRIMP zircon ages ranging from
274.8 to 252.7 Ma for ash deposits in the Laingsburg Formation (Ecca Group), which underlies the
Abrahamskraal Formation near our study area. Taken at face value, the Fildani et al. [2007, 2009]
results would place the upper Ecca Group in the latest Permian, thus implying a Triassic age for the
overlying Abrahamskraal Formation. This age assignment was reinforced by McKay et al. [2015],
who reported additional U-Pb SHRIMP zircon data from ashbeds in the Ecca Group rocks of the
Tanqua, Central Basin, and Ripon depocentres. McKay and colleagues [2015] propose that the
This article is protected by copyright. All rights reserved.

“inverted” age stratigraphy represents an early Triassic period of zircon exhaustion in the putative
source for these ashbeds, the Choiyoi magmatic province of Argentina, pointing to the presence of
recycled zircon in the ca. 245 Ma Puesto Viejo Formation studied by Domeier et al. [2011a,b].
There are three substantial problems with the 250-255 Ma age intepretation for the upper Ecca
Group strata. First, assigning the Ecca Group to the latest Permian ignores the existing
biostratigraphic observations presented by faunal [Rubidge, 1990; Smith and Keyser, 1995; Rubidge
et al., 1999] and palynologic data [Barbolini, 2014], which uniformly support correlation with middle
Permian rocks of the other Gondwanan continents. Because most period or era boundaries are
fundamentally biostratigraphic divisions, e.g., the Permian-Triassic boundary separating Paleozoic
and Mesozoic biota, abandoning these constraints ignores an enormous, coherent body of
chronostratigraphically vital data. A second contradiction is posed by the identification of post-
Kiaman magnetic polarity zones and associated 262-268 Ma SHRIMP zircon ages reported by Lanci
et al. [2013] from the basal Abrahamskraal Fm., consistent with CA-TIMS U-Pb zircon ages of 255 –
268 Ma reported by for the lower and middle Beaufort Group [Rubidge et al., 2013] , and a new ca.
253 Ma age for a volcanic porcellanite in the uppermost Beaufort Group reported by Gastaldo et al.
[2015]. Though the “zircon exhaustion” hypothesis could explain the problem of apparently inverted
stratigraphy, there is no documentation at present as to the true source of the Karoo ash deposits. The
presence of inherited zircons in the Puesto Viejo Fm. of Argentina [Domeier et al., 2011b] does not
prove that all ash deposits of late Permian age in the Karoo Basin contain exclusively inherited zircon.
The third contradiction stems from the association between the Cape Fold Belt and foreland basin
sediments of the Karoo Supergroup. Extensive faulting and folding has affected the Ecca Group in the
Laingsburg region, which is situated in the fold-thrust portion of the Cape Fold Belt. New 40Ar/39Ar
data reported by Hansma et al. [2015] from shear zones along strike from Laingsburg indicate that this
section of the fold-thrust belt was active between 260 and 275 Ma. This range of deformation ages
provides a minimum constraint of ca. 260 Ma for the deposition of the Ecca Group strata.
Because this disagreement arises solely from different interpretations of U-Pb SHRIMP
geochronologic data, we consider that the problem may be resolved by uniform scrutiny of the U-Pb
zircon data. Lanci et al. [2013] argued that the “young” age interpretations reported by Fildani et al.
This article is protected by copyright. All rights reserved.

[2009] could reflect undetected Pb-loss from a relatively small number of zircon grains, a problem
compounded by the use of the single youngest, concordant zircon grain (or grains, in some cases) as
the basis of the age interpretation. This selection implies that all older zircons are inherited
xenocrysts, which introduces a young bias to the age interpretation. We have re-examined the U-Pb
zircon dataset reported by Fildani et al. [2007] and Fildani et al. [2009] to explore alternative age
interpretations that might mitigate the disagreement. Specifically, we have employed a more
conservative criterion that assigns an age to the youngest population of zircons, which we interpret as
the eruption age of the ashbed. Notably, the precision of secondary ions mass spectrometry isotopic
data for ages <500 Ma does not commonly allow for discordance to be detected, only suspected. The
loss of Pb from a zircon grain results in migration of the analytical result towards the origin in U-Pb
space. For ages of ca. 250 Ma, the Pb-loss discordant array is parallel to the concordia curve, so Pb-
loss can occur without being detected. This creates the quandary of analytically concordant data that
are not marked by inordinately high common Pb, so the initial suspicion of undetected Pb-loss is
based solely on the fact that such grains are outliers to the main population. Fortunately, a reasonably
large amount of analytical data from different zircon grains is easily obtainable with the SHRIMP, so
that coherent populations can be recognized. Where undetected Pb loss is suspected, the grain(s) so
affected should be younger than the youngest unaffected zircon population.
In considering the age of the Ecca Group ashbeds, we restrict our re-interpretation of ages to those
data reported by Fildani et al. [2009] from the ashbeds in the Laingsburg region, avoiding the
uncertain correlation between separate submarine fan deposits of the Lainsburg and Tanqua regions,
which are ~100 km apart. This caution is warranted by reported diachroneity in the age of the contact
between Ecca Group and Beaufort Group strata [Turner, 1999; Rubidge et al., 1999]. Similar
reasoning leads us to exclude the Ripon depocentre data recently presented by McKay et al. [2015] as
well, although the arguments made below pertain to that dataset as well. We use the TuffZirc
algorithm [Ludwig, 2009] to identify zircon populations that we interpret as the best geochronologic
estimate of an eruption age (Table 2). Results from the TuffZirc analysis yield ages in the 265-275 Ma
range (Fig. 11), which is in reasonable agreement with the 262-268 Ma age assignment for the
uppermost Ecca Group and lowermost Beaufort Group exposed at Ouberg Pass [Lanci et al., 2013].
The notable exception to this 265-275 Ma age range is sample CVX-12, which presents a TuffZirc
This article is protected by copyright. All rights reserved.

age of 256 +2/-3 (n=8, 93% conf.), somewhat older than the mean-weighted 206Pb/238U age of 252.7 ± 4
Ma (n=6, 2σ error) reported by Fildani et al. [2009]. Although the consistent age stacking based on the
youngest single grain approach would appear to support the interpretation of Fildani et al. [2009], the
ages with stated 2σ errors for the TuffZirc population are also compatible with the known
stratigraphic sequence. This is shown by Monte Carlo simulations, which provide a “best fit” age
model for stratigraphically ordered samples. For the purposes of this paper, the 266 to 276 Ma age
range identified by the Monte Carlo “best fit” ages is regarded as the depositional age interval of the
Ecca Group (Fig. 11). This age range agrees with the biostratigraphic data for vertebrate fauna, i.e.,
the Eodicynodont zonation of the Ecca Group-Beaufort Group contact [Rubidge et al., 1999], as well
as new palynologic data for the Ecca Group [Barbolini, 2014].
The hypothesis of undetected Pb-loss in the zircons that yielded “young” ages underpins this re-
interpretation of the published age dataset, and requires further explanation and substantiation.
Notably, all of the problematic data were obtained almost exclusively from ashbeds in the most
deeply-buried sections of the middle Ecca Group, where illite crystallinity data reported by Halbich et
al. [1983] suggest low-grade metamorphic temperatures in the range of 170 – 200°C. This is the
temperature range for which fluid-mediated lattice damage begins to occur in zircon [Geisler-
Wierville et al., 2002; Geisler et al., 2007], so our contention of undetected Pb-loss has a firm
experimental basis. We followed two lines of inquiry to substantiate the Pb-loss hypothesis. First, we
searched for evidence of Pb-loss by looking for systematic differences between the 235U/207Pb age
(t207) and the 238U/206Pb age (t206) in zircon grains. Discordance caused by Pb loss affects the two U/Pb
isotopic systems differently because of different relative abundances of parent-daughter isotopes, with
discordance typically marked by a trend of t207 > t206. No such trend is evident from the “young”
population, mostly due to the large errors associated with t207 based on analytical uncertainty in the
measured abundance of 207Pb. The second approach seeks to differentiate the “too-young” population
on the basis of chemistry, specifically, the levels of U and Th. Because Pb-loss in zircon is generally
considered to result from damage to the crystal lattice through accumulated radiation dosage, we
would expect metamictization in the youngest grains to result from higher U and Th content due to
higher accumulated radioactive dosages. To test this, we examined the U and Th contents of the
This article is protected by copyright. All rights reserved.

youngest grains, which were defined as those that lie outside the youngest TuffZirc population mode.
For comparison, the U and Th contents of the concordant, <300 Ma grains were also examined, as
well as the discordant zircon populations that were reported but not interpreted for age information by
Fildani et al. [2007, 2009]. Not surprisingly, the highest combined U and Th concentrations are found
in the discordant population (n=52), with a median value of 1200 +380/-360 ppm (95% confidence). The
zircon population that is equivalent in age to the TuffZirc age or older has a median combined U and
Th content of 790 +53/-120 ppm (95% conf.), significantly lower than the discordant dataset. The
“young” zircon population has a median U+Th content of 868 +110/-130 (95% conf.), and the youngest
sample (CVX12) reported by Fildani et al. [2009] has a combined U+Th content of 1167 +470/-250 ppm
(95% conf.). Taken together, these observations suggest a systematic shift towards more radioactive
content for the anomalously young population of zircon grains (Fig. 11), reinforcing our suspicion that
undetected Pb-loss caused by increasing radiation dosage and attendant metamictization has affected
this population. Confirmation of this Pb-loss hypothesis requires thermal ionization mass
spectrometry analysis of these grains, preferably preceded by chemical abrasion.
6. Conclusions
The paleomagnetic directions and rock-magnetism of the upper part of the Abrahamskraal
Formation in the lower Beaufort Group studied in the composite, 600 m thick Great Wall, Link, and
Bloukrans sections are virtually identical to that studied at the Ouberg Pass. Intermediate- and high-
temperature components (A and B, respectively) of the NRM have been isolated at both locations at
the same temperature ranges and their directions are perfectly overlapping. The intermediate
temperature Component-A is interpreted to result from regional heating caused by the emplacement of
widespread Karoo intrusions in the Early Jurassic. Paleomagnetic directions are consistent with
previous work and increase the available data contributing to a Late-Permian geomagnetic pole
position for the African plate. The magnetostratigraphy of this composite section indicates the
prevalence of normal polarity magnetozones, which is clearly different from the dominantly reversed
polarity of the Ouberg Pass site. We present two alternative interpretations: hypothesis 1 assigns a
Capitanian age (ca.266–260 Ma) to the GK-LK-BK composite section, providing a correlation with
This article is protected by copyright. All rights reserved.

the Ouberg Pass stratigraphy. This interpretation requires an order of magnitude increase in
sedimentation rate for GW-LK-BK section. Hypothesis 2 posits a correlation to the normal polarity
zones that predominate during the middle Wuchianpingian to middle Changshingian times (ca. 256 –
254 Ma). Both interpretations contradict are inconsistent with recent interpretations of a late Permian
age for the underlying Ecca Group. Our re-examination of the U/Pb zircon data from ashbeds used for
this late Permian age interpretation for the upper Ecca Group indicates higher U+Th content in
putatively latest Permian grains, highlighting the potential for Pb loss from radiation-damaged grains.
Monte Carlo modeling of TuffZirc populations indicates an age range of 266–276 Ma for deposition
of the upper Ecca Group.
7. Acknowledgements
We would like to thank all persons involved in the Beaufort Project, in particular Anne Powell, A.
Palfrey, T. Payenberg, J. Vermeulen, E. King, K. Ratcliffe, G. Hildred, D. Cole, A. Mistry, M. Yan, J,
Hansma, and M. Danisik. We thank Mr. Vosloo for granting the access to the Bloukrans farm. John
Geissman and Michiel de Kock are both thanked for thoughtful, thorough reviews. This work was
supported by Chevron Australia Pty Ltd. and the Australian Research Council (LP0991834). Data
used in the paper is provided in tables. Detailed data for individual samples can be obtained by writing
This article is protected by copyright. All rights reserved.

8. References
Anderson, J.M., (1977), The biostratigraphy of the Permian and Triassic. Part 3. A review of
Gondwana palynology with particular reference to the northern Karoo Basin, South Africa.
Mem. Bot. Surv. S. Afr, 4, 1–33.
Arosio, R., (2012), Detrital studies on the Abrahamskraal Formation from the Karoo Basin and their
implications for the uplift of the Cape Fold Belt, Unpublished M.Sc. thesis, University of
Western Australia, Perth. 74 p.
Ballard, M. M., R. Van der Voo, and I. W. Hälbish,,(1986), Remagnetization in Late Permian and
Early Triassic rocks from southern Africa and their implication for Pangea reconstruction,
Earth and Planet. Sci. Lett., 79, 412-418.
Bangert, B., Stollhofen, H., Lorenz, V., Armstrong, R., (1999), The geochronology and significance of
ash-fall tuffs in the glaciogenic Carboniferous-Permian Dwyka Group of Namibia and South
Africa. J. Afr. Earth Sci., 29, 33-49.
Barbolini, N. (2014), Palynostratigraphy of the South African Karoo Supergroup and correlations with
coeval Gondwanan successions. Unpublished Ph.D. Thesis, University of the Witswatersrand,
South Africa, 386 p.
Botha, J., Smith, R.M.H., (2007), Lystrosaurus species composition across the Permo-Triassic
boundary in the Karoo Basin of South Africa. Lethaia, 40, 125-137.
Catuneanu, O., Hancox, P.J., Rubidge, B.S., (1998), Reciprocal flexural behaviour and contrasting
stratigraphies: a new basin development model for the Karoo retroarc foreland system, South
Africa. Basin Res., 10, 157-178.
Catuneanu O., H. Wopfner, P.G. Eriksson, B. Cairncross, B.S. Rubidge, R.M.H. Smith, P.J. Hancox
(2005), The Karoo basins of south-central Africa, J. Afr. Earth Sci., 43, 211–253.
This article is protected by copyright. All rights reserved.

Day, M.O., and Rubidge, B.S., (2014), brief lithostratigraphic review of the Abrahamskraal and
Koonap formations of the Beaufort Group, South Africa: Towards a basin-wide stratigraphic
scheme for the Middle Permian Karoo. J. Afr. Earth Sci., 100, 227–242.
De Kock, M. and Kirschivink, J. (2004), Paleomagnetic constraints on the Permian-Triassic boundary
in terrestrial strata of the Karoo Supergroup, South Africa: Implications for causes of the end-
Permian extinction event. Gond. Res., 7,175–183.
de Wit, M.J. and Ransome, I.G.D., (1992), Regional inversion tectonics along the southern margin of
Gondwana. In: de Wit, M.J., Ransome, I.G.D. (Eds.). Inversion Tectonics of the Cape Fold
Belt, Karoo and Cretaceous Basins of Southern Africa. Balkema, Rotterdam, pp. 15-21.
Domeier, M., Van der Voo, R., Tomezzoli, R.N., Tohver, E., Hendriks, B.W.H., Torsvik, T., Vizan,
H., Dominguez, A., (2011a), Support for an “A-type” Pangea reconstruction from high-
fidelity paleomagnetic records. Journal of Geophysical Research, 116, B12, art. no. B12114.
Domeier, M., Van der Voo, R., Tohver, E., Tomezzoli, R.N., Vizan, H., Torsvik, T.H., Kirshner, J.,
(2011b), New Late Permian Constraints on the Apparent Polar Wander Path and Paleo-
Marginal Deformation of Gondwana, Geochem. Geophys. Geosyst., 12, Q07002.
du Toit, A.L., (1937). Our Wandering Continents. Oliver and Boyd, London.
Falcon, R.M.S., (1989), Macro and micro-factors affecting coal-seam quality and distribution in
southern Africa with particular reference to the No. 2 seam, Witbank Coalfield, South Africa.
Int. J. Coal Geol., 12,. 681–731.
Fildani, A., N. J. Drinkwater, A. Weislongel, T. McHargue, D. M. Hodgson, and S. Flint (2007), Age
controls on the Tanqua and Laingsburg Deep-Water systems: new insights on the evolution
and sedimentary fill of the Karoo basin, South Africa, J. Sed. Res., 77, 901-908.
Fildani, A., Weislogel, A., Drinkwater, N.J., McHargue, T., Tankard, A., Wooden, J., Hodgson, D.,
Flint, S., (2009), U-Pb zircon ages from the southwestern Karoo Basin, South Africa—
Implications for the Permian-Triassic boundary. Geology, 37, 719–722.
Gastaldo, R.A., Adendorff, R., Bamford, M., Labandeira, C.C., Neveling, J., and Sims, H., (2005),
Taphonomic trends of macrofloral assemblages across the Permian-Triassic bound- ary,
Karoo Basin, South Africa: Palaios, 20, 479–497.
This article is protected by copyright. All rights reserved.

Gastaldo, R.A., Kamo, S.L., Neveling, J., Geissman, J.W., Bamford, M., and Looy, C.V., (2015). Is
the vertebrate-defined Permian-Triassic boundary in the Karoo Basin, South Africa, the
terrestrial expression of the end-Permian marine event? Geology, doi:10.1130/G37040.1
Geisler-Wierwille, T., R. T. Pidgeon, W. Van Bronswijk, and R. Kurtz. (2002), Transport of uranium,
thorium and lead in metamict zircon under low-temperature hydrothermal conditions. Chem.
Geol., 191, 141-154.
Geisler,T., Schaltegger, U., and Tomaschek, F., (2007), Re-equilibration of Zircon in Aqueous Fluids
and Melts. Elements, 3, 43-50.
Gradstein, F.M., Ogg, J., Schmitz, M.A., Ogg, G., (2012), A Geologic Time Scale 2012. Elsevier
Publishing Company.
Hälbich, I.W., Fitch, F.J., Miller, J.A., (1983), Dating the Cape Orogeny, In: Söhnge, A.P.G.,Hälbich,
I.W. (Eds.), Geodynamics of the Cape Fold Belt. The Geological Society of South Africa, pp.
149-164.
Hälbich, I.W., (1994), A structural sequence in low strain sedimentary rocks in the Beaufort Group of
the south-western Karoo and its bearing on syngenetic and epigenetic mineralization: J. Afr.
Earth Sci., 18, 197-208.
Hansma, J., Tohver, E., Schrank, C., Jourdan, F., Adams, D., (2015), The Timing of the Cape
Orogeny: New 40Ar/39Ar age constraints on deformation and cooling of the Cape Fold Belt,
South Africa. Gond. Res., doi:10.1016/j.gr.2015.02.005
Huene, F. von (1940). "Osteologie und systematische Stellung von Mesosaurus". Palaeontographica.
Abteilung A. Palaeozoologie-Stratigraphie, 92, 45–58.
Jirah, S., and Rubidge, B., (2014), Refined stratigraphy of the Middle Permian Abrahamskraal
Formation(Beaufort Group) in the southern Karoo Basin. J. Afr. Earth Sci., 100, 121-135.
Johnson, M.R., Van Vuuren, C.J., Visser, J.N.J., Cole, D.I., Wickens, H. De V., Christie, A.D.M. and
Roberts, D.L. (1997), The Foreland Karoo Basin, South Africa. In: African Basins.
Sedimentary Basins of the world (Ed. K.J. Hsü), 3.
Lanci, L., E. Tohver, A. Wilson and S. Flint, (2013), Upper Permian magnetic stratigraphy of the
lower Beaufort Group, Karoo Basin, Earth Planet. Sci. Lett., 375, 123–134.
This article is protected by copyright. All rights reserved.

Lock, B.E., (1978), The Cape Fold Belt of SouthAfrica; tectonic control of sedimentation. Geol. Ass.
(London). Proc. 89, 263-281.
Ludwig, K., (2009), SQUID 2: A User’s Manual, rev. 12 Apr, 2009. Berkeley Geochron. Ctr.
Spec. Pub. 5, 110 pp.
Maxwell, D., (1992), Permian and Early Triassic extinction of non-marine tetrapods. Palaeontol. 35,
571-583.
McFadden, P.L., and McElhinny, M.W., (1990), Classification of the reversal test in
palaeomagnetism, Geophys. J. Internat., 103, 725-729.
McKay M. P., A. L. Weislogel, A. Fildani, R. L. Brunt, D. M. Hodgson and S. S. Flint (2015), U-Pb
zircon tuff geochronology from the Karoo Basin, South Africa: implications of zircon
recycling on stratigraphic age controls, Internat. Geol. Rev.,
doi:10.1080/00206814.2015.1008592.
Parés, J.M., van der Pluijm, B.A., Dinarès-Turell, J., (1999), Evolution of magnetic fabrics during
incipient deformation of mudrocks (Pyrenees, northern Spain). Tectonophys., 307, 1–14.
Ratcliffe, K. T., Wilson, A., Payenberg, T., Rittersbacher, A., Hildred, G. V., & Flint, S. S. (2015),
Ground truthing chemostratigraphic correlations in fluvial systems. AAPG Bull., 99, 155-180.
Rubidge, B.S., (1990), A new vertebrate biozone at the base of the Beaufort Group, South Africa. Pal.
Afr. 27, 17–20.
Rubidge, B.S., Modesto, S., Sidor, C., and J. Welman, (1999), Eunotosaurus africanus from the Ecca-
Beaufort contact in the Northern Cape Province, South Africa: implications for Karoo Basin
development. S. Afr. J. Sci., 95, 553-555.
Rubidge B. S., D. H. Erwin, J. Ramezani, S. A. Bowring, and W. J. de Klerk (2013), High-precision
temporal calibration of Late Permian vertebrate biostratigraphy: U-Pb zircon constraints from
the Karoo Supergroup, South Africa, Geology, 41, 363–366.
Rubidge B.S. (1995). Biostratigraphy of the Eodicynodon Assemblage Zone. In Biostratigraphy of the
Beaufort Group, pp. 3–7, ed. B.S. Rubidge. South African Committee for Stratigraphy,
Biostratigraphic Series 1. Council for Geoscience, Pretoria.
This article is protected by copyright. All rights reserved.

Ruckwied, K., Götz, A.E., Jones, P. (2014), Palynological records of the Permian Ecca Group (South
Africa): Utilizing climatic icehouse–greenhouse signals for cross basin correlations.
Palaeogeo. Palaeoclimat. Palaeoecol., 413, 167–172.
Santos, R.V., Souza, P.A., Alvarenga, C.J.S., Dantas, E.L., Pimentel, M.M., Oliveira, C.G. de, Araújo,
L.M., (2006), Shrimp U–Pb zircon dating and palynology of bentonitic layers frm the Permian
Irati Formation, Paraná Basin, Brazil. Gond. Res., 9, 456–463.
Shen, S.Z., Crowley, J.L., Wang, Y., Bowring, S.A., Erwin, D.H., Sadler, P.M., Cao, C.Q., Rothman,
D.H., Henderson, C.M., Ramezani, J., Zhang, H., Shen, Y., Wang, X.D., Wang, W., Mu, L.,
Li, W.Z., Tang, Y.G., Liu, X.L., Liu, L.J., Zeng, Y., Jiang, Y.F., Jin, Y. G., (2011),
Calibrating the End-Permian mass extinction. Science, 334, 1367–1372.
Smith, R. M. H., Eriksson, P. G., Botha, W.J., (1993), A review of the stratigraphy and sedimentary
environments of the Karoo-aged basins of Southern Africa. J. Afr. Earth Sci., 16, 143– 169.
Smith R.M.H. and Keyser A.W. (1995), Biostratigraphy of the Tapinocephalus Assemblage Zone. In
Biostratigraphy of the Beaufort Group, pp. 8–12, ed. B.S. Rubidge. South African Committee
for Stratigraphy, Biostratigraphic Series 1.Council for Geoscience, Pretoria.
Steiner, M.B., (2006), The magnetic polarity timescale across the Permian–Triassic boundary. In:
Lucas, S.G., Cassinis, G., Schneider, J.W. (Eds.), Non-MarinePermian Biostratigraphy and
Biochronology. Geol. Soc. London, London, pp. 15–38.
Szurlies, M. (2013), Late Permian (Zechstein) magnetostratigraphy in Western and Central Europe,
Geol. Soc. London Spec. Pub. 376, 73-85.
Tauxe, L., and Kent, D. V. (2004), A Simplified Statistical Model for the Geomagnetic Field and the
Detection of Shallow Bias in Paleomagnetic Inclinations: Was the Ancient Magnetic Field
Dipolar?, in Timescales of the Internal Geomagnetic Field, edited by J. E. T. Channell, D. V.
Kent, W. Lowrie and J. Meert, American Geophysical Union, Washington, D.C.
Turner, B. R., (1999), Tectonostratigraphical development of the Upper Karoo foreland basin:
orogenic unloading versus thermally-induced Gondwana rifting. J. Afr. Earth Sci., 28, 215-
238.
This article is protected by copyright. All rights reserved.

van der Walt, M., Day, M., Rubidge, B., and Cooper, A.K., and Netterberg, I. (2010), A new GIS-
based biozone map of the Beaufort Group (Karoo Supergroup), South Africa. Palaeont. Afr.
45, 1–5.
Ward, P.D., Botha, J., Buick, R., de Kock, M.O., Erwin, D.H., Garrison, G.H., Kirschvink, J.L., and
Smith, R. (2005), Abrupt and gradual extinction among Late Permian land vertebrates in the
Karoo Basin, South Africa: Science, 307, 709–714.
Wilson, A., S. Flint, T. Payenberg, E. Tohver, L. Lanci (2014), Architectural styles and sedimentology
of the fluvial lower Beaufort group, Karoo basin, South Africa, J. Sed. Res., 84, 326-348.
Winter, H. de la R., (1984), Tectonostratigraphy, as applied to the analysis of South African
Phanerozoic basins. Trans. Geol. Soc. S. Afr. 87, 169-179.
This article is protected by copyright. All rights reserved.

Table 1 – Reversal test statistics
573
574
575
576
577
578
579
580
581
582
583
584
585
586
587
588
589
590
591
Great Wall-Link-Bloukrans (GLB)
Reversed directions, N=22 Dec Inc R k alpha(95)Eigen Values T2
conf(95) T1
conf(95)E3 E2 E1 Fisher Statistics 113.0 45.5 20.56 14.62 8.4 - - - - -
Bingham Statistics 113.0 45.7 - - - 19.3 1.92 0.74 0.92 0.89 Normal Directions, N=76
Fisher Statistics 314.8 -55.9 70.58 13.84 4.5 - - - - - Bingham Statistics 315 56.1 - - - 66.03 5.89 4.08 0.57 0.56 Angle between Fisher averages 17
Angle between Bingham averages 17.21 Critical Angle [McFadden and McElhinny, 1990] 9.48
Compiled GLB + OP (Ouberg Pass)
Reversed Directions, N=135 Dec Inc R k alpha(95)Eigen Values T2
conf(95) T1
conf(95)E3 E2 E1 Fisher Statistics 126.5 52.1 120.96 9.55 4.2 - - - - -
Bingham Statistics 126.7 52.4 - - - 109.52 14.32 11.17 0.56 0.55 Normal Directions, N=99
Fisher Statistics 311.8 -54.8 91.62 13.27 4.1 - - - - - Bingham Statistics 312.1 -55.2 - - - 85.41 7.38 6.21 0.54 0.53
Angle between Fisher averages 4 Angle between Bingham averages 4.29
Critical Angle [McFadden and McElhinny, 1990] 5.92
This article is protected by copyright. All rights reserved.

Table 2 - Average paleomagnetic directions (Fisher), the Virtual Geomagnetic Pole position is
computed from the Fisher-mean direction.
Dec. Inc. k 95 N VGP Lat. (dp)
VGP Long. (dm)
VGP Lat.
†
VGP Long.
† A-Component 344.3 -56.6 17.7 3.8 82 76.5
(4.0)
268.6
(5.5)
ChRM (B-Component)
normal
314.8 -55.9 13.8 4.5 76 — —
ChRM (B-Component)
reversed
113.0 45.5 14.6 8.4 22 — —
ChRM (B-Component)
combined
309.0 -53.9 12.8 4.2 98 48.0
(4.1)
274.4
(5.9)
55.7 272.6
ChRM (B-Component)*
this study + Lanci et al.
[2013]
308.7 -53.3 10.8 2.9 234 47.5
(2.8)
274.0
(4.0)
55.2 272.2
E-I corrected
Inclination*
-62.9 56-70** 234 48.9
(8.6)
258.8
(11.0)
56.1 254.1
Domeier et al. [2011]
(volcanic Argentina)
52.4 244.3
(*) SITE COORDINATE: Lat. = -32.7 Long. = 20.6 (**) Bootstrapped 95% confidence interval. (†) Rotated to northwest Africa (Adria) coordinates using rotation parameters of Lottes and Rowley {1990].
This article is protected by copyright. All rights reserved.

Table 3 - Reinterpreted of Ecca Grp data from Fildani et al. [2009].
Ecca Group Laingsburg region
Fildani et al. [2009] interpreted age result TuffZirc identifed population
Monte Carlo stratigraphic age of TuffZirc
populations
Sample Name age error (2σ) # grains age error Conf. level # grains Age error +/-
(95%)
*CVX12 252.7 4 6 256 +2/-3 93 8 256.2 +1.8/-3.3
CVX11 254.2 6.4 1 265.5 +3.5/-0.5 96.1 12 265.8 +1/-1.7
†CVX10 258.1 3.2 1 266 +1/-1 93.8 5 266.56 +0.68/-1.2
CVX6 261.7 2.8 3 275 +1/-4 96.1 9 271 +2.1/-1.9
CVX8 262.8 4 9 266 +5/-3 97.8 13 271.9 +2.3/-2
CVX5 270.1 4 2 278 +4/-4 87.8 4 275.1 +1.5/-2.2
CVX4 274.8 3 4 275 +2/-1 96.1 12 276.3 +1.2/-1.8 *Suspect sample with anomalously young age.†Tuff zirc identified an additional, older population of 276 +4/-1 Ma (n=9, conf. = 96.1%)
This article is protected by copyright. All rights reserved.

Figure Captions
Figure 1
Study area and geology of the Karoo Basin. A) Map of southern Africa showing the location of
the southwestern Karoo Basin shown in B. B) Geological map of the southwestern Karoo Basin
modified from Johnson et al. [1997]. The study area is shown as box C. (C) Topographic map of the
study area. Logged sections are shown as solid black lines. Red lines are correlation lines linking the
three logged sections in this study. White dashed line mark the approximate contact between the Ecca
Group and the Beaufort Group in the study area. D) Enlargement of the Ouberg Pass (OP) log, note
the Ecca/Beaufort contact is at 96 m in the logged section. E) Phototextured topographic model
(exaggerated relief) showing the location of the Great Wall, Link and Bloukrans logs (black lines) and
correlation lines (red) between the sections (images from Google Earth).
Figure 2
Pattern of principal axes of magnetic susceptibility in the Abrahamskraal Fm. at the Great Wall
section. Jelinek and Flinn fabric diagrams and the equal-area plot (lower hemisphere) of the tilt-
corrected directions of the principal axes of AMS (squares, K1; triangles K2; circles K3) are shown.
The great-circle represent the bedding planes in the adjacent Link and Bloukrans section; the bedding
plane at the Great Wall section is horizontal. The major K1 axis is well grouped in the East-West
direction suggesting the presence of an intersection lineation between bedding and E-W trending
cleavage formed during Cape Fold Belt deformation.
Figure 3
Normalized IRM acquisition curves of a representative set of samples from BK and LK sections.
With a few exceptions samples are saturated at field < 300 mT suggesting that the dominant magnetic
mineral is magnetite, in agreement with coeval samples from Ouberg Pass section [Lanci et al., 2013].
Sporadic high-coercivity samples are found in the most oxidized bedding. The inset shows the high
NRM of two samples remagnetized by lightning.
This article is protected by copyright. All rights reserved.

Figure 4
Equal-area stereoplot (lower hemisphere) of the directions of component-A in geographic
coordinates from the GW, LK and BK sections (circles), and from the Ouberg Pass sections
(diamonds) showing the perfect overlap in the two sites. Averaged direction and 95% confidence cone
are shown. Red quare shows position of time-averaged geomagnetic field direction, and red star
shows present-day geomagnetic field direction.
Figure 5
Equal-area stereoplot (lower hemisphere) of the tilt corrected ChRM directions (component-B)
from the GW, LK and BK sections (a) and form the joint set of Ouberg Pass and the GW, LK, BK
sections (b). Averaged directions and 95% confidence cone are shown for each separate polarity.
Results from Ouberg Pass and this study overlap perfectly and normal and reversed directions are
antipodal and pass a reversal test. Detailed statistics are reported in Table 1.
Figure 6
(Upper) Bins of common polarity bootstrapped results for the Great Wall – Link – Bloukrans
(GLB) ChRM component-B directions in Cartesian coordinates (reversed directions- dashed line,
normal directions- solid line). (Lower) Compiled directions from GLB and Ouberg Pass (OP)
demonstrating common mean at 95% confidence level.
Figure 7
Summary of magnetic stratigraphy of the Great Wall section with lithological description,
sampled levels, ChRM paleomagnetic directions, virtual geomagnetic pole latitude (VGP Lat),
magnetic susceptibility, and representative orthogonal vector plots are reported. In the stratigraphic
column mudstones are shown with a white fill and sandstones with a black fill, background is grey.
Figure 8
This article is protected by copyright. All rights reserved.

Summary of magnetic stratigraphy of the Link section, with stratigraphic log, sampled levels,
ChRm directions, magnetic polarity, and selected Zijderveld plots showing demagnetization behavior.
Colors in stratigraphic column as in Figure 7.
Figure 9
Summary of magnetic stratigraphy of the Bloukrans section, with stratigraphic log, sampled
levels, magnetic susceptibility, ChRm directions, magnetic polarity, and selected Zijderveld plots
showing demagnetization behavior. Colors in stratigraphic column as in Figure 7.
Figure 10
Summary of the magnetic stratigraphy of the joint GW, LK and BK sections compared to recent
geomagnetic polarity time scales, indicating both of the possible correlations
Figure 11
(Top) Calculated TuffZirc ages (green) from Ecca Group U-Pb data reported by Fildani et al. [2009]
demonstrate consistently older ages identified from coherent populations of zircon versus original
interpretation (red, F09). Samples are ordered stratigraphically with the youngest to the left. Grey
swath indicates the best fit ages of 265 – 275 Ma determined by Monte Carlo simulation. (Bottom)
Histogram of U+Th content for different populations; TuffZirc selected populations (green), “young”
grains used as the basis of the Fildani et al. [2009] age interpretation (yellow), and discordant analyses
that were reported but not age-interpreted by Fildani et al. [2009]. Note the shift towards more
radioactive content for the “young” population, consistent with the undetected Pb-loss that we
postulate.
This article is protected by copyright. All rights reserved.

0m
500m
98m - 1st Red Bed
Waterford Fm.
Abrahamskraal Fm.
1000m
ND
B
21°0
'0"E
33°0'0"S
32°50'0"S
32°30'0"S
32°20'0"S 0 5 10 20km
Ouberg Pass
BloukransLink log
Great Wall
C
N
Laingsburg
Sutherland
MoordenaarsKaroo
Matjiesfontein
R354
R354
R354
Plateau
Roggeveld Mou sntain
Verlatenkloof Pass
33°10'0"S
Beaufort Group
Ecca Group
Ecca Group
D
E
Great Wall
Great Wall LogLink log
Bloukrans
Bloukrans Log
E
5 km
N
N1
-1
8°
0°
18
°
36
°
54
°
- 26°
- 13°
0°
13°
A 32°40'0"S
Correlation traces
C
This article is protected by copyright. All rights reserved.

1.0
0.8
0.6
0.4
0.2
0.0
Mor
mal
ized
IRM
10008006004002000Field (mT)
0.4
0.3
0.2
0.1
0.010080604020
This article is protected by copyright. All rights reserved.

Equal Area
χ max.χ int.χ min.
1.00 1.02 1.04 1.06 1.081.00
1.01
1.02
1.03
1.04
1.05
1.06
1.07
1.08
F
Prolate
Oblate
L
1.00 1.05 1.10 1.15-1.0
-0.8
-0.6
-0.4
-0.2
0.0
0.2
0.4
0.6
0.8
1.0
P'
Prolate
OblateT
This article is protected by copyright. All rights reserved.

This article is protected by copyright. All rights reserved.

N
N = 98
N
N = 234
a) b)
This article is protected by copyright. All rights reserved.

GLB
GLB + Ouberg Pass
This article is protected by copyright. All rights reserved.

150
100
50
0360270180900 -90 0 90 -90 0 90
VGP Lat.DeclinationSampled
levels InclinationGreat Wall
NRM
300
150
450575600640
Z,N
E
GW93ATilt-corrected coordinates
Each
Div
ision
is 1
e-3
A/m
NRM
150
100
200
300400
475525
575
625
Z,N E
GW40CTilt-corrected coordinates
Each
Div
ision
is 1
e-4
A/m
NRM
300450
600 640
150
575
Z,N
E
Decl.Incl.
GW141ATilt-corrected coordinates
Each
Div
ision
is 1
e-3
A/m
GW141A
GW40C
GW93A
This article is protected by copyright. All rights reserved.

150
100
50
0
Dep
th (m
)
360270180900 -90 0 90 -90 0 90
VGP Lat.DeclinationSampled
levels Inclination
Link
250
400450
570620
680
Z,W
N
Eac
h D
ivis
ion
is 1
e-4
A/m
NRM
LS19ATilt-corrected coordinates
NRM
250
550625
675
Z,W
N
LS6ATilt-corrected coordinates
680
NRM
250
400540 570620660
Z,W
N
Decl.Incl.
LS27ATilt-corrected coordinates
Each Division is 1e-4 A/m
LS27A
LS6A
LS19A
Each Division is 1e-4 A/m
This article is protected by copyright. All rights reserved.

300
250
200
150
100
50
0
Dep
th (m
)
360270180900 -90 0 90 -90 0 90
VGP Lat.DeclinationSus.
(SI units)Sampled
levels Inclination
Bloukrans
NRM
300
400
450475
550
600
Z,N
E
BK07AGeographic coordinates
Eac
h D
ivis
ion
is 1
e-4
A/m
NRM
300
425
475
520
560
Z,N
E
BK32ATilt-corrected coordinates
Eac
h D
ivis
ion
is 1
e-4
A/m
NRM
300
150
400
540580
Z,N
E
Decl. Incl.
BK42ATilt-corrected coordinates
Each
Div
ision
is 1
e-5
A/m
BK42A
BK32A
BK07A
102 103 104
This article is protected by copyright. All rights reserved.

BloukransVGP Lat. Composite
Great WallVGP Lat.
0
100
200
300
Com
po
site s
tratigra
phic
depth
(m
)
400
500
600
LinkVGP Lat.
Polarity Unknown
Reverse Polarity
Normal Polarity
-90 0 90
-90 0 90
-90 0 90
R1
N1R2
N2
R3
N3
252.6(P\T)
~260
Steiner (2006)Age (Ma)
GU
AD
AL
PIA
N
Capitania
nC
hang-
hsin
gia
nW
uchia
pin
gia
n
LO
PIN
GIA
N
LO
PIN
GIA
N
LO
PIN
GIA
N255
260
265
Gradstein et al. (2012) Shen et al. (2011)
255
260
265G
UA
DA
LP
IAN
GU
AD
AL
PIA
N
Wu
ch
iap
ing
ian
Ca
pita
nia
nC
ha
ng
-h
sin
gia
nAge (Ma)Age (Ma)
This article is protected by copyright. All rights reserved.

���
���
���
���
���
��
�� � �� �� � ��� ��� ��� ��
���������������
�� ����������������� ��
�������������������� ������������ ����������
����
����
�����
�����
���
���
!�"�#����"���$����������
��� ���� %��� ��� �����
�
�
��
%�
����������� ���������� �����������������
��������������������������������������������� �����������
&�#��'(��)��*+��,-.+))/'�,��0�+#��'0�
&�#��'(��)��*+��,-1-0+��2��0�+#��'0�
&�#��'(��)��*+��,-�'�,0�������0�+#��'0�
��3�.4�,0���������"
&�#
��'(
��$��
*+��
,-
This article is protected by copyright. All rights reserved.