
Magnetic structure in Fe/Sm-Co exchange spring bilayers with intermixed interfaces
16
Magnetic Structure in Fe/Sm-Co Exchange Spring Bilayers with Intermixed Interfaces Yaohua Liu, 1, * S. G. E. te Velthuis, 1, † J. S. Jiang, 1 Y. Choi, 1, ‡ S. D. Bader, 1 A. A. Parizzi, 2 H. Ambaye, 2 and V. Lauter 2 1 Materials Science Division, Argonne National Laboratory, Argonne, IL 60439, USA 2 Spallation Neutron Source Oak Ridge National Laboratory, Oak Ridge, TN 37831, USA (Dated: December 23, 2010) Abstract The depth profile of the intrinsic magnetic properties in an Fe/Sm-Co bilayer fabricated under nearly optimal spring-magnet conditions was determined by complementary studies of polarized neutron reflectometry and micromagnetic simulations. We found that at the Fe/Sm-Co interface the magnetic properties change gradually at the length scale of 8 nm. In this intermixed interfacial region, the saturation magnetization and magnetic anisotropy are lower and the exchange stiffness is higher than values estimated from the model based on a mixture of Fe and Sm-Co phases. Therefore, the intermixed interface yields superior exchange coupling between the Fe and Sm-Co layers, but at the cost of average magnetization. PACS numbers: 75.70.Cn, 61.05.fj 1 arXiv:1012.5086v1 [cond-mat.mtrl-sci] 22 Dec 2010
Transcript of Magnetic structure in Fe/Sm-Co exchange spring bilayers with intermixed interfaces
Magnetic Structure in Fe/Sm-Co Exchange Spring Bilayers with
Intermixed Interfaces
Yaohua Liu,1, ∗ S. G. E. te Velthuis,1, † J. S. Jiang,1 Y. Choi,1, ‡
S. D. Bader,1 A. A. Parizzi,2 H. Ambaye,2 and V. Lauter2
1Materials Science Division, Argonne National Laboratory, Argonne, IL 60439, USA
2Spallation Neutron Source Oak Ridge National Laboratory, Oak Ridge, TN 37831, USA
(Dated: December 23, 2010)
Abstract
The depth profile of the intrinsic magnetic properties in an Fe/Sm-Co bilayer fabricated under
nearly optimal spring-magnet conditions was determined by complementary studies of polarized
neutron reflectometry and micromagnetic simulations. We found that at the Fe/Sm-Co interface
the magnetic properties change gradually at the length scale of 8 nm. In this intermixed interfacial
region, the saturation magnetization and magnetic anisotropy are lower and the exchange stiffness
is higher than values estimated from the model based on a mixture of Fe and Sm-Co phases.
Therefore, the intermixed interface yields superior exchange coupling between the Fe and Sm-Co
layers, but at the cost of average magnetization.
PACS numbers: 75.70.Cn, 61.05.fj
1
arX
iv:1
012.
5086
v1 [
cond
-mat
.mtr
l-sc
i] 2
2 D
ec 2
010
I. INTRODUCTION
Exchange-coupled, high-magnetization (soft) and high-anisotropy (hard) magnetic phases
have potential applications as both ultra-strong permanent magnet1 and ultra-high-density
recording media.2 While the intrinsic properties of the two phases play the most impor-
tant role, optimization of the interface properties are also important to achieve the best
performance. For example, the interface morphology need to be optimized for good ex-
change coupling between the soft and hard phases. Micromagnetic simulations suggested
that magnetically graded interfaces, whose magnetic properties are gradually changed over a
distance ∼ 10 nm, is more effective than sharp interfaces, in order to increase the nucleation
field in the soft phase and decrease the switching barrier of the hard phase.3,4 Magneti-
cally graded interfaces can be fabricated from chemically intermixing phases via nanotech-
nology.5–7 Nanoscale spatial resolution is needed to experimentally determine the intrinsic
magnetic properties of hard-soft heterostructures. Interestingly, for Fe/Sm-Co spring mag-
nets under optimized fabrication conditions for the maximum energy product, the Fe layer
and the Sm-Co layer have an intermixed interface over a length scale ∼ 5 − 10 nm.8,9 Al-
though the intrinsic magnetic properties of individual Fe films and Sm-Co films have been
well studied,10 there lacks quantitative knowledge about the intrinsic magnetic properties of
the intermixed Fe/Sm-Co interface due to its complex composition.8,9
Polarized neutron reflectometry (PNR) is a sensitive tool to study the depth profile of
magnetic structures within multilayers with sub-nanometer depth resolution,11,12 and has
been used to study exchange coupling and anisotropy.13,14 For example, in a NiFe/FePt
spring magnet, O’Donovan et al. have determined that the twisted magnetic structure of
the spring magnet is not confined to the magnetically soft layer, but also penetrates into
the hard magnetic phase.13 Recently, Kirby et al. showed qualitatively that the structural
gradation yields a graded anisotropy in Co/Pd multilayers.7
In the present work, we report PNR studies on a Fe/Sm-Co bilayer, which was fabricated
under nearly optimized spring magnet conditions. We first confirmed that there is a struc-
turally intermixed interface of ∼ 8-nm wide between the Fe and Sm-Co layers via combined
X-ray reflectometry (XRR) and PNR studies. We also determined the depth profile of the
saturation magnetization MS. Furthermore, the profiles of the magnetic anisotropy K and
the exchange stiffness A were obtained by analyzing the PNR data with the aid of micro-
2
magnetic simulations. The magnetic properties in the intermixed region were compared to a
model based on a mixture of Fe and Sm-Co phases. The saturation magnetization is slightly
lower than the value estimated from the model, suggesting new compounds formed in the
intermixed region. The intrinsic anisotropy is also lower than the value from the model.
However, the exchange stiffness is higher, so that the interface efficiently couples the Fe and
Sm-Co layers.
II. EXPERIMENTAL METHODS
The Fe/Sm-Co thin film was fabricated via dc magnetron sputtering onto an MgO (110)
single-crystal substrate with a nominal structure of (10 nm Cr)/(10 nm Fe)/(20 nm Sm-
Co)/(20 nm Cr)/MgO. The sample size is 10× 10 mm2. The Cr (211) buffer layer and the
Sm-Co layer were grown at 400 ◦C, and the Fe layer was grown at 100 ◦C.5 The Sm-Co
layer, nominally Sm2Co7 composition, has an uniaxial, in-plane magnetic easy axis.15 Mag-
netic hysteresis loops were obtained by means of vibrating sample magnetometer (VSM).
XRR studies were performed with a X-ray diffractometer using Cu Kα radiation. PNR
experiments were conducted at the SNS at Oak Ridge National Laboratory, at the Mag-
netism Reflectometer.16 This is a time-of-flight (TOF) instrument with a wavelength band
2 - 5 A and the polarization efficiency of ∼ 98%. All experiments were conducted at room
temperature.
-1
0
1
MX/
MS
-1.0 -0.5 0.0 0.5 1.0µ0H (T)
FIG. 1. (Color online) Easy-axis magnetic hysteresis loop. The film is saturated at 1 T. The two
circles label the magnetization states measured by PNR, with applied fields of +1.11 and +0.39 T,
respectively.
The external field was applied along the magnetic easy-axis for PNR experiments. For
convenience, we define the field direction as +x and the sample surface normal as −z.
3
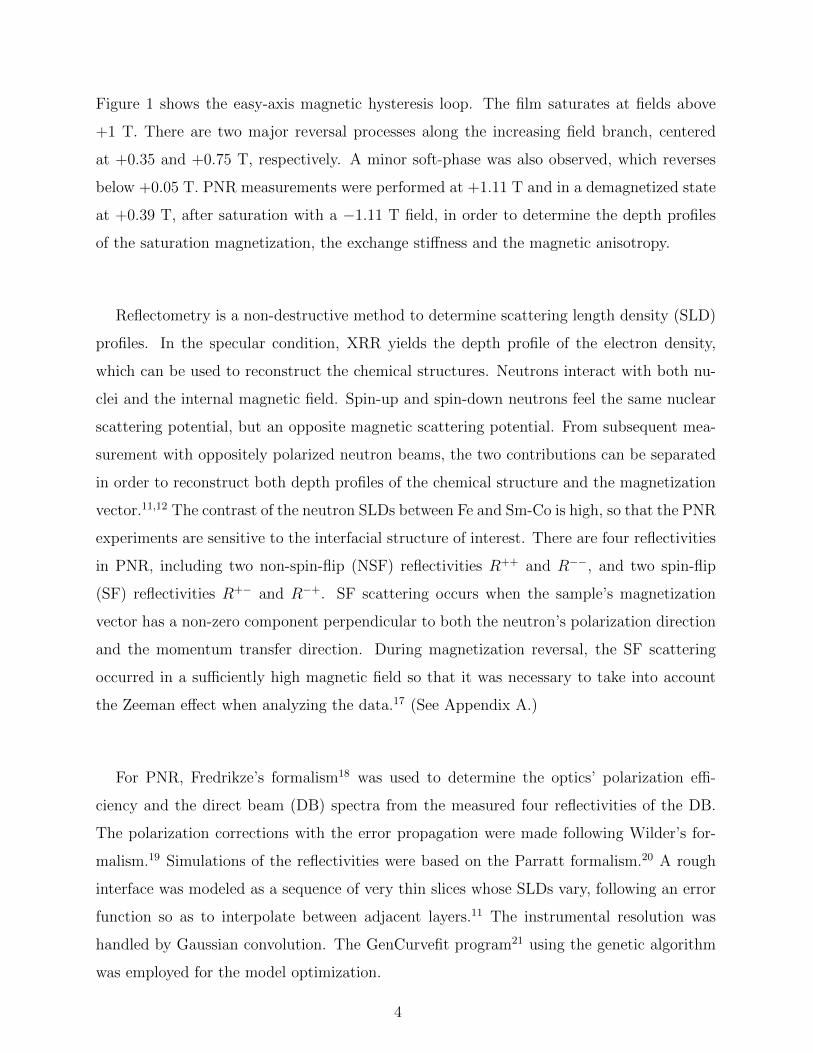
Figure 1 shows the easy-axis magnetic hysteresis loop. The film saturates at fields above
+1 T. There are two major reversal processes along the increasing field branch, centered
at +0.35 and +0.75 T, respectively. A minor soft-phase was also observed, which reverses
below +0.05 T. PNR measurements were performed at +1.11 T and in a demagnetized state
at +0.39 T, after saturation with a −1.11 T field, in order to determine the depth profiles
of the saturation magnetization, the exchange stiffness and the magnetic anisotropy.
Reflectometry is a non-destructive method to determine scattering length density (SLD)
profiles. In the specular condition, XRR yields the depth profile of the electron density,
which can be used to reconstruct the chemical structures. Neutrons interact with both nu-
clei and the internal magnetic field. Spin-up and spin-down neutrons feel the same nuclear
scattering potential, but an opposite magnetic scattering potential. From subsequent mea-
surement with oppositely polarized neutron beams, the two contributions can be separated
in order to reconstruct both depth profiles of the chemical structure and the magnetization
vector.11,12 The contrast of the neutron SLDs between Fe and Sm-Co is high, so that the PNR
experiments are sensitive to the interfacial structure of interest. There are four reflectivities
in PNR, including two non-spin-flip (NSF) reflectivities R++ and R−−, and two spin-flip
(SF) reflectivities R+− and R−+. SF scattering occurs when the sample’s magnetization
vector has a non-zero component perpendicular to both the neutron’s polarization direction
and the momentum transfer direction. During magnetization reversal, the SF scattering
occurred in a sufficiently high magnetic field so that it was necessary to take into account
the Zeeman effect when analyzing the data.17 (See Appendix A.)
For PNR, Fredrikze’s formalism18 was used to determine the optics’ polarization effi-
ciency and the direct beam (DB) spectra from the measured four reflectivities of the DB.
The polarization corrections with the error propagation were made following Wilder’s for-
malism.19 Simulations of the reflectivities were based on the Parratt formalism.20 A rough
interface was modeled as a sequence of very thin slices whose SLDs vary, following an error
function so as to interpolate between adjacent layers.11 The instrumental resolution was
handled by Gaussian convolution. The GenCurvefit program21 using the genetic algorithm
was employed for the model optimization.
4
III. EXPERIMENTAL RESULTS AND ANALYSIS
A. Depth profile of Saturated Magnetization
10-5
10-4
10-3
10-2
10-1
100
X-ra
y Re
flect
ivity
0.200.150.100.05
XRR fit
10-5
10-4
10-3
10-2
10-1
100
Neut
ron
Refle
ctiv
ity
0.080.060.040.02QZ (Å
-1)
µ0H = +1.11 T R+
R−
(a)
(b)
8
6
4
2
0
Neut
ron
SLD
(10-6
Å-2)
6040200 z (nm)
6
5
4
3
2
1
0
X-ray SLD (10-5Å
-2)
Cr
Cr
MgOFe
Sm-Comixe
d
Neutron SLD
X-ray SLD
Mag.
Nuc.
(c)
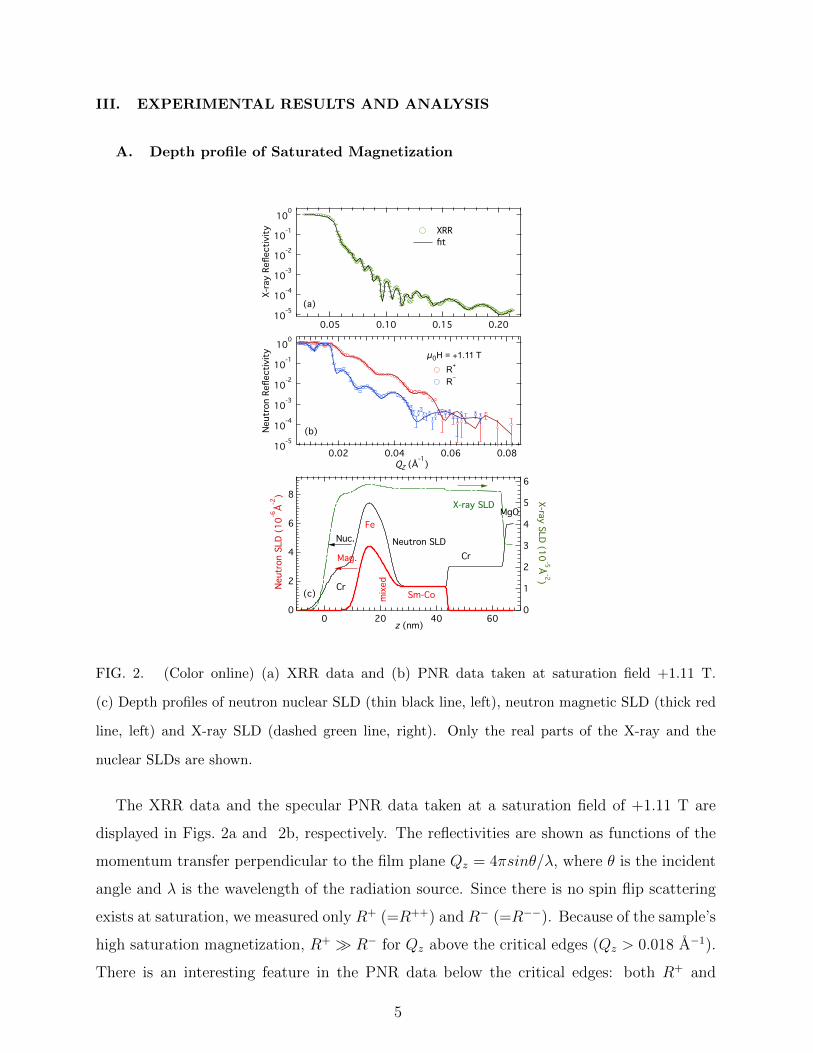
FIG. 2. (Color online) (a) XRR data and (b) PNR data taken at saturation field +1.11 T.
(c) Depth profiles of neutron nuclear SLD (thin black line, left), neutron magnetic SLD (thick red
line, left) and X-ray SLD (dashed green line, right). Only the real parts of the X-ray and the
nuclear SLDs are shown.
The XRR data and the specular PNR data taken at a saturation field of +1.11 T are
displayed in Figs. 2a and 2b, respectively. The reflectivities are shown as functions of the
momentum transfer perpendicular to the film plane Qz = 4πsinθ/λ, where θ is the incident
angle and λ is the wavelength of the radiation source. Since there is no spin flip scattering
exists at saturation, we measured only R+ (=R++) and R− (=R−−). Because of the sample’s
high saturation magnetization, R+ � R− for Qz above the critical edges (Qz > 0.018 A−1).
There is an interesting feature in the PNR data below the critical edges: both R+ and
5
R− showed frustrated total reflection. This is due to the enhanced absorption at resonant
conditions.22 Simulations show that the Q separation between the two dips strongly depends
on the magnetization along the field direction, especially that of the Sm-Co layer, which is
the locus of absorption. Therefore, this separation, as well as the splitting between R+ and
R− above the critical edge, are direct indications of the sample’s magnetization.
The chemical and the magnetic SLD profiles were determined by fitting the XRR and the
PNR data simultaneously with the same structural model.23 Since there are well tabulated
values for the neutron and the X-ray scattering length and absorption length for each ele-
ment, both the real and imaginary parts of the X-ray and the neutron’s nuclear SLDs were
calculated from the chemical composition and the film density. Therefore a single parameter
was used to determine both the X-ray and the neutron nuclear SLDs for each layer that has
a well defined composition. This parameter is the mass density for that particular layer.
However, the intermixed interface has a complex chemical composition that extends > 5 nm
in depth.8,9 The X-ray and the neutron’s nuclear SLDs in the intermixed region need to be
determined separately, which was done by introducing an intermixed layer between the Fe
and Sm-Co layers. Therefore, both the nuclear and the magnetic SLD profiles can vary
in more sophisticated ways and they are less correlated to each other over the intermixed
region. Actually, the peak and dip positions in R− between 0.025 and 0.045 A can not
be reproduced without introducing this intermixed layer, which indicates that a single er-
ror function is not sufficient to model the nuclear and/or the magnetic SLD profiles at the
Fe/Sm-Co interface.
The best-fit curves for the reflectivity data are overlaid on the data, and the SLD depth
profiles are shown in Fig. 2c. The SLD profiles show sharp transitions at the Cr/MgO and
the Sm-Co/Cr interfaces with rms roughnesses of ∼ 0.4 nm for both interfaces. However, the
SLD profiles gradually change between the Fe and Sm-Co layers over a distance of ∼ 8 nm.
Such a large intermixed region is consistent with previous energy-dispersive-spectroscopy
(EDS) results from samples fabricated under the same conditions.8 In the intermixed region,
there appears a shoulder in the nuclear SLD profile (Fig. 2c), showing that it is chemically
rich in Fe. However, this feature is not present in the magnetic SLD profile. This will be
discussed below. The parameters of interest are listed in Table I, which shows that both the
Fe and the Sm-Co layers have their saturation magnetizations close to the literature values10
despite the large intermixing at the interface.
6
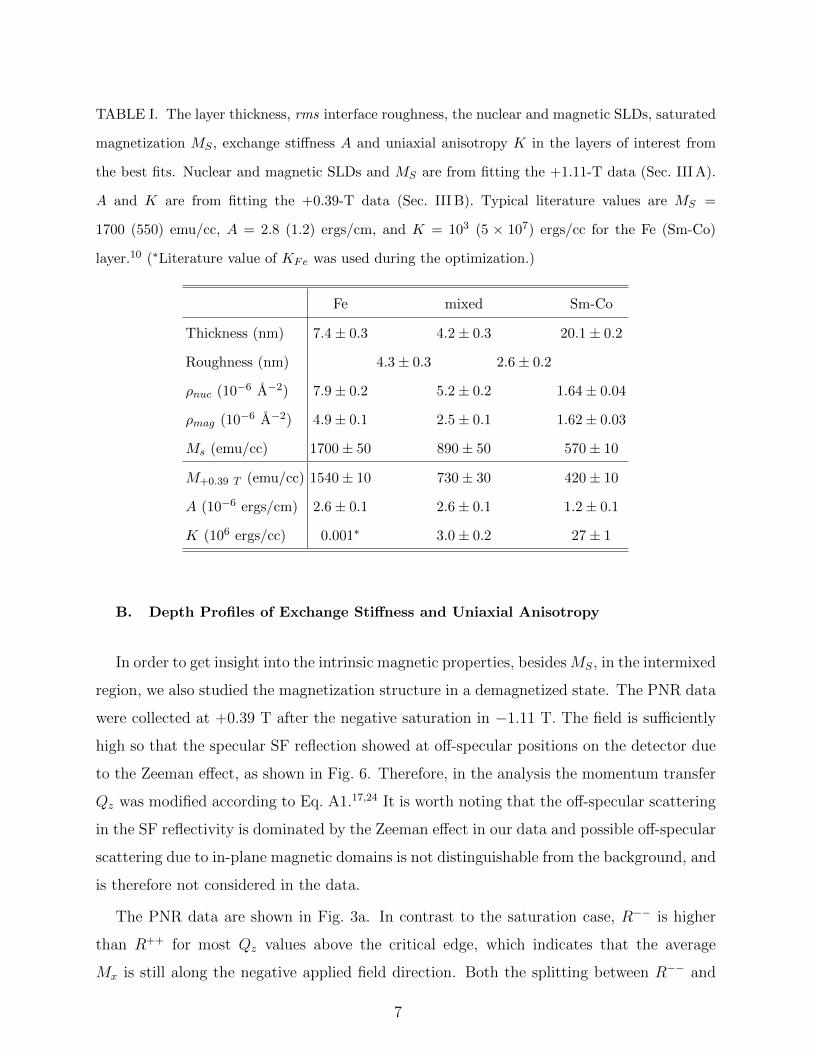
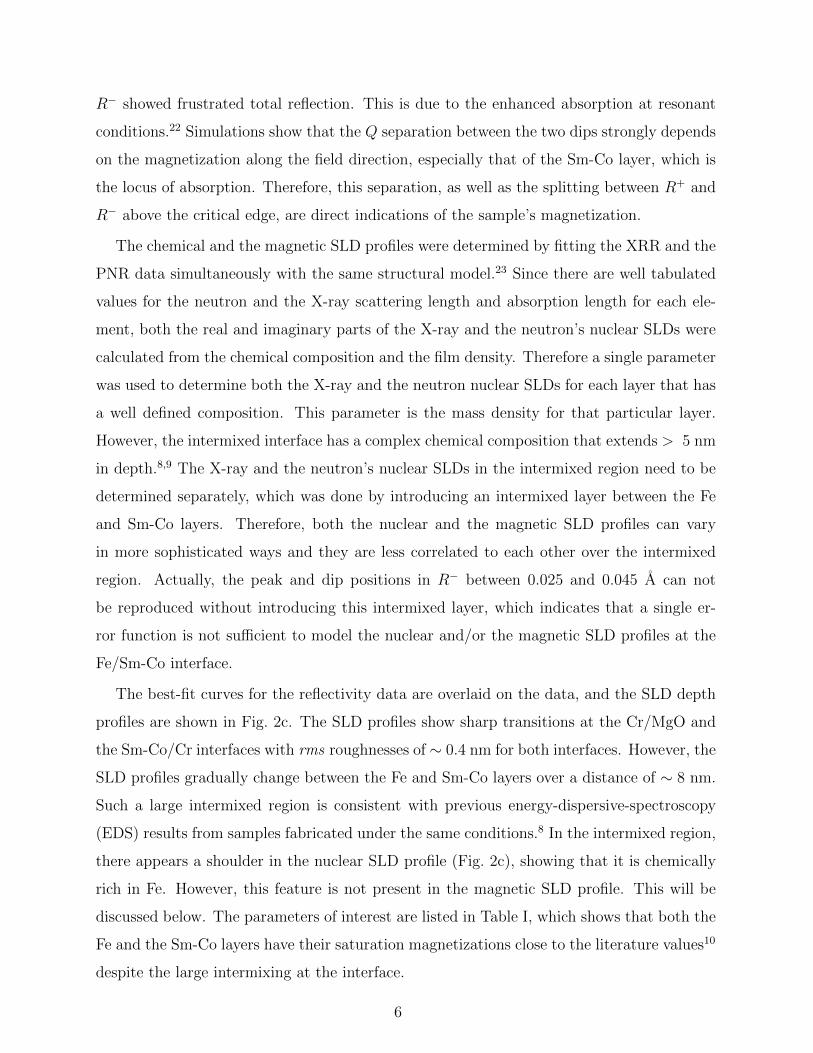
TABLE I. The layer thickness, rms interface roughness, the nuclear and magnetic SLDs, saturated
magnetization MS , exchange stiffness A and uniaxial anisotropy K in the layers of interest from
the best fits. Nuclear and magnetic SLDs and MS are from fitting the +1.11-T data (Sec. III A).
A and K are from fitting the +0.39-T data (Sec. III B). Typical literature values are MS =
1700 (550) emu/cc, A = 2.8 (1.2) ergs/cm, and K = 103 (5 × 10⁷) ergs/cc for the Fe (Sm-Co)
layer.10 (∗Literature value of KFe was used during the optimization.)
Fe mixed Sm-Co
Thickness (nm) 7.4± 0.3 4.2± 0.3 20.1± 0.2
Roughness (nm) 4.3± 0.3 2.6± 0.2
ρnuc (10−6 A−2) 7.9± 0.2 5.2± 0.2 1.64± 0.04
ρmag (10−6 A−2) 4.9± 0.1 2.5± 0.1 1.62± 0.03
Ms (emu/cc) 1700± 50 890± 50 570± 10
M+0.39 T (emu/cc) 1540± 10 730± 30 420± 10
A (10−6 ergs/cm) 2.6± 0.1 2.6± 0.1 1.2± 0.1
K (106 ergs/cc) 0.001∗ 3.0± 0.2 27± 1
B. Depth Profiles of Exchange Stiffness and Uniaxial Anisotropy
In order to get insight into the intrinsic magnetic properties, besidesMS, in the intermixed
region, we also studied the magnetization structure in a demagnetized state. The PNR data
were collected at +0.39 T after the negative saturation in −1.11 T. The field is sufficiently
high so that the specular SF reflection showed at off-specular positions on the detector due
to the Zeeman effect, as shown in Fig. 6. Therefore, in the analysis the momentum transfer
Qz was modified according to Eq. A1.17,24 It is worth noting that the off-specular scattering
in the SF reflectivity is dominated by the Zeeman effect in our data and possible off-specular
scattering due to in-plane magnetic domains is not distinguishable from the background, and
is therefore not considered in the data.
The PNR data are shown in Fig. 3a. In contrast to the saturation case, R−− is higher
than R++ for most Qz values above the critical edge, which indicates that the average
Mx is still along the negative applied field direction. Both the splitting between R−− and
7
R++ and the separation between the dips below the critical edge are smaller because the
average Mx is much lower than Ms. At the same time, there is significant SF scattering
of the same amplitude as the NSF scattering, indicating a large in-plane magnetization
component perpendicular to the field direction (My). This is caused by the magnetization
spiral structure observed in exchange-coupled bilayers during demagnetization.13 Figure 3b
plots the depth profile of the magnetization vector ~M that yields the best fit, which is
obtained from micromagnetic simulations. Our PNR studies do not reveal the chirality of
~M so that a positive My is used for convenience. As expected, the magnetic moment of the
Sm-Co layer is along the negative field direction and the magnetization vector rotates into
the intermixed region and the Fe layer.
Rohlsberger et al. have shown that the depth profile of the magnetization vector in
10-5
10-4
10-3
10-2
10-1
100
Neu
tron
Ref
lect
ivity
0.070.060.050.040.030.020.01QZ (Å
-1)
NSF R++
R−−
SF (x0.1) R+−
R−+
(a)
Sm-Co
mixed
Fe
(b)
FIG. 3. (Color online) (a) PNR data taken at +0.39 T after saturation in −1.11 T. R+− and
R−+ are offset by a factor of 0.1 for clarity. (b) The depth profiles of the magnetization vector
~M (obtained from micromagnetic simulations) that yields the best fit to the PNR data. The field
direction is along +x.
8
exchange coupled bilayers agrees with the micromagnetic simulation from the 1D spin-chain
model.25 Fitzsimmons et al. further determined the micromagnetic parameters for individual
layers in the exchange coupled DyFe22/YFe2 superlattice using combined studies of PNR
and micromagnetic simulations.14 For the Fe/Sm-Co spring magnet studied here, the Fe
and the Sm-Co layers are largely intermixed for ∼ 8 nm at the interface and it is naturally
to expect that the intrinsic magnetic properties, i.e. uniaxial anisotropy K and exchange
stiffness A, vary gradually due to the gradation of the chemical composition. Hence, we
extended Fitzsimmons’ approach and constructed depth profiles of the intrinsic magnetic
properties. Given a profile of the micromagnetic parameters, the equilibrium magnetic
structure can be simulated by energy minimization via the 1D spin-chain model,10 from
which the neutron’s magnetic scattering potential can be directly calculated followed by the
spin-dependent neutron reflectivities. Therefore, the intrinsic magnetic properties can be
optimized to yield the best fit to the experimental PNR data.
These profiles of K and A are built up of layers identical to those of the chemical structure
as determined from the fits to the XRR and the PNR data in saturations. The gradual
changes between the layers are computed using the interface roughness in the same way as
is done for the SLDs. When fitting, the chemical structure and the roughnesses are fixed to
those already determined. M is allowed to be lower than Ms to account for the effect from
the minor soft phase mentioned above. The model optimization is not sensitive to the KFe
3
2
1
0
A (
10-6
erg
s/cm
)
403020100z (nm)
3
2
1
0
K (10
7 ergs/cc )
mix
ed Sm-CoFe
Fe
mix
ed Sm-CoCr642
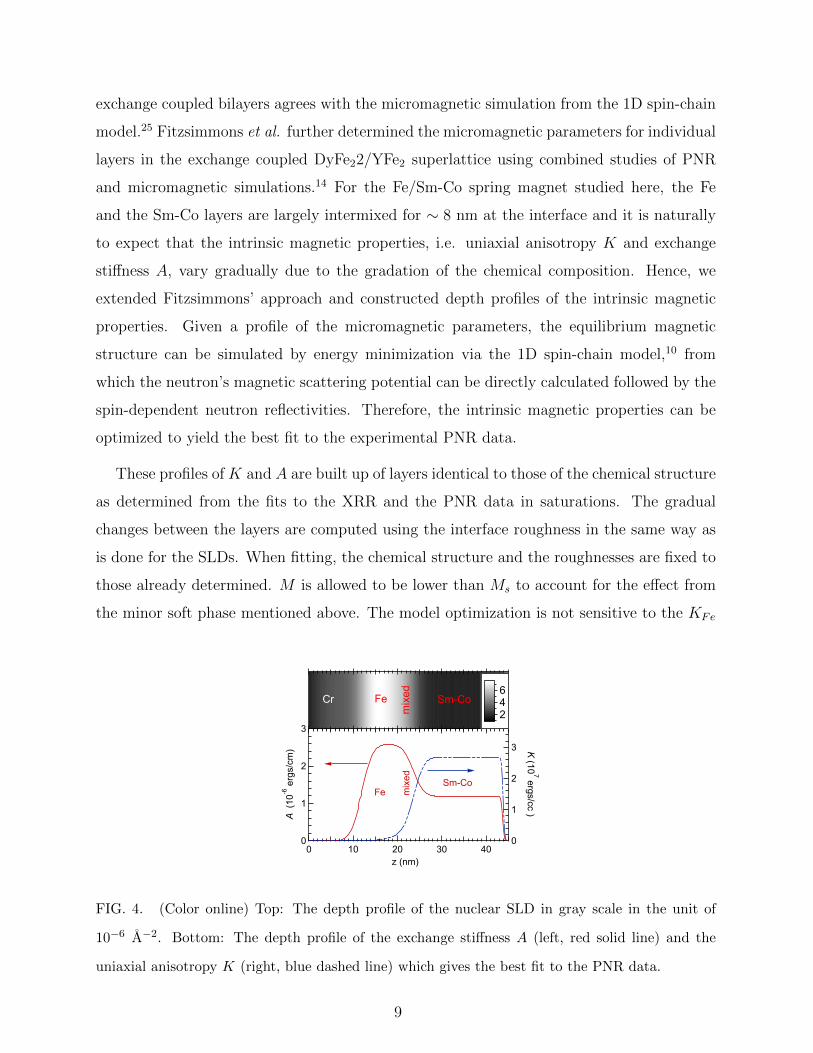
FIG. 4. (Color online) Top: The depth profile of the nuclear SLD in gray scale in the unit of
10−6 A−2. Bottom: The depth profile of the exchange stiffness A (left, red solid line) and the
uniaxial anisotropy K (right, blue dashed line) which gives the best fit to the PNR data.
9
because the associated magnetic energy is negligible, and therefore the literature value ofKFe
is used. The error bars of the parameters only reflect the statistical error and the accuracy
of the values depends on the model. Therefore it is important here to have the additional
layer between the Fe and the Sm-Co layers in the model because the exact mapping function
from the chemical structure to the micromagnetic properties is unknown. The layer has its
own free micromagnetic parameters so that M , A and K in the intermixed region are able
to vary more independently from those in the Fe layer and the Sm-Co layer. We checked the
robustness of the model by allowing different interface roughnesses for M , A, and K and
found that the optimized micromagnetic parameters have similar depth dependencies.
The depth profiles of A and K from the best fit are shown in Fig. 4 and the values of
M , A and K for layers of interest are listed in Table I. Both the parameters A and K show
monotonic depth dependence as expected. MSm−Co is ∼ 20% lower than the saturation
value, from which we estimated that ∼ 10% of the Sm-Co was reversed due to the minor
phase. Therefore, the 1D spin-chain model is approximately valid and yields fairly good fits,
which were overlaid on the data in Fig. 3a. As also listed in Table I, in the intermixed region,
A is close to that of the Fe layer, but K is much lower than the average value between the
Fe and the Sm-Co layers.
IV. DISCUSSION AND SUMMARY
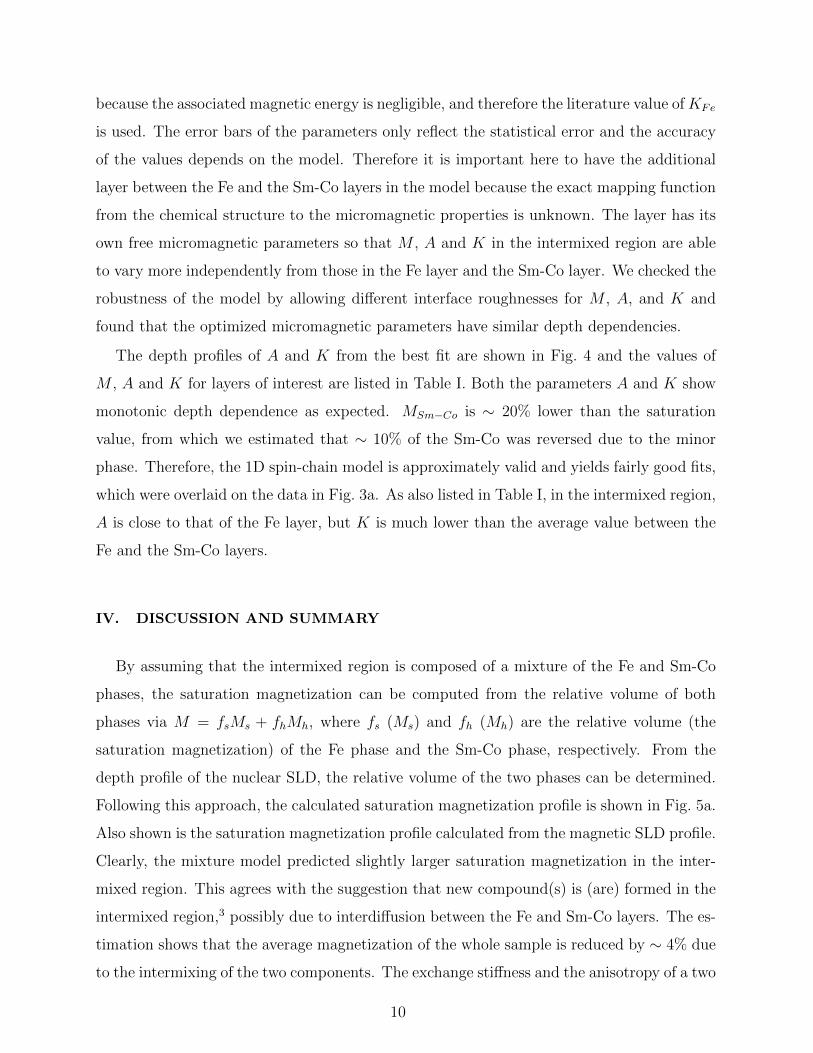
By assuming that the intermixed region is composed of a mixture of the Fe and Sm-Co
phases, the saturation magnetization can be computed from the relative volume of both
phases via M = fsMs + fhMh, where fs (Ms) and fh (Mh) are the relative volume (the
saturation magnetization) of the Fe phase and the Sm-Co phase, respectively. From the
depth profile of the nuclear SLD, the relative volume of the two phases can be determined.
Following this approach, the calculated saturation magnetization profile is shown in Fig. 5a.
Also shown is the saturation magnetization profile calculated from the magnetic SLD profile.
Clearly, the mixture model predicted slightly larger saturation magnetization in the inter-
mixed region. This agrees with the suggestion that new compound(s) is (are) formed in the
intermixed region,3 possibly due to interdiffusion between the Fe and Sm-Co layers. The es-
timation shows that the average magnetization of the whole sample is reduced by ∼ 4% due
to the intermixing of the two components. The exchange stiffness and the anisotropy of a two
10
Fe
mix
ed Sm-CoCr 642
15
10
5
0
M (1
00 e
mu/
cc)
CrFe
Sm-Co
mix
ed
PNR results Mixture model
2
1
0
A (
10-6
erg
s/cm
)
403020100z (nm)
3
2
1
0
K (10
7 ergs/cc )
Fe
Sm-Comix
ed
(a)
(b)
FIG. 5. (Color online) Depth profiles of (a) the saturation magnetization, and (b) the exchange
stiffness (left) and the uniaxial anisotropy (right) calculated by assuming that the intermixed region
is a mixture of the Fe phase and the Sm-Co phase (dashed lines). The experimentally determined
profiles are plotted as solid lines. Also shown in the top panel is the depth profile of the nuclear
SLD in gray scale. The unit is 10−6 A−2.
phase mixture can also be approximately estimated by the relative volume: K = fsKs+fhKh
and A = fsAs + fhAh.26 The results are shown in Fig. 5b. In comparison to those deter-
mined from the PNR experiments, the model predicts higher anisotropy but lower exchange
stiffness in the intermixed region. Therefore, we conclude that the optimized Fe/Sm-Co
interface for a spring magnet reduces the average magnetization.
Interfaces with graded magnetic properties are desirable for superior performances in ex-
change coupling systems, such as spring magnets and magnetic media.2,3 A straightforward
approach to achieve magnetically graded interfaces is to make structurally graded inter-
faces.5–7 The micromagnetic properties could be predicted from the composition. However,
it is challenging if multiple phases coexist even when the micromagnetic properties of each
individual phase are known, due to lacking of prior knowledge of the interphase coupling.
As shown above, the intrinsic magnetic properties in the intermixed Fe/Sm-Co interface
deviates from the results predicted by the mixture model. Therefore, a complex correlation
between the magnetic properties and the nominal composition may exist at the chemically
graded interfaces.
11
In summary, we determined the intrinsic magnetic properties of a Fe/Sm-Co bilayer un-
der the nearly optimized fabrication condition for spring magnets. We determined that the
intermixed interface between the Fe and Sm-Co layers extends ∼ 8 nm, where the magnetic
properties changes gradually, as expected. We compared the magnetic properties with the
prediction of a mixture model and found, in the intermixed region, the saturation magne-
tization is slightly lower than that estimated from the model, but the exchange stiffness is
higher. This observation indicates that the intermixed interface is efficient for magnetically
coupling the Fe and Sm-Co layers but at the cost of the average magnetization. The intrin-
sic anisotropy is also lower than the value from the model. Overall, the intrinsic magnetic
properties in the structurally intermixed region may not be predicted correctly by the mix-
ture model of nominal compositions, which is worth keeping in mind when designing the
magnetically graded interfaces.
ACKNOWLEDGMENTS
We thank Gian P. Felcher for helpful discussions. Research at Argonne was supported
by the U.S. Department of Energy, Office of Basic Energy Sciences, Division of Materials
Sciences and Engineering under Award No.DE-AC02-06CH11357. Research at Oak Ridge
National Laboratory’s Spallation Neutron Source was sponsored by the Scientific User Fa-
cilities Division, Office of Basic Energy Sciences, U. S. Department of Energy.
Appendix A: Zeeman effect and off-specular scattering
The Zeeman effect in PNR was firstly clarified by Felcher et. al.17,24 The effect shows
up in the SF reflectivities when the difference of the Zeeman energy for spin-up and spin-
down neutrons is not negligible in a sufficiently high magnetic field. Let k⊥ and k// label
the perpendicular and the parallel components of the wavevector with respect to the sample
surface in the vacuum region, i.e., before neutrons enter the magnetic-field region of interest.
k⊥ = 2πsinθ/λ � k// at glancing angles. There is negligible energy exchange between the
sample and the neutrons for elastic scattering, therefore the Zeeman energy change after SF
scattering accompanies a change of the kinetic energy, which is associated with ~k. The energy
change after spin-flip is twice the Zeeman energy. If the sample is magnetically homogenous
12
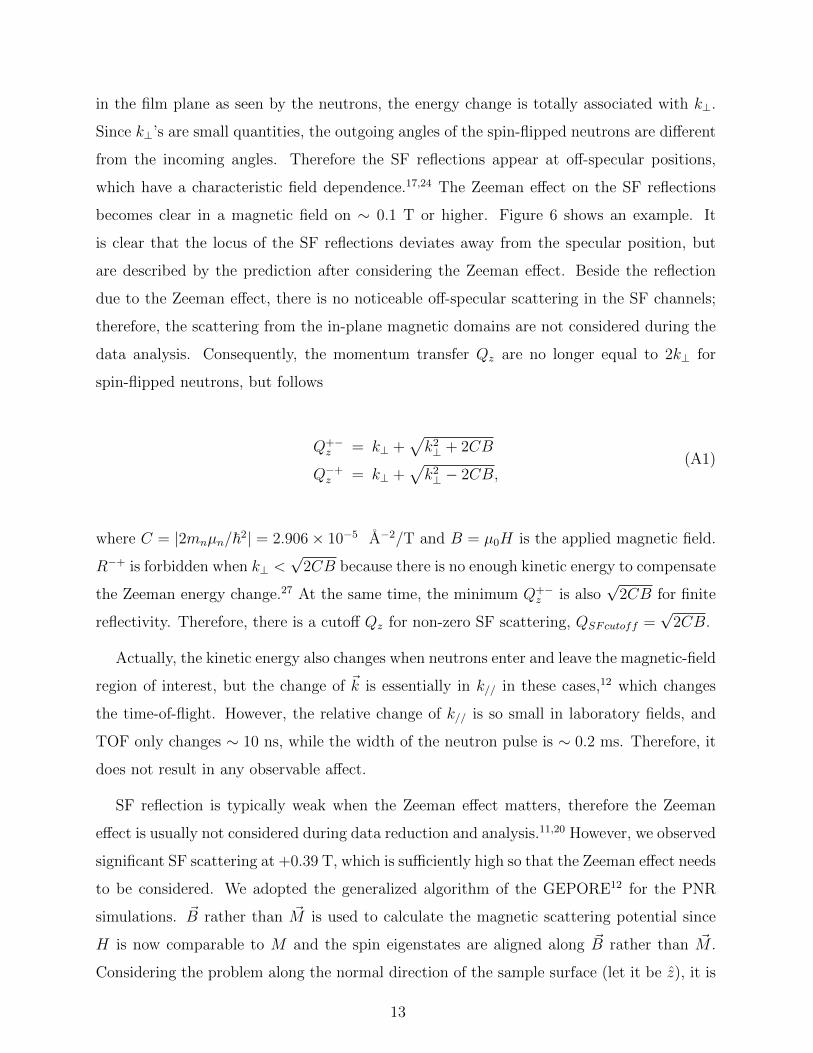
in the film plane as seen by the neutrons, the energy change is totally associated with k⊥.
Since k⊥’s are small quantities, the outgoing angles of the spin-flipped neutrons are different
from the incoming angles. Therefore the SF reflections appear at off-specular positions,
which have a characteristic field dependence.17,24 The Zeeman effect on the SF reflections
becomes clear in a magnetic field on ∼ 0.1 T or higher. Figure 6 shows an example. It
is clear that the locus of the SF reflections deviates away from the specular position, but
are described by the prediction after considering the Zeeman effect. Beside the reflection
due to the Zeeman effect, there is no noticeable off-specular scattering in the SF channels;
therefore, the scattering from the in-plane magnetic domains are not considered during the
data analysis. Consequently, the momentum transfer Qz are no longer equal to 2k⊥ for
spin-flipped neutrons, but follows
Q+−z = k⊥ +
√k2⊥ + 2CB
Q−+z = k⊥ +√k2⊥ − 2CB,
(A1)
where C = |2mnµn/~2| = 2.906× 10⁻⁵ A−2/T and B = µ0H is the applied magnetic field.
R−+ is forbidden when k⊥ <√
2CB because there is no enough kinetic energy to compensate
the Zeeman energy change.27 At the same time, the minimum Q+−z is also
√2CB for finite
reflectivity. Therefore, there is a cutoff Qz for non-zero SF scattering, QSFcutoff =√
2CB.
Actually, the kinetic energy also changes when neutrons enter and leave the magnetic-field
region of interest, but the change of ~k is essentially in k// in these cases,12 which changes
the time-of-flight. However, the relative change of k// is so small in laboratory fields, and
TOF only changes ∼ 10 ns, while the width of the neutron pulse is ∼ 0.2 ms. Therefore, it
does not result in any observable affect.
SF reflection is typically weak when the Zeeman effect matters, therefore the Zeeman
effect is usually not considered during data reduction and analysis.11,20 However, we observed
significant SF scattering at +0.39 T, which is sufficiently high so that the Zeeman effect needs
to be considered. We adopted the generalized algorithm of the GEPORE12 for the PNR
simulations. ~B rather than ~M is used to calculate the magnetic scattering potential since
H is now comparable to M and the spin eigenstates are aligned along ~B rather than ~M .
Considering the problem along the normal direction of the sample surface (let it be z), it is
13
0.6
0.5
0.4
0.35.04.54.03.53.02.5
20
10
10
10
10
(d) R− +0.6
0.5
0.4
0.35.04.54.03.53.02.5
70 60
40 30
30
20
20
20
20
10
10
10
10 10
10
(c) R− −
0.6
0.5
0.4
0.3
5.04.54.03.53.02.5
20
(b) R+ −0.6
0.5
0.4
0.3
5.04.54.03.53.02.5
50
20
20
20 10
10
10
10
10
(a) R++
10 20 30 40 50 60 70 80 90
θ i+θ
f (d
egre
e)
λ (Å)
FIG. 6. (Color online) The coutour map of the neutron intensities measured with the polarization
analysis, which are presented as functions of the neutron wavelengths λ. The data were collected
from a Fe/Sm-Co spring magnet sample at an incident angle θi = 0.24o in an external field of
+0.39 T after a negative saturation. The dashed lines indicate the specular reflection positions
without considering the Zeeman effect, i.e. θf = θi. The solid lines in the SF channels indicate the
off-specular scattering following the the Zeeman effect, i.e. sin2 θf = sin2 θi ± cBλ2
2π2 .
reduced to a pair of coupled 1D differential wave equations,12[− ~2
2mk20 + V++(z)− E
]Ψ+(z) + V+−Ψ−(z) = 0[
− ~22mk20 + V−−(z)− E
]Ψ−(z) + V−+Ψ+(z) = 0.
(A2)
V is the potential operator. Ψ±(z)’s are the wave functions for spin-up and spin down states.
k0 is the wavevector in vacuum, which can be either a real number or a pure imaginary
number. States with k02 ± CB < 0 correspond to evanescent waves outside the sample.
Due to the Zeeman energy, the coupled eigenstates of Ψ+ and Ψ− have different wavevectors
outside the sample, namely√k0
2 − CB and√k0
2 + CB, which has been considered to set
up the boundary conditions at the sample surface in the modified algorithm to take account
the Zeeman effect.
14
‡ Current address: Advanced Photon Source, Argonne National Laboratory, Argonne, IL 60439,
USA
1 E. Kneller and R. Hawig, Magnetics, IEEE Transactions on 27, 3588 (Jul. 1991).
2 R. Victora and X. Shen, Magnetics, IEEE Transactions on 41, 2828 (oct. 2005), ISSN 0018-
9464.
3 J. S. Jiang, J. E. Pearson, Z. Y. Liu, B. Kabius, S. Trasobares, D. J. Miller, S. D. Bader, D. R.
Lee, D. Haskel, G. Srajer, and J. P. Liu, Appl. Phys. Lett. 85, 5293 (2004).
4 D. Suess, Appl. Phys. Lett. 89, 113105 (2006).
5 Y. Choi, J. S. Jiang, J. E. Pearson, S. D. Bader, and J. P. Liu, Appl. Phys. Lett. 91, 022502
(2007).
6 D. Goll, A. Breitling, L. Gu, P. A. van Aken, and W. Sigle, J. Appl. Phys. 104, 083903 (2008).
7 B. J. Kirby, J. E. Davies, K. Liu, S. M. Watson, G. T. Zimanyi, R. D. Shull, P. A. Kienzle, and
J. A. Borchers, Phys. Rev. B 81, 100405 (2010).
8 Y. Choi, J. S. Jiang, Y. Ding, R. A. Rosenberg, J. E. Pearson, S. D. Bader, A. Zambano,
M. Murakami, I. Takeuchi, Z. L. Wang, and J. P. Liu, Phys. Rev. B 75, 104432 (2007).
9 Y. Liu, Y. Q. Wu, M. J. Kramer, Y. Choi, J. S. Jiang, Z. L. Wang, and J. P. Liu, Appl. Phys.
Lett. 93, 192502 (2008).
10 E. E. Fullerton, J. S. Jiang, M. Grimsditch, C. H. Sowers, and S. D. Bader, Phys. Rev. B 58,
12193 (1998).
11 M. R. Fitzsimmons and C. Majkrzak, in Modern Techniques for Characterizing Magnetic Ma-
terials, edited by Y. Zhu (Springer, US, 2005) pp. 107 – 155.
12 C. Majkrzak, K. O’Donovan, and N. Berk, in Neutron Scattering from Magnetic Materials,
edited by T. Chatterji (Elsevier Science, Amsterdam, 2006) pp. 397 – 471, both the REFLPAK20
and the SPIN FLIP11 use the GEPORE’s algorithm to simulate PNR.
13 K. V. O’Donovan, J. A. Borchers, C. F. Majkrzak, O. Hellwig, and E. E. Fullerton, Phys. Rev.
Lett. 88, 067201 (2002).
14 M. R. Fitzsimmons, S. Park, K. Dumesnil, C. Dufour, R. Pynn, J. A. Borchers, J. J. Rhyne,
and P. Mangin, Phys. Rev. B 73, 134413 (2006).
15 M. Benaissa, K. Krishnan, E. Fullerton, and J. Jiang, Magnetics, IEEE Transactions on 34,
1204 (1998).
15
16 V. Lauter, H. Ambaye, R. Goyette, W.-T. H. Lee, and A. Parizzi, Physica B 404, 2543 (2009).
17 G. Felcher, S. Adenwalla, V. D. Haan, and A. V. Well, Physica B 221, 494 (1996).
18 H. Fredrikze and R. W. E. van de Kruijs, Physica B 297, 143 (2001).
19 A. R. Wildes, Neutron News 17, 17 (2006), ISSN 1044-8632.
20 P. Kienzle, K. V. O’Donovan, J. Ankner, N. Berk, and C. Majkrzak,
http://www.ncnr.nist.gov/reflpak, 2000-2006.
21 A. Nelson, Journal of Applied Crystallography 39, 273 (2006).
22 M. Maza, B. Pardo, J. P. Chauvineau, A. Raynal, A. Menelle, and F. Bridou, Phys. Lett. A
223, 145 (1996).
23 It was found that the PNR results suggest a larger surface roughness and a thicker top Cr layer
than XRR. The thickness difference is about 0.9 nm and is most likely due to the increase of
the oxide layer after ∼ 2 years.
24 G. Felcher, S. Adenwalla, V. D. Haan, and A. V. Well, Nature 377, 409 (1995).
25 R. Rohlsberger, H. Thomas, K. Schlage, E. Burkel, O. Leupold, and R. Ruffer, Phys. Rev. Lett.
89, 237201 (2002).
26 R. Skomski and J. M. D. Coey, Phys. Rev. B 48, 15812 (Dec 1993).
27 R. W. E. van de Kruijs, H. Fredrikze, M. T. Rekveldt, A. A. van Well, Y. V. Nikitenko, and
V. G. Syromyatnikov, Physica B 283, 189 (2000).
16