Magnetic activity of six young solar analogues II. Surface Differential Rotation from long-term...
16
Astronomy & Astrophysics manuscript no. (will be inserted by hand later) Magnetic activity of six young solar analogues II. Surface Differential Rotation from long-term photometry S. Messina 1,? and E. F. Guinan 2 1 Catania Astrophysical Observatory, INAF, Via S. Sofia 78, I-95123 Catania, Italy e-mail: [email protected] 2 Dept. of Astronomy and Astrophysics, Villanova University, Villanova 19085, PA USA e-mail: [email protected] Received 16 May 2003 / Accepted 18 July 2003 Abstract. The present paper is the second of a series dedicated to the study of the magnetic activity in a selected sample of young solar analogues. The sample includes five single G0-G5V stars with ages between ’ 130 Myr and 700 Myr: EK Dra, π 1 UMa, HN Peg, k 1 Cet and BE Cet. In this study we also include the Pleiades-age (’ 130 Myr) K0V star DX Leo. Our analysis is based on high precision photometric observations carried out as part of The Sun in Time project, aimed at a multiwavelength study of stars with solar-like global properties, but with different ages and thus at different stages of evolution. In the first papers of this series we presented the photometric observations and determined the existence of starspot cycles and their correlation with the global stellar properties. In the present paper we investigate the surface differential rotation (SDR). The periodogram analysis of the photometric data time series has allowed us to determine the rotational periods and to derive the following results: i) all the selected stars show variations of the rotational period. Such variations are definitely periodic and in phase with the starspot cycle for BE Cet and DX Leo. They are likely periodic and in phase also for π 1 UMa, EK Dra and HN Peg, but still need confirmation. By analogy with the solar butterfly diagram, the rotational period variations are interpretable in terms of surface differential rotation, that is, they are attributable to the existence of active latitude belts migrating during the activity cycle on a differentially rotating star; ii) BE Cet, π 1 UMa and EK Dra show a solar-like pattern of SDR, that is the rotational period steadily decreases along the activity cycle, jumping back to higher values at the beginning of the next cycle; on the contrary, DX Leo, k 1 Cet and HN Peg show an antisolar pattern; iii) the amplitude of the rotational period variations shows a power law dependence on the rotational period similar to that found in previous studies. Contrary to theoretical predictions, the cycle length is not correlated to the Dynamo number, it is indeed positively correlated to the SDR amplitude. More precisely, stars tend to concentrate along three different branches with the cycle length increasing with increasing ΔΩ/Ω. Moreover, we found that the SDR amplitude changes from cycle to cycle, which is reminiscent of a wave of excess rotation propagating in latitude; iiii) the apparently different solar and antisolar behaviours are probably due to different inclinations of the stellar rotation axis under which the star is seen. The long-term photometry of the young single star LQ Hya, although not included in the initial project, is also used in the present analysis to enlarge the investigated sample. We determined for LQ Hya three different starspot cycles and an antisolar pattern of SDR. Key words. Stars: activity - Stars: Late-type - Stars: magnetic fields - Stars: rotation - Stars: starspots 1. Introduction Stars with solar-like global properties (e.g., mass, T eff , L/L ), but at different stages of evolution, are suitable to study the evolution of the Sun’s magnetic activity. With this aim coordinated multiwavelength observations of sev- Send offprint requests to : S. Messina ? Guest User, Canadian Astronomy Data Center, which is operated by the Dominion Astrophysical Observatory for the National Research Council of Canada’s Herzberg Institute of Astrophysics. eral nearby, single, solar-type stars selected as proxies for the Sun from the ZAMS (Zero Age Main Sequence) to the TAMS (Terminal Age Main Sequence) have been car- ried out since 1990 as part of The Sun in Time project. The aim of the project is to investigate stellar activity cycles and differential rotation, to determine the evolu- tion of the solar dynamo and magnetic activity as well as to extract the solar UV and X-ray fluxes through the Sun’s post-ZAMS history (Dorren & Guinan 1994; G¨ udel et al. 1997; Guinan et al. 2001). In the first paper of this series (Messina & Guinan 2002, hereafter referred to as
Transcript of Magnetic activity of six young solar analogues II. Surface Differential Rotation from long-term...
Astronomy & Astrophysics manuscript no.(will be inserted by hand later)
Magnetic activity of six young solar analogues
II. Surface Differential Rotation from long-term photometry
S. Messina1,? and E. F. Guinan2
1 Catania Astrophysical Observatory, INAF, Via S. Sofia 78, I-95123 Catania, Italye-mail: [email protected]
2 Dept. of Astronomy and Astrophysics, Villanova University, Villanova 19085, PA USAe-mail: [email protected]
Received 16 May 2003 / Accepted 18 July 2003
Abstract. The present paper is the second of a series dedicated to the study of the magnetic activity in a selectedsample of young solar analogues. The sample includes five single G0-G5V stars with ages between ' 130 Myrand 700 Myr: EK Dra, π1 UMa, HN Peg, k1 Cet and BE Cet. In this study we also include the Pleiades-age(' 130 Myr) K0V star DX Leo. Our analysis is based on high precision photometric observations carried out aspart of The Sun in Time project, aimed at a multiwavelength study of stars with solar-like global properties, butwith different ages and thus at different stages of evolution. In the first papers of this series we presented thephotometric observations and determined the existence of starspot cycles and their correlation with the globalstellar properties. In the present paper we investigate the surface differential rotation (SDR). The periodogramanalysis of the photometric data time series has allowed us to determine the rotational periods and to derive thefollowing results: i) all the selected stars show variations of the rotational period. Such variations are definitelyperiodic and in phase with the starspot cycle for BE Cet and DX Leo. They are likely periodic and in phase alsofor π1 UMa, EK Dra and HN Peg, but still need confirmation. By analogy with the solar butterfly diagram, therotational period variations are interpretable in terms of surface differential rotation, that is, they are attributableto the existence of active latitude belts migrating during the activity cycle on a differentially rotating star; ii)BE Cet, π1 UMa and EK Dra show a solar-like pattern of SDR, that is the rotational period steadily decreasesalong the activity cycle, jumping back to higher values at the beginning of the next cycle; on the contrary, DXLeo, k1 Cet and HN Peg show an antisolar pattern; iii) the amplitude of the rotational period variations shows apower law dependence on the rotational period similar to that found in previous studies. Contrary to theoreticalpredictions, the cycle length is not correlated to the Dynamo number, it is indeed positively correlated to theSDR amplitude. More precisely, stars tend to concentrate along three different branches with the cycle lengthincreasing with increasing ∆Ω/Ω. Moreover, we found that the SDR amplitude changes from cycle to cycle, whichis reminiscent of a wave of excess rotation propagating in latitude; iiii) the apparently different solar and antisolarbehaviours are probably due to different inclinations of the stellar rotation axis under which the star is seen. Thelong-term photometry of the young single star LQ Hya, although not included in the initial project, is also usedin the present analysis to enlarge the investigated sample. We determined for LQ Hya three different starspotcycles and an antisolar pattern of SDR.
Key words. Stars: activity - Stars: Late-type - Stars: magnetic fields - Stars: rotation - Stars: starspots
1. Introduction
Stars with solar-like global properties (e.g., mass, Teff ,L/L), but at different stages of evolution, are suitable tostudy the evolution of the Sun’s magnetic activity. Withthis aim coordinated multiwavelength observations of sev-
Send offprint requests to: S. Messina? Guest User, Canadian Astronomy Data Center, which is
operated by the Dominion Astrophysical Observatory for theNational Research Council of Canada’s Herzberg Institute ofAstrophysics.
eral nearby, single, solar-type stars selected as proxies forthe Sun from the ZAMS (Zero Age Main Sequence) tothe TAMS (Terminal Age Main Sequence) have been car-ried out since 1990 as part of The Sun in Time project.The aim of the project is to investigate stellar activitycycles and differential rotation, to determine the evolu-tion of the solar dynamo and magnetic activity as wellas to extract the solar UV and X-ray fluxes through theSun’s post-ZAMS history (Dorren & Guinan 1994; Gudelet al. 1997; Guinan et al. 2001). In the first paper of thisseries (Messina & Guinan 2002, hereafter referred to as
2 S. Messina and E. F. Guinan: “SDR of six solar analogues”
Paper I) we presented the photometric observations anddetermined the existence of starspot cycles and of corre-lations between cycle length, amplitude and global stellarproperties for a selected sample of six young solar ana-logues. In the present paper we investigate the presenceof Surface Differential Rotation (SDR) and its connectionwith the starspot cycle in the same sample of stars, that isfive young single G0-G5V stars with ages between ' 130Myr and 700 Myr: EK Dra, π1 UMa, HN Peg, k1 Cet andBE Cet. We also include in this study the Pleiades-age ('130 Myr) K0V star DX Leo (see Table 1).A good knowledge of the SDR and of its dependenceon the global stellar properties is remarkable as differ-ential rotation is one of the key ingredients of the hydro-magnetic dynamo in the generation and sustainment ofstellar magnetic fields. These are thought to be responsi-ble of all activity phenomena observed in late-type stars(see e.g. Guinan & Gimenez 1992; Catalano et al. 1999;Rodono 2000). Moreover, observational studies of stellardifferential rotation are fundamental since they provideempirical relations which allow us to test dynamo theo-ries. In fact, also the current solar dynamo models are notcapable yet to successfully reproduce the temporal andspatial properties of the magnetic fields observed at theSun’s surface (Stix 1984).Since it is not possible to resolve the stellar disk, the mea-surements of differential rotation currently derived fromstellar observations are indirect. Nonetheless, they are in-dicative of the conditions in the stellar interior and putsignificant constraints to the amplitude of the internal dif-ferential rotation, the last being the quantity used in themodels.Measurements of stellar SDR are currently obtained indifferent ways: from Doppler Imaging maps, by latitude-by-latitude cross-correlation analysis to pairs of surfaceimages obtained several days apart (Vogt & Penrod 1983);from χ2 landscape imaging methods (Collier Cameron etal. 2002; Donati et al. 2000); from line profile analysis(Reiners & Schmitt 2002); from stellar butterfly diagrams,that is from the season-to-season variations of the rota-tional period, as measured from spectro-photometric (e.g.Ca II H&K fluxes, Wilson 1978; Baliunas et al. 1985, 1995;Dohanue et al. 1996) or broad-band photometric observa-tions, and correlated with the phase of the stellar activitycycle. By analogy with the solar case, such diagrams areinterpretable in terms of migration of activity centers to-wards latitudes with different angular velocities.The observations presented in Paper I are sufficiently timeextended to use stellar butterfly diagrams to investigatethe SDR. Since spots cover a limited range of latitudesthe SDR amplitudes derived with this methods are lowerlimits. Nonetheless, this method can allow us to investi-gate the existence of correlations with other global stellarparameters, the existence of different patterns of SDR andhow they are connected with the phase of the starspot cy-cle.In Sect. 2 we present the seasonal rotational periods ob-tained by means of the periodogram analysis. We also
present the results of the pooled variance analysis we car-ried out to disentangle the possible effects of the activeregions growth and decay (ARGD) on rotational periodvariations. The existence of different SDR patterns andtheir correlation with stellar parameters are discussed inSect. 3, while the conclusions are presented in Sect. 4.We refer the reader to Paper I for information on theglobal properties of the six stars under investigation, onthe photometric observations on which the present analy-sis is based, as well as on data acquisition and reductionprocedures.
2. Analysis
2.1. Periodograms
The photometric data of the six program stars wereanalysed using the Scargle-Press period search routine(Scargle 1982; Horne & Baliunas 1986) to look for theperiod of the photometric rotational modulation.The results are summarized in the Tables 2 - 7, where welist: time interval (HJD range) to which the photomet-ric period refers, number of observations (Nm), photo-metric period (P) and its uncertainty (∆P), as derivedfrom the method of Horne & Baliunas (1986), and thefalse-alarm-probability (FAP) of the peak frequency. Thelast quantity estimates the probability that a peak of thatheight could result from a similar sample of Gaussian noisewith the same variance of analysed data (cf. Horne &Baliunas 1986). No apparent periodicity was detected in afew seasons, when the data were too few and sparse. Thelack of apparent periodicity in other seasons was causedby the rather uniform longitudinal distribution of the spotcenters that could not produce a coherent rotational mod-ulation. Secondary periodicities were also searched by fil-tering the primary frequency modulation from the dataand recomputing the periodogram for residual data, ac-cording to the prescriptions of Horne & Baliunas (1986)and Baliunas et al. (1995). Only EK Dra showed evidencein several seasons for a significant secondary periodicity inthe optical modulation, when the primary frequency wasassumed to be real. Once determined the seasonal pho-tometric period, it proved possible to select several timeintervals (see Table 3- 8 of Paper I) along which the fluxshowed a regular modulation which could be attributedto the rotation of a stationary spot pattern on the pho-tosphere of the star. In such a way 24 light curves wereobtained for BE Cet, 18 for k1 Cet, 35 for π1 UMa, 92 forEK Dra, 12 for HN Peg and 53 for DX Leo.The light curves of all program stars showed remark-able variations in shape and amplitude over different timescales. The shortest-term variability can be attributedto optical flaring, whereas the variability observed ontime scales of a few rotations may be attributed to size-able intrinsic changes of the photospheric spot pattern.The longest-term variability, which can be cyclical, is at-tributable to variations of the total spotted area as well asof its distribution on the stellar photosphere. It has been
S. Messina and E. F. Guinan: “SDR of six solar analogues” 3
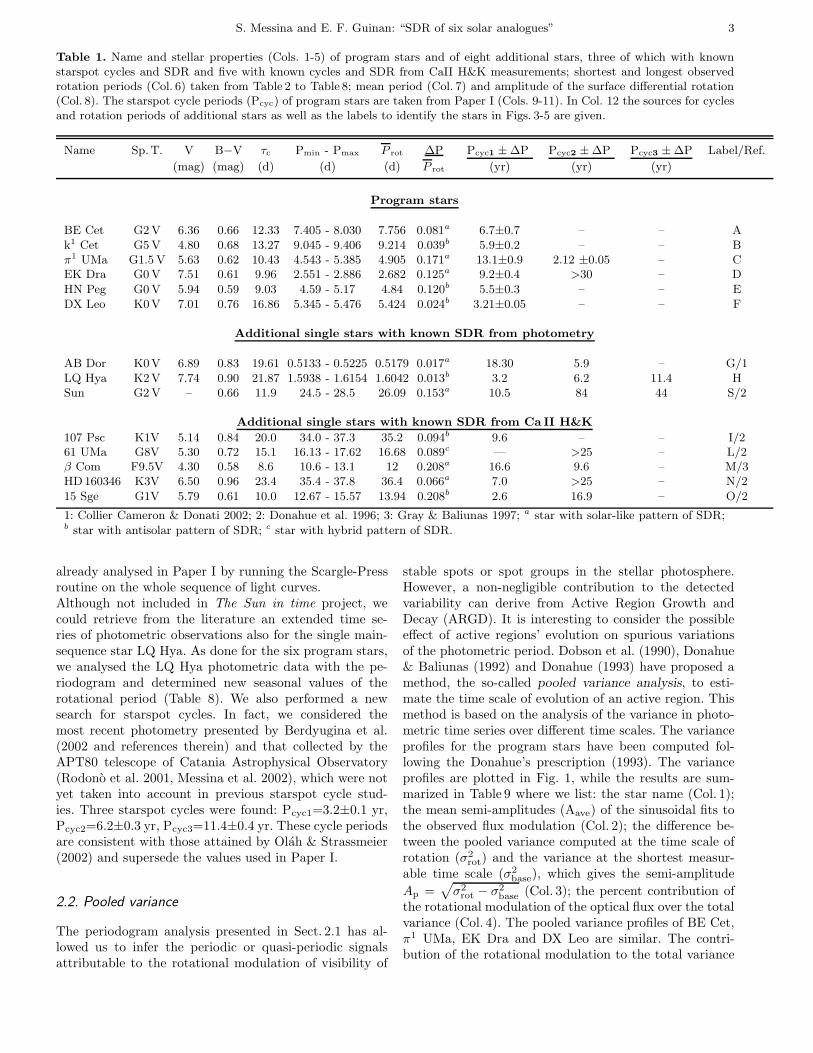
Table 1. Name and stellar properties (Cols. 1-5) of program stars and of eight additional stars, three of which with knownstarspot cycles and SDR and five with known cycles and SDR from CaII H&K measurements; shortest and longest observedrotation periods (Col. 6) taken from Table 2 to Table 8; mean period (Col. 7) and amplitude of the surface differential rotation(Col. 8). The starspot cycle periods (Pcyc) of program stars are taken from Paper I (Cols. 9-11). In Col. 12 the sources for cyclesand rotation periods of additional stars as well as the labels to identify the stars in Figs. 3-5 are given.
Name Sp.T. V B−V τc Pmin - Pmax P rot ∆P Pcyc1 ± ∆P Pcyc2 ± ∆P Pcyc3 ± ∆P Label/Ref.
(mag) (mag) (d) (d) (d) P rot (yr) (yr) (yr)
Program stars
BE Cet G2 V 6.36 0.66 12.33 7.405 - 8.030 7.756 0.081a 6.7±0.7 – – Ak1 Cet G5 V 4.80 0.68 13.27 9.045 - 9.406 9.214 0.039b 5.9±0.2 – – Bπ1 UMa G1.5 V 5.63 0.62 10.43 4.543 - 5.385 4.905 0.171a 13.1±0.9 2.12 ±0.05 – CEK Dra G0 V 7.51 0.61 9.96 2.551 - 2.886 2.682 0.125a 9.2±0.4 >30 – D
HN Peg G0 V 5.94 0.59 9.03 4.59 - 5.17 4.84 0.120b 5.5±0.3 – – EDX Leo K0V 7.01 0.76 16.86 5.345 - 5.476 5.424 0.024b 3.21±0.05 – – F
Additional single stars with known SDR from photometry
AB Dor K0V 6.89 0.83 19.61 0.5133 - 0.5225 0.5179 0.017a 18.30 5.9 – G/1LQ Hya K2V 7.74 0.90 21.87 1.5938 - 1.6154 1.6042 0.013b 3.2 6.2 11.4 HSun G2 V – 0.66 11.9 24.5 - 28.5 26.09 0.153a 10.5 84 44 S/2
Additional single stars with known SDR from Ca II H&K
107 Psc K1V 5.14 0.84 20.0 34.0 - 37.3 35.2 0.094b 9.6 – – I/261 UMa G8V 5.30 0.72 15.1 16.13 - 17.62 16.68 0.089c — >25 – L/2β Com F9.5V 4.30 0.58 8.6 10.6 - 13.1 12 0.208a 16.6 9.6 – M/3HD160346 K3V 6.50 0.96 23.4 35.4 - 37.8 36.4 0.066a 7.0 >25 – N/2
15 Sge G1V 5.79 0.61 10.0 12.67 - 15.57 13.94 0.208b 2.6 16.9 – O/2
1: Collier Cameron & Donati 2002; 2: Donahue et al. 1996; 3: Gray & Baliunas 1997; a star with solar-like pattern of SDR;b star with antisolar pattern of SDR; c star with hybrid pattern of SDR.
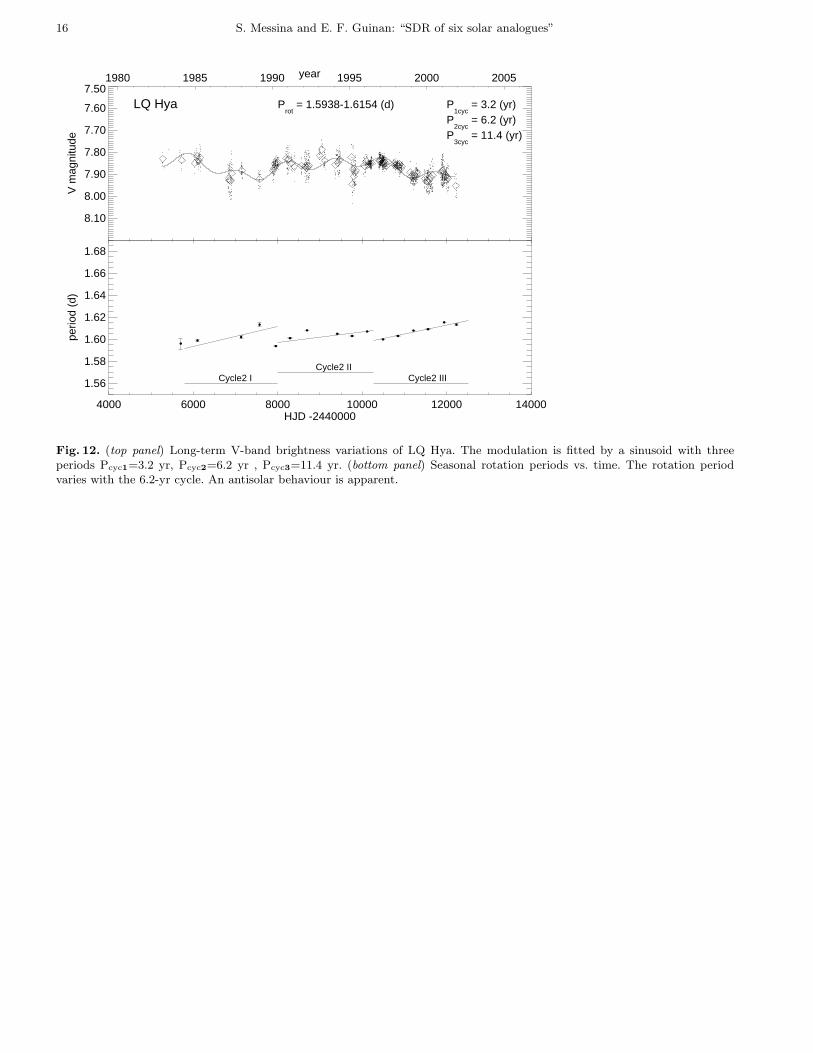
already analysed in Paper I by running the Scargle-Pressroutine on the whole sequence of light curves.Although not included in The Sun in time project, wecould retrieve from the literature an extended time se-ries of photometric observations also for the single main-sequence star LQ Hya. As done for the six program stars,we analysed the LQ Hya photometric data with the pe-riodogram and determined new seasonal values of therotational period (Table 8). We also performed a newsearch for starspot cycles. In fact, we considered themost recent photometry presented by Berdyugina et al.(2002 and references therein) and that collected by theAPT80 telescope of Catania Astrophysical Observatory(Rodono et al. 2001, Messina et al. 2002), which were notyet taken into account in previous starspot cycle stud-ies. Three starspot cycles were found: Pcyc1=3.2±0.1 yr,Pcyc2=6.2±0.3 yr, Pcyc3=11.4±0.4 yr. These cycle periodsare consistent with those attained by Olah & Strassmeier(2002) and supersede the values used in Paper I.
2.2. Pooled variance
The periodogram analysis presented in Sect. 2.1 has al-lowed us to infer the periodic or quasi-periodic signalsattributable to the rotational modulation of visibility of
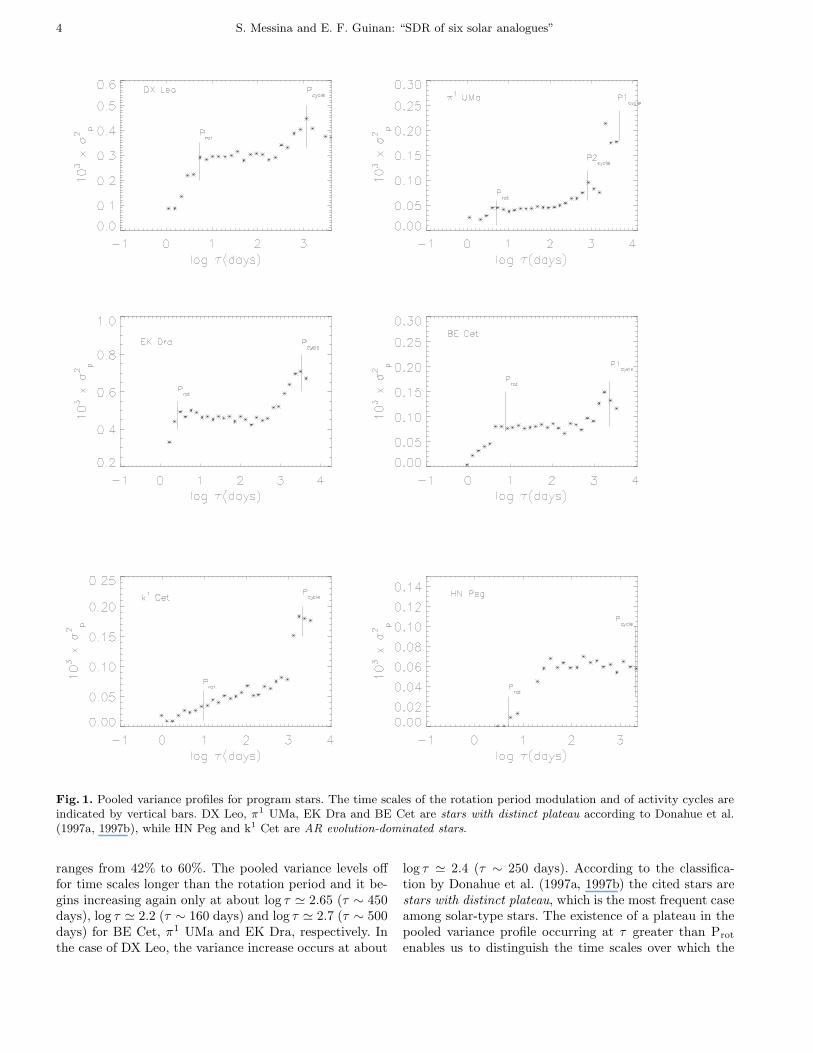
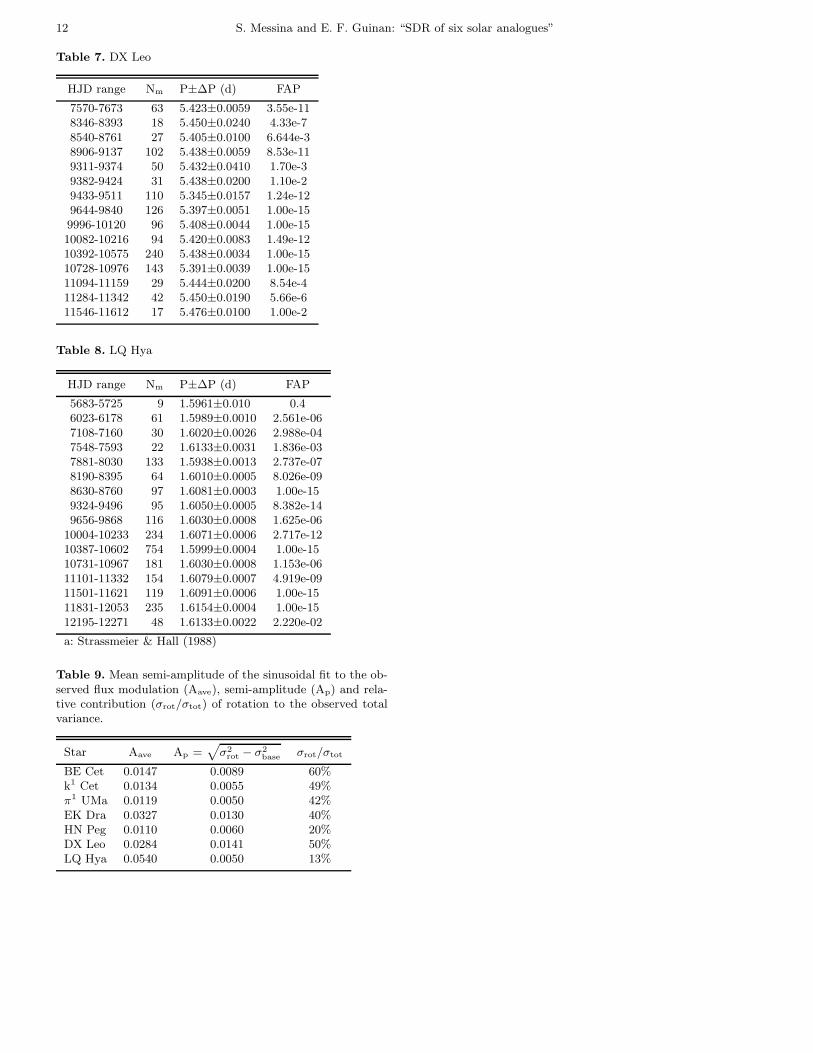
stable spots or spot groups in the stellar photosphere.However, a non-negligible contribution to the detectedvariability can derive from Active Region Growth andDecay (ARGD). It is interesting to consider the possibleeffect of active regions’ evolution on spurious variationsof the photometric period. Dobson et al. (1990), Donahue& Baliunas (1992) and Donahue (1993) have proposed amethod, the so-called pooled variance analysis, to esti-mate the time scale of evolution of an active region. Thismethod is based on the analysis of the variance in photo-metric time series over different time scales. The varianceprofiles for the program stars have been computed fol-lowing the Donahue’s prescription (1993). The varianceprofiles are plotted in Fig. 1, while the results are sum-marized in Table 9 where we list: the star name (Col. 1);the mean semi-amplitudes (Aave) of the sinusoidal fits tothe observed flux modulation (Col. 2); the difference be-tween the pooled variance computed at the time scale ofrotation (σ2
rot) and the variance at the shortest measur-able time scale (σ2
base), which gives the semi-amplitude
Ap =√
σ2rot − σ2
base (Col. 3); the percent contribution ofthe rotational modulation of the optical flux over the totalvariance (Col. 4). The pooled variance profiles of BE Cet,π1 UMa, EK Dra and DX Leo are similar. The contri-bution of the rotational modulation to the total variance
4 S. Messina and E. F. Guinan: “SDR of six solar analogues”
Fig. 1. Pooled variance profiles for program stars. The time scales of the rotation period modulation and of activity cycles areindicated by vertical bars. DX Leo, π1 UMa, EK Dra and BE Cet are stars with distinct plateau according to Donahue et al.(1997a, 1997b), while HN Peg and k1 Cet are AR evolution-dominated stars.
ranges from 42% to 60%. The pooled variance levels offfor time scales longer than the rotation period and it be-gins increasing again only at about log τ ' 2.65 (τ ∼ 450days), log τ ' 2.2 (τ ∼ 160 days) and log τ ' 2.7 (τ ∼ 500days) for BE Cet, π1 UMa and EK Dra, respectively. Inthe case of DX Leo, the variance increase occurs at about
log τ ' 2.4 (τ ∼ 250 days). According to the classifica-tion by Donahue et al. (1997a, 1997b) the cited stars arestars with distinct plateau, which is the most frequent caseamong solar-type stars. The existence of a plateau in thepooled variance profile occurring at τ greater than Prot
enables us to distinguish the time scales over which the
S. Messina and E. F. Guinan: “SDR of six solar analogues” 5
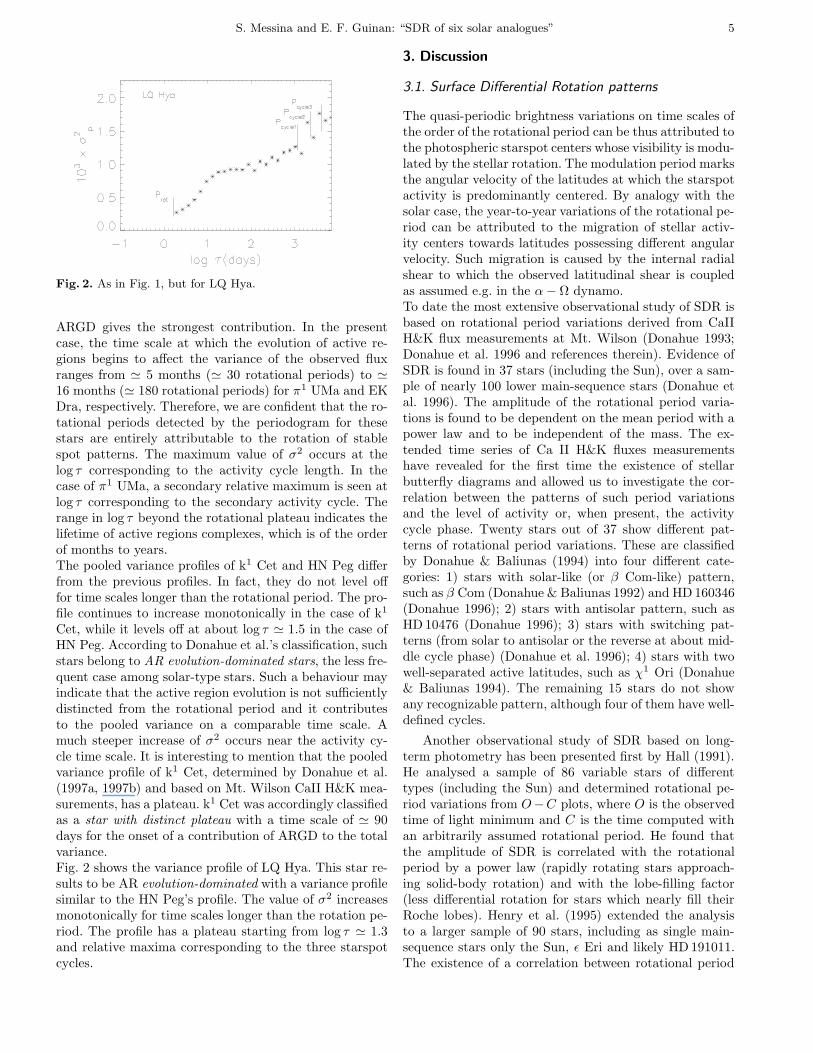
Fig. 2. As in Fig. 1, but for LQ Hya.
ARGD gives the strongest contribution. In the presentcase, the time scale at which the evolution of active re-gions begins to affect the variance of the observed fluxranges from ' 5 months (' 30 rotational periods) to '16 months (' 180 rotational periods) for π1 UMa and EKDra, respectively. Therefore, we are confident that the ro-tational periods detected by the periodogram for thesestars are entirely attributable to the rotation of stablespot patterns. The maximum value of σ2 occurs at thelog τ corresponding to the activity cycle length. In thecase of π1 UMa, a secondary relative maximum is seen atlog τ corresponding to the secondary activity cycle. Therange in log τ beyond the rotational plateau indicates thelifetime of active regions complexes, which is of the orderof months to years.The pooled variance profiles of k1 Cet and HN Peg differfrom the previous profiles. In fact, they do not level offfor time scales longer than the rotational period. The pro-file continues to increase monotonically in the case of k1
Cet, while it levels off at about log τ ' 1.5 in the case ofHN Peg. According to Donahue et al.’s classification, suchstars belong to AR evolution-dominated stars, the less fre-quent case among solar-type stars. Such a behaviour mayindicate that the active region evolution is not sufficientlydistincted from the rotational period and it contributesto the pooled variance on a comparable time scale. Amuch steeper increase of σ2 occurs near the activity cy-cle time scale. It is interesting to mention that the pooledvariance profile of k1 Cet, determined by Donahue et al.(1997a, 1997b) and based on Mt. Wilson CaII H&K mea-surements, has a plateau. k1 Cet was accordingly classifiedas a star with distinct plateau with a time scale of ' 90days for the onset of a contribution of ARGD to the totalvariance.Fig. 2 shows the variance profile of LQ Hya. This star re-sults to be AR evolution-dominated with a variance profilesimilar to the HN Peg’s profile. The value of σ2 increasesmonotonically for time scales longer than the rotation pe-riod. The profile has a plateau starting from log τ ' 1.3and relative maxima corresponding to the three starspotcycles.
3. Discussion
3.1. Surface Differential Rotation patterns
The quasi-periodic brightness variations on time scales ofthe order of the rotational period can be thus attributed tothe photospheric starspot centers whose visibility is modu-lated by the stellar rotation. The modulation period marksthe angular velocity of the latitudes at which the starspotactivity is predominantly centered. By analogy with thesolar case, the year-to-year variations of the rotational pe-riod can be attributed to the migration of stellar activ-ity centers towards latitudes possessing different angularvelocity. Such migration is caused by the internal radialshear to which the observed latitudinal shear is coupledas assumed e.g. in the α − Ω dynamo.To date the most extensive observational study of SDR isbased on rotational period variations derived from CaIIH&K flux measurements at Mt. Wilson (Donahue 1993;Donahue et al. 1996 and references therein). Evidence ofSDR is found in 37 stars (including the Sun), over a sam-ple of nearly 100 lower main-sequence stars (Donahue etal. 1996). The amplitude of the rotational period varia-tions is found to be dependent on the mean period with apower law and to be independent of the mass. The ex-tended time series of Ca II H&K fluxes measurementshave revealed for the first time the existence of stellarbutterfly diagrams and allowed us to investigate the cor-relation between the patterns of such period variationsand the level of activity or, when present, the activitycycle phase. Twenty stars out of 37 show different pat-terns of rotational period variations. These are classifiedby Donahue & Baliunas (1994) into four different cate-gories: 1) stars with solar-like (or β Com-like) pattern,such as β Com (Donahue & Baliunas 1992) and HD 160346(Donahue 1996); 2) stars with antisolar pattern, such asHD 10476 (Donahue 1996); 3) stars with switching pat-terns (from solar to antisolar or the reverse at about mid-dle cycle phase) (Donahue et al. 1996); 4) stars with twowell-separated active latitudes, such as χ1 Ori (Donahue& Baliunas 1994). The remaining 15 stars do not showany recognizable pattern, although four of them have well-defined cycles.
Another observational study of SDR based on long-term photometry has been presented first by Hall (1991).He analysed a sample of 86 variable stars of differenttypes (including the Sun) and determined rotational pe-riod variations from O−C plots, where O is the observedtime of light minimum and C is the time computed withan arbitrarily assumed rotational period. He found thatthe amplitude of SDR is correlated with the rotationalperiod by a power law (rapidly rotating stars approach-ing solid-body rotation) and with the lobe-filling factor(less differential rotation for stars which nearly fill theirRoche lobes). Henry et al. (1995) extended the analysisto a larger sample of 90 stars, including as single main-sequence stars only the Sun, ε Eri and likely HD 191011.The existence of a correlation between rotational period
6 S. Messina and E. F. Guinan: “SDR of six solar analogues”
variations and long-term brightness changes was detectedin five stars (four binaries and one subgiant star).
The extended time series of photometric data collectedas part of The Sun in time project allows us to investigatein a selected sample of single solar-type stars the exis-tence of those SDR patterns already detected by Donahuefrom Ca II H&K fluxes measurements and by Henry etal. from O − C plots in binary and subgiant stars. Insuch a way analogies and/or differences with respect tothe solar case and to binary stars can be investigated.Preliminary results based on photometric data were pre-sented by Messina et al. (1999) and Messina & Guinan(2001).
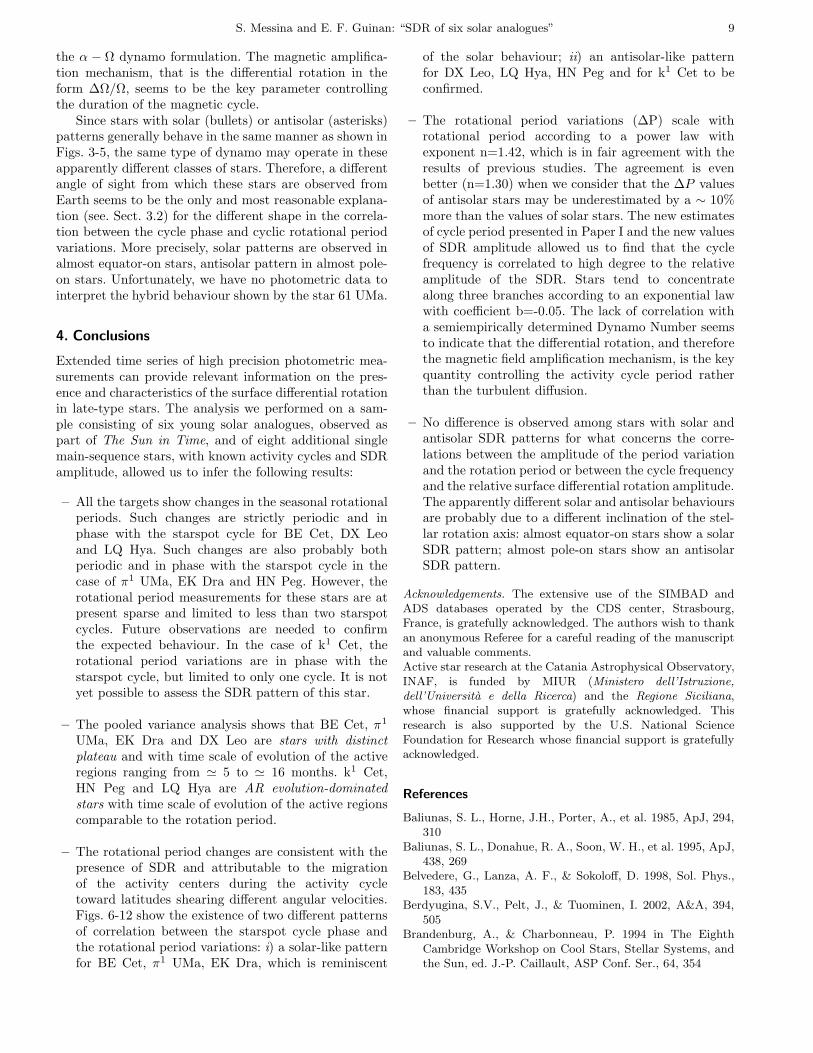
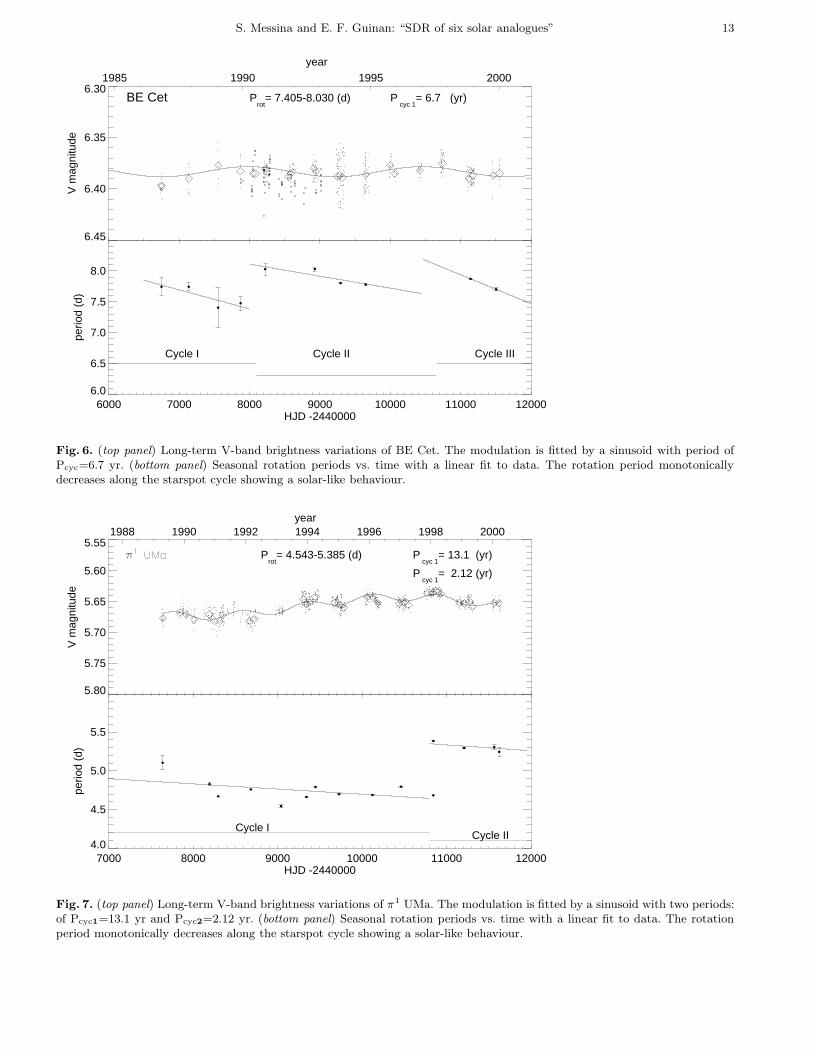
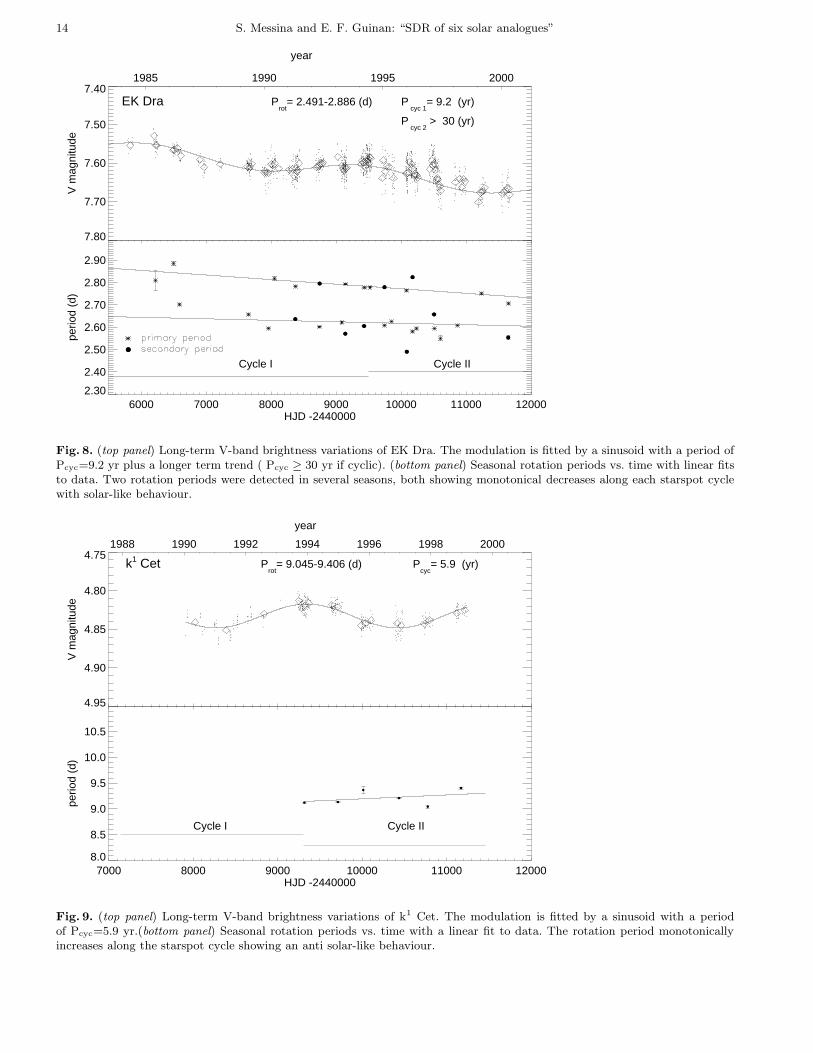
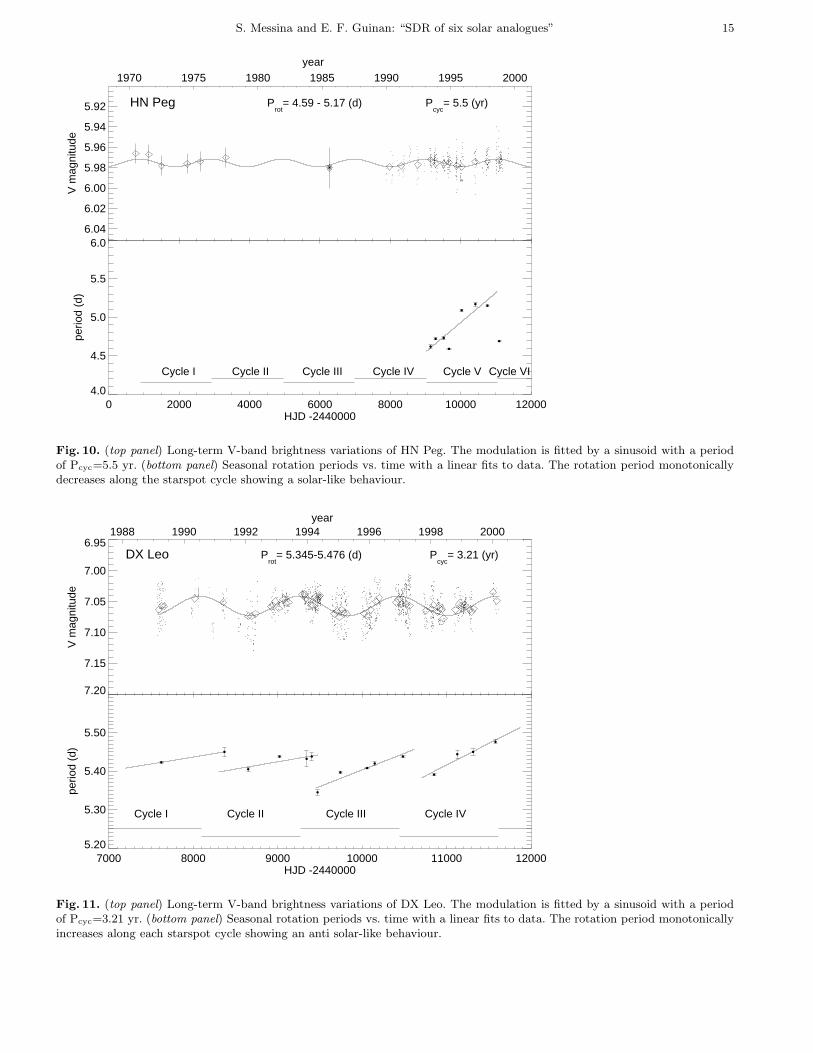
In Figs. 6-12 (top panels) we plot the time sequence ofV-band magnitudes of the program stars. Dots are nightlyaveraged observations and diamonds are mean magnitudescomputed from individual light curves (Vmax + Vmin)/2.Continuous lines are sinusoidal fits to the data accordingto the cycle periods listed in Table 1 (see also Sect. 3 andSect. 4 of Paper I). In the bottom panels of Figs. 6- 12 weplot the seasonal values of the rotational period and theiruncertainty as listed in Tables 2- 8. Continuous lines arelinear fits to the data. Horizontal lines show the time loca-tion of individual starspot cycles and show the correlationbetween the trend of rotational period variations and thestarspot cycle phase.In the case of BE Cet and π1 UMa (Fig. 6 and Fig. 7) therotational period tends to decrease steadily during eachcycle, jumping back to a higher value at the beginningof a new cycle. This is reminiscent of the sunspot cyclicbehaviour, where the latitude of spot formation moves to-ward the equator, i.e., toward progressively faster rotat-ing latitudes along an activity cycle, thus producing a de-crease in the photometric period. However, the rotationalperiod measurements of π1 UMa are at present limited toless than two cycles and future observations are needed toconfirm the solar-like behaviour. In the case of EK Dra(Fig. 8) the periodogram analysis detected the presenceof a secondary rotation period in several seasons, as men-tioned in Sect. 2.1. Both periods tend to decrease steadilyduring 17 yr of observations. The two contemporary rota-tional periods are likely to be due to the presence of twolong-lived active regions at different latitudes with differ-ent angular velocities because of the differential rotationregime. The period variations seem to be correlated withthe long-term photometric variation. On the basis of arecent study of long-term photometry on Sonenberg sky-patrol plates (Frohlich et al. 2002), this long-term varia-tion may be a segment of a cycle longer than half a cen-tury. If this is the case, EK Dra would display a solar-likebehaviour.k1 Cet, HN Peg and DX Leo (Fig. 9 to Fig. 11) show anantisolar pattern, where the rotational period tends to in-crease steadily during each cycle, jumping back to a lowervalue at the beginning of a new cycle. In the case of k1 Cet,we have to date measurements of the rotational periodalong one starspot cycle only, while in the case of HN Pegthe last rotational period measured at the epoch 1998.23
seems to confirm the suspected antisolar behaviour. It isimportant to remember that the pooled variance analysishas shown that for k1 Cet and HN Peg the ARGD mayaffect the value of the rotational period. Therefore, on thebasis of the available relatively sparse rotational perioddata and of the pooled variance analysis, we reserve toconfirm the antisolar behaviour of these two stars withfuture observations. On the contrary, in the case of DXLeo (Fig. 11) the number of observed starspot cycles issufficient to confidently classify its behaviour as antisolar.LQ Hya (Fig. 12) has a rotational period which varies inphase with the 6.2-yr starspot cycle and with a clear anti-solar behaviour. It is remarkable that a regular and pho-tometrically detectable pattern of SDR persists, althoughthree cycles with similar amplitude (0.02 mag) and differ-ent period superimpose each on other.It is also interesting to note that the slope of the rota-tional period variations and, therefore, the amplitude ofSDR changes from cycle to cycle. Such behaviour is evi-dent for BE Cet and best visible for DX Leo and LQ Hyawhose photometric monitoring cover several cycles. Suchbehaviour, already observed in AB Dor (Collier Cameron& Donati 2002) from spectroscopic data, resembles a waveof excess rotation on a time scale of the order of decades.However, the observed variation of the slope from cycle tocycle may as well as be caused by a variation of the widthof the latitude band in which spots occur.
One of the most remarkable results derived from thisanalysis is the indirect evidence (since the stellar disk isnot spatially resolved), also from photometric data, thatsolar-type stars can display an antisolar pattern of SDR inthe sense of rotational periods steadily increasing duringthe starspot cycle. In the case of the Sun, the migration ofactive regions is regarded as a consequence of the latitu-dinal migration of a dynamo wave propagating in a shellnear the base of the solar convective zone. The directionof migration is related to the sign of the product of the ra-dial gradient of the angular velocity in the shell ∂Ω
∂rby the
parameter α, which measures the intensity of the regenera-tion of the poloidal field component by cyclonic convection(Moffatt 1978)1. In the Sun the sign of α∂Ω
∂r, at low and
intermediate latitudes, is such as to produce an equatori-alward migration of the dynamo wave (Stix 1976). Sucha migration, in association with the increase in the angu-lar velocity toward the equator ( ∂Ω
∂φ< 0, where φ is the
latitude), is responsible of the decrease in the rotationalperiod of the active regions of the Sun versus increasingcycle phases, i.e toward the activity maximum.In order to explain the antisolar behaviour observed instars with Sun-like global properties, a different patternof the differential rotation (or of the α effect) might beinvoked, i.e. a poleward acceleration of the surface dif-ferential rotation. However, it is also possible to proposean interpretation in terms of high latitude starspot activ-
1 In the present discussion we shall assume that any possiblemeridional flow does not affect significantly the migration ofthe dynamo wave in the Sun and active stars.
S. Messina and E. F. Guinan: “SDR of six solar analogues” 7
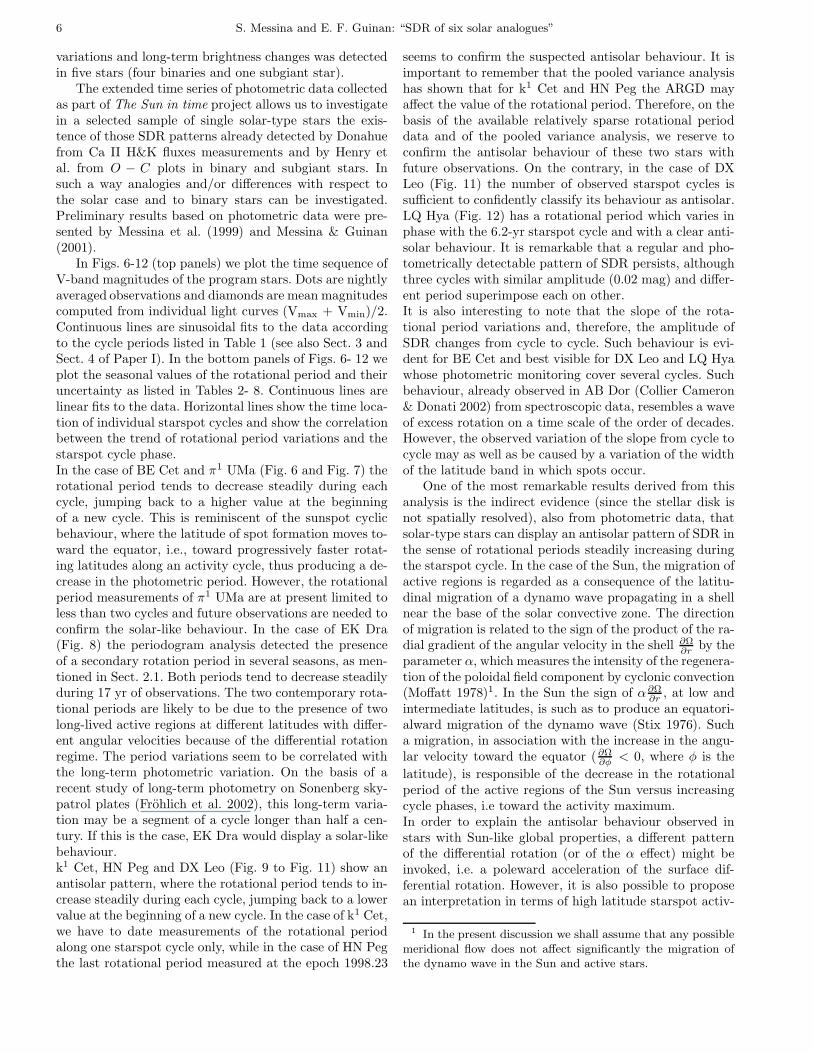
Fig. 3. The rotational period variations (∆P) for the stars inTable 1 are plotted vs. the mean rotational period. Bullets, as-terisks and pluses denote solar, antisolar and hybrid SDR pat-terns, respectively. Capital letters identify the targets accordingto Table 1. The continuous line is a power law fit to the wholesample, while the dotted line is a power law fit to G-type starsonly.
ity with the same internal differential rotation pattern ofthe Sun. Specifically, helioseismic observations show thatthe radial gradient at the base of the convective zone ∂Ω
∂r
changes sign for φ > 40 (e.g., Kosovichev 1996). The so-lar dynamo is not strong enough to produce spot activityat latitudes φ > 40, but in more active stars the dynamomay be expected to amplify significantly the toroidal fieldup to subpolar latitudes (e.g., Tobias et al. 1997; Belvedereet al. 1998). The high latitude spot belts (φ > 40) will mi-grate toward the pole, because the sign of α ∂Ω
∂ris opposite
to that in low latitudes (φ < 40), and if the rotation axisof the star is inclined with respect to the line of sight, thehigh latitude spots may well dominate the optical mod-ulation producing an increase in the photometric periodwith the activity cycle phase.Evidence of periodic variations of the rotational periodcorrelated with the starspot cycle phase are also found inbinary stars, e.g. in the RS CVn-type star II Peg (Rodonoet al. 2000), which displays a solar-like SDR pattern. Anundergoing study, based on long-term photometry of bi-nary stars (Rodono et al. 2003) and carried out in a con-sistent way as that used in the present analysis, will allowus to investigate analogies and/or differences with respectto the case of single main-sequence stars.
3.2. Correlation with stellar parameters
In order to perform a more robust analysis of the cor-relation between SDR and global stellar properties, wesearched the literature for other stars with known cyclesand contemporary seasonal rotational period determina-tions. Eight stars were found to satisfy our requirements:AB Dor, 107 Psc, 61 UMa, β Com, HD160346, 15 Sge andthe Sun. These stars are listed in Table 1 with indication
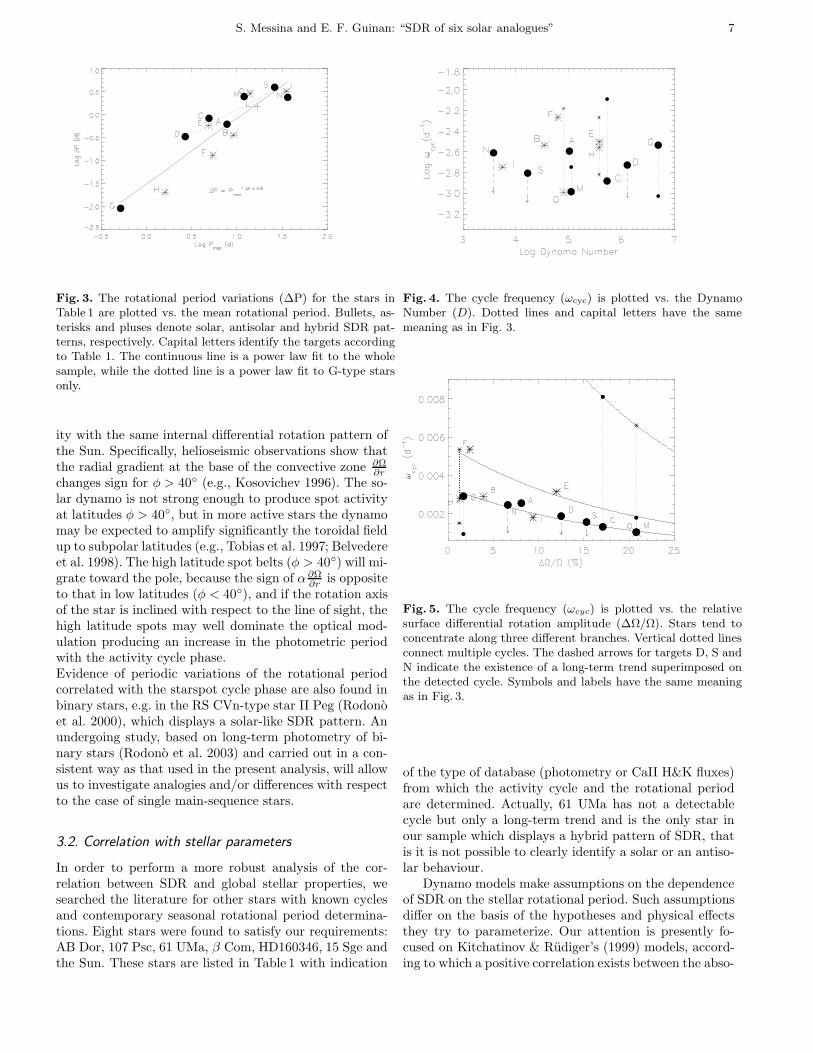
Fig. 4. The cycle frequency (ωcyc) is plotted vs. the DynamoNumber (D). Dotted lines and capital letters have the samemeaning as in Fig. 3.
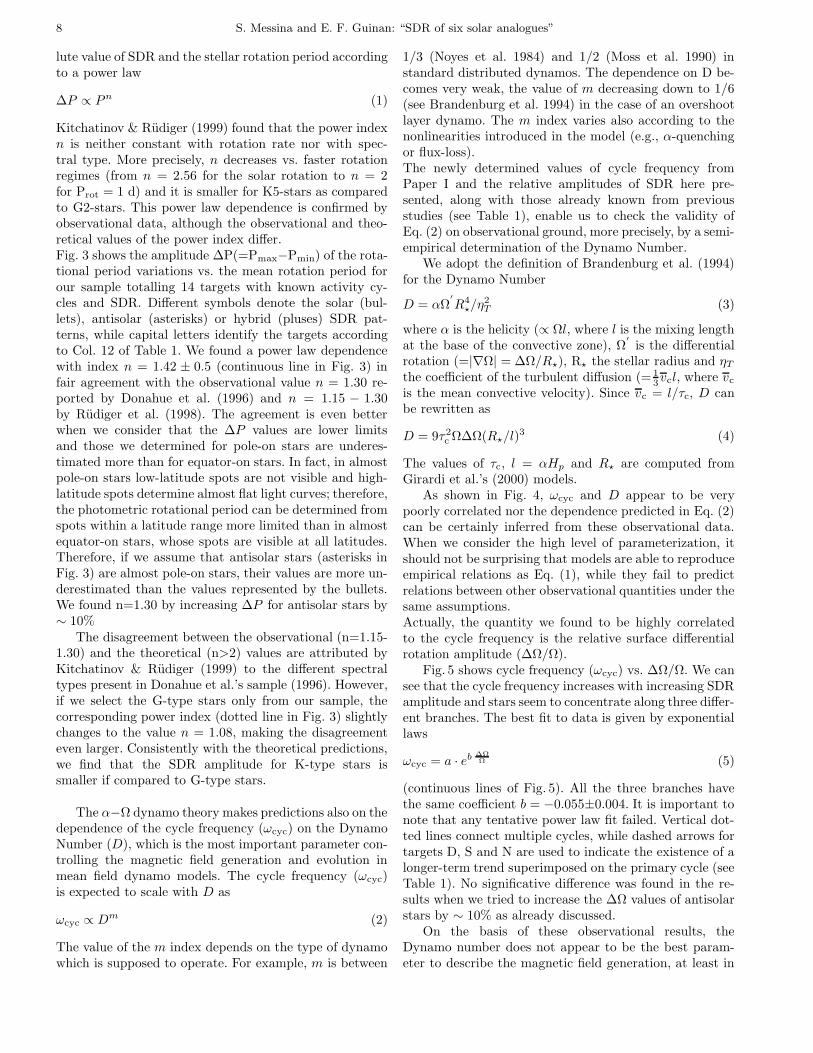
Fig. 5. The cycle frequency (ωcyc) is plotted vs. the relativesurface differential rotation amplitude (∆Ω/Ω). Stars tend toconcentrate along three different branches. Vertical dotted linesconnect multiple cycles. The dashed arrows for targets D, S andN indicate the existence of a long-term trend superimposed onthe detected cycle. Symbols and labels have the same meaningas in Fig. 3.
of the type of database (photometry or CaII H&K fluxes)from which the activity cycle and the rotational periodare determined. Actually, 61 UMa has not a detectablecycle but only a long-term trend and is the only star inour sample which displays a hybrid pattern of SDR, thatis it is not possible to clearly identify a solar or an antiso-lar behaviour.
Dynamo models make assumptions on the dependenceof SDR on the stellar rotational period. Such assumptionsdiffer on the basis of the hypotheses and physical effectsthey try to parameterize. Our attention is presently fo-cused on Kitchatinov & Rudiger’s (1999) models, accord-ing to which a positive correlation exists between the abso-
8 S. Messina and E. F. Guinan: “SDR of six solar analogues”
lute value of SDR and the stellar rotation period accordingto a power law
∆P ∝ P n (1)
Kitchatinov & Rudiger (1999) found that the power indexn is neither constant with rotation rate nor with spec-tral type. More precisely, n decreases vs. faster rotationregimes (from n = 2.56 for the solar rotation to n = 2for Prot = 1 d) and it is smaller for K5-stars as comparedto G2-stars. This power law dependence is confirmed byobservational data, although the observational and theo-retical values of the power index differ.Fig. 3 shows the amplitude ∆P(=Pmax−Pmin) of the rota-tional period variations vs. the mean rotation period forour sample totalling 14 targets with known activity cy-cles and SDR. Different symbols denote the solar (bul-lets), antisolar (asterisks) or hybrid (pluses) SDR pat-terns, while capital letters identify the targets accordingto Col. 12 of Table 1. We found a power law dependencewith index n = 1.42 ± 0.5 (continuous line in Fig. 3) infair agreement with the observational value n = 1.30 re-ported by Donahue et al. (1996) and n = 1.15 − 1.30by Rudiger et al. (1998). The agreement is even betterwhen we consider that the ∆P values are lower limitsand those we determined for pole-on stars are underes-timated more than for equator-on stars. In fact, in almostpole-on stars low-latitude spots are not visible and high-latitude spots determine almost flat light curves; therefore,the photometric rotational period can be determined fromspots within a latitude range more limited than in almostequator-on stars, whose spots are visible at all latitudes.Therefore, if we assume that antisolar stars (asterisks inFig. 3) are almost pole-on stars, their values are more un-derestimated than the values represented by the bullets.We found n=1.30 by increasing ∆P for antisolar stars by∼ 10%
The disagreement between the observational (n=1.15-1.30) and the theoretical (n>2) values are attributed byKitchatinov & Rudiger (1999) to the different spectraltypes present in Donahue et al.’s sample (1996). However,if we select the G-type stars only from our sample, thecorresponding power index (dotted line in Fig. 3) slightlychanges to the value n = 1.08, making the disagreementeven larger. Consistently with the theoretical predictions,we find that the SDR amplitude for K-type stars issmaller if compared to G-type stars.
The α−Ω dynamo theory makes predictions also on thedependence of the cycle frequency (ωcyc) on the DynamoNumber (D), which is the most important parameter con-trolling the magnetic field generation and evolution inmean field dynamo models. The cycle frequency (ωcyc)is expected to scale with D as
ωcyc ∝ Dm (2)
The value of the m index depends on the type of dynamowhich is supposed to operate. For example, m is between
1/3 (Noyes et al. 1984) and 1/2 (Moss et al. 1990) instandard distributed dynamos. The dependence on D be-comes very weak, the value of m decreasing down to 1/6(see Brandenburg et al. 1994) in the case of an overshootlayer dynamo. The m index varies also according to thenonlinearities introduced in the model (e.g., α-quenchingor flux-loss).The newly determined values of cycle frequency fromPaper I and the relative amplitudes of SDR here pre-sented, along with those already known from previousstudies (see Table 1), enable us to check the validity ofEq. (2) on observational ground, more precisely, by a semi-empirical determination of the Dynamo Number.
We adopt the definition of Brandenburg et al. (1994)for the Dynamo Number
D = αΩ′
R4?/η2
T (3)
where α is the helicity (∝ Ωl, where l is the mixing lengthat the base of the convective zone), Ω
′
is the differentialrotation (=|∇Ω| = ∆Ω/R?), R? the stellar radius and ηT
the coefficient of the turbulent diffusion (= 13vcl, where vc
is the mean convective velocity). Since vc = l/τc, D canbe rewritten as
D = 9τ2c Ω∆Ω(R?/l)3 (4)
The values of τc, l = αHp and R? are computed fromGirardi et al.’s (2000) models.
As shown in Fig. 4, ωcyc and D appear to be verypoorly correlated nor the dependence predicted in Eq. (2)can be certainly inferred from these observational data.When we consider the high level of parameterization, itshould not be surprising that models are able to reproduceempirical relations as Eq. (1), while they fail to predictrelations between other observational quantities under thesame assumptions.Actually, the quantity we found to be highly correlatedto the cycle frequency is the relative surface differentialrotation amplitude (∆Ω/Ω).
Fig. 5 shows cycle frequency (ωcyc) vs. ∆Ω/Ω. We cansee that the cycle frequency increases with increasing SDRamplitude and stars seem to concentrate along three differ-ent branches. The best fit to data is given by exponentiallaws
ωcyc = a · eb ∆Ω
Ω (5)
(continuous lines of Fig. 5). All the three branches havethe same coefficient b = −0.055±0.004. It is important tonote that any tentative power law fit failed. Vertical dot-ted lines connect multiple cycles, while dashed arrows fortargets D, S and N are used to indicate the existence of alonger-term trend superimposed on the primary cycle (seeTable 1). No significative difference was found in the re-sults when we tried to increase the ∆Ω values of antisolarstars by ∼ 10% as already discussed.
On the basis of these observational results, theDynamo number does not appear to be the best param-eter to describe the magnetic field generation, at least in
S. Messina and E. F. Guinan: “SDR of six solar analogues” 9
the α − Ω dynamo formulation. The magnetic amplifica-tion mechanism, that is the differential rotation in theform ∆Ω/Ω, seems to be the key parameter controllingthe duration of the magnetic cycle.
Since stars with solar (bullets) or antisolar (asterisks)patterns generally behave in the same manner as shown inFigs. 3-5, the same type of dynamo may operate in theseapparently different classes of stars. Therefore, a differentangle of sight from which these stars are observed fromEarth seems to be the only and most reasonable explana-tion (see. Sect. 3.2) for the different shape in the correla-tion between the cycle phase and cyclic rotational periodvariations. More precisely, solar patterns are observed inalmost equator-on stars, antisolar pattern in almost pole-on stars. Unfortunately, we have no photometric data tointerpret the hybrid behaviour shown by the star 61 UMa.
4. Conclusions
Extended time series of high precision photometric mea-surements can provide relevant information on the pres-ence and characteristics of the surface differential rotationin late-type stars. The analysis we performed on a sam-ple consisting of six young solar analogues, observed aspart of The Sun in Time, and of eight additional singlemain-sequence stars, with known activity cycles and SDRamplitude, allowed us to infer the following results:
– All the targets show changes in the seasonal rotationalperiods. Such changes are strictly periodic and inphase with the starspot cycle for BE Cet, DX Leoand LQ Hya. Such changes are also probably bothperiodic and in phase with the starspot cycle in thecase of π1 UMa, EK Dra and HN Peg. However, therotational period measurements for these stars are atpresent sparse and limited to less than two starspotcycles. Future observations are needed to confirmthe expected behaviour. In the case of k1 Cet, therotational period variations are in phase with thestarspot cycle, but limited to only one cycle. It is notyet possible to assess the SDR pattern of this star.
– The pooled variance analysis shows that BE Cet, π1
UMa, EK Dra and DX Leo are stars with distinct
plateau and with time scale of evolution of the activeregions ranging from ' 5 to ' 16 months. k1 Cet,HN Peg and LQ Hya are AR evolution-dominated
stars with time scale of evolution of the active regionscomparable to the rotation period.
– The rotational period changes are consistent with thepresence of SDR and attributable to the migrationof the activity centers during the activity cycletoward latitudes shearing different angular velocities.Figs. 6-12 show the existence of two different patternsof correlation between the starspot cycle phase andthe rotational period variations: i) a solar-like patternfor BE Cet, π1 UMa, EK Dra, which is reminiscent
of the solar behaviour; ii) an antisolar-like patternfor DX Leo, LQ Hya, HN Peg and for k1 Cet to beconfirmed.
– The rotational period variations (∆P) scale withrotational period according to a power law withexponent n=1.42, which is in fair agreement with theresults of previous studies. The agreement is evenbetter (n=1.30) when we consider that the ∆P valuesof antisolar stars may be underestimated by a ∼ 10%more than the values of solar stars. The new estimatesof cycle period presented in Paper I and the new valuesof SDR amplitude allowed us to find that the cyclefrequency is correlated to high degree to the relativeamplitude of the SDR. Stars tend to concentratealong three branches according to an exponential lawwith coefficient b=-0.05. The lack of correlation witha semiempirically determined Dynamo Number seemsto indicate that the differential rotation, and thereforethe magnetic field amplification mechanism, is the keyquantity controlling the activity cycle period ratherthan the turbulent diffusion.
– No difference is observed among stars with solar andantisolar SDR patterns for what concerns the corre-lations between the amplitude of the period variationand the rotation period or between the cycle frequencyand the relative surface differential rotation amplitude.The apparently different solar and antisolar behavioursare probably due to a different inclination of the stel-lar rotation axis: almost equator-on stars show a solarSDR pattern; almost pole-on stars show an antisolarSDR pattern.
Acknowledgements. The extensive use of the SIMBAD andADS databases operated by the CDS center, Strasbourg,France, is gratefully acknowledged. The authors wish to thankan anonymous Referee for a careful reading of the manuscriptand valuable comments.Active star research at the Catania Astrophysical Observatory,INAF, is funded by MIUR (Ministero dell’Istruzione,dell’Universita e della Ricerca) and the Regione Siciliana,whose financial support is gratefully acknowledged. Thisresearch is also supported by the U.S. National ScienceFoundation for Research whose financial support is gratefullyacknowledged.
References
Baliunas, S. L., Horne, J.H., Porter, A., et al. 1985, ApJ, 294,310
Baliunas, S. L., Donahue, R. A., Soon, W. H., et al. 1995, ApJ,438, 269
Belvedere, G., Lanza, A. F., & Sokoloff, D. 1998, Sol. Phys.,183, 435
Berdyugina, S.V., Pelt, J., & Tuominen, I. 2002, A&A, 394,505
Brandenburg, A., & Charbonneau, P. 1994 in The EighthCambridge Workshop on Cool Stars, Stellar Systems, andthe Sun, ed. J.-P. Caillault, ASP Conf. Ser., 64, 354
10 S. Messina and E. F. Guinan: “SDR of six solar analogues”
Catalano, S., Lanzafame, A., Pagano, I., & Rodono, M. 1999,Mem. Soc. Astron. Ital., 70, 463
Collier Cameron, A., & Donati, J.-F. 2002, MNRAS, 329, L23
Collier Cameron, A., Donati, J.-F., & Semel, M. 2002,MNRAS, 330, 699
Dobson, A. K., Donahue, R. A., Radick, R. R., & Kadlec, K. L.1990, in The Sixth Cambridge Symposium on Cool Stars,Stellar Systems and the Sun, ed. G. Wallerstein, ASP Conf.Ser., 9, 132
Donahue, R. A. 1993, Ph.D. Thesis, New Mexico StateUniversity
Donahue, R. A. 1996, in Stellar Surface Structures, eds. K.Strassmeier, & J. L. Linsky, IAU Symp. 176, Kluwer,Dordrecht, 261
Donahue, R. A., & Baliunas, S. L. 1992, ApJ, 393, L63
Donahue, R. A., & Baliunas, S. L. 1994, in The EighthCambridge Workshop on Cool Stars, Stellar Systems, andthe Sun, ed. J.-P. Caillault, ASP Conf. Ser., 64, 468
Donahue, R. A., Saar, S.H., & Baliunas, S. L. 1996, ApJ, 466,384
Donahue, R.A., Dobson, A.K., & Baliunas, S.L. 1997a, SolarPhysics, 171, 211
Donahue, R.A., Dobson, A.K., & Baliunas, S.L. 1997b, SolarPhysics, 171, 191
Donati, J.-F., Mengel, M., Carter, B.D., Marsden, S., CollierCameron, A., & Wichmann R. 2000, MNRAS, 316, 699
Dorren, J.D., & Guinan, E. F. 1994, ApJ, 428, 805
Fekel, F. C., Bopp, B. W., & Africano, J. L. 1986, AJ, 92, 1150
Frohlich, H.-E., Tschape, R., Rudiger, G., & Strassmeier, K.G.2002, A&A, 391, 659
Girardi, L., Bressan, A., Bertelli, G., & Chiosi, C. 2000, A&AS,141, 371
Gray, F.D., & Baliunas, S.L. 1997, ApJ, 475, 303
Gudel, M., Guinan, E.F., & Skinner, S.L. 1997, ApJ, 483, 947
Guinan, E.F., & Gimenez, A. 1992, in The Realm of InteractingBinary Stars, eds. J. Sahade, G.E. McCluskey, & YojiKondo. Astrophysics and Space Science Library, 177, 51
Guinan, E. F., Ribas, I., & Harper, G. M. 2001, AAS, 199, 8805
Hall, D.S. 1991, in The Sun and Cool Stars. Activity,Magnetism, Dynamos, eds. I. Tuominen, D. Moss, & G.Rudiger, IAU Coll. 130, 353
Henry, G. W., Fekel, F. C., & Hall, D. S. 1995, AJ, 110, 2926
Horne, J. H., & Baliunas, S. L. 1986, ApJ, 302, 757
Kitchatinov, L. L., & Rudiger, G. 1999, A&A, 344, 911
Kosovichev, A. G. 1996, ApJ, 469, L61
Messina, S., Guinan, E. F., Lanza, A. F., & Ambruster, C.1999, A&A, 347, 249
Messina, S., & Guinan, E. F. 2001, in The 12th CambridgeWorkshop on Cool Stars Stellar Systems and the Sun, A.Brown, G.M. Harper & T.R. Ayres (eds) Boulder (CO),06.07
Messina, S., & Guinan, E. F. 2002, A&A, 393, 225 (Paper I)
Moffatt, H. K. 1978, Magnetic Field Generation in ElectricallyConducting Fluids, Cambridge Univ. Press, Cambridge
Moss, D., Tuominen, I., & Brandenburg, A. 1990, A&A, 228,284
Noyes, R.W., Weiss, N.O., & Vaughan, A.H. 1984, ApJ, 287,769
Olah, K., Kollath, Z., & Strassmeier, K. G. 2000, A&A, 356,643
Olah, K., & Strassmeier, K. G. 2002, AN, 323, 361
Reiners, A., & Schmitt, J. H. M. M. 2002, A&A, 384, 155
Rodono, M. 2000, in Stellar Clusters and Associations:Convection, Rotation, and Dynamos, eds. R. Pallavicini,G. Micela, & S. Sciortino, ASP Conf. Ser., 198, 391
Rodono, M., Messina, S., Lanza, A.F., Cutispoto, G., &Teriaca, L. 2000, A&A, 358, 624
Rodono, M., Cutispoto, G., Lanza, A.F., & Messina, S. 2001,AN, 322, 333
Rodono, M., Messina, S., & Cutispoto, G., 2003, in progressRudiger, G., von Rekowski, B., Donahue, R. A., & Baliunas,
S. L. 1998, ApJ, 494, 691Scargle, J. D. 1982, ApJ, 263, 835Stix, M. 1976, A&A, 47, 243Stix, M. 1984, AN, 305, 215Strassmeier, K., & Hall, D.S. 1988, ApJS, 67, 453Strassmeier, K. G., Bartus, J., Cutispoto, G., & Rodono, M.
1997, A&AS, 125, 11Strassmeier, K. G., Serkowitsch, E., & Granzer, T. 1999,
A&AS, 140, 29Strassmeier, K.G., Bartus, J., Cutispoto, G., & Rodono, M.
1997, A&AS, 125, 11Tobias, S. M., Proctor, M. R. E., & Knobloch, E. 1997, A&A,
318, L55Vogt, S.S., & Penrod, G.P. 1983, PASP, 95, 565Wilson, O.C. 1978, ApJ, 226, 379
S. Messina and E. F. Guinan: “SDR of six solar analogues” 11
Table 2. BE Cet: Time range (HJD-2440000) to which theperiod refers, number of data points (Nm), photometric periodand its uncertainty (P±∆P), False-Alarm-Probability (FAP).
HJD range Nm P±∆P (d) FAP
6736–6761 15 7.744±0.295 0.1907129–7143 10 7.744±0.134 6.97e-27549–7557 9 7.405±0.654 0.1767869-7876 8 7.477±0.223 0.1008200–8245 17 8.030±0.198 0.2058897–8958 33 8.030±0.069 1.02e-39234–9353 72 7.804±0.009 5.77e-139612–9689 46 7.780±0.027 2.38e-7
11085–11197 62 7.872±0.020 8.08e-911447–11560 18 7.702±0.051 6.41e-2
Table 3. k1 Cet
HJD range Nm P±∆P (d) FAP
9239–9393 87 9.123±0.019 3.85e-129653–9773 41 9.135±0.036 4.20e-59986–10040 34 9.367±0.142 3.89e-310391–10482 32 9.211±0.024 2.98e-510718–10836 27 9.045±0.058 5.43e-211102–11240 33 9.406±0.039 5.08e-4
Table 4. π1 UMa
HJD range Nm P±∆P (d) FAP
7625-7650 15 5.104±0.176 0.498174-8211 14 4.828±0.041 4.50e-28230-8361 43 4.670±0.006 3.52e-78622-8742 33 4.759±0.008 8.84e-59018-9062 15 4.543±0.043 0.2239284-9398 81 4.661±0.009 2.54e-99411-9482 35 4.791±0.023 6.7e-69644-9808 94 4.697±0.011 1.47e-4
10029-10214 94 4.687±0.009 1.08e-510405-10517 68 4.795±0.012 4.15e-810736-10949 102 4.683±0.008 2.17e-510736-10949 102 5.385±0.009 2.52e-611118-11296 73 5.294±0.011 2.51e-511546-11582 17 5.305±0.063 4.19e-211612-11634 10 5.244±0.107 0.13
Table 5. EK Dra
HJD range Nm P±∆P (d) FAP note
5780–5873 9 2.8591±0.0097 0.226187–6250 21 2.8085±0.0880 1.73e-26486–6519 23 2.8864±0.0206 1.55e-26547–6621 24 2.7007±0.0088 1.49e-26881–6982 24 2.8340±0.0085 0.1097198–7231 8 2.7418±0.0265 0.3257623–7687 48 2.6576±0.0072 5.27e-5 17623–7687 48 2.7850±0.0171 0.198 27915–8007 30 2.5955±0.0034 2.46e-48045–8065 15 2.8196±0.0193 8.05e-28307–8435 86 2.7843±0.0019 9.68e-13 18307–8435 86 2.6365±0.0029 8.34e-8 28687–8805 50 2.6016±0.0036 7.99e-5 18687–8805 50 2.7959±0.0043 1.48e-4 29077–9101 18 2.6220±0.0069 5.14e-3 19077–9101 18 2.8831±0.0466 0.28 29115–9166 78 2.7936±0.0074 1.70e-9 19115–9166 78 2.5714±0.0050 9.80e-11 29379–9481 107 2.7773±0.0037 8.41e-11 19379–9481 107 2.6056±0.0045 5.15e-7 29499–9544 51 2.7796±0.0052 4.11e-89703–9785 27 2.6097±0.0040 5.54e-4 19703–9785 27 2.7796±0.0092 3.45e-2 29810–9904 36 2.6262±0.0037 4.93e-5 19810–9904 36 2.8292±0.0115 0.155 2
10075–10100 66 2.7635±0.0084 8.61e-11 110075–10100 66 2.4906±0.0090 2.56e-9 210143–10208 36 2.5814±0.0083 1.82e-3 110143–10208 36 2.8244±0.0089 9.67e-4 210212–10261 28 2.5955±0.0083 8.06e-410432–10583 118 2.5953±0.0015 1.00e-15 110432–10583 118 2.6576±0.0049 3.98e-3 210590–10620 20 2.5517±0.020 3.94e-2 110590–10620 20 2.7960±0.0345 0.177 210822–10914 30 2.6076±0.0024 6.45e-5 110822–10914 30 2.5648±0.0090 0.140 210979–10994 8 2.6310±0.0251 0.11911212–11266 22 2.7513±0.0120 3.08e-2 111212–11266 22 2.5504±0.0160 0.187 211623–11675 29 2.7080±0.0104 1.63e-3 111623–11675 29 2.5543±0.0145 4.77e-2 2
(1) primary period; (2) after filtering
Table 6. HN Peg
HJD range Nm P±∆P (d) FAP
9126–9163 22 4.62±0.05 2.54e-29239–9337 22 4.72±0.03 0.199491–9547 18 4.73±0.04 5.91e-29633–9706 36 4.59±0.02 3.15e-39986–10071 29 5.09±0.02 5.73e-410392–10443 20 5.17±0.05 7.97e-210714–10806 33 5.15±0.02 5.37e-411010–11179 64 4.69±0.01 1.47e-2
12 S. Messina and E. F. Guinan: “SDR of six solar analogues”
Table 7. DX Leo
HJD range Nm P±∆P (d) FAP
7570-7673 63 5.423±0.0059 3.55e-118346-8393 18 5.450±0.0240 4.33e-78540-8761 27 5.405±0.0100 6.644e-38906-9137 102 5.438±0.0059 8.53e-119311-9374 50 5.432±0.0410 1.70e-39382-9424 31 5.438±0.0200 1.10e-29433-9511 110 5.345±0.0157 1.24e-129644-9840 126 5.397±0.0051 1.00e-159996-10120 96 5.408±0.0044 1.00e-1510082-10216 94 5.420±0.0083 1.49e-1210392-10575 240 5.438±0.0034 1.00e-1510728-10976 143 5.391±0.0039 1.00e-1511094-11159 29 5.444±0.0200 8.54e-411284-11342 42 5.450±0.0190 5.66e-611546-11612 17 5.476±0.0100 1.00e-2
Table 8. LQ Hya
HJD range Nm P±∆P (d) FAP
5683-5725 9 1.5961±0.010 0.46023-6178 61 1.5989±0.0010 2.561e-067108-7160 30 1.6020±0.0026 2.988e-047548-7593 22 1.6133±0.0031 1.836e-037881-8030 133 1.5938±0.0013 2.737e-078190-8395 64 1.6010±0.0005 8.026e-098630-8760 97 1.6081±0.0003 1.00e-159324-9496 95 1.6050±0.0005 8.382e-149656-9868 116 1.6030±0.0008 1.625e-06
10004-10233 234 1.6071±0.0006 2.717e-1210387-10602 754 1.5999±0.0004 1.00e-1510731-10967 181 1.6030±0.0008 1.153e-0611101-11332 154 1.6079±0.0007 4.919e-0911501-11621 119 1.6091±0.0006 1.00e-1511831-12053 235 1.6154±0.0004 1.00e-1512195-12271 48 1.6133±0.0022 2.220e-02
a: Strassmeier & Hall (1988)
Table 9. Mean semi-amplitude of the sinusoidal fit to the ob-served flux modulation (Aave), semi-amplitude (Ap) and rela-tive contribution (σrot/σtot) of rotation to the observed totalvariance.
Star Aave Ap =√
σ2rot − σ2
base σrot/σtot
BE Cet 0.0147 0.0089 60%k1 Cet 0.0134 0.0055 49%π1 UMa 0.0119 0.0050 42%EK Dra 0.0327 0.0130 40%HN Peg 0.0110 0.0060 20%DX Leo 0.0284 0.0141 50%LQ Hya 0.0540 0.0050 13%
S. Messina and E. F. Guinan: “SDR of six solar analogues” 13
6.45
6.40
6.35
6.30
V m
agni
tude
BE Cet Prot
= 7.405-8.030 (d) P cyc 1
= 6.7 (yr)
1985 1990 1995 2000
year
6000 7000 8000 9000 10000 11000 12000HJD -2440000
6.0
6.5
7.0
7.5
8.0
perio
d (d
)
Cycle I Cycle II Cycle III
Fig. 6. (top panel) Long-term V-band brightness variations of BE Cet. The modulation is fitted by a sinusoid with period ofPcyc=6.7 yr. (bottom panel) Seasonal rotation periods vs. time with a linear fit to data. The rotation period monotonicallydecreases along the starspot cycle showing a solar-like behaviour.
5.80
5.75
5.70
5.65
5.60
5.55
V m
agni
tude
Prot
= 4.543-5.385 (d) P cyc 1
= 13.1 (yr)
P cyc 1
= 2.12 (yr)
1988 1990 1992 1994 1996 1998 2000year
7000 8000 9000 10000 11000 12000HJD -2440000
4.0
4.5
5.0
5.5
perio
d (d
)
Cycle ICycle II
Fig. 7. (top panel) Long-term V-band brightness variations of π1 UMa. The modulation is fitted by a sinusoid with two periods:of Pcyc1=13.1 yr and Pcyc2=2.12 yr. (bottom panel) Seasonal rotation periods vs. time with a linear fit to data. The rotationperiod monotonically decreases along the starspot cycle showing a solar-like behaviour.
14 S. Messina and E. F. Guinan: “SDR of six solar analogues”
7.80
7.70
7.60
7.50
7.40
V m
agni
tude
EK Dra Prot
= 2.491-2.886 (d) P cyc 1
= 9.2 (yr)
P cyc 2
> 30 (yr)
1985 1990 1995 2000
year
6000 7000 8000 9000 10000 11000 12000HJD -2440000
2.30
2.40
2.50
2.60
2.70
2.80
2.90
perio
d (d
)
Cycle I Cycle II
Fig. 8. (top panel) Long-term V-band brightness variations of EK Dra. The modulation is fitted by a sinusoid with a period ofPcyc=9.2 yr plus a longer term trend ( Pcyc ≥ 30 yr if cyclic). (bottom panel) Seasonal rotation periods vs. time with linear fitsto data. Two rotation periods were detected in several seasons, both showing monotonical decreases along each starspot cyclewith solar-like behaviour.
4.95
4.90
4.85
4.80
4.75
V m
agni
tude
k1 Cet Prot
= 9.045-9.406 (d) Pcyc
= 5.9 (yr)
1988 1990 1992 1994 1996 1998 2000
year
7000 8000 9000 10000 11000 12000HJD -2440000
8.0
8.5
9.0
9.5
10.0
10.5
perio
d (d
)
Cycle I Cycle II
Fig. 9. (top panel) Long-term V-band brightness variations of k1 Cet. The modulation is fitted by a sinusoid with a periodof Pcyc=5.9 yr.(bottom panel) Seasonal rotation periods vs. time with a linear fit to data. The rotation period monotonicallyincreases along the starspot cycle showing an anti solar-like behaviour.
S. Messina and E. F. Guinan: “SDR of six solar analogues” 15
6.04
6.02
6.00
5.98
5.96
5.94
5.92
V m
agni
tude
HN Peg Prot
= 4.59 - 5.17 (d) Pcyc
= 5.5 (yr)
1970 1975 1980 1985 1990 1995 2000year
0 2000 4000 6000 8000 10000 12000HJD -2440000
4.0
4.5
5.0
5.5
6.0
perio
d (d
)
Cycle I Cycle II Cycle III Cycle IV Cycle V Cycle VI
Fig. 10. (top panel) Long-term V-band brightness variations of HN Peg. The modulation is fitted by a sinusoid with a periodof Pcyc=5.5 yr. (bottom panel) Seasonal rotation periods vs. time with a linear fits to data. The rotation period monotonicallydecreases along the starspot cycle showing a solar-like behaviour.
7.20
7.15
7.10
7.05
7.00
6.95
V m
agni
tude
DX Leo Prot
= 5.345-5.476 (d) Pcyc
= 3.21 (yr)
1988 1990 1992 1994 1996 1998 2000year
7000 8000 9000 10000 11000 12000HJD -2440000
5.20
5.30
5.40
5.50
perio
d (d
)
Cycle I Cycle II Cycle III Cycle IV
Fig. 11. (top panel) Long-term V-band brightness variations of DX Leo. The modulation is fitted by a sinusoid with a periodof Pcyc=3.21 yr. (bottom panel) Seasonal rotation periods vs. time with a linear fits to data. The rotation period monotonicallyincreases along each starspot cycle showing an anti solar-like behaviour.
16 S. Messina and E. F. Guinan: “SDR of six solar analogues”
8.10
8.00
7.90
7.80
7.70
7.60
7.50
V m
agni
tude
LQ Hya Prot
= 1.5938-1.6154 (d) P1cyc
= 3.2 (yr)P
2cyc = 6.2 (yr)
P3cyc
= 11.4 (yr)
1980 1985 1990 1995 2000 2005year
4000 6000 8000 10000 12000 14000HJD -2440000
1.56
1.58
1.60
1.62
1.64
1.66
1.68
perio
d (d
)
Cycle2 ICycle2 II
Cycle2 III
Fig. 12. (top panel) Long-term V-band brightness variations of LQ Hya. The modulation is fitted by a sinusoid with threeperiods Pcyc1=3.2 yr, Pcyc2=6.2 yr , Pcyc3=11.4 yr. (bottom panel) Seasonal rotation periods vs. time. The rotation periodvaries with the 6.2-yr cycle. An antisolar behaviour is apparent.