madras3-320968.pdf - IDS OpenDocs
177
This work is licensed under a Creative Commons Attribution-NonCommercial- NoDerivs 3.0 Licence. To view a copy of the licence please see: http://creativecommons.0rg/iicenses/by-nc-nd/3.0/
-
Upload
khangminh22 -
Category
Documents
-
view
1 -
download
0
Transcript of madras3-320968.pdf - IDS OpenDocs
This work is licensed under a Creative Commons Attribution-NonCommercial-NoDerivs 3.0 Licence.
To view a copy of the licence please see: http://creativecommons.0rg/iicenses/by-nc-nd/3.0/

NUTRITION IN TAMIL NADU
RAJAMMAL P. DEVADAS, M.A. j M.SC.j PH.D. (OHIO)
Principal, Sri Avinashilingam Home Science College,
Coimbalore-11
<4M*t ^ tu.t Compliment*
mf d*
PUBLISHED BY
SANGAM PUBLISHERS, MADRAS-600001 FOR
MADRAS INSTITUTE OF DEVELOPMENT STUDIES
WITH THEIR ASSISTANCE

Sangam Publishers, 11, Sunkurama Chelty Street, Madras-600001
(c) Madras Institute of Development Studies
First Published, November 1972
Printed in India
by Tax and Company Law Press,
84, M. K. jV. Road, Guindy, Madras-32

CONTENTS
Chapters Page
PREFACE BY D R . MALCOLM S. ADISESHIAH . . . v
I INTRODUCTION'—GOALS OF NUTRITION POLICY AND
PLANNING FOR TAMIL NADU . . . . . . . . . 1
I I PRESENT STATUS OF NUTRITION IN TAMIL N A D U . . . 10
I I I CURRENT EFFORTS TO COMBAT MALNUTRITION IN TAMIL NADU . . . . . . . . . . . . 2 8
I V CONCEPT OF NUTRITION PROGRAMMES . . . . . . 3 4
V T H E STRATEGIES FOR A T W E L V E - Y E A R N U T R I -
TIONAL PLAN FOR TAMIL NADU . . . . . . 3 9
V I ADMINISTRATION OF NUTRITION PROGRAMMES . . . 5 7
V I I BUDGET FOR THE T W E L V E - Y E A R TAMIL N A D U
NUTRITION PLAN . . . . . . . . . 6 2
V I I I NUTRITION RESEARCH . . . . . . . . . 6 7
I X A N INTEGRATED APPROACH TO NUTRITION PLAN-
NING FOR DEVELOPMENT . . . . . . . . . 7 6
X INTER-DEPARTMENTAL COLLABORATION IN N U T R I -
TION PROGRAMMES OF THE F U T U R E . . . . . . 7 8
X T EVALUATION OF NUTRITIONAL PROGRAMMES . . . 81
X I I FOOD—ADULTERATION AND CONTAMINATION . . . 8 6
Annexures * *
I INTEGRATED NUTRITION FROM NURSERY SCHOOL
THROUGH SECONDARY SCHOOL . . . . . . . . . 9 8
I I CURRICULUM IN PRINCIPLES OF FOOD AND
NUTRITION (BASIC COURSE FOR A L L COLLEGE
STUDENTS MAJORING IN HUMANITIES) . . . . . . 1 1 2
I I I CURRICULUM IN THE SCIENCE OF NUTRITION FOR
COLLEGE STUDENTS IN SCIENCES . . . . . . 1 1 4

iv
Annexures Page
I V CURRICULUM IN NUTRITIONAL EDUCATION FOR
COLLEGES OF TEACHER EDUCATION . . . . . . 1 1 7
V IN-SERVICE TEACHER'S TRAINING COURSE FOR
NUTRITION EDUCATION IN SCHOOLS . . . . . . 121
V I PRACTICAL NUTRITION . . . . . . . . . 1 2 3
V I I CURRICULUM IN SCIENCE OF NUTRITION FOR MEDICAL STUDENTS . . . . . . . . . 1 2 8
V I I I CURRICULUM IN THE SCIENCE OF NUTRITION FOR
STUDENTS OF AGRICULTURE AND ANIMAL
HUSBANDRY . . . . . . . . . . . . 131
I X CURRICULUM IN THE SCIENCE OF NUTRITION FOR STUDENTS OF FOOD ENGINEERING . . . . . . 1 3 4
X MIDDAY MEAL MENU PATTERN FOR PRE-SC,HOOL CHILDREN 3 TO 6 YEARS OF AGE . . . . . . 137
X I RESULTS OF STUDIES ON THE MIDDAY MEALS SCHEME IN SRI AVINASHILINGAM BASIC SCHOOL . . . 1 3 9
X I I DAILY FOOD FOR EXPECTANT AND NURSING
MOTHERS . . . . . . . . . . . . 146
X I I I DAILY FOOD FOR ADOLESCENT GIRLS AND BOYS . . . 1 5 0
X I V BUDGET ESTIMATE FOR THE DEPARTMENT OF
NUTRITION . . . . . . . . . . . . 1 5 4
REFERENCES . . . . . . . . . . . . 156
LIST OF TABLES . . . . . . . . . . . . 1 6 0
INDEX . . . . . . ••• -•• 1 6 2

PREFACE
N U T R I T I O N is part of health. The problems of nutr i t ion are universal. They are found among well-fed as well as ill-fed persons, among affluent families and communities as well as among poor ones. A recent report in the United Kingdom states that the people there who go to bed every night af ter over-eating spend £100 million annually on slimming. In our country too, nutr i-tion problems are found among the rich and well-to-do largely as a result of over-eating and eating the wrong foods. If th is was the problem of nutr i t ion, then the curious definition of nutr i t ion, given in the first edition of the Encyclopaedia Britannica, in 1771, would seem to be adequate. Nutr i t ion in the animal economy, it explains, is the repairing of the continuing loss, which the diffe-rent parts of the body undergo. The motion of the par ts of the body, the friction of these par ts with each other and especially the action of the air would destroy the body entirely, if the loss was not repaired by a proper diet, containing nut r i t ive juices ; which, being digested in the stomach and af terwards converted into chyle, mix with the blood and are distributed through the whole body.
The problem of nutr i t ion as analysed in this monograph has a double dimension. First, it is the end result of all the elements which determine and inter-act on the life of the child, the mother, the adult and the aged—physical, ecological and cultural. The p l i 3 ' s i c a l factors include the quant i ty and quali ty of food produc-tion in the community, i ts distr ibution and delivery, the inst i tut ional frame-work and the physical and mental work involved for the individual. The ecological factors include the flora and fauna, the air and water surrounding, the individual. The cultural elements refer to the educational background, dietary habits, values and tradit ions of the individual and the family and the general health and hygienic s tandards of the people, For the individual, nutr i t ion is a func t ion of all these varied forces.
The other dimension is the level of living of the person, the community and the country. If nutr i t ion is par t of health,

vi
malnutr i t ion is a part of disease which is the tragic accompani-ment of poverty. I t is in the context of poverty—of a people living at or below the poverty line, which for this Country and State can be defined as the consumption of 2,200 calories—that the problem of nut r i t ion takes on tragic overtones. Of the 540 million people living in this Country, one quarter , that is 130 million men, women and babies, go to bed hungry every night. If the present situation is not corrected, we would have 12 million hungry people in this State by 1980. Hunger results from insufficient food intake. Our National Sample Surveys for 1953, 1960 and 1964 show that this sub-normal food intake has had identical consequences on the poor families in all the three years : large families wi th low survival rate ; a conservative, lethargic and quarrelsome temperament induced by starvation ; a high rate of in fan t and maternal morbidity and mortality ranging from 60-70 per c e n t ; mental retardation and brain damage to the pre-school child ; the 25 millions who are ill at any point of time and suffer from derived ailments that can be causalty traced back to bad feeding ; 3 per cent of total working time or Rs. 800 crores lost in sickness and Rs. 400 crores being spent by the families on medicines. According to the cynical values that are then generated, a sick child who was mis-conceived, is ill-fed and unwanted is a greater monument to the folly—personal, familial and national—of malnutr i t ion than the one which dies of hunger early in his doomed career.
This culture of poverty is not, of course, unique to India and Tamil Nadu. The following table devised by the Club of Rome Scientists in The Limits to Growth—A Potomac Associates book by Donella H. Meadows, Dennis L. Meadows, Jorgen Randers and William W. Bahrens II I , Universe Books, New York 1972—and reproduced with their kind permission illustrates the current inequalities in the world protein and calorie intake.
The table shows that daily protein and calorie requirements are not being supplied to most areas of the world and that inequalities of distribution exist not only among regions, but also within regions. Lines indicating calories and proteins required are those estimated for North Americans. The assumption in that table is tha t if diets in other regions were sufficient to allow

vii
people to reach ful l potent ia l body weight, requ i rements would be the same everywhere.
NORTH AMERICA
WESTERN EUROPE
P R O T E I N R E Q U I R E D C A L O R I E S R E Q U I R E D
WEST A F R I C A
NORTH A F R I C A
I N D I A
PAKISTAN
CENTRAL AFRICA
100 80 60 40 20 0 1000 2000 3000 GRAMS OF PROTEIN PER CAPITA PER DAY CAl.OR/ES PEP CAPITA PERDAy
O T H E R PROTEIN SUPPLY
A N I M A L K S H C A L O R I E P R O T E I N SUPPLY FISFIS! S U P P L Y
Source: UN Food and Agricul ture Organisat ion, Provisional Indica t ive World Plan for Agricul tura l Development ( R o m e : UN Food and Agricul ture Organisat ion, 1970).
The Uni ted Nat ions Pro te in Advisory group tells us tha t t w e n t y per cent of all children under five in Asia, Afr ica and La t in America suffer f rom protein ma lnu t r i t ion a n d twelve million of them die annua l ly . By cont ras t it reports t h a t im-proved diet in J a p a n has led to a two-inch increase in the average he ight of its chi ldren. The damage in the developing countr ies is more extensive because protein deficiency in p regnan t and

viii
lactating mothers, about seventy per cent of whom live in the rural areas, must add to this tragic toll. This is the vulnerable group in our vulnerable society—-the pre-school child and the young mother. Protein deficiency between the ages of one and five in a child is irremediable. That is the time when its brain is formed and protein deficiency during that period can so irrepara-bly damage its brain that no amount of good schooling or good food later can repair the damage. Of course, the underfed everj'-where are vulnerable ; they are and ought to be the prior concern of any planning for a plan is only as strong as its people. But the light of well-being cannot be brought to the lives of 130 million men and women all at once. For the adult, aged and infirm, the State must be content to supplement piece-meal what they can do for themselves; their health and character todaj ' are a function of the conduct and habits of their childhood. The past for them is a prison-house. But the child and mother of today bound by ties of fraility are the pliant resources of the fu tu re ; they represent an investment and are a feasible and an impera-tive priority whose character can become destiny.
The current nutrit ional situation of Tamil Nadu portrayed in the monograph is disturbing. According to the Diet Atlas of India reproduced in Table 2 of this publication, Tamil Nadu has the lowest mean per capita daily consumption of calories and proteins among the thirteen States listed—36 grammes for pro-tein and 1,498 for calories as against the All-India mean of 53 and 1,985 and the allowance of 44 and 2,400 recommended by the ICMR. The 1961 Food Habit Survey in Tamil Nadu of the Census Department which shows a mean per capita consumption unit of 2,500 calories has a per capita requirement of 2,800. The National Sample Survey for 1969-70 records the consumption expenditure in Tamil Nadu according to which 55 per cent of the households spend less than 79 Paise per head per day which is the money equivalent of the minimal 2,200 calories and which marks off poverty from bare sufficiency. The calorie intake that obtains in the case of children below three years is 700 against the recom-mended 1,200 per clay. For pregnant and lactating mothers, it is a third short of the recommended 2,500 to 2,900 calories. For the general adult population, it is 600 short of the recommended 2,200 calories. As a result of malnutrition, the average weight at

ix
birth of a child is 2'73 kg. I n f an t mortali ty has been computed at 62'5 per thousand live births, one-third of these deaths being mainly due to nutr i t ional disorders.
Against this background, the major nutr i t ion programmes operating in the State are a valiant but ineffective a t tempt to stem the swelling tide. The Kuzhanthaikal Kappagams through its six variants feed about 90,000 pre-school children and 35,000 pregnant and nursing mothers. The midday meal school pro-gramme feeds 18 2 lakh school children for 200 days in a year. The 77 industr ial canteens feed 30,000 children. The special nutr i t ion programme feeds 1T5 lakh 6—30 months old children in tribal areas or urban slums. The health centres provide food for 35,000 children. The nutr i t ion programmes in force thus cover over 21 lakh children, including a little less than three lakh pre-school children, out of a total of some 40 lakhs living below the poverty line. The 35,000 mothers who are currently projected represent less than a twel f th of those needing at tent ion. Apart from this quant i ta t ive problem there exist problems of administrat ion and of quali ty. Finally, the pro-grammes are either sceptical of education for health and nutr i t ion or there are not enough funds for them. What people can be taught to do for themselves is always greater than direct physical intervention which ameliorates but does not ennoble.
The nutr i t ion programme proposed in the monograph assumes an effective food production and distr ibution network. The 59 per cent of total requirements of calories from rice, cholam, cumbu, wheat, ragi, and other cereals can be met for all the people in the State with the help of the new agricultural technologies. I t is now necessary to extend this technology to bridge the protein gap in the State through intensified produc-tion of pulses, oilseeds, vegetables, f ru i t s and through expanded animal and fish farming. This is rather important because of the popular t rend to supplement deficit diets with protein or amino-acids. Lysin fortified bread or other amino-acid enriched foods const i tute a good nutr i t ion programme in the over-fed, affluent countries. For India and Tamil Nadu, where protein deficiency is a par t of total energy deficiency, the effort should be to make available a sufficient cereal/pulse-based diet together with milk and eggs at the weaning age. Such a diet will meet

X
both the caloric and protein needs of the child, the mother and the adult . This points to the technological need to maximise the caloric and protein yield of our agricultural and other inputs . Again in a situation, where the food, that in the first place is not enough to go round, is also beyond the means of the majori ty, the production and technology programme must be accompanied by a mass distribution mechanism so that the foods reach the mother and the child in the poor sector. What is left undone by the price mechanism must be remedied by nutr i t ion intervention.
The time-bound three-point programme proposed for the State covers nutr i t ion and health education, feeding the target groups of pre-school children and pregnant and lactating mothers and the evaluation of the programme. Nutri t ion, as stated earlier, is part of health and is the result of constant and cont inuous education aimed at changing our food habits and family and individual living traditions. The monograph details the conse-quential educational programmes necessary for the school, college, teacher training inst i tut ions, adult and community education inst i tut ions and medical and other professional groups and a programme of nutr i t ion research which will directly support the education and action programmes.
The feeding programme is directed at the vulnerable group of pre-school children and mothers. Through expanded Kuzlianthaikal Kappagams and pre-primary sections, creches, immunization and nutr i t ion rehabilitation programmes, 47-7 lakh of pre-school children will be fed at a cost of Rs. 123 crores over the period 1972-83. This investment is a major responsi-bility for both the State and the Centre and is part of the anti-poverty priority to which the planning process is committed. The resources for the programme can be mobilised from the drives to be launched during the F i f t h Plan, particularly from increasing surpluses to be found in the rural areas. A restruc-tured school feeding programme is proposed for the Education Department. The programme for feeding pregnant and lactating mothers in the primary health and materni ty and child welfare centres at a cost of Rs. 30 crores (not elaborated in this publica-tion) should be added to this target feeding programme. The barest outline of a long term programme of nutr i t ion for vulnera-

xi
ble adolescents and adul ts has also been suggested to which the State will have to tu rn its a t tent ion af ter the Sixth Plan.
Finally, an inbuilt evaluation ins t rument in the whole pro-gramme will continuously test the delivery and the effects against the goals and feed-back the results in order to improve the per-formance of each specific programme and the effectiveness of the total effort. The evaluation design is also capable of taking stock of increments of s tandards and well-being that accrue to the masses of people through planned economic effort. In order to introduce a degree of uniformity in the evaluation of the different nutr i t ion programmes based on varying criteria, a pro forma evaluation outline has been proposed. The s tudy makes a strong plea for an integrated, autonomous adminis t ra t ive agency to be headed by a Director with five divisions under him—one each for Research and Planning, Educat ion and Extension, Evaluat ion, Food Administration and Food Development and Processing. Such a sub-system should be par t of an integrated administrat ion of Health, Family Planning and Nutr i t ion working in close liaison with the Depar tments of Agriculture, Educat ion, Labour and Local Administrat ion and Community Development in the State. At the district, Block, Pr imary health and mini-health centre levels, there will be both integration and unification of health, family planning and nut r i t ion services.
There is a concluding section on food toxicants—exogenous as well as endogenous. Nutr i t ion as analysed in the monograph presupposes foods that do not contain poisons themselves and are free from natural contaminants and injur ious man-made additives. In a sense this section should be the s tar t ing point of the publication. In thestate, food is susceptible to contamination atall three stages of production, distr ibution and consumption. The dangers are particularly great in public eating places through which the major par t of the nutr i t ion programme is to be imple-mented. I t is, therefore, proposed tha t health education of citizenry and school children be designed to deal with these hazards. The task of the educator could be made easier by severe deterrent punishment, sanctions for which already exist in the Public Health Acts, Tamil Nadu, against the deliberate habi-tual offender rather than, the ignorant one. Food analysts ' laboratories forming part of the preventive health machinery in

xiii
the district and consumer associations need to be expeditiously established.
This publication is the result of studies and analysis of the nutrit ion situation in Tamil Nadu undertaken by Mrs. Rajammal Devadas aided by a group of specialists to help the State Planning Commission develop its Perspective Plan for the State in Health, Family Planning, Nutrition and Sanitation. This, the study has achieved. In her studies, Mrs. Devadas has received valuable help from several specialists in Health and Nutrit ion in various Departments of Governments, medical institutions, and voluntary agencies in the State and the Country, Unesco and the Tamil Nadu Nutrition Project staff . The statistical parts of the study have been aided by statistical specialists from the Government and the Madras Ins t i tu te of Development Studies. She traces her inspiration to many international, national and State persona-lities, including the founder of her institution. One of them in particular—the Tamil Nadu Chief Minister, she has found neces-sary to quote:
" ^jsnrsm/Diu ^ / (u j i iL/as i r njir&rnu m s v i r a s r r " , ]§)6!5TOT>iduj Loyi&ussjrr, js^Smiu jBUJgl LOIJLI ffifragjLO in(r6oijrL|p G)a=6WsyfBJ(56Tr «jiu,£I(o60(biij &<£gji fi_bW«»6ij<& (gyij j jsm^a'srj is^ snifirBi(3)sug] ^lansudssrflsir QfiSsir su6rrt^66rn5liUbS)wuJT^gi " —
The views, judgments and conclusions set forth in the study are, however, entirely the responsibility of Mrs. Rajammal P. Devadas—the accepted nutri t ion specialist of Tamil Nadu and India. I commend the study to the attention of the appropriate departments of the State Government and subject specialists in the Country.
Madras, V l _ a j L c i £ v * l S . fl 4
29th June, 1972.

CHAPTER I
INTRODUCTION — GOALS OF NUTRITION POLICY AND PLANNING FOR TAMIL NADU
HUMAN nutr i t ion is not simply availability and intake of food. Good nutr i t ion and malnutr i t ion are the end results of many interact ing factors operating simultaneously and con-current ly on the individual in the physical, ecological and cultural environment of the community. The amount of various foods and nu t r ien t s reaching the different segments of the population depend on food production, availability, logistics of distr ibution, cultural and economic systems, educational levels and food habits of the people. All these factors contr ibute towards the total health status. Nutr i t ion is thus closely related to several aspects of human life. Not based on such an unders tanding, our present approaches towards the problems of health and nutr i t ion are rather f ragmentary , sporadic, in te rmi t ten t and isolated, lead-ing to duplication and avoidable waste in effort and expenditure. Integrat ion of educational, medical, nutr i t ional and public health, including family p lanning services is, therefore, imperative.
Economic growth is essential for the eradication of hunger and malnutr i t ion. Increased per capita income tha t accompanies economic growth will not in itself, however, solve the problem of malnutr i t ion. Weal th does not necessarily eliminate malnutr i -tion though pover ty prevents people from buying the food they need. Malnutr i t ion in the early years reduces the productive capacity of adul ts (1). Physically, they lack the energy and stamina which are essential for satisfactory work. Fur thermore, malnutr i t ion might lead to s tunted growth and mental retarda-tion of the young. Chronic and severe malnutr i t ion in childhood increases the chances of children becoming poor readers and poor writers (2). These, in tu rn , may lead to defects in neuro-integra-tive funct ioning, to school failure and subsequent subnormal adaptive abilities. This chain of events consti tutes a vicious

2 NUTRITION IN TAMIL NADU
cycle, which has a ' sp i ra l ' effect on society, causing a low level of adaptive funct ioning, non-application of modern knowledge to every day living, undesirable social customs, infections and insufficiency of food. All these factors contribute to malnutr i -tion, which leaves a large pool of survivors who func t ion in sub-optimal ways and become a drag on an already limping economy.
Malnutrit ion lowers a community 's resistance to disease resulting in higher morbidity which has extensive social conse-quences. Accident rates are higher among the malnourished groups, who tire easily and quickly. Apathy, lethargy and lack of initiative are the common characteristics of poorly fed groups. In the past, this apparent sluggishness was frequent ly a t t r ibuted to laziness, indolence, an a t t i tude of fatalism or other so-called ' e thnic t r a i t s ' . The FAO has reported that those countries with the lowest per capita daily protein and calorie consumption are also those with the lowest product ivi ty (3).
Deficiency diseases are extremely insidious in that they sap the vitality of people to a considerable degree. Many people who presume tha t they are well may be victims of several deficiency conditions. Certain nutr i t ional deficiencies, such as acute inadequacy of Vitamin A, which may ultimately result in blindness, limit product ivi ty . In India, there are today at least one million cases of blindness at t r ibutable to this cause alone (4) (6). The blind become a drain on society with little or no opportunit ies to contr ibute to it. Such blindness could easily be prevented by spending a few paise on each individual. This minimum investment could avert large economic losses likely to accrue to the society due to the incidence of blindness which might seriously cripple the whole developmental effort. The medical costs necessary to treat the final effects of malnutr i t ion, either through hospitals or health centres, are many times greater than the cost of providing the necessary nut r ien ts to prevent malnutr i t ion initially (6).
A solution to the problem of malnutr i t ion is so urgent tha t it cannot wait upon a satisfactory level of economic growth ('). Neglecting it will mean holding back economic growth for an indefinite period. In fact, certain aspects of economic growth

INTRODUCTION
could be achieved faster and more effect:' rely, if nutr i t ional programmes aimed directly at bet ter ing the social conditions of people were undertaken. People have to be educated in the types and quant i t ies of food tha t they and their children need, and on how to produce or procure nutr i t ious foods at minimal costs.
Our efforts towards improving social conditions are being thwarted constantly by over-population. Since population ex-plosion has been accentuated by an increase in life expectancy and fall in death rate, it may seem unbelievable that improved nutr i t ion , which actually helps to save more lives, could aid in limiting the population (8). The fact is tha t a large number of people want to have more children than either they or society can afford in order to be sure that at least one or two will survive. Their fear is well founded because the in fan t and child mortal i ty are still high in Tamil Nadu and in India. If measures were taken to increase the chances of the survival of the first two children as a result of better nutr i t ion, parents might feel much less impelled to have fu r the r children, and would accordingly be far more psychologically receptive to the ideas and methods of family planning. The continuing th rus t of the population explosion is far less due, than is often supposed, to ignorance or lack of contraceptive methods.
Malnutri t ion, especially Protein Calorie Malnutri t ion (PCM) and infections, have a synergistic influence on health specially of children. Hence it is essential to examine the various causal and co-existing factors responsible for malnutr i t ion in communities, before a meaningful preventat ive programme can be chalked out.
In Tamil Nadu, the major causes of malnutr i t ion are :
Low income and consequent low purchasing power ;
Ignorance of nutr i t ional needs and lack of knowledge about commonly available nutr i t ive foods. Certain harmful tradit ional habits, customs and beliefs regarding meals ;
Infect ions and infestat ions ; and
Other factors connected with poor food and living habits and household tensions.

4 NUTRITION IN TAMIL NADU
Low Income
Judged by any parameter, the purchasing power of the majori ty of the people is low. The cost of foodstuffs, particularly of animal origin, such as milk, eggs, meat and fish is beyond the reach of many families. Furthermore, most families in the lower economic strata need to feed many members. The number of children per family is large — usually five. Besides these children, aged dependents — one or both of the children's grand parents, relatives such as widowed sister(s) and aunt(s), may live with the family. Hence a family may consist of 8 to 9 persons with only one member earning. Consequently families may not have even two square meals for all the members, far less, special foods for children. *
However, in the so called lowest economic strata in cities inhabit ing slums, of ten more than one member of the family earns Rs. 1-—2 daily as labourer, casual labour, and a sweeper or a domestique. They can meet the basic necessities of food and clothing f rom their earnings. But it has been found tha t women of the lower economic s t ra ta in Madras city spend a sizeable par t of their daily wages on non-food items such as cinema, tea and flowers. As for food, rice and a little kozhambu with or without small bits of fish for flavour are all tha t is consumed. No special food is provided for weaned in fan t s except perhaps an occasional Appam or Iddly. Instead of milk, an apology for coffee is given which only depresses the appetite (9).
Ignorance
The ignorance of parents results in the following pre-disposing causes of malnutr i t ion among in fan t s :
Failure to breast feed adequately ;
Over dilution of fresh or canned milk and baby foods to make supplies go longer;
Using unhygienic and wrong techniques in bottle-feeding ; and
Failure to give any supplementary food ; misuse of supplementary foods; unsuitable supplementary foods; s tar t ing the right ones too l a t e ; giving suitable foods

INTRODUCTION 5
wrongly prepared and supplemer tary foods in inade-quate quantit ies.
Even in the bet ter off families, malnutr i t ion among in fan t s and children is common because of ignorance and certain tradi-t ions and beliefs about feeding. Some dietary habits which are rooted in local custom but still lead to malnutr i t ion in children inc lude :
Feeding children on arrowroot conjee, which contains practically no protein, over prolonged periods during and following an attack of diarrhoea.
Rout ine use of laxatives such as castor oil and milk of magnesia;
The use of coffee, as diet instead of milk ;
Use of gripe water and tonics which can easily pay for less expensive but more nutr i t ious foods;
Starving prolonged fevers like typhoid and other illnesses ;
Cautionary exclusion of curds and f ru i t juices for fear of bringing on colds and coughs; and
The belief that nutr i t ious foods such as dhall, egg, meat, fish, groundnuts , Bengal gram and green leafy vegetables will cause indigestion.
Infections and Infestations
Infect ions and malnutr i t ion const i tute a vicious cycle, especially among children (10). Parasitic infestat ions cause and contribute to under-nutr i t ion. A great deal of morbidity and mortal i ty in the population of Tamil Nadu is due to infections taking a serious tu rn because of malnutr i t ion. The common infections and infestat ions which affect the children of Tamil Nadu a re :
Intest inal infect ions; Parasit ic in fes ta t ions ; Respiratory infections, tuberculosis in par t icular ; and Other infections like whooping cough and measles.
The major factors responsible for the severity of infections when they do occur are :

6 NUTRITION IN TAMIL NADU
Poor nu t r i t i on ; Poor environmental sani ta t ion; Ill-ventilated and over-crowded houses ; and Unhygienic habits.
Other Factors
Malnutri t ion among pre-school and school children is often due to the following remediable factors :
The eating of sweets and oily snacks, made and sold unhygienical ly;
Inadequate lunch at school, rushing through meals, especially in the morning and at noon ;
Anxiety and tension dur ing meals; Over-anxiety of elders about the child's eating hab i t s ; Disturbed parent-child relat ionships; Inadequate sleep and res t ; and Inabil i ty of working mothers to look af ter their children.
Thus even under present conditions, at least 50 per cent of border-line cases of malnutr i t ion occurring among children in Tamil Nadu — and for that matter among adul ts — can be prevented through dissemination of effective nutr i t ion informa-tion and extensive distribution of low cost nutr i t ious foods.
Combating Malnutrition
Combating malnutr i t ion calls for a simultaneous, multi-pronged approach which involves:
Production of nutri t ionally valuable foods in adequate quanti t ies ;
Making those foods available to all sections of the popula-tion by subsidising, where necessary, foods specially for vulnerable groups;
Dissemination of knowledge regarding nutr i t ion through all media of publicity ;
Improvement of environmental sanitation ; Making available protected water supply ; and Immunization.

INTRODUCTION 7
Goals of Nutrition Policy in Tamil Nadu
The long term goal of the State Government is achievement of opt imum nutr i t ion for every single individual living in Tamil Nadu. The production and distribution of adequate nutr i t ious foods, the augmentat ion of purchasing power in the hands of the the poor and the education of all the people affected by this programme and on the scale necessary for the achievement of the objective are formidable tasks indeed. The State should, there-fore, define and delimit i ts t ime-bound p lans clearly and unequivocally and set the tasks for each five-year period. P lanning has to be with these clear tasks in view in order to benefit immediately the vulnerable sections of the population, namely, infants , toddlers, pre-school children, expectant and nursing mothers and adolescent boys and girls. The Plan must sow the seeds for general improvement in food habits. The overall objectives for nutr i t ion planning in Tamil Nadu should, therefore, aim to :
Improve the expectation of life at b i r th and reduce infant , child and maternal mortali ty, by providing integrated educational, health, medical and nutr i t ional services;
Raise the present nutr i t ient intake of all segments of population to the levels recommended by the Indian Council of Medical Research (ICMR) with particular reference to the vulnerable sections—infants, weaning and pre-school children, expectant and nursing mothers and adolescent boys and girls, below the 'Poverty line' f ( u ) ;
Gear food production and distr ibution to the above objectives in such a way that all segments of the popula-tion become productive individuals, realising their full potentials for growth ; and
Impart nutr i t ion education to all sections of the population.
•f Poverty l i n e ( n ) is the expression adopted by V. M. Dandekar in his book 'Poverty in India'. I t is defined in terms of per capita consump-tion expenditure below which point it is impossible for a fami ly to obtain sufficient food for maintenance. For Tamil Nadu, this expenditure is 79 Paise per capita which will supply 2,200 calories daily. Per capita includes adults and children.

8 NUTRITION IN TAMIL NADU
The objectives outlined above can be realised by coordinated action programmes under a well kni t Department of Nutr i t ion, having specific goals, both immediate and long term.
Immediate Immediate actions are required t o :
In tegrate nutr i t ional feeding with all services needed by the pre-school child such as education and heal th care ;
Impar t nutr i t ion education in all schools and colleges, to all mothers and children participating in feeding pro-grammes and to planners, administrators and personnel in government and other depar tments ;
Increase substantial ly the number of children in the 3 to 6 years age group fed through Kuzhanthaikal Kappagams (Balwadies) to cover 17.4 lakhs children from households below the 'Pover ty line' by 1984. This is to be achieved by opening 12,500 Balwadies and at taching a pre-primary section to each of the 15,300 out of the 30,600 primary schools ;
Organise 3750 Nutri t ion Rehabili tation-cum-Demonstration centres in different Districts to impart nutr i t ion educa-tion to mothers of 3.75 lakhs severely malnourished children ;
Reach 1.05 lakh children below 30 months age through pilot projects of Creches or Day Care Centres with nut r i t ious weaning food ;
Improve the nutr i t ional feeding programmes for expectant and nursing mothers and increase their number f rom 33,540 to 4 lakhs, in such a way that those below the ' Pover ty l i n e ' are covered to the greatest extent possible; and
Organise all the existing and new feeding programmes to provide for i ts beneficiaries at least one-third of the daily caloric and nu t r i en t requirements.
Long Term The long term goals are to :
Reach all sections of the population with nutr i t ion educa-tion to improve their food habits through intervention
INTRODUCTION 9
in the school and college curricula, professional pro-grammes and extension and publici ty activities. A complete network of nut r i t ion and health education centres is needed to involve all categories of medical and heal th workers, school teachers, social workers, adminis-trators, p lanners and leaders of the community so that they may, in turn , educate and involve every man, woman and child of the S ta te ;
Make available nut r i t ious foods to all people, subsidising the prices where necessary ;
Increase per capita consumption of calories and nut r ien ts to the levels recommended by ICMR—by increasing and coordinating production efforts, and by streamlining distr ibution mechanisms; and
Plan and implement action-oriented research projects on nut r i t ion which will help in finding ways and means of reaching the above goals expeditiously.

CHAPTER II
PRESENT STATUS OF NUTRITION IN TAMIL NADU
T H E parameters used to define the present s ta tus of nutr i t ion in Tamil Nadu are :
Consumption of calories, proteins and other nut r ien ts by the different segments of the population ;
The dimensions of the population to be fed ;
Heights and weights of chi ldren;
Morbidity due to malnutri t ion ; and
In fan t and child mortal i ty.
A knowledge of all these related parameters is an important basis for planning nutr i t ion programmes. There has so far been no integrated approach to the s tudy of all these variables. Nevertheless, there are many small geographically limited studies which provide a general picture of the current s tatus of nut r i t ion , in terms of one parameter or another , mentioned above.
Consumption of Calories by the Different Segments of the Population
A number of studies conducted between 1960-69 under the auspices of the ICMR, give an idea of the mean consumption of calories and nu t r ien t s in the different states. These studies have been summarised in the Diet Atlas of the ICMR (1971)(12) and compared with ICMR's Recommended Allowances for Calories and Nut r ien ts for Indians(13) given in Table 1.


12 NUTRITION IN TAMIL NADU
Table 2 gives the daily per capita consumption of calories and proteins in the different states.
TABLE 2 — Mean per Capita Daily Consumption of Calories and Proteins in the Different States of the Indian Union (12).
Number N a m e of the State Proteins in grams
Calories
1. Andhra Pradesh 53 2040 2. Bihar 56 1865 3. Gujarat 54 1612 4. Haryana Not avai lable 5. Jammu—Kashmir 63 2265 6. Himachal Pradesh Not avai lable 7. Kerala 47 1842 8. Madhya Pradesh 98 2779 9. Maharashtra 68 2281
10. Mysore 66 2220 11. Punjab 84 2832 12. Rajasthan 77 2044 13. Tamil Nadu 36 1498 14. Uttar Pradesh 66 2307 15. West Bengal 48 1927
All India 53 1985 ICMR's Recommended Allowances ( l s ) 44 2400
Tamil Nadu ranks lowest among the States with regard to the mean consumption of calories and proteins. The per capita food consumption in Tamil Nadu based on 114 surveys, conducted by the ICMR is given in Table 3.
TABLE 3 — Per Capita Mean Daily Food Consumption in Tamil Nadu (12).
Number Food I tems Consumption ICMR's in grams Recommended
Allowances ( l s ) in grams
1. Rice 288 1 Wheat 11 J- 356 370 Other cereals 57 J
2. Pulses 16 J
70 3. Milk and millc products 26 180 4. Meat, fish and eggs 13 35 5. L e a f y vegetables 8 110 6. Other vegetables 52 125 7. Frui t 5 37 8. Fats and oils 6 38 9. Sugar, jaggery 6 40
10. Condiments 20 Not g iven

PRESENT STATUS OF NUTRITION IN TAMIL NADU 13
Except for cereals, the in take of all o ther foods is much below the levels recommended by the ICMR. T h e staple diet consists of rice, cumbu, cholam or ragi to which, a few grams of red gram (dhall) are added in the prepara t ion of sambhar. Some amount of black gram is consumed through iddlies or dosais. Consumption of green leafy vegetables is negligible. Consumption of other vegetables is seasonal—-availability and the amoun t of ten being inadequate. Fats , oils, sugar and jaggery which are sources of calories are used in very small quant i t i es for seasoning. Milk and milk produc ts are scarcely taken, even though people are aware of the importance of these foods. Meat, fish and eggs are con-sumed rarely. Consumption of fish is somewhat be t ter along the coastal areas.
T h e Statewide Food Habi t Survey (14) conducted by the Census Depar tmen t in 1961, was based on oral enqui ry , involving recall. The consumption pa t t e rn as shown by tha t survey is given in Table 4.
TABLE 4—Food Consumption Pattern in Tamil Nadu—1961.
Number Foods Mean Consumption per Consumption Uni t (CU)
(grams per day)
1. Rice and other cereals 577 2. Pulses 37 3. Vegetables 79 4. Fruits 57 5. Milk and milk products 68 6. Sugar and jaggery 51 7. Fish, meat and egg 17
This survey records a mean daily consumption of 2500 calories per Consumption Uni t , f for Tamil Nadu. Al though the caloric in take is adequate, the mean consumpt ion of foods other than cereals is lower than the recommended levels.
f The number of men, women and children of different age groups in a household is converted into Consumption Uni t s wi th reference to the caloric requirement of an average man, namely , 2800 calories taken as one Consumption Uni t . Therefore the figure derived on the basis of Consumption U n i t is bound to be larger than that derived on Per Capita basis.

14 NUTRITION IN TAMIL NADU
The National Sample Survey (NSS)(15) has compiled data on monthly consumption expenditure. Table 5 gives the distribu-tion of people spending different amounts per month in Tamil Nadu.
TABLE 5 — Percentage Distribution of Population according to Monthly Per Capita Expenditure Classes in 1969-70 in
Tamil Nadu (15).
Monthly Per capita Expenditure Classes (in Rupees)
Percentage Distribution of Population Monthly Per capita Expenditure Classes (in Rupees) Rural Urban State
0— 8 0-1 0 2 0-1 8—11 0-8 0-2 0 -6
11—13 1-7 0-7 1-3 13—15 2-5 0 -9 1-9 15—18 6 - 9 2-9 5 -3 18—21 12-1 4-1 8 -9 21—24 11-5 5-6 9-1 24—28 13-3 9 - 4 11-8 28—34 17-1 13-3 15-6 34—43 15-7 15 • 9 15-8 43—55 9-5 18-9 13-2 55—75 5-7 12-6 8-5 75 and above 3-1 15-3 7 -9
All classes 100-0 100-0 100-0
Judged by the consumption expenditure in Tamil Nadu, based on the National Sample Survey (15) nearly 55 per cent of the households spend less than 79 Paise per day per head, yielding minimum of 2200 Calories. Thus based on the 1972 cost of living index, 79 Paise represents the quantified poverty line.
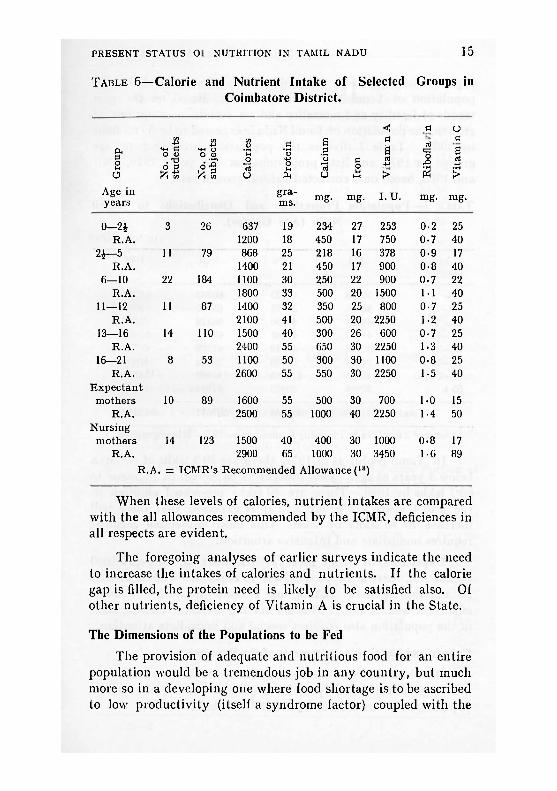
In addition to knowledge of per capita food intake of a popu-lation, it is necessary to know the consumption pat tern of i ts different segments, part icularly the vulnerable ones, pre-school children and expectant and nursing mothers. Table 6 provides an abstract of many food intake studies conducted by Sri Avinashilingam Home Science College, Coimbatore.
PRESENT STATUS OF NUTRITION IN TAMIL NADU 15
TABLE 6—Calorie and Nutrient Intake of Selected Groups in Coinibatore District.
< a o G
roup
No.
of
stu
den
ts
No.
of
sub
ject
s
Cal
orie
s
Pro
tein
Cal
cium
Iron
a I rt 4J s>
t« <c o XI 'ri M
0 S 03 4-J •rt >
Age in years
gra-ms. mg. mg. I . U . mg. mg.
0 - 2 J 3 26 637 19 234 27 253 0 -2 25 R.A. 1200 18 450 17 750 0-7 40
2 1 - 5 11 79 868 25 218 16 378 0 - 9 17 R.A. 1400 21 450 17 900 0 -8 40
6—10 22 184 1100 30 250 22 900 0-7 22 R.A. 1800 33 500 20 1500 1-1 40
11—12 11 87 1400 32 350 25 800 0-7 25 R.A. 2100 41 500 20 2250 1-2 40
13—16 14 110 1500 40 300 26 600 0-7 25 R.A. 2400 55 650 30 2250 1-3 40
16—21 8 53 1100 50 300 30 1100 0 -8 25 R.A. 2600 55 550 30 2250 1-5 40
Expec tant mothers 10 89 1600 55 500 30 700 1-0 15
R.A. 2500 55 1000 40 2250 1-4 50 Nursing
mothers 14 123 1500 40 400 30 1000 0 -8 17 R.A. 2900 65 1000 30 3450 1-6 89
R.A. = ICMR's Recommended Allowance (18)
When these levels of calories, nu t r i en t intakes are compared with the all allowances recommended by the ICMR, deficiences in all respects are evident .
The foregoing analyses of earlier surveys indicate the need to increase the intakes of calories and nut r ien ts . If the calorie gap is filled, the protein need is likely to be satisfied also. Of other nut r ients , deficiency of Vitamin A is crucial in the State.
The Dimensions of the Populations to be Fed
The provision of adequate and nut r i t ious food for an ent ire population would be a t remendous job in any country , bu t much more so in a developing one where food shortage is to be ascribed to low product iv i ty (itself a syndrome factor) coupled with the

16 NUTRITION IN TAMIL NADU
explosion of populat ion. According to the Census of 1971, the populat ion of Tamil Nadu is 41 millions. Based on the past t rends of fer t i l i ty and mortal i ty and on certain assumptions of growth, the population of Tamil Nadu is expected to be 55 millions by 1986. Table 7 divides the population according to age groups for 1971, and l ists projections for the years 1976, 1981 and 1986, based on a corrected na tura l growth rate.
TABLE 7—Population Projections and Distributions in Tamil Nadu (Age Groups).
( in hundreds)
Age (Years)
1971 1976 1981 1986
0— 4 59928 68473 68283 68708 5— 9 48606 56875 65560 65895
10—14 44427 47840 56128 64837 15—19 41237 43688 47168 55463 20—24 37786 40242 42788 46350 25—29 34068 36688 39250 41900 30—54 112935 126485 140488 154769 55 + 32046 39473 47946 57437
Total 411033 459764 507611 555359
Source: Tamil Nadu Planning Commission—1972-—Mimeographed.
In Tamil Nadu, as of 1971, there are 59'9 lakhs of children below 4 years of age. This number is expected to increase to 68'7 lakhs by 1986. There are 40 lakhs pre-school children in the 2 to 4 years age group and it is expected tha t these will increase to 46 lakhs by 1986. This most vulnerable segment requires immediate and intensive a t tent ion .
Experience in village surveys (16) shows tha t , for every 1000 populat ion, there are approximately 15 expectant women a t least 30 nurs ing mothers, making up a State total of 6-17 lakhs expectant women and 12'33 lakhs nurs ing mothers. This segment of the population also requires special and immediate a t tent ion .
Caloric and Nutrient requirements of the Population
Based on the ICMR recommendations set for th in Table 1(13) the total caloric and protein requirements of the ent ire population are worked out as in 1971 in Table 8.

PRESENT STATUS OF NUTRITION IN TAMIL NADU 17
TABLE 8—Protein-Calorie requirements fo~ Population of Tamil Nadu according to the ICMR Recommendation (1968)
Age group (years)
Less than 1 1 2 3
4— 6 7— 9
10—12 13—15 16—18
18+Males 18 + Females
Population (lakhs)
Da i ly Calorie Requirements
(millions)
D a i l y Protein Requirements
(tonnes)
10-6 795 2-01 9 -4 1131 16-02
11-8 1414 21-21 11-8 1414 23-56 31-4 ' 4713 69-13 29-4 5286 96-91 28-5 5982 116-80 26-1 6141 137-20 23-3 6068 128-36
114-3 32017 628-36 114-3 25156 514-55
410-9 90117 1754-11 Adjustment tor expectant and nursing mothers — add i t i on— 1720 50-66
Total for one day 91837 1804-77
Total requirement* for one year 33520505 658934-50
*Thi s es t imate has not made al lowances for imperfect distribution, uti l isation and absorption.
Calories and Protein from Cereals and Pulses The calories and protein content of cereals and pulses
produced in 1971 are set for th in Table 9.
TABLE 9—Calories and Protein Available from Edible Portion of Total Cereal Production in Tamil Nadu (1970-71) (13.17)
No. Cereals Production (tonnes)
Protein (tonnes)
Calories (millions)
1. Rice 5303400 271534 14637380 2. Cholam 546800 45494 1526670 3. Cumbu 321200 29807 927630 4. Ragi 344900 20142 905020 5. Varagu 234900 15597 580670 6. Samai 88600 5458 241700 7. Maize 19260 1710 52700 8. W h e a t 514 48 1420 9. Other cereals 54390 4496 12746
10. Bengal gram 1520 208 4320 11. Red gram 19470 3473 52180 12. Green gram 10540 2531 35220 13. Black gram 12976 2491 36020 14. Horse gram 51080 8990 131170 15. Other pulses 13880 3220 4402
Total 7023430 415199 19149248
N—2

1 8 NUTRITION IN TAMIL NADU
Nearly 59 per cent of the State's total requirement of calories are met by cereals. The green revolution and the advances of science and technology made in the cultivation of paddy, wheat and some other cereals, holds out the hope that the calorie-gap can be bridged. The green revolution must extend to legumes, oil seeds, vegetables, f ru i t and fodder crops if the lack of proteins and other nu t r ien t s is to be made good. Protein from animal sources needs to be augmented through an integrated approach to the development of animal husbandry and fisheries alongside of and in a manner similar to the intensive development of the State 's agricultural potential.
Mean Lengths or Heights and Weights of Children
The average weight of a child at bir th in Tamil Nadu has been computed at 2"8 kg(18). During the first four months, growth-rates of Indian children compare well with those of their counterparts in developed countries(19). I t is af ter six months of age, that growth lags behind. This is mainly due to malnutr i -tion. According to Gopalan(20), a recent country-wide nutr i t ion survey of thousands of pre-school children showed that the heights and weights of 90 per cent were below the 10th percentile value of the North American children of corresponding ages.
Mean length or height and weight of children in Coimbatore District have been worked out in Table 10 by age and sex. 'Standard weight' in Table 10 refers to the desirable or ideal weight for a child of a specific age and stature. These s tandard weights for length/height and age were computed from measure-ments of thousands of children in various ethnic groups in the USA over a period of several years. The standard weight for length for children aged 7-36 months were adapted from Tables of Woodbury(21). All other s tandard weights for height, age and sex were taken f rom Baldwin-Wood Tables(22).

** "2 a S *> HH .2 <•> o-o
h bb
in > t-1
17 bo bo •Sr*
-a 60 BO g
A w
a o< d 2 £ 0
cn
-a M ta H-. •a O c ctS
& .—. u bb O *-W
£ 00 b/3 '5 C '5 > H)
W> bo '(U
^ t! — a
S'S HJW
a PK •PH J-, o e
b/)
MC0tNi0OOC0O(NC0OC0C00l'-<i00iC0tN- ,0)C0if)
inCOtN^l^Dint^tn^-'O^COr-Nh-O'-'COOMtDCDO to t^ IN t^ CO O) (J) O O ' —«
Th t" co co to OJ M i o c o a i c o w c c o m o i N ^ c o c o r H r-H lO Tt1 rf rH IM (M '—1
a i i o o t ^ c o c o - a i i n c o r ^ c o ^ i n c o a i c o t ^ t ^ c o ^ a ^ - ' o^cococococoa^cxja^cocococoajoicoajcoo^cocoaico
'tClOt^COCOiOOl'^CO't^tDM^CDiOiOCOCOCOCOCO
COt^OCD^COmcOOCOCM-'CO^CDCD^tDCOO^tDN
o i ^ m o c o i o M m ^ c o i N c o c o i n c o i o c o ^ r H C D ^ i o t o
* r—« ty v-y t 5 CO en lO r
<u

20 NUTRITION IN TAMIL NABU
That the a t ta inment in terms of s tandard weight for length/ height is below 100 in all the age groups shows tha t the nutr i t ional s ta tus of the population surveyed is below the recommended levels. The percentile a t ta inment and s tandard weight for length/height and age would have been less if the Coimbatore children had been nearer to the Western length/height average.
Morbidity due to Malnutrition
Long continued dietary deficiencies are reflected in the poor growth of children and their falling easy prey to infections. The onset of nutr i t ional diseases can be hastened or aggravated by the f requent occurrence of a variety of infections—bacterial, viral or parasitic—which deplete the already low nutr i t ional reserves of individuals result ing in more severe malnutr i t ion. Malnutri t ion and infection const i tute a vicious circle each aggravating the other.
Women of child-bearing age form another vulnerable group with respect to nutr i t ional stress. The deficiencies of the mothers are reflected in their children(23, 24). The f requency of pre-gnancy and lactation fu r the r drain the nutr i t ional reserves of the mothers.
The wide prevalence of different types of malnutr i t ion in the . community, primarily due to inadequate diets, results in high morbidity. In a s tudy on morbidity, some 3,284 children below 10 years of age were found to have visited the peripheral clinic of the Ins t i tu te of Child Health in Madras, for one ailment or another. The pa t te rn of morbidi ty is shown in Table 11.
Considering each visit to the children's hospital as a case, 43,400 cases were registered among children below five years, out of a total of 56,788 cases. This shows the high morbidi ty inci-dence in children below 5 years.
Morbidity statistics received from 16 Primary Heal th Centres (PHC) spread over Tamil Nadu are presented in Table 12.

p o « o w o <
PH w
«: w t*
w o <
CO o 01 Ol 0 Ol 01 CM CO 0 CO m CO ^ 0 0 CM CM CM 0 CO O O" m i n 0 0
(M t^ Ol 1 0 CO CT)
O l O l CM
O ID 0 CD CO CO ^ CO 0
0
t o CO 0 O O ' 1 CM ID 0 0
O 10 0 CT1 CM CD Ol r-* CT> ^ CM CO CM CM i n CT)
0 0
CO <N
CM O CM O CO m 0 0
CT) CO m i -
CO CM | O l 0 CM r -
0 0 0
O i n
CO " " ' 0 CM ID 0 0
r 0 O CD <D CO CO ID 1
m O CO 0 0
1 0 CM CM CO O CO i n ID 0
0
CO CO 1 0
m CM ID O
CM CO ID '3 > us m CO
CO 0 0 i n CM CM CM O
0 a | CO CO 0 0
CM r- in CM 0 CO ID UD - O CO CO CO ID ID m 0 0
? CO CM CO O CO O CM i n 0 0
t - - CO CO i n
O in 0 O
CO 0 CTl O l
0 0
CO m CM 0 O CO CO M 0 0
o P*
p <D S
H T3 C CS
o fc
<4 w
< w 0 a a a '3 'cl 'a a rt a cd
a rt -JJ > > > a
•>) H O H
^ m t©

CtJ 0) >1
CO
^ - E O N C O N O ^ C J ' ^ T V I O ^ C O I O M ^ - '
ffl
IN CO O —i r- o o
0 0 0 CO •a- 0 CO CT> — CO CO CD m —1 S- CO CD CO CT) 1- CM CM m CM CM O CM CT1 CT> CD
<u >>
o 4J CO
a >>
CO CO Ol O O CO CO 1 ~ O 1- ^ CO O CO CO CM 0 m CO CT) CO CM CT1 m CM CM CD CO CM CM
O ^ ^ C O N t f l O t N ' l CO
O ^ in o in in ta co o
co in co CD O CO CD O CO CM
M ID O CO 0 CM in CO 0 0 0 CM 0
" 0
CD 0 CO LO CT> r> CO _ CO CO CD CD CM lO CO CO a> in CM CO CM CM CO in <N CM CM CM
m CO O) CO 0 CO m 0 CO CTl CT) m CO [ - CO CD i- 1- CM CO 0 O 0 CO r- 0 CO a CO CO m CO in CO CM CM CO r- O ^
CO -a- CO CO - CO CO - O
ffi
P3
— CO — CT1 Tf 0 CO 0s- co CT> in O CO CT) CM CM
" CM
0 a> CO CO 0 0 in a> CO crt 0 CO CO CO <JD CO CO CO CM CM CM CM CM
O co CM CM O r CM CO CO r-4 CD CM
"
0 CO _ CO m O "f in CT1 in CO CO CO "
0 0 r CO CO „ CM N CM cn CD m m CO m c l CM CM O) CO
•—1 CM CM CO r-1 —1
co r-cji
6 o
H CO 01 in Tf in
co m co ai co « in —• — co — —
m co o ^ di o o
CO CM Tf CO in 0 CM 1
^
CO CM G) CM 0 CO CO 10 CI CM
cfl
rt a h _ o
H rf ->J 5 3 ? % W
>- .2 S 0 S
•3
•c H
™ r-* £ £ > o
<3 a S "> TO <D C 03 w .a o !3 tJ aj ^ is * 1 « -H A
"K S O s 1 ° fi ^ M M O
<D «J
•a -C ~ Urn CO a o
J3 . 2 ft — u t, o a 3 -fi
•a u w C« 0)
3 -d !>, m a .a O • TH (Y bO cn O C +J ft .3 ca -a 3 ft <D (D
O H H S K
2 cci •JJ o O H
o H „ H
H

PRESENT STATUS OF NUTRITION IN TAMIL NADU 2 3
A dis t inct pa t t e rn of morbid i ty for rur U areas emerges when these da ta are collated with those in Table 11. Nearly 48 per cent of the cases t reated in PHC's are directly associated with malnu t r i t ion . T h e incidence of nut r i t ion-re la ted morb id i ty is high in the age groups 1-5 and 6-11 years in bo th u rban and rural areas.
A sample survey of 2,000 children examined in 12 dis t r ic ts of Tamil Nadu du r ing the years 1968-69 and 1969-70 by the Directorate of Heal th , Government of Tamil Nadu, is summarized in Table 13.
TABLE 13—Incidence of Malnutrition among Children
Sign of malnutrit ion Per cent
Vi tamin B complex deficiency ^Q Q
Angular s tomati t i s J Vi tamin A deficiency 5 -0
Skin condit ions 4 -5 Anaemia 1-0 Vitamin C deficiency 0 - 5
Data f rom another s tudy on 39,084 school-going children in Coimbatore Distr ic t are presented in Table 14.

O O O O O O CO
O CO ^ —< ( N
— O lO T)< ^ O O O
o o w
CC
o H s
3 2
CD rh" —< co 01 10 m oi ^ m o co (jd co O) m jn co m
CO CM
O ) CO
-N W H ^ Ol CM
•O a s u 4»
CO 13 <u
O O o m C O O l C O O c M 0 ) O O CM
O 1- — -i
<u cn
in « i-l <D f-. 05 I 5 g
q> en •S . S a S « -a s 0 ,0
'E "E « "S
> £5 1 « O h. a s m 2
• l l fS ® u
Q. 9
&
3 « .O a 3
2
a <4 .O
•CI S 3
fc
C td 43 a 3
2
O) r o co o o o ^ to CD CO CO CM * CO 1—1
CM
c o t o c o - ^ m i ^ t o ^ CO ^ 1 0 — 1
CM CO l O
O C O - s H O l C O i n O c M t- to CM tO ~ CM m 01
CO CO
o — CO CT) CO
CO O <M
10 co to a> ^ t^ to r^ ^ o
o ^ Ol to o ^ CO co co
CM t o CM
CO o o
0 ^ 0 — 6 0
t O C M t O c M i o a i - ^ C O t O C M C M C O m co o CO c n — CM
to CO CO
<u 6£ M
' a o> u I* V cu
w I-) n <
H
a 3 o T3 a cd
<« a W W W W
W 0) in a bo o
G -O 3 .Q
kJ <
3 -o 9 n > m ^ pCj 2 O

PRESENT STATUS OF NUTRITION IN TAMIL NADU 2 5
Data f rom another series of nu t r i t ion surveys carried out in some par t s of Tamil Nadu f rom 1954-1971 are presented in Table 15.
TABLE 15—Percentage Prevalence of Nutritional Deficiency Signs in Tamil Nadu
Group and place
Number Examined
Vi tamin A Deficiency
Vi tamin B Defic iency PCM Anaemia
Pre-school children: V /o /o /o 0/ /o Poonamallee 305 7 .0 4 -0 26-6 N.A.
Tiruchirapalli 516 3-5 3-0 22-2 N.A.
Madurai 520 1-7 4 0 23-4 N.A.
School children in:
Tamil Nadu Sample survey 1970 20300 7-1 9 - 4 N.A. 2 -5
Pre-school children:
Alamarathupatt i 35 34-3 11-4 N.A. N.A.
Munnailakottai 40 32 5 7-5 2-9 N.A. Thusur 70 20-1 30-1 4-5 N.A.
Kanavaipatt i 22 4 -5 13-1 N.A. N.A.
North Thaamaraikula ra 153 2-0 2-0 0 -6 21 6
N.A. : Not Available .
The nut r i t iona l deficiencies most observed were those of calories, protein and Vitamin A and B complex vi tamins. Nu t r i -t ional anaemia was prevalent among 56 per cent of the expectant mothers surveyed.
Infant and Child Mortality
I n f a n t mor ta l i ty is an indicator of the heal th s t a tus of a communi ty . Much i n f a n t morta l i ty is caused by malnut r i t ion in the mother dur ing pregnancy and dur ing the first few weeks of the i n f an t ' s life. T h e registered i n f a n t mor ta l i ty ra te in Tamil Nadu was 62'5 per thousand live b i r ths in 1969(26). Nearly one- third of the tota l morta l i ty is accounted for by children

2 6 NUTRITION IN TAMIL NADU
below five years, of whom 50 per cent died wi th in the first year. Table 16 presents da ta on mor ta l i ty among chi ldren below 10 years, and is derived f rom a s tudy conducted a t the I n s t i t u t e of Child Hea l th in Madras.
TABLE 16—Main Causes of Mortality among Pre-school Age-group in Madras
Incidence of Mortal i ty
All children
Pre-school age-group
Percentage of pre-school children
Number of children examined 2061 828 40 '0 1. Gastro-enteritis 639 228 35-6
2. Respiratory infect ions 496 110 22-0 3. Marasmus 251 97 38-6 4. Kwashiorkor 122 112 92-0 5. Other nutritional disorders 129 55 42-6
6. Tuberculosis 114 58 51-0
7. Typhoid, diphtheria and pol iomyelit is 44 31 70-5
8. Meningitis and encephalit is 95 29 30-5
9. Convulsive disorders 50 25 50-0
10. Encephalopathy 121 83 68-6
F o r t y per cent of the dea ths were among the pre-school age group, and 90 per cent of those dea ths were due to Kwashiorkor .
Ano the r s tudy of 21,100 cases t rea ted in the I n s t i t u t e of Child Hea l th in Madras in 1971 relates morta l i ty to p r imary and secondary causes some of which are shown in Table 17.

PRESENT STATUS OF NUTRITION IN TAMIL NADU 2 7
TABLE 17—Total Number of Children with Malnutrition treated in Madras Institute of Child Health during 1971
Treated as i Total Incidence primary condition
OiS6RS6 Total Total Total Total
treated deaths treated deaths
Vi tamin A deficiency—keratomalacia, xerophthalmia 5 1 1 —
Other manifestat ions of V i tamin A deficiency 3 — —
Vitamin A deficiency unspecif ied 88 14 2 —
Ascorbic acid deficiency 2 — 2 —
Rickets—active V i tamin D deficiency 43 7 10 —
Other v i tamin deficiency states unspecified 17 15 2 —
Protein malnutrit ion 471 157 389 149 Nutrit ional marasmus 414 136 169 62 Other unspecified nutritional
218 deficiencies 2234 564 218 27 Iron deficiency anaemia 57 2 43 —
Anaemia unspecified 220 55 84 17
Total 3554 951 920 255
The incidence of moderate and severe malnut r i t ion was observed in 17 per cent of total admiss ions ; cases of severe malnut r i t ion cons t i tu ted 25 per cent of all cases of malnu t r i t ion and 4*3 per cent of the total n u m b e r of admissions.
A figure of 4-3 per cent for the propor t ion of severe malnut -ri t ion cases to total admissions indicates a wider prevalence, since mild malnu t r i t iona l cases are not generally admi t ted to hospital unless they suffer f rom secondary infect ions or other ai lments. In a random s tudy of 1,043 consecutive cases who a t tended an out -pa t ien t depar tment , only 251 cases (24 per cent) did not show any symptoms of malnu t r i t ion .
All these studies, though l imited, throw light on the enor-mous dimensions of the problem of malnu t r i t ion . Viewed f rom any angle—consumption pa t te rns , an th ropomet ry , morbid i ty rates and morta l i ty figures—the problem is staggering. Over-coming malnu t r i t ion through concerted and co-ordinated p lanning and implementat ion of projects involving the co-operation of all depar tments and agencies concerned is, therefore, of pa ramoun t importance.

CHAPTER I I I
CURRENT EFFORTS TO COMBAT MALNUTRITION IN TAMIL NADU
MANY feeding programmes have been launched and are in operation under the auspices of the Central and State Governments and voluntary agencies in Tamil Nadu. The chief feeding prog-rammes are described below under five headings.
1. The Kuzhanthaikal Kappagam (Balwadi) Programmes
There are different types of Kuzhanthaikal Kappagams based on feeding programmes for pre-school children. In some, expectant and nursing mothers are also fed. Those operating at present a r e :
(a) CARE (The Cooperatives for American Relief Everywhere) Feeding Programme : Under the Depar tment of Women's Wel-fare and Directorate of Rural Development, there are at present 1707 Kuzhanthaikal Kappagams scattered throughout the State. The CARE Feeding Programme is operating for 300 days in a year benefitt ing 61,000 children and 30,000 expectant and nursing mothers in 1,000 of these pre-schools.
(b) Demonstration Feeding Programme : The Central Govern-ment 's Demonstrat ion Feeding Programme is being implemented in 84 Kuzhanthaikal Kappagams of 28 selected Community Development Blocks. In each Kuzhanthaikal Kappagam under this feeding programme, 30 pre-school children and 20 children, 6 to 30 months of age, are fed at a cost of 15 Paise per meal ; and 30 expectant and nursing mothers at a cost of 25 Paise per head per day. Nutr i t ious foods that are locally available are used in this feeding programme.
(c) Integrated Child Welfare Demonstration Project: In the Integrated Child Welfare Demonstrat ion Project at Poonamallee,

CURRENT EFFORTS TO COMBAT MALNUTRITION IN TAMIL NADU 2 9
2,100 toddlers and pre-school children are given midday meals, at a cost of 10 Paise per child per day.
(d) Family and Child Welfare Project: In four Family and Child Welfare Projects, with six pre-schools each, 760 children are fed at a cost of 20 Paise per child per day.
(e) Applied Nutrition Programme (ANP) : In 181 pre-schools which come under the scope of the Applied Nutr i t ion Pro-gramme (ANP), 7,240 pre-school children and 1,810 expectant and nursing mothers are given ANP-produced eggs and vegetables, when available, to supplement their meals. This programme is assisted substantial ly by UNICEF—Uni ted Nations Children's Emergency Fund—through the State Government .
(f) Other Kuzhanthaikal Kappagams : In 400 Kuzhanthaikal Kappagams, where neither CARE nor Demonstrat ion Feeding Programmes operate, children are given puffed rice, roasted Bengal gram or other snacks.
2. Tamil Nadu Midday Meals Scheme
The Tamil Nadu Midday Meals Scheme operates in 30,603 elementary schools in the state. The scheme provides midday meals to 16-2 lakhs of pupils for 200 days in a year. The Hari jan Welfare Depar tment and the Corporation of Madras have their own schemes for supplying midday meals to two lakhs of children.
The State Government 's share is limited to the recurring expendi ture not exceeding six Paise per meal per child. The Local Committee has to meet the balance of recurring expenditure of not less than 4 Paise per meal per child and the entire non-recurring expenditure.
Impressed by the working of the scheme, CARE improved the nutr i t ional contents of the school meals by supplying 100 grammes of Bulgar wheat per child for 100 days, 8 grammes of oil per child for 200 days, and 30 grammes of corn soya milk (CSM) a protein-rich, blended food, per child for 200 days.
3. The Industrial Nutrition Programme
The Industr ia l Nutr i t ion Programme comes under the purview of the Department of Labour in the Government of

3 0 NUTRITION IN TAMIL NADU
Tamil Nadu. The programme is applicable only to pre-school children of industr ia l workers and their wives who are expectant or nursing. In November 1971, there were 77 industr ies catering for 29,913 beneficiaries, more than 50 per cent of whom were pre-school children. The number of beneficiaries was reduced to 18,267 by J anua ry 1972, mostly because of the mount ing costs of food preparat ion which the managements found difficult to meet.
For the Industr ia l Nutr i t ion Programme, the CARE in Madras, donates Bulgar wheat a t the rate of 100 grammes per head for 150 days, CSM 100 grammes per head for 150 days, and 10 grammes salad oil per head for 300 days.
4. Special Nutrition Programme
A special nutr i t ion programme sponsored by the Central Government and implemented by the Depar tment of Women's Welfare provides daily three slices of bread weighing 75 grammes per child. Only children who are 6 to 30 months old and live in tribal areas or in urban slums are eligible to benefit from the programme—and it now extends to 1,51,629 children.
5. Primary Health Centres (PHC)
With the help of CARE, 354 Pr imary Health Centres, 289 Municipal Health Centres and 101 Backward Area Centres are dis t r ibut ing food to 35,630 children. CARE contr ibutes 100 grammes of wheat and CSM and 10 grammes salad oil per child for 300 days.
On-going Nutritional Feeding Programmes
The nutr i t ional feeding programmes described above are summarised in Table 18.

CURRENT EFFORTS TO COMBAT MALNUTRITION IN TAMIL NADU 31
TABLE 18—On-going Feeding Programmes in Tamil Nadu
, , , No. benefitted No. of
M„ Feeding Programmes davs Der Expectant N o - centres a a y s per c h i l d r e n a n d nursing year mothers
1. Kuzhanthaikal Kappagams: (a) CARE 100 300 61000 30000 (b) Demonstration 84 300 4200 2520 (c) Integrated Child Welfare 50 300 2100 —
(d) Fami ly and Child Welfare 24 300 760 —
(e) A N P 181 100 7240 1810 (f) Others (snacks) 368 100 14720 —
2. Primary Schools Midday Meals in schools
including those under Hari ian Welfare and the Corporation of Madras 30663 200 1820000 —
3. Industrial Canteens 77 — 29913 —
4. Special Nutrition 280 250 151629 —
5. Health Centres : (a) Primary Heal th
Centres 354 (b) Municipal Health
Centres 280 735 300 35630 —
(c) Backward Areas Centres 101
Total 2091192 34330
The feeding programmes ment ioned above are func t ion ing unde r m a n y handicaps which restr ict their efficiency. Studies conducted by Sri Avinashi l ingam Home Science College(27) reveal the shor tcomings listed below.
Kuzhanthaikal Kappagams (Balwadies)
In some Kuzhanthaikal Kappagams the following problems were n o t e d :
Food was no t prepared p rope r ly ; T h e quan t i t y was o f t en insufficient for the number of
chi ldren assembled a t the feeding centre, whether or not t hey were en ro l l ed ;

3 2 NUTRITION IN TAMIL NADU
A considerable number of children did not receive the food regular ly;
The impact of the feeding programmes of the Kuzhanthaikal Kappagams has not been measured ;
Difficulties were experienced in the t ransport on food from the Range Office to the Kuzhanthaikal Kappagams;
The Budget for feeding appeared to receive low priority from the sponsors;
Irregular provision of funds ;
Lack of co-operation from the public and pa ren t s ; and
Absence of nutr i t ion education.
School Midday Meals Scheme
Problems connected with the School Midday Meals Scheme include
Inadequacy of funds . Grants from the Government were inadequate and some schools were in debt because they had to meet the expendi ture on food ;
Irregular supply of funds because of a heavy burden on the teachers to collect funds, and on the public to donate regularly ;
Failure of Panchayats to meet their obligations caused schools to incur debts and even to maintain false accounts ;
Scarcity of wa te r ;
Unhygienic water supply ;
In many schools, teachers and pupils cooked food taking t ime off from formal teaching and learning ;
Infestat ion of foods with weevils, other insects and rodents due to lack of storage facil i t ies;
Difficulties in the t ransportat ion of CARE food to the village from the Range Centre. The expenditure of time, money and effort involved was enormous ;

CURRENT EFFORTS TO COMBAT MALNUTRITION IN TAMIL NADU 3 3
Inadequate kitchen facilities. Wi thout kitchens, any space-sheds, class rooms or verandahs were used for cooking and serving food ;
Absence of t ra ining for teachers in the managerial and nutr i t ional aspects of the school meal programme ;
No facilities for school gardens such as land, water, fertili-sers and pest icides;
Limited cooperation from parents and the public ;
Lack of provision to feed all the hungry children ; and
Absence of nutr i t ion education.
N — 3

CHAPTER IV
CONCEPT OF NUTRITION PROGRAMME
A NUTRITIONAL feeding programme has many aspects of which serving the food at the centres is only one. The meal service should be a tool for developing good food habits for health, good manners such as thoughtfulness , consideration for others and should generally serve as a foundat ion for good citizenship. An efficient nutr i t ion programme should comprise o f :
(1) Nutr i t ion and health education ; (2) Feeding target groups; and (3) Evaluat ion.
1. Nutrition and Health Education The central objective of any nutr i t ion and health programme
should be to improve the total well-being of the population which is achieved by effecting desirable changes in food habits and pat terns of living. In order to change the habits of the people, they must be motivated intensively through organised, consistent, continuous and convincing educational efforts.
(a) Intervention in the School and College Curricula : Nutr i-tion education has to s tar t f rom early childhood. Young children can be reached as a group in the Kuzhanthaikal Kappagams. They are captive and receptive audiences. Nutr i-tion education must s tar t f rom there and continue through primary, middle and secondary school years, adolescence and adulthood. Annexure I describes how nutr i t ion education can be imparted effectively in the existing situation by amendment of the curricular frame-work at various levels. At higher levels of education all s tudents in the colleges majoring in the humani-ties or in basic sciences should be required to take a short course in nutr i t ion. The curriculum suggested for s tudents of humani-ties is given in Annexure II and that for science s tudents in Annexure III.

CONCEPT OF NUTRITION PROGRAMME 3 5
(b) Intervention in Teacher Education : In order to incorpo-rate nutr i t ion education in the school curriculum, suitably t rained and motivated teachers are required. Accordingly all centres of teacher education need to be reoriented to this effort. All colleges of teacher education should offer a full course in nutr i t ion education as outlined in Annexure IV. The existing teachers should be given short orientation-training dur ing summer vacations by the proposed Depar tment of Nutri-tion, utilising existing nutr i t ion bureaus, cells, medical and home science colleges and other ins t i tu t ions as appropriate. The contents for such a course are suggested in Annexure V.
(c) Intervention in Community and Publicity Programmes : The available media of publicity—newspapers, magazines, the cinema, the radio, films, posters, exhibitions, fairs and camps—all current ly used in the service of citizenship and health education, family planning, the green revolution, national savings campaigns and the Community Development Programme need to be geared to the needs of nutr i t ion education directed at the masses of people.
The job chart of all extension and health workers in rural and urban areas should include educating families in nutr i t ion and health. For this purpose, a provision should be made for the employment of extension officers in Nutr i t ion at all levels from the State to the village and they should be exposed to suitable nutr i t ion education. A practical course for the village and block level nutr i t ion workers is outlined in Annexure VI.
(d) Intervention in Medical Programmes: The role of diet in the t rea tment of disease, nutr i t ional education and follow-up of pat ients need to be fur ther emphasised in t ra ining for hospital work.
I t is, therefore, necessary to establish nutr i t ion clinics and appoint diet i t ian-cum-nutr i t ionists at least in the District and Taluk Headquarters hospitals if not in the primary health centres. Medical and para-medical personnel need orientation in nutr i t ion education. Their curricula need to be revised (in the manner suggested in Annexure VII) so as to incorporate nutr i t ion education in it.

3 6 NUTRITION IN TAMIL NADU
(e) Intervention in Other Professional Programmes: Since advances in nutr i t ion are impossible without increasing food production, and improving processing and distribution, all the inter-related sectors such as agriculture, animal husbandry and food technology which have a bearing on nutr i t ion should have their training programmes suitably revised and enlarged. A series of lectures over 32 hours in the course of five to six days, should be sufficient to give the necessary orientation as outlined in Annexures VI I I and IX.
2. Feeding Target Groups
As recommended by the Seminar on Nutr i t ional Feeding in the Four th Plan (27), nutr i t ional feeding programmes should be considered as components of the total development of the indivi-dual. They are fundamenta l ly for development, and not given in charity or for relief. Assistance for nutr i t ional feeding should be worked into the communit j ' ' s own arrangements for wealth trans-fers of this kind and into i ts inst i tut ions for education and extension. The economic, nutr i t ional adequacy, hygienic and educational factors should be kept in view, while planning feeding programmes.
(a) The Economic Aspects: Any feeding programme, to be successful, must be continuous, regular and nutr i t ional ly adequate. Feeding must be carried out on the specified days without any break for whatever reason—absence of the workers, festivals, special drives or visits, or other, cont inui ty can be ensured only when the supplies are dependable, the administra-tors and workers at the operational levels realise the importance of cont inui ty in feeding, and the functionaries are allowed to work without disturbance and financial anxiety.
(b) Nutritional Adequacy: Nutri t ional adequacy can be ensured by feeding adequate quanti t ies of foods regularly. Regulari ty in t iming and the pat tern of feeding is essential for promoting growth and maintaining the health of the participants, inspiring them with confidence and developing good food habits.
For a long time to come, feeding efforts will have to be limited to the most vulnerable sections of the population living below the ' Poverty Line ' and to one meal a day except in creches where

CONCEPT OF NUTRITION PROGRAMME 3 7
children of working mothers are cared for the whole day. Wi th in these l imitat ions, the supplementary meal served at the centre should make up the deficits in calories and protein as est imated in Table 19 and also provide a min imum of one th i rd of an individual ' s daily requirements as computed by the ICMR (13).
TABLE 19—Caloric and Protein Deficits and Needs of Selected Vulnerable Groups in Tamil Nadu
ICMR's Recommended Group Requirement Mean Def ic i t /Day
Calories Protein (grams)
Calories Protein (grams)
Infants—(6 Months to 11 months) 900 16 430 3-6 Toddlers—(12 Months to 23 months) 1200 18 648 5 - 4 Pre-schoolers—(24 Months to 36
Months) 1200 18 604 3-9 Pregnant Women 2500 55 1387 4 -0 Nursing Mothers 2000 65 1470 27-0
Source : Sri Avinashi l ingam Home Science College, Coimbatore.
Children aged f rom 12 to 23 mon ths may be the most under-nourished. They may have a greatly diminished supply of breast milk and have very lit t le addi t ional supplementary food. Menus costing wi th in 20-25 Paise per child per day to meet one thi rd of the ICMR's recommended allowances are given in Annexure X for I n f a n t Feeding Programmes and Kuzhanthaikal Kappagams.
(c) Hygienic Aspects : For feeding programmes to fulfil their objectives, i t is imperat ive to ensure the necessary facilities, optional sani tary condit ions, hygienic handl ing of food and adequate protected water supply. Feeding programmes should be ini t iated only where these condi t ions are fulfilled.
(d) Educational Aspects : Feeding programmes in pre-schools and other educat ional stages should be utilised as tools for teaching nut r i t ion in a practical manner . They should also become ' Resul t Demons t r a t i ons ' to paren ts and the communi ty . T h e d in ing halls and canteens of educational ins t i tu t ions can be used to disseminate messages of nut r i t ion th rough (clean and balanced) m e n u s ; these demonst ra t ions can be supplemented by verbal messages delivered through posters, pictures and displays.

3 8 NUTRITION IN TAMIL NADU
3. Evaluation
Evaluation is an integral part of any programme f rom its inception. I t gives in general a sense of direction in the pro-gramme towards the desired goal just as self-criticism which internal evaluation implies gives it the necessary thrust . Evalua-tion is not a formali ty to be gone through at the terminal point, but should be so built into the operations of the system to maintain the programme and ensure its lasting success.
Many development and feeding programmes have failed because they lacked specifically defined goals and proper evalua-tion from the beginning. There is no evidence of evaluation in any of the on-going feeding programmes in Tamil Nadu, except for the belated, terminal evaluation of ANP. The few research studies carried out in the Sri Avinashilingam Home Science College (28) shed encouraging light on the acceleration of growth, sociability, at tendance, health s tatus and performance in school-children who participated in the School Midday Meals' Scheme. Some results of these studies are set for th in Annexure XI . Such evaluation needs to be planned as part of feeding programmes, using available expertise.

CHAPTER V
THE STRATEGIES FOR A TWELVE-YEAR NUTRITIONAL PLAN FOR TAMIL NADU
CONSIDERING Tamil Nadu's urgent need of and its re-sources for development and the limitations imposed on the system by given conditions the following integrated strategies of nutr i t ional improvement are recommended for adoption dur ing the 12-year Perspective Plan period (1973—1984).
(1) Nutr i t ion programmes for children below 30 months of age ;
(2) Nutr i t ion programmes for children between 2 | and 6 years of age ;
(3) Nutr i t ion programmes for expectant and nursing mothers ;
(4) Nutr i t ion rehabilitation programmes for severely undernourished children and their mothers ;
(5) Nutr i t ion programmes for school-children of 6 to 12 years of age;
(6) Nutr i t ion programmes for adolescent boys and girls aged from 13 to 18 yea r s ; and
(7) Nutr i t ion programmes for adults .
A Depar tment of Nutr i t ion has to be created for implement-ing these strategies with the co-operation of the concerned and related departments . The justifications for the strategies pro-posed are offered below under appropriate headings.
1. Nutrition Programmes for Children below 30 Months of Age
Nutri t ional requirements of in fan t s are high because baby-hood is a period of rapid growth and development. During the first year of life, the baby must gain considerably in weight and length, teeth must be cut and bones mineralized, certain systems

4 0 NUTRITION IN TAMIL NADU
of the body must complete their growth and the body composition modified.
Weight at bir th comprises about 80 per cent water, 8 per cent protein, 5 per cent fa t and 7 per cent minerals and carbohy-drate. The last mentioned proportion will remain stable through-out life, protein will rise to about 17 per cent, fat to 15 or 16 per cent and water will have decreased to about 60 per cent by the time the baby is six months old(30).
The head of a new-born is disproportionally large for his body. His arms and legs are short and practically useless at first. His skeleton is mainly cartilage or gristle and water, and only the central sections of his long bones are mineralized. These must be calcified gradually as he grows during childhood. He will cut six to eight teeth in his first year, these and the rest to make up his deciduous set to 28, must be cut and calcified from root to crown. The final calcification will be complete in his young adulthood(30.31).
A healthy, full- term baby is able to digest and absorb food and to excrete waste and gastric juices from his digestive tract. His kidneys funct ion to eliminate waste products from his blood stream. He needs relatively more to drink than an older child or adult . He can suck but is not yet ready to chew and swallow solid or semi-solid food. His eyes do not focus properly, and his senses of smell and taste have yet to be developed. He has a larger number of red blood cells, each containing more haemoglobin than he will have at any time later in life(32).
During the first six months, a healthy, full- term baby gains an average of 180 grammes in weight a week. By six months, or earlier, he has doubled his b i r th weight ; by twelve months he should have trebled it. He will increase his bir th length by 50 per cent by the end of the first year. Head, chest and other circumferences of the body will have made similar gains(22). His arms and legs will increase in length and strength as he grows and develops.
The natural food for the first few months of the baby's life is mother 's milk, but it provides little or no excess of any

THE STRATEGIES FOR A TWELVE-YEALL NUTRITIONAL PLAN 4 1
nutr ient for fu tu re store or to make good a deficiency that may exist. The baby of an anaemic mother may not have stored sufficient iron as a foetus to supply his current needs unti l foods to supply iron are added to his milk diet which is low in this mineral. Vitamin A and calcium stored in the foetus may soon need augment ing in greater amounts than are present in breast-milk. A source of Vitamin D needs to be added to the baby's milk in the early months of life to enable him to absorb the calcium from his diet. Milk is not a source of ample Vitamin C or thiamine. An undernourished mother eating largely carbohydrate-high foods, might t ransmit infant i le beri-beri to her baby through her thiamine deficient milk(33). In any case, af ter the first six months, milk in the quanti t ies in which it can be drunk by the in fan t , becomes progressively less nutri t ionally adequate as the sole food.
I t is a wise practice to s tar t supplementary feeding about the third month of a baby's life. Three ' golden rules ' for in fan t feeding a re :
Int roduce only one new food at a time to ascertain the baby's reaction to each new food ;
Give new foods in small amounts at first, to minimize results of harmful react ions; and
Be sure that food given to a baby is smooth in texture, bland and non-irr i tant to taste and digestion, appropriate in quant i ty and temperature and chemically harmless.
By start ing supplementary feeding early in a baby's life say at six months of age, he will have become used to a variety of foods—strained soup made from cereals and pulses, strained leafy vegetables and carrots, pureed f ru i t and f ru i t juice, potato, ripe banana, and curds. These will augment his milk feeds, and their quanti t ies can be increased according to the growing child's needs. Egg, first as yolk only, then the whole egg, lean meat and fish may be added to the diet dur ing the lat ter par t of the first year of life—or before, if the baby can tolerate the foods and if the parents can afford them. A convenient source of Vitamin D for infants , toddlers and others who may need it, is cod-liver oil, but it is dangerous to exceed the prescribed dose as the Vitamins D

4 2 NUTRITION IN TAMIL NADU
and A contained in the oil could accumulate in the recipient to cause serious harm.
By twelve months of age, the child should be eating practically all the foods of the family. In his second and third year of life, the quanti t ies of the foods he knows will be gradually increased, and perhaps a few foods may appear in a form that is novel to him—grated raw carrot, lettuce, leaves, and whole peeled apple. Milk available to the toddler and older child may be insufficient for their needs, but such beverages as g roundnu t milk, reinforced with calcium carbonate—such as is spread on betel leaves—and ragi malt help to make up a deficit of milk.
The growth of a child of one to two years of age, is less rapid than it was in the first year of life. Weight gain in the second year will be 25 to 20 per cent of the twelve month ' s weight, the gain will decline by 10 per cent in the third year. Gain in height is about 10 to 8 per cent of the previous twelve month ' s height each year. I t is noteworthy that the height of a two year old child is practically half of what it will be when adulthood is reached. So under-nutr i t ion during the first two years of life may cause a permanent ly sub-optimum stature in the individual. The nutr i t ion programmes described below may help to prevent this s tunt ing in children of families living below ' Poverty L i n e ' in urban and in rural areas.
(a) Creches in the Rural Areas: Programmes for reaching children below 30 months in the rural areas are extremely important . At present Demonstrat ion Feeding, Daycare Centres or Creches attached to Kuzhanthaikal Kappagams are taking care of children in this age group. The feasibility of expanding this service needs to be explored. The establishment of at least 3,500 Creches with feeding programmes is suggested for the 12-Year Plan Period. With 30 children in each Creche, 75,000 children would be covered. Eventua l ly the programme will be extended to all the eligible children in this age group.
(b) Creches in the Urban Areas: The efforts of different industr ies have to be co-ordinated to s tar t Kuzhanthaikal Kappagams and Daycare Centres, both within the factory and in the industr ial areas. As this is likely to improve product ivi ty

THE STRATEGIES FOR A TWELVE-YEALL NUTRITIONAL PLAN 4 3
and labour relations, provision of creches can be required by-labour laws. I t has been estimated that indus t ry could help to cover 50,000 children in this way.
(c) Special Nutrition Programmes for Children Below 30 Months in Urban and Tribal Areas : In urban areas, including slums, there are many unrecognised pre-schools, besides those run by municipalities and corporations. I t is necessary to s t rengthen and co-ordinate their efforts in feeding children, particularly, those in the slums, and areas where lower economic groups live. The Crash Nutr i t ion Programme of dis tr ibut ing Modern Bread, or, any other modified scheme, for children below 3 years, should be integrated into a system, for actually feeding the children in suitable centres at these places. I t is understood that the Crash Nutr i t ion Programme is catering for 1'52 lakhs of children. Sponsoring agencies, such as the Depar tment of Social Welfare, should make efforts to double this number in urban and tribal areas.
2. Nutrition Programmes for Children between 2J to 6 Years of Age
The period of 2\ to 6 years of age in a child continues to be one of physical and mental change and personality development. The rate of growth of the arms and legs is of ten greater than the growth of the t runk . From about 18 months to three years, growth of muscle accounts for about 50 per cent of the child's gain in weight. With increasing motor control, the active child develops more muscles also as he runs, climbs, slides and swings. As his legs grow longer, his centre of gravi ty shi f ts upward away f rom the ground, and more muscles of the back, but tocks and thighs are needed to hold his body upright(32). The growth of muscles is more rapid than the growth of other tissues and will continue at tha t rate unti l the child is ready for the growth spur t of adolescence.
The skeleton of a pre-school child s t rengthens rather than lengthens, as minerals deposit around the cartilage of bone at a faster rate than bone can lengthen. The bone is composed of t iny, complex crystals, mainly of calcium and phosphorus, which are set in a honey-comb fashion around a framework of cartilage. The honey-comb st ructure gives s t rength and an enormous

4 4 NUTRITION IN TAMIL NADU
surface area to a relatively small amount of bone material—as much as 3000 square metres to 30 grammes(33).
I t can be seen by the pat tern of growth in a pre-school child, tha t his diet must include ample quanti t ies of protein-high foods, good sources of calcium and iron and adequate amounts of vitamins. Caloric needs are relatively lower than they were in the rapid growth period of babyhood, but sufficient must be provided for his steady growth and for his highly active life.
A good diet for a pre-school child will s tand him in good stead as a protection against infectious diseases of childhood, to which he is apt to be exposed. Good nutr i t ion may not lessen his susceptibility to infections, but it will help his resistance to them. Infect ious disease in a poorly nourished child may cause or contribute to severe malnutr i t ion. The need for a viable nutr i t ional s ta tus of pre-school children has been foreseen by the Government of Tamil Nadu which aims to provide nut r i t ional feeding programmes for pre-school children of families below the ' Pover ty Line
There are 79 lakhs children below six years in Tamil N a d u ; of these, approximately 85 per cent are below the 'Pover ty Line'. This means, the feeding programmes will have to cover nearly 40 lakhs children among whom 17*3 lakhs are likely to be below three years of age.
(a) Using Existing Kuzhanthaikal Kappagains under Different Agencies: A single programme to feed pre-school children in the Kuzhanthaikal Kappagams is of paramount importance. This would integrate the efforts of ANP, CARE, Demonstrat ion Feeding and the Family and Child Welfare and other schemes of the Women's Welfare Department . I t should cover all the 1,707 Kuzhanthaikal Kappagams funct ioning in the State with a uniform programme of feeding, care and education. Except for the 584 Kuzhanthaikal Kappagams, where only snacks are given, all others have some feeding programme or another. The cost of food varies f rom 10 to 20 Paise per child per day.
As an integrated feeding programme has to be developed immediately, it should indicate :
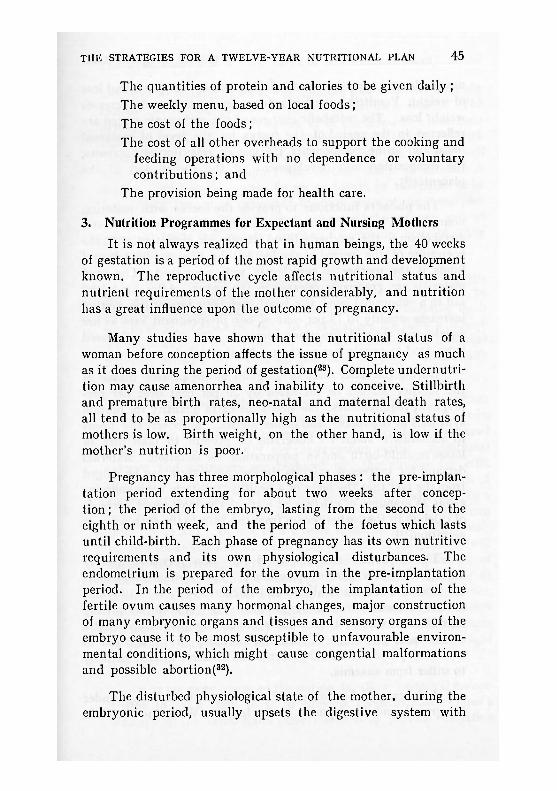
THE STRATEGIES FOR A TWELVE-YEALL NUTRITIONAL PLAN 4 5
The quanti t ies of protein and calories to be given da i ly ; The weekly menu, based on local foods ; The cost of the foods; The cost of all other overheads to support the cooking and
feeding operations with no dependence or voluntary contr ibut ions; and
The provision being made for health care.
3. Nutrition Programmes for Expectant and Nursing Mothers
I t is not always realized tha t in human beings, the 40 weeks of gestation is a period of the most rapid growth and development known. The reproductive cycle affects nutr i t ional s ta tus and nut r ient requirements of the mother considerably, and nutr i t ion has a great influence upon the outcome of pregnancy.
Many studies have shown tha t the nutr i t ional s ta tus of a woman before conception affects the issue of pregnancy as much as it does during the period of gestation(23). Complete undernutr i -tion may cause amenorrhea and inability to conceive. Stillbirth and premature bir th rates, neo-natal and maternal death rates, all tend to be as proportionally high as the nutr i t ional s ta tus of mothers is low. Bir th weight, on the other hand, is low if the mother 's nutr i t ion is poor.
Pregnancy has three morphological phases : the pre-implan-tat ion period extending for about two weeks af ter concep-tion ; the period of the embryo, lasting from the second to the eighth or n in th week, and the period of the foetus which lasts unti l child-birth. Each phase of pregnancy has its own nutr i t ive requirements and its own physiological disturbances. The endometrium is prepared for the ovum in the pre-implantation period. In the period of the embryo, the implantation of the fertile ovum causes many hormonal changes, major construction of many embryonic organs and tissues and sensory organs of the embryo cause it to be most susceptible to unfavourable environ-mental conditions, which might cause congential malformations and possible abortion(32).
The disturbed physiological state of the mother , dur ing the embryonic period, usually upsets the digestive system with

4 6 NUTRITION IN TAMIL NADU
nausea, loss of appetite, a reduction in food consumption and loss of weight. Vomitt ing fur ther reduces food intake and increases weight loss. The metabolic changes of the embryonic period are reflected in the period of the foetus by the level of maternal blood and urine components, the loss or retention of nutr ients , the composition and development of the foetus and of the placental3) .
The placenta funct ions to provide the foetus with maternal nourishment and for re turning the end products of the foetal metabolism to the mother 's blood stream for excretion. At the beginning of the period of the foetus, the placenta is fa ts and lipids if the mother is sufficiently well nourished. The lipid materials are gradually released to the foetus. After an initial fall to a subnormal level, the basal metabolic rate of the mother increases steadily to 13 per cent of, her pre-pregnant rate as her weight and thyroid funct ions increase. The mother will need extra food to supply her quickened basal metabolic rate.
During the latter half of pregnancy, the protein intake of the mother should be increased by 20 per cent over her pre-pregnant requirements. She. needs the extra quant i ty for protein synthesis of the foetus and of her uterus. Moreover, she needs to accumulate about 4*5 kilograms of protein to take care of losses in child-birth and in preparation for lactation. Maternal demand for increased calcium during pregnancy can be judged from the fact tha t the body of a health}', full-term baby contains about 24 grammes of calcium at birth. The most rapid increase of calcium in the foetus occurs f rom the 34th to the 40th week of gestation(32).
The expectant mother 's need for iron increases greatly during the lat ter part of pregnancy. In a normal pregnancy, the mother will need to absorb and utilize 700 to 1000 milligrams for her own and the foetal requirements^4) . I t is not surprising that anaemic women become more so during pregnancy ; tha t a considerable percentage of maternal mortality in India is due to anaemia(35) and that a baby born of an anaemic mother is likely to suffer f rom anaemia.
A deficiency of ascorbic acid dur ing pregnancy may hinder the growth and development of the foetus. When the maternal

T H E STRATEGIES FOR A TWELVE-YEALL NUTRITIONAL PLAN 4 7
diet is short of this vitamin, the mother will t ransmit what she has to the foetus, to the detr iment of her own health. The average concentration of Vitamin C in the blood of a new born in fan t is two to four times tha t in the mother ' s blood(34). As with Vitamin C, so with Vitamin A and carotene, the mother will deprive her body to supply the foetus. Lack of Vitamin A during gestation may cause bones and teeth of the child to be imperfectly formed. A deficiency of one or more of the B complex vi tamins dur ing gestation may prevent the proper use of ingested foods to supply energy, to provide body-building materials, and to regulate essential processes of the body.
If the nutr i t ional s ta tus of the pregnant woman is adequate, her period of gestation and child-birth is unlikely to be traumatic, and a full-term, healthy baby of a reasonable bir th weight is only to be expected. In this manner the baby will have a propitious start for its growth and development which should progress satisfactorily with an adequate supply of breast milk and a timely addition of supplementary foods.
During lactation, the nutr i t ion requirements of the mother increase progressively over her pregnancy need, with two exceptions; her calcium requirement is unaltered and her need for iron re turns to that of her pre-pregnant status. Additional calories and nut r ien ts are required by the mother for milk production which should increase steadily to meet the needs of the fast growing baby. The amount of milk produced should be a response to the baby's demand which varies considerably from in fan t to in fan t . By the time a baby is six months old, he may require about one litre of breast milk per day. This quant i ty will supply 720 calories, 11 grammes of protein, 280 milligrammes of calcium and 1370 I.u. of Vitamin A, as well as lesser amounts of other nutr ients . Unless a nursing mother has a substantial diet, she will produce milk at the expense of the calories and nut r ien ts her body requires; she may not be able to produce milk adequate in quant i ty and quality for her baby, and she may lose weight and health.
I t is far more costly to the nation to allow maternal malnu-trit ion to exist than it is to prevent its occurrence. Thus a strategy of the Tamil Nadu Government is to provide nutr i t ion

4 8 NUTRITION IN TAMIL NADU
programmes for expectant and nursing mothers existing below the ' Poverty L ine ' .
Educational and feeding programmes for expectant and nursing mothers have to be organised with health care and pre-and post-natal a t tent ion. Therefore, the nutr i t ional aspects of these groups should be the responsibility of the Health Sector, where it is planned to appoint additional nutr i t ionists . The nutr i t ional requirements and details of menus and their cost for expectant and nursing mothers are given in Annexure XI I .
4. Nutrition Rehabilitation Programmes
Nutri t ion Rehabilitation Programmes are necessary to educate the mothers on the common signs of malnutr i t ion among pre-school children, and to motivate them how to ameliorate malnu-tri t ion by simple, low cost, local nutr i t ious foods. Nutr i t ion Rehabilitation Centres can serve as Demonstrat ion Centres to show parents how nutr i t ious diets can improve their children's health within a few months. Mothers can be educated in proper methods of feeding children.
Ten villages can be selected from every Community Develop-ment Block. In each village, 30 children can be fed at a time to promote their nutr i t ional s tatus to levels of normalcy within four months. Thus , about 100 children can be rehabilitated in each village per year. Simultaneously, there must be intensive publi-city, through the radio and other mass media, of the results of such rehabili tation.
After funct ioning in demonstration villages for a year, the demonstration team can move on to other villages. A team of 10 Balasevikas will thus be able to cover a block in 6 or 7 years. For the entire State, 3,750 Balasevikas would accordingly be required. Public Health personnel would follow up the progress of the rehabilitated children by weighing them once a quarter . The scheme should include facilities for fu r ther rehabilitation of a mother and child when the child's poor weight-gain indicates the necessity for additional rehabilitation, with nutr i t ional advice and guidance. The scheme could cover 3*75 lakhs of children annually.

THE STRATEGIES FOR A TWELVE-YEALL NUTRITIONAL PLAN 4 9
5. Nutrition Programmes for School Children of 6 to 12 Years of Age
The pat tern of growth of a young primary school child is much the same, for two or three years, as the older pre-school child, previously described. Unt i l the growth spur t of adolescence starts, the school child will gain about 8 to 10 per cent of the previous annual weight each year, and height will increase by a steady five centimetres annually, muscles will continue to develop and calcification of bones and teeth is to be expected. The last bone to calcify is a small one in the wrist. This calcification takes place in the 12th year of a boy's life and a year or so earlier in a girl. In contrast , the final calcification of the thi rd molar will be completed in young adulthood. If the young primary school child has been eating ample food to supply the require-ments of calories and nutr ients , the girl or boy should be able to store fat, ready for use in the adolescent growth spurt , when the quanti t ies of food eaten may not quite meet the calorie require-ment of such rapid growth. The girl will prepare for her adoles-cent growth at about the n in th or ten th year of l i fe ; the boy some two years later.
Programmes providing midday meals in primary schools should provide much more than the nutr i t ional requirements of children. The focus of the programmes should be on nutr i t ional education woven into the integrated curriculum of nutr i t ion, outlined in Annexure I. Integrated nutr i t ion education includes experiences for children in learning self-reliance and service to others. The nutr i t ion programmes of the Tamil Nadu Govern-ment aim to provide these experiences by encouraging children to grow foods for themselves and others in school gardens and boxes, and to learn service to self and others at meals.
Tamil Nadu is ahead of all other States in i ts Midday Meals Scheme which is in operation in 30,603 elementary schools, catering to 18*2 lakh pupils for 200 days in a year. The con-cept, objectives and operation of the Tamil Nadu school lunch programme are generally satisfactory (20). However, the scheme needs to be strengthened in terms of nutr i t ional and health orientation and education.
The current Midday Meals Scheme needs to continue with improvements in nutr i t ive quality and nutr i t ion education.
N — 4

NUTRITION IN TAMIL NADU
Incorporating nutr i t ion education is even more impor tan t for permanent results than the earlier objective of improving the school a t tendance. One of the effective methods of impart ing nutr i t ion education and improving the health s tatus of children is through well planned nutr i t ious menus for the school lunch. The Tamil Nadu Midday Meals Scheme receives valuable food donations from CARE, a subsidy of six Paise per child per day f rom the State Government and a donation of four Paise per child per day from the public. Utilising these provisions, Sri Avinashilingam Home Science College has planned adequate lunches. Table 20 gives the quanti t ies of foods used in those menus and their cost.
TABLE 20—Cost, Quantity and Nutritive Value of Foodstuffs Used per Child per Meal
Food i tem Uni t price Quantity Cost per meal per kg. (grams) Rs. P. Rs. P.
*Rice or 1-25 } 100
0-062 Bulgar wheat 1-10 )
100 Free from C A R E
Red gram dhal 2-10 20 0-042 Greens (Amarantlius, tender) 0-20 50 0-010 C.S.M. Not available 30 Free from CARE Jaggery 1-80 10 0-018 Papaya 0-40 20 0-008 Oil 3-50 8 Free from CARE
Total 0 .140
* Since rice is used only on alternate days, the cost of rice per day comes to 6 Paise, making the average cost of the school meal 13-6 Paise per child per meal.
Nutritive value Calories Protein Calcium Iron
667. to 678 19 to 20 g.
416 mg. 26 mg.
Vi tamin A Thiamine Riboflavin Ascorbic acid
5480 I .U. 0 - 4 to 1.1 0 -5 mg.
73 mg.
mg.

THE STRATEGIES FOR A TWELVE-YEAR NUTRITIONAL PLAN 5 1
The weekly menu for the school lunch is given in Table 21.
TABLE 21—Weekly Menu in Sri Aviuashilingam Basic School Midday Meals
D a y s Menu
Monday Tamarind rice, Greens poriyal Tomato/Papaya*, CSM payasam *
Tuesday Wheat uppuma, Greens kootu Tomato/Papaya , CSM payasam
Wednesday Dlial rice, Greens poriyal Tomato /Papaya , CSM payasam
Thursday Wheat uppuma, Greens kootu Tomato/Papaya , CSM payasam
Friday Lime rice, Greens kootu Tomato /Papaya , CSM payasam
Saturday Wheat uppuma. Greens kootu Tomato /Papaya , CSM payasam
* Any seasonal low cost raw vegetable or fruit—Guava, Nell ikai , Mango Carrot, or Sprouted gram.
* Corn Soya Milk.
6. Nutrition Programmes for Adolescent Boys and Girls The nut r i t iona l needs of children f rom infancy to puber ty
have been carefully considered by exper t groups, and wherever possible, feeding programmes have been launched to help meet these needs in India . On the other hand, nut r i t iona l require-ments of adolescents have received scant a t ten t ion , except perhaps when the adolescent is also a mother . Yet boys and girls grow faster in adolescence than at a n y other t ime except in in fancy . The nut r i t ional needs of an adolescent you th are higher than at any other time of his life ; those of an adolescent girl are exceeded only dur ing pregnancy and lactation.
A moderate acceleration of growth in adolescence may amount to a 12 per cent to 15 per cent increase in weight, and 7"5 to 10 cent imetres in height, a year. The growth spur t usually s ta r t s and ceases two chronological years earlier in girls than in boys. The maximum growth in adolescent girls generally occurs between the ages of 10 and 15 years, then growth declines at 16 to cease in height soon af terwards . In boys, the growth spur t is usually f r o m 12 to 17 years with a decline at 18 years followed by a cessation of growth in height.

5 2 NUTRITION IN TAMIL NADTT
Within this general pat tern of growth, boys and girls vary widely, depending upon heredity, body build and environmental influences. Some may never reach their growth potentialities, nor even have a significant spurt of g rowth ; some start and stop their adolescent growth earlier than others. Chronological age and physiological age do not always coincide.
Adolescent growth in weight and height does not always synchronize with physiological change and development in the body. All the systems of the body, except the nervous and lymphatic systems, undergo change. Endocrine glands develop and produce sex hormones. Fat is usually converted to energy for g r o w t h ; muscles increase in size and strength, especially in boys ; calcification of bones is completed in adolescence; bones increase in length and density, and finally the epiphyses of long bones close to end growth in height. Some calcification of teeth continues through adolescence to be completed in young adulthood, when the roots of the thi rd molars are finally calcified(31).
The physical and physiological change and development in adolescence are sufficient to cause strain, and to increase greatly the nutr i t ional requirements of the adolescent. The stress of psychological, emotional and social change and development may fur ther increase the nutr i t ional demands of the body, by causing loss of nutr ients , especially of protein and calcium(24). The loss of blood in menarche increases the strain and nutr i t ional needs of an adolescent girl, for whom motherhood may emphasize the stress and her nutr i t ional vulnerabil i ty. An adolescent's requirements of calories and all nu t r ien ts are relatively greater than those in earlier childhood and in adulthood.
Adolescent boys and girls, therefore, need more food—and of good qual i ty—than their younger brothers and sisters. They need more protein, calcium, iron, riboflavin and ascorbic acid than their adult counterparts . Boys between the ages of 16 and 19 years need more calories than active young men ; their daily diet should be similar in quant i ty and quali ty to tha t of a ' re ference ' woman when she is a nursing mother. The greatest nutr i t ional need of the adolescent girl occurs from 12 to 15 years of age, and declines to the needs of an active young woman at

THE STRATEGIES FOR A TWELVE-YEAR NUTRITIONAL PLAN 5 3
about 16 or soon after , unless she is pregnant or lactating, when her requirements of calories and all nu t r ien ts are increased (13. 35). Annexure X I I I details the quanti t ies of foods at minimum cost which will meet the daily nutr i t ional require-ments of adolescent boys and girls.
Thus, adolescence is second only to infancy and very young childhood in nutr i t ional vulnerabil i ty. Development programmes might greatly increase the health and working capacity of the nation, if meal and nutr i t ional education programmes were organized for adolescent boys and girls in high schools, in t raining establishments and in work canteens. Their eating habits are closely connected with those of fu tu re families and with the national economy. Therefore, educational programmes during this stage should include nutr i t ion as outlined in Annexure I.
7. Nutrition Programmes for Adults
Calories and nu t r ien t s requirements except of Vitamin A, and iron for women, diminish slightly a f te r the peak period of growth in adolescence. Demands for protein, calcium, ascorbic acid and Vitamin A remain constant dur ing adulthood. The iron needs of men are constant but decrease a little in women af te r menopause. In general, requirements of calories, thiamine, riboflavin and niacin decrease as age increases. Each twenty years of adult life requires fewer calories than the preceding twenty years, thus less of the B-complex vitamins.
The nutr i t ional s ta tus of an adult reflects present food habits, previous dietary history and fu tu re health and efficiency. Good eating habits throughout life ensure and prolong vigorous years of adulthood, retarding the decline and decay of later years. Poor eating habits in earlier years may result in harmfu l effects on the body—some remediable, some lasting and others tha t get worse(32).
Adults are not static—physically, physiologically or psycho-logically. All systems, organs and cells of the body need calories and nut r ients daily for their maintenance and renewal. Muscles long continue to develop and to funct ion efficiently into well nourished adulthood. Each used red blood cell is normally

5 4 NUTRITION IN TAMIL NADTT
replaced with a new cell every three mon ths ; each cell of the liver should be renewed every seven days ; the minute micro-villi of the intest inal mucosa should be renewed dai ly ; osteoclasts continually erupt calcium and phosphorus salts of bones, which osteoblasts should simultaneously renew. The replacement and renewal of cells can take place efficiently only if the diet is adequate. Adverse changes that occur in growing old are due less to aging itself than to malnourished cells and organs, which become unable to maintain themselves adequately or to funct ion efficiently!30).
Statistics in India indicate that 60 per cent of the popula-tion are underfed(36). Nourishment to the cells and organs of the underfed must be insufficient for renewal and proper funct ioning. During 1964 more than 4-5 million people were treated for malnutr i t ion in hospitals and dispensaries; of these pat ients 3,511 died(36); a costly waste of lives, medicine and t reatment . The average monthly cost of medicines and medical services has been calculated as 85 Paise per person; loss of production in terms of man/work/day was reckoned as 97 Paise per month in towns and 105 Paise in villages(36). Loss of life and production, cost of sickness and medical care are negative factors in national development. Lives could be saved, work capacity increased, and sickness prevented if people had adequate diets.
Undernourished people with poor physique cannot contribute ful ly to national economy; moreover, the intellectual develop-ment of an underfed population is generally lower than that of a well nourished people(37). Malnutri t ion undermines mental apt i tude and alertness and is of ten the cause of accidents at work and at home. Heavy physical work requires considerable energy, which will draw on reserves of the body if the diet is deficient in calories. First , the store of glycogen will be depleted, then the body fat . Fa t catabolized for energy in the absence of carbohydrates produces toxins injurious to the individual. When surplus body fa t has been consumed for energy, proteins of the body must be sacrificed, causing loss of muscles and weight, and impaired enzyme systems(38).
Tha t better diets are able to increase production has been demonstrated in several countries!1). Construction on the Pan

THE STRATEGIES FOR A TWELVE-YEAR NUTRITIONAL PLAN 5 5
American Highway in Central America increased from 1*8 to 5'9 cubic yards daily within a few months of the labourers receiving well balanced meals thrice a day. A public works project in Costa Rica showed an increase of 917 cubic metres of earth moved, per man daily, as a result of bet ter daily meals and improved environmental sanitation. The production turnover of migrant workers in a Madagascar Sugar Fac tory showed a tenfold increase as a result of adequate meals being served in the works canteen.
The Depar tment of Labour in the Government of Tamil Nadu has an industr ia l nutr i t ion programme for pregnant and lactating wives of industr ial workers and for their pre-school children. This programme might be fu r the r exploited to supply low cost, adequate meals in works canteens, and to provide nutr i t ional education, part icularly for men and youths , whose education in this regard has f requent ly been neglected.
The eating habits of the bread winner are usually very influen-tial in pat terning the family diet. Men of ten do the family marketing, and some cook meals when their wives are indisposed. If the pater familias is convinced tha t the vulnerable groups in his family need certain foods in sufficient quant i t ies for their health and development, he is likely to make an effort to provide these foods and to adjust his eating habits for the good of the family.
In planning an overall nutr i t ion programme for Tamil Nadu, the per capita daily food requirements of adults as well as children need to be considered. The Indian Council of Medical Research(13) has tabulated suitable kinds and quanti t ies of daily food for vege-tarian and non-vegetarian adults, by sex and activity. The tables make useful references for planners of agricultural production and nutr i t ional programmes. Although men are not so nutr i t ion-ally vulnerable as their children and child-bearing wives, they are important people to keep well-fed, for their own sake, the sake of their families and for ful l national development.
Food for All
The Government of Tamil Nadu is fully conscious that the quant i ty and quali ty of food produced in the State must continue to increase in order to supply the needs of the expanding

5 6 NUTRITION IN TAMIL NADTT
population. Shops and markets must be kept well stocked with locally produced, nutr i t ious foods of which some may need to be subsidised by the Government in order to maintain their prices a t reasonably low levels.
The provision of ample food is not enough to ensure that the nutr i t ional s ta tus of the population is raised to and maintained at an adequate level. In addition to nutr i t ion programmes for vulnerable groups living below the poverty line, programmes of nutr i t ional education for all people must be continuously orga-nized and evaluated. Only then can adequate nutr i t ion become the bir th right of all citizens, rich and poor alike.

CHAPTER VI
ADMINISTRATION OF NUTRITION PROGRAMMES
T H E question of an appropriate organizational s t ruc ture for planning and implementing nutr i t ional programmes in the State has been engaging the at tent ion of planners and nutr i t ionis ts for some time. Today nutr i t ion programmes are implemented by different Depar tments of Government, for whom nutr i t ion programming is not the first priority among their many responsi-bilities. This has resulted in a multiplici ty of schemes covering the same segment of population, with different menus, nu t r ien t and caloric contents and costs. This has occurred because the depar tments started these programmes as and when f u n d s became available from different sources without their feasibility or likely impact being taken into account. If all the nutr i t ional efforts are pooled and implemented in a coordinated manner, af ter s tudying the need, acceptability and logistics of cont inuous distr ibution in adequate quantit ies, the programmes should then bring for th the desired results.
At present, the midday meals programme is not a major acti-vi ty of the schools, nor is there an emphasis on nutr i t ion education. A number of different types of feeding programmes are organized by the Women 's Welfare Department , which has many other responsibilities other than feeding. I t must be difficult for the Women's Welfare Depar tment to give whole-hearted at tention to the feeding programmes. Similarly, the feeding programmes under the Public Health Depar tment have a low priori ty in the gamut of health activities. Feeding pro-grammes in the industrial organizations controlled by the Labour Depar tment do not receive all the necessary at tent ion tha t they require. The Applied Nutr i t ion Programme implemented in a phased manner is one of the many activities of the Rural Develop-ment Depar tment . The evaluation of ANP shows that the programme requires greater direction than is possible wi th the

5 8 NUTRITION IN TAMIL NADTT
present s t ructure . I t has been observed that the ANP in some blocks and villages was discontinued af ter the Uni ted Nations ' and Governmental support was withdrawn at the conclusion of the five-year target period. These experiences demonstrate the need for a strong administrat ive machinery for the planning, organisation and implementation of the nutr i t ion programmes. This is in keeping with the present th inking of the World Bank and the National P lanning Commission who would like to see Nutr i t ion Cells or Uni ts established in the State and panchayat headquarters because of the impor tant role of nutr i t ion in develop-ment activities. New activities in the field of nut r i t ion need, therefore, to be formulated and implemented. The proposed organisation for nutr i t ion development should be s t ruc tured in such a way tha t it draws its personnel f rom the following disci-plines : Normal and clinical nutr i t ion ; Food technology ; Food adminis t ra t ion; Biostat is t ics; Nutr i t ional and Extension Educat ion.
If the selected services are available from all these disciplines in a ' package ' with the framework of one organization, then it will be possible to plan nutr i t ion programmes effectively. In order to realise this objective, setting up a Depar tment of Nutr i -tion or a Nutr i t ion Development Corporation by the Government of Tamil Nadu with five divisions and complementary staff at district, block and village levels is absolutely essential. The organizational s t ructure of the proposed depar tment has been schematised in the Chart. The budget estimates for the proposed s t ructure are set for th in Annexure XIV.

• 3 1 3 * O
3
fc
I—I • RT
s <3
H
4) 0
0 *
O -H
fc 5 5 . . . © •
05
• PH
ce O
a ©
Ot
S <U B -W Ut A <u Q <y JS
a o a 2 O l-c s s £ Z
© ~ z H3 0 tf
. c fa ® •on o S 3 H O. » c " 5 S I ^ •U ® o 'S f* > O "
a Hi bo •M . O TF) <u o • , _
e ^ g r T) 3 U >"> Ci <"
•O > "O tS ^•Ofl O § «
FA
3
O.TT
a In i/i C • S |
fa O H
W „ S l f l A
i ^ « ' fl . i M "8 3 5 $.8 3 3 - - ^ o - g
O ' O fa
u o V « O «
i S ^ B l - 8 -• § " 8 1 | i l l s •-I B a d ni a GT) 0 5 N A G B B S s .S <« rt <3 a C a t. ^ boO s ^ t ; o H ft-s; sow fl ft ^ »
i 0 «> X
© -M U Ei
X &
a §
•W H
t(H A O
J U
> P • PN •M
FT •W
« H fl
• H
M SM 4-i S
z SH
£
T»
TJ C
- <3 A ©
s Z I-I
<2 >> u
0) s=J U <U
W
A A> • s -
_ (H _ m M g. a, 0 <U
Q (H" 0
U OJ
s * d <
ci d . ft O C U j o
-M S >
S I 5
Q
> 4-> U 3 11 0 +J cfl — . s * •d l-i HH o o
,p4 ^ CJ M - S » o S H -tJ ^ s c d
c 0 o d 'to o d 2 ® t M
• ^ W
K rt c!
g rt aJ O r. ^ O O 2-53.9 H +3 ft« C
d si 05 « 2 j 1
~w - >
O o o g 3 a s Q f l o "
* I Tl fc S 1 !? rt rt ^ bo rt o o T. w txo o 2 -S 3
-a S ^ ' 2 D H o - J s H13 Sfa
A .5 ° s ^ g o 3 (s) fa
-fa
« a s s
o k ; FE PH Q
<U "O
fa
rt .ti 4) at j_i
Si «
d S ® .2 S H a s t z s 3 ® ® •on d o 3 5 > n
^ z
fl rt '

6 0 NUTRITION IN TAMIL NADU
Division 1—Research, Planning and Programmes Division
The Research, Planning and Programmes Division is designed to coordinate all the nutr i t ion research activities in the State through a Consultative Committee which will enlist representa-tives from the different research and teaching organizations. This division will design, sponsor and fund research activities for Nutri t ion Development. I t will be responsible for drawing up the Perspective Plan for Nutr i t ional Development in the State and detailed action plans for implementation.
Division 2—Education, Extension and Publications Division
The Educat ion, Extension and Publications Division will take over all the activities of the ANP, now administered by the Direc-torate of Rural Development. This Division will integrate i ts activities with the Nutr i t ional Feeding Programmes now adminis-tered by the Depar tments of Educat ion and other agencies. I t will conduct nutr i t ional training programmes for medical, para-medical and all other personnel who are engaged directly or indirectly in nutr i t ion activities. I t will be associated with the training of ANP workers in the Rural Extension Training Centres and be responsible besides for the production of publicity materials and the dissemination of nutr i t ion information generally. In this endeavour, it will coordinate the information f rom publicity uni t s available in different depar tments and it will use all the media for publicity. I t will extend the ANP throughout the entire State dur ing the 12-year Plan Period.
Division 3—Evaluation Division
The Evaluat ion Division will assess all nutr i t ion programmes in the field continuously. This division will take over a data bank relating to nutr i t ion now being compiled by the Tamil Nadu Nutr i t ion Project and keep it uptodate. I t will render statistical service needed by the other Divisions of the Depar tment of Nutr i t ion.
Division 4—Food Administration Division
The primary responsibility of the Food Administration Division will be to run the Kuzhanthaikal Kappagams and arrange for all the integrated services needed for child development—

a d m i n i s t r a t i o n o f n u t r i t i o n p r o g r a m m e s 6 1
education, feeding, immunization and e ther health services. Fur the r this Division will be responsible for rendering technical advice and coordinating the feeding programmes undertaken by different depar tments and inst i tut ions. I t will advise on suitable menus and help to expedite the procurement of food in the quanti t ies required.
Division 5—Food Development and Processing Division
The Food Development and Processing Division will evaluate available technology and manufac tur ing processes for foods and will select foods suitable for the use of young children. Start ing with weaning foods, it will commission and guide food develop-ment research calling on other agencies for help where necessary.
Field Level Staff
The Depar tment of Nutr i t ion will have the complementary staff needed to implement the programmes at the Regional, District, Block and Village levels as will be seen from the chart and budget estimates.

CHAPTER VII
BUDGET FOR THE TWELVE-YEAR TAMIL NADU NUTRITION PLAN
AMONG the strategies described in Chapter V, those per ta in-ing to children below six years in the lowest economic s t ra ta will cost a total sum of Rs. 123 crores spread over the period of twelve years, benefi t t ing 4-77 million children. The ent i re responsibil i ty including the budget for the maternal nut r i t ion programmes will be borne by the Heal th sector. Programmes for school children will be financed by the Educat ion Depar tment . The est imate of Rs. 123 crores has been derived as follows :
1. Kuzhanthaikal Kappagams/Pre-Primary Sections
(а) At least 20 Paise per child per day are needed to p rov ide -J- of the daily caloric requirement (400-500 cal.) and 10 grammes of protein. The feeding should be for not less than 300 days in a year.
(б) Each Kuzhanthaikal Kappagam/Pre-primsiTy section will have 60 children.
(c) The min imum staff for a Kuzhanthaikal KappagamlPre-pr imary section will consist of one Balasevika and two Ayahs. The min imum wages suggested for the Balasevika are Rs. 80 per month to be ul t imately raised to tha t of a pr imary school teacher and for the Ayah, Rs. 20.
(d) The ren t for the bui lding and contingencies will cost Rs. 37 per Kuzhanthaikal KappagamlPre-prima.ry sec-tion per month .
(e) The non-recurr ing cost for utensils and accessories will be Rs. 300 per Kuzhanthaikal KappagamlPre-prima.ry section.
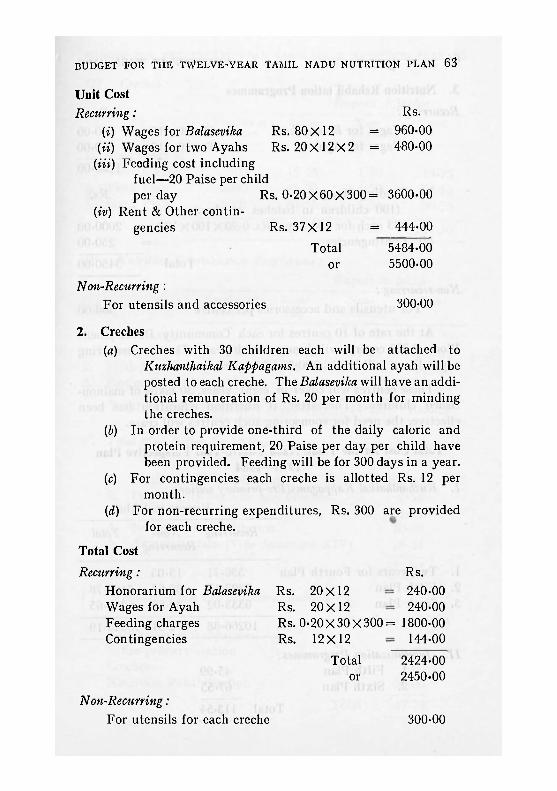
b u d g e t f o r t h e t w e l v e - y e a r t a m i l n a d u n u t r i t i o n p l a n 6 3
Unit Cost Recurring: Rs.
(i) Wages for Balasevika Rs. 8 0 x 1 2 = 960-00 (ii) Wages for two Ayahs Rs. 2 0 x 1 2 x 2 = 480-00
(Hi) Feeding cost including fuel—20 Paise per child per day Rs. 0 - 2 0 x 6 0 x 3 0 0 = 3600-00
(iv) Ren t & Other contin-gencies Rs. 37X12 = 444-00
Total 5484-00 or 5500-00
Non-Recurring : For utensils and accessories 300-00
2. Creches (a) Creches with 30 children each will be at tached to
Kuzhanthaikal Kappagams. An additional ayah will be posted to each creche. The Balasevika will have an addi-tional remunerat ion of Rs. 20 per month for minding the creches.
(b) In order to provide one-third of the daily caloric and protein requirement, 20 Paise per day per child have been provided. Feeding will be for 300 days in a year.
(c) For contingencies each creche is allotted Rs. 12 per month.
(d) For non-recurring expenditures, Rs. 300 are provided for each creche.
Total Cost
Recurring: Rs. Honorarium for Balasevika Rs. 20X12 240-00 Wages for Ayah Rs. 20X12 240-00 Feeding charges Rs. 0 - 2 0 x 3 0 x 3 0 0 = 1800-00 Contingencies Rs. 12X12 144-00
Total 2424-00 or 2450-00
Non-Recurring: For utensils for each creche 300-00

6 4 n u t r i t i o n i n t a m i l n a d u
3. Nutrition Rehabilitation Programmes
Recurring: Rs. (a) Wages for Balasevika Rs. 8 0 x 1 2 = 960-00 (b) Wages for Ayah Rs. 2 0 x 1 2 = 240-00
~~1200-00
(c) Feeding Charges Rs. (100 children in batches of about 33 each for 100 days) Rs. 0-20 X100 X100 = 2000-00
(d) Contingencies = 250-00
Total 3450-00
Non-recurring: For utensils and accessories per centre 300-00
At the rate of 10 centres for each Community Development Block, 3,750 centres will funct ion each year. The total recurring expendi ture will be Rs. 120-38 lakhs per year.
These centres will cover in, eight years, 30 lakhs of malnou-rished children. Thereafter , if nutr i t ion education has been effective, the need for sponsoring such centres will cease.
Total Cost for the Tamil Nadu Twelve-Year Perspective Plan 1973—1984
I. Kuzhanthaikal Kappagams/ Pre-primary sections : Rupees in lakhs
* Recurring Non-
Recurring Total
1. Two years for Four th Plan 536-71 13-05 549-76 2. F i f t h Plan 3397-15 32-63 3429-78 3. Sixth Plan 6333-02 32-63 6365-65
10266-88 78-31 10345-19
II. Immunization Programmes: 1. F i f th Plan 45-99 2. Sixth Plan 67-55
Total 113-54

BUDGET FOR THE TWELVE-YEAR TAMIL NADU NUTRITION PLAN 6 5
I I I . Creches: Rupees in lakhs
Number of Recur- Non- Total Creches ring Recurring
1. Two years of Four th Plan 500 12-25 1-50 13-75
2. F i f t h Plan 2000 49-00 4-50 53-50 3. Sixth Plan 3500 85-75 4-50 90-25
6000 147-00 10-50 157-50
IV. Nutrition Rehabilitation Programme: Rupees in lakhs
Number of Recur- Non- Total Creches ring Recurring
1. Two Years of Four th Plan 3750 258-76 11-25 270-01
2. F i f t h Plan 3750 646-90 — 646-90 3. Par t of Sixth Plan 3750 129-38 — 129-38
T o t a l : 11250 1035-04 11-25 1046-29
V. Total Plan Outlay for 12 Years: Rupees in crores
1. Kuzhanthaikal Kappagams 103-45 2. Pre-Primary Sections and Creches 1-58 3. Immunizat ion 1-14 4. Nutr i t ion Rehabili tation 10-46 5. Administrat ion (Vide Annexure XIV) 6-24
122-87
VI. Population that will be Covered through—
Numbers in lakhs Kuzhanthaikal Kappagams/
Pre-primary section 16-68 Creches 1-05 Nutr i t ion Rehabili tation 30-00
To ta l : 47-73 N—5

66 n u t r i t i o n i n t a m i l n a d T T
COST OF KUZHANTHAIKAL KAPPAGAM/ PRE-PRIMARY PROGRAMMES
Rs. in lakhs
NUMBERS RECURRING COST
Kuzhanthai- Pre-pri Kuzliantha - Pre-Year kal mary Total kal primary Total
Kappagam Kappagam primary
1972--73 2607 1275 3,882 140-78 68-85 209 63 7 3 - -74 3507 2550 6,057 189-38 137-70 327 08
330-16 206-55 536 71
1974--75 4407 3825 8,232 237-98 206-55 444 53 7 5 - -76 5307 5100 10,407 286-58 275-40 561 98 7 6 - -77 6207 6375 12,582 335-18 344-25 679 43 7 7 - -78 7107 7650 14,757 383-78 413-10 796 88 7 8 - -79 8007 8928 16,932 432-37 481-95 914 33
1,675-89 1,721-25 3,397 ~15
1979— -80 8907 10200 19,107 480-98 550-80 1031 78 8 0 - -81 9807 11475 21,282 529-58 619-65 1149 23 8 1 - 82 10707 12750 23,457 578-18 688-50 1266 68 8 2 - -83 11607 14025 25,632 626-78 757-35 1384 13 8 3 - -84 12500 15300 27,800 675-00 826-20 1501 20
2,890-52 3,442-50 6,333 02
Grand Total : 4,896-57 5,370-30 10,266 88
N o t e : 1. Kuzhanthaikal Kappagam @ 900 numbers per year. 2. Pre-primary sections @ 1275 numbers per year. 3. Number of children per Kuzhanthaikal Kappagam/per Pre-
Primary—60.

CHAPTER VIII
NUTRITION RESEARCH
Current Research Efforts
SEVERAL research projects need to be sponsored to support nutri t ion development programmes and strategies. The research activities of some insti tutions in Tamil Nadu, i.e., Sri Avinashi-lingam Home Science College, Coimbatore, Christian Medical College, Vellore, Women's Christian College, Madras, Inst i tute of Child Health, Madras, Madurai Medical College, Gandhigram Rural Insti tute, Voluntary Health Centre, Madras, are reviewed below.
SRI AVINASHILINGAM HOME SCIENCE COLLEGE, COIMBATORE
Studies on infant weaning foods through feeding trials with i n f an t s ;
Development and evaluation of protein quality of nutrit ional supplements for pre-schoolers;
Formulation of low cost nutrient-rich supplements for children. Mixtures of oil seeds and commonly consumed pulses— red gram, black gram, green gram, groundnut and sesame—as supplements to rice diets ;
Conducting feeding trials with pre-school and primary school children to test the growth promoting qualities of the newly developed supplements, pulses and grams, and vegetable protein mixtures such as the Indian Multipurpose Food, CSM and their combinations;
Testing the efficacy of vegetable portein mixtures of sesame and green grams for the treatment of Protein Calorie Malnutrition ;
Assessment of the supplementary value of some indigenous vegetables such as Amaranth and mixed jungle greens to rice d ie ts ;
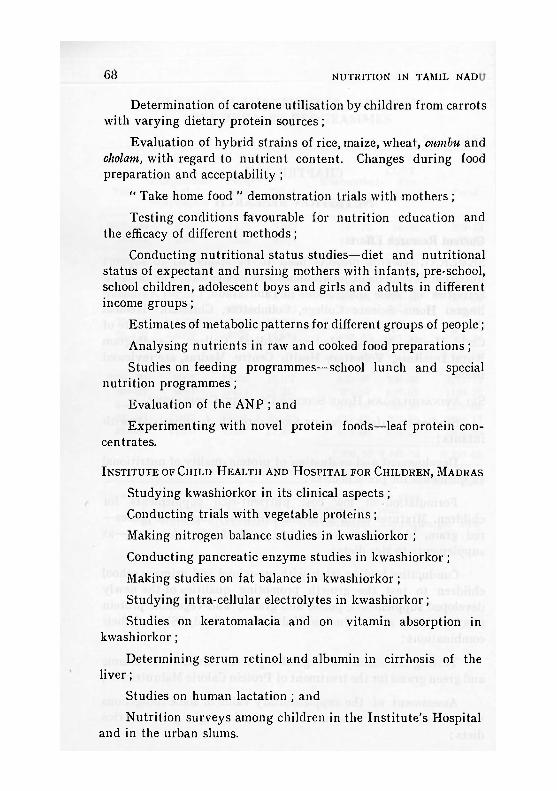
6 8 n u t r i t i o n i n t a m i l n a d T T
Determination of carotene utilisation by children from carrots with varying dietary protein sources;
Evaluation of hybrid strains of rice, maize, wheat, cumbu and cholam, with regard to nu t r i en t content . Changes during food preparation and acceptabi l i ty;
" Take home food " demonstrat ion trials with mothers ;
Testing conditions favourable for nutr i t ion education and the efficacy of different methods;
Conducting nutr i t ional s ta tus studies—diet and nutr i t ional status of expectant and nursing mothers with infants , pre-school, school children, adolescent boys and girls and adults in different income g roups ;
Est imates of metabolic pat terns for different groups of people;
Analysing nut r ien ts in raw and cooked food prepara t ions ;
Studies on feeding programmes—school lunch and special nutr i t ion programmes;
Evaluat ion of the ANP ; and
Exper iment ing with novel protein foods—leaf protein con-centrates.
INSTITUTE OF CHILD H E A L T H AND HOSPITAL FOR CHILDREN, MADRAS
Studying kwashiorkor in i ts clinical aspects ;
Conducting trials with vegetable proteins ;
Making nitrogen balance studies in kwashiorkor ;
Conducting pancreatic enzyme studies in kwashiorkor;
Making studies on fat balance in kwashiorkor ;
Studying infra-cellular electrolytes in kwashiorkor;
Studies on keratomalacia and on vitamin absorption in kwashiorkor;
Determining serum rctinol and albumin in cirrhosis of the l iver ;
Studies on human lactation ; and
Nutr i t ion surveys among children in the Ins t i tu te ' s Hospital and in the urban slums.

n u t r i t i o n r e s e a r c h 6 9
CHRISTIAN MEDICAL COLLEGE, V E L L O R E
Evaluat ing protein quali ty in mixtures of legumes;
I n f a n t feeding trials with weaning supplements. Supple-mentat ion of g roundnut protein isolate in meals for pre-school ch i ldren ;
Absorption and availability of nutrients—Comparison of the supplements—Indian Multipurpose Food and g roundnut Protein Isolate for pre-school children ;
Trials with children suffering from kwashiorkor—-Treatment with milk protein, milk protein blends, moderate protein, high caloric diets and processed fish protein ;
Calcium balance studies on children accustomed to low calcium intake ; and
Studies in the prevention of Vitamin A deficiency. Vitamin A therapy in children wi th kwashiorkor.
W O M E N ' S CHRISTIAN COLLEGE, MADRAS
Studies on the effects of vegetable protein foods and Amaranth supplementing rice diets as tested on young albino rats ;
Determining availability of Vitamin C from nellikai and drum-stick leaves in the diet of college women;
Studying the interrelationship between Vitamin C, iron and calcium and between carbohydrates and thiamine ;
Studies on leaf protein concentrates ;
Studies on the biological availability of calcium, phosphorus, iron and carotene f rom edible green leaves ;
Nitrogen balance studies ; and
Studying the basal metabolic rate of girls of 9—16 years age.
MADURAI MEDICAL COLLEGE, MADURAI
Studies on Vitamin A—malnutri t ional blindness ;
Nutri t ional rehabilitation of severely malnourished children through low cost indigenous food supplements ; and
Nutr i t ion education.

7 0 n u t r i t i o n i n t a m i l n a d T T
GANDHIGRAM R U R A L INSTITUTE, MADURAI
Formulation of protein-rich foods for in fan t s ; and
Popularization of low cost indigenous nut r i t ious foods in the villages.
Future Research
Research endeavours in the immediate f u t u r e must become responsive to the social problems of alleviating hunger and malnutr i t ion. Studies in the following broad areas of research will help to fulfil this goal.
Nut r ien t requirements and metabolism of different segments of Indian population in various stages of life ;
Methods suitable for assessing the nutr i t ional s ta tus of communities ;
Family size and nutr i t ional s ta tus ;
Food quality, composition and safety ;
Food pat terns and habits ;
Evolving desirable food service systems ;
Ecology of nutr i t ion ;
Methods suitable for nutr i t ion education in the urban and rural areas;
Test ing diets prescribed in indigenous medical systems ;
Evaluation of sponsored nutr i t ion programmes.
Nutrient Requirements and Metabolism
Nutr ien t requirements and metabolism can be studied in the following ways :
Determining the optimum amounts of calories and nu t r ien t s required for growth, and maintenance of physical and mental-well being. Food sources and cost will be de termined;
Effects of variables such as activity, stress and disease on the needs for special nutr ients and calories ;
Minimum and maximum range of nu t r ien t requirements for all stages of growth, maintenance of health and

n u t r i t i o n r e s e a r c h 71
reproduction. This information it needed by administ-rators, planners and agriculturists for planning targets of food product ion;
Effects of oral contraceptives on nut r ient requirements and utilisation ;
Effects of genetic variables in foods on nut r ien t needs and ut i l i sa t ion; and
Inter-relationships between various levels of different nu t r ien t s in meeting requirements.
Methods of assessing Nutritional Status
Simple methods are needed to assess the nutr i t ional s ta tus of individuals and population groups in the villages. Health is not only freedom from disease but a condition of positive, physical, mental and social well-being. For the a t ta inment of this goal, normal s tandards and targets must be identified. Norms are to be set as s tandard criteria of good nour i shment ; these must be dependable and valid. The following areas require special investigation :
Definition of nutr i t ional s ta tus and methods of its evaluation ; Relationship between physical, mental and emotional health
and nutri t ional s t a tus ; Refinement of methods for measuring nutr i t ional s tatus as
indicators of acute and sub-clinical nutr i t ional deficiencies; Evaluation of nutr i t ional s tatus of individuals and selected
population groups (rural, economically disadvantaged, nutr i t ional ly vulnerable groups, viz., pre-school children, expectant and nursing mothers) ;
Correlation of nutr i t ional s ta tus with dietary intake and other variables; and
Continuing investigation of all possible venues for improving the nutr i t ional s tatus of the population with special a t ten-tion to the needs of the disadvantaged segments of society.
Family Size and Nutritional Status
It has been shown that , for any given level of family income, among the low socio-economic groups, the larger the family size, the poorer is the nutr i t ional status.

7 2 n u t r i t i o n i n t a m i l n a d T T
An assessment of the probable impact of family planning on the nutr i t ional situation under the present levels of family income and food availability would be a valuable tool for an integrated social policy. If the successful implementation of the family planning programme would result in a significant increase in food availability and nutr i t ional status, the resulting gains would be taken into consideration in fu tu re planning.
Food Quality, Composition and Safety
The following aspects of quality, composition and safety of foods need to be studied :
The nut r i t ive value of many of the high yielding varieties of cereals and pulses have to be determined. These data will be useful in ident i fy ing varieties which are to be released to farmers for large scale cultivation ;
Standardisation of recipes for household use ;
Est imat ion of cooking losses ;
Development and refinement of methods for determining food composition of raw and cooked foods ;
Composition and nutr i t ive value of raw and cooked foods, their wholesomeness, palatability and cost of foods which are widely consumed and the new hybrid s trains of cereals and pulses ;
Development and evaluation of protein food supplements f rom local sources;
Factors affecting wholesomeness in storing, preparing, holding and serving food on home and inst i tut ional scales;
Effects of commercial food processing and packaging methods on final food quality, nutr i t ive value, safety and cost ;
Determining consumer needs and desires for food in new forms. Market for partially and ful ly prepared " ready to eat " foods ;
Relationship between extent of processing, market ing quality of final product , consumer acceptance and economics of utilisation in homes and feeding establishments ; and

n u t r i t i o n r e s e a r c h 7 3
Problems of adulterat ion of food. Consumers' role in solving these problems.
Food Patterns and Food Habits
Studies of food pa t te rns and habits of communities will include
Unders tanding values held by various population groups concerning food ; ways in which these values are mediated through food practices;
Methods of motivat ing people to modify eating hab i t s ;
Evaluat ing techniques which are effective in motivat ing people to change their eating pa t te rns ;
Est imation of distr ibution and use of misinformation about foods, methods of counteracting misinformation ;
Relationship between food and psychological and emotional needs ; and
Effects of sensory perception, psychological and environ-mental factors upon food acceptance and dietary habits.
Evolving Desirable Food Service Systems
In order to evolve desirable food service systems the following will be s tud ied :
Factors which determine the cost, acceptability and nut r ient contr ibution of meals in catering ins t i t u t ions ;
Role of dieti t ians in inst i tut ion management ; Standardised recipes for large scale cookery ; and Nutr i t ion education in hostels and hotels.
Ecology of Nutrition
Studies on ecological factors associated with nutr i t ion will include
Factors influencing food intakes. Identification of factors which determine food at t i tudes, preferences and practices with special emphasis on the social, cultural, religious and economic f ac to r s ;
Effects of short or long term nutr i t ional deprivation on different aspects of health and human capacities;

7 4 n u t r i t i o n i n t a m i l n a d T T
Relation between pre-natal nutr i t ion and early diet of the child, to mental and physical well-being throughout l i fe;
Relation between pre-natal nutr i t ion and subsequent health of the mothers ;
Nutr i t ion and infection ;
Nutr i t ion and working efficiency ; and
Economics of nut r i t ion (cost of malnutri t ion).
Methods Suitable for Nutrition Education
Methods suitable for nutr i t ion education can be examined through
An analysis of all the curricula of welfare, extension and educational programmes with a view to incorporating nutr i t ion education in them ;
Development and evaluation of curricula for different groups ;
Testing different methods singly and in combination for teaching nutr i t ion ;
Production and evaluation of nutr i t ional teaching aids and l i te ra ture ;
Assessing the effectiveness of innovative educational cam-paigns for disseminating nutr i t ion information ; and
Techniques for measuring the effectiveness of nutr i t ion education.
Testing Diets Prescribed in Indigenous Medical Systems
Diets prescribed in indigenous medical systems can be studied by
An analysis of the dietary prescriptions in indigenous systems of medicine; and
Est imat ing the effects of diets used in the indigenous systems.
Evaluation of Sponsored Nutrition Programmes
The impact of sponsored programmes such as the Applied Nutr i t ion Programme and those providing meals for infants , pre-school and school children, on their nutr i t ional s ta tus needs to be assessed.

NUTRITION RESEARCH 75
Research work in different ins t i tu tes h i s demonstrated that by creating awareness and motivat ing rural communities, effec-tive programmes of nutr i t ional rehabili tation could be organised and implemented by the village communities themselves, using local food resources with no dependence on outside support . Such efforts need to be widened and s t rengthened on a permanent basis.

CHAPTER IX
AN INTEGRATED APPROACH TO NUTRITION PLANNING FOR DEVELOPMENT
Tamil Nadu Nutrition Project
T H E Tamil Nadu Project on Nutr i t ion Planning for Develop-ment is designed to ident i fy and assess factors which have a bearing on child and maternal nutr i t ion. The findings of this s tudy will help to fix priorities while implementing the immediate and long term strategies for nutr i t ion intervention and development.
Analytical methods employed in this s tudy seek to investigate and establish the inter-relationships between agricultural produc-tion sub-systems, food processing and marketing practices on the one hand, and consumer food habits and the preference sub-system as related to the nutr i t ional intake of the target population in Tamil Nadu on the other. This will be the first time a " Systems Approach " is being made to the study of nutr i t ion in India. Upon completion, the concepts developed in this State investigation could be utilized with modifications throughout the country in planning for nutr i t ion development.
I t is expected tha t this systems approach to nutr i t ional planning will accomplish
The Development of a. data bank and a system of data pro-cessing and recovery, including information on three major food sub-systems—agricultural production, food processing and distr ibution, and the consumer participation—which will have continued usefulness in planning programme analysis and the evaluation of nutr i t ion operation proposals ;
The development of a " systems model " for food and nutri-tion in Tamil Nadu, adequate for the analysis of one or

n u t r i t i o n p l a n n i n g f o r d e v e l o p m e n t 7 7
more simple nutr i t ion intervent ion proposals, and capable of fu r the r development into a model and analytical metho-dology having broad applications in simulation exercises and predictive funct ions as well as in programme evalua-tion and as a support for decision making ;
Testing the early phase of the model and data system by analysis and evaluation of a number of proposed interven-tions which have been suggested, and the amendment of the data systems suggested by the experience gained in these t e s t s ;
To the fullest extent possible before the end of the project, the evaluation of existing feeding programmes and nutri-tion-related problems of concern to the several depar tments of the Tamil Nadu Government which are cooperating in the s tudy ;
Completion of two action-oriented sub-projects incorporated in the Work Plan, the " Take Home Food Test " and the " Continuous Processing and Distribution Demonstrat ion ". Completion of the latter includes product identification, acceptability testing and operational planning ; and
The t ransfer of the data bank and data processing technology to a newly created inst i tut ional setting, to make use of data regularly maintained and constant ly up dated. The Tamil Nadu Nutr i t ion Project, which has these objectives in view, is open ended and will modify its approach and methodology in the light of circumstances and new know-ledge generated in the course of the s tudy.
I t is conceived as an analytical and planning s tudy with the expectation that , if contemplated successfully, it would lead rapidly to feasible, well-planned intervention projects based upon critical selection from among various options disclosed by the s tudy.

CHAPTER IX
INTER-DEPARTMENTAL COLLABORATION IN NUTRITION PROGRAMMES OF THE FUTURE
NUTRITION is a multifaceted discipline, intimately related to agriculture, animal husbandry, fisheries, health, education, rural development and social welfare. Therefore all the Depar tments dealing with these subjects have a vital role to play in coordi-nat ing nutri t ion activities and fur ther ing the goals of nutri t ional programmes.
Agriculture, Animal Husbandry and Fisheries
The Departments of Agriculture, Animal Husbandry and Fisheries will
formulate production plans and targets based on nutr i t ional needs, in collaboration with the Department of Nu t r i t i on ;
encourage farmers to increase quality, and quan t i ty in food production by giving them incentives such as a " nutr i t ion premium ";
test new varieties and strains for nutr i t ive value and accep-tability before release for large scale cultivation, taking the help of the Department of Nutr i t ion and local home science colleges;
appoint nutrit ionists on the governing bodies of agricultural universities, councils and boards;
promote household gardens, poultry and livestock uni ts and pisciculture; and
supply milk and milk products and eggs at concessional prices to school canteens.
Education Department
The Education Department will

n u t r i t i o n p r o g r a m m e s o f t h e f u t u r e 7 9
introduce topics on nutr i t ion in the curricula at all levels of education, including that for teacher t raining ;
scrutinise science text-books for topics in nutr i t ion for authent ic i ty and bring out new books on nutr i t ion ;
increase the number of children fed in the Midday Meals Scheme. Interest College P lanning Forums, Rotary Clubs, Social Service Associations and National Service Corps to assist the School Midday Meals Programmes by raising f u n d s ;
organise sale of good milk for hostels and canteens on a non-profit basis;
insist tha t dieti t ians should be in charge of large catering inst i tu t ions like hostels ;
produce films on nutr i t ion ;
maintain health and nutr i t ion records in schools on cumula-tive basis ;
allot marks for the health s ta tus of pupils in internal evaluation ; and
urge colleges and universities to take up s tudy of nutr i t ion projects.
Public Health Department
The Public Health Department will
employ dieti t ians in large hospitals ;
map out the areas where malnutr i t ion is highly prevalent and organise ameliorative measures on an emergency foot ing ;
give orientation in nutri t ion in the t raining of medical and para medical personnel ;
enforce food laws effectively ; and
organise a ' Nutr i t ion Week ' along with related drives for Family Planning, etc.
Rural (Community Development) Development Department
The Rural Development Department will under take to

8 0 n u t r i t i o n IN t a m i l n a d T T
give in-service training in nutr i t ion to all func t ionar ies ;
organise intensive nutr i t ion drives in conjunction with cam-paigns for Family Planning, Small Savings and increase kitchen gardens and poultry uni ts ;
publicise low cost nutr i t ious recipes;
use mobile nutr i t ion un i t s for nutr i t ion education ; and
establish community food preservation and baking centres.
Social Welfare Department
The Social Welfare Department will
organise nutr i t ion education on activities in Mahalir Manrams and young women's c lubs ;
organise competitions in production, food storage, cooking and food preservation ;
promote nutr i t ion education in all welfare and relief acti-vities ; and
depute all field workers for refresher training in nutr i t ion.

CHAPTER IX
EVALUATION O F NUTRITIONAL P R O G R A M M E S
EVALUATION is a process of arriving at a considered judgment , and is essential to planning and implementing programmes!38). Fundamenta l ly , the purpose of a programme is the focal point of i ts evaluation ; to achieve the purpose, specific objectives mus t be s e t ; to at tain the objectives definite goals must be reached. The purpose of the Tamil Nadu Depar tment of Nutr i t ion is, dur ing the next twelve years, to improve the nutr i t ional s tatus of the population, especially tha t of the most nutr i t ional ly vulner-able groups. This purpose has been indicated by five parameters defining the present state of nutr i t ion in Tamil Nadu. Four of the parameters clearly suggest broad objectives to be met, and goals to be reached annually, in order to at tain definite nutr i -tional improvement in the twelve-year period.
The first parameter is the consumption of calories, protein and other nu t r ien t s by the different segments of the population. The average daily consumption of protein and calories in Tamil Nadu is 36 grams and 1498 respectively. A broad objective would be to increase the consumption to the s tandard allowances suggested—44 grams of protein and 2400 calories dai ly—during the next twelve years. The goal to achieve the objective might be an increase of •§ of a gram of protein and 75 calories each year. The data given in Table 2 on the present levels of intake of calories and nut r ients can be used for formulat ing definite objectives and goals of nutr i t ion programmes for specific vulnerable groups.
Similarly, the third parameter—heights and weights of children—can be used to form objectives and goals for improved growth acceleration over a given period of time, by sex and age from bir th through adolescence. Weight for height and age of women might be another indicator for evaluation.
N—6

8 2 n u t r i t i o n i n t a m i l n a d T T
The final parameters stated are the relationship between malnutri t ion and child morbidity and mortal i ty. The appropriate tables of data show that the objective of reducing these rates is imperative. Still bir th, premature birth, and maternal mortali ty are rates that urgent ly need to be reduced. Their reduction, too, might be a specific objective, with feasible goals to be achieved annually.
An independent coordinating administrat ion, " Nutr i t ion Department " has been suggested to bring an integrated approach to problems of nutr i t ional improvement. Five Divisions are in-cluded in the plan of administrat ion ; each will require uniform evaluation of specific goals and objectives, and each must select the most appropriate indicators for evaluation, depending upon the activities and changes to be measured.
Criteria f requent ly used for measuring effort or activity include t ra ining of personnel ; preparation of educational mater ia l ; participation in various activities, clinics, garden projects, clubs, feeding programmes, demonst ra t ions ; the percentage of the population served; the quanti t ies of food consumed; seeds distr ibuted and gardens established ; increase in food production and information offered to the public. These measurements become more precise and meaningful if taken at the beginning and throughout the programme routinely, in a uniform way and over a period of time sufficiently long for careful examination of the results (39).
Direct or indirect measurements of change related to food practices require a long period of time. Criteria generally used a r e : changes in mortal i ty and morbidi ty statistics, anthropo-metric and dietary changes, changes in a t t i tudes towards food, changes in nutr i t ional knowledge and nutr i t ional status, changes in food production and distribution, changes in food handling and food preparation practices, and requests for fu r the r nutr i t ional services (39).
The methods and procedures for obtaining data for evaluation inc lude: analysis of statistics—health, agriculture, trade and commerce, employment—interviewing and vis i ts ; records and repor t s ; observation of markets, eating places, changes in

i
e v a l u a t i o n o f n u t r i t i o n a l p r o g r a m m e s 8 3
at t i tudes and food pract ices; taking of antnropometric, dietary and clinical data, t raining of personnel and number of the population served (s9).
Many of the criteria, methods and procedures mentioned above can be and have been used for evaluating nut r i t ion education as such (J0). Successful methods and aids used in teaching need careful and detailed documentation in order to share the results and findings with the rest of India and other countries. Lack of coordination and publicity has often prevented the ful l exploi-tat ion of successful methods and aids used in nutr i t ional education. The Divisions of Education, Extension and Publica-tion, and of Evaluat ion planned to be included in the Depar tment of Nutr i t ion will cooperate to prevent such situations.
In order to achieve uniformity in such a diversity of criteria, methods and procedures for evaluation, a tabular presenta-tion pro forma of formal evaluation is outlined. I t can be readily adjusted to most of the data likely to be used in the assessment of nutr i t ional programmes.
O u t l i n e of P r o f o r m a for E v a l u a t i o n of N u t r i t i o n a l
P r o g r a m m e s
Period (1 to 12) from the month of 19 to 19
Report from (name) date Place
I. Vital statistics : Objectives : Reduction of
rates of Neonatal mortality Infant mortality Child death (ages) Maternal mortality
Baseline Data
Target for Period of
Report Achievement
of Targets
(Number and percentage of target of achi-evement)

8 4 n u t r i t i o n i n t a m i l n a d T T
Stil l births Premature births Birth rate Morbidity rate Malnutrition diseases
listed
II . Nutritional Status
(of target groups)
III . Anthropometric measure-ments :
(Length or height and weight by age and sex.)
Percenti le a t ta inment of standard of target groups
IV. Food Production:
Objectives : To increase the number of
(a) Kitchen gardens School gardens Community gardens Home gardens
(b) Type of fruits and vegetables grown
Green l ea fy vegetables Carrots Pumpkin Tomato Citrus fruit P ineapple Guava Mango P a p a y a Other vegetables Other fruits
(c) Poultry units School Community Home
(d) Egg production School Community Home

e v a l u a t i o n o f n u t r i t i o n a l p r o g r a m m e s 85
V. Food Consumption: Objectives: To increase number/attendance/days
.3 £ (B) (C) (A) (A) (B) (C)
(a) Feeding programmes (by type and target group)
Percentage Attendance of Partici-pants
( D ) 1 0 0 % 75-99% 50-74%
Objective : To control or increase quantities of foods served in feeding
Quantities of Targets
foods served
Achievement of targets
programmes
(b) Types of feeding programme
VI . Training an.£ Education :
1. Long-term staff train-ed
2. Short-term staff train-ed
Nutritional No. of No. of curricula institutions students
Integrated nutrition in schools
Home science in high schools
Inservice teachers' train-ing
VII . Changes in food habits Dietary surveys

CHAPTER XI I
F O O D — A D U L T E R A T I O N AND CONTAMINATION
T H E basic r ight of people to adequate diets must be equal to their r ight to safe food if the nutr i t ional s tatus of the population is to be materially improved. Without proper precautions, food may become a hazard to health through adulteration, contamina-tion, spoilage and putrefact ion. Of these, adulterat ion must be totally eradicated, and the other evils minimized or prevented.
Fraudulent Food Practices
The Consumer Guidance Society of Bombay staged an exhibition in March 1971, showing many kinds of food adul-terants, f raudulent weights and measures, and foods most commonly adulterated, which comprise 33 pe rcen t of foods eaten in India today (!).
Common adul terants of food include the deliberate addit ion of sand, grit, dirt , waste products, such as used tea leaves, and cheap " foreign " starch to cereals, pulses and spices, also water to milk and curds, in order to make up the required weight or measure of the food tha t is adulterated. Another practice is removing fa t illegally from whole milk and its products to the detr iment of their quality.
Criminally harmful food adulterat ion practices include adding powdered glass to sugar and sa l t ; combining mobile oil or argemone oil with edible oil ; incorporating iron filings with suji (ravai) and kesari dlial with lent i l s ; mixing horse dung with spices, and using unsafe and prohibited compounds for colouring foods. Metanil yellow, sometimes used illegally for colouring laddus and barfis might cause cancer in the con-sumer, as might argemone oil and splintered glass. Dulcin, wrongly used for colouring sherbet, and coal-tar dyes used for reddening betel nu t in pan, are poisonous with a cumulatively

f o o d — a d u l t e r a t i o n a n d c o n t a m i n a t i o n 87
adverse effect 011 the eater. Kesari dhal contains a toxin capable of causing lathyrism, which may result in permanent paralysis of the legs.
Legal Prohibition of Adulteration
Laws exist to prohibit f raudulen t food practices in India. Tamil Nadu was one of the earliest States to legislate against food adulteration in the Madras Prevent ion of Food Adulteration Act of 1918. The Act provided for the inspection and control of food offered for sale. Food s tandards were set, the post of public analyst was established and procedures for enforcing the Act were stipulated. The Madras Prevent ion of Adulteration Rules of 1932 modified the Act of 1918, and empowered sanitary inspectors and health officers of local governing bodies to inspect food markets and to collect food samples for analysis (2).
Legislation of Madras State in prohibit ing f raudulent food practices was a forerunner of the Prevention of Food Adulteration (PFA) Act of 1954 for All India. The Act provided for deterrent punishment of offenders, and prohibited the manufacture, import and sale of adulterated food. I t envisaged the sett ing up of the Central Committee of Food Standards and the Central Food Laboratory, Calcutta, which were established in 1955. The former advises the Central and State Governments on adminis-trat ive matters arising from the Act. The Central Food Laboratory carries out research on food s tandards and on methods of detecting food adulterat ion. I t is advised by sub-committees on the standardization of foods and on amendments necessary to PFA Rules (3). The PFA Act of 1954 was amended in 1965, making the puni t ive measures somewhat stricter.
At present, Tamil Nadu has 290 local governing bodies and the Corporation of Madras to enforce the PFA Act in their localities. All sanitary inspectors are responsible for periodic collection of food samples for analysis. Analyses are made either in the Government Analysts ' Laboratory at the King Ins t i tu te , Guindy, or in the Public Analysts ' Laboratory of the Madras Corporation. An analysts ' laboratory has recently been started at Coimbatore on the lines of the King Inst i tute .

88 n u t r i t i o n i n t a m i l n a d T T
Intensified Efforts Required
The number of food laboratories in Tamil Nadu is completely inadequate. Many more regional and district laboratories are required with better facilities than those existing in the establish-ed ones. A sufficient number of personnel should be trained as food inspectors and employed in every food market and local adminis-trat ions of Tamil Nadu. At present the machinery for enforcing the PFA Act barely covers a third of the State. The machinery for the control of food production centres which do not seek voluntari ly s tandards certification of their products, and eating houses in urban and rural areas needs to be s t rengthened considerably.
The present penal ty for offenders against the PFA Act, of a fine and not less than five months ' imprisonment, is too lenient for habitual offenders who may have caused disease or death to consumers. A repeated offence should be punished by with-drawal of the food trading licence for prolonged periods or for life, depending on the seriousness of the crime.
Legislation and punishment are not ideal ways of r idding society of evil practices. Each citizen should take an active part in their eradication. In the case of food adulterat ion, public apathy and ignorance hamper governmental agencies in work connected with health, hygiene, food and drugs. A well-informed and watchful public can aid the government in the detection and prevention of food malpractices and can provide ideas and incentives for the improvement of food handling and quali ty. Nutr i t ion and health education in schools can produce awareness in the educated classes and can lead to rationalization of eating and disposal habits and can do credit to the maxim of the hygienic home. The education campaigns directed at the citizenry can likewise, if they succeed in breaking through apathy, only lead to consumer resistance. In a developing economy, re turns from food processing industr ies are among the highest and a great factor in the stabilisation of demand for the surplus products of the G.M.F. and Green Revolution campaigns. Public health preferences should not act as a deterrent against small-scale and proprietorial kind of marginal enterprises where small cost increments can fatal ly magnify competitive differentials.

f o o d — a d u l t e r a t i o n a n d c o n t a m i n a t i o n 8 9
Communication techniques must take ac count of this. The maxims of public health should, therefore, be embodied and institutionalized in constructive t ra ining in food production and distr ibution trades and in deterrent legislation enforceable by local authori ty . Enforcement machinery and analysts ' laboratory facilities are more important at the local au thor i ty level.
Most consumers can recognize obvious adulterants , such as sand and dir t in food, but the more ingenious types are difficult for the lay public to detect. The consumer must be kept informed of current food adul terants and constantly reminded to report offences through recognized local channels. Tamil Nadu requires a non-profit making, voluntary organization, such as the Con-sumer Guidance Society of Bombay, with branches in every district , town and block of the State. Members of the organiza-tion would be responsible consumers, for whom consumer education would be part of membership. Consumer education would include knowledge of addit ives permit ted in foods for their enrichment, preservation and consumer appeal, and of the dangers and prevention of food-borne diseases and food poison-ing. In a competitive multi-firm economy, they can provide a technical guidance service for consumers by which choice can be based on objective criteria as well as personal preferences.
With public vigilance and intensified governmental action, food adulterat ion could become a crime of the past in Tamil Nadu. Then efforts to improve food production and eating habits would become worthwhile and rewarding. By itself, legislation can only be a tardy means of upgrading s tandards of public behaviour.
The efforts of improved food production and consumption and the banishment of food adulterat ion can be of maximum benefit to the nation only when food-borne diseases, intestinal parasites and food poisoning are not allowed to debilitate the health of the public. \
Communicable Diseases
Of more than 60 communicable diseases, at least 25 are asso-ciated with food and can be prevented. The causal micro-organisms reach the human host by direct or indirect transmission

9 0 n u t r i t i o n i n t a m i l n a d T T
from a sick person or a carrier, or through consumption of food or water contaminated by insects or animals or by eating food from diseased animals (4).
Transmission by humans can be prevented by isolation of pat ients with infections, through precautionary measures when treating the pat ients and af ter recovery, immunization, periodic examination of food-handlers in public eating places, and by strict personal cleanliness of all food-handlers and the general public.
Transmission of communicable diseases bj ' water can be prevented by purification of water supplies and protection of water sources by proper sewage disposal. The lat ter includes adequate sani tary facilities in homes and public places, and edu-cation in their proper use. A proper beginning can only be made when the provisions against the commission of nuisance in public places are enforced.
The transmission of disease by insects and animals can be eliminated by control of breeding places, prevention of animal and insect en t ry into the premises of eating places and food distr ibution centres and the destruction of rodents and harmful insects which contaminate food supplies.
To prevent transmission of disease by food, conditions in which food is produced, t ransported and stored must be strictly supervised. The conditions include adequate food storage, equipment, services and personnel, animals involved and all the modes and stages of distr ibution. All food stuffs in public places should be regularly inspected and suspected items destroyed at once. Milk and dairy products should be pasteurized and all stages between pasteurization and consumption should be carefully controlled to prevent recontamination.
Parasites
The disease-causing micro-organisms associated with food are as harmful to health as intest inal parasites that lay eggs in human or animal faeces, and pass into human hosts as eggs or larvae depending on the species. Common parasites are round-

f o o d — a d u l t e r a t i o n a n d c o n t a m i n a t i o n 9 1
worms, tapeworms and flukes that take up -esidence within the unprotected body and set up conditions of varying severity, all of them debilitating to the host.
Basic prevention of intest inal parasites consists in sanitary disposal of excreta, elimination of soil pollution around dwelling places, and strict personal hygience. Protect ing the feet and the skin f rom infestat ion by parasites, and adequate cooking of meat and fish, are also precautions not to be disregarded.
Bacterial Food Poisoning
Methods of preventing food-borne diseases and intestinal parasites are equally applicable to the prevention of bacterial food poisoning. This may be described as an acute attack of abdominal pain and diarrhoea, often accompanied by vomitt ing, developing within 2 to 36 hours of eating contaminated food. The major causes of bacterial food poisoning are staphylococcal toxin, and a miscellaneous group of bacterial infections and in toxins caused by the contamination of food by a number of different organisms (5).
The miscellaneous group of bacteria causing food intoxins and infection come mainly from insani tary sewage disposal and unhygienic habits of food-handlers. Wi th proper sanitation and personal hygiene, food would not be exposed to contamina-tion by bacteria.
Staphylococcal food poisoning occurs more rapidly than others caused by bacteria. I t s durat ion is shorter and the symptoms may not be too severe. I t is a common food poison-ing usually derived from food-handlers. Harmfu l staphylococci may be t ransmit ted to food in droplets f rom the nose or throat or b}? the hand from boils, cuts and other skin lesions of infected people. Though the organism is easily destroyed by heat, unfor tunate ly , the toxin it produces is heat-stable. Unprotected food in a warm, moist kitchen is an ideal place for the organism to grow and produce toxin, which no amount of cooking can destroy. Foods most vulnerable to this kind of poison are cooked foods, such as processed meat, canned foods left in open containers, pastries containing cream or custard or meat, sauces
v and gravies, cooked curries and root crops eaten cold, and exposed " l e f t -overs" for reheating.

9 2
I
n u t r i t i o n i n t a m i l n a d u
Prevention of food poisoning depends upon the observance of sanitary conditions of food from its production to i ts consump-tion. Temperature, moisture and time are vital factors in food protection. Bacteria cannot grow without moisture and food. The most favourable temperature for bacterial growth ranges from 14°C to 40°C. Most bacteria are destroyed at higher tempe-ratures, and lower ones inhibit bacterial activity. The length of time over which food is exposed to contamination is important since a single bacterium can produce over two million bacteria in a few hours of favourable conditions. The higher the bacterial count the more severe is the poisoning (4).
The essential factor of strict personal cleanliness in prevent-ing adverse consequences from contaminated food must be stressed in all programmes of health, nutr i t ion and consumer education. This is of vital importance in India where many people use their hands for eating, so the majori ty of the popula-tion are in that sense food-handlers.
Food Spoilage
Harmfu l micro-organisms causing disease and poisoning are particularly dangerous in that they mark food in no evident manner . Other micro-organisms and enzymes leave signs of their activities by obvious change in appearance, smell or taste. Some of the changes are beneficial and are used in food processes such as making curds, cheese and read3'-to-eat meats. Other enzymatic and microbial activities are undesirable if unwanted and uncon-trolled. Enzymes accelerate the sett ing in of rot in f ru i t s and vegetables unless inhibited ; micro-organisms pu t r e fy meat, fish and eggs, sour milk, ferment inefficiently canned or bottled f ru i t s and vegetables.
This type of food spoilage, which can be detected by smell, sight and taste, though less dangerous than food contamination undetected by the senses, is wasteful of food, money, time and effort, as spoilt food must be thrown away. It is chiefly perish-able foods, having a relatively high moisture content, tha t are spoilt in indiscernible ways. Their care in storage should form par t of the basic education of food-sellers, food inspectors and consumers alike.

f o o d — a d u l t e r a t i o n a n d c o n t a m i n a t i o n 9 3
Chemical Food Poisoning
Apart from the pitfalls of adulterat ion, spoilage and conta-mination, foods must be protected from chemicals used in various stages for preservation and as insecticide from their production to consumption.
Through careless storage and use, arsenic and other compo-nents of rat poisons have appeared in confectionery and other food stuffs. Arsenic, sprayed on f ru i t s and vegetables as a pesti-cide, may leave a residue, poisonous when imbibed. The presence of arsenic, too, has been reported in paper, waxpaper, t in and aluminium foil used to wrap food (4). Sodium fluoride used against cockroaches and in insecticide sprays may contaminate f rui ts , vegetables and food in storage. The dry compound is dangerous, unless cautiously stored, as it could be mistakenly used for flour, baking powder or milk powder with disastrous consequences.
Other chemical hazards include zinc poisoning from acid f ru i t s and their juices left in exposed galvanized or plated con-tainers, and from rain-water collected in galvanized tanks ; copper poisoning from meat cooked or canned in copper containers and from copper dissolved in acid liquids and carbonated beverages ; lead poisoning from the metal dissolved by soft water and acid foods and dr inks in contact with lead piping or plated and soldered cans and equipment. Antimony, extracted by foods cooked in poor quali ty enamelware and cadmium from cadmium-plated food containers, have also poisoned consumers (4).
Antibiotics, if used in excess of allowances for preserving poultry, or in accidental contact with stored foods, can cause considerable sickness, as can excessive amounts of sodium and potassium nitrates used in curing meat. E thy lene dioxide, hydrocyanic acid gas and methyl bromide, used to fumigate storerooms, can cause serious harm to people and animals unless used with due precaution.
The chain of events for consumer protection from chemical poisoning, s tarts with food and drug authorit ies setting standards for the use of permissible pesticides and fungicides in speci-fied, safe amounts. Government machinery for enforcing the

9 4 n u t r i t i o n i n t a m i l n a d T T
standards and for controlling the use and storage of crop-protec-tion chemicals should include agricultural supervisors and sanitary inspectors. Education of the public in these matters should be the responsibility of extension, health and consumer guidance personnel.
Endogenous Poisoning
In addition to chemical compounds and micro-organisms causing food poisoning, illness can result from eating foods con-taining natural compounds that are toxic unless neutralized, or from eating foods poisoned by fungi dur ing harvest or storage.
Certain species of fusarium, when growing in grain before harvest, produce compounds harmfu l to man and animals and ergot on grains, especially rye, can cause ergotism which restricts blood circulation, if the infected cereal is eaten. A careful inspection of grain dur ing harvest and dry conditions of storage are necessary to protect cereals from such field fungi.
Numerous storage fungi are likely to be present in the air and dust or grain-storage warehouses. If the grains are insuffi-ciently dry and the storage temperature is too high, storage fungi will invade the grain to produce damage and decay, rendering the grains unusable for food or feed (6).
The moisture content of grains and g roundnuts dur ing harvest and storage exposes them to Aspergillus—flavus, which produces aflotoxins poisonous to man, birds and animals. Food infect ions carried by oilseeds and vegetable oils have caused health hazards in other countries. Preventive health care in India should concern itself with the identification of diseases caused by or t ransmit ted through edible oils peculiar to this country.
Practically all seeds of leguminous plants contain toxins that interfere with digestion if eaten raw. For tunate ly , the seeds are generally cooked as pulses before eating and the process destroys the anti-digestion toxins. Broad-beans (Vica flavia) contain another compound that may cause Favism, a severe hemolytic anaemia. Cooking makes the bean safe for the majori ty of people, but fresh, young broadbeans are tempting to eat in salads or when

f o o d — a d u l t e r a t i o n a n d c o n t a m i n a t i o n 9 5
being prepared for cooking. A number of people are allergic to raw broad-beans, but are not harmed by the cooked form. A few unfor tuna tes are allergic to cooked and raw broad-beans, to the pollen of broad-bean flowers and to milk from cows that have grazed on or near broad-beans (7). Health authori t ies in parts of India, including the temperate zones of Tamil Nadu, where broad-beans are grown, should warn the public of dangers associated wi th this crop.
More dangerous to Indians than broad-beans is the Lat l iyrus Pea, (Lathyrus sativus), commonly known as kesari dhal and previously mentioned as an adul terant of rnasur dhal, which it resembles. La thy rus peas contain a toxin that may cause lathyrism in i ts consumers, resulting in spastic paralysis of more severe cases. Normal cooking methods do not destroy the poisonous compound, though soaking the pea af ter harvest followed by sun-drying has lessened its toxicity. The pea grows in drought conditions impossible for other crops. I t s danger as food is common knowledge, yet kesari dhal will be eaten in times of famine in preference to starvation. Agricultural experts urge the cultivation of peas and beans, other than the la thyrus pea, which, through improved technology, can withstand drought . Public Health measures in Tamil Nadu prohibit the sale of both kesari and masur dlials.
Several foods commonly eaten in Tamil Nadu contain poisons tha t are usually rendered harmless by local methods of food pre-paration. Here again, there is scope for research organized on the basis of pat ient case study which can be traced back to the disease-causing elements in food. These could be usefully orga-nized under the aegis of municipal authori t ies in the large urban or metropolitan cities (which have special machinery for dealing with contaminants originating in imports) or under consumer associations. Much work done by the Indian Council of Agricul-tural Research on toxins in natura l chemical products is available for fu r the r applied use.
Pests of Cereals and Pulses
Although cereals and pulses are staple foods of India, their protection dur ing harvest and storage is far from sufficient. They are exposed to onslaught by rodents which invade warehouses

9 6 n u t r i t i o n i n t a m i l n a d T T
and feed on grains meant for human food or animal feed. They, and their excreta on foods, t ransmit disease and poison to un-protected consumers. In addition, certain insect pests cause considerable harm to grains, flour and other foods in storage.
The rice weevil, Sitophilus calandra oryzae, can breed in any cereal grain. Each egg of the weevil is laid in a hole bored in a grain and sealed with a gelatinous substance as protective covering. The female lays four to five eggs daily and over 200 in her life-time. The larvae hatch in a few days and feed on the grains as they tunnel their way out, leaving excreta in their wake. The weevil develops most rapidly when moisture in the grain is 12 to 14 per cent. Under favourable conditions of mois-ture and temperature, two or three generations of rice weevils can destroy an enormous amount of grain stored in heavily infested granaries (8).
The lesser grain weevil, Rchizopertha dominica, is probably a worse menace to stored grain than the rice weevil, for it lives longer, lays more eggs daily and can breed a t higher tempera-tures and in drier conditions. Pea weevils, especially Bruchus chinensis, common in India, can destroy large quant i t ies of legu-mes while growing and dur ing storage. Many varieties of beetles choose stored meals and flour for breeding in preference to grains. The eggs they lay, being sticky, adhere to the flour and are hard to de tec t ; their larvae are appropriately known as "meal worms". A beetle pest, common in India, is Orzaephilus snrinamenisis that can crawl through t iny cracks and bore holes in stout cardboard in search of food. I t s appetite is enormous; it depletes food and nut r ien ts and spoils the taste and appearance (8).
To protect food and feed from pests, an adequate number of granaries and warehouses must be provided. The Central Ware-housing Corporation has constructed 77 Central warehouses and State warehouses in 16 States, each with a capacity of a third of a million tons of food. The Food Corporation, a s ta tu tory body established in 1965, purchases and distr ibutes staple food. In Tamil Nadu, the Food Corporation has a storage capacity for half a million tons of 80 different types of cereals. P lans for the fu tu re include increasing storage capacity to over 8 million tons, by the Warehousing and the Food Corporations and private

f o o d — a d u l t e r a t i o n a n d c o n t a m i n a t i o n 97
agencies (9). Wi th a population of 555 mi' l ions in India, and 41 millions in Tamil Nadu, food storage capacity is already inadequate without the expected population increase.
Even with enough warehouses, each must be proofed against rodents, and they and their habitats must be destroyed. Stores must be shelved well above the ground and with room for the free flow of air. Heat t reatment , or carefully controlled fumigation, is necessary for destroying insect pests. Good venti-lation is indispensable for control of temperature and moisture. Proper supervision of harvesting and storage processes is neces-sary for safe food control. Above all, a knowledgeable and vigilant public must aid the government in the protection of food. Through the strategies for nutri t ional improvement, the consumer must be sufficiently well-fed so as to refuse food that is spoiled, has deteriorated in quality and is teeming with weevils—which is not the case in Tamil Nadu at present.

ANNEXURE I
INTEGRATED NUTRITION FROM NURSERY SCHOOL THROUGH SECONDARY SCHOOL
General Objectives
(1) To motivate children to want to eat for their best growth, health and activity.
(2) To develop good food habits.
(3) To know the use and preparation of locally produced foods.
(4) To learn good food hygiene and safe food practices.
N U R S E R Y SCHOOL
Activities
(1) Conversations with children on foods they eat at their daily meals.
(2) Discussion with them on foods to eat tha t make a ' good ' breakfast , lunch, snack or supper. I l lustrate by any meals provided at school or if none can be provided, a class project is the provision of ' s a m p l e ' meals at school, cooked with the co-operation of the parents .
(3) The children bring news to school of any ' new ' food they have eaten at home and vice versa, bringing a sample, if possible.
(4) Children prepare real or imaginary foods with real uten-sils in a kitchen provided for them.
(5) Weights and heights are recorded periodically, and a sample chart is kept of each child's development. Discus-sions with parents and children on foods for growth.
(G) Children learn to wash hands and clcan teeth before and af ter meals.

i n t e g r a t e d n u t r i t i o n f r o m n u r s e r y s c h o o l 9 9
(7) Children bring f ru i t s and vegetables to school to wash and peel before eating and learn why this is necessary.
(8) Children have a model shop where they " buy " foods daily.
(9) Children learn songs, games and rhymes related to food.
(10) Stories are told about well-fed and poorly-fed children and animals.
(11) Food posters and pictures decorate the nursery school walls. Children paint and colour pictures of foods.
(12) Parent/ teacher discussions on the four basic food groups. Children's eating problems are discussed and solutions suggested by the group.
P R I M A R Y S C H O O L
All schools should be equipped with a non-spring balance and a measuring rod for taking weights and heights annual ly.
S T A N D A R D I
Concepts
(1) Living things, plants, animals and people need food every day.
(2) To grow strong and healthy, children need food, rest, exercise and cleanliness every day.
(3) Foods are not alike ; they differ in colour, shape, taste, texture and odour.
(4) Different foods can be grouped together ; some make us " g r o w " , some make us " g o " , some make us " g l o w " . Each day choose some foods from each group so that we can " grow ", " go " and " glow " every day.
Syllabus Teaching Aids and Activities
Regional Language:
Oral words : Pictures of foods, utensils, etc. with matching words.
Reading known words : Flash cards of words with pictures of foods.

ioo n u t r i t i o n i n t a m i l n a d T T
Pot-book wr i t ing:
Poetry, rhymes, songs:
General :
Arithmetic:
Counting :
Easy addition and sub-traction :
Art & Craft:
History:
Geography:
Nature Study:
Including names of foods, utensils, etc.
Related to foods and to eating. Children make up food rhymes to recite in class.
Il lustrated books and stories about foods. Prepare simple dramas and dances related to food habits, food preparation and harvesting, washing and peeling of food articles before eating, hand-washing, tooth-cleaning.
Teaching ari thmetic through eating and food interests.
Learn to count by charts. Wri te the numbers af ter counting on slate, book and black board.
Learn by " shopping" , paying and receiving change clue.
Draw, colour and cut out " f o o d s " . Keep a food " scrap book ".
Tell stories of ancient India ; Life and food habits of nomads and hunters. The coming of the Aryans with cattle. Agrarian life, use illustrated picture-books, flip charts.
Visit local parks, gardens and farms. Locate water supplies, observe path-ways, to and fro exits.
Observe and learn plants and berries that can and cannot be eaten. Grow seeds in the classroom.
S T A N D A R D II
Concepts (1) Animals and plants are useful to man. (2) Some animals give us food. Each kind of animal needs
its own food and drink. (3) Many plants give us food. Different parts of plants are
used for food.

i n t e g r a t e d n u t r i t i o n f r o m n u r s e r y s c h o o l 101
(4) We can plant in gardens, boxes and p o t j to grow our food.
(5) Foods we eat must be clean. Hands must be washed before and af ter touching food. Teeth must be cleaned af te r eating.
Syllabus
Regional Language.
Reading:
Dictation :
Arithmetic:
Art & Craft :
Teaching Aids and Activities
Include poems and prose describing foods, eating, seed-sowing and harvesting. Use cut-outs and pictures for illustra-tion. Children make up and recite their own poems on these subjects.
Select passages that contain description of festivals and what foods are eaten then. Read and illustrate food needs of animals, birds and fish.
Include names of animals and their young, and the names of foods they eat.
Counting, adding and subtract ing with two digits, using food charts and Khadigraph.
Counting by 5's, 10's, 20's by children as they line up to wash hands.
Notion of f rac t ions ; using whole and part of food cut-outs.
Uni ts of length : metres and centimetres, i l lustrated by the children's own heights.
Measure of capacity : litres, linked with measurement of milk and water.
Calendar : with festivals and their foods as " red letter " days.
Indian money : learned by " shopping " activities.
Colour pictures in outline of foods, farms and animals. Make clay models of vegetable, f rui t , etc.

102 n u t r i t i o n i n t a m i l n a d T T
History: Illustrated stories of the Vedas, pur anas, and epics, with emphasis on agriculture and home life.
Geography : Learn the map of India and the shape of the school and its grounds. List chief crops produced and animals reared in a region.
Nature Study: Observe the various stages of plant cultivation in local gardens and parks. Bring vegetables to school. Observe how much dirt is removed from them when washed.
S T A N D A R D III
Concepts
(1) Foods are eaten in natura l and prepared forms. The different forms add interest and variety to daily meals.
(2) Machines and utensils are used in food preparation.
(3) Places where foods are prepared have different names, e.g., mill, bakery, dairy, poultry unit .
(4) Dry foods last longer than fresh foods. Foods must be carefully stored so that they may last longer.
(5) Clean, safe food must be prepared and eaten in clean, bright places, by clean, neat people.
(1) Foods are prepared in a variety of ways for our daily meals.
(2) Food preparation can change the appearance, colour, shape, taste and texture of food.
(3) Foods must be well chewed before being swallowed.
(4) Bits of food stick to our teeth if we do not clean them af ter eating.
(5) For food preparation, we use different kinds of utensils and equipment. These must always be kept clean.
S T A N D A R D S IV & V
Concepts

i n t e g r a t e d n u t r i t i o n f r o m n u r s e r y s c h o o l 103
(6) Different preparations are called by different names: soups, curries, rotis, etc.
(7) Fresh foods can be bought at markets, cooked foods at bakeries, stalls and eating places.
(8) The cleanliness and neatness of people, places and equip-ment in connection with food is very impor tant .
(9) Foods are grouped into four basic groups. We must choose foods from each food group daily.
S Y L L A B U S Standard V Subject Standard III Standard IV
Regional Language Poetry & Prose : As in Standard II, but at progressively advancing levels. Reading: Grammar :
Writing composition :
English : Vocabulary :
Poetry: Reading &
writing : Grammar :
Arithmetic :
Art & Craft :
do. Nouns, verbs, singular and plural, tenses. All can be taught through foods and food preparation, etc. using Khadigraph, charts, flash cards.
Write on food l ikes and dislikes. W h y we clean our teeth and wash our hands.
Learn to write a menu, write about the school lunch.
Describe each food in the four basic groups. Describe how the foods are prepared.
Learn those words particularly needed for understanding the concepts above. Learn riddles and rhymes about foods. As Standard II at progressively advancing levels.
All can be taught through foods, etc., using Khadigraph cut-outs and words. Decimal system, weight, capacity taught by use of foods, multiplica-tion and division by planning shop-ping and meals for the family, time of day, hour, etc. by promoting the habit of eating at fixed times.
Draw and colour foods and make cardboard food models. Make a model farm or kitchen.
As Standard III at more advanced levels. Teach concept of lakhs through population and imports and exports. Buying and selling land, produce, animals. Averages and per-centage taught through the children's weights and heights. Areas by quantities needed for planting.

104 n u t r i t i o n i n t a m i l n a d T T
Subject History:
Geography
Nature study, agri-culture and health :
Standard III Asoka and his in-fluence on Hindu-ism and introduc-tion of vegetaria-nism.
Standard V European trades. Eas t India Co. Vast exchange of food habits. Disco-very of the New World-Slavery.
Standard IV Moslem Rule, Ak-bar the great. Shah Jehan. The enor-mous Moghul con-tribution to foods, customs and cul-ture.
Use flip charts and story book illustrations. Site of school, with Use of maps con- Geography
tinued. Home dis-tricts, India—air, sea, road and rail transport. Popula-tion and demogra-phy, 5-year plan of agriculture. Make a map of the school campus.
special reference to kitchen, dining room and in rela-t ion to markets, restaurants, mills , bakeries, etc. Ar-range vis i ts to these. Vis i t farms. Learn of food and fodder grown in regions. Irrigation and water supply. Learn about maps, physical features, c l imate, occupa-tions, trade and trade routes. Observe the kinds of foods that ani-mals need to eat. Visit flour mil ls and bakeries.
of I n d i a ; c l imate, vegetation, agri-culture, irrigation, fisheries, power resources, mine-rals. World trade routes.
Vis i t places where poorly fed and well-fed animals can be observed. Vis i t kitchens to note cleanliness and neatness.
Learn how decay-ing matter is used for food production. Learn foods inclu-ded in the four basic groups.
S T A N D A R D S V I - I X
Concepts
(1) Foods are made up of nutr ients . Each nut r ien t is diffe-ren t from the other.
(2) Each nut r ien t has a special job to do in the body. If the nu t r ien t is missing from the diet, its job in the body is left undone.
(3) Foods that supply the specific nu t r ien ts for giving the body energ}'.

i n t e g r a t e d n u t r i t i o n f r o m n u r s e r y s c h o o l 1 0 5
(4) Foods tha t contain proteins for building and repairing all par ts of the body. Types of protein-high foods, animal, vegetable.
(5) Foods that supply minerals ; iron for blood ; calcium for bones and teeth.
(6) Vitamins needed to help the body get energy from food, to use nut r ien ts for growth and repair, to protect the body from ill-health.
(7) Fru i t s and vegetables tha t supply vi tamins and minerals.
(8) Meaning of what const i tutes an adequate diet and how this can be obtained.
(9) Good and poor eating habits.
(10) The processes foods must undergo before our bodies can use the nut r ients . Food preparat ion, digestion, absorp-tion.
(11) Poor sani tary and hygienic habi ts lead to intestinal parasites and total waste of nu t r ien t s from food and nutr i t ional education.
(12) Good food habits, personal hygiene, and good food prepa-ration practices serve to prevent nutr i t ional deficiencies.
Syllabus
Subjects should be continued according to the syllabus, with emphasis on food and nutr i t ion wherever possible. Mathema-tical problems centred on foods ; history of wars, conquests, famines and immigration as ins t rumental in changing food habi t s ; social and economic development and its endowment of a country. Geography, with its climatic effects on agriculture ; economics, t rading and trade routes. Geography of hunger and of the well-fed.
Elementary Science :
STANDARD V I : Funct ion of nu t r ien t s in foods, taught by using Khadigraph, charts and graphs.
STANDARD V I I : The digestive system, with models and charts—food habits of animals, fish and birds.

106 n u t r i t i o n i n t a m i l n a d T T
STANDARD V I I I :
STANDARD I X :
Natural " food factories ", the cow, goat and buffalo as milkgivers. Birds as producers of eggs. P lan ts synergism with man ; their processing the elements into food. Nitrogen cycle in soil. The earth-worm in soil formation. Microbio-logy : use in food manufacture , curds, cheese, etc.
Food poisoning and food-borne diseases, The effect of food preparation nut r ients in food.
on
S E C O N D A R Y E D U C A T I O N — S T A N D A R D S X & X I
Concepts
(1) Nutri t ion as a funct ion in the life of all living creatures.
(2) Nutri t ion is necessary for maintaining all normal body systems.
(3) The science of chemistry is basic to nut r i t ion .
(4) Nutri t ion influences health and disease.
(5) Chemical changes occur in foods and to alter their size, shape, colour, texture, taste, digestibility, palatability and nutr ient contents.
Syllabus
Subjects taught as in primary education with nutr i t ional emphasis when possible.
Science: BOTANY
ZOOLOGY:
(1) Life and stages of growth of monocot, e.g., ragi, paddy, their nut r ient content .
(2) Life and stages of growth of a dicot e.g., sunflower, legumes, their nu t r ien t content .
(3) Soil : its formation, composit ion; its nutr ient requi rement ; i ts contribution to plant and animal production.
Natural history of animals, classification and habits, especially feeding habits.

i n t e g r a t e d n u t r i t i o n f r o m n u r s e r y s c h o o l 107
BIOLOGY AND The 9 systems of the body, human and animal, PHYSIOLOGY : with emphasis on heal th and nutr i t ional
aspects.
CHEMISTRY : Factors that induce chemical change. Acids, bases and salts. Hardness of water. Changes tha t occur when foods are cooked.
A T H R E E - Y E A R C O U R S E I N H O M E S C I E N C E F O R S E C O N D A R Y S C H O O L
Objectives
(1) To give fu tu re wives and mothers an unders tanding of efficient house-keeping and care of the family.
(2) To provide experience in skills needed for efficient house-keeping and family care.
Time : 3 hours a week for 3 years.
Allocation of T ime (in hours)
Subject I Year II Year III Year
Theory Practical Theory Practical Theory Practical
Foods and Nutrit ion 14 28 14 28 14 28 Hygiene , First aid.
Home Nursing 8 6 3 6 2 4 Home Management 5 10 4 8 4 8 Texti les , Clothing,
Laundry 7 22 4 20 4 22 Child Welfare 2 6 4 2 4 6 F a m i l y Relat ions 4 2 4 2 F a m i l y Economics 3 6 4 2
Tota l : 36 72 36 72 36 72
108 103 108
O U T L I N E O F F O O D A N D N U T R I T I O N
Objectives
(1) To gain a broader unders tanding of nutr ients , their func-tions and sources.
(2) To comprehend the nu t r i en t values of individual foods and of the basic food groups.
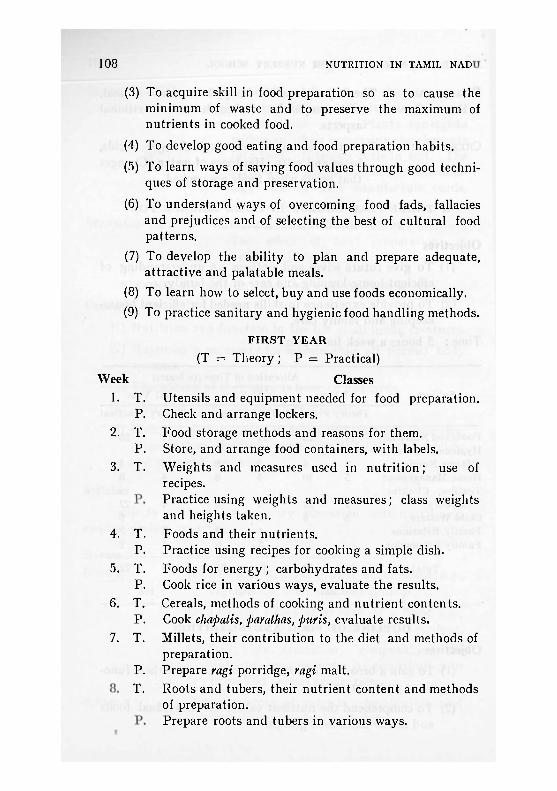
108 n u t r i t i o n i n t a m i l n a d T T
(3) To acquire skill in food preparation so as to cause the minimum of waste and to preserve the maximum of nut r ien ts in cooked food.
(4) To develop good eating and food preparation habits.
(5) To learn ways of saving food values through good techni-ques of storage and preservation.
(6) To unders tand ways of overcoming food fads, fallacies and prejudices and of selecting the best of cultural food pat terns .
(7) To develop the ability to plan and prepare adequate, a t t ract ive and palatable meals.
(8) To learn how to select, buy and use foods economically.
(9) To practice sanitary and hygienic food handling methods.
F I R S T Y E A R
(T = T h e o r y ; P = Practical)
Classes Utensils and equipment needed for food preparation. Check and arrange lockers. Food storage methods and reasons for them. Store, and arrange food containers, with labels. Weights and measures used in nu t r i t ion ; use of recipes. Practice using weights and measures; class weights and heights taken. Foods and their nutr ients . Practice using recipes for cooking a simple dish. Foods for energy ; carbohydrates and fats. Cook rice in various ways, evaluate the results. Cereals, methods of cooking and nu t r i en t contents . Cook cliapatis, paratlias, puris, evaluate results. Millets, their contr ibution to the diet and methods of preparation. Prepare ragi porridge, ragi malt. Roots and tubers, their nut r ient content and methods of preparation. Prepare roots and tubers in various ways.
Week 1. T.
P. 2. T.
P. 3. T.
4. T. P.
5. T. P.
6. T. P.
7. T.
P. T.

i n t e g r a t e d n u t r i t i o n f r o m n u r s e r y s c h o o l 1 0 9
9. T. The banana 's contribution to the diet and ways of using it .
P . Prepare banana milkshake, banana fr i t ters , banana chips.
10. T . P ro te ins ; funct ions in the body, classification, daily requirements, food sources.
P. Make a list of quanti t ies of specific foods to supply the daily requirements of protein for the class age group.
11. T. Pulses, their nu t r i en t content and methods of cooking. P. Cookery of grams and dhals.
12. T. Complementary aspects of proteins from one food served with proteins from another .
P. Cook iddlis, dosai, vegetable kedgree. 13. T. Eggs, their contr ibution to the diet and methods of
preparat ion. P. Egg cookery.
14. T . Nuts and how to use them. P. Make nu t cutlets, g roundnut chutney, groundnut milk.
S E C O N D Y E A R
Week Classes
1. T. The place of fish in the diet, classification. Nutr ient contents. Effect of heat on their s t ructure .
P. Fish cookery. 2. T. Minerals ; function in the body, food sources.
P. List the quant i t ies of foods to supply daily require-ments of iron and calcium for the age group of the class.
3. T. Meat, types and classification of joints. Structure of meat, effect of heat on the s t ructure and nut r ien t contents .
P . Meat cookery.
4. T. Milk and its unique place in the diet. Types and uses of milk.
P. Preparation of milk dishes. 5. T. Microbiology of milk and milk products. Milk-borne
diseases. Use of bacteria in making curds and cheese. P. Making of curds and cheese.

1 1 0 n u t r i t i o n i n t a m i l n a d T T
6. T. Methods of using cheese and curds in food preparation. P. Prepare channa cheese and other cheese dishes.
7. T. Vi tamins; fat-soluble vitamins, funct ions and sources. P. Preparation of green and yellow vegetables.
8. T. Water-soluble Vitamin C, funct ions in the body and food sources. Methods of f ru i t and vegetable prepara-tion to conserve the vitamin. Recommended allow-ances.
P. Make f ru i t and vegetable salads.
9. T. Water-soluble B Vitamins, thiamine, riboflavin, niacin, funct ions in the body, food sources, recommended allowances.
P. Make f ru i t and vegetable salads.
10. T. Other Vitamins of the B-complex group, funct ions and food sources.
P. Demonstrate losses of riboflavin in whey upon exposure to sun light. Losses of thiamine and niacin in milling. Discussion on preservation of vitamins in food prepa-ration.
11. T. P lanning nutr i t ious daily meals. Cost studies. Time and motion studies.
P. Plan a meal including methods and time for preparing each food.
12. T. Method of preparing snacks that contr ibute valuable nut r ien ts to the daily diet.
P. Preparat ion of nutr i t ional snacks.
13. T. Methods of preparing beverages tha t add to the value of daily meals.
P. Preparat ion of nut r i t ious beverages.
14. T. The need for an adequate breakfast and const i tuents of one.
P. Prepare nutr i t ious breakfasts.
T H I R D Y E A R
Week Classes
1. T. Food fads and fallacies, their effect on the diet. P. Prepare a meal for a family of four.

i n t e g r a t e d n u t r i t i o n f r o m n u r s e r y s c h o o l 11 1
2. T. Other factors that affect dietary habits. P. Prepare a picnic lunch.
3. T. Nutr i t ional needs in pregnancy and lactation. P. Prepare a day's meal for a normal woman with addi-
tions for pregnancy and lactation.
4. T. Nutr i t ional needs of the infant . I n f a n t feeding. P. Prepare food for in fan t s of various ages.
5. T. Nutr i t ional care of the young child. P. Prepare a day's meal for a young child.
6. T. Theory and practice of School Feeding Programmes. P. Visit a midday meal at school. Report on the visit.
7. T. Nutr i t ional needs in adolescence. P. Prepare a day 's meal for an adolescent boy and girl.
8. T. The aging process and nutr i t ional requirements. P. Prepare a meal for an old person.
9. T. Over weight and under weight, their danger and therapeut ic diets for them.
P. Prepare a reducing diet.
10. T. Constipation, prevention and diet therapy for it. P. Prepare diet to help cure constipation.
11. T. Types and causes of diarrhoea, nutr i t ional and dietary aspects.
P. Prepare a diet to alleviate diarrhoea.
12. T. Principles of diet therapy. Types of therapeutic diets.
P. Prepare a liquid diet for a pat ient with fever.
13. T. Therapeutic diets for home-nursing. Convalescent diets.
P. Prepare a convalescent diet.
14. T. " Let 's have a par ty ". P lanning and preparing for a par ty .
P. Give an end of school par ty.

1 1 2 n u t r i t i o n i n t a m i l n a d u
ANNEXURE II
CURRICULUM IN PRINCIPLES OF FOOD AND NUTRITION
(Basic Course for All College Students Majoring in Humanities)
[Total hours : 32. Lectures, (L): 16, Practicals or Demonstrat ions, (PD): 16.]
L. 1. Introduction: The meaning of nutr i t ion. Description of nu t r ien t s in foods and their general funct ions . Signs of good and poor nutr i t ion. The effects of daily meals on health.
L. 2. Sugars, Starches <§• Celluloses: Occurrence in nature. Funct ions in plants and animals. Chief food sources. Effect of heat on carbohydrates.
L. 3. Fats: How plants make oils and animals generate fats. Dietary sources, uses and abuses in food prepara t ion ; ebullition, f ry ing and decomposition points.
L. 4. Proteins: Occurrence in nature . Building blocks of proteins, essential and non-essential. Quality of dietary proteins, animal, plant and mixed. Funct ions of pro-teins in the body. Daily requirements. Meeting the daily requirements.
PD. (1) Methods of cooking rice and wheat. (2) Demonstrat ion of ebullition, f ry ing, and decomposition points. (3) Cook-ing potato and banana chips. (4) Egg cookery.
L. 5. Digestion of Food, Absorption of Nutrients: Organs of digestion and absorption. Definition of enzymes and hormones. Processes of digestion and absorption.
L. 6. Blood : Func t ions of blood in the body. Life of a red blood cell. Daily requirements and food sources of iron; factors affecting absorption of iron. Mention of other trace minerals.
L. 7. Bones and Teeth: The composition of bones and teeth. Food sources of calcium and phosphorus. factors affecting their absorption and utilization in bone forma-tion. Sources of Vitamin D. Mention of sodium, chloride and potassium.

p r i n c i p l e s o f f o o d a n d n u t r i t i o n 1 1 3
PD. (5) Methods of using milk in food preparation. (6) Prepa-ration of curds and cottage cheese. (7) Preparat ion of ragi malt and groundnut milk.
L. 8. Vitamins: Definition and classification. Occurrence of carotene and Vitamin A in nature . Funct ions of Vitamin A. Recommended daily allowances. Good food sources of Vitamin A and carotene. Mention of Vitamins E and K.
L. 9. Thiamine, Riboflavin and, Niacin: Diseases associated wi th these deficiencies. Funct ions in the body. Recom-mended daily allowances. Good food sources. Losses in food preparation. Mention of other B-complex vitamins.
L. 10. Vitamin C: Funct ions in the body. Description of deficiency leading to Scurvy. Recommended daily allowances. Good food sources. Factors affecting the Vitamin C content during harvest, storage and food preparation.
PD. (8) Preparat ion of salads. (9) Preparation of carrots, pumpkin and leafy vegetables. (10) Sprouting green gram.
L. 11. Factors Affecting Food Production, Distribution and Con-sumption : Effects of climate, geography, season, economy, trading, t ransport , education and politics on food produc-tion, distribution and consumption.
L. 12. Food Beliefs in India: Effects of religion, society, culture and beliefs on food habits and health.
L. 13. Food Hygiene: Description of micro-organisms. Benefi-cial micro-organisms in food processes. Food-borne diseases and infections. Methods of hygienic food hand-ling and storage.
L. 14. Planning Daily Meals: Use of food charts and guides. Food exchange lists. Economical marketing and food preparation.
L. 15. Diets for Women: Daily foods for a " n o r m a l " woman. Ext ras to include in times of pregnancy and lactation.
N - 8

1 1 4 n u t r i t i o n i n t a m i l n a d T T
L. 16. Feeding Infants and Children: Nutr i t ional needs of infants . Time to introduce new foods in baby 's diet, amount , type and texture of foods. Family meals by twelve months. Additions required by young children, school children and adolescents.
PD. (11-13) Plan and prepare a day 's food for an average woman with additions for nursing mothers. (14) Prepare in fan t foods for 3, 6, 9 and 12 months old infants . (15) Plan daily meals for children and adolescents. (16) Plan family meals.
A N N E X U R E I I I
CURRICULUM IN THE SCIENCE OF NUTRITION FOR COLLEGE STUDENTS IN SCIENCES
[Total hours : 32; Lectures, (L): 20 hours ; Practicals or Demonstrations, (PD) : 12 hours]
L. 1. Nutrient in foods: Nut r ien t composition of foods. General funct ions in providing energy and materials for growth and repair of the body and for regulating body processes.
L. 2. Composition of the body : Body fluid compartments and their measurements.
L. 3. Carbohydrates: Occurrence in nature, classification, chemistry, funct ions in the body, chief food sources.
L. 4. Lipids: Classification, chemistry and characteristics of fats, food sources and dietary uses. Phospho-lipids and cholesterol funct ions in the body.
L. 5. Proteins : Unique quality of proteins, chemistry, compo-sition and synthesis. Essential and non-essential amino-acids. Quality of dietary proteins. Calculating digestibility and biological values. Protein requirements. Effects of Protein undernutr i t ion .
PD. (1) Iodine test for starches, sweetness test for sucrose vs. glucose. (2) Saponification of fa t compared with non-saponification of mineral oils. (3) Action of cold a n j
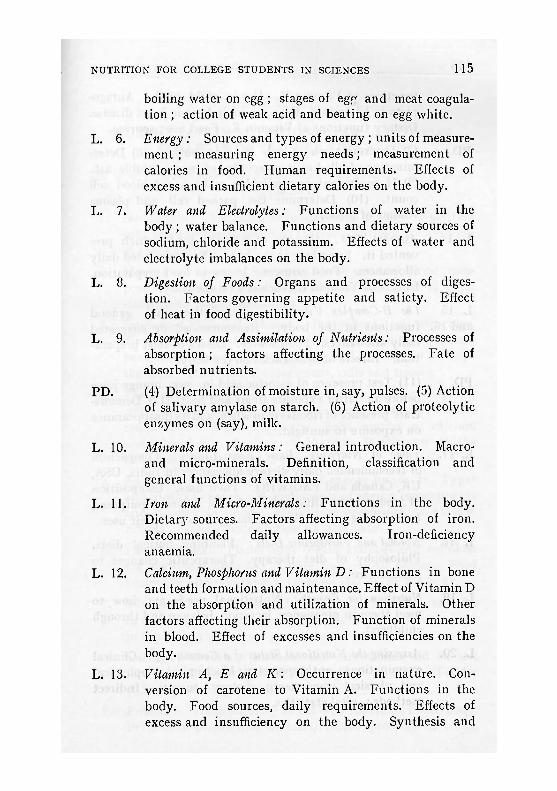
n u t r i t i o n f o r c o l l e g e s t u d e n t s i n s c i e n c e s 1 1 5
boiling water on egg ; stages of egf and meat coagula-tion ; action of weak acid and beating on egg white.
L. 6. Energy : Sources and types of energy ; un i t s of measure-ment ; measuring energy needs ; measurement of calories in food. Human requirements. Effects of excess and insufficient dietary calories on the body.
L. 7. Water and Electrolytes: Func t ions of water in the body ; water balance. Funct ions and dietary sources of sodium, chloride and potassium. Effects of water and electrolyte imbalances on the body.
L. 8. Digestion of Foods: Organs and processes of diges-tion. Factors governing appeti te and satiety. Effect of heat in food digestibility.
L. 9. Absorption and Assimilation of Nutrients: Processes of absorpt ion; factors affecting the processes. Fate of absorbed nutr ients .
PD. (4) Determination of moisture in, say, pulses. (5) Action of salivary amylase on starch. (6) Action of proteolytic enzymes on (say), milk.
L. 10. Minerals and Vitamins: General introduction. Macro-and micro-minerals. Definition, classification and general func t ions of vitamins.
L. 11. Iron and Micro-Minerals: Funct ions in the body. Die tar j ' sources. Factors affecting absorption of iron. Recommended daily allowances. Iron-deficiency anaemia.
L. 12. Calcium, Phosphorus and Vitamin D: Funct ions in bone and teeth formation and maintenance. Effect of Vitamin D on the absorption and utilization of minerals. Other factors affecting their absorption. Funct ion of minerals in blood. Effect of excesses and insufficiencies on the body.
L. 13. Vitamin A, E arid K : Occurrence in nature. Con-version of carotene to Vitamin A. Funct ions in the body. Food sources, daily requirements. Effects of excess and insufficiency on the body. Synthesis and

1 1 6 n u t r i t i o n i n t a m i l n a d T T
funct ions of Vitamin K. Use in child birth. Antago-nists to Vitamin K, their use in ischaemic heart disease. Dietary funct ions of Vitamin E. Food use ; sources.
PD. (7) Determination of ash in, say, pulses. (8) Deter-mination of alkalinity or acidity of water-soluble ash. (9) If equipment is available : make a red blood cell count. (10) Determine the packed cell and plasma volume of blood.
L. 14. Ascorbic Acid: History of Scurvy, foods which pre-vented it. Funct ions in the body. Recommended daily allowances. Food sources; losses in food preparation. Effects of Vitamin C deficiency on the body.
L. 15 The B-Complex Vitamins: Description and general and 16. funct ions in the body. Recommended or suggested
daily allowances. Food source. Losses in food prepara-tion. Effects of deficiencies on the body.
PD. (11) Test presence of ascorbic acid in, say, orange juice before and af ter exposure to air and heat. (12) Demons-trate presence of riboflavin in whey, and its disappearance on exposure to sunlight.
L. 17. Table of Nutrients, Basic Food Guides: Comparison of recommended daily dietary allowances in India, USA, UK, Canada and FAO/WHO. Their uses. Composition of food tables; different kinds for different purposes, basic food guides. Food exchange lists and their uses.
L. 18. Normal and Therapeutic Diets : P lanning normal diets. Philosophy of diet therapy. Therapeutic changes to normal diets.
L. 19. Nutrition for Growth: Nutr i t ional needs and how to meet them in pregnancy, lactation, infancy and through childhood.
L. 20. Assessing the Nutritional Status of a Community : Clinical examinat ions; an thropomet ry ; biochemical, biophysical and physical assessment; dietary survey. Indirect me thods ; vital statistics.

n u t r i t i o n a l e d u c a t i o n t o r c o l l e g e s o f t e a c h e r s 1 1 7
A N N E X U R E IV
CURRICULUM IN NUTRITIONAL EDUCATION FOR COLLEGES OF TEACHER EDUCATION
(32 Hours. Use visual aids throughout the course; term paper required.)
1. Introduction: Nutr i t ion as fundamenta l to life. Nutr i t ion integrated in the educational system. Nut r ien t composition of foods and their general funct ions.
2. Man's Environment: Similarity of the sea and blood com-position, minerals in the sea and in the soil. Uses of trace elements in plants and animals.
3. Integument, Cells and Tissues: Protoplasm, cell s tructure, division and permeability, types of tissues, integument , functions, s tructure, pigmentation and absorption through the skin. Nutr i t ion of integument , cells and tissues.
4. The Skeletal System: I t s func t ions and component parts, nu t r ien ts needed for bone and tooth formation. Daily requirements of the nutr ients . Food sources of calcium and phosphorus. Sourcfs of Vitamin D. Diseases of the bone due to nutr i t ional deficiencies.
5. Energy : Sources and t r j p p i n g of energy by plants . Types and uni ts of energy. Measurements of energy requirements and calories in foods. Human requirements of energy. Effects of caloric malnutri t ion on the body.
6. Plant Factories : P lants make sugars, starches and cellulose for man and animals. Edible port ions of plants. Food sources of carbohydrates. Their utilization by the body.
7. Oils and Fats : How and why oils occur in plants and fat in animals. Characteristics and kinds of oils and fats. Uses in the body and in food preparation.
8. Soil and 'Nutrition : Bacteria and earthworms aid in soil fert i l i ty. The nitrogen cycle and plant proteins. Fodder of food-producing animals.
9. Proteins: Their building blocks and funct ions in the body. Proteins of plants and animals, mixed proteins of foods.

1 1 8 n u t r i t i o n i n t a m i l n a d T T
Daily requirements. Principal food sources. Disease caused by protein insufficiencies.
10. The Digestive System: Organs and processes of digestion. Factors affecting appetite. Digestion of foods; absorption and assimilation of nutr ients . Factors affecting absorption.
11. The Muscular System: Structure of muscles. How they funct ion . Their utilization of nutr ients .
12. The Circulatory System: Organs and func t ions of the system. Life of red blood cells. Daily needs of the body for iron food sources. Factors affecting absorption.
13. History of Vitamins: Definition and classification of vitamins. Diseases associated with vitamin deficiencies lead to their discover}'. Vitamin A as it occurs in nature. Funct ions in the body. Daily needs and food sources.
14. Water-soluble Vitamins: Thiamine, riboflavin, niacin and other B-Complex vitamins. General funct ions, daily needs, food sources. Losses in food processing and preparation.
15. Vitamin C: Func t ions in the body. Daily needs. Food sources. Factors affecting Vitamin C content in foods ; season, variety, harvesting, storage, and food preparation.
16. Body Signs and Nutritional Status: Outward signs of good and poor nutr i t ion. Relationship of weight for height and age to nutr i t ion. How weights and heights are recorded accurately. Record of class weights and heights.
17. Milk: The unique, first food for man and animals. Com-position of milk. Comparison of human milk with others. Milk-borne diseases. Pasteurisation and processing of milk. Uses of milk and its products . .Suggested amounts for daily consumption.
18. Meat and Poultry: Hanging meat. Types and joints of meat and poultry. Quality and marketing prices. Structure of muscle meat and offal. Nutr ient content . Methods of cooking. Meat-borne diseases. Care in storage and use. Meat processing and meat extracts. Suggested amounts for daily consumption by non-vegetarians,
19. Fish & Eggs : Types and sources of fish and eggs. Structure and nutr ient contents. Methods of cooking. Fish and

n u t r i t i o n a l e d u c a t i o n f o r c o l l e g e s o f t e a c h e r s 1 1 9
egg-borne diseases. Care in marketing and storage. Processing of fish and eggs. Suggested amounts for daily consumption.
20. Pulses and Nuts: Types and nut r ient contents . Harvesting and storage. Methods of preparation. Use as milk substi-tutes. Suggested amounts for daily consumption.
21. Green and Yellow Vegetables, Fruit: Classification. Chief contribution of nut r ients to the diet. Methods of prepara-tion to avoid nu t r ien t losses. Suggested amounts for daily consumption.
22. Starchy Foods: Varieties of cereals and millets. Structure. Harvesting. Storage. Milling and processing. Nutr ient composition. Methods of preparation. Suggested amounts for daily consumption.
23. Miscellaneous: Accessory foods for calories and meal pala-tability. General rules of food hygiene. Teeth and their care.
24. Teaching Nutrition in Schools : Food groups. Exchange list. Teaching the concept of the three " g s " — " g o " , " g r o w " and " glow " foods ; grains, grams and greens. Types of teaching aids to make and use. Class to prepare lessons and aids for demonstration teaching.
25. Teaching Nutrition in Literature and Language: Use names of foods, farmyard animals and food utensils for teaching vocabulary, spelling, parts of speech, composition. Teach rhymes and riddles about food. Emphasize foods and their production in drama and literature, e.g., Foods in the Bible. Effects of religion on food habits.
26. Teaching Nutrition in Arithmetic and Mathematics : Counting-cards of foods, addition, subtraction, multiplication and division in shopping and catering. Percentages and averages with class weights and heights ; weights and measures of food. Time of day and dates of meals and festivals. Monetary systems and marketing. Area of fields for quanti-ties of seeds.
27. Teaching Nutrition in History : Indian history : hunters and cave dwellers and their food habits. Coming of the Aryans

1 2 0 n u t r i t i o n i n t a m i l n a d T T
with their cattle, agrarian influence. Buddha and his vegetarianism. Asoka and his influence. Mongol rule and exchange of food habits. Akbar, the great. In ternat ional exchange of ideas ; caravan routes, crusaders. Marco Polo. Discovery of the New World. Traders and missionaries. Wars, famines and migrations. Rural reconstruction. Indian Constitution. Cooperatives and voluntary bodies.
28. Teaching Nutrition in Geography: Climate and rainfall . Effects of crops. Maps of chief crops and animals reared by regions. Irrigation and water-supply, effects on foods and nutr i t ion. Trade winds, trade routes, industries. Sea, rail, road and air t ransport . Population and demography. Five-year plans for agriculture and nutri t ion,
29. Teaching Nutrition in Science: Nature s tudy of plants and their edible por t ions; stages of plant cultivation, growing seeds in the classroom. Measurement of dirt and refuse removed from vegetables before cooking. Farm stock and their fodder. Signs of good and poor nutr i t ion in local animals. Visit mills and bakeries. Teaching the " 3-gs " and funct ions of nu t r ien ts with graphs and charts of skeletal, circulatory, muscular, respiratory and digestive sys tems; organs, their funct ions and relationships to nutr i t ion. Natural food-producing factories: farm animals, birds, fish, plants. Elementary chemistry ; minerals, acids, bases and salts, their place in nutr i t ion. Hardness of water. Effects of heat on starches, fats, proteins.
30. Teaching Nutrition in Arts and Crafts: Colour pictures of foods and farm animals. Make posters and charts of foods. Embroider aprons with f ru i t s and vegetables. Woodwork: cupboards for storage, dining tables. Pot tery, cups, plates and bowls.
31 and 32. Class completes visual aids and each one gives a demonstrat ion lesson of a school syllabus subject, using her aids. Evaluat ion of lesson and aids.

t e a c h e r ' s t r a i n i n g c o u r s e f o r n u t r i t i o n e d u c a t i o n 121
A N N E X U R E V
IN-SERVICE TEACHER'S TRAINING COURSE FOR NUTRITION EDUCATION IN SCHOOLS
(6-day course)
First Day 9.30—10.30 Introduction to the Coarse: Purposes and organiza-
tion. Contents of the course.
10.30—11.30 Carbohydrates and Fats : Occurrence in nature, classi-fication and characteristics. Funct ions in the body. Chief food sources.
11.30—12.30 Proteins: Occurrence in n a t u r e ; basic structures. Funct ions in the body. Quality of animal, plant and mixed pro te ins ; recommended allowances. Chief food sources. Effects of protein deficiency on the body.
12.30—1.30 Lunch.
1.30—2.30 Minerals: Occurrence in nature . Func t ions in building and maintaining bones, teeth and blood.
2.30—4.30 Vitamins: Definition. Brief history of discovery. Classification. General funct ions in the body. Recommen-ded allowance. Food sources. Effects of vi tamin deficiencies on the body.
Second Day 9.30—10.30 Factors affecting Food Habits: Food beliefs in
India.
10.30—11.30 Food Hygiene: Storage and handling. Beneficial and malevolent food bacteria.
11.30—12.30 Teeth: Structure, formation and maintenance; dental hygiene.
12.30—1.30 Lunch.
1.30—2.30 Digestion and Absorption : Digestion of food. Absorp-tion and assimilation of nutr ients .
2.30—3.30 Food Economy : Economic food purchasing and pre-paration. Minimizing nut r ien t losses in processing, storage and preparation.

1 2 2 n u t r i t i o n i n t a m i l n a d u
) 3.30—4.30 Weight and Measurement: Weight and measurement
of food. Weights, heights and outward signs of good and poor nutr i t ion.
Third Day
9.30—10.30 Basic Food Groups: Exchange list. Composition of foods. Tables. Nutr ient contribution of the food groups to the diet. Suggested daily amounts from each group.
10.30—11.30 Diet Planning: Planning diets for the family. Ext ras needed for expectant and nursing mothers.
11.30—12.30 Diets for Young Children: Feeding in fan t s and young children. Their growth pat terns and nutr i t ional requirements.
12.30—1.30 Lunch.
1.30—2.30 Diets for School Children: Schoolch i ld ren : growth, development and nutr i t ional needs. The school lunch and ANP in nutr i t ional education.
2.30—3.30 Audio Visual Aids : Types, uses and equipment. How to make and use film strips and slides. Demonstrat ion and practice in using projectors.
3.30—4.30 Visual Aids : Types and how to use them. Demonst-ration by teaching, spelling and counting.
Fourth Day
9.30—10.30 Geography and History : Demonstrat ion of teaching nutr i t ion in geography and history.
10.30—11.30 Literature and Language : Demonstration of teach-ing nutr i t ion in l i terature and language.
11.30—12.30 Science: Demonstration of teaching nutr i t ion in school science.
12.30— 1.30 Lunch.
1.30— 4.30 Teachers plan their demonstration lessons.
Fifth Day
All day : Teachers make visual aids for their demonstration lessons.

p r a c t i c a l n u t r i t i o n 1 2 3
Sixth Day
All d a y : Teachers in turn give demonstrat ion lessons. Evaluat ion by the group of the lessons, visual aids and of the course.
A N N E X U R E VI
PRACTICAL N U T R I T I O N
(96 Hour Course for Block and Mini Health Centre Nutrition —Workers 32 Hours Theory and 64 Hours Practical)
1. Introduction: Purpose and organization of the course. How to learn and teach practical nutr i t ion. Effects of diet on health. Signs of good and poor health.
2. Measurements : The importance of accurate measurements. How to take and record weight, height and length. How to weigh and measure food. Care of measuring apparatus. Precautions in weighing.
3—4. Practice in taking and recording weight, height and length. Using weights and measures in marketing and in food preparation.
5. Basic Food Groups: Concept and contents of basic food groups. How much of each group to include in daily diets. Cost versus nutr i t ional contribution of foods to health.
6. Foods for Energy : Cereals, roots, tubers and bananas, fats and oils. Their contribution to the d i e t ; methods and uses in food preparation.
7—8. Cooking Energy Foods: Preparat ion of iddli, dosai, uppuma, roti and paratlias.
9—-10. Cooking Energy Foods (conld.): Hay box cooking (absorp-tion method) of rice. Roasting or baking potatoes. Making banana chips.
11. Foods for Growth and Repair : Muscle meat and poul t ry . Types and joints of meat and poultry. Liver, kidney and heart, meat extracts. Contribution to the diet. Methods of cooking.

1 2 4 n u t r i t i o n i n t a m i l n a d T T
12. Foods for Growth anil Repair: F i sh : types, contr ibution to the diet. Methods of preservation and cooking.
Eggs, contribution to the diet. Methods and uses in food preparation.
13—16. Preparation of meat, poultry, fish in curries. F ry ing fish. Egg cooking : boiling, frying, scrambling, poaching, as omelettes and pancakes.
17. Foods for Growth and Repair: Pulses and nuts . Classifica-tion, contribution to the diet. Methods and uses in food preparation. Groundnut milk as a subst i tute for cow's milk.
18—-21. Preparation of Pulses and Nuts : Sprouting green gram, f rying Bengal g ram; gram and dhal curr ies ; g roundnut milk and chutney.
22. Milk and Milk Products : Unique food for growth and repair. Uses in sickness and convalescence. Contribution to the diet. Methods and uses in food preparation.
23—26. Preparation of Milk: Making cocoa, milk soups, banana (and other f rui t ) milk shakes. Preparation of curds and cottage cheese. Uses in f rui t and vegetable salads.
27. Vegetables: Classification and parts eaten. Contribution to the diet and the digestive system. Methods of food preparation.
28—29. Preparation of Vegetables : Green and leafy vegetables, cooking and use in salads, stuffed paratlias and stuffed dosai. Carrots grated, cut in strips, boiled as soup. Use in salads. Stuffed pumpkin. Stuffed tomato, tomato juice, tomato si lad. Preparation of fresh beans and peas and pureed vegetables. Chutney making.
30. Fruit: Classification, preparation, preservation, contribution to the diet and digestion.
31—34. Preparation of Fruit: Raw, stewed, pureed, as salad. Preservation of f ru i t s in season. Chutney making. Making jam, jelly, f ru i t cheese and f ru i t juices.
35. Effects of Cooking and Eating on Food: How starchy foods, meat, fish, eggs, milk, pulses, vegetables and f ru i t are altered

p r a c t i c a l n u t r i t i o n 1 2 5
in cooking, dur ing eating and in the body. Body's need for roughage and water.
36. Food Hygiene: Food poisoning and food-borne diseases. Factors to observe when buying food. Proper storage of food. Sanitary handling of food utensils. Personal hygiene of food-handlers.
37. Food Adulteration : Types of foods likely to be adulterated. How foods are adulterated. Indian food laws. Consumer's role in preventing food adulterat ion.
38. Planning Diets: Food and fuel budgeting. Planning meals with utensils available. Choice of foods in season. How to prepare and serve planned meals.
39—40. Practice in Planning Diets for a family of six, on a low income, for a day and a week.
41. Kitchen Craft: How to make and use a smokeless chula and haybox. Kitchen arrangement and management. Evapora-tion as a cooling system.
42. Diets for Women: Daily food requirements of a normal woman. Why and how to alter the diet in pregnancy and lactation.
43—44. Preparation of Daily Meals for a Woman and an expectant and nursing mother.
45—46. Feeding the Infant and Young Child : Golden rules in in fan t feeding; when to s tar t supplementary feeding. How to prepare milk formula. Types, amounts and prepa-ration of food for the infant and young child.
47—48. Preparation of Food for Infants and Young Children: Potato, ripe banana, f ru i t juice, carrot, green leafy vege-table, cereal, egg, pulses, rusk and milk formula or milk drink.
49. Feeding Programmes for infants , young children and mothers at Kuzhanthaikal Kappagams and Malialir Manrams. Family and Child Welfare Scheme. Demonstrat ion feeding project, Special nutr i t ion (Modern Bread) scheme.
50. Feeding the Nursery School Child: Food requirements and physical needs of the nursery school child. Experiences in nutr i t ional education at the nursery school.

1 2 6 n u t r i t i o n i n t a m i l n a d T T
51—52. Visit a Kuzhanthaikal Kappagam and or a nursery school.
52—53. Prepare a meal for nursery school children.
54. Assessing nut r i t ion programmes and nutr i t ional s ta tus of the community. Methods used. How to obtain data and keep records.
55. Educating mothers in child feeding in Mini-Health and other centres, Mahalir Manrams and Kuzhanthaikal Kappagams. Visual aids and teaching methods to use. How to interview mothers. Questions to ask, records to keep, using the interview for nutr i t ional education.
56. Educating Mothers on their diets before and dur ing preg-nancy and lactation. Visual aids and teaching methods to use in Health Centres, Mahalir Manrams and Kuzhanthaikal Kappagams. Interviewing women on their own food a t t i tudes and habits, using the interview for nutr i t ional education.
57—58. Visit a Mahalir Manram and a Health Centre.
59. Nutritional Education and International Aid: CARE UNICEF, FAO, WHO and UNESCO. The ANP. The Tamil Nadu Nutr i t ion Project.
60. Kitchen Gardening: The place of home, school and commu-nity gardens in nutr i t ion education. Choice of vegetables and f ru i t s to grow. The rotation of crops. Fertilizers, manure, pests and pesticides.
61—62. Visit a Kitchen Garden and Orchard.
63. Feeding the Primary School Child : How to meet food require-ments of a primary school child. School lunches. P lann ing home meals in relation to school meals.
64—67. Visit a School Midday Meal Scheme in a town and a village. Visit an ANP programme.
68. Poultry Keeping: How to keep poultry, the house, feeds, breeds of birds, the deep-litter system. Poul t ry diseases and how to avoid them. Making poultry pay.
69—70. Visit a Poultry Unit.

p r a c t i c a l n u t r i t i o n 1 2 7
71. Nutrition Education of School Children : Inl igrated nutr i t ion education in the school syllabus. Visual aids and teaching methods to use.
72—73. Preparation of Meals for a Primary School Child.
74. Feeding the Adolescent: Growth spurt in adolescence. Need for extra food of good quality. How to meet adolescent needs for food. Additions required for pregnant and lactat-ing adolescent girls.
75. Nutritional Education of the Adolescent: How to appeal to the adolescents through peer groups and you th clubs. Good diets for boys for their success in sports and careers. Appeal to adolescent girls for good looks as fu tu re wives. Appeal to maternal inst incts as fu tu re mothers. Home Science teaching, visual aids and teaching methods.
76. Food and Nutritional Education for the " Bread Winner": Dietary needs of men, and how to meet them. Knowledge of nutr i t ion useful to food producers. Knowledge of nutr i -tional needs of each family member ; market ing for the family. Men make the best cooks. Nutr i t ion education for school masters.
77—78. Prepare meals for an adolescent boy and a man.
79—80. Prepare meals for adolescent girls and with extra nutr i -tion for adolescent in pregnancy and lactation.
81. Home Nursing: Care of the sick. Diets in colds and fevers. Serving attractive food for the invalid.
82. Prepare a tray of soft foods and milk beverages for a sick or convalescent pat ient .
83. Diets in Constipation and Diarrhoea : Causes of constipation. Diet high in fibres and fluid to prevent constipation. Diet in (casual) diarrhoea; feeding the baby suffering from sum-mer diarrhoea.
84—85. Prepare Diets for adults suffering from constipation and diarrnoea.
86—91. Visual Aids: Students prepare visual aids for them-selves for nutr i t ion education in Kuzhanthaikal Kappagams, Mahalir Manrams, Youth Clubs, Farmers Clubs and Schools.

1 2 8 n u t r i t i o n i n t a m i l n a d T T
92—96. Demonstration Nutrition Education by each s tudent , using the visual aids she has made.
A N N E X U R E VII
CURRICULUM IN SCIENCE OF NUTRITION FOR MEDICAL STUDENTS
(Total hours : 32 ; Lectures : 20 hours ; Practicals or Demonstra t ions : 12 hours)
L e c t u r e s
1. Introduction to the Course: Nut r ien t composition of foods. General funct ions in providing energy and materials for growth and repair of the body and for regulating body processes.
2. Composition of the Body : Body fluid compartments and their measurements.
3. Carbohydrates: Occurrence in nature, classification, chemistry ; funct ions in the body ; chief food sources.
4. Lipids : Classifications, chemistry and characteristics of f a t s ; food sources and dietary uses. Phospho-lipids and cholesterol funct ions in the body. Ketone bodies and ketoses.
5. Proteins and Enzymes: Definition. Unique quali ty of proteins, chemistry, composition and synthesis. Essential and non-essential amino acids. Quality of dietary pro-teins. Calculating digestibility and biological values. Protein requirements. Effects of protein undernutr i t ion. Enzymes and their functions.
6. Energy : Source and types of energy ; uni ts of measure-ment, measuring energy needs, measurement of calories in food. Human requirements. Effects of excess and insufficient dietary calories on the body.
7. Water and Electrolytes : Funct ions of water in the body ; water-balance. Funct ions and dietary sources of sodium, chloride and potassium. Effects of water and electrolyte imbalances on the body.

n u t r i t i o n f o r m e d i c a l s t u d e n t s 1 2 9
8. Micro-minerals: Funct ions in the body. Dietary sources. Recommended allowances of iron and iodine. Effects of micro-mineral malnutr i t ion on the body. Organs and processes of making blood.
9. Macro-minerals and Vitamin D : Func t ions in the body. Food sources of calcium, phosphorus and magnesium. Sources of Vitamin D. Recommended allowances. Effects of excesses and deficiencies on the body.
10. Vitamins A, E and K : Occurrence in nature. Conversion of carotene to Vitamin A. Funct ions in the body. Food sources, daily requirements. Effects of excess and insufficiency on the body. Synthesis and funct ions of Vitamin K. Use in child bir th. Antagonists to Vitamin K, their use in ischaemic heart disease. Dietary funct ions of Vitamin E. Food sources.
11. Ascorbic Acid: Funct ions in the body. Synthesis. Recommended allowances. Food sources, and factors affecting them. Effects of ascorbic acid deficiency on the body. Methods of estimating ascorbic acid nutri-tional s ta tus of an individual.
12 The B-Complex Vitamins: Description and general and funct ions in the body. Recommended or suggested 13. daily allowances. Food source. Losses in food prepa-
ration. Effects of deficiencies on the body. Methods of determining the B-complex vitamin s ta tus of an individual.
14. Digestion, Absorption and Elimination of Nutrients: Organs and processes of digestion, absorption and elimi-nation of the body. Factors affecting the processes.
15. Effects of Non-Nutritional Factors on Diet: Factors affecting food production, distr ibution, consumption: climate, geography, trading, t ransport , storage, political, economic, social, cultural and religious.
16. Food Hygiene: Food-borne diseases. Sanitary food storage. Hygiene of food handling and preparation. Teeth : s t ructure and cutt ing. Effects of nutr i t ion and diet on teeth. Dental hygiene.
N—9

1 3 0 n u t r i t i o n i n t a m i l n a d T T
17. Tables of Nutrients, Basic Food Guides : Comparison of recommended daily allowances of India, USA, UK, Canada and FAO/WHO. Their uses. Composition of food tables; different kinds for different purposes. Basic food guides. Food exchange lists and their uses.
18. Normal and Therapeutic Diets: P lanning normal diets. Philosophy of diet therapy. Therapeutic changes to normal diets.
19. Nutrition for Growth: Nutri t ional needs and how to meet them in pregnancy, lactation, infancy and through childhood.
20. Assessing the Nutritional Status of a Community : Clinical examinations ; anthropometry ; bio-chemical, bio-physi-cal and physical assessment; dietary survey. Indirect methods; vital statistics, ecological information.
Practicals or Demonstrations
1. Effect of heat on starch demonstrated by the iodine test.
2. Reducing properties of sugar demonstrated with alkaline solution of metals.
3. Saponification of fats. Non-saponification of mineral oils.
4. Demonstrat ion of thermal, chemical and mechanical coagulation of protein.
5. Determination of water in food.
6. Determination of food ash, and pH of water-soluble ash.
7. Demonstration of action of salivary amylase on starch.
8. Demonstrat ion of proteolytic action of digestive enzymes on protein.
9. Make a red blood cell count.
10. Determination of haemoglobin and plasma protein by copper sulphate specific gravity method.
11. Determination of haematocrit .
12. Determination of ascorbic acid in blood and urine by the dye method.

n u t r i t i o n f o r a g r i c u l t u r e & v e t e r i n a r y s t u d e n t s 1 3 1
A N N E X U R E VII I
CURRICULUM IN THE SCIENCE OF NUTRITION FOR STUDENTS OF AGRICULTURE AND ANIMAL
HUSBANDRY
(Total hours : 32; Lectures: 20 hou r s ; Practicals or Demonstra t ions: 12 hours)
Lectures
L Introduction to the Course: Nutr ient composition of foods, general funct ions of nutr ients .
2. Energy : Source and types of energy ; un i t s of measure-ment . Direct and indirect methods of measuring energy needs in man and animals. Caloric needs of human and farm animals. Measurement of calories in food stuffs ; O2 consumption. C0 2 production of p lant tissues.
3. Carbohydrates: Definition. Occurrence in nature. Classifi-cation and chemistry. Funct ions in the organism. Chief food sources.
4. Lipids: Definition. Classification. Chemistry and char-acteristics of fats. Food sources and dietary uses. Funct ions of phospho-lipids and cholesterol in the organism. Ketone bodies and Ketoses.
5. Proteins and Enzymes : Definition. Chemistry, composi-tion and synthesis of proteins. Funct ions in the organism. Essential and non-essential amino acids. Quality of proteins. Digestibility and biological values. Protein requirements. Effects of protein malnutr i t ion. Funct ions of enzymes.
6. Water and Electrolytes: Funct ions of water in the orga-nism. Water-balance. Funct ions and dietary sources of sodium, chloride and potassium. Effects of water and electrolyte imbalances on the organism.
7. Iron and Micro-minerals: Micro-minerals in soil. Dietary sources. Funct ions in the organism. Dietary allowances. Effects of micro-mineral malnutr i t ion in plants, animals and man.

1 3 2 n u t r i t i o n i n t a m i l NADTT
8. Macro-minerals and, Vitamin D: Funct ions in the organism. Sources of macro-minerals and Vitamin D. Daily allowances. Effects of macro-mineral and Vitamin D excesses and deficiencies on the organism.
9. Vitamins A, E and K : Occurrence in nature. Funct ions of Vitamin A in the organism. Food sources and daily requirements of Vitamin A. Effects of Vitamin A mal-nutr i t ion on the organism. Synthesis, funct ions and antagonists of Vitamin K. Food sources. Effects of malnutr i t ion on the organism. Funct ions of Vitamin E in the diet, in food and in animals. Food sources. Effects of malnutr i t ion on animals and birds.
10. Ascorbic Acid: Funct ions in the organism. Synthesis of ascorbic acid. Daily allowances. Food sources. Factors affecting ascorbic acid content of food. Effects of ascorbic acid deficiency in man and guinea pigs.
11. B-Complex Vitamins : Description and general funct ions and in the organism of the B-complex vitamins, choline and
12. inositol. Daily allowances. Food sources. Factors affect-ing the food sources. Effect of deficiencies cn the organism.
13. Digestion of Foods, Absorption of Nutrients: Organs and processes of the digestive tract. Factors affecting the processes.
14. End Products of Metabolism: Excretion of nitrogen by man and animals. Nitrogen cycle in nature. Excretion of lipids, vitamins, electrolytes and minerals. Products of carbohydrate metabolism.
15. Experimental Animals: Nutri t ional needs of experi-mental animals and birds. Effects of malnutr i t ion on these organisms. Uses in clinical diagnosis and nut r ien t assays of food.
16. Microbiology of Foods: Classification of food micro-organisms. Use of micro-organisms in food processes. Micro-organisms in food malevolent to man and animals. Hygiene and sanitation in food handling and storage.

n u t r i t i o n f o r a g r i c u l t u r e & v e t e r i n a r y s t u d e n t s 1 3 3
17. Non-Nutritional Factors affecting Food • Effects of cli-mate, geography, soil, seasons and education on food production and harvesting. Effects of trade, t ransport , storage facilities, economics and politics on food distri-bution.
18. Food Beliefs in India : Effects of religion, society, tradi-tion, culture and beliefs on food habits and health. Distr ibution and consumption of food within the family and community.
19. Planning Daily Meals : Recommended daily allowances of nutr ients . Food composition tables. Use of food charts, guides and exchange lists. Economical marketing and food preparation.
20. Nutrition Programmes : Types of rural and urban nutri-tional programmes. Crop and small animal raising in schools and communities. Poultry keeping. Contribu-tion of nutr i t ional activities to the nutr i t ional s tatus of the population. Aid of national and internat ional agencies in nutr i t ion programmes.
Practicals or Demonstrations
1. Iodine test of starches. Chemical tests of mono-and di-saccharides.
2. Saponification of fats. Non-saponification of mineral oils, formation of emulsions and suspensions.
3. Formation of gels. Thermal, chemical and mechanical coagulation of protein.
4. Determination of water in foods.
5. Action of salivary enzymes on starches.
6. Action of proteolytic enzymes on proteins.
7. Determination of ash in food, and the pH of water-soluble ash.
8. Obtain riboflavin from milk in whey. Observe its disappearance in light.
9. Determination of ascorbic acid in orange juice, before and af ter exposure to air.

1 3 4 n u t r i t i o n i n t a m i l n a d T T
10. Determination of ascorbic acid in potatoes, before and after peeling and cooking.
11. Demonstrat ion of micro-biological action of yeast, moulds, and
12. Bacteria on foods, e.g., jam, bread and milk.
A N N E X U R E I X
CURRICULUM IN SCIENCE OF NUTRITION FOR STUDENTS OF FOOD ENGINEERING
(Total hours : 32 ; Lectures : 20; Practicals or Demonstra t ions: 12 hours)
Lectures
1. Introduction to the Course : Nutr ient composition of foods. General funct ions of nutr ients .
2. Development of Food Chemistry: History of food che-mistry. Variability and uniformity in bio-chemical research. Methods of sampling. Moisture in foods.
3. Carbohydrates-. Definition, occurrence in nature, classifi-cation and chemistry. Funct ions in the body. Chief food sources. Identification by chemical react ions: colour, fermentat ion, optical activity.
4. Lipids: Definition. Occurrence in food. Physical and chemical properties of edible fats and oils. Uses in food preparation and in the diet. Chief food sources.
5. Proteins and Enzymes : Definition, chemistry, composi-tion and synthesis. Funct ions in the body. Amino acid quali ty of proteins. Digestibility and biological values of proteins. Protein requirements. Effects of protein malnutr i t ion on the body. Funct ions of enzymes.
6. Water and Electrolytes : Funct ions and water-balance of the body. Funct ions and dietary sources of sodium, chloride and potassium. Effects of water and electrolyte imbalances on the body.
7. Micro-minerals : Funct ions of iron and micro-minerals in the body. Food sources. Dietary allowances. Effects of micro-mineral malnutri t ion on the body.
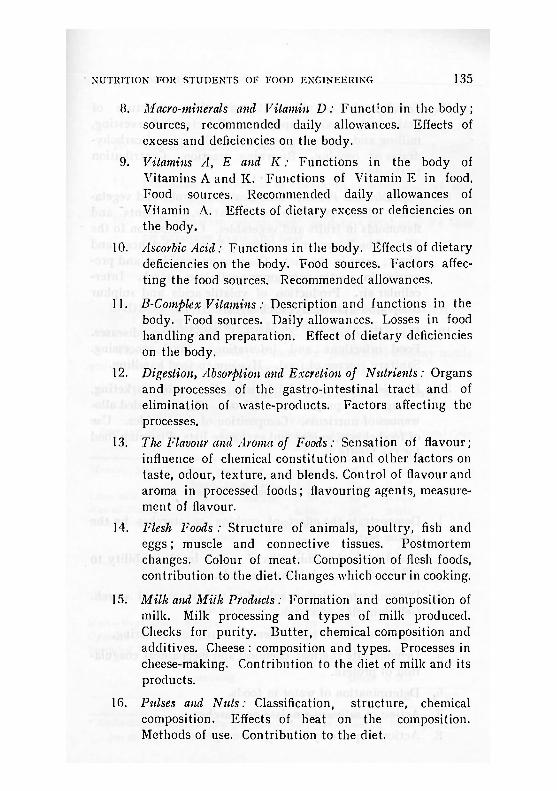
n u t r i t i o n f o r s t u d e n t s o f f o o d e n g i n e e r i n g 1 3 5
8. Macro-minerals and Vitamin D: Funct ion in the body ; sources, recommended daily allowances. Effects of excess and deficiencies 011 the body.
9. Vitamins A, E and K: Func t ions in the body of Vitamins A and K. Funct ions of Vitamin E in food. Food sources. Recommended daily allowances of Vitamin A. Effects of dietary excess or deficiencies on the body.
10. Ascorbic Acid: Funct ions in the body. Effects of dietary deficiencies on the body. Food sources. Factors affec-t ing the food sources. Recommended allowances.
11. B-Complex Vitamins: Description and funct ions in the body. Food sources. Daily allowances. Losses in food handling and preparation. Effect of dietary deficiencies on the body.
12. Digestion, Absorption and Excretion of Nutrients: Organs and processes of the gastro-intestinal t ract and of elimination of waste-products. Factors affecting the processes.
13. The Flavour and Aroma of Foods: Sensation of flavour; influence of chemical consti tut ion and other factors on taste, odour, texture, and blends. Control of flavour and aroma in processed foods; flavouring agents, measure-ment of flavour.
14. Flesh Foods : Structure of animals, poultry, fish and eggs; muscle and connective tissues. Postmortem changes. Colour of meat. Composition of flesh foods, contribution to the diet. Changes which occur in cooking.
15. Milk and Milk Products : Formation and composition of milk. Milk processing and types of milk produced. Checks for puri ty. But ter , chemical composition and additives. Cheese : composition and types. Processes in cheese-making. Contribution to the diet of milk and its products.
16. Pulses and Nuts: Classification, s t ructure, chemical composition. Effects of heat on the composition. Methods of use. Contribution to the diet.

1 3 6 n u t r i t i o n i n t a m i l n a d T T
17. Cereals and Their Uses: Classification, s t ructure of grains, chemical composition. Effects of harvesting, milling and processing on grains. Changes of carbohy-drates on cooking. Browning reaction. Contribution to the diet.
10. Vegetables and Fruits : Classification of f iu i t s and vegeta-bles. Their s t ructure and texture. Pigments and flavonoids in f ru i t s and vegetables. Contribution to the diet. The Browning reaction. Pectic substances and fibres ; uses in the diet. Changes on cooking and pro-cessing in pectic substances, cellulose, starch. Inter-cellular air. Production of volatile acids and sulphur compounds, post-harvest changes.
19. Food Hygiene and Sanitation: Food-borne diseases. Food infections and infestations. Food processing. Sanitary storage of food. Hygiene in food handling.
20. Planning Meals: Food beliefs. Economic marketing, storage and preparation of foods. Recommended allo-wances of nutr ients . Composition of food tables. Use of food charts, guides and exchange lists. P lanning food for the family.
Practicals or Demonstrations
1. Demonstrate the effect of cooking on starches by the iodine test.
2. Quanti tat ive determination of sugars by their ability to reduce alkaline solutions of metals.
3. Demonstrate relative solubility of sugar and starch. Gelatinization of starch.
4. Saponification of fats. Demonstration of rendering.
5. Demonstrate thermal, chemical and mechanical coagula-tion of protein.
6. Determination of water in foods.
7. Action of salivary amylase on starches.
8. Action of proteolytic enzymes on proteins.

n u t r i t i o n f o r s t u d e n t s o f f o o d e n g i n e e r i n g 1 3 7
9. De t e rmina t i on of ash in food, and p l i of water-soluble ash.
10. D e m o n s t r a t e micro-biological action of milk in curd-making .
11. D e m o n s t r a t e presence of riboflavin in whey and its loss on exposure to l ight .
12. De te rmina t ion of ascorbic acid in a food and its loss on exposure to air a n d heat .
A N N E X U R E X
MIDDAY MEAL M E N U PATTERN FOR PRE-SCHOOL CHILDREN 3 TO 6 YEARS OF AGE
T h e cost* and q u a n t i t y of food for pre-school midday meals are shown in Table A below, per child each day .
TABLE A—Cost and Quantity of Food per Child Daily
Price Cost per D a y and Menu Food per kg. Amount portion Total Cost
Rs. in grams Rs. Rs.
Monday, Menu 1. Rice, parboiled 1-25 80 0-100 Bengal gram dhal 1-35 20 0-027
Lime rice Amaranth , tender 0-20 50 0-010 Keerai Kootu Tomato 0-60 20 0-012 Sliced Tomato L ime juice 10 Paise—a fewdrops 0-003
Seasoning — pinch 0 003 Groundnut oil 3-50 10 0-035
0-190 0-190
Tuesday, Menu 2. Maize flour 0-65 80 0-052 Green gram 2-10 20 0-042
Maize-Vegetable Amaranth 0-20 50 0-010 Uppuma Brinjal 0-20 80 0-016 Sprouted Mung Jaggery 1-80 12 0-021
Oil 3-50 5 0-018 Seasoning — pinch 0-003
0-162 0-162
* Excluding overhead charges which may not exceed 2 Paise per child per day.

138 n u t r i t i o n i n t a m i l n a d T T
Price Cost per Day & Menu Food per kg. Amount portion Total cost
Rs. in grams Rs . Rs.
Wednesday, Menu 3. Choi am 0-65 40 0 026 Rice 1-25 40 0-050 Black gram dhal 2-45 20 0-049
Cholarn Iddli Bengal gram dhal 1-35 5 0-007 Curry leaf chutney Curry leaves 0-20 25 0-005 Mango Mango 0-20 50 0-010
Oil 3-50 5 0-018 Seasoning — — 0-003
0-168 0-168
Thursday, Menu 4. Ragi 6-65 60 0-039 Bengal gram dhal 1-35 20 0-027
Ragi Pitln Vine Spinach 0-20 25 0-005 Keerai Kootu Potato 0-80 100 0-080 Grated Carrot Carrot 0-20 50 0-010
Jaggery 1-80 8 0-014 Oil 3-50 5 0-018 Seasoning — pinch 0-003
0-196 0-196
Friday, Menu 5. Rice 1-25 80 0-100 Bengal gram dhal 1-35 10 0-014
Keerai Dhal Red gram dhal 2-00 10 0-020 Kozhahattai Amaranth 0-20 50 0-010 Sliced Papaya Papaya 0-20 50 0-010
Oil 3-50 10 0-035 Seasoning — pinch 0-003
0-192 0-192
Saturday, menu 6. Wheat ravai 1-25 80 0-100 Bengal gram dhal 1-35 20 0-027 Amaranth 0-20 50 0-010
Wheat-Vegetable Carrot 0-60 10 0-006 Pongal Oil 3-50 10 0-035 Grated carrot Seasoning — — 0-003
0-181 0-181
Grand Total Average Cost
1-089 0-181
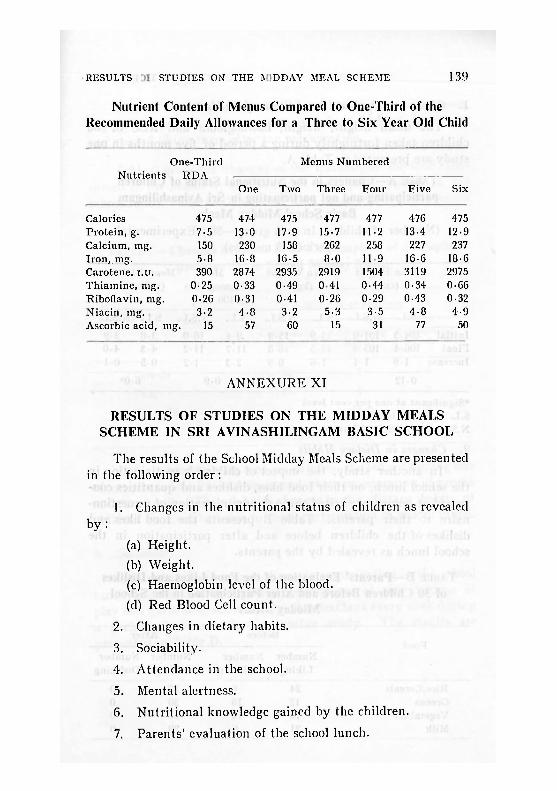
r e s u l t s 01' s t u d i e s o n t h e m i d d a y m e a l s s c h e m e 139
Nutrient Content of Menus Compared to One-Third of the Recommended Daily Allowances for a Three to Six Year Old Child
One-Third Menus Numbered Nutrients R D A .
One Two Three Four F ive Six
Calories 475 474 Protein, g. 7-5 13-0 Calcium, mg. 150 230 Iron,_mg. 5-8 16-8 Carotene, i .u. 390 2874 Thiamine, mg. 0-25 0-33 Riboflavin, mg. 0-26 0.31 Niacin, mg. 3-2 4-8 Ascorbic acid, mg. 15 57
475 477 477 4-76 475 17-9 15-7 11.2 13-4 12-9
158 262 258 227 237 16-5 8-0 1 1 9 16-6 18-6 2935 2919 1504 3119 2975 0-49 0 4 1 0-44 0-34 0-66 0-41 0-26 0-29 0-43 0-32
3-2 5-3 3-5 4-8 4-9 60 15 31 77 50
A N N E X U R E XI
RESULTS OF STUDIES ON THE MIDDAY MEALS SCHEME IN SRI AVINASHILINGAM BASIC SCHOOL
The results of the School Midday Meals Scheme are presented in the following order :
1. Changes in the nutr i t ional s tatus of children as revealed b y :
(a) Height.
(b) Weight.
(c) Haemoglobin level of the blood.
(d) Red Blood Cell count.
2. Changes in dietarj ' habits.
3. Sociability.
4. Attendance in the school.
5. Mental alertness.
6. Nutr i t ional knowledge gained by the children.
7. Parents ' evaluation of the school lunch.

1 4 0 n u t r i t i o n i n t a m i l n a d T T
1. Changes in the Nutritional Status of Children
The mean height , weight, haemoglobin and RBC of 60 children taken fo r tn igh t ly dur ing a period of five mon ths in one s tudy are presented in Table A.
TABLE A—Changes in the Nutritional Status of Children participating and not participating in Sri Avinashilingam
Basic School Midday Meals (Number of children in each group—30; Exper imenta l
period—5 months)
Mean Height Mean Weight Mean Mean RBC Count (cm) (kg) Haemoglobin (million/c.c.)
(g/100 ml.)
S.L. N.S.L. S.L. N.S.L. S.L. N.S.L. S.L. N.S.L.
Initial 104-5 104-0 15-9 15-9 9 -4 10-0 3-8 3-9 Final 106-4 105-4 17-5 16-8 11-7 11-2 4 -3 4-0 Increase 1-9 1-4 1-6 0 -9 2-3 1-2 0 -5 0-1
0-12 7
* CO 0-9 6-0*
•Signif icant at one per cent level S.L. School lunch N.S.L. = Non-School Lunch
2. Changes in Dietary Habits
In another s tudy, the impact of chi ldren 's part ic ipat ion in the school lunch, on their food likes, dislikes and quant i t ies con-sumed at home was elicited through adminis t ra t ion of a question-naire to their parents . Table B presents the food likes and dislikes of the children before and a f te r part icipation in the school lunch as revealed by the parents .
TABLE B—Parents' Evaluation of the Food Likes and Dislikes of 30 Children Before and After Participation in the School
Midday Meals
Food Before After
Food Number Number Number Number Liking Disl iking Liking Disl iking
Rice/Cereals 24 6 30 0 Greens 12 18 30 0 Vegetables 16 14 30 0 Milk 21 9 30 0

r e s u l t s 01' s t u d i e s o n t h e m i d d a y m e a l s s c h e m e 1 4 1
While a considerable number of children did not like greens, vegetables and milk before participation in the school lunch, all had started liking them af ter the part icipation.
Table C gives the changes in the quan t i ty of the foods con-sumed in the homes by children who were part icipat ing in the school lunch. The foods selected were those served in the school meal.
TABLE C—Changes in Home Food Consumption of 30 Pupils participating in School Midday Meals
Number of children Food
Consuming Consuming Consuming amount More Less
Cereals 22 2 6
Dhal 26 4 0
Vegetables (Greens) 6 24 0
Milk 18 12 0
I t is s tr iking to note that six children started consuming less of cereals, while 24 had increased their consumption of greens and 12 of milk. Thus definite changes in the dietary habits of children were evident due to their participation in school lunch.
3. Sociability
The social development of pupils part icipating in the school lunch was assessed through the observations of the children at play and gardening activities by class teachers every week during a period of six months in another s tudy. The results are presented in Table D.
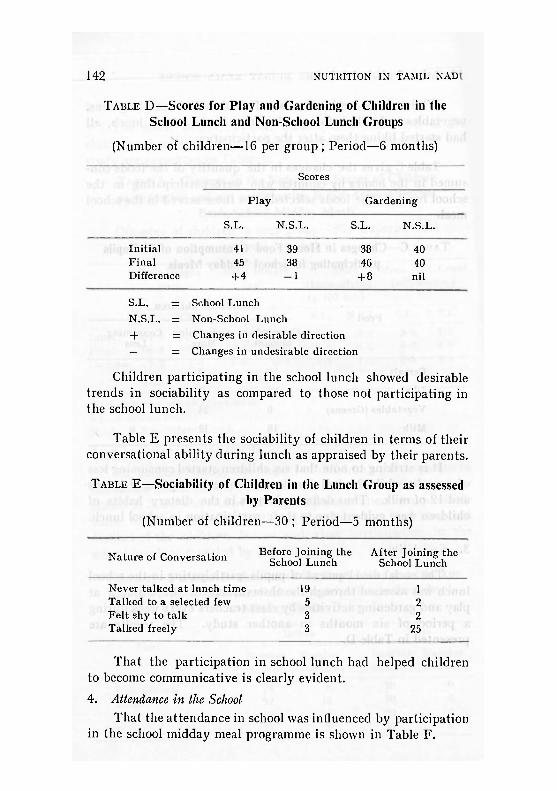
1 4 2 n u t r i t i o n i n t a m i l n a d T T
TABLE D—Scores for Play and Gardening of Children in the School Lunch and Non-School Lunch Groups
(Number of children—16 per group ; Period—6 months)
Scores
P lay Gardening
S.L. N.S.L. S.L. N.S.L.
Init ial 41 39 38 40 F ina l 45 38 46 40 Difference + 4 — 1 + 8 nil
S.L. = School Lunch
N.S.L. = Non-School Lunch -f- = Changes in desirable direction
— = Changes in undesirable direction
Children part icipat ing in the school lunch showed desirable t rends in sociability as compared to those not part ic ipat ing in the school lunch.
Table E presents the sociability of children in terms of their conversational ability dur ing lunch as appraised by their parents .
TABLE E—Sociability of Children in the Lunch Group as assessed by Parents
(Number of children—30 ; Period—5 months)
Nature of Conversation Before Joining the School Lunch
After Joining the School Lunch
Never talked at lunch t ime 19 1 Talked to a selected few 5 2 Fe l t shy to talk 3 2 Talked freely 3 25
Tha t the part icipat ion in school lunch had helped children to become communicative is clearly evident.
4. Attendance in the School Tha t the a t tendance in school was influenced by participation
in the school midday meal programme is shown in Table F .

r e s u l t s 01' s t u d i e s o n t h e m i d d a y m e a l s s c h e m e 1 4 3
TABLE F—Attendance of the School Lunch and Non-School Lunch Groups
(Number of children in each group—30 ; Exper imenta l Period—5 months)
Number of days
First half Second half
School lunch 59 68 Non-School lunch 68 59
The percentage of a t tendance of the school lunch group improved f rom the first half to the second half of the experi-mental period. There was an equivalent decrease in a t tendance of the non-school lunch group dur ing the second half of the period.
5. Mental Alertness
Sixteen pupils in the school lunch and a corresponding group not par t ic ipat ing in the lunch were required to write a proverb, af ter being given three minutes to memorise it. Scores were assigned for the time taken to write, and also for the correctness. The teachers maintained records of the performance of the pupils in class tests. Both these were used to assess the mental alertness of the pupils. These results are presented in Table G.
TABLE G—Marks Awarded to Pupils in the School Lunch and Non-School Lunch Groups for Mental Performance
(No. of children in each group—16 ; Period—6 months)
N u m b e r of p u p i l s
Percentage of marks Memory Test Class performance
S.L. N.S.L. x 2 S.L. N.S.L. x 2
Below 35 — 1 — —
36—50 — 3 — —
51—75 — 6 17'7** 2 12 13 0* 76—100 16 6 12 4
** Significant at 0 05 level S.L. = School Lunch * Significant at O'Ol level N.S.L.=Non-School Lunch
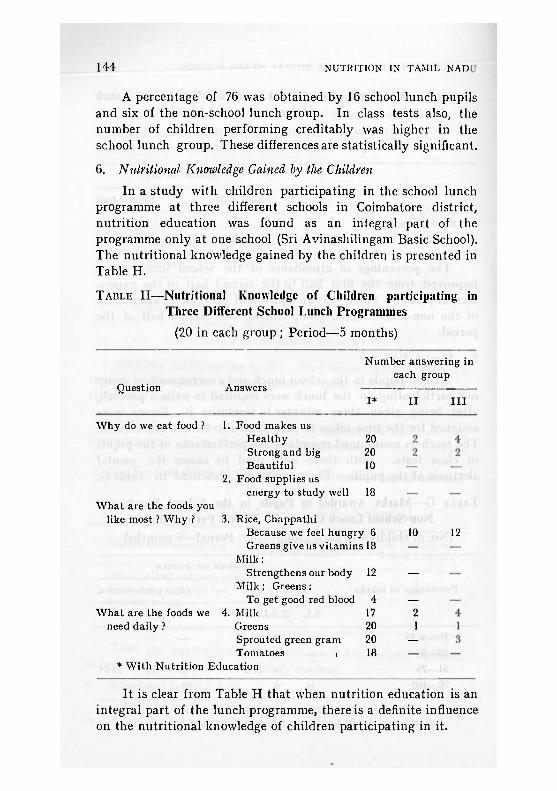
1 4 4 n u t r i t i o n i n t a m i l n a d T T
A percentage of 76 was obtained by 16 school lunch pupils and six of the non-school lunch group. In class tes ts also, the number of children performing creditably was higher in the school lunch group. These differences are statistically significant.
6. Nutritional Knowledge Gained by the Children
In a s tudy with children part icipating in the school lunch programme at three different schools in Coimbatore district, nut r i t ion education was found as an integral par t of the programme only at one school (Sri Avinashilingam Basic School). The nutr i t ional knowledge gained by the children is presented in Table H.
TABLE H—Nutritional Knowledge of Children participating in Three Different School Lunch Programmes
(20 in each g r o u p ; Period—5 months)
Number answering in each group
Question Answers — I* I I I I I
W h y do we eat food ?
What are the foods you like most ? W h y ?
1. Food makes us Heal thy 20 Strong and big 20 Beautiful 10
2. Food supplies us energy to study well 18
What are the foods we need dai ly ?
3. Rice, Chappathi Because we feel hungry 6 10 Greens give us v i tamins 18 —
Milk: Strengthens our body 12 —
Milk; Greens: To get good red blood 4 —
4. Milk 17 2 Greens 20 1 Sprouted green gram 20 — Tomatoes i 18 —
* W i t h Nutrit ion Education
12
It is clear f rom Table H that when nutr i t ion education is an integral par t of the lunch programme, there is a definite influence on the nutr i t ional knowledge of children part ic ipat ing in it.

r e s u l t s 01' s t u d i e s o n t h e m i d d a y m e a l s s c h e m e 1 4 5
7. Parents' Evaluation of School Lunch
Another s tudy was made on the impact of the school midday meals programme in changing the food habits of one hundred families. The results indicated that
(1) Parents of school lunch children who received nutr i t ion education were more conscious of the school lunch objectives than those of the non-school lunch group.
(2) Parents of the school lunch group knew more about the school lunch preparations, than those of the non-school lunch group.
(3) Parents of the school lunch group considered leafy vegetables and millets were also important for the growing child.
(4) Consumption of leafy vegetables, and millets like ragi and cholam and wheat was higher among the school lunch group than among the non-school lunch group.
(5) Parents considered that the school lunch programme had a significant influence on changing the dietary habits of children.
(6) Many children in the school lunch asked their mothers for the types of foods served in the school lunch.
N—10

1 4 6 n u t r i t i o n i n t a m i l n a d T T
A N N E X U R E XI I
DAILY FOOD FOR EXPECTANT AND NURSING M O T H E R S
The approximate cost and quanti t ies of daily foods for moderately active expectant and nursing mothers are tabulated below.
Cost and Quantities of Daily Foods for Moderately Active Mothers
Unit Expectant Mother Nursing Mother price Amount Cost Amount Cost
Food
per litre/ kg. Rs.
in grams per portion
Rs.
in grams per portion
Rs.
Cow's milk 1-05 120 0-126 120 0-126
Pulses, mixed (average price) 1-90 45 0-086 60 0-114
Fruit in season 0-20 100 0-020 100 0-020
Dark leafy vegetables 0-20 100 0-020 130 0-026
Other vegetables 0-60 70 0-042 80 0-048
Rice, parboiled 1-25 140 0-177 160 0-200
Ragi flour 0 .65 140 0-090 160 0-104
Wheat ravai, flour, whole 1-25 120 0-150 130 0-163
Cholam or maize ravai, flour 0-65 120 0-078 140 0 091
Jaggery 1 8 0 25 0-045 42 0-077
Groundnut oil 3-50 15 0-052 20 0-070
Seasoning, spice, coconut — — 0-024 — 0 031
Total 0-910 1-070
The dietary costs are limited by the estimate of 79 Paise as the minimum necessary to purchase foods supplying 2200 calories daily. A higher purchasing ceiling would make diets more varied and palatable as more milk, pulses, f ru i t , vegetable, jaggery, oil and spices could be included and the quanti t ies of cereals considerably reduced.
Calories and nut r ien ts of the diets were computed, tabulated and compared with the Indian Recommended Daily Dietary Allowances (13) as shown below :

d a i l y f o o d f o r e x p e c t a n t a n d n u r s i n g m o t h e r s 147
Nutrient Contents of Diets for Moderately Active Mothers Compared with the Recommended Daily Dietary Allowances
Nutrient Expectant Mother
R A Diet
Nursing Mother
RA Diet
Calories Protein, g. Calcium, mg. Iron, mg. Carotene, I.U. Thiamine, ing. Riboflavin, mg. Niacin, mg. Ascorbic acid, mg.
2500 55
1000
40 3000
1-3 1-4
17 50
2500 62-3
1302 60-5
7965 2.8 1-4
20-2 124
2900 65
1000
30 4600
1-5 1-6
20 80
2900 72-8
1527 85.2
9638 3-2 1-7
22-9 155
The making up of a mother 's diet is i l lustrated below in a two-day menu pat tern. Meals aie practically interchangeable.
Menu
Day Breakfast Lunch Supper
1. Cholam uppuma Savoury steamed Dhal Currie Fruit Ragi Adai Rice
Grated Carrot
2. Ragi Putin Milk
Rice and Dhal Kitcheri Amaranth
Wheat Pongal
Tiffin
Wheat Mallilha Milk
Maize Bread Sliced Tomato Fruit
The cost and quanti t ies of foods for the menus are tabulated belqw. The slight variation in the cost of pulses is reciprocated in the seasoning costs.
N—11

S c . 5 O c3 V fa
h e 3 ol O f a 60
<.a
s ( S -fa
<a •o o
T3 C
c .a ni fa
" '3 fa
6.K U
6 <3 u bo a
13 O O fa •e a rt
<A« R--O N O W
O "O lO O O) ^ O M
» s « o
s SP oq fa
C g v C to o to o rt o -> O
—i r- —< m o o G W -H O N ^ N
» o o m co ro o t Ol O O »-< o <N
o io in io io
s to c '3 o +> <3 R ^ D fi U ..
C Q O W O O O c n f a
© o
vf — CO C£> — IM CM «
CO O O 03 « •st" O CN —< —•
o in o in
8>3 s m fa m
f « 3 as c 13 ° rt ui C — gS ^ 'X v < O in
o H
^ co m o co O O O C*1 •—1 CD
O O) CO (flic CO Ol a> o o o o o
o H
O t) T3 s « a 5 a .2 I -s a s
to 3
M faOOuCOc/)

< o
o g w5 X 0 £ a w w H O
o .h ns A PH
0 a p a 6 o rt J fe <
o
•a o o h •a B
PH
0 cn § « §
< bo
co co CD CO o
o O CO co CO CM 1-1
o cn a> M CM o
> § to a (3 . _ o
•ft, <u <0
H S >>
Th co in r o O —I CM O CM
o r- o t
00 CO CO CO o 1 - O — O CM
o m o CM CO
3 o
^ ki r 1-. -j 'm i? O O O O O
" f t : V V h S O
rt 6 ~ o H O
bo g '3 o .
<r.I (JH
as o H
a ft
!* O Q
o g en pi P «
W M H O
o .H d O An
g a |
ifi ri <3 r
o o C rt 8' <
o O co O) O CO •—" •—" o
o o co o in to
t; O CI + o to O tO O 1—I O '—' r—1
o O m o o -i1 n rt «
CO T CD t D CM
o o
o m to m CM
•a o o fn X) c
3 O « S* 4-» s ni <D <5 v bo ,
o H
£ « tf o o $ h £
o H CO
V. rt ft

1 5 0 n u t r i t i o n i n t a m i l n a d T T
A N N E X U R E X I I I
DAILY F O O D FOR ADOLESCENT GIRLS AND BOYS
The cost and quanti t ies of daily food for adolescent girls and boys are tabulated below :
Cost and Quantities of Daily Foods for Adolescent Girls and Boys
Food
Uni t price per
litre/kg.
G I R L 13 to 18 years old
B O Y 13 to 18 years old
Food
Uni t price per
litre/kg. Cost per Cost per
Amount portion Amount portion Rs. in grams Rs. in grams Rs.
Cow's milk 1-05 120 0-126 120 0-126
Pulses, mixed (average price) 1-90 45 0-086 60 0-114
Fruit in season 0-20 100 0-020 100 0-020
Dark leafy vegetables 0-20 60 0-012 120 0-024
Other vegetables 0-60 60 0-036 80 0-048
Rice, parboiled 1-25 100 0-125 120 0-150
Wheat ravai, flour 1-25 100 0-125 120 0-150
Cliolam or maize ravai 0-65 130 0-085 160 0-104 Ragi flour 0-65 130 0-085 160 0-104
Jaggery 1-80 18 0-032 24 0-043 Groundnut oil 3-50 12 0-042 18 0-063 Seasoning, spice, coconut — — 0-016 — 0-024
Total 0-790 0-970
The cost of diets for adolescent girls and boys is limited by the estimate of 79 Paise for purchasing food to supply 2200 calories daily. A higher purchasing ceiling would make the diets more varied and palatable as the quant i ty of cereals could be considerably reduced and replaced by more milk, pulses, f rui t , vegetables, jaggery and oil.
Calories and nut r ients of the diets have been computed, tabulated and compared with the Indian Recommended Daily Dietary Allowances of Nutr ients (13), as shown below :
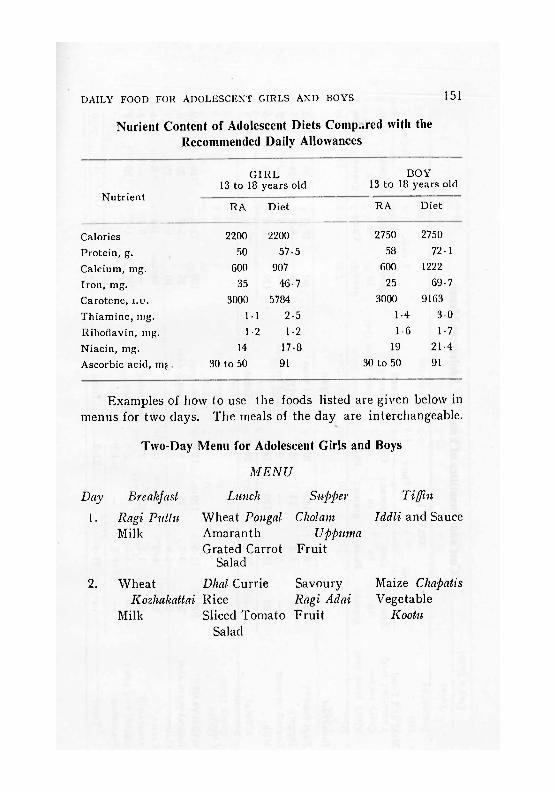
d a i l y f o o d f o r a d o l e s c e n t g i r l s a n d b o y s 151
Nurient Content of Adolescent Diets Compared with the Recommended Daily Allowances
Nutr ient
Calories
Protein, g.
Calcium, mg.
Iron, mg.
Carotene, i .u. Thiamine , mg.
Riboflavin, mg.
Niacin, mg.
Ascorbic acid, m^
G I R L 13 to 18 years old
R A Die t
2200 2200
50 57-5
600 907
35 46 .7
3000 5784
1-1 2-5
1-2 1-2
14 17-8
30 to 50 91
B O Y 13 to 18 years old
R A Die t
2750 2750
58 72 • 1
600 1222
25 69-7
3000 9163
1-4 3 0
1 6 1-7
19 21-4
30 to 50 91
Examples of how to use the foods listed are given below in menus for two clays. The meals of the day are interchangeable.
Two-Day Menu for Adolescent Girls and Boys
MENU
Lunch Supper Day
1.
Breakfast
Ragi Puttu Milk
2. Wheat
Wheat Pongal Cliolam Amaranth Uppuma Grated Carrot F ru i t
Salad
Dhal Currie
Tiffin
Iddli and Sauce
Savoury Kozliakattai Rice Ragi Adai
Milk Sliced Tomato Frui t Salad
Maize Cliapatis Vegetable
Kootu

t* < ft
-d o o fa •d q <3
!* < A
fa
° .S '3 ° fa
a s 3 « 6 § -s a | a
o CJ
a c s O c a c
cci H bo
o O
C3 c/) § s § a 2
<2.
01
co co r to (N O N
o O> CM
o c-j in to O CO O CM
a •OS a K Ol
a) bo -d • t-t T3 CD ID
3 O <C e ft;
w t! to
bo ^ * O §
CO t ^ CD
o 4 o w
i* M in to CO CO O CM
>o s
O O CT) —I CO CM m co o o -1
IN O O ^ N N cm in o o
o in o ^ O CM
"f
a cS H 60 T3
bo a '3 • o
8 « rt S SJ
o H
fa fa O O (?) H
O CM CT) M O in H o CM cj
m m CT) CT> CM co co CM CO O O •-' "-i O
o in m m o in O N « H ®
a s bo d bo a
- -2. « C CD is fa o o
a d i-d S ~ < O
o H

O O
t* <1 p
3 « s a - 2 hr
o.a <« O fc
p 2 a a a o — n) P ^ 5 bo
o o fn •a e a)
< P
p 3 3 3 B O — cJ p 5 bo
r- co ° .5 O i4
3 cn g.s S a
•d o o h T) B
^ f f l i O i O N ^ O S O O O O O ^ C M O C M
o in ffl co o to
lOliJCOCOCO^INO CO O O O © 1—1 O CM
o © m in o
5 u 3 . O
t ® S? s to
S c O <U - ' C J
•O B ni
bo B '3 o • "1 p. s o o u a o f f l h
•3, CM in O O m O — O CM CM
in oi ci co o co CO O O O CM —'
•ft, •ft.
!3 £ C o 4J o Ui <U rt r3
(/) O O O c/) fr O
H RH M CO N O ^ O —' O Ol O
O O O ( D CO M ( O H
IT) in f^ iD iO yp CO N N O O Jt O
o O o o o CO ( N C S CO - H
a
a
o ai
a o £ bo •
® r; 4) a i, r si S £ ffl c/fO O (/j >>
P
o in to
-f CM o — 6
m ai CM
CO T o o o
2 5 a oj n -C h S c 3
bo a '3 o ^ o o h p
h. K B U H O O o )
o H in V, CT3 p

1 5 4 n u t r i t i o n i n t a m i l n a d T T
If colleges and industry wish to provide midday meals for adolescent girls and boys, the cost per meal will be approximately 26 and 32 Paise respectively to ensure that each meal provides one-third of the recommended daily dietary allowances of nutr ients . In addition, the cost of fuel, labour and overhead expenses must be calculated.
A N N E X U R E XIV
BUDGET ESTIMATE FOR THE DEPARTMENT OF NUTRITION
(Recurring)
State Detai ls Directorate Districts Total
1. Salary 10,00,000-00 34,40,000-00 44,40,000 00
2. Travel l ing Allowance 25,000-00 3,00,000-00 3,25,000 00
3. Rent 36,000-00 31,200-00 67,200 00
4. Stationery 15,000-00 13,000-00 28,000 00
5. Contingencies 25,000-00 39,000-00 64,000 00
6. Petrol and Vehicle Main-tenance 15,000-00 1,35,000-00 1,50,000 00
Total 11,16,000-00 39,58,200-00 50,74,200 00 Total (Non-recurring) 3,54,500-00 11,64,000-00 15,18,500 00
Progressive Total 14,70,500-00 51,22,200-00 65,92,700 00
Rs. in lakhs Rs. in Crores Total Expenditure for 12 years 5 0 - 7 4 x 1 2 = 6-089 Non-recurring expenditure = 0-152
(as per details g iven below) Total = 6-241

b u d g e t e s t i m a t e f o r t h e d e p a r t m e n t o f n u t r i t i o n 1 5 5
Abstract Estimate for the Proposed Nutritior Directorate
(Non-Recurring)
State Details Directorate Districts Total
1. Printing press & accessories 97,000-00 97,000-00
2. Cinema unit with Van 46,000-00 46,000-00
3. Exhibition unit with Van 50,000-00 50,000-00
4. Audio-visual accessories— f~ Tape recorder, amplifier, etc. 3,000-00 3,000-00
5. Equipments for artist-c«m-photographer 20,000-00 20,000-00
6. Calculating machines 10,000-00 10,000-00
7. Typewriter & duplicators ( 1 3 + 6 for the Directorate and 13+13 for districts) 28,500-00 39,000-00 67,500-00
8. Initial expenses for food-processing 50,000-00 50,000-00
9. Cost of vehicles—2 for the Directorate, 6 for the regional officers, 13 for the district officers and 26 for mobile units 50,000-00 11,25,000-00 11,75,000-00
Total 3,54,500-00 11,64,000-00 15,18,500-00

REFERENCES
1. Berg, Alen D. Malnutrition and National Development, Council of Foreign Relations Inc., 1967.
2. Cravioto, J., E.R. Delicardie, C. Pinero, M. Lindero, M. Arroyo and E. Alcade. Mental Development and Malnutrition, Proceedings of the Nutr i t ion Society of India, 10, 1971.
3. Nutrition and Working Efficiency. Freedom from Hunger Campaign—Basic Study 5, Food and Agricultural Orga-nisation, Rome, 1966.
4. Venkataswamy, G. Malnutritional Blindness in India, J . of Inch Med. Assn., 47, 1966.
5. McLaren, D.S., Malnutrition and the Eye, Academic Press, London,1963.
6. Cook, R. The Financial Cost of Malnutrition in the Common-wealth Caribbean, J . of Trop. Ped., 14, 1968.
7. Boerma, A.H. Key-note address to the First Asian Congress of Nutrition, Hyderabad, Nutr i t ion News Letter 9, 1971.
8. Gopalan, C. Ill Worldwide Experience. Special Problems and Preventative Programmes (1) India, J . of Trop. Ped. 14, 1968.
9. Raju, B.V. Unpublished communications, 1972.
10. Scrimshaw, N.S., C.E. Taylor and J .E. Gordan. Interactions of Nutrition and Infection, World Health Organisation, Geneva, 1968.
11. Dandekar, V.M. Poverty in India, Economic and Political Weekly, Bombay, 1971.
12- Gopalan, C., S.C. Balasubramanian, B.V. Rama Sastri, and K. Visweswara Rao. Diet Atlas of India, Nat. Inst , ol Nutr i t ion, ICMR, Hyderabad, 1969.
13. Gopalan, C., B.V. Rama Sastri and S. C. Balasubramanian, Nutritive Value of Indian Foods, Nat. Inst , of Nutri t ion, ICMR, Hyderabad, 1971.

REFERENCES 157
14. Food Habits in Madras State, Census of India, Vol. II, 1964.
15. Dept. of Statistics. National Sample Survey, 24th Round, 1971.
16. Devadas, Rajammal P., Rohini Sambamurthy, Mercy Vasantha Kumari Devadoss, R. Mira Bai and A. Radha-rukmani. A Dietary and Nutritional Survey of a Small Village Community in South India, Ind. J. of Nutr . & Diet. 1, 1964.
17. Production Figures, Based on the Final Forecast from the Dept. of Statistics.
18. Gopalan, C., and K. Vijaya Raghavan. Nutrition Atlas of India, Nat. Inst, of Nutrit ion, ICMR, Hyderabad, 1969.
19. Ghosh, S., S.K. Bhargava and V. Bhargava. Groivtli Patterns of Babies in Delhi Area in the First Year of Life, Proceed-ings of the Nutr . SQC. of India, 10, 1971.
20. Gopalan, C. Nutrition and Development, Nat. Inst, of Nutri-tion, ICMR, Hyderabad, 6, 1972.
21. Bogert, L. Jean, George M. Briggs and Doris Howe Calloway. Nutrition and Physical Fitness, W.B. Saunders Co., Philadelphia, 1966.
22. Jelliffe, D.B. The Assessment of the Nutritional Status of the Community, World Health Organisation, Geneva, 1966.
23. Stearnes, Genevieve, Nutritional Status of the Mother Prior to Conception, Nutrit ion in Pregnancy, Symposium IV. Council on Foods and Nutri t ion. Am. Med. Assn., Chicago, 1958.
24. Maternal Nutrition and Course of Pregnancy, National Academy of Sciences, Washington, D.C., 1970.
25. Coimbatore District Secondary Schools Medical Aid Com-mittee—Coimbatore—Second Annual Report—1970-71.
26. Government of Tamil Nadu—Finance Dept., Economic Appraisal—Tamil Nadu—1971-72.

1 5 8 n u t r i t i o n i n t a m i l n a d u
27. Avinashilingam, T.S., Seminar on Nutr i t ional Feeding in the Four th Plan, Sri Avinashilingam Home Science College, 1970.
28. Devadas, Rajammal P. and A. Radharukmani . The Growth and Nutritional Status of School Children, Ind. J . of Nutr . & Diet. 1, 1964.
29. Sundaravadivelu, N.D., Midday Meals Scheme—Growth of a Massive Movement, Yojana 14, 1969.
30. Davidson, Sir S. and R. Passmore Human Nutrition and Dietetics, E and S. Livingstone Ltd. , Edinburgh and London, 1968.
31. Robinson, Corinne. Fundamentals of Normal Nutrition, The MacMillan Co., New York, 1968.
32. Food. The Year Book of Agriculture 1959, U.S. Dept. of Agri., Washington, D.C., 1959.
33. Ritchie, Jean A.S. Learning Better Nutrition, Food and Agri-cultural Organisation, Rome, 1967.
34. Macy, Icie G. Metabolic and Biochemical Changes in Normal Pregnancy, Nutr i t ion in Pregnancy, Symposium IV Council on Foods and Nutri t ion, Am. Med. Assoc., Chicago, 1968.
35. Recommended Dietary Allowances, National Academy of
Science, Washington, D.C., 1963.
36. Health and Nutrition, Monthly commentary, 5, 1968.
37. Barnes, R.H. Effect of Malnutrition on Mental Development, Am. J . of Home Ec., 611, 1969.
38. Hotzel, D. Working Efficiency and Its Dependence on Nutritional Status, Berlin-Gressan Seminar, Spring 1966.
39. Report of the Latin American Seminar on the Planning and Evaluation of Applied Nutrition Programs, PAHO/WHO, Washington, D.C., 1967.
40. Low, D.I.D. Evaluating Nutrition Education Programmes on Tivo Islands in the Caribbean. Ph. D. Thesis, U. of Calif., 1970.

r e f e r e n c e s 1 5 9
41. Gandhi, Indira. Towards Growth with Social Justice, Budget Message, 1970.
42. Subramaniam, C. Strategy Statement on Action to Avert the Protein Crisis in the Developing Countries, Dept. of Econ. and Soc. Affairs, United Nations, New York, 1971.
43. Boerma, A.H. Address to the Second World Food Congress. The Hague, 1970.
44. Jaganna than , Maithily. Up in Arms for the Consumers, The Hindu, Sunday, April 11, 1971.
45. Rao, Mohan, District Health Office, Coimbatore, unpublished communication.
46. India, A Reference Annual 1971-72, Ministry of Informat ion and Broadcasting, New Delhi, 1972.
47. Collins, C. P. Food Hygiene Ashore and Afloat; Pi tman Medical Publishing Co. Ltd. London, 1952.
48. Hobbs, Betty, C. Food Poisoning and Food Hygiene, Edward Arnold and Co., London, 1952.
49. Irving, G. W. and S. R. Hoover. Food Quality—Effects of Production, Practices and Processing, Amer. Assn. for the Advancement of Science, Washington, D. C., 1965.
50. Aykroyd, W. P. and J . Doughty. Legumes in Human Nutri-tion, FAO, Rome, 1964.
51. Nicholls, L. Tropical Nutrition and Dietetics, Bailliere, Tindall and Cox, London, 1945.
52. Times of India Directory and Who's Who, 1971.

;s
1,
2.
3.
4,
5.
6 .
7.
8.
9.
10
1 1 .
1 2 .
LIST OF TABLES
DAILY ALLOWANCES OF NUTRIENTS FOR INDIANS
MEAN PER CAPITA DAILY CONSUMPTION OF
CALORIES AND PROTEINS IN THE DIFFERENT
STATES OF THE INDIAN UNION
P E R CAPITA MEAN DAILY FOOD CONSUMPTION IN TAMIL N A D U
FOOD CONSUMPTION PATTERN IN TAMIL NADU — 1 9 6 1
PERCENTAGE DISTRIBUTION OF POPULATION
ACCORDING TO MONTHLY PER CAPITA EXPENDI-
TURE CLASSES IN 1 9 6 9 - 7 0 IN TAMIL N A D U
CALORIE AND NUTRIENT INTAKE OF SELECTED GROUPS IN COIMBATORE DISTRICT
POPULATION PROJECTIONS AND DISTRIBUTIONS IN TAMIL NADU ( A g e G r o u p s )
PROTEIN-CALORIE REQUIREMENTS FOR POPULA-
TION OF TAMIL NADU ACCORDING TO THE I C M R
RECOMMENDATIONS ( 1 9 6 8 )
PRODUCTION IN TAMIL NADU OF CEREALS AND
PULSES AND CALORIES AND PROTEIN AVAILABLE
FROM THEIR EDIBLE PORTION 1 9 7 0 - 1 9 7 1
MEAN LENGTH, HEIGHT AND WEIGHT OF CHILDREN
IN COIMBATORE DISTRICT AND PERCENTAGE
ATTAINMENT OF STANDARD WEIGHT FOR LENGTH/
HEIGHT, AGE AND SEX
MORBIDITY PATTERN AMONG CHILDREN BELOW TEN YEARS OF AGE IN TAMIL NADU
MORBIDITY IN SELECTED RURAL AREAS OF TAMIL NADU

l i s t o f t a b l e s 1 6 1
Tables P a g e
13 . INCIDENCE OF MALNUTRITION AMONG CHILDREN . . . 2 3
14 . PERCENTAGE OF PUPILS SUFFERING FROM VARIOUS
DEFECTS/DISEASES IN SELECTED SECONDARY
SCHOOLS IN COIMBATORE DISTRICT DURING
1 9 7 0 — 7 1 . . . 2 4
15 . PERCENTAGE PREVALENCE OF NUTRITIONAL
DEFICIENCY SIGNS IN TAMIL N A D U . . . 2 5
16 . MAIN CAUSES OF MORTALITY AMONG PRE-SCHOOL
AGE-GROUP IN MADRAS . . . 2 6
17 . T O T A L NUMBER OF CHILDREN WITH MALNUTRI-
TION TREATED IN MADRAS INSTITUTE OF CHILD
H E A L T H DURING 1 9 7 1 . . . 2 7
18 . ON-GOING FEEDING PROGRAMMES IN T A M I L N A D U . . . 3 1
19 . CALORIC AND PROTEIN DEFICITS AND NEEDS
OF SELECTED VULNERABLE GROUPS IN T A M I L
N A D U . . . 3 7
2 0 . COST, QUANTITY AND NUTRITIVE VALUE OF FOOD-
STUFFS USED PER CHILD PER MEAL . . . 5 0
2 1 . W E E K L Y MENU IN SRI AVINASHILINGAM BASIC
SCHOOL MIDDAY MEALS . . . 5 1
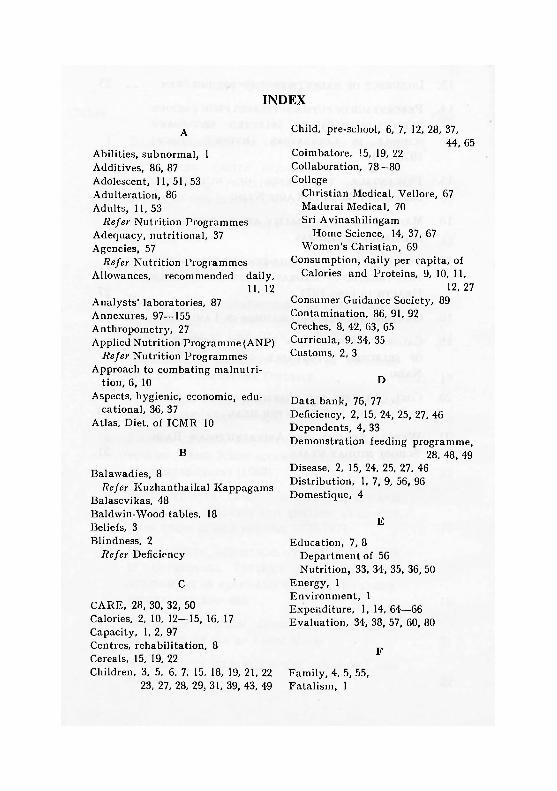
INDEX
A
Abilities, subnormal, 1 Additives, 86, 87 Adolescent, 11 ,51 ,53 Adulteration, 86 Adults, 11, 53
Refer Nutrition Programmes Adequacy, nutritional, 37 Agencies, 57
Refer Nutrition Programmes Allowances, recommended daily,
11, 12 Analysts' laboratories, 87 Annexures, 97—155 Anthropometry, 27 Applied Nutrition Programme (ANP)
Refer Nutrition Programmes Approach to combating malnutri-
tion, 6, 10 Aspects, hygienic, economic, edu-
cational, 36, 37 Atlas, Diet, of ICMR 10
B
Balawadies, 8 Refer Kuzhanthaikal Kappagams
Balasevikas, 48 Baldwin-Wood tables, 18 Beliefs, 3 Blindness, 2
Refer Deficiency
C
CARE, 28, 30, 32, 50 Calories, 2, 10, 12—15, 16, 17 Capacity, 1, 2, 97 Centres, rehabilitation, 8 Cereals, 15, 19, 22 Children, 3, 5, 6, 7, 15, 18, 19, 21, 22
23, 27, 28, 29, 31, 39, 43, 49
Child, pre-school, 6, 7, 12, 28, 37, 44, 65
Coimbatore, 15, 19, 22 Collaboration, 7 8 - 8 0 College
Christian Medical, Vellore, 67 Madurai Medical, 70 Sri Avinasliilingam
Home Science, 14, 37, 67 Women's Christian, 69
Consumption, daily per capita, of Calories and Proteins, 9, 10, 11,
12, 27 Consumer Guidance Society, 89 Contamination, 86, 91, 92 Creches, 8, 42, 63, 65 Curricula, 9, 34, 35 Customs, 2, 3
D
Data bank, 76, 77 Deficiency, 2, 15, 24, 25, 27, 46 Dependents, 4, 33 Demonstration feeding programme,
28, 48, 49 Disease, 2, 15, 24, 25, 27. 46 Distribution, 1, 7, 9, 56, 96 Domestique, 4
E
Education, 7, 8 Department of 56 Nutrition, 33, 34, 35, 36, 50
Energy, 1 Environment, 1 Expenditure, 1, 14, 64—66 Evaluation, 34, 38, 57, 60, 80
F
Family, 4, 5, 55, Fatalism, 1

i n d e x 163
Feeding programmes, 29—-33, 57 Refer Nutrition Programmes
Foods, 1, 2, 6, 9, 13, 50, 72, 86, 96, 97 Food patterns, 12, 73 Food poisoning, 9)—93, 94
G
Goals, 7, 8, 9, 81 Groups, 1, 15, 20, 36, 37, 43, 45, 81 Growth, 1, 2, 9, 40. 43, 44, 51, 52
H
Habits, 1, 3, 4, 5, 13, 41, 55, 72 Health Centres, (PHC), 20, 23, 30,
31, 65 Health Education
Refer Education Hospitals, 2
I
I.C.M.R., 9, 106 Ignorance, 4 Immunisation, 6 Infants , 4, 5, 11, 12, 19, 40
Refer Nutrition Programmes Infections, 3, 5, 21, 22, 91 Infestations, 3, 5, 32, 95, 96 Intake, 1,3, 15 Institute of Child health, 20, 26,
27, 68
K
Kuzhanthaikal Kappagams, 8, 28, 29, 31, 32, 37, 44, 62—66
M
Mahalir Manrams, 80 Malnutrition, 1, 2, 3, 5, 6, 10, 20,
27, 28, 48 Midday Meals Scheme, 29, 32, 33,
49,51, 57 Morbidity, 2, 10, 20, 21, 22, 27 Mortality, 3, 10, 25—27 Mothers, expectant and nursing, 17
Refer Groups, Nutrition Program-mes
N
National Sample Survey, 14 Nutrients, 2, 10, 70 Nutrition, Ibid.
Department of, 8, 58, 59, 60, 81 Plan, 62—66, 76 Programmes, 28, 29, 30, 31, 34,
43, 45, 48, 51, 53, 57, 58, 65, 74, 78—80
Research, 66—75 Strategies, 76 Systems approach, 70 Status, 70, 71
O
Objectives, 80 Organisational Structure
Refer Department of Nutrition
P
Parameters, 4, 10, 19, 81, 82 Parasites, 90 Panchayats, 32 Pests, 32, 86, 95 Poisoning 93, 94, 95
Refer Food Policy, 7, 89 Population, 1, 3, 7, 9, 10, 11, 14—27 Poverty line, 7, 8, 42, 48, 56 Pre-scliools, 25, 26, 29, 44 Prevention of
Food Adulteration Act, 87 Prices, 9, 56 Primary schools, 49 Productivity, 2 Pro forma, 83, 84, 85 Programmes, 35, 36
Refer Nutrition Projects, 9, 67—75 Proteins, 2, 10, 11, 12, 15, 16, 17, 18,
44 Pulses, 17
Purchasing power, 3, 4
R References, 156—159

1 6 4 n u t r i t i o n i n t a m i l n a d T T
Rehabil i tat ion, 48 Requirements, 1, 9, 55 Revolution, Green, 18 Rural Inst i tute ,
Gandhigram, 66
S
Sanitat ion, 6 Services, 1, 58 Stamina, 1 S t r a t a , 4 Statistics, 12—15,20—27 Surveys, 23, 25
T
Tables, l ist of, 160 161 Tamil Nadu, 3, 7, 9, 12, 13, 17, 29,
35, 36, 39, 50, 80, 87
V Vi tamins
Refer Deficiencies
W
Water-supply, 6, 32 Weight, 18
Refer Parameters Workers, 9, 61 ,80 Woodbury tables, 18