M&A in Real Estate: The Value and Effect of Synergies in ...
129
Copenhagen Business School, 2017 MSc. Financing and Accounting / MSc. Applied Economics and Finance Authors: Eirik Wabø Arnesen & Oscar Thøger Maltesen Supervisor: Jon Skjernov Date of Submission: May 15 th , 2017 Number of Pages: 119 Number of Characters: 271,659 (incl. spaces) Number of Standard Pages: 119 M&A in Real Estate: The Value and Effect of Synergies in Castellum’s Acquisition of Norrporten Master’s Thesis
-
Upload
khangminh22 -
Category
Documents
-
view
2 -
download
0
Transcript of M&A in Real Estate: The Value and Effect of Synergies in ...
Copenhagen Business School, 2017 MSc. Financing and Accounting / MSc. Applied Economics and Finance
Authors: Eirik Wabø Arnesen & Oscar Thøger Maltesen
Supervisor: Jon Skjernov
Date of Submission: May 15th, 2017
Number of Pages: 119 Number of Characters: 271,659 (incl. spaces) Number of Standard Pages: 119
M&A in Real Estate: The Value and Effect of Synergies in
Castellum’s Acquisition of Norrporten
Master’s Thesis
Executive summary
1
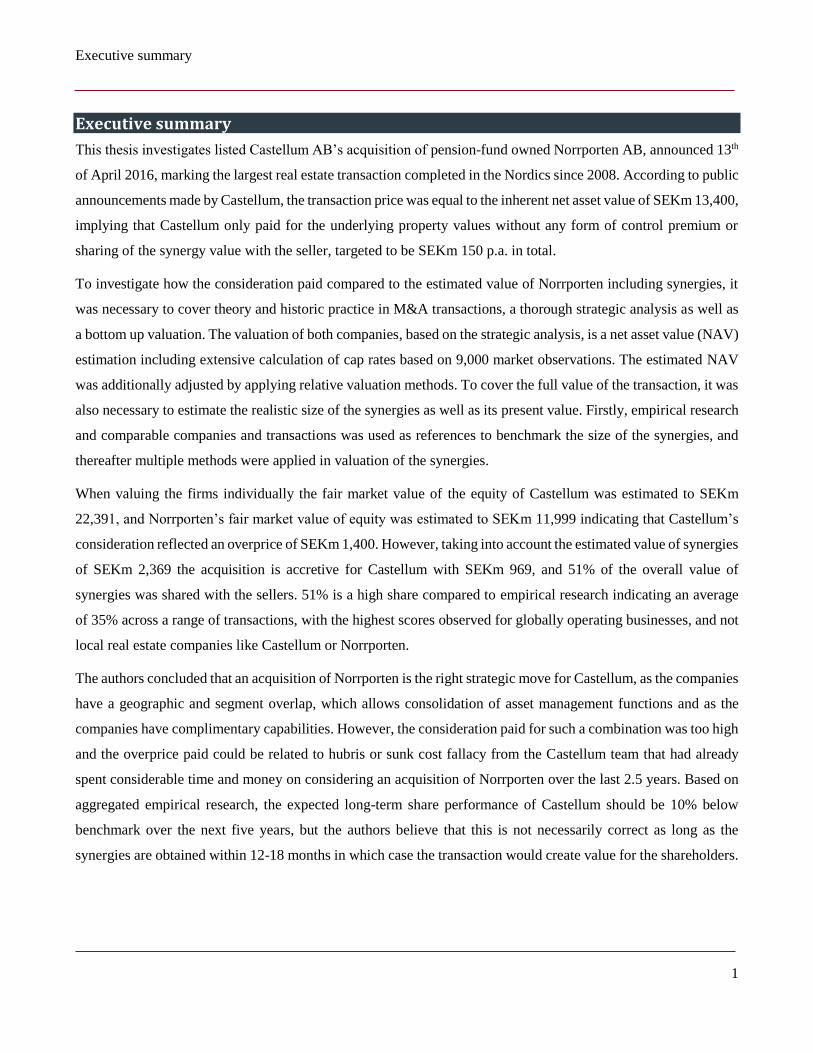
Executive summary
This thesis investigates listed Castellum AB’s acquisition of pension-fund owned Norrporten AB, announced 13th
of April 2016, marking the largest real estate transaction completed in the Nordics since 2008. According to public
announcements made by Castellum, the transaction price was equal to the inherent net asset value of SEKm 13,400,
implying that Castellum only paid for the underlying property values without any form of control premium or
sharing of the synergy value with the seller, targeted to be SEKm 150 p.a. in total.
To investigate how the consideration paid compared to the estimated value of Norrporten including synergies, it
was necessary to cover theory and historic practice in M&A transactions, a thorough strategic analysis as well as
a bottom up valuation. The valuation of both companies, based on the strategic analysis, is a net asset value (NAV)
estimation including extensive calculation of cap rates based on 9,000 market observations. The estimated NAV
was additionally adjusted by applying relative valuation methods. To cover the full value of the transaction, it was
also necessary to estimate the realistic size of the synergies as well as its present value. Firstly, empirical research
and comparable companies and transactions was used as references to benchmark the size of the synergies, and
thereafter multiple methods were applied in valuation of the synergies.
When valuing the firms individually the fair market value of the equity of Castellum was estimated to SEKm
22,391, and Norrporten’s fair market value of equity was estimated to SEKm 11,999 indicating that Castellum’s
consideration reflected an overprice of SEKm 1,400. However, taking into account the estimated value of synergies
of SEKm 2,369 the acquisition is accretive for Castellum with SEKm 969, and 51% of the overall value of
synergies was shared with the sellers. 51% is a high share compared to empirical research indicating an average
of 35% across a range of transactions, with the highest scores observed for globally operating businesses, and not
local real estate companies like Castellum or Norrporten.
The authors concluded that an acquisition of Norrporten is the right strategic move for Castellum, as the companies
have a geographic and segment overlap, which allows consolidation of asset management functions and as the
companies have complimentary capabilities. However, the consideration paid for such a combination was too high
and the overprice paid could be related to hubris or sunk cost fallacy from the Castellum team that had already
spent considerable time and money on considering an acquisition of Norrporten over the last 2.5 years. Based on
aggregated empirical research, the expected long-term share performance of Castellum should be 10% below
benchmark over the next five years, but the authors believe that this is not necessarily correct as long as the
synergies are obtained within 12-18 months in which case the transaction would create value for the shareholders.
Table of Contents
2
Table of Contents
EXECUTIVE SUMMARY ....................................................................................................................................................... 1
TABLE OF CONTENTS ......................................................................................................................................................... 2
1.1. INTRODUCTION ............................................................................................................................................................. 4
1.2. PROBLEM STATEMENT ................................................................................................................................................... 5
1.3. METHODOLOGY ............................................................................................................................................................ 8
1.4. DELIMITATION AND ASSUMPTIONS ................................................................................................................................. 10
2. OVERVIEW OF THE TRANSACTION ...................................................................................................................... 11
3. INTRODUCTION TO REAL ESTATE ........................................................................................................................ 13
3.1. INVESTING IN REAL ESTATE ............................................................................................................................................ 13
3.2. SUPPLY- AND VALUE CHAIN ........................................................................................................................................... 16
3.3. REAL ESTATE IN SWEDEN .............................................................................................................................................. 18
4. INTRODUCTION TO CASTELLUM AND NORRPORTEN ........................................................................................... 19
4.1. CASTELLUM ................................................................................................................................................................ 19
4.2. NORRPORTEN ............................................................................................................................................................. 24
5. STRATEGIC ANALYSIS .......................................................................................................................................... 28
5.1. PESTEL .................................................................................................................................................................... 28
5.2. PORTERS FIVE FORCES .................................................................................................................................................. 47
5.3. VRIO ANALYSIS .......................................................................................................................................................... 57
6. FINANCIAL ANALYSIS........................................................................................................................................... 65
6.1. DEFINITION AND INTRODUCTION OF PEER GROUP .............................................................................................................. 65
6.2. THE REOC FINANCIAL STATEMENT ................................................................................................................................. 68
6.3. ACCOUNTING POLICY ................................................................................................................................................... 70
6.4. RECLASSIFICATION OF FINANCIAL STATEMENTS ................................................................................................................. 71
6.5. PROFITABILITY BENCHMARK ........................................................................................................................................... 72
6.6. LEVERAGE AND LIQUIDITY BENCHMARK ............................................................................................................................ 75
6.7. RELATIVE VALUATION BENCHMARK ................................................................................................................................. 77
7. SWOT ANALYSIS .................................................................................................................................................. 80
Table of Contents
3
8. VALUATION ......................................................................................................................................................... 81
8.1. CHOICE OF VALUATION METHODS ................................................................................................................................... 81
8.2. COST OF CAPITAL – THE NOI CAPITALIZATION RATE ........................................................................................................... 83
8.3. NET ASSET VALUE OF CASTELLUM .................................................................................................................................. 88
8.4. NET ASSET VALUE OF NORRPORTEN ............................................................................................................................... 91
8.5. PREMIUM TO NAV ...................................................................................................................................................... 93
8.6. RELATIVE VALUATION OF CASTELLUM AND NORRPORTEN .................................................................................................... 94
8.7. SUMMARY OF STAND-ALONE VALUATIONS ........................................................................................................................ 95
9. MERGERS & ACQUISITIONS ................................................................................................................................. 96
9.1. RATIONALE FOR M&A ................................................................................................................................................. 96
9.2 HISTORICAL PERFORMANCE OF MERGERS ......................................................................................................................... 97
9.2. FINANCIAL RETURN AT MERGER ANNOUNCEMENT .............................................................................................................. 97
9.3. LONG TERM FINANCIAL RETURN FROM MERGERS ............................................................................................................... 98
9.4. ACCOUNTING RETURNS ................................................................................................................................................ 99
9.5. REAL ESTATE SPECIFIC RESEARCH .................................................................................................................................. 100
9.6. SUMMARY ON EXPECTED REACTIONS FOR CASTELLUM ...................................................................................................... 100
9.7. REACTIONS TO CASTELLUM’S MERGER ANNOUNCEMENT ................................................................................................... 101
10. SYNERGIES ........................................................................................................................................................ 102
10.1. TYPES OF SYNERGIES .................................................................................................................................................. 103
10.2. SYNERGY ASSESSMENT................................................................................................................................................ 104
10.3. REALIZATION OF SYNERGIES ......................................................................................................................................... 108
10.4. SYNERGY VALUATION ................................................................................................................................................. 111
11. VALUATION OF COMBINED FIRMS .................................................................................................................... 114
11.1. CONCLUSION OF VALUATION ON COMBINED FIRMS .......................................................................................................... 114
11.2. SENSITIVITY ANALYSIS ................................................................................................................................................. 115
12. CONCLUSION ..................................................................................................................................................... 116
13. THE THESIS IN PERSPECTIVE .............................................................................................................................. 118
14. LITERATURE LIST ............................................................................................................................................... 119
15. APPENDIX ..................................................................................................................................... 129
Table of Contents
4
1.1. Introduction Castellum AB (hereafter “Castellum”), a listed Swedish real estate giant, was founded in conjunction with the
financial and real-estate recession in the beginning of the 1990s with the primary objective to develop the company
into a stable Swedish real-estate corporation (Castellum, n.d.) Following years of acquisitions, divestments, and
proven economic growth, Castellum went through an initial public offering in 1997, and was prior to the
transaction one of the largest listed real estate firms in the Nordics.
On April 13th, 2016, Castellum announced an acquisition of Norrporten AB (hereafter “Norrporten”), a pension-
fund owned real estate company comprising an operating platform and real estate assets with an estimated fair
value of approx. SEKbn 26 (Norrporten, 2016). The acquisition marked the largest single transaction worth of real
estate in the Nordics since 2008 with closing in the second quarter of 2016 (Tolleson, 2016). Following the closing,
all employees and real estate assets were to be integrated into Castellum.
Henrik Saxborn, CEO of Castellum made the following announcement in an investor relation press release
regarding the transaction (Castellum, 2016d):
“Together we create an even stronger real estate company with larger presence in important growth markets in
Sweden and Copenhagen. Norrporten and Castellum have many similarities, among them is the close collaboration with
customers. We can use the best of each respective organization’s knowledge and experience and thereby create shareholder
value”.
On the day of the announcement, the share price closed at SEK 125.5 per share, -3.9% down from the day before.
Ceteris paribus, this announcement performance indicates that shareholders did not believe that the merger would
create value. Empirical research on mergers & acquisitions (M&A) are vast and with great degree of contradicting
findings, but it has been found that acquirers often overpay due to hubris or overestimation of synergies, among
other factors.
Synergies is often a fundamental argument that could make or break the success of an M&A transaction, and
Castellum communicated that SEKm 150 p.a. in operational cost synergies was targeted to be realized within 12-
18 months. With a bottom-up analysis of the transaction, the authors seek to investigate whether the share price
drop was justified and if the transaction would create value for shareholders in the long-term, and if this was related
to overpricing of Norrporten or overestimation of synergies.
Table of Contents
5
1.2. Problem Statement With the context and motivation introduced above this thesis seeks to assess whether Castellum’s acquisition of
Norrporten was made at fair price through the estimated fair value of Norrporten with Castellum as buyer. This
comprehends a valuation of both Norrporten and Castellum as separate entities as well as an assessment and
valuation of the synergies resulting from consolidating the two companies. The addressed problem statement is:
How does the price paid by Castellum in its acquisition of Norrporten compare with the estimated fair value of the equity
prior to the announcement, and how does any potential synergies affect the fair value of the combined firms as of April 13th,
2016?
The thesis is built up with a range of non-exhaustive sub-questions required to answer the overall problem
statement of the thesis. The structure as presented below is also the overarching structure of the thesis.
Overview of the transaction
It will be important to illustrate the fundamentals of the details in the specific transaction. This section aims to do
this, both with regards to timeline and extent. These details will provide the platform for further analysis.
How did the acquisition process evolve, and who was involved?
How was the structure of the transaction presented?
Introduction to Real Estate
The dynamics and value drivers within the real estate market, more specifically for publicly listed companies, is
important to understand, both for the authors to accurately identify and analyze value drivers, and for readers to
understand the assumptions of the separate valuations and the combined firm value including synergies. This
chapter will present how the real estate industry is structured, mainly focusing on listed companies.
How is a real estate company structured?
Introduction to Castellum and Norrporten
By delving into the history of both companies, separate market exposures, as well as details related to the specific
companies, the authors will be better suited to understand the starting point of the consolidated company.
What is the pre-transaction organizational structure of Castellum and Norrporten?
What was the respective market position as well as geographical and segment exposure for the companies?
Table of Contents
6
Strategic Analysis
The strategic analysis will focus on the evident strengths and weaknesses of the companies, as well as opportunities
and threats they face. These findings aim to identify the value drivers for both companies in their respective
external and internal markets, which is an important backdrop when forecasting value drivers. Furthermore, this
section will reveal whether the combination of the companies made sense from a strategic point of view.
What is the exposure to the external environment?
How does the current positioning of the companies compare to the competitive landscape?
What strengths and weaknesses does the companies obtain, and do these complement each other?
Financial Analysis
By delving into financial accounts for both companies, as well as a group of similar companies (peer group), the
authors seek to analyze trends and relative financial positioning. A prerequisite for this analysis is to understand
the financial statement structure of real estate companies, why this is introduced and discussed.
How are the financial statements of real estate companies structured?
How are the companies positioned financially, and how have they performed relative to the peer group?
Valuation
After having assessed the respective company profiles and surrounding environment, the valuation section intends
to answer an important outline of the thesis. The authors will present the estimated fair value of equity and
enterprise value (EV) for both companies, regardless of the merger. This will provide useful information in regards
to whether the price paid by Castellum holds up against the estimated fair market value of Norrporten.
What techniques are best suited when valuing a listed real estate company?
What return does investors expect from real estate?
What is the estimated fair market value of equity and EV for Castellum and Norrporten?
Mergers & Acquisitions
Having presented the estimated fair value of both companies, this section will try to answer why companies engage
in M&A, as well as historical performance and expectations to M&A. The section will present the findings from
empirical research, both for general M&A, and specific findings for real estate. This will provide a platform for
understanding why Castellum would engage in M&A and whether it is expected to create value for companies and
investors.
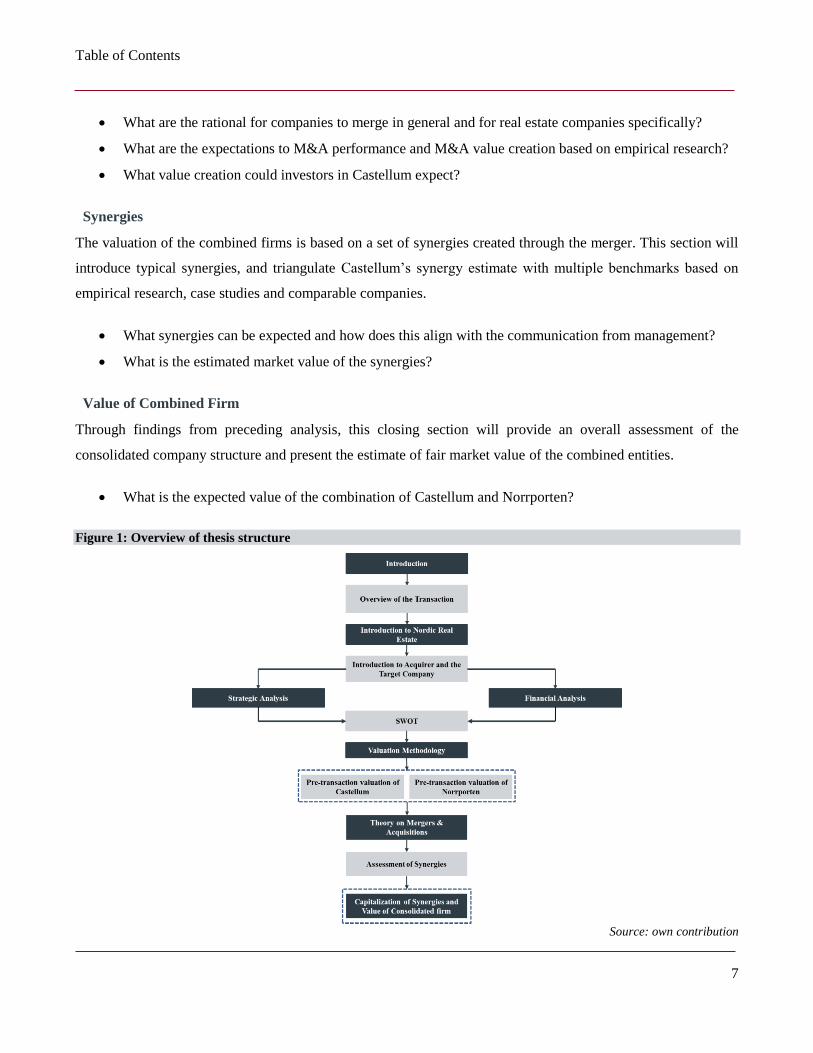
Table of Contents
7
What are the rational for companies to merge in general and for real estate companies specifically?
What are the expectations to M&A performance and M&A value creation based on empirical research?
What value creation could investors in Castellum expect?
Synergies
The valuation of the combined firms is based on a set of synergies created through the merger. This section will
introduce typical synergies, and triangulate Castellum’s synergy estimate with multiple benchmarks based on
empirical research, case studies and comparable companies.
What synergies can be expected and how does this align with the communication from management?
What is the estimated market value of the synergies?
Value of Combined Firm
Through findings from preceding analysis, this closing section will provide an overall assessment of the
consolidated company structure and present the estimate of fair market value of the combined entities.
What is the expected value of the combination of Castellum and Norrporten?
Figure 1: Overview of thesis structure
Source: own contribution
Table of Contents
8
1.3. Methodology
1.3.1. Choice of theory and models
Introduction to selected theoretical models and other theoretical discussions are integrated with the relevant
chapters and sections of the thesis. As it is not a prerequisite for reading the thesis to have profound knowledge of
real estate and M&A, this structure has been preferred to ensure that the authors motivations are as transparent as
possible for the reader and to make the thesis more reader friendly. Throughout the thesis, it has been a focus to
apply several models and theories for each topic as the analysis benefits from width in selected models (Andersen,
2003). On several occasions, theories have been conflicting and therefore supplemented and challenged each other.
It has been important to reflect different standpoints in these situations, and use the differences to highlight
potential weaknesses of the opposing theories (Andersen, 2003).
The strategic analysis is conducted for both the external environment and the internal environment with focus on
applying traditional and proven strategic frameworks. The external analysis is based on the PESTEL model, which
is a framework for analysis of the political, economic, social, technological, environmental and legal factors that
affects the operations of the companies. Further, the competitive environment and intensity is examined with the
5 forces framework developed by Michael E. Porter (1979). Of any valuation exercise, the strategic analysis of the
external environment plays a crucial part as the authors need to understand how the different strategies of the
companies will perform, position and create value relative to each other going forward (Rappaport, 1986). To
understand the internal capabilities of the companies the VRIO-model introduced by Barney (1991) is applied, the
VRIO model investigates the company’s internal capabilities as the root of superior profitability or positioning.
As this thesis includes an analysis of any additional value created from the combination of Castellum and
Norrporten, the VRIO-model is useful for getting an overview of how the companies will fit and complement each
other, and where other external capabilities or investments may be required post-merger.
The financial analysis and valuation covers both real estate specific and general metrics all based on literature
available through the library at Copenhagen Business School as recommended by Andersen (2003), except for
Poorvu (2003) published by Harvard Business School. The general metrics and concepts are based on Petersen &
Plenborg (2012), Rosenbaum & Pearl (2009) with real estate specific metrics based on Brueggeman & Fisher
(2005), Poorvu (2003), Geltner & Miller (2007). The three latter are American literature and have been adjusted
for recommendations from European Public Real Estate Association (EPRA) to ensure consistency European
practice and reporting.
Table of Contents
9
The strategic analysis is together with the financial analysis is concluded in a SWOT analysis for both companies
that summarizes the competitive positioning and lays out the key observations that impacts the valuation. For
example, from Porter’s five forces the ability to influence rental prices and the riskiness of operation in each market
will affect the estimated rental income and capitalization rate (cap rate) and hence directly affect the valuation. As
recommended in interview and further supported by literature, the valuation of the companies as separate entities
is based on the NAV model. Alternative generic and real estate specific relative valuation methods is used to stress
test the NAV and to cover potential nuances that the NAV is not able to capture. A comprehensive and more
technical discussion on choice of the NAV model is covered by section 8.1.
1.3.2. Data collection and evaluation of information
This thesis is written from the investors point of view, and therefore all data applied in this thesis are publicly
available data. However, some data and observations are based on material that are available only to a specific
party e.g. equity research reports only available for capital markets clients in an investment bank. As the majority
of shareholders in Castellum are institutional investors (Castellum, 2015), this information is assumed to ensure
that the authors level of knowledge is on par with the investor’s, and thus improve the quality of the research. A
long list of relevant financial analysts was approached for an interview, but as most requests was declined the
degree of certainty of findings in interviews are considered low due a low sample size. However, the two interviews
completed are considered to be highly relevant but are sought supported and triangulated by other sources and
findings. Both interviews were conducted in a semi-structured form (Andersen, 2003).
Most weight have been put on the quantitative content in the annual reports as this is considered harder to
manipulate due to auditing and accounting standards. Furthermore, the information on specific properties quoted
in the annual report of the peers, including size and location, are publicly available in governmental real estate
registers and is assumed accurately quoted in the reports. Real estate in general is a well-researched area with large
amount of data available, especially market data and market reports. As this thesis is written without any internal
information from Castellum or Norrporten to validate findings, the authors have in general strived to use well
known independent external sources where possible e.g. EPRA. For information related to the calculation of cap
rates, including market data on the real estate market it has been crucial to access new and updated information
which is typically only obtainable online (Andersen, 2003). For material published by commercial stakeholders as
for example consultants, most weight has been put on reports that has demonstrated findings derived from a larger
sample or research that has been performed in collaboration with an academic institution. The latter is especially
relevant for the synergy analysis as little relevant real estate specific synergy research was found.
Table of Contents
10
1.4. Delimitation and Assumptions
The point of view of the thesis is that of the institutional investor, based only on public information
complimented with information believed to be available to the institutional investor. This includes equity
research reports from multiple Investment Banks as well as an introduction interview with Castellum’s
Chief Investment Officer, Erika Olsèn assumed similar to an analyst conference call.
Knowledge within corporate finance and valuation is a prerequisite for reading the thesis, as all relevant
theory related to general financial methods is not introduced. However, some concepts are considered less
well-known and introduced briefly in the thesis, e.g. listed real estate as concept and NAV valuation for
real estate companies.
April 13th 2015 was the announcement date of the transaction to the public markets, and therefore this set
as the cut-off date for new information and as the valuation date. This implies that the financing decisions
including rights issue related to the transaction will not be covered as the details of the rights issue was
not announced until May 25th 2016.
Through a Q&A call between investors and management on the announcement day the authors were made
aware of that Castellum was preparing a sale of real estate assets worth SEKbn 4.0 following the closing
of the transaction. The authors have chosen to neglect this information due to lack of details and value the
portfolio “as-is” on the announcement day. The synergies are dependent on geographical overlap, and due
to insufficient details on the specific asset sales, the impact on synergies from divesture is not covered in
the analysis.
The classification of expenses between operating expenses and corporate overhead in the efficiency
benchmark is assumed to be consistent across all companies.
Historical data for 10 years have been used where possible to show a full economic cycle and examine the
impact on the peer companies from shocks to the economy as the real estate market is tightly knit with
interest rate market and housing prices. However, limited information available for the full peer group for
the period and thus no material conclusions will be drawn based observations in years where there are
limited data available. A longer period than presented has not been considered as Castellum initiated
reporting under IFRS in 2005.
Price to NAV or price to EPRA NAV is a relevant valuation metric for relative valuation and peer analysis
which have been left out of the analysis as building a NAV model specifically for this analysis implies
that the authors do not take reported NAV values for granted.
Overview of The Transaction
11
2. Overview of The Transaction
In November 2015, reports broke regarding an ongoing initial public offering (IPO) process of Norrporten, one of
the large real estate owners in Sweden (Reuters, 2015a). The sellers, the Second- and Sixth Swedish National
Pension Funds (AP2 and AP6, collectively as “the AP Funds”) became majority owners in 2000, and delisted the
company in December the same year. After 15 years of ownership, it seems that the plan was to reintroduce
Norrporten to the public market.
Within days following the first rumors had spread, Reuters could confirm through sources familiar with the matter,
that the investment banking divisions of Goldman Sachs and Nordea had been hired to lead a public listing of the
company in 2016 (Reuters, 2015, Nov. 26th). The IPO market had for years following the financial crisis struggled
with few listings and only moderate demand. In 2015, a new wave had erupted with 15 listings in Sweden, the
highest level in 15 years (Reuters, 2015, Nov. 26th). Taking advantage of the IPO window and extract as much
capital gain as possible for the benefit of Swedish pensioners would make strategic sense for the AP Funds.
Rumors had it, in March 2016 that in the background of an IPO process, a dual-track process i.e. a process for sale
of the entire company, had erupted alongside the IPO with materials distributed to a list of prospective buyers.
Castellum was understood to be a motivated buyer of the entire company (Reuters, 2016a). These rumors
intensified, where after both parties announced the transaction on the same day as Castellum reported their results
for the first quarter of 2016, on April 13th, 2016.
Castellum had as of their Q1 results a reported fair value of their properties at SEKbn 44.8, including development
projects and undeveloped land (Castellum, 2016b). Similarly, as of year-end 2015 figures, Norrporten had a
reported fair value of their properties at SEKbn 25.8 (Norrporten, 2016). The combined property portfolio would
aggregate to SEKbn 70.6, becoming the largest non-state-owned real estate enterprise in Sweden. The combined
property portfolio would overlap to some extent, but additionally, Norrporten would add new locations on
Castellum’s map. Altogether, they would hold properties in 19 areas in Sweden and Denmark.
The total consideration paid amounted to SEKbn 13.4, partly through payment of 78% of the transaction value in
cash, while the remaining would be paid in the form of shares in Castellum (Castellum, 2016c). With the share
consideration, the AP Funds would emerge as the two largest owners of Castellum with approx. 5% each (Thomson
Reuters, 2016).
Castellum announced a fully committed financing of the consideration, divided between 1) secured bank debt of
SEKbn 3.9 through new and unutilized credit facilities, 2) directed share issue to the AP Funds of SEKbn 3.0, and
Overview of The Transaction
12
3) a rights issue of SEKbn 6.5. As mentioned in section 1.4., the impact from the rights issue is not covered in the
thesis as the related details was first announced after the cut-off date for this thesis.
Castellum argued following the announcement that the acquisition was fundamentally supportive for their strategy
with lowered risk due to diversification of tenants and broadening of customer offering, as well as better
positioning to reach the target of 10% annual growth in income from property management (Castellum, 2016c).
With the acquisition, Castellum would see a significant step-up in size with investment properties on their balance
sheet increasing with 59% and rental income increasing with 53% (Thomson Reuters, 2016). Castellum also
reasoned the organizational good fit as an important driver. The new skills acquired from the organizational set-
up of Norrporten was suggested to add value, while also generate cost savings through synergies with target of
SEKm 150 annually, expected to be reached within 12-18 months (Castellum, 2016c). According to Chief
Investment Officer of Castellum, Erika Olsén, they had been seeking this opportunity and held a strong interest in
Norrporten for a long time:
“Overall, Norrporten made very good sense for Castellum to acquire. Through acquiring Norrporten, we
were able to obtain high quality properties in many locations in which we were already present. First of all,
the properties are considered to be in very good technical condition, the quality of tenants was attractive and
would better diversify our own tenancy mix while additionally the customer relations were considered
attractive. We had analyzed the company and its property portfolio many times. Even if we were offered the
property portfolio in an asset transaction, it would make good sense for us, and we would have made the deal
either way”.
- Erika Olsèn, CIO Castellum, interview, March 30th 2017
Furthermore, Castellum believed that there were benefits to be made from combining the companies:
“However, to be able to retain the employees was a big bonus where their experience with customers and
property knowledge in itself would help improve our operations. In addition, our analysis of their operating
expenses made us believe that there were several places to improve costs. They seemed to be expensive in
their operations based on several metrics. Furthermore, double management, headquarters and board
members was not needed. We would become a big player in many geographies and become a large part of
the local development. This would further improve our relations with municipalities, which was also
considered positive”
- Erika Olsèn, CIO Castellum, interview, March 30th 2017
Introduction to Real Estate
13
3. Introduction to Real Estate
Having introduced the specific transaction and the outline of the thesis, the proceeding will introduce how the real
estate market is structured, and the dynamics of the industry. This will provide an underlying platform for
understanding how both Castellum and Norrporten operates in their markets, as well as provide important input
for the later value assessment of the companies.
3.1. Investing in real estate
3.1.1. Buyers of real estate
At its core, real estate is tangible, real property consisting of land and the buildings on it (Oaktree, 2016). Investors
buying real estate can be separated in two principal segments: commercial and residential. Residential real estate
refers to single-family homes and multi-family rental apartments (Oaktree, 2016). The residential market is not
discussed in the thesis as Castellum and Norrporten do not invest in residential properties. The commercial real
estate market refers to income-producing properties including office, retail, industrial/warehouse and hotels in
addition to sub-segments like self-storage, manufactured housing and healthcare (Oaktree, 2016). This market
engages investors in buying single properties, or large portfolios, with the main purpose of generating returns from
leasing activities.
Investors seeking return from real estate faces the choice of how to allocate capital. The two primary channels are
through public or private real estate markets, meaning buying shares in listed securities, or buying the real estate
directly. Risks and benefits between these channels differs as will be outlined below (Oaktree, 2016).
Direct real estate investments involve the outright purchase of real estate, i.e. purchase of buildings. This form of
capital allocation is costly, and requires an established infrastructure throughout the supply chain, with intensive
resource constraints on sourcing, analyzing and managing properties (Oaktree, 2016). Additionally, the direct
investments tend to be concentrated in a few large assets, therefore creating high asset specific risk (Briddell &
Supple, 2011). However, direct investors can target specific property types and markets with cash flow
transparency aligned with targeted investments. Additionally, these investors will control business plans and
govern management of properties, thereby reducing governance risk (Briddell & Supple, 2011). Main investors in
this channel are institutional investors and high net-worth individuals (Oaktree, 2016).
An alternative that has grown in size within direct real estate investments are private equity real estate funds
(Preqin, 2013). This strategy leaves capital allocation from investors to investment management companies,
thereby outsourcing the property management activities and the intensive infrastructure needed in the acquisition
Introduction to Real Estate
14
process. Additionally, investment managers raise money from several shareholders with similar risk profile,
reducing asset specific risk by the opportunity to acquire more properties (Briddell & Supple, 2011). Investment
managers usually follow specific guidelines as outlined by the investor group, thereby limiting potential
governance risk (Oaktree, 2016). Private funds are either open-ended or closed-ended, where closed-ended
requires investors to commit capital over a designated period without the ability to withdraw capital, leaving high
liquidity risk (Oaktree, 2016). Open-ended funds do not have a commitment period and investment managers
allocate capital received by investors in real estate perpetually, whereby investors in these private funds can buy
or sell shares of the fund at designated points in time (Briddell & Supple, 2011). Even though the funds claim to
offer higher liquidity, they still operate in a market where underlying real estate assets can be relatively illiquid,
as for outright purchase of real estate as outlined above (Briddell & Supple, 2011). The fund manager’s
compensation is through management fee on committed capital as well as transaction fees. Additionally,
investment managers are incentivized by a fee that are received if returns exceed a specified minimum hurdle rate.
The transaction costs for investors are therefore higher through this allocation strategy (Oaktree, 2016). Investors
in funds have similar profiles as the investors making direct investments (Oaktree, 2016).
In contrast to the direct investment channel, investors can buy shares in listed entities, being corporations or trusts
(Briddell & Supple, 2011). The two channels in the publicly listed universe are real estate investment trusts
(“REITs”) and real estate operating companies (“REOCs”). The distinct difference between these two are that
REITs are obliged to distribute at least 90% of their taxable income to investors in the form of dividends, while
REOCs can retain earnings and reinvest (Briddell & Supple, 2011). REOCs are more flexible than REITs as it is
outlined specific terms for REITs on shareholder structure and property types they can buy (Oaktree, 2016). On
the other hand, REITs are more tax efficient vehicles for investors with focus on frequent dividend yield, while
REOC investors seek capital gains (NAREIT, n.d.). REITs originates from the US where it is a popular structure
for real estate investors. Over the recent decades, the US legislation for REITs has been tried in European and
Asian countries, but the REOC structure is dominant in most of the European publicly listed real estate market
(Evans & Crawford, n.d.). As the companies covered in this thesis are REOCs, this will be the basis for the analysis,
while REITs are also an important reference due to a lot of empirical research on REITs relative to REOCs.
Investors in publicly traded securities outsource management duties, increasing possible governance risk. The low
share of total ownership also limits investor’s potential to influence business plans (Briddell & Supple, 2011). Due
to the structure of REOCs, the return profile is not only driven by the specific assets, but also the management
team (Oaktree, 2016). Additionally, investors face beta risk as the real estate shares react to market movements.
This means that listed real estate securities are dependent on both the asset market and the broader equity market
in general. Nevertheless, the daily liquidity and transparent pricing together with the opportunity to deploy capital
Introduction to Real Estate
15
rapidly is attractive for investors (Briddell & Supple, 2011). Typically, capital deployed in the listed real estate
market stems from a wide range of individuals and institutional investors (Oaktree, 2016).
3.1.2. Customers of Real Estate Owners
Income of real estate owners is generated by letting out space in owned properties. The characteristics of tenants,
who are the real estate owner’s customers, varies depending on the type of the property. While offices can be let
to e.g. businesses or public authorities in need of space for regular operations, retail space can be let to e.g. retailers
offering goods or services from a store. Industrial and warehouse properties are let to production companies e.g.
pharmaceuticals, or distribution companies e.g. postal services. Similar for all real estate owners is that they intend
to increase security in the income-producing elements of their business, meaning obtaining the most viable tenants.
This indicates that real estate owners seek to diversify tenants in a property portfolio and attract creditworthy
tenants. Due to the low default risk, public authorities are considered to be highly attractive tenants, e.g. schools,
hospital or tax authorities and are often called secured income tenants (CBRE, 2015a; 2011). Tenants and owners
tend to have long relationships due to binding legal contracts.
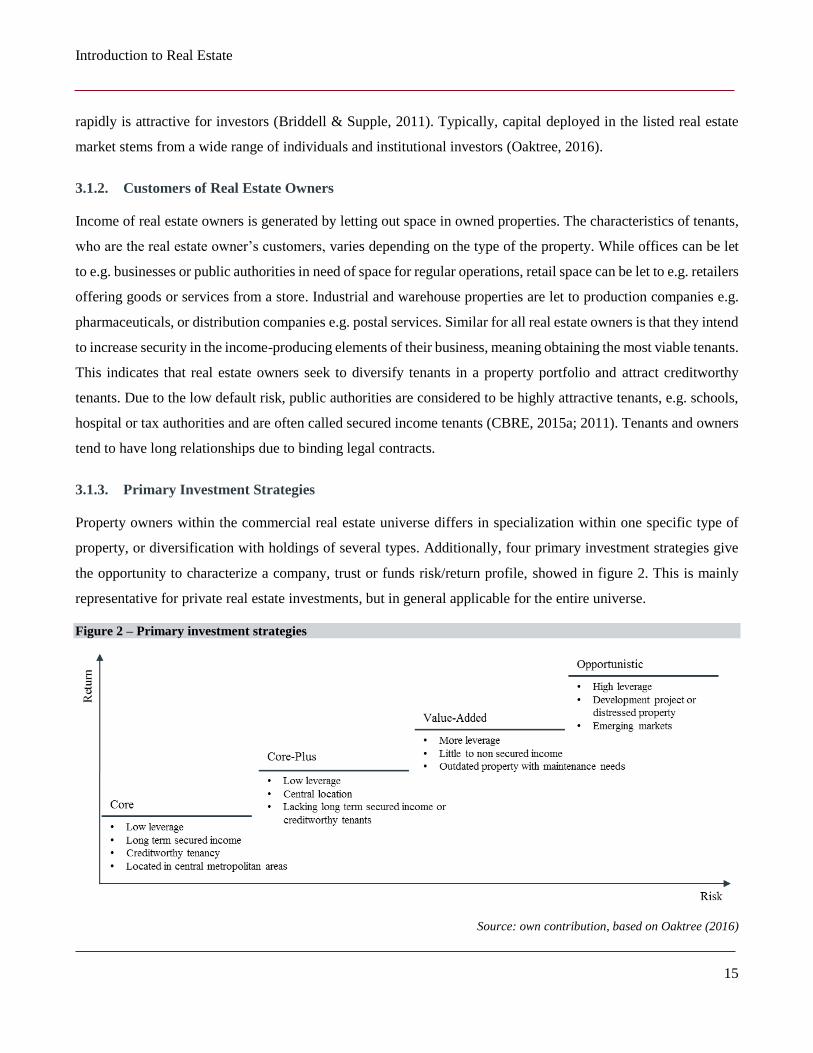
3.1.3. Primary Investment Strategies
Property owners within the commercial real estate universe differs in specialization within one specific type of
property, or diversification with holdings of several types. Additionally, four primary investment strategies give
the opportunity to characterize a company, trust or funds risk/return profile, showed in figure 2. This is mainly
representative for private real estate investments, but in general applicable for the entire universe.
Figure 2 – Primary investment strategies
Source: own contribution, based on Oaktree (2016)
Introduction to Real Estate
16
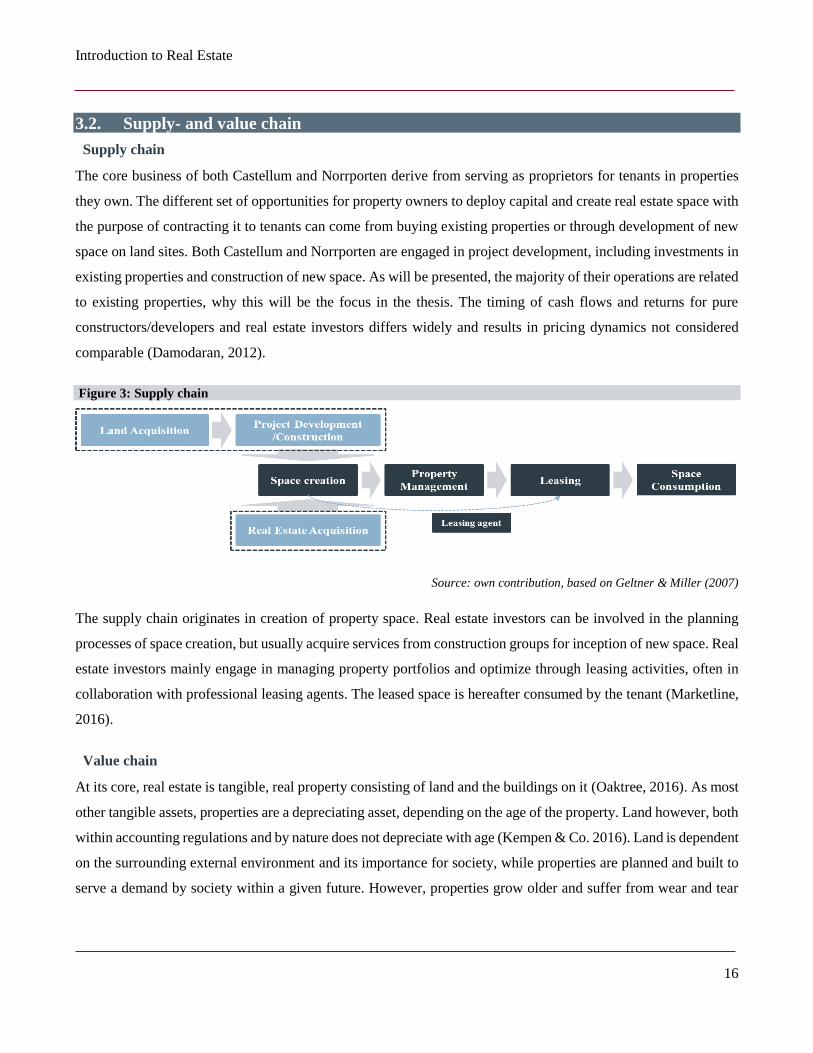
3.2. Supply- and value chain
Supply chain
The core business of both Castellum and Norrporten derive from serving as proprietors for tenants in properties
they own. The different set of opportunities for property owners to deploy capital and create real estate space with
the purpose of contracting it to tenants can come from buying existing properties or through development of new
space on land sites. Both Castellum and Norrporten are engaged in project development, including investments in
existing properties and construction of new space. As will be presented, the majority of their operations are related
to existing properties, why this will be the focus in the thesis. The timing of cash flows and returns for pure
constructors/developers and real estate investors differs widely and results in pricing dynamics not considered
comparable (Damodaran, 2012).
Figure 3: Supply chain
Source: own contribution, based on Geltner & Miller (2007)
The supply chain originates in creation of property space. Real estate investors can be involved in the planning
processes of space creation, but usually acquire services from construction groups for inception of new space. Real
estate investors mainly engage in managing property portfolios and optimize through leasing activities, often in
collaboration with professional leasing agents. The leased space is hereafter consumed by the tenant (Marketline,
2016).
Value chain
At its core, real estate is tangible, real property consisting of land and the buildings on it (Oaktree, 2016). As most
other tangible assets, properties are a depreciating asset, depending on the age of the property. Land however, both
within accounting regulations and by nature does not depreciate with age (Kempen & Co. 2016). Land is dependent
on the surrounding external environment and its importance for society, while properties are planned and built to
serve a demand by society within a given future. However, properties grow older and suffer from wear and tear
Introduction to Real Estate
17
and the society that once demanded the property develops. Thus, over time properties deteriorate and suffer from
obsolescence (Baum and McElhinney, 1997).
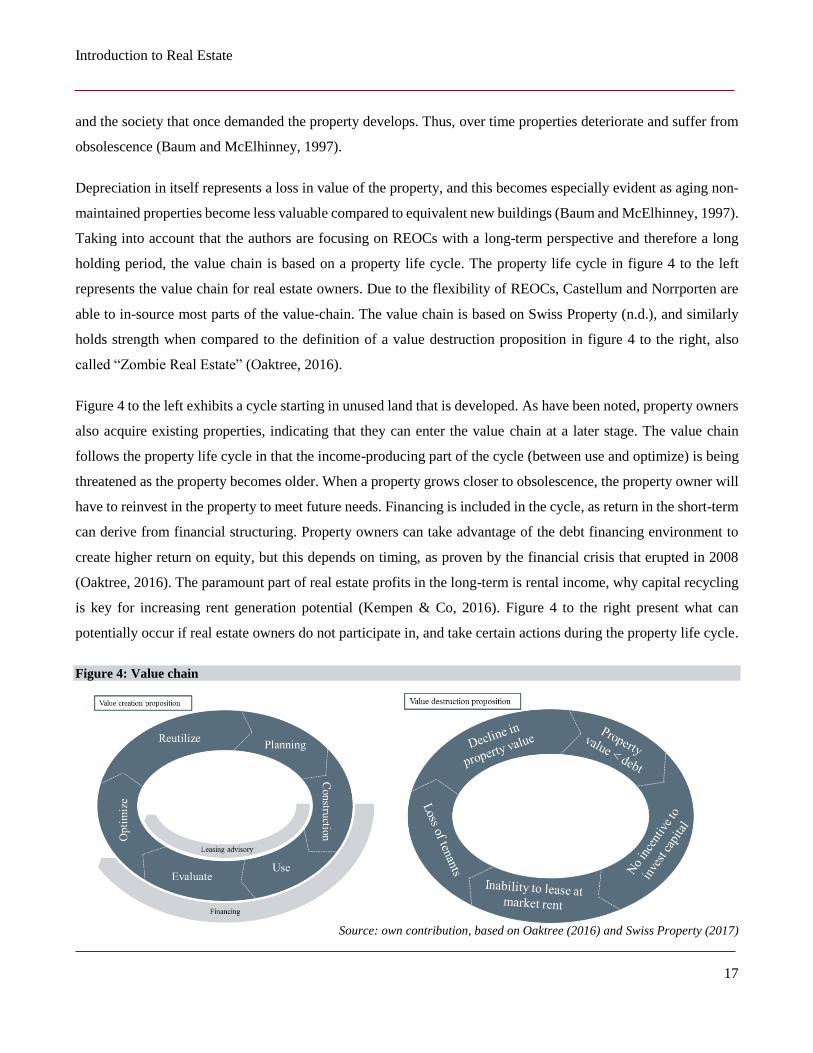
Depreciation in itself represents a loss in value of the property, and this becomes especially evident as aging non-
maintained properties become less valuable compared to equivalent new buildings (Baum and McElhinney, 1997).
Taking into account that the authors are focusing on REOCs with a long-term perspective and therefore a long
holding period, the value chain is based on a property life cycle. The property life cycle in figure 4 to the left
represents the value chain for real estate owners. Due to the flexibility of REOCs, Castellum and Norrporten are
able to in-source most parts of the value-chain. The value chain is based on Swiss Property (n.d.), and similarly
holds strength when compared to the definition of a value destruction proposition in figure 4 to the right, also
called “Zombie Real Estate” (Oaktree, 2016).
Figure 4 to the left exhibits a cycle starting in unused land that is developed. As have been noted, property owners
also acquire existing properties, indicating that they can enter the value chain at a later stage. The value chain
follows the property life cycle in that the income-producing part of the cycle (between use and optimize) is being
threatened as the property becomes older. When a property grows closer to obsolescence, the property owner will
have to reinvest in the property to meet future needs. Financing is included in the cycle, as return in the short-term
can derive from financial structuring. Property owners can take advantage of the debt financing environment to
create higher return on equity, but this depends on timing, as proven by the financial crisis that erupted in 2008
(Oaktree, 2016). The paramount part of real estate profits in the long-term is rental income, why capital recycling
is key for increasing rent generation potential (Kempen & Co, 2016). Figure 4 to the right present what can
potentially occur if real estate owners do not participate in, and take certain actions during the property life cycle.
Figure 4: Value chain
Source: own contribution, based on Oaktree (2016) and Swiss Property (2017)
Introduction to Real Estate
18
3.3. Real Estate in Sweden
3.3.1. Swedish real estate ownership
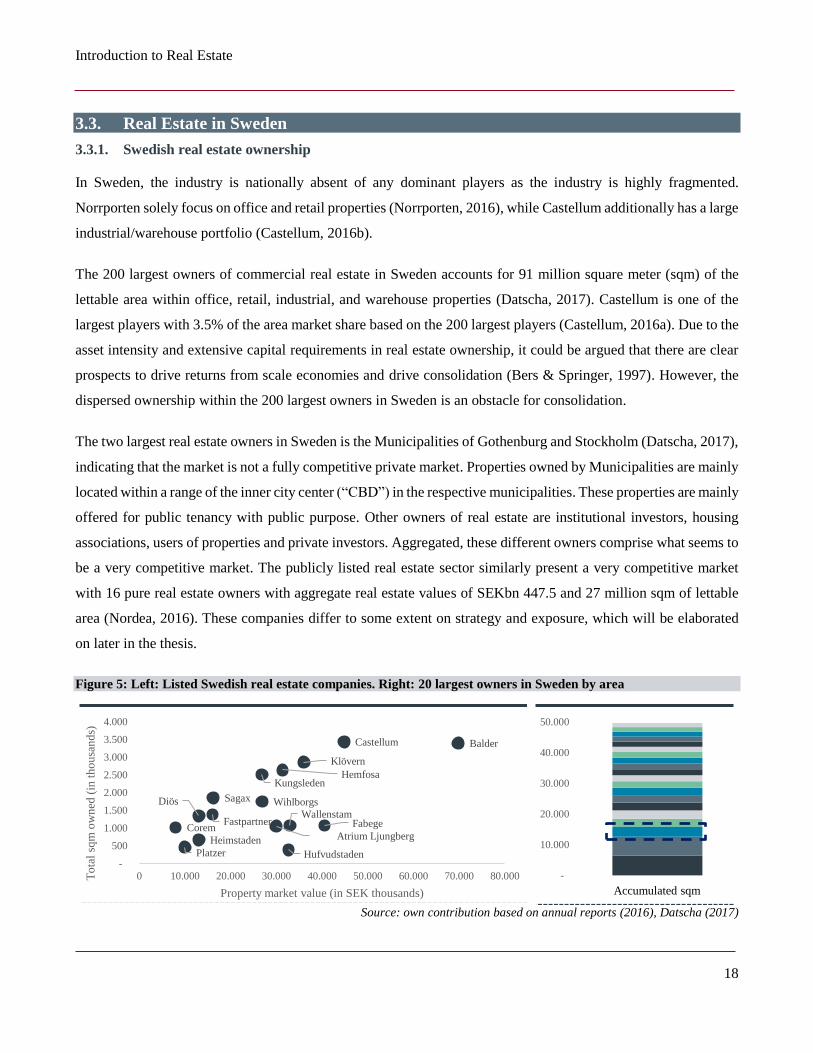
In Sweden, the industry is nationally absent of any dominant players as the industry is highly fragmented.
Norrporten solely focus on office and retail properties (Norrporten, 2016), while Castellum additionally has a large
industrial/warehouse portfolio (Castellum, 2016b).
The 200 largest owners of commercial real estate in Sweden accounts for 91 million square meter (sqm) of the
lettable area within office, retail, industrial, and warehouse properties (Datscha, 2017). Castellum is one of the
largest players with 3.5% of the area market share based on the 200 largest players (Castellum, 2016a). Due to the
asset intensity and extensive capital requirements in real estate ownership, it could be argued that there are clear
prospects to drive returns from scale economies and drive consolidation (Bers & Springer, 1997). However, the
dispersed ownership within the 200 largest owners in Sweden is an obstacle for consolidation.
The two largest real estate owners in Sweden is the Municipalities of Gothenburg and Stockholm (Datscha, 2017),
indicating that the market is not a fully competitive private market. Properties owned by Municipalities are mainly
located within a range of the inner city center (“CBD”) in the respective municipalities. These properties are mainly
offered for public tenancy with public purpose. Other owners of real estate are institutional investors, housing
associations, users of properties and private investors. Aggregated, these different owners comprise what seems to
be a very competitive market. The publicly listed real estate sector similarly present a very competitive market
with 16 pure real estate owners with aggregate real estate values of SEKbn 447.5 and 27 million sqm of lettable
area (Nordea, 2016). These companies differ to some extent on strategy and exposure, which will be elaborated
on later in the thesis.
Figure 5: Left: Listed Swedish real estate companies. Right: 20 largest owners in Sweden by area
Source: own contribution based on annual reports (2016), Datscha (2017)
Atrium Ljungberg
BalderCastellum
Fabege
Hemfosa
Heimstaden
Hufvudstaden
Klövern
Kungsleden
Sagax
Wallenstam
Wihlborgs
Fastpartner
Diös
Corem
Platzer -
500
1.000
1.500
2.000
2.500
3.000
3.500
4.000
0 10.000 20.000 30.000 40.000 50.000 60.000 70.000 80.000To
tal
sqm
ow
ned
(in
th
ou
san
ds)
Property market value (in SEK thousands)
-
10.000
20.000
30.000
40.000
50.000
Accumulated sqm
Introduction to Castellum and Norrporten
19
4. Introduction to Castellum and Norrporten
4.1. Castellum
4.1.1. History
The Swedish economy experienced a boom in the late 1980s and early 1990s with massive speculation and rising
debt levels. A specific target sector within this economic cycle was real estate that resulted in creation of inflated
real estate values (Bergström & Englung & Thorell, 2003). The bubble deflated in 1992, resulting in a severe credit
crunch and widespread insolvency within banks and larger Swedish companies. In relation to the increasing default
risk of the major companies in Sweden, the government founded Securum, a state-owned company with the
purpose of taking on “bad debt” and stabilize the crisis (Bergström et al, 2003).
Securum was founded with a great degree of independence under laws not applying for general financial
institutions and banking regulations (Bergström et al, 2003). Securum took control over a large share of real estate
assets nationwide, and became a large equity owner within the sector. Through repackaging and strategic
considerations, Securum were able to unwind a large amount of bad credits through flotations of three real estate
companies, Castellum, Norrporten and Pandox.
Castellum was formed as a legal entity through packaging of a sizeable real estate portfolio in 1993. The strategic
focus was to create a sizeable and stable real estate company with exposure to a few selected key areas in Sweden
(Castellum, n.d.). To manage the later disposal from public owners, Agilia Holding was established, who
controlled the company from inception to the IPO in 1997. Agilia Holding offloaded their remaining shares
successively throughout 1997 and 1998 following the IPO (Bergström et al, 2003). The market capitalization of
Castellum as of the IPO was SEKbn 3.0 with underlying property values of SEKbn 10.0 (Carnegie, n.d.).
Following Agilia’s divesture of Castellum, the two Swedish pension funds AP2 and AP6 became the largest
owners with a combined ownership of 24.1% (Castellum, 1998).
From the IPO until the announced merger with Norrporten, Castellum emerged as the second largest publicly listed
real estate entity in Sweden. The financial position improved with a long-term objective of 35% as minimum
equity/asset ratio to be able to cope with liquidity, and not only in times of prosperity (Castellum, 1998). There
have been no major shifts in strategy since the IPO, except for expanding to Copenhagen, Denmark in 2011
(Castellum, 2012). Additionally, Castellum have engaged in project development over the years with investments
in existing properties as well as new developments. The size of the portfolio grew from 2.1 million sqm of lettable
area at the IPO to 3.4 million sqm as of April 13th, 2016 (Castellum, 2016b).
Introduction to Castellum and Norrporten
20
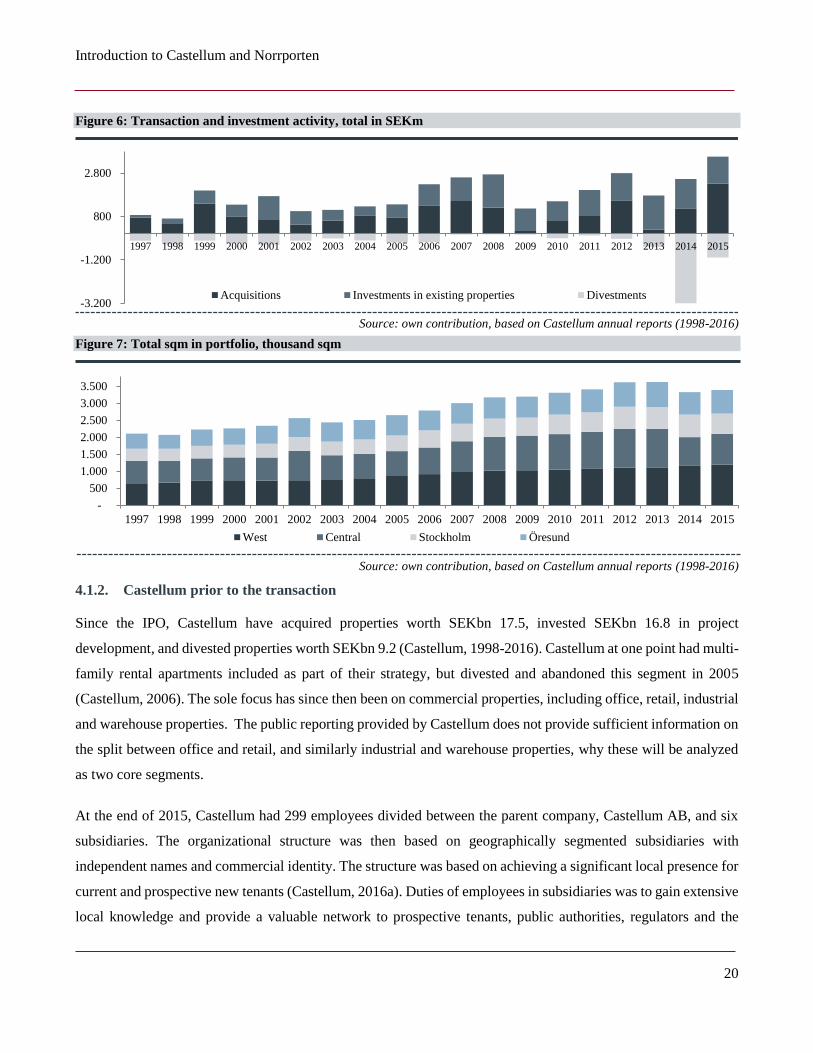
Figure 6: Transaction and investment activity, total in SEKm
Source: own contribution, based on Castellum annual reports (1998-2016)
Figure 7: Total sqm in portfolio, thousand sqm
Source: own contribution, based on Castellum annual reports (1998-2016)
4.1.2. Castellum prior to the transaction
Since the IPO, Castellum have acquired properties worth SEKbn 17.5, invested SEKbn 16.8 in project
development, and divested properties worth SEKbn 9.2 (Castellum, 1998-2016). Castellum at one point had multi-
family rental apartments included as part of their strategy, but divested and abandoned this segment in 2005
(Castellum, 2006). The sole focus has since then been on commercial properties, including office, retail, industrial
and warehouse properties. The public reporting provided by Castellum does not provide sufficient information on
the split between office and retail, and similarly industrial and warehouse properties, why these will be analyzed
as two core segments.
At the end of 2015, Castellum had 299 employees divided between the parent company, Castellum AB, and six
subsidiaries. The organizational structure was then based on geographically segmented subsidiaries with
independent names and commercial identity. The structure was based on achieving a significant local presence for
current and prospective new tenants (Castellum, 2016a). Duties of employees in subsidiaries was to gain extensive
local knowledge and provide a valuable network to prospective tenants, public authorities, regulators and the
-3.200
-1.200
800
2.800
1997 1998 1999 2000 2001 2002 2003 2004 2005 2006 2007 2008 2009 2010 2011 2012 2013 2014 2015
Acquisitions Investments in existing properties Divestments
-
500
1.000
1.500
2.000
2.500
3.000
3.500
1997 1998 1999 2000 2001 2002 2003 2004 2005 2006 2007 2008 2009 2010 2011 2012 2013 2014 2015
West Central Stockholm Öresund
Introduction to Castellum and Norrporten
21
transaction market (Castellum, 2016a). The parent company served as the management entity handling all
corporate matters as well as support functions. The authors understand that decisions were made top-down from
the parent company, based on inputs from respective subsidiaries (Castellum, 2016a).
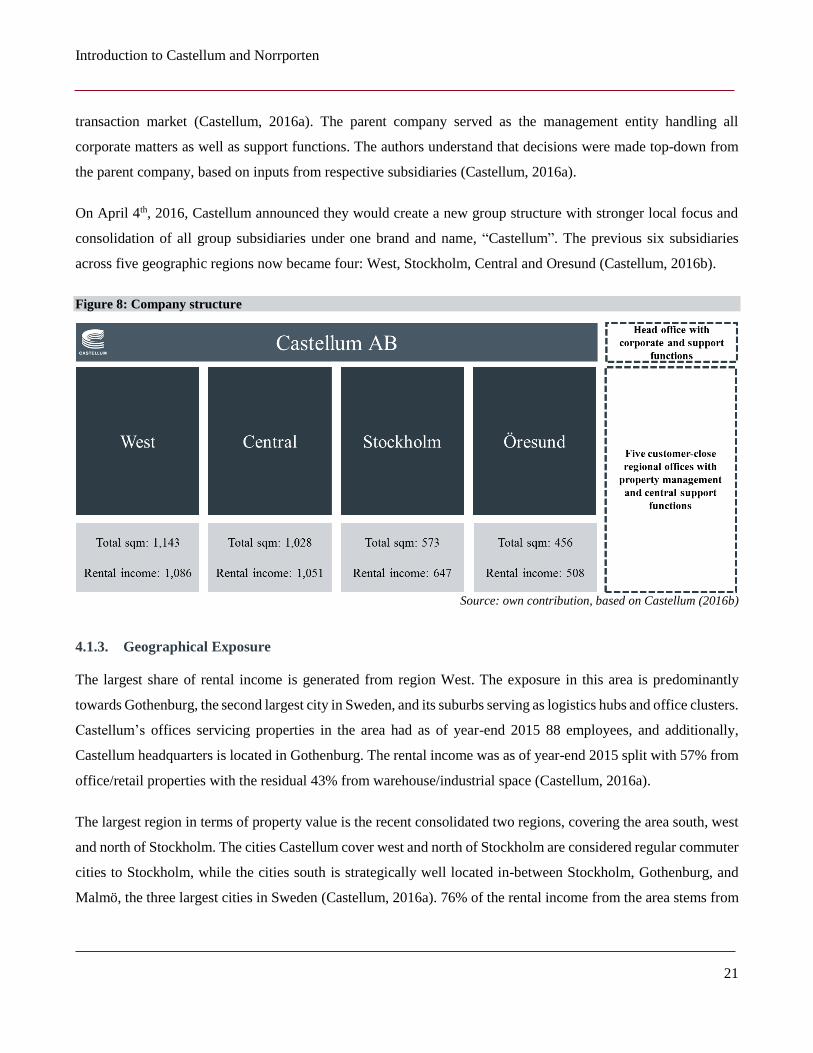
On April 4th, 2016, Castellum announced they would create a new group structure with stronger local focus and
consolidation of all group subsidiaries under one brand and name, “Castellum”. The previous six subsidiaries
across five geographic regions now became four: West, Stockholm, Central and Oresund (Castellum, 2016b).
Figure 8: Company structure
Source: own contribution, based on Castellum (2016b)
4.1.3. Geographical Exposure
The largest share of rental income is generated from region West. The exposure in this area is predominantly
towards Gothenburg, the second largest city in Sweden, and its suburbs serving as logistics hubs and office clusters.
Castellum’s offices servicing properties in the area had as of year-end 2015 88 employees, and additionally,
Castellum headquarters is located in Gothenburg. The rental income was as of year-end 2015 split with 57% from
office/retail properties with the residual 43% from warehouse/industrial space (Castellum, 2016a).
The largest region in terms of property value is the recent consolidated two regions, covering the area south, west
and north of Stockholm. The cities Castellum cover west and north of Stockholm are considered regular commuter
cities to Stockholm, while the cities south is strategically well located in-between Stockholm, Gothenburg, and
Malmö, the three largest cities in Sweden (Castellum, 2016a). 76% of the rental income from the area stems from
Introduction to Castellum and Norrporten
22
office and retail space while the remaining stems from warehouse and industrial activities. Before the organization
restructuring, the two regions had 82 employees combined (Castellum, 2016a).
Castellum also holds significant exposure towards Stockholm, the capital city of Sweden, mainly exposed to the
greater Stockholm area, surrounding the CBD, hereunder office clusters and major transit routes. The rental income
is divided evenly between office/retail and warehouse/industrial space. Castellum’s Stockholm office had as of
year-end 2015 47 employees (Castellum, 2016a).
The Oresund region covers the southernmost part of Sweden and Copenhagen. The portfolio is concentrated in the
larger cities of Malmö, Lund, Helsingborg and Copenhagen, and located in the fringes of cities in proximity to
infrastructure. 70% of the rental income is derived from office and retail space, while the remaining comes from
warehouse/industrial properties. Castellum’s local offices employed 58 employees as of year-end 2015 (Castellum,
2016a).
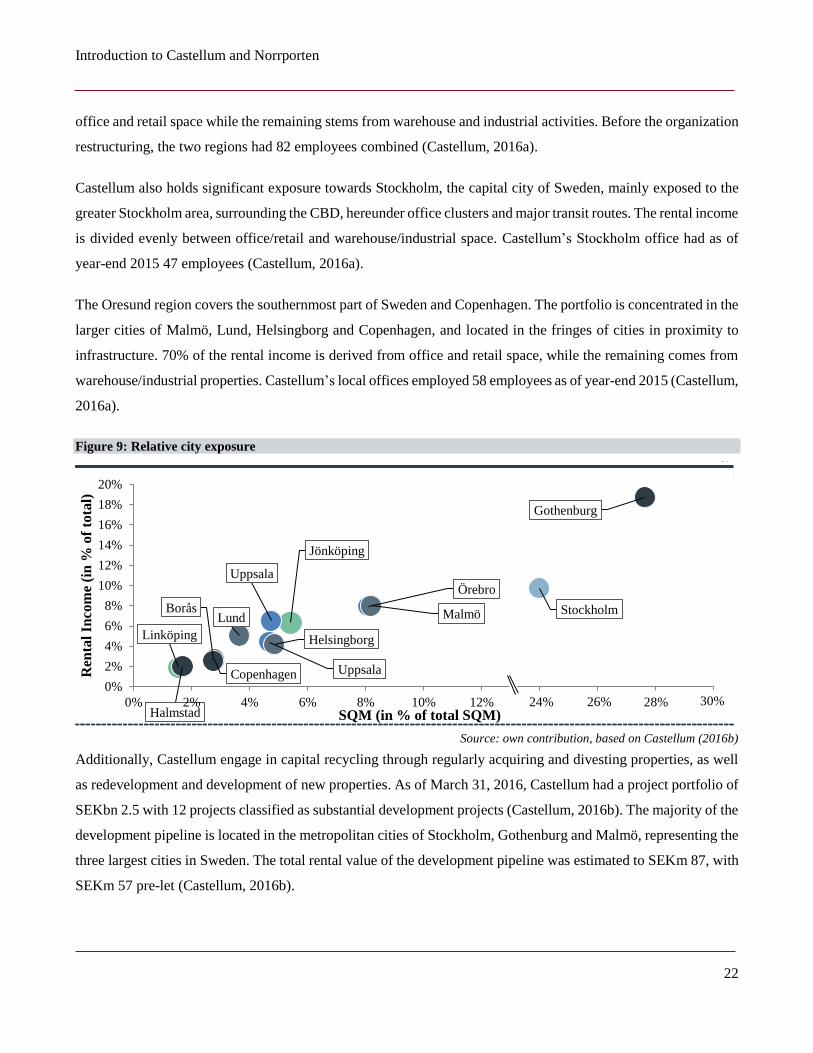
Figure 9: Relative city exposure
Source: own contribution, based on Castellum (2016b)
Additionally, Castellum engage in capital recycling through regularly acquiring and divesting properties, as well
as redevelopment and development of new properties. As of March 31, 2016, Castellum had a project portfolio of
SEKbn 2.5 with 12 projects classified as substantial development projects (Castellum, 2016b). The majority of the
development pipeline is located in the metropolitan cities of Stockholm, Gothenburg and Malmö, representing the
three largest cities in Sweden. The total rental value of the development pipeline was estimated to SEKm 87, with
SEKm 57 pre-let (Castellum, 2016b).
Jönköping
Linköping
Uppsala
Örebro
Uppsala
StockholmMalmöLund
Helsingborg
Copenhagen
Gothenburg
Halmstad
Borås
0%
2%
4%
6%
8%
10%
12%
14%
16%
18%
20%
0% 2% 4% 6% 8% 10% 12% 14% 16% 18% 20%
Ren
tal
Inco
me
(in
% o
f to
tal)
SQM (in % of total SQM)24% 26% 28% 30%
Introduction to Castellum and Norrporten
23
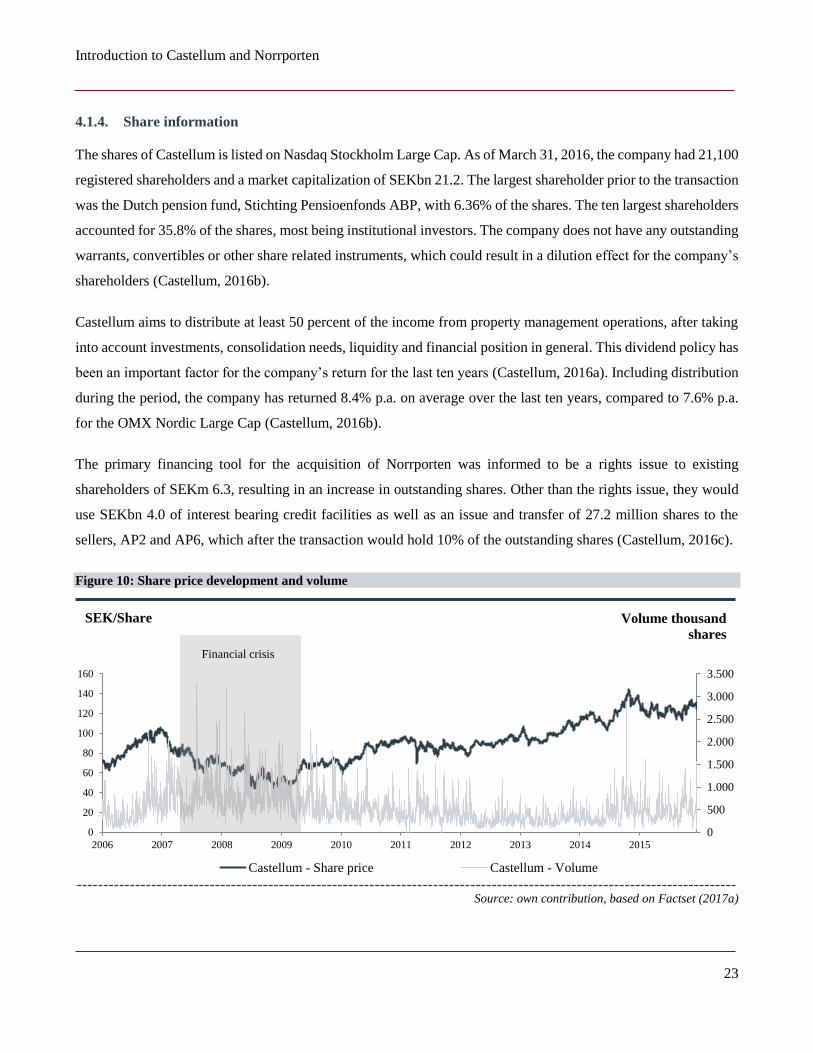
4.1.4. Share information
The shares of Castellum is listed on Nasdaq Stockholm Large Cap. As of March 31, 2016, the company had 21,100
registered shareholders and a market capitalization of SEKbn 21.2. The largest shareholder prior to the transaction
was the Dutch pension fund, Stichting Pensioenfonds ABP, with 6.36% of the shares. The ten largest shareholders
accounted for 35.8% of the shares, most being institutional investors. The company does not have any outstanding
warrants, convertibles or other share related instruments, which could result in a dilution effect for the company’s
shareholders (Castellum, 2016b).
Castellum aims to distribute at least 50 percent of the income from property management operations, after taking
into account investments, consolidation needs, liquidity and financial position in general. This dividend policy has
been an important factor for the company’s return for the last ten years (Castellum, 2016a). Including distribution
during the period, the company has returned 8.4% p.a. on average over the last ten years, compared to 7.6% p.a.
for the OMX Nordic Large Cap (Castellum, 2016b).
The primary financing tool for the acquisition of Norrporten was informed to be a rights issue to existing
shareholders of SEKm 6.3, resulting in an increase in outstanding shares. Other than the rights issue, they would
use SEKbn 4.0 of interest bearing credit facilities as well as an issue and transfer of 27.2 million shares to the
sellers, AP2 and AP6, which after the transaction would hold 10% of the outstanding shares (Castellum, 2016c).
Figure 10: Share price development and volume
Source: own contribution, based on Factset (2017a)
0
500
1.000
1.500
2.000
2.500
3.000
3.500
0
20
40
60
80
100
120
140
160
2006 2007 2008 2009 2010 2011 2012 2013 2014 2015
Castellum - Share price Castellum - Volume
SEK/Share Volume thousand
shares
Financial crisis
Introduction to Castellum and Norrporten
24
4.2. Norrporten
4.2.1. History
Similar to Castellum, Norrporten was established following the flotations from government control post the
financial crisis in the early 1990’s. While Castellum was fully divested from public ownership in 1998, Norrporten
was IPOed in 1994. This has later been criticized as a too early divesture by the government, as markets had not
fully recovered, resulting in pressure from the public as it was said to not serve the best interest for the taxpayers
(Bergström et. al., 2003).
As with its name (translate to “the gate to the North”), Norrporten focused on the larger cities in Northern Sweden,
which was the strategy Securum had set out for it (Bergström et. al., 2003). The portfolio kept growing at a steady
pace during the 1990s, with a milestone acquisition from Skanska in 1996, increasing Norrporten’s portfolio with
40% and making Skanska the majority owner as part of the funding (Skanska, 1997).
NS Holding AB, a holding company controlled by the two Swedish pension funds, AP2 and AP6, together with
the government controlled real estate company, Vasakronan, announced a public offer for the outstanding shares
of Norrporten (Norrporten, n.d.). The offer was approved by the majority of shareholders leading to a compulsory
acquisition of Norrporten and a following delisting in December 2000 (Norrporten, n.d.). The new owners injected
a sizeable portion of equity and the increased portfolio value and geographical reach. From being a Northern
Sweden focused company, they had expanded to include one of the southernmost cities in Sweden, Kristianstad,
by 2001 (Norrporten, n.d.).
Similar to Castellum, Norrporten made the first foreign investment in Copenhagen, Denmark, completed in 2005.
Later, the company expanded further south to Hamburg, Germany, as part of a strategy with focus on urban
investments with a local asset management teams present. The properties in Hamburg was later divested
(Norrporten, n.d.).
Through a transaction in 2006, Norrporten sold a sizeable portfolio to Vasakronan. The deal was funded by
Vasakronan transferring their ownership share to the AP Funds, making the AP Funds the sole owner of Norrporten
(Norrporten, n.d.). During its short lifetime, Norrporten has seen many different owners, been engaged in extensive
M&A activity and been managed by many management teams, most recently with a change of the full management
team in 2013 (Norrporten, n.d.).
Introduction to Castellum and Norrporten
25
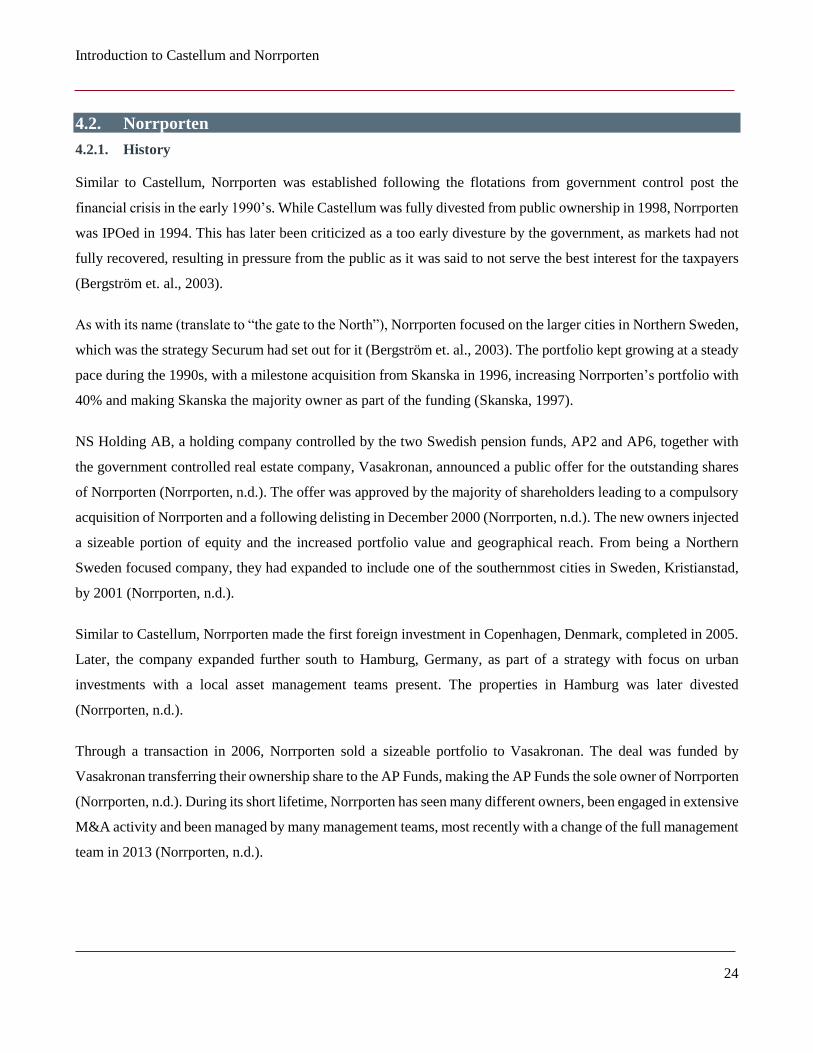
Since the IPO in in 1994, Norrporten’s property portfolio has grown from SEKbn 2.0 to SEKbn 25.8 as of year-
end 2015 (Norrporten, 2016). Even though not comparable one-to-one, the market capitalization at the IPO was
SEKm 287, while the book value of equity was SEKbn 11.8 as of year-end 2015 (Norrporten, 2016).
Figure 11: Historical milestones and value (thousand SEK)
Source: own contribution, based on Norrporten (n.d.)
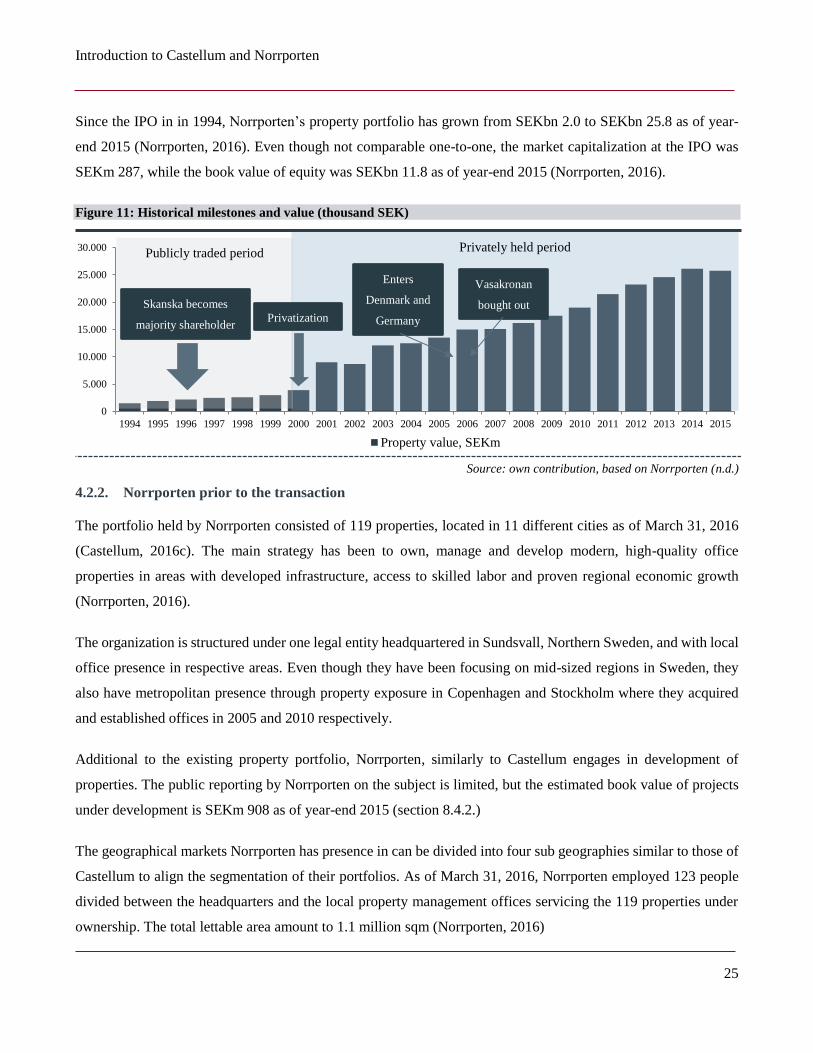
4.2.2. Norrporten prior to the transaction
The portfolio held by Norrporten consisted of 119 properties, located in 11 different cities as of March 31, 2016
(Castellum, 2016c). The main strategy has been to own, manage and develop modern, high-quality office
properties in areas with developed infrastructure, access to skilled labor and proven regional economic growth
(Norrporten, 2016).
The organization is structured under one legal entity headquartered in Sundsvall, Northern Sweden, and with local
office presence in respective areas. Even though they have been focusing on mid-sized regions in Sweden, they
also have metropolitan presence through property exposure in Copenhagen and Stockholm where they acquired
and established offices in 2005 and 2010 respectively.
Additional to the existing property portfolio, Norrporten, similarly to Castellum engages in development of
properties. The public reporting by Norrporten on the subject is limited, but the estimated book value of projects
under development is SEKm 908 as of year-end 2015 (section 8.4.2.)
The geographical markets Norrporten has presence in can be divided into four sub geographies similar to those of
Castellum to align the segmentation of their portfolios. As of March 31, 2016, Norrporten employed 123 people
divided between the headquarters and the local property management offices servicing the 119 properties under
ownership. The total lettable area amount to 1.1 million sqm (Norrporten, 2016)
0
5.000
10.000
15.000
20.000
25.000
30.000
1994 1995 1996 1997 1998 1999 2000 2001 2002 2003 2004 2005 2006 2007 2008 2009 2010 2011 2012 2013 2014 2015
Property value, SEKm
Publicly traded period
Skanska becomes
majority shareholder
Privately held period
Privatization
Vasakronan
bought out
Enters
Denmark and
Germany
Introduction to Castellum and Norrporten
26
Figure 12: Company structure
Source: own contribution, based on Norrporten (2016)
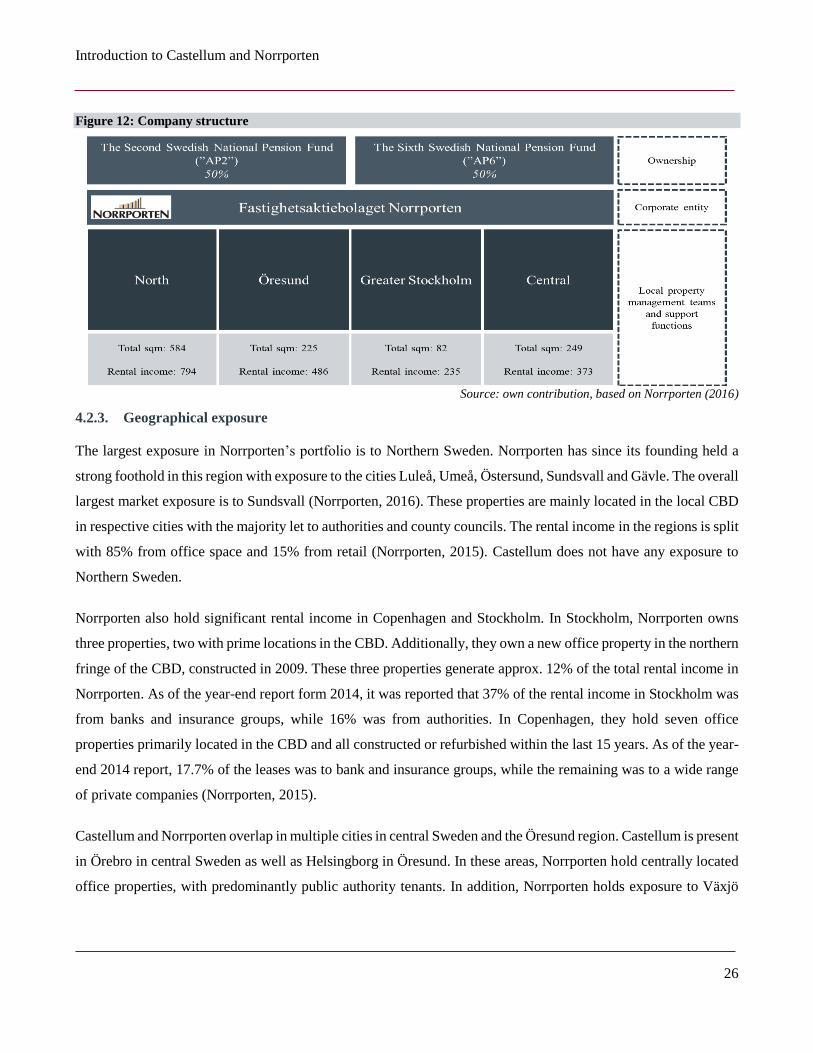
4.2.3. Geographical exposure
The largest exposure in Norrporten’s portfolio is to Northern Sweden. Norrporten has since its founding held a
strong foothold in this region with exposure to the cities Luleå, Umeå, Östersund, Sundsvall and Gävle. The overall
largest market exposure is to Sundsvall (Norrporten, 2016). These properties are mainly located in the local CBD
in respective cities with the majority let to authorities and county councils. The rental income in the regions is split
with 85% from office space and 15% from retail (Norrporten, 2015). Castellum does not have any exposure to
Northern Sweden.
Norrporten also hold significant rental income in Copenhagen and Stockholm. In Stockholm, Norrporten owns
three properties, two with prime locations in the CBD. Additionally, they own a new office property in the northern
fringe of the CBD, constructed in 2009. These three properties generate approx. 12% of the total rental income in
Norrporten. As of the year-end report form 2014, it was reported that 37% of the rental income in Stockholm was
from banks and insurance groups, while 16% was from authorities. In Copenhagen, they hold seven office
properties primarily located in the CBD and all constructed or refurbished within the last 15 years. As of the year-
end 2014 report, 17.7% of the leases was to bank and insurance groups, while the remaining was to a wide range
of private companies (Norrporten, 2015).
Castellum and Norrporten overlap in multiple cities in central Sweden and the Öresund region. Castellum is present
in Örebro in central Sweden as well as Helsingborg in Öresund. In these areas, Norrporten hold centrally located
office properties, with predominantly public authority tenants. In addition, Norrporten holds exposure to Växjö
Introduction to Castellum and Norrporten
27
and Jönköping in central Sweden, both extensions for Castellum with a majority of public authorities and county
councils as tenants. These properties are mainly office properties located in the CBD (Norrporten, 2015).
Figure 13: Relative city exposure
Source: own contribution, based on Norrporten (2014, 2015, 2016)
4.2.4. Rationale for Exit
After the realization that the generic national pension scheme led to huge losses for those who retired in Sweden,
the system was reinvented in 1960 with an earnings-related supplementary pension (ATP-system) (AP2, n.d.). A
set of general pension funds was introduced successively, resulting in the AP Funds from one to six being
established between 1974 and 1996. Altogether, these funds manage capital allocations exceeding SEKbn 1,000,
acting as buffer in order to cover future pension disbursements (AP2, n.d.).
Since 2009, the net inflows have been negative for these pension funds, with greater payments to pensioners’ than
contribution to the pension system. Public forecasts predict this development will continue for the next 25 years,
thus, the AP Funds will have to realize investments to distribute pension payments (AP2, n.d.). AP2 and AP6 had
been owners of Norrporten for 15 years with significant unrealized capital gains why an exit would be beneficial
for pensioners. Additionally, the consideration package to the AP Funds consisted of shares in Castellum, meaning
that they could stay exposed to real estate without reinvestment risk in addition to bringing funds for pension
disbursement at a faster pace due to higher liquidity of listed companies. Additionally, an IPO process has a higher
risk/return profile based on how potential investors would perceive the offered prospect, in addition to how big
the residual stake the AP Funds would have to keep following the IPO (AP2, 2016 Apr. 13th)
Luleå,
Umeå,
Östersund,
Sundsvall,
Gävle,
Örebro,
Jönköping,
Växjö,
Helsingborg,
Stockholm,
Copenhagen,
0%
5%
10%
15%
20%
0% 2% 4% 6% 8% 10% 12% 14% 16% 18% 20%
Ren
tal
Inco
me
(in
% o
f to
tal)
SQM (in % of total SQM)
Strategic Analysis
28
5. Strategic Analysis
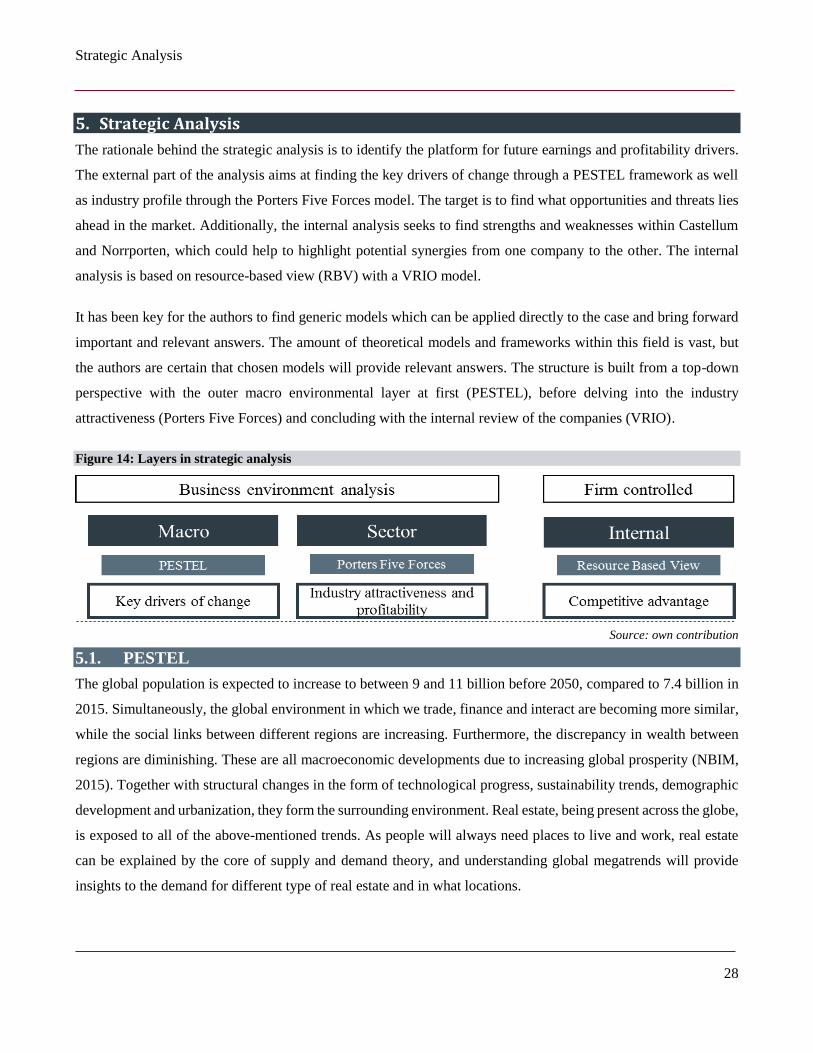
The rationale behind the strategic analysis is to identify the platform for future earnings and profitability drivers.
The external part of the analysis aims at finding the key drivers of change through a PESTEL framework as well
as industry profile through the Porters Five Forces model. The target is to find what opportunities and threats lies
ahead in the market. Additionally, the internal analysis seeks to find strengths and weaknesses within Castellum
and Norrporten, which could help to highlight potential synergies from one company to the other. The internal
analysis is based on resource-based view (RBV) with a VRIO model.
It has been key for the authors to find generic models which can be applied directly to the case and bring forward
important and relevant answers. The amount of theoretical models and frameworks within this field is vast, but
the authors are certain that chosen models will provide relevant answers. The structure is built from a top-down
perspective with the outer macro environmental layer at first (PESTEL), before delving into the industry
attractiveness (Porters Five Forces) and concluding with the internal review of the companies (VRIO).
Figure 14: Layers in strategic analysis
Source: own contribution
5.1. PESTEL
The global population is expected to increase to between 9 and 11 billion before 2050, compared to 7.4 billion in
2015. Simultaneously, the global environment in which we trade, finance and interact are becoming more similar,
while the social links between different regions are increasing. Furthermore, the discrepancy in wealth between
regions are diminishing. These are all macroeconomic developments due to increasing global prosperity (NBIM,
2015). Together with structural changes in the form of technological progress, sustainability trends, demographic
development and urbanization, they form the surrounding environment. Real estate, being present across the globe,
is exposed to all of the above-mentioned trends. As people will always need places to live and work, real estate
can be explained by the core of supply and demand theory, and understanding global megatrends will provide
insights to the demand for different type of real estate and in what locations.
Strategic Analysis
29
The PESTEL analysis categorizes environmental influence through six main factors: political, economic, socio-
cultural, technological, environmental and legal factors. Political and legal factors are found to overlap and is
therefore treated as one factor. The trends are in the following formulated separately, but most are not fully
independent, as they tend to converge in the high-level global developments (NBIM, 2015).
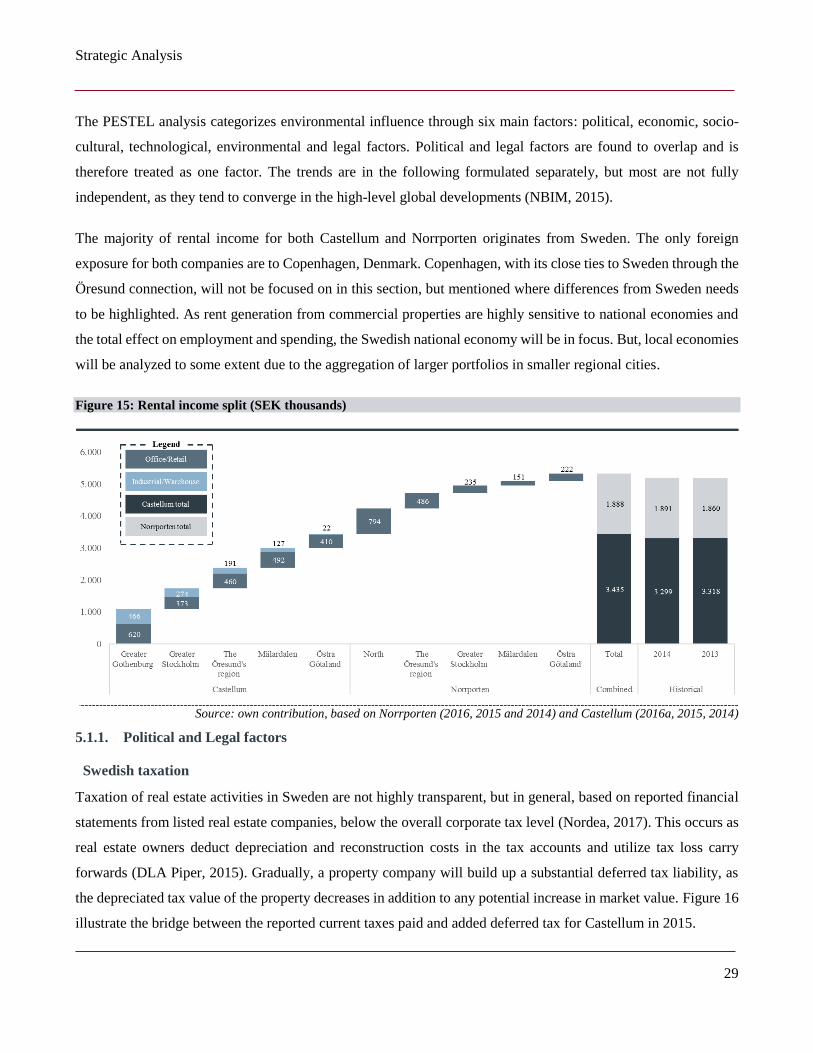
The majority of rental income for both Castellum and Norrporten originates from Sweden. The only foreign
exposure for both companies are to Copenhagen, Denmark. Copenhagen, with its close ties to Sweden through the
Öresund connection, will not be focused on in this section, but mentioned where differences from Sweden needs
to be highlighted. As rent generation from commercial properties are highly sensitive to national economies and
the total effect on employment and spending, the Swedish national economy will be in focus. But, local economies
will be analyzed to some extent due to the aggregation of larger portfolios in smaller regional cities.
Figure 15: Rental income split (SEK thousands)
Source: own contribution, based on Norrporten (2016, 2015 and 2014) and Castellum (2016a, 2015, 2014)
5.1.1. Political and Legal factors
Swedish taxation
Taxation of real estate activities in Sweden are not highly transparent, but in general, based on reported financial
statements from listed real estate companies, below the overall corporate tax level (Nordea, 2017). This occurs as
real estate owners deduct depreciation and reconstruction costs in the tax accounts and utilize tax loss carry
forwards (DLA Piper, 2015). Gradually, a property company will build up a substantial deferred tax liability, as
the depreciated tax value of the property decreases in addition to any potential increase in market value. Figure 16
illustrate the bridge between the reported current taxes paid and added deferred tax for Castellum in 2015.
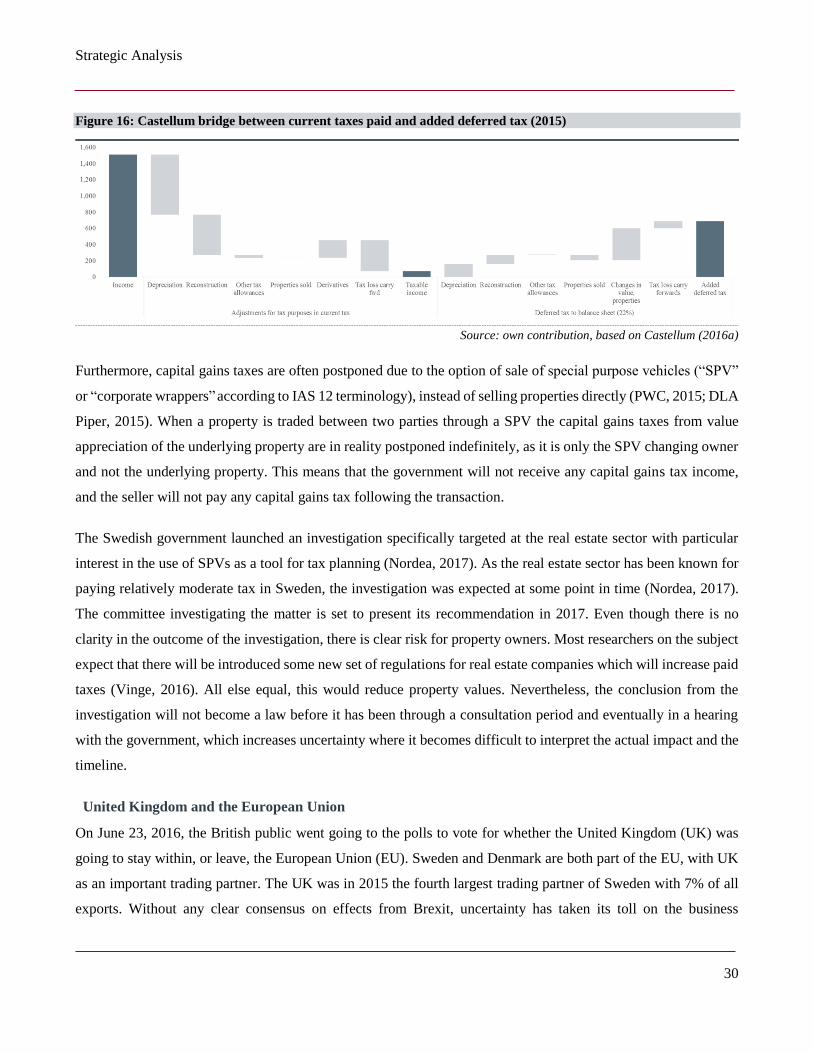
Strategic Analysis
30
Figure 16: Castellum bridge between current taxes paid and added deferred tax (2015)
Source: own contribution, based on Castellum (2016a)
Furthermore, capital gains taxes are often postponed due to the option of sale of special purpose vehicles (“SPV”
or “corporate wrappers” according to IAS 12 terminology), instead of selling properties directly (PWC, 2015; DLA
Piper, 2015). When a property is traded between two parties through a SPV the capital gains taxes from value
appreciation of the underlying property are in reality postponed indefinitely, as it is only the SPV changing owner
and not the underlying property. This means that the government will not receive any capital gains tax income,
and the seller will not pay any capital gains tax following the transaction.
The Swedish government launched an investigation specifically targeted at the real estate sector with particular
interest in the use of SPVs as a tool for tax planning (Nordea, 2017). As the real estate sector has been known for
paying relatively moderate tax in Sweden, the investigation was expected at some point in time (Nordea, 2017).
The committee investigating the matter is set to present its recommendation in 2017. Even though there is no
clarity in the outcome of the investigation, there is clear risk for property owners. Most researchers on the subject
expect that there will be introduced some new set of regulations for real estate companies which will increase paid
taxes (Vinge, 2016). All else equal, this would reduce property values. Nevertheless, the conclusion from the
investigation will not become a law before it has been through a consultation period and eventually in a hearing
with the government, which increases uncertainty where it becomes difficult to interpret the actual impact and the
timeline.
United Kingdom and the European Union
On June 23, 2016, the British public went going to the polls to vote for whether the United Kingdom (UK) was
going to stay within, or leave, the European Union (EU). Sweden and Denmark are both part of the EU, with UK
as an important trading partner. The UK was in 2015 the fourth largest trading partner of Sweden with 7% of all
exports. Without any clear consensus on effects from Brexit, uncertainty has taken its toll on the business
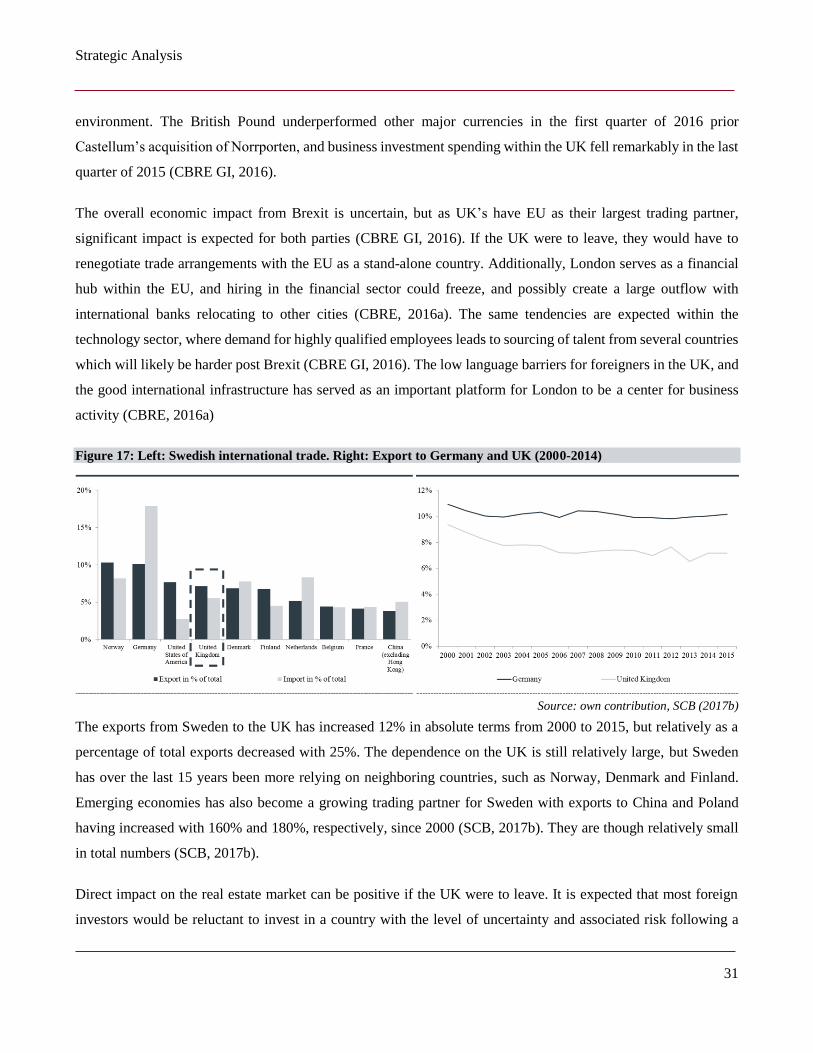
Strategic Analysis
31
environment. The British Pound underperformed other major currencies in the first quarter of 2016 prior
Castellum’s acquisition of Norrporten, and business investment spending within the UK fell remarkably in the last
quarter of 2015 (CBRE GI, 2016).
The overall economic impact from Brexit is uncertain, but as UK’s have EU as their largest trading partner,
significant impact is expected for both parties (CBRE GI, 2016). If the UK were to leave, they would have to
renegotiate trade arrangements with the EU as a stand-alone country. Additionally, London serves as a financial
hub within the EU, and hiring in the financial sector could freeze, and possibly create a large outflow with
international banks relocating to other cities (CBRE, 2016a). The same tendencies are expected within the
technology sector, where demand for highly qualified employees leads to sourcing of talent from several countries
which will likely be harder post Brexit (CBRE GI, 2016). The low language barriers for foreigners in the UK, and
the good international infrastructure has served as an important platform for London to be a center for business
activity (CBRE, 2016a)
Figure 17: Left: Swedish international trade. Right: Export to Germany and UK (2000-2014)
Source: own contribution, SCB (2017b)
The exports from Sweden to the UK has increased 12% in absolute terms from 2000 to 2015, but relatively as a
percentage of total exports decreased with 25%. The dependence on the UK is still relatively large, but Sweden
has over the last 15 years been more relying on neighboring countries, such as Norway, Denmark and Finland.
Emerging economies has also become a growing trading partner for Sweden with exports to China and Poland
having increased with 160% and 180%, respectively, since 2000 (SCB, 2017b). They are though relatively small
in total numbers (SCB, 2017b).
Direct impact on the real estate market can be positive if the UK were to leave. It is expected that most foreign
investors would be reluctant to invest in a country with the level of uncertainty and associated risk following a
Strategic Analysis
32
withdrawal from the EU, which would, all else equal, result in reallocation of capital to other geographical markets.
The Nordics has in recent years been targeted by international capital, with a purpose of serving as a safe haven
with stable politics, economy and to a large degree currency as well (Union, 2016). This new flow of capital to
real estate would increase competition for objects and lead to potential increasing prices.
If London were to lose its position as a financial hub within the EU, the most prominent replacements would be
Frankfurt, Paris or Amsterdam. Stockholm, in competition with Berlin, has been considered an alternative hub to
replace the growing technology sector in London (CBRE GI, 2016). By moving these jobs to Stockholm, it could
create upward pressure in demand and potentially impact rent levels positively.
Political intervention in population movements
As discussed in section 5.1.3 on socio-cultural impacts, urbanization is a clear secular trend. The population living
in the fringes and countryside has become more prone to move closer to more accessible infrastructure, and
attractive employment markets. The current government in Denmark chose in 2015 to initiate a process of moving
a range of government institutions out of the larger university cities (Kusnitzoff, 2015) to mitigate decreasing
population in smaller cities outside urban areas, which affects growth of the local economies. Decreasing
population growth creates a difficult environment for smaller regional cities with lowered budgets and tax revenue
to create new opportunities in the local environment (Kusnitzoff, 2015). The government initiative comprehends
4,000 jobs in the public sector. Moving 4,000 employees out of Copenhagen will shift supply upwards and demand
downwards which could potentially affect the rental price level.
Conclusion of political influence
The most evident impact from the political environment relates to the potential new tax burden. With both
uncertainties on how the proposal will look and whether the government choose to align this into the regulatory
tax framework, it is difficult to forecast any impact on the issue. If the UK were to leave the EU, it would have
immediate impact for important trading partners, especially within the EU. Denmark and Sweden would see initial
impact on the economy, but this is suggested to stabilize in the medium term as the different parties adjust to the
new normal with the UK outside of the EU. Even though there could be an uplift in real estate values due to
reallocation of capital to safer European markets, the increased demand is assumed to be related to a period of
transition rather than a new normal.
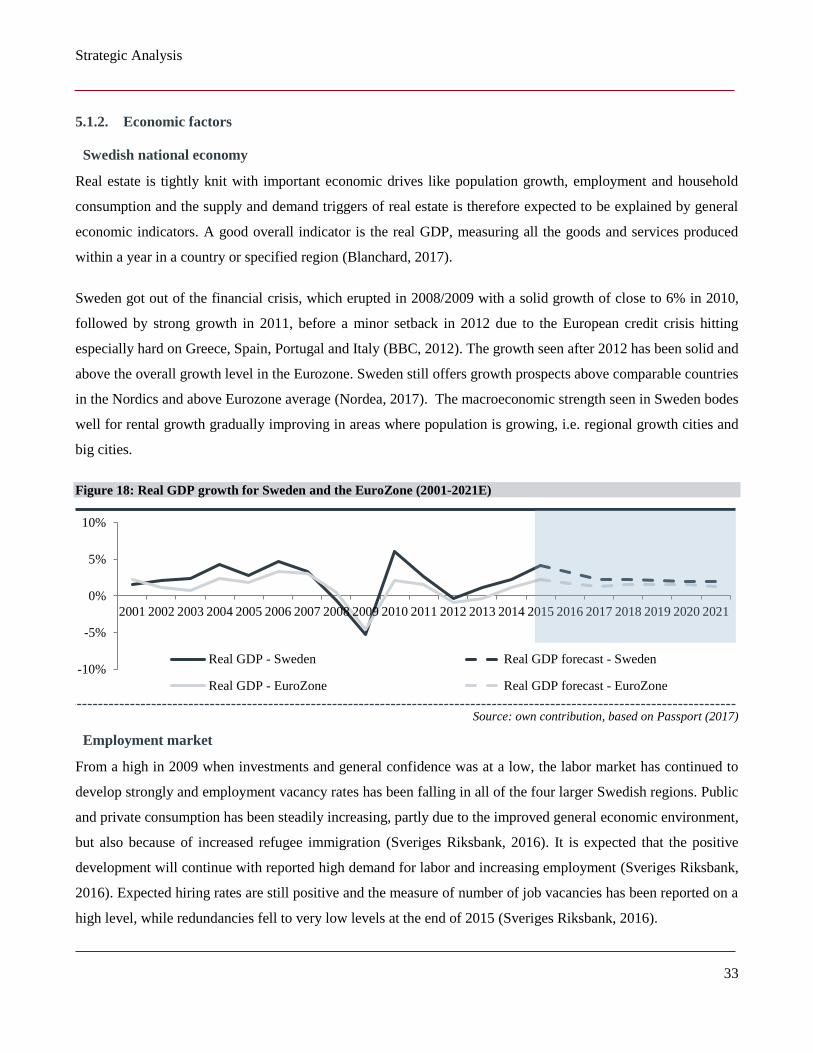
Strategic Analysis
33
5.1.2. Economic factors
Swedish national economy
Real estate is tightly knit with important economic drives like population growth, employment and household
consumption and the supply and demand triggers of real estate is therefore expected to be explained by general
economic indicators. A good overall indicator is the real GDP, measuring all the goods and services produced
within a year in a country or specified region (Blanchard, 2017).
Sweden got out of the financial crisis, which erupted in 2008/2009 with a solid growth of close to 6% in 2010,
followed by strong growth in 2011, before a minor setback in 2012 due to the European credit crisis hitting
especially hard on Greece, Spain, Portugal and Italy (BBC, 2012). The growth seen after 2012 has been solid and
above the overall growth level in the Eurozone. Sweden still offers growth prospects above comparable countries
in the Nordics and above Eurozone average (Nordea, 2017). The macroeconomic strength seen in Sweden bodes
well for rental growth gradually improving in areas where population is growing, i.e. regional growth cities and
big cities.
Figure 18: Real GDP growth for Sweden and the EuroZone (2001-2021E)
Source: own contribution, based on Passport (2017)
Employment market
From a high in 2009 when investments and general confidence was at a low, the labor market has continued to
develop strongly and employment vacancy rates has been falling in all of the four larger Swedish regions. Public
and private consumption has been steadily increasing, partly due to the improved general economic environment,
but also because of increased refugee immigration (Sveriges Riksbank, 2016). It is expected that the positive
development will continue with reported high demand for labor and increasing employment (Sveriges Riksbank,
2016). Expected hiring rates are still positive and the measure of number of job vacancies has been reported on a
high level, while redundancies fell to very low levels at the end of 2015 (Sveriges Riksbank, 2016).
-10%
-5%
0%
5%
10%
2001 2002 2003 2004 2005 2006 2007 2008 2009 2010 2011 2012 2013 2014 2015 2016 2017 2018 2019 2020 2021
Real GDP - Sweden Real GDP forecast - Sweden
Real GDP - EuroZone Real GDP forecast - EuroZone
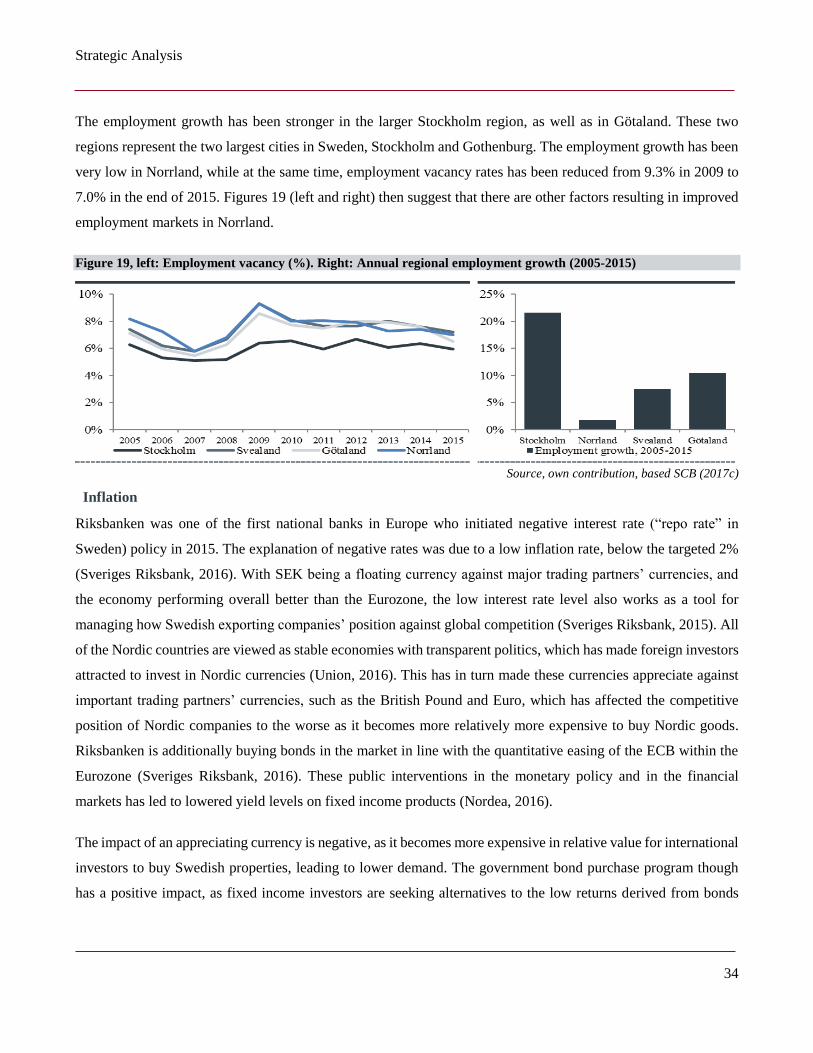
Strategic Analysis
34
The employment growth has been stronger in the larger Stockholm region, as well as in Götaland. These two
regions represent the two largest cities in Sweden, Stockholm and Gothenburg. The employment growth has been
very low in Norrland, while at the same time, employment vacancy rates has been reduced from 9.3% in 2009 to
7.0% in the end of 2015. Figures 19 (left and right) then suggest that there are other factors resulting in improved
employment markets in Norrland.
Figure 19, left: Employment vacancy (%). Right: Annual regional employment growth (2005-2015)
Source, own contribution, based SCB (2017c)
Inflation
Riksbanken was one of the first national banks in Europe who initiated negative interest rate (“repo rate” in
Sweden) policy in 2015. The explanation of negative rates was due to a low inflation rate, below the targeted 2%
(Sveriges Riksbank, 2016). With SEK being a floating currency against major trading partners’ currencies, and
the economy performing overall better than the Eurozone, the low interest rate level also works as a tool for
managing how Swedish exporting companies’ position against global competition (Sveriges Riksbank, 2015). All
of the Nordic countries are viewed as stable economies with transparent politics, which has made foreign investors
attracted to invest in Nordic currencies (Union, 2016). This has in turn made these currencies appreciate against
important trading partners’ currencies, such as the British Pound and Euro, which has affected the competitive
position of Nordic companies to the worse as it becomes more relatively more expensive to buy Nordic goods.
Riksbanken is additionally buying bonds in the market in line with the quantitative easing of the ECB within the
Eurozone (Sveriges Riksbank, 2016). These public interventions in the monetary policy and in the financial
markets has led to lowered yield levels on fixed income products (Nordea, 2016).
The impact of an appreciating currency is negative, as it becomes more expensive in relative value for international
investors to buy Swedish properties, leading to lower demand. The government bond purchase program though
has a positive impact, as fixed income investors are seeking alternatives to the low returns derived from bonds
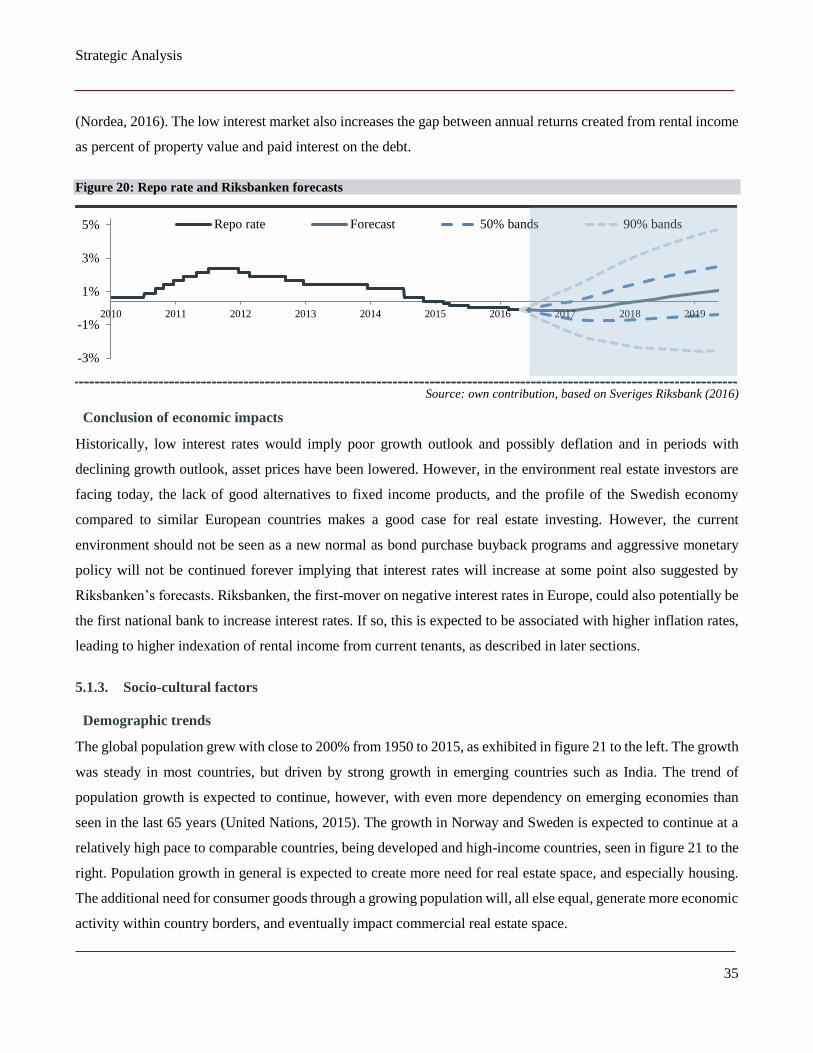
Strategic Analysis
35
(Nordea, 2016). The low interest market also increases the gap between annual returns created from rental income
as percent of property value and paid interest on the debt.
Figure 20: Repo rate and Riksbanken forecasts
Source: own contribution, based on Sveriges Riksbank (2016)
Conclusion of economic impacts
Historically, low interest rates would imply poor growth outlook and possibly deflation and in periods with
declining growth outlook, asset prices have been lowered. However, in the environment real estate investors are
facing today, the lack of good alternatives to fixed income products, and the profile of the Swedish economy
compared to similar European countries makes a good case for real estate investing. However, the current
environment should not be seen as a new normal as bond purchase buyback programs and aggressive monetary
policy will not be continued forever implying that interest rates will increase at some point also suggested by
Riksbanken’s forecasts. Riksbanken, the first-mover on negative interest rates in Europe, could also potentially be
the first national bank to increase interest rates. If so, this is expected to be associated with higher inflation rates,
leading to higher indexation of rental income from current tenants, as described in later sections.
5.1.3. Socio-cultural factors
Demographic trends
The global population grew with close to 200% from 1950 to 2015, as exhibited in figure 21 to the left. The growth
was steady in most countries, but driven by strong growth in emerging countries such as India. The trend of
population growth is expected to continue, however, with even more dependency on emerging economies than
seen in the last 65 years (United Nations, 2015). The growth in Norway and Sweden is expected to continue at a
relatively high pace to comparable countries, being developed and high-income countries, seen in figure 21 to the
right. Population growth in general is expected to create more need for real estate space, and especially housing.
The additional need for consumer goods through a growing population will, all else equal, generate more economic
activity within country borders, and eventually impact commercial real estate space.
-3%
-1%
1%
3%
5%
2010 2011 2012 2013 2014 2015 2016 2017 2018 2019
Repo rate Forecast 50% bands 90% bands
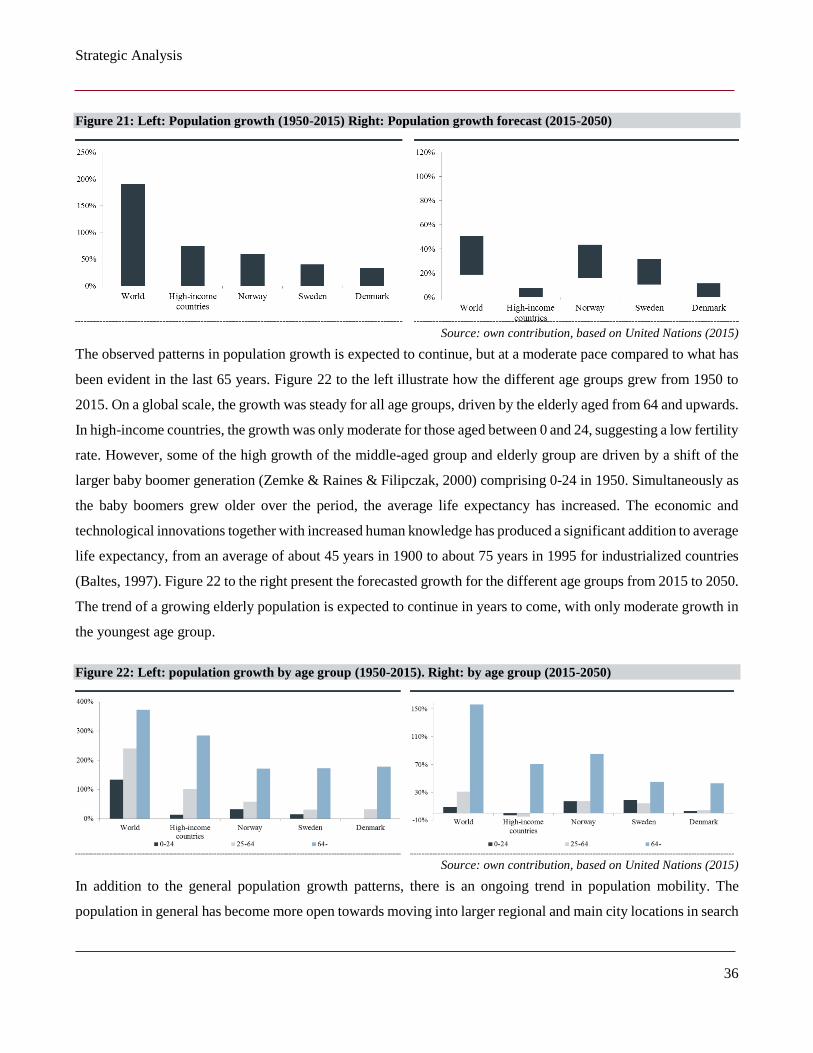
Strategic Analysis
36
Figure 21: Left: Population growth (1950-2015) Right: Population growth forecast (2015-2050)
Source: own contribution, based on United Nations (2015)
The observed patterns in population growth is expected to continue, but at a moderate pace compared to what has
been evident in the last 65 years. Figure 22 to the left illustrate how the different age groups grew from 1950 to
2015. On a global scale, the growth was steady for all age groups, driven by the elderly aged from 64 and upwards.
In high-income countries, the growth was only moderate for those aged between 0 and 24, suggesting a low fertility
rate. However, some of the high growth of the middle-aged group and elderly group are driven by a shift of the
larger baby boomer generation (Zemke & Raines & Filipczak, 2000) comprising 0-24 in 1950. Simultaneously as
the baby boomers grew older over the period, the average life expectancy has increased. The economic and
technological innovations together with increased human knowledge has produced a significant addition to average
life expectancy, from an average of about 45 years in 1900 to about 75 years in 1995 for industrialized countries
(Baltes, 1997). Figure 22 to the right present the forecasted growth for the different age groups from 2015 to 2050.
The trend of a growing elderly population is expected to continue in years to come, with only moderate growth in
the youngest age group.
Figure 22: Left: population growth by age group (1950-2015). Right: by age group (2015-2050)
Source: own contribution, based on United Nations (2015)
In addition to the general population growth patterns, there is an ongoing trend in population mobility. The
population in general has become more open towards moving into larger regional and main city locations in search
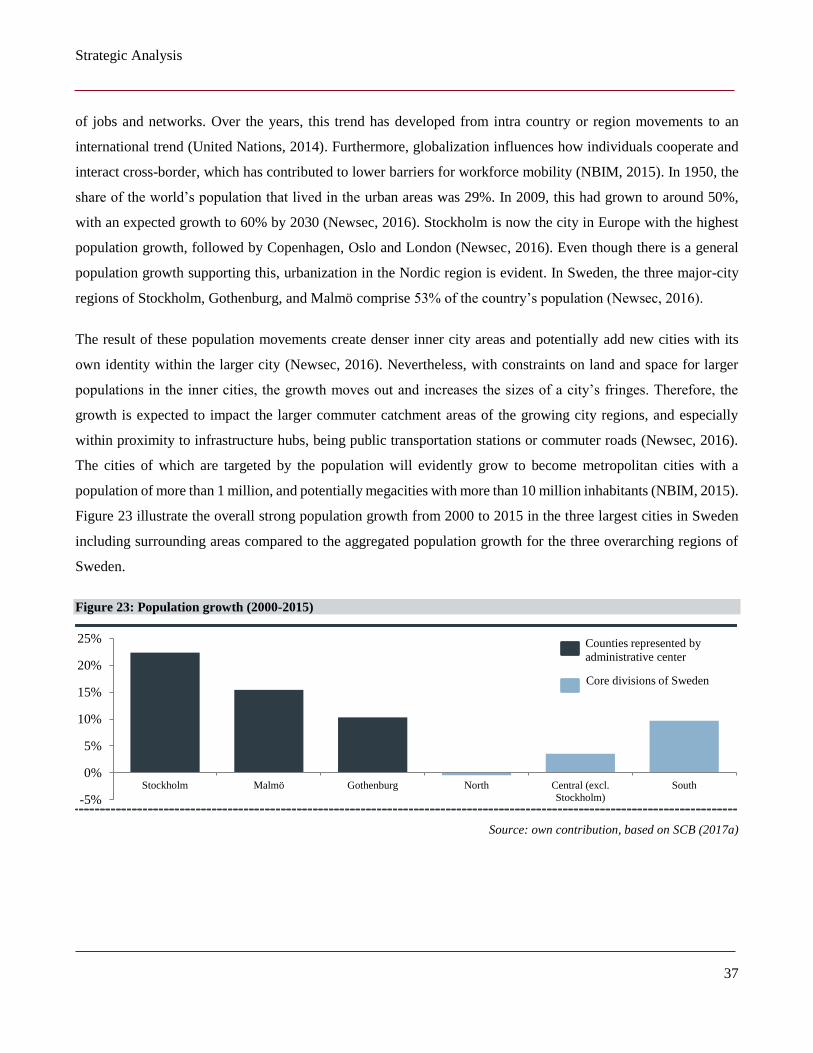
Strategic Analysis
37
of jobs and networks. Over the years, this trend has developed from intra country or region movements to an
international trend (United Nations, 2014). Furthermore, globalization influences how individuals cooperate and
interact cross-border, which has contributed to lower barriers for workforce mobility (NBIM, 2015). In 1950, the
share of the world’s population that lived in the urban areas was 29%. In 2009, this had grown to around 50%,
with an expected growth to 60% by 2030 (Newsec, 2016). Stockholm is now the city in Europe with the highest
population growth, followed by Copenhagen, Oslo and London (Newsec, 2016). Even though there is a general
population growth supporting this, urbanization in the Nordic region is evident. In Sweden, the three major-city
regions of Stockholm, Gothenburg, and Malmö comprise 53% of the country’s population (Newsec, 2016).
The result of these population movements create denser inner city areas and potentially add new cities with its
own identity within the larger city (Newsec, 2016). Nevertheless, with constraints on land and space for larger
populations in the inner cities, the growth moves out and increases the sizes of a city’s fringes. Therefore, the
growth is expected to impact the larger commuter catchment areas of the growing city regions, and especially
within proximity to infrastructure hubs, being public transportation stations or commuter roads (Newsec, 2016).
The cities of which are targeted by the population will evidently grow to become metropolitan cities with a
population of more than 1 million, and potentially megacities with more than 10 million inhabitants (NBIM, 2015).
Figure 23 illustrate the overall strong population growth from 2000 to 2015 in the three largest cities in Sweden
including surrounding areas compared to the aggregated population growth for the three overarching regions of
Sweden.
Figure 23: Population growth (2000-2015)
Source: own contribution, based on SCB (2017a)
-5%
0%
5%
10%
15%
20%
25%
Stockholm Malmö Gothenburg North Central (excl.
Stockholm)
South
Counties represented by
administrative center
Core divisions of Sweden
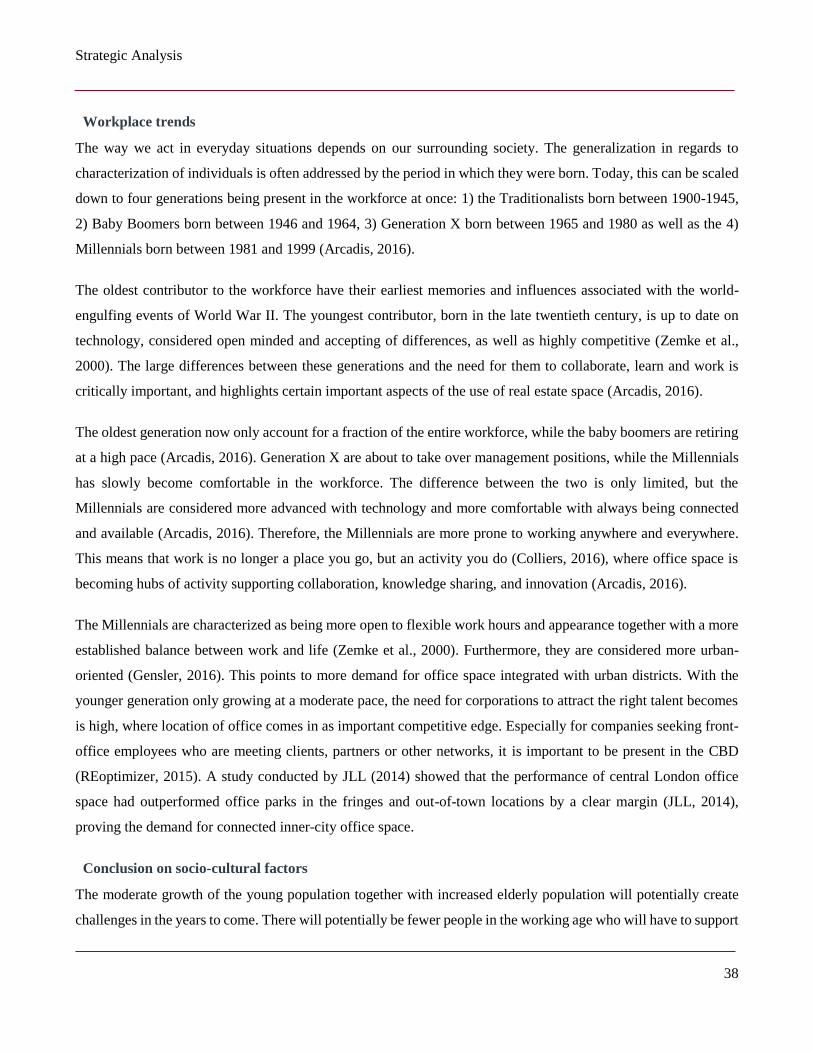
Strategic Analysis
38
Workplace trends
The way we act in everyday situations depends on our surrounding society. The generalization in regards to
characterization of individuals is often addressed by the period in which they were born. Today, this can be scaled
down to four generations being present in the workforce at once: 1) the Traditionalists born between 1900-1945,
2) Baby Boomers born between 1946 and 1964, 3) Generation X born between 1965 and 1980 as well as the 4)
Millennials born between 1981 and 1999 (Arcadis, 2016).
The oldest contributor to the workforce have their earliest memories and influences associated with the world-
engulfing events of World War II. The youngest contributor, born in the late twentieth century, is up to date on
technology, considered open minded and accepting of differences, as well as highly competitive (Zemke et al.,
2000). The large differences between these generations and the need for them to collaborate, learn and work is
critically important, and highlights certain important aspects of the use of real estate space (Arcadis, 2016).
The oldest generation now only account for a fraction of the entire workforce, while the baby boomers are retiring
at a high pace (Arcadis, 2016). Generation X are about to take over management positions, while the Millennials
has slowly become comfortable in the workforce. The difference between the two is only limited, but the
Millennials are considered more advanced with technology and more comfortable with always being connected
and available (Arcadis, 2016). Therefore, the Millennials are more prone to working anywhere and everywhere.
This means that work is no longer a place you go, but an activity you do (Colliers, 2016), where office space is
becoming hubs of activity supporting collaboration, knowledge sharing, and innovation (Arcadis, 2016).
The Millennials are characterized as being more open to flexible work hours and appearance together with a more
established balance between work and life (Zemke et al., 2000). Furthermore, they are considered more urban-
oriented (Gensler, 2016). This points to more demand for office space integrated with urban districts. With the
younger generation only growing at a moderate pace, the need for corporations to attract the right talent becomes
is high, where location of office comes in as important competitive edge. Especially for companies seeking front-
office employees who are meeting clients, partners or other networks, it is important to be present in the CBD
(REoptimizer, 2015). A study conducted by JLL (2014) showed that the performance of central London office
space had outperformed office parks in the fringes and out-of-town locations by a clear margin (JLL, 2014),
proving the demand for connected inner-city office space.
Conclusion on socio-cultural factors
The moderate growth of the young population together with increased elderly population will potentially create
challenges in the years to come. There will potentially be fewer people in the working age who will have to support
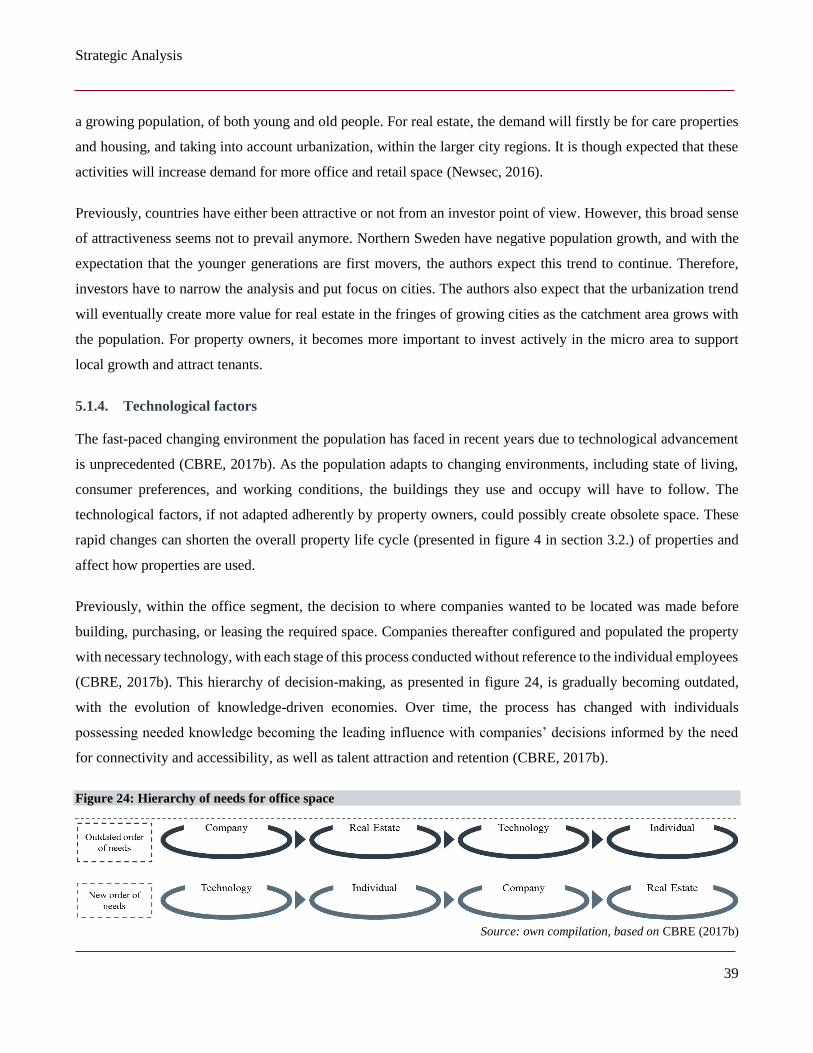
Strategic Analysis
39
a growing population, of both young and old people. For real estate, the demand will firstly be for care properties
and housing, and taking into account urbanization, within the larger city regions. It is though expected that these
activities will increase demand for more office and retail space (Newsec, 2016).
Previously, countries have either been attractive or not from an investor point of view. However, this broad sense
of attractiveness seems not to prevail anymore. Northern Sweden have negative population growth, and with the
expectation that the younger generations are first movers, the authors expect this trend to continue. Therefore,
investors have to narrow the analysis and put focus on cities. The authors also expect that the urbanization trend
will eventually create more value for real estate in the fringes of growing cities as the catchment area grows with
the population. For property owners, it becomes more important to invest actively in the micro area to support
local growth and attract tenants.
5.1.4. Technological factors
The fast-paced changing environment the population has faced in recent years due to technological advancement
is unprecedented (CBRE, 2017b). As the population adapts to changing environments, including state of living,
consumer preferences, and working conditions, the buildings they use and occupy will have to follow. The
technological factors, if not adapted adherently by property owners, could possibly create obsolete space. These
rapid changes can shorten the overall property life cycle (presented in figure 4 in section 3.2.) of properties and
affect how properties are used.
Previously, within the office segment, the decision to where companies wanted to be located was made before
building, purchasing, or leasing the required space. Companies thereafter configured and populated the property
with necessary technology, with each stage of this process conducted without reference to the individual employees
(CBRE, 2017b). This hierarchy of decision-making, as presented in figure 24, is gradually becoming outdated,
with the evolution of knowledge-driven economies. Over time, the process has changed with individuals
possessing needed knowledge becoming the leading influence with companies’ decisions informed by the need
for connectivity and accessibility, as well as talent attraction and retention (CBRE, 2017b).
Figure 24: Hierarchy of needs for office space
Source: own compilation, based on CBRE (2017b)
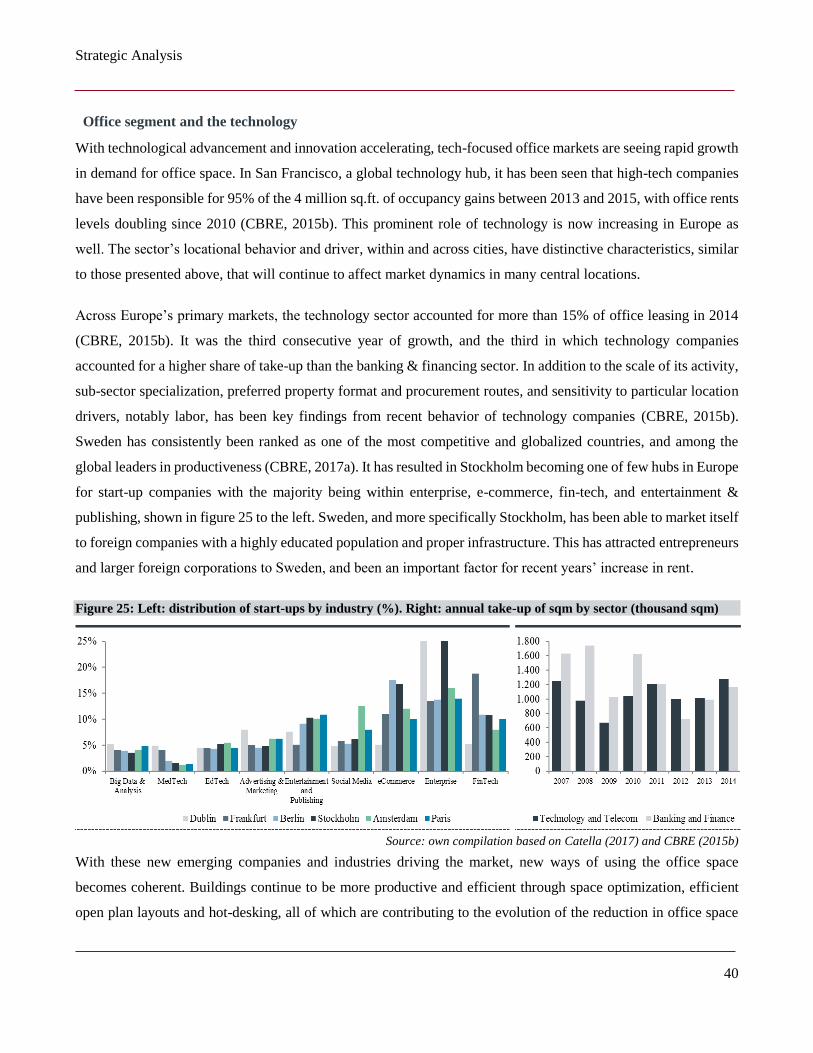
Strategic Analysis
40
Office segment and the technology
With technological advancement and innovation accelerating, tech-focused office markets are seeing rapid growth
in demand for office space. In San Francisco, a global technology hub, it has been seen that high-tech companies
have been responsible for 95% of the 4 million sq.ft. of occupancy gains between 2013 and 2015, with office rents
levels doubling since 2010 (CBRE, 2015b). This prominent role of technology is now increasing in Europe as
well. The sector’s locational behavior and driver, within and across cities, have distinctive characteristics, similar
to those presented above, that will continue to affect market dynamics in many central locations.
Across Europe’s primary markets, the technology sector accounted for more than 15% of office leasing in 2014
(CBRE, 2015b). It was the third consecutive year of growth, and the third in which technology companies
accounted for a higher share of take-up than the banking & financing sector. In addition to the scale of its activity,
sub-sector specialization, preferred property format and procurement routes, and sensitivity to particular location
drivers, notably labor, has been key findings from recent behavior of technology companies (CBRE, 2015b).
Sweden has consistently been ranked as one of the most competitive and globalized countries, and among the
global leaders in productiveness (CBRE, 2017a). It has resulted in Stockholm becoming one of few hubs in Europe
for start-up companies with the majority being within enterprise, e-commerce, fin-tech, and entertainment &
publishing, shown in figure 25 to the left. Sweden, and more specifically Stockholm, has been able to market itself
to foreign companies with a highly educated population and proper infrastructure. This has attracted entrepreneurs
and larger foreign corporations to Sweden, and been an important factor for recent years’ increase in rent.
Figure 25: Left: distribution of start-ups by industry (%). Right: annual take-up of sqm by sector (thousand sqm)
Source: own compilation based on Catella (2017) and CBRE (2015b)
With these new emerging companies and industries driving the market, new ways of using the office space
becomes coherent. Buildings continue to be more productive and efficient through space optimization, efficient
open plan layouts and hot-desking, all of which are contributing to the evolution of the reduction in office space
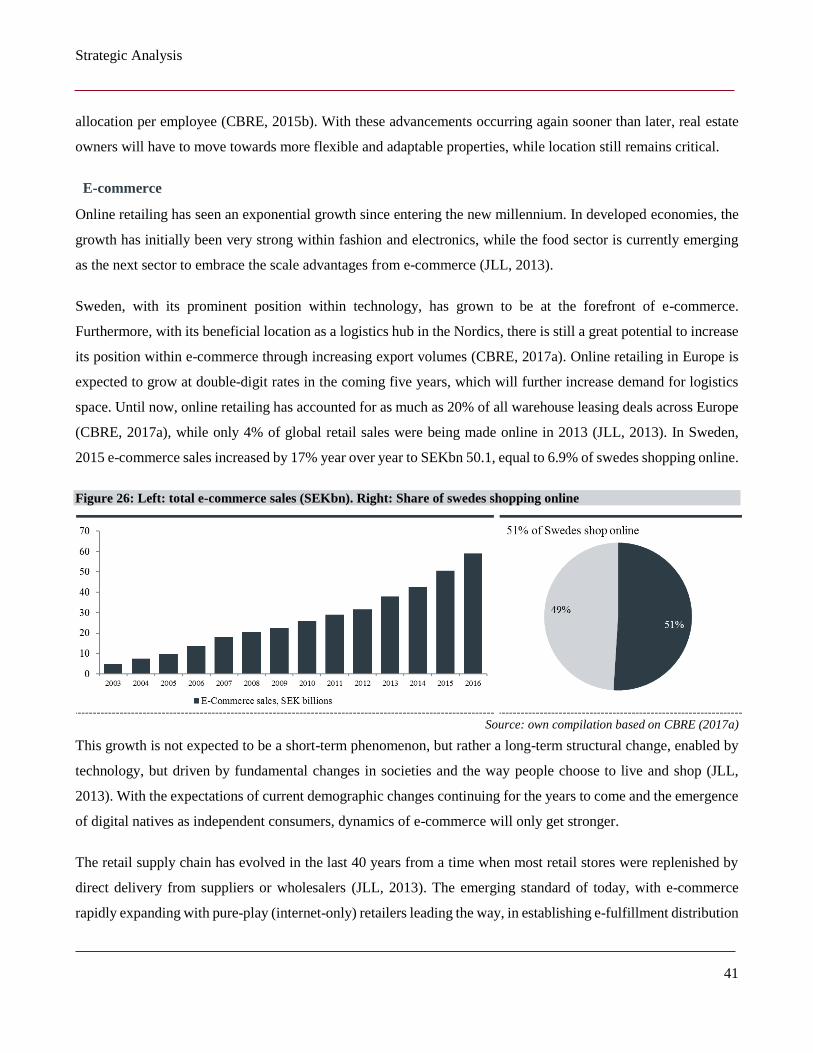
Strategic Analysis
41
allocation per employee (CBRE, 2015b). With these advancements occurring again sooner than later, real estate
owners will have to move towards more flexible and adaptable properties, while location still remains critical.
E-commerce
Online retailing has seen an exponential growth since entering the new millennium. In developed economies, the
growth has initially been very strong within fashion and electronics, while the food sector is currently emerging
as the next sector to embrace the scale advantages from e-commerce (JLL, 2013).
Sweden, with its prominent position within technology, has grown to be at the forefront of e-commerce.
Furthermore, with its beneficial location as a logistics hub in the Nordics, there is still a great potential to increase
its position within e-commerce through increasing export volumes (CBRE, 2017a). Online retailing in Europe is
expected to grow at double-digit rates in the coming five years, which will further increase demand for logistics
space. Until now, online retailing has accounted for as much as 20% of all warehouse leasing deals across Europe
(CBRE, 2017a), while only 4% of global retail sales were being made online in 2013 (JLL, 2013). In Sweden,
2015 e-commerce sales increased by 17% year over year to SEKbn 50.1, equal to 6.9% of swedes shopping online.
Figure 26: Left: total e-commerce sales (SEKbn). Right: Share of swedes shopping online
Source: own compilation based on CBRE (2017a)
This growth is not expected to be a short-term phenomenon, but rather a long-term structural change, enabled by
technology, but driven by fundamental changes in societies and the way people choose to live and shop (JLL,
2013). With the expectations of current demographic changes continuing for the years to come and the emergence
of digital natives as independent consumers, dynamics of e-commerce will only get stronger.
The retail supply chain has evolved in the last 40 years from a time when most retail stores were replenished by
direct delivery from suppliers or wholesalers (JLL, 2013). The emerging standard of today, with e-commerce
rapidly expanding with pure-play (internet-only) retailers leading the way, in establishing e-fulfillment distribution
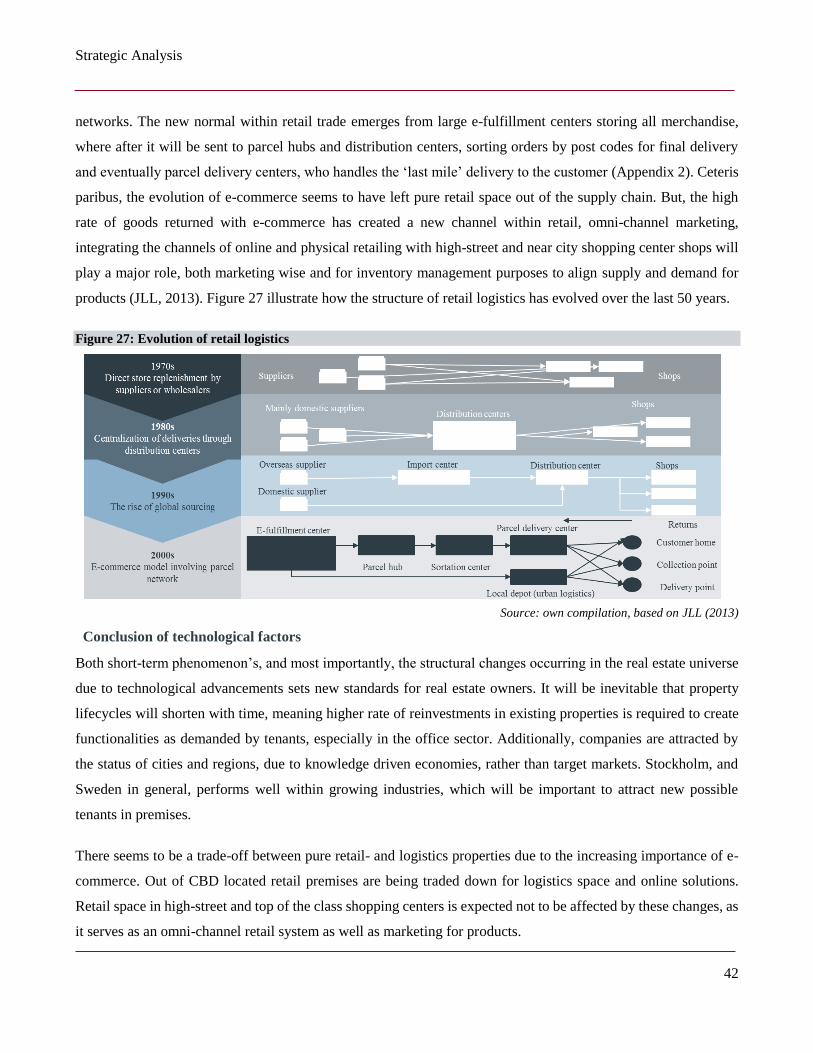
Strategic Analysis
42
networks. The new normal within retail trade emerges from large e-fulfillment centers storing all merchandise,
where after it will be sent to parcel hubs and distribution centers, sorting orders by post codes for final delivery
and eventually parcel delivery centers, who handles the ‘last mile’ delivery to the customer (Appendix 2). Ceteris
paribus, the evolution of e-commerce seems to have left pure retail space out of the supply chain. But, the high
rate of goods returned with e-commerce has created a new channel within retail, omni-channel marketing,
integrating the channels of online and physical retailing with high-street and near city shopping center shops will
play a major role, both marketing wise and for inventory management purposes to align supply and demand for
products (JLL, 2013). Figure 27 illustrate how the structure of retail logistics has evolved over the last 50 years.
Figure 27: Evolution of retail logistics
Source: own compilation, based on JLL (2013)
Conclusion of technological factors
Both short-term phenomenon’s, and most importantly, the structural changes occurring in the real estate universe
due to technological advancements sets new standards for real estate owners. It will be inevitable that property
lifecycles will shorten with time, meaning higher rate of reinvestments in existing properties is required to create
functionalities as demanded by tenants, especially in the office sector. Additionally, companies are attracted by
the status of cities and regions, due to knowledge driven economies, rather than target markets. Stockholm, and
Sweden in general, performs well within growing industries, which will be important to attract new possible
tenants in premises.
There seems to be a trade-off between pure retail- and logistics properties due to the increasing importance of e-
commerce. Out of CBD located retail premises are being traded down for logistics space and online solutions.
Retail space in high-street and top of the class shopping centers is expected not to be affected by these changes, as
it serves as an omni-channel retail system as well as marketing for products.
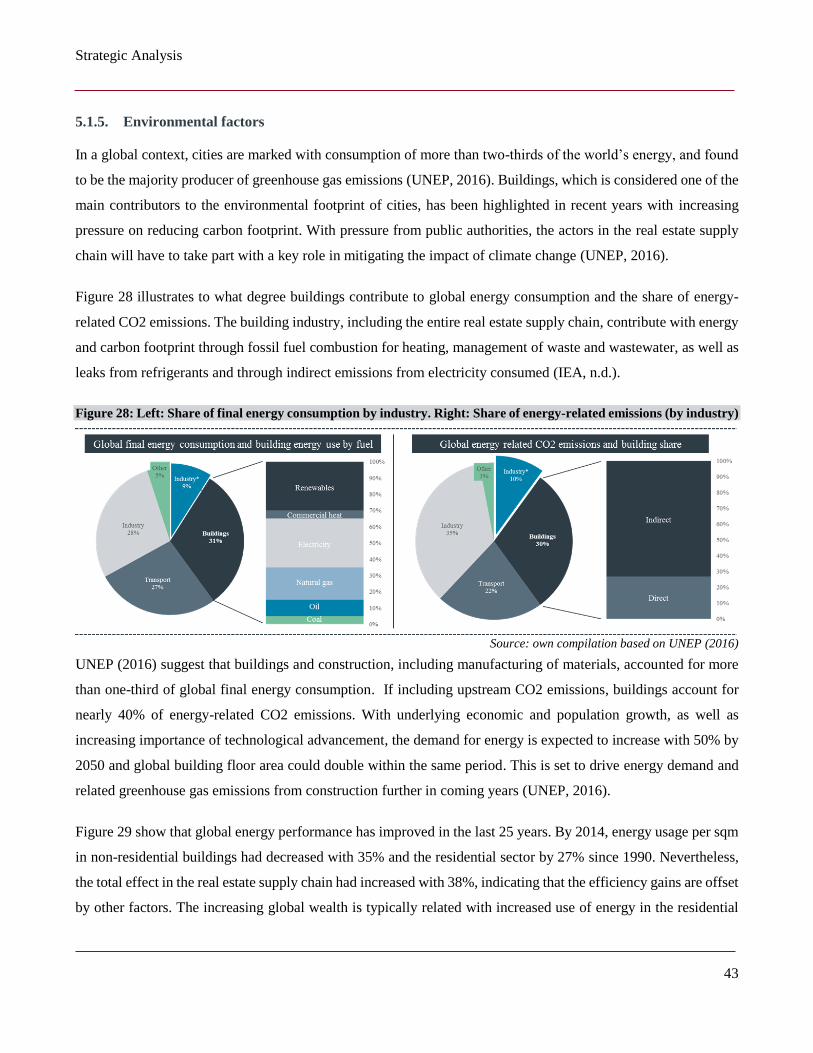
Strategic Analysis
43
5.1.5. Environmental factors
In a global context, cities are marked with consumption of more than two-thirds of the world’s energy, and found
to be the majority producer of greenhouse gas emissions (UNEP, 2016). Buildings, which is considered one of the
main contributors to the environmental footprint of cities, has been highlighted in recent years with increasing
pressure on reducing carbon footprint. With pressure from public authorities, the actors in the real estate supply
chain will have to take part with a key role in mitigating the impact of climate change (UNEP, 2016).
Figure 28 illustrates to what degree buildings contribute to global energy consumption and the share of energy-
related CO2 emissions. The building industry, including the entire real estate supply chain, contribute with energy
and carbon footprint through fossil fuel combustion for heating, management of waste and wastewater, as well as
leaks from refrigerants and through indirect emissions from electricity consumed (IEA, n.d.).
Figure 28: Left: Share of final energy consumption by industry. Right: Share of energy-related emissions (by industry)
Source: own compilation based on UNEP (2016)
UNEP (2016) suggest that buildings and construction, including manufacturing of materials, accounted for more
than one-third of global final energy consumption. If including upstream CO2 emissions, buildings account for
nearly 40% of energy-related CO2 emissions. With underlying economic and population growth, as well as
increasing importance of technological advancement, the demand for energy is expected to increase with 50% by
2050 and global building floor area could double within the same period. This is set to drive energy demand and
related greenhouse gas emissions from construction further in coming years (UNEP, 2016).
Figure 29 show that global energy performance has improved in the last 25 years. By 2014, energy usage per sqm
in non-residential buildings had decreased with 35% and the residential sector by 27% since 1990. Nevertheless,
the total effect in the real estate supply chain had increased with 38%, indicating that the efficiency gains are offset
by other factors. The increasing global wealth is typically related with increased use of energy in the residential
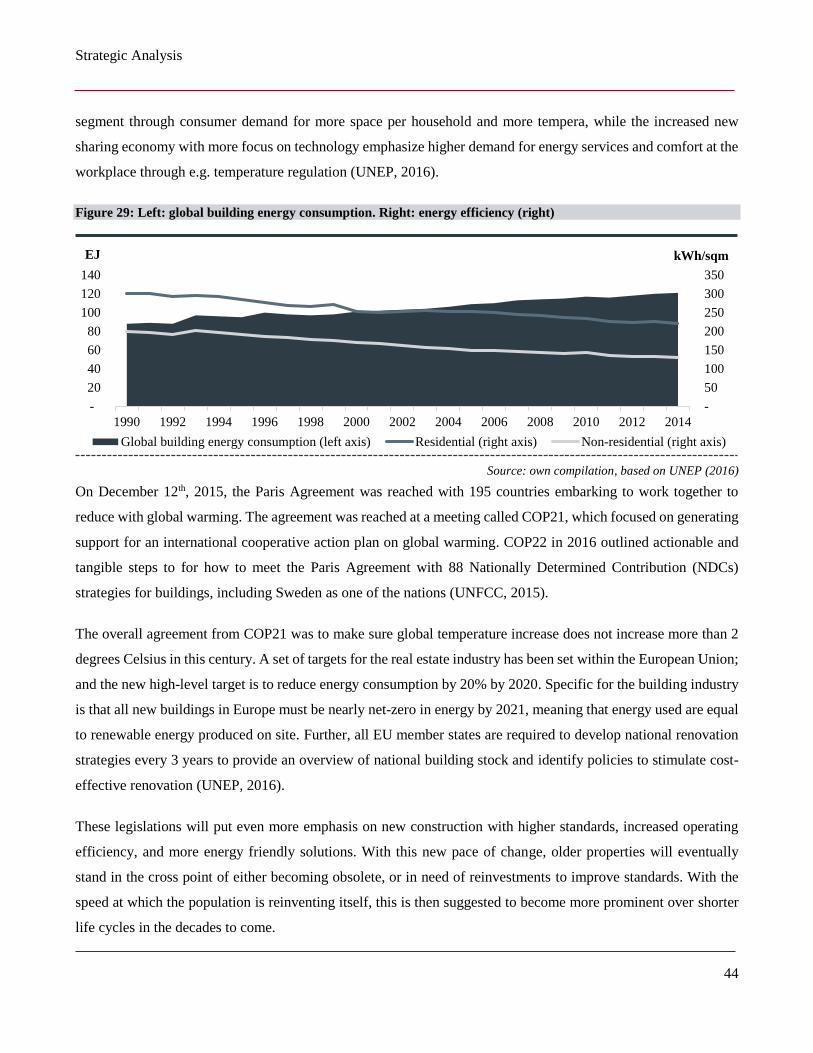
Strategic Analysis
44
segment through consumer demand for more space per household and more tempera, while the increased new
sharing economy with more focus on technology emphasize higher demand for energy services and comfort at the
workplace through e.g. temperature regulation (UNEP, 2016).
Figure 29: Left: global building energy consumption. Right: energy efficiency (right)
Source: own compilation, based on UNEP (2016)
On December 12th, 2015, the Paris Agreement was reached with 195 countries embarking to work together to
reduce with global warming. The agreement was reached at a meeting called COP21, which focused on generating
support for an international cooperative action plan on global warming. COP22 in 2016 outlined actionable and
tangible steps to for how to meet the Paris Agreement with 88 Nationally Determined Contribution (NDCs)
strategies for buildings, including Sweden as one of the nations (UNFCC, 2015).
The overall agreement from COP21 was to make sure global temperature increase does not increase more than 2
degrees Celsius in this century. A set of targets for the real estate industry has been set within the European Union;
and the new high-level target is to reduce energy consumption by 20% by 2020. Specific for the building industry
is that all new buildings in Europe must be nearly net-zero in energy by 2021, meaning that energy used are equal
to renewable energy produced on site. Further, all EU member states are required to develop national renovation
strategies every 3 years to provide an overview of national building stock and identify policies to stimulate cost-
effective renovation (UNEP, 2016).
These legislations will put even more emphasis on new construction with higher standards, increased operating
efficiency, and more energy friendly solutions. With this new pace of change, older properties will eventually
stand in the cross point of either becoming obsolete, or in need of reinvestments to improve standards. With the
speed at which the population is reinventing itself, this is then suggested to become more prominent over shorter
life cycles in the decades to come.
-
50
100
150
200
250
300
350
-
20
40
60
80
100
120
140
1990 1992 1994 1996 1998 2000 2002 2004 2006 2008 2010 2012 2014
Global building energy consumption (left axis) Residential (right axis) Non-residential (right axis)
EJ kWh/sqm
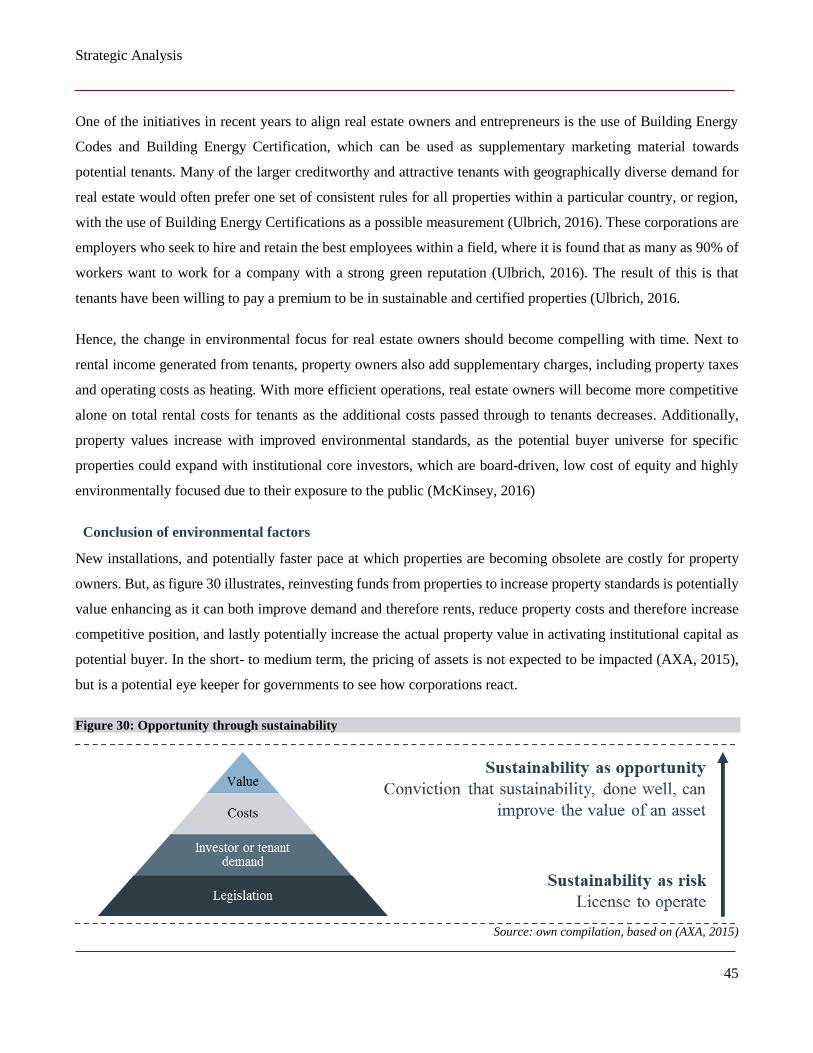
Strategic Analysis
45
One of the initiatives in recent years to align real estate owners and entrepreneurs is the use of Building Energy
Codes and Building Energy Certification, which can be used as supplementary marketing material towards
potential tenants. Many of the larger creditworthy and attractive tenants with geographically diverse demand for
real estate would often prefer one set of consistent rules for all properties within a particular country, or region,
with the use of Building Energy Certifications as a possible measurement (Ulbrich, 2016). These corporations are
employers who seek to hire and retain the best employees within a field, where it is found that as many as 90% of
workers want to work for a company with a strong green reputation (Ulbrich, 2016). The result of this is that
tenants have been willing to pay a premium to be in sustainable and certified properties (Ulbrich, 2016.
Hence, the change in environmental focus for real estate owners should become compelling with time. Next to
rental income generated from tenants, property owners also add supplementary charges, including property taxes
and operating costs as heating. With more efficient operations, real estate owners will become more competitive
alone on total rental costs for tenants as the additional costs passed through to tenants decreases. Additionally,
property values increase with improved environmental standards, as the potential buyer universe for specific
properties could expand with institutional core investors, which are board-driven, low cost of equity and highly
environmentally focused due to their exposure to the public (McKinsey, 2016)
Conclusion of environmental factors
New installations, and potentially faster pace at which properties are becoming obsolete are costly for property
owners. But, as figure 30 illustrates, reinvesting funds from properties to increase property standards is potentially
value enhancing as it can both improve demand and therefore rents, reduce property costs and therefore increase
competitive position, and lastly potentially increase the actual property value in activating institutional capital as
potential buyer. In the short- to medium term, the pricing of assets is not expected to be impacted (AXA, 2015),
but is a potential eye keeper for governments to see how corporations react.
Figure 30: Opportunity through sustainability
Source: own compilation, based on (AXA, 2015)
Strategic Analysis
46
5.1.6. Key drivers of change
Based on history, low and even negative interest rates would imply an outlook for poor growth and possible
deflation. In these periods, asset values have usually also been low. The picture of Sweden and its economy does
not represent these characteristics, but rather a country with steady employment growth, increased disposable
income and growing production. In today’s economy, in which globalization and therefore cross-border
dependency marks a big part on a nations balance sheet, Sweden will not embark in an interest rate increase before
trading partners, has been able to stabilize monetary and financial policies. Even though real estate prices have
been affected by the low yields, rent levels are considered superior indicator for real estate return performance. In
the long run, property returns are driven by rental growth, not by yields, as they oscillate without trend. The trend
in rents is driven by economic growth, building/replacement costs and land and or planning constraint (Kempen
& Co, 2016). As the current economic position of Sweden is considered strong and stable, there is no reason to
believe that there will be a downward pressure on rents in the time to come.
The key drivers for real estate over the coming decades goes in parallel with how the society chooses to use
properties. Firstly, population movements, both within national borders and cross-border, will put more emphasis
on being active owner of real estate in the larger cities that decouple from a country in itself. A city with
demographic growth that simultaneously are able to couple with the possibility of creating additional jobs will
alone be able to drive prosperity. Secondly, technological advancements and the disruptive, innovation driven
nature of business, mean that real estate products are being rethought in both form and provision (Gensler, 2016).
The generations that are currently advocating the business environment are driven by human knowledge together
with technology, presenting new forces in which society keeps reinventing itself at a faster pace. For a real estate
owner, this highlights the importance of being active owners and able to react in an agile manner. As with the
paradigm shift from closed offices to cubicles and hot-desking, the authors believe the new trend from strictly
open offices to activity-based workplaces are the newest paradigm shift, with the belief that paradigms will erupt
in a more rapid pace in coming decades.
Finally, the Millennials as well as the growing Generation Z (born after 1999) are both considered more actively
involved in the surroundings, including the environment (Zemke et al., 2000). The current environmental
regulation of real estate is not expected to hurt property values in the short- to medium run, but the authors expect
that with younger generations becoming the majority of the society, property owners need to align with more
environmental friendly solutions that can benefit both real estate investors and tenants. The authors expect that
property owners who are already preparing for these changes in the regulatory environment and aligning with the
“new normal” can generate superior returns.
Strategic Analysis
47
5.2. Porters Five Forces Michael Porter, a Harvard Business School professor, has spent his long-time career on analyzing strategies and
competition. One of the most important aspects of his research, both admired by scholars and practitioners, was
that he embodied that the goal should not be to enter an industry or sector with the sole purpose of competing
against established firms, as this would only transfer wealth from the internal competitors to externals. Porter
urged that one should research the attractiveness of an industry, and enter an industry or sector, if there are any
“openings” in the competitive landscape (Duval & Stachenfeld, 2016)
One of his most important papers practically dictates how practitioners think of competition and strategy. In his
paper “How Competitive Forces Shape Strategy” (Porter, 1979), he introduced a framework with five factors to
consider when evaluating the attractiveness of an industry. These five factors, broadly considering the power of
participants in the eco-system of an industry, illustrate competitive forces and their impact on prices, operational
costs and investment costs required to compete. These five factors therefore have a direct link to the financial
statements, including both the running profit generation and the capital structure of the balance sheet.
Real estate as an eco-system covers many sub sectors, ranging from real estate construction in inception phase to
transaction advisory and demolition firms. To be more specific in this analysis, and limit the range of forces
actually considered relevant for the specific companies in the analysis, the relevant sub-sector within real estate
that is examined in the analysis is regarded as real estate owners.
5.2.1. Threat of new entrants
Generic theory applied to real estate
The theory as outlined by Porter indicate that the degree of entry barriers to an industry could have profound
impacts on return prospects. The theory highlights that barriers to entry depends on possible scale advantages in
the market, product differentiation & identity, and capital requirements (Porter, 1979).
Of generic theories, capital stands out as important. Unlike technology and light asset sectors, real estate is able to
depict most of the values through the book value of assets. The prospects of return are dependent on the ability of
assets to deliver cash flow, reflected through fair value reporting of properties. With the asset intensity of the real
estate sector, it follows that extensive capital is required to enter the market. It is possible to enter the market
through a leveraged capital structure, however, the level of debt limits the flexibility of industry participant. For
example, a relatively conservative, but leveraged position was found prevalent for the peer group in the financial
analysis (section 6.6.). Barriers on capital will be evaluated in section 5.2.2, however, the initial need for capital
is high, creating barriers to enter the market.
Strategic Analysis
48
The possibility of product differentiation and creation of a strong brand identity create certain barriers for other
participants to compete (Porter, 1979). For real estate companies, it is difficult to obtain a competitive advantage
based on these intangible assets. The product delivered by property owners is mostly generic in providing space
for tenants. Even though quality varies and specific location is close to inimitable, the effective product delivered
is undifferentiated, lowering entry barriers. In the current environment, property owner’s identity is not of
importance for tenants. Towards capital providers, the brand could be of importance, as property owners holding
a strong record of accomplishment and solid balance sheets is considered more attractive both towards equity and
debt investors. Nevertheless, these aspects do not increase entry barriers.
The relevant costs and possibilities of scale advantages is discussed in more detail in section 10.2 as well as the
analysis of costs in relation to owned sqm. The findings suggest that there are scale advantages for property owners.
Except for property maintenance and administrative costs, all costs in relation to consumption in properties are
passed through to the tenants. Property maintenance is expected to increase one-to-one with the number of sqm
owned, as the average maintenance costs is not believed to be reduced as number of properties increase. In terms
of central administrative costs, figure 64 in section 10.2. indicating diminishing scale to a certain level of sqm,
where after it gradually levels off, in line with the theory of diminishing returns to scale. The scale advantages
create entry barriers, with larger property owners being able to attract with lower rent levels due to the lower cost
schedule.
Public to private ownership
The public authority’s influence real estate through both being a major owner of property and land, as well as their
intervention in zoning plans and building requirements/constraints. This is to a large degree representative in
Sweden, both on local and central level.
In Sweden, 18 municipalities are included among the 50 largest property owners in the country, accounting for
38% of the space. Including the public sector at central level, it accounts for 20 of the 50 largest with 43% of the
total space among top 50 (Datscha, 2017). The properties owned by municipalities and government is mostly used
by authorities or counties, and does not limit anyone from entry into or expand their market.
The past 5 decades has highlighted the increasing pace of deregulation. Public authorities have over time been
selling land and properties to private investors who intends to add value beyond what public authorities are able
to do as property owners. The value to public authorities from divesting real estate is that new owners add a
purpose for properties of which could enhance the development of regions and cities (CBRE, 2011). This increased
supply of properties for sale has created opportunities for new participants in the market with properties and land
Strategic Analysis
49
with a wide range of risk profiles. The reasoning for disposal of properties by the public ownership has shifted
over the recent decade where it has become an element in budget deficit-reduction plans (CBRE, 2011). The
properties variation in quality and hence appeal to prospective investors has again created certain opportunities for
new owners due to significant room for improvement (CBRE, 2011).
The public authorities are though still able to control and navigate in the real estate market. Through regulations
in zoning plans, the government are able to restrict the use, height and materials used in new constructions or
redevelopment of existing properties. The risks involved with these development projects are high and would
create barriers in terms of both legal and technical knowledge. Nevertheless, these services can be purchased from
dedicated consultancy houses with specific knowledge in both handling authorities and planning development
projects in line with requirements, limiting barriers to some extent (Deloitte, 2015).
Increasing cross-country knowledge and alternative routes to market
Before the turn of the century, domestic participants held most activity within the sector in the Nordics. The
limitations for foreign investors related to the importance of local presence, knowledge to culture, regulatory
implications and networks. With increased mobility between global regions in the recent 20 years follows a steep
learning curve in global markets, including the real estate landscape.
At the end of 2015, the Nordic investment market constituted of between 10% and 20% of total European
transactions, which is a fivefold increase from 2009. Due to the relatively stable political situation in the Nordics
and an attractive profile in terms of growth prospects relative to similar European counterparts, the foreign
investment activity has been an important contributor to increased number of transactions. Most of these investors
are new to the market, and increases the competition directly through reduced direct returns from properties at
acquisition (CBRE, 2016b; Catella, 2016).
Some of the foreign investors are making direct investment in the Nordics with established property management
teams present, but the majority are either investing through the general partner structure which is growing in
popularity. The last decade has seen the rise of alternative ways to invest in real estate with secondary investments
through private equity firms of which only focus on real estate investments, as noted in section 3.1. This safeguards
foreign investors as the Nordic general partner teams have local knowledge and networks. Additionally, foreign
investors are able to outsource asset management duties to dedicated asset management firms, which have grown
significantly over the last decade (Cushman & Wakefield, 2013).
Strategic Analysis
50
The increased trend of foreign investments in a region is firstly affecting properties with secured income in prime
locations. The observed dynamics is that prices on such objects increases with higher competition, reducing
investment yields. Yields are compressed downwards to levels where the risk/reward equation does not hold up
anymore, leading to shifts outwards on the risk curve to investment in secondary locations and properties with
higher risk (Union, 2016). The current low interest rate environment creates an investment landscape in which
there are few alternatives to the equivalent of fixed income investments, which will increase the allocation towards
real estate in the coming years (PWC, 2014), and especially from institutional investors. This will further enhance
the competitive forces and push yields down, similar to the movements seen in fully competitive markets.
5.2.2. Bargaining power of suppliers
Undifferentiated services diminish supplier power
Based on the scale of in-house operations and size of the property portfolio introduces the choice for property
owners to either contract services externally or build in-house capabilities and serve customers through this supply
chain. The most commonly used external services by property owners are related to letting and maintenance of
properties as well as construction contractors (Marketline, 2014, 2016). These suppliers are all part of highly
professional and competitive markets (Marketline, 2014, 2016).
If the operations include development, either through construction of new builds, reconstruction and/or expansion
of existing properties, services are often contracted to professionals within the construction sector. This market is
competitive and fragmented (Marketline, 2014). There is a large degree of smaller sized construction companies,
relying heavily on receiving tendered projects. As price is an important factor when in tendering, the smaller sized
constructors usually push prices down. These mechanics suggest low bargaining power for the suppliers. In
addition, offerings by contractors are largely undifferentiated services, increasing the internal competition within
the construction sector (Marketline, 2014, 2016)
Other suppliers, more related to ongoing operations, are letting agencies. These agencies are paid for managing
operations, but the major cost for property owners often kicks in based on a success rate, meaning that the agency
receives full payment based on new signed leased contracts (Marketline, 2016). Additionally, the break fee for the
owner to discontinue the letting arrangements are small, meaning low switching costs. The market for letting
agencies is considered professional and large with both domestic companies and international branches observed
in most western countries (Keller Williams, 2011). Even though the product they supply is to large degree
undifferentiated, they can create edge and are believed to charge higher prices based on historical performance
and their rolodex. Based on the above, the general bargaining power is though considered low.
Strategic Analysis
51
The final key supplier of recurring services to real estate owners is facility management providers. These services
can be insourced, but tend to be outsourced at varying degree (Marketline, 2016). Facility management
arrangements can both relate to certain projects and long-term recurring maintenance programs. Most companies
therefore initiate an overall agreement with a company for several properties, and for a longer period. The long-
term contracts are considered attractive for the suppliers, leading to price pressure on long contracts (Marketline,
2016). It is believed that there are switching costs on long-term contracts, which can be of significance if the
property owner assign facility managers to specific properties instead of the entire portfolio. If a property owner
sells the property through an asset deal, the facility management contract will typically be terminated. Companies
with larger portfolios to assign facility management contracts are therefore suggested to have an advantage in the
negotiation for these services.
Market for supply of credit as a source of capital
As mentioned in 5.2.1., capital requirements are high, for both entry and expansion. The large upfront payment
for accessing the rights to properties and their existing and possible future cash flow, often result in participants
using credit markets as a source of capital. The median loan to value (LTV) of the Swedish listed real estate
companies is 54% (Nordea, 2016), illustrating that this is not only the case for new entrants, but established
industry players as well.
The financial crisis that erupted in the late 2008 had profound impact, and essentially incepted through credit
markets. Financial institutions grew larger based on increased leverage on their balance sheet. In the aftermath,
several institutions reviewed the regulations within the banking sector. The supervisory pressure is particularly
high in the United States and Europe, which have seen a spate of regulations in the areas of capital, governance,
market infrastructure, financial crime and taxes, accounting and disclosure of remuneration (Capgemini, 2014).
The renewed supervision and regulatory requirements post financial crisis impacted credit markets through lending
rates, banks willingness and possibilities to issue new debt.
The Basel committee, set up by the Bank for International Settlements (BIS) has resulted in increased capital
requirements, buffers, and liquidity requirements. This will affect the return on equity for banks negatively
(Capgemini, 2014). The immediate effect of these requirements is that banks will have to lower high-risk weighted
parts of portfolios on the balance sheet, resulting in a cut in lending volumes to a vast amount of sectors, including
commercial real estate and corporate lending (Capgemini, 2014). The regulations overall are directed towards
reducing the risk-taking by banks and impose restrictions on credit lending. The availability for credit will
therefore limit buyers longer out on the risk curve, while it is suggested that prime properties with a core profile
Strategic Analysis
52
would not see any larger restrictions on credit capital imposed, as this would not increase the risk-weighted average
profile of a bank’s portfolio.
Regulations have led to higher capital buffers and increased the burden of compliance in banks, which has
increased the overall cost of funding for banks (Capgemini, 2014). In addition, the higher capital and liquidity
requirements have an economic cost and affect the borrowing cost of funds for banks. The loan rates have to take
into account the higher cost of capital and those of other sources of funding. To overcome the increased economic
cost and rising cost of credit, banks are charging higher rate of interest on lending, which enables banks to increase
their lending margins (Capgemini, 2014).
The banks cost of lending, and willingness to issue debt is offset by the artificially low interest rates in the markets
and alternative routes to credit funding are widening. Bond issuance in the public markets and from institutions,
such as pension funds, create renewed competition and put a cap for the banks cost of debt. Again, the lack of
good alternatives in the more secured investment market means that there is an increasing interest for debt
financing transactions (Nordea, 2016). This is however partially in favor of the larger, stable, and established
players in the industry, who is therefore given an advantage to new entrants. Nevertheless, the increasing amount
of institutional capital directed towards equity investments in real estate will not be negatively affected by this, as
institutional often come in with a generous amount of equity in relation to debt, with their lower cost of equity
requirements and core profiles.
5.2.3. Bargaining power of customers
Transparent lending market
Tenants source space either through in-house functions or via letting agents. Property owners and managers are
targeting these tenants by marketing the space, either in-house, or through letting agents. The marketplace in which
tenant and property owners meets has, primarily due to the technological evolution and the size of the online
classifieds market, become highly transparent. Real estate brokerages and advisors can through in-house
capabilities and internet searches obtain what levels tenants are expecting for the demanded space. This is usually
consolidated into a range of different market reports, either limited to paying customer groups, or free and
accessible for everyone.
With the dynamics of how the supply and demand side are being informed, competitive market prices are being
reached within different geographies, segments and property standards. Similar to the supply and demand
dynamics of the transaction market, equilibrium is being reached based on a vast amount of public information
and the prospects of value creation. This again suggest that the marketplace is highly competitive.
Strategic Analysis
53
Property owner and tenants’ position in negotiations
The common standard for office and retail space is that property owners and tenants balance the relationship
between duration and consideration of a lease agreement. A property owner sees more value in long leases due to
the security of income generated from the asset. With the transparency mentioned in the market, property owners
will attract and incentivize prospective tenants with discounts to market rent, either as a one-off, or a general lower
running rent during the lease agreement. This suggest that tenants are well positioned in lease negotiations initially,
with the power they obtain in signing long leases at a reduced cost.
On the other side, in signing a long lease, the tenant commit to the space for the entire length of the lease agreement,
reducing flexibility and increasing future risk in that the tenant might outgrow the space. The switching cost is
therefore considered high, as tenant will be in a low powered position when negotiating an early exit to the lease
agreement. Additionally, remuneration from the tenant in relation to degradation of the space during the lease term
should be included in the equation. Most space is improved by property owners prior to start of the lease term, and
next to normal wear and tear, tenants will have to pay for the new upgrade of the space. Even though this does not
result in shift of power in bargaining, all else equal, tenants are incentivized to stay and sign a new lease for the
space (Manley, 1988).
5.2.4. Threat of substituting products
From owning to renting
Tenants has the option of owning instead of renting the properties they use. But, with the uncertainties related to
owning often leaves corporations with the more predictable cost i.e. rent. If a corporation was to analyze the
alternative cost of owning to renting, they would have to predict interest rate movements, length of mortgage
agreement and incorporate the running costs of owning the property (Marketline, 2016). As companies become
more focused on core operations, real estate activities tend to be less prioritized, adding more demand in the letting
market (CBRE, 2015a)
Previously, corporate real estate asset disposals such as sale and leaseback transactions was seen as a means of
raising capital, and therefore compete with other alternatives (CBRE, 2015a). This could explain the increased
corporate asset disposals from 2004 to 2007. With the current low interest rate environment, corporations are able
to finance themselves in cheaper markets, resulting in less incentive for sale of properties. Corporate asset disposals
have increased every year since 2009, but contribute relatively less to the total transaction. It is suggested that the
growing trend reflects a desire to fund change in the corporation rather than raise capital (CBRE, 2015a).
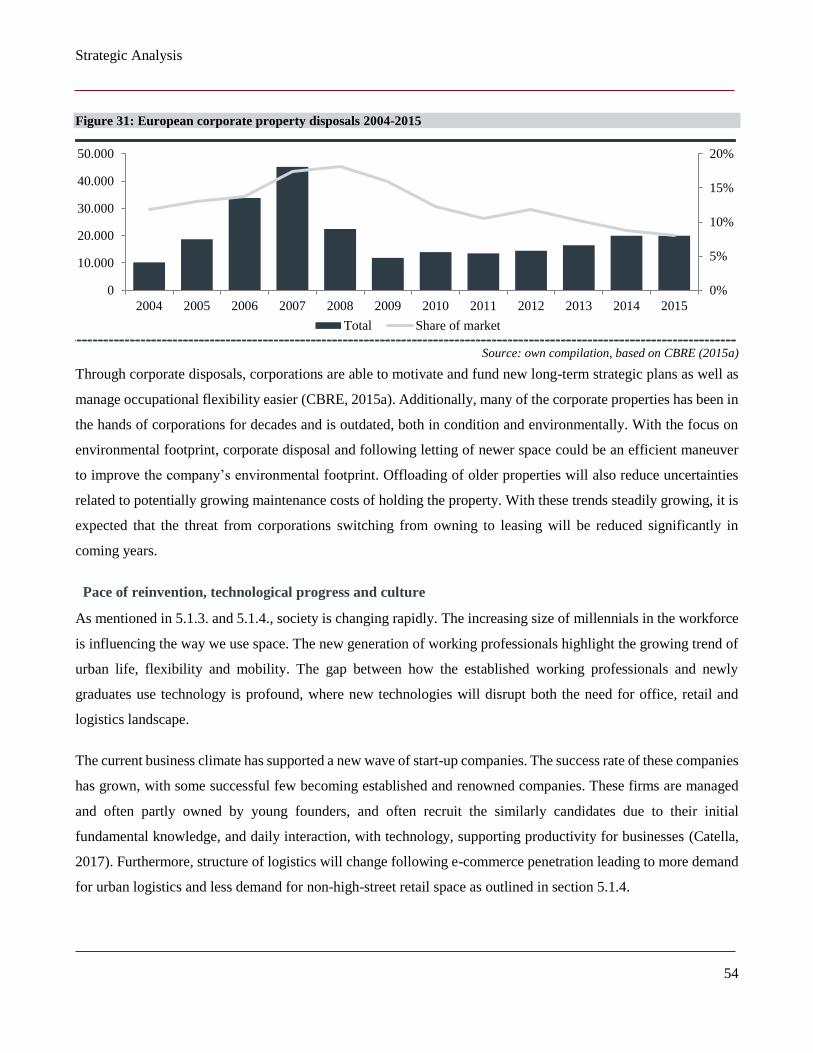
Strategic Analysis
54
Figure 31: European corporate property disposals 2004-2015
Source: own compilation, based on CBRE (2015a)
Through corporate disposals, corporations are able to motivate and fund new long-term strategic plans as well as
manage occupational flexibility easier (CBRE, 2015a). Additionally, many of the corporate properties has been in
the hands of corporations for decades and is outdated, both in condition and environmentally. With the focus on
environmental footprint, corporate disposal and following letting of newer space could be an efficient maneuver
to improve the company’s environmental footprint. Offloading of older properties will also reduce uncertainties
related to potentially growing maintenance costs of holding the property. With these trends steadily growing, it is
expected that the threat from corporations switching from owning to leasing will be reduced significantly in
coming years.
Pace of reinvention, technological progress and culture
As mentioned in 5.1.3. and 5.1.4., society is changing rapidly. The increasing size of millennials in the workforce
is influencing the way we use space. The new generation of working professionals highlight the growing trend of
urban life, flexibility and mobility. The gap between how the established working professionals and newly
graduates use technology is profound, where new technologies will disrupt both the need for office, retail and
logistics landscape.
The current business climate has supported a new wave of start-up companies. The success rate of these companies
has grown, with some successful few becoming established and renowned companies. These firms are managed
and often partly owned by young founders, and often recruit the similarly candidates due to their initial
fundamental knowledge, and daily interaction, with technology, supporting productivity for businesses (Catella,
2017). Furthermore, structure of logistics will change following e-commerce penetration leading to more demand
for urban logistics and less demand for non-high-street retail space as outlined in section 5.1.4.
0%
5%
10%
15%
20%
0
10.000
20.000
30.000
40.000
50.000
2004 2005 2006 2007 2008 2009 2010 2011 2012 2013 2014 2015
Total Share of market
Strategic Analysis
55
Even though these trends are prevalent, society are still in the need of building space, either in the form of office,
retail or logistics. There are few to none substitutes that does not include a building as the basis. The use of office
and retail space will change rapidly in coming decades in line with trend in the previous decade. Those property
owners who are able to react in an agile manner will be able to continue to return value to shareholders. It will
become even more important to be active as a property owner in “growth cities” instead of “growth countries”, as
cities are able to serve its own market, and channel its own marketing towards companies, both growing
population, business activity and retail trade.
The overall assessment is that e-commerce is the largest threat to demand for retail space, and can potentially
create obsolete space. Within the office market, the trend point towards a growing need for flexible and open office
solutions, and preferably with co-working facilities. This is though not a risk for creation of obsolete space, but
rather a warning for property owners to adapt towards meeting preferences of companies, and be more proactive
in terms of creating space specifically designated for a style of company or industry.
5.2.5. Rivalry among existing competitors
The conditions needed for a market to be considered perfectly competitive are: 1) no single player influence pricing
and production; 2) homogenous products; 3) full transparency about product and price; 4) one price in the market,
prevailing solely from supply and demand; and 5) freedom of entry and exit (Parkin, 2012).
A perfectly competitive market is not achievable in the real world, where companies are trying to differentiate
products and gain market share. Nevertheless, the characteristics of the real estate market seems to be very close
to a perfectly competitive market. The industry is fragmented with a handful of large property owners and a long
tail of small players, were the larger players only control a moderate share of the total market. Additionally, the
market in which property owners trade assets are considered highly transparent with public registration of
ownership and high availability of recent property prices, leads to a competitive environment driven by observed
market prices. Furthermore, the same logic is driving the competitive environment in the rental market.
Due to scale in administration costs, large owners achieve lower production costs, and the capital intensity of the
industry is leading to high entry and exit barriers. However, many of the characteristics of the market points toward
a market that is highly competitive. In a perfectly competitive market, a firm can make abnormal profits in the
short run, while in the long run, no profits can be made (Parkin, 2012).

Strategic Analysis
56
5.2.6. Assessment of overall competitive environment
The marketplace for property ownership is relatively unique, in being highly competitive while at the same time a
high-input market driven by asset intensity, creating entry barriers. This alone should limit any potential pressure
from competition outside of the current market. However, the deregulation and turn from public to private
ownership of both properties and land enhanced the creation of a singular private sector consisting of constructers
and owners of properties. With following focus on specialization and furthermore on core operations, property
ownership segregated and rapidly became a stand-alone sector, becoming highly competitive with companies
fighting for market shares in the form of sqm ownership.
Fueled by the high level of transparency between the supplier, lender, and property owners, real estate has been,
and always will be, a competitive market. The authors believe that the dynamics of the supply and demand side is
close to a perfectly competitive market, in which case theory suggest that no profits are being amassed by the
producer. Conflicting with this hypothesis is the property owners proven shareholder value creation, with varying
results from booms and busts dependent on timing and cyclical trends. This then suggests that there are competitive
forces in the sector, in advantage of the property owner.
The high level of competitive pressure has reduced former competitive advantages leading to a purely price driven
competition. The current low interest rate environment and aggressive credit market the sector is exposed to now
has created excess returns for property owners through high cash-on-cash returns from leveraged positions across
all sectors of the real estate market. With a growing capital base, low cost of equity investors will further enhance
competition for prime land and properties with safe returns, which increase prime property values, but also
diminish returns.
With the increasing speed in which individuals are reinventing themselves, excess returns in the future is expected
to be created by the real estate providers who can meet rapidly changing human needs through both being agile
and flexible. Similarly, property investors need to service the particular demands erupting from the knowledge
economy, and prepare for a digital transformation of society, urging people urbanize and further drive the rise of
regional- and main-cities that will become even more important economic powerhouses. Even though real estate
is a depreciating asset, land is not. The scarcity of unused land, and increasing investor focus on urban areas,
highlight a mismatch in the demand and supply side, where it is expected that urban land and property values will
increase until potential owners see value being destroyed. The shift in value creation then stems from asset
management activities, or exploitation of new unseen property markets, both geographical and in the sense of user
concepts.
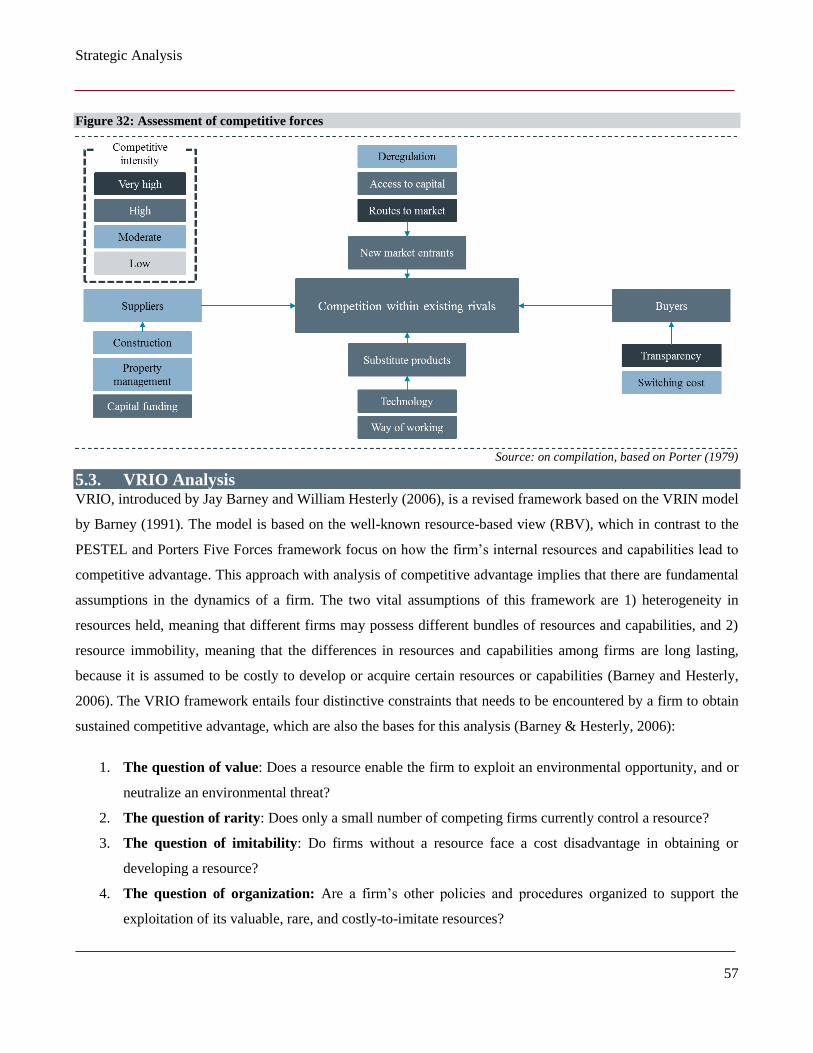
Strategic Analysis
57
Figure 32: Assessment of competitive forces
Source: on compilation, based on Porter (1979)
5.3. VRIO Analysis VRIO, introduced by Jay Barney and William Hesterly (2006), is a revised framework based on the VRIN model
by Barney (1991). The model is based on the well-known resource-based view (RBV), which in contrast to the
PESTEL and Porters Five Forces framework focus on how the firm’s internal resources and capabilities lead to
competitive advantage. This approach with analysis of competitive advantage implies that there are fundamental
assumptions in the dynamics of a firm. The two vital assumptions of this framework are 1) heterogeneity in
resources held, meaning that different firms may possess different bundles of resources and capabilities, and 2)
resource immobility, meaning that the differences in resources and capabilities among firms are long lasting,
because it is assumed to be costly to develop or acquire certain resources or capabilities (Barney and Hesterly,
2006). The VRIO framework entails four distinctive constraints that needs to be encountered by a firm to obtain
sustained competitive advantage, which are also the bases for this analysis (Barney & Hesterly, 2006):
1. The question of value: Does a resource enable the firm to exploit an environmental opportunity, and or
neutralize an environmental threat?
2. The question of rarity: Does only a small number of competing firms currently control a resource?
3. The question of imitability: Do firms without a resource face a cost disadvantage in obtaining or
developing a resource?
4. The question of organization: Are a firm’s other policies and procedures organized to support the
exploitation of its valuable, rare, and costly-to-imitate resources?
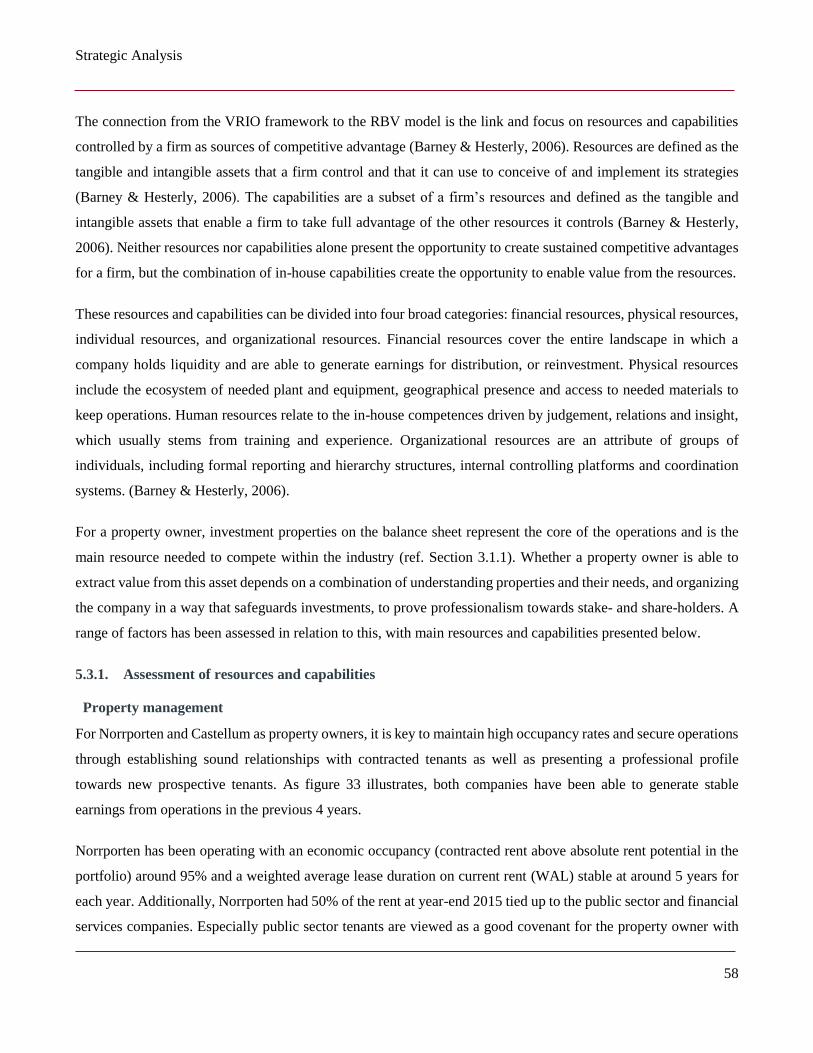
Strategic Analysis
58
The connection from the VRIO framework to the RBV model is the link and focus on resources and capabilities
controlled by a firm as sources of competitive advantage (Barney & Hesterly, 2006). Resources are defined as the
tangible and intangible assets that a firm control and that it can use to conceive of and implement its strategies
(Barney & Hesterly, 2006). The capabilities are a subset of a firm’s resources and defined as the tangible and
intangible assets that enable a firm to take full advantage of the other resources it controls (Barney & Hesterly,
2006). Neither resources nor capabilities alone present the opportunity to create sustained competitive advantages
for a firm, but the combination of in-house capabilities create the opportunity to enable value from the resources.
These resources and capabilities can be divided into four broad categories: financial resources, physical resources,
individual resources, and organizational resources. Financial resources cover the entire landscape in which a
company holds liquidity and are able to generate earnings for distribution, or reinvestment. Physical resources
include the ecosystem of needed plant and equipment, geographical presence and access to needed materials to
keep operations. Human resources relate to the in-house competences driven by judgement, relations and insight,
which usually stems from training and experience. Organizational resources are an attribute of groups of
individuals, including formal reporting and hierarchy structures, internal controlling platforms and coordination
systems. (Barney & Hesterly, 2006).
For a property owner, investment properties on the balance sheet represent the core of the operations and is the
main resource needed to compete within the industry (ref. Section 3.1.1). Whether a property owner is able to
extract value from this asset depends on a combination of understanding properties and their needs, and organizing
the company in a way that safeguards investments, to prove professionalism towards stake- and share-holders. A
range of factors has been assessed in relation to this, with main resources and capabilities presented below.
5.3.1. Assessment of resources and capabilities
Property management
For Norrporten and Castellum as property owners, it is key to maintain high occupancy rates and secure operations
through establishing sound relationships with contracted tenants as well as presenting a professional profile
towards new prospective tenants. As figure 33 illustrates, both companies have been able to generate stable
earnings from operations in the previous 4 years.
Norrporten has been operating with an economic occupancy (contracted rent above absolute rent potential in the
portfolio) around 95% and a weighted average lease duration on current rent (WAL) stable at around 5 years for
each year. Additionally, Norrporten had 50% of the rent at year-end 2015 tied up to the public sector and financial
services companies. Especially public sector tenants are viewed as a good covenant for the property owner with
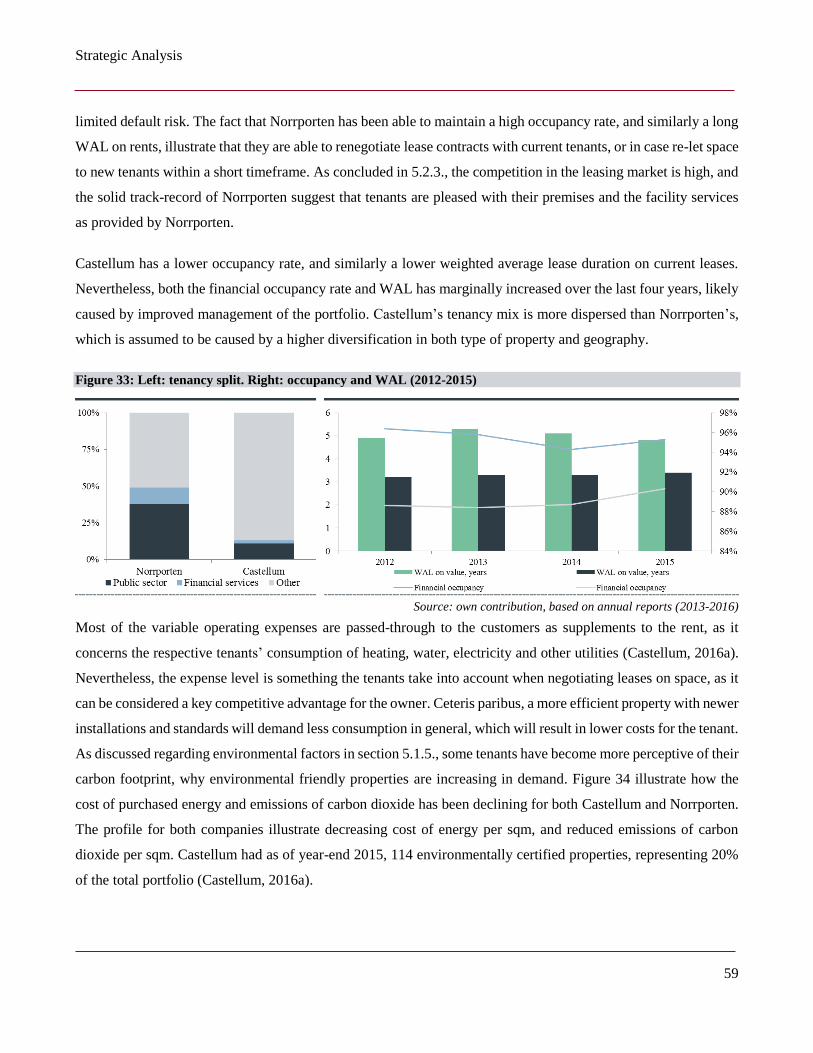
Strategic Analysis
59
limited default risk. The fact that Norrporten has been able to maintain a high occupancy rate, and similarly a long
WAL on rents, illustrate that they are able to renegotiate lease contracts with current tenants, or in case re-let space
to new tenants within a short timeframe. As concluded in 5.2.3., the competition in the leasing market is high, and
the solid track-record of Norrporten suggest that tenants are pleased with their premises and the facility services
as provided by Norrporten.
Castellum has a lower occupancy rate, and similarly a lower weighted average lease duration on current leases.
Nevertheless, both the financial occupancy rate and WAL has marginally increased over the last four years, likely
caused by improved management of the portfolio. Castellum’s tenancy mix is more dispersed than Norrporten’s,
which is assumed to be caused by a higher diversification in both type of property and geography.
Figure 33: Left: tenancy split. Right: occupancy and WAL (2012-2015)
Source: own contribution, based on annual reports (2013-2016)
Most of the variable operating expenses are passed-through to the customers as supplements to the rent, as it
concerns the respective tenants’ consumption of heating, water, electricity and other utilities (Castellum, 2016a).
Nevertheless, the expense level is something the tenants take into account when negotiating leases on space, as it
can be considered a key competitive advantage for the owner. Ceteris paribus, a more efficient property with newer
installations and standards will demand less consumption in general, which will result in lower costs for the tenant.
As discussed regarding environmental factors in section 5.1.5., some tenants have become more perceptive of their
carbon footprint, why environmental friendly properties are increasing in demand. Figure 34 illustrate how the
cost of purchased energy and emissions of carbon dioxide has been declining for both Castellum and Norrporten.
The profile for both companies illustrate decreasing cost of energy per sqm, and reduced emissions of carbon
dioxide per sqm. Castellum had as of year-end 2015, 114 environmentally certified properties, representing 20%
of the total portfolio (Castellum, 2016a).
Strategic Analysis
60
Figure 34 to the left illustrate running maintenance cost per sqm for both companies and shows that Castellum
used 50% less on running maintenance compared to Norrporten. This is surprising to the authors as Castellum’s
portfolio was perceived to be more similar to a value-add strategy portfolio (ref figure 2), which would typically
result in higher running maintenance. The asset quality and standard of the portfolios was discussed with Erika
Olsén (Appendix 10) in relation to whether the focus on ESG investing for institutional investors (The AP Funds)
meant that Norrporten held a more environmentally friendly portfolio, and if this was important:
“We could see that Norrporten had put effort in having a sustainable portfolio. However, Castellum has also been
doing this in very high levels in recent years. The thing is that we might not have communicated this to a large extent to
investors. If Norrporten did not have focus on sustainable properties, it could rather have been a problem”
- Erika Olsèn, CIO Castellum, interview, March 30th 2017
The lower levels of Castellum indicate that they maintain the standard of their properties with less funds, benefiting
owners. The authors’ question whether the higher maintenance costs of Norrporten could be related to preparing
Norrporten for an exit, i.e. to decrease economic vacancy rates by increasing running maintenance.
Figure 34: Left: maintenance costs per sqm (SEK per sqm). Right: sustainability measures
Source: own contribution, based on Castellum (2016a) and Norrporten (2016)
Lower maintenance costs at Castellum paired with the environmental friendly profile of both companies is
expected to represent a good basis for integration of the companies due to small differences and possibilities for
best practice sharing. The combination of in-house knowledge of technical property standards, relations to
different groups of tenants and environmental profile could enhance exploitation of new opportunities, and even
neutralize from possible shifts new regulation and shifts in demand related to green buildings. The capabilities of
the companies are however neither rare nor imitable as there are leading external consultants within all fields with
this knowledge and network that would be available to everyone who could afford it. The cost of creating more
efficient and environmental friendly space is a barrier, but as discussed in 5.1.5., the payoff time is short due to
cost efficiency of environmental friendly space. Both Norrporten and Castellum are well positioned to exploit the
opportunities that erupt, with special emphasis on their local expertise in respective regions through local offices.
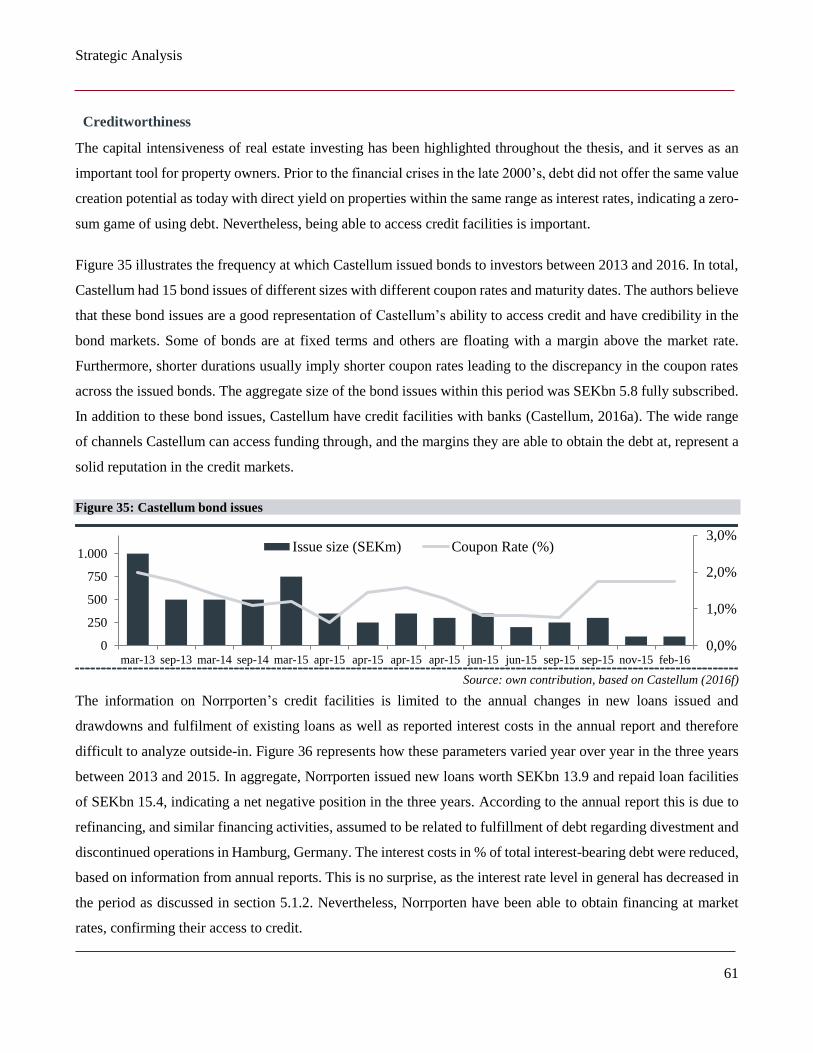
Strategic Analysis
61
Creditworthiness
The capital intensiveness of real estate investing has been highlighted throughout the thesis, and it serves as an
important tool for property owners. Prior to the financial crises in the late 2000’s, debt did not offer the same value
creation potential as today with direct yield on properties within the same range as interest rates, indicating a zero-
sum game of using debt. Nevertheless, being able to access credit facilities is important.
Figure 35 illustrates the frequency at which Castellum issued bonds to investors between 2013 and 2016. In total,
Castellum had 15 bond issues of different sizes with different coupon rates and maturity dates. The authors believe
that these bond issues are a good representation of Castellum’s ability to access credit and have credibility in the
bond markets. Some of bonds are at fixed terms and others are floating with a margin above the market rate.
Furthermore, shorter durations usually imply shorter coupon rates leading to the discrepancy in the coupon rates
across the issued bonds. The aggregate size of the bond issues within this period was SEKbn 5.8 fully subscribed.
In addition to these bond issues, Castellum have credit facilities with banks (Castellum, 2016a). The wide range
of channels Castellum can access funding through, and the margins they are able to obtain the debt at, represent a
solid reputation in the credit markets.
Figure 35: Castellum bond issues
Source: own contribution, based on Castellum (2016f)
The information on Norrporten’s credit facilities is limited to the annual changes in new loans issued and
drawdowns and fulfilment of existing loans as well as reported interest costs in the annual report and therefore
difficult to analyze outside-in. Figure 36 represents how these parameters varied year over year in the three years
between 2013 and 2015. In aggregate, Norrporten issued new loans worth SEKbn 13.9 and repaid loan facilities
of SEKbn 15.4, indicating a net negative position in the three years. According to the annual report this is due to
refinancing, and similar financing activities, assumed to be related to fulfillment of debt regarding divestment and
discontinued operations in Hamburg, Germany. The interest costs in % of total interest-bearing debt were reduced,
based on information from annual reports. This is no surprise, as the interest rate level in general has decreased in
the period as discussed in section 5.1.2. Nevertheless, Norrporten have been able to obtain financing at market
rates, confirming their access to credit.
0,0%
1,0%
2,0%
3,0%
0
250
500
750
1.000
mar-13 sep-13 mar-14 sep-14 mar-15 apr-15 apr-15 apr-15 apr-15 jun-15 jun-15 sep-15 sep-15 nov-15 feb-16
Issue size (SEKm) Coupon Rate (%)
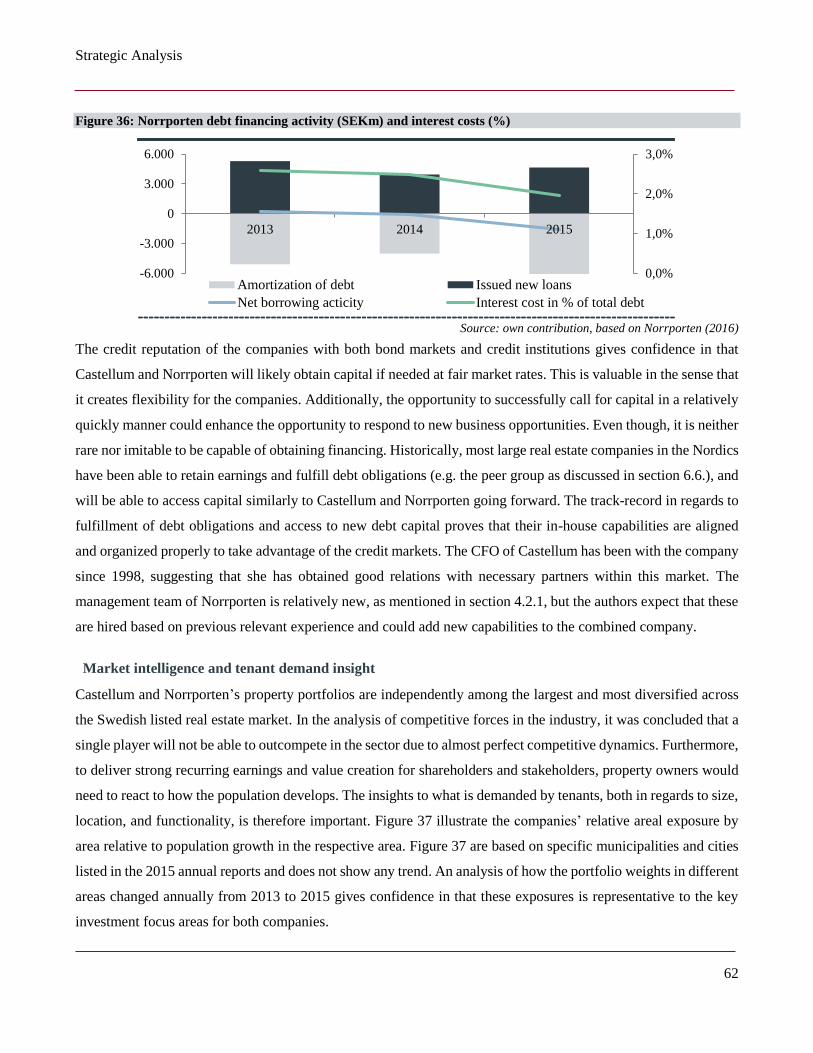
Strategic Analysis
62
Figure 36: Norrporten debt financing activity (SEKm) and interest costs (%)
Source: own contribution, based on Norrporten (2016)
The credit reputation of the companies with both bond markets and credit institutions gives confidence in that
Castellum and Norrporten will likely obtain capital if needed at fair market rates. This is valuable in the sense that
it creates flexibility for the companies. Additionally, the opportunity to successfully call for capital in a relatively
quickly manner could enhance the opportunity to respond to new business opportunities. Even though, it is neither
rare nor imitable to be capable of obtaining financing. Historically, most large real estate companies in the Nordics
have been able to retain earnings and fulfill debt obligations (e.g. the peer group as discussed in section 6.6.), and
will be able to access capital similarly to Castellum and Norrporten going forward. The track-record in regards to
fulfillment of debt obligations and access to new debt capital proves that their in-house capabilities are aligned
and organized properly to take advantage of the credit markets. The CFO of Castellum has been with the company
since 1998, suggesting that she has obtained good relations with necessary partners within this market. The
management team of Norrporten is relatively new, as mentioned in section 4.2.1, but the authors expect that these
are hired based on previous relevant experience and could add new capabilities to the combined company.
Market intelligence and tenant demand insight
Castellum and Norrporten’s property portfolios are independently among the largest and most diversified across
the Swedish listed real estate market. In the analysis of competitive forces in the industry, it was concluded that a
single player will not be able to outcompete in the sector due to almost perfect competitive dynamics. Furthermore,
to deliver strong recurring earnings and value creation for shareholders and stakeholders, property owners would
need to react to how the population develops. The insights to what is demanded by tenants, both in regards to size,
location, and functionality, is therefore important. Figure 37 illustrate the companies’ relative areal exposure by
area relative to population growth in the respective area. Figure 37 are based on specific municipalities and cities
listed in the 2015 annual reports and does not show any trend. An analysis of how the portfolio weights in different
areas changed annually from 2013 to 2015 gives confidence in that these exposures is representative to the key
investment focus areas for both companies.
0,0%
1,0%
2,0%
3,0%
-6.000
-3.000
0
3.000
6.000
2013 2014 2015
Amortization of debt Issued new loans
Net borrowing acticity Interest cost in % of total debt
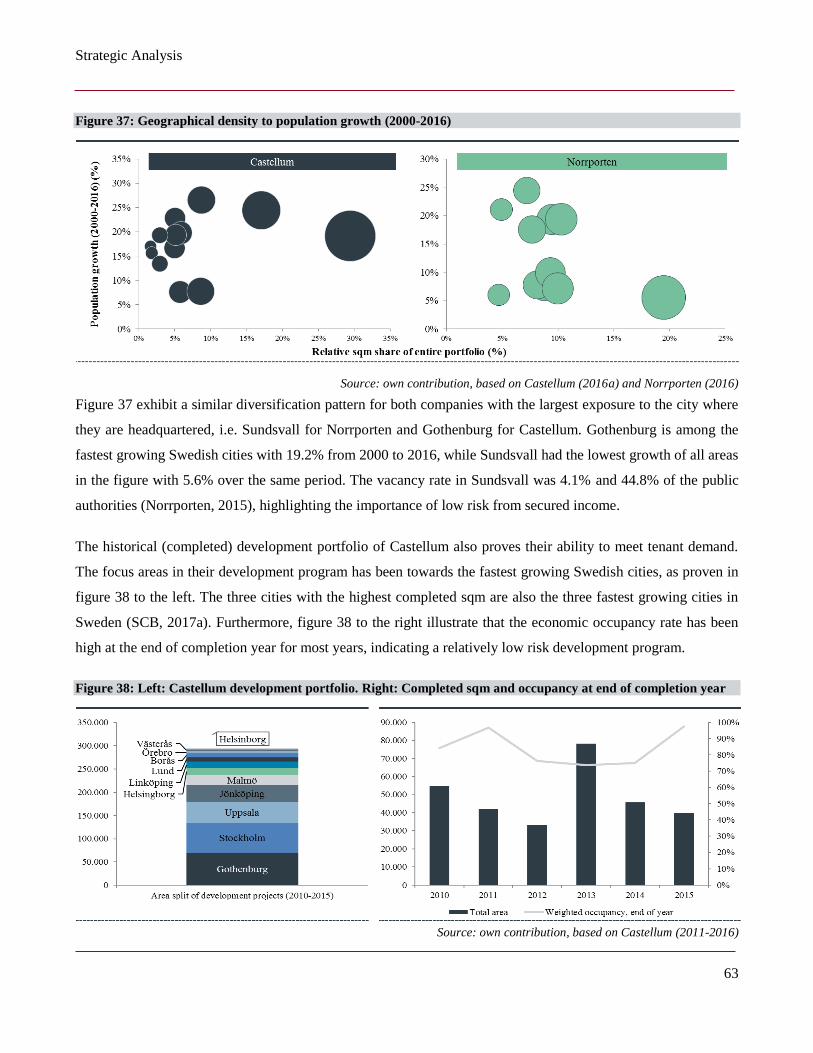
Strategic Analysis
63
Figure 37: Geographical density to population growth (2000-2016)
Source: own contribution, based on Castellum (2016a) and Norrporten (2016)
Figure 37 exhibit a similar diversification pattern for both companies with the largest exposure to the city where
they are headquartered, i.e. Sundsvall for Norrporten and Gothenburg for Castellum. Gothenburg is among the
fastest growing Swedish cities with 19.2% from 2000 to 2016, while Sundsvall had the lowest growth of all areas
in the figure with 5.6% over the same period. The vacancy rate in Sundsvall was 4.1% and 44.8% of the public
authorities (Norrporten, 2015), highlighting the importance of low risk from secured income.
The historical (completed) development portfolio of Castellum also proves their ability to meet tenant demand.
The focus areas in their development program has been towards the fastest growing Swedish cities, as proven in
figure 38 to the left. The three cities with the highest completed sqm are also the three fastest growing cities in
Sweden (SCB, 2017a). Furthermore, figure 38 to the right illustrate that the economic occupancy rate has been
high at the end of completion year for most years, indicating a relatively low risk development program.
Figure 38: Left: Castellum development portfolio. Right: Completed sqm and occupancy at end of completion year
Source: own contribution, based on Castellum (2011-2016)
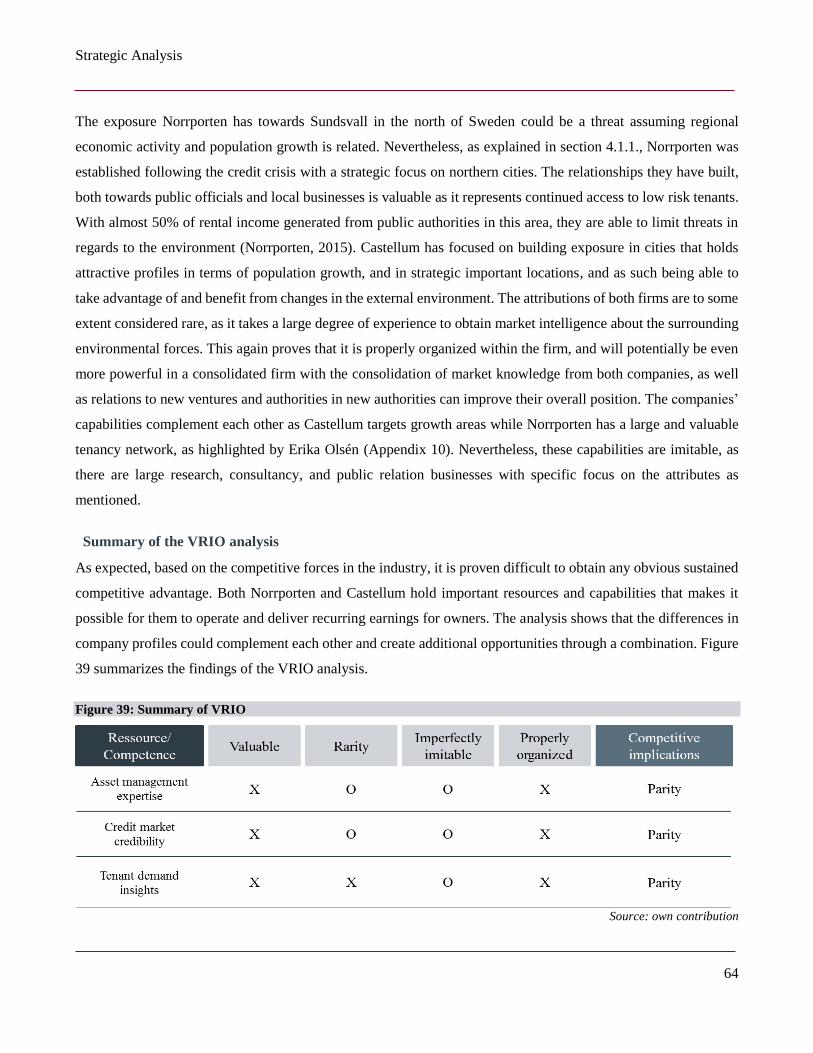
Strategic Analysis
64
The exposure Norrporten has towards Sundsvall in the north of Sweden could be a threat assuming regional
economic activity and population growth is related. Nevertheless, as explained in section 4.1.1., Norrporten was
established following the credit crisis with a strategic focus on northern cities. The relationships they have built,
both towards public officials and local businesses is valuable as it represents continued access to low risk tenants.
With almost 50% of rental income generated from public authorities in this area, they are able to limit threats in
regards to the environment (Norrporten, 2015). Castellum has focused on building exposure in cities that holds
attractive profiles in terms of population growth, and in strategic important locations, and as such being able to
take advantage of and benefit from changes in the external environment. The attributions of both firms are to some
extent considered rare, as it takes a large degree of experience to obtain market intelligence about the surrounding
environmental forces. This again proves that it is properly organized within the firm, and will potentially be even
more powerful in a consolidated firm with the consolidation of market knowledge from both companies, as well
as relations to new ventures and authorities in new authorities can improve their overall position. The companies’
capabilities complement each other as Castellum targets growth areas while Norrporten has a large and valuable
tenancy network, as highlighted by Erika Olsén (Appendix 10). Nevertheless, these capabilities are imitable, as
there are large research, consultancy, and public relation businesses with specific focus on the attributes as
mentioned.
Summary of the VRIO analysis
As expected, based on the competitive forces in the industry, it is proven difficult to obtain any obvious sustained
competitive advantage. Both Norrporten and Castellum hold important resources and capabilities that makes it
possible for them to operate and deliver recurring earnings for owners. The analysis shows that the differences in
company profiles could complement each other and create additional opportunities through a combination. Figure
39 summarizes the findings of the VRIO analysis.
Figure 39: Summary of VRIO
Source: own contribution
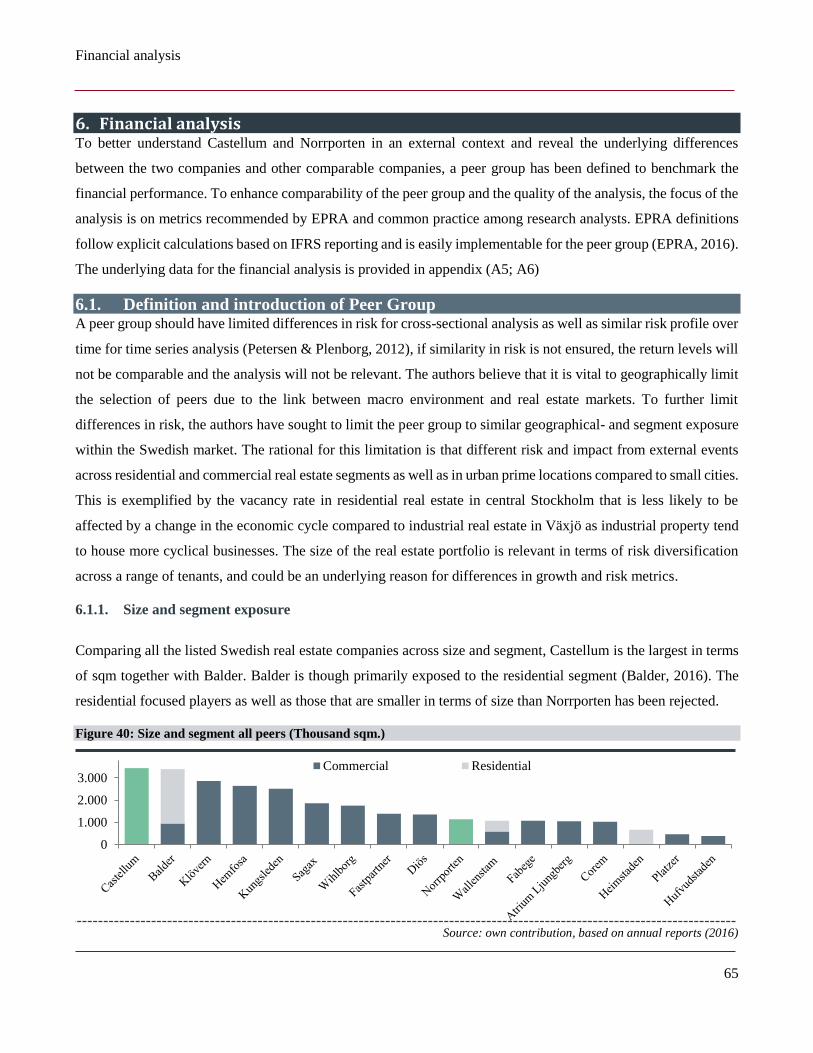
Financial analysis
65
6. Financial analysis To better understand Castellum and Norrporten in an external context and reveal the underlying differences
between the two companies and other comparable companies, a peer group has been defined to benchmark the
financial performance. To enhance comparability of the peer group and the quality of the analysis, the focus of the
analysis is on metrics recommended by EPRA and common practice among research analysts. EPRA definitions
follow explicit calculations based on IFRS reporting and is easily implementable for the peer group (EPRA, 2016).
The underlying data for the financial analysis is provided in appendix (A5; A6)
6.1. Definition and introduction of Peer Group A peer group should have limited differences in risk for cross-sectional analysis as well as similar risk profile over
time for time series analysis (Petersen & Plenborg, 2012), if similarity in risk is not ensured, the return levels will
not be comparable and the analysis will not be relevant. The authors believe that it is vital to geographically limit
the selection of peers due to the link between macro environment and real estate markets. To further limit
differences in risk, the authors have sought to limit the peer group to similar geographical- and segment exposure
within the Swedish market. The rational for this limitation is that different risk and impact from external events
across residential and commercial real estate segments as well as in urban prime locations compared to small cities.
This is exemplified by the vacancy rate in residential real estate in central Stockholm that is less likely to be
affected by a change in the economic cycle compared to industrial real estate in Växjö as industrial property tend
to house more cyclical businesses. The size of the real estate portfolio is relevant in terms of risk diversification
across a range of tenants, and could be an underlying reason for differences in growth and risk metrics.
6.1.1. Size and segment exposure
Comparing all the listed Swedish real estate companies across size and segment, Castellum is the largest in terms
of sqm together with Balder. Balder is though primarily exposed to the residential segment (Balder, 2016). The
residential focused players as well as those that are smaller in terms of size than Norrporten has been rejected.
Figure 40: Size and segment all peers (Thousand sqm.)
Source: own contribution, based on annual reports (2016)
0
1.000
2.000
3.000Commercial Residential
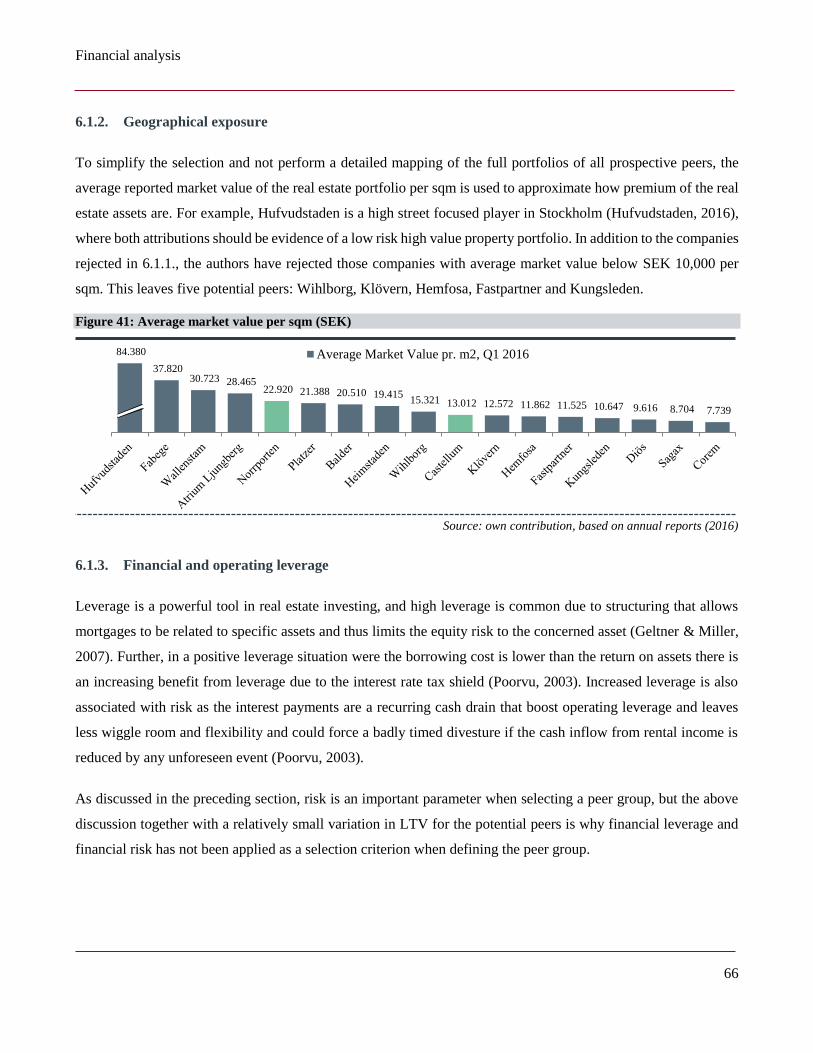
Financial analysis
66
6.1.2. Geographical exposure
To simplify the selection and not perform a detailed mapping of the full portfolios of all prospective peers, the
average reported market value of the real estate portfolio per sqm is used to approximate how premium of the real
estate assets are. For example, Hufvudstaden is a high street focused player in Stockholm (Hufvudstaden, 2016),
where both attributions should be evidence of a low risk high value property portfolio. In addition to the companies
rejected in 6.1.1., the authors have rejected those companies with average market value below SEK 10,000 per
sqm. This leaves five potential peers: Wihlborg, Klövern, Hemfosa, Fastpartner and Kungsleden.
Figure 41: Average market value per sqm (SEK)
Source: own contribution, based on annual reports (2016)
6.1.3. Financial and operating leverage
Leverage is a powerful tool in real estate investing, and high leverage is common due to structuring that allows
mortgages to be related to specific assets and thus limits the equity risk to the concerned asset (Geltner & Miller,
2007). Further, in a positive leverage situation were the borrowing cost is lower than the return on assets there is
an increasing benefit from leverage due to the interest rate tax shield (Poorvu, 2003). Increased leverage is also
associated with risk as the interest payments are a recurring cash drain that boost operating leverage and leaves
less wiggle room and flexibility and could force a badly timed divesture if the cash inflow from rental income is
reduced by any unforeseen event (Poorvu, 2003).
As discussed in the preceding section, risk is an important parameter when selecting a peer group, but the above
discussion together with a relatively small variation in LTV for the potential peers is why financial leverage and
financial risk has not been applied as a selection criterion when defining the peer group.
84.380
37.820 30.723 28.465
22.920 21.388 20.510 19.415 15.321 13.012 12.572 11.862 11.525 10.647 9.616 8.704 7.739
Average Market Value pr. m2, Q1 2016
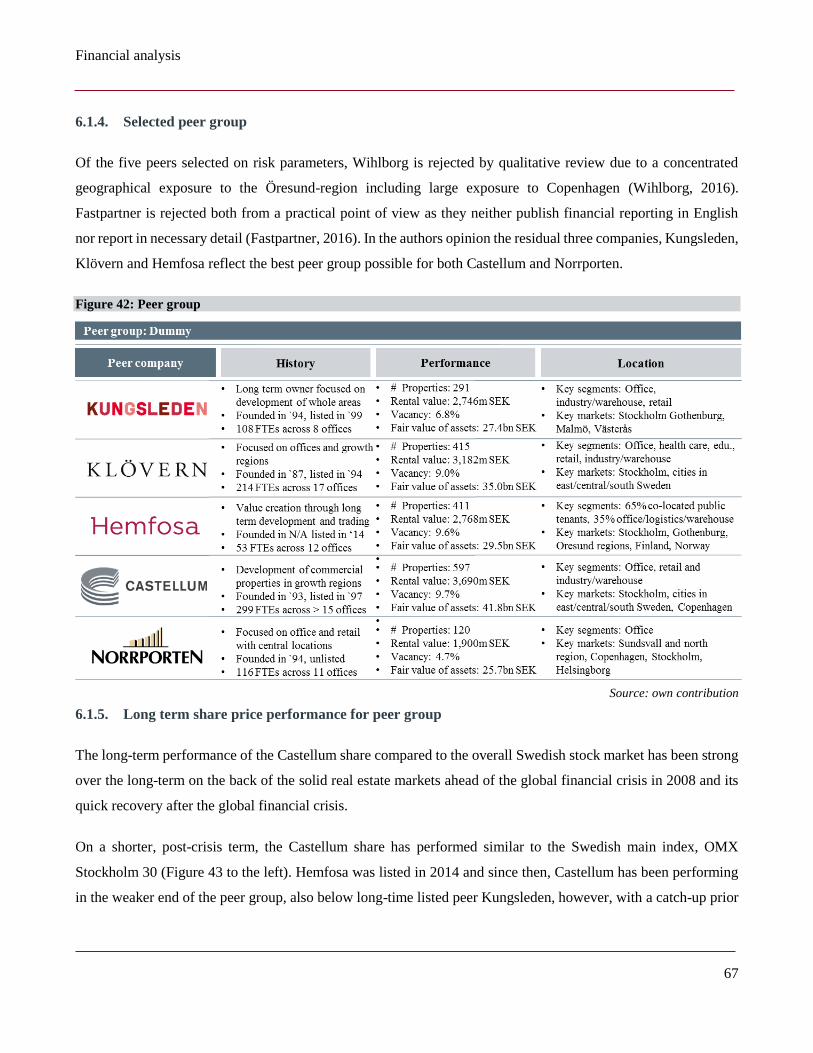
Financial analysis
67
6.1.4. Selected peer group
Of the five peers selected on risk parameters, Wihlborg is rejected by qualitative review due to a concentrated
geographical exposure to the Öresund-region including large exposure to Copenhagen (Wihlborg, 2016).
Fastpartner is rejected both from a practical point of view as they neither publish financial reporting in English
nor report in necessary detail (Fastpartner, 2016). In the authors opinion the residual three companies, Kungsleden,
Klövern and Hemfosa reflect the best peer group possible for both Castellum and Norrporten.
Figure 42: Peer group
Source: own contribution
6.1.5. Long term share price performance for peer group
The long-term performance of the Castellum share compared to the overall Swedish stock market has been strong
over the long-term on the back of the solid real estate markets ahead of the global financial crisis in 2008 and its
quick recovery after the global financial crisis.
On a shorter, post-crisis term, the Castellum share has performed similar to the Swedish main index, OMX
Stockholm 30 (Figure 43 to the left). Hemfosa was listed in 2014 and since then, Castellum has been performing
in the weaker end of the peer group, also below long-time listed peer Kungsleden, however, with a catch-up prior
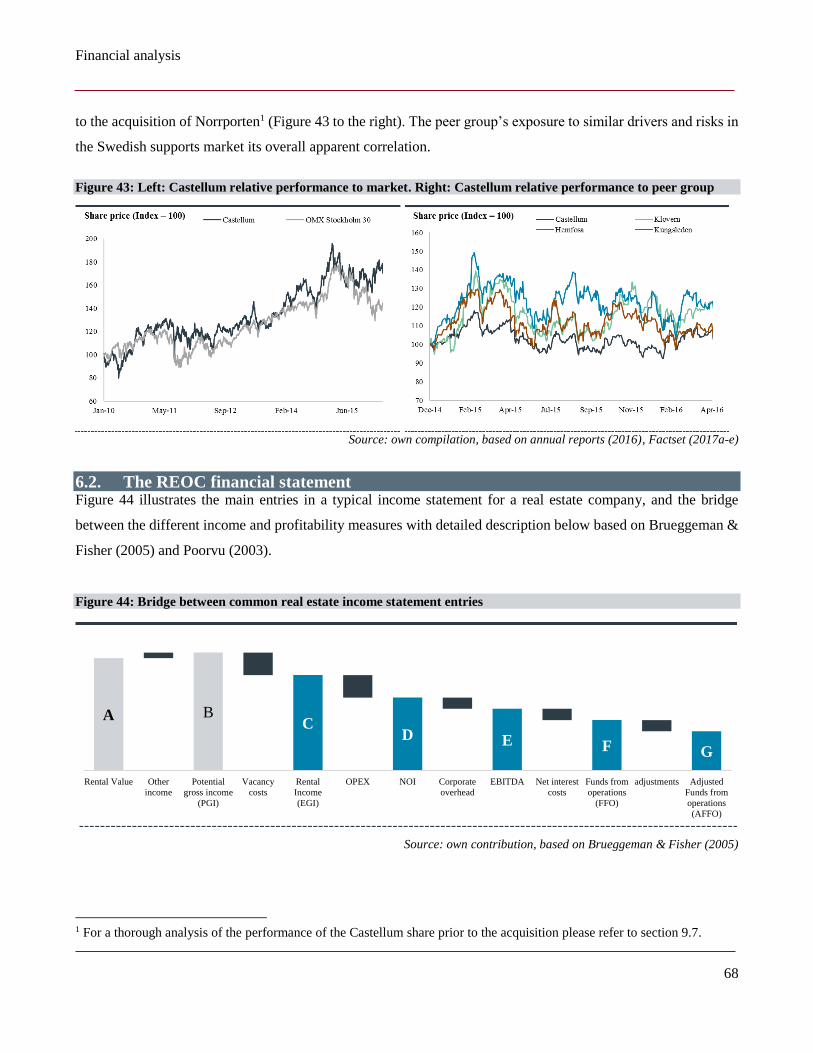
Financial analysis
68
to the acquisition of Norrporten1 (Figure 43 to the right). The peer group’s exposure to similar drivers and risks in
the Swedish supports market its overall apparent correlation.
Figure 43: Left: Castellum relative performance to market. Right: Castellum relative performance to peer group
Source: own compilation, based on annual reports (2016), Factset (2017a-e)
6.2. The REOC financial statement Figure 44 illustrates the main entries in a typical income statement for a real estate company, and the bridge
between the different income and profitability measures with detailed description below based on Brueggeman &
Fisher (2005) and Poorvu (2003).
Figure 44: Bridge between common real estate income statement entries
Source: own contribution, based on Brueggeman & Fisher (2005)
1 For a thorough analysis of the performance of the Castellum share prior to the acquisition please refer to section 9.7.
A BC
D E F G
Rental Value Other
income
Potential
gross income
(PGI)
Vacancy
costs
Rental
Income
(EGI)
OPEX NOI Corporate
overhead
EBITDA Net interest
costs
Funds from
operations
(FFO)
adjustments Adjusted
Funds from
operations
(AFFO)
Financial analysis
69
6.2.1. Revenue measures
Real estate companies distinguish between rental income and rental value. Rental value (Point A) represents the
potential rental income net of other revenues based on current market prices assuming no vacant space, but does
not enter the profit and loss statement (P&L) for Nordic REOCs. Other income represents potential additional
services that are charged on top of rent (Brueggeman & Fisher, 2005). If other income is of significant size, it
needs to be investigated carefully as it often become an important profit driver due to high margins (Poorvu, 2003).
The sum of rental value and other income represents PGI, the potential gross income (point B). Vacancy cost is
the opportunity cost from vacant space, and should be based on a measure reflecting value of vacant space (EPRA,
2016). Rental income, also referred to as EGI, is the effective gross income (Point C) and represents the top line
in the P&L for companies in the peer group.
6.2.2. Operating expenses
The difference between the rental income (Point C) and net operating income (NOI), (Point D), are the operating
expenses directly related to operating and managing properties e.g. maintaining general building condition. The
expense level varies with the size of the asset base, the number of units and locations and service level determined
in the contracts and the building conditions. Castellum`s operating expenses can be segmented into general
operating expenses, maintenance, ground rent, property tax, leasing and property management where general
operating expenses is the sum of utilities, facility management, cleaning, insurance and rent losses (Castellum,
2016). Leasing and property management costs represents administration costs directly related to properties
including for example rent collection, rent negotiation and accounting (Castellum, 2016). EBITDA (Point E) for
real estate companies is calculated by deducting central administration costs from NOI.
6.2.3. FFO and AFFO
Funds from operations (FFO) is an estimate of the cash flow available for distribution to shareholders, and is
similar to the earnings concept for industrial companies (Brueggeman & Fisher, 2005). FFO is calculated as
EBITDA adjusted for net financing costs (Geltner & Miller, 2007). Recently, more and more real estate financial
statement users have adopted adjusted funds from operations (AFFO) as a substitute for FFO, mainly to capture
the cash flow effect from recurring capital improvement expenditures (Brueggeman & Fisher, 2005). Due to data
availability, FFO is preferred to AFFO in this thesis.
Financial analysis
70
6.2.4. Tax and depreciation
There are several taxes relevant for REOCs in Sweden as covered in section 5.1.1. Corporate rental income net of
expenses is taxed with 22%, where expenses comprehend interests, maintenance, administration and operations
with a general exception for interest on intra-group financing. Capital gains tax on sale of properties is calculated
as sales price less tax value of the property and taxed with the corporate tax rate of 22%. Similarly, capital losses
are deductible against capital gains on property and can be used to net out gains intra-group (DLA Piper, 2015).
There are several minor fees and taxes levied by municipalities for residential property, and by the state for
commercial and industrial properties, as well as land regulated for residential buildings or under construction.
These taxes are in the range of 0.1%-2.8% of the tax value of the properties (DLA Piper, 2015).
Deferred tax
Deferred tax in the income statement is the change in the deferred tax assets or liabilities over the accounting year.
Deferred tax liability is a very common item in the balance sheet of a REOC and relates to the temporary
differences between book value and taxable value for investment properties, as the book value is measured at fair
value (i.e. appreciated to market value), while the taxable value is subject to depreciation. The notes of the financial
statement are further required to disclose reconciliation of the book value amounts at beginning and end of the
period.
Depreciation
As investment properties are measured at fair value there are no depreciations of the investment properties in the
financial accounts. However, initial book value for the investment properties in the balance sheet are measured
based on the purchase price for the asset or the current book value if acquired through an SPV. If the asset is
acquired through construction the construction and associated costs make out the initial book value. Depreciation
in the financial statement for real estate companies is small relative to other industries and is mainly related to
non-property fixed assets (Castellum, 2016a)
6.3. Accounting policy
Overall definitions
The following definitions and specifications are prevailing for the peer group and compared across the financial
reports. Investment properties is defined as the building and land owned for the purpose of creating value through
revenue generation or value increase and are measured at fair value. Rental income is the revenue from operating
lease agreements with the assets remaining in the company’s books, plus additions as tax, utility costs etc. that is
passed on to the tenant. Gains and losses from property sales are recognized at the date when the company take
Financial analysis
71
possession of the property, or at transfer of risk. Derivatives and investment properties is measured at fair value
with adjustments in the income statement (Castellum, 2016a; Norrporten, 2016; Hemfosa, 2016; Klövern, 2016;
Kungsleden, 2016). The fair value represents the value the investment property wisely can be exchanged for,
reflecting actual market value (IAS 40.5).
Deferred tax
Deferred tax liabilities are measured at nominal value and are accounted with the corporate tax rate of 22% without
any discounts or deductions. This typically overstate the value of the actual liabilities as efficient structuring of
property transactions would reduce effective tax rate, and also considering the time value of money and nominal
measurement when the liabilities are not expected to be paid for a foreseeable future (Castellum, 2016a). Treatment
of deferred tax in the consolidated financial statements for single asset SPVs were the owner company expect to
receive the fair value of the asset inside the SPV when the shares in the SPV are sold, have recently been discussed
by the IFRS Interpretation Committee with relation to IAS 12, section 35 and 39. The committee concluded that
both the asset and the SPV needs to be measured and recognized separately in the consolidated financial statements
if this is required by local tax law (Harzheim, 2014).
6.4. Reclassification of Financial Statements Reclassification of the peer group’s financial statements have been conducted to isolate the company’s core
operations according to the main principles of Petersen & Plenborg (2012) applied to a real estate environment
and the applied valuation methods. For a real estate company, financing is a more interwoven part of operations
as the market value of the physical assets on a real estate company`s balance sheet typically constitutes 80-120%
of the share price (Geltner & Miller, 2007) and the value of the property is not determined by the capital structure
of the owner (Kempen & Co, 2016).
For the purpose of both the valuation and the peer group analysis, the income statement should reflect the core real
estate operations, which should be a defined set of activities as equal as possible across the peer group to ensure
the performance measures are benchmarking comparable activities. In the analysis there has been limited need for
normalization except a company to company assessment of weather the joint venture activities should be defined
as a part of the core or not. The only significant adjustment required was to carve out Nordic Modular Group from
Kungsledens’ core activities. Nordic Modular Group develops, manufactures, sells and leases out moveable
buildings across the Nordics and was included in Kungsleden core financials in 2012, and later separated as income
from associated after it was considered to not be part of core and divested over two rounds in 2014 and 2015
(Kungsleden, 2016).
Financial analysis
72
As for the income statement, balance sheet adjustments have been made accordingly to adjust for potential non-
core or discontinued activities which is only found to be significant for Kungsleden. Further, several balance- and
income statement adjustments are made in conjunction with the NAV analysis and these adjustments are covered
in detail by section 8.1.2. with further company specific comments in section 8.3 and 8.4.
6.5. Profitability benchmark This section benchmarks the historical performance of Castellum and Norrporten against the defined peer group
to identify capabilities and weaknesses concluded in the SWOT together with the strategic analysis.
6.5.1. EPRA cost ratio and NOI margin
EPRA cost ratio isolates the underlying profitability of the core real estate operations, and translate this into a
relative and comparable operating profitability measure (EPRA, 2016). The EPRA cost ratio has a similar
information content as the EBITDA-margin, but the margins move in the opposite direction i.e. higher EPRA cost
ratio is associated with lower EBITDA margin. Tax and ground rent is not included in EPRA cost ratio in this
analysis due to differences stemming from geographical exposure, e.g. impact from ground rent in Stockholm
region. Property tax and ground rent is however included in NOI margin analysis to keep the NOI concept
consistent throughout the thesis as it is a key value driver for valuation later in the analysis.
𝑬𝑷𝑹𝑨 𝒄𝒐𝒔𝒕 𝒓𝒂𝒕𝒊𝒐 =𝑷𝒓𝒐𝒑𝒆𝒓𝒕𝒚 𝒆𝒙𝒑𝒆𝒏𝒔𝒆𝒔 + 𝒂𝒅𝒎𝒊𝒏𝒊𝒔𝒕𝒓𝒂𝒕𝒊𝒐𝒏 𝒆𝒙𝒑𝒆𝒏𝒔𝒆𝒔
𝑮𝒓𝒐𝒔𝒔 𝒓𝒆𝒏𝒕𝒂𝒍 𝒊𝒏𝒄𝒐𝒎𝒆
A complimentary measure to the EPRA cost ratio is the NOI margin, which measures the operational profits on
core rental operations. A relatively high NOI margin and EPRA cost ratio could indicate an inefficient or large
corporate overhead compared to peers. Castellum has a long term stable NOI margin but slightly weaker than
Hemfosa and Norrporten, considering the last three years. Hemfosa is a fast growing company and its improving
NOI margin could stem from learning curve, scale and other effects associated to growth that is hard to assess in
an outside-in analysis. Kungsleden has the lowest NOI margin in the peer group, and this can be some bias from
discontinued activities. However, the 2014 and 2015 NOI margin for its core real estate activities is likely a highly
accurate estimate of core real estate activities. The larger variation for EPRA-cost ratio indicates that there is larger
variation in corporate overhead across the group, where Castellum stands out as the best practice example for back
office utilization.
Kungsleden was excluded from the EPRA cost ratio analysis due to limitation from isolating property tax from
core property operations due to Nordic Modular Group and also due to limited information and divesture of a
former real estate company called Hemsö AB sold to AP3 in 2012 (Kungsleden, 2013).
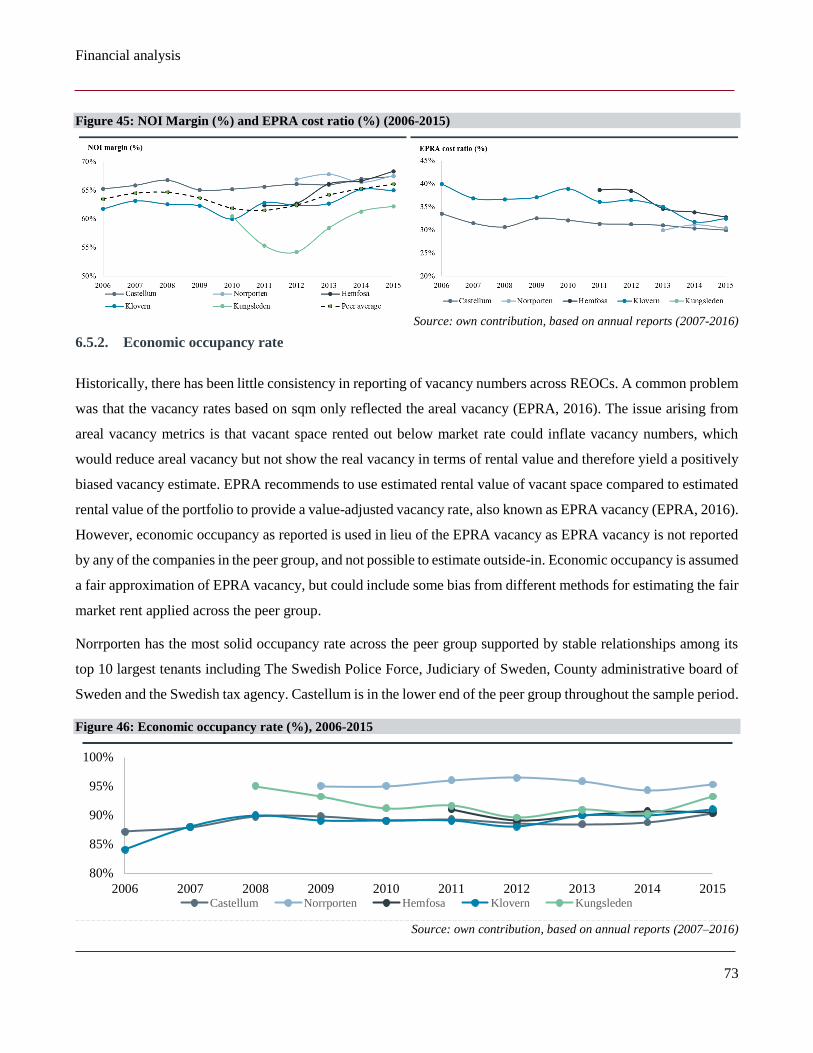
Financial analysis
73
Figure 45: NOI Margin (%) and EPRA cost ratio (%) (2006-2015)
Source: own contribution, based on annual reports (2007-2016)
6.5.2. Economic occupancy rate
Historically, there has been little consistency in reporting of vacancy numbers across REOCs. A common problem
was that the vacancy rates based on sqm only reflected the areal vacancy (EPRA, 2016). The issue arising from
areal vacancy metrics is that vacant space rented out below market rate could inflate vacancy numbers, which
would reduce areal vacancy but not show the real vacancy in terms of rental value and therefore yield a positively
biased vacancy estimate. EPRA recommends to use estimated rental value of vacant space compared to estimated
rental value of the portfolio to provide a value-adjusted vacancy rate, also known as EPRA vacancy (EPRA, 2016).
However, economic occupancy as reported is used in lieu of the EPRA vacancy as EPRA vacancy is not reported
by any of the companies in the peer group, and not possible to estimate outside-in. Economic occupancy is assumed
a fair approximation of EPRA vacancy, but could include some bias from different methods for estimating the fair
market rent applied across the peer group.
Norrporten has the most solid occupancy rate across the peer group supported by stable relationships among its
top 10 largest tenants including The Swedish Police Force, Judiciary of Sweden, County administrative board of
Sweden and the Swedish tax agency. Castellum is in the lower end of the peer group throughout the sample period.
Figure 46: Economic occupancy rate (%), 2006-2015
Source: own contribution, based on annual reports (2007–2016)
80%
85%
90%
95%
100%
2006 2007 2008 2009 2010 2011 2012 2013 2014 2015Castellum Norrporten Hemfosa Klovern Kungsleden
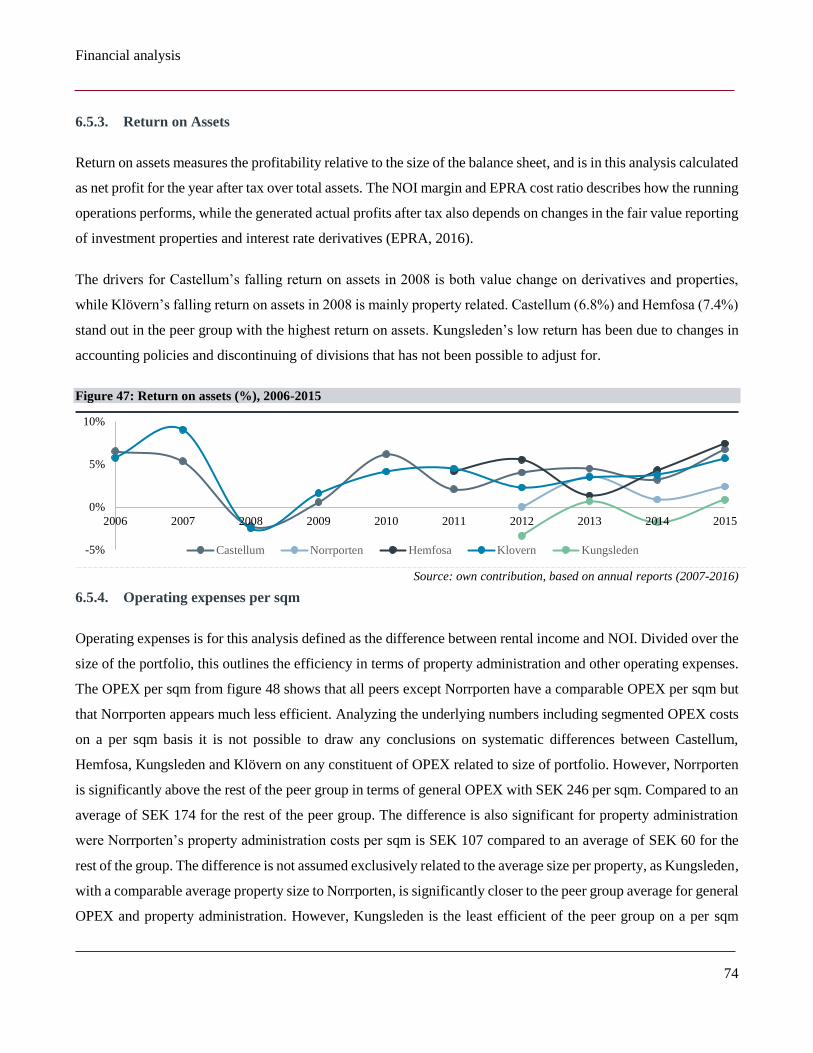
Financial analysis
74
6.5.3. Return on Assets
Return on assets measures the profitability relative to the size of the balance sheet, and is in this analysis calculated
as net profit for the year after tax over total assets. The NOI margin and EPRA cost ratio describes how the running
operations performs, while the generated actual profits after tax also depends on changes in the fair value reporting
of investment properties and interest rate derivatives (EPRA, 2016).
The drivers for Castellum’s falling return on assets in 2008 is both value change on derivatives and properties,
while Klövern’s falling return on assets in 2008 is mainly property related. Castellum (6.8%) and Hemfosa (7.4%)
stand out in the peer group with the highest return on assets. Kungsleden’s low return has been due to changes in
accounting policies and discontinuing of divisions that has not been possible to adjust for.
Figure 47: Return on assets (%), 2006-2015
Source: own contribution, based on annual reports (2007-2016)
6.5.4. Operating expenses per sqm
Operating expenses is for this analysis defined as the difference between rental income and NOI. Divided over the
size of the portfolio, this outlines the efficiency in terms of property administration and other operating expenses.
The OPEX per sqm from figure 48 shows that all peers except Norrporten have a comparable OPEX per sqm but
that Norrporten appears much less efficient. Analyzing the underlying numbers including segmented OPEX costs
on a per sqm basis it is not possible to draw any conclusions on systematic differences between Castellum,
Hemfosa, Kungsleden and Klövern on any constituent of OPEX related to size of portfolio. However, Norrporten
is significantly above the rest of the peer group in terms of general OPEX with SEK 246 per sqm. Compared to an
average of SEK 174 for the rest of the peer group. The difference is also significant for property administration
were Norrporten’s property administration costs per sqm is SEK 107 compared to an average of SEK 60 for the
rest of the group. The difference is not assumed exclusively related to the average size per property, as Kungsleden,
with a comparable average property size to Norrporten, is significantly closer to the peer group average for general
OPEX and property administration. However, Kungsleden is the least efficient of the peer group on a per sqm
-5%
0%
5%
10%
2006 2007 2008 2009 2010 2011 2012 2013 2014 2015
Castellum Norrporten Hemfosa Klovern Kungsleden
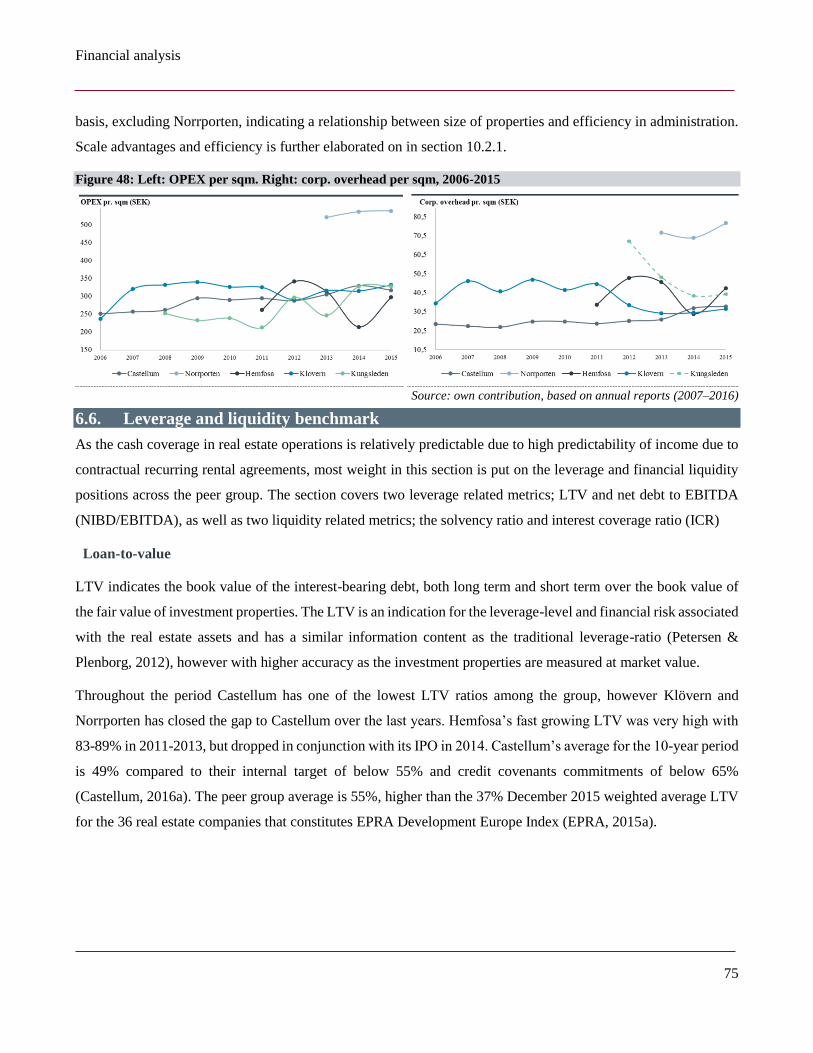
Financial analysis
75
basis, excluding Norrporten, indicating a relationship between size of properties and efficiency in administration.
Scale advantages and efficiency is further elaborated on in section 10.2.1.
Figure 48: Left: OPEX per sqm. Right: corp. overhead per sqm, 2006-2015
Source: own contribution, based on annual reports (2007–2016)
6.6. Leverage and liquidity benchmark
As the cash coverage in real estate operations is relatively predictable due to high predictability of income due to
contractual recurring rental agreements, most weight in this section is put on the leverage and financial liquidity
positions across the peer group. The section covers two leverage related metrics; LTV and net debt to EBITDA
(NIBD/EBITDA), as well as two liquidity related metrics; the solvency ratio and interest coverage ratio (ICR)
Loan-to-value
LTV indicates the book value of the interest-bearing debt, both long term and short term over the book value of
the fair value of investment properties. The LTV is an indication for the leverage-level and financial risk associated
with the real estate assets and has a similar information content as the traditional leverage-ratio (Petersen &
Plenborg, 2012), however with higher accuracy as the investment properties are measured at market value.
Throughout the period Castellum has one of the lowest LTV ratios among the group, however Klövern and
Norrporten has closed the gap to Castellum over the last years. Hemfosa’s fast growing LTV was very high with
83-89% in 2011-2013, but dropped in conjunction with its IPO in 2014. Castellum’s average for the 10-year period
is 49% compared to their internal target of below 55% and credit covenants commitments of below 65%
(Castellum, 2016a). The peer group average is 55%, higher than the 37% December 2015 weighted average LTV
for the 36 real estate companies that constitutes EPRA Development Europe Index (EPRA, 2015a).
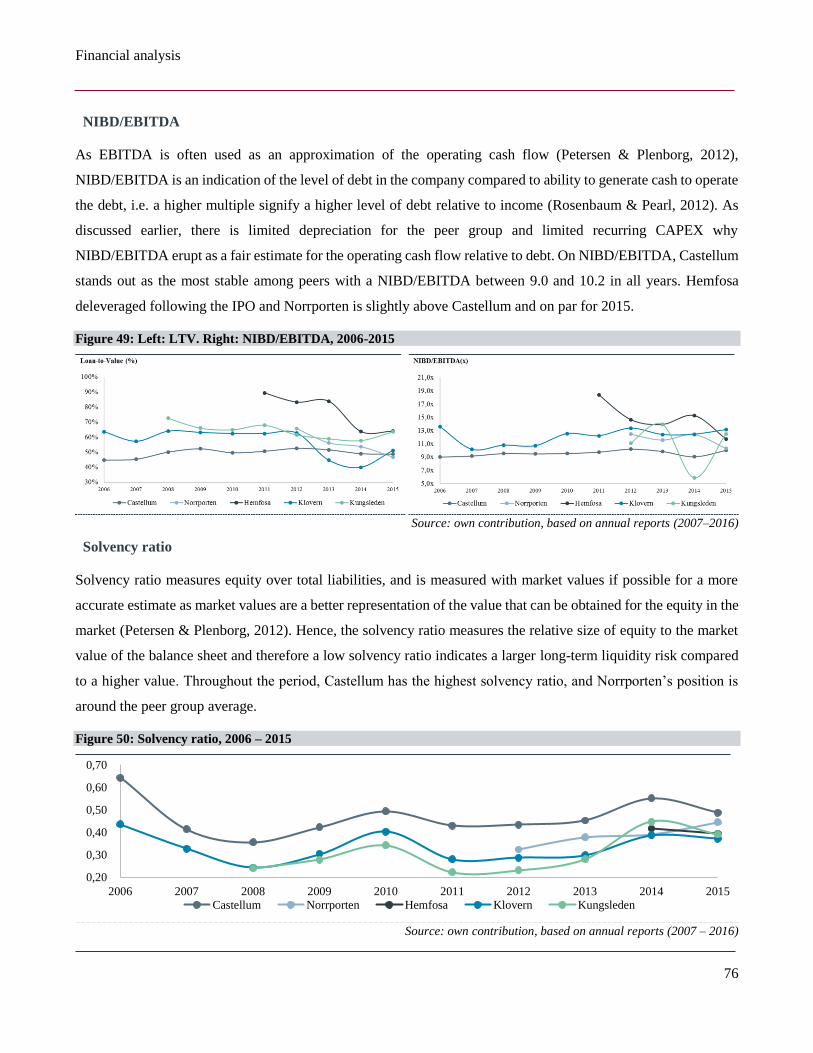
Financial analysis
76
NIBD/EBITDA
As EBITDA is often used as an approximation of the operating cash flow (Petersen & Plenborg, 2012),
NIBD/EBITDA is an indication of the level of debt in the company compared to ability to generate cash to operate
the debt, i.e. a higher multiple signify a higher level of debt relative to income (Rosenbaum & Pearl, 2012). As
discussed earlier, there is limited depreciation for the peer group and limited recurring CAPEX why
NIBD/EBITDA erupt as a fair estimate for the operating cash flow relative to debt. On NIBD/EBITDA, Castellum
stands out as the most stable among peers with a NIBD/EBITDA between 9.0 and 10.2 in all years. Hemfosa
deleveraged following the IPO and Norrporten is slightly above Castellum and on par for 2015.
Figure 49: Left: LTV. Right: NIBD/EBITDA, 2006-2015
Source: own contribution, based on annual reports (2007–2016)
Solvency ratio
Solvency ratio measures equity over total liabilities, and is measured with market values if possible for a more
accurate estimate as market values are a better representation of the value that can be obtained for the equity in the
market (Petersen & Plenborg, 2012). Hence, the solvency ratio measures the relative size of equity to the market
value of the balance sheet and therefore a low solvency ratio indicates a larger long-term liquidity risk compared
to a higher value. Throughout the period, Castellum has the highest solvency ratio, and Norrporten’s position is
around the peer group average.
Figure 50: Solvency ratio, 2006 – 2015
Source: own contribution, based on annual reports (2007 – 2016)
0,20
0,30
0,40
0,50
0,60
0,70
2006 2007 2008 2009 2010 2011 2012 2013 2014 2015Castellum Norrporten Hemfosa Klovern Kungsleden
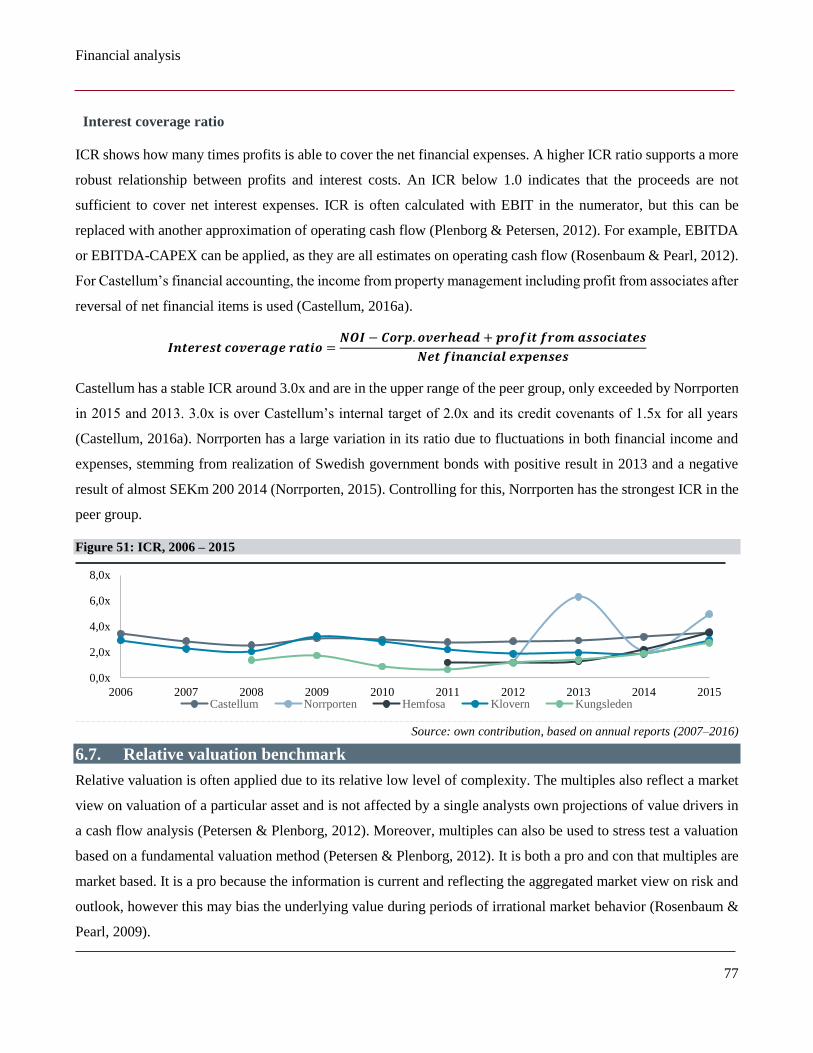
Financial analysis
77
Interest coverage ratio
ICR shows how many times profits is able to cover the net financial expenses. A higher ICR ratio supports a more
robust relationship between profits and interest costs. An ICR below 1.0 indicates that the proceeds are not
sufficient to cover net interest expenses. ICR is often calculated with EBIT in the numerator, but this can be
replaced with another approximation of operating cash flow (Plenborg & Petersen, 2012). For example, EBITDA
or EBITDA-CAPEX can be applied, as they are all estimates on operating cash flow (Rosenbaum & Pearl, 2012).
For Castellum’s financial accounting, the income from property management including profit from associates after
reversal of net financial items is used (Castellum, 2016a).
𝑰𝒏𝒕𝒆𝒓𝒆𝒔𝒕 𝒄𝒐𝒗𝒆𝒓𝒂𝒈𝒆 𝒓𝒂𝒕𝒊𝒐 =𝑵𝑶𝑰 − 𝑪𝒐𝒓𝒑. 𝒐𝒗𝒆𝒓𝒉𝒆𝒂𝒅 + 𝒑𝒓𝒐𝒇𝒊𝒕 𝒇𝒓𝒐𝒎 𝒂𝒔𝒔𝒐𝒄𝒊𝒂𝒕𝒆𝒔
𝑵𝒆𝒕 𝒇𝒊𝒏𝒂𝒏𝒄𝒊𝒂𝒍 𝒆𝒙𝒑𝒆𝒏𝒔𝒆𝒔
Castellum has a stable ICR around 3.0x and are in the upper range of the peer group, only exceeded by Norrporten
in 2015 and 2013. 3.0x is over Castellum’s internal target of 2.0x and its credit covenants of 1.5x for all years
(Castellum, 2016a). Norrporten has a large variation in its ratio due to fluctuations in both financial income and
expenses, stemming from realization of Swedish government bonds with positive result in 2013 and a negative
result of almost SEKm 200 2014 (Norrporten, 2015). Controlling for this, Norrporten has the strongest ICR in the
peer group.
Figure 51: ICR, 2006 – 2015
Source: own contribution, based on annual reports (2007–2016)
6.7. Relative valuation benchmark
Relative valuation is often applied due to its relative low level of complexity. The multiples also reflect a market
view on valuation of a particular asset and is not affected by a single analysts own projections of value drivers in
a cash flow analysis (Petersen & Plenborg, 2012). Moreover, multiples can also be used to stress test a valuation
based on a fundamental valuation method (Petersen & Plenborg, 2012). It is both a pro and con that multiples are
market based. It is a pro because the information is current and reflecting the aggregated market view on risk and
outlook, however this may bias the underlying value during periods of irrational market behavior (Rosenbaum &
Pearl, 2009).
0,0x
2,0x
4,0x
6,0x
8,0x
2006 2007 2008 2009 2010 2011 2012 2013 2014 2015Castellum Norrporten Hemfosa Klovern Kungsleden
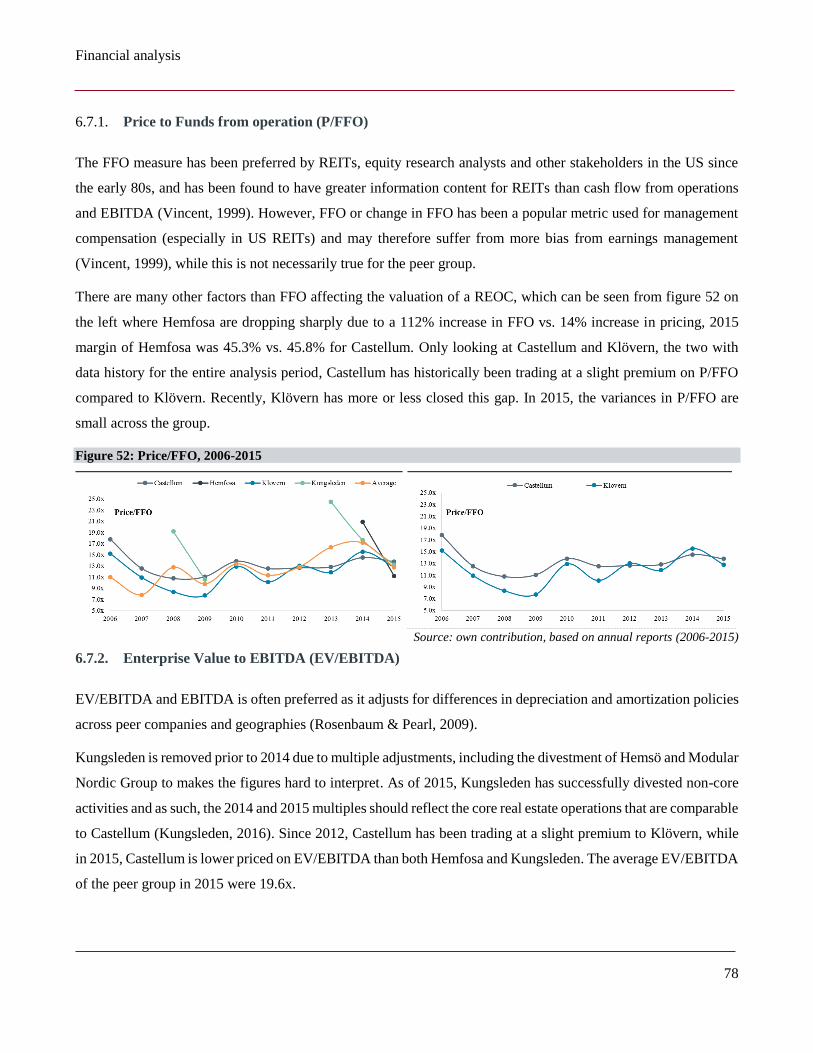
Financial analysis
78
6.7.1. Price to Funds from operation (P/FFO)
The FFO measure has been preferred by REITs, equity research analysts and other stakeholders in the US since
the early 80s, and has been found to have greater information content for REITs than cash flow from operations
and EBITDA (Vincent, 1999). However, FFO or change in FFO has been a popular metric used for management
compensation (especially in US REITs) and may therefore suffer from more bias from earnings management
(Vincent, 1999), while this is not necessarily true for the peer group.
There are many other factors than FFO affecting the valuation of a REOC, which can be seen from figure 52 on
the left where Hemfosa are dropping sharply due to a 112% increase in FFO vs. 14% increase in pricing, 2015
margin of Hemfosa was 45.3% vs. 45.8% for Castellum. Only looking at Castellum and Klövern, the two with
data history for the entire analysis period, Castellum has historically been trading at a slight premium on P/FFO
compared to Klövern. Recently, Klövern has more or less closed this gap. In 2015, the variances in P/FFO are
small across the group.
Figure 52: Price/FFO, 2006-2015
Source: own contribution, based on annual reports (2006-2015)
6.7.2. Enterprise Value to EBITDA (EV/EBITDA)
EV/EBITDA and EBITDA is often preferred as it adjusts for differences in depreciation and amortization policies
across peer companies and geographies (Rosenbaum & Pearl, 2009).
Kungsleden is removed prior to 2014 due to multiple adjustments, including the divestment of Hemsö and Modular
Nordic Group to makes the figures hard to interpret. As of 2015, Kungsleden has successfully divested non-core
activities and as such, the 2014 and 2015 multiples should reflect the core real estate operations that are comparable
to Castellum (Kungsleden, 2016). Since 2012, Castellum has been trading at a slight premium to Klövern, while
in 2015, Castellum is lower priced on EV/EBITDA than both Hemfosa and Kungsleden. The average EV/EBITDA
of the peer group in 2015 were 19.6x.
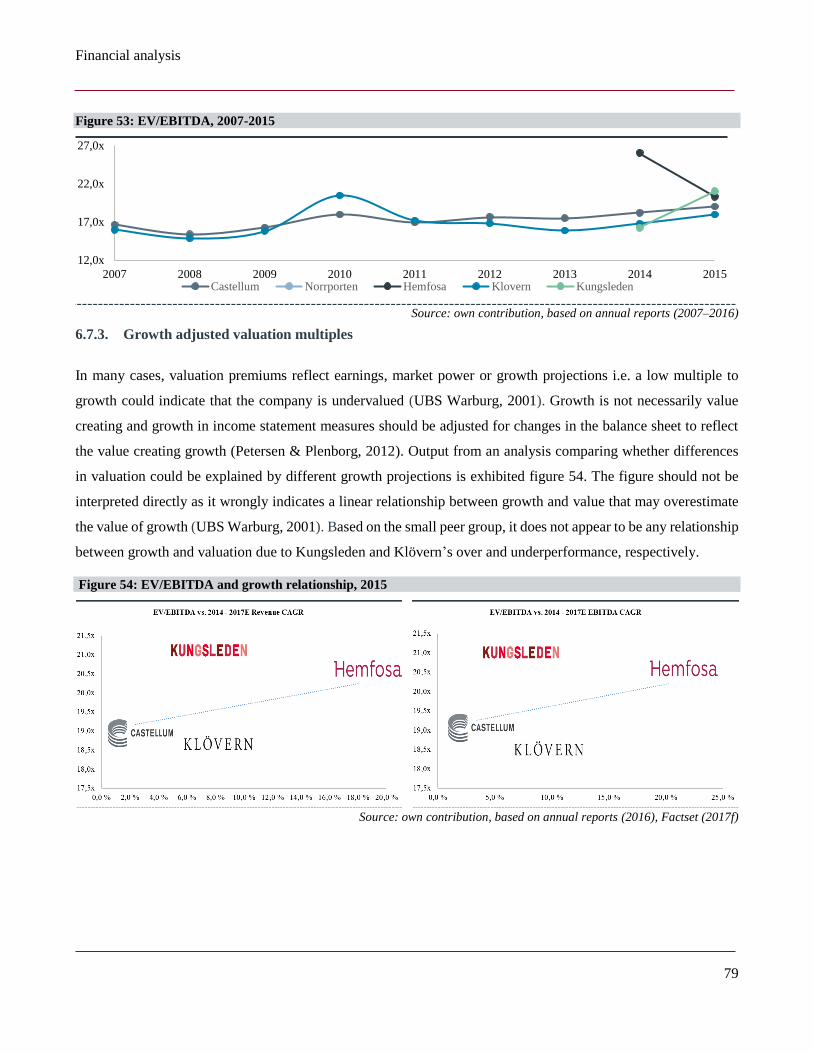
Financial analysis
79
Figure 53: EV/EBITDA, 2007-2015
Source: own contribution, based on annual reports (2007–2016)
6.7.3. Growth adjusted valuation multiples
In many cases, valuation premiums reflect earnings, market power or growth projections i.e. a low multiple to
growth could indicate that the company is undervalued (UBS Warburg, 2001). Growth is not necessarily value
creating and growth in income statement measures should be adjusted for changes in the balance sheet to reflect
the value creating growth (Petersen & Plenborg, 2012). Output from an analysis comparing whether differences
in valuation could be explained by different growth projections is exhibited figure 54. The figure should not be
interpreted directly as it wrongly indicates a linear relationship between growth and value that may overestimate
the value of growth (UBS Warburg, 2001). Based on the small peer group, it does not appear to be any relationship
between growth and valuation due to Kungsleden and Klövern’s over and underperformance, respectively.
Figure 54: EV/EBITDA and growth relationship, 2015
Source: own contribution, based on annual reports (2016), Factset (2017f)
12,0x
17,0x
22,0x
27,0x
2007 2008 2009 2010 2011 2012 2013 2014 2015Castellum Norrporten Hemfosa Klovern Kungsleden
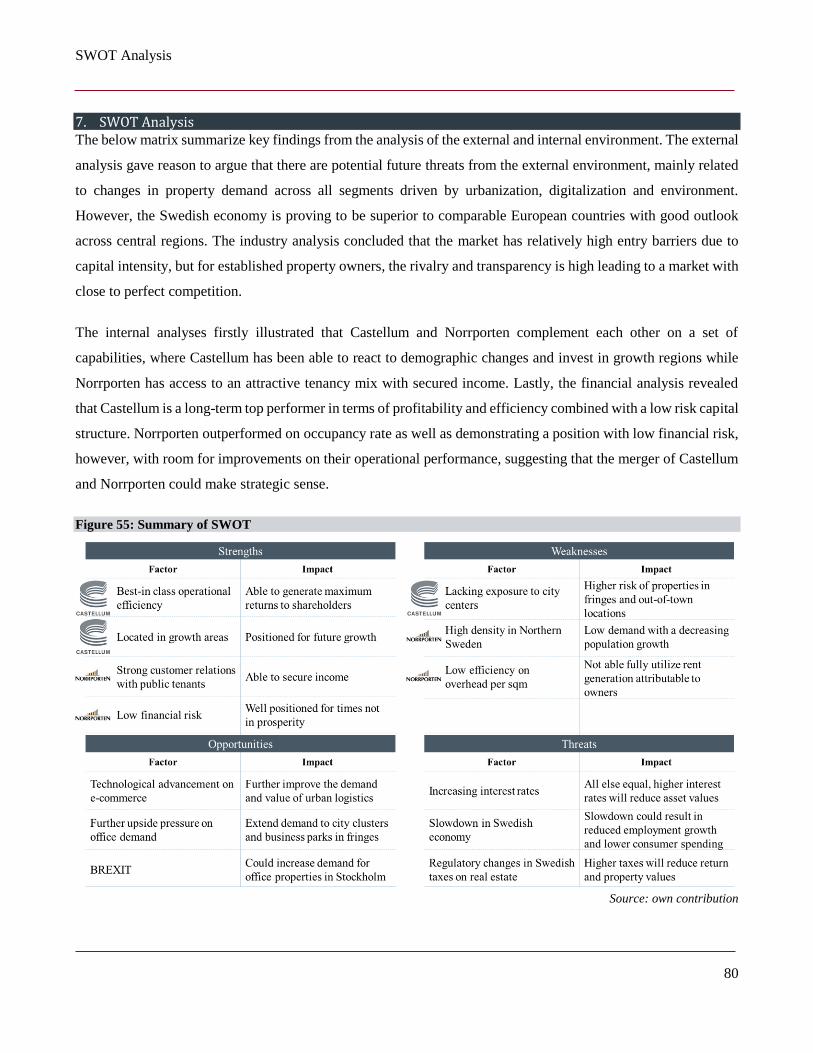
SWOT Analysis
80
7. SWOT Analysis The below matrix summarize key findings from the analysis of the external and internal environment. The external
analysis gave reason to argue that there are potential future threats from the external environment, mainly related
to changes in property demand across all segments driven by urbanization, digitalization and environment.
However, the Swedish economy is proving to be superior to comparable European countries with good outlook
across central regions. The industry analysis concluded that the market has relatively high entry barriers due to
capital intensity, but for established property owners, the rivalry and transparency is high leading to a market with
close to perfect competition.
The internal analyses firstly illustrated that Castellum and Norrporten complement each other on a set of
capabilities, where Castellum has been able to react to demographic changes and invest in growth regions while
Norrporten has access to an attractive tenancy mix with secured income. Lastly, the financial analysis revealed
that Castellum is a long-term top performer in terms of profitability and efficiency combined with a low risk capital
structure. Norrporten outperformed on occupancy rate as well as demonstrating a position with low financial risk,
however, with room for improvements on their operational performance, suggesting that the merger of Castellum
and Norrporten could make strategic sense.
Figure 55: Summary of SWOT
Source: own contribution
Valuation
81
8. Valuation
8.1. Choice of valuation methods Petersen & Plenborg (2012) characterize an ideal valuation approach by the four ingredients; precision (unbiased
estimates), realistic assumptions, user friendliness and understandable output, which is also the overarching
methodology used when considering different valuation methods for this analysis. The full historical analytical
statements and valuation assumption summaries is provided in appendix (A3; A4; A7)
8.1.1. The NAV debate
The valuation of a listed REOC features a unique situation with dual asset markets and hereunder valuation of
parallel asset markets as listed REOCs have exposure to both the underlying private property market and the public
stock market (Geltner & Miller, 2007). Dual asset markets raise several questions, including which market to use
for valuation purposes and which market that is correct if there is deviation in pricing. The private market for real
estate is independent from the public equities market for real estate companies, hence arbitrage opportunities may
occur if the two markets prices the same real estate assets differently at the same point in time e.g. to take private
real estate portfolios to the public market (Geltner & Miller, 2007). Given the parallelism of the two asset markets,
the authors believe it is key to isolate the underlying asset value with a NAV model as the starting point for the
valuation. The NAV method places a value on how the underlying private market would have valued the listed
portfolio of assets net of liabilities, and therefore the approach makes sense to use for both Castellum and
Norrporten to streamline the valuation methods used for both companies.
A discounted cash flow (DCF) analysis was considered by the authors for this valuation but was rejected after
preliminary testing for the benefit of a NAV model due to the DCF models extremely high sensitivity to the
terminal value estimates and most of the value being captured by the terminal period. This is due to the current
ultra-low interest rate environment and its effect on the mechanics of the weighted average cost of capital (WACC)
combined with the perpetuity nature of cash flow from real estate assuming a constant real estate portfolio. The
DCF models behavior was found to conflict with Petersen & Plenborg`s (2012) characteristics of an ideal valuation
model, especially due to unrealistic assumptions and low degree of preciseness as the model was highly sensitive
to value drives surrounded by high degree of uncertainty and subjectivity. Furthermore, the model selection was
also supported in an interview with Stefan Albinsson, fund manager for real estate fund Niam VI (Appendix 10).
As with all valuation methods there are both advantages and drawbacks with NAV. The pro-NAV camp,
represented by Green Street Advisors, set forth that listed real estate for all practical purposes is a collection of
liquid and commoditized buildings, whose underlying going market rates is observed in a large and efficient
Valuation
82
private real estate market (Geltner & Miller, 2007). The authors support the Green Street Advisors view on the
NAV approach as the NAV model for this analysis can be based on widely available and granular cap rates.
Moreover, the model will require limited projections into the future.
Drawbacks with the NAV approach includes that the NAV value is highly dependent on the cap rate used on NOI,
especially for highly levered companies (Vinocour, 2003), and that the cap rate to some extent can be subjective
(Geltner & Miller, 2007). The pro cash flow camp in listed real estate also argues that the NAV approach fails to
capture the value of the management team and their ability to create value going forward by buying and selling
properties as the NAV is a static metric (Geltner & Miller, 2007).
The NAV-based pricing model
Potential bias from an inaccurate cap rate is mitigated by extensive bottom-up estimation of cap rates for each
segment and geography based on more than 9,000 observations, further discussed in section 8.2. To address the
issue raised by pro cash flow camp as a static metric, the NAV model will be the base of the valuation and
adjustments will be made according to how much value that will be destroyed or created by the company’s strategy
going forward (Vinocour, 2003). In most cases NAV capture 80-120% of the equity value of REITs (Geltner &
Miller, 2007), and therefore represents a highly relevant starting point for the valuation. On industry level, NAV
gravitates to a parity with price on the long term (Vinocour, 2003), but pricing can differ over longer periods of
time with the REIT often reflecting future development of the private property market (Geltner et. al., 2007). In
periods where pricing differ from NAV, a bridge from the fair market value of the underlying real estate to the fair
value of the equity is necessary.
Both companies’ portfolios excluding synergies will be valued with a NAV model followed by a discussion on
potential premium to NAV in section 8.5. To validate the NAV valuation and premiums, relative valuation
methods will also be applied, with multiples selected based on Geltner & Miller (2007) as well as common practice
among Nordic real estate equity analysts, including Price/FFO and EV/EBITDA.
8.1.2. Reported financial statements translation to NAV
Some adjustments are required for both companies to ensure that the NAV estimate is as accurate as possible, with
details on adjustments and estimates in section 8.3 and 8.4 for both companies. The NOI is broken down as much
as possible from the financial statements and valued with the cap rate estimates discussed in section 8.2. This
implies that NOI is segmented on property type and geographic regions. Furthermore, the NAV calculation is
based on a 12-month forward NOI (Green Street Advisors, 2014) that needs to be estimated for both companies.
Valuation
83
As some property expenses are not allocated to segments and regions in the companies’ financials, these enters
the NAV calculation as negative NOI and are capitalized with a weighted average cap rate.
As the real estate assets are valued based on NOI and cap rates in a NAV model, the corresponding balance sheet
value of investment properties is excluded to not double count the value i.e. investment properties are represented
by the NOI capitalization (BIWS, n.d.). Both companies have development projects and undeveloped land
included under investment properties that is separated out as it is not valued on NOI basis. Some of the projects
do generate income, but the annual reports do not include enough information to separate the income generating
projects from the non-income generating projects. Other balance sheet items in general are assumed to be 100%
of carrying value.
If possible, NAV is calculated using market value of liabilities. As this is not available, book values are used as an
approximation. An assumption for the calculation of NAV is that the portfolio is valued as is, i.e. no acquisitions
or divesture of investment properties is expected. This implies that the deferred tax liabilities will never be realized
and is to be viewed as part of shareholder’s equity. When deferred tax liabilities are assumed to be part of equity,
it should be added back in the calculation to increase the NAV accordingly. This is also according to Stewart
(1991) as discussed in Plenborg & Petersen (2012) and furthermore aligned with Castellum’s own EPRA NAV
calculations (2015), and EPRA’s guidelines (EPRA, 2016). Derivative liabilities are for the same reasons reversed,
as it will not lead to any payments (Castellum, 2015), this is also according to guidelines in (EPRA, 2016). The
NAV valuation performed in section 8.3. and 8.4. is therefore aligned with the EPRA NAV metric, measuring the
fair value of a company on a long-term basis, in contrast to the EPRA NNNAV which deducts deferred taxes and
measures the spot price of the company’s net assets (EPRA, 2015).
8.2. Cost of capital – The NOI capitalization rate As introduced in the preceding section, NAV valuation is calculated using a cap rate of the NOI generated from
investment properties. With the convention that the pricing, and hence NAV model, is based on first-year yield on
the initial investment, cap rates prevails as one of the critical assumptions in the analysis (Green Street Advisors,
2014). An in-depth understanding of both micro location, macro environment, the specific properties state of
repair, and general desirability of the real estate coupled with a good handle on surrounding cap rates is essential
for determining precise estimates of cap rates (Green Street Advisors, 2014). The proceeding analysis will aim to
align the cap rates of the portfolios owned by Castellum and Norrporten through combining market-conformal
rates with the strategic analysis performed, with emphasis on macro environment, micro location and property
condition. The cap rates are handled on a market-by-market basis, as they fluctuate widely across geographical
markets and segments.
Valuation
84
Geography and location
The conclusion on socio-cultural impact on the external environment in 5.1.3. said that being present in attractive
growth countries does not necessarily provide certainties for achieving return. The conclusions set forth that
society has become increasingly mobile and agile towards moving for work and networks, meaning that real estate
owners are seeking exposure to the cities that can offer both demographic growth and a stable economy.
When considering the investment property portfolios on the larger geographical areas, the exposure of Castellum
is higher in Central and Southern Sweden with significant holdings in all of the three largest cities in Sweden, as
well as Copenhagen. Norrporten have the highest density of their portfolio in Northern Sweden, the only of the
larger geographical areas of Sweden found to have negative population growth (figure 23). Additionally, the
largest single exposure Norrporten holds is to the city of Sundsvall, which is the least growing city of all
representative cities in both portfolios (figure 37). However, Norrporten also hold exposure to growth cities
including both Stockholm and Copenhagen.
When considering micro locations, Norrporten have a higher density in central locations, being CBD (Norrporten,
2016). Castellum holds a more dispersed micro exposure on portfolio level. Their industrial/warehouse portfolio
is mainly located in clusters close to transportation hubs outside cities, with good infrastructure (Castellum,
2016a). The industrial/warehouse portfolio held by Castellum is located in growth regions and close to larger cities
offering attractive opportunities in line with the trends in e-commerce and urban logistics as outlined in the
conclusion on technological advancement and its impact on logistics in section 5.1.4. The office and retail portfolio
has some exposure to CBD, but is primarily located in city fringes in prevailing office clusters and business parks
(Castellum, 2016a). Overall, Castellum evidently has a more attractive macro level exposure while Norrporten
holds more attractive micro level exposure.
Property specific factors: age and condition
The illustration of a property’s life-cycle and the value proposition for property owners as presented in section 3.2.
gave the initial representation of how investments in existing properties are needed to align the leasable area to
customer demand. In addition, the conclusions from the socio-cultural factors together with technological
advancements in section 5.1.3. and 5.1.4. gave reason to argue that these investments are needed more frequently
as society changes at a faster pace.
On portfolio level, both Castellum and Norrporten have property values far exceeding their aggregated debt
position, resulting in that both are able to recycle capital and invest in existing property portfolios to align them
with demand (in relation to figure 4 to the right on the value destruction proposition). Figure 2 illustrated the
Valuation
85
primary strategies for investing in real estate. The general attribution for property owners will be to interest core
investors with the lowest risk and return profile, who are also those with the general lowest return requirements
(Oaktree, 2016). This requires properties to be in a condition where they are attractive for current and future
demand by tenants which will therefore attract possible investors in buying the property.
Both Castellum and Norrporten have similar profiles, based on a review of their property portfolios, including
size, usage, acquisition year as well as building- and reconstruction year. Building year ranges from the early 19th
century to newly constructed properties, but the general impression is that they are investing in outdated space.
This is also supported with the high occupancy rates (figure 28) suggesting that they have properties that attract
tenants. Additionally, both portfolios have a sustainable profile, indicating that they invest in new installations to
align with technical standards. The conclusion alone on quality and condition suggest that the properties should
be attractive in the transaction market, which is applicable for both companies.
Prevailing market rents to portfolio rent levels
Comparing contractual rents from a property to the market rents will help answer two important questions. Cap
rates capitalize on rental income generated from the property and should be within comfortable range of the market
rent. If rent levels are above the prevailing market rents for similar properties, it illustrates a skewed picture for
investors, who will take into consideration that the rent level is not achievable upon re-letting. Furthermore,
Castellum and Norrporten’s respective portfolios are homogenous with respect to type and micro location.
Therefore, assuming that the “Law of Large Numbers” applies, aggregating their portfolios in regions will ensure
to align the perceived quality and demand with actual market perception with respect to rent, as it is assumed that
the average rental levels in their respective areas and types of property should be close to the market average.
Rent levels prevailing in the geographic areas and specific to property types has been obtained from a set of real
estate broker reports. Most of the larger brokerages in Sweden report for the largest cities, however, NAI Svefa
(2012a – 2016) report semi-annually reports for most representative cities for investors as they have local branches
present in most areas. Appendix 11 show the historical rent levels in the relevant cities, segmented on location and
perceived asset quality. For the larger cities, additional broker reports (JLL, 2016; Newsec, 2016) have been used
to sense check the rent levels as provided by NAI Svefa. The comparison of the market rent to average rent levels
in the portfolios supports that both Norrporten and Castellum holds mid- to high quality properties within their
respective property segments, however that Norrporten are generally located in CBD, achieving somewhat higher
rents.
Valuation
86
Vacancy levels of portfolios compared to market vacancy
As with benchmarking of prevailing market rents to rent levels in their portfolios, vacancy levels in the market
compared to vacancy in a property portfolio is an important measurement when aligning cap rates. Cap rates are
denoted on the rental income generated at the specific point in time of a transaction. If a property owner had 50%
vacancy in a property, he would in best case have a 50% upside in rental generation on re-letting the space, which
the owner would also need to be compensated for in a transaction of the property. If applying the same cap rate on
a property with 50% vacancy compared to one with 100% occupancy, you would simply hand off the potential
value of increased rent without being compensated for the 50% potential additional rent in the future. The market
has a nominal vacancy rate which denotes vacant spaced compared to total leasable space in the specified region.
Additionally, there is structural vacancy, which is unique for each market, and represent the required amount of
vacancy a market must have due to e.g. tenancy relocation or new ventures expanding to the specific area (Mueller,
2006). Furthermore, the term structural vacancy includes vacant space that does not meet required standards for
the current market, and can be considered obsolete space if not refurbished or reconstructed (Mueller, 2006).
The data on vacancy levels in different geographies is not as transparent as rental levels, but a set of larger
brokerages perform vacancy studies but only in a few of the larger cities. The recent JLL (2016d) report stated a
total vacancy level in Stockholm of 7.1% with 3-4% in the inner city area, while the adjacent suburbs had a
somewhat higher vacancy between 6.3% and 7.2%. One of the key factors increasing overall vacancy in greater
Stockholm is the vacancy level in, Kista, a northern suburb, with 15.7%. However, neither Castellum nor
Norrporten has exposure in this area. The overall vacancy in the area is in line with what is reported by the
companies.
The Gothenburg area was reported to have a vacancy of 6.1%, ranging from 3.1% in the CBD to 14.5% in Eastern
Gothenburg (JLL, 2016). Only Castellum has exposure to Gothenburg, but this is also their largest market (figure
37) with exposure to CBD stretching south- and northwards of CBD, while the prevailing higher vacancy rates are
in the east/west submarkets. The reported vacancy in the Gothenburg area for Castellum was as of Q1 2016 92.6%,
illustrating no need to adjust for vacancy levels when applying cap rates.
Malmö and its surrounding area had a reported total vacancy of 7.1% with small differences in the representative
micro locations. Surprisingly, Malmö CBD has a higher vacancy rate than the remaining inner city with 4.5%
compared to 6.4%. Otherwise, the area has a stable vacancy between 6% and 7%. The highest reported vacancy
in the region was in Lund, with a vacancy of 9.8% (JLL, 2016). Only Castellum hold exposure to this area.
Valuation
87
For Copenhagen, reporting is only segmented on the CBD and greater Copenhagen. The vacancy levels within the
CBD, considered applicable for Norrporten properties, was reported to be 8.1%, while the greater Copenhagen
area was 10.2% (JLL, 2016). The latest reported vacancy level for Norrporten’s portfolio in Copenhagen was in
2014 18.4%, which were partly due finalization of construction without leases signed (Norrporten, 2015). This
will be adjusted for with the expectation that this new space is highly lettable. Moreover, Castellum experience a
similarly high vacancy rate in Copenhagen, as well as the Öresund region in total with an average occupancy
between segments of 85.4% (Castellum, 2016a), which will also be adjusted for.
Observed cap rates in the markets
To not misalign the personal perception with the general transaction market, a large set of market data has been
analyzed to align the authors expectations to the general market in terms of cap rates. NAI Svefa is the single
publicly available resource covering the entire universe needed in the analysis, but reports by JLL (2016) and
Newsec (2016) have been used to limit potential bias.
The trend in the larger cities has been a lowered expectation of return on capital i.e. lower cap rates. This has also
been evident in the commuter catchment area, and similarly for logistic properties within southern Sweden in
connection with the main transportation hubs in between cities and harbors. The smaller regional cities have not
experienced the same downward shift in required return, which by the authors is expected to be due to the markets
increasing focus on investing in specific growth areas, in contrary to specific countries. Especially Northern
Sweden has not seen much downward trend in required return. The cap rates vary with the lowest range between
4% to 4.5%, usually for office and retail space in highly central locations, while the highest is above 10%, mainly
for poorly located industrial/logistics properties. The entire dataset is illustrated in graphs in appendix (A11).
Used cap rates
The overall analysis on cap rates has been performed on the basis of 9,000 observations from 2012 until the spring
of 2016 to triangulate the relationship between rent levels, property condition as well as vacancy rates. Further,
market rent, vacancy levels as well as observed cap rates for the larger cities has been tested against other market
reports to not solely depend on a single view, as brokers in general are using reports to market themselves and
create revenue from property owners. This bias has been carefully taken into account, why the used cap rates
should be considered a fair estimate for the cap rate. Figure 56 represent the used cap rates in the markets, as well
as segmented on property type to the extent as possible. Furthermore, to give an indication of the importance of
the specific cap rates, they are compared up against the relative revenue streams. The portfolio of Castellum is
split between office/retail and industrial/warehouse, while the portfolio of Norrporten is only split between relative
sqm share within the region on office and retail space due to limited transparency in reported data.
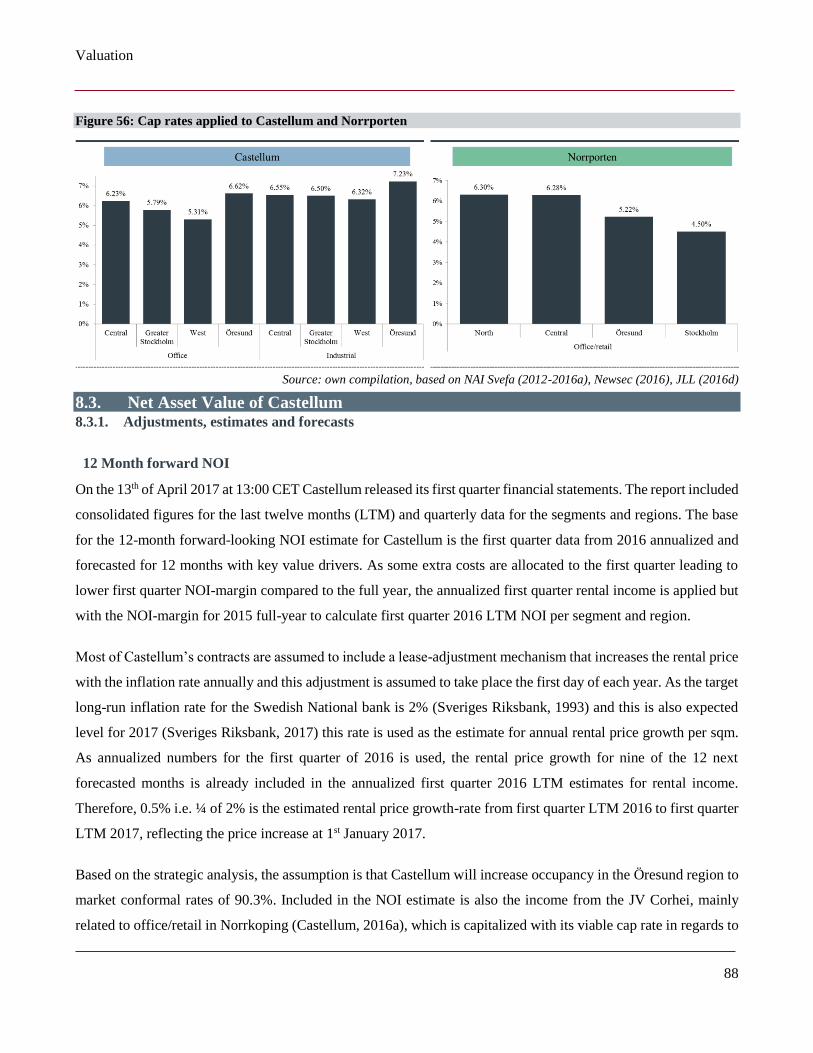
Valuation
88
Figure 56: Cap rates applied to Castellum and Norrporten
Source: own compilation, based on NAI Svefa (2012-2016a), Newsec (2016), JLL (2016d)
8.3. Net Asset Value of Castellum 8.3.1. Adjustments, estimates and forecasts
12 Month forward NOI
On the 13th of April 2017 at 13:00 CET Castellum released its first quarter financial statements. The report included
consolidated figures for the last twelve months (LTM) and quarterly data for the segments and regions. The base
for the 12-month forward-looking NOI estimate for Castellum is the first quarter data from 2016 annualized and
forecasted for 12 months with key value drivers. As some extra costs are allocated to the first quarter leading to
lower first quarter NOI-margin compared to the full year, the annualized first quarter rental income is applied but
with the NOI-margin for 2015 full-year to calculate first quarter 2016 LTM NOI per segment and region.
Most of Castellum’s contracts are assumed to include a lease-adjustment mechanism that increases the rental price
with the inflation rate annually and this adjustment is assumed to take place the first day of each year. As the target
long-run inflation rate for the Swedish National bank is 2% (Sveriges Riksbank, 1993) and this is also expected
level for 2017 (Sveriges Riksbank, 2017) this rate is used as the estimate for annual rental price growth per sqm.
As annualized numbers for the first quarter of 2016 is used, the rental price growth for nine of the 12 next
forecasted months is already included in the annualized first quarter 2016 LTM estimates for rental income.
Therefore, 0.5% i.e. ¼ of 2% is the estimated rental price growth-rate from first quarter LTM 2016 to first quarter
LTM 2017, reflecting the price increase at 1st January 2017.
Based on the strategic analysis, the assumption is that Castellum will increase occupancy in the Öresund region to
market conformal rates of 90.3%. Included in the NOI estimate is also the income from the JV Corhei, mainly
related to office/retail in Norrkoping (Castellum, 2016a), which is capitalized with its viable cap rate in regards to
Valuation
89
the analysis in section 8.2. Income and costs related to development projects is accounted for in the balance sheet
and is therefore excluded from the NOI calculation. Transaction costs are not deducted from NOI as this is assumed
to be accounted in a later period to not leak any information regarding the transaction as it was announced after
the first quarter 2016 report, and as it is a non-recurring item in general assuming no further M&A activity.
Balance sheet
Development projects and building rights needs to be separated out of investment properties in the balance sheet
as these are valued at book value in the valuation. The balance sheet of Castellum significantly changed from year
end 2015 to first quarter 2016 due to transactions, i.e. investment properties increased from SEKbn 41.8 to SEKbn
44.7 and debt increased from SEKbn 20.3 to SEKbn 22.6. However, segmented fair value of development projects
are not reported for the quarter and are therefore assumed unchanged from 2015 annual report in lieu of better
alternative estimates. Value of investments in JVs are included with 0% to not double-count as this is accounted
for via the NOI estimation. Furthermore, goodwill is excluded as this is not included in NAV calculation (Green
Street Advisors, 2014). The quarterly report is less detailed than the full year balance sheet, and to segment some
of the reported numbers for first quarter 2016 the relative size relationship between numbers from 2015 have been
used as an estimate for the segmentation, e.g. break down of current receivables net. This has no impact on the
valuation, but is done to present as granular numbers as possible in the output.
8.3.2. Summary NAV valuation of Castellum
Figure 57 shows the calculated NAV per share for Castellum at SEK 131.25 as of April 13th, 2016, corresponding
to a total NAV of SEKbn 22.58 and SEKbn 45.08 in enterprise value. The adjusted (for later dividends) observed
closing stock price at 13th of April 2017 i.e. on the announcement day prior to the announcement of the merger,
but after the release of the first quarter financials is SEK 130.6. However, as the transaction was rumored on March
8th and followed by a drop in the share price of 3.9%, the share price of SEK 130.60 may contain some anticipation
related to the merger, and thus the share price of SEK 134.68 adjusted for the price drop on March 8th is used
instead. The estimated NAV implies that the market priced Castellum at a 3% premium to the calculated NAV.
The biggest share of Castellum’s value stems from office/retail properties in west, i.e. in Greater Gothenburg, as
well as office/retail properties in the east, including Mälardalen and Easter Götaland.
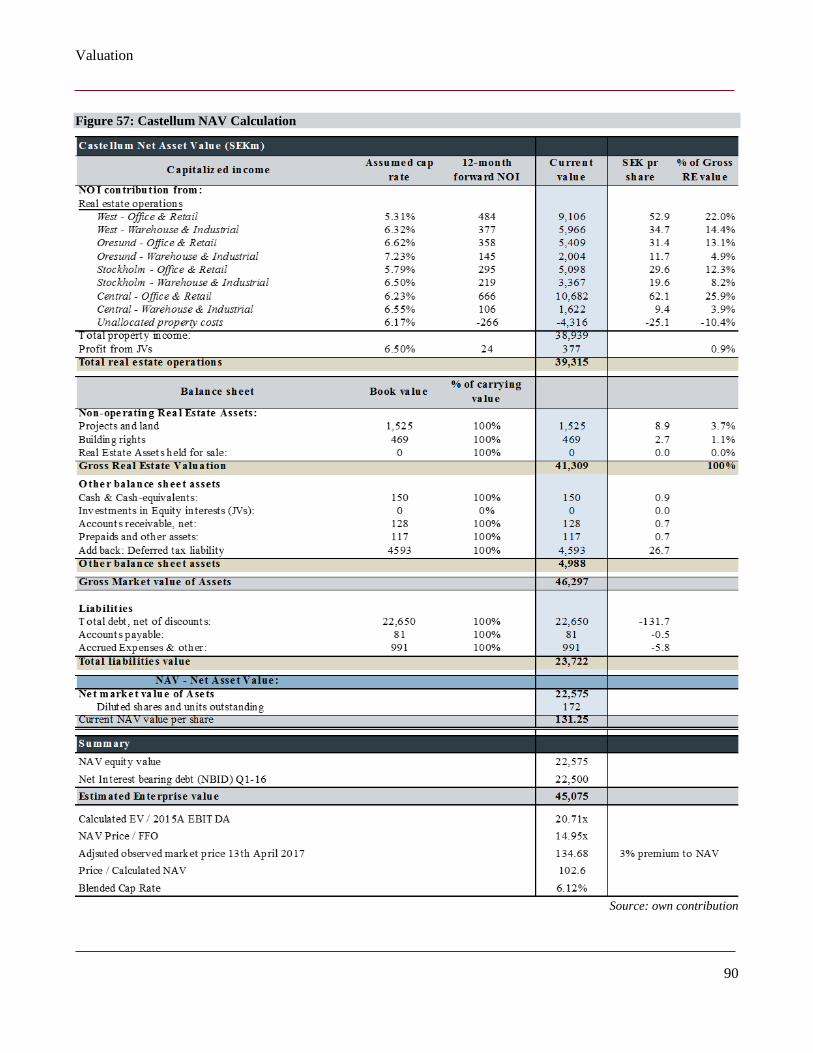
Valuation
90
Figure 57: Castellum NAV Calculation
Source: own contribution
Valuation
91
8.4. Net Asset Value of Norrporten 8.4.1. Adjustments, estimates and forecasts
12-month forward NOI
The 12-month forward NOI for Norrporten is based on the same methodology as Castellum, with first quarter
numbers as presented in the rights issue prospectus of Castellum as base for 12 months forward NOI estimates
(Castellum, 2016e). As the reported first quarter LTM is identical to the reported full year 2015 numbers, it appears
that Norrporten has not had a rent price adjustment in the first day of 2016. This rental price adjustment is therefore
assumed to be adjusted by Norrporten mid-year i.e. as of the first day in the third quarter, and thus 1.5 percentage
points of the 2 percent inflation adjustment is included in forecast for first quarter 2017 LTM. As for Castellum,
Norrporten is with background in the strategic analysis expected to close the gap to the market occupancy rate in
the Öresund-region, and the occupancy is thus assumed to be 90.3% in estimation of 12 month forward NOI.
Balance sheet
Norrporten has historically not reported income and costs segmented on development projects and building rights,
and neither communicated explicitly in financial reporting the value of its’s development projects and building
rights. This is a challenge in the NAV model as it is not certain if the non-operating real estate assets are included
in reported NOI and if including them through the balance sheet leads to double counting the value. According to
the prospectus, Norrporten had 318 ongoing projects as of March 31st, including new-builds, extensions and
redevelopments, with SEKm 161 in remaining investments, and SEKm 58.8 worth of building rights. Historically,
around 4% of fair value of investment properties are related to development projects (Norrporten, 2015). To be
consistent with the calculation methods for Castellum, 4% of investment properties implies estimated SEKm 909
in fair value of projects and building rights combined. The amount seems reasonable compared to Castellum, but
due to potential bias from double counting the percentage of inclusion of carrying value for projects and land is
75% in NAV to mitigate some of the effects from potential double counting. Building rights are included at 100%
as they are assumed to not be income generating.
8.4.2. Summary NAV valuation of Norrporten
Figure 58 shows the calculated NAV for Norrporten at SEKbn 11.76 as of April 13th, 2016. The NAV
communicated in relation to the transaction was SEKbn 13.4, and thus the communicated NAV is at a premium
of 14% to the estimated NAV. The biggest share of Norrporten’s value stems from their properties in the north. In
terms of implied multiples by NAV, Norrporten is priced at a discount to Castellum i.e. 3.3% discount on implied
EV/EBITDA and 17% discount on NAV/FFO.
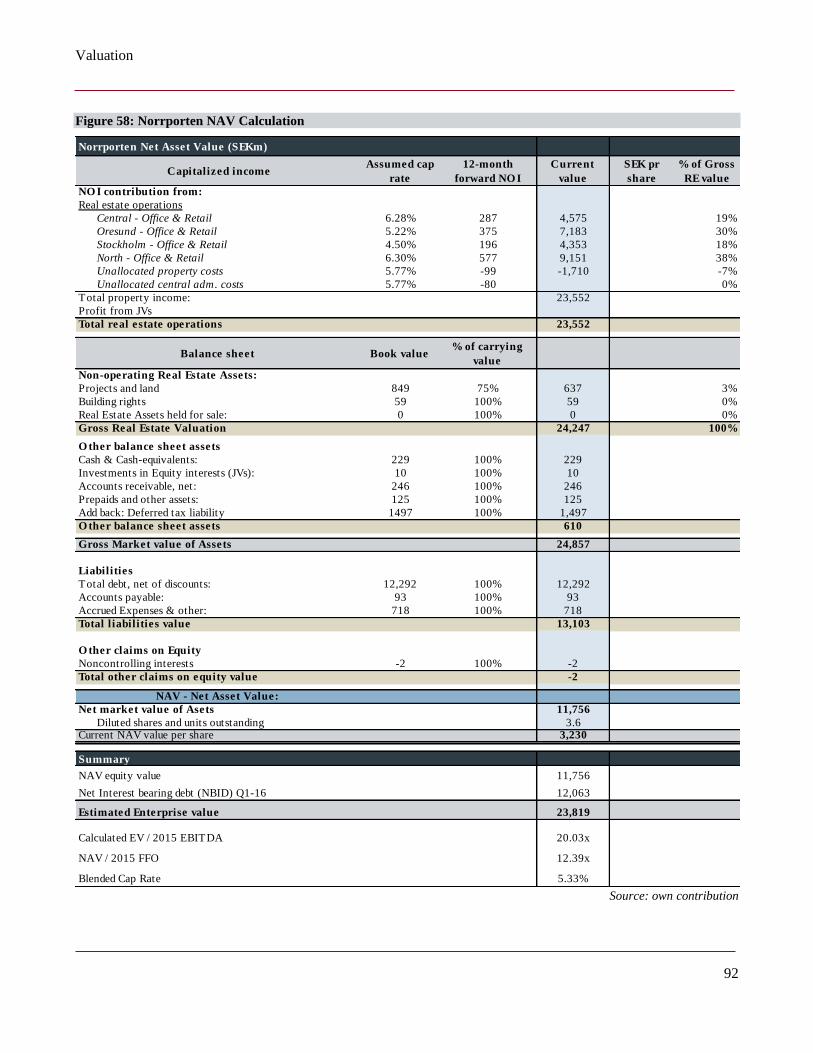
Valuation
92
Figure 58: Norrporten NAV Calculation
Source: own contribution
Norrporten Net Asset Value (SEKm)
Capitalized incomeAssumed cap
rate
12-month
forward NO I
Current
value
SEK pr
share
% of Gross
RE value
NO I contribution from:
Real estate operations
Central - Office & Retail 6.28% 287 4,575 19%
Oresund - Office & Retail 5.22% 375 7,183 30%
Stockholm - Office & Retail 4.50% 196 4,353 18%
North - Office & Retail 6.30% 577 9,151 38%
Unallocated property costs 5.77% -99 -1,710 -7%
Unallocated central adm. costs 5.77% -80 0%
Total property income: 23,552
Profit from JVs
Total real estate operations 23,552
Balance sheet Book value % of carrying
value
Non-operating Real Estate Assets:
Projects and land 849 75% 637 3%
Building rights 59 100% 59 0%
Real Estate Assets held for sale: 0 100% 0 0%
Gross Real Estate Valuation 24,247 100%
O ther balance sheet assets
Cash & Cash-equivalents: 229 100% 229
Investments in Equity interests (JVs): 10 100% 10
Accounts receivable, net: 246 100% 246
Prepaids and other assets: 125 100% 125
Add back: Deferred tax liability 1497 100% 1,497
O ther balance sheet assets 610
Gross Market value of Assets 24,857
Liabilities
Total debt, net of discounts: 12,292 100% 12,292
Accounts payable: 93 100% 93
Accrued Expenses & other: 718 100% 718
Total liabilities value 13,103
O ther claims on Equity
Noncontrolling interests -2 100% -2
Total other claims on equity value -2
NAV - Net Asset Value:
Net market value of Asets 11,756
Diluted shares and units outstanding 3.6Current NAV value per share 3,230
Summary
NAV equity value 11,756
Net Interest bearing debt (NBID) Q1-16 12,063
Estimated Enterprise value 23,819
Calculated EV / 2015 EBITDA 20.03x
NAV / 2015 FFO 12.39x
Blended Cap Rate 5.33%
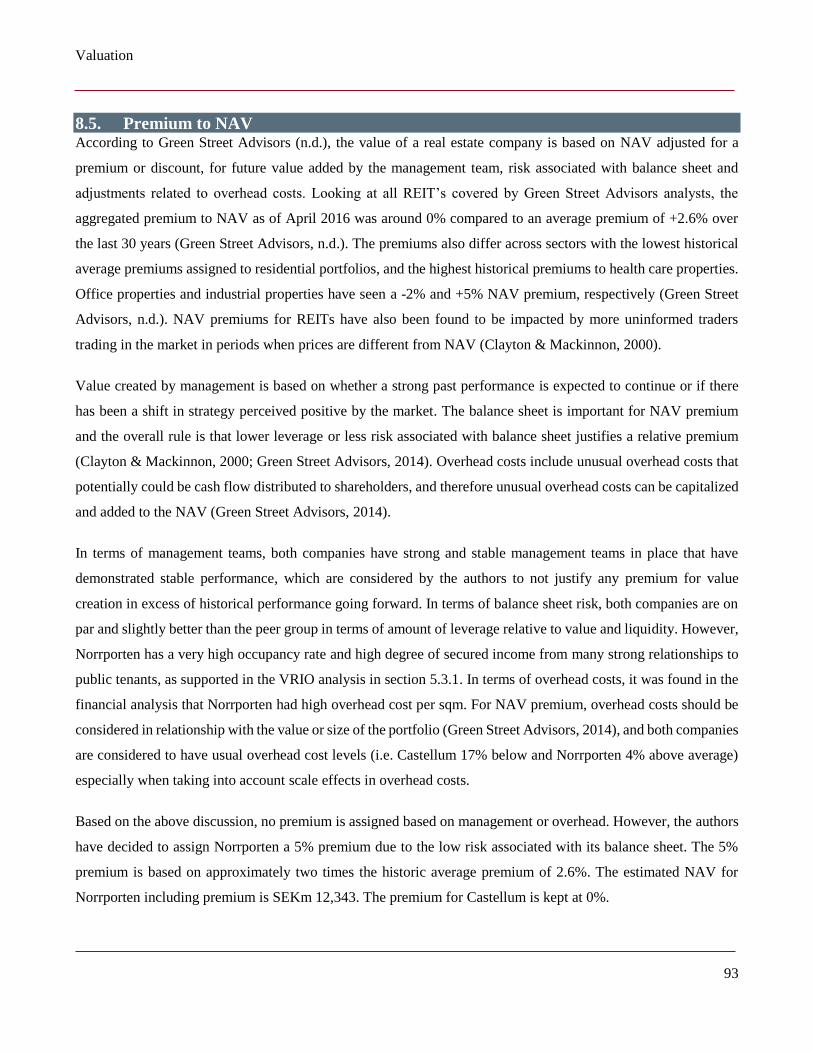
Valuation
93
8.5. Premium to NAV According to Green Street Advisors (n.d.), the value of a real estate company is based on NAV adjusted for a
premium or discount, for future value added by the management team, risk associated with balance sheet and
adjustments related to overhead costs. Looking at all REIT’s covered by Green Street Advisors analysts, the
aggregated premium to NAV as of April 2016 was around 0% compared to an average premium of +2.6% over
the last 30 years (Green Street Advisors, n.d.). The premiums also differ across sectors with the lowest historical
average premiums assigned to residential portfolios, and the highest historical premiums to health care properties.
Office properties and industrial properties have seen a -2% and +5% NAV premium, respectively (Green Street
Advisors, n.d.). NAV premiums for REITs have also been found to be impacted by more uninformed traders
trading in the market in periods when prices are different from NAV (Clayton & Mackinnon, 2000).
Value created by management is based on whether a strong past performance is expected to continue or if there
has been a shift in strategy perceived positive by the market. The balance sheet is important for NAV premium
and the overall rule is that lower leverage or less risk associated with balance sheet justifies a relative premium
(Clayton & Mackinnon, 2000; Green Street Advisors, 2014). Overhead costs include unusual overhead costs that
potentially could be cash flow distributed to shareholders, and therefore unusual overhead costs can be capitalized
and added to the NAV (Green Street Advisors, 2014).
In terms of management teams, both companies have strong and stable management teams in place that have
demonstrated stable performance, which are considered by the authors to not justify any premium for value
creation in excess of historical performance going forward. In terms of balance sheet risk, both companies are on
par and slightly better than the peer group in terms of amount of leverage relative to value and liquidity. However,
Norrporten has a very high occupancy rate and high degree of secured income from many strong relationships to
public tenants, as supported in the VRIO analysis in section 5.3.1. In terms of overhead costs, it was found in the
financial analysis that Norrporten had high overhead cost per sqm. For NAV premium, overhead costs should be
considered in relationship with the value or size of the portfolio (Green Street Advisors, 2014), and both companies
are considered to have usual overhead cost levels (i.e. Castellum 17% below and Norrporten 4% above average)
especially when taking into account scale effects in overhead costs.
Based on the above discussion, no premium is assigned based on management or overhead. However, the authors
have decided to assign Norrporten a 5% premium due to the low risk associated with its balance sheet. The 5%
premium is based on approximately two times the historic average premium of 2.6%. The estimated NAV for
Norrporten including premium is SEKm 12,343. The premium for Castellum is kept at 0%.
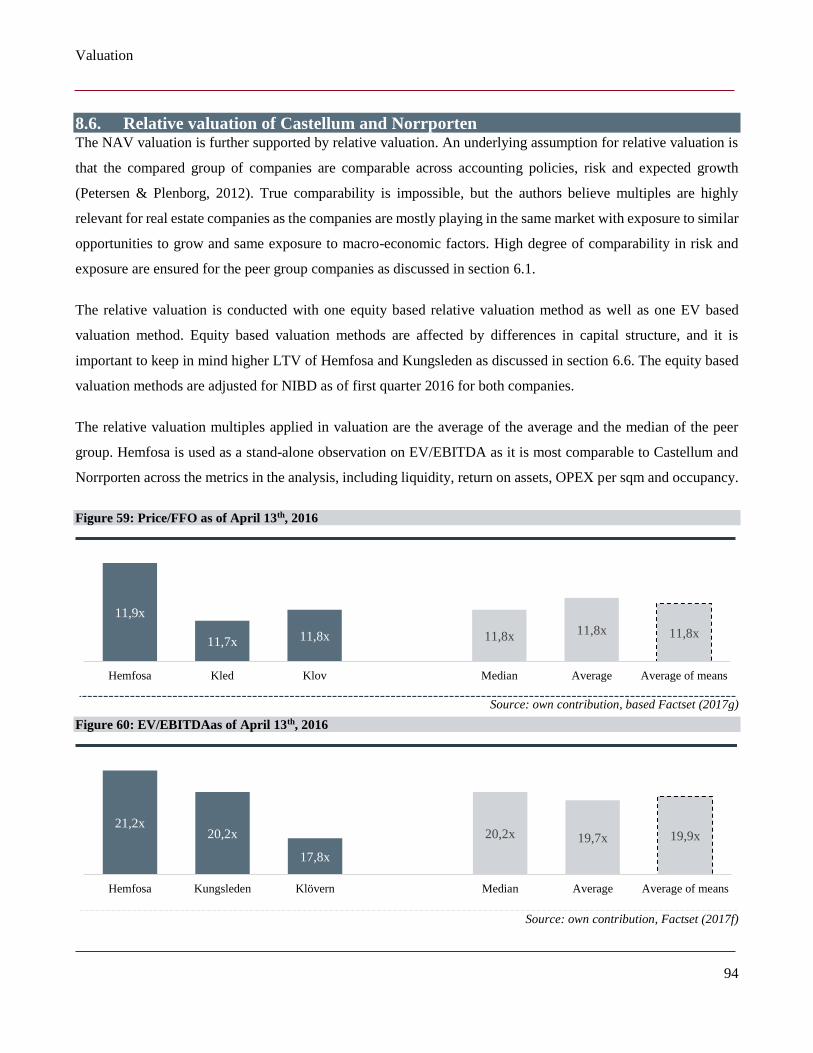
Valuation
94
8.6. Relative valuation of Castellum and Norrporten The NAV valuation is further supported by relative valuation. An underlying assumption for relative valuation is
that the compared group of companies are comparable across accounting policies, risk and expected growth
(Petersen & Plenborg, 2012). True comparability is impossible, but the authors believe multiples are highly
relevant for real estate companies as the companies are mostly playing in the same market with exposure to similar
opportunities to grow and same exposure to macro-economic factors. High degree of comparability in risk and
exposure are ensured for the peer group companies as discussed in section 6.1.
The relative valuation is conducted with one equity based relative valuation method as well as one EV based
valuation method. Equity based valuation methods are affected by differences in capital structure, and it is
important to keep in mind higher LTV of Hemfosa and Kungsleden as discussed in section 6.6. The equity based
valuation methods are adjusted for NIBD as of first quarter 2016 for both companies.
The relative valuation multiples applied in valuation are the average of the average and the median of the peer
group. Hemfosa is used as a stand-alone observation on EV/EBITDA as it is most comparable to Castellum and
Norrporten across the metrics in the analysis, including liquidity, return on assets, OPEX per sqm and occupancy.
Figure 59: Price/FFO as of April 13th, 2016
Source: own contribution, based Factset (2017g)
Figure 60: EV/EBITDAas of April 13th, 2016
Source: own contribution, Factset (2017f)
11,9x
11,7x 11,8x 11,8x 11,8x 11,8x
Hemfosa Kled Klov Median Average Average of means
21,2x20,2x
17,8x
20,2x 19,7x 19,9x
Hemfosa Kungsleden Klövern Median Average Average of means
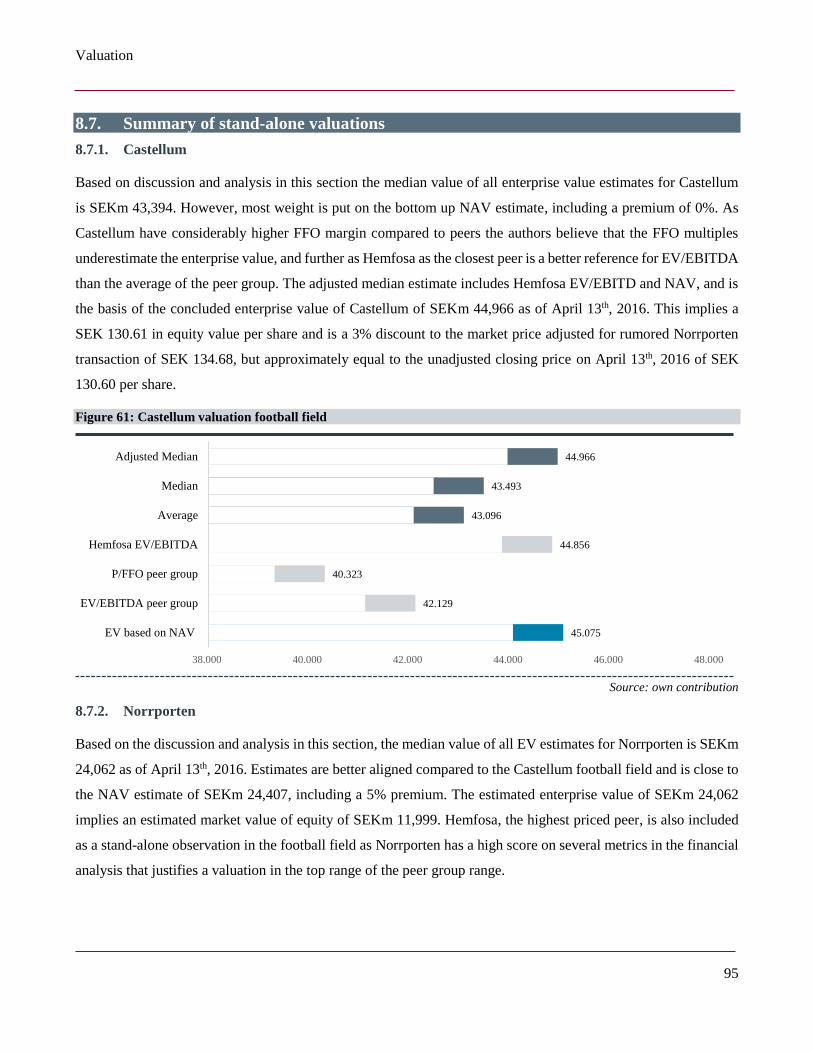
Valuation
95
8.7. Summary of stand-alone valuations
8.7.1. Castellum
Based on discussion and analysis in this section the median value of all enterprise value estimates for Castellum
is SEKm 43,394. However, most weight is put on the bottom up NAV estimate, including a premium of 0%. As
Castellum have considerably higher FFO margin compared to peers the authors believe that the FFO multiples
underestimate the enterprise value, and further as Hemfosa as the closest peer is a better reference for EV/EBITDA
than the average of the peer group. The adjusted median estimate includes Hemfosa EV/EBITD and NAV, and is
the basis of the concluded enterprise value of Castellum of SEKm 44,966 as of April 13th, 2016. This implies a
SEK 130.61 in equity value per share and is a 3% discount to the market price adjusted for rumored Norrporten
transaction of SEK 134.68, but approximately equal to the unadjusted closing price on April 13th, 2016 of SEK
130.60 per share.
Figure 61: Castellum valuation football field
Source: own contribution
8.7.2. Norrporten
Based on the discussion and analysis in this section, the median value of all EV estimates for Norrporten is SEKm
24,062 as of April 13th, 2016. Estimates are better aligned compared to the Castellum football field and is close to
the NAV estimate of SEKm 24,407, including a 5% premium. The estimated enterprise value of SEKm 24,062
implies an estimated market value of equity of SEKm 11,999. Hemfosa, the highest priced peer, is also included
as a stand-alone observation in the football field as Norrporten has a high score on several metrics in the financial
analysis that justifies a valuation in the top range of the peer group range.
45.075
42.129
40.323
44.856
43.096
43.493
44.966
38.000 40.000 42.000 44.000 46.000 48.000
EV based on NAV
EV/EBITDA peer group
P/FFO peer group
Hemfosa EV/EBITDA
Average
Median
Adjusted Median
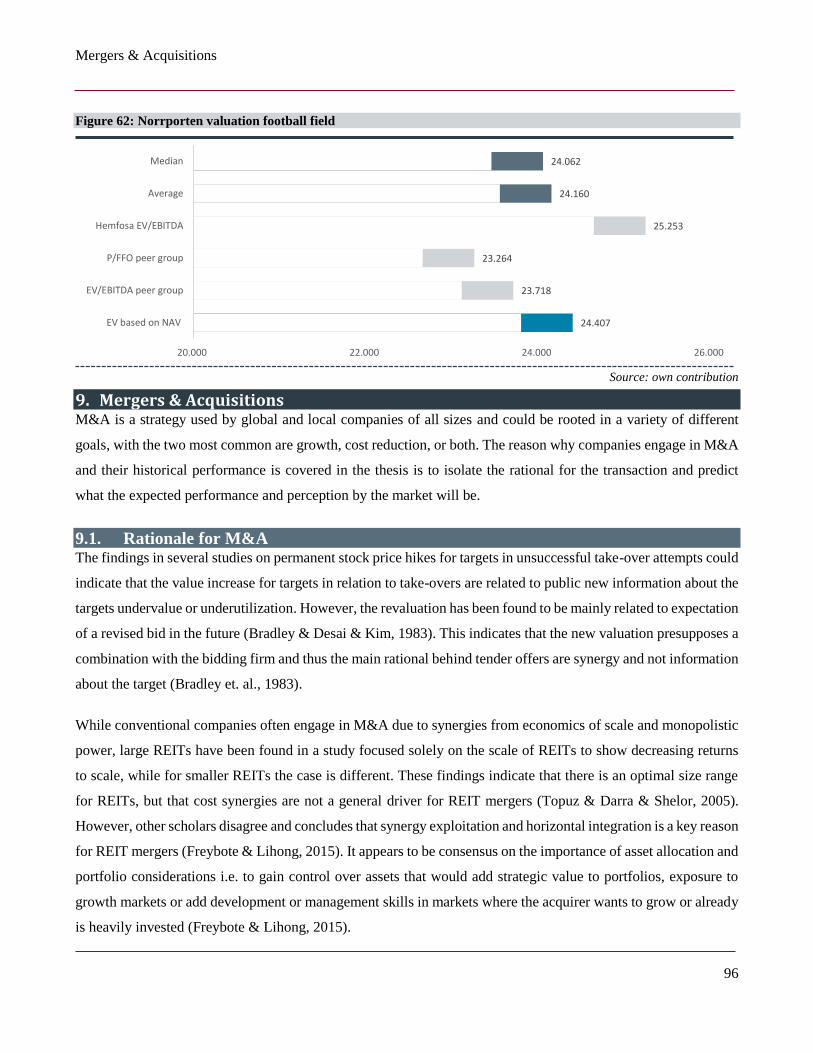
Mergers & Acquisitions
96
Figure 62: Norrporten valuation football field
Source: own contribution
9. Mergers & Acquisitions M&A is a strategy used by global and local companies of all sizes and could be rooted in a variety of different
goals, with the two most common are growth, cost reduction, or both. The reason why companies engage in M&A
and their historical performance is covered in the thesis is to isolate the rational for the transaction and predict
what the expected performance and perception by the market will be.
9.1. Rationale for M&A The findings in several studies on permanent stock price hikes for targets in unsuccessful take-over attempts could
indicate that the value increase for targets in relation to take-overs are related to public new information about the
targets undervalue or underutilization. However, the revaluation has been found to be mainly related to expectation
of a revised bid in the future (Bradley & Desai & Kim, 1983). This indicates that the new valuation presupposes a
combination with the bidding firm and thus the main rational behind tender offers are synergy and not information
about the target (Bradley et. al., 1983).
While conventional companies often engage in M&A due to synergies from economics of scale and monopolistic
power, large REITs have been found in a study focused solely on the scale of REITs to show decreasing returns
to scale, while for smaller REITs the case is different. These findings indicate that there is an optimal size range
for REITs, but that cost synergies are not a general driver for REIT mergers (Topuz & Darra & Shelor, 2005).
However, other scholars disagree and concludes that synergy exploitation and horizontal integration is a key reason
for REIT mergers (Freybote & Lihong, 2015). It appears to be consensus on the importance of asset allocation and
portfolio considerations i.e. to gain control over assets that would add strategic value to portfolios, exposure to
growth markets or add development or management skills in markets where the acquirer wants to grow or already
is heavily invested (Freybote & Lihong, 2015).
24.407
23.718
23.264
25.253
24.160
24.062
20.000 22.000 24.000 26.000
EV based on NAV
EV/EBITDA peer group
P/FFO peer group
Hemfosa EV/EBITDA
Average
Median
Mergers & Acquisitions
97
9.2 Historical performance of mergers M&A is one of the most researched topics in finance (Agrawa & Jaffe & Mandelker, 1992), but if mergers are
actually value-creating is still a debated topic in finance (Brealey & Myers & Allen, 2013). This section will cover
the review of empirical studies on merger performance, what factors are affecting empirical findings, and what
reactions that can be expected for Castellum’s investors. In general, there is a consensus among scholars that for
listed companies the targets shareholders benefit from mergers and acquisitions while the effect on the bidder’s
shareholders and corporate performance of acquiring firms are more ambiguous (Brealey et. al. 2013). Further, as
most research on merger performance covers a group of listed companies this section of the thesis will mainly
relate to Castellum. The distinction between mergers and acquisitions are considered to be only a legal definition
i.e. combination and integration, respectively. As most research is merger focused, the two terms are applied
interchangeably. If differences in research for merges and acquisitions is prevalent, this will be highlighted.
9.2. Financial return at merger announcement Announcement returns are returns following the immediate time before and after the announcement of the
transaction. Stock prices can convey a lot of information on how shareholders view a merger, and when analyzing
stock price reactions to describe the investor’s reaction to the merger announcement it is necessary to separate this
impact from that of long-term performance. Several general studies with large samples and risk-adjusted models
incl. Mandelker (1974) and Langetieg (1978) conclude that the acquirer should expect an insignificant positive or
negative share price reaction, which implies that companies should not engage in mergers as it does not create
value for shareholders and thus the extensive merger activity seen is some sort of anomaly. However, as mergers
seems to come in waves it can be hard to find a generalization for merger performance (Brealey et. al. 2013).
Payment method
The short-term stock price movements can be affected by payment method due to the signaling effect of equity
cash flow decisions. Paying for the acquisition with equity could indicate that management believes the shares are
under-valued by the market, and paying for the acquisition with cash could indicate that the management is
convinced of the opposite (Brealey et. al. 2013). Consistent with this theory, a study of 399 US takeovers conducted
by Franks & Harris & Titman (1991) concluded that depending on the model applied, companies with all-equity
financed, defined as more than 90% of consideration paid in equity, bids performed significantly worse in the short
term compared to companies with cash financed acquisitions. The signaling effect should only be prevalent on the
short run as a semi-strong form efficient market should adjust the market prices to reflect the signaling of payment
method immediately at announcement. However, a long term study by Agrawa et. al. (1992) also found
underperformance for acquirers that financed their takeovers with equity over a 5-year horizon which questions
the efficient market hypothesis.
Mergers & Acquisitions
98
Merger programs
Traditional research on performance of acquiring companies looks at the performance of a large sample of mergers
and averages the returns across all observations. The results obtained by this aggregation may not be true for
companies involved in merger programs as the market already reflects some anticipation related to mergers
expected to be announced in the program. Asquith & Burner & Mullins Jr. (1983) compares the returns of
companies involved in merger programs to those not involved, and found that cumulative excess returns for
companies involved in merger programs were significantly larger for the second to fourth merger than for the first
merger as many companies announce the merger program following the first merger. This indicates that there is a
positive market reaction to announcement of a merger program, which leads to some bias in including companies
with merger programs in merger announcement studies.
Other effects
When analyzing and isolating the market reaction of a merger, one should keep in mind that several other less
explicit or obvious effects could contaminate the returns as the market can interpret the merger decision in several
ways. For example, a high bid can be interpreted by the market as signal that the bidding company are performing
better than planned and will report higher cash flow than expected at next reporting (Roll, 1986), which again can
lead to a positive share price reaction. Events that increases the leverage of the acquirer, like acquisitions where
the consideration are paid in equity instead of cash (Vermaelen, 1981) should, everything else held constant,
increase the bidding company’s debt to equity as net debt increases and hence impact weighted average cost of
capital (WACC). To isolate and improve the quality of the stock price reaction that is attributable to only the
merger, the normal price reaction from leverage increase and other effects needs to be deducted (Roll, 1986).
9.3. Long term financial return from mergers Assuming efficient capital markets, stock market prices will instantly reflect the merger news and a systematically
abnormal over or under-performance of the shares of acquiring firms should be impossible. Hence, in an efficient
capital market, outcome of mergers needs to be a fair game in the sense that it is equal probability for the stock
returns following the merger to be positive as negative (Langetieg, 1978). If this is not the case future returns can
be predicted and investors can in theory make abnormal profits by systematically trading on merger events.
Earlier research on long term merger performance were often based on samples initial built for announcement
return studies and benchmarked against a proxy for market returns using an asset pricing model which often were
biased due to size and beta effects (Higson & Elliot, 1998). When securities in the sample are of different size and
the time series applied are long, there will often be a highly significant bias in merger performance studies (Dimson
& Marsh, 1985), similarly not allowing for monthly shifts in the beta value of the asset pricing models will lead
Mergers & Acquisitions
99
to significant bias, especially for cumulative return calculations (Agrawa et. al., 1992). Findings are also sensitive
to what sample period that is applied in the study due to merger waves, exemplified by Higson and Elliot’s (1998)
study of 830 UK mergers, where 1981-1984 were the only sub period in the study with abnormal returns for
acquiring companies and were found to have the very high value of +26%. Another example is Franks & Harris
& Titman (1991) who concluded that there was no significant underperformance based on a study of 399 US
mergers, where more than 50% of the observations was events from five years in the late 70s that were the only
sub period with positive returns in the sample of Agrawa et. al. (1992).
The most comprehensive study found relevant for this thesis are Agrawa et. al. (1992) study of 937 NYSE mergers
which is adjusted for firm size and is calculated with monthly rebalancing of beta. This study concludes that
acquiring firms underperform the benchmark by -10% over a five-year period following the merger. This finding
conflicted with several other prominent studies2 that found small but insignificant underperformance, however,
not all of these included beta-adjustments.
The findings of Agrawa et. al. (1992) are not consistent with what Mandelker (1974) describes as the perfectly
competitive acquisitions market hypothesis (PACM). PACM implies that an acquiring firm should expect no
synergies from monopolistic power due to the competitiveness of the acquisition leading to the price always being
as high as the cost of reproducing the target`s assets. As such, Mandelker (1974) implies that there are no rational
to do mergers, and that merger rationales are left to theories like Richard Roll`s hubris theory (1986) and other
cognitive biases based on past behavior or overconfidence (Burner, 2005).
9.4. Accounting returns A study of the 50 largest mergers in the USA in the late 1970s and early 1980s found an average post-merger
increase of 2.4 percentage points in profits pre-tax. The finding was found to be especially prevalent for mergers
within the same industry and to correlate with the merger announcement performance (Healy & Palepu & Ruback,
1992). As the performance of this research is correlated with the stock price performance, and since most of the
sample is from the late 1970s and early 1980s which has been found to be an outlier in terms of stock price
performance in later research (e.g. Agrawa et al., 1992) the authors believe that there is evidence for a positive
bias in the findings of Healy et. al. (1992).
Findings by Ravenscraft & Scharer (1987) from a different period also questions Haely et. al. (1992). Ravenscraft
& Scharer (1987) studies tender offers in the 1960s and 1970s and found that acquirers had inferior profit levels
relative to their peers in the industry prior to the acquisition, while after the acquisition, the relative profitability
2 e.g. Langetieg (1978), Asquith (1983), Magenheim and Mueller (1988)
Mergers & Acquisitions
100
gap had decreased. The findings were statistically significant. Many of the acquisitions was based on expected
increased profitability due to synergies, but the decreasing profitability indicates that this was not the case
(Ravenscraft & Scherer, 1987). Ravenscraft & Scharer (1987) conclude that their findings are an anomaly as
mergers are often carried out to improve efficiency, and that their findings are conflicting with this rational. The
study does not include tax and interest, i.e. if their findings is in fact not an anomaly and efficiency improvements
are reached they have to be tax and interest related only (Ravenscraft & Scherer, 1987).
9.5. Real estate specific research Unique characteristics and legal regulation of REITs lead them to react differently to mergers than conventional
companies, and existing merger theory is insufficient to describe REITs mergers fully. The characteristics includes
for example the role of fixed asset bases both operationally and strategically for REITs (Freybote & Lihong, 2015),
and a SEC regulation requiring 90% pay-out ratio leading to opposite signaling reactions from payment method
compared to normal companies (Ratcliffe & Dimovski, 2012). The latter also reduces the relevance of REIT
performance results for Castellum.
A comprehensive study of the long-term performance of 114 REIT mergers with both public and private
counterparts have found that while there can be positive announcement period returns, the long-term performance
of REIT mergers over a five-year period is negative with -10%, which is statistically significant. The results are
similar for both public and private companies merging with the public partner (Campbell & Giambona & Sirmans,
2007). These findings indicate that there can be an inconsistency with the efficient market hypothesis for REITs.
9.6. Summary on expected reactions for Castellum The research reviewed is not for listed real estate companies with the same model as Castellum as this is not
available. However, some general expectations can be summaries based on the research. According to the research,
the underlying announcement effect of Castellum is be expected to be insignificantly positive or negative, but that
it could be a negative reaction driven by the rights issue as this could signal management perception of current
share price level. Capital structure is assumed to not have an effect as the details of the rights issue was not clear
at the announcement and that Castellum still managed to keep its target LTV ratio. Both general and REIT research
indicate that investors could expect an underperformance to benchmark of around -10% over the next five years,
and that in terms of accounting performance, the company will not be able to live up to the expectations of the
efficiency impact of the merger.
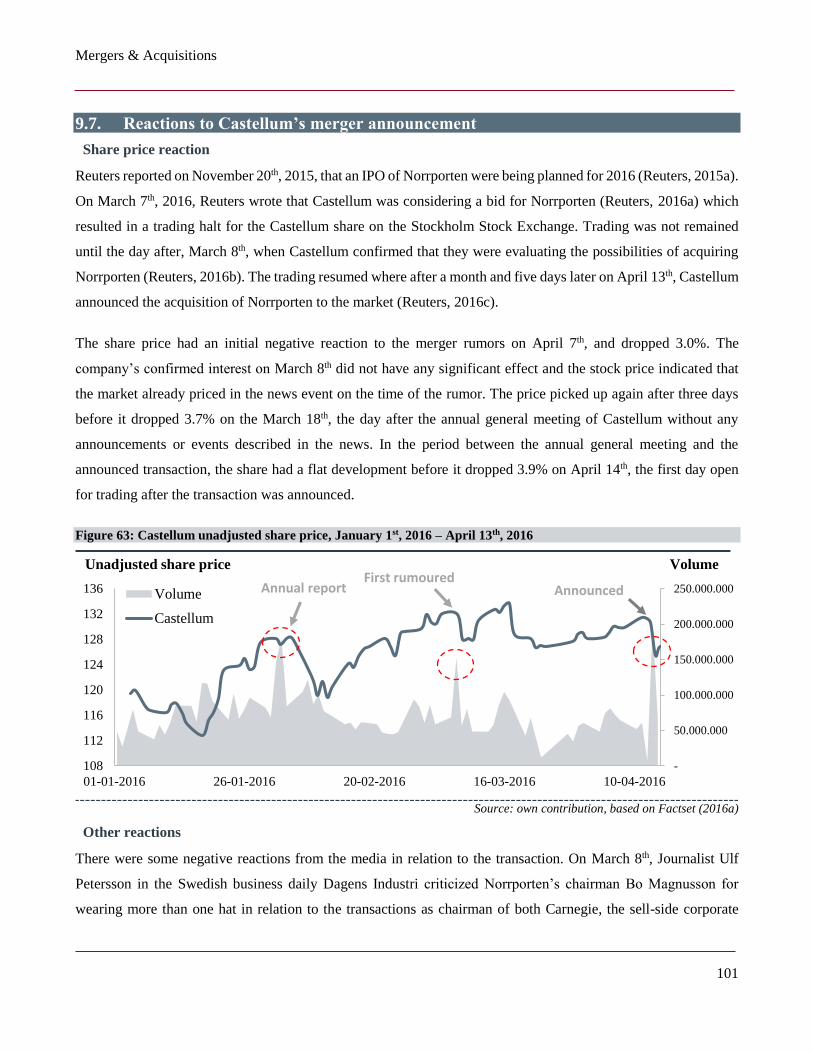
Mergers & Acquisitions
101
9.7. Reactions to Castellum’s merger announcement
Share price reaction
Reuters reported on November 20th, 2015, that an IPO of Norrporten were being planned for 2016 (Reuters, 2015a).
On March 7th, 2016, Reuters wrote that Castellum was considering a bid for Norrporten (Reuters, 2016a) which
resulted in a trading halt for the Castellum share on the Stockholm Stock Exchange. Trading was not remained
until the day after, March 8th, when Castellum confirmed that they were evaluating the possibilities of acquiring
Norrporten (Reuters, 2016b). The trading resumed where after a month and five days later on April 13th, Castellum
announced the acquisition of Norrporten to the market (Reuters, 2016c).
The share price had an initial negative reaction to the merger rumors on April 7th, and dropped 3.0%. The
company’s confirmed interest on March 8th did not have any significant effect and the stock price indicated that
the market already priced in the news event on the time of the rumor. The price picked up again after three days
before it dropped 3.7% on the March 18th, the day after the annual general meeting of Castellum without any
announcements or events described in the news. In the period between the annual general meeting and the
announced transaction, the share had a flat development before it dropped 3.9% on April 14th, the first day open
for trading after the transaction was announced.
Figure 63: Castellum unadjusted share price, January 1st, 2016 – April 13th, 2016
Source: own contribution, based on Factset (2016a)
Other reactions
There were some negative reactions from the media in relation to the transaction. On March 8th, Journalist Ulf
Petersson in the Swedish business daily Dagens Industri criticized Norrporten’s chairman Bo Magnusson for
wearing more than one hat in relation to the transactions as chairman of both Carnegie, the sell-side corporate
-
50.000.000
100.000.000
150.000.000
200.000.000
250.000.000
108
112
116
120
124
128
132
136
01-01-2016 26-01-2016 20-02-2016 16-03-2016 10-04-2016
Volume
Castellum
Unadjusted share priceFirst rumoured
Announced
Volume
Annual report
Synergies
102
finance advisor, and Norrporten (Petersson, 2016). Furthermore, there are many personal relationships across the
Swedish real estate markets, and one highly relevant for this transaction is that Helena Olin, the head of real estate
investments at AP2, is also the wife of Henrik Saxborn, the CEO of Castellum. Helena Olin have a conflict of
interest due to Henrik Saxborn’s shareholdings of more than SEKm 4 in Castellum as of 2015 (Castellum, 2016a)
and his potentially increased remuneration and future career prospects related to heading a larger company,
assuming that the couple have joint finances. However, the relationship is assumed to not have influenced the
transaction as it is assumed that AP2 have the right governance mechanism in place.
On April 15th, Dagens Industri quoted an anonymous insider who stated that the transaction was unwise of
Castellum. The motivation for the statement was the “failed IPO track” and that several institutional investors did
not wish to participate in the IPO. Castellum’s CEO, Henrik Saxborn, countered this by highlighting synergy
potential, a well-planned financing pack and that the company was acquired below NAV (Nylander, 2016).
10. Synergies Synergies is defined as the extra value that is created by combining two firms, either by reduction of costs,
additional revenues or other value creating factors e.g. reduction of discount rate (Damodaran, 2015). The
importance of synergies in M&A is high, and it has been justification for both some of the best and the worst M&A
deals performed with limited granularity and communication of the hard data underlying the synergy argument
(BCG, 2016). A sample of 286 major M&A transactions performed in North America between 2010 and 2015
where the acquisition targets value was at least 30% of acquirers’ value, the average control premium was 34%.
Comparing the control premium to the estimated synergies, the premium is a reflection that sellers foresee the
buyer’s synergies and require a premium. On average, the sellers capture one-third of the expected value of the
synergies (BCG, 2013).
In relation to Castellum’s acquisition of Norrporten, Castellum communicated SEKm 150 in cost synergies to be
realized over 12-18 months, mainly related to operating synergies in overhead functions (Thomson Reuters, 2016).
Judging from their cost base, some of the most obvious cost synergies could be costs related to removing one of
the management teams, executive boards as well as asset management functions located in the same cities e.g.
both companies have asset management offices with staff in Copenhagen. Research supports that duplicate
functions and salary are some of the most typical cost cuts in real estate mergers (Anderson & Medla & Rottke &
Schiereck., 2011).
Synergies
103
10.1. Types of synergies 10.1.1. Operating synergies
Operating synergies are those allowing the combined firm to increase profits from assets at the time of the
combination. Economics of scale is a typical operating cost synergy reducing relative amount of fixed costs by
e.g. better utilization of a middle office function, relocation of staff or production to one combined location.
Synergies affecting revenues can include the ability to increase prices due to pricing power, an effect that is greater
if the market is consolidated (Damodaran, 2005). Revenue synergies can also stem from cross selling of products
to existing customers, for example in a merger of two companies offering complimentary products. A combination
of firms with complementary skills and a strong product portfolio can also create value (Damodaran, 2005).
10.1.2. Financial synergies
Financial synergies refer to synergies that affect cash flows or the cost of capital through any of its drivers. A
typical financial synergy for listed companies acquiring private companies are access, and better utilization of
cash, also called cash slack, denoting that one of the companies can pursue opportunities that otherwise would not
due to limited access to cash (Damodaran, 2005). Cost of capital drivers as leverage and tax rate can also generate
financial synergies through increase of debt capacity from more stable operations and utilization of deferred tax
or shelter from operating losses, respectively (Damodaran, 2005). A financial synergy that is often highlighted by
management is risk reduction from diversification, but many financial analysts disagree with this rational and
argue that investors could more efficiently obtain the same diversification in the financial markets (Brealey et. al.,
2013). Lower financing costs on new loans are also a financial synergy that considered a dubious reason to merge.
The borrowing cost per se can be lower following a merger but the net gain is expected to be zero as the borrowing
costs goes down due to more collateral for the debt giving bondholders a better protection. For debt that existed
before the merger, the companies will not necessarily be better off as the interest rate margin is already structured
but the legal collateral for bondholders’ increase (Brealey et al., 2013).
10.1.3. Synergies in real estate mergers
Lower return to bidding firms in real estate mergers compared to other sectors is often explained by less synergy
potential. However, scale and efficiency gains are normally mentioned as the largest potential synergy sources in
real estate. (Anderson et. al., 2011). Efficiency improvements would typically be made in general and
administrative functions as overhead is shared across a larger asset base. Operational cost was mentioned in 91%
of the sample in a study of 32 real estate merger announcements that included disclosure of synergies, with
overhead being the most mentioned type of operational cost (Anderson et. al, 2011). Interest expense is a less
important synergy than overhead, but is relevant in transactions were companies with low financing costs acquire
companies with high financing costs (Anderson et. al., 2011).
Synergies
104
10.2. Synergy assessment The valuation of synergies is divided in two parts. First, the synergy potential is assessed and tested by looking at
comparable transactions, case studies and empirical research. As this research is based on an outside-in view, it is
not possible to assess Castellum’s synergy estimate accurately, and the research will instead map out expected
sample space based on several data points. After assessing the plausibility of the communicated synergies, the
estimated present value of the synergies is calculated in the following section. Both companies have sufficient size
to access the same cheap financing, and a potential for interest rate or financial synergies is not been identified.
This is further supported by a comment from Castellum’s CEO Henrik Saxborn on the conference call covering
the transaction: “The synergies are more or less 100% operational at this stage” (Thomson Reuters, 2016, pg. 6),
and this is why financial synergies will not be further investigated in the scope of this thesis.
10.2.1. Scale efficiencies in administration costs
Anderson et. al. (2011) found that the median expected synergies for the sample of 32 real estate mergers made
out 1.8% of the combined total revenue of both firms before the merger, with most of the costs related to central
administration and overhead. For operating costs, the expected synergies were 7.15% of the combined total, and
for overhead 21.25% of the combined overhead. Looking at the target in isolation, the median expected 70%
reduction of the target’s overhead and administrative costs, where the cut of duplicate functions and salary was
found to be an important part of the cost cut potential (Anderson et. al., 2011). This research suggests scale
efficiencies for real estate companies as relative cost reductions can be made following larger asset bases.
To investigate the relationship between overhead and company size, 17 listed Swedish real estate companies have
been researched. In Figure 64, overhead costs are represented by corporate administration costs per sqm (y axis)
which is plotted against total sqm of the portfolio (x axis) to represent size. The results exhibit overhead that is
more efficient for larger companies, and support the argument of lower operating costs from sharing of overhead
functions over a larger asset base made by Anderson et. al. (2011). The analysis is fitted with a power-function
trend line to illustrate what appears to be diminishing returns to scale for this group of companies. This is likely
caused by lack of scalability of some functions as the companies reach a certain size, e.g. an in-house legal officer
might be required by listed companies but one officer might be enough until the companies reach a certain size
before more officers are required leading to increased salary costs.
As can be seen from figure 48, Norrporten’s central administration costs were SEK 77 per sqm compared to SEK
33 per sqm for Castellum. Assuming that Castellum as a new owner of Norrporten is able to reduce the central
administration cost to the same as the current per sqm level in Castellum, and further reduce the property
administration costs to the same level as Castellum, the total annual savings would be SEKm 93.03.
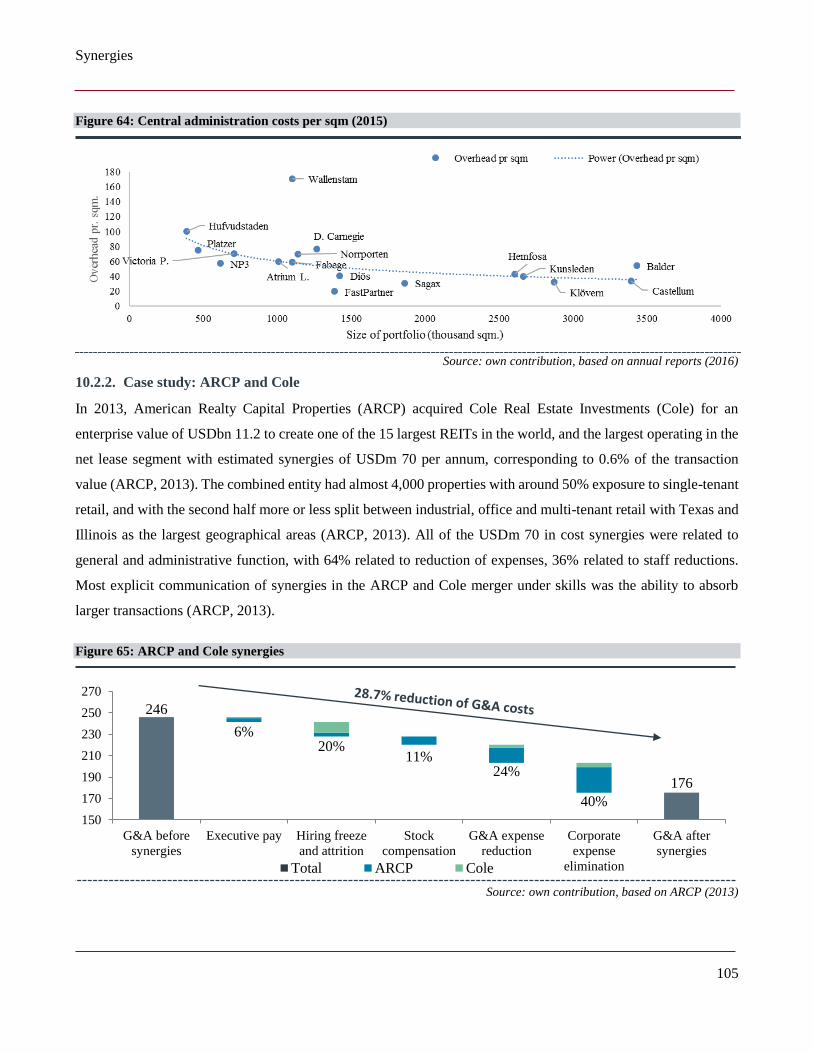
Synergies
105
Figure 64: Central administration costs per sqm (2015)
Source: own contribution, based on annual reports (2016)
10.2.2. Case study: ARCP and Cole
In 2013, American Realty Capital Properties (ARCP) acquired Cole Real Estate Investments (Cole) for an
enterprise value of USDbn 11.2 to create one of the 15 largest REITs in the world, and the largest operating in the
net lease segment with estimated synergies of USDm 70 per annum, corresponding to 0.6% of the transaction
value (ARCP, 2013). The combined entity had almost 4,000 properties with around 50% exposure to single-tenant
retail, and with the second half more or less split between industrial, office and multi-tenant retail with Texas and
Illinois as the largest geographical areas (ARCP, 2013). All of the USDm 70 in cost synergies were related to
general and administrative function, with 64% related to reduction of expenses, 36% related to staff reductions.
Most explicit communication of synergies in the ARCP and Cole merger under skills was the ability to absorb
larger transactions (ARCP, 2013).
Figure 65: ARCP and Cole synergies
Source: own contribution, based on ARCP (2013)
246
176
6%20%
11%24%
40%
150
170
190
210
230
250
270
G&A before
synergies
Executive pay Hiring freeze
and attrition
Stock
compensation
G&A expense
reduction
Corporate
expense
elimination
G&A after
synergies
Total ARCP Cole
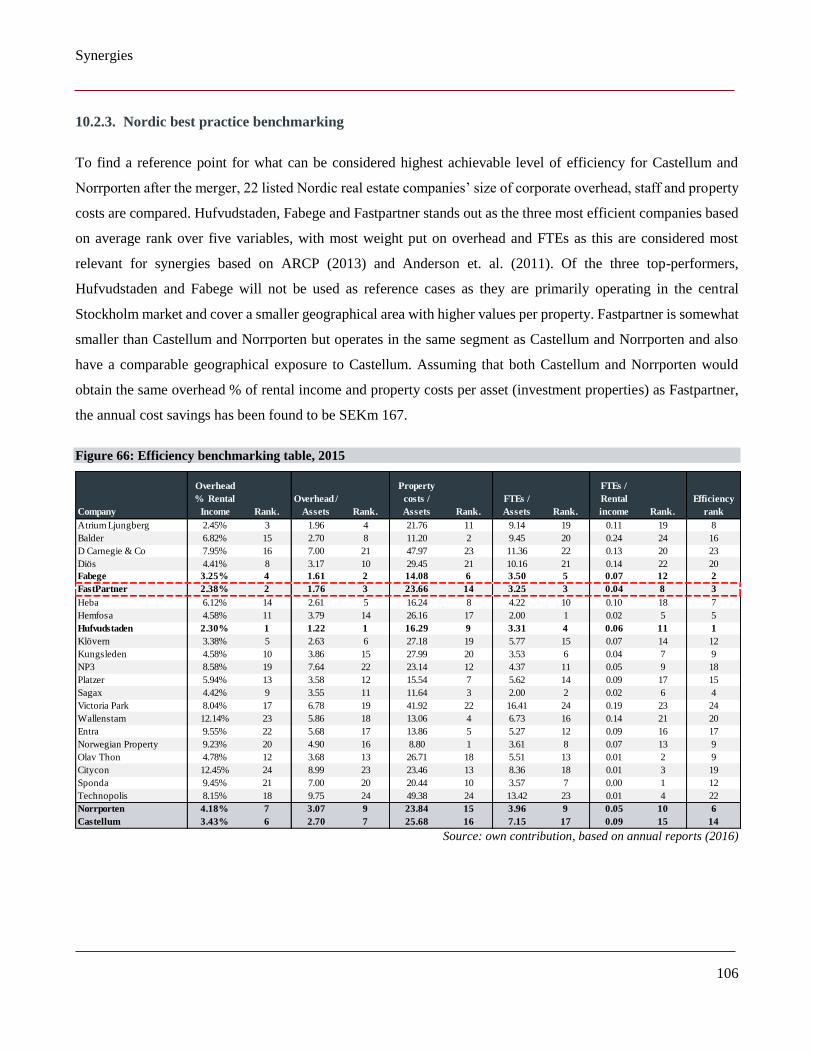
Synergies
106
10.2.3. Nordic best practice benchmarking
To find a reference point for what can be considered highest achievable level of efficiency for Castellum and
Norrporten after the merger, 22 listed Nordic real estate companies’ size of corporate overhead, staff and property
costs are compared. Hufvudstaden, Fabege and Fastpartner stands out as the three most efficient companies based
on average rank over five variables, with most weight put on overhead and FTEs as this are considered most
relevant for synergies based on ARCP (2013) and Anderson et. al. (2011). Of the three top-performers,
Hufvudstaden and Fabege will not be used as reference cases as they are primarily operating in the central
Stockholm market and cover a smaller geographical area with higher values per property. Fastpartner is somewhat
smaller than Castellum and Norrporten but operates in the same segment as Castellum and Norrporten and also
have a comparable geographical exposure to Castellum. Assuming that both Castellum and Norrporten would
obtain the same overhead % of rental income and property costs per asset (investment properties) as Fastpartner,
the annual cost savings has been found to be SEKm 167.
Figure 66: Efficiency benchmarking table, 2015
Source: own contribution, based on annual reports (2016)
Company
Overhead
% Rental
Income Rank.
Overhead /
Assets Rank.
Property
costs /
Assets Rank.
FTEs /
Assets Rank.
FTEs /
Rental
income Rank.
Efficiency
rank
Atrium Ljungberg 2.45% 3 1.96 4 21.76 11 9.14 19 0.11 19 8
Balder 6.82% 15 2.70 8 11.20 2 9.45 20 0.24 24 16
D Carnegie & Co 7.95% 16 7.00 21 47.97 23 11.36 22 0.13 20 23
Diös 4.41% 8 3.17 10 29.45 21 10.16 21 0.14 22 20
Fabege 3.25% 4 1.61 2 14.08 6 3.50 5 0.07 12 2
FastPartner 2.38% 2 1.76 3 23.66 14 3.25 3 0.04 8 3
Heba 6.12% 14 2.61 5 16.24 8 4.22 10 0.10 18 7
Hemfosa 4.58% 11 3.79 14 26.16 17 2.00 1 0.02 5 5
Hufvudstaden 2.30% 1 1.22 1 16.29 9 3.31 4 0.06 11 1
Klövern 3.38% 5 2.63 6 27.18 19 5.77 15 0.07 14 12
Kungsleden 4.58% 10 3.86 15 27.99 20 3.53 6 0.04 7 9
NP3 8.58% 19 7.64 22 23.14 12 4.37 11 0.05 9 18
Platzer 5.94% 13 3.58 12 15.54 7 5.62 14 0.09 17 15
Sagax 4.42% 9 3.55 11 11.64 3 2.00 2 0.02 6 4
Victoria Park 8.04% 17 6.78 19 41.92 22 16.41 24 0.19 23 24
Wallenstam 12.14% 23 5.86 18 13.06 4 6.73 16 0.14 21 20
Entra 9.55% 22 5.68 17 13.86 5 5.27 12 0.09 16 17
Norwegian Property 9.23% 20 4.90 16 8.80 1 3.61 8 0.07 13 9
Olav Thon 4.78% 12 3.68 13 26.71 18 5.51 13 0.01 2 9
Citycon 12.45% 24 8.99 23 23.46 13 8.36 18 0.01 3 19
Sponda 9.45% 21 7.00 20 20.44 10 3.57 7 0.00 1 12
Technopolis 8.15% 18 9.75 24 49.38 24 13.42 23 0.01 4 22
Norrporten 4.18% 7 3.07 9 23.84 15 3.96 9 0.05 10 6
Castellum 3.43% 6 2.70 7 25.68 16 7.15 17 0.09 15 14
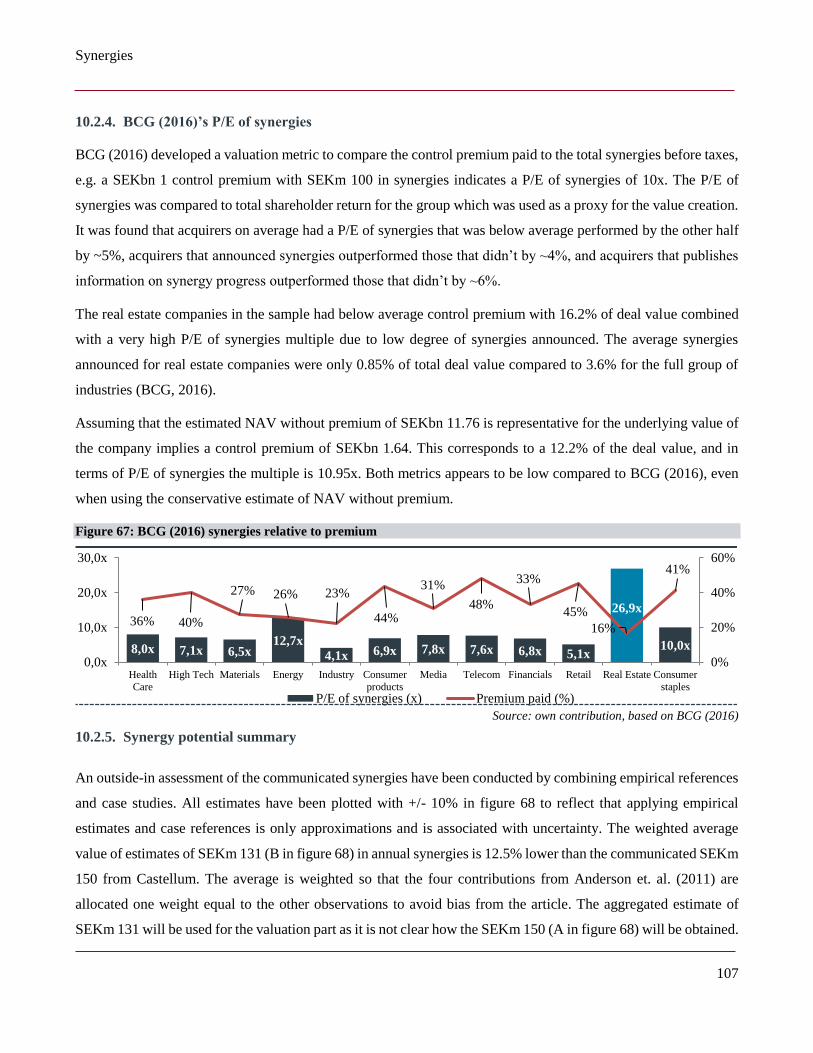
Synergies
107
10.2.4. BCG (2016)’s P/E of synergies
BCG (2016) developed a valuation metric to compare the control premium paid to the total synergies before taxes,
e.g. a SEKbn 1 control premium with SEKm 100 in synergies indicates a P/E of synergies of 10x. The P/E of
synergies was compared to total shareholder return for the group which was used as a proxy for the value creation.
It was found that acquirers on average had a P/E of synergies that was below average performed by the other half
by ~5%, acquirers that announced synergies outperformed those that didn’t by ~4%, and acquirers that publishes
information on synergy progress outperformed those that didn’t by ~6%.
The real estate companies in the sample had below average control premium with 16.2% of deal value combined
with a very high P/E of synergies multiple due to low degree of synergies announced. The average synergies
announced for real estate companies were only 0.85% of total deal value compared to 3.6% for the full group of
industries (BCG, 2016).
Assuming that the estimated NAV without premium of SEKbn 11.76 is representative for the underlying value of
the company implies a control premium of SEKbn 1.64. This corresponds to a 12.2% of the deal value, and in
terms of P/E of synergies the multiple is 10.95x. Both metrics appears to be low compared to BCG (2016), even
when using the conservative estimate of NAV without premium.
Figure 67: BCG (2016) synergies relative to premium
Source: own contribution, based on BCG (2016)
10.2.5. Synergy potential summary
An outside-in assessment of the communicated synergies have been conducted by combining empirical references
and case studies. All estimates have been plotted with +/- 10% in figure 68 to reflect that applying empirical
estimates and case references is only approximations and is associated with uncertainty. The weighted average
value of estimates of SEKm 131 (B in figure 68) in annual synergies is 12.5% lower than the communicated SEKm
150 from Castellum. The average is weighted so that the four contributions from Anderson et. al. (2011) are
allocated one weight equal to the other observations to avoid bias from the article. The aggregated estimate of
SEKm 131 will be used for the valuation part as it is not clear how the SEKm 150 (A in figure 68) will be obtained.
8,0x 7,1x 6,5x12,7x
4,1x 6,9x 7,8x 7,6x 6,8x 5,1x
26,9x
10,0x
36% 40%
27% 26% 23%
44%
31%
48%
33%
45%
16%
41%
0%
20%
40%
60%
0,0x
10,0x
20,0x
30,0x
Health
Care
High Tech Materials Energy Industry Consumer
products
Media Telecom Financials Retail Real Estate Consumer
staples
P/E of synergies (x) Premium paid (%)
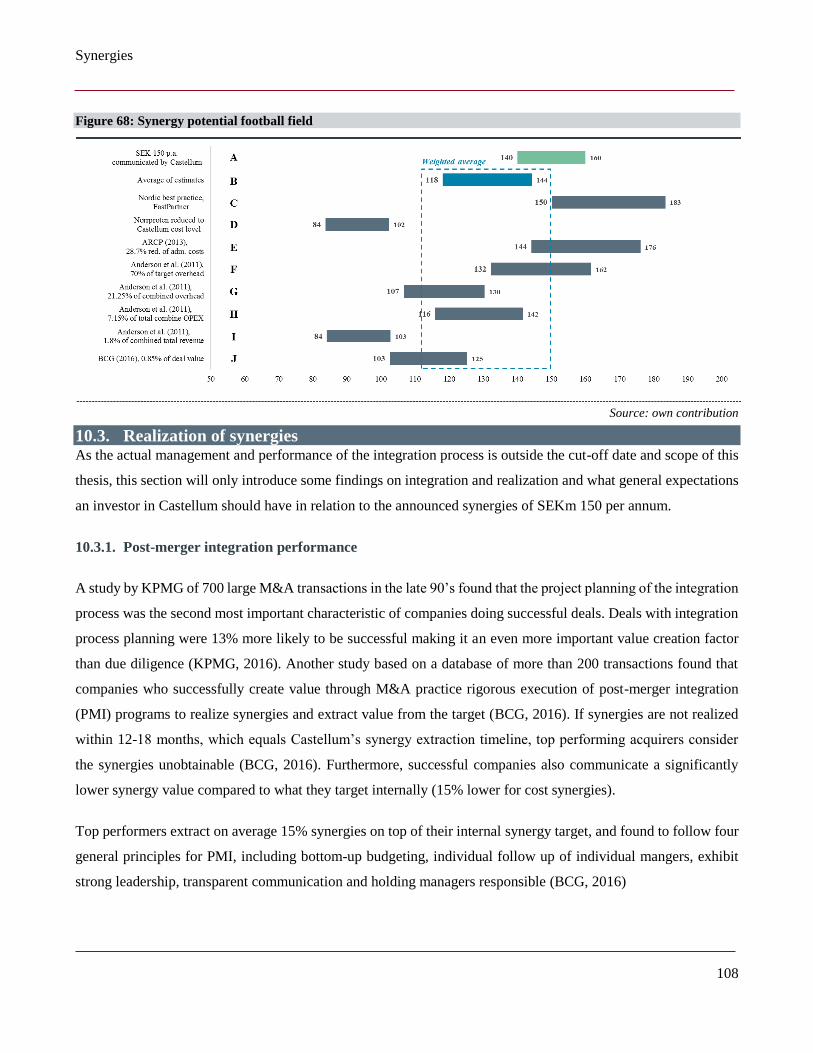
Synergies
108
Figure 68: Synergy potential football field
Source: own contribution
10.3. Realization of synergies As the actual management and performance of the integration process is outside the cut-off date and scope of this
thesis, this section will only introduce some findings on integration and realization and what general expectations
an investor in Castellum should have in relation to the announced synergies of SEKm 150 per annum.
10.3.1. Post-merger integration performance
A study by KPMG of 700 large M&A transactions in the late 90’s found that the project planning of the integration
process was the second most important characteristic of companies doing successful deals. Deals with integration
process planning were 13% more likely to be successful making it an even more important value creation factor
than due diligence (KPMG, 2016). Another study based on a database of more than 200 transactions found that
companies who successfully create value through M&A practice rigorous execution of post-merger integration
(PMI) programs to realize synergies and extract value from the target (BCG, 2016). If synergies are not realized
within 12-18 months, which equals Castellum’s synergy extraction timeline, top performing acquirers consider
the synergies unobtainable (BCG, 2016). Furthermore, successful companies also communicate a significantly
lower synergy value compared to what they target internally (15% lower for cost synergies).
Top performers extract on average 15% synergies on top of their internal synergy target, and found to follow four
general principles for PMI, including bottom-up budgeting, individual follow up of individual mangers, exhibit
strong leadership, transparent communication and holding managers responsible (BCG, 2016)
Synergies
109
BCG (2016) findings could indicate that if Castellum is conducting strategic synergy communication and PMI
management, the synergies communicated internally could be higher than the SEKm 150 synergies that have been
communicated. Further, the investors should consider deeming the synergies unobtainable if not obtained within
12-18 months and a strong and established PMO office should be established to further increase the probability of
a successful integration.
10.3.2. Cost of integration and negative synergies
Cost of integration
The 12-18 months communicated time to realization by Castellum equals BCG (2016) maximum time for synergy
realization before unobtainability. As such, time is of the essence in Castellum’s integration of Norrporten
assuming that the potential value can be considered lost after 18 months and it is therefore important that Castellum
formulate a strategic PMI plan as set forth above. Execution of a swift and efficient integration also comes at an
integration cost which appears not to be accounted for in Castellum’s communication of synergies.
A global survey of 200 senior corporate executives from large companies across a range of industries with recent
transaction experience found that the average cost of integration was 14% of the transaction value (Habeck et. al.,
2014). 66% of the respondents was satisfied with the level of their integration budgets, and only 14% of the
respondents said that they in retrospect wanted lower budget. The researchers isolated the group that was most
likely to want to decrease their budget, which was the transactions driven by acquisition of strategic fixed assets
(Habeck et. al., 2014), of which are also assumed to be the most relevant category for real estate.
By comparing the survey respondents, top priorities for time spend and budget allocation, which is operations,
sales & marketing and R&D illustrate that integration costs intuitively should be smaller for a real estate company.
R&D is not relevant for a real estate company, and operations, which on average is the top category, is likely less
complex than for the other industries covered in the analysis including industrials and consumer products. IT costs
are also an important integration priority that is relevant for Castellum, and is the fourth most mentioned priority
in the survey (Habeck et. al., 2014).
Due to the different nature of real estate companies, it is hard to find relevant observations for cost of integrations
that is applicable to real estate. The survey findings of total integration costs equal to 14% is assumed not relevant
for Castellum as it dwarfs the annual synergies, and this makes sense considered the relative less focus on, and
size of operations, sales & marketing and R&D for real estate companies. However, costs related to termination
of lease contracts, cost associated with reduction of staff, integration of IT, systems and accounting are
Synergies
110
unneglectable, but the amount is very hard to estimate in lieu of internal company data. For valuation, it is assumed
that the cost of integration is SEKm 150 including severance pay. The estimate is associated with high degree of
uncertainty, but leaving it out altogether due to lack of other estimates risks positive bias in the valuation.
Transaction costs
There are many costs related to preparation and execution of M&A transactions, including transaction costs related
to the financing pack. Costs that are incurred up to the transaction date i.e. April, 13th, should be considered sunk
costs that are incurred regardless of the outcome of Castellum’s offer (Johnson, 2002). Costs up to the transaction
includes costs in the full preparation phase including management time and internal resources spent, fees to
lawyers and advisors e.g. Castellum’s fee to corporate finance real estate advisor Pangea Property Partners. In an
interview with Ekonomi- och FinansNyheterna on April 14th, Henrik Saxborn stated that Castellum would incur
around 25 million SEK in transaction costs (EFN, 2016). He also stated that Castellum had been considering an
acquisition of Norrporten for 2.5 years (EFN, 2016), which could indicate that a considerable amount had already
been spent in terms of internal resources and time.
Negative synergies
Examples of negative synergies mentioned by respondents in a survey by PwC are negative effect from alignment
of accounting and practices, additional investments required in sales and marketing as well as generous employee
benefits (PwC, 2010). As both Castellum and Norrporten’s financial statements have a high degree of alignment
due to accounting standards by IFRS and EPRA, the alignment of accounting policies is expected to have limited
impact on the synergies. The rest of the highlighted negative synergies by PwC (2010) is hard to assess without
access to internal company data, and it is assumed to not affect the conclusion of the analysis.
10.3.3. Pitfalls
Potential pitfalls in M&A transactions
Based on a range of case studies, some of the common reasons to failed M&A transactions are deals with high
complexity that are hard for decision-makers to understand and thus makes decision-makers base some of their
choices on guesswork (Burner, 2005). Other reasons for failure includes small margin of error and cognitive bias
(Burner, 2005). Cognitive bias is the case when decision-makers are biased against evidence that is prevalent or
ignore evidence due to successful behavior in the past or aversion to walk away from a deal and cut losses when
investment are already made in preparation, time and effort (Burner, 2005). Cognitive bias due to successful
behavior in the past, or overconfidence, is the hubris effect in M&A as first introduced by Roll (1966).
Synergies
111
Another potential pitfall in M&A could be culture clash between the organizations as the larger culture typically
becomes dominant (Schein, 2009). Culture defines how employees get work done in an organization. However, in
a consolidation of two companies, employees become very aware of differences in practice to the other party and
protective of their own practices (Marks & Mirvis & Ashkenas, 2014). This occurs as both parties favor their own
culture (Schein, 2009). The risk of culture clashes is found to be most evident in integration of larger multinational
firms with more distinctive differences in culture as well as language (Schein, 2009).
Potential pitfalls for Castellum and Norrporten
Complexity appears not to be especially high as the companies have very comparable operations and the
transaction does not appear to be a tight margin situation, e.g. Castellum was able to maintain its target loan to
value ratio (EFN, 2016). However, Henrik Saxborn and his team considered Norrporten as a target for 2.5 years
(EFN, 2016), which could indicate that a lot of time, emotion and costs had been put in an acquisition of
Norrporten. According to economic theory, sunk costs incurred are irrelevant for future profits and must be
ignored, but psychology research suggests that human behavior violates the economic theory as incurred costs are
accounted for in future decision-making, also known as the sunk-cost fallacy or sunk cost bias (Haita-Falah, 2016).
In terms of culture, the similarity between the companies in terms of location and similar modus operandi, a culture
crash does not seem like a big threat to the transaction but the success of a combination is highly dependent on
how the management team and Henrik Saxborn communicates and shows leadership (Schein, 2009).
10.4. Synergy valuation When assessing synergies, it is important to understand at what time the synergies are expected to affect costs to
make sure the present value is accurately reflecting the future cost or revenue impact from the synergies
(Damodaran, 2005), as well as potential that are incurred in relation to integration and synergy realization. As
NAV valuation is based on the balance sheet and cap rate applied to NOI, general and administrative services do
not directly enter the NAV valuation and needs to be valued by alternative valuation methods below.
10.4.1. EV/EBITDA multiple
Damodaran (2005) recommends valuing the operational combined firm by reflecting effects from combination in
value drivers, including higher growth rate, higher margins, lower cost of deb etc. The value of the synergies would
then be the value of the combined firm less the value of the acquiring firm. However, this method only makes
sense for cash flow valuation methods, which does not comply with the NAV approach in this analysis. Instead,
for operational synergies a method using relative valuation can put a value on the synergies by looking at e.g. the
EBITDA impact of the synergies compared to the corresponding EBITDA multiple. Synergies that affect interest

Synergies
112
payments will affect the income statement below EBITDA, but financial synergies have been considered to not
have any significant relevance for this case. Thus, the EBITDA multiple approach will capture the full synergies
for valuation purposes. Applying Castellum’s EV/EBITDA of 21.3x 2015 EBITDA as of April 13th, 2016, the
implied value of the synergies on an enterprise value basis is SEKm 2,789 that is SEKm 2,639 net of assumed
integration costs.
𝑃𝑉𝑠𝑦𝑛𝑒𝑟𝑔𝑖𝑒𝑠 = 𝐸𝐵𝐼𝑇𝐷𝐴 𝑖𝑚𝑝𝑎𝑐𝑡 𝑜𝑓 𝑠𝑦𝑛𝑒𝑟𝑔𝑖𝑒𝑠 ∙ (𝐸𝑉
𝐸𝐵𝐼𝑇𝐷𝐴) − 𝑐𝑜𝑠𝑡 𝑜𝑓 𝑖𝑛𝑡𝑒𝑔𝑟𝑎𝑡𝑖𝑜𝑛 = 𝑆𝐸𝐾 131 𝑚𝑖𝑙𝑙𝑖𝑜𝑛 ∙ 21.3𝑥 − 150 = 𝑆𝐸𝐾 2,639
10.4.2. Present value of perpetuity
Assuming that the valuation was made on a cash flow model, the incremental value from synergies would
positively influence the free cash flow discounted with the relevant cost of capital. As the SEKm 131 in cost
reductions are assumed to continue indefinitely the present value calculation would in practice be made with a
perpetuity calculation (Rosenbaum & Pearl, 2012). The relevant cost of capital applied for property costs in the
NAV calculation for Norrporten is 5.67%, which is the weighted average of NOI cap rate of Norrporten. This
capitalization implies a synergy value of SEKm 2,310 net of integration costs. Present value of synergies has been
calculated with the assumption that SEKm 131 is realized in synergies in 18 months and that SEKm 131 is realized
in synergies every 12 months thereafter.
𝑃𝑉𝑠𝑦𝑛𝑒𝑟𝑔𝑖𝑒𝑠 = 𝑃𝑉 𝑐𝑎𝑠ℎ 𝑓𝑙𝑜𝑤 𝑖𝑚𝑝𝑎𝑐𝑡 − 𝑖𝑛𝑡𝑒𝑔𝑟𝑎𝑡𝑖𝑜𝑛 𝑐𝑜𝑠𝑡𝑠 =131
1 + 𝑐𝑎𝑝. 𝑟𝑎𝑡𝑒
1812
+
𝑆𝐸𝐾 131𝑐𝑎𝑝. 𝑟𝑎𝑡𝑒
(1 + 𝑐𝑎𝑝. 𝑟𝑎𝑡𝑒)1812
− 150
Figure 69 exhibits the result based on different capitalization rates. The most relevant cap rate has been assumed
to be 5.67% under the assumption that this is the weighted average cap rate for Norrporten and that the cost
reductions is mainly related to Norrporten.
Figure 69: Capitalized synergy value
Source: own contribution
SEK millions
5.0% 5.3% 5.5% 5.7% 6.0% 6.3% 6.5% 6.8%
PV of synergies 2,620 2,495 2,382 2,310 2,183 2,096 2,015 1,941
Capitalisation rates
Synergies
113
10.4.3. EV / FFO
EV/FFO is a similar valuation method to the EV/EBITDA approach, assuming all synergies are reflected at FFO
level. However, this method is based on enterprise value and not price as no assumption regarding capital structure
relevant for synergies are made. The calculation yields an estimate of SEKm 3,799 net of integration costs.
𝑃𝑉𝑠𝑦𝑛𝑒𝑟𝑔𝑖𝑒𝑠 = 𝑆𝐸𝐾 131 𝑚𝑖𝑙𝑙𝑖𝑜𝑛 ∙ 29.77𝑥 − 150 = 𝑆𝐸𝐾 131 𝑚𝑖𝑙𝑙𝑖𝑜𝑛 ∙ 29.77𝑥 − 150 = 𝑆𝐸𝐾 3,750
10.4.4. Synergies as a cap for control premium
The value of controlling a badly managed company that operates with excess capacity is in general higher than for
a very well-run company, as the new owner would add relatively less value for the latter (Damodaran, 2005). The
premium can be compared to the discounted value of potential synergies to yield a measure that describe the size
of the synergies relative to the deal value and how much of the synergy value the buyer are sharing with the seller
(BCG, 2013). The share of the value the seller receives often depends on how uniquely or easily replaceable the
contribution from the target is, and the degree of competition in the auction (Damodaran, 2005). It is crucial to
track the share of synergies shared with the seller, as if control premium is as big as or bigger than present value
of synergies, the deal would destroy value for the acquirer (BCG, 2013). Over the last years, the seller’s share of
synergies has increased and had a medium share of 31% in 2013 based on 365 major transactions, with large
deviations across industries. The largest observed share was found for globally operating industries and the lowest
share for locally operating industries (BCG, 2013). The sellers share is not related to size or level of profitability
of the target, but is positively related with the profitability level of the acquirer (BCG, 2013), which could indicate
that acquirers with best practice operational know-how are expected to extract more value from target and hence
has a larger synergy anticipation from seller. However, communicated synergies are not always reliable as
communicated synergies are set below the management internal estimate to get a positive market reaction on over
performance. For example, 94% of merger announcement with synergy announcement do not announce revenue
synergies (BCG, 2013).
The estimated market value of equity of SEKm 11,999 represent the underlying equity value of Norrporten and
therefore the control premium implicitly represents SEKm 1,399 of the SEKm 13,400 consideration paid by
Castellum for Norrporten. This indicates that Castellum paid Norrporten SEKm 1,399 for synergies that is worth
an estimated SEKm 2,639 based on the median of the three estimates. This result implies that Castellum have
shared 53% of the value of synergies with Norrporten. Based on this result, the share of synergies that Norrporten
got is above the observed market average, especially for locally operating companies.
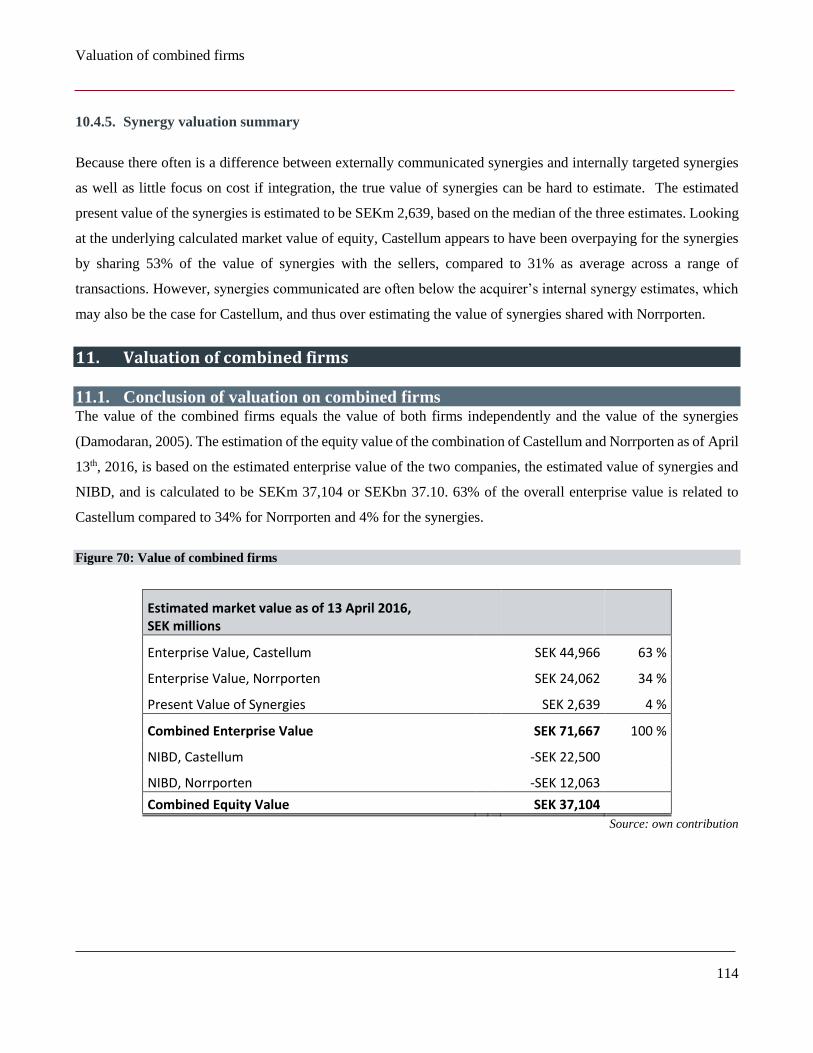
Valuation of combined firms
114
10.4.5. Synergy valuation summary
Because there often is a difference between externally communicated synergies and internally targeted synergies
as well as little focus on cost if integration, the true value of synergies can be hard to estimate. The estimated
present value of the synergies is estimated to be SEKm 2,639, based on the median of the three estimates. Looking
at the underlying calculated market value of equity, Castellum appears to have been overpaying for the synergies
by sharing 53% of the value of synergies with the sellers, compared to 31% as average across a range of
transactions. However, synergies communicated are often below the acquirer’s internal synergy estimates, which
may also be the case for Castellum, and thus over estimating the value of synergies shared with Norrporten.
11. Valuation of combined firms
11.1. Conclusion of valuation on combined firms The value of the combined firms equals the value of both firms independently and the value of the synergies
(Damodaran, 2005). The estimation of the equity value of the combination of Castellum and Norrporten as of April
13th, 2016, is based on the estimated enterprise value of the two companies, the estimated value of synergies and
NIBD, and is calculated to be SEKm 37,104 or SEKbn 37.10. 63% of the overall enterprise value is related to
Castellum compared to 34% for Norrporten and 4% for the synergies.
Figure 70: Value of combined firms
Estimated market value as of 13 April 2016, SEK millions
Enterprise Value, Castellum SEK 44,966 63 %
Enterprise Value, Norrporten SEK 24,062 34 %
Present Value of Synergies SEK 2,639 4 %
Combined Enterprise Value SEK 71,667 100 %
NIBD, Castellum -SEK 22,500
NIBD, Norrporten -SEK 12,063
Combined Equity Value SEK 37,104
Source: own contribution
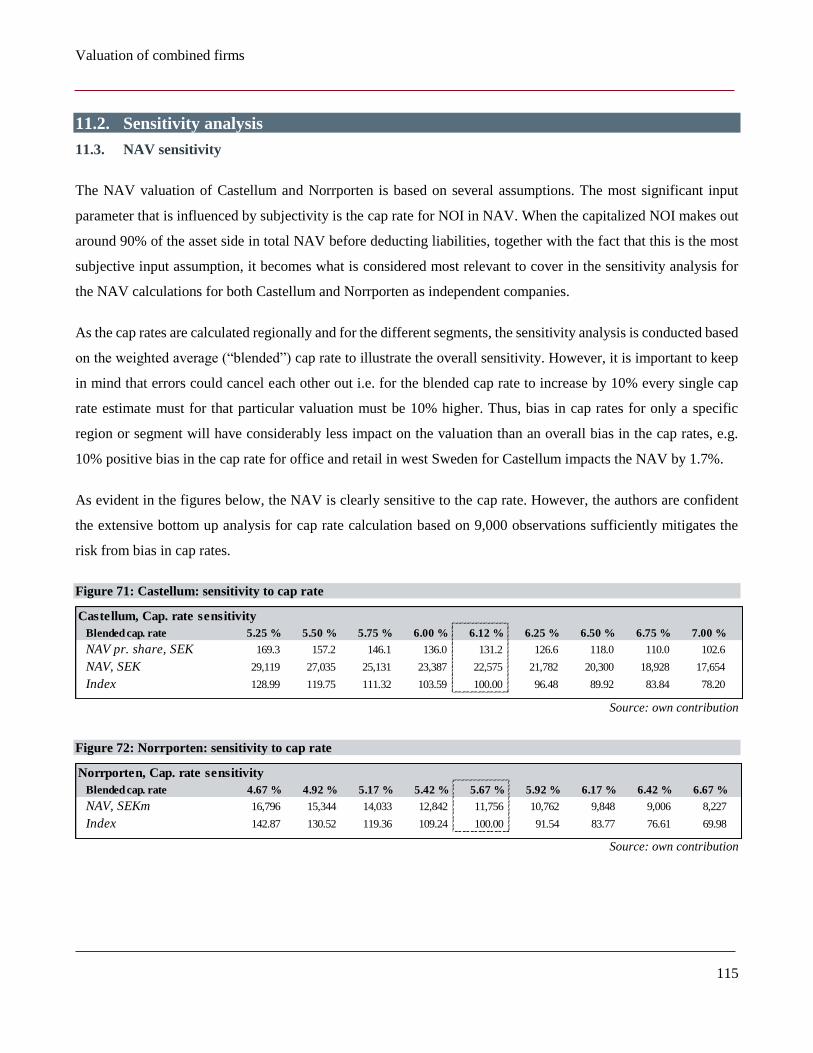
Valuation of combined firms
115
11.2. Sensitivity analysis
11.3. NAV sensitivity
The NAV valuation of Castellum and Norrporten is based on several assumptions. The most significant input
parameter that is influenced by subjectivity is the cap rate for NOI in NAV. When the capitalized NOI makes out
around 90% of the asset side in total NAV before deducting liabilities, together with the fact that this is the most
subjective input assumption, it becomes what is considered most relevant to cover in the sensitivity analysis for
the NAV calculations for both Castellum and Norrporten as independent companies.
As the cap rates are calculated regionally and for the different segments, the sensitivity analysis is conducted based
on the weighted average (“blended”) cap rate to illustrate the overall sensitivity. However, it is important to keep
in mind that errors could cancel each other out i.e. for the blended cap rate to increase by 10% every single cap
rate estimate must for that particular valuation must be 10% higher. Thus, bias in cap rates for only a specific
region or segment will have considerably less impact on the valuation than an overall bias in the cap rates, e.g.
10% positive bias in the cap rate for office and retail in west Sweden for Castellum impacts the NAV by 1.7%.
As evident in the figures below, the NAV is clearly sensitive to the cap rate. However, the authors are confident
the extensive bottom up analysis for cap rate calculation based on 9,000 observations sufficiently mitigates the
risk from bias in cap rates.
Figure 71: Castellum: sensitivity to cap rate
Source: own contribution
Figure 72: Norrporten: sensitivity to cap rate
Source: own contribution
Castellum, Cap. rate sensitivity
Blended cap. rate 5.25 % 5.50 % 5.75 % 6.00 % 6.12 % 6.25 % 6.50 % 6.75 % 7.00 %
NAV pr. share, SEK 169.3 157.2 146.1 136.0 131.2 126.6 118.0 110.0 102.6 #
NAV, SEK 29,119 27,035 25,131 23,387 22,575 21,782 20,300 18,928 17,654 #
Index 128.99 119.75 111.32 103.59 100.00 96.48 89.92 83.84 78.20 #
Norrporten, Cap. rate sensitivity
Blended cap. rate 4.67 % 4.92 % 5.17 % 5.42 % 5.67 % 5.92 % 6.17 % 6.42 % 6.67 %
NAV, SEKm 16,796 15,344 14,033 12,842 11,756 10,762 9,848 9,006 8,227
Index 142.87 130.52 119.36 109.24 100.00 91.54 83.77 76.61 69.98
Conclusion
116
12. Conclusion
The outline of the thesis was to investigate Castellum’s acquisition of Norrporten, which was announced on April
13th, 2016. Castellum announced in connection with the acquisition that they had acquired Norrporten at the fair
value of the property portfolio, in addition to targeting synergies of SEKm 150 p.a. to be realized within 12-18
months. The thesis analyses how the price paid by Castellum compares to the estimated fair value of Norrporten,
as well as the rational for and estimated value impact from synergies.
To set the stage for the analysis, the different buyers in the real estate sector was introduced with Castellum and
Norrporten defined as Real Estate Operating Company (REOC). Furthermore, the supply chain and value drivers
are analyzed to give an introduction to how REOCs create profits and what the key fundamental market value are
for a REOC. Due to the structure of REOCs with a long-term ownership perspective and investment properties
being depreciating assets that require recurring investment to stay relevant for the current and future demand of
the society, why the presented value chain can be seen as a property life-cycle for a REOC to not be threatened by
obsolescence.
For the authors to be able to accurately value both Castellum and Norrporten, as well as identify possible internal
drivers for consolidation, a thorough strategic analysis was carried out with emphasis on the external environment
on a macro level as well as the industry profile. The macro level analysis concluded that main factors impacting
the future for real estate investors are demographic changes together with technological advancements leading to
society changing at a faster pace. Focus on environmental friendliness is driven by governmental initiatives and
also supported by the younger generations, which will intensify the focus on high-quality properties with up to
date technical standards going forward. Nevertheless, the industry profile suggests that there are limited benefits
in revenue from consolidation as no pricing power was identified.
The internal analysis concluded that a consolidation could make sense from a strategic point of view with
complementing internal capabilities, especially due to Castellum’s track record of investing in growth areas, and
Norrporten’s ability to retain a large and important customer network with what is perceived as secured income
tenants, also supported by their best in class occupancy rates. Furthermore, the financial analysis proved that
Castellum has been a long-term top performer on profitability and efficiency from operations with a low risk
capital structure, whereas Norrporten exhibited room for improvements in operational efficiency due to high
overhead costs. However, Norrporten has been able to demonstrate a position with overall low financial risk. The
combined balance should allow Castellum to maintain a low risk balance sheet following the acquisition, while
cost reductions from improving Norrporten’s operational efficiency poses an opportunity supporting the synergy
angle of the acquisition.
Conclusion
117
The NAV model with a subsequent discussion on premiums makes out the cornerstone of the valuation, as this
method had the broadest support from practitioners and literature in setting the starting point for a valuation dealing
with the issue related to parallelism of asset markets for REITs and REOCs. In addition, relative valuation methods
were applied to sense check and support the NAV valuation. The estimated equity value of Castellum was found
to be SEK 130.6 per share as of April 13th, 2016, identical to the observed stock price, but indicating a 3% discount
to the share price adjusted for the reaction related to rumors regarding the acquisition of Norrporten. Norrporten’s
estimated total equity value was estimated to SEKm 11,999, corresponding to 10.4% or SEKm 1,400 below the
consideration of SEKm 13,400 paid by Castellum in the transaction
The authors outside-in assessment of the synergy rationale and what could be expected for investors was
thoroughly discussed in relation to the SEKm 150 p.a. communicated by Castellum. A study of empirical research,
case studies of previous M&A activity with synergies across several sectors including real estate, coupled with the
analysis of Castellum and Norrporten formed a synergy estimate of SEKm 131 p.a. When capitalizing estimated
synergies, the calculated present value of the synergies was found to be SEKm 2,369 including integration costs
of SEKm 150. This result implies that based on the stand-alone equity valuation for Norrporten, the acquirer paid
SEKm 1,400 for synergies worth SEKm 2,369 i.e. 51% of the value of synergies was shared with the seller. This
implies that the transaction is expected to be accretive for Castellum, however, the share of synergies that was
shared with the sellers is high compared to empirical research, especially for a real estate company that is only
operating locally.
Timing is of the essence when realizing synergies, and the completion of the post-merger integration within 12-
18 months is essential for the ability to obtain the synergies. There are also negative synergies and potential pitfalls
related to acquisitions that is hard to quantify in an outside-in analysis. The authors believe the high degree of
synergies shared with the seller can be due to cognitive bias as hubris or sunk cost fallacy, as Castellum had
considered an acquisition of Norrporten for 2.5 years prior to the announced acquisition and had thus invested
time and money into completing an acquisition of Norrporten.
On a longer term, the baseline expectation for shareholders in Castellum based on empirical research is -10%
underperformance for the share over the next five years, and that financing with a rights issue would typically lead
to a further negative stock price reaction on the short run due to signaling. However, it is estimated that the
acquisition is accretive for Castellum with SEKm 969 and the transaction should thus not destroy value for
shareholders, given that the expected synergies are realized in due course.
The thesis in perspective
118
13. The thesis in perspective
The authors were faced with complexity in valuing the companies due to the presence of parallel asset markets i.e.
the stock market and the underlying real estate market. With NAV as the cornerstone valuation method, the cap
rates applied to NOI are specifically calculated for the underlying real estate assets and the cost of capital is
therefore independent from the operational entity owning the assets. The thesis also analyzed synergies relevant
for the transaction, which are considered specific for the buyer/owner and not the underlying real estate assets, and
therefore the authors question how these two methods are paired most optimally as they build on two different sets
of assumptions and capital costs. No research was found on this issue, and therefore it was handled from a practical
point of view by applying a range of methods in synergy valuation to validate the capitalized synergy estimate.
After study of a large selection of research papers by professionals, the authors were surprised by how little
emphasis the professional equity research analysts have put on the communicated synergies, both in reports and
in the analyst conference call following the transaction. The authors believe the synergies are highly relevant given
their impact i.e. synergies were found to increase the combined equity value by 7.7% and represents potentially
SEKm 150 dividend p.a. One hypothesis could be that equity research analysts are putting much weight on the
NAV model, and that this may lead the valuation focus to underlying asset values and away from potential cash
flow effects related to operational improvements and synergies. A qualitative study of valuation methods among
real estate analysts and investment professionals would be an interesting extension of this hypothesis.
The authors had the opportunity to follow the performance of the consolidated company for over a year from the
announcement on April 13th 2016. The SEKbn 4.0 in asset sale following the acquisition as mentioned in the
analyst call was delimited by this thesis, and Castellum eventually ended up with asset sales of SEKbn 7.5 between
Q3 2016 and Q1 2017 supported by a strong transaction market. The sales represented 10% of the book value of
investment properties as of Q1 2017. The extensive disposals of assets highlight the relevance of asking to what
extent communicated synergies was calculated assuming that the entire Norrporten portfolio is kept without any
divestures, or if the synergies should be expected to be reduced by 29%, corresponding to the reduction in
investment properties gained through the acquisition. This reduction would impact the conclusion of the thesis.
Since the acquisition announcement, Castellum’s share price has returned 17.4% and thus underperformed the
Stockholm OMX 30 Index by 1.7%, but outperformed the peer group significantly. The SEKbn 7.5 disposal of
investment properties was mainly related to the entire portfolio in Northern Sweden, as well as some assets in the
Öresund region. Based on the analysis of the external environment, the Northern Sweden portfolio represented
significant risk compared to the overall portfolio and could be a driver of recent stock price movements.
Literature list
119
14. Literature list Agrawa, A., & Jaffe, J., & Mandelker, G., (1992) The Post-Merger Performance Of Acquiring Firms: A Re-
Examination Of An Anomaly. Journal of Finance, September 1992, Vol.47(4) pp. 1605-1621
Anderson, R., & Medla, H., & Rottke, N., & Schiereck, D. (2011). Why Do REIT Mergers Take Place? Evidence from
Synergestic Forecasts. Dr. P. Phillips School of Real Estate, UCF College of Business Administration. Working Paper
1109 Retrieved on March 18. 2017 from: http://realestateucf.com/wp-content/uploads/2014/08/realestate-workingpapers-
2011-09.pdf
AP2 (2016). The Second and Sixth Swedish National Pension Fund sell Norrporten to Castellum. Retrieved March 03.
2017 from: http://www.ap2.se/en/news-reports/news/2016/the-second-and-sixth-swedish-national-pension-fund-sell-
norrporten-to-castellum/
AP2 (n.d.). A Unique Pension System. Retrieved on March 03. 2017 from: http://www.ap2.se/en/about-ap2/our-
mission/a-unique-pension-system/history/
Arcadis (2016). 2016 Trends in the Workplace. Arcadis Research report published in 2016. Retrieved on April 20. 2017
from: https://www.arcadis.com/media/2/3/6/%7B236A8585-8DF7-4FD2-B6C1-
8EBC5A2D6906%7DWorkplace%20Trends%20for%202016.pdf
Asquith, P., & Burner, R. F., & Mullins Jr., D. W., (1983). The gains to bidding firms from merger Journal of
Financial Economics, 1983, Vol. 11(1), pp. 121-139
Atrium Ljungberg (2016). Annual Report 2015.
AXA IM (2015). Press Release - Comments on the impacts of COP 21 on investors. Retrieved March 16, 2017 from:
https://www.axa-im.com/en/news-archive/-/news/axa-im-comments-on-the-impact-of-cop21-on-investo-
1/maximized/2wCz
Balder (2016). Annual Report 2015.
Baltes, P. (1997). On the Incomplete Architecture of Human Ontogeny: Selection, Optimization, and Compensation as
Foundation of Development Theory. American Psychologist, April 1997, Vol.52(5) pp. 366-380
Barney, J. & Hesterly, W. (2006). Strategic Management and Competitive Advantage: Concepts, 1st edition. Pearson
Prentice Hall
Barney, Jay. (1991). Firm Resources and Sustained Competitive Advantage. Journal of Management, 1991, Vol.17(1)
pp. 99-120
Baum, A., & McElhinney, A. (1997). The Causes and Effects of Depreciation on Office Buildings: a Ten Year Update.
Department of Land Management and Development, University of Reading. Academic Paper Retrieved on March 18.
2017 from: http://www.reading.ac.uk/LM/LM/fulltxt/0700.pdf
BBC (2012, 13. June). Timeline: The unfolding Eurozone crisis. Retrieved March 16. 2017 from:
http://www.bbc.com/news/business-13856580
BCG (2013). Bcg.perspectives - Divide and Conquer. How Successful M&A Deals Split the Synergies. Boston
Consulting Group and Technische Universität Munchen. Retrieved from bcg.perspectives portal on March 13. 2017
BCG (2016). Bcg.perspectives - The real deal on M&A, Synergies, and value. Boston Consulting Group. Retrieved from
bcg.perspectives portal on March 13. 2017
Bergström, C., & Englund, P., & Thorell, P. (2003) Securum and the Way out of the Swedish Banking Crisis.
Summary of a report commissioned by SNS. Center for Business and Policy Studies. Retrieved April 04. 2017 from:
https://www.sns.se/wp-content/uploads/2016/11/securum_eng.pdf
Bers, M., & Springer, T. (1997) Economics of Scale for Real Estate Investment Trusts. Journal of Real Estate Research,
1997, Vol.14(3) pp. 275-290
Literature list
120
BIWS (n.d.). REIT NAV (Net Asset Value) Model Overview. Retrieved March 01. 2017 from:
https://breakingintowallstreet.com/biws/reit-nav-model-net-asset-value-model/
Blanchard, Olivier (2017). Macroeconomics 7th edition. Pearson Education
Bradley, M., & Desai, A., & Kim, E. H. (1988). Synergistic gains from corporate acquisitions and their division
between the stockholders of target and acquiring firms. Journal of Financial Economics, 1988, Vol 21(1), pp. 3-40
Brealey, R. A., & Myers, S. C., & Allien, F. (2013). Principles of Corporate Finance, 11th Global Edition.
McGrawHill Education
Briddell, E. T., & Supple, A. (2011) Public and Private Real Estaet: Room for Both in a Diversified Portfolio. Urdang.
Retrieved 7 April 2017 from:
https://www.reit.com/sites/default/files/portals/0/PDF/PublicPrivateRealEstateURDANG07262011.pdf
Brueggeman, W. B., & Fisher, J. F. (2005). Real Estate Finance and Investments 12th edition. McGrawHill Education
Burner, Robert F., (2005). Deals from Hell: M&A Lessons That Rise Above the Ashes. John Wiley & Sons
Campbell, R., & Giambona, E., & Sirmans, C.F. (2009). The Long-Horizon performance of REIT mergers. The
Journal of Real Estate Finance and Economics, Feb. 2009, Vol. 38(2), pp.105-114
Capgemini (2014). Impact of Regulations on Bank Lending. Capgemini. Retrieved from Capgemini Resource Portal on
March 24. 2017
Carnegie (n.d.). Castellum - Acquisition of Norrporten AB By Castellum AB. Carnegie Corporate Finance. Retrieved on
April 05. 2017 from: https://www.carnegie.se/corporate-finance/Nyheter/castellum/
Castellum (1998). Annual Report 1997.
Castellum (1999). Annual Report 1998.
Castellum (2000). Annual Report 1999.
Castellum (2001). Annual Report 2000.
Castellum (2002). Annual Report 2001.
Castellum (2003). Annual Report 2002.
Castellum (2004). Annual Report 2003.
Castellum (2005). Annual Report 2004.
Castellum (2006). Annual Report 2005.
Castellum (2007). Annual Report 2006.
Castellum (2008). Annual Report 2007.
Castellum (2009). Annual Report 2008.
Castellum (2010). Annual Report 2009.
Castellum (2011). Annual Report 2010.
Castellum (2012). Annual Report 2011.
Castellum (2013). Annual Report 2012.
Castellum (2014). Annual Report 2013.
Castellum (2015). Annual Report 2014.
Castellum (2016a). Annual Report 2015.
Castellum (2016b). First Quarter, Quarterly Report 2016.
Literature list
121
Castellum (2016c). Acquisition of Norrporten AB, Investor Presentation.
Castellum (2016d). Castellum gainsa access to Norrporten and resolves on issue in kind and transfer of repurchased
shares. Castellum Investor Relations. Retrieved 01 April from:
https://vp244.alertir.com/afw/files/press/castellum/201606150069-1.pdf
Castellum (2016e). Castellum rights issue prospect May 2016.
Castellum (2016f). Castellum historical bond issues
Catella (2016). The Nordics - increasing demand from international investors. Catella. Retrieved from Catella
Newsroom on March 13. 2017
Catella (2017). Innovation, Start-ups and Real Estate Locations in the 21st Century: New technologies and concepts in
the European competition of real estate locations. Catella. Retrieved from Catella Newsroom on March 13. 2017
CBRE (2011). Challenges in disposing of public sector real estate. CBRE Group. Retrieved February 21. 2017 from:
http://www.cbre.dk/dk_en/research/research_content/research_right/PUBLIC_SECTOR_SALES_MAR_2011.pdf
CBRE (2015a). Corporate asset disposals: strong appetite masked by growth in wider investment market. Viewpoint,
CBRE Group. Retrieved from CBRE Research and Report Portal on March 01. 2017
CBRE (2015b). The technology sector's effect on office markets: The example of Berlin. Viewpoint, CBRE Group.
Retrieved from CBRE Research and Report Portal on March 13. 2017
CBRE (2016a). The Wider European Impact of the UK's Vote to Leave the EU. Viewpoint, CBRE Group. Retrieved
from CBRE Research and Report Portal on March 03. 2017
CBRE (2016b). The effect of foreign investments on prime office yields in the Nordics. Viewpoint, CBRE Group.
Retrieved from CBRE Research and Report Portal on February 27. 2017
CBRE (2017a). Sweden Logistics Market. CBRE Group. Retrieved from CBRE Research and Report Portal on March
07. 2017
CBRE (2017b). Always on: Real estate response for a rapidly changing world. CBRE Group. Retrieved from CBRE
Research and Report Portal on January 15. 2017
CBRE GI (2016). What Brexit Means for UK Property. CBRE Group. Retrieved March 01. 2017 from:
http://www.cbreglobalinvestors.com/research/publications/Pages/specialreports.aspx
Citycon (2016). Annual Report 2015.
Clayton, J. & Mackinnon, G. H. (2000). Explaining the Discount to NAV in REIT pricing: Noise or Information?.
Published online, accessed through SSRN March 06. 2017: https://ssrn.com/abstract=258268 or
http://dx.doi.org/10.2139/ssrn.258268
Colliers (2016). The Activity-based workplace Design Trend. Retrieved March 16, 2017 from:
http://www.colliers.com/en-us/meetourexperts/activitybasedworkplacedesign
Corem (2016). Annual Report 2015.
Cushman & Wakefield (2013). Global Trends in Real Estate Outsourcing. Cushman & Wakefield. Retrieved May 03.
2017 from: http://annualreview.cushwake.com/downloads/03_global_trends_RE.pdf
D. Carnegie & Co. (2016). Annual Report 2015.
Damodaran, Aswath (2005). The Value of Synergy. Stern School of Business.
Damodaran, Aswath (2012). Investment Valuation 3rd edition. John Wiley & Sons.
Deloitte (2015). Commercial real estate redefined: How the nexus of technology advancements and consumer behavior
will disrupt the industry. Deloitte Center for Financial Services. Retrieved May 01. 2017 from:
https://www2.deloitte.com/content/dam/Deloitte/us/Documents/Real%20Estate/us-cre-outlook-2016.pdf
Literature list
122
Dimson, E., & Marsh, P., (1986). Event Study Methodologies and The size effect: The case of UK press
recommendations. Journal of Financial Economics, 1986, Vol. 17(1), pp. 113-142
Diös (2016). Annual Report 2015.
DLA Piper (2015). Real Estate Investment in Sweden - The Legal Perspective. DLA Piper. Legal paper published in
2015, retrieved March 09. 2017 from: http://www.dlapiperrealworld.com/export/sites/real-
world/brochures/downloads/Sweden-Investor-Guide.pdf
Duval & Stachenfeld (2016). Porter's Five Forces in the Real Estate World. Duval & Stachenfeld. Retrieved from Duval
& Stachenfeld archive on March 24. 2017
Duval & Stachenfeld (2016). The Real Estate Philosopher: Porter's Five Forces in the Real Estate World. Retrieved
March 17. 2017 from: http://www.dsllp.com/content/The%20Real%20Estate%20Philosopher%20-
%20Porter%27s%20Five%20Forces%20in%20the%20Real%20Estate%20World.pdf
Edberg, Johan. (2016). Time for a comeback in 2016. Pareto Securities Equtiy Research report published 22. January
2016 and accessed throguh Thomson One Banker portal at Copenhagen Busienss School
Ekonomi- och FinansNyhetarna. [EFN] (2016, April 14). Sveriges Google och framtidens H&M. Retrieved February
10. 2017 from: https://www.youtube.com/watch?v=w7xpvmDg1QY
Entra (2016). Annual Report 2015.
EPRA (2015a). EPRA Research - Loan to Value Monitor, December 2015. Market report. Retrieved March 10. 2017
from: http://www.epra.com/media/EPRA_Monthly_LTV_Monitor_December_2015_1449586994128.pdf
EPRA. (2016). Best Practice Recommendations Guidelines, November 2016. European Public Real Estate Association
Best Practice Documents. Retrieved May 08. 2017 from: http://www.epra.com/regulation-and-reporting/bpr/
Evans, D., & Crawford, S. (n.d.) REITs in Europe. NA REIT. Retrieved April 07. 2017 from:
https://www.reit.com/advocacy/policy/cross-border-issues/cross-border-issues-archive/reits-europe
Fabege (2016). Annual Report 2015.
Factset (2017a, March 15). Castellum Share Price. Retrieved Marc 15, from Factset
Factset (2017b, March 15). Hemfosa Share Price. Retrieved Marc 15, from Factset
Factset (2017c, March 15). Klövern Share Price. Retrieved Marc 15, from Factset
Factset (2017d, March 15). Kungsleden Share Price. Retrieved Marc 15, from Factset
Factset (2017e, March 15). Stockholm OMX 30 Index. Retrieved Marc 15, from Factset
Factset (2017f, March 15). Peer group EV/EBITDA. Retrieved Marc 15, from Factset
Factset (2017g, March 15). Peer group Price/FFO. Retrieved Marc 15, from Factset
Fastpartner (2016). Annual Report 2015.
Fastpartner (2016). Annual Report 2015.
Franks, J., & Harris, R., & Titman, S. (1991). The postmerger share-price performance of acquiring firms. Journal of
Financial Economics, 1991, Vol.29(1), pp.81-96
Freybote, J., & Lihong, Q., (2015). The Impact of asset allocation on REIT merger decisions. Journal of Property
Research, Jan. 2015, p. 1-20
Geltner, D., & Miller, N. (2007). Commercial Real Estate Analysis & Investments 2nd edition. Thomson Higher
Education
Gensler (2016). The Future of Workplace Design Forecast 2015. Retrieved March 16, 2017 from:
https://www.gensler.com/design-forecast-2015-the-future-of-workplace
Literature list
123
Green Street Advisors (2014). REIT Valuation The NAV-based Pricing Model. Retrieved from: https://s3-us-west-
2.amazonaws.com/gstqa-us-west/public_files/GreenStreetPricingModelReport.pdf
Green Street Advisors (n.d.). Average Premium to NAV. Retrieved April 01. 2017 from:
https://www.greenstreetadvisors.com/insights/avgpremnav
Haita-Falah, Corina. (2016). Sunk-cost fallacy and cognitive ability in individual decision-making. Journal of
Economic Psychology, 2017, Vol.58, pp. 44-59
Harzheim, Thomas (2014). IAS 12 Income taxes - recognition of deferred tax for a single asset in a corporate wrapper.
Staff note published ahead of IFRS Intepretation committe meeting on IAS 12 published july 2014. Retrieved 9. march
2017 from: http://www.ifrs.org/Meetings/MeetingDocs/Interpretations%20Committee/2014/March/AP02A%20-
%20Draft%20amendments%20to%20IAS%2012%20-
%20Recognition%20of%20DTAs%20for%20unrealised%20losses.pdf
Heimstaden (2016). Annual Report 2015.
Hemfosa (2012). Annual Report 2011.
Hemfosa (2013). Annual Report 2012.
Hemfosa (2014). Annual Report 2013.
Hemfosa (2015). Annual Report 2014.
Hemfosa (2016). Annual Report 2015.
Higson, C., & Elliott, J., (1998). Post-takeover returns: The UK evidence. Journal of Empirical Finance, 1998, Vol. 5,
pp.27-46
Hufvudstaden (2016). Annual Report 2015.
JLL (2013). E-commerce boom triggers transformation in retail logistics. Jones Lang LaSalle. Retrieved from JLL
Research portal on 21 January 2017
JLL (2014). The new geography of office demand (vol. 2); Business Parks - rising to the challenge. Jones Lang LaSalle.
Retrieved from JLL Research portal on 21 January 2017
JLL (2016). Nordic Cities Report, Spring 2016. Jones Lang LaSalle. Retrieved from JLL Research portal on April 2.
2017
Johnson, Howard E. (2012). Placing a Value on Synergies and Strategic Advantage. Published by Cambell Valuation
Partners Ltd., Canada. Retrieved on 7th of April from: http://studylib.net/doc/8412861/placing-value-on-synergies---
veracap-manda-international
Keller & Williams (2012). Does Brand matter to the Real Estate Customer. Keller Williams Realty. Retrieved April 7.
from: http://www.ovi.at/de/verband/news/2014/Objekte/Does-Brand-Matter-WP.pdf
Kempen & Co. (2016). European Real Estate - Send in the bankers!. Real Time 79, Kempen & Co Merchant Bank.
Market report published 23. May 2016, received in hardcopy by editors 29. July 2016
Klövern (2012). Annual Report 2011.
Klövern (2013). Annual Report 2012.
Klövern (2014). Annual Report 2013.
Klövern (2015). Annual Report 2014.
Klövern (2016). Annual Report 2015.
KPMG (1999). Unlocking shareholder value: The keys to success. Retrieved 06. april 2017 from
http://people.stern.nyu.edu/adamodar/pdfiles/eqnotes/KPMGM&A.pdf
Kungsleden (2007). Annual Report 2006.
Literature list
124
Kungsleden (2008). Annual Report 2007.
Kungsleden (2009). Annual Report 2008.
Kungsleden (2010). Annual Report 2009.
Kungsleden (2011). Annual Report 2010.
Kungsleden (2012). Annual Report 2011.
Kungsleden (2013). Annual Report 2012.
Kungsleden (2014). Annual Report 2013.
Kungsleden (2015). Annual Report 2014.
Kungsleden (2016). Annual Report 2015.
Kusnitzoff, Ove (2015, Octotber 1.). Regeringen: 3.900 arbejdspladser flytter til 38 byer. Politikken. Retrieved April 6.
2017 from: http://politiken.dk/indland/politik/art5593612/Regeringen-3.900-arbejdspladser-flytter-til-38-byer
Langetieg, Terence C. (1978). An applciation of a three-factor performance index to measure stockholder gains from
merger. Journal of Financial Economics, 1978, Vol. 6(4), pp. 365-383
Mandelker, Gershon. (1974). Risk and return: The case of merging firms. Journal of Financial Economics, 1974,
Vol.1(4), pp. 303-335
Manely, Marisa. (1988). Before you Sign That Lease.... Harvard Business Review, online republished article from May
1988 Issue. Retrieved May 9. 2017 from: https://hbr.org/1988/05/before-you-sign-that-lease
Marketline (2014) Scandinavia - Construction. Industry Profile published July 24. 2014, accessed through Marketline
Portal at Copenhagen Business School.
Marketline (2016) Scandinavia - Real Estate. Industry Profile published July 25. 2016, accessed through Marketline
Portal at Copenhagen Business School.
Marks, M. L., & Mirvis, P., & Ashkenas, R., (2014). Making the Most of Culture Clash in M&A. Leader to Leader,
Dec. 2014, Vol.71, pp. 45-53
Marks, M. L., & Mirvis, P., & Ashkenas, R., (2014). Making the Most of Culture Clash in M&A. Leader to Leader,
Dec. 2014, Vol.71, pp. 45-53
McKinsey (2016). Sustaining sustainability: What institutional investors should do next on ESG. McKinsey &
Company. Retrieved on March 21, 2017 from http://www.mckinsey.com/industries/private-equity-and-principal-
investors/our-insights/sustaining-sustainability-what-institutional-investors-should-do-next-on-esg
Mueller, G. (2006). Testimony of Glenn R. Mueller, Ph.D. before the Subcommittee on Financial Institutions and
Consumer Credit Of the Committee on Financial Services United States House of Representatives: Real Estate Space
Market Cycles. September 14, 2006
NAI Svefa (2012a) Svensk Fastighetsmarknad – fokus 24 orter vt 12. NAI Svefa. Retrieved from NAI Svefa Research
archive on March 28. 2017
NAI Svefa (2012b) Svensk Fastighetsmarknad – fokus 24 orter ht 12. NAI Svefa. Retrieved from NAI Svefa Research
archive on March 28. 2017
NAI Svefa (2013a) Svensk Fastighetsmarknad – fokus 24 orter vt 13. NAI Svefa. Retrieved from NAI Svefa Research
archive on March 28. 2017
NAI Svefa (2013b) Svensk Fastighetsmarknad – fokus 24 orter ht 13. NAI Svefa. Retrieved from NAI Svefa Research
archive on March 28. 2017
NAI Svefa (2014a) Svensk Fastighetsmarknad – fokus 24 orter vt 14. NAI Svefa. Retrieved from NAI Svefa Research
archive on March 28. 2017
Literature list
125
NAI Svefa (2014b) Svensk Fastighetsmarknad – fokus 24 orter ht 14. NAI Svefa. Retrieved from NAI Svefa Research
archive on March 28. 2017
NAI Svefa (2014b) Svensk Fastighetsmarknad – fokus 24 orter ht 15. NAI Svefa. Retrieved from NAI Svefa Research
archive on March 28. 2017
NAI Svefa (2015a) Svensk Fastighetsmarknad – fokus 24 orter vt 15. NAI Svefa. Retrieved from NAI Svefa Research
archive on March 28. 2017
NAI Svefa (2016) Svensk Fastighetsmarknad – fokus 24 orter vt 16. NAI Svefa. Retrieved from NAI Svefa Research
archive on March 28. 2017
NAREIT (n.d.). What is a REIT? NAREIT. Retrieved Feb.22 from: https://www.reit.com/investing/reit-basics/what-reit
NBIM (2015). Global Trends and Their Impact on Real Estate. Norges Bank Investment Management. Retrieved
February 21. 2017 from: https://www.nbim.no/en/transparency/news-list/2015/discussion-note-on-global-trends-and-
their-impact-on-real-estate/
Newsec (2016). Newsec Property Outlook Spring 2016. Newsec. Retrieved from Newsec Research archive on January
13. 2017
Nordea (2016). Crossroads for Real Estate Shares. Nordea Nordic Real Estate. Published July 07. 2016, and accessed
through Nordea Markets Equtiy Research Portal
Nordea (2017). Rate Increase and taxes short-term blinders. Nordea Nordic Real Estate. Published January 12. 2017, and
accessed through Nordea Markets Equtiy Research Portal
Norrporten (2007). Annual Report 2006.
Norrporten (2008). Annual Report 2007.
Norrporten (2009). Annual Report 2008.
Norrporten (2010). Annual Report 2009.
Norrporten (2011). Annual Report 2010.
Norrporten (2012). Annual Report 2011.
Norrporten (2013). Annual Report 2012.
Norrporten (2014). Annual Report 2013.
Norrporten (2015). Annual Report 2014.
Norrporten (2016). Annual Report 2015.
Norrporten (n.d.). The story so far. Retrieved March 03. 2017 from: http://www.norrporten.nu/about-norrporten
Norwegian Property (2016). Annual Report 2015.
NP3 (2016). Annual Report 2015.
Nylander, Anders (2016). Dagens Industri Nyheter - Castellums vd försvarar köpet. Retrieved 06. april 2017 from
Factiva at Copenhagen Business School: Document DAGIND0020160415ec4f0000j
Oaktree (2016). Strategy primer: investing in real estate. Oaktree Capital. Retrieved April 06. 2017 from:
https://www.oaktreecapital.com/docs/default-source/default-document-library/oaktreeinsights_real-estate_final.pdf
Olav Thon (2016). Annual Report 2015.
Parkin, Michael (2012). Microeconomics 12th edition. Pearson Education
Passport (2017, March. 20). Statistics. Retrieved March 20. 2017 from: Real GDP growth by country
Literature list
126
Paul Healy, Krishna Palepu, Richard Ruback. (1992). Does corporate performance improve after mergers. Journal of
Financial Economics, April 1992, Vol. 31(2), Pp. 135-175
Petersen, C. V., & Plenborg, T. (2012). Financial Statement Analysis. Person Education Limited
Petersson, Ulf (2016). Dagens Industri Analys - Dubbla stolar i Norrportenaffär. Retrieved 06. april 2017 from:
http://www.di.se/artiklar/2016/3/8/dubbla-stolar-i-norrportenaffar/
Platzer (2016). Annual Report 2015.
Poorvu, Willaim J. (2003). Financial Analysis of Real Property Investments HBS No. 9-379-193. Harvard Business
School Publishing
Porter, Michael (1979) How Competitive Forces Shape Strategy. Harvard Business Review, Vol.57(2) pp. 137-145
Preqin (2013). Nordic-Focused Fund Managers. Preqin. Retrieved from Preqin database on April 15. 2017
PWC (2010). How synergies drive successful acquisitions - Identifying, realizing and tracking synergies in the M&A
process. Retrieved April 07. 2017 from:
http://s3.amazonaws.com/zanran_storage/www.pwc.com/ContentPages/111403627.pdf
PWC (2014). Real Estate 2020 - Building the Future. PWC. Retrieved April 17. 2017 from:
https://www.pwc.com/sg/en/real-estate/assets/pwc-real-estate-2020-building-the-future.pdf
PWC (2015). Key Tax Issues at Year End for Real Estate Investors 2015/2016. Accounting paper published in
December 2015. Retrieved March 09. 2017 from: https://www.pwc.lu/en/real-estate/docs/pwc-re-key-tax-issues-real-
estate-2015-2016.pdf
Rappaport, Alfred (1986). Creating shareholder value 1st eidition. Maxwell Macmillan Cananda Inc.
Ratcliffe, C., & Dimovski, W., (2012). REIT mergers and acquisitions: a meta-analysis. Journal of Property
Invenstment & Finance, 2012, Vol. 30(30), p. 241-256
Ravenscraft, F. D. & Scherer, M. (1987). Life after takeover. The Journal of Industrial Economics, Dec. 1987, Vol.
36(2), pp. 147-156
REoptimizer (2016). City vs. Suburb: The Office Space Choice that Won't Go Away. Retrieved March 17, 2017 from:
http://www.reoptimizer.com/real-estate-optimization-blog/city-vs.-suburb-the-office-space-choice-that-won39t-go-away
Reuters (2015, 26. Nov). Swedish funds pick banks to lead IPO of real estate firm Norrporten. Retrieved 06. april 2017
from: http://www.reuters.com/article/norrporten-ipo-idUSFWN1370D220151126
Reuters (2015a, 20. Nov). Swedish pension funds plan 2016 listing of real estate firm Norrporten. Retrieved 06. april
2017 from: http://www.reuters.com/article/norrporten-ipo-idUSL8N13F3F020151120
Reuters (2016a, 7. March). Sweden's Castellum considers bid for Norrporten. Retrieved 06. april 2017 from:
http://www.reuters.com/article/us-castellum-norrporten-idUSKCN0W91TO
Reuters (2016b, 8. March). Sweden's Castellum confirms inerest in Norrporten; shares to resume trading. Retrieved
06. april 2017 from: http://www.reuters.com/article/castellum-norrporten-idUSL5N16G11S
Reuters (2016c, 13. April). Swedish property firm Castellum inks deal to buy Norrporten-media report.Retrieved 06.
april 2017 from: http://www.reuters.com/article/castellun-norrporten-idUSFWN17G06T
Roll, Richard. (1986). The Hubris Hypothesis Of Corporate Takeovers. The Journal of Business, April 1986, Vol.59(2)
pp. 197-216
Rosenbaum, J., & Pearl, J. (2009). Investment Banking: Valuation, Leveraged Buyouts and Mergers & Acquisitions.
John Wiley & Sons Inc.
Sagax (2016). Annual Report 2015.
SCB (2017a). Sweden Population Statistics. Sweden Statistics
Literature list
127
SCB (2017b). Sweden International Trade Statistics. Sweden Statistics
SCB (2017c). Sweden Labor Market Data. Sweden Statistics
Schein, Edgar., (2009). The Corporate Culture Survival Guide. New and Revised Edition. Jossey-Bass, Wiley
Skanska (1997). Annual Report 1996.
Sponda (2016). Annual Report 2015.
Sveriges Riksbank (2016a). Monetary Policy Report, February 2016. Sveriges Riksbank. Retrieved from Sveriges
Riksbank Monetary Policy Report Archive on April 05. 2017
Sveriges Riskbank (1993). Press Release No. 5, 15. January 1993 - The Riksbank's Target for Monetary Polcy.
Retrieved from: http://www.riksbank.se/Upload/Dokument_riksbank/Kat_publicerat/Pressmeddelanden/930115e.pdf
Sveriges Riskbank (2015). Monetary Policy Report, February 2015. Retrieved March 15. from:
http://www.riksbank.se/Documents/Rapporter/PPR/2015/150212/rap_ppr_150212_eng.pdf
Sveriges Riskbank (2016). Monetary Policy Report, April 2016. Retrieved March 15. from:
http://www.riksbank.se/Documents/Rapporter/PPR/2016/160421/rap_ppr_160421_eng.pdf
Sveriges Riskbank (2017). 15 February 2017 - Current forecast for the repo rate, inflation and GDP. Retrieved from:
http://www.riksbank.se/en/Monetary-policy/Forecasts-and-interest-rate-decisions/Current-forecast-for-the-repo-rate-
inflation-and-GDP/
SVT (2014). Miljonrullning inom pensionsägt bolag. Retrieved 06. april 2017 from:
http://www.svt.se/nyheter/granskning/ug/miljonrullning-inom-ap-fondernas-eget-bolag
Swiss Property (n.d.). Property Lifecycle. Swiss Property. Retrieved on April 05. 2017 from: http://www.swiss-
property.ch/group/property-lifecycle/?lang=en
Technopolis (2016). Annual Report 2015.
Thomson Reuters (2016). Thomson Reuters Streetevents - Edited Transcript: CAST.ST - Castellum AB Acquires
Norrporten and carries out a rights issue conference call. Retrieved March 26. 2017 from Thomson One Banker portal
at Copenhagen Business School
Tolleson, Nicklas (2016, 14. April). The Largest Deal in the Nordics since 2008. Nordic Property News. Retrieved
April 06. 2017 from: http://nordicpropertynews.com/article/606/the-largest-deal-in-the-nordics-since-2008
Topuz, J. C., & Darrat, A. F., & Shelor, R. M., (2005). Technical, Allocative and Scale Efficiencies of REITs: an
empirical inquiry. Journal of Business Finance & Accounting, Nov. 2005, Vol.32(9-10), pp. 1961-1994
UBS Warburg (2001). Valuation Multiples: A Primer. Issue 1. UBS Warburg Global Equity Research, accessed online:
http://www.rgquintero.com/media/91f679831d8e9521ffff80e8ffffe906.pdf
Ulbrich, Christian (2016) COP 22, Climate Change, The New Economy. The United Nationas Climate Change
Conference - COP22&CMP12 Magazine, pp. 110-113. Retrieved March 5. from: http://touchline.s3-website-eu-west-
1.amazonaws.com/cop22/1-1
UNEP (2014). Commercial Real Estate: Unlocking the energy efficiency retrofit investment opportunity. UNEP Finance
Initiative. Retrieved from UNEP Finance Initiative archive on 28 January 2017
UNEP (2016). Towards zero-emission efficient and resilient buildings: Global Status Report 2016. Global Alliance for
Buildings and Construction. Retrieved from UNEP archive on 28 January 2017
UNFCC (2015). Press Release - Unprecedented Global Alliance for Buildings and Construction to Combat Climate
Changes. Retrieved March 16. 2017 from: http://newsroom.unfccc.int/lpaa/building/press-release-lpaa-focus-building-
20-countries-and-over-60-organizations-launch-an-unprecedented-global-alliance-for-buildings-and-construction-to-
combat-climate-change/#downloads
Literature list
128
Union (2016). M2 - Markedsrapport Vår 2016. Retrieved May 09. 2017 from: http://www.union.no/wp-
content/uploads/m2-vr-2016.pdf
United Nations (2014). World Urbanization Prospects, the 2014 revision. Retrieved February 27. 2017 from:
https://www.compassion.com/multimedia/world-urbanization-prospects.pdf
United Nations (2015). World Population Prospects, the 2015 revision. Retrieved February 27. 2017 from:
https://esa.un.org/unpd/wpp/publications/files/key_findings_wpp_2015.pdf
Vermaelen, Theo. (1981). Common stock repurchases and market signalling: An empirical study.Journal of Financial
Economics, 1981, Vol. 9, pg. 139-183
Victoria Park (2016). Annual Report 2015.
Vincent, Linda. (1999). The information content in funds from operations (FFO) for REITs. Journal of Accounting and
Economics, 1991, pg. 68-104
Vinge (2016). What are the current trends in and future prospects for the real estate market (both commercial and
residential) in your jurisdiction? Market Spotlight. Retrieved February 21. 2017 from:
http://www.lexology.com/library/detail.aspx?g=028b5b84-17d0-4b77-a591-02b191bc1482
Vinocour, Barry. (2003). Understanding NAV. REIT University. Retrieved February 01. 2017 from: https://samples-
breakingintowallstreet-com.s3.amazonaws.com/84-05-REIT-University-NAV-Overview.pdf
Wallenstam (2016). Annual Report 2015.
Wihlborg (2016). Annual Report 2015.
Zemke, R. & Raines, C. & Filipczak, B. (2000). Generations at Work: Managing the Clas of Veteran, Boomers, Xers,
and Nexters in Your Workplace 1st edition. AMACOM