L&T Annual Report 2019-20 - WIRC-ICAI.org
135
459 INDEPENDENT AUDITORS’ REPORT TO THE MEMBERS OF LARSEN & TOUBRO LIMITED Report on the Audit of the Consolidated Financial Statements Opinion We have audited the accompanying consolidated financial statements of Larsen & Toubro Limited (the “Parent”) and its subsidiaries, (the Parent and its subsidiaries together referred to as the “Group”) which includes 35 joint operations of the Group accounted on proportionate basis and the Group’s share of profit in its associates and joint ventures, which comprise the Consolidated Balance Sheet as at 31st March 2020, and the Consolidated Statement of Profit and Loss (including Other Comprehensive Income), the Consolidated Statement of Cash Flows and the Consolidated Statement of Changes in Equity for the year then ended, and a summary of significant accounting policies and other explanatory information. In our opinion and to the best of our information and according to the explanations given to us, and based on the consideration of reports of the other auditors on separate financial information of the joint operations, subsidiaries, associates and joint ventures referred to in the Other Matters section below, the aforesaid consolidated financial statements give the information required by the Companies Act, 2013 (the “Act”) in the manner so required and give a true and fair view in conformity with the Indian Accounting Standards prescribed under section 133 of the Act read with the Companies (Indian Accounting Standards) Rules, 2015, as amended (“Ind AS”), and other accounting principles generally accepted in India, of the consolidated state of affairs of the Group as at 31st March 2020, and their consolidated profit, their consolidated total comprehensive income, their consolidated cash flows and their consolidated changes in equity for the year ended on that date. Basis for Opinion We conducted our audit of the consolidated financial statements in accordance with the Standards on Auditing specified under section 143 (10) of the Act (“SA”s). Our responsibilities under those Standards are further described in the Auditor’s Responsibility for the Audit of the Consolidated Financial Statements section of our report. We are independent of the Group, its associates and joint ventures in accordance with the Code of Ethics issued by the Institute of Chartered Accountants of India (“ICAI”) together with the ethical requirements that are relevant to our audit of the consolidated financial statements under the provisions of the Act and the Rules made thereunder, and we have fulfilled our other ethical responsibilities in accordance with these requirements and the ICAI’s Code of Ethics. We believe that the audit evidence obtained by us and the audit evidence obtained by the other auditors in terms of their reports referred to in the Other Matters section below, is sufficient and appropriate to provide a basis for our audit opinion on the consolidated financial statements. Emphasis of Matter We draw attention to Note [1](III) to the Consolidated Financial Statements in which the Group describes the uncertainties arising from the COVID-19 pandemic. Our report is not modified in respect of this matter. Key Audit Matters Key audit matters are those matters that, in our professional judgment, were of most significance in our audit of the consolidated financial statements of the current period. These matters were addressed in the context of our audit of the consolidated financial statements as a whole, and in forming our opinion thereon, and we do not provide a separate opinion on these matters. We have determined the matters described below to be the key audit matters to be communicated in our report. DELOITTE HASKINS & SELLS LLP Chartered Accountants Indiabulls Finance Centre, Tower 3 27th – 32nd Floor, Senapati Bapat Marg Elphinstone Road (West) Mumbai 400 013.
-
Upload
khangminh22 -
Category
Documents
-
view
3 -
download
0
Transcript of L&T Annual Report 2019-20 - WIRC-ICAI.org

459
INDEPENDENT AUDITORS’ REPORTTO THE MEMBERS OF LARSEN & TOUBRO LIMITED
Report on the Audit of the Consolidated Financial StatementsOpinion
We have audited the accompanying consolidated financial statements of Larsen & Toubro Limited (the “Parent”) and its subsidiaries, (the Parent and its subsidiaries together referred to as the “Group”) which includes 35 joint operations of the Group accounted on proportionate basis and the Group’s share of profit in its associates and joint ventures, which comprise the Consolidated Balance Sheet as at 31st March 2020, and the Consolidated Statement of Profit and Loss (including Other Comprehensive Income), the Consolidated Statement of Cash Flows and the Consolidated Statement of Changes in Equity for the year then ended, and a summary of significant accounting policies and other explanatory information.
In our opinion and to the best of our information and according to the explanations given to us, and based on the consideration of reports of the other auditors on separate financial information of the joint operations, subsidiaries, associates and joint ventures referred to in the Other Matters section below, the aforesaid consolidated financial statements give the information required by the Companies Act, 2013 (the “Act”) in the manner so required and give a true and fair view in conformity with the Indian Accounting Standards prescribed under section 133 of the Act read with the Companies (Indian Accounting Standards) Rules, 2015, as amended (“Ind AS”), and other accounting principles generally accepted in India, of the consolidated state of affairs of the Group as at 31st March 2020, and their consolidated profit, their consolidated total comprehensive income, their consolidated cash flows and their consolidated changes in equity for the year ended on that date.
Basis for Opinion
We conducted our audit of the consolidated financial statements in accordance with the Standards on Auditing specified under section 143 (10) of the Act (“SA”s). Our responsibilities under those Standards are further described in the Auditor’s Responsibility for the Audit of the Consolidated Financial Statements section of our report. We are independent of the Group, its associates and joint ventures in accordance with the Code of Ethics issued by the Institute of Chartered Accountants of India (“ICAI”) together with the ethical requirements that are relevant to our audit of the consolidated financial statements under the provisions of the Act and the Rules made thereunder, and we have fulfilled our other ethical responsibilities in accordance with these requirements and the ICAI’s Code of Ethics. We believe that the audit evidence obtained by us and the audit evidence obtained by the other auditors in terms of their reports referred to in the Other Matters section below, is sufficient and appropriate to provide a basis for our audit opinion on the consolidated financial statements.
Emphasis of Matter
We draw attention to Note [1](III) to the Consolidated Financial Statements in which the Group describes the uncertainties arising from the COVID-19 pandemic.
Our report is not modified in respect of this matter.
Key Audit Matters
Key audit matters are those matters that, in our professional judgment, were of most significance in our audit of the consolidated financial statements of the current period. These matters were addressed in the context of our audit of the consolidated financial statements as a whole, and in forming our opinion thereon, and we do not provide a separate opinion on these matters. We have determined the matters described below to be the key audit matters to be communicated in our report.
DELOITTE HASKINS & SELLS LLPChartered AccountantsIndiabulls Finance Centre, Tower 327th – 32nd Floor, Senapati Bapat Marg Elphinstone Road (West)Mumbai 400 013.

460
AUDITORS’ REPORT ON CONSOLIDATED FINANCIAL STATEMENTS ANNUAL REPORT 2019-20
Revenue recognition – accounting for construction contracts
Key audit matter description
As described in Note No. [1](II)(i) of the Consolidated Financial Statements, the Group recognises revenue from contracts with customers when it satisfies its performance obligations.
Accounting for construction contracts is considered as a Key Audit Matter as there are significant accounting judgements in estimating revenue to be recognised on contracts with customers, including estimation of costs to complete and determining the timing of revenue recognition.
The Group recognises revenue and profit/loss based on stage of completion based on the proportion of contract costs incurred at balance sheet date, relative to the total estimated costs of the contract at completion. The recognition of revenue is thus dependent on estimates in relation to total estimated costs of each contract.
Cost contingencies are included in these estimates to take in to account specific uncertain risks, or disputed claims against the Group, arising within each contract. These contingencies are reviewed by the Management on a regular basis throughout the contract life and adjusted where appropriate.
The revenue on contracts may also include variable consideration (variations and claims). Variable consideration is recognised when the probability of reversal of such revenue is low.
Further, Refer to Note No. 47 for the disclosures made in the Consolidated Financial Statements as per Ind AS 115 ‘Revenue from Contracts with Customers’.
Principal Audit Procedures
The procedures performed included the following:
• obtained an understanding of the process followed by the Group in determination of the estimates and contract revenue;
• performed walkthrough procedures over the process of identification of performance obligation;
• tested the design and implementation of internal control over the quantification of the estimates used as well as the operating effectiveness of such control;
• tested segregation of duties while recording the contracts in the Group’s information system and recognising revenue from such contracts;
• tested the General IT Controls over the relevant information technology systems’ access and change management controls relating to contracts and related information used in recording and disclosing revenue in accordance with Ind AS 115 – Revenue from Contracts with Customers;
• tested sample of contracts for:
- appropriate identification of performance obligations;
- change orders and the impact on the estimated costs to complete;
- evaluation of reasonability of estimates of costs to complete; and
- tested the appropriateness of the timing of recognizing the revenue from the contracts;
• tested the appropriateness of the variable considerations recognised based on the low probability of reversal of such revenue; and
• tested appropriateness of the disclosures in the financial statements in respect of such construction contracts to ensure compliance with Ind AS 115.
Measurement of contract assets in respect of overdue milestones and receivables in respect of overdue invoices.
Key audit matter description
The Group, in its contract with customers, promises to transfer distinct services to its customers, which may be rendered in the form of engineering, procurement, and construction (EPC) services through design-build contracts, and other forms of construction contracts. The recognition of revenue is based on contractual terms, which could be based on agreed unit price or lump-sum revenue arrangements. At each reporting date, revenue is accrued for costs incurred against work performed that may not have been invoiced.
Identifying whether the Group’s performance has resulted in a service that would be billable and collectable where the works carried out have not been acknowledged by customers as of the reporting date, or in the case of certain defence contracts, where the evidence of work carried out and cost incurred are covered by confidentiality arrangements, involves a significant amount of judgment.
Assessing the recoverability of contract assets related to overdue milestones and amounts overdue against invoices raised which have remained unsettled for a significantly long period after the end of the contractual credit period also involves a significant amount of judgment. Refer to Note No. [1](II)(i) and [1](II)(r) of the Consolidated Financial Statements.

461
Principal Audit Procedures
The procedures performed included the following:
• obtained an understanding of the Group’s processes in collating the evidence supporting execution of work for each disaggregated type of revenue;
• obtained an understanding of the Group’s processes in assessing the recoverability of amounts overdue and process over estimating the expected credit loss allowance;
• tested the design and operating effectiveness of the key controls over the completeness and accuracy of the key inputs and assumptions into the provisioning model;
• evaluated controls over authorisation and calculation of provisioning model;
• for defence contracts which are covered under statutory confidentiality arrangements, for sample of contracts, the auditors have compared the revenue recognised with amounts collected from customers to ensure that the gap between revenue recognised and collections is below the materiality threshold;
• evaluated the delivery and collection history of customers against whose contracts un-invoiced revenue is recognised;
• verified for the sample selected, receipts post balance sheet date upto the approval of the financial statements by the Board of Directors of the Parent Company;
• performed an overall assessment of the expected credit loss provision to determine if they were reasonable considering the Group’s portfolio, risk profile, credit risk management practices and the macroeconomic environment; and
• tested the appropriateness of the disclosures in the financial statements to ensure compliance with Ind AS 115.
Appropriateness of revenues and onerous obligations in respect of fixed price contracts involves critical estimates for services relating to Information Technology & Technology Services Segment
Key audit matter description
Estimated effort is a critical estimate to determine revenues and provision for onerous obligations on fixed price contracts. This estimate has a high inherent uncertainty as it requires consideration of progress of the contract, efforts/cost incurred till date, efforts/cost required to complete the remaining contract performance obligations.
Refer to Note No. [1](II)(i) of the Consolidated Financial Statements.
Principal Audit Procedures
The procedures performed by component auditors (being other firms of chartered accountants) included the following:
• evaluated the design and implementation of internal controls over recording of actual cost/efforts till date and the process of estimation of cost/efforts required to complete the performance obligations;
• tested the operating effectiveness of the said internal controls for a selected sample of contracts.
• selected a sample of new and existing contracts and performed following procedures;
o read, analysed and identified the distinct performance obligations in these contracts.
o compared such performance obligations with those identified and recorded by the Group.
o verified contract terms to determine the transaction price including any variable consideration and verified allocation of the transaction price to each performance obligation after adjusting the estimated variable consideration.
• in respect of a sample of fixed price contracts, progress towards satisfaction of performance obligation used to compute recorded revenue was verified with the efforts/cost recorded and estimated efforts/cost from the corresponding information systems;
• verified sample of contracts with unbilled revenues to identify possible delays in achieving milestones, which require change in estimated efforts to complete the remaining performance obligations.

462
AUDITORS’ REPORT ON CONSOLIDATED FINANCIAL STATEMENTS ANNUAL REPORT 2019-20
Provision for expected credit losses for financial services segment
Key audit matter description
Significant judgement is used in classifying loan assets measured at amortised cost and applying appropriate measurement principles. The allowance for expected credit losses (“ECL”) on such loan assets, measured at amortised cost, is a critical estimate involving greater level of management judgement.
As part of our risk assessment, we determined that the allowance for ECL on loan assets (including undisbursed commitments) has a high degree of estimation uncertainty, with a potential range of reasonable outcomes for the financial statements.
The elements in estimating ECL which involve increased level of audit focus are as follows:
• Qualitative and quantitative factors used in staging the loan assets measured at amortised cost;
• Basis used for estimating Probabilities of Default (“PD”);
• Basis used for estimating Loss Given Default (“LGD”);
• Judgements used in projecting economic scenarios and probability weights applied to reflect future economic conditions;
• Adjustments to model driven ECL results to address emerging trends.
Refer Note No. [1](II)(r)(i)(D) of the Consolidated Financial Statements
Principal Audit Procedures
We have examined the policies approved by the Board of Directors of the Company that articulate the objectives of managing each portfolio and their business models (including policies for sale out of amortised cost business model). We have also verified the methodology adopted for computation of ECL (“ECL Model”) that addresses policies approved by the Board of Directors, procedures and controls for assessing and measuring credit risk on all lending exposures measured at amortised cost.
Additionally, we have confirmed that adjustments to the output of the ECL Model is consistent with the documented rationale and basis for such adjustments and that the amount of adjustment has been approved by the Audit Committee of the Board of Directors.
Our audit procedures related to the allowance for ECL included the following, among others:
• Tested the design and effectiveness of internal controls over the:
– completeness and accuracy of the Exposure at Default (“EAD”) and the classification thereof into stages consistent with the definitions applied in accordance with the policy approved by the Board of Directors including the appropriateness of the qualitative factors to be applied;
– completeness and accuracy of information used in the estimation of the PD for the different stages depending on the nature of the portfolio; and
– computation of the ECL including methodology used to determine macro economic overlays and adjustments to the output of the ECL Model.
• Also, for a sample of ECL on loan assets:
– we tested the input data such as ratings and period of default and other related information used in estimating the PD;
– we evaluated reasonableness of LGD estimates by comparing actual recoveries post the loan asset becoming credit impaired with estimates of LGD;
– we evaluated the incorporation of the applicable assumptions into the ECL Model and tested the mathematical accuracy and computation of the allowances by using the same input data used by the Company.
• We also tested the adequacy of the adjustment after stressing the inputs used in determining the output as per the ECL Model and ensured that the adjustment was in conformity with the amount approved by the Audit Committee.
• We also assessed the disclosures made in relation to the ECL allowance to confirm compliance with the provisions of Ind AS 107.

463
Impairment of Toll Collection Rights of certain operating projects who have incurred continuous losses.
Key audit matter description
Toll collection rights obtained in consideration for rendering construction services, represent the right to collect toll revenue during the concession period in respect of Build-Operate-Transfer ("BOT") and Design-Build-Operate-Transfer (“DBOT”) projects. Toll collection rights are capitalised as intangible assets upon completion of the project at the cumulative construction costs plus the present value of obligation towards negative grants and additional concession fee payable to National Highways Authority of India ("NHAI")/State Authorities, if any.
The Group has carried out an evaluation for impairment of such toll collection rights where indicators of impairment were identified. Due to the multitude of factors and assumptions involved in determining the forecasted revenues/cash flows and discount rate in the projection period, significant judgments are required to estimate the recoverable values.
Management has estimated the future cash flows arising from achieving revenues and costs in line with the increase in traffic as well as refinancing/restructuring. As such estimations involve complex and subjective judgements by the Management, there is a risk that there may be an impairment that has not been recorded.
Refer Note No. [1](II)(o) of the Consolidated Financial Statements.
Principal Audit Procedures
The component auditors (being other firms of chartered accountants) have performed the following audit procedures:
• conducted discussions with Company personnel to identify factors, if any, that should be taken into account in the impairment analysis;
• evaluated the design and implementation of the relevant controls and the operating effectiveness of such internal controls in estimating the future projections including assumptions used in determining the value in use;
• compared the actual revenues and cash flows generated by the entities during the year as compared to the projections and estimates considered in the previous year and evaluated the basis of future projections with regard to the revenue and cash flows;
• evaluated the appropriateness of key assumptions in the valuations including discount rate, growth rate, and consulted internal specialists for such evaluation. The challenge was based on the auditors’ assessment of the historical accuracy of the Group’s estimates in the prior periods and an assessment of the consistency of assumptions across all the subsidiaries and comparison of the assumptions with public data wherever available;
• the component auditors have also performed a sensitivity analysis to assess the impact of possible different assumptions related to revenue and cost estimates including:
i. Increase/decrease in revenue growth rate; and
ii. Increase/decrease to cost forecasts.
Physical verification of inventory
Key audit matter description
The Company’s management conducts physical verification of inventories during the year at reasonable intervals, however, on account of the COVID-19 related lockdown restrictions, management was able to perform year end physical verification of inventories, only at certain locations. Management has carried out other procedures to validate the existence of its inventory as at the year end, such as carrying out consumption analysis, and performing roll-back procedures from the subsequent year end physical verification date to determine the quantities of the inventory at the balance sheet date.
Refer Note No. [1](II)(s) of the Consolidated Financial Statements.
The procedures performed included the following:
• Understood the process and tested the Management’s internal controls to establish the existence of inventory in relation to the process of periodic physical verification carried out by the management, the scope and coverage of the periodic verification programme, the results of such verification including analysis of discrepancies, if any;

464
AUDITORS’ REPORT ON CONSOLIDATED FINANCIAL STATEMENTS ANNUAL REPORT 2019-20
• At selected locations subsequent to year-end, where the management appointed third party independent chartered accountants to perform physical verification, sent instructions to the third party chartered accountants to carry out the physical verification and provided samples to be verified by them. We have received the report of the physical verification carried out by the third party independent chartered accountants. Obtained the roll back procedures performed by the management from the subsequent year-end physical verification date to arrive at the quantities as at the balance sheet date. Traced the samples physically verified by the third party independent chartered accountants roll back workings provided by the management.
• Inspected, for samples selected, supporting documentation relating to purchases and consumption, and such other third party evidences where applicable.
• Tested the analytical reviews performed by the Company such as consumption analysis.
Information Other than the Financial Statements and Auditor’s Report Thereon
i. The Parent’s Company’s Board of Directors is responsible for the other information. The other information comprises the information included in the Management Discussion and Analysis, Board’s Report including Annexures to Board’s Report, Business Responsibility Report, Corporate Governance and Shareholder’s Information, but does not include the consolidated financial statements, standalone financial statements and our auditor’s report thereon.
ii. Our opinion on the consolidated financial statements does not cover the other information and we do not express any form of assurance conclusion thereon.
In connection with our audit of the consolidated financial statements, our responsibility is to read the other information, compare with the financial statements of the joint operations, subsidiaries, joint ventures and associates audited by the other auditors, to the extent it relates to these entities and, in doing so, place reliance on the work of the other auditors and consider whether the other information is materially inconsistent with the consolidated financial statements or our knowledge obtained during the course of our audit or otherwise appears to be materially misstated. Other information so far as it relates to the joint operations, subsidiaries, joint ventures and associates, is traced from their financial statements audited by the other auditors.
If based on the work we have performed, we conclude that there is a material misstatement of this other information, we are required to report that fact. We have nothing to report in this regard.
Management’s Responsibility for the Consolidated Financial Statements
The Parent’s Company’s Board of Directors is responsible for the matters stated in section 134(5) of the Act with respect to the preparation of these consolidated financial statements that give a true and fair view of the consolidated financial position, consolidated financial performance including other comprehensive income, consolidated cash flows and consolidated changes in equity of the Group including its associates and joint ventures in accordance with the Ind AS and other accounting principles generally accepted in India.
The respective Board of Directors of the companies included in the Group and of its associates and joint ventures are responsible for maintenance of adequate accounting records in accordance with the provisions of the Act for safeguarding the assets of the Group and its associates and its joint ventures and for preventing and detecting frauds and other irregularities; selection and application of appropriate accounting policies; making judgments and estimates that are reasonable and prudent; and design, implementation and maintenance of adequate internal financial controls, that were operating effectively for ensuring the accuracy and completeness of the accounting records, relevant to the preparation and presentation of the financial statements that give a true and fair view and are free from material misstatement, whether due to fraud or error, which have been used for the purpose of preparation of the consolidated financial statements by the Directors of the Parent Company, as aforesaid.
In preparing the consolidated financial statements, the respective Board of Directors of the companies included in the Group and of its associates and joint ventures are responsible for assessing the ability of the respective entities to continue as a going concern, disclosing, as applicable, matters related to going concern and using the going concern basis of accounting unless the respective Board of Directors either intends to liquidate their respective entities or to cease operations, or has no realistic alternative but to do so.
The respective Board of Directors of the companies included in the Group and of its associates and joint ventures are also responsible for overseeing the financial reporting process of the Group and of its associates and joint ventures.
Auditor’s Responsibility for the Audit of the Consolidated Financial Statements
Our objectives are to obtain reasonable assurance about whether the consolidated financial statements as a whole are free from material misstatement, whether due to fraud or error and to issue an auditor’s report that includes our opinion. Reasonable assurance is a high level of assurance but is not a guarantee that an audit conducted in accordance with SAs will always detect a material

465
misstatement when it exists. Misstatements can arise from fraud or error and are considered material if, individually or in the aggregate, they could reasonably be expected to influence the economic decisions of users taken on the basis of these consolidated financial statements.
As part of an audit in accordance with SAs, we exercise professional judgment and maintain professional skepticism throughout the audit. We also:
• Identifyandassesstherisksofmaterialmisstatementoftheconsolidatedfinancialstatements,whetherduetofraudorerror,design and perform audit procedures responsive to those risks, and obtain audit evidence that is sufficient and appropriate to provide a basis for our opinion. The risk of not detecting a material misstatement resulting from fraud is higher than for one resulting from error, as fraud may involve collusion, forgery, intentional omissions, misrepresentations, or the override of internal control.
• Obtainanunderstandingofinternalfinancialcontrolrelevanttotheauditinordertodesignauditproceduresthatareappropriatein the circumstances. Under section 143(3)(i) of the Act, we are also responsible for expressing our opinion on whether the Parent Company has adequate internal financial controls system in place and the operating effectiveness of such controls.
• Evaluatetheappropriatenessofaccountingpoliciesusedandthereasonablenessofaccountingestimatesandrelateddisclosuresmade by the management.
• Concludeontheappropriatenessofmanagement’suseofthegoingconcernbasisofaccountingand,basedontheauditevidenceobtained, whether a material uncertainty exists related to events or conditions that may cast significant doubt on the ability of the Group and its associates and joint ventures to continue as a going concern. If we conclude that a material uncertainty exists, we are required to draw attention in our auditor’s report to the related disclosures in the consolidated financial statements or, if such disclosures are inadequate, to modify our opinion. Our conclusions are based on the audit evidence obtained up to the date of our auditor’s report. However, future events or conditions may cause the Group and its associates and joint ventures to cease to continue as a going concern.
• Evaluatetheoverallpresentation,structureandcontentoftheconsolidatedfinancialstatements,includingthedisclosures,andwhether the consolidated financial statements represent the underlying transactions and events in a manner that achieves fair presentation.
• ObtainsufficientappropriateauditevidenceregardingthefinancialinformationoftheentitiesorbusinessactivitieswithintheGroup and its associates and joint ventures to express an opinion on the consolidated financial statements. We are responsible for the direction, supervision and performance of the audit of the financial statements of such entities or business activities included in the consolidated financial statements of which we are the independent auditors. For the other entities included in the consolidated financial statements, which have been audited by the other auditors, such other auditors remain responsible for the direction, supervision and performance of the audits carried out by them. We remain solely responsible for our audit opinion.
Materiality is the magnitude of misstatements in the consolidated financial statements that, individually or in aggregate, makes it probable that the economic decisions of a reasonably knowledgeable user of the consolidated financial statements may be influenced. We consider quantitative materiality and qualitative factors in (i) planning the scope of our audit work and in evaluating the results of our work; and (ii) to evaluate the effect of any identified misstatements in the consolidated financial statements.
We communicate with those charged with governance of the Parent Company and such other entities included in the consolidated financial statements of which we are the independent auditors regarding, among other matters, the planned scope and timing of the audit and significant audit findings, including any significant deficiencies in internal control that we identify during our audit.
We also provide those charged with governance with a statement that we have complied with relevant ethical requirements regarding independence, and to communicate with them all relationships and other matters that may reasonably be thought to bear on our independence, and where applicable, related safeguards.
From the matters communicated with those charged with governance, we determine those matters that were of most significance in the audit of the consolidated financial statements of the current period and are therefore the key audit matters. We describe these matters in our auditor’s report unless law or regulation precludes public disclosure about the matter or when, in extremely rare circumstances, we determine that a matter should not be communicated in our report because the adverse consequences of doing so would reasonably be expected to outweigh the public interest benefits of such communication.

466
AUDITORS’ REPORT ON CONSOLIDATED FINANCIAL STATEMENTS ANNUAL REPORT 2019-20
Other Matters
• Wedidnotauditthefinancialinformationof28jointoperationsincludedinthestandalonefinancialstatementsofthecompaniesincluded in the Group whose financial information reflect total assets of R 3,728.86croreasat31stMarch,2020,totalrevenueof R 4,112.64crore,totalnetlossaftertaxofR 119.39 crore, total comprehensive loss of R 119.39 crore and net cash outflows amounting to R 115.90 crore for the year ended 31st March, 2020, as considered in the respective standalone financial statements of the companies included in the Group. The financial information of these joint operations have been audited by the other auditors whose reports have been furnished to us by the Management, and our opinion in so far as it relates to the amounts and disclosures included in respect of these joint operations and our report in terms of subsection (3) of Section 143 of the Act, in so far as it relates to the aforesaid joint operations, is based solely on the report of such other auditors.
• Wedidnotauditthefinancialinformationof68subsidiaries,whosefinancialinformationreflecttotalassetsofR 1,00,047.10 crore as at 31st March, 2020, total revenues of R 36,971.08crore,totalnetprofitaftertaxofR 3,965.32crore,totalcomprehensive income of R 3,236.04croreandnetcashinflowsamountingtoR 2,151.28crorefortheyearended31stMarch,2020, as considered in the consolidated financial statements. The consolidated financial statements also include the Group’s share of loss after tax of R 29.61crorefortheyearended31stMarch,2020andtotalcomprehensivelossofR 2.81crorefortheyearended31stMarch,2020,asconsideredintheconsolidatedfinancialstatements,inrespectof3associatesand8jointventures,whose financial information have not been audited by us. These financial information have been audited by other auditors whose reports have been furnished to us by the Management and our opinion on the consolidated financial statements, in so far as it relates to the amounts and disclosures included in respect of these subsidiaries, joint ventures and associates, and our report in terms of subsection (3) of Section 143 of the Act, in so far as it relates to the aforesaid subsidiaries, joint ventures and associates is based solely on the reports of the other auditors.
• Wedidnotauditthefinancialinformationof6jointoperationsincludedinthestandalonefinancialstatementsofthecompaniesincluded in the Group whose financial information reflect total assets of R 239.74 crore as at 31st March, 2020, total revenue of R 257.69crore,totalnetprofitaftertaxofR 15.40 crore, total comprehensive income of R 15.40 crore and net cash inflows amount to R 32.30 crore for the year ended 31st March, 2020, as considered in the respective standalone financial statements of the companies included in the Group. These financial information are unaudited and have been furnished to us by the Management and our opinion on the consolidated financial statements, in so far as it relates to the amounts and disclosures included in respect of these joint operations, is based solely on such unaudited financial information. In our opinion and according to the information and explanations given to us by the Management, these financial information are not material to the Group.
• Wedidnotauditthefinancialinformationof46subsidiaries,whosefinancialinformationreflecttotalassetsofR 1,019.63croreas at 31st March, 2020, total revenues of R 742.37 crore, total net loss after tax of R 6.01crore,totalcomprehensivelossofR 10.71 crore and net cash inflows amounting to R 36.85crorefortheyear31stMarch,2020,asconsideredintheconsolidatedfinancial statements. The consolidated financial statements also include the Group’s share of after tax of R 10.40 crore and total comprehensive loss of R 10.36crorefortheyearended31stMarch,2020,asconsideredintheconsolidatedfinancialstatements,inrespectof3associatesand6jointventures,financialinformationhavenotbeenauditedbyus.Thesefinancialinformationareunaudited and have been furnished to us by the Management and our opinion on the consolidated financial statements, in so far as it relates to the amounts and disclosures included in respect of these subsidiaries, joint ventures and associates, is based solely on such unaudited financial information. In our opinion and according to the information and explanations given to us by the Management, these financial information are not material to the Group.
Our opinion on the consolidated financial statements above and our report on Other Legal and Regulatory Requirements below, is not modified in respect of the above matters with respect to our reliance on the work done and the reports of the other auditors and the financial information certified by the Management.
Report on Other Legal and Regulatory Requirements
As required by Section 143(3) of the Act, based on our audit and on the consideration of the reports of the other auditors on the separate financial information of the joint operations, subsidiaries, associates and joint ventures referred to in the Other Matters section above we report, to the extent applicable that:
a) We have sought and obtained all the information and explanations which to the best of our knowledge and belief were necessary for the purposes of our audit of the aforesaid consolidated financial statements.
b) In our opinion, proper books of account as required by law relating to preparation of the aforesaid consolidated financial statements have been kept so far as it appears from our examination of those books and the reports of the other auditors.
467
c) The Consolidated Balance Sheet, the Consolidated Statement of Profit and Loss including Other Comprehensive Income, the Consolidated Statement of Cash Flows and the Consolidated Statement of Changes in Equity dealt with by this Report are in agreement with the relevant books of account maintained for the purpose of preparation of the consolidated financial statements.
d) In our opinion, the aforesaid consolidated financial statements comply with the Ind AS specified under Section 133 of the Act.
e) On the basis of the written representations received from the directors of the Parent Company as on 31st March, 2020 taken on record by the Board of Directors of the Company and the reports of the statutory auditors of its joint operation companies, subsidiary companies, associate companies and joint venture companies incorporated in India, none of the directors of the Group companies, its associate companies and joint venture companies incorporated in India is disqualified as on 31st March, 2020 from beingappointedasadirectorintermsofSection164(2)oftheAct.
f) With respect to the adequacy of the internal financial controls over financial reporting and the operating effectiveness of such controls, refer to our separate Report in “Annexure A” which is based on the auditors’ reports of the Parent company, subsidiary companies, associate companies and joint venture companies incorporated in India. Our report expresses an unmodified opinion on the adequacy and operating effectiveness of internal financial controls over financial reporting of those companies.
g) WithrespecttotheothermatterstobeincludedintheAuditor’sReportinaccordancewiththerequirementsofsection197(16)ofthe Act, as amended,
In our opinion and to the best of our information and according to the explanations given to us, the remuneration paid by the Parent Company to its directors during the year is in accordance with the provisions of section 197 of the Act.
h) With respect to the other matters to be included in the Auditor’s Report in accordance with Rule 11 of the Companies (Audit and Auditors) Rules, 2014, as amended in our opinion and to the best of our information and according to the explanations given to us:
i. The consolidated financial statements disclose the impact of pending litigations on the consolidated financial position of the Group, its associates and joint ventures;
ii. Provision has been made in the consolidated financial statements, as required under the applicable law or accounting standards, for material foreseeable losses, if any, on long-term contracts including derivative contracts; and
iii. There has been no delay in transferring amounts, required to be transferred, to the Investor Education and Protection Fund by the Parent Company and its subsidiary companies, associate companies and joint venture companies incorporated in India.
For DELOITTE HASKINS & SELLS LLP Chartered Accountants (Firm’sRegistrationNo.117366W/W-100018)
Sanjiv V. Pilgaonkar (Partner) (MembershipNo.039826) UDIN:20039826AAAADJ8143
Mumbai, June 5, 2020
468
AUDITORS’ REPORT ON CONSOLIDATED FINANCIAL STATEMENTS ANNUAL REPORT 2019-20
ANNEXURE “A” TO THE INDEPENDENT AUDITORS’ REPORT (Referred to in paragraph “(f)” under ‘Report on Other Legal and Regulatory Requirements’ section of our report of even date)
Report on the Internal Financial Controls Over Financial Reporting under Clause (i) of Sub-section 3 of Section 143 of the Companies Act, 2013 (the “Act”)
In conjunction with our audit of the consolidated financial statements of the Company as of and for the year ended March 31, 2020, we have audited the internal financial controls over financial reporting of LARSEN & TOUBRO LIMITED (hereinafter referred to as “Parent”) and its subsidiary companies which includes one of the Group’s 35 joint operations which is a company incorporated in India, its associate companies and joint ventures, which are companies incorporated in India, as of that date.
Management’s Responsibility for Internal Financial Controls
The respective Board of Directors of the Parent, its subsidiary companies, its joint operation, its associate companies and joint ventures, which are companies incorporated in India, are responsible for establishing and maintaining internal financial controls based on the internal control over financial reporting criteria established by the respective Companies considering the essential components of internal control stated in the Guidance Note on Audit of Internal Financial Controls Over Financial Reporting issued by the Institute of Chartered Accountants of India (“ICAI”). These responsibilities include the design, implementation and maintenance of adequate internal financial controls that were operating effectively for ensuring the orderly and efficient conduct of its business, including adherence to the respective company’s policies, the safeguarding of its assets, the prevention and detection of frauds and errors, the accuracy and completeness of the accounting records, and the timely preparation of reliable financial information, as required under the Companies Act, 2013.
Auditor’s Responsibility
Our responsibility is to express an opinion on the internal financial controls over financial reporting of the Parent, its subsidiary companies, its joint operation, its associate companies and its joint ventures, which are companies incorporated in India, based on our audit. We conducted our audit in accordance with the Guidance Note on Audit of Internal Financial Controls Over Financial Reporting (the “Guidance Note”) issued ICAI and the Standards on Auditing (“SA”), prescribed under Section 143(10) of the Companies Act, 2013, to the extent applicable to an audit of internal financial controls. Those Standards and the Guidance Note require that we comply with ethical requirements and plan and perform the audit to obtain reasonable assurance about whether adequate internal financial controls over financial reporting was established and maintained and if such controls operated effectively in all material respects.
Our audit involves performing procedures to obtain audit evidence about the adequacy of the internal financial controls system over financial reporting and their operating effectiveness. Our audit of internal financial controls over financial reporting included obtaining an understanding of internal financial controls over financial reporting, assessing the risk that a material weakness exists, and testing and evaluating the design and operating effectiveness of internal control based on the assessed risk. The procedures selected depend on the auditor’s judgement, including the assessment of the risks of material misstatement of the financial statements, whether due to fraud or error.
We believe that the audit evidence we have obtained and the audit evidence obtained by other auditors of the subsidiary companies, joint operation, associate companies and joint ventures, which are companies incorporated in India, in terms of their reports referred to in the Other Matters paragraph below, is sufficient and appropriate to provide a basis for our audit opinion on the internal financial controls system over financial reporting of the Parent, its subsidiary companies, its joint operation, its associate companies and its joint ventures, which are companies incorporated in India.
Meaning of Internal Financial Controls Over Financial Reporting
A company’s internal financial control over financial reporting is a process designed to provide reasonable assurance regarding the reliability of financial reporting and the preparation of financial statements for external purposes in accordance with generally accepted accounting principles. A Company’s internal financial control over financial reporting includes those policies and procedures that (1) pertain to the maintenance of records that, in reasonable detail, accurately and fairly reflect the transactions and dispositions of the assets of the company; (2) provide reasonable assurance that transactions are recorded as necessary to permit preparation of financial statements in accordance with generally accepted accounting principles, and that receipts and expenditures of the company are being made only in accordance with authorisations of management and directors of the company; and (3) provide reasonable assurance regarding prevention or timely detection of unauthorised acquisition, use, or disposition of the company’s assets that could have a material effect on the financial statements.
Inherent Limitations of Internal Financial Controls Over Financial Reporting
Because of the inherent limitations of internal financial controls over financial reporting, including the possibility of collusion or improper management override of controls, material misstatements due to error or fraud may occur and not be detected. Also, projections of any evaluation of the internal financial controls over financial reporting to future periods are subject to the risk that

469
the internal financial control over financial reporting may become inadequate because of changes in conditions, or that the degree of compliance with the policies or procedures may deteriorate.
Opinion
In our opinion to the best of our information and according to the explanations given to us and based on the consideration of the reports of the other auditors referred to in the Other Matters paragraph below, the Parent, its subsidiary companies, its joint operation, its associate companies and joint ventures, which are companies incorporated in India, have, in all material respects, an adequate internal financial controls system over financial reporting and such internal financial controls over financial reporting were operating effectively as at March 31, 2020, based on the criteria for internal financial controls over financial reporting established by the respective companies considering the essential components of internal control stated in the Guidance Note.
Other Matters
Our aforesaid report under Section 143(3)(i) of the Act on the adequacy and operating effectiveness of the internal financial controls over financial reporting in so far as it relates to 31 subsidiary companies, 1 joint operation company, 3 associate companies and 7 joint ventures, which are companies incorporated in India, is based solely on the corresponding reports of the auditors of such companies incorporated in India.
Our aforesaid report under Section 143(3)(i) of the Act on the adequacy and operating effectiveness of the internal financial controls over financial reporting in so far as it relates to 12 subsidiary companies, 1 associate and 3 joint venture companies, which are companies incorporated in India, whose financial information is unaudited and whose efficacy of internal financial controls over financial reporting is based solely on the Management’s certification provided to us and our opinion on the adequacy and operating effectiveness of the internal financial controls over financial reporting of the Group is not affected as the financial information of such entities is not material to the Group.
Our opinion is not modified in respect of the above matters with respect to our reliance on the work done by and the reports of such other auditors and the financial information certified by the Management.
For DELOITTE HASKINS & SELLS LLP Chartered Accountants (Firm‘sRegistrationNo.117366W/W-100018)
Sanjiv V. Pilgaonkar Partner (MembershipNo.039826) UDIN:20039826AAAADJ8143
Mumbai, June 5, 2020

470
CONSOLIDATED BALANCE SHEET ANNUAL REPORT 2019-20
Consolidated Balance Sheet as at March 31, 2020As at 31-3-2020 As at 31-3-2019
Note v crore v crore v crore v croreASSETS:Non-current assets Property, plant and equipment 2 10103.79 10889.56 Capital work-in-progress 2 3224.91 2483.56 Investment property 3 3714.72 4254.56 Goodwill 4 8011.40 1826.91 Other intangible assets 5 19596.98 4222.91 Intangible assets under development 5 86.18 11435.93 Right-of-use assets 61(c)(iii) 2226.49 – Financial assets Investments in joint ventures and associates 43(e) 2851.01 2642.29 Other investments 6 4496.72 4318.64 Loans towards financing activities 7 58589.36 57788.88 Other loans 8 1522.33 1481.08 Other financial assets 9 638.15 1144.05
68097.57 67374.94 Deferred tax assets (net) 51(d) 3846.58 3418.93 Other non-current assets 10 6541.62 5648.62Current assets Inventories 11 5746.65 6413.93 Financial assets Investments 12 12699.75 13946.17 Trade receivables 13 40731.52 36845.87 Cash and cash equivalents 14 11324.57 6509.49 Other bank balances 15 3793.21 5216.75 Loans towards financing activities 16 41723.42 42530.82 Other loans 17 716.00 626.69 Other financial assets 18 2927.87 2551.25
113916.34 108227.04 Other current assets 19 58659.69 52143.06Group(s) of assets classified as held for sale 45(d) 4367.21 7.41
TOTAL ASSETS 308140.13 278347.36

471
As at 31-3-2020 As at 31-3-2019Note v crore v crore v crore v crore
EQUITY AND LIABILITIES:Equity Equity share capital 20 280.78 280.55 Other equity 21 66442.44 62094.25
Equity attributable to owners of the Company 66723.22 62374.80 Non-controlling interests 9520.83 6826.11LiabilitiesNon-current liabilities Financial liabilities Borrowings 22 82331.33 74120.79 Lease liability 1741.60 – Other financial liabilities 23 901.14 354.83
84974.07 74475.62 Provisions 24 708.67 556.84 Deferred tax liabilities (net) 51(d) 1453.04 311.13 Other non-current liabilities 25 31.09 0.55 Current liabilities Financial liabilities Borrowings 26 35021.02 29223.84 Current maturities of long term borrowings 27 23654.77 22210.54 Lease liability 424.95 – Trade payables: Due to micro enterprises and small enterprises 479.51 261.12 Due to others 28 43164.42 42733.69 Other financial liabilities 29 4923.23 4622.78
107667.90 99051.97 Other current liabilities 30 30816.67 31166.55 Provisions 31 2750.85 2443.43 Current tax liabilities (net) 1509.62 1137.16Liabilities associated with group(s) of assets classified as held for sale 45(d) 1984.17 3.20
TOTAL EQUITY AND LIABILITIES 308140.13 278347.36
CONTINGENT LIABILITIES 32 COMMITMENTS (capital and others) 33NOTES FORMING PART OF THE FINANCIAL STATEMENTS 1 to 64
Consolidated Balance Sheet as at March 31, 2020 (contd.)
In terms of our report attachedFor DELOITTE HASKINS & SELLS LLPChartered Accountants S.N.SUBRAHMANYAN
Chief Executive Officer & Managing Director (DIN02255382)
Chennai
Firm’sRegistrationNo.117366W/W-100018by the hand of
SANJIV V. PILGAONKAR Partner R.SHANKAR RAMAN M.M.CHITALE
Independent DirectorMembershipNo.39826 Whole-time Director & Chief Financial OfficerMumbai (DIN00019798) (DIN00101004)
Mumbai Mumbai
SIVARAM NAIR ACompany Secretary & Compliance OfficerM. No. FCS3939Mumbai
June 5, 2020
472
CONSOLIDATED STATEMENT OF PROFIT AND LOSS ANNUAL REPORT 2019-20
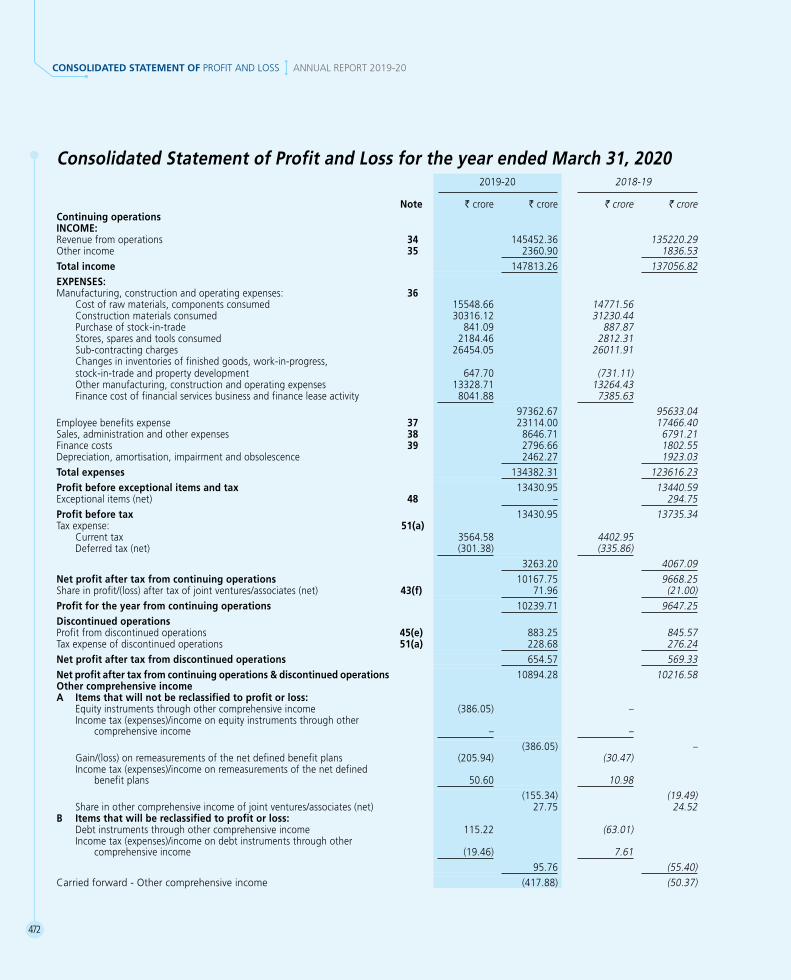
Consolidated Statement of Profit and Loss for the year ended March 31, 20202019-20 2018-19
Note v crore v crore v crore v crore
Continuing operationsINCOME:Revenue from operations 34 145452.36 135220.29 Other income 35 2360.90 1836.53Total income 147813.26 137056.82EXPENSES:Manufacturing, construction and operating expenses: 36 Cost of raw materials, components consumed 15548.66 14771.56 Construction materials consumed 30316.12 31230.44 Purchase of stock-in-trade 841.09 887.87 Stores, spares and tools consumed 2184.46 2812.31 Sub-contracting charges 26454.05 26011.91 Changes in inventories of finished goods, work-in-progress, stock-in-trade and property development 647.70 (731.11) Other manufacturing, construction and operating expenses 13328.71 13264.43 Finance cost of financial services business and finance lease activity 8041.88 7385.63
97362.67 95633.04Employee benefits expense 37 23114.00 17466.40Sales, administration and other expenses 38 8646.71 6791.21Finance costs 39 2796.66 1802.55Depreciation, amortisation, impairment and obsolescence 2462.27 1923.03 Total expenses 134382.31 123616.23Profit before exceptional items and tax 13430.95 13440.59 Exceptional items (net) 48 – 294.75 Profit before tax 13430.95 13735.34 Tax expense: 51(a) Current tax 3564.58 4402.95 Deferred tax (net) (301.38) (335.86)
3263.20 4067.09Net profit after tax from continuing operations 10167.75 9668.25Share in profit/(loss) after tax of joint ventures/associates (net) 43(f) 71.96 (21.00)Profit for the year from continuing operations 10239.71 9647.25Discontinued operationsProfit from discontinued operations 45(e) 883.25 845.57Tax expense of discontinued operations 51(a) 228.68 276.24Net profit after tax from discontinued operations 654.57 569.33Net profit after tax from continuing operations & discontinued operations 10894.28 10216.58Other comprehensive incomeA Items that will not be reclassified to profit or loss: Equity instruments through other comprehensive income (386.05) – Income tax (expenses)/income on equity instruments through other comprehensive income – –
(386.05) – Gain/(loss) on remeasurements of the net defined benefit plans (205.94) (30.47) Income tax (expenses)/income on remeasurements of the net defined benefit plans 50.60 10.98
(155.34) (19.49) Share in other comprehensive income of joint ventures/associates (net) 27.75 24.52 B Items that will be reclassified to profit or loss: Debt instruments through other comprehensive income 115.22 (63.01) Income tax (expenses)/income on debt instruments through other comprehensive income (19.46) 7.61
95.76 (55.40)Carried forward - Other comprehensive income (417.88) (50.37)
473
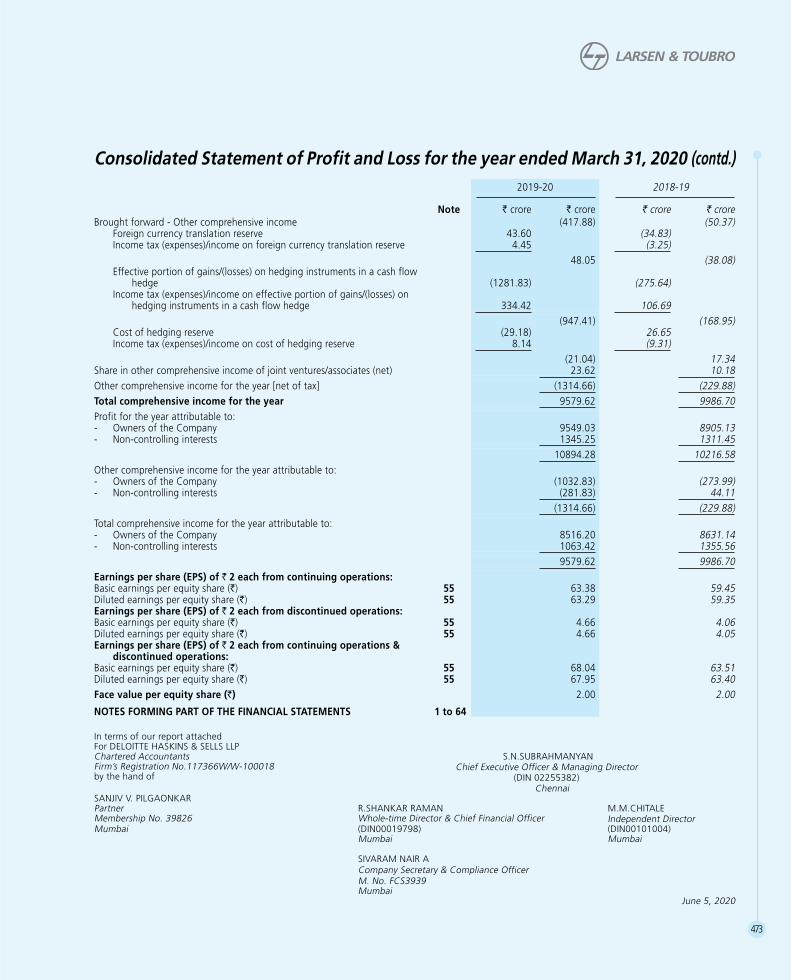
2019-20 2018-19
Note v crore v crore v crore v croreBrought forward - Other comprehensive income (417.88) (50.37) Foreign currency translation reserve 43.60 (34.83) Income tax (expenses)/income on foreign currency translation reserve 4.45 (3.25)
48.05 (38.08) Effective portion of gains/(losses) on hedging instruments in a cash flow hedge (1281.83) (275.64) Income tax (expenses)/income on effective portion of gains/(losses) on hedging instruments in a cash flow hedge 334.42 106.69
(947.41) (168.95) Cost of hedging reserve (29.18) 26.65 Income tax (expenses)/income on cost of hedging reserve 8.14 (9.31)
(21.04) 17.34 Share in other comprehensive income of joint ventures/associates (net) 23.62 10.18Other comprehensive income for the year [net of tax] (1314.66) (229.88)Total comprehensive income for the year 9579.62 9986.70Profit for the year attributable to:- Owners of the Company 9549.03 8905.13- Non-controlling interests 1345.25 1311.45
10894.28 10216.58Other comprehensive income for the year attributable to:- Owners of the Company (1032.83) (273.99)- Non-controlling interests (281.83) 44.11
(1314.66) (229.88)Total comprehensive income for the year attributable to:- Owners of the Company 8516.20 8631.14- Non-controlling interests 1063.42 1355.56
9579.62 9986.70Earnings per share (EPS) of R 2 each from continuing operations:Basic earnings per equity share (R) 55 63.38 59.45 Diluted earnings per equity share (R) 55 63.29 59.35 Earnings per share (EPS) of R 2 each from discontinued operations:Basic earnings per equity share (R) 55 4.66 4.06Diluted earnings per equity share (R) 55 4.66 4.05 Earnings per share (EPS) of R 2 each from continuing operations & discontinued operations:Basic earnings per equity share (R) 55 68.04 63.51Diluted earnings per equity share (R) 55 67.95 63.40Face value per equity share (R) 2.00 2.00
NOTES FORMING PART OF THE FINANCIAL STATEMENTS 1 to 64
Consolidated Statement of Profit and Loss for the year ended March 31, 2020 (contd.)
In terms of our report attachedFor DELOITTE HASKINS & SELLS LLPChartered Accountants S.N.SUBRAHMANYAN
Chief Executive Officer & Managing Director (DIN02255382)
Chennai
Firm’sRegistrationNo.117366W/W-100018by the hand of
SANJIV V. PILGAONKAR Partner R.SHANKAR RAMAN M.M.CHITALE
Independent DirectorMembershipNo.39826 Whole-time Director & Chief Financial OfficerMumbai (DIN00019798) (DIN00101004)
Mumbai Mumbai
SIVARAM NAIR ACompany Secretary & Compliance OfficerM. No. FCS3939Mumbai
June 5, 2020

474
CONSOLIDATED STATEMENT OF CHANGES IN EQUITY ANNUAL REPORT 2019-20
Consolidated Statement of Changes in Equity for the year ended March 31, 2020A. Equity share capital
Particulars
2019-20 2018-19
Number of shares
v crore Number of shares
v crore
Issued, subscribed and fully paid up equity shares outstanding at the beginning of the year 1,40,27,29,385 280.55 1,40,13,69,456 280.27Add: Shares issued on exercise of employee stock options during the year 7,83,249 0.16 13,59,929 0.28Add: Shares issued on conversion of foreign currency convertible bonds during the year 3,79,388 0.07 – –
Issued, subscribed and fully paid up equity shares outstanding at the end of the year 1,40,38,92,022 280.78 1,40,27,29,385 280.55
B. Other equityv crore
Particulars
Share application
money pending
allotment
Equity component
of foreign currency
convertible bonds
Reserves and surplus Items of other comprehensive income
Total other equity
Non-controlling
interestsTotalCapital
reserveCapital
redemption reserve
Securities premium
Employee share
options (net)
Statutory reserves
Retained earnings
Foreign currency
translation reserve
Hedging reserve
Debt instruments
through other
compre-hensive income
Equity instruments
through other
compre-hensive income
Balance as at 31-3-2018 3.56 153.20 282.44 42.00 8363.02 313.56 3352.91 41077.32 572.67 437.77 24.78 – 54623.23 5201.43 59824.66 Change in accounting policy [Ind AS 115] – – – – – – – (1237.65) – – – – (1237.65) (2.73) (1240.38)Restated balance as at 1-4-2018 3.56 153.20 282.44 42.00 8363.02 313.56 3352.91 39839.67 572.67 437.77 24.78 – 53385.58 5198.70 58584.28 Profit for the year (a) – – – – – – – 8905.13 – – – – 8905.13 1311.45 10216.58 Other comprehensive income (b) – – – – – – – (18.72) (31.94) (192.40) (55.15) 24.22 (273.99) 44.11 (229.88)
Total comprehensive income for the year (a+b) – – – – – – – 8886.41 (31.94) (192.40) (55.15) 24.22 8631.14 1355.56 9986.70
Issue of equity shares (3.56) – – – 108.97 – – – – – – – 105.41 6.50 111.91 Transfer to non- financial assets/liabilities – – – – – – – – – (0.37) – – (0.37) – (0.37)Transfer from/(to) retained earnings during
the year – – – – – (12.19) 498.77 (486.58) – – – – – – – Employee share options (net) – – – – – 35.68 – – – – – – 35.68 117.43 153.11 Dividend paid for previous year – – – – – – – (2243.18) – – – – (2243.18) (199.53) (2442.71)Additional tax on dividend paid for the
previous year – – – – – – – (427.02) – – – – (427.02) (50.01) (477.03)Net gain/loss on transactions with
non-controlling interests – – – – – – – 2634.66 – – – – 2634.66 (2634.66) – Increase in non-controlling interest due to
dilution/divestment/acquisition – – – – – – – (27.65) – – – – (27.65) 3032.12 3004.47
Balance as at 31-3-2019 – 153.20 282.44 42.00 8471.99 337.05 3851.68 48176.31 540.73 245.00 (30.37) 24.22 62094.25 6826.11 68920.36
475
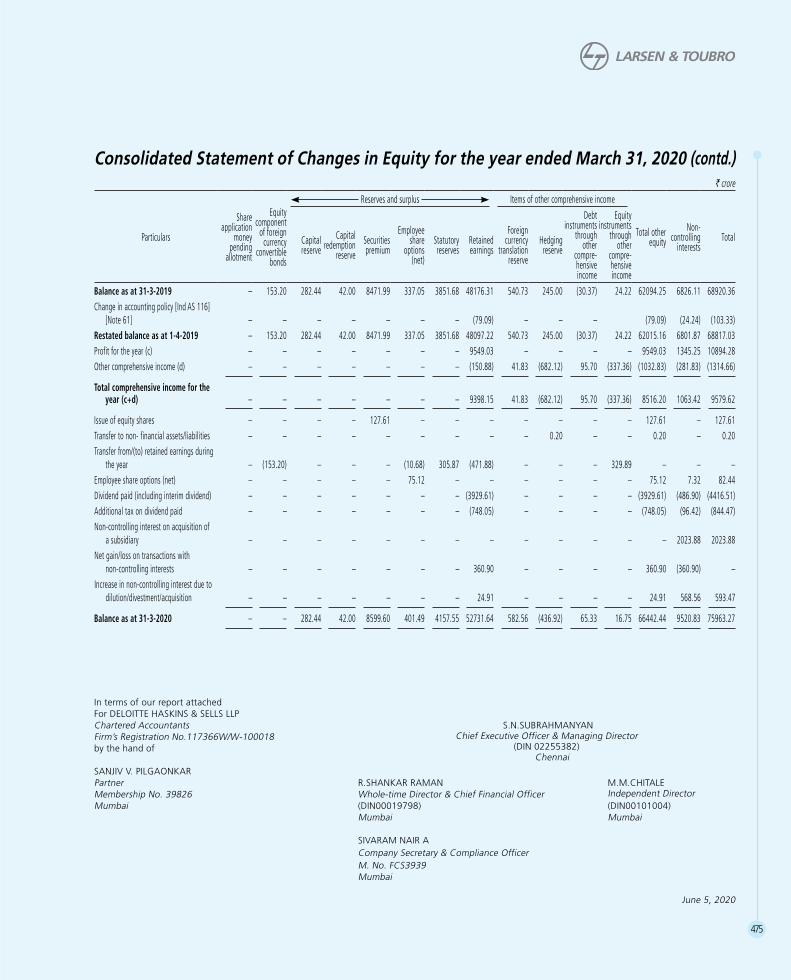
Consolidated Statement of Changes in Equity for the year ended March 31, 2020 (contd.)v crore
Particulars
Share application
money pending
allotment
Equity component
of foreign currency
convertible bonds
Reserves and surplus Items of other comprehensive income
Total other equity
Non-controlling
interestsTotalCapital
reserveCapital
redemption reserve
Securities premium
Employee share
options (net)
Statutory reserves
Retained earnings
Foreign currency
translation reserve
Hedging reserve
Debt instruments
through other
compre-hensive income
Equity instruments
through other
compre-hensive income
Balance as at 31-3-2019 – 153.20 282.44 42.00 8471.99 337.05 3851.68 48176.31 540.73 245.00 (30.37) 24.22 62094.25 6826.11 68920.36 Change in accounting policy [Ind AS 116]
[Note 61] – – – – – – – (79.09) – – – (79.09) (24.24) (103.33)Restated balance as at 1-4-2019 – 153.20 282.44 42.00 8471.99 337.05 3851.68 48097.22 540.73 245.00 (30.37) 24.22 62015.16 6801.87 68817.03 Profit for the year (c) – – – – – – – 9549.03 – – – – 9549.03 1345.25 10894.28 Other comprehensive income (d) – – – – – – – (150.88) 41.83 (682.12) 95.70 (337.36) (1032.83) (281.83) (1314.66)
Total comprehensive income for the year (c+d) – – – – – – – 9398.15 41.83 (682.12) 95.70 (337.36) 8516.20 1063.42 9579.62
Issue of equity shares – – – – 127.61 – – – – – – – 127.61 – 127.61 Transfer to non- financial assets/liabilities – – – – – – – – – 0.20 – – 0.20 – 0.20 Transfer from/(to) retained earnings during
the year – (153.20) – – – (10.68) 305.87 (471.88) – – – 329.89 – – – Employee share options (net) – – – – – 75.12 – – – – – – 75.12 7.32 82.44 Dividend paid (including interim dividend) – – – – – – – (3929.61) – – – – (3929.61) (486.90) (4416.51)Additional tax on dividend paid – – – – – – – (748.05) – – – – (748.05) (96.42) (844.47)Non-controlling interest on acquisition of
a subsidiary – – – – – – – – – – – – – 2023.88 2023.88 Net gain/loss on transactions with
non-controlling interests – – – – – – – 360.90 – – – – 360.90 (360.90) – Increase in non-controlling interest due to
dilution/divestment/acquisition – – – – – – – 24.91 – – – – 24.91 568.56 593.47
Balance as at 31-3-2020 – – 282.44 42.00 8599.60 401.49 4157.55 52731.64 582.56 (436.92) 65.33 16.75 66442.44 9520.83 75963.27
In terms of our report attachedFor DELOITTE HASKINS & SELLS LLPChartered Accountants S.N.SUBRAHMANYAN
Chief Executive Officer & Managing Director (DIN02255382)
Chennai
Firm’sRegistrationNo.117366W/W-100018by the hand of
SANJIV V. PILGAONKAR Partner R.SHANKAR RAMAN M.M.CHITALE
Independent DirectorMembershipNo.39826 Whole-time Director & Chief Financial OfficerMumbai (DIN00019798) (DIN00101004)
Mumbai Mumbai
SIVARAM NAIR ACompany Secretary & Compliance OfficerM. No. FCS3939Mumbai
June 5, 2020
476
CONSOLIDATED STATEMENT OF CASH FLOWS ANNUAL REPORT 2019-20
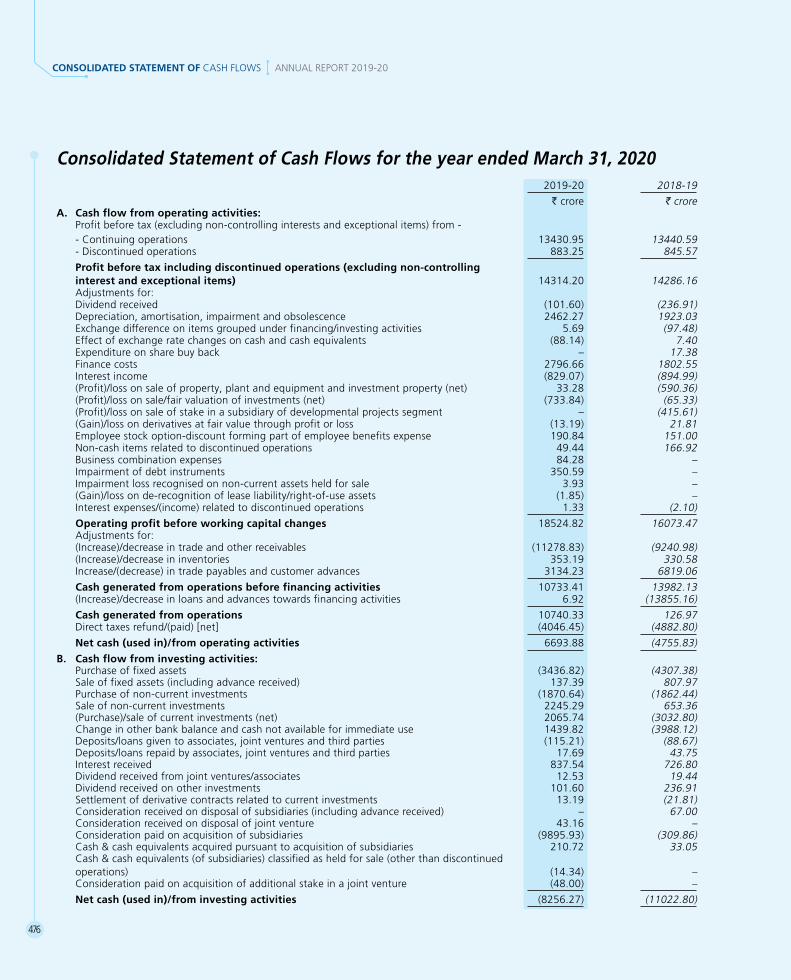
Consolidated Statement of Cash Flows for the year ended March 31, 20202019-20 2018-19
v crore v croreA. Cash flow from operating activities:
Profit before tax (excluding non-controlling interests and exceptional items) from -- Continuing operations 13430.95 13440.59 - Discontinued operations 883.25 845.57
Profit before tax including discontinued operations (excluding non-controlling interest and exceptional items) 14314.20 14286.16Adjustments for:Dividend received (101.60) (236.91)Depreciation, amortisation, impairment and obsolescence 2462.27 1923.03 Exchange difference on items grouped under financing/investing activities 5.69 (97.48)Effect of exchange rate changes on cash and cash equivalents (88.14) 7.40 Expenditure on share buy back – 17.38Finance costs 2796.66 1802.55Interest income (829.07) (894.99)(Profit)/loss on sale of property, plant and equipment and investment property (net) 33.28 (590.36)(Profit)/loss on sale/fair valuation of investments (net) (733.84) (65.33)(Profit)/loss on sale of stake in a subsidiary of developmental projects segment – (415.61)(Gain)/loss on derivatives at fair value through profit or loss (13.19) 21.81Employee stock option-discount forming part of employee benefits expense 190.84 151.00 Non-cash items related to discontinued operations 49.44 166.92Business combination expenses 84.28 –Impairment of debt instruments 350.59 –Impairment loss recognised on non-current assets held for sale 3.93 –(Gain)/loss on de-recognition of lease liability/right-of-use assets (1.85) –Interest expenses/(income) related to discontinued operations 1.33 (2.10)
Operating profit before working capital changes 18524.82 16073.47Adjustments for:(Increase)/decrease in trade and other receivables (11278.83) (9240.98)(Increase)/decrease in inventories 353.19 330.58Increase/(decrease) in trade payables and customer advances 3134.23 6819.06
Cash generated from operations before financing activities 10733.41 13982.13(Increase)/decrease in loans and advances towards financing activities 6.92 (13855.16)
Cash generated from operations 10740.33 126.97Direct taxes refund/(paid) [net] (4046.45) (4882.80)
Net cash (used in)/from operating activities 6693.88 (4755.83)
B. Cash flow from investing activities:Purchase of fixed assets (3436.82) (4307.38)Sale of fixed assets (including advance received) 137.39 807.97Purchase of non-current investments (1870.64) (1862.44)Sale of non-current investments 2245.29 653.36(Purchase)/sale of current investments (net) 2065.74 (3032.80)Change in other bank balance and cash not available for immediate use 1439.82 (3988.12)Deposits/loans given to associates, joint ventures and third parties (115.21) (88.67)Deposits/loans repaid by associates, joint ventures and third parties 17.69 43.75 Interest received 837.54 726.80Dividend received from joint ventures/associates 12.53 19.44 Dividend received on other investments 101.60 236.91Settlement of derivative contracts related to current investments 13.19 (21.81)Consideration received on disposal of subsidiaries (including advance received) – 67.00Consideration received on disposal of joint venture 43.16 –Consideration paid on acquisition of subsidiaries (9895.93) (309.86)Cash & cash equivalents acquired pursuant to acquisition of subsidiaries 210.72 33.05 Cash & cash equivalents (of subsidiaries) classified as held for sale (other than discontinued operations) (14.34) –Consideration paid on acquisition of additional stake in a joint venture (48.00) –
Net cash (used in)/from investing activities (8256.27) (11022.80)

477
Consolidated Statement of Cash Flows for the year ended March 31, 2020 (contd.)2019-20 2018-19
v crore v croreC. Cash flow from financing activities:
Proceeds from issue of share capital (including share application money) 17.56 11.31 Proceeds from non-current borrowings [Note 50] 42587.43 24181.62Repayment of non-current borrowings [Note 50] (33685.03) (14081.42)Proceeds from other borrowings (net) [Note 50] 4915.20 7765.14Payment (to)/from non-controlling interest (net)- including sale proceeds on divestment of part stake in subsidiary companies (60.05) 2884.85Settlement of derivative contracts related to borrowings 308.29 308.95Dividends paid (3929.61) (2243.18)Additional tax on dividend (621.72) (403.93)Repayment of lease liability [Note 50] (258.03) –Interest paid on lease liability (162.79) –Interest paid (including cash flows on account of interest rate swaps) (2739.70) (2983.17)Net cash (used in)/from financing activities 6371.55 15440.17 Net (decrease)/increase in cash and cash equivalents (A + B + C) 4809.16 (338.46)Cash and cash equivalents at beginning of the year 6460.23 6798.69Cash and cash equivalents for discontinued operations (classified as held for sale) (151.44) –Cash and cash equivalents at end of the year 11117.95 6460.23
Notes:1. Statement of Cash Flows has been prepared under the indirect method as set out in the Indian Accounting Standard (Ind AS) 7
“Statement of Cash Flows” as specified in the Companies (Indian Accounting Standards) Rules, 2015.2. Purchase & Sale of fixed assets represents additions & deletions to property, plant and equipment, investment property and
intangible assets adjusted for movement of (a) capital work-in-progress for property, plant and equipment and investment property and (b) Intangible assets under development during the year.
3. Cash and cash equivalents included in the Statement of Cash Flows comprise the following:
2019-20 2018-19
v crore v crore(a) Cash and cash equivalents disclosed under current assets [Note 14] 11324.57 6509.49(b) Other bank balances disclosed under current assets [Note 15] 3793.21 5216.75(c) Cash and bank balances disclosed under non-current assets [Note 9] 273.82 290.07
Total cash and cash equivalents as per Balance Sheet 15391.60 12016.31
Add: (i) Unrealised exchange (gain)/loss on cash and cash equivalents (reflected in Statement of Profit and loss) (116.39) (28.25)
Add: (ii) Unrealised exchange (gain)/loss on cash and cash equivalents (reflected in Other Comprehensive Income) (90.23) (21.01)
Less: (iii) Other bank balances disclosed under current assets [Note 15] 3793.21 5216.75Less: (iv) Cash and bank balances disclosed under non-current assets [Note 9] 273.82 290.07
Total cash and cash equivalents as per Statement of Cash Flows 11117.95 6460.23
4. Previous year’s figures have been regrouped/reclassified wherever applicable.
In terms of our report attachedFor DELOITTE HASKINS & SELLS LLPChartered Accountants S.N.SUBRAHMANYAN
Chief Executive Officer & Managing Director (DIN02255382)
Chennai
Firm’sRegistrationNo.117366W/W-100018by the hand of
SANJIV V. PILGAONKAR Partner R.SHANKAR RAMAN M.M.CHITALE
Independent DirectorMembershipNo.39826 Whole-time Director & Chief Financial OfficerMumbai (DIN00019798) (DIN00101004)
Mumbai Mumbai
SIVARAM NAIR ACompany Secretary & Compliance OfficerM. No. FCS3939Mumbai
June 5, 2020

478
NOTES FORMING PART OF THE CONSOLIDATED FINANCIAL STATEMENTS ANNUAL REPORT 2019-20
NOTE [1](I)
Corporate Information
The Consolidated Financial Statements comprise financial statements of “Larsen & Toubro Limited” (“L&T”, the “Parent Company”) and its subsidiaries (collectively referred to as “the Group”) for the year ended March 31, 2020.
The principal activities of the Group, its Joint Ventures and associates consist of providing Engineering and Construction solutions in key sectors such as Infrastructure, Hydrocarbon, Power, Process Industries and Defence, Information Technology and Financial Services. FurtherdetailsofthebusinessoperationsoftheGrouparementionedinNote[46]SegmentInformation.
NOTE [1](II)
Significant Accounting Policies
(a) Statement of compliance
The Group’s financial statements have been prepared in accordance with the provisions of the Companies Act, 2013 and the Indian Accounting Standards (Ind AS) notified under the Companies (Indian Accounting Standards) Rules, 2015 and amendments thereof issued by the Ministry of Corporate Affairs in exercise of the powers conferred by section 133 of the Companies Act, 2013. In addition, the guidance notes/announcements issued by the Institute of Chartered Accountants of India (ICAI) are also applied except where compliance with other statutory promulgations require a different treatment. These financials statements have been approved for issue by the Board of Directors at their meeting held on June 5, 2020.
(b) Basis of accounting
The Group maintains its accounts on accrual basis following historical cost convention, except for certain assets and liabilities that are measured at fair value in accordance with Ind AS.
Fair value measurements are categorised as below based on the degree to which the inputs to the fair value measurements are observable and the significance of the inputs to the fair value measurement in its entirety:
(i) Level 1 inputs are quoted prices (unadjusted) in active markets for identical assets or liabilities that the Group can access at measurement date
(ii) Level 2 inputs are inputs, other than quoted prices included in level 1, that are observable for the asset or liability, either directly or indirectly; and
(iii) Level 3 inputs are unobservable inputs for the valuation of assets or liabilities
Above levels of fair value hierarchy are applied consistently and generally, there are no transfers between the levels of the fair value hierarchy unless the circumstances change warranting such transfer.
(c) Presentation of financial statements
The Balance Sheet, Statement of Profit and Loss and Statement of Changes in Equity are prepared and presented in the format prescribed in the Schedule III to the Companies Act, 2013 (“the Act”). The Statement of Cash Flows has been prepared and presented as per the requirements of Ind AS 7 “Statement of Cash Flows”. The disclosure requirements with respect to items in the Balance Sheet and Statement of Profit and Loss, as prescribed in the Schedule III to the Act, are presented by way of notes forming part of the financial statements along with the other notes required to be disclosed under the notified Accounting Standards and the SEBI (Listing Obligations and Disclosure Requirements) Regulations, 2015 as amended.
Amounts in the financial statements are presented in Indian Rupees in crore [1 crore = 10 million] rounded off to two decimal places as permitted by Schedule III to the Companies Act, 2013. Per share data are presented in Indian Rupees to two decimal places.
(d) Basis of consolidation
(i) The consolidated financial statements incorporate the financial statements of the Parent Company and its subsidiaries. For this purpose, an entity which is, directly or indirectly, controlled by the Parent Company is treated as subsidiary. The Parent Company together with its subsidiaries constitute the Group. Control exists when the Parent Company, directly or indirectly, has power over the investee, is exposed to variable returns from its involvement with the investee and has the ability to use its power to affect its investor’s returns.
Notes forming part of the Consolidated Financial Statements

479
(ii) Consolidation of a subsidiary begins when the Parent Company, directly or indirectly, obtains control over the subsidiary and ceases when the Parent Company, directly or indirectly, loses control of the subsidiary. Income and expenses of a subsidiary acquired or disposed of during the year are included in the consolidated Statement of Profit and Loss from the date the Parent Company, directly or indirectly, gains control until the date when the Parent Company, directly or indirectly, ceases to control the subsidiary.
(iii) The consolidated financial statements of the Group combines financial statements of the Parent Company and its subsidiaries line-by-line by adding together the like items of assets, liabilities, income and expenses. All intra-group assets, liabilities, income, expenses and unrealised profits/losses on intra-group transactions are eliminated on consolidation. The accounting policies of subsidiaries have been harmonised to ensure the consistency with the policies adopted by the Parent Company. The consolidated financial statements have been presented to the extent possible, in the same manner as Parent Company’s standalone financial statements.
Profit or loss and other comprehensive income are attributed to the owners of the Parent Company and to the non- controlling interests and have been shown separately in the financial statements.
(iv) Non-controlling interests represent that part of the total comprehensive income and net assets of subsidiaries attributable to interest which is not owned, directly or indirectly, by the Parent Company.
(v) The gains/losses in respect of part divestment/dilution of stake in subsidiary companies not resulting in ceding of control, are recognised directly in other equity attributable to the owners of the Parent Company.
(vi) The gains/losses in respect of divestment of stake resulting in ceding of control in subsidiary companies are recognised in the Statement of Profit and Loss. The investment representing the interest retained in a former subsidiary, if any, is initially recognised at its fair value with the corresponding effect recognised in the Statement of Profit and Loss as on the date the control is ceded. Such retained interest is subsequently accounted as an associate or a joint venture or a financial asset.
(e) Investments in joint ventures and associates
When the Group has with other parties joint control of the arrangement and rights to the net assets of the joint arrangement, it recognises its interest as joint ventures. Joint control exists when the decisions about the relevant activities require unanimous consent of the parties sharing the control. When the Group has significant influence over the other entity, it recognises such interests as associates. Significant influence is the power to participate in the financial and operating policy decisions of the entity but is not control or joint control over the entity.
The results, assets and liabilities of joint ventures and associates are incorporated in the consolidated financial statements using equity method of accounting after making necessary adjustments to achieve uniformity in application of accounting policies, wherever applicable.
An investment in joint venture or associate is initially recognised at cost and adjusted thereafter to recognise the Group’s share of profit or loss and other comprehensive income of the joint venture or associate. Gain or loss in respect of changes in other equity of joint ventures or associates resulting in divestment or dilution of stake in the joint ventures and associates is recognised in the Statement of Profit and Loss. On acquisition of investment in a joint venture or associate, any excess of cost of investment over the fair value of the assets and liabilities of the joint venture and associate, is recognised as goodwill and is included in the carrying value of the investment in the joint venture and associate. The excess of fair value of assets and liabilities over the investment is recognised directly in equity as capital reserve. The unrealised profits/losses on transactions with joint ventures and associates are eliminated by reducing the carrying amount of investment.
The carrying amount of investment in joint ventures and associates is reduced to recognise impairment, if any, when there is evidence of impairment.
When the Group’s share of losses of a joint venture or an associate exceeds the Group’s interest in that joint venture or associate (which includes any long term interests that, in substance, form part of the Group’s net investment in the joint venture or associate), the Group discontinues recognising its share of further losses. Additional losses are recognised only to the extent that the Group has incurred legal or constructive obligations or made payments on behalf of the joint venture or associate.
Notes forming part of the Consolidated Financial Statements (contd.)NOTE [1](II) (contd.)

480
NOTES FORMING PART OF THE CONSOLIDATED FINANCIAL STATEMENTS ANNUAL REPORT 2019-20
(f) Interests in joint operations
When the Group has joint control of the arrangement based on contractually determined right to the assets and obligations for liabilities, it recognises such interests as joint operations. Joint control exists when the decisions about the relevant activities require unanimous consent of the parties sharing the control. In respect of its interests in joint operations, the Group recognises its share in assets, liabilities, income and expenses line-by-line in the standalone financial statements of the entity which is party to such joint arrangement which then becomes part of the consolidated financial statements of the Group when the financial statements of the Parent Company and its subsidiaries are combined for consolidation. Interests in joint operations are included in the segments to which they relate.
(g) Business Combination/Goodwill on consolidation
The Group accounts for its business combinations under acquisition method of accounting. Acquisition related costs are recognised in the Statement of Profit and Loss as incurred. The acquiree’s identifiable assets, liabilities and contingent liabilities that meet the condition for recognition are recognised at their fair values at the acquisition date.
Goodwill on consolidation as on the date of transition i.e. April 1, 2015 represents the excess of cost of acquisition at each point of time of making the investment in the subsidiary over the Group’s share in the net worth of a subsidiary. For this purpose, the Group’s share of net worth is determined on the basis of the latest financial statements, prior to the acquisition, after making necessary adjustments for material events between the date of such financial statements and the date of respective acquisition. Capital reserve on consolidation represents excess of the Group’s share in the net worth of a subsidiary over the cost of acquisition at each point of time of making the investment in the subsidiary.
Goodwill on consolidation arising on acquisitions on or after the date of transition represents the excess of (a) consideration paid for acquiring control and (b) acquisition date fair value of previously held ownership interest, if any, in a subsidiary over the Group’s share in the fair value of the net assets (including identifiable intangibles) of the subsidiary as on the date of acquisition of control.
Goodwill on consolidation is allocated to cash generating units or group of cash generating units that are expected to benefit from the synergies of the acquisition.
Goodwill arising on consolidation is not amortised, however, it is tested for impairment annually. In the event of cessation of operations of a subsidiary, the unimpaired goodwill is written off fully.
Business combinations arising from transfers of interests in entities that are under common control are accounted at historical cost. The difference between any consideration given and the aggregate historical carrying amounts of assets and liabilities of the acquired entity are recorded in shareholders’ equity.
(h) Operating cycle for current and non-current classification
Operating cycle for the business activities of the Group covers the duration of the specific project/contract/product line/service including the defect liability period, wherever applicable and extends up to the realisation of receivables (including retention monies) within the agreed credit period normally applicable to the respective lines of business.
(i) Revenue recognition
The Group recognises revenue from contracts with customers when it satisfies a performance obligation by transferring promised goods or service to a customer. The revenue is recognised to the extent of transaction price allocated to the performance obligation satisfied. Performance obligation is satisfied over time when the transfer of control of good or service to a customer is done over time and in other cases, performance obligation is satisfied at a point in time. For performance obligation satisfied over time, the revenue recognition is done by measuring the progress towards complete satisfaction of performance obligation. The progress is measured in terms of a proportion of actual cost incurred to-date, to the total estimated cost attributable to the performance obligation.
Transaction price is the amount of consideration to which the Group expects it to be entitled in exchange for transferring goods or services to a customer excluding amounts collected on behalf of a third party. Variable consideration is estimated using the expected value method or most likely amount as appropriate in a given circumstance. Payment terms agreed with a customer are as per business practice and the financing component, if significant, is separated from the transaction price and accounted as interest income.
Notes forming part of the Consolidated Financial Statements (contd.)NOTE [1](II) (contd.)

481
Costs to obtain a contract which are incurred regardless of whether the contract was obtained are charged-off in profit & loss immediately in the period in which such costs are incurred. Incremental costs of obtaining a contract, if any, and costs incurred to fulfil a contract are amortised over the period of execution of the contract in proportion to the progress measured in terms of a proportion of actual cost incurred to-date, to the total estimated cost attributable to the performance obligation.
Significant judgments are used in:
a. Determining the revenue to be recognised in case of performance obligation satisfied over a period of time. Revenue recognition is done by measuring the progress towards complete satisfaction of performance obligation. The progress is measured in terms of a proportion of actual cost incurred to-date, to the total estimated cost attributable to the performance obligation.
b. Determining the estimated losses, which are recognised in the period in which such losses become probable based on the expected total contract cost as at the reporting date.
c. Determining the method to be applied to arrive at the variable consideration requiring an adjustment to the transaction price.
Revenue includes adjustments made towards liquidated damages and variation wherever applicable. Escalation and other claims, which are not ascertainable/acknowledged by customers are not taken into account.
A. Revenue from sale of goods including contracts for supply/commissioning of complex plant and equipment is recognised as follows:
Revenue from sale of manufactured and traded goods is recognised when the control of the same is transferred to the customer and it is probable that the Group will collect the consideration to which it is entitled for the exchanged goods. Performance obligations in respect of contracts for sale of manufactured and traded goods is considered as satisfied at a point in time when the control of the same is transferred to the customer and where there is an alternative use of the asset or the company does not have either explicit or implicit right of payment for performance completed till date. In case where there is no alternative use of the asset and the company has either explicit or implicit right of payment considering legal precedents, performance obligation is considered as satisfied over a period of time and revenue is recognised over time.
B. Revenue from construction/project related activity is recognised as follows:
• Costpluscontracts:Revenuefromcostpluscontractsisrecognisedovertimeandisdeterminedwithreferencetotheextent performance obligations have been satisfied. The amount of transaction price allocated to the performance obligations satisfied represents the recoverable costs incurred during the period plus the margin as agreed with the customer.
• Fixedpricecontracts:Contractrevenueisrecognisedovertimetotheextentofperformanceobligationsatisfiedandcontrol is transferred to the customer. Contract revenue is recognised at allocable transaction price which represents the cost of work performed on the contract plus proportionate margin, using the percentage of completion method. Percentage of completion is the proportion of cost of work performed to-date, to the total estimated contract costs.
Impairment loss (termed as provision for foreseeable losses in the financial statements) is recognised in profit or loss to the extent the carrying amount of the contract asset exceeds the remaining amount of consideration that the company expects to receive towards remaining performance obligations (after deducting the costs that relate directly to fulfill such remaining performance obligations). In addition, the Group recognises impairment loss (termed as provision for expected credit loss on contract assets in the financial statements) on account of credit risk in respect of a contract asset using expected credit loss model on similar basis as applicable to trade receivables.
For contracts where the aggregate of contract cost incurred to date plus recognised profits (or minus recognised losses as the case may be) exceeds the progress billing, the surplus is shown as contract asset and termed as “Due from customers”. For contracts where progress billing exceeds the aggregate of contract costs incurred to-date plus recognised profits (or minus recognised losses, as the case may be), the surplus is shown as contract liability and termed as “Due to customers”. Amounts received before the related work is performed are disclosed in the Balance Sheet as contract liability and termed as “Advances from customer”. The amounts billed on customer for work performed and are unconditionally due for payment i.e only passage of time is required before payment falls due, are disclosed in the Balance Sheet as trade receivables. The amount of
Notes forming part of the Consolidated Financial Statements (contd.)NOTE [1](II) (contd.)

482
NOTES FORMING PART OF THE CONSOLIDATED FINANCIAL STATEMENTS ANNUAL REPORT 2019-20
retention money held by the customers pending completion of performance milestone is disclosed as part of contract asset and is reclassified as trade receivables when it becomes due for payment.
C. Revenue from construction/project related activity and contracts executed in joint arrangements under work-sharing arrangement [being joint operations, in terms of Ind AS 111 “Joint Arrangements”], is recognised on the same basis as adopted in respect of contracts independently executed by the Group.
D. Revenue from property development activities is recognised when performance obligation is satisfied, customer obtains control of the property transferred and a reasonable expectation of collection of the sale consideration from the customer exists. The costs incurred on property development activities are carried as “Inventories” till such time the aforesaid conditions are fulfilled.
E. In the case of the developmental project business and the realty business, revenue includes profit on sale of investment properties or sale of stake in the subsidiary and/or joint venture companies as the sale/divestments are inherent in the business model.
F. Rendering of services
Revenue from rendering of services is recognised over time as and when the customer receives the benefit of the company’s performance and the company has an enforceable right to payment for services transferred.
Unbilled revenue represents value of services performed in accordance with the contract terms but not billed.
In respect of information technology (IT) business and technology services business, revenue from contracts awarded on time and material basis is recognised over a period of time when relevant services are rendered and related costs are incurred. Revenue from fixed price contracts is recognised over a period of time using the proportionate completion method.
Revenue from contracts for rendering of engineering design services and other services which are directly related to the construction of an asset is recognised on the same basis as stated in (i) B above.
G. Income from interest-bearing loans is recognised on accrual basis over the life of the loans based on the effective yield. Income from bill discounting, advisory and syndication services and other financing activities is accounted on accrual basis.
H. Revenue on account of construction services rendered in connection with Build-Operate-Transfer (BOT) projects undertaken by the Group is recognised during the period of construction using percentage of completion method. After the completion of construction period, revenue relatable to fare/toll collections of such projects from users of facilities is accounted when the amount is due and recovery is certain. License fees for way-side amenities are accounted on accrual basis.
I. Commission income is recognised as and when the terms of the contract are fulfilled.
J. Income from investment management fees is recognised in accordance with the contractual terms and the SEBI regulations based on average Assets Under Management (AUM) of mutual fund schemes over the period of the agreement in terms of which services are performed. Portfolio management fees are recognised in accordance with the related contracts entered with the clients over the period of the agreement. Trusteeship fees are accounted on accrual basis.
K. Revenue from port operation services (upto the date of sale) is recognised on completion of respective services or as per terms agreed with the port operator, wherever applicable.
L. Revenue from charter hire is recognised based on the terms of the time charter agreement.
M. Revenue from operation and maintenance services of power plant receivable under the Power Purchase Agreement is recognised on accrual basis.
N. Other operational revenue represents income earned from the activities incidental to the business and is recognised when the performance obligation is satisfied and the right to receive the income is established as per the terms of the contract.
(j) Other income
A. Interest income on investments and loans is accrued on a time basis by reference to the principal outstanding and the effective interest rate including interest on investments classified as fair value through profit or loss or fair value through other
Notes forming part of the Consolidated Financial Statements (contd.)NOTE [1](II) (contd.)

483
comprehensive income. Interest receivable on customer dues is recognised as income in the Statement of Profit and Loss on accrual basis provided there is no uncertainty towards its realisation.
B. Dividend income is accounted in the period in which the right to receive the same is established.
C. Government grants, which are revenue in nature and are towards compensation for the qualifying costs, incurred by the Group, are recognised as other income/ reduced from underlying expenses in the Statement of Profit and Loss in the period in which such costs are incurred. Government grant receivable in the form duty credit scrips is recognised as other income in the Statement of Profit and Loss in the period in which the application is made to the government authorities and to the extent there is no uncertainty towards its receipt.
D. Other items of income are accounted as and when the right to receive such income arises and it is probable that the economic benefits will flow to the group and the amount of income can be measured reliably.
(k) Exceptional items
An item of income or expense which by its size, type or incidence requires disclosure in order to improve an understanding of the performance of the Group is treated as an exceptional item and the same is disclosed in the notes to accounts. (read with Note [1](II)(y)(i)(b))
(l) Property, plant and equipment (PPE)
PPE is recognised when it is probable that future economic benefits associated with the item will flow to the Group and the cost of the item can be measured reliably. PPE is stated at original cost net of tax/duty credits availed, if any, less accumulated depreciation and cumulative impairment, if any.
All directly attributable costs related to the acquisition of PPE and borrowing costs in case of qualifying assets are capitalised in accordance with the Group’s accounting policy.
Own manufactured PPE is capitalised at cost including an appropriate share of overheads. Administrative and other general overhead expenses that are specifically attributable to construction or acquisition of PPE or bringing the PPE to working condition are allocated and capitalised as a part of the cost of the PPE.
Subsequent costs are included in the assets’ carrying amount or recognised as a separate asset, as appropriate, only when it is probable that future economic benefits associated with the item will flow to the entity and the cost can be measured reliably.
PPE not ready for the intended use on the date of the Balance Sheet are disclosed as “capital work-in-progress”. (Also refer to policies on leases, borrowing costs, impairment of assets and foreign currency transactions below).
Depreciation is recognised using straight line method so as to write off the cost of the assets (other than freehold land and properties under construction) less their residual values over their useful lives specified in Schedule II to the Companies Act, 2013, or in case of assets where the useful life was determined by technical evaluation, over the useful life so determined. Depreciation method is reviewed at each financial year end to reflect the expected pattern of consumption of the future economic benefits embodied in the asset. The estimated useful life and residual values are also reviewed at each financial year end with the effect of any change in the estimates of useful life/residual value is accounted on prospective basis.
Where cost of a part of the asset (“asset component”) is significant to total cost of the asset and useful life of that part is different from the useful life of the remaining asset, useful life of that significant part is determined separately and such asset component is depreciated over its separate useful life.
Depreciation on additions to/deductions from, owned assets is calculated pro rata from the date it is ready for use.
Depreciation charge for impaired assets is adjusted in future periods in such a manner that the revised carrying amount of the asset is allocated over its remaining useful life.
Freehold land is not depreciated. PPE is derecognised upon disposal or when no future economic benefits are expected from its use or disposal.
Any gain or loss arising on derecognition is recognised in the Statement of Profit and Loss in the same period.
Notes forming part of the Consolidated Financial Statements (contd.)NOTE [1](II) (contd.)

484
NOTES FORMING PART OF THE CONSOLIDATED FINANCIAL STATEMENTS ANNUAL REPORT 2019-20
(m) Investment property
Properties (including those under construction) held to earn rentals and/or capital appreciation are classified as investment property and are measured and reported at cost, including transaction costs and borrowing cost capitalised for qualifying assets, in accordance with the Group’s accounting policy.
Depreciation is recognised using straight line method so as to write off the cost of the investment property less their residual values over their useful lives specified in Schedule II to the Companies Act, 2013, or in the case of assets where the useful life was determined by technical evaluation, over the useful life so determined. Depreciation method is reviewed at each financial year end to reflect the expected pattern of consumption of the future benefits embodied in the investment property. The estimated useful life and residual values are also reviewed at each financial year end and the effect of any change in the estimates of useful life/ residual value is accounted on prospective basis. Freehold land and properties under construction are not depreciated.
An investment property is derecognised upon disposal or when the investment property is permanently withdrawn from use and no future economic benefits are expected from the disposal. Any gain or loss arising on derecognition of property is recognised in the Statement of Profit and Loss in the same period.
(n) Intangible assets
Intangible assets are recognised when it is probable that the future economic benefits that are attributable to the asset will flow to the enterprise and the cost of the asset can be measured reliably. Intangible assets are stated at original cost net of tax/duty credits availed, if any, including borrowing costs capitalised for qualifying assets and reduced by accumulated amortisation and cumulative impairment. Administrative and other general overhead expenses that are specifically attributable to acquisition of intangible assets are allocated and capitalised as a part of the cost of the intangible assets.
Research and development expenditure on new products:
(i) Expenditure on research is expensed under respective heads of account in the period in which it is incurred
(ii) Development expenditure on new products is capitalised as intangible asset, if all of the following can be demonstrated:
A. the technical feasibility of completing the intangible asset so that it will be available for use or sale;
B. the Group has intention to complete the intangible asset and use or sell it;
C. the Group has ability to use or sell the intangible asset;
D. the manner in which the probable future economic benefits will be generated including the existence of a market for output of the intangible asset or intangible asset itself or if it is to be used internally, the usefulness of intangible assets;
E. the availability of adequate technical, financial and other resources to complete the development and to use or sell the intangible asset; and
F. the Group has ability to reliably measure the expenditure attributable to the intangible asset during its development. Development expenditure that does not meet the above criteria is expensed in the period in which it is incurred.
Intangible assets not ready for the intended use on the date of the Balance Sheet are disclosed as “intangible assets under development”.
Intangible assets are amortised on straight line basis over the estimated useful life. The method of amortisation and useful life are reviewed at the end of each accounting year with the effect of any changes in the estimate being accounted for on a prospective basis. The estimated useful life for major categories of the intangible assets are as follows:
(i) Specialised software: over a period of three to ten years;
(ii) Technical know-how: over a period of three to seven years;
(iii) Development costs for new products: over a period of five years;
(iv) Customer contracts and relationships: over a period of the contract which generally is over three to ten years;
(v) Tradename: over a period of 5 years;
(vi) Intangible assets with indefinite useful life that are acquired separately are carried at cost less accumulated impairment losses;
Notes forming part of the Consolidated Financial Statements (contd.)NOTE [1](II) (contd.)
485
(vii) Fare collection rights obtained in consideration for rendering construction services represent the right to collect fare during the concession period in respect of Build-Operate-Transfer (BOT) projects undertaken by the Group. Fare collection rights are capitalised as intangible asset upon completion of the project at the cumulative construction costs including related margins. Till the completion of the project, the same is recognised as intangible assets under development. Fare collection rights are amortised using the straight-line method over the period of concession; and
(viiii) Amortisation on impaired assets is provided by adjusting the amortisation charge in the remaining periods so as to allocate the asset’s revised carrying amount over its remaining useful life.
(o) Impairment of assets
As at the end of each accounting year, the Group reviews the carrying amounts of its PPE, investment property and intangible assets to determine whether there is any indication that those assets have suffered an impairment loss. If such indication exists, the PPE, investment property and intangible assets are tested for impairment so as to determine the impairment loss, if any. Goodwill and the intangible assets with indefinite life are tested for impairment each year.
Impairment loss is recognised when the carrying amount of an asset exceeds its recoverable amount. Recoverable amount is determined:
(i) in the case of an individual asset, at the higher of the net selling price and the value in use; and
(ii) in the case of a cash generating unit (the smallest identifiable group of assets that generates independent cash flows), at the higher of the cash generating unit’s net selling price and the value in use.
(The amount of value in use is determined as the present value of estimated future cash flows from the continuing use of an asset, which may vary based on the future performance of the entity and from its disposal at the end of its useful life. For this purpose, the discount rate (pre-tax) is determined based on the weighted average cost of capital of the company suitably adjusted for risks specified to the estimated cash flows of the asset).
If recoverable amount of an asset (or cash generating unit) is estimated to be less than its carrying amount, such deficit is recognised immediately in the Statement of Profit and Loss as impairment loss and the carrying amount of the asset (or cash generating unit) is reduced to its recoverable amount. For this purpose, the impairment loss recognised in respect of a cash generating unit is allocated first to reduce the carrying amount of any goodwill allocated to such cash generating unit and then to reduce the carrying amount of the other assets of the cash generating unit on a pro-rata basis.
When an impairment loss subsequently reverses, the carrying amount of the asset (or cash generating unit), except for allocated goodwill, is increased to the revised estimate of its recoverable amount, so that the increased carrying amount does not exceed the carrying amount that would have been determined had no impairment loss is recognised for the asset (or cash generating unit) in prior years. A reversal of an impairment loss (other than impairment loss allocated to goodwill) is recognised immediately in the Statement of Profit and Loss.
(p) Employee benefits
(i) Short term employee benefits:
Employee benefits such as salaries, wages, short term compensated absences, expected cost of bonus, ex-gratia, and performance linked rewards falling due wholly within twelve months of rendering the service are classified as short term employee benefits and are expensed in the period in which the employee renders the related service.
(ii) Post-employment benefits:
A. Defined contribution plans: The Group’s superannuation scheme, state governed provident fund scheme, employee state insurance scheme, social security contributions and employee pension scheme are defined contribution plans. The contribution paid/payable under the schemes is recognised during the period in which the employee renders the related service.
B. Defined benefit plans: The employees’ gratuity fund schemes and employee provident fund schemes managed by board of trustees established by the company, the post-retirement medical care plan and the Parent Company pension plan represent defined benefit plans. The present value of the obligation under defined benefit plans is determined based on actuarial valuation using the Projected Unit Credit Method.
Notes forming part of the Consolidated Financial Statements (contd.)NOTE [1](II) (contd.)
486
NOTES FORMING PART OF THE CONSOLIDATED FINANCIAL STATEMENTS ANNUAL REPORT 2019-20
The obligation is measured at the present value of the estimated future cash flows using a discount rate based on the market yield on government securities of a maturity period equivalent to the weighted average maturity profile of the defined benefit obligations at the Balance Sheet date.
Re-measurement, comprising actuarial gains and losses, the return on plan assets (excluding amounts included in net interest on the net defined benefit liability or asset) and any change in the effect of asset ceiling (if applicable) is recognised in other comprehensive income and is reflected in retained earnings and the same is not eligible to be reclassified to profit or loss.
Defined benefit costs comprising current service cost, past service cost and gains or losses on settlements are recognised in the Statement of Profit and Loss as employee benefits expense. Interest cost implicit in defined benefit employee cost is recognised in the Statement of Profit and Loss under finance cost. Gains or losses on settlement of any defined benefit plan are recognised when the settlement occurs. Past service cost is recognised as expense at the earlier of the plan amendment or curtailment and when the Group recognises related restructuring costs or termination benefits.
In case of funded plans, the fair value of the plan assets is reduced from the gross obligation under the defined benefit plans to recognise the obligation on a net basis.
(iii) Long term employee benefits:
The obligation recognised in respect of long term benefits such as compensated absences, long service award etc. is measured at present value of estimated future cash flows expected to be made by the Group and is recognised in a similar manner as in the case of defined benefit plans vide (ii) B above.
Long term employee benefit costs comprising current service cost and gains or losses on curtailments and settlements, re-measurements including actuarial gains and losses are recognised in the Statement of Profit and Loss as employee benefit expenses. Interest cost implicit in long term employee benefit cost is recognised in the Statement of Profit and Loss under finance cost.
(iv) Termination benefits:
Termination benefits such as compensation under employee separation schemes are recognised as expense when the company’s offer of the termination benefit is accepted or when the Group recognises the related restructuring costs whichever is earlier.
(q) Leases
LeasesareaccountedasperIndAS116whichhasbecomemandatoryfromApril1,2019.
Assets taken on lease are accounted as right-of-use assets and the corresponding lease liability is accounted at the lease commencement date.
Initially the right-of-use asset is measured at cost which comprises the initial amount of the lease liability adjusted for any lease payments made at or before the commencement date, plus any initial direct costs incurred and an estimate of costs to dismantle and remove the underlying asset or to restore the underlying asset or the site on which it is located, less any lease incentives received.
The lease liability is initially measured at the present value of the lease payments, discounted using the Group’s incremental borrowing rate. It is remeasured when there is a change in future lease payments arising from a change in an index or a rate, or a change in the estimate of the guaranteed residual value, or a change in the assessment of purchase, extension or termination option. When the lease liability is remeasured in this way, a corresponding adjustment is made to the carrying amount of the right-of-use asset, or is recorded in profit or loss if the carrying amount of the right-of-use asset has been reduced to zero.
The right-of-use asset is measured by applying cost model i.e. right-of-use asset at cost less accumulated depreciation/impairment losses . The right-of-use asset is depreciated using the straight-line method from the commencement date to the end of the lease term or useful life of the underlying asset whichever is lower. Carrying amount of lease liability is increased by interest on lease liability and reduced by lease payments made.
Notes forming part of the Consolidated Financial Statements (contd.)NOTE [1](II) (contd.)
487
Lease payments associated with following leases are recognised as expense on straight-line basis:
(i) Low value leases; and
(ii) Leases which are short-term.
Assets given on lease are classified either as operating lease or as finance lease. A lease is classified as a finance lease if it transfers substantially all the risks and rewards incidental to ownership of an underlying asset. Initially asset held under finance lease is recognised in balance sheet and presented as a receivable at an amount equal to the net investment in the lease. Finance income is recognised over the lease term, based on a pattern reflecting a constant periodic rate of return on Group’s net investment in the lease. A lease which is not classified as a finance lease is an operating lease.
The Group recognises lease payments in case of assets given on operating leases as income on a straight-line basis. The Group presents underlying assets subject to operating lease in its balance sheet under the respective class of asset.
(Also refer to policy on depreciation, supra)
(r) Financial instruments
Financial assets and/or financial liabilities are recognised when the Group becomes party to a contract embodying the related financial instruments. All financial assets, financial liabilities and financial guarantee contracts are initially measured at transaction values and where such values are different from the fair value, at fair value. Transaction costs that are attributable to the acquisition or issue of financial assets and financial liabilities (other than financial assets and financial liabilities at fair value through profit or loss) are added to or deducted from, as the case may be, the fair value of such financial assets or liabilities on initial recognition. Transaction costs directly attributable to the acquisition of financial assets or financial liabilities at fair value through profit or loss are recognised immediately in profit or loss.
A financial asset and a financial liability is offset and presented on net basis in the balance sheet when there is a current legally enforceable right to set-off the recognised amounts and it is intended to either settle on net basis or to realise the asset and settle the liability simultaneously.
(i) Financial assets
A. All recognised financial assets are subsequently measured in their entirety at either amortised cost or fair value, depending on the classification of the financial assets as follows:
1. Investments in debt instruments that are designated as fair value through profit or loss (FVTPL) - at fair value
2. Other investments in debt instruments – at amortised cost, subject to following conditions:
• Theassetisheldwithinabusinessmodelwhoseobjectiveistoholdassetsinordertocollectcontractualcashflows; and
• Thecontractualtermsofinstrumentgiveriseonspecifieddatestocashflowsthataresolelypaymentsofprincipal and interest on the principal amount outstanding.
3. Debt instruments that meet the following conditions are subsequently measured at fair value through other comprehensive income [FVTOCI] (unless the same are designated as fair value through profit or loss)
• Theassetisheldwithinabusinessmodelwhoseobjectiveisachievedbothbycollectingcontractualcashflowsand selling financial assets; and
• Thecontractualtermsofinstrumentgiveriseonspecifieddatestocashflowsthataresolelypaymentsofprincipal and interest on the principal amount outstanding.
4. Debt instruments at FVTPL is a residual category for debt instruments, if any, and all changes are recognised in profit or loss.
Notes forming part of the Consolidated Financial Statements (contd.)NOTE [1](II) (contd.)

488
NOTES FORMING PART OF THE CONSOLIDATED FINANCIAL STATEMENTS ANNUAL REPORT 2019-20
5. Investments in equity instruments are classified as FVTPL, unless the related instruments are not held for trading and the Group irrevocably elects on initial recognition to present subsequent changes in fair value in other comprehensive income.
6. Tradereceivables,securitydeposits,cashandcashequivalents,employeeandotheradvances–atamortisedcost
7. The group has elected to measure the investments in associates and joint ventures held through unit trusts at FVTPL.
B. For financial assets that are measured at FVTOCI, income by way of interest and dividend, provision for impairment and exchange difference, if any, (on debt instrument) are recognised in profit or loss and changes in fair value (other than on account of above income or expense) are recognised in other comprehensive income and accumulated in other equity. On disposal of debt instruments at FVTOCI, the cumulative gain or loss previously accumulated in other equity is reclassified to profit or loss. In case of equity instruments at FVTOCI, such cumulative gain or loss is not reclassified to profit or loss on disposal of investments.
C. A financial asset is primarily derecognised when:
1. the right to receive cash flows from the asset has expired, or
2. the group has transferred its rights to receive cash flows from the asset or has assumed an obligation to pay the received cash flows in full without material delay to a third party under a pass-through arrangement; and a) the group has transferred substantially all the risks and rewards of the asset, or b) the group has neither transferred nor retained substantially all the risks and rewards of the asset, but has transferred control of the asset.
On derecognition of a financial asset in its entirety, the difference between the carrying amount measured at the date of derecognition and the consideration received is recognised in profit or loss.
D. Impairment of financial assets: The Group recognises impairment loss on trade receivables using expected credit loss model which involves use of a provision matrix constructed on the basis of historical credit loss experience as permitted under Ind AS 109.
For all other financial assets, expected credit losses are measured at an amount equal to 12-month expected credit losses or at an amount equal to lifetime expected credit losses if the credit risk on the financial asset has increased significantly since initial recognition.
In respect of financial services business, the Group applies a separate model of the expected credit loss for recognising impairment loss on financial assets measured at amortised cost, debt instruments at FVTOCI, lease receivables, trade receivables and other contractual rights to receive cash or other financial asset and financial guarantees not designated as at FVTPL as follows:
• Expectedcreditlossesaretheweightedaverageofcreditlosseswiththerespectiverisksofdefaultoccurringastheweights. Credit loss is the difference between all contractual cash flows that are due to the Group in accordance with the contract and all the cash flows that the Group expects to receive (i.e. all cash shortfalls), discounted at the original effective interest rate (or credit- adjusted effective interest rate for purchased or originated credit-impaired financial assets). The Group estimates cash flows by considering all contractual terms of the financial instrument (for example, prepayment, extension, call and similar options) through the expected life of that financial instrument.
• TheGroupmeasuresthelossallowanceforafinancialinstrumentatanamountequaltothelifetimeexpectedcreditlosses if the credit risk on that financial instrument has increased significantly since initial recognition. If the credit risk on a financial instrument has not increased significantly since initial recognition, the Group measures the loss allowance for that financial instrument at an amount equal to 12-month expected credit losses. 12-month expected credit losses are portion of the lifetime expected credit losses and represent the lifetime cash shortfalls that will result if default occurs within the 12 months weighted by the probability of default after the reporting date and thus, are not cash shortfalls that are predicted over the next 12 months.
Notes forming part of the Consolidated Financial Statements (contd.)NOTE [1](II) (contd.)
489
• Whenmakingtheassessmentofwhethertherehasbeenasignificantincreaseincreditrisksinceinitialrecognition,the Group uses the change in the risk of a default occurring over the expected life of the financial instrument instead of the change in the amount of expected credit losses. To make that assessment, the Group compares the risk of a default occurring on the financial instrument as at the reporting date with the risk of a default occurring on the financial instrument as at the date of initial recognition and considers reasonable and supportable information, that is available without undue cost or effort, that is indicative of significant increases in credit risk since initial recognition.
(ii) Financial liabilities
A. Financial liabilities, including derivatives and embedded derivatives, which are designated for measurement at FVTPL are subsequently measured at fair value. Financial guarantee contracts are subsequently measured at the amount of impairment loss allowance or the amount recognised at inception net of cumulative amortisation, whichever is higher. All other financial liabilities including loans and borrowings, trade and other payables are initially recognised at fair value and subsequently measured at amortised cost using Effective Interest Rate (EIR) method.
B. A financial liability is derecognised when the related obligation expires or is discharged or cancelled.
(iii) The Group designates certain hedging instruments such as derivatives, embedded derivatives and in respect of foreign currency risk, certain non-derivatives as either fair value hedges, cash flow hedges, or hedges of net investments in foreign operations. Hedges of foreign exchange risk on firm commitments are accounted as cash flow hedges.
A. Fair value hedges: Changes in fair value of the designated portion of derivatives that qualify as fair value hedges are recognised in profit or loss immediately, together with any changes in the fair value of the hedged asset or liability that are attributable to the hedged risk. Hedge accounting is discontinued when the hedging instrument expires or is sold, terminated, or exercised, or when it no longer qualifies for hedge accounting. The fair value adjustment to the carrying amount of the hedged item arising from the hedged risk is amortised to profit or loss from that date.
B. Cash flow hedges: In case of transaction related hedges, the effective portion of changes in the fair value of derivatives that are designated and qualify as cash flow hedges is recognised in other comprehensive income and accumulated in equity as ‘hedging reserve’. The gain or loss relating to the ineffective portion is recognised immediately in profit or loss. Amounts previously recognised in other comprehensive income and accumulated in equity relating to the effective portion are reclassified to profit or loss in the periods when the hedged item affects profit or loss, in the same head as the hedged item. The effective portion of the hedge is determined at the lower of the cumulative gain or loss on the hedging instrument from inception of the hedge and the cumulative change in the fair value of the hedged item from the inception of the hedge and the remaining gain or loss on the hedging instrument is treated as ineffective portion.
In case of time period related hedges, the premium element and the spot element of a forward contract is separated and only the change in the value of the spot element of the forward contract is designated as the hedging instrument. Similarly, wherever applicable, the foreign currency basis spread is separated from the financial instrument and is excluded from the designation of that financial instrument as the hedging instrument in case of time period related hedges. The changes in the fair value of the premium element of the forward contract or the foreign currency basis spread of the financial instrument is accumulated in a separate component of equity as ‘cost of hedging’. The changes in the fair value of such premium element or foreign currency basis spread are reclassified to profit or loss as a reclassification adjustment on a straight-line basis over the period of the forward contract or the financial instrument.
The cash flow hedges are allocated to the forecast transactions on gross exposure basis. Where the hedged forecast transaction results in the recognition of a non-financial asset, such gains / losses are transferred from Hedge Reserve (but not as reclassification adjustment) and included in the initial measurement cost of the non-financial asset.
Hedge accounting is discontinued when the hedging instrument expires or is sold, terminated, or exercised, or when it no longer qualifies for hedge accounting. Any gain or loss recognised in other comprehensive income and accumulated in equity at that time remains in equity and is recognised in profit or loss when the forecast transaction is ultimately recognised in profit or loss. When a forecast transaction is no longer expected to occur, the gain or loss accumulated in equity is recognised immediately in profit or loss.
Notes forming part of the Consolidated Financial Statements (contd.)NOTE [1](II) (contd.)
490
NOTES FORMING PART OF THE CONSOLIDATED FINANCIAL STATEMENTS ANNUAL REPORT 2019-20
(iv) Compound financial instruments issued by the Group which can be converted into fixed number of equity shares at the option of the holders irrespective of changes in the fair value of the instrument are accounted by separately recognising the liability and the equity components. The liability component is initially recognised at the fair value of a comparable liability that does not have an equity conversion option. The equity component is initially recognised at the difference between the fair value of the compound financial instrument as a whole and the fair value of the liability component. The directly attributable transaction costs are allocated to the liability and the equity components in proportion to their initial carrying amounts.
Subsequent to initial recognition, the liability component of the compound financial instrument is measured at amortised cost using the effective interest method. The equity component of a compound financial instrument is not remeasured subsequently.
(s) Inventories
Inventories are valued after providing for obsolescence, as under:
(i) Raw materials, components, construction materials, stores, spares and loose tools at lower of weighted average cost or net realizable value. However, these items are considered to be realisable at cost if the finished products in which they will be used, are expected to be sold at or above cost.
(ii) Manufacturing work-in-progress at lower of weighted average cost including related overheads or net realisable value. In some cases, manufacturing work-in-progress are valued at lower of specifically identifiable cost or net realisable value. In the case of qualifying assets, cost also includes applicable borrowing costs vide policy relating to borrowing costs.
(iii) Finished goods and stock-in-trade (in respect of goods acquired for trading) at lower of weighted average cost or net realisable value. Cost includes costs of purchases, costs of conversion and other costs incurred in bringing the inventories to their present location. Taxes which are subsequently recoverable from taxation authorities are not included in the cost.
(iv) Completed property/work-in-progress (including land) in respect of property development activity at lower of specifically identifiable cost or net realisable value.
Assessment of net realisable value is made at each subsequent period end and when the circumstances that previously caused inventories to be written-down below cost no longer exist or when there is clear evidence of an increase in net realisable value because of changed economic circumstances, the write-down, if any, in the past period is reversed to the extent of the original amount written-down so that the resultant carrying amount is the lower of the cost and the revised net realisable value.
(t) Cash and bank balances
Cash and bank balances also include fixed deposits, margin money deposits, earmarked balances with banks and other bank balances which have restrictions on repatriation. Short term and liquid investments being subject to more than insignificant risk of change in value, are not included as part of cash and bank balances.
(u) Securities premium
(i) Securities premium includes:
A. The difference between the face value of the equity shares and the consideration received in respect of shares issued.
B. The fair value of the stock options which are treated as expense, if any, in respect of shares allotted pursuant to Stock Options Scheme.
(ii) The issue expenses of securities which qualify as equity instruments are written off against securities premium.
(v) Borrowing Costs
Borrowing costs include finance costs calculated using the effective interest method, finance charges in respect of assets acquired on lease and exchange differences arising on foreign currency borrowings, to the extent they are regarded as an adjustment to finance costs. In cases where hedging instruments are acquired for protection against exchange rate risk related to borrowings and are accounted as hedging a time-period related hedge item, the borrowing costs also include the amortization of premium element of the forward contract and foreign currency basis spread as applicable, over the period of the hedging instrument.
Notes forming part of the Consolidated Financial Statements (contd.)NOTE [1](II) (contd.)

491
Borrowing costs net of any investment income from the temporary investment of related borrowings that are attributable to the acquisition, construction or production of a qualifying asset are capitalised/inventoried as part of cost of such asset till such time the asset is ready for its intended use or sale. A qualifying asset is an asset that necessarily requires a substantial period of time to get ready for its intended use or sale. All other borrowing costs are recognised in profit or loss in the period in which they are incurred.
(w) Share-based payment arrangements
The stock options granted to employees pursuant to the Group’s Stock Options Schemes, are measured at the fair value of the options at the grant date. The fair value of the options is treated as discount and accounted as employee compensation cost over the vesting period on a straight line basis. The amount recognised as expense in each year is arrived at based on the number of grants expected to vest. If a grant lapses after the vesting period, the cumulative discount recognised as expense in respect of such grant is transferred to the general reserve within equity. The share based payment equivalent to the fair value as on the date of grant of employee stock options granted to key managerial personnel is disclosed as a related party transaction in the year of grant.
(x) Foreign currencies
(i) The functional currency and presentation currency of the Group is Indian Rupee. Functional currency of the Group and foreign operations has been determined based on the primary economic environment in which the Group and its foreign operations operate considering the currency in which funds are generated, spent and retained.
(ii) Transactions in currencies other than the Group’s functional currency are recorded on initial recognition using the exchange rate at the transaction date. At each Balance Sheet date, foreign currency monetary items are reported at the closing spot rate. Non-monetary items that are measured in terms of historical cost in foreign currency are not retranslated. Exchange differences that arise on settlement of monetary items or on reporting of monetary items at each Balance Sheet date at the closing spot rate are recognised in the Statement of Profit and Loss in the period in which they arise except for:
A. exchange differences on foreign currency borrowings relating to assets under construction for future productive use, which are included in the cost of those assets when they are regarded as an adjustment to finance costs on those foreign currency borrowings;
B. exchange differences on transactions entered into in order to hedge certain foreign currency risks; and
C. exchange differences on monetary items receivable from or payable to a foreign operation for which settlement is neither planned nor likely to occur (therefore forming part of the net investment in foreign operation), which are recognised initially in other comprehensive income and reclassified from equity to profit or loss on repayment of the monetary items.
(iii) Exchange rate as of the date on which the non-monetary asset or non-monetary liability is recognised on payment or receipt of advance consideration is used for initial recognition of related asset, expense or income.
(iv) Financial statements of foreign operations whose functional currency is different than Indian Rupees are translated into Indian Rupees as follows:
A. assets and liabilities for each Balance Sheet presented are translated at the closing rate at the date of that Balance Sheet;
B. income and expenses for each income statement are translated at average exchange rates; and
C. all resulting exchange differences are recognised in other comprehensive income and accumulated in equity as foreign currency translation reserve for subsequent reclassification to profit or loss on disposal of such foreign operations. The portion of foreign currency translation reserve attributed to non-controlling interests is reflected as part of non-controlling interests.
(y) Accounting and reporting of information for Operating Segments
Operating segments are those components of the business whose operating results are regularly reviewed by the chief operating decision making body in the Group to make decisions for performance assessment and resource allocation. The reporting of segment information is the same as provided to the management for the purpose of the performance assessment and resource allocation to the segments.
Notes forming part of the Consolidated Financial Statements (contd.)NOTE [1](II) (contd.)
492
NOTES FORMING PART OF THE CONSOLIDATED FINANCIAL STATEMENTS ANNUAL REPORT 2019-20
Segment accounting policies are in line with the accounting policies of the Group. In addition, the following specific accounting policies have been followed for segment reporting:
(i) Segment revenue includes sales and other operational revenue directly identifiable with/allocable to the segment including (a) inter- segment revenue and (b) profit on sale of stake in the subsidiary and/or joint venture companies under Developmental projects segment and Realty business grouped under “Others” segment
(ii) Expenses that are directly identifiable with/allocable to segments are considered for determining the segment result. In respect of (a) Financial Services segment and (b) Power Generation projects under Developmental Projects segment which are classified as assets given on finance lease, the finance costs on borrowings are accounted as segment expenses.
(iii) Most of the centrally incurred costs are allocated to segments mainly on the basis of their respective expected segment revenue estimated at the beginning of the reported period.
(iv) Income which relates to the Group as a whole and not allocable to segments is included in “unallocable corporate income”.
(v) Segment result includes margins on inter-segment capital jobs, which are reduced in arriving at the profit before tax of the Group.
(vi) Segment result includes the finance costs incurred on interest bearing advances with corresponding credit included in “unallocable corporate income”
(vii) Segment results are not adjusted for the exceptional item attributable to the corresponding segment. The said exceptional item has been included in “unallocable corporate income net of expenditure”. The corresponding segment assets are being carried under the respective segments without adjusting the exceptional item.
(viii) Segment assets and liabilities include those directly identifiable with the respective segments. In respect of (a) Financial Services segment, and (b) Power Generation projects under Developmental Projects segment which are classified as assets given on finance lease, segment liabilities include borrowings as the finance costs on borrowings are accounted as segment expenses in respect of the segment and projects. Investment in joint ventures and associates identified with a particular segment are reported as part of the segment assets of those respective segments.
Unallocable corporate assets and liabilities represent the assets and liabilities that relate to the Group as a whole.
(ix) Segment non-cash expenses forming part of segment expenses includes the fair value of the employee stock options which is accounted as employee compensation cost [see Note 1(w) above] and is allocated to the segment.
(x) Segment revenue resulting from transactions with other business segments is accounted on the basis of transfer price which are either determined to yield a desired margin or agreed on a negotiated basis.
(z) Taxes on income
Tax on income for the current period is determined on the basis of taxable income (or on the basis of book profits wherever minimum alternate tax is applicable) and tax credits computed in accordance with the provisions of the applicable tax laws and based on the expected outcome of assessments/appeals.
Deferred tax is recognised on temporary differences between the carrying amounts of assets and liabilities in the Group’s financial statements and the corresponding tax bases used in computation of taxable profit and quantified using the tax rates and laws enacted or substantively enacted as on the Balance Sheet date.
Deferred tax liabilities are generally recognised for all taxable temporary differences including the temporary differences associated with investments in subsidiaries and associates, and interests in joint ventures, except where the Group is able to control the reversal of the temporary difference and it is probable that the temporary difference will not reverse in the foreseeable future.
Deferred tax assets are generally recognised for all temporary differences to the extent that is probable that taxable profits will be available against which those deductible temporary differences can be utilised. The carrying amount of deferred tax assets is reviewed at the end of each reporting period and reduced to the extent that it is no longer probable that sufficient taxable profits will be available to allow all or part of the asset to be recovered.
Notes forming part of the Consolidated Financial Statements (contd.)NOTE [1](II) (contd.)

493
Deferred tax assets relating to unabsorbed depreciation/business losses/losses under the head “capital gains”/ other temporary differences are recognised and carried forward to the extent of available taxable temporary differences or where there is convincing other evidence that sufficient future taxable income will be available against which such deferred tax assets can be realised. Deferred tax assets in respect of unutilised tax credits which mainly relate to minimum alternate tax and dividend distribution tax paid or payable by the subsidiary companies are recognised, to the extent it is probable that such unutilised tax credits will get realised, in the period in which such determination is made.
The measurement of deferred tax liabilities and assets reflects the tax consequences that would follow from the manner in which the Group expects, at the end of reporting period, to recover or settle the carrying amount of its assets and liabilities.
Transaction or event which is recognised outside profit or loss, either in other comprehensive income or in equity or in case of business combination, is recorded along with the tax as applicable.
The Group uses estimates and judgements based on the relevant rulings in the areas of allowances and disallowances which is exercised while determining the provision for income tax.
(aa) Provisions, contingent liabilities and contingent assets
Provisions are recognised only when:
(i) the Group entity has a present obligation (legal or constructive) as a result of a past event; and
(ii) it is probable that an outflow of resources embodying economic benefits will be required to settle the obligation; and
(iii) a reliable estimate can be made of the amount of the obligation
Provision is measured using the cash flows estimated to settle the present obligation and when the effect of time value of money is material, the carrying amount of the provision is the present value of those cash flows. Reimbursement expected in respect of expenditure required to settle a provision is recognised only when it is virtually certain that the reimbursement will be received.
Contingent liability is disclosed in case of:
(i) a present obligation arising from past events, when it is not probable that an outflow of resources will be required to settle the obligation; and
(ii) a present obligation arising from past events, when no reliable estimate is possible.
Contingent assets are disclosed where an inflow of economic benefits is probable. Provisions, contingent liabilities and contingent assets are reviewed at each Balance Sheet date.
Where the unavoidable costs of meeting the obligations under the contract exceed the economic benefits expected to be received under such contract, the present obligation under the contract is recognised and measured as a provision.
(ab) Commitments
Commitments are future liabilities for contractual expenditure, classified and disclosed as follows:
a) estimated amount of contracts remaining to be executed on capital account and not provided for;
b) uncalled liability on shares and other investments partly paid;
c) funding related commitment to associate and joint venture companies; and
d) other non-cancellable commitments, if any, to the extent they are considered material and relevant in the opinion of management.
Other commitments related to sales/procurements made in the normal course of business are not disclosed to avoid excessive details.
Notes forming part of the Consolidated Financial Statements (contd.)NOTE [1](II) (contd.)

494
NOTES FORMING PART OF THE CONSOLIDATED FINANCIAL STATEMENTS ANNUAL REPORT 2019-20
Notes forming part of the Consolidated Financial Statements (contd.)NOTE [1](II) (contd.)(ac) Discontinued Operations and non-current assets held for sale
Discontinued operation is a component of the Group that has been disposed of or classified as held for sale and represents a major line of business.
Non-current assets and disposal groups are classified as held for sale if their carrying amount is intended to be recovered principally through a sale (rather than through continuing use) when the asset (or disposal group) is available for immediate sale in its present condition subject only to terms that are usual and customary for sale of such asset (or disposal group) and the sale is highly probable and is expected to qualify for recognition as a completed sale within one year from the date of classification.
Non-current assets and disposal groups classified as held for sale are measured at lower of their carrying amount and fair value less costs to sell.
(ad) Statement of Cash Flows
Statement of Cash Flows is prepared segregating the cash flows into operating, investing and financing activities. Cash flow from operating activities is reported using indirect method adjusting the net profit for the effects of:
i. changes during the period in inventories and operating receivables and payables, transactions of a non-cash nature;
ii. non-cash items such as depreciation, provisions, deferred taxes, unrealised foreign currency gains and losses, and undistributed profits of associates and joint ventures; and
iii. all other items for which the cash effects are investing or financing cash flows.
Cash and cash equivalents (including bank balances) shown in the Statement of Cash Flows exclude items which are not available for general use as at the date of Balance Sheet.
(ae) Key sources of estimation
The preparation of financial statements in conformity with Ind AS requires that the management of the Group makes estimates and assumptions that affect the reported amounts of income and expenses of the period, the reported balances of assets and liabilities and the disclosures relating to contingent liabilities as of the date of the financial statements. The estimates and underlying assumptions made by the management have been explained under respective policies and are reviewed on an ongoing basis. Revisions to accounting estimates include useful lives of property, plant and equipment & intangible assets, allowance for doubtful debts/advances, future obligations in respect of retirement benefit plans, expected cost of completion of contracts, provision for rectification costs, fair value measurement etc. Difference, if any, between the actual results and estimates is recognised in the period in which the results are known.
NOTE [1](III)
The Group has assessed the impact of COVID-19 on its financial statements based on the internal and external information upto the date of approval of these financial statements and expects to recover the carrying amounts of its investments, intangible assets, goodwill, trade receivable, project work-in-progress and inventories. The Group will continue to monitor the future economic conditions and update its assessment.
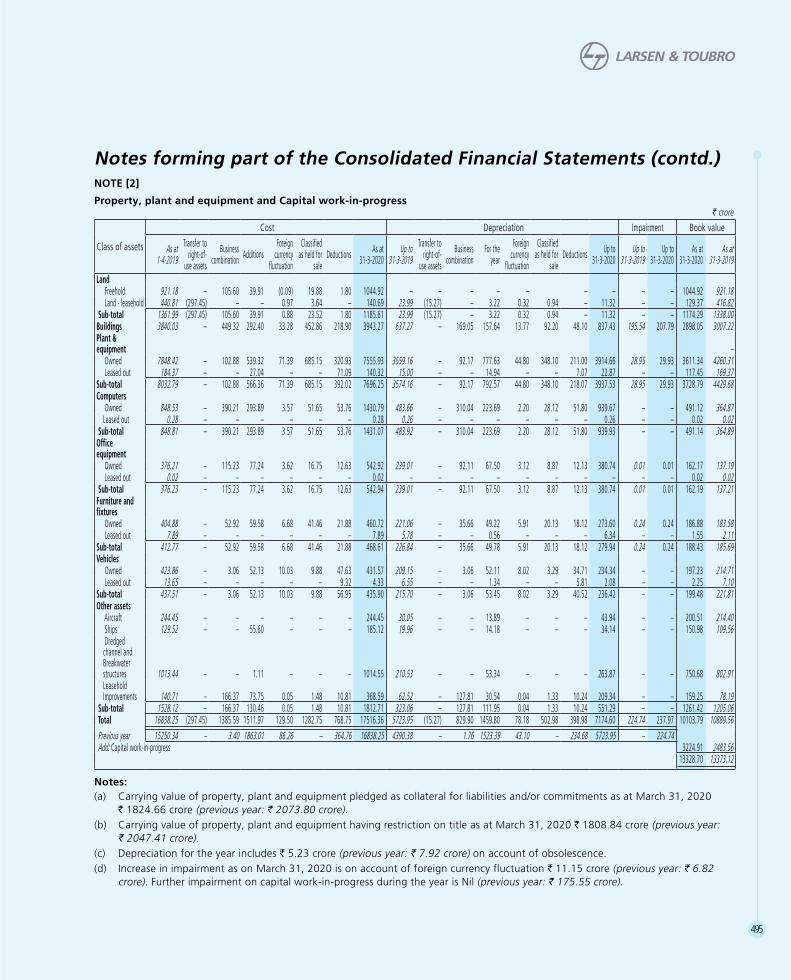
495
NOTE [2]
Property, plant and equipment and Capital work-in-progressv crore
Class of assets
Cost Depreciation Impairment Book value
As at 1-4-2019
Transfer to right-of-
use assets
Business combination Additions
Foreign currency
fluctuation
Classified as held for
saleDeductions As at
31-3-2020Up to
31-3-2019
Transfer to right-of-
use assets
Business combination
For the year
Foreign currency
fluctuation
Classified as held for
saleDeductions Up to
31-3-2020Up to
31-3-2019Up to
31-3-2020 As at
31-3-2020 As at
31-3-2019
Land Freehold 921.18 – 105.60 39.91 (0.09) 19.88 1.80 1044.92 – – – – – – – – – 1044.92 921.18 Land - leasehold 440.81 (297.45) – – 0.97 3.64 – 140.69 23.99 (15.27) – 3.22 0.32 0.94 – 11.32 – – 129.37 416.82 Sub-total 1361.99 (297.45) 105.60 39.91 0.88 23.52 1.80 1185.61 23.99 (15.27) – 3.22 0.32 0.94 – 11.32 – – 1174.29 1338.00Buildings 3840.03 – 449.32 292.40 33.28 452.86 218.90 3943.27 637.27 – 169.05 157.64 13.77 92.20 48.10 837.43 195.54 207.79 2898.05 3007.22Plant & equipment – Owned 7848.42 – 102.88 539.32 71.39 685.15 320.93 7555.93 3559.16 – 92.17 777.63 44.80 348.10 211.00 3914.66 28.95 29.93 3611.34 4260.31 Leased out 184.37 – – 27.04 – – 71.09 140.32 15.00 – – 14.94 – – 7.07 22.87 – – 117.45 169.37Sub-total 8032.79 – 102.88 566.36 71.39 685.15 392.02 7696.25 3574.16 – 92.17 792.57 44.80 348.10 218.07 3937.53 28.95 29.93 3728.79 4429.68Computers Owned 848.53 – 390.21 293.89 3.57 51.65 53.76 1430.79 483.66 – 310.04 223.69 2.20 28.12 51.80 939.67 – – 491.12 364.87 Leased out 0.28 – – – – – – 0.28 0.26 – – – – – – 0.26 – – 0.02 0.02 Sub-total 848.81 – 390.21 293.89 3.57 51.65 53.76 1431.07 483.92 – 310.04 223.69 2.20 28.12 51.80 939.93 – – 491.14 364.89 Office equipment Owned 376.21 – 115.23 77.24 3.62 16.75 12.63 542.92 239.01 – 92.11 67.50 3.12 8.87 12.13 380.74 0.01 0.01 162.17 137.19 Leased out 0.02 – – – – – – 0.02 – – – – – – – – – – 0.02 0.02 Sub-total 376.23 – 115.23 77.24 3.62 16.75 12.63 542.94 239.01 – 92.11 67.50 3.12 8.87 12.13 380.74 0.01 0.01 162.19 137.21 Furniture and fixtures Owned 404.88 – 52.92 59.58 6.68 41.46 21.88 460.72 221.06 – 35.66 49.22 5.91 20.13 18.12 273.60 0.24 0.24 186.88 183.58 Leased out 7.89 – – – – – – 7.89 5.78 – – 0.56 – – – 6.34 – – 1.55 2.11Sub-total 412.77 – 52.92 59.58 6.68 41.46 21.88 468.61 226.84 – 35.66 49.78 5.91 20.13 18.12 279.94 0.24 0.24 188.43 185.69 Vehicles Owned 423.86 – 3.06 52.13 10.03 9.88 47.63 431.57 209.15 – 3.06 52.11 8.02 3.29 34.71 234.34 – – 197.23 214.71 Leased out 13.65 – – – – – 9.32 4.33 6.55 – – 1.34 – – 5.81 2.08 – – 2.25 7.10Sub-total 437.51 – 3.06 52.13 10.03 9.88 56.95 435.90 215.70 – 3.06 53.45 8.02 3.29 40.52 236.42 – – 199.48 221.81 Other assets Aircraft 244.45 – – – – – – 244.45 30.05 – – 13.89 – – – 43.94 – – 200.51 214.40 Ships 129.52 – – 55.60 – – – 185.12 19.96 – – 14.18 – – – 34.14 – – 150.98 109.56 Dredged
channel and Breakwater structures 1013.44 – – 1.11 – – – 1014.55 210.53 – – 53.34 – – – 263.87 – – 750.68 802.91
Leasehold Improvements 140.71 – 166.37 73.75 0.05 1.48 10.81 368.59 62.52 – 127.81 30.54 0.04 1.33 10.24 209.34 – – 159.25 78.19
Sub-total 1528.12 – 166.37 130.46 0.05 1.48 10.81 1812.71 323.06 – 127.81 111.95 0.04 1.33 10.24 551.29 – – 1261.42 1205.06 Total 16838.25 (297.45) 1385.59 1511.97 129.50 1282.75 768.75 17516.36 5723.95 (15.27) 829.90 1459.80 78.18 502.98 398.98 7174.60 224.74 237.97 10103.79 10889.56 Previous year 15250.34 – 3.40 1863.01 86.26 – 364.76 16838.25 4390.38 – 1.76 1523.39 43.10 – 234.68 5723.95 – 224.74 Add: Capital work-in-progress 3224.91 2483.56
13328.70 13373.12
Notes:(a) Carrying value of property, plant and equipment pledged as collateral for liabilities and/or commitments as at March 31, 2020
R 1824.66crore(previous year: R 2073.80crore).(b) Carrying value of property, plant and equipment having restriction on title as at March 31, 2020 R 1808.84crore(previous year:
R 2047.41 crore).(c) Depreciation for the year includes R 5.23 crore (previous year: R 7.92 crore) on account of obsolescence.(d) Increase in impairment as on March 31, 2020 is on account of foreign currency fluctuation R 11.15 crore (previous year: R 6.82
crore). Further impairment on capital work-in-progress during the year is Nil (previous year: R 175.55 crore).
Notes forming part of the Consolidated Financial Statements (contd.)

496
NOTES FORMING PART OF THE CONSOLIDATED FINANCIAL STATEMENTS ANNUAL REPORT 2019-20
(e) Owned assets given on operating lease have been presented separately under respective class of assets as “Leased out” pursuant toIndAS116“Leases”.
(f) Cost as at April 1, 2019 of individual assets has been reclassified, wherever necessary.
(g) Range of useful life of property, plant and equipment is as below:
Sr. no. Class of assets Minimum useful life
(in years)Maximum useful life
(in years)1 Leasehold land 15 992 Owned buildings 3 613 Owned plant and equipment 3 354 Computers 2 75 Office equipment 3 306 Furniture and fixtures 3 127 Owned vehicles 3 158 Aircraft 18 189 Ships 5 1510 Dredged channel and Breakwater structures 41 50
NOTE [3]
Investment propertyv crore
Class of assets
Cost Depreciation Impairment Book value
As at 1-4-2019 Additions
Foreign currency
fluctuation
Classified as held for
sale
Transfer (to)/from
inventories and
owners occupied property
Deductions As at 31-3-2020
Up to 31-3-2019
For the period
Foreign currency
fluctuation
Classified as held for
sale
Transfer (to)/from
inventories and
owners occupied property
Deductions Up to 31-3-2020
Up to 31-3-2019
Up to 31-3-2020
As at 31-3-2020
As at 31-3-2019
Land 553.78 112.17 1.01 2.02 (105.56) 11.74 547.64 12.68 9.48 – – – – 22.16 4.71 – 525.48 536.39 Buildings 1374.62 336.56 – 37.90 (57.78) 8.11 1607.39 38.63 31.37 – 2.79 (0.76) 0.22 66.23 – – 1541.16 1335.99 Total 1928.40 448.73 1.01 39.92 (163.34) 19.85 2155.03 51.31 40.85 – 2.79 (0.76) 0.22 88.39 4.71 – 2066.64 1872.38
Previous year 1978.65 219.79 0.62 – (158.02) 112.64 1928.40 34.95 34.78 – – (5.17) 13.25 51.31 – 4.71 Add: Capital work-in-progress 1648.08 2382.18
3714.72 4254.56
Notes:(a) Carrying value of investment property pledged as collateral for liabilities and/or commitments and having restriction on title as at
March 31, 2020 R 0.16crore(previous year: R 0.16crore).(b) Usefullifeofbuildingincludedininvestmentproperty:20to60years.
(c) Amount recognised in the Statement of Profit and Loss for investment property:v crore
Sr. no. Particulars 2019-20 2018-191 Rental income derived from investment property 129.29 148.712 Direct operating expenses arising from investment property that generated rental income 5.24 7.373 Direct operating expenses arising from investment property that did not generate rental income 0.63 0.67
(d) Fair value of investment property: R 5582.46croreasatMarch31,2020(previous year: R 6456.76crore).
Notes forming part of the Consolidated Financial Statements (contd.)NOTE [2] (contd.)
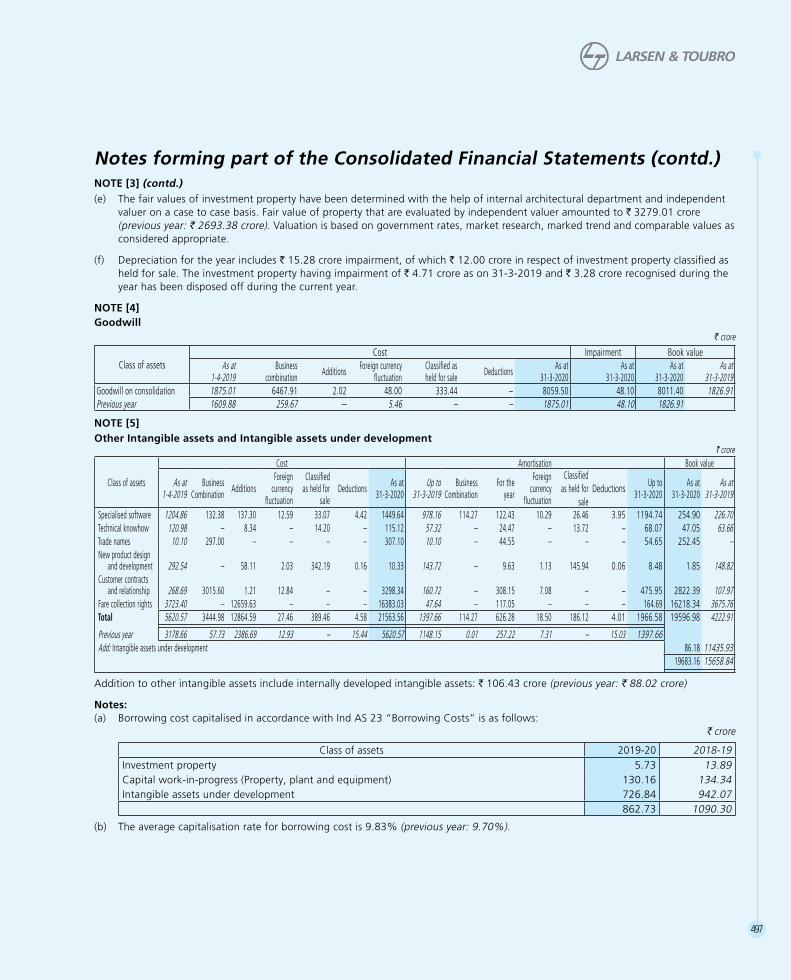
497
(e) The fair values of investment property have been determined with the help of internal architectural department and independent valuer on a case to case basis. Fair value of property that are evaluated by independent valuer amounted to R 3279.01 crore (previous year: R 2693.38crore). Valuation is based on government rates, market research, marked trend and comparable values as considered appropriate.
(f) Depreciation for the year includes R 15.28croreimpairment,ofwhichR 12.00 crore in respect of investment property classified as held for sale. The investment property having impairment of R 4.71 crore as on 31-3-2019 and R 3.28crorerecognisedduringtheyear has been disposed off during the current year.
NOTE [4]Goodwill
v crore
Class of assetsCost Impairment Book value
As at 1-4-2019
Business combination Additions Foreign currency
fluctuationClassified as held for sale Deductions As at
31-3-2020 As at
31-3-2020 As at
31-3-2020 As at
31-3-2019Goodwill on consolidation 1875.01 6467.91 2.02 48.00 333.44 – 8059.50 48.10 8011.40 1826.91Previous year 1609.88 259.67 – 5.46 – – 1875.01 48.10 1826.91
NOTE [5] Other Intangible assets and Intangible assets under development
v crore
Class of assets
Cost Amortisation Book value
As at 1-4-2019
Business Combination Additions
Foreign currency
fluctuation
Classified as held for
sale Deductions As at
31-3-2020 Up to
31-3-2019Business
Combination For the
year
Foreign currency
fluctuation
Classified as held for
saleDeductions Up to
31-3-2020 As at
31-3-2020 As at
31-3-2019
Specialised software 1204.86 132.38 137.30 12.59 33.07 4.42 1449.64 978.16 114.27 122.43 10.29 26.46 3.95 1194.74 254.90 226.70 Technical knowhow 120.98 – 8.34 – 14.20 – 115.12 57.32 – 24.47 – 13.72 – 68.07 47.05 63.66 Trade names 10.10 297.00 – – – – 307.10 10.10 – 44.55 – – – 54.65 252.45 – New product design
and development 292.54 – 58.11 2.03 342.19 0.16 10.33 143.72 – 9.63 1.13 145.94 0.06 8.48 1.85 148.82 Customer contracts
and relationship 268.69 3015.60 1.21 12.84 – – 3298.34 160.72 – 308.15 7.08 – – 475.95 2822.39 107.97 Fare collection rights 3723.40 – 12659.63 – – – 16383.03 47.64 – 117.05 – – – 164.69 16218.34 3675.76 Total 5620.57 3444.98 12864.59 27.46 389.46 4.58 21563.56 1397.66 114.27 626.28 18.50 186.12 4.01 1966.58 19596.98 4222.91
Previous year 3178.66 57.73 2386.69 12.93 – 15.44 5620.57 1148.15 0.01 257.22 7.31 – 15.03 1397.66 Add: Intangible assets under development 86.18 11435.93
19683.16 15658.84
Addition to other intangible assets include internally developed intangible assets: R 106.43crore(previous year: R 88.02crore)
Notes:(a) Borrowing cost capitalised in accordance with Ind AS 23 “Borrowing Costs” is as follows:
v crore
Class of assets 2019-20 2018-19Investment property 5.73 13.89Capital work-in-progress (Property, plant and equipment) 130.16 134.34Intangible assets under development 726.84 942.07
862.73 1090.30
(b) Theaveragecapitalisationrateforborrowingcostis9.83%(previousyear:9.70%).
Notes forming part of the Consolidated Financial Statements (contd.)NOTE [3] (contd.)

498
NOTES FORMING PART OF THE CONSOLIDATED FINANCIAL STATEMENTS ANNUAL REPORT 2019-20
NOTE [6]
Non-current assets: Financial assets - Other investments
Particulars As at 31-3-2020 As at 31-3-2019
v crore v crore
Equity instruments 579.87 574.21
Preference shares 89.20 99.13
Government and trust securities 0.07 1832.55
Debentures and bonds 1098.28 813.20
Mutual funds 93.21 19.69
Security receipts 2498.65 791.07
Units of fund 106.44 188.79
Other investments 31.00 –
4496.72 4318.64
NOTE [7]
Non-current assets: Financial assets - Loans towards financing activities
Particulars As at 31-3-2020 As at 31-3-2019
v crore v crore v crore v crore
Considered good - secured 39485.69 38843.70
Less: Allowance for expected credit loss 199.75 155.71
39285.94 38687.99
Considered good - unsecured 14466.13 14988.60
Less: Allowance for expected credit loss 129.70 139.05
14336.43 14849.55
Having significant increase in credit risk 3469.63 2029.89
Less: Allowance for expected credit loss 188.53 178.47
3281.10 1851.42
Credit impaired 5470.39 6270.60
Less: Allowance for expected credit loss 3784.50 3870.68
1685.89 2399.92
58589.36 57788.88
Notes forming part of the Consolidated Financial Statements (contd.)

499
NOTE [8]
Non-current assets: Financial assets - Other loans
Particulars As at 31-3-2020 As at 31-3-2019
v crore v crore v crore v crore Security deposits Considered good - unsecured 425.26 244.12 Less: Allowance for expected credit loss 36.54 28.30
388.72 215.82Loans and advances to related parties Considered good - unsecured 1072.90 1264.11
Other loans Considered good - secured – 0.08 Considered good - unsecured 174.51 114.87 Less: Allowance for expected credit loss 113.80 113.80
60.71 1.07
1522.33 1481.08
NOTE [9]
Non-current assets: Financial assets - Others
Particulars As at 31-3-2020 As at 31-3-2019
v crore v crore
Cash and bank balances not available for immediate use 273.82 290.07
Fixed deposits with banks (maturity more than 12 months) 1.04 201.04
Forward contract receivables 257.00 432.32
Embedded derivative receivables 54.20 6.15
Other receivables 52.09 214.47
638.15 1144.05
NOTE [10]
Other non-current assets
Particulars As at 31-3-2020 As at 31-3-2019
v crore v crore v crore v crore Capital advances: Secured 0.78 5.38 Unsecured 271.23 165.72
272.01 171.10 Advance recoverable other than in cash 2125.54 1986.60Current tax receivable (net) 4144.07 3490.92
6541.62 5648.62
Notes forming part of the Consolidated Financial Statements (contd.)

500
NOTES FORMING PART OF THE CONSOLIDATED FINANCIAL STATEMENTS ANNUAL REPORT 2019-20
NOTE [11]Current assets: Inventories
Particulars As at 31-3-2020 As at 31-3-2019
v crore v croreRaw materials [include goods-in-transit R 16.56crore
(previous year: R 53.34 crore)] 860.49 722.75
Components [include goods-in-transit R 15.89crore (previous year: R 31.55 crore)] 403.39 529.55
Construction materials [include goods-in-transit R 17.13 crore (previous year: R 114.55 crore)] 95.86 221.57
Manufacturing work-in-progress 467.87 651.70
Finished goods 98.56 301.74
Stock-in-trade (in respect of goods acquired for trading) [include goods-in-transit R 37.10 crore (previous year: R 38.79crore)] 308.36 386.27
Stores and spares [include goods-in-transit R 1.14 crore (previous year: R 2.25 crore)] 295.98 295.49
Loose tools [include goods-in-transit Nil (previous year: R 0.05 crore)] 13.38 14.66
Property development projects (including land) 3202.76 3290.20
5746.65 6413.93
Note: During the year R 83.39crore(previous year: R 468.74crore) was recognised as expense towards write-down of inventories.
NOTE [12] Current assets: Financial assets - Investments
Particulars As at 31-3-2020 As at 31-3-2019
v crore v croreEquity shares 3.04 8.28Preference shares 0.68 0.68Government and trust securities 758.35 962.66Debentures and bonds 3959.79 4192.93 Mutual funds 7677.60 8781.62Other investments 300.29 –
12699.75 13946.17
NOTE [13] Current assets: Financial assets - Trade receivables
Particulars As at 31-3-2020 As at 31-3-2019
v crore v crore v crore v crore Considered good - secured 160.37 68.99Considered good - unsecured 42365.84 38576.64Less: Allowance for expected credit loss 1963.85 1989.56
40401.99 36587.08Credit impaired 1386.52 1201.07 Less: Allowance for expected credit loss 1217.36 1011.27
169.16 189.80
40731.52 36845.87
Notes forming part of the Consolidated Financial Statements (contd.)

501
NOTE [14]
Current assets: Financial assets - Cash and cash equivalents
Particulars As at 31-3-2020 As at 31-3-2019
v crore v croreBalance with banks 4535.56 4261.34
Cheques and drafts on hand 173.66 624.49
Cash on hand 6.64 37.44
Fixed deposits with banks (maturity less than 3 months) 6608.71 1586.22
11324.57 6509.49
NOTE [15]
Current assets: Financial assets - Other bank balances
Particulars As at 31-3-2020 As at 31-3-2019
v crore v croreFixed deposits with banks 1876.65 845.70
Earmarked balances with banks-unclaimed dividend 120.08 85.34
Earmarked balances with banks-Section 4(2)(l)(D) of RERA* 0.25 0.41
Earmarked balances with banks-others 505.61 1.10
Margin money deposits with banks 930.84 149.08
Cash and bank balances not available for immediate use 359.78 4135.12
3793.21 5216.75
*RealEstate(RegulationandDevelopment)Act,2016
NOTE [16]
Current assets: Financial assets - Loans towards financing activities
Particulars As at 31-3-2020 As at 31-3-2019
v crore v crore v crore v crore Considered good - secured 33534.47 34028.69Less: Allowance for expected credit loss 61.72 52.19 Less: Net fair value changes 220.84 130.77
33251.91 33845.73Considered good - unsecured 7584.55 8108.95Less: Allowance for expected credit loss 169.82 146.77
7414.73 7962.18Having significant increase in credit risk 1147.73 801.03Less: Allowance for expected credit loss 90.95 78.12
1056.78 722.91
41723.42 42530.82
Notes forming part of the Consolidated Financial Statements (contd.)
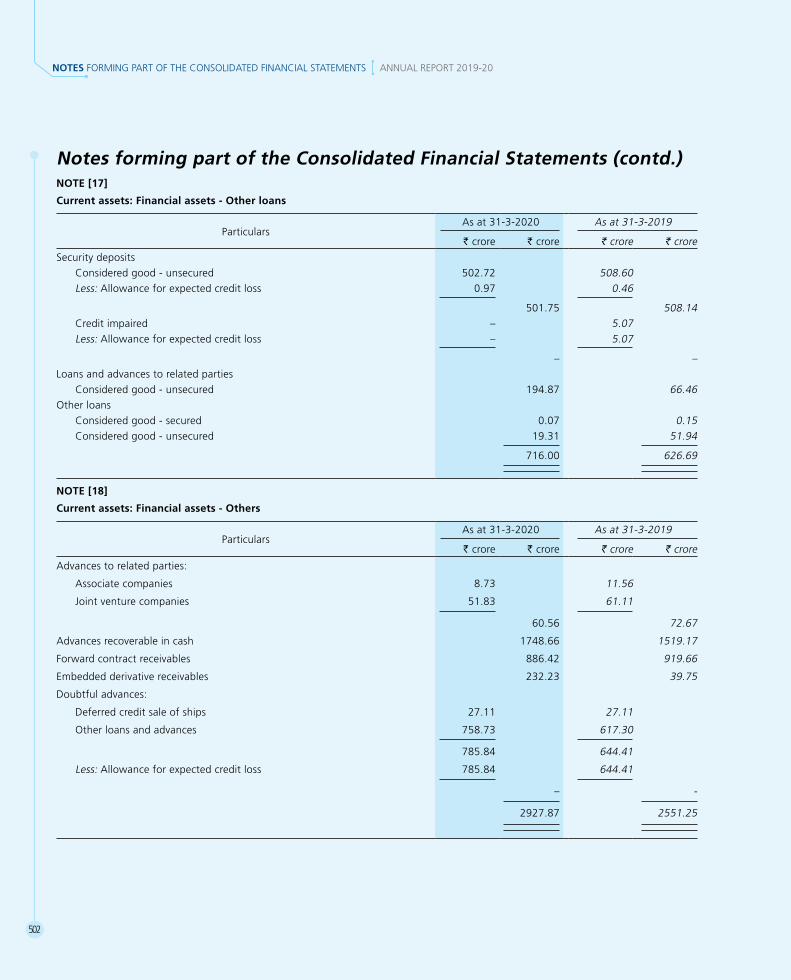
502
NOTES FORMING PART OF THE CONSOLIDATED FINANCIAL STATEMENTS ANNUAL REPORT 2019-20
NOTE [17]
Current assets: Financial assets - Other loans
Particulars As at 31-3-2020 As at 31-3-2019
v crore v crore v crore v crore Security deposits Considered good - unsecured 502.72 508.60 Less: Allowance for expected credit loss 0.97 0.46
501.75 508.14 Credit impaired – 5.07 Less: Allowance for expected credit loss – 5.07
– – Loans and advances to related parties Considered good - unsecured 194.87 66.46Other loans Considered good - secured 0.07 0.15 Considered good - unsecured 19.31 51.94
716.00 626.69
NOTE [18]
Current assets: Financial assets - Others
Particulars As at 31-3-2020 As at 31-3-2019
v crore v crore v crore v crore
Advances to related parties:
Associate companies 8.73 11.56
Joint venture companies 51.83 61.11
60.56 72.67
Advances recoverable in cash 1748.66 1519.17
Forward contract receivables 886.42 919.66
Embedded derivative receivables 232.23 39.75
Doubtful advances:
Deferred credit sale of ships 27.11 27.11
Other loans and advances 758.73 617.30
785.84 644.41
Less: Allowance for expected credit loss 785.84 644.41
– -
2927.87 2551.25
Notes forming part of the Consolidated Financial Statements (contd.)
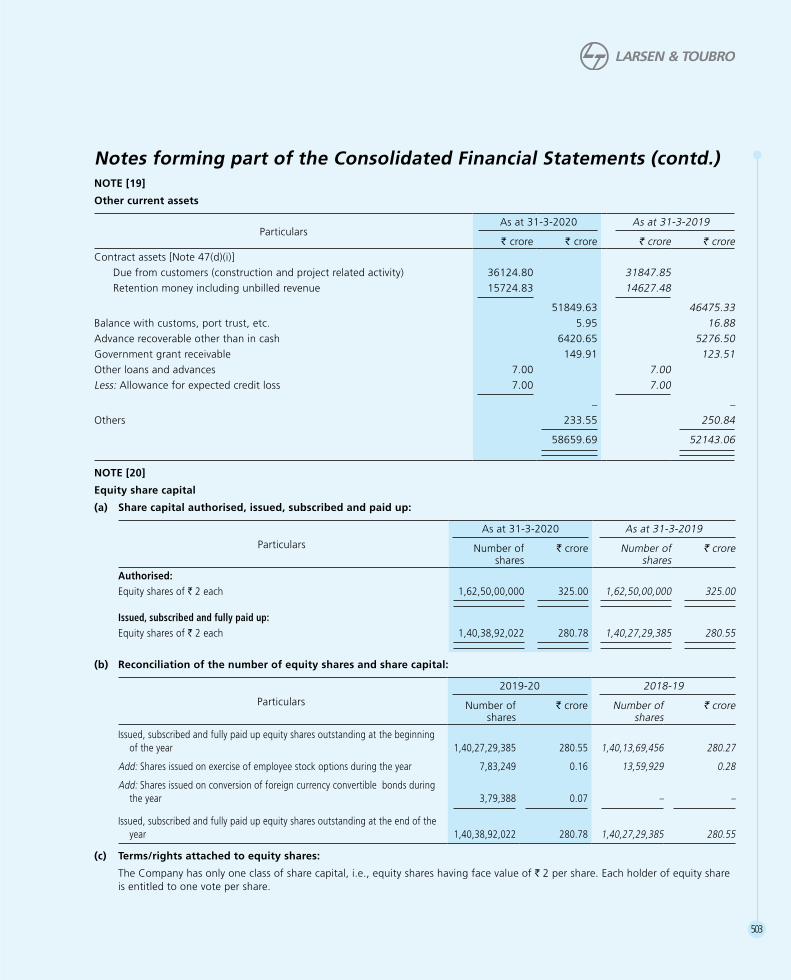
503
NOTE [19]
Other current assets
Particulars As at 31-3-2020 As at 31-3-2019
v crore v crore v crore v crore Contract assets [Note 47(d)(i)] Due from customers (construction and project related activity) 36124.80 31847.85 Retention money including unbilled revenue 15724.83 14627.48
51849.63 46475.33Balance with customs, port trust, etc. 5.95 16.88Advance recoverable other than in cash 6420.65 5276.50Government grant receivable 149.91 123.51 Other loans and advances 7.00 7.00 Less: Allowance for expected credit loss 7.00 7.00
– –Others 233.55 250.84
58659.69 52143.06
NOTE [20]
Equity share capital
(a) Share capital authorised, issued, subscribed and paid up:
Particulars
As at 31-3-2020 As at 31-3-2019
Number of shares
v crore Number of shares
v crore
Authorised:Equity shares of R 2 each 1,62,50,00,000 325.00 1,62,50,00,000 325.00
Issued, subscribed and fully paid up:Equity shares of R 2 each 1,40,38,92,022 280.78 1,40,27,29,385 280.55
(b) Reconciliation of the number of equity shares and share capital:
Particulars
2019-20 2018-19
Number of shares
v crore Number of shares
v crore
Issued, subscribed and fully paid up equity shares outstanding at the beginning of the year 1,40,27,29,385 280.55 1,40,13,69,456 280.27
Add: Shares issued on exercise of employee stock options during the year 7,83,249 0.16 13,59,929 0.28
Add: Shares issued on conversion of foreign currency convertible bonds during the year 3,79,388 0.07 – –
Issued, subscribed and fully paid up equity shares outstanding at the end of the year 1,40,38,92,022 280.78 1,40,27,29,385 280.55
(c) Terms/rights attached to equity shares:
The Company has only one class of share capital, i.e., equity shares having face value of R 2 per share. Each holder of equity share is entitled to one vote per share.
Notes forming part of the Consolidated Financial Statements (contd.)

504
NOTES FORMING PART OF THE CONSOLIDATED FINANCIAL STATEMENTS ANNUAL REPORT 2019-20
(d) Shareholder holding more than 5% of equity shares as at the end of the year:
Name of the shareholder
As at 31-3-2020 As at 31-3-2019
Number of shares
Shareholding %
Number of shares
Shareholding %
Life Insurance Corporation of India 20,91,83,856 14.90 24,66,76,682 17.59L&T Employees Trust 18,55,24,682 13.22 17,21,28,421 12.27
(e) Shares reserved for issue under options outstanding as at the end of the year on un-issued share capital:
Particulars
As at 31-3-2020 As at 31-3-2019
Number of equity shares to be issued as fully paid
R crore (at face
value)
Number of equity shares
to be issued as fully paid
R crore (at face
value)
Employee stock options granted and outstanding # 25,21,389@ 0.50* 28,85,240@ 0.58*0.675%5years&1dayUS$denominatedforeigncurrency
convertible bonds (FCCB) – – 95,20,455@ 1.90** * The equity shares will be issued at a premium of R 63.06crore(previous year: R 71.99 crore)
** The equity shares will be issued at a premium of Nil (previous year: R 1214.50 crore) on the exercise of options by the bond holders
# Note 20 (h) for terms of employee stock option schemes
@ Thenumberofoptionshavebeenadjustedconsequenttobonusissuewhereverapplicable
(f) The aggregate number of equity shares allotted as fully paid up by way of bonus shares in immediately preceding five years ended March31,2020are46,67,64,755(previousperiodoffiveyearsendedMarch31,2019:46,67,64,755shares).
(g) The aggregate number of equity shares issued pursuant to contract, without payment being received in cash in immediately preceding last five years ended on March 31, 2020– Nil (previous period of five years ended March 31, 2019: Nil).
(h) Stock option of the parent company:
i. Terms:
A. The grant of options to the employees under the stock option schemes is on the basis of their performance and other eligibilitycriteria.Theoptionsarevestedequallyoveraperiodof4years[5yearsinthecaseofseries2006(A)],subjectto the discretion of the management and fulfillment of certain conditions.
B. Options can be exercised anytime within a period of 7 years from the date of grant and would be settled by way of issue of equity shares. Management has discretion to modify the exercise period.
ii. The details of the grants under the aforesaid schemes under various series are summarised below:
Sr. No.
Series reference 2000 2002(A) 2002(B) 2003(A) 2003(B) 2006(A)
Particulars 2019-20 2018-19 2019-20 2018-19 2019-20 2018-19 2019-20 2018-19 2019-20 2018-19 2019-20 2018-19
i. Grant price - (R) 2.00 2:00 2.00 2.00 2.00 2.00 7.80 7.80 7.80 7.80 267.10 267.10
ii. Grant dates 1-6-2000 19-4-2002 19-4-2002 23-5-2003 onwards 23-5-2003 onwards 1-7-2007 onwards
iii. Vesting commences on 1-6-2001 19-4-2003 19-4-2003 23-5-2004 onwards 23-5-2004 onwards 1-7-2008 onwards
iv. Options granted and outstanding at the beginning of the year – 19,800 – 48,375 – 89,325 – 70,767 1,73,309 4,87,892 27,11,931 35,49,464
v. Options lapsed – 19,800 – 48,375 – 89,325 – 70,767 13,837 1,05,342 2,64,380 3,51,935
vi. Options granted – – – – – – – – 38,700 25,200 6,58,915 6,39,890
vii. Options exercised – – – – – – 52,237 2,34,441 7,31,012 11,25,488
Notes forming part of the Consolidated Financial Statements (contd.)NOTE [20] (contd.)
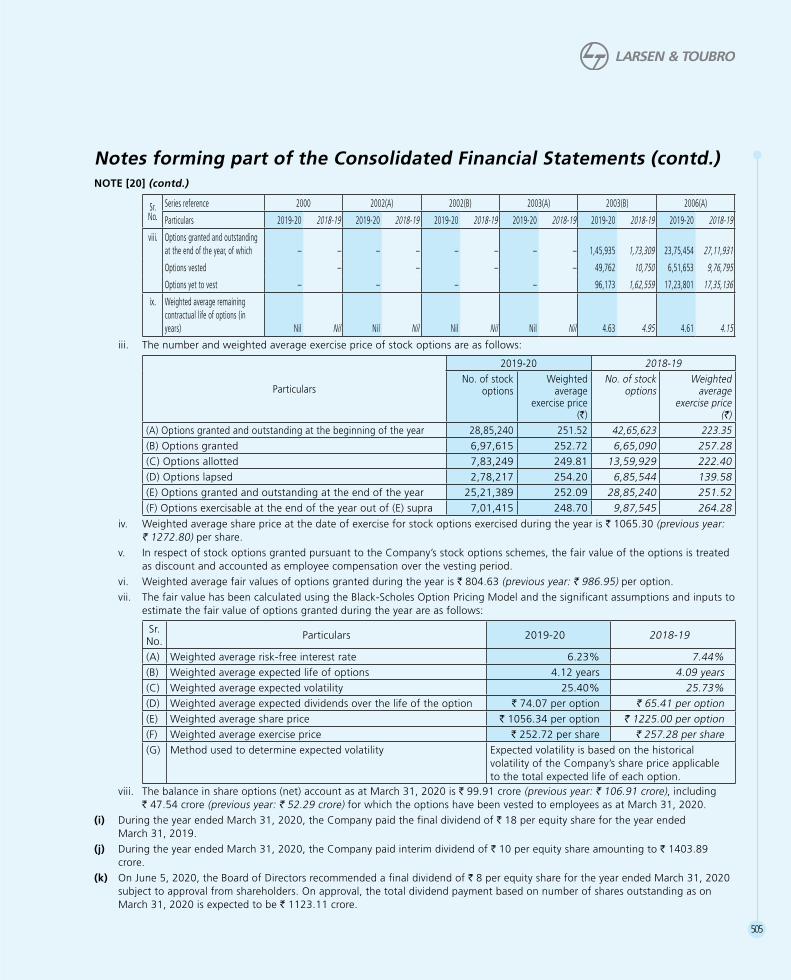
505
Sr. No.
Series reference 2000 2002(A) 2002(B) 2003(A) 2003(B) 2006(A)
Particulars 2019-20 2018-19 2019-20 2018-19 2019-20 2018-19 2019-20 2018-19 2019-20 2018-19 2019-20 2018-19
viii. Options granted and outstanding at the end of the year, of which – – – – – – – – 1,45,935 1,73,309 23,75,454 27,11,931
Options vested – – – – 49,762 10,750 6,51,653 9,76,795
Options yet to vest – – – – 96,173 1,62,559 17,23,801 17,35,136
ix. Weighted average remaining contractual life of options (in years) Nil Nil Nil Nil Nil Nil Nil Nil 4.63 4.95 4.61 4.15
iii. The number and weighted average exercise price of stock options are as follows:
Particulars
2019-20 2018-19No. of stock
optionsWeighted
average exercise price
(R)
No. of stock options
Weighted average
exercise price (R)
(A) Options granted and outstanding at the beginning of the year 28,85,240 251.52 42,65,623 223.35(B) Options granted 6,97,615 252.72 6,65,090 257.28(C) Options allotted 7,83,249 249.81 13,59,929 222.40(D) Options lapsed 2,78,217 254.20 6,85,544 139.58(E) Options granted and outstanding at the end of the year 25,21,389 252.09 28,85,240 251.52(F) Options exercisable at the end of the year out of (E) supra 7,01,415 248.70 9,87,545 264.28
iv. Weighted average share price at the date of exercise for stock options exercised during the year is R 1065.30(previous year: R 1272.80) per share.
v. In respect of stock options granted pursuant to the Company’s stock options schemes, the fair value of the options is treated as discount and accounted as employee compensation over the vesting period.
vi. Weighted average fair values of options granted during the year is R 804.63(previous year: R 986.95) per option. vii. The fair value has been calculated using the Black-Scholes Option Pricing Model and the significant assumptions and inputs to
estimate the fair value of options granted during the year are as follows:
Sr. No. Particulars 2019-20 2018-19
(A) Weighted average risk-free interest rate 6.23% 7.44%(B) Weighted average expected life of options 4.12 years 4.09 years(C) Weighted average expected volatility 25.40% 25.73%(D) Weighted average expected dividends over the life of the option R 74.07 per option R 65.41peroption(E) Weighted average share price R 1056.34peroption R 1225.00 per option(F) Weighted average exercise price R 252.72 per share R 257.28pershare(G) Method used to determine expected volatility Expected volatility is based on the historical
volatility of the Company’s share price applicable to the total expected life of each option.
viii. The balance in share options (net) account as at March 31, 2020 is R 99.91 crore (previous year: R 106.91crore), including R 47.54 crore (previous year: R 52.29 crore) for which the options have been vested to employees as at March 31, 2020.
(i) During the year ended March 31, 2020, the Company paid the final dividend of R 18perequitysharefortheyearendedMarch 31, 2019.
(j) During the year ended March 31, 2020, the Company paid interim dividend of R 10 per equity share amounting to R 1403.89crore.
(k) On June 5, 2020, the Board of Directors recommended a final dividend of R 8perequitysharefortheyearendedMarch31,2020subject to approval from shareholders. On approval, the total dividend payment based on number of shares outstanding as on March 31, 2020 is expected to be R 1123.11 crore.
Notes forming part of the Consolidated Financial Statements (contd.)NOTE [20] (contd.)
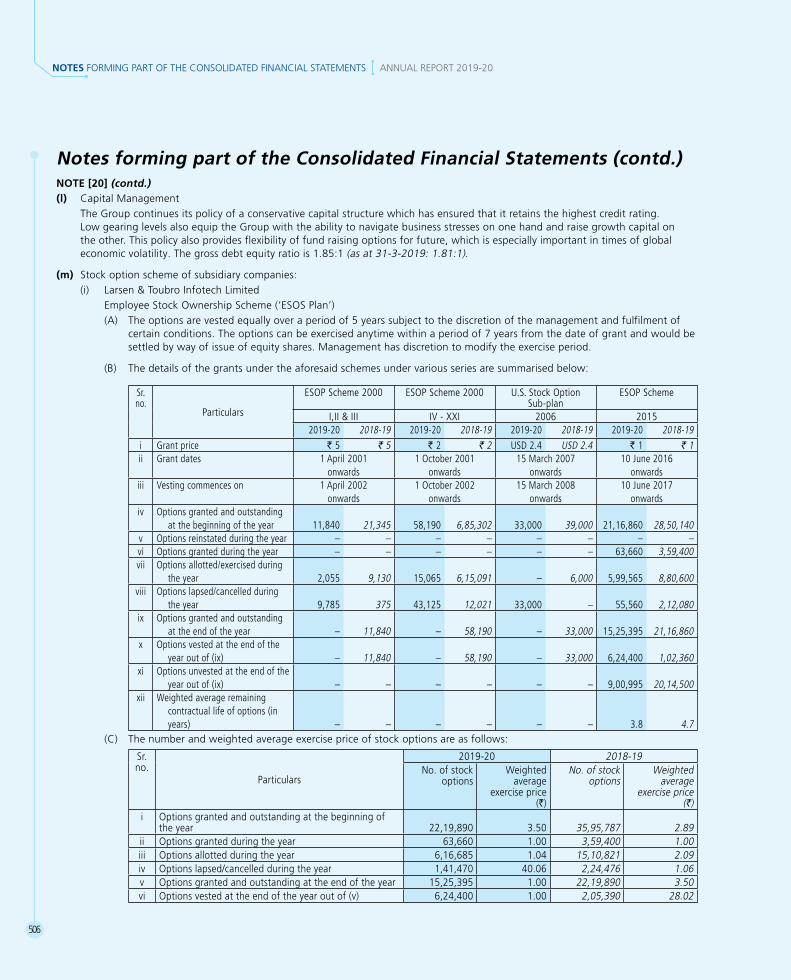
506
NOTES FORMING PART OF THE CONSOLIDATED FINANCIAL STATEMENTS ANNUAL REPORT 2019-20
(l) Capital Management The Group continues its policy of a conservative capital structure which has ensured that it retains the highest credit rating.
Low gearing levels also equip the Group with the ability to navigate business stresses on one hand and raise growth capital on the other. This policy also provides flexibility of fund raising options for future, which is especially important in times of global economicvolatility.Thegrossdebtequityratiois1.85:1(asat31-3-2019:1.81:1).
(m) Stock option scheme of subsidiary companies: (i) Larsen & Toubro Infotech Limited Employee Stock Ownership Scheme (‘ESOS Plan’) (A) The options are vested equally over a period of 5 years subject to the discretion of the management and fulfilment of
certain conditions. The options can be exercised anytime within a period of 7 years from the date of grant and would be settled by way of issue of equity shares. Management has discretion to modify the exercise period.
(B) The details of the grants under the aforesaid schemes under various series are summarised below:
Sr. no.
Particulars
ESOP Scheme 2000 ESOP Scheme 2000 U.S. Stock Option Sub-plan
ESOP Scheme
I,II & III IV - XXI 2006 20152019-20 2018-19 2019-20 2018-19 2019-20 2018-19 2019-20 2018-19
i Grant price R 5 R 5 R 2 R 2 USD 2.4 USD 2.4 R 1 R 1ii Grant dates 1 April 2001
onwards1 October 2001
onwards15 March 2007
onwards10 June 2016
onwardsiii Vesting commences on 1 April 2002
onwards1 October 2002
onwards15 March 2008
onwards10 June 2017
onwardsiv Options granted and outstanding
at the beginning of the year 11,840 21,345 58,190 6,85,302 33,000 39,000 21,16,860 28,50,140v Options reinstated during the year – – – – – – – –vi Options granted during the year – – – – – – 63,660 3,59,400vii Options allotted/exercised during
the year 2,055 9,130 15,065 6,15,091 – 6,000 5,99,565 8,80,600viii Options lapsed/cancelled during
the year 9,785 375 43,125 12,021 33,000 – 55,560 2,12,080ix Options granted and outstanding
at the end of the year – 11,840 – 58,190 – 33,000 15,25,395 21,16,860x Options vested at the end of the
year out of (ix) – 11,840 – 58,190 – 33,000 6,24,400 1,02,360xi Options unvested at the end of the
year out of (ix) – – – – – – 9,00,995 20,14,500xii Weighted average remaining
contractual life of options (in years) – – – – – – 3.8 4.7
(C) The number and weighted average exercise price of stock options are as follows:
Sr. no.
Particulars
2019-20 2018-19No. of stock
optionsWeighted
average exercise price
(R)
No. of stock options
Weighted average
exercise price (R)
i Options granted and outstanding at the beginning of the year 22,19,890 3.50 35,95,787 2.89
ii Options granted during the year 63,660 1.00 3,59,400 1.00iii Options allotted during the year 6,16,685 1.04 15,10,821 2.09iv Options lapsed/cancelled during the year 1,41,470 40.06 2,24,476 1.06v Options granted and outstanding at the end of the year 15,25,395 1.00 22,19,890 3.50vi Options vested at the end of the year out of (v) 6,24,400 1.00 2,05,390 28.02
Notes forming part of the Consolidated Financial Statements (contd.)NOTE [20] (contd.)

507
NOTE [20] (contd.) (D) Weighted average share price at the date of exercise for stock options exercised during the year is R 1581.00pershare
(previous year: R 1617.00pershare).
(E) Weighted average fair value of options granted during the year is R 1540.66pershare(previous year: R 1649.62pershare).
(F) The fair value has been calculated using the Black-Scholes Option Pricing model and significant assumptions and inputs to estimate the fair value options granted during the year are as follows:
Sr. no. Particulars 2019-20 2018-19
i Weighted average risk-free interest rate 6.18% 7.49%
ii Weighted average expected life of options 3 years 3 years
iii Weighted average expected volatility 17.44% 17.72%
iv Weighted average expected dividends over the life of option R 148.29 R 108.91
v Weighted average share price R 1541.55 R 1650.48
vi Weighted average exercise price R 1 R 1
vii Method used to determine expected volatility The expected volatility has been calculated entirely based on historic volatility of the IT Index.
(ii) L&T Technology Services Limited
(A) Employee stock option plan (ESOP)
(i) TheobjectiveoftheESOPScheme,2016istorewardthoseemployeeswhocontributesignificantlytotheCompany’s profitability and shareholder’s value as well as encourage improvement in performance and retention of talent. The options are vested equally over a period of 5 years subject to the discretion of the management and fulfillment of certain conditions.
(ii) TheexerciseperiodfortheoptionsgrantedundertheESOPScheme,2016wouldbesevenyears(84months)fromthedateofgrantofoptionsorsixyears(72months)fromthedateoffirstvestingorthreeyears(36months)fromthe date of retirement/death, whichever is earlier, subject to any change as may be approved by the Board. The exercise price may be decided by the Board, in such manner, during such period, in one or more tranches and on such terms and conditions as it may deem fit, provided that the exercise price per option shall not be less than the par value of the equity share of our Company and shall not be more than the market price as defined in the SEBI (Share Based Employee Benefits) Regulations, 2014 and shall be subject to compliance with accounting policies under the said regulation. The number of shares to be allotted on exercise of options should not exceed the total number of unexercised vested options that may be exercised by the employee. Details of grant under ESOP Scheme, 2016issummarisedbelow:
Sr. no. Particulars
ESOPscheme,2016
2019-20 2018-19
i Grant price R 2 R 2
ii Grant dates 28-07-2016onwards
iii Vesting commences on 28-07-2017onwards
iv Options granted and outstanding at the beginning of the year 17,38,667 32,24,945
v Options lapsed during the year 84,000 1,64,000
vi Options granted during the year 1,66,000 2,35,000
vii Options exercised during the year 4,98,233 15,57,278
viii Options granted and outstanding at the end of the year-(a) 13,22,434 17,38,667
of (a) above - vested outstanding options 1,05,074 82,187
of (a) above - unvested outstanding options 12,17,360 16,56,480
ix Weighted average remaining contractual life of options (in years) 2.99 4.51
Notes forming part of the Consolidated Financial Statements (contd.)

508
NOTES FORMING PART OF THE CONSOLIDATED FINANCIAL STATEMENTS ANNUAL REPORT 2019-20
(B) No options were granted to key managerial personnel during the current year as well as previous year.
(C) The number and weighted average exercise price of stock options are as follows:
Sr. no.
Particulars
2019-20 2018-19
No. of stock options
Weighted average exercise
price (R)
No. of stock options
Weighted average exercise
price (R)i Options granted and outstanding at the
beginning of the year 17,38,667 2.00 32,24,945 2.00ii Options granted during the year 1,66,000 2.00 2,35,000 2.00iii Options exercised during the year 4,98,233 2.00 15,57,278 2.00iv Options lapsed during the year 84,000 2.00 1,64,000 2.00v Options granted and outstanding at the end of
the year 13,22,434 2.00 17,38,667 2.00vi Options exercisable at the end of the year out
of (v) above 1,05,074 2.00 82,187 2.00 (D) Weighted average share price at the date of exercise for stock options exercised during the year is R 1619.53pershare
(previous year: R 1435.59 per share).
(E) In respect of stock options granted pursuant to the Company’s stock options schemes, the fair value of the options is treated as discount and accounted as employee compensation over the vesting period.
(F) The fair value at grant date of options granted during the year ended 31-3-2020 is R 1588.88peroptionandR 1527.59 per option (previous year: R 1231.30 per option). The fair value of grant date is determined using the Black-Scholes Option Pricing Model which takes into account the exercise price, term of option, share price at grant date and expected price volatility of the underlying share, the expected dividend yield and the risk free interest rate for the term of the option. The model inputs for options granted during the year included:
Sr. no. Particulars 2019-20 2018-19i Weighted average exercise price R 2.00 R 2.00 R 2.00ii Grant date 19-Jul-19 18-Oct-19 23-Jul-18iii Expiry date 18-Jul-26 17-Oct-26 22-Jul-25iv Weighted average share price at grant date R 1660.45per
optionR 1593.30 per
optionR 1281.80per
optionv Weighted average expected price volatility of
company’s share 24.01% 23.21% 22.47%vi Weighted average expected dividend yield over life of
option 5.30% 5.08% 5.06%vii Weighted average risk-free interest 6.22% 6.03% 7.67%viii Method used to determine expected volatility The expected price volatility is based on the historic
volatility (based on the remaining life of the options), adjusted for any expected changes to future volatility due to publicly available information.
(iii) L&T Finance Holdings Limited The Company has formulated Employee Stock Option Schemes 2010 (ESOP Scheme 2010) and 2013 (ESOP Scheme 2013).
The grant of options to the employees under the stock option schemes is on the basis of their performance and other eligibilitycriteria.Theoptionsallottedunderthescheme2010arevestedoveraperiodoffouryearsintheratioof15%,20%,30%and35%respectivelyfromtheendof12monthsfromthedateofgrant,subjecttothediscretionofthemanagement and fulfillment of certain conditions. The options granted under the scheme 2013 are vested in a graded manneroveraperiodoffouryearswith0%,33%,33%and34%ofgrantsvestingeachyear,commencingfromtheendof24monthsfromthedateofgrantorw.e.f.July10,2019vestedinagradedmanneroveraperiodoffouryearswith25%,25%,25%and25%ofgrantsvestingeachyear,commencingfromtheendof12monthsfromthedateofgrant.
Notes forming part of the Consolidated Financial Statements (contd.)NOTE [20] (contd.)
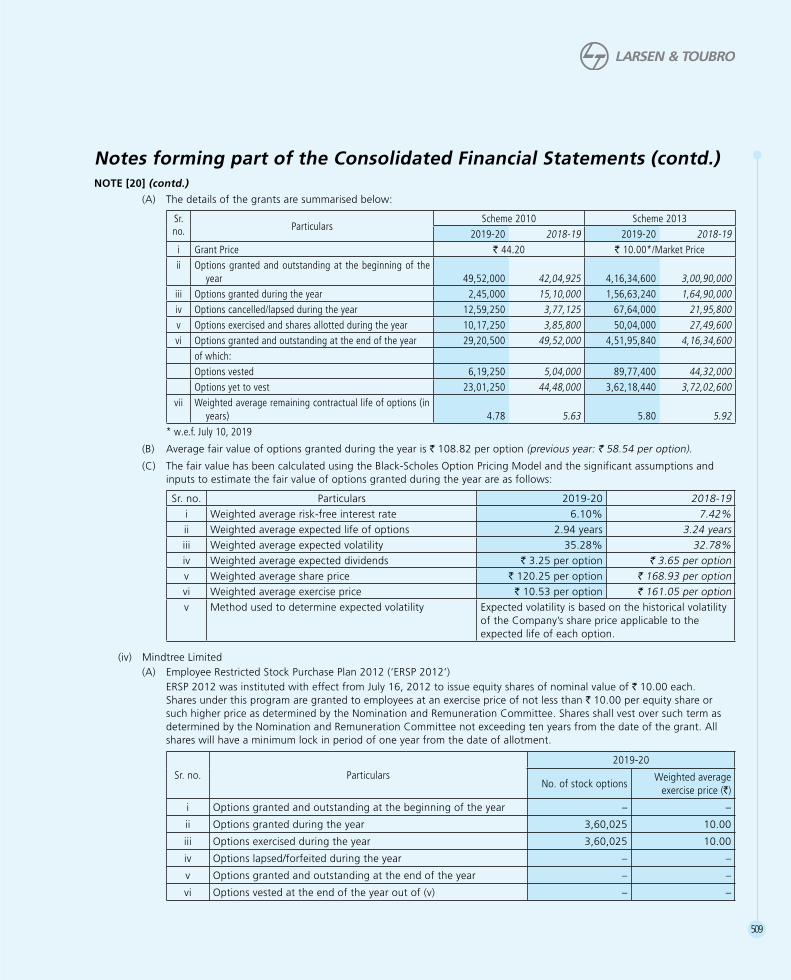
509
(A) The details of the grants are summarised below:
Sr. no. Particulars
Scheme 2010 Scheme 20132019-20 2018-19 2019-20 2018-19
i Grant Price R 44.20 R 10.00*/Market Priceii Options granted and outstanding at the beginning of the
year 49,52,000 42,04,925 4,16,34,600 3,00,90,000iii Options granted during the year 2,45,000 15,10,000 1,56,63,240 1,64,90,000iv Options cancelled/lapsed during the year 12,59,250 3,77,125 67,64,000 21,95,800v Options exercised and shares allotted during the year 10,17,250 3,85,800 50,04,000 27,49,600vi Options granted and outstanding at the end of the year 29,20,500 49,52,000 4,51,95,840 4,16,34,600
of which:Options vested 6,19,250 5,04,000 89,77,400 44,32,000Options yet to vest 23,01,250 44,48,000 3,62,18,440 3,72,02,600
vii Weighted average remaining contractual life of options (in years) 4.78 5.63 5.80 5.92
* w.e.f. July 10, 2019
(B) Average fair value of options granted during the year is R 108.82peroption(previous year: R 58.54peroption).
(C) The fair value has been calculated using the Black-Scholes Option Pricing Model and the significant assumptions and inputs to estimate the fair value of options granted during the year are as follows:
Sr. no. Particulars 2019-20 2018-19i Weighted average risk-free interest rate 6.10% 7.42%ii Weighted average expected life of options 2.94 years 3.24 yearsiii Weighted average expected volatility 35.28% 32.78%iv Weighted average expected dividends R 3.25 per option R 3.65peroptionv Weighted average share price R 120.25 per option R 168.93peroptionvi Weighted average exercise price R 10.53 per option R 161.05peroptionv Method used to determine expected volatility Expected volatility is based on the historical volatility
of the Company’s share price applicable to the expected life of each option.
(iv) Mindtree Limited (A) Employee Restricted Stock Purchase Plan 2012 (‘ERSP 2012’) ERSP2012wasinstitutedwitheffectfromJuly16,2012toissueequitysharesofnominalvalueofR 10.00 each.
Shares under this program are granted to employees at an exercise price of not less than R 10.00 per equity share or such higher price as determined by the Nomination and Remuneration Committee. Shares shall vest over such term as determined by the Nomination and Remuneration Committee not exceeding ten years from the date of the grant. All shares will have a minimum lock in period of one year from the date of allotment.
Sr. no. Particulars2019-20
No. of stock optionsWeighted average
exercise price (R)
i Options granted and outstanding at the beginning of the year – –
ii Options granted during the year 3,60,025 10.00
iii Options exercised during the year 3,60,025 10.00
iv Options lapsed/forfeited during the year – –
v Options granted and outstanding at the end of the year – –
vi Options vested at the end of the year out of (v) – –
Notes forming part of the Consolidated Financial Statements (contd.)NOTE [20] (contd.)
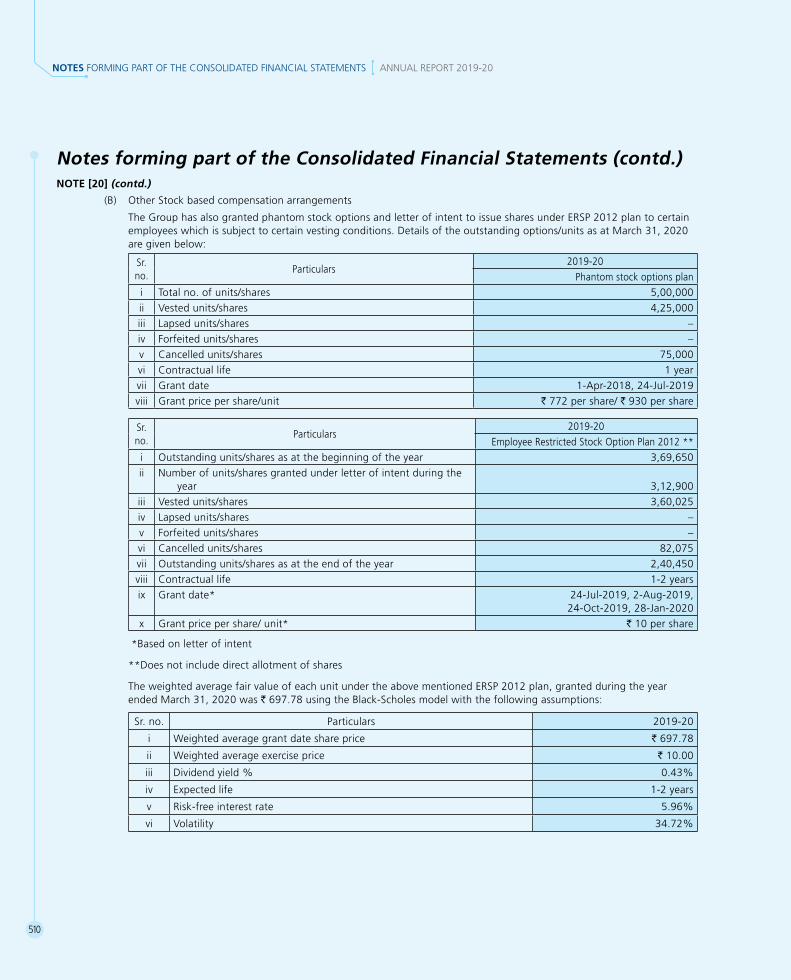
510
NOTES FORMING PART OF THE CONSOLIDATED FINANCIAL STATEMENTS ANNUAL REPORT 2019-20
(B) Other Stock based compensation arrangements
The Group has also granted phantom stock options and letter of intent to issue shares under ERSP 2012 plan to certain employees which is subject to certain vesting conditions. Details of the outstanding options/units as at March 31, 2020 are given below:
Sr. no.
Particulars2019-20
Phantom stock options plani Total no. of units/shares 5,00,000ii Vested units/shares 4,25,000iii Lapsed units/shares –iv Forfeited units/shares –v Cancelled units/shares 75,000vi Contractual life 1 yearvii Grant date 1-Apr-2018,24-Jul-2019viii Grant price per share/unit R 772 per share/ R 930 per share
Sr. no.
Particulars2019-20
Employee Restricted Stock Option Plan 2012 **i Outstanding units/shares as at the beginning of the year 3,69,650ii Number of units/shares granted under letter of intent during the
year 3,12,900iii Vested units/shares 3,60,025iv Lapsed units/shares –v Forfeited units/shares –vi Cancelled units/shares 82,075vii Outstanding units/shares as at the end of the year 2,40,450viii Contractual life 1-2 yearsix Grant date* 24-Jul-2019, 2-Aug-2019,
24-Oct-2019,28-Jan-2020x Grant price per share/ unit* R 10 per share
*Based on letter of intent
**Does not include direct allotment of shares
The weighted average fair value of each unit under the above mentioned ERSP 2012 plan, granted during the year ended March 31, 2020 was R 697.78usingtheBlack-Scholesmodelwiththefollowingassumptions:
Sr. no. Particulars 2019-20
i Weighted average grant date share price R 697.78
ii Weighted average exercise price R 10.00
iii Dividendyield% 0.43%
iv Expected life 1-2 years
v Risk-free interest rate 5.96%
vi Volatility 34.72%
Notes forming part of the Consolidated Financial Statements (contd.)NOTE [20] (contd.)
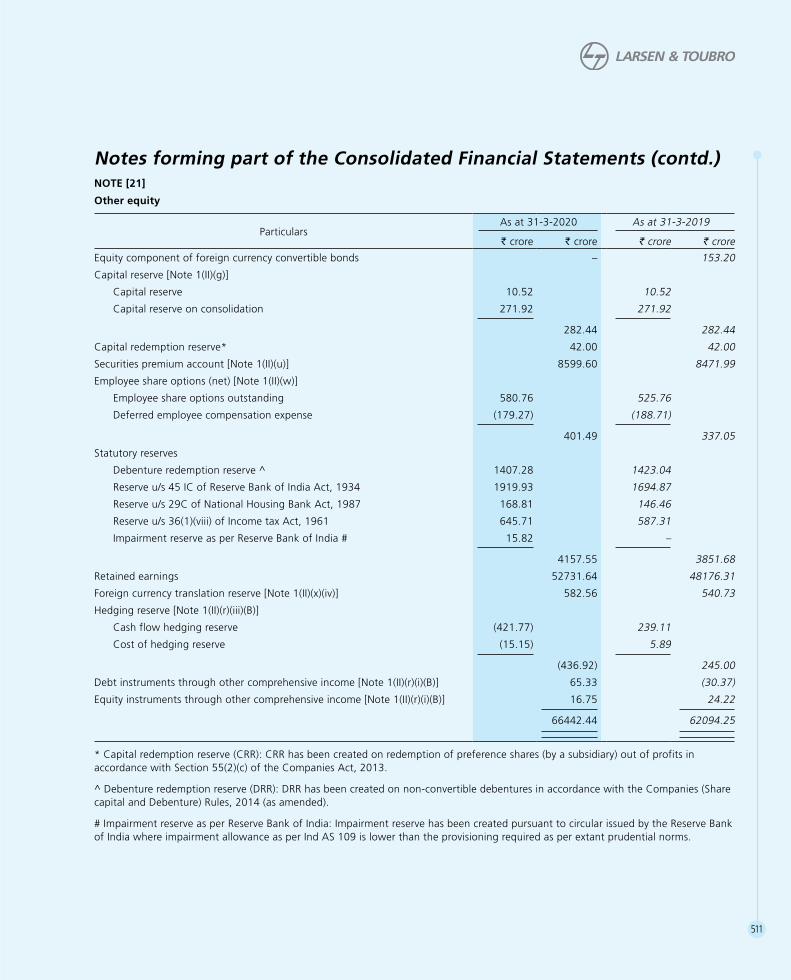
511
NOTE [21]
Other equity
Particulars As at 31-3-2020 As at 31-3-2019
v crore v crore v crore v crore
Equity component of foreign currency convertible bonds – 153.20
Capital reserve [Note 1(II)(g)]
Capital reserve 10.52 10.52
Capital reserve on consolidation 271.92 271.92
282.44 282.44
Capital redemption reserve* 42.00 42.00
Securities premium account [Note 1(II)(u)] 8599.60 8471.99
Employee share options (net) [Note 1(II)(w)]
Employee share options outstanding 580.76 525.76
Deferred employee compensation expense (179.27) (188.71)
401.49 337.05
Statutory reserves
Debenture redemption reserve ^ 1407.28 1423.04
Reserve u/s 45 IC of Reserve Bank of India Act, 1934 1919.93 1694.87
Reserveu/s29CofNationalHousingBankAct,1987 168.81 146.46
Reserveu/s36(1)(viii)ofIncometaxAct,1961 645.71 587.31
Impairment reserve as per Reserve Bank of India # 15.82 –
4157.55 3851.68
Retained earnings 52731.64 48176.31
Foreign currency translation reserve [Note 1(II)(x)(iv)] 582.56 540.73
Hedging reserve [Note 1(II)(r)(iii)(B)]
Cash flow hedging reserve (421.77) 239.11
Cost of hedging reserve (15.15) 5.89
(436.92) 245.00
Debt instruments through other comprehensive income [Note 1(II)(r)(i)(B)] 65.33 (30.37)
Equity instruments through other comprehensive income [Note 1(II)(r)(i)(B)] 16.75 24.22
66442.44 62094.25
* Capital redemption reserve (CRR): CRR has been created on redemption of preference shares (by a subsidiary) out of profits in accordance with Section 55(2)(c) of the Companies Act, 2013.
^ Debenture redemption reserve (DRR): DRR has been created on non-convertible debentures in accordance with the Companies (Share capital and Debenture) Rules, 2014 (as amended).
# Impairment reserve as per Reserve Bank of India: Impairment reserve has been created pursuant to circular issued by the Reserve Bank of India where impairment allowance as per Ind AS 109 is lower than the provisioning required as per extant prudential norms.
Notes forming part of the Consolidated Financial Statements (contd.)
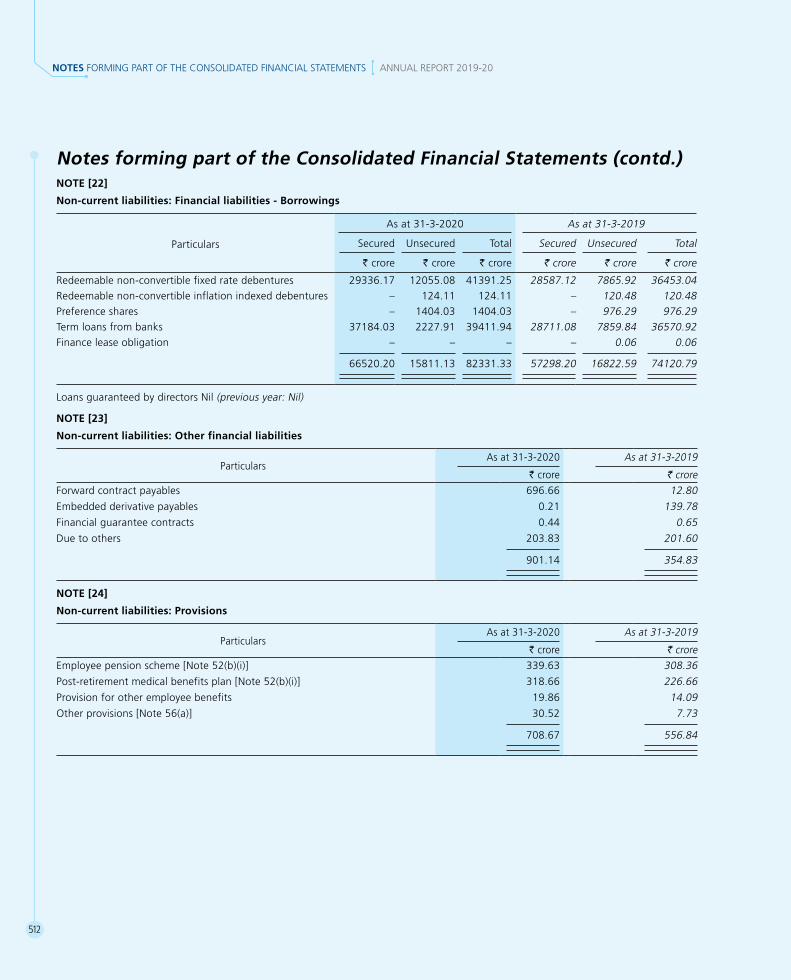
512
NOTES FORMING PART OF THE CONSOLIDATED FINANCIAL STATEMENTS ANNUAL REPORT 2019-20
NOTE [22]
Non-current liabilities: Financial liabilities - Borrowings
Particulars
As at 31-3-2020 As at 31-3-2019
Secured Unsecured Total Secured Unsecured Total
v crore v crore v crore v crore v crore v crore
Redeemable non-convertible fixed rate debentures 29336.17 12055.08 41391.25 28587.12 7865.92 36453.04Redeemable non-convertible inflation indexed debentures – 124.11 124.11 – 120.48 120.48Preference shares – 1404.03 1404.03 – 976.29 976.29Term loans from banks 37184.03 2227.91 39411.94 28711.08 7859.84 36570.92Finance lease obligation – – – – 0.06 0.06
66520.20 15811.13 82331.33 57298.20 16822.59 74120.79
Loans guaranteed by directors Nil (previous year: Nil)
NOTE [23]
Non-current liabilities: Other financial liabilities
Particulars As at 31-3-2020 As at 31-3-2019
v crore v croreForward contract payables 696.66 12.80
Embedded derivative payables 0.21 139.78
Financial guarantee contracts 0.44 0.65
Due to others 203.83 201.60
901.14 354.83
NOTE [24]
Non-current liabilities: Provisions
Particulars As at 31-3-2020 As at 31-3-2019
v crore v croreEmployee pension scheme [Note 52(b)(i)] 339.63 308.36
Post-retirement medical benefits plan [Note 52(b)(i)] 318.66 226.66
Provision for other employee benefits 19.86 14.09
Otherprovisions[Note56(a)] 30.52 7.73
708.67 556.84
Notes forming part of the Consolidated Financial Statements (contd.)
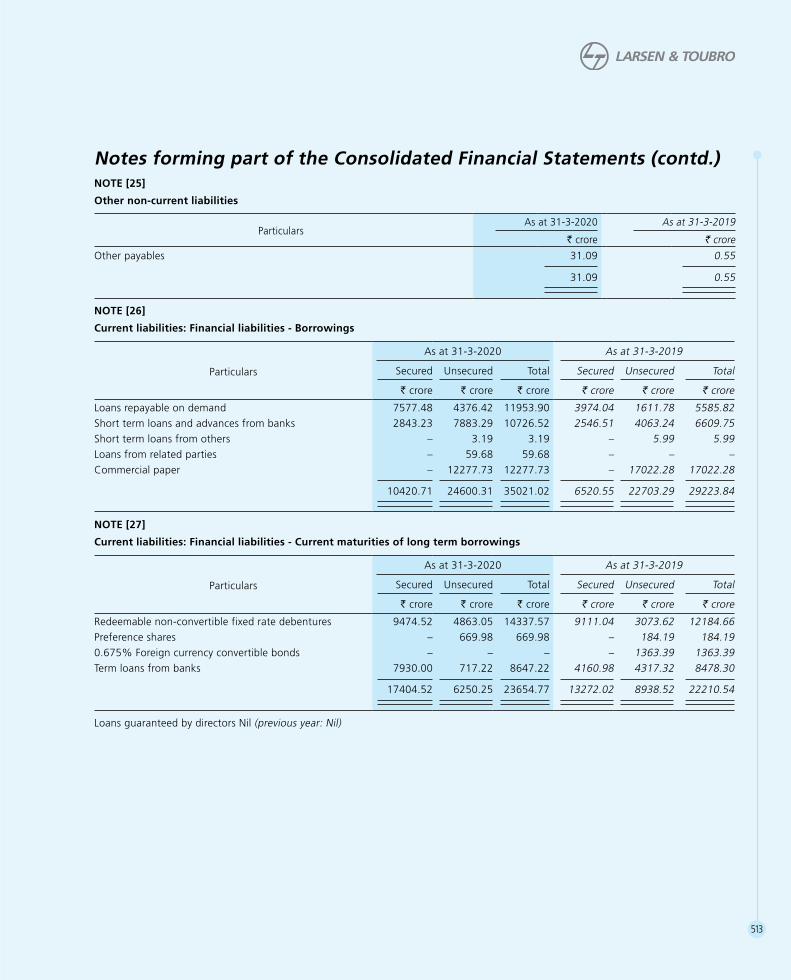
513
NOTE [25]
Other non-current liabilities
Particulars As at 31-3-2020 As at 31-3-2019
v crore v crore
Other payables 31.09 0.55
31.09 0.55
NOTE [26]
Current liabilities: Financial liabilities - Borrowings
Particulars
As at 31-3-2020 As at 31-3-2019
Secured Unsecured Total Secured Unsecured Total
v crore v crore v crore v crore v crore v crore
Loans repayable on demand 7577.48 4376.42 11953.90 3974.04 1611.78 5585.82Short term loans and advances from banks 2843.23 7883.29 10726.52 2546.51 4063.24 6609.75Short term loans from others – 3.19 3.19 – 5.99 5.99 Loans from related parties – 59.68 59.68 – – – Commercial paper – 12277.73 12277.73 – 17022.28 17022.28
10420.71 24600.31 35021.02 6520.55 22703.29 29223.84
NOTE [27]
Current liabilities: Financial liabilities - Current maturities of long term borrowings
Particulars
As at 31-3-2020 As at 31-3-2019
Secured Unsecured Total Secured Unsecured Total
v crore v crore v crore v crore v crore v crore
Redeemable non-convertible fixed rate debentures 9474.52 4863.05 14337.57 9111.04 3073.62 12184.66Preference shares – 669.98 669.98 – 184.19 184.190.675%Foreigncurrencyconvertiblebonds – – – – 1363.39 1363.39Term loans from banks 7930.00 717.22 8647.22 4160.98 4317.32 8478.30
17404.52 6250.25 23654.77 13272.02 8938.52 22210.54
Loans guaranteed by directors Nil (previous year: Nil)
Notes forming part of the Consolidated Financial Statements (contd.)

514
NOTES FORMING PART OF THE CONSOLIDATED FINANCIAL STATEMENTS ANNUAL REPORT 2019-20
NOTE [28]
Current liabilities: Financial liabilities - Other trade payables
Particulars As at 31-3-2020 As at 31-3-2019
v crore v crore v crore v crore Acceptances 237.30 520.99 Due to related parties: Associate companies 109.26 47.68 Joint venture companies 1300.77 1092.73
1410.03 1140.41 Due to others 41517.09 41072.29
43164.42 42733.69
NOTE [29]
Current liabilities: Other financial liabilities
Particulars As at 31-3-2020 As at 31-3-2019
v crore v croreUnclaimed dividend 114.27 84.64
Unclaimed interest on debentures 17.99 15.31
Financial guarantee contracts 0.58 1.13
Forward contract payables 1277.04 380.65
Embedded derivative payables 118.21 145.48
Due to others 3395.14 3995.57
4923.23 4622.78
NOTE [30]
Other current liabilities
Particulars As at 31-3-2020 As at 31-3-2019
v crore v crore v crore v croreContract liabilities [Note 47(d)(i)]
Due to customers (construction and project related activity) 11666.09 11001.87
Advances from customers 16353.36 17270.56
28019.45 28272.43
Other payables 2797.22 2894.12
30816.67 31166.55
Notes forming part of the Consolidated Financial Statements (contd.)
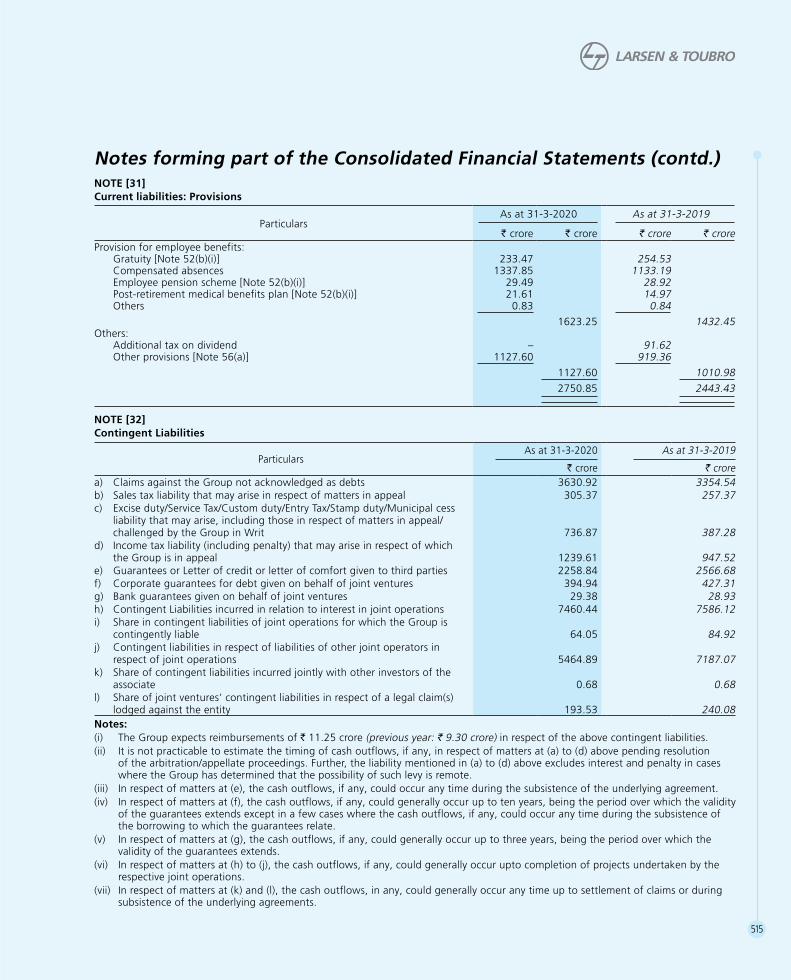
515
NOTE [31]Current liabilities: Provisions
Particulars As at 31-3-2020 As at 31-3-2019
v crore v crore v crore v crore Provision for employee benefits: Gratuity [Note 52(b)(i)] 233.47 254.53 Compensated absences 1337.85 1133.19 Employee pension scheme [Note 52(b)(i)] 29.49 28.92 Post-retirement medical benefits plan [Note 52(b)(i)] 21.61 14.97 Others 0.83 0.84
1623.25 1432.45 Others: Additional tax on dividend – 91.62 Otherprovisions[Note56(a)] 1127.60 919.36
1127.60 1010.982750.85 2443.43
NOTE [32]Contingent Liabilities
Particulars As at 31-3-2020 As at 31-3-2019
v crore v crorea) Claims against the Group not acknowledged as debts 3630.92 3354.54 b) Sales tax liability that may arise in respect of matters in appeal 305.37 257.37 c) Excise duty/Service Tax/Custom duty/Entry Tax/Stamp duty/Municipal cess
liability that may arise, including those in respect of matters in appeal/challenged by the Group in Writ 736.87 387.28
d) Income tax liability (including penalty) that may arise in respect of which the Group is in appeal 1239.61 947.52
e) Guarantees or Letter of credit or letter of comfort given to third parties 2258.84 2566.68f) Corporate guarantees for debt given on behalf of joint ventures 394.94 427.31 g) Bank guarantees given on behalf of joint ventures 29.38 28.93h) Contingent Liabilities incurred in relation to interest in joint operations 7460.44 7586.12i) Share in contingent liabilities of joint operations for which the Group is
contingently liable 64.05 84.92j) Contingent liabilities in respect of liabilities of other joint operators in
respect of joint operations 5464.89 7187.07k) Share of contingent liabilities incurred jointly with other investors of the
associate 0.68 0.68l) Share of joint ventures’ contingent liabilities in respect of a legal claim(s)
lodged against the entity 193.53 240.08Notes:(i) The Group expects reimbursements of R 11.25 crore (previous year: R 9.30 crore) in respect of the above contingent liabilities. (ii) It is not practicable to estimate the timing of cash outflows, if any, in respect of matters at (a) to (d) above pending resolution
of the arbitration/appellate proceedings. Further, the liability mentioned in (a) to (d) above excludes interest and penalty in cases where the Group has determined that the possibility of such levy is remote.
(iii) In respect of matters at (e), the cash outflows, if any, could occur any time during the subsistence of the underlying agreement. (iv) In respect of matters at (f), the cash outflows, if any, could generally occur up to ten years, being the period over which the validity
of the guarantees extends except in a few cases where the cash outflows, if any, could occur any time during the subsistence of the borrowing to which the guarantees relate.
(v) In respect of matters at (g), the cash outflows, if any, could generally occur up to three years, being the period over which the validity of the guarantees extends.
(vi) In respect of matters at (h) to (j), the cash outflows, if any, could generally occur upto completion of projects undertaken by the respective joint operations.
(vii) In respect of matters at (k) and (l), the cash outflows, in any, could generally occur any time up to settlement of claims or during subsistence of the underlying agreements.
Notes forming part of the Consolidated Financial Statements (contd.)
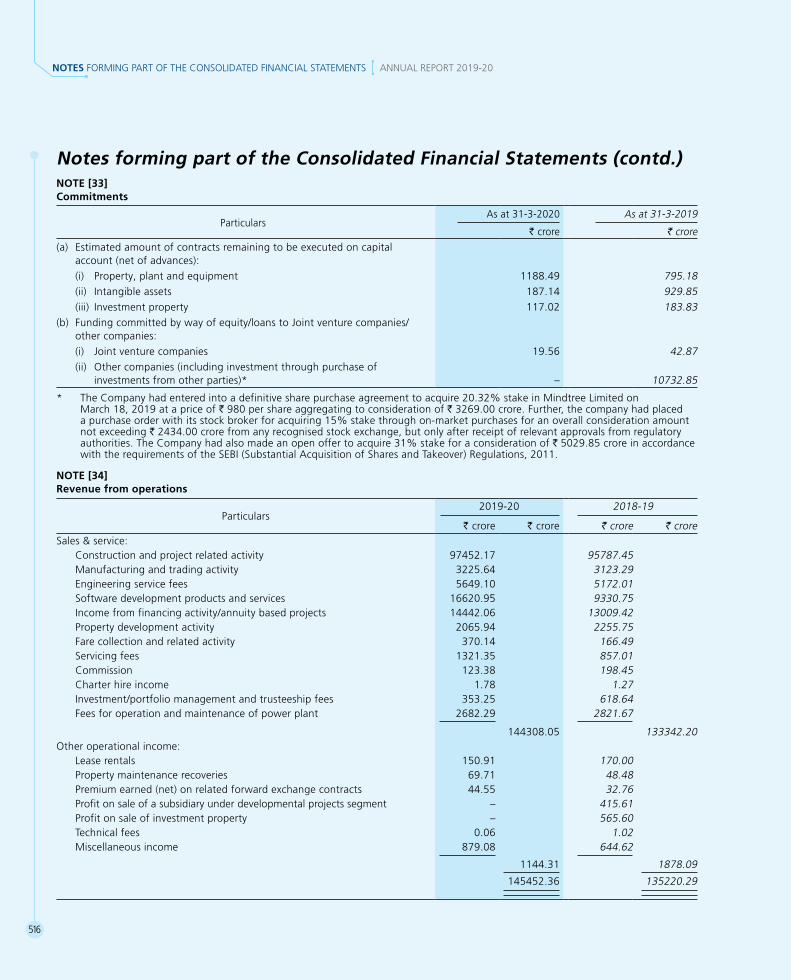
516
NOTES FORMING PART OF THE CONSOLIDATED FINANCIAL STATEMENTS ANNUAL REPORT 2019-20
NOTE [33]Commitments
Particulars As at 31-3-2020 As at 31-3-2019
v crore v crore(a) Estimated amount of contracts remaining to be executed on capital
account (net of advances): (i) Property, plant and equipment 1188.49 795.18 (ii) Intangible assets 187.14 929.85 (iii) Investment property 117.02 183.83(b) Funding committed by way of equity/loans to Joint venture companies/
other companies: (i) Joint venture companies 19.56 42.87 (ii) Other companies (including investment through purchase of
investments from other parties)* – 10732.85
* TheCompanyhadenteredintoadefinitivesharepurchaseagreementtoacquire20.32%stakeinMindtreeLimitedonMarch18,2019atapriceofR 980pershareaggregatingtoconsiderationofR 3269.00crore.Further,thecompanyhadplacedapurchaseorderwithitsstockbrokerforacquiring15%stakethroughon-marketpurchasesforanoverallconsiderationamountnot exceeding R 2434.00 crore from any recognised stock exchange, but only after receipt of relevant approvals from regulatory authorities.TheCompanyhadalsomadeanopenoffertoacquire31%stakeforaconsiderationofR 5029.85croreinaccordancewith the requirements of the SEBI (Substantial Acquisition of Shares and Takeover) Regulations, 2011.
NOTE [34]Revenue from operations
Particulars2019-20 2018-19
v crore v crore v crore v crore Sales & service: Construction and project related activity 97452.17 95787.45 Manufacturing and trading activity 3225.64 3123.29 Engineering service fees 5649.10 5172.01 Software development products and services 16620.95 9330.75 Income from financing activity/annuity based projects 14442.06 13009.42 Property development activity 2065.94 2255.75 Fare collection and related activity 370.14 166.49 Servicing fees 1321.35 857.01 Commission 123.38 198.45 Charter hire income 1.78 1.27 Investment/portfolio management and trusteeship fees 353.25 618.64 Fees for operation and maintenance of power plant 2682.29 2821.67
144308.05 133342.20 Other operational income: Lease rentals 150.91 170.00 Property maintenance recoveries 69.71 48.48 Premium earned (net) on related forward exchange contracts 44.55 32.76 Profit on sale of a subsidiary under developmental projects segment – 415.61 Profit on sale of investment property – 565.60 Technical fees 0.06 1.02 Miscellaneous income 879.08 644.62
1144.31 1878.09
145452.36 135220.29
Notes forming part of the Consolidated Financial Statements (contd.)

517
NOTE [35]Other income
Particulars2019-20 2018-19
v crore v crore v crore v crore Interestincome[Note46(a)]: Loans and advances to joint venture and associate companies 109.34 113.16 Investments 378.65 389.71 Others 341.08 392.12
829.07 894.99Dividend income: Trade investments 1.76 2.09 Current investments 0.60 176.73 Others 99.24 58.09
101.60 236.91Net gain/(loss) on sale or fair valuation of investments 733.84 65.33Net gain/(loss) on derivatives at fair value through profit or loss 13.19 (21.81)Net gain/(loss) on sale of property, plant and equipment (33.28) 24.76Lease rentals 19.94 5.07 Miscellaneous income (net of expenses) 696.54 631.28
2360.90 1836.53
NOTE [36]Manufacturing, construction and operating expenses
Particulars2019-20 2018-19
v crore v crore v crore v crore Cost of raw materials, components consumed: Raw materials and components 15632.01 14887.42 Less: Scrap sales 83.35 115.86
15548.66 14771.56Construction materials consumed 30316.12 31230.44 Purchase of stock-in-trade 841.09 887.87Stores, spares and tools consumed 2184.46 2812.31Sub-contracting charges 26454.05 26011.91Changes in inventories of finished goods, stock-in-trade, work-in-progress and property development: Closing stock: Finished goods 98.56 55.09 Stock-in-trade 308.36 291.28 Work-in-progress 5748.17 5609.37 Cost of built up space and property development land: Work-in-progress 3130.39 3174.88 Completed property 72.37 115.32
9357.85 9245.94
Carried forward 9357.85 75344.38 9245.94 75714.09
Notes forming part of the Consolidated Financial Statements (contd.)

518
NOTES FORMING PART OF THE CONSOLIDATED FINANCIAL STATEMENTS ANNUAL REPORT 2019-20
Particulars2019-20 2018-19
v crore v crore v crore v crore Brought forward 9357.85 75344.38 9245.94 75714.09 Less: Opening stock: Finished goods 55.09 61.84 Stock-in-trade 291.28 224.81 Work-in-progress 5609.37 4345.49 Cost of built up space and property development land: Work-in-progress 3174.88 3744.40 Completed property 115.32 138.29
9245.94 8514.83
(111.91) (731.11) Inventorisation of investment property 759.61 –
647.70 (731.11)Other manufacturing, construction and operating expenses: Power and fuel 1922.13 2085.09 Royalty and technical know-how fees 119.52 42.94 Packing and forwarding 572.93 485.06 Rent and hire charges 2714.02 2930.62 Bank guarantee charges 248.67 208.40 Engineering, professional, technical and consultancy fees 2003.15 2084.53 Insurance 321.32 285.08 Rates and taxes 632.18 622.53 Travelling and conveyance 1113.94 1113.65 Repairs to plant and equipment 90.48 77.64 Repairs to buildings 22.22 23.00 General repairs and maintenance 640.32 473.21 Provision/(reversal) for foreseeable losses on construction contracts (103.28) 183.51 Other provisions 12.84 148.06 Expenses on construction job in realty business 392.48 850.63 Software development expenses 1759.24 933.07 Miscellaneous expenses 866.55 717.41
13328.71 13264.43Finance cost of financial services business and finance lease activity: Interest and other financing charges 8041.88 7385.63
97362.67 95633.04
Notes forming part of the Consolidated Financial Statements (contd.)NOTE [36]Manufacturing, construction and operating expenses (contd.)

519
NOTE [37]Employee benefits expense
Particulars2019-20 2018-19
v crore v crore v crore v crore Salaries, wages and bonus 20821.99 15760.62Contribution to and provision for: Provident fund and pension fund 407.06 289.91 Superannuation/employee pension and social security schemes 199.13 212.55 Gratuity funds [Note 52(b)(ii)] 154.25 144.75
760.44 647.21Expenses on employee stock option scheme 190.84 151.00 Employee medical and other insurance premium expenses 411.48 196.85Staff welfare expenses 1133.82 1052.56Recoveries on account of deputation charges (204.57) (341.84)
23114.00 17466.40
NOTE [38]Sales, administration and other expenses
Particulars2019-20 2018-19
v crore v crore v crore v crore Power and fuel 157.71 120.51 Packing and forwarding 67.30 66.45Insurance 113.37 90.18Rent and hire charges 244.17 526.66Rates and taxes 392.89 209.28Travelling and conveyance 946.82 704.26Repairs to buildings 98.85 38.86General repairs and maintenance 544.72 466.49Professional fees 1176.94 920.36Directors’ fees 11.64 8.95Telephone, postage and telegrams 227.03 202.14 Advertising and publicity 206.94 169.40Stationery and printing 69.61 68.75Commission: Distributors and agents 62.30 378.76 Others 1.61 2.30
63.91 381.06Bank charges 182.24 150.55 Miscellaneous expenses 1230.03 796.70Bad debts and advances written off (net of written back) 1759.76 1830.59Less: Allowances for doubtful debts and advances written back 1885.56 1653.15
(125.80) 177.44 Receivable discounting charges -non recourse 29.38 39.36Impairment of debt instruments 350.59 –Allowances for expected credit loss 2724.43 1789.07Loss on fair valuation of loans towards financing activities (net) 93.31 77.62Recoveries from joint venture and associate companies (40.40) (46.22)Exchange (gain)/loss (net) (438.96) (235.08)Other provisions 319.99 68.42
8646.71 6791.21
Notes forming part of the Consolidated Financial Statements (contd.)

520
NOTES FORMING PART OF THE CONSOLIDATED FINANCIAL STATEMENTS ANNUAL REPORT 2019-20
NOTE [39]
Finance costs
Particulars 2019-20 2018-19
v crore v croreInterest expenses 2723.26 1752.65
Other borrowing costs 12.71 12.79
Exchange (gain)/loss [net] (attributable to finance costs) 60.69 37.11
2796.66 1802.55
39(a)Aggregationofexpensesdisclosedvide[Note36-Manufacturing,constructionandoperatingexpenses],[Note37-Employeebenefitsexpense],[Note38-Sales,administrationandotherexpenses]and[Note39-Financecosts]
R crore
Sr. No.
Nature of expenses
2019-20 2018-19
Note 36: Manufacturing,
construction and operating
expenses
Note 37: Employee
benefits expense
Note 38: Sales,
administration and other expenses
Note 39: Finance costs
Total Note 36: Manufacturing,
construction and operating
expenses
Note 37: Employee
benefits expense
Note 38: Sales,
administration and other expenses
Note 39: Finance costs
Total
1 Power and fuel 1922.13 – 157.71 – 2079.84 2085.09 – 120.51 – 2205.60
2 Packing and forwarding 572.93 – 67.30 – 640.23 485.06 – 66.45 – 551.51
3 Insurance 321.32 411.48 113.37 – 846.17 285.08 196.85 90.18 – 572.11
4 Rent and hire charges 2714.02 – 244.17 – 2958.19 2930.62 – 526.66 – 3457.28
5 Rates and taxes 632.18 – 392.89 – 1025.07 622.53 – 209.28 – 831.81
6 Travelling and conveyance 1113.94 – 946.82 – 2060.76 1113.65 – 704.26 – 1817.91
7 Repairs to plant and equipment 90.48 – – – 90.48 77.64 – – – 77.64
8 Repairs to buildings 22.22 – 98.85 – 121.07 23.00 – 38.86 – 61.86
9 General repairs and maintenance 640.32 – 544.72 – 1185.04 473.21 – 466.49 – 939.70
10 Engineering, professional, technical and consultancy fees 2003.15 – 1176.94 – 3180.09 2084.53 – 920.36 – 3004.89
11 Interest and other financing charges 8041.88 – – 2796.66 10838.54 7385.63 – – 1802.55 9188.18
12 Miscellaneous expenses 866.55 – 1230.03 – 2096.58 717.41 – 796.70 – 1514.11
Notes forming part of the Consolidated Financial Statements (contd.)

521
NOTE [40]
The List of subsidiaries, associates, joint ventures and joint operations included in the Consolidated Financial Statements are as under:
As at 31-3-2020 As at 31-3-2019
Sr. no. Name of subsidiaries
Principal place of business
Proportion of effective ownership
interest (%)
Proportion of voting power
held (%)
Proportion of effective ownership
interest (%)
Proportion of voting power
held (%)
Indian subsidiaries1 Hi-Tech Rock Products and Aggregates Limited India 100.00 100.00 100.00 100.00 2 L&T Geostructure LLP India 100.00 100.00 100.00 100.00 3 L&T Geo – L&T JV for Maharatangarh project India 100.00 100.00 100.00 100.00 4 L&T Geo – L&T UJV CMRL CS India 100.00 100.00 100.00 100.00 5 L&T Infrastructure Engineering Limited India 100.00 100.00 100.00 100.00 6 L&T Cassidian Limited # India 100.00 100.00 100.00 100.00 7 L&T Hydrocarbon Engineering Limited India 100.00 100.00 100.00 100.00 8 L&T Gulf Private Limited ## India 100.00 100.00 – – 9 Larsen & Toubro Infotech Limited India 74.53 74.53 74.80 74.80 10 Syncordis Software Services India Private Limited India 74.53 74.53 74.80 74.80 11 Ruletronics Systems Private Limited India 74.53 74.53 74.80 74.80 12 Lymbyc Solutions Private Limited % India 74.53 74.53 – – 13 Powerup Cloud Technologies Private Limited @ India 74.53 74.53 – – 14 L&T Technology Services Limited India 74.62 74.62 78.88 78.88 15 L&T Thales Technology Services Private Limited India 55.22 55.22 58.37 58.37 16 Graphene Semiconductor Services Private Limited India 74.62 74.62 78.88 78.88 17 Seastar Labs Private Limited India 74.62 74.62 78.88 78.88 18 Esencia Technologies India Private Limited India 74.62 74.62 78.88 78.88 19 Mindtree Limited @@ India 61.08 61.08 – – 20 L&T Capital Markets Limited India 63.72 63.72 63.91 63.91 21 L&T Finance Holdings Limited India 63.72 63.72 63.91 63.91 22 L&T Housing Finance Limited India 63.72 63.72 63.91 63.91 23 L&T Infra Debt Fund Limited India 63.72 63.72 63.91 63.91 24 L&T Infra Investment Partners Advisory Private Limited India 63.72 63.72 63.91 63.91 25 L&T Infra Investment Partners Trustee Private Limited India 63.72 63.72 63.91 63.91 26 L&T Infrastructure Finance Company Limited India 63.72 63.72 63.91 63.91 27 L&T Investment Management Limited India 63.72 63.72 63.91 63.91 28 L&T Mutual Fund Trustee Limited India 63.72 63.72 63.91 63.91 29 L&T Financial Consultants Limited India 63.72 63.72 63.91 63.91 30 Mudit Cement Private Limited India 63.72 63.72 63.91 63.91 31 L&T Finance Limited India 63.72 63.72 63.91 63.91 32 L&T Infra Investment Partners India 34.99 34.99 35.11 35.11 33 L&T Metro Rail (Hyderabad) Limited India 100.00 100.00 100.00 100.00 34 Sahibganj Ganges Bridge-Company Private Limited # India 100.00 100.00 100.00 100.00 35 L&T Arunachal Hydropower Limited India 100.00 100.00 100.00 100.00 36 L&T Himachal Hydropower Limited India 100.00 100.00 100.00 100.00 37 L&T Power Development Limited India 100.00 100.00 100.00 100.00 38 L&T Uttaranchal Hydropower Limited India 100.00 100.00 100.00 100.00 39 Nabha Power Limited India 100.00 100.00 100.00 100.00 40 Chennai Vision Developers Private Limited India 100.00 100.00 100.00 100.00 41 L&T Asian Realty Project LLP India 100.00 100.00 100.00 100.00 42 L&T Parel Project LLP India 100.00 100.00 100.00 100.00 43 L&T Realty Limited * India NA NA NA NA44 L&T Westend Project LLP India 100.00 100.00 100.00 100.00 45 LTR SSM Private Limited # India 99.00 99.00 99.00 99.00 46 L&T Seawoods Limited India 100.00 100.00 100.00 100.00 47 L&T Vision Ventures Limited India 68.00 68.00 68.00 68.00 48 L&T Electricals and Automation Limited India 100.00 100.00 100.00 100.00 49 L&T Construction Equipment Limited India 100.00 100.00 100.00 100.00 50 L&T Construction Machinery Limited India 100.00 100.00 100.00 100.00
Notes forming part of the Consolidated Financial Statements (contd.)

522
NOTES FORMING PART OF THE CONSOLIDATED FINANCIAL STATEMENTS ANNUAL REPORT 2019-20
As at 31-3-2020 As at 31-3-2019
Sr. no. Name of subsidiaries
Principal place of business
Proportion of effective ownership
interest (%)
Proportion of voting power
held (%)
Proportion of effective ownership
interest (%)
Proportion of voting power
held (%)
Indian subsidiaries51 L&T Valves Limited India 100.00 100.00 100.00 100.00 52 L&T Shipbuilding Limited ** India NA NA 97.00 97.00 53 Bhilai Power Supply Company Limited India 99.90 99.90 99.90 99.90 54 L&T Power Limited India 99.99 99.99 99.99 99.99 55 Kesun Iron and Steel Company Private Limited India 95.00 95.00 95.00 95.00 56 L&T Aviation Services Private Limited India 100.00 100.00 100.00 100.00 57 L&T Capital Company Limited India 100.00 100.00 100.00 100.00 58 L&T Infra Contractors Private Limited India 100.00 100.00 100.00 100.00
# The company is in process of being struck off from the register of companies## The company is reclassified as subsidiary w.e.f. November 20, 2019 due to purchase of additional stake% The Group has acquired stake on August 29, 2019@ The Group has acquired stake on October 25, 2019@@ The Group has acquired stake on July 2, 2019* The company is merged with L&T Construction Equipment Limited w.e.f. April 1, 2018** The company is merged with Larsen & Toubro Limited w.e.f. April 1, 2019
As at 31-3-2020 As at 31-3-2019
Sr. no. Name of subsidiaries
Principal place of business
Proportion of effective ownership
interest (%)
Proportion of voting power
held (%)
Proportion of effective ownership
interest (%)
Proportion of voting power
held (%)
Foreign subsidiaries1 Larsen & Toubro (Oman) LLC Sultanate of
Oman 65.00 65.00 65.00 65.00 2 Larsen & Toubro Qatar LLC # Qatar 49.00 100.00 49.00 100.00 3 Larsen & Toubro Saudi Arabia LLC Kingdom of
Saudi Arabia 100.00 100.00 100.00 100.00 4 Larsen & Toubro T&D SA (Proprietary) Limited South Africa 72.50 72.50 72.50 72.50 5 Larsen & Toubro Heavy Engineering LLC Sultanate of
Oman 70.00 100.00 70.00 100.00 6 Larsen & Toubro Hydrocarbon International Limited
LLC ##Kingdom of Saudi Arabia 100.00 100.00 100.00 100.00
7 L&T Modular Fabrication Yard LLC Sultanate of Oman 70.00 100.00 70.00 100.00
8 L&T Overseas Projects Nigeria Limited Nigeria 100.00 100.00 100.00 100.00 9 Larsen Toubro Arabia LLC Kingdom of
Saudi Arabia 75.00 100.00 75.00 100.00 10 L&T Hydrocarbon Saudi Company Kingdom of
Saudi Arabia 100.00 100.00 100.00 100.00 11 Larsen & Toubro Kuwait Construction General
Contracting Company WLL Kuwait 49.00 100.00 49.00 100.00 12 PT Larsen & Toubro Hydrocarbon Engineering
Indonesia Indonesia 95.00 95.00 95.00 95.00 13 Larsen & Toubro Electromech LLC Sultanate of
Oman 70.00 100.00 70.00 100.00 14 L&T Hydrocarbon International FZE UAE 100.00 100.00 100.00 100.00 15 L&T Information Technology Services (Shanghai) Co.,
Ltd. China 74.53 74.53 74.80 74.80 16 L&T Infotech Financial Services Technologies Inc. Canada 74.53 74.53 74.80 74.80 17 Larsen & Toubro Infotech Canada Limited Canada 74.53 74.53 74.80 74.80 18 Larsen & Toubro Infotech LLC USA 74.53 74.53 74.80 74.80 19 Larsen & Toubro Infotech South Africa (Proprietary)
Limited South Africa 55.83 55.83 56.02 56.02
Notes forming part of the Consolidated Financial Statements (contd.)NOTE [40] (contd.)
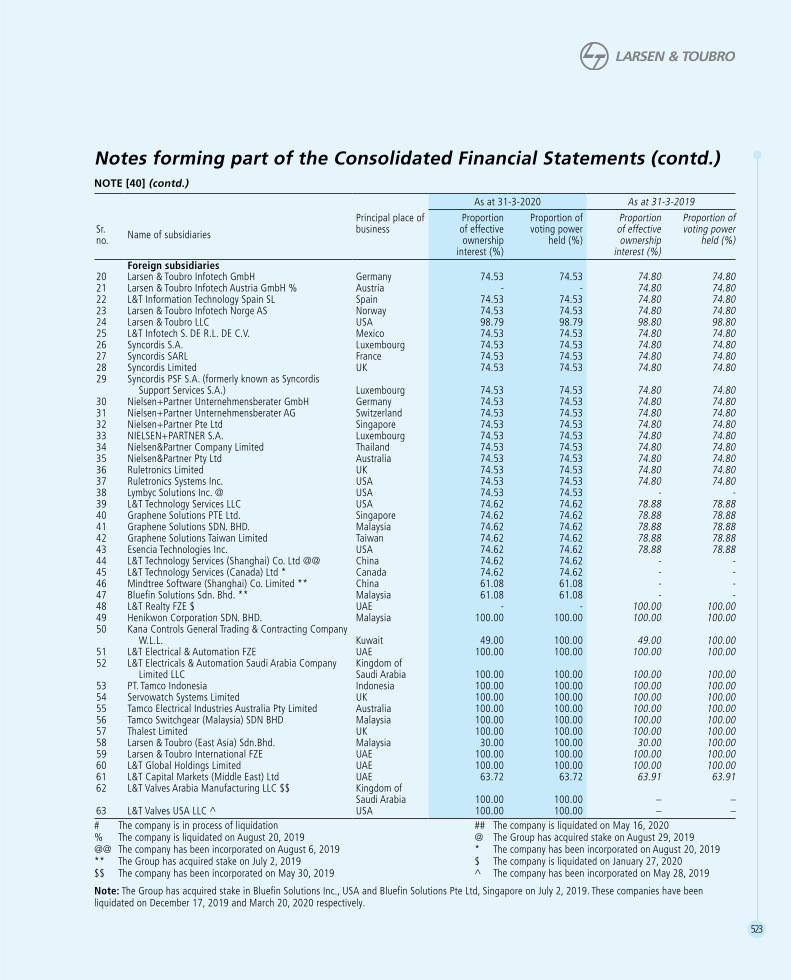
523
As at 31-3-2020 As at 31-3-2019
Sr. no. Name of subsidiaries
Principal place of business
Proportion of effective ownership
interest (%)
Proportion of voting power
held (%)
Proportion of effective ownership
interest (%)
Proportion of voting power
held (%)
Foreign subsidiaries20 Larsen & Toubro Infotech GmbH Germany 74.53 74.53 74.80 74.80 21 Larsen & Toubro Infotech Austria GmbH % Austria - - 74.80 74.80 22 L&T Information Technology Spain SL Spain 74.53 74.53 74.80 74.80 23 Larsen & Toubro Infotech Norge AS Norway 74.53 74.53 74.80 74.80 24 Larsen & Toubro LLC USA 98.79 98.79 98.80 98.80 25 L&T Infotech S. DE R.L. DE C.V. Mexico 74.53 74.53 74.80 74.80 26 Syncordis S.A. Luxembourg 74.53 74.53 74.80 74.80 27 Syncordis SARL France 74.53 74.53 74.80 74.80 28 Syncordis Limited UK 74.53 74.53 74.80 74.80 29 Syncordis PSF S.A. (formerly known as Syncordis
Support Services S.A.) Luxembourg 74.53 74.53 74.80 74.80 30 Nielsen+Partner Unternehmensberater GmbH Germany 74.53 74.53 74.80 74.80 31 Nielsen+Partner Unternehmensberater AG Switzerland 74.53 74.53 74.80 74.80 32 Nielsen+Partner Pte Ltd Singapore 74.53 74.53 74.80 74.80 33 NIELSEN+PARTNER S.A. Luxembourg 74.53 74.53 74.80 74.80 34 Nielsen&Partner Company Limited Thailand 74.53 74.53 74.80 74.80 35 Nielsen&Partner Pty Ltd Australia 74.53 74.53 74.80 74.80 36 Ruletronics Limited UK 74.53 74.53 74.80 74.80 37 Ruletronics Systems Inc. USA 74.53 74.53 74.80 74.80 38 Lymbyc Solutions Inc. @ USA 74.53 74.53 - - 39 L&T Technology Services LLC USA 74.62 74.62 78.88 78.88 40 Graphene Solutions PTE Ltd. Singapore 74.62 74.62 78.88 78.88 41 Graphene Solutions SDN. BHD. Malaysia 74.62 74.62 78.88 78.88 42 Graphene Solutions Taiwan Limited Taiwan 74.62 74.62 78.88 78.88 43 Esencia Technologies Inc. USA 74.62 74.62 78.88 78.88 44 L&T Technology Services (Shanghai) Co. Ltd @@ China 74.62 74.62 - - 45 L&T Technology Services (Canada) Ltd * Canada 74.62 74.62 - - 46 Mindtree Software (Shanghai) Co. Limited ** China 61.08 61.08 - - 47 Bluefin Solutions Sdn. Bhd. ** Malaysia 61.08 61.08 - - 48 L&T Realty FZE $ UAE - - 100.00 100.00 49 Henikwon Corporation SDN. BHD. Malaysia 100.00 100.00 100.00 100.00 50 Kana Controls General Trading & Contracting Company
W.L.L. Kuwait 49.00 100.00 49.00 100.00 51 L&T Electrical & Automation FZE UAE 100.00 100.00 100.00 100.00 52 L&T Electricals & Automation Saudi Arabia Company
Limited LLCKingdom of Saudi Arabia 100.00 100.00 100.00 100.00
53 PT. Tamco Indonesia Indonesia 100.00 100.00 100.00 100.00 54 Servowatch Systems Limited UK 100.00 100.00 100.00 100.00 55 Tamco Electrical Industries Australia Pty Limited Australia 100.00 100.00 100.00 100.00 56 Tamco Switchgear (Malaysia) SDN BHD Malaysia 100.00 100.00 100.00 100.00 57 Thalest Limited UK 100.00 100.00 100.00 100.00 58 Larsen & Toubro (East Asia) Sdn.Bhd. Malaysia 30.00 100.00 30.00 100.00 59 Larsen & Toubro International FZE UAE 100.00 100.00 100.00 100.00 60 L&T Global Holdings Limited UAE 100.00 100.00 100.00 100.00 61 L&T Capital Markets (Middle East) Ltd UAE 63.72 63.72 63.91 63.91 62 L&T Valves Arabia Manufacturing LLC $$ Kingdom of
Saudi Arabia 100.00 100.00 – –63 L&T Valves USA LLC ^ USA 100.00 100.00 – –# The company is in process of liquidation ## The company is liquidated on May 16, 2020% The company is liquidated on August 20, 2019 @ The Group has acquired stake on August 29, 2019@@ The company has been incorporated on August 6, 2019 * The company has been incorporated on August 20, 2019** The Group has acquired stake on July 2, 2019 $ The company is liquidated on January 27, 2020$$ The company has been incorporated on May 30, 2019 ^ The company has been incorporated on May 28, 2019
Note: The Group has acquired stake in Bluefin Solutions Inc., USA and Bluefin Solutions Pte Ltd, Singapore on July 2, 2019. These companies have been liquidated on December 17, 2019 and March 20, 2020 respectively.
Notes forming part of the Consolidated Financial Statements (contd.)NOTE [40] (contd.)
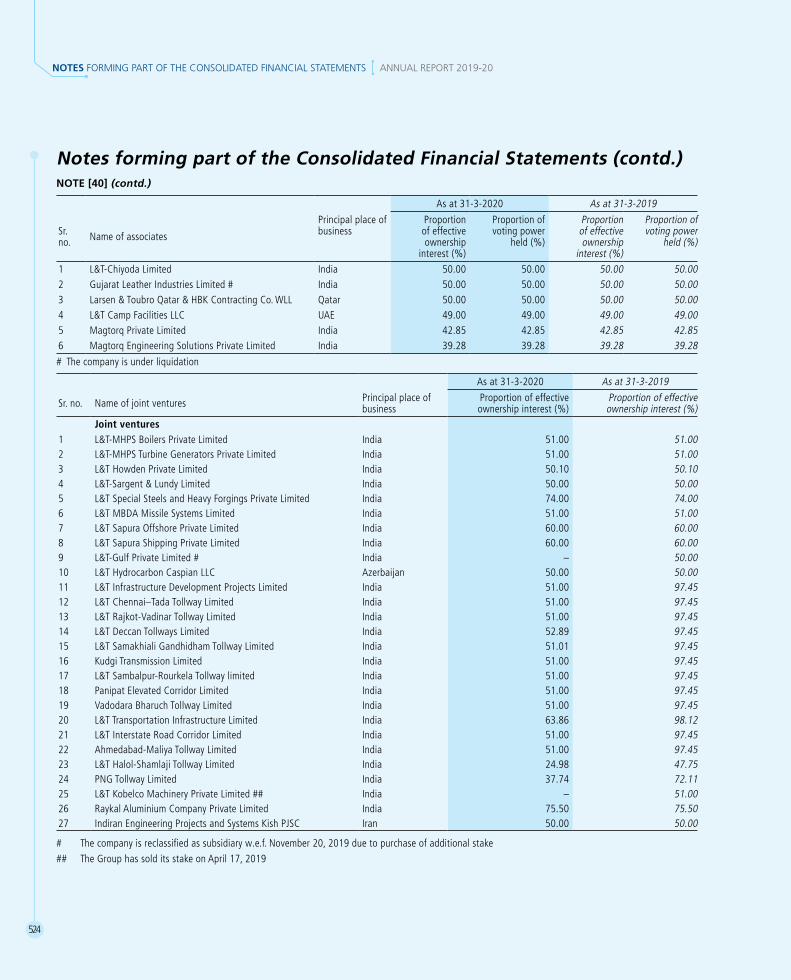
524
NOTES FORMING PART OF THE CONSOLIDATED FINANCIAL STATEMENTS ANNUAL REPORT 2019-20
As at 31-3-2020 As at 31-3-2019
Sr. no. Name of associates
Principal place of business
Proportion of effective ownership
interest (%)
Proportion of voting power
held (%)
Proportion of effective ownership
interest (%)
Proportion of voting power
held (%)
1 L&T-Chiyoda Limited India 50.00 50.00 50.00 50.00 2 Gujarat Leather Industries Limited # India 50.00 50.00 50.00 50.00 3 Larsen & Toubro Qatar & HBK Contracting Co. WLL Qatar 50.00 50.00 50.00 50.00 4 L&T Camp Facilities LLC UAE 49.00 49.00 49.00 49.00 5 Magtorq Private Limited India 42.85 42.85 42.85 42.85 6 Magtorq Engineering Solutions Private Limited India 39.28 39.28 39.28 39.28
# The company is under liquidation
As at 31-3-2020 As at 31-3-2019
Sr. no. Name of joint ventures Principal place of business
Proportion of effective ownership interest (%)
Proportion of effective ownership interest (%)
Joint ventures1 L&T-MHPS Boilers Private Limited India 51.00 51.00 2 L&T-MHPS Turbine Generators Private Limited India 51.00 51.00 3 L&T Howden Private Limited India 50.10 50.10 4 L&T-Sargent & Lundy Limited India 50.00 50.00 5 L&T Special Steels and Heavy Forgings Private Limited India 74.00 74.00 6 L&T MBDA Missile Systems Limited India 51.00 51.00 7 L&T Sapura Offshore Private Limited India 60.00 60.00 8 L&T Sapura Shipping Private Limited India 60.00 60.00 9 L&T-Gulf Private Limited # India – 50.00 10 L&T Hydrocarbon Caspian LLC Azerbaijan 50.00 50.00 11 L&T Infrastructure Development Projects Limited India 51.00 97.45 12 L&T Chennai–Tada Tollway Limited India 51.00 97.45 13 L&T Rajkot-Vadinar Tollway Limited India 51.00 97.45 14 L&T Deccan Tollways Limited India 52.89 97.45 15 L&T Samakhiali Gandhidham Tollway Limited India 51.01 97.45 16 Kudgi Transmission Limited India 51.00 97.45 17 L&T Sambalpur-Rourkela Tollway limited India 51.00 97.45 18 Panipat Elevated Corridor Limited India 51.00 97.45 19 Vadodara Bharuch Tollway Limited India 51.00 97.45 20 L&T Transportation Infrastructure Limited India 63.86 98.12 21 L&T Interstate Road Corridor Limited India 51.00 97.45 22 Ahmedabad-Maliya Tollway Limited India 51.00 97.45 23 L&T Halol-Shamlaji Tollway Limited India 24.98 47.75 24 PNG Tollway Limited India 37.74 72.11 25 L&T Kobelco Machinery Private Limited ## India – 51.00 26 Raykal Aluminium Company Private Limited India 75.50 75.50 27 Indiran Engineering Projects and Systems Kish PJSC Iran 50.00 50.00
# The company is reclassified as subsidiary w.e.f. November 20, 2019 due to purchase of additional stake
## The Group has sold its stake on April 17, 2019
Notes forming part of the Consolidated Financial Statements (contd.)NOTE [40] (contd.)

525
As at 31-3-2020 As at 31-3-2019
Sr. no.
Name of joint operations (with specific ownership interest in the arrangement)
Principal place of business
Proportion of effective ownership interest (%)
Proportion of effective ownership interest (%)
1 Desbuild L&T Joint Venture India 49.00 49.00 2 Larsen and Toubro Limited-Shapoorji Pallonji & Co. Ltd. Joint
Venture India 50.00 50.00 3 Al Balagh Trading & Contracting Co W.L.L- L&T Joint Venture Qatar 80.00 80.00 4 L&T-AM Tapovan Joint Venture India 65.00 65.00 5 HCC-L&T Purulia Joint Venture India 43.00 43.00 6 International Metro Civil Contractors Joint Venture India 26.00 26.00 7 Metro Tunneling Group India 26.00 26.00 8 L&T-Hochtief Seabird Joint Venture India 90.00 90.00 9 Metro Tunneling Chennai-L&T Shanghai Urban Construction
(Group) Corporation Joint Venture India 75.00 75.00 10 Metro Tunneling Delhi- L&T Shanghai Urban Construction
(Group) Corporation Joint Venture India 60.00 60.00 11 L&T-Shanghai Urban Construction (Group) Corporation Joint
Venture CC27 Delhi India 68.00 68.00 12 Aktor-Larsen & Toubro-Yapi Merkezi-STFA-Al Jaber Engineering
Joint Venture Qatar 22.00 22.00 13 Civil Works Joint Venture Kingdom of Saudi
Arabia 29.00 29.00 14 L&T-Shanghai Urban Construction (Group) Corporation Joint
Venture India 51.00 51.00 15 DAEWOO and L&T Joint Venture India 50.00 50.00 16 L&T-STEC JV MUMBAI India 65.00 65.00 17 L&T-ISDPL (JV) India 100.00 100.00 18 L&T-IHI Consortium India 100.00 100.00 19 L&T-Eastern Joint Venture UAE 65.00 65.00 20 Larsen and Toubro Limited-Scomi Engineering BHD Consortium-
Residual Joint Works Joint Venture India 60.00 60.00 21 Larsen and Toubro Limited-Scomi Engineering BHD Consortium-
O&M Joint Venture India 50.00 50.00 22 L&T- Inabensa Consortium India 100.00 100.00 23 L&T-Delma Mafraq Joint Venture UAE 100.00 100.00 24 L&T-AL-Sraiya LRDP 6 Joint Venture Qatar 75.00 75.00 25 Larsen & Toubro Limited & NCC Limited Joint Venture India 55.00 55.00 26 Besix-Larsen & Toubro Joint Venture UAE 50.00 50.00 27 Larsen & Toubro Ltd - Passavant Energy & Environment JV India 50.00 50.00 28 LNT-Shriram EPC Tanzania UJV Tanzania 90.00 90.00 29 LTH Milcom Private Limited India 56.67 56.67 30 L&T-Tecton JV India 60.00 60.00 31 L&T-Powerchina JV # UAE 55.00 –32 Bauer- L&T Geo Joint Venture India 50.00 50.00 33 EMAS Saudi Arabia Ltd Kingdom of Saudi
Arabia 50.00 50.00 34 L&T Infrastructure Engineering - LEA Associates South Asia JV @ India 61.00 –35 L&T Infra Engineering JV United Consultancy @@ Bhutan 75.81 –
# The joint arrangement was entered into on November 27, 2019@ The joint arrangement was entered into on February 12, 2020@@ The joint arrangement was entered into on December 7, 2019
Notes forming part of the Consolidated Financial Statements (contd.)NOTE [40] (contd.)

526
NOTES FORMING PART OF THE CONSOLIDATED FINANCIAL STATEMENTS ANNUAL REPORT 2019-20
Sr. no. Name of joint operations (with specific proportion of activity carried out through the arrangement) Principal place of business
1 L&T Sojitz Consortium India
2 L&T-KBL (UJV) Hyderabad India
3 L&T-KBL-MAYTAS UJV India
4 Mallanna Sagar Reservoir LnT-Prasad-RK Infra JV India
5 Larsen & Toubro Limited Waterleau Consortium Qatar
6 L&T-BRAPL JV (package II) India
7 L&T-BRAPL JV (package III) India
8 IIS-L&T Consortium India
9 PES Engg P ltd-L&T Consortium India
10 L&T ISDPL - DI (JV) India
11 L&T Galfar Consortium Oman
12 Sojitz Corporation-L&T Consortium India
13 Sojitz Corporation-Gayathri Projects Ltd-L&T Consortium India
14 PESB and Larsen & Toubro Joint Venture Malaysia
15 Scomi Engineering Bhd-L&T Consortium India
16 L&T-PCIPL JV India
17 Consortium of M/s. J. Ray McDermott Sdn. Bhd. and M/s. L&T Hydrocarbon Engineering Limited India
18 Consortium of L&T Hydrocarbon Engineering Limited and EMAS AMC Pte. Ltd. Kingdom of Saudi Arabia
19 Consortium of L&T Hydrocarbon Engineering Limited and Reliance Naval and Engineering Limited India
20 Consortium of L&T Hydrocarbon Engineering Limited, GE Oil & Gas UK Ltd, McDermott International Management S. de RL, Berlian McDermott Sdn Bhd and Vetco Gray Pte Ltd India
21 Consortium of L&T Hydrocarbon Engineering Limited, Technip France and Technic India Limited India
22 L&T Parel Project LLP-Omkar Realtors & Developers Pvt. Ltd. (Crescent bay) India
23 L&T Asian Realty Project LLP-Nirmal Life Style Developers Pvt. Ltd. (Nirmal Lifestyle) India
24 L&T Infrastructure Engineering Limited-Fortress Infrastructure Advisory Services (for 4 projects) India
25 L&T Infrastructure Engineering Limited-Mahindra Consulting Engineers Ltd. India
26 L&T Infrastructure Engineering Limited-Pricewaterhouse Coopers Pvt.Ltd.(for 2 projects) India
27 L&T Infrastructure Engineering Limited-Rajendran Associates (for 2 projects) India
28 L&T Infrastructure Engineering Limited-Transtek Engineers & Services Pvt.Ltd. India
29 L&T Infrastructure Engineering Limited-Vax Consultants Pvt.Ltd.(for 5 projects) India
30 L&T Infrastructure Engineering Limited-Aakar Abhinav Consultants Pvt Ltd India
31 L&T Infrastructure Engineering Limited-Centre for Symbiosis of Technology Environment & Management (STEM) India
32 L&T Infrastructure Engineering Limited-CRISIL Risk & Infrastructure Solutions Ltd India
33 L&T Infrastructure Engineering Limited-Rites Ltd and KPMG India
NOTE [41]
The components of other equity shown in the Consolidated Balance Sheet include the Group’s share in the respective reserves of subsidiaries. Reserve attributable to non-controlling interest is reported separately in the Consolidated Balance Sheet. Retained earnings comprise Group’s share in general reserve and balance of Profit and Loss.
Notes forming part of the Consolidated Financial Statements (contd.)NOTE [40] (contd.)

527
NOTE [42]
Disclosure pursuant to Ind AS 112 “Disclosure of Interest in other entities”: Subsidiaries
(a) Change in the Group’s ownership interest in a subsidiary (without ceding control)
(i) On account of divestment of part stake
Duringtheyear2019-20,theGrouphassold3.89%stakeinL&TTechnologyServicesLimited.TheproceedsondisposalofR 668.95crorewerereceivedincash.AnamountofR 118.37crore(beingtheproportionateshareofthecarryingamountof the net assets of L&T Technology Services Limited) has been transferred to non-controlling interests. The difference of R 550.58crorebetweentheconsiderationreceivedandtheincreaseinthenon-controllinginterestshasbeencreditedtoretained earnings.
Duringtheyear2018-19,theGrouphassold7.44%stakeinLarsen&ToubroInfotechLimitedand8.43%stakeinL&TTechnology Services Limited. The proceeds on disposal of R 3378.02crorewerereceivedincash.AnamountofR 417.19 crore (being the proportionate share of the carrying amount of the net assets of Larsen & Toubro Infotech Limited and L&T Technology Services Limited) has been transferred to non-controlling interests. The difference of R 2960.83crorebetweentheconsideration received and the increase in the non-controlling interests has been credited to retained earnings.
(ii) On account of dilution
During the year 2019-20, the Group’s continuing interest has reduced on account of dilution due to exercise of ESOPs by 0.19%,0.26%,0.38%and0.04%inL&TFinanceHoldingsLimited,inLarsen&ToubroInfotechLimited,inL&TTechnologyServices Limited and Mindtree Limited respectively. The proceeds on dilution of R 39.98crorewerereceivedincash.Anamount of R 89.68crore(beingtheproportionateshareofthecarryingamountofthenetassetsofL&TFinanceHoldingsLimited, Larsen & Toubro Infotech Limited, L&T Technology Services Limited and Mindtree Limited) has been transferred to non-controlling interests. The difference of R 49.70 crore between the increase in the non-controlling interests and the consideration received has been debited to retained earnings.
Duringtheyear2018-19,theGroup’scontinuinginteresthasreducedonaccountofdilutionduetoexerciseofESOPsby0.10%,0.72%and1.33%inL&TFinanceHoldingsLimited,inLarsen&ToubroInfotechLimitedandinL&TTechnologyServices Limited respectively. The proceeds on dilution of R 22.13 crore were received in cash. An amount of R 132.23 crore (being the proportionate share of the carrying amount of the net assets of L&T Finance Holdings Limited, Larsen & Toubro Infotech Limited and L&T Technology Services Limited) has been transferred to non-controlling interests. The difference of R 110.10 crore between the increase in the non-controlling interests and the consideration received has been debited to retained earnings.
(b) The effect of divestment with ceding of control in subsidiary during the period is as under: v crore
Name of subsidiary
Effect on consolidated profit/(loss) after non-controlling
interest Line item in Statement of Profit & Loss in which the gain/(loss) is recognised
2019-20 2018-19Marine Infrastructure Developer Private Limited – 415.61 Other operational incomeTotal – 415.61
Notes forming part of the Consolidated Financial Statements (contd.)

528
NOTES FORMING PART OF THE CONSOLIDATED FINANCIAL STATEMENTS ANNUAL REPORT 2019-20
Notes forming part of the Consolidated Financial Statements (contd.)NOTE [42] (contd.)(c) Disclosure of subsidiaries having material non-controlling interest: (i) Summarised Statement of Profit and Loss
v crore
ParticularsL&T Finance Limited L&T Finance Holdings Limited2019-20 2018-19 2019-20 2018-19
Revenue 8184.78 6890.59 475.28 481.73Profit/(loss) for the year 366.28 845.93 266.81 267.79Other comprehensive income (149.36) (1.38) (0.11) (0.32) Total comprehensive income 216.92 844.55 266.70 267.47Effective%ofnon-controllinginterest 36.28% 36.09% 36.28% 36.09%Profit/(loss) allocated to non-controlling interest (including
consolidation adjustments) 370.93 539.68 (58.38) (28.76)Dividend (including dividend distribution tax) to non-
controlling interest – – 137.30 71.87
v crore
ParticularsLarsen & Toubro Infotech
LimitedL&T Technology Services
Limited2019-20 2018-19 2019-20 2018-19
Revenue 10287.59 9016.17 5225.65 4781.37Profit/(loss) for the year 1552.36 1475.06 790.03 700.10 Other comprehensive income (438.10) 25.87 (260.32) (2.13) Total comprehensive income 1114.26 1500.93 529.71 697.97Effective%ofnon-controllinginterest 25.46% 25.20% 25.38% 21.12%Profit/(loss) allocated to non-controlling interest (including
consolidation adjustments) 367.53 314.13 189.98 118.82Dividend (including dividend distribution tax) to non-
controlling interest 143.38 115.89 66.10 37.66
v crore
ParticularsMindtree Limited (consolidated)#
2019-20Revenue 5917.18Profit/(loss) for the year 538.17Other comprehensive income (438.10)Total comprehensive income 100.07 Effective%ofnon-controllinginterest 38.92%Profit/(loss) allocated to non-controlling interest (including consolidation adjustments) 144.33 Dividend (including dividend distribution tax) to non-controlling interest 211.01
# from the date of acquisition
(ii) Summarised Balance Sheetv crore
ParticularsL&T Finance Limited L&T Finance Holdings Limited
As at 31-3-2020
As at 31-3-2019
As at 31-3-2020
As at 31-3-2019
Current assets (a) 29825.41 32026.49 1153.20 866.85Current liabilities (b) 20300.36 20353.11 2099.72 1370.42 Net current assets (c)=(a) - (b) 9525.05 11673.38 (946.52) (503.57) Non-current assets (d) 23163.98 23810.66 10101.69 9182.03Non-current liabilities (e) 23795.26 26583.43 1393.23 848.11Net non-current assets (f)=(d) - (e) (631.28) (2772.77) 8708.46 8333.92Net assets (g)=(c) + (f) 8893.77 8900.61 7761.94 7830.35Accumulated non-controlling interest 1734.51 1492.01 2765.91 2766.57

529
Notes forming part of the Consolidated Financial Statements (contd.)
v crore
Particulars
Larsen & Toubro Infotech Limited
L&T Technology Services Limited
As at 31-3-2020
As at 31-3-2019
As at 31-3-2020
As at 31-3-2019
Current assets (a) 5985.20 4838.98 2779.82 2271.41 Current liabilities (b) 2084.65 1482.92 980.61 783.45Net current assets (c)=(a) - (b) 3900.55 3356.06 1799.21 1487.96Non-current assets (d) 2331.61 1379.71 1301.88 953.93 Non-current liabilities (e) 1003.32 22.32 481.06 5.97 Net non-current assets (f)=(d) - (e) 1328.29 1357.39 820.82 947.96Net assets (g)=(c) + (f) 5228.84 4713.45 2620.03 2435.92 Accumulated non-controlling interest 1320.47 1177.75 672.69 507.15
v crore
ParticularsMindtree Limited
(consolidated)As at 31-3-2020
Current assets (a) 3208.74Current liabilities (b) 1323.75 Net current assets (c)=(a) - (b) 1884.99Non-current assets (d) 1901.73 Non-current liabilities (e) 676.13Net non-current assets (f)=(d) - (e) 1225.60Net assets (g)=(c) + (f) 3110.59 Accumulated non-controlling interest 1829.41
(iii) Summarised Statement of Cash Flows
v crore
ParticularsL&T Finance Limited L&T Finance Holdings Limited2019-20 2018-19 2019-20 2018-19
Cash flows from operating activities 4266.99 (7560.70) 82.24 774.99 Cash flows from investing activities 676.41 (2145.81) (1006.23) (1306.32)Cash flows from financing activities (3756.15) 10888.36 924.08 520.56Net increase/(decrease) in cash and cash equivalents 1187.25 1181.85 0.09 (10.77)
v crore
ParticularsLarsen & Toubro Infotech
LimitedL&T Technology Services
Limited2019-20 2018-19 2019-20 2018-19
Cash flows from operating activities 1643.93 1247.62 664.41 739.58Cash flows from investing activities (578.11) (682.89) (280.52) (489.03)Cash flows from financing activities (918.39) (595.07) (377.23) (202.13)Net increase/(decrease) in cash and cash equivalents 147.43 (30.34) 6.66 48.42
v crore
ParticularsMindtree Limited (consolidated)#
2019-20Cash flows from operating activities 634.00Cash flows from investing activities 153.40 Cash flows from financing activities (614.70)Net increase/(decrease) in cash and cash equivalents 172.70
# from the date of acquisition
NOTE [42] (contd.)
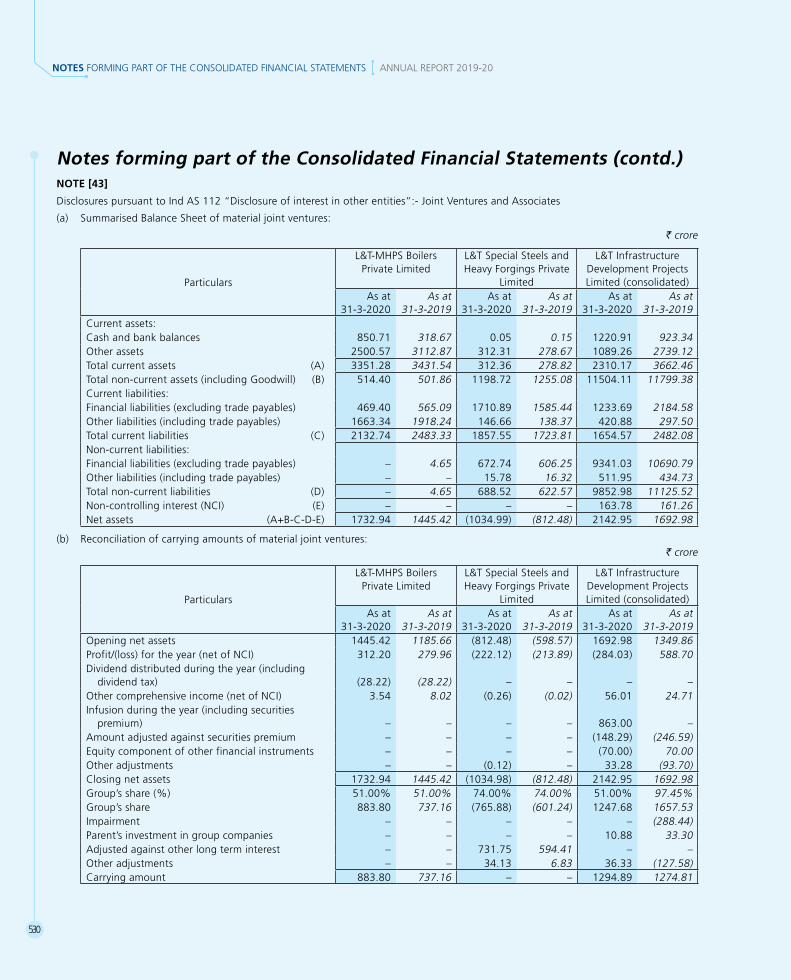
530
NOTES FORMING PART OF THE CONSOLIDATED FINANCIAL STATEMENTS ANNUAL REPORT 2019-20
Notes forming part of the Consolidated Financial Statements (contd.)NOTE [43]
Disclosures pursuant to Ind AS 112 “Disclosure of interest in other entities”:- Joint Ventures and Associates
(a) Summarised Balance Sheet of material joint ventures:
v crore
Particulars
L&T-MHPS Boilers Private Limited
L&T Special Steels and Heavy Forgings Private
Limited
L&T Infrastructure Development Projects Limited (consolidated)
As at 31-3-2020
As at 31-3-2019
As at 31-3-2020
As at 31-3-2019
As at 31-3-2020
As at 31-3-2019
Current assets:Cash and bank balances 850.71 318.67 0.05 0.15 1220.91 923.34 Other assets 2500.57 3112.87 312.31 278.67 1089.26 2739.12 Total current assets (A) 3351.28 3431.54 312.36 278.82 2310.17 3662.46Total non-current assets (including Goodwill) (B) 514.40 501.86 1198.72 1255.08 11504.11 11799.38Current liabilities:Financial liabilities (excluding trade payables) 469.40 565.09 1710.89 1585.44 1233.69 2184.58Other liabilities (including trade payables) 1663.34 1918.24 146.66 138.37 420.88 297.50 Total current liabilities (C) 2132.74 2483.33 1857.55 1723.81 1654.57 2482.08Non-current liabilities:Financial liabilities (excluding trade payables) – 4.65 672.74 606.25 9341.03 10690.79Other liabilities (including trade payables) – – 15.78 16.32 511.95 434.73 Total non-current liabilities (D) – 4.65 688.52 622.57 9852.98 11125.52 Non-controlling interest (NCI) (E) – – – – 163.78 161.26Net assets (A+B-C-D-E) 1732.94 1445.42 (1034.99) (812.48) 2142.95 1692.98
(b) Reconciliation of carrying amounts of material joint ventures:v crore
Particulars
L&T-MHPS Boilers Private Limited
L&T Special Steels and Heavy Forgings Private
Limited
L&T Infrastructure Development Projects Limited (consolidated)
As at 31-3-2020
As at 31-3-2019
As at 31-3-2020
As at 31-3-2019
As at 31-3-2020
As at 31-3-2019
Opening net assets 1445.42 1185.66 (812.48) (598.57) 1692.98 1349.86Profit/(loss) for the year (net of NCI) 312.20 279.96 (222.12) (213.89) (284.03) 588.70Dividend distributed during the year (including
dividend tax) (28.22) (28.22) – – – – Other comprehensive income (net of NCI) 3.54 8.02 (0.26) (0.02) 56.01 24.71 Infusion during the year (including securities
premium) – – – – 863.00 – Amount adjusted against securities premium – – – – (148.29) (246.59)Equity component of other financial instruments – – – – (70.00) 70.00 Other adjustments – – (0.12) – 33.28 (93.70)Closing net assets 1732.94 1445.42 (1034.98) (812.48) 2142.95 1692.98Group’sshare(%) 51.00% 51.00% 74.00% 74.00% 51.00% 97.45%Group’s share 883.80 737.16 (765.88) (601.24) 1247.68 1657.53Impairment – – – – – (288.44)Parent’s investment in group companies – – – – 10.88 33.30Adjusted against other long term interest – – 731.75 594.41 – – Other adjustments – – 34.13 6.83 36.33 (127.58)Carrying amount 883.80 737.16 – – 1294.89 1274.81

531
(c) Summarised Statement of Profit and Loss of material joint ventures: v crore
Particulars
L&T-MHPS Boilers Private Limited
L&T Special Steels and Heavy Forgings Private
Limited
L&T Infrastructure Development Projects Limited (consolidated)
2019-20 2018-19 2019-20 2018-19 2019-20 2018-19
Revenue 2035.62 2735.70 222.78 211.63 1759.15 1666.57
Interest Income 36.22 20.26 0.20 0.12 137.25 29.71
Depreciation and amortisation (65.00) (62.32) (48.59) (47.65) (487.30) (452.16)
Finance cost (5.19) (17.72) (199.45) (181.59) (1063.40) (1070.17)
Tax expense (117.60) (137.93) – – (118.47) (36.97)
Profit/(loss) from continuing operations (net of NCI) 312.20 279.96 (222.12) (213.89) (284.03) 607.52
Profit from discontinued operations (net of NCI) – – – – – (18.82)
Profit/(loss) for the year (net of NCI) 312.20 279.96 (222.12) (213.89) (284.03) 588.70
Other comprehensive income (net of NCI) 3.54 8.02 (0.26) (0.02) 56.01 24.71
Total comprehensive income (net of NCI) 315.74 287.98 (222.38) (213.91) (228.02) 613.41
(d) Financial Information in respect of individually not material joint ventures/associates
v crore
ParticularsAs at
31-3-2020As at
31-3-2019Aggregate carrying amount of investment in individually not material joint ventures/associates 672.32 630.32Aggregate amounts of the Group’s share of:Profit/(loss) for the year 55.20 66.11Other comprehensive income for the year 24.93 6.02Total comprehensive income for the year 80.13 72.13
(e) Carrying amount of investments in joint ventures/associates
v crore
ParticularsAs at
31-3-2020As at
31-3-2019Non-material associates 115.02 88.52Non-material joint ventures 557.30 541.80Sub-total 672.32 630.32Material joint ventures 2178.69 2011.97 Total 2851.01 2642.29
(f) Share in profit /(loss) of joint ventures/associates (net)
v croreParticulars 2019-20 2018-19
Non-material associates 25.88 17.72 Non-material joint ventures 29.32 48.39Sub-total 55.20 66.11Material joint ventures 16.76 (87.11)Total 71.96 (21.00)
Notes forming part of the Consolidated Financial Statements (contd.)NOTE [43] (contd.)
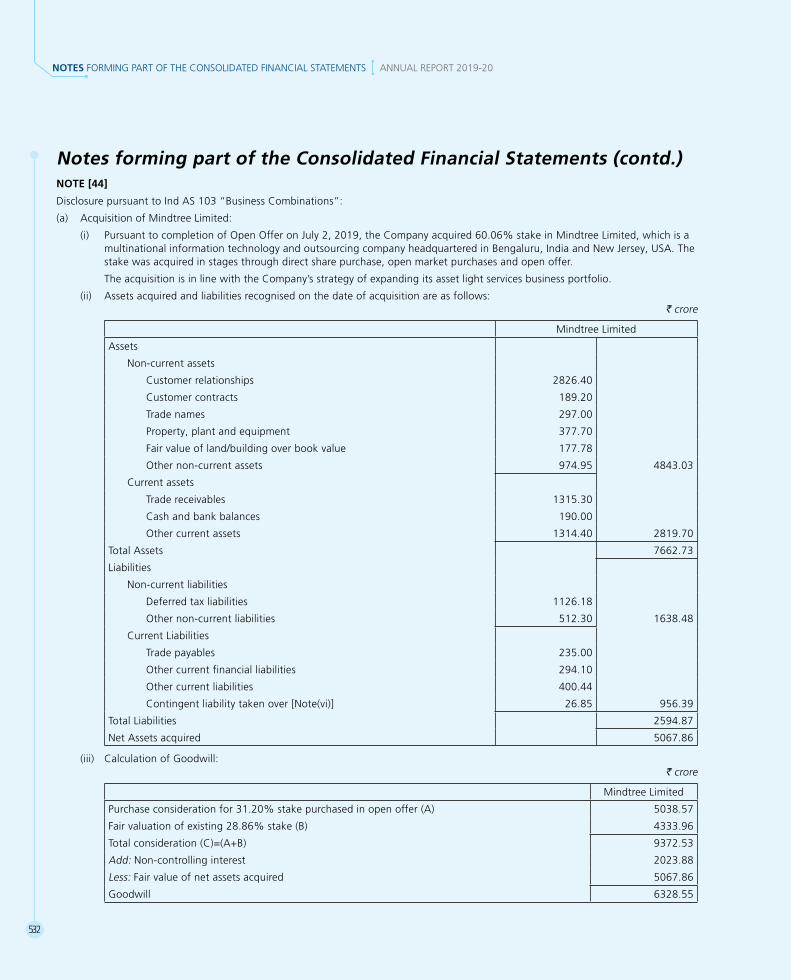
532
NOTES FORMING PART OF THE CONSOLIDATED FINANCIAL STATEMENTS ANNUAL REPORT 2019-20
Notes forming part of the Consolidated Financial Statements (contd.)NOTE [44]
Disclosure pursuant to Ind AS 103 “Business Combinations”:
(a) Acquisition of Mindtree Limited:
(i) PursuanttocompletionofOpenOfferonJuly2,2019,theCompanyacquired60.06%stakeinMindtreeLimited,whichisamultinational information technology and outsourcing company headquartered in Bengaluru, India and New Jersey, USA. The stake was acquired in stages through direct share purchase, open market purchases and open offer.
The acquisition is in line with the Company’s strategy of expanding its asset light services business portfolio.
(ii) Assets acquired and liabilities recognised on the date of acquisition are as follows:v crore
Mindtree Limited
Assets
Non-current assets
Customer relationships 2826.40
Customer contracts 189.20
Trade names 297.00
Property, plant and equipment 377.70
Fair value of land/building over book value 177.78
Other non-current assets 974.95 4843.03
Current assets
Trade receivables 1315.30
Cash and bank balances 190.00
Other current assets 1314.40 2819.70
Total Assets 7662.73
Liabilities
Non-current liabilities
Deferred tax liabilities 1126.18
Other non-current liabilities 512.30 1638.48
Current Liabilities
Trade payables 235.00
Other current financial liabilities 294.10
Other current liabilities 400.44
Contingent liability taken over [Note(vi)] 26.85 956.39
Total Liabilities 2594.87
Net Assets acquired 5067.86
(iii) Calculation of Goodwill:v crore
Mindtree Limited
Purchaseconsiderationfor31.20%stakepurchasedinopenoffer(A) 5038.57
Fairvaluationofexisting28.86%stake(B) 4333.96
Total consideration (C)=(A+B) 9372.53
Add: Non-controlling interest 2023.88
Less: Fair value of net assets acquired 5067.86
Goodwill 6328.55
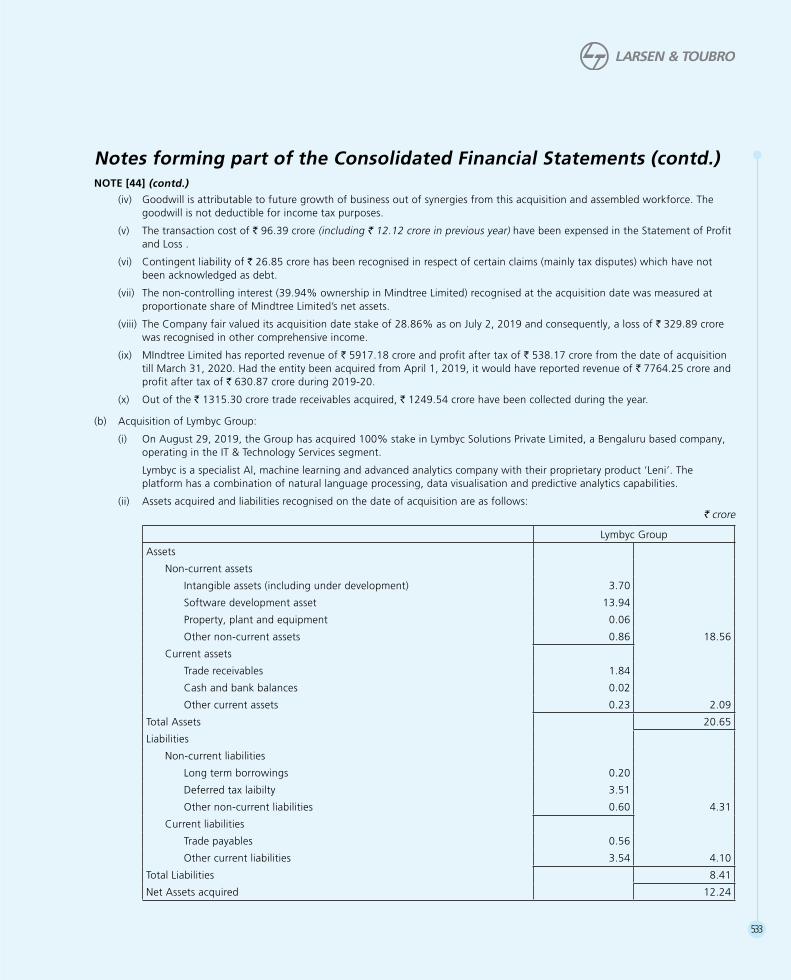
533
Notes forming part of the Consolidated Financial Statements (contd.)
(iv) Goodwill is attributable to future growth of business out of synergies from this acquisition and assembled workforce. The goodwill is not deductible for income tax purposes.
(v) The transaction cost of R 96.39crore(including R 12.12 crore in previous year) have been expensed in the Statement of Profit and Loss .
(vi) Contingent liability of R 26.85crorehasbeenrecognisedinrespectofcertainclaims(mainlytaxdisputes)whichhavenotbeen acknowledged as debt.
(vii) Thenon-controllinginterest(39.94%ownershipinMindtreeLimited)recognisedattheacquisitiondatewasmeasuredatproportionate share of Mindtree Limited’s net assets.
(viii) TheCompanyfairvalueditsacquisitiondatestakeof28.86%asonJuly2,2019andconsequently,alossofR 329.89crorewas recognised in other comprehensive income.
(ix) MIndtree Limited has reported revenue of R 5917.18croreandprofitaftertaxofR 538.17crorefromthedateofacquisitiontill March 31, 2020. Had the entity been acquired from April 1, 2019, it would have reported revenue of R 7764.25croreandprofit after tax of R 630.87croreduring2019-20.
(x) Out of the R 1315.30 crore trade receivables acquired, R 1249.54 crore have been collected during the year.
(b) Acquisition of Lymbyc Group:
(i) OnAugust29,2019,theGrouphasacquired100%stakeinLymbycSolutionsPrivateLimited,aBengalurubasedcompany,operating in the IT & Technology Services segment.
Lymbyc is a specialist Al, machine learning and advanced analytics company with their proprietary product ‘Leni’. The platform has a combination of natural language processing, data visualisation and predictive analytics capabilities.
(ii) Assets acquired and liabilities recognised on the date of acquisition are as follows:v crore
Lymbyc Group
Assets
Non-current assets
Intangible assets (including under development) 3.70
Software development asset 13.94
Property, plant and equipment 0.06
Other non-current assets 0.86 18.56
Current assets
Trade receivables 1.84
Cash and bank balances 0.02
Other current assets 0.23 2.09
Total Assets 20.65
Liabilities
Non-current liabilities
Long term borrowings 0.20
Deferred tax laibilty 3.51
Other non-current liabilities 0.60 4.31
Current liabilities
Trade payables 0.56
Other current liabilities 3.54 4.10
Total Liabilities 8.41
Net Assets acquired 12.24
NOTE [44] (contd.)
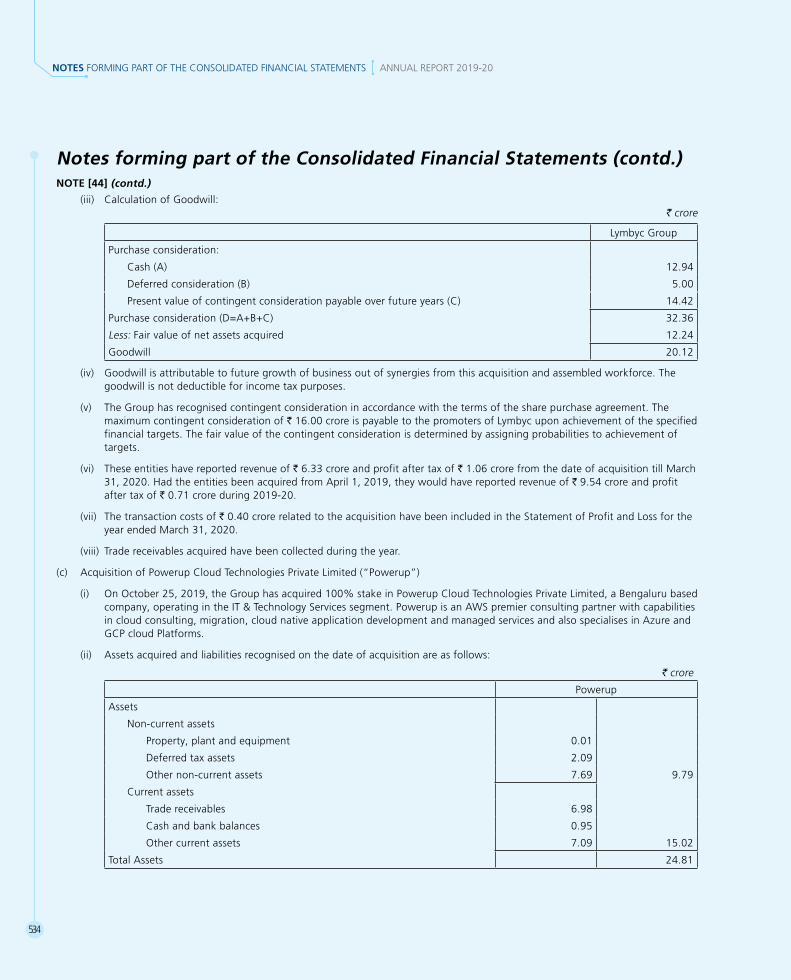
534
NOTES FORMING PART OF THE CONSOLIDATED FINANCIAL STATEMENTS ANNUAL REPORT 2019-20
Notes forming part of the Consolidated Financial Statements (contd.)
(iii) Calculation of Goodwill:v crore
Lymbyc Group
Purchase consideration:
Cash (A) 12.94
Deferred consideration (B) 5.00
Present value of contingent consideration payable over future years (C) 14.42
Purchase consideration (D=A+B+C) 32.36
Less: Fair value of net assets acquired 12.24
Goodwill 20.12
(iv) Goodwill is attributable to future growth of business out of synergies from this acquisition and assembled workforce. The goodwill is not deductible for income tax purposes.
(v) The Group has recognised contingent consideration in accordance with the terms of the share purchase agreement. The maximum contingent consideration of R 16.00croreispayabletothepromotersofLymbycuponachievementofthespecifiedfinancial targets. The fair value of the contingent consideration is determined by assigning probabilities to achievement of targets.
(vi) These entities have reported revenue of R 6.33croreandprofitaftertaxofR 1.06crorefromthedateofacquisitiontillMarch31, 2020. Had the entities been acquired from April 1, 2019, they would have reported revenue of R 9.54 crore and profit after tax of R 0.71 crore during 2019-20.
(vii) The transaction costs of R 0.40 crore related to the acquisition have been included in the Statement of Profit and Loss for the year ended March 31, 2020.
(viii) Trade receivables acquired have been collected during the year.
(c) Acquisition of Powerup Cloud Technologies Private Limited (“Powerup”)
(i) OnOctober25,2019,theGrouphasacquired100%stakeinPowerupCloudTechnologiesPrivateLimited,aBengalurubasedcompany, operating in the IT & Technology Services segment. Powerup is an AWS premier consulting partner with capabilities in cloud consulting, migration, cloud native application development and managed services and also specialises in Azure and GCP cloud Platforms.
(ii) Assets acquired and liabilities recognised on the date of acquisition are as follows:
v crore
Powerup
Assets
Non-current assets
Property, plant and equipment 0.01
Deferred tax assets 2.09
Other non-current assets 7.69 9.79
Current assets
Trade receivables 6.98
Cash and bank balances 0.95
Other current assets 7.09 15.02
Total Assets 24.81
NOTE [44] (contd.)

535
Notes forming part of the Consolidated Financial Statements (contd.)
v crore
Powerup
Liabilities
Non-current liabilities
Long term borrowings 0.95
Other non-current liabilities 7.92 8.87
Current liabilities
Trade payables 5.90
Other current liabilities 23.25 29.15
Total Liabilities 38.02
Net Assets acquired (13.21)
(iii) Calculation of Goodwill:v crore
Powerup
Purchase consideration:
Cash (A) 28.80
Deferred consideration (B) 5.00
Contingent consideration payable over one year (C) 46.65
Purchase consideration (D=A+B+C) 80.45
Less: Fair value of net assets acquired (13.21)
Goodwill 93.66
(iv) Goodwill is attributable to future growth of business out of synergies from this acquisition and assembled workforce. The goodwill is not deductible for income tax purposes.
(v) The Group has recognised contingent consideration in accordance with terms of share purchase and subscription agreement. The maximum contingent consideration of R 52.13 crore is payable to the promoters and identified employees of Powerup upon achievement of specified financial targets. The fair value of contingent consideration is determined by assigning probabilities to achievement of the targets.
(vi) The entity has reported revenue of R 16.12croreandlossofR 1.55 crore from the date of acquisition till March 31, 2020. Had the entity been acquired from April 1, 2019, it would have reported revenue of R 34.86croreandlossofR 13.85croreduring 2019-20.
(vii) The transaction costs of R 0.47 crore related to the acquisition have been included in the Statement of Profit and Loss for the year ended March 31, 2020.
(viii) Out of R 6.98croreoftradereceivablesacquired,R 6.62crorehavebeencollectedduringtheyear.
NOTE [44] (contd.)

536
NOTES FORMING PART OF THE CONSOLIDATED FINANCIAL STATEMENTS ANNUAL REPORT 2019-20
(d) Acquisition of further stake in L&T Gulf Private Limited
(i) OnNovember20,2019,theGrouphasacquiredfurther50%stakeinL&TGulfPrivateLimited.Theentityhasbecomeawholly owned subsidiary. It operates in the Hydrocarbon segment.
(ii) Assets acquired and liabilities recognised on the date of acquisition are as follows:v crore
L&T Gulf Private LimitedAssets Non-current assets Property, plant and equipment 0.41 Deferred tax assets 0.48 Other non-current assets 0.85 1.74 Current assets Trade receivables 4.66 Cash and bank balances 19.76 Other current assets 3.47 27.89Total Assets 29.63Liabilities Current liabilities Trade payables 3.43 Other current liabilities 1.78 5.21Total Liabilities 5.21Net Assets acquired 24.42
(iii) Calculation of Goodwill:v crore
L&T Gulf Private LimitedPurchaseconsiderationpaidincashfor50%stake(A) 25.00Fairvaluationofexisting50%stake(B) 25.00Total (C=A+B) 50.00Less: Fair value of net assets acquired 24.42Goodwill 25.58
(iv) Goodwill is attributable to future growth of business out of synergies from this acquisition and assembled workforce. The goodwill is not deductible for income tax purposes.
(v) The entity has reported revenue of R 12.13 crore and profit after tax of R 8.65crorefromthedateofacquisitiontillMarch31,2020. Had the entity been acquired from April 1, 2019, it would have reported revenue of R 14.76croreandprofitaftertaxof R 1.63croreduring2019-20.
(vi) Out of R 4.66croreoftradereceivablesacquired,R 3.40 crore have been collected during the year.
(e) The Hon’ble National Company Law Tribunal, Chennai Bench vide order dated March 10, 2020 and the Hon’ble National Company Law Tribunal, Mumbai Bench vide order dated April 24, 2020 have approved the scheme of amalgamation of L&T Shipbuilding Ltd (wholly-owned subsidiary) with the Company (‘the Scheme’), the appointed date being April 1, 2019. Accordingly, the effect of theSchemehasbeengiveninthestandalonefinancialsoftheCompanyfortheyear2019-20and2018-19.
(f) The Hon’ble National Company Law Tribunal, Mumbai Bench vide its order dated April 23, 2020 approved the composite scheme of arrangement between L&T Realty Limited, L&T Construction Equipment Limited and L&T Construction Machinery Limited (all wholly-owned subsidiaries of the Company) and their respective shareholders and creditors (‘the Scheme’), the appointed date beingApril1,2018.Accordingly,theeffectoftheSchemehasbeengiveninthestandalonefinancialsoftherespectivecompaniesfortheyear2019-20and2018-19.
Notes forming part of the Consolidated Financial Statements (contd.)NOTE [44] (contd.)

537
NOTE [45]
Disclosure pursuant to Ind AS 105 “Non-current Assets Held for Sale and Discontinued Operations”:
(a) The Group has following non-current assets/disposal group recognised as held for sale as on March 31, 2020
Assets/disposal group Reportable segment
Electrical & Automation business [Note (i)] Electrical & AutomationWealth management business [L&T Capital Markets Limited & L&T Capital Markets
(Middle East) Limited] [Note (ii)] Financial ServicesNon-current assets (buildings) (L&T Financial Consultants Limited) Financial ServicesCurrent assets (L&T Vision Ventures Limited) OthersNon-current assets (land taken on finance lease and buildings) (Mindtree Limited) IT and Technology Services
Notes:
(i) OnMay1,2018,theGrouphadsigned,subjecttoregulatoryapprovals,definitiveagreementswithSchneiderElectricforstrategicdivestmentofitsElectrical&Automation(E&A)business[Note46-compositionofE&Abusiness].TheCompetitionCommissionofIndia(CCI)accordedonApril18,2019itsapproval(thedetailedorderwasuploadedonitswebsiteonJune6,2019) for acquisition of the Group’s E&A business by Schneider Electric subject to fulfilment of certain conditions.
As the sale was likely to be completed within the next one year from then, E&A business had been classified as discontinued operations from Q1 2019-20 onwards. The Group remains committed to its divestment plan. Based on the progress of the divestment process and its current status, the Group continues to classify its E&A business as discontinued operation.
(ii) Subsequent to the year under review, the Group has divested its entire stake in L&T Capital Markets Limited to IIFL Wealth Finance Limited on April 24, 2020.
(b) The Group has following non-current assets/disposal group recognised as held for sale as on March 31, 2019
Assets/disposal group Reportable segmentNon-current assets (buildings) (L&T Financial Consultants Limited) Financial ServicesCurrent assets (L&T Vision Ventures Limited) Others
(c) The proposed sale is expected to be completed within 1 year from the respective reporting dates.
(d) The details of assets/disposal group classified as held for sale and liabilities associated thereto are as under:
v crore
ParticularsAs at
31-3-2020As at
31-3-2019Group(s) of assets classified as held for sale: Property, plant and equipment 780.95 1.17 Capital work-in-progress 21.79 – Investment property 25.13 – Goodwill 333.44 – Other intangible assets 203.35 – Intangible assets under development 122.25 – Right-of-use assets 32.83 – Other loans 3.52 – Inventories 1009.04 – Trade receivables 1184.41 – Cash and cash equivalents 165.78 – Tax assets 4.74 – Other assets 479.98 6.24 Total 4367.21 7.41
Notes forming part of the Consolidated Financial Statements (contd.)
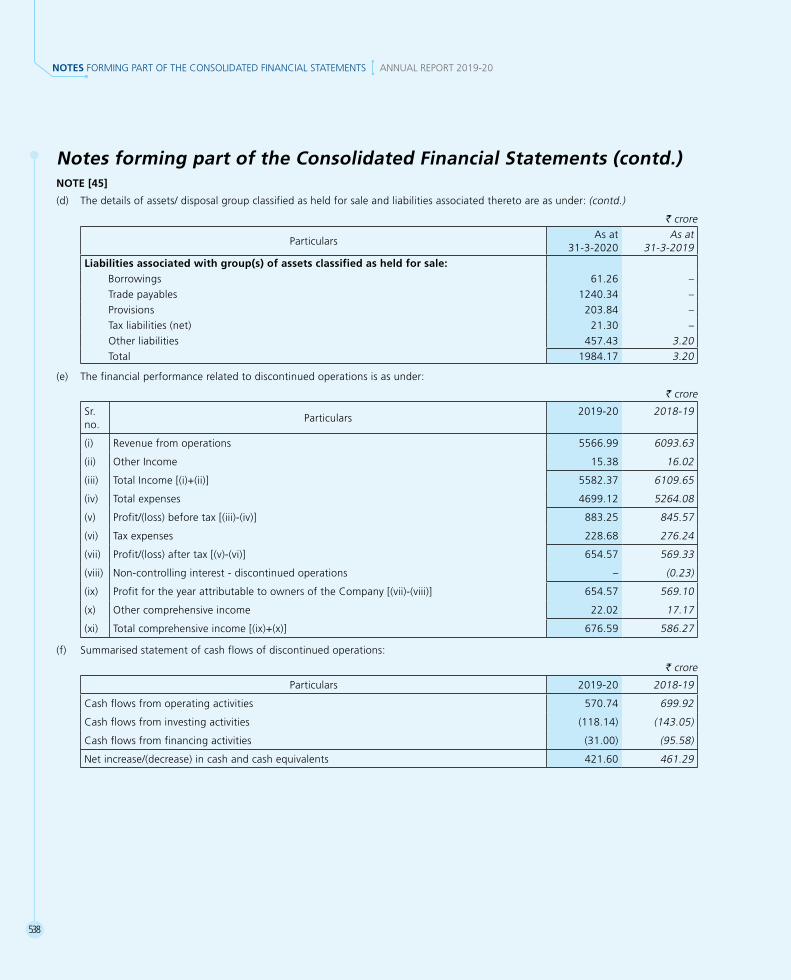
538
NOTES FORMING PART OF THE CONSOLIDATED FINANCIAL STATEMENTS ANNUAL REPORT 2019-20
NOTE [45]
(d) The details of assets/ disposal group classified as held for sale and liabilities associated thereto are as under: (contd.)
v crore
ParticularsAs at
31-3-2020As at
31-3-2019Liabilities associated with group(s) of assets classified as held for sale: Borrowings 61.26 – Trade payables 1240.34 – Provisions 203.84 – Tax liabilities (net) 21.30 – Other liabilities 457.43 3.20 Total 1984.17 3.20
(e) The financial performance related to discontinued operations is as under:
v crore
Sr. no.
Particulars2019-20 2018-19
(i) Revenue from operations 5566.99 6093.63
(ii) Other Income 15.38 16.02
(iii) Total Income [(i)+(ii)] 5582.37 6109.65
(iv) Total expenses 4699.12 5264.08
(v) Profit/(loss) before tax [(iii)-(iv)] 883.25 845.57
(vi) Tax expenses 228.68 276.24
(vii) Profit/(loss) after tax [(v)-(vi)] 654.57 569.33
(viii) Non-controlling interest - discontinued operations – (0.23)
(ix) Profit for the year attributable to owners of the Company [(vii)-(viii)] 654.57 569.10
(x) Other comprehensive income 22.02 17.17
(xi) Total comprehensive income [(ix)+(x)] 676.59 586.27
(f) Summarised statement of cash flows of discontinued operations:
v crore
Particulars 2019-20 2018-19
Cash flows from operating activities 570.74 699.92
Cash flows from investing activities (118.14) (143.05)
Cash flows from financing activities (31.00) (95.58)
Net increase/(decrease) in cash and cash equivalents 421.60 461.29
Notes forming part of the Consolidated Financial Statements (contd.)

539
NOTE [46]DisclosurepursuanttoIndAS108“OperatingSegment”:(a) Information about reportable segments
v crore
ParticularsFor the year ended 31-3-2020 For the year ended 31-3-2019
External Inter-segment Total External Inter-segment TotalRevenueInfrastructure 73036.56 740.75 73777.31 72418.05 785.71 73203.76 Power 2293.62 24.84 2318.46 3971.50 11.59 3983.09 Heavy Engineering 2853.18 351.86 3205.04 2174.22 339.44 2513.66 Defence Engineering 3970.47 8.70 3979.17 3751.97 97.27 3849.24 Electrical & Automation [Note 45] 5232.29 334.70 5566.99 5786.81 306.82 6093.63 Hydrocarbon 17420.45 25.02 17445.47 15131.58 44.65 15176.23 IT & Technology Services 22135.33 199.91 22335.24 14371.36 181.74 14553.10 Financial Services 13822.36 – 13822.36 12637.69 – 12637.69 Developmental Projects 4850.33 – 4850.33 5068.04 – 5068.04 Others 5070.06 238.66 5308.72 5695.88 239.10 5934.99 Total 150684.65 1924.44 152609.09 141007.10 2006.33 143013.43 Less: Revenue from discontinued operations 5232.29 334.70 5566.99 5786.81 306.82 6093.63 Elimination – 1589.74 1589.74 – 1699.51 1699.51Total 145452.36 – 145452.36 135220.29 – 135220.29 Segment result [Profit/(Loss) before interest and tax]Infrastructure 5207.37 5388.77 Power 236.11 129.88 Heavy Engineering 566.01 487.01 Defence Engineering 575.84 472.22 Electrical & Automation [Note 45] 888.06 850.09 Hydrocarbon 1746.18 1178.10 IT & Technology Services 3693.23 3084.20 Financial Services 2678.65 3052.64 Developmental Projects 387.28 314.35 Others 969.43 776.20 Total 16948.16 15733.46 Result of discontinued operations (888.06) (850.09)Inter-segment margins on capital jobs (63.01) (5.50)Finance costs (2796.66) (1802.55)Unallocated corporate income net of expenditure 230.52 365.27 Exceptional items (net) – 294.75 Profit before tax 13430.95 13735.34 Tax expense: Current tax (3564.58) (4402.95) Deferred tax (net) 301.38 335.86 Net profit after tax from continuing operations 10167.75 9668.25 Share in profit/(loss) after tax of joint ventures/associates
(net) 71.96 (21.00)Profit for the year from continuing operations 10239.71 9647.25 Discontinued operationsProfit from discontinued operations 883.25 845.57 Tax expense of discontinued operations (228.68) (276.24)Net profit after tax from discontinued operations 654.57 569.33 Net profit after tax from continuing operations &
discontinued operations 10894.28 10216.58 Non-controlling interest for the year (1345.25) (1311.45)Net profit after tax, non-controlling interests and
share in profit/(loss) of joint ventures/associates 9549.03 8905.13
Notes forming part of the Consolidated Financial Statements (contd.)

540
NOTES FORMING PART OF THE CONSOLIDATED FINANCIAL STATEMENTS ANNUAL REPORT 2019-20
v crore
Segment Assets Segment Liabilities
Particulars As at As at As at As at
31-3-2020 31-3-2019 31-3-2020 31-3-2019
Infrastructure 80369.92 74848.71 52090.81 50908.92
Power 6126.80 6030.51 4381.75 4838.09
Heavy Engineering 4320.26 4020.13 1414.15 1517.38
Defence Engineering 7279.68 7826.76 4265.88 4964.28
Electrical & Automation [Note 45] 4370.28 4183.22 1973.08 2053.88
Hydrocarbon 15355.49 12224.57 12475.30 10096.59
IT & Technology Services 26514.97 9647.21 6876.49 2575.96
Financial Services 108481.90 104842.19 95021.16 92973.64
Developmental Projects 33166.54 30998.97 8768.35 9368.08
Others 10681.05 9819.89 3546.15 3936.13
Segment total 296666.89 264442.16 190813.12 183232.95
Corporate unallocated assets/liabilities 15365.22 16165.54 44974.94 28173.84
Inter-segment assets/liabilities (3891.98) (2260.34) (3891.98) (2260.34)
Consolidated total assets/liabilities 308140.13 278347.36 231896.08 209146.45
v crore
Particulars
Depreciation, amortisation, impairment & obsolescence
included in segment expense
Non-cash expenses other than depreciation included in
segment expense
2019-20 2018-19 2019-20 2018-19
Infrastructure 704.44 764.59 40.31 46.40
Power 38.07 47.16 0.94 2.99
Heavy Engineering 46.29 56.98 1.18 2.19
Defence Engineering 145.26 134.03 1.40 2.59
Electrical & Automation [Note 45] 46.94 161.63 2.50 6.97
Hydrocarbon 151.56 151.83 2.81 7.82
IT & Technology Services 941.28 251.34 52.08 7.25
Financial Services 78.44 49.01 88.64 68.15
Developmental Projects 151.77 207.22 – –
Others 92.48 96.77 0.58 1.46
Segment total 2396.53 1920.56 190.44 145.82
Unallocable 131.89 164.10 2.90 12.15
Less: Relates to discontinued operations 46.94 161.63 2.50 6.97
Inter-segment 19.21 – – –
Consolidated total 2462.27 1923.03 190.84 151.00
Note: Impairment loss included in segment expense: Financial Services segment R 12 crore (previous year: Nil), Developmental Projects segment Nil (previous year: R 127.94 crore), Other segment R 3.28crore(previous year: R 2.08crore) and Corporate Unallocated R 2.09 crore (previous year: R 146.93crore).
Notes forming part of the Consolidated Financial Statements (contd.)NOTE [46]
(a) Information about reportable segments (contd.)
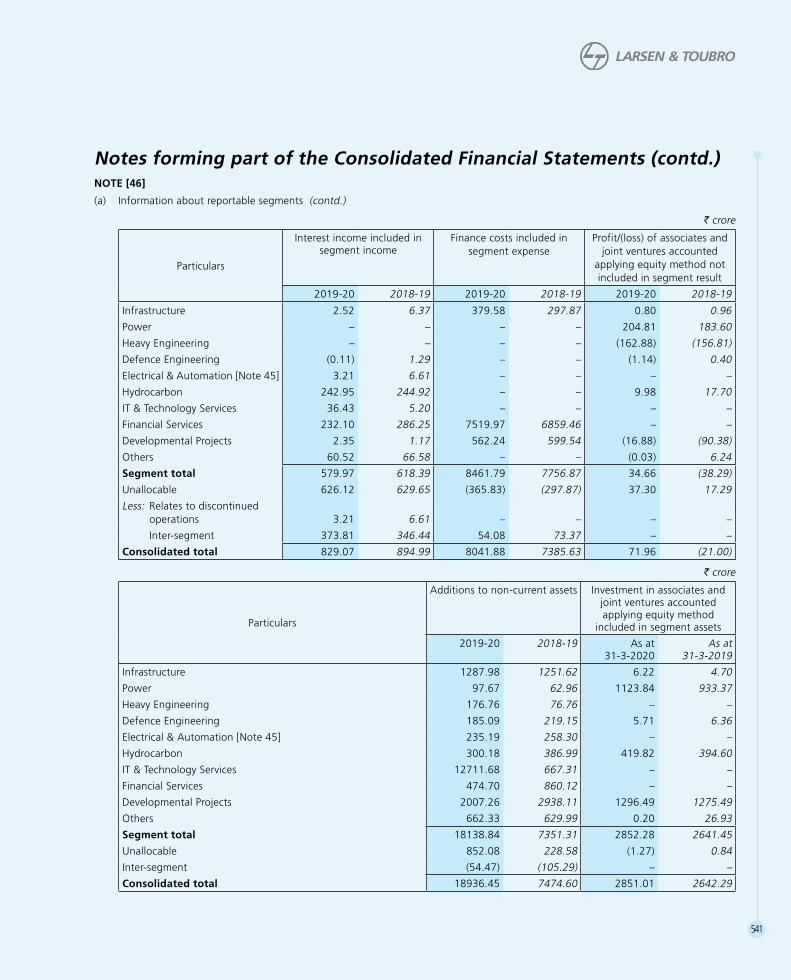
541
v crore
Particulars
Interest income included in segment income
Finance costs included in segment expense
Profit/(loss) of associates and joint ventures accounted
applying equity method not included in segment result
2019-20 2018-19 2019-20 2018-19 2019-20 2018-19
Infrastructure 2.52 6.37 379.58 297.87 0.80 0.96
Power – – – – 204.81 183.60
Heavy Engineering – – – – (162.88) (156.81)
Defence Engineering (0.11) 1.29 – – (1.14) 0.40
Electrical & Automation [Note 45] 3.21 6.61 – – – –
Hydrocarbon 242.95 244.92 – – 9.98 17.70
IT & Technology Services 36.43 5.20 – – – –
Financial Services 232.10 286.25 7519.97 6859.46 – –
Developmental Projects 2.35 1.17 562.24 599.54 (16.88) (90.38)
Others 60.52 66.58 – – (0.03) 6.24
Segment total 579.97 618.39 8461.79 7756.87 34.66 (38.29)
Unallocable 626.12 629.65 (365.83) (297.87) 37.30 17.29
Less: Relates to discontinued operations 3.21 6.61 – – – –
Inter-segment 373.81 346.44 54.08 73.37 – –
Consolidated total 829.07 894.99 8041.88 7385.63 71.96 (21.00)
v crore
Particulars
Additions to non-current assets Investment in associates and joint ventures accounted applying equity method
included in segment assets
2019-20 2018-19 As at 31-3-2020
As at 31-3-2019
Infrastructure 1287.98 1251.62 6.22 4.70
Power 97.67 62.96 1123.84 933.37
Heavy Engineering 176.76 76.76 – –
Defence Engineering 185.09 219.15 5.71 6.36
Electrical & Automation [Note 45] 235.19 258.30 – –
Hydrocarbon 300.18 386.99 419.82 394.60
IT & Technology Services 12711.68 667.31 – –
Financial Services 474.70 860.12 – –
Developmental Projects 2007.26 2938.11 1296.49 1275.49
Others 662.33 629.99 0.20 26.93
Segment total 18138.84 7351.31 2852.28 2641.45
Unallocable 852.08 228.58 (1.27) 0.84
Inter-segment (54.47) (105.29) – –
Consolidated total 18936.45 7474.60 2851.01 2642.29
Notes forming part of the Consolidated Financial Statements (contd.)NOTE [46]
(a) Information about reportable segments (contd.)
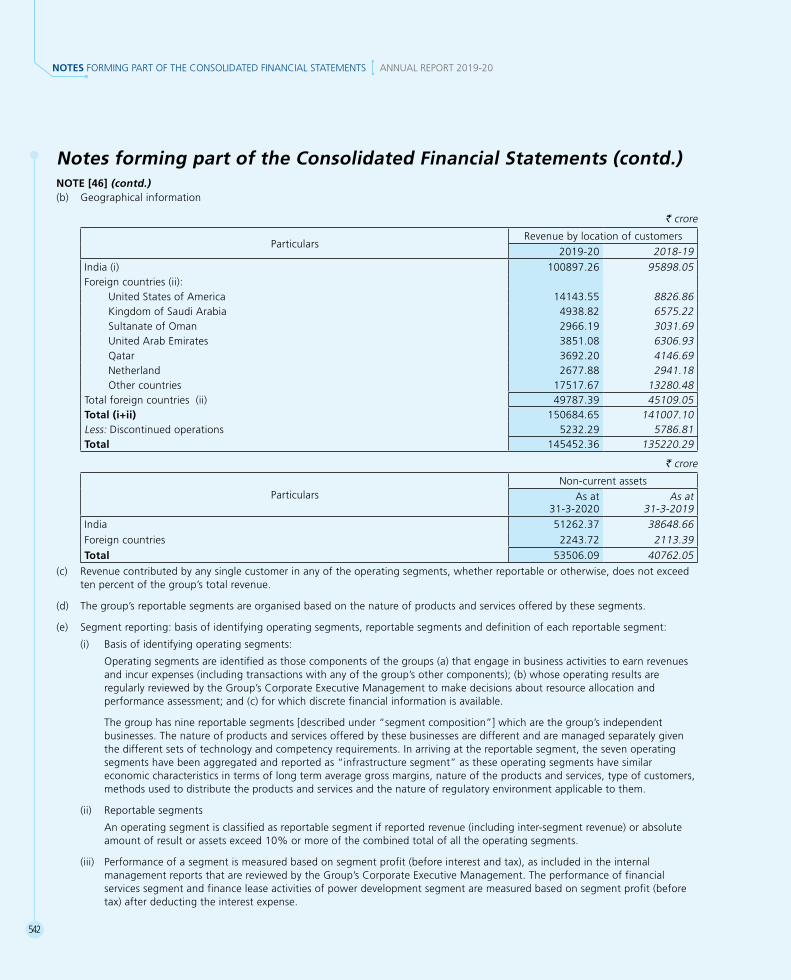
542
NOTES FORMING PART OF THE CONSOLIDATED FINANCIAL STATEMENTS ANNUAL REPORT 2019-20
NOTE [46] (contd.)(b) Geographical information
v crore
ParticularsRevenue by location of customers
2019-20 2018-19India (i) 100897.26 95898.05Foreign countries (ii): United States of America 14143.55 8826.86 Kingdom of Saudi Arabia 4938.82 6575.22 Sultanate of Oman 2966.19 3031.69 United Arab Emirates 3851.08 6306.93 Qatar 3692.20 4146.69 Netherland 2677.88 2941.18 Other countries 17517.67 13280.48Total foreign countries (ii) 49787.39 45109.05Total (i+ii) 150684.65 141007.10Less: Discontinued operations 5232.29 5786.81Total 145452.36 135220.29
v crore
ParticularsNon-current assets
As at 31-3-2020
As at 31-3-2019
India 51262.37 38648.66Foreign countries 2243.72 2113.39Total 53506.09 40762.05
(c) Revenue contributed by any single customer in any of the operating segments, whether reportable or otherwise, does not exceed ten percent of the group’s total revenue.
(d) The group’s reportable segments are organised based on the nature of products and services offered by these segments.
(e) Segment reporting: basis of identifying operating segments, reportable segments and definition of each reportable segment:
(i) Basis of identifying operating segments:
Operating segments are identified as those components of the groups (a) that engage in business activities to earn revenues and incur expenses (including transactions with any of the group’s other components); (b) whose operating results are regularly reviewed by the Group’s Corporate Executive Management to make decisions about resource allocation and performance assessment; and (c) for which discrete financial information is available.
The group has nine reportable segments [described under “segment composition”] which are the group’s independent businesses. The nature of products and services offered by these businesses are different and are managed separately given the different sets of technology and competency requirements. In arriving at the reportable segment, the seven operating segments have been aggregated and reported as “infrastructure segment” as these operating segments have similar economic characteristics in terms of long term average gross margins, nature of the products and services, type of customers, methods used to distribute the products and services and the nature of regulatory environment applicable to them.
(ii) Reportable segments
An operating segment is classified as reportable segment if reported revenue (including inter-segment revenue) or absolute amountofresultorassetsexceed10%ormoreofthecombinedtotalofalltheoperatingsegments.
(iii) Performance of a segment is measured based on segment profit (before interest and tax), as included in the internal management reports that are reviewed by the Group’s Corporate Executive Management. The performance of financial services segment and finance lease activities of power development segment are measured based on segment profit (before tax) after deducting the interest expense.
Notes forming part of the Consolidated Financial Statements (contd.)

543
(iv) Segment composition
• Infrastructure segment comprises engineering and construction of building and factories, transportation infrastructure, heavy civil infrastructure, power transmission & distribution, water & effluent treatment, smart world & communication projects and metallurgical & material handling systems.
• Power segment comprises turnkey solutions for Coal-based and Gas-based thermal power plants including power generation equipment with associated systems and/or balance-of-plant packages.
• Heavy Engineering segment comprises manufacture and supply of custom designed, engineered critical equipment & systems to core sector industries like Fertiliser, Refinery, Petrochemical, Chemical, Oil & Gas and Thermal & Nuclear Power.
• Defence Engineering segment comprises (a) design, development, serial production and through life-support of equipment, systems and platforms for Defence and Aerospace sectors and (b) design, construction and repair/refit of defence vessels.
• Electrical & Automation segment comprises manufacture and sale of low and medium voltage switchgear components, custom built low and medium voltage switchboards, electronic energy meters/protection (relays) systems and control & automation products.
• Hydrocarbon segment comprises complete EPC solutions for the global Oil & Gas Industry from front-end design through detailed engineering, modular fabrication, procurement, project management, construction, installation and commissioning.
• IT & Technology Services segment comprises information technology and integrated engineering services.
• Financial Services segment comprises rural finance, housing finance, wholesale finance, mutual fund and wealth management.
• Developmental projects segment comprises development, operation and maintenance of basic infrastructure projects, toll and fare collection, power development, development and operation of port facilities (till the date of sale) and providing related advisory services.
• Others segment includes realty, manufacture and sale of industrial valves, manufacture, marketing and servicing of construction equipment and parts thereof, marketing and servicing of mining machinery and parts thereof, manufacture and sale of rubber processing machinery, mining and aviation. None of the businesses reported as part of others segment meet any of the quantitative thresholds for determining reportable segments for the year ended March 31, 2020.
Notes forming part of the Consolidated Financial Statements (contd.)NOTE [46] (contd.)

544
NOTES FORMING PART OF THE CONSOLIDATED FINANCIAL STATEMENTS ANNUAL REPORT 2019-20
NOTE [47]
Disclosure pursuant to Ind AS 115 “Revenue from Contracts with Customers”:
(a) Disaggregation of revenue into operating segments and geographical areas:v crore
Segment
2019-20Revenue as per Ind AS 115
Other revenue
Total as per Statement of
Profit and Loss/ Segment report
Domestic Foreign Total
Infrastructure 54988.27 17883.72 72871.99 164.57 73036.56Power 1848.75 385.96 2234.71 58.91 2293.62Heavy Engineering 1390.92 1428.61 2819.53 33.65 2853.18Defence Engineering 3624.88 342.40 3967.28 3.19 3970.47Electrical & Automation (discontinued operations) 3904.50 1320.59 5225.09 7.20 5232.29Hydrocarbon 9804.07 7527.39 17331.46 88.99 17420.45IT & Technology Services 1834.31 20301.02 22135.33 – 22135.33Financial Services 669.83 – 669.83 13152.53 13822.36Developmental Projects 3712.05 – 3712.05 1138.28 4850.33Others 4448.14 570.69 5018.83 51.23 5070.06Total 86225.72 49760.38 135986.10 14698.55 150684.65Less: Revenue from discontinued
operations 3904.50 1320.59 5225.09 7.20 5232.29Revenue from continuing operations 82321.22 48439.79 130761.01 14691.35 145452.36
v crore
Segment
2018-19Revenue as per Ind AS 115
Other revenue
Total as per Statement of
Profit and Loss/ Segment report
Domestic Foreign Total
Infrastructure 53212.17 19095.51 72307.68 110.37 72418.05Power 2583.78 1383.77 3967.55 3.95 3971.50Heavy Engineering 964.08 1184.05 2148.13 26.09 2174.22Defence Engineering 3420.43 331.54 3751.97 – 3751.97Electrical & Automation (discontinued operations) 4234.45 1533.30 5767.75 19.06 5786.81Hydrocarbon 7174.51 7945.69 15120.20 11.38 15131.58IT & Technology Services 1217.91 13153.45 14371.36 – 14371.36Financial Services 1135.97 – 1135.97 11501.72 12637.69Developmental Projects 3521.39 – 3521.39 1546.65 5068.04Others 4581.92 443.95 5025.87 670.01 5695.88Total 82046.61 45071.26 127117.87 13889.23 141007.10Less: Revenue from discontinued
operations 4234.45 1533.30 5767.75 19.06 5786.81Revenue from continuing operations 77812.16 43537.96 121350.12 13870.17 135220.29
Notes forming part of the Consolidated Financial Statements (contd.)

545
(b) Break up of revenue (as per Ind AS 115) into over a period of time and at a point in time:v crore
Year
Over a period of time At a point in time
Continuing operations
Discontinued operations
Total Continuing operations
Discontinued operations
Total
2019-20 120248.36 276.15 120524.51 10512.65 4948.94 15461.59
2018-19 110735.81 462.40 111198.21 10614.31 5305.35 15919.66
(c) Movement in expected credit loss (“ECL”) during the year:v crore
ParticularsProvision on trade receivables Provision on contract assets
2019-20 2018-19 2019-20 2018-19
Opening balance as at April 1 3000.83 2900.10 856.31 121.85
Transition impact of Ind AS 115 – – – 780.87
Changes in allowance for ECL:
Provision/(reversal) of allowance for ECL 313.00 84.34 173.42 (198.80)
Additional provision (net) 178.37 265.62 2.14 155.14
Write off as bad debts (194.62) (249.23) – (2.75)
Translation adjustment 12.12 – 3.40 –
Classified as held for sale (154.10) – (23.25) –
Addition on account of business combination 25.61 – 0.03 –
Closing balance as at March 31 3181.21 3000.83 1012.05 856.31
(d) Contract balances:
(i) Movement in contract balances during the year -
v crore
Particulars
2019-20 2018-19
Contract assets
(A)
Contract liabilities
(B)
Net contract balances
(A-B)
Contract assets
(A)
Contract liabilities
(B)
Net contract balances
(A-B)
Opening balance as at April 1 46475.33 28272.43 18202.90 42194.20 24196.28 17997.92
Closing balance as at March 31 51849.63 28019.45 23830.18 46475.33 28272.43 18202.90
Net increase/(decrease) 5374.30 (252.98) 5627.28 4281.13 4076.15 204.98
Balances as at March 31, 2020 does not include balances classified as held for sale.
Note:
During the current year, increase in net contract balances is primarily due to higher revenue recognition as compared to progress bills raised.
During the previous year, increase in net contract balances is primarily due to higher revenue recognition as compared to progress bills raised and Ind AS 115 transition adjustment.
Notes forming part of the Consolidated Financial Statements (contd.)NOTE [47] (contd.)

546
NOTES FORMING PART OF THE CONSOLIDATED FINANCIAL STATEMENTS ANNUAL REPORT 2019-20
(ii) Revenue recognised from opening balance of contract liabilities amounts to R 7536.12crore(previous year: R 9724.78crore).
(iii) Revenue recognised from the performance obligation satisfied (or partially satisfied) upto previous year (arising out of contract modifications) amounts to R 295.31 crore (previous year: R 221.00 crore).
(e) Cost to obtain/fulfil the contract:
(i) Amortisation in Statement of Profit and Loss: R 18.97crore(previous year: R 5.32 crore).
(ii) Recognised as contract assets as at March 31, 2020 R 118.87crore(as at March 31, 2019 R 30.26crore)
(f) Reconciliation of contracted price with revenue during the year:
v crore
Particulars 2019-20 2018-19
Opening contracted price of orders on hand as at April 1* 640145.61 560785.57
Add:
Fresh orders/change orders received (net) 176430.35 160021.63
Increase due to additional consideration recognised as per contractual terms/(decrease) due to scope reduction (net) (24041.59) 2164.52
Addition on account of business combination 2320.76 –
Increase due to exchange rate movements (net) 6929.54 2798.27
Less:
Orders completed during the year 75306.08 85624.38
Closing contracted price of orders on hand as at March 31* 726478.59 640145.61
Total revenue recognised during the year 135986.10 127117.87
Less: Revenue out of orders completed during the year 34451.56 27545.23
Revenue out of orders under execution at the end of the year (I) 101534.54 99572.64
Revenue recognised upto previous year (from orders pending completion at the end of the year) (II) 304746.53 242938.20
Increase/(decrease) due to exchange rate movements (net) (III) 2422.33 (68.63)
Balance revenue to be recognised in future viz. Order book (IV) 317775.19 297703.40
Closing contracted price of orders on hand as at March 31* (I+II+III+IV) 726478.59 640145.61
Closing contracted price of orders on hand at the end of the year - Continuing operations 722210.41
Closing contracted price of orders on hand at the end of the year - Discontinued operations 4268.18
* including full value of partially executed contracts
(g) Remaining performance obligations and its expected conversion into revenue:v crore
Remaining performance obligation
TotalExpected conversion in revenue
Upto 1 Year
From 1 to 2 years
From 2 to 3 years
From 3 to 4 years
From 4 to 5 years
Beyond 5 years
As at March 31, 2020
Total 317775.19 126750.06 104518.84 58127.31 19742.88 4517.78 4118.32Continuing operations 315199.16 124719.69 104141.46 58051.78 19719.71 4500.33 4066.19Discontinued operations 2576.03 2030.37 377.38 75.53 23.17 17.45 52.13
As at March 31, 2019 297703.40 116804.46 108730.85 44795.85 16996.20 5926.62 4449.42
Notes forming part of the Consolidated Financial Statements (contd.)NOTE [47] (contd.)

547
(h) The Group has undertaken a project for construction, operation and maintenance of the Metro Rail System on Design-Build-Finance-Operate-Transfer (DBFOT) basis as per the concession agreement with the government authorities. The significant terms of the arrangement are as under:
Period of the concession
Initial period of 35 years and extendable by another 25 years at the option of the concessionaire subject to fulfilment of certain conditions under concession agreement.
Remuneration Fare collection rights from the users of the Metro Rail System, license to use land provided by the government for constructing depots and for transit oriented development and earn lease rental income on such development and grant of viability gap fund.
Funding from grantor Viability Gap Funding of R 1458crore.
Infrastructure return at the end of the concession period
Being DBFOT project, the project assets have to be transferred at the end of concession period.
Renewal and termination options
Further extension of 25 years will be granted at the option of the concessionaire upon satisfaction of Key Performance Indicators laid under the concession agreement. This option is to be exercised by the concessionaire during the 33rd year of the initial concession period. Termination of the concession agreement can either be due to (a) Force Majeure (b) Non Political event (c) Indirect political event (d) Political event. On occurrence of any of the above events, the obligations, dispute resolution, termination payments etc are as detailed in the concession agreement.
Rights & Obligations Major obligations of the concessionaire are relating to –
(a) project agreements
(b) change in ownership
(c) issuance of Golden Share to the Government
(d) maintenance of aesthetic quality of the Rail System
(e) operation and maintenance of the rolling stock and equipment necessary and sufficient for handlingUsersequivalentto110%oftheAveragePHPDTetc.
Major obligations of the Government are –
(a) providing required constructible right of way for construction of rail system and land required for construction of depots and transit oriented development
(b) providing reasonable support and assistance in procuring applicable permits required for construction
(c) providing reasonable assistance in obtaining access to all necessary infrastructure facilities and utilities
(d) obligations relating to competing facilities
(e) obligations relating to supply of electricity etc.
Classification of service arrangement
Intangible assets have been recognised towards rights to charge the users of the utility
Construction revenue recognised
R 512.75 crore (previous year: R 387.33crore) [included in Note 47 (a) above]
NOTE [48]
Exceptionalitemfor2018-19representsrecognitionofcertaincustomerdueswhichwerewrittenoffearliersubsequentlyconsideredrecoverable.
Notes forming part of the Consolidated Financial Statements (contd.)NOTE [47] (contd.)

548
NOTES FORMING PART OF THE CONSOLIDATED FINANCIAL STATEMENTS ANNUAL REPORT 2019-20
NOTE [49]
Disclosure pursuant to Ind AS 1 ”Presentation of financial statements“:
(a) Current assets expected to be recovered within twelve months and after twelve months from the reporting date:
v crore
Sr. No.
Particulars
Note As at 31-3-2020 As at 31-3-2019
Within twelve
months
After twelve
monthsTotal
Within twelve
months
After twelve
monthsTotal
1 Inventories 11 3637.58 2109.07 5746.65 5318.60 1095.33 6413.93
2 Trade receivables 13 40284.22 447.30 40731.52 36453.46 392.41 36845.87
3 Other loans 17 716.00 – 716.00 625.59 1.10 626.69
4 Other financial assets 18 2926.52 1.35 2927.87 2551.25 – 2551.25
5 Other current assets 19 49689.89 8969.80 58659.69 44772.56 7370.50 52143.06
(b) Current liabilities expected to be settled within twelve months and after twelve months from the reporting date:
v crore
Sr. No.
Particulars
Note As at 31-3-2020 As at 31-3-2019
Within twelve
months
After twelve
monthsTotal
Within twelve
months
After twelve
monthsTotal
1 Lease liability 374.37 50.58 424.95 – – –
2 Trade payables:
Due to micro enterprises and small enterprises 423.25 56.26 479.51 252.96 8.16 261.12
Due to others 28 41695.77 1468.65 43164.42 41583.63 1150.06 42733.69
3 Other financial liabilities 29 4902.41 20.82 4923.23 4542.62 80.16 4622.78
4 Other current liabilities 30 25575.15 5241.52 30816.67 26333.88 4832.67 31166.55
5 Provisions 31 2536.17 214.68 2750.85 2270.39 173.04 2443.43
Notes forming part of the Consolidated Financial Statements (contd.)

549
NOTE [50]
Disclosure pursuant to Ind AS 7 “Statement of Cash Flows” - Changes in liabilities arising from financing activities:
v crore
Sr. No.
Particulars
Non-current
borrowings (Note 22)
Current borrowings (Note26)
Current maturities
of long term
borrowings (Note 27)
Non-current
lease liability
Current lease
liability
Total
a Balanceasat1-4-2018 72914.76 19331.85 15277.47
NA
107524.08
b Changes from financing cash flows 8493.76 7765.14 1606.44 17865.34
c The effect of changes in foreign exchange rates 46.45 210.74 240.30 497.49
d Interest accrued (net of interest paid) (250.03) 0.11 (81.82) (331.74)
e Other changes (transfer within categories) (7084.15) 1916.00 5168.15 –
f Balance as at 31-3-2019 (f = a to e) 74120.79 29223.84 22210.54 – – 125555.17
g TransitionimpactofIndAS116 (0.06) – – 876.58 298.48 1175.00
h Additions to lease liability – – – 380.66 279.57 660.23
i Changes from financing cash flows 29105.80 4915.20 (20203.40) (58.66) (199.37) 13559.57
j The effect of changes in foreign exchange rates 391.81 246.68 157.81 41.25 4.61 842.16
k Interest accrued (net of interest paid) (142.63) 696.56 399.10 – – 953.03
l Other changes (transfer within categories) (21145.53) – 21145.53 (58.90) 58.90 –
m Conversion to equity – – (54.81) – – (54.81)
n De-recognition of lease liability – – – (15.17) (1.12) (16.29)
o Liabilities classified as held for sale – (61.26) – – (17.57) (78.83)
p Addition on account of business combination 1.15 – – 575.84 1.45 578.44
q Balance as at 31-3-2020 (q = f to p) 82331.33 35021.02 23654.77 1741.60 424.95 143173.67
Amounts reported in Statement of Cash Flows under financing activities -v crore
Sr. No. Particulars 2019-20 2018-19
a Proceeds from non-current borrowings 42587.43 24181.62
b Repayment of non-current borrowings (33685.03) (14081.42)
c Proceeds from other borrowings (net) 4915.20 7765.14
d Repayment of lease liability (258.03) –
e Total changes from financing cash flows (e = a to d) 13559.57 17865.34
Notes forming part of the Consolidated Financial Statements (contd.)

550
NOTES FORMING PART OF THE CONSOLIDATED FINANCIAL STATEMENTS ANNUAL REPORT 2019-20
NOTE [51]
Disclosure pursuant to Ind AS 12 “Income Taxes”:(a) Major components of tax expense/(income):
v croreSr. No.
Particulars2019-20 2018-19
Consolidated Statement of Profit and Loss:(a) Profit and Loss section:
(i) Current income tax: Current income tax expense 3983.86 5001.69 Effect of previously unrecognised tax losses and tax offsets used during the current year (148.77) (567.92) Tax expense in respect of earlier years (80.96) 259.55
3754.13 4693.32(ii) Deferred tax: Tax expense on origination and reversal of temporary differences (251.71) (349.72) Effect of previously unrecognised tax losses and tax offsets on which deferred tax benefit is recognised (752.38) (0.27) Effect on deferred tax balances due to the change in income tax rate 741.84 –
(262.25) (349.99)Income tax expense/(income) reported in the consolidated Statement of Profit and Loss [(i)+(ii)] 3491.88 4343.33Income tax expense attributable to:Profit from continuing operations 3263.20 4067.09Profit from discontinued operations 228.68 276.24
3491.88 4343.33(b) Other comprehensive income section:
(i) Items not to be reclassified to profit or loss in subsequent periods: (A) Current tax expense/(income): On re-measurement of defined benefit plans (49.19) (11.37)
(49.19) (11.37) (B) Deferred tax expense/(income): On re-measurement of defined benefit plans (1.41) 0.39
(1.41) 0.39 (ii) Items to be reclassified to profit or loss in subsequent periods: (A) Current tax expense/(income): On gain/(loss) on cash flow hedges other than mark to market 36.29 (88.36) On foreign currency translation – 0.49
36.29 (87.87) (B) Deferred tax expense/(income): Net gain/(loss) on cost of hedging reserve (8.14) 9.31 On mark to market gain/(loss) on cash flow hedges (370.71) (18.33) On gain/(loss) on fair value of debt securities 19.46 (7.61) On foreign currency translation (4.45) 2.76
(363.84) (13.87)Income tax expense/(income) reported in the other comprehensive income [(i)+(ii)] (378.15) (112.72)
(c) Retained earnings:Deferred tax (31.03) (606.15)Income tax expense/(income) reported in retained earnings (31.03) (606.15)
Notes forming part of the Consolidated Financial Statements (contd.)

551
(b) Reconciliation of income tax expense and accounting profit multiplied by domestic tax rate applicable in India:
v croreSr. No. Particulars 2019-20 2018-19(a) Profit before tax from:
Continuing operations 13430.95 13735.34 Discontinued operations 883.25 845.57
14314.20 14580.91(b) CorporatetaxrateasperIncometaxAct,1961 25.17% 34.94%(c) Tax on accounting profit [(c)=(a)*(b)] 3602.60 5095.16(d) (i) Tax on Income exempt from tax:
Dividend income and interest on tax free bonds (7.08) (69.75)(ii) Tax on expense not tax deductible: (A) Corporate Social Responsibility expenses 69.39 60.10 (B) Expenses in relation to exempt income 80.04 48.58 (C) Tax on employee perquisites borne by the Group 2.08 1.57 (iii) WeighteddeductiononResearch&Developmentexpenditureanddeductionu/s80IA (0.76) (151.25)(iv) Tax effect on impairment and fair valuation losses recognised on which deferred tax
asset is not recognised (6.83) 168.15(v) Effect of previously unrecognised tax losses and unutilised tax credits used to reduce
tax expense (856.79) (773.88)(vi) Tax effect of losses of current year on which no deferred tax benefit is recognised 106.56 580.92(vii) Effect of tax paid on foreign source income which is exempt from tax in India (254.55) (321.18)(viii) Effect on deferred tax due to change in income tax rate 741.84 –(ix) Effect of tax benefit on business combination under common control (164.47) (228.35)(x) Tax effect on various other Items 179.85 (66.74)Total effect of tax adjustments [(i) to (x)] (110.72) (751.83)
(e) Tax expense recognised during the year[(e)=(c)-(d)] 3491.88 4343.33(f) Effective tax rate [(f)=(e)/(a)] 24.39% 29.79%
TheParentCompanyandsomeofthesubsidiarieshaveoptedtopaythetaxundersection115BAAoftheIncomeTaxAct,1961.Accordingly,(a)theprovisionforcurrentanddeferredtaxhasbeendeterminedattherateof25.17%,(b)thedeferredtaxassetsanddeferredtaxliabilitiesasonApril1,2019havebeenrestatedattherateof25.17%and(c)theunutilisedcreditforminimumalternate tax as on April 1, 2019 has been written-off.
(c) (i) Unused tax losses and unused tax credits for which no deferred tax asset is recognised in Balance Sheet:
ParticularsAs at 31-3-2020 As at 31-3-2019v crore Expiry year v crore Expiry year
Tax losses (Business loss and unabsorbed depreciation)- Amount of losses having expiry 3554.29 FY 2021-35 3615.27 FY 2020-34- Amount of losses having no expiry 10425.08 8084.24Tax losses (Capital loss) 614.58 FY2021-28 3901.55 FY 2020-27Unused tax credits [Minimum Alternate Tax (MAT) credit not
recognised] – 199.12 FY 2029-34Total 14593.95 15800.18
Notes forming part of the Consolidated Financial Statements (contd.)NOTE [51] (contd.)

552
NOTES FORMING PART OF THE CONSOLIDATED FINANCIAL STATEMENTS ANNUAL REPORT 2019-20
(ii) Unrecognised deductible temporary differences for which no deferred tax asset is recognised in Balance Sheet: v crore
Sr. No. Particulars As at
31-3-2020As at
31-3-2019(a) Towards provision for diminution in value of investments 628.25 783.94(b) Arising out of upward revaluation of tax base of assets (on account of indexation
benefit) 2718.10 2491.23(c) Other items giving rise to temporary differences 78.08 78.08
Total 3424.43 3353.25
(d) Major components of deferred tax liabilities and deferred tax assets: v crore
Particulars
Deferred tax liabilities/
(assets) as at 31-3-2019
Charge/(credit) to
retained earnings
Charge/(credit) to Statement
of Profit and Loss
Effect due to acquisition/
disposal
Classified as held for
sale
Charge/(credit) to other
comprehensive income
Debit/(credit) to hedge
reserve (other than through
OCI)
Reversal of deferred tax
asset on DDT credit utilised
during the year
Exchange difference
Deferred tax liabilities/
(assets) as at 31-3-2020
Deferred tax liabilities:- Difference between book base and tax
base of property, plant & equipment, investment property and intangible assets 1663.57 – (242.14) – – – – – – 1421.43
- Disputed statutory liabilities paid and claimed as deduction for tax purposes but not debited to Statement of Profit and Loss 157.21 – (23.55) – – – – – – 133.66
- Gain on derivative transactions to be offered for tax purposes in the year of transfer/settlement 70.71 – – – – (68.68) – – – 2.03
- Other items giving rise to temporary differences (401.53) – (217.84) 1170.38 (19.72) – – – (1.87) 529.42
Deferred tax liabilities: 1489.96 – (483.53) 1170.38 (19.72) (68.68) – – (1.87) 2086.54Offsetting of deferred tax liabilities with
deferred tax (assets) (1178.83) (633.50)Net deferred tax liabilities 311.13 1453.04 Deferred tax (assets):- Provision for doubtful debts, loans &
advances and contract assets (2206.94) – 470.09 (5.03) – – – – – (1741.88)- Unpaid statutory liabilities (291.32) – (63.40) – – (1.13) – – – (355.85)- Unabsorbed depreciation (283.03) – 86.50 – – – – – – (196.53)- Carried forward tax losses (119.18) – (737.86) (2.15) – – – – – (859.19)- Unutilised MAT credit (793.84) – 480.86 – 3.98 – – – – (309.00)- Loss on derivative transactions to be
claimed for tax purposes in the year of transfer/settlement 40.08 – 9.13 – – (280.44) 0.07 – – (231.16)
- Difference between book base and tax base of property, plant & equipment, investment property and intangible assets 14.66 – (4.12) (8.59) 0.14 – – – – 2.09
- Other items giving rise to temporary differences (958.19) (31.03) (19.92) (27.55) 16.77 (15.00) – 248.03 (1.67) (788.56)
Deferred tax (assets): (4597.76) (31.03) 221.28 (43.32) 20.89 (296.57) 0.07 248.03 (1.67) (4480.08)Offsetting of deferred tax (assets) with
deferred tax liabilities 1178.83 633.50Net deferred tax (assets) (3418.93) (3846.58)Net deferred tax liability/(assets) (3107.80) (31.03) (262.25) 1127.06 1.17 (365.25) 0.07 248.03 (3.54) (2393.54)
Notes forming part of the Consolidated Financial Statements (contd.)NOTE [51] (contd.)

553
NOTE [52]
Disclosure pursuant to Ind AS 19 “Employee Benefits” [Note 1(II)(p)]:
(a) Defined contribution plans: Amount of R 463.20crore(previous year: R 403.86crore) is recognised as an expense. Out of above, R 443.18crore(previous year: R 386.24crore) is included in “employee benefit expense” [Note 37] and R 19.61crore(previous year: R 16.82crore) pertains to discontinued operations in the Statement of Profit and Loss and R 0.41 crore (previous year: R 0.80crore) has been capitalised.
(b) Defined benefit plans:
(i) The amounts recognised in Balance Sheet are as follows:
v crore
Particulars
Gratuity plan Post-retirement medical benefit plan
Pension plan Trust-managed provident fund plan
As at 31-3-2020
As at 31-3-2019
As at 31-3-2020
As at 31-3-2019
As at 31-3-2020
As at 31-3-2019
As at 31-3-2020
As at 31-3-2019
A) Present value of defined benefit obligation– Wholly funded 1051.92 753.52 – – – – 4671.90 4090.42 – Wholly unfunded 233.47 254.53 340.27 241.63 369.12 337.28 – –
1285.39 1008.05 340.27 241.63 369.12 337.28 4671.90 4090.42 Less: Fair value of plan assets 851.04 649.28 – – – – 4960.42 4128.60 Less: Unrecognised past service costs – – – – – – – – Add: Amount not recognised as an asset
[limit in para 64(b)] 1.40 3.24 – – – – 6.34 3.38 Amount to be recognised as liability or (asset) 435.75 362.01 340.27 241.63 369.12 337.28 (282.18) (34.80)
B) Amounts reflected in the Balance SheetLiabilities 438.09 364.96 340.27 241.63 369.12 337.28 51.82 46.33 Assets (2.34) (2.95) – – – – – (0.10) Net liability/(asset) 435.75 362.01 340.27 241.63 369.12 337.28 51.82 46.23 Net liability/(asset) - Current 435.75 362.01 21.61 14.97 29.49 28.92 51.82 46.23 Net liability/(asset) - Non-current – – 318.66 226.66 339.63 308.36 – –
(ii) The amounts recognised in Statement of Profit and Loss are as follows:
v crore
ParticularsGratuity plan Post-retirement medical
benefit planPension plan Trust-managed
provident fund plan2019-20 2018-19 2019-20 2018-19 2019-20 2018-19 2019-20 2018-19
1 Current service cost 164.01 149.50 22.41 20.01 3.57 3.14 157.67 $ 136.98 $2 Interest cost 62.53 53.22 17.65 16.71 24.31 24.22 357.39 314.71 3 Interest income on plan assets (50.73) (44.24) – – – – (357.39) (314.71)4 Actuarial losses/(gains) - Difference
between actual return on plan assets and interest income (21.53) 5.74 – – – – (253.37) (18.86)
5 Actuarial losses/(gains) - Others 117.60 28.77 83.68 (5.40) 26.24 4.57 – –6 Past service cost 0.17 – – 0.05 – 0.63 – –7 Actuarial gain/(loss) not recognised in
books – – – – – – 253.37 18.86 8 Adjustment for earlier years – 1.29 – – – – – – 9 Effect of the limit in para 64(b) (0.33) (2.76) – – – – – – 10 Translation adjustments (2.14) 1.22 – – – – – – 11 Amount capitalised out of the above (0.34) (1.19) (0.03) (0.01) – – – –
Total (1 to 11) 269.24 191.55 123.71 31.36 54.12 32.56 157.67 136.98
Notes forming part of the Consolidated Financial Statements (contd.)

554
NOTES FORMING PART OF THE CONSOLIDATED FINANCIAL STATEMENTS ANNUAL REPORT 2019-20
v crore
ParticularsGratuity plan Post-retirement medical
benefit planPension plan Trust-managed
provident fund plan2019-20 2018-19 2019-20 2018-19 2019-20 2018-19 2019-20 2018-19
I. Amount included in “Employee benefits expense” 154.25 144.75 21.51 20.93 3.57 3.77 150.74 130.86
II. Amount included as part of “Manufacturing, construction and operating expenses” 0.64 0.31 – – – – – –
III. Amount included as part of “Finance costs” 10.54 7.47 17.65 15.00 24.31 24.22 – –
IV. Amount included as part of “Other comprehensive income” 96.02 31.12 83.68 (5.40) 26.24 4.57 – –
V. Amount included in “Profit from discontinued operations” 7.79 7.90 0.87 0.83 – – 6.93 6.12 Total (I+II+III+IV+V) 269.24 191.55 123.71 31.36 54.12 32.56 157.67 136.98 Actual return on plan assets 72.26 38.50 – – – – 610.76 333.57
(iii) The changes in the present value of defined benefit obligation representing reconciliation of opening and closing balances thereof are as follows:
v crore
Particulars
Gratuity plan Post-retirement medical benefit plan
Pension plan Trust-managed provident fund plan
As at 31-3-2020
As at 31-3-2019
As at 31-3-2020
As at 31-3-2019
As at 31-3-2020
As at 31-3-2019
As at 31-3-2020
As at 31-3-2019
Opening balance of the present value of defined benefit obligation 1008.05 892.09 241.63 222.16 337.28 326.68 4090.42 3633.31 Add: Current service cost 164.01 149.50 22.41 20.01 3.57 3.14 157.67 $ 136.98 $ Add: Interest cost 62.53 53.22 17.65 16.71 24.31 24.22 357.39 314.71 Add: Contribution by plan participants i) Employer – – – – – – – – ii) Employee – – – – – – 414.78 352.78 iii) Transfer-in/(out) – – – – – – – – Add/(less): Actuarial losses/(gains) arising
from changes in - i) Demographic assumptions (1.98) 6.32 6.78 (11.43) (0.04) (15.00) – – ii) Financial assumptions 93.00 11.66 40.13 8.40 24.41 7.60 – – iii) Experience adjustments 26.26 10.79 36.76 (2.37) 1.87 11.96 – – Less: Benefits paid (158.46) (109.45) (12.52) (11.85) (22.28) (21.96) (483.54) (477.56)Less: Unfunded liability classified as held
for sale (23.40) – (12.57) – – – – – Add: Past service cost 0.17 – – – – 0.64 – – Add: Liabilities assumed on transfer of
employees 0.46 (15.31) – – – – 134.63 128.71 Add: Business combination/acquisition 95.16 0.19 – – – – – – Add: Adjustment for earlier years (0.17) 1.48 – – – – (0.07) – Add/(less): Translation adjustments 19.76 7.56 – – – – 0.62 1.49 Closing balance of the present value of defined benefit obligation 1285.39 1008.05 340.27 241.63 369.12 337.28 4671.90 4090.42
Notes forming part of the Consolidated Financial Statements (contd.)NOTE [52] (contd.)

555
(iv) Changes in the fair value of plan assets representing reconciliation of the opening and closing balances thereof are as follows:v crore
Particulars
Gratuity plan Trust-managed provident fund plan
As at 31-3-2020
As at 31-3-2019
As at 31-3-2020
As at 31-3-2019
Opening balance of the fair value of the plan assets 649.28 610.99 4128.60 3676.19
Add: Interest income on plan assets* 50.73 44.24 357.39 314.71
Add/(less): Actuarial gains/(losses) - Difference between actual return on plan assets and interest income 21.53 (5.74) 253.37 18.86
Add: Contribution by the employer 136.91 69.11 160.88 132.76
Add: Contribution by plan participants – – 408.23 334.82
Add: Assets assumed on transfer of employees 0.10 – 135.02 128.98
Add: Business combination/disposal (net) 63.80 – – –
Less: Benefits paid (71.31) (69.16) (483.54) (477.56)
Add: Adjustment for earlier years – – 0.47 0.18
Less: Settlements – (0.16) – (0.34)
Closing balance of the plan assets 851.04 649.28 4960.42 4128.60
Notes: The fair value of the plan assets under the trust managed provident fund plan has been determined at amounts based on their value at the time of redemption, assuming a constant rate of return to maturity.
* Basis used to determine interest income on plan assets:
The Trust formed by the Parent Company and a few subsidiaries manage the investments of provident funds and gratuity fund. Interest income on plan assets is determined by multiplying the fair value of the plan assets by the discount rate stated in (vii) below both determined at the start of the annual reporting period.
The Group expects to fund R 168.82crore(previous year: R 111.90 crore) towards its gratuity plan and R 174.71 crore (previous year: R 143.83crore) towards its trust-managed provident fund plan during the year 2020-21.
$ Employer’scontributiontoprovidentfund.
(v) The fair value of major categories of plan assets are as follows:
v crore
Particulars
Gratuity plan
As at 31-3-2020 As at 31-3-2019
Quoted Unquoted Total Quoted Unquoted Total
Cash and cash equivalents – 3.06 3.06 – 1.78 1.78
Equity instruments 11.62 – 11.62 15.81 – 15.81
Debt instruments - Corporate bonds 244.33 – 244.33 193.00 – 193.00
Debt instruments - Central Government bonds 170.41 – 170.41 162.66 – 162.66
Debt instruments - State Government bonds 92.54 – 92.54 77.63 – 77.63
Debt instruments - Public Sector Unit bonds 14.91 – 14.91 8.41 – 8.41
Mutual funds - Equity 11.62 9.35 20.97 7.20 9.88 17.08
Mutual funds - Debt – – – – 4.75 4.75
Notes forming part of the Consolidated Financial Statements (contd.)NOTE [52] (contd.)

556
NOTES FORMING PART OF THE CONSOLIDATED FINANCIAL STATEMENTS ANNUAL REPORT 2019-20
Notes forming part of the Consolidated Financial Statements (contd.)NOTE [52] (contd.)
v crore
Particulars
Gratuity plan
As at 31-3-2020 As at 31-3-2019
Quoted Unquoted Total Quoted Unquoted Total
Mutual funds - Others 0.25 2.62 2.87 – – –
Special deposit scheme – 2.60 2.60 – 1.49 1.49
Fixed deposits – 3.00 3.00 – 1.85 1.85
Insurer managed fund – 277.54 277.54 – 163.17 163.17
Other (payables)/receivables – 7.19 7.19 – 1.65 1.65
Closing balance of the plan assets 545.68 305.36 851.04 464.71 184.57 649.28
v crore
Particulars
Trust-managed provident fund plan
As at 31-3-2020 As at 31-3-2019
Quoted Unquoted Total Quoted Unquoted Total
Cash and cash equivalents – 24.63 24.63 – 7.28 7.28
Equity instruments 16.09 – 16.09 0.06 – 0.06
Debt instruments - Corporate bonds 1391.85 – 1391.85 831.42 – 831.42
Debt instruments - Central Government bonds 1069.27 – 1069.27 956.71 – 956.71
Debt instruments - State Government bonds 1236.85 – 1236.85 988.14 – 988.14
Debt instruments - Public Sector Unit bonds 774.67 – 774.67 890.85 – 890.85
Mutual funds - Equity 77.90 66.76 144.66 56.48 75.28 131.76
Mutual funds - Debt 0.09 – 0.09 0.34 34.09 34.43
Mutual funds - Others 10.84 0.04 10.88 – 1.98 1.98
Special deposit scheme – 271.69 271.69 – 271.20 271.20
Fixed deposits – 2.13 2.13 – 2.60 2.60
Other (payables)/receivables 13.26 4.35 17.61 7.99 4.18 12.17
Closing balance of the plan assets 4590.82 369.60 4960.42 3731.99 396.61 4128.60
(vi) The average duration of the defined benefit obligation at the end of the reporting period is as follows:
Plans As at 31-3-2020 As at 31-3-2019
1. Gratuity 6.83 6.16
2. Post-retirement medical benefit plan 14.60 14.60
3. Pension plan 7.81 7.70

557
(vii) Principal actuarial assumptions at the Balance Sheet date (expressed as weighted average):
Plans As at 31-3-2020 As at 31-3-2019
(A) Discount rate:
(a) Gratuity plan 6.48% 7.31%
(b) Pension plan 6.48% 7.31%
(c) Post-retirement medical benefit plan 6.48% 7.31%
(B) Annual increase in healthcare costs (see note below) 5.00% 5.00%
(C) Salary growth rate:
(a) Gratuity plan 5.77% 5.12%
(b) Pension plan 7.92% 7.00%
(D) Attrition Rate:
(a) Forgratuityplan,theattritionratevariesfrom1%to25%(previousyear:1%to25%)for various age groups.
(b) Forpensionplan,theattritionratevariesfrom0%to2%(previousyear:0%to2%) for various age groups.
(c) Forpost-retirementmedicalbenefitplan,theattritionratevariesfrom1%to19%(previousyear:1%to11%) for various age groups.
(E) The estimates of future salary increases, considered in actuarial valuation, take into account inflation, seniority, promotion and other relevant factors, such as supply and demand in the employment market.
(F) The interest payment obligation of trust-managed provident fund is assumed to be adequately covered by the interest income on long term investments of the fund. Any shortfall in the interest income over the interest obligation is recognised immediately in the Statement of Profit and Loss as actuarial losses.
(G) The obligation of the Group under the post-retirement medical benefit plan is limited to the overall ceiling limits. At present, healthcare cost, as indicated in the principal actuarial assumption given above, has been assumed to increase at 5%p.a.
(H) One percentage point change in actuarial assumptions would have the following effects on defined benefit obligation:
v crore
ParticularsEffectof1%increase Effectof1%decrease
As at 31-3-2020
As at 31-3-2019
As at 31-3-2020
As at 31-3-2019
Gratuity
Impact of change in salary growth rate 86.20 58.64 (76.84) (53.14)
Impact of change in discount rate (76.50) (51.99) 86.74 58.35
Post-retirement medical benefit plan
Impact of change in health care cost 27.19 26.97 (22.27) (22.03)
Impact of change in discount rate (46.36) (33.66) 59.00 41.66
Company pension plan
Impact of change in discount rate (27.51) (24.45) 31.72 28.13
(viii) Characteristics of defined benefit plans and associated risks:
(A) Gratuity plan:
The Parent Company operates gratuity plan through a trust wherein every employee is entitled to the benefit equivalent to fifteen days salary last drawn for each completed year of service. The same is payable on termination of service or
Notes forming part of the Consolidated Financial Statements (contd.)NOTE [52] (contd.)

558
NOTES FORMING PART OF THE CONSOLIDATED FINANCIAL STATEMENTS ANNUAL REPORT 2019-20
retirement whichever is earlier. The benefit vests after five years of continuous service. The company’s scheme is more favourable as compared to the obligation under The Payment of Gratuity Act, 1972.
The defined benefit plans for gratuity of the Parent Company and material domestic subsidiary companies are administered by separate gratuity funds that are legally separate from the Parent Company and the material domestic subsidiary companies. The trustees nominated by the Group are responsible for the administration of the plans. There are no minimum funding requirements of these plans. The funding of these plans is based on gratuity fund’s actuarial measurement framework set out in the funding policies of the plan. These actuarial measurements are similar compared to the assumptions set out in (vii) supra. An insignificant portion of the gratuity plan of the group attributable to subsidiary companies is administered by the respective subsidiary companies and is funded through insurer managed funds. A part of the gratuity plan is unfunded and managed within the Group. Further, the unfunded portion also includes amounts payable in respect of the Group’s foreign operations which result in gratuity payable to employees engaged as per the local laws of country of operation. Employees do not contribute to any of these plans.
(B) Post-retirement medical care plan:
The post-retirement medical benefit plan provides for reimbursement of health care costs to certain categories of employees post their retirement. The reimbursement is subject to an overall ceiling sanctioned based on cadre of the employee at the time of retirement. The plan is unfunded. Employees do not contribute to the plan.
(C) Pension plan:
In addition to contribution to state-managed pension plan (EPS scheme), the Group operates a post retirement pension scheme, which is discretionary in nature for certain cadres of employees. The quantum of pension depends on the cadre of the employee at the time of retirement. The plan is unfunded. Employees do not contribute to the plan.
(D) Trust-managed provident fund plan:
The Parent Company and a few subsidiaries manage provident fund plan through a provident fund trust for its employees which is permitted under The Employees’ Provident Funds and Miscellaneous Provisions Act, 1952. The plan mandates contribution by employer at a fixed percentage of employee’s salary. Employees also contribute to the plan at a fixed percentage of their salary as a minimum contribution and additional sums at their discretion. The plan guarantees interest at the rate notified by the provident fund authority. The contribution by employer and employee together with interest are payable at the time of separation from service or retirement whichever is earlier. The benefit under this plan vests immediately on rendering of service.
The interest payment obligation of trust-managed provident fund is assumed to be adequately covered by the interest income on long term investments of the fund. Any shortfall in the interest income over the interest obligation is recognised immediately in the Statement of Profit and Loss as actuarial loss. Any loss/gain arising out of the investment risk and actuarial risk associated with the plan is also recognised as expense or income in the period in which such loss/gain occurs.
All the above defined benefit plans expose the Group to general actuarial risks such as interest rate risk and market (investment) risk.
NOTE [53]
Disclosure pursuant to Ind AS 20 “Accounting for Government Grants and Disclosure of Government Assistance”:
The Group’s exports qualify for various export benefits offered in the form of duty credit scrips under foreign trade policy framed by Department General of Foreign Trade India (DGFT). Income/reduction from underlying expenses recognised towards such export incentives and duty drawback amounts to R 253.61crore(previous year: R 252.91crore).
Notes forming part of the Consolidated Financial Statements (contd.)NOTE [52] (contd.)

559
NOTE [54]
Disclosure of related parties/related party transactions pursuant to Ind AS 24 “Related Party Disclosures”
(a) List of related parties: (i) Name of associate companies with whom transactions were carried out during the year:
Associate Companies:1 L&T-Chiyoda Limited 2 Magtorq Private Limited3 L&T Camp Facilities LLC 4 Larsen & Toubro Qatar & HBK Contracting Co. WLL
(ii) Name of joint venture companies with whom transactions were carried out during the year:
Joint Venture Companies:1 L&T Interstate Road Corridor Limited 2 L&T-Sargent & Lundy Limited3 Ahmedabad - Maliya Tollway Limited 4 L&T Halol-Shamlaji Tollway Limited5 L&T Chennai-Tada Tollway Limited 6 Krishnagiri Walajahpet Tollway Limited*7 Beawar Pali Pindwara Tollway Limited* 8 Devihalli Hassan Tollway Limited*9 L&T Rajkot-Vadinar Tollway Limited 10 L&T Howden Private Limited
11 L&T Deccan Tollways Limited 12 L&T Sapura Shipping Private Limited13 L&T Samakhiali Gandhidham Tollway Limited 14 L&T Sapura Offshore Private Limited15 Kudgi Transmission Limited 16 L&T-GulfPrivateLimited@17 L&T Sambalpur- Rourkela Tollway limited 18 L&T-MHPS Boilers Private Limited19 L&T Infrastructure Development Projects Limited 20 L&T-MHPS Turbine Generators Private Limited21 Panipat Elevated Corridor Limited 22 Raykal Aluminium Company Private Limited23 Krishnagiri Thopur Toll Road Limited* 24 L&T Special Steels and Heavy Forgings Private Limited25 Western Andhra Tollways Limited* 26 PNG Tollway Limited27 Vadodara Bharuch Tollway Limited 28 L&T Kobelco Machinery Private Limited **29 L&T Transportation Infrastructure Limited 30 L&T MBDA Missile Systems Limited31 L&T Hydrocarbon Caspian LLC
*TheGrouphassolditsstakeonMay4,2018 ** The Group has sold its stake on April 17, 2019 @Reclassifiedassubsidiaryw.e.f.November20,2019duetopurchaseofadditionalstake.
(iii) Name of post-employment benefit plans with whom transactions were carried out during the year:
Provident Fund Trusts:1 Larsen & Toubro Officers & Supervisory Staff Provident Fund2 Larsen & Toubro Limited Provident Fund of 19523 Larsen & Toubro Limited Provident Fund4 L&T Kansbahal Officers & Supervisory Provident Fund5 L&T Kansbahal Staff & Workmen Provident Fund6 L&T Construction Equipment Provident Fund Trust7 L&T Valves Employees Provident Fund
Gratuity Trusts:1 Larsen & Toubro Officers & Supervisors Gratuity Fund2 Larsen & Toubro Gratuity Fund3 L&T Technology Services Limited Employee Group Gratuity Scheme 4 L&T Shipbuilding Limited Employees Group Assurance Scheme5 Nabha Power Limited Employees’ Group Gratuity Assurance Scheme6 L&T Hydrocarbon Engineering Ltd Group Gratuity Scheme7 Mindtree Limited Employees Gratuity Fund Trust *
* w.e.f. July 2, 2019
Superannuation Trust Larsen & Toubro Limited Senior Officers’ Superannuation Scheme
Notes forming part of the Consolidated Financial Statements (contd.)

560
NOTES FORMING PART OF THE CONSOLIDATED FINANCIAL STATEMENTS ANNUAL REPORT 2019-20
(iv) Name of Key Management Personnel (of the parent company) and their relatives with whom transactions were carried out during the year:
(A) Executive Directors:1 Mr. S. N. Subrahmanyan (Chief Executive Officer and
Managing Director)2 Mr. R. Shankar Raman (Whole-time Director and
Chief Financial Officer)3 Mr. Shailendra Roy (Whole-time Director) 4 Mr. D. K. Sen (Whole-time Director)5 Mr. M. V. Satish (Whole-time Director) 6 Mr. J.D. Patil (Whole-time Director)
(B) Independent/Non-executive Directors:1 Mr. A.M. Naik (Group Chairman) 2 Mr. M. M. Chitale3 Mr. Subodh Bhargava 4 Mr. M. Damodaran5 Mr. Vikram Singh Mehta 6 Mr. Adil Zainulbhai7 Mr. Akhilesh Gupta * 8 Mrs. Sunita Sharma9 Mr.ThomasMathewT$ 10 Mr. Ajay Shankar #
11 Mr. Subramanian Sarma 12 Mrs. Naina Lal Kidwai13 Mr. Sanjeev Aga 14 Mr. N. Kumar15 Mr. Arvind Gupta ** 16 Mr.HemantBhargava@17 Mr. Sushobhan Sarker ##
*Ceasedw.e.f.September8,2019 **Ceasedw.e.f.March26,2020 @Appointedw.e.f.May28,2018 $Ceasedw.e.f.April2,2020 #Ceasedw.e.f.May29,2020 ##Ceasedw.e.f.May2,2018
(v) Entity with common Key Management Personnel
Mindtree Foundation*
*w.e.f. September 17, 2019
(b) Disclosure of related party transactions:
v crore
Sr. No. Nature of transaction/relationship/major parties
2019-20 2018-19
Amount Amounts for major parties
Amount Amounts for major parties
(i) Purchase of goods & services (including commission paid) Joint ventures, including: 853.97 1210.35 L&T-MHPS Boilers Private Limited 587.70 779.49 L&T-MHPS Turbine Generators Private Limited 117.38 187.78 Associates, including: 249.53 162.15 L&T-Chiyoda Limited 234.65 154.52
Total 1103.50 1372.50
(ii) (A) Sale of goods/contract revenue & services Joint ventures, including: 104.31 184.85 L&T-MHPS Boilers Private Limited 96.79 168.41 Associate: – 0.13 L&T-Chiyoda Limited – 0.13
Total 104.31 184.98
(B) Reversal of sale of goods/contract revenue & services Joint ventures: 0.01 25.99 L&T Deccan Tollways Limited – 23.86 L&T Samakhiali Gandhidham Tollway Limited – 2.13 L&T-Sargent & Lundy Limited 0.01 –
Total 0.01 25.99
Notes forming part of the Consolidated Financial Statements (contd.)NOTE [54] (contd.)

561
v crore
Sr. No. Nature of transaction/relationship/major parties
2019-20 2018-19
Amount Amounts for major parties
Amount Amounts for major parties
(iii) Purchase/lease of property, plant and equipment Joint ventures: 0.20 0.54 L&T-MHPS Boilers Private Limited 0.05 – L&T-MHPS Turbine Generators Private Limited – 0.13 L&T Special Steels and Heavy Forgings Private Limited – 0.13 L&T Sapura Shipping Private Limited 0.15 0.16 L&T Kobelco Machinery Private Limited – 0.12
Total 0.20 0.54
(iv) Sale of property, plant and equipment Joint venture: 0.44 0.69 L&T-MHPS Boilers Private Limited 0.44 0.69 Key management personnel: – 6.25 Mr. Shailendra Roy – 6.25
Total 0.44 6.94
(v) Investments including subscription to equity shares and preference shares (equity portion) and other equity transactions Joint ventures: 0.33 1.18 L&T-MHPS Turbine Generators Private Limited 0.33 0.70 L&T MBDA Missile Systems Limited – 0.48
Total 0.33 1.18
(vi) Sale/Redemption of investments Joint venture: 22.42 – L&T Infrastructure Development Projects Limited 22.42 –
Total 22.42 –
(vii) Inter-corporate deposits given/(repaid) - net Joint ventures: 97.52 55.86 L&T Special Steels and Heavy Forgings Private Limited 115.21 84.48 L&T Sapura Shipping Private Limited (17.69) (28.62)
Total 97.52 55.86
(viii) Net inter-corporate borrowing taken/(repaid) Joint ventures: 57.50 – L&T MBDA Missile Systems Limited 57.50 –
Total 57.50 –
(ix) Charges paid for miscellaneous services Joint ventures, including: 9.90 6.65 L&T-Sargent & Lundy Limited 8.21 4.92 L&T-MHPS Boilers Private Limited 1.63 1.05 Associate: 7.29 0.97 L&T-Chiyoda Limited 7.29 0.97
Total 17.19 7.62
Notes forming part of the Consolidated Financial Statements (contd.)NOTE [54] (contd.)

562
NOTES FORMING PART OF THE CONSOLIDATED FINANCIAL STATEMENTS ANNUAL REPORT 2019-20
v crore
Sr. No. Nature of transaction/relationship/major parties
2019-20 2018-19
Amount Amounts for major parties
Amount Amounts for major parties
(x) Rent paid, including lease rentals under leasing arrangements Joint ventures, including: 3.49 1.24 L&T Special Steels and Heavy Forgings Private Limited 3.20 1.20
Total 3.49 1.24
(xi) Rent received, overheads recovered and miscellaneous income Joint ventures, including: 72.71 79.40 L&T-MHPS Boilers Private Limited 28.40 35.10 L&T-Sargent & Lundy Limited 11.39 11.77 L&T-MHPS Turbine Generators Private Limited 8.32 8.04 L&T Infrastructure Development Projects Limited 7.93 6.06 Associate: 18.44 23.20 L&T-Chiyoda Limited 18.44 23.20 Key management personnel: – 0.03 Mr. D. K. Sen – 0.03
Total 91.15 102.63
(xii) (A) Charges incurred for deputation of employees from related parties Joint venture: – 1.00 L&T Infrastructure Development Projects Limited – 1.00
Total – 1.00
(B) Charges recovered for deputation of employees to related parties Joint ventures, including: 5.50 7.71 L&T Infrastructure Development Projects Limited 0.66 1.62 L&T Special Steels and Heavy Forgings Private Limited 0.77 1.35 L&T Sapura Shipping Private Limited 4.08 4.13 Associate: 6.59 12.88 L&T-Chiyoda Limited 6.59 12.88
Total 12.09 20.59
(xiii) Dividend received Joint ventures: 12.53 19.44 L&T-MHPS Boilers Private Limited 11.94 11.94 L&T Kobelco Machinery Private Limited 0.59 – L&T-Sargent & Lundy Limited – 7.50
Total 12.53 19.44
(xiv) Commission received, including those under agency arrangements Joint ventures: 0.05 3.80 L&T-MHPS Boilers Private Limited 0.05 0.05 L&T Kobelco Machinery Private Limited – 3.75
Total 0.05 3.80
Notes forming part of the Consolidated Financial Statements (contd.)NOTE [54] (contd.)
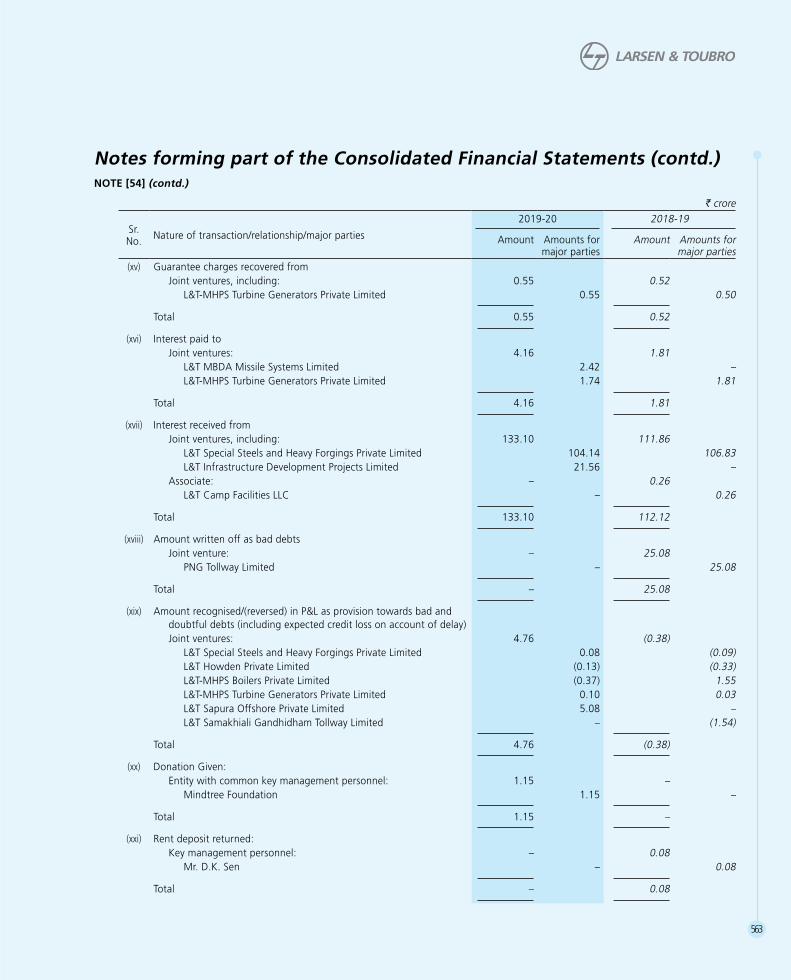
563
v crore
Sr. No. Nature of transaction/relationship/major parties
2019-20 2018-19
Amount Amounts for major parties
Amount Amounts for major parties
(xv) Guarantee charges recovered from Joint ventures, including: 0.55 0.52 L&T-MHPS Turbine Generators Private Limited 0.55 0.50
Total 0.55 0.52
(xvi) Interest paid to Joint ventures: 4.16 1.81 L&T MBDA Missile Systems Limited 2.42 – L&T-MHPS Turbine Generators Private Limited 1.74 1.81
Total 4.16 1.81
(xvii) Interest received from Joint ventures, including: 133.10 111.86 L&T Special Steels and Heavy Forgings Private Limited 104.14 106.83 L&T Infrastructure Development Projects Limited 21.56 – Associate: – 0.26 L&T Camp Facilities LLC – 0.26
Total 133.10 112.12
(xviii) Amount written off as bad debts Joint venture: – 25.08 PNG Tollway Limited – 25.08
Total – 25.08
(xix) Amount recognised/(reversed) in P&L as provision towards bad and doubtful debts (including expected credit loss on account of delay) Joint ventures: 4.76 (0.38) L&T Special Steels and Heavy Forgings Private Limited 0.08 (0.09) L&T Howden Private Limited (0.13) (0.33) L&T-MHPS Boilers Private Limited (0.37) 1.55 L&T-MHPS Turbine Generators Private Limited 0.10 0.03 L&T Sapura Offshore Private Limited 5.08 – L&T Samakhiali Gandhidham Tollway Limited – (1.54)
Total 4.76 (0.38)
(xx) Donation Given: Entity with common key management personnel: 1.15 – Mindtree Foundation 1.15 –
Total 1.15 –
(xxi) Rent deposit returned: Key management personnel: – 0.08 Mr. D.K. Sen – 0.08
Total – 0.08
Notes forming part of the Consolidated Financial Statements (contd.)NOTE [54] (contd.)

564
NOTES FORMING PART OF THE CONSOLIDATED FINANCIAL STATEMENTS ANNUAL REPORT 2019-20
v crore
Sr. No. Nature of transaction/relationship/major parties
2019-20 2018-19
Amount Amounts for major parties
Amount Amounts for major parties
(xxii) Contribution to post employment benefit plan(A) Towards Employer’s contribution to provident fund trusts, including: 165.75 142.15
Larsen & Toubro Officers & Supervisory Staff Provident Fund 152.29 129.63
Total 165.75 142.15
(B) Towards Employer’s contribution to gratuity fund trusts, including: 110.32 59.56 Larsen & Toubro Officers & Supervisors Gratuity Fund 55.65 43.35 L&T Technology Services Limited Employee Group Gratuity Scheme 17.32 13.03 Mindtree Limited Employees Gratuity Fund Trust 22.56 –
Total 110.32 59.56
(C) Towards Employer’s contribution to superannuation trust: 10.99 9.78 Larsen & Toubro Limited Senior Officers’ Superannuation Scheme 10.99 9.78
Total 10.99 9.78
“Majorparties”denoteentitiesaccountingfor10%ormoreoftheaggregateforthatcategoryoftransactionduringrespectiveperiods.
(xxiii) Compensation to Key Management Personnel (KMP):
v crore
Key Management Personnel
2019-20 2018-19
Short term employee
benefits
Post employment
benefitsTotal
Short term employee
benefits
Post employment
benefitsTotal
Executive Directors:
(a) Mr. S. N. Subrahmanyan 11.87 3.13 15.00 21.28 5.67 26.95
(b) Mr. R. Shankar Raman 7.89 2.08 9.97 14.06 3.75 17.81
(c) Mr. Shailendra Roy 5.26 1.37 6.63 9.16 2.33 11.49
(d) Mr. D. K. Sen 3.56 0.91 4.47 5.54 1.46 7.00
(e) Mr. M. V. Satish 4.60 1.18 5.78 7.43 1.95 9.38
(f) Mr. J. D. Patil 4.04 1.04 5.08 6.51 1.71 8.22
Independent/Non-Executive Directors:
(a) Mr. A. M. Naik (Group Chairman) 9.13 3.00 # 12.13 9.21 3.00 # 12.21
(b) Mr. Subramanian Sarma 16.33 – 16.33 14.00 – 14.00
(c) Other Independent/Non-Executive Directors 5.01 – 5.01 6.20 – 6.20
Total 67.69 12.71 80.40 93.39 19.87 113.26
# Represents pension
Notes forming part of the Consolidated Financial Statements (contd.)NOTE [54] (contd.)
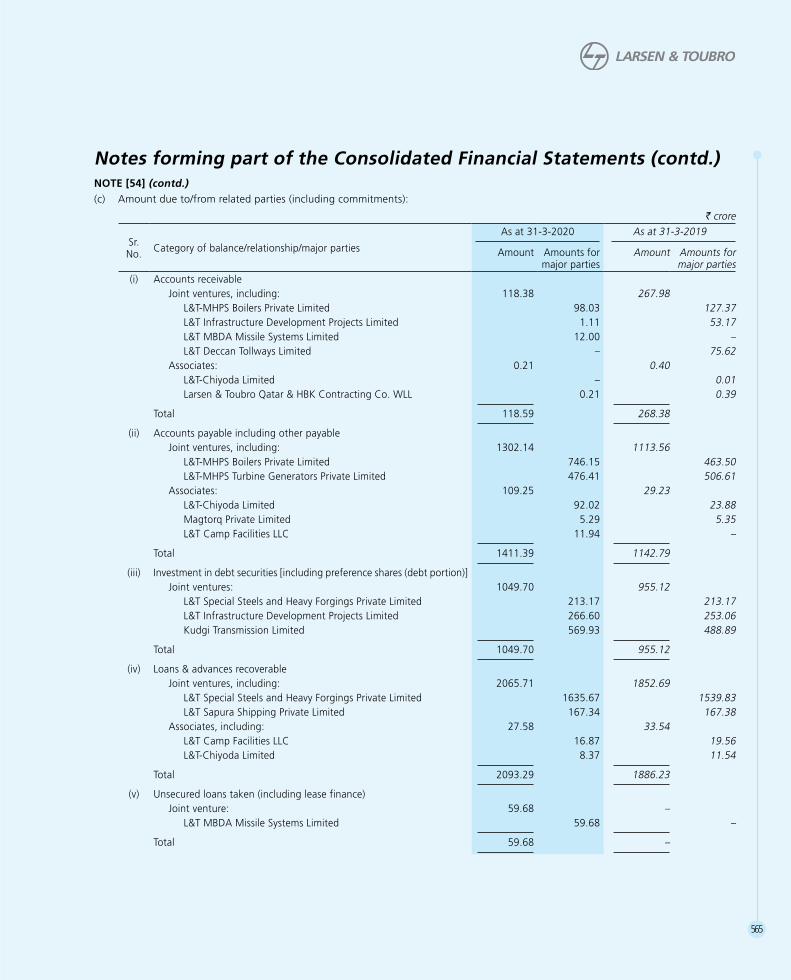
565
(c) Amount due to/from related parties (including commitments):
v crore
Sr. No. Category of balance/relationship/major parties
As at 31-3-2020 As at 31-3-2019
Amount Amounts for major parties
Amount Amounts for major parties
(i) Accounts receivable Joint ventures, including: 118.38 267.98 L&T-MHPS Boilers Private Limited 98.03 127.37 L&T Infrastructure Development Projects Limited 1.11 53.17 L&T MBDA Missile Systems Limited 12.00 – L&T Deccan Tollways Limited – 75.62 Associates: 0.21 0.40 L&T-Chiyoda Limited – 0.01 Larsen & Toubro Qatar & HBK Contracting Co. WLL 0.21 0.39
Total 118.59 268.38
(ii) Accounts payable including other payable Joint ventures, including: 1302.14 1113.56 L&T-MHPS Boilers Private Limited 746.15 463.50 L&T-MHPS Turbine Generators Private Limited 476.41 506.61 Associates: 109.25 29.23 L&T-Chiyoda Limited 92.02 23.88 Magtorq Private Limited 5.29 5.35 L&T Camp Facilities LLC 11.94 –
Total 1411.39 1142.79
(iii) Investment in debt securities [including preference shares (debt portion)] Joint ventures: 1049.70 955.12 L&T Special Steels and Heavy Forgings Private Limited 213.17 213.17 L&T Infrastructure Development Projects Limited 266.60 253.06 Kudgi Transmission Limited 569.93 488.89
Total 1049.70 955.12
(iv) Loans & advances recoverable Joint ventures, including: 2065.71 1852.69 L&T Special Steels and Heavy Forgings Private Limited 1635.67 1539.83 L&T Sapura Shipping Private Limited 167.34 167.38 Associates, including: 27.58 33.54 L&T Camp Facilities LLC 16.87 19.56 L&T-Chiyoda Limited 8.37 11.54
Total 2093.29 1886.23
(v) Unsecured loans taken (including lease finance) Joint venture: 59.68 – L&T MBDA Missile Systems Limited 59.68 –
Total 59.68 –
Notes forming part of the Consolidated Financial Statements (contd.)NOTE [54] (contd.)
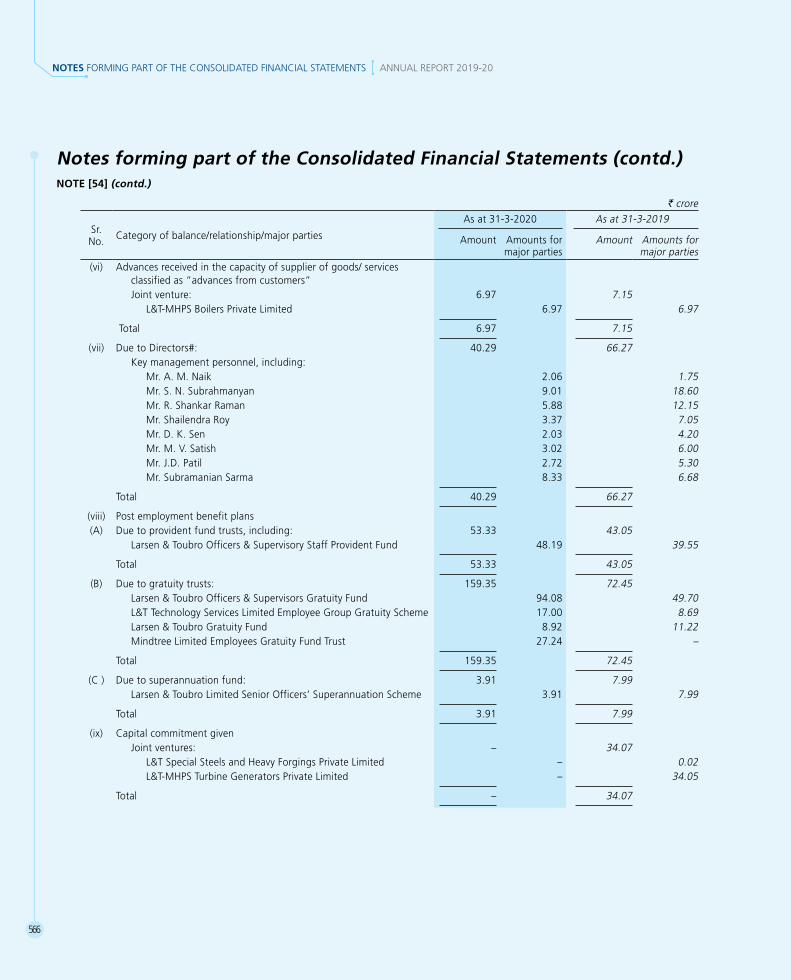
566
NOTES FORMING PART OF THE CONSOLIDATED FINANCIAL STATEMENTS ANNUAL REPORT 2019-20
v crore
Sr. No. Category of balance/relationship/major parties
As at 31-3-2020 As at 31-3-2019
Amount Amounts for major parties
Amount Amounts for major parties
(vi) Advances received in the capacity of supplier of goods/ services classified as ”advances from customers” Joint venture: 6.97 7.15 L&T-MHPS Boilers Private Limited 6.97 6.97
Total 6.97 7.15
(vii) Due to Directors#: 40.29 66.27 Key management personnel, including: Mr. A. M. Naik 2.06 1.75 Mr. S. N. Subrahmanyan 9.01 18.60 Mr. R. Shankar Raman 5.88 12.15 Mr. Shailendra Roy 3.37 7.05 Mr. D. K. Sen 2.03 4.20 Mr. M. V. Satish 3.02 6.00 Mr. J.D. Patil 2.72 5.30 Mr. Subramanian Sarma 8.33 6.68
Total 40.29 66.27
(viii) Post employment benefit plans(A) Due to provident fund trusts, including: 53.33 43.05
Larsen & Toubro Officers & Supervisory Staff Provident Fund 48.19 39.55
Total 53.33 43.05
(B) Due to gratuity trusts: 159.35 72.45 Larsen & Toubro Officers & Supervisors Gratuity Fund 94.08 49.70 L&T Technology Services Limited Employee Group Gratuity Scheme 17.00 8.69 Larsen & Toubro Gratuity Fund 8.92 11.22 Mindtree Limited Employees Gratuity Fund Trust 27.24 –
Total 159.35 72.45
(C ) Due to superannuation fund: 3.91 7.99 Larsen & Toubro Limited Senior Officers’ Superannuation Scheme 3.91 7.99
Total 3.91 7.99
(ix) Capital commitment given Joint ventures: – 34.07 L&T Special Steels and Heavy Forgings Private Limited – 0.02 L&T-MHPS Turbine Generators Private Limited – 34.05
Total – 34.07
Notes forming part of the Consolidated Financial Statements (contd.)NOTE [54] (contd.)

567
v crore
Sr. No. Category of balance/relationship/major parties
As at 31-3-2020 As at 31-3-2019
Amount Amounts for major parties
Amount Amounts for major parties
(x) Revenue commitment given Joint ventures, including: 2316.16 401.52 L&T-MHPS Boilers Private Limited 1224.92 207.56 L&T-MHPS Turbine Generators Private Limited 668.92 42.63 L&T Howden Private Limited 160.70 103.60 Associates, including: 245.94 205.99 L&T-Chiyoda Limited 220.96 186.89
Total 2562.10 607.51
(xi) Revenue commitment received Joint ventures, including: 59.70 88.31 L&T-MHPS Boilers Private Limited 15.85 – L&T Special Steels and Heavy Forgings Private Limited 5.90 0.29 L&T-MHPS Turbine Generators Private Limited 6.88 – L&T MBDA Missile Systems Limited 30.00 69.19 L&T-Gulf Private Limited – 18.77
Total 59.70 88.31
(xii) Provision for doubtful debts on outstanding balances in respect of Joint ventures, including: 23.09 23.55 L&T-MHPS Boilers Private Limited 23.00 23.37
Total 23.09 23.55
(xiii) Guarantees given on behalf of Joint ventures: 514.74 546.66 L&T-MHPS Boilers Private Limited 29.38 28.93 L&T-MHPS Turbine Generators Private Limited 394.94 427.31 L&T Special Steels and Heavy Forgings Private Limited 90.42 90.42
Total 514.74 546.66
“Majorparties”denoteentitiesaccountingfor10%ormoreoftheaggregateforthatcategoryofbalanceduringrespectiveperiods.
# includes commission due to other Non-executive directors R 3.87crore(as at 31-3-2019 : R 4.54 crore)
Note: 1. All related party contracts/arrangements have been entered on arm’s length basis.
2. The amount of outstanding balances as shown above are unsecured and will be settled/recovered in cash.
Notes forming part of the Consolidated Financial Statements (contd.)NOTE [54] (contd.)

568
NOTES FORMING PART OF THE CONSOLIDATED FINANCIAL STATEMENTS ANNUAL REPORT 2019-20
NOTE [55]
Basic and Diluted Earnings per share [EPS] computed in accordance with Ind AS 33 ”Earnings per Share”:
Particulars 2019-20 2018-19
Basic EPS
Profit after tax from continuing operations as per accounts (R crore) A 8894.46 8336.03
Profit after tax from discontinued operations as per accounts (R crore) B 654.57 569.10
Profit after tax from continuing operations & discontinued operations as per accounts (R crore) C=A+B 9549.03 8905.13
Weighted average number of equity shares outstanding D 1,40,33,69,848 1,40,20,87,033
Basic EPS from continuing operations (R) A/D 63.38 59.45
Basic EPS from discontinued operations (R) B/D 4.66 4.06
Basic EPS from continuing operations & discontinued operations (R) C/D 68.04 63.51
Diluted EPS
Profit after tax from continuing operations as per accounts (R crore) A 8894.46 8336.03
Profit after tax from discontinued operations as per accounts (R crore) B 654.57 569.10
Profit after tax from continuing operations & discontinued operations as per accounts (R crore) C=A+B 9549.03 8905.13
Weighted average number of equity shares outstanding D 1,40,33,69,848 1,40,20,87,033
Add: Weighted average number of potential equity shares on account of employee stock options E 18,52,930 24,57,688
Weighted average number of equity shares outstanding for diluted EPS F=D+E 1,40,52,22,778 1,40,45,44,721
Diluted EPS from continuing operations (R) A/F 63.29 59.35
Diluted EPS from discontinued operations (R) B/F 4.66 4.05
Diluted EPS from continuing operations & discontinued operations (R) C/F 67.95 63.40
Face value per share (R) 2 2
The following potential equity shares are anti-dilutive and are therefore excluded from the weighted average number of equity shares for the purpose of diluted earnings per share:
Particulars 2019-20 2018-19
Weighted average number of potential equity shares on account of conversion of foreign currency convertible bonds 51,90,133 95,20,455
Notes forming part of the Consolidated Financial Statements (contd.)

569
NOTE [56]
Disclosure pursuant to Ind AS 37 “Provisions, Contingent Liabilities and Contingent Assets”:
(a) Movement in provisions: v crore
Sr. No. Particulars
Class of provisionsProduct
warrantiesExpected tax
liability in respect of
indirect taxes
Litigation related
obligations
Contractual rectification
cost-construction
contracts
Others* Total
1 Balance as at 1-4-2019 63.71 243.55 59.53 532.85 27.45 927.09 2 Additional provision during the year 26.34 125.97 146.34 452.14 66.20 816.99 3 Provision used during the year (16.06) (45.54) (0.84) (9.16) (2.98) (74.58) 4 Unused provision reversed during the period (3.03) (15.95) – (415.64) (2.64) (437.26) 5 Addition on account of business combination 0.92 – 9.12 – 0.53 10.57 6 Classified as held for sale (60.73) – – – (27.94) (88.67) 7 Translation adjustments 0.98 – – 1.16 0.82 2.96 8 Additional provision for unwinding of interest and
change in discount rate 1.02 – – – – 1.02 9 Balance as at 31-3-2020 (1 to 8) 13.15 308.03 214.15 561.35 61.44 1158.12
* includes backwork charges, provision for foreseeable losses and onerous contract.
Breakup of provisions: v crore
Particulars Note 24 Note 31 TotalBalance as at 1-4-2019 7.73 919.36 927.09Balance as at 31-3-2020 30.52 1127.60 1158.12
(b) Nature of provisions: (i) Product warranties: The Group gives warranties on certain products and services, undertaking to repair or replace the items
that fail to perform satisfactorily during the warranty period.
Provision made as at March 31, 2020 represents the amount of the expected cost of meeting such obligations of rectification/replacement. The timing of the outflows is expected to be within a period of five years from the date of Balance Sheet.
(ii) Expected tax liability in respect of indirect taxes represents mainly the differential sales tax liability on account of non-collection of declaration forms for the period prior to five years.
(iii) Provision for litigation related obligations represents liabilities that are expected to materialise in respect of matters in appeal.
(iv) Contractual rectification cost represents the estimated cost the Group is likely to incur during defect liability period as per the contract obligations and in respect of completed construction contracts accounted under Ind AS 115 “Revenue from contracts with customers”.
(c) Disclosure in respect of contingent liabilities is given in Note 32.
NOTE [57]Research & DevelopmentThe expenditure on research and development activities recognised as expense in the Statement of Profit and Loss is R 247.69crore(including R 88.32crorepertainingtodiscontinuedoperations)[previous year: R 232.27 crore (including R 76.30crorepertainingtodiscontinued operations)] Further, the Group has incurred capital expenditure on research and development activities as follows:a) on property, plant & equipment R 7.60crore(includingR 4.19 crore pertaining to discontinued operations) [previous
year: R 5.59 crore (including R 2.95 crore pertaining to discontinued operations)] b) on intangible assets being expenditure on new product development R 34.28crore(includingR 30.17 crore pertaining to
discontinued operations) [previous year: R 52.54 crore (including R 46.61crorepertainingtodiscontinuedoperations)] c) on other intangible assets R 3.07 crore (including R 1.93 crore pertaining to discontinued operations) [previous year: R 1.96crore
(including Nil pertaining to discontinued operations)] In addition,the Group has incurred expenditure of R 0.08crore(includingNilpertainingtodiscontinuedoperations)[previous year: R 0.52 crore (including Nil pertaining to discontinued operations)] which is customer funded.
Notes forming part of the Consolidated Financial Statements (contd.)
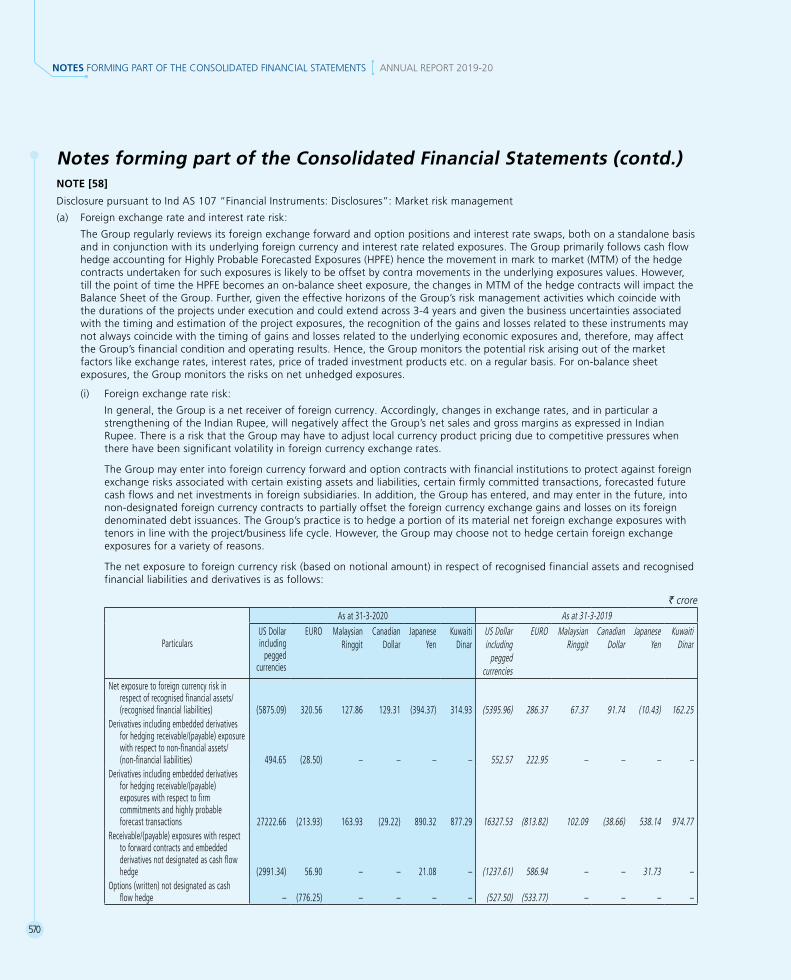
570
NOTES FORMING PART OF THE CONSOLIDATED FINANCIAL STATEMENTS ANNUAL REPORT 2019-20
NOTE [58]
Disclosure pursuant to Ind AS 107 “Financial Instruments: Disclosures”: Market risk management
(a) Foreign exchange rate and interest rate risk:
The Group regularly reviews its foreign exchange forward and option positions and interest rate swaps, both on a standalone basis and in conjunction with its underlying foreign currency and interest rate related exposures. The Group primarily follows cash flow hedge accounting for Highly Probable Forecasted Exposures (HPFE) hence the movement in mark to market (MTM) of the hedge contracts undertaken for such exposures is likely to be offset by contra movements in the underlying exposures values. However, till the point of time the HPFE becomes an on-balance sheet exposure, the changes in MTM of the hedge contracts will impact the Balance Sheet of the Group. Further, given the effective horizons of the Group’s risk management activities which coincide with the durations of the projects under execution and could extend across 3-4 years and given the business uncertainties associated with the timing and estimation of the project exposures, the recognition of the gains and losses related to these instruments may not always coincide with the timing of gains and losses related to the underlying economic exposures and, therefore, may affect the Group’s financial condition and operating results. Hence, the Group monitors the potential risk arising out of the market factors like exchange rates, interest rates, price of traded investment products etc. on a regular basis. For on-balance sheet exposures, the Group monitors the risks on net unhedged exposures.
(i) Foreign exchange rate risk:
In general, the Group is a net receiver of foreign currency. Accordingly, changes in exchange rates, and in particular a strengthening of the Indian Rupee, will negatively affect the Group’s net sales and gross margins as expressed in Indian Rupee. There is a risk that the Group may have to adjust local currency product pricing due to competitive pressures when there have been significant volatility in foreign currency exchange rates.
The Group may enter into foreign currency forward and option contracts with financial institutions to protect against foreign exchange risks associated with certain existing assets and liabilities, certain firmly committed transactions, forecasted future cash flows and net investments in foreign subsidiaries. In addition, the Group has entered, and may enter in the future, into non-designated foreign currency contracts to partially offset the foreign currency exchange gains and losses on its foreign denominated debt issuances. The Group’s practice is to hedge a portion of its material net foreign exchange exposures with tenors in line with the project/business life cycle. However, the Group may choose not to hedge certain foreign exchange exposures for a variety of reasons.
The net exposure to foreign currency risk (based on notional amount) in respect of recognised financial assets and recognised financial liabilities and derivatives is as follows:
v crore
Particulars
As at 31-3-2020 As at 31-3-2019US Dollar including
pegged currencies
EURO Malaysian Ringgit
Canadian Dollar
Japanese Yen
Kuwaiti Dinar
US Dollar including
pegged currencies
EURO Malaysian Ringgit
Canadian Dollar
Japanese Yen
Kuwaiti Dinar
Net exposure to foreign currency risk in respect of recognised financial assets/(recognised financial liabilities) (5875.09) 320.56 127.86 129.31 (394.37) 314.93 (5395.96) 286.37 67.37 91.74 (10.43) 162.25
Derivatives including embedded derivatives for hedging receivable/(payable) exposure with respect to non-financial assets/(non-financial liabilities) 494.65 (28.50) – – – – 552.57 222.95 – – – –
Derivatives including embedded derivatives for hedging receivable/(payable) exposures with respect to firm commitments and highly probable forecast transactions 27222.66 (213.93) 163.93 (29.22) 890.32 877.29 16327.53
(813.82) 102.09 (38.66) 538.14 974.77
Receivable/(payable) exposures with respect to forward contracts and embedded derivatives not designated as cash flow hedge (2991.34) 56.90 – – 21.08 – (1237.61) 586.94 – – 31.73 –
Options (written) not designated as cash flow hedge – (776.25) – – – – (527.50)
(533.77) – – – –
Notes forming part of the Consolidated Financial Statements (contd.)
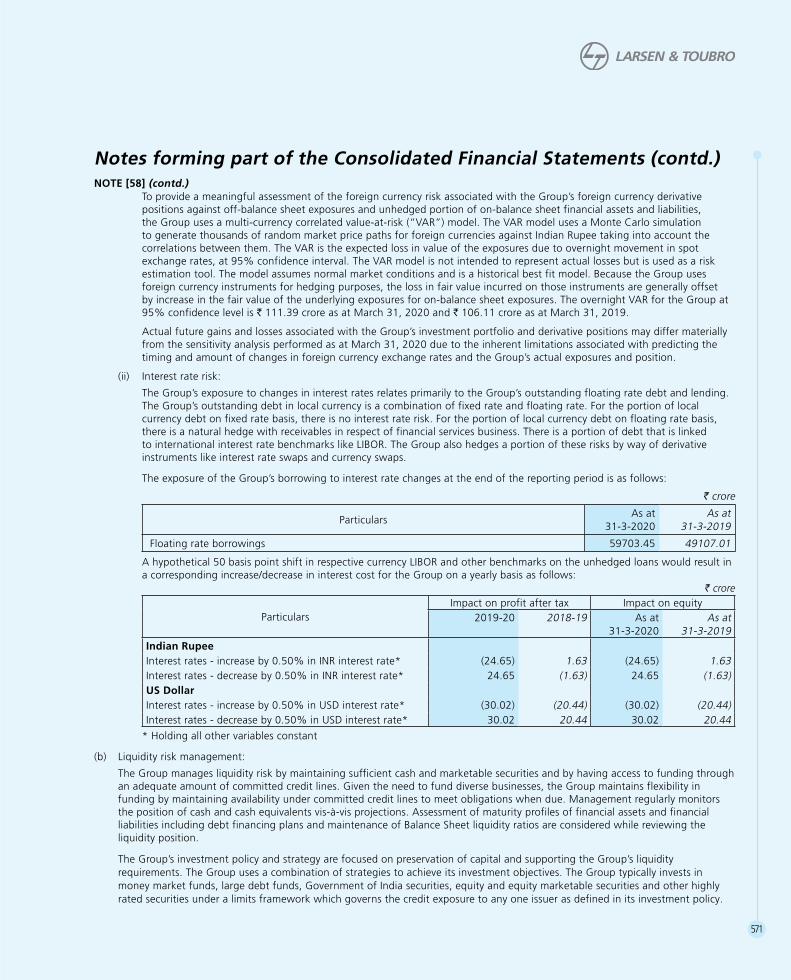
571
To provide a meaningful assessment of the foreign currency risk associated with the Group’s foreign currency derivative positions against off-balance sheet exposures and unhedged portion of on-balance sheet financial assets and liabilities, the Group uses a multi-currency correlated value-at-risk (“VAR”) model. The VAR model uses a Monte Carlo simulation to generate thousands of random market price paths for foreign currencies against Indian Rupee taking into account the correlations between them. The VAR is the expected loss in value of the exposures due to overnight movement in spot exchangerates,at95%confidenceinterval.TheVARmodelisnotintendedtorepresentactuallossesbutisusedasariskestimation tool. The model assumes normal market conditions and is a historical best fit model. Because the Group uses foreign currency instruments for hedging purposes, the loss in fair value incurred on those instruments are generally offset by increase in the fair value of the underlying exposures for on-balance sheet exposures. The overnight VAR for the Group at 95%confidencelevelisR 111.39 crore as at March 31, 2020 and R 106.11croreasatMarch31,2019.
Actual future gains and losses associated with the Group’s investment portfolio and derivative positions may differ materially from the sensitivity analysis performed as at March 31, 2020 due to the inherent limitations associated with predicting the timing and amount of changes in foreign currency exchange rates and the Group’s actual exposures and position.
(ii) Interest rate risk:
The Group’s exposure to changes in interest rates relates primarily to the Group’s outstanding floating rate debt and lending. The Group’s outstanding debt in local currency is a combination of fixed rate and floating rate. For the portion of local currency debt on fixed rate basis, there is no interest rate risk. For the portion of local currency debt on floating rate basis, there is a natural hedge with receivables in respect of financial services business. There is a portion of debt that is linked to international interest rate benchmarks like LIBOR. The Group also hedges a portion of these risks by way of derivative instruments like interest rate swaps and currency swaps.
The exposure of the Group’s borrowing to interest rate changes at the end of the reporting period is as follows:
v crore
ParticularsAs at
31-3-2020As at
31-3-2019
Floating rate borrowings 59703.45 49107.01
A hypothetical 50 basis point shift in respective currency LIBOR and other benchmarks on the unhedged loans would result in a corresponding increase/decrease in interest cost for the Group on a yearly basis as follows:
v crore
ParticularsImpact on profit after tax Impact on equity
2019-20 2018-19 As at 31-3-2020
As at 31-3-2019
Indian RupeeInterestrates-increaseby0.50%inINRinterestrate* (24.65) 1.63 (24.65) 1.63Interestrates-decreaseby0.50%inINRinterestrate* 24.65 (1.63) 24.65 (1.63)US DollarInterestrates-increaseby0.50%inUSDinterestrate* (30.02) (20.44) (30.02) (20.44) Interestrates-decreaseby0.50%inUSDinterestrate* 30.02 20.44 30.02 20.44
* Holding all other variables constant
(b) Liquidity risk management:
The Group manages liquidity risk by maintaining sufficient cash and marketable securities and by having access to funding through an adequate amount of committed credit lines. Given the need to fund diverse businesses, the Group maintains flexibility in funding by maintaining availability under committed credit lines to meet obligations when due. Management regularly monitors the position of cash and cash equivalents vis-à-vis projections. Assessment of maturity profiles of financial assets and financial liabilities including debt financing plans and maintenance of Balance Sheet liquidity ratios are considered while reviewing the liquidity position.
The Group’s investment policy and strategy are focused on preservation of capital and supporting the Group’s liquidity requirements. The Group uses a combination of strategies to achieve its investment objectives. The Group typically invests in money market funds, large debt funds, Government of India securities, equity and equity marketable securities and other highly rated securities under a limits framework which governs the credit exposure to any one issuer as defined in its investment policy.
Notes forming part of the Consolidated Financial Statements (contd.)NOTE [58] (contd.)

572
NOTES FORMING PART OF THE CONSOLIDATED FINANCIAL STATEMENTS ANNUAL REPORT 2019-20
The policy requires investments generally to be investment grade, with the primary objective of minimising the potential risk of principal loss. To provide a meaningful assessment of the price risk associated with the Group’s investment portfolio, the Group performed a sensitivity analysis to determine the impact of change in prices of the securities on the value of the investment portfolioassuminga0.50%movementindebtfundsanddebtsecuritiesanda5%movementintheNAVoftheequityandequitymarketablesecurities.Basedontheinvestmentposition,ahypothetical0.50%changeinthefairmarketvalueofdebtsecuritieswould result in a value change of +/- R 39.42 crore as at March 31, 2020 and +/- R 38.01croreasatMarch31,2019.A5%change in the equity funds’ NAV would result in a value change of +/- R 6.49croreasatMarch31,2020and+/-R 39.16croreas at March 31, 2019 respectively. The investments in money market funds are for the purpose of liquidity management only and hence not subject to any material price risk.
(c) Credit risk management: (i) Financial services business: Financial services business has a risk management framework that monitors and ensures that the business lines operate within
the defined risk appetite and risk tolerance levels as defined by the senior management. Risk management function is closely involved in management and control of credit risk, portfolio monitoring, market risks including liquidity risk and operational risks. The credit risk function independently evaluates proposals based on well-established sector specific internal frameworks, in order to identify, mitigate and allocate risks as well as to enable risk-based pricing of assets. Regulatory and process risks are identified, mitigated and managed by a separate Group. Risk management policies are made under the guidance of Risk Management Committee and are approved by Board of Directors.
(ii) Other than financial services business: The Group’s customer profile include public sector enterprises, state owned companies and large private corporates.
Accordingly,theGroup’scustomercreditriskislow.TheGroup’saverageprojectexecutioncycleisaround24to36months.General payment terms include mobilisation advance, monthly progress payments with a credit period ranging from 45 to 90 days and certain retention money to be released at the end of the project. In some cases retentions are substituted with bank/corporate guarantees. The Group has a detailed review mechanism of overdue customer receivables at various levels within the organisation to ensure proper attention and focus for realisation.
(iii) Reconciliation of loss allowance provision for financial services business - Loans:
v crore
ParticularsLoss allowance
measured at 12-month ECL
Loss allowance measured at life time ECL Financial assets for which
credit risk has increased significantly and credit not
impaired
Financial assets for which credit risk has increased
significantly and credit impaired
Lossallowanceasat1-4-2018 279.81 192.61 4920.40
Provision on new financial assets 313.71 33.49 123.00
Transferred to and from 12-month ECL to life time ECL
28.36 (25.78) (2.58)
Higher/(lower) provision on existing financial assets
(141.88) 27.79 (1127.94)
Loss allowance as at 31-3-2019 480.00 228.11 3912.88
Provision on new financial assets 339.90 34.94 77.01
Transferred to and from 12-month ECL to life time ECL
29.05 (177.03) 147.98
Higher/(lower) provision on existing financial assets
(278.60) 182.61 (355.16)
Loss allowance as at 31-3-2020 570.35 268.63 3782.71
Notes forming part of the Consolidated Financial Statements (contd.)NOTE [58] (contd.)

573
(iv) Reconciliation of allowance for expected credit loss (“ECL”) on trade receivables (other than financial services business):
v croreParticulars 2019-20 2018-19
Opening balance as at April 1 3000.83 2900.10 Changes in allowance for ECL: Provision/(reversal) of allowance for ECL 313.00 84.34 Additional provision (net) 178.37 265.62 Write off as bad debts (194.62) (249.23)Translation adjustment 12.12 –Classified as held for sale (154.10) –Addition on account of business combination 25.61 –Closing balance as at March 31 (Note 13) 3181.21 3000.83
(v) Amounts written off:
v crore
Particulars 2019-20 2018-19
Amount of financial assets written off during the period but still enforceable 900.38 1534.95
NOTE [59]
Other disclosure pursuant to Ind AS 107 “Financial Instruments: Disclosures”:
(a) Category-wise classification for applicable financial assets:v crore
Sr. No.
ParticularsNote As at
31-3-2020As at
31-3-2019I. Measured at fair value through Profit or Loss (FVTPL):
(i) Investment in equity instruments 6,12 582.81 582.49(ii) Investment in preference shares 6,12 89.21 99.81(iii) Investment in mutual funds and units of fund 6,12 7877.25 8990.10(iv) Investment in government securities, debentures and bonds 6,12 1798.48 1523.26(v) Derivative instruments not designated as cash flow hedges 9,18 99.93 139.12 (vi) Embedded derivatives not designated as cash flow hedges 9,18 177.84 28.40(vii) Investment in security receipts 6 2498.65 791.07 (viii) Loans 7,8,16,17 24877.64 24395.92 (ix) Other investments 6,12 0.94 –Sub-total (I) 38002.75 36550.17
II. Measured at amortised cost:(i) Loans 7,8,16,17 77673.47 78031.55(ii) Investment in government securities, debentures and bonds 6,12 59.73 1832.55(iii) Other investments 6,12 330.35 –(iv) Trade receivables 13 40731.52 36845.87(v) Advances recoverable in cash 18 1748.66 1519.17 (vi) Cash and bank balances 9,14,15 15392.64 12217.35 (vii) Other receivables 112.65 287.14Sub-total (II) 136049.02 130733.63
III. Measured at fair value through Other Comprehensive Income (FVTOCI):(i) Investment in government securities, debentures and bonds 6,12 3958.28 4445.53 (ii) Investment in equity instruments 6,12 0.10 –(iii) Investment in preference shares 6,12 0.67 –(iv) Derivative instruments designated as cash flow hedges 9,18 1043.49 1212.86(v) Embedded derivatives designated as cash flow hedges 9,18 108.59 17.50 Sub-total (III) 5111.13 5675.89Total (I+II+III) 179162.90 172959.69
Notes forming part of the Consolidated Financial Statements (contd.)NOTE [58] (contd.)

574
NOTES FORMING PART OF THE CONSOLIDATED FINANCIAL STATEMENTS ANNUAL REPORT 2019-20
(b) Category-wise classification for applicable financial liabilities:
v crore
Sr. No.
ParticularsNote As at
31-3-2020 As at
31-3-2019
I. Measured at fair value through Profit or Loss (FVTPL):
(i) Derivative instruments not designated as cash flow hedges 23,29 158.76 24.93
(ii) Embedded derivatives not designated as cash flow hedges 23,29 57.18 99.41
(iii) Others 218.20 157.00
Sub-total (I) 434.14 281.34
II. Measured at amortised cost:
(i) Borrowings 22,26,27 141007.12 125555.17
(ii) Trade payables
Due to micro enterprises and small enterprises 479.51 261.12
Due to others 28 43164.42 42733.69
(iii) Lease liability 2166.55 –
(iv) Others 3513.03 4140.12
Sub-total (II) 190330.63 172690.10
III. Derivative instruments (including embedded derivatives) through Other Comprehensive Income:
(i) Derivative instruments designated as cash flow hedges 23,29 1814.94 368.52
(ii) Embedded derivatives designated as cash flow hedges 23,29 61.24 185.85
Sub-total (III) 1876.18 554.37
IV. Financial guarantee contracts 23,29 1.02 1.78
Total (I+II+III+IV) 192641.97 173527.59
(c) Items of income, expenses, gains or losses related to financial instruments:
v croreSr. No.
Particulars2019-20 2018-19
I. Net gains/(losses) on financial assets and financial liabilities measured at fair value through Profit or Loss and amortised cost:
A. (i) Financial assets or financial liabilities mandatorily measured at fair value through Profit or Loss:
1. Gains/(losses) on fair valuation or sale of investments 561.72 137.91
2. Gains/(losses) on fair valuation or sale of loans (Financial Services) (93.31) (77.62)
3. Gains/(losses) on fair valuation/settlement of derivative:
(a) Gains/(losses) on fair valuation or settlement of forward contracts not designated as cash flow hedges (300.59) 7.73
(b) Gains/(losses) on fair valuation or settlement of embedded derivative contracts not designated as cash flow hedges 124.73 (1.65)
(c) Gains/(losses) on fair valuation or settlement of futures not designated as cash flow hedges 13.19 (21.81)
Sub-total (A) 305.74 44.56
Notes forming part of the Consolidated Financial Statements (contd.)NOTE [59] (contd.)

575
v croreSr. No.
Particulars2019-20 2018-19
B. Financial assets measured at amortised cost:
(i) Exchange difference gains/(losses) on revaluation or settlement of items denominated in foreign currency (trade receivables, loans given etc.)
1076.54 464.22
(ii) (Allowance)/reversal for expected credit loss during the year (1950.15) (699.45)
(iii) Provision for impairment loss (other than ECL) [net] (311.09) (815.30)
(iv) Gains/(losses) on derecognition:
(a) Bad debts written off (net) 175.60 442.28
(b) Gains/(losses) on transfer of financial assets (non-recourse) (78.35) (363.83)
Sub-total (B) (1087.45) (972.08)
C. Financial liabilities measured at amortised cost:
(i) Exchange difference gains/(losses) on revaluation or settlement of items denominated in foreign currency (trade payables, borrowing availed etc.)
(777.86) (454.18)
(ii) Unclaimed credit balances written back 190.30 79.98
Sub-total (C) (587.56) (374.20)
Total [I] = (A+B+C) (1369.27) (1301.72)
II. Net gains/(losses) on financial assets and financial liabilities measured at fair value through Other Comprehensive Income:
A. Gains recognised in Other Comprehensive Income:
(i) Financial assets measured at fair value through Other Comprehensive Income:
(a) Gains/(losses) on fair valuation or sale of government securities, bonds, debentures etc. 269.68 (125.90)
(ii) Derivative measured at fair value through Other Comprehensive Income:
(a) Gains/(losses) on fair valuation or settlement of forward contracts designated as cash flow hedges
(1039.11) (231.75)
(b) Gains/(losses) on fair valuation or settlement of embedded derivative contracts designated as cash flow hedges
100.98 18.49
Sub-total (A) (668.45) (339.16)
Less:
B. Gains reclassified to Profit or Loss from Other Comprehensive Income:
(i) Financial assets measured at fair value through Other Comprehensive Income:
1. On government securities, bonds, debentures etc. upon sale 154.47 (62.89)
(ii) Derivative measured at fair value through Other Comprehensive Income:
1. On forward contracts upon hedged future cash flows affecting the Profit or Loss or related assets or liabilities
355.35 347.80
2. On embedded derivative contracts upon hedged future cash flows affecting the Profit or Loss or related assets or liabilities
(18.39) 15.42
Sub-total (B) 491.43 300.33
Net gains recognised in Other Comprehensive Income (A-B) (1159.88) (639.49)
C. Impairment loss recognised in Statement of Profit and Loss (350.59) –
Total [II] = (A-B+C) (1510.47) (639.49)
Notes forming part of the Consolidated Financial Statements (contd.)NOTE [59] (contd.)
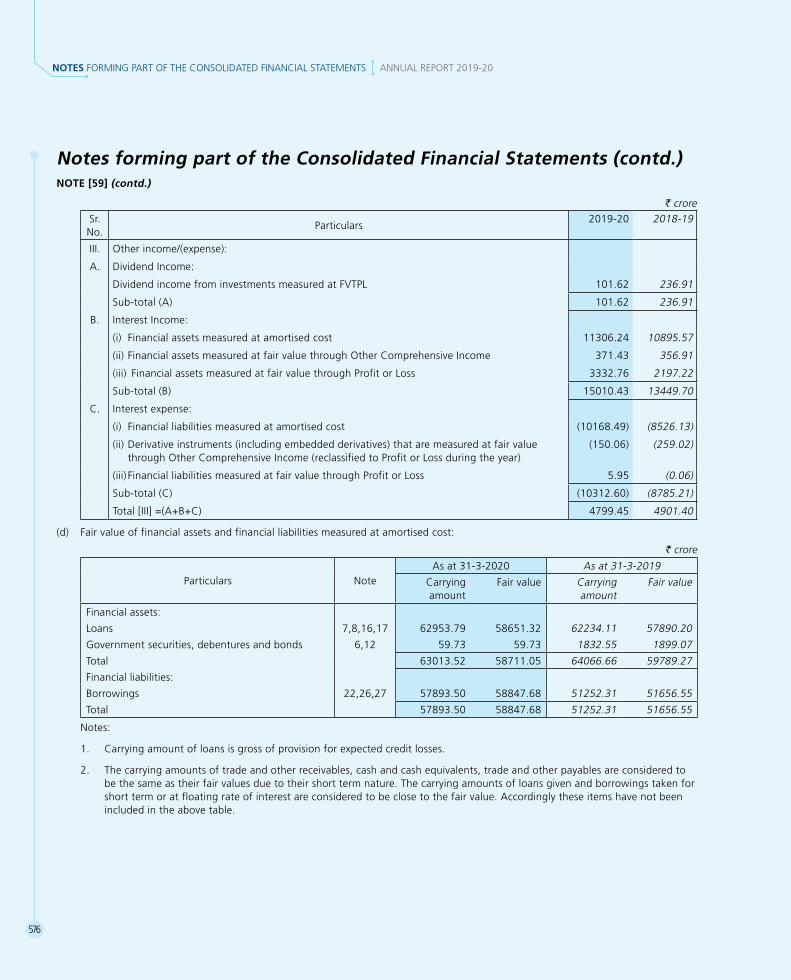
576
NOTES FORMING PART OF THE CONSOLIDATED FINANCIAL STATEMENTS ANNUAL REPORT 2019-20
v croreSr. No.
Particulars2019-20 2018-19
III. Other income/(expense):
A. Dividend Income:
Dividend income from investments measured at FVTPL 101.62 236.91
Sub-total (A) 101.62 236.91
B. Interest Income:
(i) Financial assets measured at amortised cost 11306.24 10895.57
(ii) Financial assets measured at fair value through Other Comprehensive Income 371.43 356.91
(iii) Financial assets measured at fair value through Profit or Loss 3332.76 2197.22
Sub-total (B) 15010.43 13449.70
C. Interest expense:
(i) Financial liabilities measured at amortised cost (10168.49) (8526.13)
(ii) Derivative instruments (including embedded derivatives) that are measured at fair value through Other Comprehensive Income (reclassified to Profit or Loss during the year)
(150.06) (259.02)
(iii) Financial liabilities measured at fair value through Profit or Loss 5.95 (0.06)
Sub-total (C) (10312.60) (8785.21)
Total [III] =(A+B+C) 4799.45 4901.40
(d) Fair value of financial assets and financial liabilities measured at amortised cost:
v crore
Particulars NoteAs at 31-3-2020 As at 31-3-2019
Carrying amount
Fair value Carrying amount
Fair value
Financial assets:
Loans 7,8,16,17 62953.79 58651.32 62234.11 57890.20
Government securities, debentures and bonds 6,12 59.73 59.73 1832.55 1899.07
Total 63013.52 58711.05 64066.66 59789.27
Financial liabilities:
Borrowings 22,26,27 57893.50 58847.68 51252.31 51656.55
Total 57893.50 58847.68 51252.31 51656.55
Notes:
1. Carrying amount of loans is gross of provision for expected credit losses.
2. The carrying amounts of trade and other receivables, cash and cash equivalents, trade and other payables are considered to be the same as their fair values due to their short term nature. The carrying amounts of loans given and borrowings taken for short term or at floating rate of interest are considered to be close to the fair value. Accordingly these items have not been included in the above table.
Notes forming part of the Consolidated Financial Statements (contd.)NOTE [59] (contd.)

577
(e) Disclosure pursuant to Ind AS 113 “Fair Value Measurement” - Fair value hierarchy of financial assets and financial liabilities measured at amortised cost:
v crore
As at 31-3-2020Level 1 Level 2 Level 3 Total Valuation technique for
level 3 items
Financial assets:
Loans – 8663.10 49988.22 58651.32 Discounted cash flow
Government securities, debentures and bonds 59.66 0.07 - 59.73 Discounted cash flow
Total 59.66 8663.17 49988.22 58711.05
Financial liabilities:
Borrowings 737.02 13948.82 44161.84 58847.68 Discounted cash flow
Total 737.02 13948.82 44161.84 58847.68
v crore
As at 31-3-2019 Level 1 Level 2 Level 3 Total Valuation technique for
level 3 items
Financial assets:
Loans – 8783.50 49106.70 57890.20 Discounted cash flow
Government securities, debentures and bonds – 1899.07 – 1899.07 Discounted cash flow
Total – 10682.57 49106.70 59789.27
Financial liabilities:
Borrowings 737.02 9360.96 41558.57 51656.55 Discounted cash flow
Total 737.02 9360.96 41558.57 51656.55
Valuation technique Level 2: Future cash flows discounted using G-sec/LIBOR rates plus corporate spread.
(f) Fair value hierarchy of financial assets and financial liabilities at fair value:
v crore
ParticularsNote As at 31-3-2020 As at 31-3-2019
Level 1 Level 2 Level 3 Total Level 1 Level 2 Level 3 Total
Financial assets:
Financial assets at FVTPL:
(i) Equity shares 6, 12 39.66 – 543.15 582.81 39.93 – 542.56 582.49
(ii) Preference shares 6, 12 – – 89.21 89.21 – – 99.81 99.81
(iii) Mutual fund 6, 12 7770.81 – – 7770.81 8801.31 – – 8801.31
(iv) Debt instruments viz. government securities, bonds and debentures
6, 12 997.64 – 800.84 1798.48 656.38 0.53 866.35 1523.26
(v) Derivative instruments not designated as cash flow hedges
9,18 – 99.93 – 99.93 – 139.12 – 139.12
(vi) Embedded derivative instruments not designated as cash flow hedges
9,18 – 177.84 – 177.84 – 28.40 – 28.40
(vii) Other investments 6, 12 – 0.94 2605.09 2606.03 – – 979.86 979.86
(viii) Loans (Financial Services) 16 – – 24877.64 24877.64 – – 24395.92 24395.92
Notes forming part of the Consolidated Financial Statements (contd.)NOTE [59] (contd.)

578
NOTES FORMING PART OF THE CONSOLIDATED FINANCIAL STATEMENTS ANNUAL REPORT 2019-20
v crore
ParticularsNote As at 31-3-2020 As at 31-3-2019
Level 1 Level 2 Level 3 Total Level 1 Level 2 Level 3 Total
Financial assets at FVTOCI:
(i) Debt instruments viz. government securities, bonds and debentures
6, 12 2729.27 1162.42 66.58 3958.27 2133.84 2303.29 8.40 4445.53
(ii) Preference shares 6 – – 0.67 0.67 – – – –
(iii) Equity shares 6 – – 0.10 0.10 – – – –
(iv) Derivative financial instruments designated as cash flow hedges
9,18 – 1043.49 – 1043.49 – 1212.86 – 1212.86
(v) Embedded derivative financial instruments designated as cash flow hedges
9,18 – 108.60 – 108.60 – 17.50 – 17.50
Total 11537.38 2593.22 28983.28 43113.88 11631.46 3701.70 26892.90 42226.06
Financial liabilities:
Financial liabilities at FVTPL:
(i) Designated at FVTPL:
(a) Derivative instruments not designated as cash flow hedges
23,29 – 158.76 – 158.76 – 24.93 – 24.93
(b) Embedded derivative instruments not designated as cash flow hedges
23,29 – 57.18 – 57.18 – 99.41 – 99.41
(c) Others 23,29 – – 218.20 218.20 – – 157.00 157.00
(ii) Designated at FVTOCI:
(a) Derivative financial instruments designated as cash flow hedges
23,29 – 1814.94 – 1814.94 – 368.52 – 368.52
(b) Embedded derivative financial instruments designated as cash flow hedges
23,29 – 61.24 – 61.24 – 185.85 – 185.85
Total – 2092.12 218.20 2310.32 – 678.71 157.00 835.71
Valuation technique and key inputs used to determine fair value:
A. Level 1: Mutual funds, bonds, debentures and government securities - quoted price in the active market.
B. Level 2: (a) Derivative Instruments – Present value technique using forward exchange rates at the end of reporting period.
(b) Preference share and government securities, bonds and debentures – Future cash flows are discounted using G-sec rates as at reporting date.
Notes forming part of the Consolidated Financial Statements (contd.)NOTE [59] (contd.)

579
(g) Movement of items measured using unobservable inputs (Level 3):
v crore
ParticularsEquity shares Preference
shares Debt
instruments Loans Other
investments Total
Balanceasat31-3-2018 741.83 69.67 918.35 16836.61 1145.50 19711.96 Addition during the year 565.76 – 11.19 14248.11 192.46 15017.52 Disposal during the year (571.03) – (33.33) (6688.80) (123.44) (7416.60) Gains/(losses) recognised in Profit or Loss (194.00) 30.14 (21.46) – (234.66) (419.98)Balance as at 31-3-2019 542.56 99.81 874.75 24395.92 979.86 26892.90 Addition during the year 0.10 0.67 – 6927.18 2099.75 9027.70 Disposal during the year – (6.17) (6.10) (6415.32) (298.05) (6725.64) Gains/(losses) recognised in Profit or Loss 0.59 (4.43) (1.23) (30.14) (176.47) (211.68)Balance as at 31-3-2020 543.25 89.88 867.42 24877.64 2605.09 28983.28
(h) Sensitivity disclosure for level 3 fair value measurements:
Particulars
Fair value as at
Significant unobservable inputs
SensitivityAs at
31-3-2020As at
31-3-2019
v crore
Equity shares
474.95 476.98 Book value 2020: Increase/(decrease) of 5% in the book value would result in impact on profit or loss by R 19.57 crore 2019: Increase/(decrease) of 5% in the book value would result in impact on profit or loss by R 18.02 crore”
68.30 65.58 31-3-2020: 1. Net realisation per
month R 31.83 per sq/ft. 2. Capitalisation rate
12.25% 31-3-2019: 1. Net realisation per
month R 30.90 per sq/ft. 2. Capitalisation rate
12.25%
2020 : 1% change in net realisation would result in +/- R 0.33 crore (post tax- R 0.24 crore) 25 bps change in capitalisation rate would result in +/- R 0.65 crore (post tax- R 0.49 crore) 2019 : 1% change in net realisation would result in +/- R 0.32 crore (post tax- R 0.21 crore) 25 bps change in capitalisation rate would result in +/- R 0.63 crore (post tax- R 0.41 crore)
Preference shares
89.88 99.81 Expected yield 2020: Increase/(decrease) in the fair value by 5% would result in impact on profit or loss by R 4.44 crore 2019: Increase/(decrease) in the fair value by 5% would result in impact on profit or loss by R 4.74 crore
Debt instruments 867.42 874.75 Expected yield 2020: Increase/(decrease) in fair value by 0.25% would result in impact on profit or loss by R 1.79 crore 2019: Increase/(decrease) in fair a by 0.25% would result in impact on profit or loss by R 1.65 crore
Loans 24877.64 24395.92 Expected yield 2020: Increase/(decrease) in fair value by 0.25% would result in impact on profit or loss by R 46.54 crore 2019: Increase/(decrease) in fair value by 0.25% would result in impact on profit or loss by R 39.68 crore
Other investments
2605.09 979.83 Net Assets Value (NAV) 2020: Increase/(decrease) in the NAV by 5% would result in impact on profit or loss R 97.47 crore 2019: Increase/(decrease) in the NAV by 5% would result in impact on profit or loss R 31.87 crore
Notes forming part of the Consolidated Financial Statements (contd.)NOTE [59] (contd.)
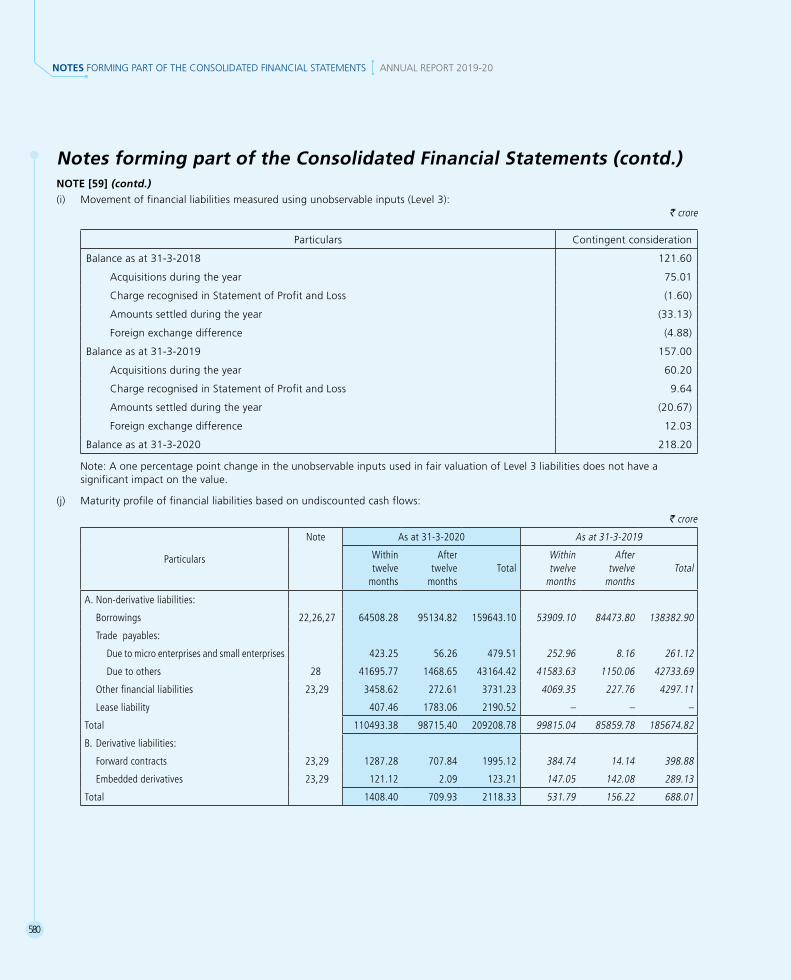
580
NOTES FORMING PART OF THE CONSOLIDATED FINANCIAL STATEMENTS ANNUAL REPORT 2019-20
(i) Movement of financial liabilities measured using unobservable inputs (Level 3):v crore
Particulars Contingent consideration
Balanceasat31-3-2018 121.60
Acquisitions during the year 75.01
Charge recognised in Statement of Profit and Loss (1.60)
Amounts settled during the year (33.13)
Foreign exchange difference (4.88)
Balance as at 31-3-2019 157.00
Acquisitions during the year 60.20
Charge recognised in Statement of Profit and Loss 9.64
Amounts settled during the year (20.67)
Foreign exchange difference 12.03
Balance as at 31-3-2020 218.20
Note: A one percentage point change in the unobservable inputs used in fair valuation of Level 3 liabilities does not have a significant impact on the value.
(j) Maturity profile of financial liabilities based on undiscounted cash flows:
v crore
Particulars
Note As at 31-3-2020 As at 31-3-2019
Within twelve
months
After twelve
monthsTotal
Within twelve
months
After twelve
monthsTotal
A. Non-derivative liabilities:
Borrowings 22,26,27 64508.28 95134.82 159643.10 53909.10 84473.80 138382.90
Trade payables:
Due to micro enterprises and small enterprises 423.25 56.26 479.51 252.96 8.16 261.12
Due to others 28 41695.77 1468.65 43164.42 41583.63 1150.06 42733.69
Other financial liabilities 23,29 3458.62 272.61 3731.23 4069.35 227.76 4297.11
Lease liability 407.46 1783.06 2190.52 – – –
Total 110493.38 98715.40 209208.78 99815.04 85859.78 185674.82
B. Derivative liabilities:
Forward contracts 23,29 1287.28 707.84 1995.12 384.74 14.14 398.88
Embedded derivatives 23,29 121.12 2.09 123.21 147.05 142.08 289.13
Total 1408.40 709.93 2118.33 531.79 156.22 688.01
Notes forming part of the Consolidated Financial Statements (contd.)NOTE [59] (contd.)

581
(k) Details of outstanding hedge instruments for which hedge accounting is followed: (i) Outstanding currency exchange rate hedge instruments: (A) Forward covers taken to hedge exchange rate risk and accounted as cash flow hedge:
Particulars
As at 31-3-2020 As at 31-3-2019
Nominal amount
(v crore)
Average rate (v)
Within twelve
months (v crore)
After twelve
months (v crore)
Nominal amount
(v crore)
Average rate (v)
Within twelve
months (v crore)
After twelve
months (v crore)
(a) Receivable hedges
US Dollar 33569.57 76.26 19267.26 14302.31 24682.61 73.43 15833.62 8848.99
EURO 2277.73 84.47 2068.58 209.15 2373.28 84.81 1643.94 729.34
Malaysian Ringgit 173.51 17.85 125.19 48.32 113.99 17.54 53.37 60.62
Omani Riyal 485.60 193.42 107.43 378.17 230.00 187.51 150.51 79.49
Arab Emirates Dirham 1174.53 20.78 830.91 343.62 1228.16 19.34 1228.16 –
British Pound 55.12 99.23 55.12 – 87.48 96.74 87.48 –
Japanese Yen 1640.41 0.69 1324.82 315.59 1449.58 0.68 1284.36 165.22
Kuwaiti Dinar 1393.32 238.30 1170.76 222.56 1524.52 237.38 1232.40 292.12
Qatari Riyal 1401.35 20.99 1319.32 82.03 1551.27 19.72 1227.83 323.44
Bangladesh Taka 1859.64 0.90 1674.92 184.72 873.53 0.88 854.91 18.62
Saudi Riyal 52.82 19.97 52.82 – 96.64 21.04 96.64 –
South African Rand 2.96 5.00 2.96 – – – – –
Mauritian Rupee 149.67 1.91 111.93 37.74 – – – –
Thai Baht 1.56 2.35 1.56 – – – – –
(b) Payable hedges
US Dollar 16377.55 73.86 12888.45 3489.10 13738.88 70.57 12789.54 949.34
EURO 4376.52 84.32 4086.26 290.26 4472.40 81.43 4338.30 134.10
Arab Emirates Dirham 396.31 20.75 396.31 – – – – –
British Pound 47.35 94.10 47.35 – 71.10 94.52 71.10 –
Japanese Yen 771.37 0.70 657.29 114.08 1060.96 0.66 877.42 183.54
Kuwaiti Dinar 409.62 236.91 409.62 – 531.77 232.14 531.77 –
Omani Riyal – – – – 28.71 180.36 28.71 –
Swiss Franc 176.13 76.89 176.13 – 302.59 72.69 302.59 –
Chinese Yuan 84.13 10.67 75.37 8.76 – – – –
Bangladesh Taka 766.73 0.88 766.73 – – – – –
Norwegian Krone – – – – 5.20 9.16 5.20 –
Mauritian Rupee 385.17 1.86 385.17 – – – – –
Canadian Dollar 31.46 54.37 31.46 – 40.53 54.04 40.53 –
Notes forming part of the Consolidated Financial Statements (contd.)NOTE [59] (contd.)

582
NOTES FORMING PART OF THE CONSOLIDATED FINANCIAL STATEMENTS ANNUAL REPORT 2019-20
(B) Options taken to hedge exchange rate risk and accounted as cash flow hedge:
Particulars
As at 31-3-2020 As at 31-3-2019Nominal amount
(v crore)
Average rate (v)
Within twelve
months (v crore)
After twelve
months (v crore)
Nominal amount
(v crore)
Average rate (v)
Within twelve
months (v crore)
After twelve
months (v crore)
(a) Receivable hedges:US Dollars/Indian Rupees 915.51 R 87.19 – 915.51 1422.50 R 71.13 to
R 74.94 1422.50 –
EURO/US Dollars 970.48 $ 1.16 to $ 1.25
516.55 453.93 632.65 $ 1.17 to $ 1.25
363.68 268.97
(b) Payable hedges:US Dollars/Indian Rupees – – – – 750.00 R 67.69 to
R 75 750.00 –
(C) Forward covers taken to hedge exchange rate risk and accounted as fair value hedge:
Particulars
As at 31-3-2020 As at 31-3-2019Nominal amount
(v crore)
Average rate (v)
Within twelve
months (v crore)
After twelve
months (v crore)
Nominal amount
(v crore)
Average rate (v)
Within twelve
months (v crore)
After twelve
months (v crore)
(a) Receivable hedgesUS Dollar 1694.48 73.82 1694.48 – 1094.17 71.00 1094.17 – Canadian Dollar 14.45 53.00 14.45 – 21.84 52.00 21.84 – British Pound 40.12 89.00 40.12 – 10.54 92.00 10.54 – Australian Dollar 10.60 44.00 10.60 – 9.03 49.00 9.03 – South African Rand 37.99 5.00 37.99 – 10.67 5.00 10.67 – Danish krone 4.41 11.00 4.41 – 2.10 11.00 2.10 – Norwegian Krone 3.70 7.00 3.70 – 3.64 8.00 3.64 – Swedish krona 18.46 8.00 18.46 – 5.46 8.00 5.46 –
(D) Forward covers taken to hedge exchange rate risk and accounted as net investment hedge:
Particulars
As at 31-3-2020 As at 31-3-2019Nominal amount
(v crore)
Average rate (v)
Within twelve
months (v crore)
After twelve
months (v crore)
Nominal amount
(v crore)
Average rate (v)
Within twelve
months (v crore)
After twelve
months (v crore)
(a) Receivable hedges:US Dollar 29.00 72.51 29.00 – 28.73 71.83 28.73 – Arab Emirates Dirham 102.55 20.11 102.55 – 81.20 20.46 – 81.20Qatari Riyal 45.77 20.70 45.77 – 116.68 20.91 116.68 – Saudi Riyal – – – – 51.07 19.34 51.07 –
Notes forming part of the Consolidated Financial Statements (contd.)NOTE [59] (contd.)

583
NOTE [59] (contd.)
(ii) Outstanding interest rate hedge instruments: Interest rate swaps taken to hedge interest rate risk and accounted as cash flow hedge:
Particulars
As at 31-3-2020 As at 31-3-2019Nominal amount
(v crore)
Average rate (%)
Within twelve
months (v crore)
After twelve
months (v crore)
Nominal amount
(v crore)
Average rate (%)
Within twelve
months (v crore)
After twelve
months (v crore)
Floating interest rate borrowings - US Dollar
4.32 7.35 4.32 - 373.90 7.26 369.58 4.32
(iii) Outstanding commodity price hedge instruments: Commodity forward Contract:
Particulars
As at 31-3-2020 As at 31-3-2019Nominal amount
(v crore)
Average rate (v)
Within twelve
months (v crore)
After twelve
months (v crore)
Nominal amount
(v crore)
Average rate (v)
Within twelve
months (v crore)
After twelve
months (v crore)
Copper (Tn)* 53.65 404260.66 27.25 26.40 (271.25) 514615.22 (271.25) – Aluminium (Tn) 355.02 133756.31 355.02 – 202.04 148790.59 202.04 – Iron Ore (Tn) 25.71 5643.17 15.18 10.53 38.32 5469.41 29.47 8.85 Coking Coal (Tn) 24.58 13101.74 15.50 9.08 39.27 13631.02 29.26 10.01 Zinc (Tn) – – – – 42.44 189480.24 42.44 – Lead (Tn) 42.56 146921.65 42.56 – 33.63 142435.43 33.63 – Nickel (Tn) 112.49 992854.36 112.49 – – – – –
*Negative nominal amount represents sell position.
(l) Carrying amounts of hedge instruments for which hedge accounting is followed: (A) Cash flow hedge:
v crore
Particulars
As at 31-3-2020 As at 31-3-2019Currency exposure
Interest rate exposure
Commodity price
exposure
Currency exposure
Interest rate exposure
Commodity price
exposure(i) Forward contracts (a) Current: Asset - Other financial assets 795.47 (0.96) 83.78 714.76 (0.40) 56.94 Liability - Other financial liabilities 1055.95 – 136.18 396.78 – 46.57 (b) Non-current: Asset - Other financial assets 53.00 – – 366.37 (0.40) – Liability - Other financial liabilities 580.21 – 1.71 109.95 – – (ii) Swap contracts (a) Current: Asset - Other financial assets – – – 49.11 0.88 – Liability - Other financial liabilities – – – – – – (b) Non-current: Asset - Other financial assets 155.06 – – – – – Liability - Other financial liabilities 59.55 – – – – – (iii) Option contracts (a) Current: Asset - Other financial assets 26.61 – – 22.43 – – Liability - Other financial liabilities 8.97 – – 0.96 – – (b) Non-current: Asset - Other financial assets 39.13 – – 6.51 – – Liability - Other financial liabilities 33.36 – – – – –
Notes forming part of the Consolidated Financial Statements (contd.)

584
NOTES FORMING PART OF THE CONSOLIDATED FINANCIAL STATEMENTS ANNUAL REPORT 2019-20
(B) Fair value hedge:
v crore
Particulars
As at 31-3-2020 As at 31-3-2019
Currency exposure
Interest rate exposure
Commodity price
exposure
Currency exposure
Interest rate exposure
Commodity price
exposure
(i) Forward contracts
(a) Current:
Asset - Other financial assets – – – – – –
Liability - Other financial liabilities 63.86 – – – – –
(b) Non-current:
Asset - Other financial assets – – – 20.90 – –
Liability - Other financial liabilities – – – – – –
(ii) Option contracts
(a) Current:
Asset - Other financial assets 4.84 – – – – –
Liability - Other financial liabilities – – – – – –
(b) Non-current:
Asset - Other financial assets 4.67 – – 3.08 – –
Liability - Other financial liabilities – – – – – –
(C) Net investment hedge:
v crore
Particulars
As at 31-3-2020 As at 31-3-2019
Currency exposure
Interest rate exposure
Commodity price
exposure
Currency exposure
Interest rate exposure
Commodity price
exposure
(i) Forward contracts
(a) Current:
Asset - Other financial assets – – – 11.48 – –
Liability - Other financial liabilities 0.26 – – 0.11 – –
(b) Non-current:
Asset - Other financial assets – – – 2.68 – –
Liability - Other financial liabilities – – – – – –
(m) Breakup of cash flow hedging reserve and cost of hedging reserve:
v crore
Particulars
As at 31-3-2020 As at 31-3-2019
Cash flow hedging reserve
Cost of hedging reserve
Cash flow hedging reserve
Cost of hedging reserve
Balance towards continuing hedges (412.63) (13.78) 360.54 6.77
Balance for which hedge accounting discontinued (9.14) (1.37) (121.43) (0.88)
Total (421.77) (15.15) 239.11 5.89
Notes forming part of the Consolidated Financial Statements (contd.)NOTE [59] (contd.)

585
(n) Reclassification of hedging reserve and cost of hedging reserve to Profit or Loss:
v crore
Particulars 2019-20 2018-19
(A) Future cash flows are no longer expected to occur:
(i) Revenue from operations – 109.03
(ii) Manufacturing, construction and operating expenses – –
(iii) Sales, administration and other expenses (16.65) (45.53)
(iv) Other income – 0.34
(B) Hedged expected future cash flows affecting Profit or Loss:
(i) Progress billing (100.64) (28.32)
(ii) Revenue from operations 167.20 67.98
(iii) Manufacturing, construction and operating expenses (131.85) (24.26)
(iv) Finance costs (150.26) (259.35)
(v) Sales, administration and other expenses 313.90 262.37
(vi) Discontinued operations 3.38 1.10
(o) Movement of cash flow hedging reserve and cost of hedging reserve:
v crore
Cash flow hedging reserve 2019-20 2018-19
Opening balance 239.11 449.22
Changes in the spot element of the forward contracts which is designated as hedging instruments for time period related hedges 248.63 261.47
Changes in fair value of forward contracts designated as hedging instruments (1001.89) (301.78)
Changes in intrinsic value of option contracts 3.64 –
Changes in fair value of swaps (43.85) 59.82
Amount reclassified to Profit or Loss (307.86) (364.94)
Amount included in non-financial asset/liability 5.39 0.31
Amount included in progress billing in Balance Sheet 100.64 28.32
Taxes related to above 334.42 106.69
Closing balance (421.77) 239.11
v crore
Cost of hedging reserve 2019-20 2018-19
Opening balance 5.89 (11.45)
Changes in the forward element of the forward contracts where changes in spot element of forward contract is designated as hedging instruments for time period related hedges (151.87) (226.43)
Included in carrying amount of hedge item 0.55 0.13
Amount reclassified to Profit or Loss 122.14 252.95
Taxes related to above 8.14 (9.31)
Closing balance (15.15) 5.89
Notes forming part of the Consolidated Financial Statements (contd.)NOTE [59] (contd.)
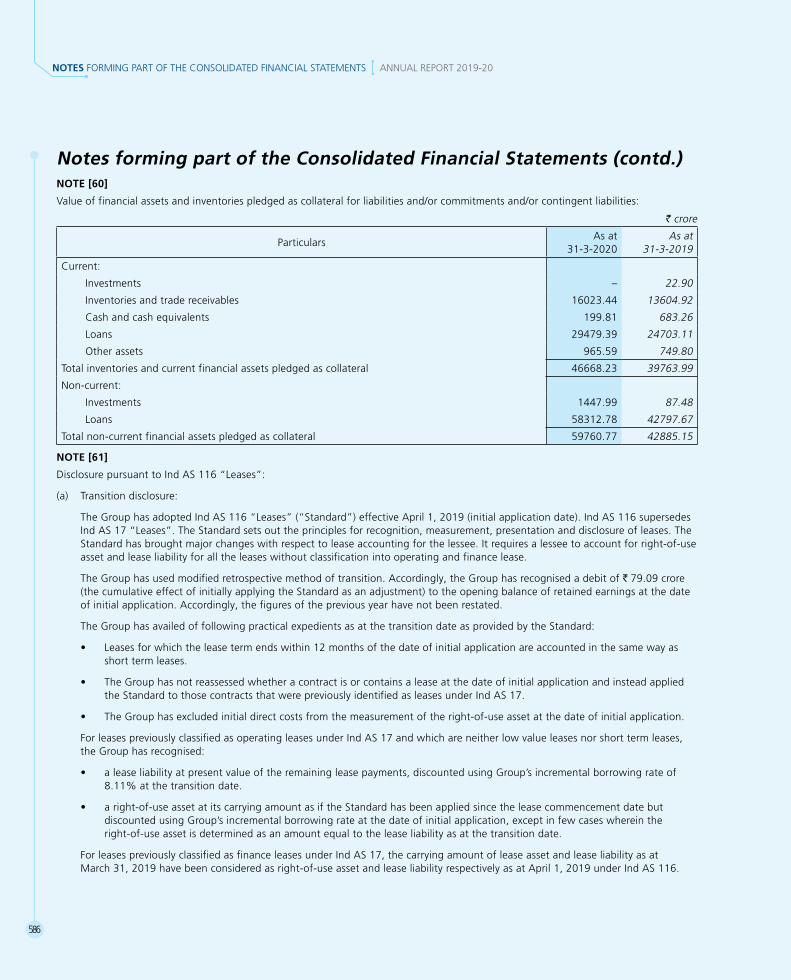
586
NOTES FORMING PART OF THE CONSOLIDATED FINANCIAL STATEMENTS ANNUAL REPORT 2019-20
Notes forming part of the Consolidated Financial Statements (contd.)NOTE [60]
Value of financial assets and inventories pledged as collateral for liabilities and/or commitments and/or contingent liabilities:
v crore
ParticularsAs at
31-3-2020As at
31-3-2019
Current:
Investments – 22.90
Inventories and trade receivables 16023.44 13604.92
Cash and cash equivalents 199.81 683.26
Loans 29479.39 24703.11
Other assets 965.59 749.80
Total inventories and current financial assets pledged as collateral 46668.23 39763.99
Non-current:
Investments 1447.99 87.48
Loans 58312.78 42797.67
Total non-current financial assets pledged as collateral 59760.77 42885.15
NOTE [61]
DisclosurepursuanttoIndAS116“Leases”:
(a) Transition disclosure:
TheGrouphasadoptedIndAS116“Leases”(“Standard”)effectiveApril1,2019(initialapplicationdate).IndAS116supersedesInd AS 17 “Leases”. The Standard sets out the principles for recognition, measurement, presentation and disclosure of leases. The Standard has brought major changes with respect to lease accounting for the lessee. It requires a lessee to account for right-of-use asset and lease liability for all the leases without classification into operating and finance lease.
The Group has used modified retrospective method of transition. Accordingly, the Group has recognised a debit of R 79.09 crore (the cumulative effect of initially applying the Standard as an adjustment) to the opening balance of retained earnings at the date of initial application. Accordingly, the figures of the previous year have not been restated.
The Group has availed of following practical expedients as at the transition date as provided by the Standard:
• Leasesforwhichtheleasetermendswithin12monthsofthedateofinitialapplicationareaccountedinthesamewayasshort term leases.
• TheGrouphasnotreassessedwhetheracontractisorcontainsaleaseatthedateofinitialapplicationandinsteadappliedthe Standard to those contracts that were previously identified as leases under Ind AS 17.
• TheGrouphasexcludedinitialdirectcostsfromthemeasurementoftheright-of-useassetatthedateofinitialapplication.
For leases previously classified as operating leases under Ind AS 17 and which are neither low value leases nor short term leases, the Group has recognised:
• aleaseliabilityatpresentvalueoftheremainingleasepayments,discountedusingGroup’sincrementalborrowingrateof8.11%atthetransitiondate.
• aright-of-useassetatitscarryingamountasiftheStandardhasbeenappliedsincetheleasecommencementdatebutdiscounted using Group’s incremental borrowing rate at the date of initial application, except in few cases wherein the right-of-use asset is determined as an amount equal to the lease liability as at the transition date.
For leases previously classified as finance leases under Ind AS 17, the carrying amount of lease asset and lease liability as at March31,2019havebeenconsideredasright-of-useassetandleaseliabilityrespectivelyasatApril1,2019underIndAS116.

587
Notes forming part of the Consolidated Financial Statements (contd.)
Reconciliation between operating lease commitments disclosed as per Ind AS 17 as at March 31, 2019 and lease liabilities recognised in the Balance Sheet at the date of initial application i.e. April 1, 2019 is as follows:
Particulars v croreOperating lease commitments under Ind AS 17 as at March 31, 2019 1258.68Less: Commitments pertaining to short term leases 79.69Less: Commitments pertaining to low value leases 11.21Less:ImpactofdiscountingofleasepaymentsunderIndAS116 368.48Add: Extension and termination options reasonably certain to be exercised 375.70 Add: Commitments relating to leases previously classified as finance leases 0.06LeaseliabilityrecognisedunderIndAS116asatApril1,2019 1175.06
(b) Where the Group is a lessor: (i) Finance leases: A. Assets given under leases mainly include power plant where the Group has agreed to manufacture/construct an
asset and convey, in substance, a right to the beneficiary to use the asset over a major part of its economic life, for a pre-determined consideration.
B. Finance lease income recognised in the Statement of Profit and Loss during the year amounts to R 1035.33 crore (R 1003.04 crore is on the net investment in finance lease and R 32.29 crore is income relating to variable lease payments not included in the measurement of the net investment in finance leases). Further, an amount of R 0.25 crore is accounted as sub-lease income classified as finance lease.
C. The gross investment in these leases and the present value of minimum lease payments receivable is as under:v crore
Sr. No.
Particulars
Minimum Lease Payments
Present value of minimum lease
paymentsAs at 31-3-2020 As at 31-3-2020
1 Receivable not later than 1 year 1189.58 214.762 Receivable later than 1 year and not later than 2 years 1137.71 185.553 Receivable later than 2 years and not later than 3 years 1231.54 306.334 Receivable later than 3 years and not later than 4 years 1511.98 637.005 Receivable later than 4 years and not later than 5 years 1289.63 476.966 Receivable later than 5 years 13467.38 6087.227 Unguaranteed residual value 990.36 990.36
Grossinvestmentinleases(1+2+3+4+5+6+7) 20818.18 8898.18Less: Unearned finance income 11920.00Present value of minimum lease payments receivable 8898.18
D. Reconciliation of carrying amount of net investment in finance lease receivables is as under:v crore
Sr. No. Particulars Net investment in finance lease1 Opening balance as at April 1, 2019 9067.702 ImpactofIndAS116-derecognitionofright-of-useassetonsub-lease
treated as finance lease 3.263 Finance income/sub-lease income recognised during the year 1003.294 Addition to finance lease during the year 76.105 Lease rental received during the year (1252.17)
Closing balance as at March 31, 2020 (1+2+3+4+5) 8898.18
NOTE [61] (contd.)

588
NOTES FORMING PART OF THE CONSOLIDATED FINANCIAL STATEMENTS ANNUAL REPORT 2019-20
Notes forming part of the Consolidated Financial Statements (contd.)
(ii) Operating leases: A. The Group has given certain assets under non-cancellable operating lease such as buildings, plant & equipment
and vehicles. Leases are renewed only on mutual consent and at a prevalent market price and sub-lease is generally restricted.
B. Operating lease income recognised in the Statement of Profit and Loss during the year amounts to R 170.85crore.Further, an amount of R 1.28croreisaccountedassub-leaseincomeclassifiedasoperatinglease.
C. Annual undiscounted lease payments receivable is as under:v crore
Sr. No. Particulars As at 31-3-20201 Receivable not later than 1 year 116.972 Receivable later than 1 year and not later than 2 years 81.773 Receivable later than 2 years and not later than 3 years 50.784 Receivable later than 3 years and not later than 4 years 27.285 Receivable later than 4 years and not later than 5 years 7.416 Receivable later than 5 years 0.61
Total(1+2+3+4+5+6) 284.82
(c) Where the Group is a lessee: (i) The Group has taken various assets on lease such as plant & equipment, buildings, office premises, vehicles. Generally, leases
are renewed only on mutual consent and at a prevalent market price and sub-lease is restricted. (ii) The Group during the year has leased out surplus capacity in leased assets and has accounted an income of R 1.53 crore on
such sub-leases. (iii) Details with respect to right-of-use assets:
v crore
Class of asset Depreciation for the year* Addition to right-of-use
asset during the year**Carrying amount of asset
as at 31-3-2020Land 17.81 26.57 385.44Buildings 288.15 1125.51 1716.20Plant & equipment 45.60 114.52 117.77 Furniture & fixtures 1.67 – 6.81Vehicles 0.21 0.15 0.27 Total 353.44 1266.75 2226.49
* Depreciation for the year includes depreciation on land R 0.14 crore and on buildings R 0.04 crore pertaining to discontinued operations.
** Addition to right-of-use asset during the year includes addition on account of business combination R 607.03crore(R 23.89croreinlandandR 583.14croreinbuildings).
(iv) Interest expense on lease liabilities amounts to R 162.79crore(includingR 0.74 crore pertaining to discontinued operations).
(v) The expense relating to payments not included in the measurement of the lease liability and recognised as expense in the Statement of Profit and Loss during the year are as follows:
A. Short term leases - R 2749.00 crore (including R 10.91 crore pertaining to discontinued operations);
B. Low value leases - R 48.45crore(includingNilpertainingtodiscontinuedoperations).
(vi) Total cash outflow for leases amounts to R 3090.44 crore (including R 13.63crorepertainingtodiscontinuedoperations)during the year including cash outflow of short term and low value leases.
(vii) The Group has entered into certain lease agreements, which had not commenced by the year end and as a result, a lease liability and right-of-use asset has not been recognised as at March 31, 2020. The aggregate future cash flows to which the Group is exposed in respect of these contracts are: Fixed payments of R 17.99 crore per year, over the lease term ranging from 1 to 9 years.
NOTE [61] (contd.)

589
Notes forming part of the Consolidated Financial Statements (contd.)NOTE [62]
Additional information pursuant to Schedule III to the Companies Act, 2013 for the year ended 31-3-2020:
Name of the entity
Net Assets, i.e., total assets minus total
liabilities
Share in profit or (loss) Share in other comprehensive income
Share in total comprehensive income
As % of consolidated
net assets
Amount (R crore)
As % of consolidated profit or loss
Amount (R crore)
As % of consolidated
other comprehensive
income
Amount (R crore)
As % of consolidated
total comprehensive
income
Amount (R crore)
Parent Company Larsen and Toubro Limited 78.20% 52175.35 69.95% 6679.21 50.24% (518.92) 72.34% 6160.29 Indian Subsidiaries Infrastructure:
Hi-Tech Rock Products and Aggregates Limited (0.01%) (5.50) (0.21%) (19.65) – – (0.23%) (19.65)
L&T Geostructure LLP 0.30% 199.22 0.51% 48.58 0.01% (0.06) 0.58% 48.52 L&T Infrastructure Engineering Limited 0.07% 45.18 0.01% 1.24 0.01% (0.07) 0.01% 1.17
Heavy Engineering: L&T Cassidian Limited – – – – – – – – Hydrocarbon: L&T Hydrocarbon Engineering Limited 4.07% 2720.29 9.86% 941.71 (17.45%) 180.26 13.17% 1121.97 L&T-Gulf Private Limited 0.05% 33.10 0.09% 8.65 – 0.01 0.10% 8.66 IT & Technology Services:
Larsen & Toubro Infotech Limited 7.84% 5228.84 16.26% 1552.36 42.42% (438.10) 13.08% 1114.26 L&T Technology Services Limited 3.93% 2620.03 8.27% 790.03 25.20% (260.32) 6.22% 529.71 Mindtree Limited (Consolidated) 4.73% 3156.72 5.64% 538.17 20.25% (209.15) 3.86% 329.02 L&T Thales Technology Services Private
Limited 0.04% 25.36 0.15% 14.64 (0.01%) 0.11 0.18% 14.75 Syncordis Software Services India Private
Limited – 2.67 0.01% 0.92 – – 0.01% 0.92 Graphene Semiconductor Services Private
Limited 0.04% 28.15 0.08% 6.94 – – 0.09% 6.94 Seastar Labs Private Limited – (0.29) – – – – – – Ruletronics Systems Private Limited 0.01% 3.90 – 0.08 – – – 0.08 Esencia Technologies India Private Limited – 0.62 – (0.09) – – – (0.09)Lymbyc Solutions Private Limited 0.01% 3.79 0.01% 1.06 – – 0.01% 1.06 Powerup Cloud Technologies Private
Limited 0.01% 7.71 (0.02%) (1.55) – (0.04) (0.02%) (1.59) Financial Services:
L&T Capital Markets Limited 0.10% 66.44 (0.04%) (3.73) (0.03%) 0.33 (0.04%) (3.40)L&T Finance Holdings Limited 11.76% 7844.84 2.79% 266.81 0.01% (0.11) 3.13% 266.70 L&T Housing Finance Limited 2.28% 1521.71 0.48% 46.31 1.11% (11.50) 0.41% 34.81 L&T Infra Debt Fund Limited 1.91% 1274.05 2.23% 212.98 0.02% (0.16) 2.51% 212.82 L&T Infra Investment Partners Advisory
Private Limited 0.02% 14.63 0.04% 3.42 – – 0.04% 3.42 L&T Infra Investment Partners Trustee
Private Limited – 0.06 – 0.01 – – – 0.01 L&T Infrastructure Finance Company
Limited 7.81% 5210.39 2.92% 279.25 (0.17%) 1.78 3.30% 281.03 L&T Investment Management Limited 0.87% 577.39 2.10% 200.08 0.10% (1.07) 2.34% 199.01
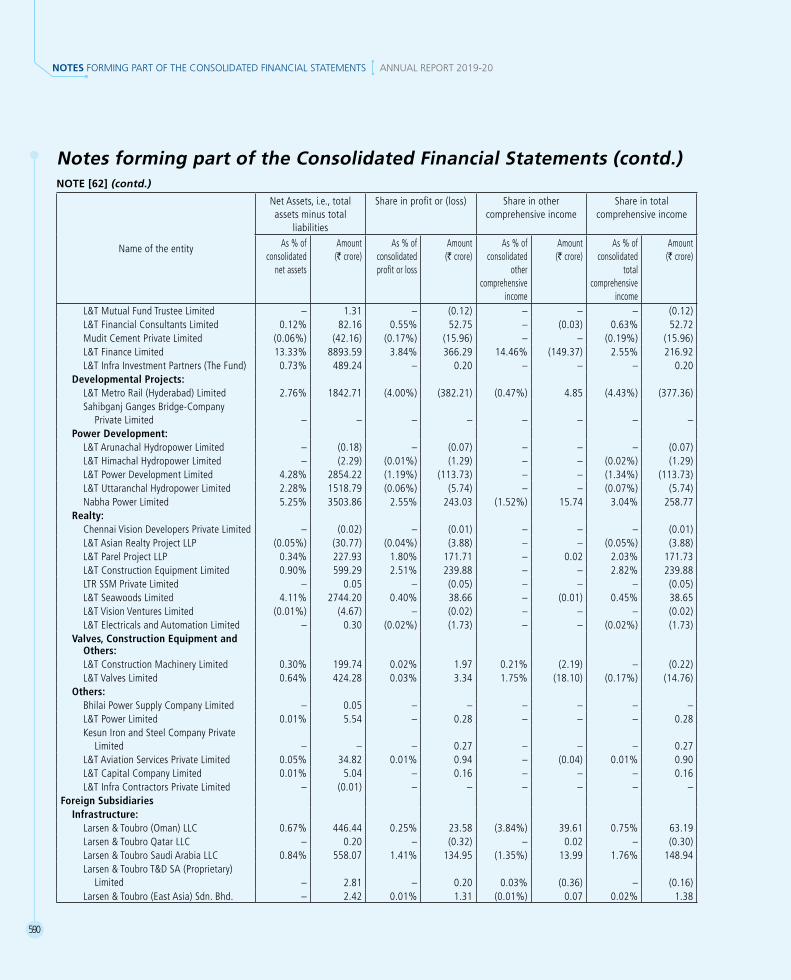
590
NOTES FORMING PART OF THE CONSOLIDATED FINANCIAL STATEMENTS ANNUAL REPORT 2019-20
Notes forming part of the Consolidated Financial Statements (contd.)
Name of the entity
Net Assets, i.e., total assets minus total
liabilities
Share in profit or (loss) Share in other comprehensive income
Share in total comprehensive income
As % of consolidated
net assets
Amount (R crore)
As % of consolidated profit or loss
Amount (R crore)
As % of consolidated
other comprehensive
income
Amount (R crore)
As % of consolidated
total comprehensive
income
Amount (R crore)
L&T Mutual Fund Trustee Limited – 1.31 – (0.12) – – – (0.12)L&T Financial Consultants Limited 0.12% 82.16 0.55% 52.75 – (0.03) 0.63% 52.72 Mudit Cement Private Limited (0.06%) (42.16) (0.17%) (15.96) – – (0.19%) (15.96)L&T Finance Limited 13.33% 8893.59 3.84% 366.29 14.46% (149.37) 2.55% 216.92 L&T Infra Investment Partners (The Fund) 0.73% 489.24 – 0.20 – – – 0.20
Developmental Projects:L&T Metro Rail (Hyderabad) Limited 2.76% 1842.71 (4.00%) (382.21) (0.47%) 4.85 (4.43%) (377.36)Sahibganj Ganges Bridge-Company
Private Limited – – – – – – – – Power Development:
L&T Arunachal Hydropower Limited – (0.18) – (0.07) – – – (0.07)L&T Himachal Hydropower Limited – (2.29) (0.01%) (1.29) – – (0.02%) (1.29)L&T Power Development Limited 4.28% 2854.22 (1.19%) (113.73) – – (1.34%) (113.73)L&T Uttaranchal Hydropower Limited 2.28% 1518.79 (0.06%) (5.74) – – (0.07%) (5.74)Nabha Power Limited 5.25% 3503.86 2.55% 243.03 (1.52%) 15.74 3.04% 258.77
Realty:Chennai Vision Developers Private Limited – (0.02) – (0.01) – – – (0.01)L&T Asian Realty Project LLP (0.05%) (30.77) (0.04%) (3.88) – – (0.05%) (3.88)L&T Parel Project LLP 0.34% 227.93 1.80% 171.71 – 0.02 2.03% 171.73 L&T Construction Equipment Limited 0.90% 599.29 2.51% 239.88 – – 2.82% 239.88 LTR SSM Private Limited – 0.05 – (0.05) – – – (0.05)L&T Seawoods Limited 4.11% 2744.20 0.40% 38.66 – (0.01) 0.45% 38.65 L&T Vision Ventures Limited (0.01%) (4.67) – (0.02) – – – (0.02)L&T Electricals and Automation Limited – 0.30 (0.02%) (1.73) – – (0.02%) (1.73)
Valves, Construction Equipment and Others: L&T Construction Machinery Limited 0.30% 199.74 0.02% 1.97 0.21% (2.19) – (0.22) L&T Valves Limited 0.64% 424.28 0.03% 3.34 1.75% (18.10) (0.17%) (14.76) Others:
Bhilai Power Supply Company Limited – 0.05 – – – – – – L&T Power Limited 0.01% 5.54 – 0.28 – – – 0.28 Kesun Iron and Steel Company Private
Limited – – – 0.27 – – – 0.27 L&T Aviation Services Private Limited 0.05% 34.82 0.01% 0.94 – (0.04) 0.01% 0.90 L&T Capital Company Limited 0.01% 5.04 – 0.16 – – – 0.16 L&T Infra Contractors Private Limited – (0.01) – – – – – –
Foreign Subsidiaries Infrastructure:
Larsen & Toubro (Oman) LLC 0.67% 446.44 0.25% 23.58 (3.84%) 39.61 0.75% 63.19 Larsen & Toubro Qatar LLC – 0.20 – (0.32) – 0.02 – (0.30)Larsen & Toubro Saudi Arabia LLC 0.84% 558.07 1.41% 134.95 (1.35%) 13.99 1.76% 148.94 Larsen & Toubro T&D SA (Proprietary)
Limited – 2.81 – 0.20 0.03% (0.36) – (0.16)Larsen & Toubro (East Asia) Sdn. Bhd. – 2.42 0.01% 1.31 (0.01%) 0.07 0.02% 1.38
NOTE [62] (contd.)
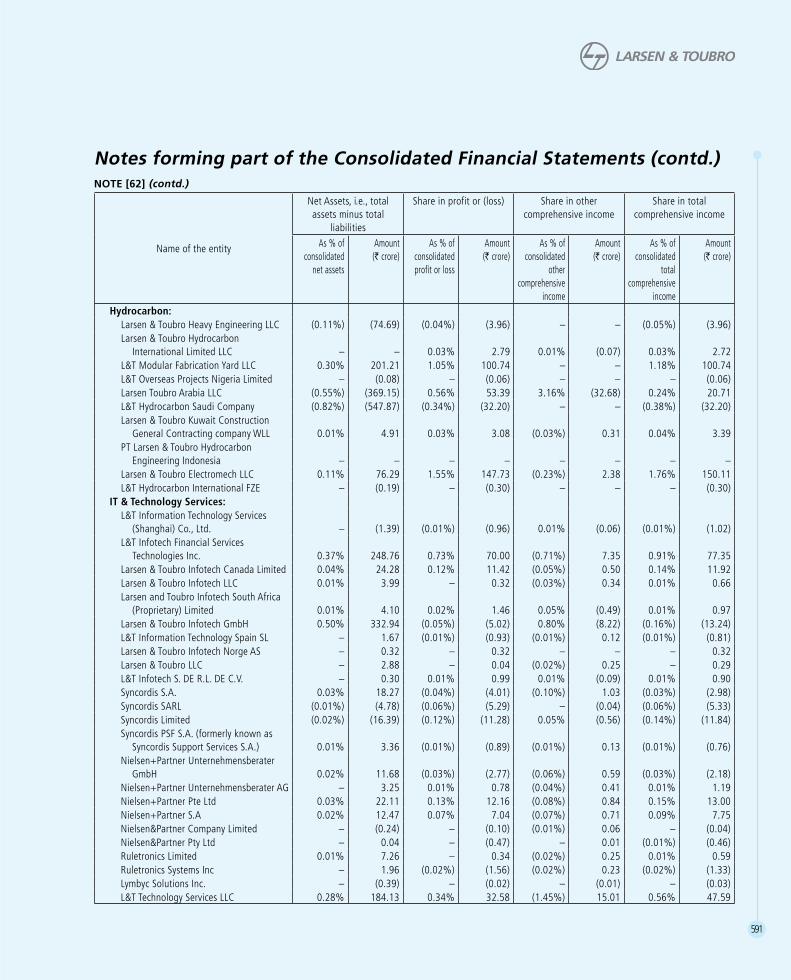
591
Notes forming part of the Consolidated Financial Statements (contd.)
Name of the entity
Net Assets, i.e., total assets minus total
liabilities
Share in profit or (loss) Share in other comprehensive income
Share in total comprehensive income
As % of consolidated
net assets
Amount (R crore)
As % of consolidated profit or loss
Amount (R crore)
As % of consolidated
other comprehensive
income
Amount (R crore)
As % of consolidated
total comprehensive
income
Amount (R crore)
Hydrocarbon:Larsen & Toubro Heavy Engineering LLC (0.11%) (74.69) (0.04%) (3.96) – – (0.05%) (3.96)Larsen & Toubro Hydrocarbon
International Limited LLC – – 0.03% 2.79 0.01% (0.07) 0.03% 2.72 L&T Modular Fabrication Yard LLC 0.30% 201.21 1.05% 100.74 – – 1.18% 100.74 L&T Overseas Projects Nigeria Limited – (0.08) – (0.06) – – – (0.06)Larsen Toubro Arabia LLC (0.55%) (369.15) 0.56% 53.39 3.16% (32.68) 0.24% 20.71 L&T Hydrocarbon Saudi Company (0.82%) (547.87) (0.34%) (32.20) – – (0.38%) (32.20)Larsen & Toubro Kuwait Construction
General Contracting company WLL 0.01% 4.91 0.03% 3.08 (0.03%) 0.31 0.04% 3.39 PT Larsen & Toubro Hydrocarbon
Engineering Indonesia – – – – – – – – Larsen & Toubro Electromech LLC 0.11% 76.29 1.55% 147.73 (0.23%) 2.38 1.76% 150.11 L&T Hydrocarbon International FZE – (0.19) – (0.30) – – – (0.30)
IT & Technology Services:L&T Information Technology Services
(Shanghai) Co., Ltd. – (1.39) (0.01%) (0.96) 0.01% (0.06) (0.01%) (1.02)L&T Infotech Financial Services
Technologies Inc. 0.37% 248.76 0.73% 70.00 (0.71%) 7.35 0.91% 77.35 Larsen & Toubro Infotech Canada Limited 0.04% 24.28 0.12% 11.42 (0.05%) 0.50 0.14% 11.92 Larsen & Toubro Infotech LLC 0.01% 3.99 – 0.32 (0.03%) 0.34 0.01% 0.66 Larsen and Toubro Infotech South Africa
(Proprietary) Limited 0.01% 4.10 0.02% 1.46 0.05% (0.49) 0.01% 0.97 Larsen & Toubro Infotech GmbH 0.50% 332.94 (0.05%) (5.02) 0.80% (8.22) (0.16%) (13.24)L&T Information Technology Spain SL – 1.67 (0.01%) (0.93) (0.01%) 0.12 (0.01%) (0.81)Larsen & Toubro Infotech Norge AS – 0.32 – 0.32 – – – 0.32 Larsen & Toubro LLC – 2.88 – 0.04 (0.02%) 0.25 – 0.29 L&T Infotech S. DE R.L. DE C.V. – 0.30 0.01% 0.99 0.01% (0.09) 0.01% 0.90 Syncordis S.A. 0.03% 18.27 (0.04%) (4.01) (0.10%) 1.03 (0.03%) (2.98)Syncordis SARL (0.01%) (4.78) (0.06%) (5.29) – (0.04) (0.06%) (5.33)Syncordis Limited (0.02%) (16.39) (0.12%) (11.28) 0.05% (0.56) (0.14%) (11.84)Syncordis PSF S.A. (formerly known as
Syncordis Support Services S.A.) 0.01% 3.36 (0.01%) (0.89) (0.01%) 0.13 (0.01%) (0.76)Nielsen+Partner Unternehmensberater
GmbH 0.02% 11.68 (0.03%) (2.77) (0.06%) 0.59 (0.03%) (2.18)Nielsen+Partner Unternehmensberater AG – 3.25 0.01% 0.78 (0.04%) 0.41 0.01% 1.19 Nielsen+Partner Pte Ltd 0.03% 22.11 0.13% 12.16 (0.08%) 0.84 0.15% 13.00 Nielsen+Partner S.A 0.02% 12.47 0.07% 7.04 (0.07%) 0.71 0.09% 7.75 Nielsen&Partner Company Limited – (0.24) – (0.10) (0.01%) 0.06 – (0.04)Nielsen&Partner Pty Ltd – 0.04 – (0.47) – 0.01 (0.01%) (0.46)Ruletronics Limited 0.01% 7.26 – 0.34 (0.02%) 0.25 0.01% 0.59 Ruletronics Systems Inc – 1.96 (0.02%) (1.56) (0.02%) 0.23 (0.02%) (1.33)Lymbyc Solutions Inc. – (0.39) – (0.02) – (0.01) – (0.03)L&T Technology Services LLC 0.28% 184.13 0.34% 32.58 (1.45%) 15.01 0.56% 47.59
NOTE [62] (contd.)
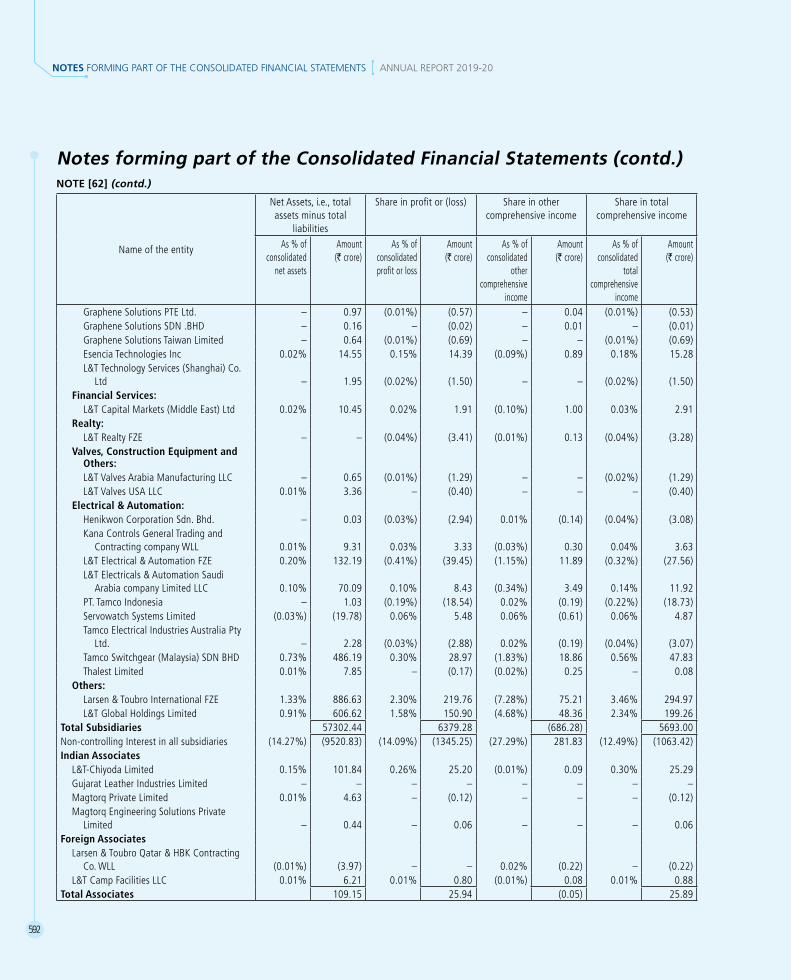
592
NOTES FORMING PART OF THE CONSOLIDATED FINANCIAL STATEMENTS ANNUAL REPORT 2019-20
Notes forming part of the Consolidated Financial Statements (contd.)
Name of the entity
Net Assets, i.e., total assets minus total
liabilities
Share in profit or (loss) Share in other comprehensive income
Share in total comprehensive income
As % of consolidated
net assets
Amount (R crore)
As % of consolidated profit or loss
Amount (R crore)
As % of consolidated
other comprehensive
income
Amount (R crore)
As % of consolidated
total comprehensive
income
Amount (R crore)
Graphene Solutions PTE Ltd. – 0.97 (0.01%) (0.57) – 0.04 (0.01%) (0.53)Graphene Solutions SDN .BHD – 0.16 – (0.02) – 0.01 – (0.01)Graphene Solutions Taiwan Limited – 0.64 (0.01%) (0.69) – – (0.01%) (0.69)Esencia Technologies Inc 0.02% 14.55 0.15% 14.39 (0.09%) 0.89 0.18% 15.28 L&T Technology Services (Shanghai) Co.
Ltd – 1.95 (0.02%) (1.50) – – (0.02%) (1.50) Financial Services: L&T Capital Markets (Middle East) Ltd 0.02% 10.45 0.02% 1.91 (0.10%) 1.00 0.03% 2.91 Realty:
L&T Realty FZE – – (0.04%) (3.41) (0.01%) 0.13 (0.04%) (3.28)Valves, Construction Equipment and
Others:L&T Valves Arabia Manufacturing LLC – 0.65 (0.01%) (1.29) – – (0.02%) (1.29)L&T Valves USA LLC 0.01% 3.36 – (0.40) – – – (0.40)
Electrical & Automation:Henikwon Corporation Sdn. Bhd. – 0.03 (0.03%) (2.94) 0.01% (0.14) (0.04%) (3.08)Kana Controls General Trading and
Contracting company WLL 0.01% 9.31 0.03% 3.33 (0.03%) 0.30 0.04% 3.63 L&T Electrical & Automation FZE 0.20% 132.19 (0.41%) (39.45) (1.15%) 11.89 (0.32%) (27.56)L&T Electricals & Automation Saudi
Arabia company Limited LLC 0.10% 70.09 0.10% 8.43 (0.34%) 3.49 0.14% 11.92 PT. Tamco Indonesia – 1.03 (0.19%) (18.54) 0.02% (0.19) (0.22%) (18.73)Servowatch Systems Limited (0.03%) (19.78) 0.06% 5.48 0.06% (0.61) 0.06% 4.87 Tamco Electrical Industries Australia Pty
Ltd. – 2.28 (0.03%) (2.88) 0.02% (0.19) (0.04%) (3.07)Tamco Switchgear (Malaysia) SDN BHD 0.73% 486.19 0.30% 28.97 (1.83%) 18.86 0.56% 47.83 Thalest Limited 0.01% 7.85 – (0.17) (0.02%) 0.25 – 0.08
Others: Larsen & Toubro International FZE 1.33% 886.63 2.30% 219.76 (7.28%) 75.21 3.46% 294.97 L&T Global Holdings Limited 0.91% 606.62 1.58% 150.90 (4.68%) 48.36 2.34% 199.26 Total Subsidiaries 57302.44 6379.28 (686.28) 5693.00 Non-controlling Interest in all subsidiaries (14.27%) (9520.83) (14.09%) (1345.25) (27.29%) 281.83 (12.49%) (1063.42)Indian Associates
L&T-Chiyoda Limited 0.15% 101.84 0.26% 25.20 (0.01%) 0.09 0.30% 25.29 Gujarat Leather Industries Limited – – – – – – – – Magtorq Private Limited 0.01% 4.63 – (0.12) – – – (0.12)Magtorq Engineering Solutions Private
Limited – 0.44 – 0.06 – – – 0.06 Foreign Associates
Larsen & Toubro Qatar & HBK Contracting Co. WLL (0.01%) (3.97) – – 0.02% (0.22) – (0.22)
L&T Camp Facilities LLC 0.01% 6.21 0.01% 0.80 (0.01%) 0.08 0.01% 0.88 Total Associates 109.15 25.94 (0.05) 25.89
NOTE [62] (contd.)

593
Notes forming part of the Consolidated Financial Statements (contd.)
Name of the entity
Net Assets, i.e., total assets minus total
liabilities
Share in profit or (loss) Share in other comprehensive income
Share in total comprehensive income
As % of consolidated
net assets
Amount (R crore)
As % of consolidated profit or loss
Amount (R crore)
As % of consolidated
other comprehensive
income
Amount (R crore)
As % of consolidated
total comprehensive
income
Amount (R crore)
Indian Joint Ventures Power:
L&T-MHPS Boilers Private Limited 1.32% 883.79 1.67% 159.22 (0.18%) 1.81 1.89% 161.03 L&T-MHPS Turbine Generators Private
Limited 0.25% 169.81 0.26% 25.06 0.19% (1.96) 0.27% 23.10 L&T Howden Private Limited 0.08% 52.86 0.09% 7.48 – (0.01) 0.09% 7.47 L&T-Sargent & Lundy Limited 0.06% 41.08 0.13% 11.29 0.07% (0.69) 0.12% 10.60
Heavy Engineering:L&T Special Steels and Heavy Forgings
Private Limited (1.15%) (765.89) (1.72%) (164.37) 0.02% (0.19) (1.93%) (164.56) Defence Engineering: L&T MBDA Missile Systems Limited – (0.57) (0.01%) (1.02) – – (0.01%) (1.02) Hydrocarbon: L&T Sapura Offshore Private Limited – 0.29 – – – – – – L&T Sapura Shipping Private Limited 0.47% 316.64 (0.12%) (11.63) (2.67%) 27.54 0.19% 15.91 L&T-Gulf Private Limited – – (0.04%) (3.68) – – (0.04%) (3.68) Developmental Projects:
L&T Infrastructure Development Projects Limited (Consolidated) 1.40% 931.81 (1.52%) (144.85) (2.77%) 28.56 (1.37%) (116.29)
Others:Raykal Aluminium Company Private
Limited – 0.20 – (0.03) – – – (0.03)Foreign Joint Ventures Hydrocarbon:
Indiran Engineering Projects & Systems, Kish, (PJSC) – (0.27) – 0.08 – 0.05 – 0.13
L&T Hydrocarbon Caspian LLC – – – – – – – – Total Joint Ventures 1629.75 (122.45) 55.11 (67.34)CFS Adjustment and elimination (52.41%) (34972.64) (21.65%) (2067.70) 15.93% (164.52) (26.21%) (2232.22)Total 66723.22 9549.03 (1032.83) 8516.20
NOTE [63]
There are no amounts due and outstanding to be credited to Investor Education & Protection Fund as at March 31, 2020.
NOTE [64]
Figures for the previous year have been regrouped/re-classified to conform to the figures of the current year.
NOTE [62] (contd.)