Low-waged and Informal Employment in South Africa
37
TRANSFORMATION 60 (2006) ISSN 0258-7696 90 Article Low-waged and informal employment in South Africa Imraan Valodia, Likani Lebani, Caroline Skinner and Richard Devey Introduction This paper forms one component of a larger project of the Human Sciences Research Council (HSRC) to assess the state of knowledge of the labour market in South Africa, and to identify research gaps. Our paper has two primary objectives: to outline the extent and incidence of low-waged employment in South Africa and to review the literature on informal employment, one important component of low-waged employment. We begin by provided a statistical overview of low-waged employment using the Labour Force Survey of March 2000 and March 2004. Based on these data, we summarise trends in low-waged employment. In Section B, we focus on informal employment in South Africa, and discuss some of the conceptual and statistical literature and apply it to the South African context. Section C provides trends on informal employment. Section D, using a unique panel drawn from the Labour Force Survey, provides analysis of some of the linkages between informal employment and other labour market statuses, including unemployment. Finally, in Section E, based both on our analysis of low-waged employment and on the review of the informal economy, we offer some suggestions for a research agenda. The issues of low-waged employment and informal employment are both important considerations for labour market policy in South Africa. One of the key debates about employment in South Africa is the relationship between wages and employment, with the argument often made that the high levels of unemployment in South Africa are a result of rapid increases in wages, particularly of unskilled black workers (see Fallon and Lucas 1998, Lewis 2002). In the last comprehensive overview study of the labour market
Transcript of Low-waged and Informal Employment in South Africa

TRANSFORMATION 60 (2006) ISSN 0258-7696 90
Article
Low-waged and informal employment inSouth Africa
Imraan Valodia, Likani Lebani, Caroline Skinner andRichard Devey
IntroductionThis paper forms one component of a larger project of the Human SciencesResearch Council (HSRC) to assess the state of knowledge of the labourmarket in South Africa, and to identify research gaps. Our paper has twoprimary objectives: to outline the extent and incidence of low-wagedemployment in South Africa and to review the literature on informalemployment, one important component of low-waged employment. Webegin by provided a statistical overview of low-waged employment usingthe Labour Force Survey of March 2000 and March 2004. Based on thesedata, we summarise trends in low-waged employment. In Section B, wefocus on informal employment in South Africa, and discuss some of theconceptual and statistical literature and apply it to the South Africancontext. Section C provides trends on informal employment. Section D,using a unique panel drawn from the Labour Force Survey, providesanalysis of some of the linkages between informal employment and otherlabour market statuses, including unemployment. Finally, in Section E,based both on our analysis of low-waged employment and on the review ofthe informal economy, we offer some suggestions for a research agenda.
The issues of low-waged employment and informal employment are bothimportant considerations for labour market policy in South Africa. One ofthe key debates about employment in South Africa is the relationshipbetween wages and employment, with the argument often made that the highlevels of unemployment in South Africa are a result of rapid increases inwages, particularly of unskilled black workers (see Fallon and Lucas 1998,Lewis 2002). In the last comprehensive overview study of the labour market
Angelia Fell
muse_stamp

91
Low-waged and informal employment in South Africa
in South Africa, Standing et al (1996) reject this argument and point to theextreme inequalities in wage income and to the high levels of low-wagedincome in South Africa. Whatever the merits of these arguments may be, itis imperative that any assessment of labour market policy in South Africatakes cognisance of the high levels of low-waged income in the labourmarket.
The South African labour market has not been shielded from rapidgrowth in informal employment across the globe (see Standing 1999,Charmes 2000). As we show below, a large proportion of the workforce isemployed in the informal economy. Understanding trends and patterns ofinformal employment is critical for broader labour market policy for anumber of reasons. First, and related to low-wages, the increasinginformalisation of work has resulted in a segment of the workforce beingunable to access the formal institutions that govern the labour market, andthey do not have access to retirement provisions and medical insurance,which form part of the remuneration package for employees in formalemployment. As President Mbeki remarked recently, �casualisation hasproduced the phenomenon of the working poor�(who) have little say overtheir wages �(and) their employers are not required to provide them withmedical and retirement benefits� (Business Report July 25, 2005). Second,an understanding of informal economy employment is important forcontextualising policy discussions about employment and unemployment.What, for example, is the potential for the unemployed to enter informalemployment and then to progress to better paying, more secure forms ofemployment? Or, is the growth in informal employment largely the result ofthe �hollowing out� of the lower segments of formal employment as firmsrestructure in response to a more open international trade environment? Isthe distinction between formal and informal employment really appropriatefor South Africa?
Section A: Low-waged employment in the South African labourmarketWe employ two simple benchmarks to assess low-waged employment inSouth Africa � earnings below R2,500 per month, and earnings belowR1,000 per month. Table 1 shows the distribution of low-waged workers inSouth Africa. On this basis, a large proportion of workers employed inSouth Africa earn low incomes. On the basis of the 2000 Labour ForceSecurity (LFS), 77.8 per cent of the workers fall under the low-wagedcategory when a R2,500 cut off point is used. A R1,000 cut off point results

92
Imraan Valodia, Likani Lebani, Caroline Skinner and Richard Devey
in 53 per cent of workers being classified as low-waged. In 2004 there is aslightly more than 10 percentage point decrease in the proportion of low-waged workers for both cut off points. Adopting a more stringent cut offpoint of earnings of R500 per month to classify low-waged employment stillresults in a high proportion of workers being classified in the low-wagedsector: 38 per cent and 19 per cent for 2000 and 2004 respectively.
Table 1: Distribution of low-waged workers in South Africa
Source: Authors� calculations from Stats SA (2001) and Stats SA(2004).
The data presented in Table 1 may be criticised for not adjusting wagesfor inflation effects � that the supposed reduction in low-waged employmentbetween 2000 and 2004 is simply an inflation effect. Unfortunately, the LFSdata for wages are collected in income bands which are not easily adjustedto allow for comparisons in real wages. Thus, the data for 2000 and 2004should not be compared � we simply present an indication of the extent oflow-waged employment using two benchmarks (earning below R1,000 andR2,500 per month) and two points in time (2000 and 2004).
However, in order to provide some indication of changes in low-wagedemployment over the period 2000 and 2004, Table 2 allows for someadmittedly inexact comparisons. The benchmarks, R1,000 and R2,500 permonth for 2000, have been adjusted to the closest possible inflationadjusted incomes benchmarks for 2004, respectively R1,500 and R3,500.These data show that between 2000 and 2004 there has been some reductionin low-waged employment in South Africa. It should be stressed, however,that these data are inexact and are shown for illustrative purposes only.
LFS 2000 LFS 2004
<=R2500 <=R1000 <=R2500 <=R1000
No. % No. % No. % No. %
Low-waged 8697262 77.8 5958388 53.3 7379357 65.0 4423904 39.0
Non-Low-waged
2477033 22.2 5215907 46.7 3978483 35.0 6933936 61.0
Total employed reporting wages
11174295 100.0 11174295 100.0 11357840 100.0 11357840 100.0

93
Low-waged and informal employment in South Africa
Table 2: Distribution of low-waged workers in South Africa � adjustedfor real incomes
Source: Authors� calculations from Stats SA (2001) and Stats SA (2004).
Using the March 2004 LFS only, Table 3 shows the distribution of wagesin the employed workforce. We see a concentration of the workforce in thelower income bands, with 58 per cent of the workforce earning betweenR200 and R2,500.
Table 3: Distribution of wages of the employed, LFS March 2004
Source: Authors� calculations from Stats SA (2001) and Stats SA (2004).
Frequency Percent Valid
Percent Cumulative
Percent None
R1-200 R201-500
R501-1000 R1001-1500 R1501-2500 R2501-3500 R3501-4500 R4501-6000 R6001-8000
R8001-11000 R11001-16000 R16001-30000
R30000+
276543 535212
1304487 2195499 1271590 1661159 974044 653423 747599 567995 438614 291266 204089 69795
2.3 4.5
10.9 18.3 10.6 13.9
8.1 5.5 6.2 4.7 3.7 2.4 1.7 0.6
2.5 4.8
11.7 19.6 11.4 14.8
8.7 5.8 6.7 5.1 3.9 2.6 1.8 0.6
2.57.3
18.938.549.964.773.479.386.091.095.097.699.4
100.0
Income
Total 11191315 93.4 100.0
Don�t know Refuse
Unspecified
257788 520514 14878
2.2 4.3 .1
Missing
Total 793181 6.6
Total 11984496 100.0

94
Imraan Valodia, Likani Lebani, Caroline Skinner and Richard Devey
Table 4 shows the racial composition of the low-waged workforce in theSouth African labour market. Using a cut off point of R2,500, these data for2000 show the racial composition of the low-waged workforce: 82 per centare black, 11 per cent are coloured, 2 per cent are Indian and 5 per cent arewhite. A lower cut off point of R1,000 results in an increase in theproportion of low-waged workers classified as black and a correspondingdecrease for other race groups. For the year 2004, a similar scenarioobtains, except that the numbers of workers classified as low-wageddecreases.
Table 4: Racial composition of low-waged workers
Source: Authors� calculations from Stats SA (2001) and Stats SA(2004).
Table 5 tabulates the distribution of low-waged workers within populationgroups. The highly skewed racial pattern of waged-income is most evidentin this table. Based on the 2004 LFS almost half (47 per cent) of blackworkers earn an income below R1,000 per month. At the higher cut-off,R2,500, almost three quarters (74 per cent) of African workers are classifiedas low-waged workers.
LFS 2000 LFS 2004
<=R2500 <=R1000 <=R2500 <=R1000
No. % No. % No. % No. %
Black 7125579 81.9 5238434 87.9 6150520 83.3 3889645 87.9
Coloured 918892 10.6 519487 8.7 880245 11.9 442140 10.0
Indian 195177 2.2 68493 1.1 111359 1.5 22024 0.5
White 450621 5.2 128153 2.2 234191 3.2 70096 1.6
Other 6992 0.1 3821 0.1 2711 0.0
Unspecified 331 0.0
Total 8697261 100.0 5958388 100.0 7379357 100.0 4423905 100.0

95
Low-waged and informal employment in South Africa
Table 5: Distribution of low-waged workers within racial groups
Source: Authors� calculations from Stats SA (2001) and Stats SA.(2004).
Table 6 shows the gender distribution within low-waged employment. Theyear 2000 had an equal proportion of males and females earning at mostR2,500. At the lower cut-off of R1,000, the proportion of women workersincreases, as it does in the more recent period. This trend would beconsistent with evidence that women earn lower incomes than men.
Table 6: Gender distribution of low-waged workers
Source: Authors� calculations from Stats SA (2001) and Stats SA(2004).
Table 7 shows the age distribution of low-waged workers. In both periodsthe majority of low-waged workers are aged between 25 and 34 years
LFS 2000 LFS 2004
<=R2500 <=R1000 <=R2500 <=R1000
No. % No. % No. % No. %
African 7125579 89.4 5238434 65.8 6150520 74.4 3889645 47.0
Coloured 918892 77.2 519487 43.7 880245 59.9 442140 30.1
Indian 195177 57.1 68493 20.0 111359 26.2 22024 5.2
White 450621 27.0 128153 7.7 234191 11.9 70096 3.6
Other 6992 87.9 3821 48.0 2711
Unspecified 331
Total 8697262 5958388 7379357 4423904

96
Imraan Valodia, Likani Lebani, Caroline Skinner and Richard Devey
irrespective of the income bracket used. On average, 70 per cent of low-waged workers are below 44 years for both income brackets and years.
Table 7: Age distribution of low-waged workers
Source: Authors� calculations from Stats SA (2001) and Stats SA(2004).
Table 8 shows the marital status of low-waged workers. For both years andboth cut-off points there is a high proportion of low-waged workers who areclassified either as married or living together. The proportion of householdswith such a marital status ranges from 45 to 51 per cent.
Table 8: Marital Status of low-waged workers
Source: Authors� calculations from Stats SA (2001) and Stats SA(2004).
LFS 2000 LFS 2004
<=R2500 <=R1000 <=R2500 <=R1000
No. % No. % No. % No. %
15-24 1428733 16.4 1099728 18.5 903628 12.2 615430 13.9
25-34 2545065 29.3 1680254 28.2 2300809 31.2 1308407 29.6
35-44 2220697 25.5 1395638 23.4 2153221 29.2 1203287 27.2
45-54 1312093 15.1 862499 14.5 1350461 18.3 821260 18.6
55-64 730695 8.4 547548 9.2 518801 7.0 352372 8.0
65+ 459978 5.3 372722 6.3 152438 2.1 123148 2.8
Total 8697261 100.0 5958389 100.0 7379358 100.0 4423904 100.0

97
Low-waged and informal employment in South Africa
Table 9 shows the education levels of low-waged workers. Education playsan important role in access to high paid work. Over three-quarters of low-waged workers do not have a matric school leaving certificate.
Table 9: Education levels of low-waged workers
Source: Authors� calculations from Stats SA (2001) and Stats SA(2004).
Table 10: Training in skills that can be used for work
Source: Authors� calculations from Stats SA (2001) and Stats SA(2004).
Table 10 shows the number of low-waged worker that have receivedtraining in some form of skill that can be used for work. In the year 2000,just 14 per cent of low-waged workers were trained in skills that can be usedfor work (using the R2,500 cut off point). Though the number of trainedworkers decreased in 2004, the apparent trend is that the lower the cut offmark, the fewer the number of people that are trained in work-related skills.Somewhat surprisingly, as shown in Table 11, the majority of workers in
LFS 2000 LFS 2004
<=R2500 <=R1000 <=R2500 <=R1000
No. % No. % No. % No. %
Noeducation
1106919 12.9 973378 16.5 714330 9.7 585368 13.3
Pre matric
5870286 68.2 4212984 71.4 4995424 68.0 3150108 71.5
Matric 1226067 14.2 579044 9.8 1375982 18.7 573026 13.0
Tertiary 409711 4.8 137012 2.3 255983 3.5 96723 2.2
Total 8612983 100.0 5902418 100.0 7341719 100.0 4405225 100.0
98
Imraan Valodia, Likani Lebani, Caroline Skinner and Richard Devey
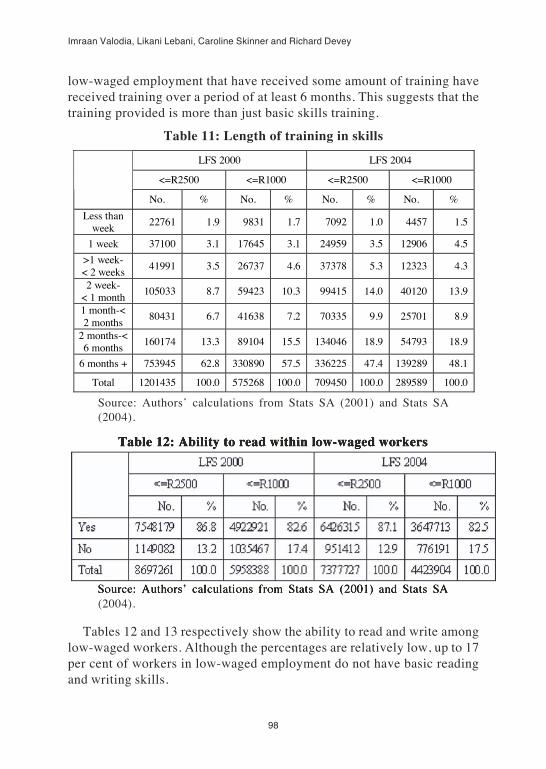
low-waged employment that have received some amount of training havereceived training over a period of at least 6 months. This suggests that thetraining provided is more than just basic skills training.
Table 11: Length of training in skills
Source: Authors� calculations from Stats SA (2001) and Stats SA(2004).
Table 12: Ability to read within low-waged workers
Source: Authors� calculations from Stats SA (2001) and Stats SA(2004).
Tables 12 and 13 respectively show the ability to read and write amonglow-waged workers. Although the percentages are relatively low, up to 17per cent of workers in low-waged employment do not have basic readingand writing skills.
LFS 2000 LFS 2004
<=R2500 <=R1000 <=R2500 <=R1000
No. % No. % No. % No. %
Less than week
22761 1.9 9831 1.7 7092 1.0 4457 1.5
1 week 37100 3.1 17645 3.1 24959 3.5 12906 4.5
>1 week- < 2 weeks
41991 3.5 26737 4.6 37378 5.3 12323 4.3
2 week- < 1 month
105033 8.7 59423 10.3 99415 14.0 40120 13.9
1 month-< 2 months
80431 6.7 41638 7.2 70335 9.9 25701 8.9
2 months-< 6 months
160174 13.3 89104 15.5 134046 18.9 54793 18.9
6 months + 753945 62.8 330890 57.5 336225 47.4 139289 48.1
Total 1201435 100.0 575268 100.0 709450 100.0 289589 100.0

99
Low-waged and informal employment in South Africa
Table 13: Ability to write within low-waged workers
Source: Authors� calculations from Stats SA (2001) and Stats SA(2004).
Table 14: Type of employment, low-waged workers
Source: Authors� calculations from Stats SA (2001) and Stats SA(2004).
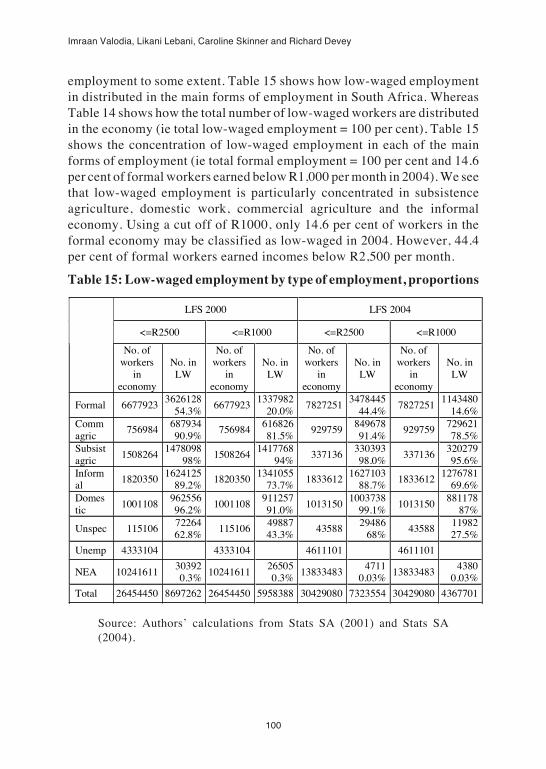
Table 14 shows how low-waged employment is distributed in the economy.In 2004, based on a cut off of R1,000 per month, most low-waged workerswere in the informal sector, but large numbers of workers in the formaleconomy also earned below R1,000 per month. Using the higher cut offpoint of R2,500 increases the number of workers in formal employment thatmay be classified as low-waged. The dominance of formal employment inthe South African labour market distorts the concentration of low-waged
LFS 2000 LFS 2004
<=R2500 <=R1000 <=R2500 <=R1000
No. % No. % No. % No. %
Formal 3626128 41.7 1337982 22.5 3478445 47.2 1143480 25.9
Comm agric
687934 7.9 616826 10.4 849678 11.5 729621 16.5
Subsist agric
1693863 19.5 1674877 28.1 386195 5.2 376482 8.5
Informal 1624125 18.7 1341055 22.5 1627103 22.0 1276781 28.9
Domestic 962556 11.1 911257 15.3 1003738 13.6 881178 19.9
Unspec 72264 0.8 49887 0.8 29486 0.4 11982 0.3
Not eco active
30392 0.3 26505 0.4 4711 0.1 4380 0.1
Total 8697262 100.0 5958389 100.0 7379356 100.0 4423904 100.0
100
Imraan Valodia, Likani Lebani, Caroline Skinner and Richard Devey
employment to some extent. Table 15 shows how low-waged employmentin distributed in the main forms of employment in South Africa. WhereasTable 14 shows how the total number of low-waged workers are distributedin the economy (ie total low-waged employment = 100 per cent), Table 15shows the concentration of low-waged employment in each of the mainforms of employment (ie total formal employment = 100 per cent and 14.6per cent of formal workers earned below R1,000 per month in 2004). We seethat low-waged employment is particularly concentrated in subsistenceagriculture, domestic work, commercial agriculture and the informaleconomy. Using a cut off of R1000, only 14.6 per cent of workers in theformal economy may be classified as low-waged in 2004. However, 44.4per cent of formal workers earned incomes below R2,500 per month.
Table 15: Low-waged employment by type of employment, proportions
Source: Authors� calculations from Stats SA (2001) and Stats SA(2004).
LFS 2000 LFS 2004
<=R2500 <=R1000 <=R2500 <=R1000
No. of workers
in economy
No. in LW
No. of workers
in economy
No. in LW
No. of workers
in economy
No. in LW
No. of workers
in economy
No. in LW
Formal 66779233626128
54.3%6677923
133798220.0%
78272513478445
44.4%7827251
114348014.6%
Comm agric
75698468793490.9%
75698461682681.5%
92975984967891.4%
92975972962178.5%
Subsist agric
15082641478098
98%1508264
141776894%
33713633039398.0%
33713632027995.6%
Informal
18203501624125
89.2%1820350
134105573.7%
18336121627103
88.7%1833612
127678169.6%
Domestic
100110896255696.2%
100110891125791.0%
10131501003738
99.1%1013150
88117887%
Unspec 1151067226462.8%
1151064988743.3%
4358829486
68%43588
1198227.5%
Unemp 4333104 4333104 4611101 4611101
NEA 10241611303920.3%
10241611265050.3%
138334834711
0.03%13833483
43800.03%
Total 26454450 8697262 26454450 5958388 30429080 7323554 30429080 4367701
101
Low-waged and informal employment in South Africa
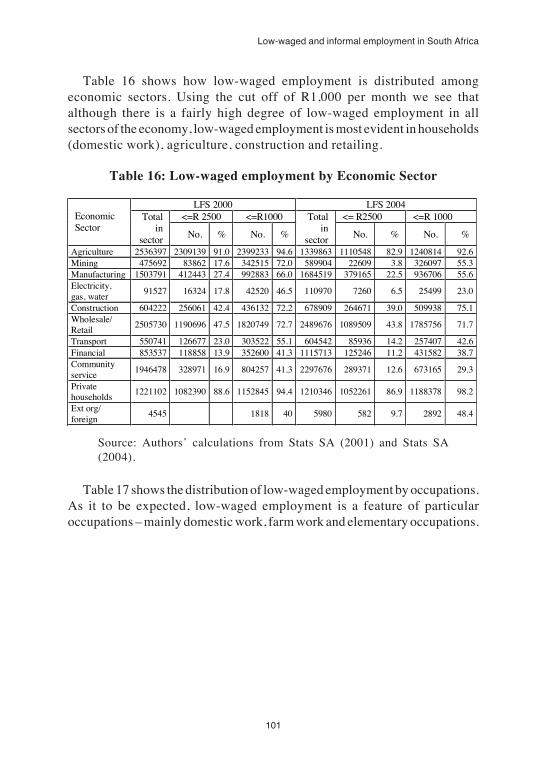
Table 16 shows how low-waged employment is distributed amongeconomic sectors. Using the cut off of R1,000 per month we see thatalthough there is a fairly high degree of low-waged employment in allsectors of the economy, low-waged employment is most evident in households(domestic work), agriculture, construction and retailing.
Table 16: Low-waged employment by Economic Sector
Source: Authors� calculations from Stats SA (2001) and Stats SA(2004).
Table 17 shows the distribution of low-waged employment by occupations.As it to be expected, low-waged employment is a feature of particularoccupations � mainly domestic work, farm work and elementary occupations.
LFS 2000 LFS 2004 <=R 2500 <=R1000 <= R2500 <=R 1000 Economic
Sector Total
in sector No. % No. %
Total in
sector No. % No. %
Agriculture 2536397 2309139 91.0 2399233 94.6 1339863 1110548 82.9 1240814 92.6Mining 475692 83862 17.6 342515 72.0 589904 22609 3.8 326097 55.3Manufacturing 1503791 412443 27.4 992883 66.0 1684519 379165 22.5 936706 55.6Electricity, gas, water
91527 16324 17.8 42520 46.5 110970 7260 6.5 25499 23.0
Construction 604222 256061 42.4 436132 72.2 678909 264671 39.0 509938 75.1Wholesale/ Retail
2505730 1190696 47.5 1820749 72.7 2489676 1089509 43.8 1785756 71.7
Transport 550741 126677 23.0 303522 55.1 604542 85936 14.2 257407 42.6Financial 853537 118858 13.9 352600 41.3 1115713 125246 11.2 431582 38.7Community service
1946478 328971 16.9 804257 41.3 2297676 289371 12.6 673165 29.3
Private households
1221102 1082390 88.6 1152845 94.4 1210346 1052261 86.9 1188378 98.2
Ext org/ foreign
4545 1818 40 5980 582 9.7 2892 48.4

102
Imraan Valodia, Likani Lebani, Caroline Skinner and Richard Devey
Table 17: Low-waged employment by occupations
Source: Authors� calculations from Stats SA (2001) and Stats SA(2004).
Table 18 shows the form of employment for low-waged workers. UsingR1,000 as the cut off to classify low-waged work, the data show that,although most low-waged workers have permanent employmentrelationships, a significant number are employed in temporary and casualjobs.
LFS 2000 LFS 2004
<=R1000 <=R2500 <=R1000 <=R2500 Occupation Total in Occup. Number % Number %
Total in Occup. Number % Number %
Management 652883 68284 10.5 163674 25.1 854060 47903 5.6 114552 13.4
Professionals 451142 15202 3.4 53833 11.9 549197 11350 2.1 31086 5.7
Technical 1075211 120323 11.2 359897 33.5 1196526 102407 8.6 248360 20.8
Clerks 1061895 156713 14.8 485743 45.7 1243450 149212 12.0 435002 35.0
Service and shop workers
1381317 583834 42.3 946610 68.5 1423499 456659 32.1 922919 64.8
Skilled agriculture
/fishery 1898871 1755337 92.4 1819068 95.8 366828 301575 82.2 321889 87.7
Craft & related
occupations 1461991 550798 37.7 1049901 71.8 1478906 439230 29.7 964732 65.2
Plant & machine operators
1160261 345653 29.8 904711 78.0 1228550 284614 23.2 852278 69.4
Elementary Occupations
2161677 1422302 65.8 1912929 88.5 2774158 1754959 63.3 2484982 89.6
Domestic workers
1022240 911257 89.1 962556 94.2 1022174 881537 86.2 1004097 98.2
Total 12327488 5929703 8658922 12137348 4429446 7379897

103
Low-waged and informal employment in South Africa
Table 18: Low-waged workers, type of employment
Source: Authors� calculations from Stats SA (2001) and Stats SA(2004).
Table 19: Low-waged workers, membership of trade unions
Source: Authors� calculations from Stats SA (2001) and Stats SA(2004).
Table 19 shows trade union membership among the low-waged. Only asmall proportion of those earning below R1,000 per month have trade unionmembership, and access to trade union services. At the higher level ofR2,500, just under one-fifth of workers belong to trade unions. Table 20elaborates on this, showing more detailed data on income and trade unionmembership. Trade union membership is associated with higher incomebrackets for both periods. There is less than 10 per cent of workers earningR500 or less who are members of a trade union. The implication is that thehigher the income the higher the likelihood that a worker is a trade unionmember.
LFS 2000 LFS 2004
<=R2500 <=R1000 <=R2500 <=R1000
No. % No. % No. % No. %
Permanent 4074358 70.8 1969765 60.1 3711559 63.3 1622406 50.7
Fixed per. contract
183582 3.2 105107 3.2 265108 4.5 114480 3.6
Temporary 898901 15.6 712834 21.7 1175409 20.0 913790 28.6
Casual 512978 8.9 408762 12.5 609799 10.4 459479 14.4
Seasonal 87298 1.5 85130 2.69 105031 1.8 90071 2.8
Total 5757117 100.0 3281598 100.0 5866906 100.0 3200226 100.0

104
Imraan Valodia, Likani Lebani, Caroline Skinner and Richard Devey
Table 20: Trade union membership, by income
Source: Authors� calculations from Stats SA (2001) and Stats SA(2004).
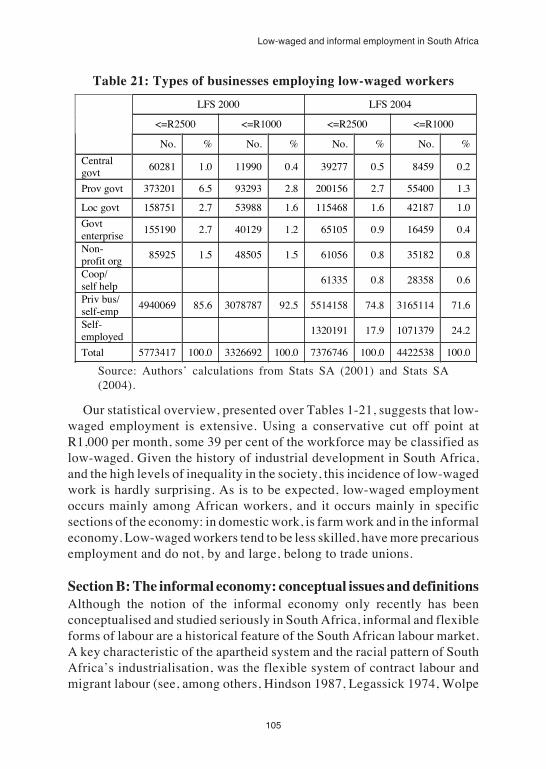
Table 21 shows low-waged work by the type of employer. The data showthat low-waged work occurs primarily in the private sector. Very smallnumbers of workers in the government and NGO sector are paid low wages.
LFS 2000 LFS 2004 Income category
Yes No Total Yes No Total
None 0
0.0% 3211 0.1%
3211 0.1%
00.0%
11507 0.2%
115070.2%
R1-200 38602 2.5%
568121 14.2%
606723 11.0%
8765 .8%
276834 5.8%
2855994.9%
R201-500 77300 5.1%
1148279 28.6%
1225579 22.1%
41801 3.8%
952009 20.1%
99381017.0%
R501-1000 294265 19.3%
1105361 27.5%
1399626 25.3%
168639 15.3%
1742542 36.8%
191118132.7%
R1001-1500 467530 30.7%
596826 14.9%
1064356 19.2%
234477 21.2%
907219 19.2%
114169619.6%
R1501-2500 647399 42.4%
591729 14.7%
1239128 22.4%
650865 58.9%
842915 17.8%
149378025.6%
Total 1525096 100.0%
4013527 100.0%
5538623 100.0%
1104547 100.0%
4733026 100.0%
5837573100.0%
105
Low-waged and informal employment in South Africa
Table 21: Types of businesses employing low-waged workers
Source: Authors� calculations from Stats SA (2001) and Stats SA(2004).
Our statistical overview, presented over Tables 1-21, suggests that low-waged employment is extensive. Using a conservative cut off point atR1,000 per month, some 39 per cent of the workforce may be classified aslow-waged. Given the history of industrial development in South Africa,and the high levels of inequality in the society, this incidence of low-wagedwork is hardly surprising. As is to be expected, low-waged employmentoccurs mainly among African workers, and it occurs mainly in specificsections of the economy: in domestic work, is farm work and in the informaleconomy. Low-waged workers tend to be less skilled, have more precariousemployment and do not, by and large, belong to trade unions.
Section B: The informal economy: conceptual issues and definitionsAlthough the notion of the informal economy only recently has beenconceptualised and studied seriously in South Africa, informal and flexibleforms of labour are a historical feature of the South African labour market.A key characteristic of the apartheid system and the racial pattern of SouthAfrica�s industrialisation, was the flexible system of contract labour andmigrant labour (see, among others, Hindson 1987, Legassick 1974, Wolpe
LFS 2000 LFS 2004
<=R2500 <=R1000 <=R2500 <=R1000
No. % No. % No. % No. %
Central govt
60281 1.0 11990 0.4 39277 0.5 8459 0.2
Prov govt 373201 6.5 93293 2.8 200156 2.7 55400 1.3
Loc govt 158751 2.7 53988 1.6 115468 1.6 42187 1.0
Govt enterprise
155190 2.7 40129 1.2 65105 0.9 16459 0.4
Non-profit org
85925 1.5 48505 1.5 61056 0.8 35182 0.8
Coop/ self help
61335 0.8 28358 0.6
Priv bus/ self-emp
4940069 85.6 3078787 92.5 5514158 74.8 3165114 71.6
Self-employed
1320191 17.9 1071379 24.2
Total 5773417 100.0 3326692 100.0 7376746 100.0 4422538 100.0

106
Imraan Valodia, Likani Lebani, Caroline Skinner and Richard Devey
1972). Related to the flexibility were high levels of unrecorded informaleconomy activities, particularly in African areas. Indeed, several micro-level studies conducted in the early 1980s suggested that extremely highlevels of informal economy activity were taking place (see for exampleCross and Preston-Whyte 1983, Webster 1984 on informal activity inSoweto, Wellings and Sutcliffe 1984 on informal activity in Durban).
Whilst the apartheid system forced many black South Africans to earntheir livelihoods in the informal economy by restricting their access to theformal economy, the apartheid state also actively constrained millions ofSouth Africans in their attempts to make a productive living throughinformal economy activities. Standing, Sender and Weeks (1996) list all theapartheid legislation that restricted the economic activities of African,coloured and Indian South Africans. The Black Urban Areas ConsolidationAct (25 of 1945) and the Group Areas Act (36 of 1966) restricted the rightof black entrepreneurs to establish and operate businesses. Apartheidlegalisation limited the range of goods that could be sold, blocked theformation of companies by blacks, and set up an array of bureaucraticprocesses that discouraged the registration of small-scale economic activity.The impact of repressive legislation on the development of black informaleconomy activities cannot be underestimated. For example, Davies (1987)conducted extensive surveys to investigate the major obstacles confrontingblack entrepreneurs in Port Elizabeth. He found that bureaucratic andpolitical controls were �without doubt, � the single most important factorthat has limited black entrepreneurial growth and development� (Davies1987:40). The findings were reiterated in similar studies of black micro-enterprises undertaken during the 1980s in Soweto, Port Elizabeth andDurban (Rogerson 1997:20). The restrictive environment in which thesebusinesses had to operate forced them to be largely of a survivalist nature.Although the legislation was relaxed in the late 1980s and early 1990s,apartheid history has impacted on the nature of informal activity takingplace today. Within the retail sector Lund (1998) points out how manycommentators have noted the lack of diversity in South African trading incomparison to other African countries. Particularly striking in a comparativeAfrican context is the extent to which informal manufacturing activities inSouth Africa are underdeveloped. In their study of home-based workconducted in the early 1990s, Manning and Mashigo (1993:31) note thatwhere manufacturing did occur, discrimination against blacks resulted inAfrican-owned micro-enterprises being located in those segments of the

107
Low-waged and informal employment in South Africa
manufacturing sectors that were of lowest value, poorest in quality and leastlucrative.
With the heightened political activity of the 1980s and the onset ofreform, there was renewed interest in the informal sector, with much of thepopular writing celebrating the energy of the informal sector (the emergenceof the minibus industry, for example), and the emergence of new blackentrepreneurship and economic opportunity. Preston-Whyte and Rogerson�s(1991) volume on the informal economy marked the first sober assessmentof the emerging informal sector, with rich case studies documenting informalactivity in a range of industries, and raising some of the important policyissues at the time.
The onset of the political transition and the necessity to develop industrialand labour market policy for post apartheid South Africa led to someanalyses of the possibilities to expand employment in the informal economy.This issue was taken up by the Industrial Strategy Project (Joffe et al 1995,Manning and Mashigo 1993). Much of this later focus was linked to policyon small business development and was quite influential in the White Paper(WP) on Small Business Development of the Department of Trade andIndustry (DIT). This government WP on the SMME sector distinguishesfour categories of SMMEs; medium enterprises (assets of about R5 million),small enterprises (employ between 5 and 50), micro-enterprises (involvingowner, some family members and one or two employees) and survivalistenterprises, which comprises the bulk of the informal economy in SouthAfrica. The WP recommends that different support strategies are requiredfor each category of the SMME sector. Yet, whilst outlining concreteproposals for the small, medium and micro categories, the WP is mute onsupport strategies for the survivalist category, which is really our area ofinterest. Budlender et al (2004) argue that whilst the government�s WP onsmall business recognises that the survivalist sector has the largestconcentration of women and lists as one of its key objectives to �support theadvancement of women in all business sectors�, the DTI offers very little,if any, support to those operating in the survivalist segment of the informaleconomy. Lund (1998:11) argues that �it would seem that the SMMEpolicy�has little relevance for the survivalist sector � in particular forwomen street traders and home-based workers. What is seen by policymakers as a micro-enterprise is not micro enough. And though the governmentespouses policy support for the development of micro-enterprise, little inthe way of material support has been allocated so far�.

108
Imraan Valodia, Likani Lebani, Caroline Skinner and Richard Devey
As in other contexts, the literature in South Africa has been concernedwith issues of definition. Despite Peattie�s (1987) critique of the term�informal sector� as an �utterly fuzzy� concept and her suggestion that thoseinterested in policy and analysis of this phenomenon should start byabandoning the concept, the concept continues to be used in all countries,including South Africa. Since Keith Hart (1973) first coined the phrase�informal sector� in the early 1970s to describe the range of subsistenceactivities of the urban poor, there has been considerable debate about whatexactly the term refers to. The most quoted definition is that contained in theInternational Labour Organisation�s Kenya Report (1972:6) in whichinformal activities are defined as �a way of doing things�, characterised by�ease of entry; reliance on indigenous resources; family ownership ofenterprises; small scale of operation; labour intensive and adaptedtechnology; skill acquired outside of the formal school system; andunregulated and competitive markets�.
For our purposes, two important points are worth noting. First the term�informal sector� disguises a significant degree of heterogeneity. Informalactivities encompass different types of economic activity (trading, collecting,providing a service, and manufacturing), different employment relations(the self employed, paid and unpaid workers, and disguised wage workers)and activities with different economic potential (survivalist activities andsuccessful small enterprises). A second and related problem is the distinctionbetween the formal and informal �sectors� as if there was a clear linedividing the two. Closer analysis of this phenomenon demonstrates thatthey are integrally linked. With the exception of illegal activities there arefew examples of informal operators who are not linked (either throughsupply or customer networks) into the formal economy. As Peattie (1987:858)points out, �if we think about the world in terms of a formal and informalsector we will be glossing over the linkages which are critical for a workingpolicy and which constitute the most difficult elements politically in policydevelopment�.
Using the term informal �economy� rather than informal �sector� partiallyaddresses such concerns. The term �economy� implies a greater range ofactivities than �sector�. If both formal and informal activities are seen aspart of the economy we are better able to see the linkages between the two.Implied in the notion �in�formal is that there is a formal, a norm, againstwhich these other activities can be compared. As with any norm this will betime and context specific. With respect to the labour market Eapen

109
Low-waged and informal employment in South Africa
(2001:2390) points out how some analysts (eg Papola 1980, Banerjee 1985)defined informality in terms of the absence of characteristics that belong to�formal� activities, like security/regularity of work, better earnings, existenceof non-wage and long term benefits, protective legislation and unionprotection. She goes on to point out that in a situation in which a number ofactivities within the formal sector are getting �informalised� and private,small scale processing/manufacturing enterprises are growing, �theborderline becomes blurred�. Considering this issue from another angle,Bromley (1995:146) asks �if an enterprise is required to have six officialpermits, for example, but only has five, should it be considered informaleven when the sixth derives from a moribund regulation that mostentrepreneurs ignore?� She goes on to conclude: �formality and informalityare really the opposite poles of a continuum with many intermediate andmixed cases� (Bromley 1995:146).
For statistical purposes, the accepted international standard for definingthe informal sector was agreed in a resolution at the 15th InternationalConference for Labour Statistics (ICLS). An important criterion of theICLS definition is that employment in the informal economy is based on thecharacteristics of the enterprise in which the person is employed instead ofthe characteristics of the worker employed. The ICLS definition recommendsthat informal sector enterprises be defined in terms of one or more of thefollowing criteria:� non registration of the enterprise in terms of national legislation such as
taxation or other commercial legislation;� non-registration of employees of the enterprise in terms of labour
legislation;� small size of the enterprise in terms of the numbers of people employed.
Statistics South Africa (SSA) uses this employment based definition inorder to derive estimates of informal employment in South Africa. The ILO(2002) and the 17th ICLS have recently proposed a definition of the informaleconomy which is based on the employment characteristics of the worker.The 2002 International Labour Conference proposes the following definition:The informal economy comprises informal employment (without securecontracts, worker benefits or social protection) of two kinds. The first isinformal employment in informal enterprises (small unregistered orunincorporated enterprises) including employers, employees, own accountoperators, and unpaid family workers in informal enterprises. The secondis informal employment outside informal enterprises (for formal enterprises,
110
Imraan Valodia, Likani Lebani, Caroline Skinner and Richard Devey
for households or with no fixed employer), including: domestic workers,casual or day labourers, temporary or part-time workers, industrialoutworkers (including home based workers), and unregistered or undeclaredworkers.
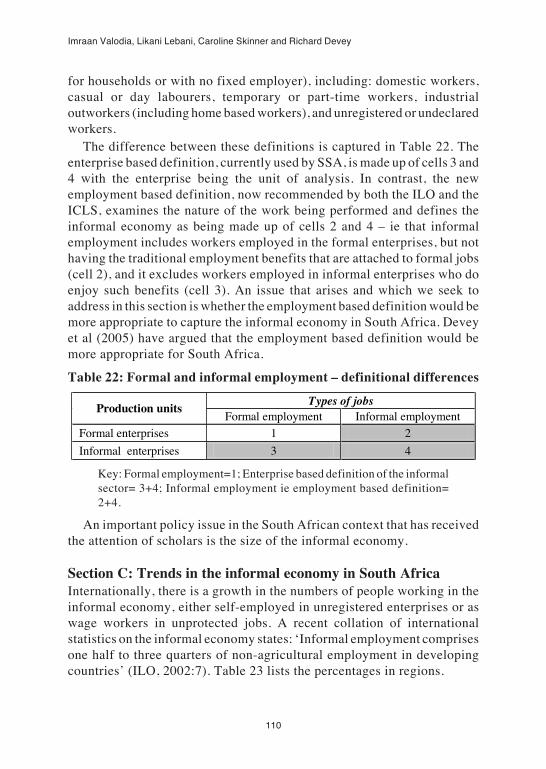
The difference between these definitions is captured in Table 22. Theenterprise based definition, currently used by SSA, is made up of cells 3 and4 with the enterprise being the unit of analysis. In contrast, the newemployment based definition, now recommended by both the ILO and theICLS, examines the nature of the work being performed and defines theinformal economy as being made up of cells 2 and 4 � ie that informalemployment includes workers employed in the formal enterprises, but nothaving the traditional employment benefits that are attached to formal jobs(cell 2), and it excludes workers employed in informal enterprises who doenjoy such benefits (cell 3). An issue that arises and which we seek toaddress in this section is whether the employment based definition would bemore appropriate to capture the informal economy in South Africa. Deveyet al (2005) have argued that the employment based definition would bemore appropriate for South Africa.
Table 22: Formal and informal employment � definitional differences
Key: Formal employment=1; Enterprise based definition of the informalsector= 3+4; Informal employment ie employment based definition=2+4.
An important policy issue in the South African context that has receivedthe attention of scholars is the size of the informal economy.
Section C: Trends in the informal economy in South AfricaInternationally, there is a growth in the numbers of people working in theinformal economy, either self-employed in unregistered enterprises or aswage workers in unprotected jobs. A recent collation of internationalstatistics on the informal economy states: �Informal employment comprisesone half to three quarters of non-agricultural employment in developingcountries� (ILO, 2002:7). Table 23 lists the percentages in regions.
Types of jobs Production units
Formal employment Informal employment
Formal enterprises 1 2
Informal enterprises 3 4

111
Low-waged and informal employment in South Africa
Table 23: Informal employment as a proportion of non agriculturalemployment
Source: Adapted from ILO (2002:7)
It is thus clear that in many parts of the world informal employment is thenorm. Further Chen (2001:72) cites that 83 per cent and 93 per cent of newjobs were created in the informal economy in Latin America and Africarespectively. This indicates that the trend of informalisation is unlikely tobe reversed. Informal employment, however, is not only a developingcountry phenomenon. The ILO (2002:7) states that three categories of non-standard or atypical work � self-employment, part-time work and temporarywork � comprised 30 per cent of overall employment in 15 Europeancountries and 25 per cent of total employment in the United States.
Figure 1 shows broad trends in the labour market in South Africa over theperiod 1997 to 2003. As Altman (2005) shows, formal sector employmenthas been growing consistently since 1997, albeit at relatively low rates ofgrowth. We see a sustained growth in unemployment. One segment of theeconomy which seems to have generated employment is the informaleconomy.1 In this sector, employment increased from 965,000 in October1997 to 1.9 million in September 2003, more than doubling over a periodof 6 years. For a number of reasons, this trend must, however, be treatedwith some caution. First, we are using data from the October HouseholdSurvey for the period 1997-1999 and the Labour Force Survey for theperiod 2000-2003, two separate surveys which are not directly comparable.Second, Devey et al (2004) point to two serious problems with theseestimates of informal employment. They highlight the fact that there areseveral inconsistencies in the data on informal employment. Moreimportantly, they show that Statistics South Africa has improved its capturingof informal employment so that at least part of the increasing trend ininformal employment is simply better capture of the phenomenon.Notwithstanding these difficulties, it is now widely accepted that informalemployment has grown since the political transition and that, as the datashows, this growth has declined in recent years.
Region Percentage North Africa Sub-Saharan Africa Latin America Asia
48% 72% 51% 65%

112
Imraan Valodia, Likani Lebani, Caroline Skinner and Richard Devey
Figure 1: Labour market status of workers in South Africa, 1997-2003
Source: Authors� calculations from October Household Survey andLabour Force Surveys
Drawing on the latest available figures � from the March 2004 LFS �Figure 2 shows the distribution of informal workers by industrial sector.From this it is clear that informal employment in South Africa is concentratedin trade, with just under half of all informal workers located in this sector.Further, there are significant numbers of people working in construction,manufacturing and services. In comparison to other developing contexts,South Africa�s informal economy is disproportionately dominated by trade(see, for example, Charmes 2000 figures for other African countries).
Figure 2: Informal economy by sector, March 2004
Source: Authors� calculation from LFS, March 2004
Labour Market Status of Workers, 1997-2003
02,000,0004,000,0006,000,0008,000,000
10,000,00012,000,00014,000,00016,000,00018,000,000
1997 1998 1999 2,000 2001 2002 2003
Year
Nu
mb
er o
f W
ork
ers
Unemployed
Unspecified
Domestic
Informal
Subs agric
Comm agric
Formal

113
Low-waged and informal employment in South Africa
Figure 3 is a graphical representation of monthly incomes in the informaleconomy. It is clear from the figure that 51 per cent of those working in theinformal economy earn R500 or less (with a significant number of peoplereporting earning nothing) and that 92 per cent earn less than R2501. Thissuggests a correlation between being poor and working in the informaleconomy. This relationship is confirmed in previous analyses using LFSdata (see, for example Meth, 2002).
Figure 3: Incomes in the informal economy, March 2004
Source: Authors� calculations from LFS, March 2004.
Table 24 contains summary statistics about the sex and race of thoseworking in the formal sector, the informal sector, and domestic work. As isthe case internationally,2 there is a gender dimension to the informaleconomy in South Africa. It is clear from the table that although more menthan women work in the informal economy, the difference is less than is thecase for the formal economy. It is also clear that the overwhelming majorityof domestic workers are women. Within the informal economy, smallerscale surveys and qualitative research indicate that women tend to be overrepresented in the less lucrative tasks (see, for example, Lund 1998 forgendered re-analysis and synthesis of research on street trading). Finally,with respect to race, the majority of those working in the informal economyare black.
1 1 %
4 0 %
2 4 %
1 7 %
7 %
2 %
0 %
5 %
1 0 %
1 5 %
2 0 %
2 5 %
3 0 %
3 5 %
4 0 %
4 5 %
N o n e R 1 -R 5 0 0 R 5 0 1 -R 1 0 0 0
R 1 0 0 1 -R 2 5 0 0
R 2 5 0 1 -R 8 0 0 0
R 8 0 0 0 +

114
Imraan Valodia, Likani Lebani, Caroline Skinner and Richard Devey
Table 24: Formal, informal economies and domestic work by sex andrace
Source: Authors� calculations from LFS, March 2004.
It is thus clear that a large number of South Africans work in the informaleconomy and that this component of employment is increasing. The SouthAfrican informal economy is disproportionately dominated by the retail andwholesale trade. Further there is a close correlation between being poor andworking in the informal economy. Finally there is a gender and racedimension to informal work.
One interesting issue that has received some attention in the literature iswhy, in contrast to other developing country examples, has South Africa�sinformal economy remained so small, in spite of the extremely high levelsof unemployment. Kingdon and Knight (2001) show that the unemployedare significantly worse off than those operating in the informal economyand argue that the informal economy in South Africa has high barriers toentry � some related to the historical racial impediments to blacks enteringthe informal economy but, Kingdon and Knight argue, labour marketlegislation and access to credit may be significant barriers to growth ininformal employment. A more plausible argument, however, may be thatgiven large firms� dominance of the South African economy, smallereconomic agents, including informal workers, lack access to markets. Thereis some evidence to support this contention. Altman�s (1995) study of theclothing industry shows that the market is dominated by large firms who areunwilling to subcontract production, and that smaller firms are unable tosupply to required quality standards. Similar evidence, in other manufacturingindustries, is provided in the report of the Industrial Strategy Project (Joffeet al 1995). Furthermore, where informal workers are able to easily enter
Formal Sector Informal Sector Domestic % of Total Population
Male 61.9% 57.9% 3.8% 52.3%
Female 38.1% 42.1% 96.2% 47.6%
Black 60.1% 89.3% 89.7% 79.7%
Coloured 14.3% 4.8% 10.2% 8.9%
Indian 4.6% 1.2% 0.0% 2.4%
White 20.9% 4.7% 0.0% 8.9%

115
Low-waged and informal employment in South Africa
markets, such as in street trading, these activities tend to be highly overtradedand incomes are exceptionally low (see Skinner 1999, 2005).
Lund (1998) provides an excellent overview of South African researchon street trading, by far the most prominent and extensive form of informalactivity. She shows that there has been a large number of repetitious studies,almost all based on small samples, exploring the extent of street vending,and reporting on the lives of these workers. From this, she argues, we get a�limited sense of the dynamics of peoples� lives� (1998:40). Building onthis overview, Lund and Skinner explore two central issues of relevance tostreet trading. Firstly, in Lund and Skinner (1999), they explore the vexedissue of representation of informal economy workers. They show that anumber of organisations that claim to represent the interests of informalworkers lack adequate records of membership, and offer very few servicesto informal workers. More often that not, these organisations emerge assome contentious issue boils over and then, as the issue dissipates, theorganisations quickly disappear. Secondly, Skinner (1999) explores theissue of local government regulations and policy toward the informaltrading. In a five city study, she shows that South African cities differfundamentally in their approach to local policy for the informal economy.
Section D: Linkages between the formal and informal economyA critical consideration for policy purposes is the contribution that theinformal economy makes to national output. An argument that the Presidencyand the ANC make, in their recent documents about the �Second Economy�is that it contributes �little to GDP�. In fact, the informal economy contributessomewhere between 7 and 12 percent of GDP. In its estimates of GDP inSouth Africa, the South African Reserve Bank uses expenditure surveys ofhouseholds to estimate the contribution of the informal economy, which itcaptures via its estimates of private consumption expenditure of households.On this basis, the informal economy contributes some 7 per cent of GDP.Using an alternative methodology, Budlender et al (2001) estimate that theinformal economy contributes between 8-12 per cent of gross domesticproduct.
A particular problem in policy terms, for those working in the informaleconomy, is the idea of the second economy being �structurally disconnectedfrom the first�. Case material evidence indicates that there are multipleforward and backward linkages between formal and informal activities.Consider, for example, Ince�s (2003) work on informal clothing

116
Imraan Valodia, Likani Lebani, Caroline Skinner and Richard Devey
manufacturing in a residential area in Durban. Not only do manufacturerssource their inputs in the formal economy, but the garments often end up informal retail stores. Witt�s (2000) work on informal fruit and vegetabledistribution demonstrates multiple linkages. It is these linkages which, inpolicy terms, are often the most interesting places to be concentrating on.Finally, the idea of the �Second Economy� homogenises a heterogeneous setof activities.
The panel component of the Labour Force Survey allows us to exploredynamics in the labour market. The sampling design of the LFS, which isconducted bi-annually in March and September, allows for 80 per cent ofthe sampling in each wave to remain in the sample. Thus, households remainin the sample over five waves of the LFS. In another paper (Devey et al2005), we explore these dynamics beginning in September 2001, for fivewaves of the LFS ending in March 2004. Matching the individuals in thesehouseholds over the period, we are able to get some indication of the extentto which workers move between employment and unemployment, and whenemployed between different segments of the economy, such as formal andinformal.3 In total, we are able to match 5,587 individuals over the period.
Table 25 gives a broad overview of how the status of these workerschanged over the period. The data show that there is a surprising level ofchurning within the labour market, with more than half of the workers�status having changed at least once over the period September 2001 toMarch 2004. As is to be expected, for those workers whose status remainedunchanged, most tended to be employed in the formal sector, or remainedeconomically inactive. Only 1.3 per cent of the 5,587 workers that remainedin the panel continued to work in the informal economy over the periodunder consideration.
Table 25: Labour market status, Sept. 2001 to March 2004, n=5587.
Source: Authors� calculations from various LFSs
Type of Worker Frequency Percent Remained in the formal economy Remained economic inactive Remained in commercial agric. Remained as a domestic worker Remained unemployed Remained as informal worker Worker status changed
1175 1077
99897471
3002
21.0 19.3 1.81.61.31.3
53.7 Total 5587 100

117
Low-waged and informal employment in South Africa
In Table 26 below we remove from the panel all workers who did notengage in informal economy activities over the period, ie we retain onlyworkers who have been engaged in informal economy activities for at leastone period. This reduces the number of workers from 5,587 to 1,009. Again,we see a surprising level of churning occurring, with only 7 per cent ofworkers remaining as informal workers over the entire period.
Table 26: Labour market status of informal economy workers,September 2001 to March 2004, n=1009
Source: Authors� calculations from various LFSs
Table 27 below shows the movement of workers that were employed inthe informal economy in any one period over the panel. As is to be expected,a large number of workers moved between the informal economy and beingunemployed or economically inactive. A significant proportion of workers(18.3 per cent) moved between formal and informal employment.
Table 27: Shifts between informal work and other labour market status
Source: Authors� calculations from various LFSs
Type of Worker Frequency Percent
Informal for 5 periods 71 7.0
Informal for 4 periods 88 8.7
Informal for 3 periods 106 10.5
Informal for 2 periods 202 20.0
Informal for 1 period 542 53.7
Total 1009 100
Type of Change Frequency Percent
Informal and unemployed and not economically active 191 18.9
Informal and not economically active 190 18.8
Informal and formal 185 18.3
Informal, formal and unemployed 77 7.6
Informal, formal and not economically active 73 7.2
Remained in informal 71 7.0
Informal and unemployed 60 5.9
Informal, formal, unemployed and not economically active 44 4.4
Other 118 11.7
Total 1009 100

118
Imraan Valodia, Likani Lebani, Caroline Skinner and Richard Devey
If we reduce the period under consideration to just six months, fromSeptember 2003 to March 2004, we still find fairly high levels of churningin the labour market. Of individuals recorded as informal workers inSeptember 2003, in March 2004, 44.5 per cent reported working in theinformal economy, 17.3 per cent reported working in the formal economy,11.4 per cent reported being unemployed, and 23.7 per cent reported beingnot economically active. Of individuals recorded as formal workers inSeptember 2003, in March 2004, 3.4 per cent reported working in theinformal economy.
These linkages between employment in the formal and informal economyare corroborated by other studies. Devey et al (2004) show that manyworkers classified as formal workers have employment characteristics thatare consistent with informal work. There is also significant evidence frommicro-level studies which highlights the growing informalisation ofpreviously formal work. Kenny (2000) in her analysis of the retail sector,not only demonstrates that casual and subcontracted labour constitutes upto 65 per cent of total employment, but highlights how core tasks like shelfpacking are increasingly done by employees of labour brokers, contractedby suppliers. Skinner and Valodia (2001) analysed the Confederation ofEmployers South Africa (COFESA), a labour consultancy that assistscompanies to restructure their workforces, to change employees tocontractors and to outsource production to them. COFESA firms no longerhave to adhere to collective agreements on minimum wages or contribute toany of the benefit or training schemes. In the workplace, other than changesin labour conditions, everything else remains the same. Skinner and Valodiademonstrate how by the end of 2000 they estimated that this had resulted inthe establishment of over 700,000 independent contractors. COFESAmembers are involved in many different sectors: food, farming, transport,construction, engineering and, particularly, in footwear and clothingmanufacturing. The legislative loophole in the Labour Relations Act thatCOFESA was using has recently been changed. It is unclear whether theprocesses COFESA set in place have been reversed. Theron and Godfrey�s(2000) more qualitative study in which interviews were conducted with keyinformants in retail, mining, manufacturing (food, clothing, metal andengineering), catering and accommodation, construction and transport.Almost all informants reported an increase in the use of labour brokers andemployment agencies (2000:27). There are also signs of an increase in theuse of labour brokers in agriculture (see for example Du Toit and Ally 2001,

119
Low-waged and informal employment in South Africa
on Western Cape horticulture).Another way to think about linkages between formal and informal work
is to examine how workers from the same household engage in work in theformal and informal economy. Using the March 2004 LFS, Devey et al(2005) explore this issue. In the survey, only 2 per cent of households (about¼ million) contained ONE formal and ONE informal worker. When theformal worker was a manager (n=9,776), 30 per cent of the cohabitinginformal workers were professionals and 39 per cent were in technicaloccupations. When the formal worker reported an elementary occupation(n=66,446), of the cohabiting informal workers, the distribution was: 44 percent elementary occupations; 14 per cent craft workers; 11 per cent service;11 per cent clerks; < 6 per cent technical; and 2.5 managers. These trendsare not surprising, given the class structure of households in South Africa,but the data indicates that there are in fact close linkages between work inthe formal economy and work in the informal economy.
Another important aspect of the informal economy with respect to labouris the role of foreigners, particularly from other African countries. There areno reliable statistics on the number of foreigners living and working inSouth Africa. It is likely however, that since the political transition,numbers have substantially increased. In the street trading sector this hasbecome an increasingly controversial issue (see Skinner and Hunter 2001).Research on international migrants in South Africa demonstrates that theyare very active in the informal economy. Studies have been conducted onspecific groups of immigrants (see Gema (2001), Geyevu (1997), andSabet-Shargi (1999) on the economic activities of Ethiopian, Ghanaian andCongolese refugees respectively). Vawda (1999) reflects on the survivalstrategies of different groups of migrants living in the Durban area. Peberdyand Crush (1998) highlight the contribution of cross border traders to thecraft industry. Rogerson (1997) and Peberdy and Rogerson (2001)demonstrate the important role foreigners play in the creation of smallbusinesses. A key theme that emerges in this literature is that, althoughforeign migrants are entering the informal economy in large numbers theytend to remain marginalised and unable to access state resources to enableprogression and growth in their enterprises.
Since the mid 1980s there has been a global trend of decentralisation,with local and regional authorities having increasing decision-makingpower. Although this was initially a response from the internationalinstitutions to address corruption, it has now taken on a momentum of its

120
Imraan Valodia, Likani Lebani, Caroline Skinner and Richard Devey
own. Further, Castells and Portes (1989:304) argue that local governmentis often more effective in responding to the informal economy because it isnot embroiled in the types of policy debates which often paralyse nationallevel initiatives. Portes and Castells make reference to Emilia Romagna inItaly, Miami and Hong Kong in demonstrating the role of local levelinitiatives in supporting segments of the informal economy with growthpotential.
In South Africa, since the political transition, local government has beengiven significantly more autonomy. Not only is local governmentconstitutionally committed to promoting economic development but, becauseof the gap in national government policies identified in Section C,increasingly local government is finding itself having to take responsibilityfor managing and supporting the informal economy. The experience inSouth Africa is mixed. Certain cities are embarking on a privatisation drive.This often has negative consequences for those in the informal economy(see, for example, Skinner 2000, on the consequences of privatising streettrader management in Johannesburg). There are a number of more innovativeresponses that warrant mention. First, in 2001 the Durban Unicity adoptedan informal economy policy that outlines a series of support measures forall informal economy workers. According to the policy document (DurbanUnicity 2001) organisations representing the informal economy will bestrengthened with a view to establishing a strong, stable negotiatingrelationship between local government and informal economy workers.This builds on the experience of a particularly innovative urban regenerationproject in the main transport hub in the inner city � the Warwick Junction.Second, the Johannesburg City Council�s establishment of a fashion districtin the inner city has significantly assisted small clothing manufacturersoperating there. The project not only offers skills training, but linksmanufacturers to markets and fashion designers.
Skinner�s (2005) survey of informal enterprises in the Durban is one ofthe few studies available that has a large enough set of data for understandingthe business operations of informal enterprises. Her study shows that thereis in fact extensive entry into, and exit from, the informal economy, withmost enterprises being established recently. She shows that most enterprises,particularly those of informal traders, operate in heavily overtraded marketswhere margins are very low.
.

121
Low-waged and informal employment in South Africa
Section E: Research agendasThis paper has concentrated on one important aspect of low-wagedemployment in South Africa � the informal economy. As highlighted in theearlier discussion, two other sectors of the economy, domestic work andagriculture, have a high incidence of low-waged employment. We have notreviewed developments in these sectors. This is an obvious gap that requiresattention, particularly since the protective ambit of labour legislation,including minimum wages, has been extended to farm workers and domesticworkers. There is an urgent need for analysis of developments in farmlabour and domestic work.
An important issue that emerges in our review of the literature on theinformal economy in South Africa, and in particular in relation to governmentsupport measures for the informal economy, is the merging of two differentcategories of business enterprises � small business and informal enterprises.The lack of conceptual clarity on these enterprises means that often thesame policy is designed for enterprises employing 100 workers (the top endof small business) and a street vendor selling basic products with a turnoverof less than R100 per day. There is an urgent need to unpack the analyticalcategories used for small business and informal enterprises.
The reliability of national survey data on informal employment, andmore broadly on the lower segments of the labour market has dogged thedebate on employment for a number of years. The President�s recentquestioning of the reliability of the national estimates of unemployment hasagain brought this issue to the fore. There is some anecdotal evidence thatlarge sections of the unemployed are engaged in low-level and low-incomeeconomic activities in the informal economy, and that the estimates ofinformal employment should therefore be somewhat higher than theypresently are (and consequently that unemployment should be lower). Thisis clearly a critical issue, and one that should receive the attention of theresearch community. Detailed field level studies to explore the economicactivities of the unemployed would go some way to resolving this issue.
South Africa is one of the few developing countries that has a time usesurvey. Regrettably, the research community in South Africa has notsufficiently exploited this data. The data is potentially useful to understandingthe dynamics between work and work activities, and is therefore particularlyrelevant for understanding informal employment, where the distinctionbetween work and non-work activities is often blurred. Furthermore, arecent innovation in macroeconomic modelling, in particularly computable
122
Imraan Valodia, Likani Lebani, Caroline Skinner and Richard Devey
general equilibrium (CGE) models, has been the incorporation of theinformal economy (see, for example, Fontana and Wood 2000). These CGEmodels rely on time use data. Further research in this area in South Africawould not only clarify linkages between the formal and informal economy,but also bring the issues of the informal economy to the fore inmacroeconomic simulations of policy options and the likely impacts ofpolicy changes.
From a labour market perspective there is clearly a need for researchaimed at better understanding the impacts of labour legislation on the low-waged sector and on the informal economy. This should focus not only onthe possible negative impacts of labour legislation on employment, but alsoon better understanding the reach of the legislation and on the possibility ofextending the protective ambit of the legislation to informal workers, whoseemployment is particularly vulnerable. What, for example, are thepossibilities for extending some social protection, such as unemploymentinsurance, to the informal economy?
Skinner�s (1999) research has highlighted the importance of localgovernment policy for the informal economy. Her five city (and town) studyhas shown that local government authorities are taking very differentapproaches � from facilitative at the one extreme, to restricting at the other� toward regulating informal economy activities. There is a need for moreresearch both to understand the outcomes of these approaches and, forpolicy purposes, to develop more uniform approaches to informal tradeactivities.
Much of the research on the informal economy has concentrated onexplaining the growth of the informal economy and on the data issues. Froman employment policy perspective there is an urgent need for researchaimed at identifying areas for growth in informal employment and thepolicies needed to realise this potential. For example, what are thepossibilities for growth in informal employment in services? Relatedly,most of the detailed case studies conducted have concentrated on streetvendors. Further research is required on other activities in the informaleconomy. For example, there is certainly anecdotal evidence of extensiveinformal provision of construction services such as plumbing, painting, etc,yet we have no studies on these activities.
Devey et al (2005) represent the first foray at researching the employmentlinkages that may exist between the formal labour market and the informaleconomy. Further research aimed at illuminating these linkages is critical

123
Low-waged and informal employment in South Africa
for a comprehensive understanding of employment and unemployment inSouth Africa.
Notes1. The other sector showing rapid growth (and then rapid decline) is subsistence
agriculture. See Aliber (2003) for an analysis of the trend in subsistenceagriculture.
2. See Sethuraman (1998) for an international gendered analysis of informalsector statistics. Having gone through substantial country specific data heconcludes: �The evidence reviewed suggests that not only are women�s incomeslower than that of men [in the informal sector but that]� a greater proportionof women are in lower income categories than men�. This finding holds goodacross all countries in Asia, Africa and Latin America from which evidence isdrawn�.
3. Note that the panel component of the LFS allows us to track households notindividuals over the five waves of the survey. We have examined the sex andage profiles of workers in these households to confirm that the individualsremain in the panel. We have thus removed from the panel all households wherethe individuals inside the household may have changed (through, for example,migration).
ReferencesAliber, M (2003) Small-scale agriculture as revealed by the Labour Force Survey.
Unpublished mimeo, HSRC.Altman, M (1995) An Industrial Strategy for the Clothing Sector. Cape Town:
University of Cape Town Press.Altman, M (2005) �The State of Employment�, in J Daniel, R Southall and J Lutchman
(eds). State of the Nation 2004-2005. Cape Town: HSRC Press.Banerjee, N (1985) Women Workers in the Unorganised Sector. Hyderabad: Sangam
Books.Bromley, R (1995) �Informality, de Soto style: from concept to policy�, in C Rakowski
(ed). Contrapunto The Informal Sector Debate in Latin America. Albany: StateUniversity Press of New York.
Budlender, D, P Buwembo, P Chobokoane and N Shabalala (2001) The InformalEconomy: statistical data and research findings; country case study: South Africa.Document prepared for WIEGO.
Budlender, D, C Skinner and I Valodia (2004) �Budgets and the informal economy: ananalysis of the impact of the budget on informal workers in South Africa�,University of KwaZulu-Natal: School of Development Studies.
Castells, M and A Portes (1989) �World underneath: the origins, dynamics, and effectsof the informal economy�, in A Portes, M Castells and L Benton (eds). The InformalEconomy. Baltimore: The Johns Hopkins Press.

124
Imraan Valodia, Likani Lebani, Caroline Skinner and Richard Devey
Charmes, J (2000) �Size, trends and productivity of women�s work in the informalsector and in old and new forms of informal employment: an outlook of recentempirical evidence�, paper presented at the International Association for FeministEconomics, Istanbul, August.
Chen, M (2001) �Women in the informal sector: a global picture, the global movement�,SAIS Review 21(1).
Cross, C, W Mbhele, P Masondo, N Zulu and M Mngadi (2001) �Case studies ofwomen home-based workers in Durban�s shacks and townships�, Durban: DurbanMetro Council Economic Development Department.
Davies, W (1987) �Black entrepreneurial experience and practice in Port Elizabeth�,Development Studies Working Paper No. 36, Grahamstown: Institute of Social andEconomic Research, Rhodes University.
Devey, R, C Skinner and I Valodia (2004) �Definitions, data and the informal economyin South Africa: a critical analysis�, University of KwaZulu-Natal: School ofDevelopment Studies.
Devey, R, C Skinner and I Valodia (2005) �The state of the informal economy�, in JDaniel, R Southall and J Lutchman (eds). State of the Nation 2004-2005. CapeTown: HSRC Press.
Durban Unicity Council (2001) Informal Economy Policy. (http://www.nu.ac.za/csds).
Du Toit, A and F Ally (2001) �The externalisation and casualisation of farm labour inWestern Cape horticulture�, Stellenbosch: Centre for Rural Legal Studies.
Eapen, M (2001) �Women in informal sector in Kerala: need for re-examination�,Economic and Political Weekly, June 30.
Fallon, P and R Lucas (1998) �South Africa: labour markets, adjustment, andinequalities�, Discussion Paper 12, Informal Discussion Papers on Aspects of theSouth African Economy, Washington DC: World Bank, Southern Africa Department.
Fontana, M and A Wood (2000) �Modelling the effects of trade on women and workand at home�, World Development 28(7).
Gema, G (2001) �The social and economic integration of ethiopian asylum seekers inDurban and South African immigration policy�. Masters Dissertation. Centre forSocial and Development Studies, University of Natal, Durban.
Geyevu, S (1997) �The socio-economic impact of Ghanaian non-professional illegalaliens in Durban Metropolitan Area and suggested policy framework�. MastersDissertation, University of Durban-Westville.
Hart, K (1973) �Informal income opportunities and urban employment in Ghana�,Journal of Modern African Studies 11.
Hindson, D (1987) Pass Controls and the Urban African Proletariat. Johannesburg:Ravan Press.

125
Low-waged and informal employment in South Africa
Ince, M (2003) �Informal clothing manufacturing in a residential area: the case ofChatsworth�, Masters Dissertation, School of Development Studies, University ofNatal.
International Labour Organisation (1972) Employment, Incomes and Equality: astrategy for increasing productive employment in Kenya. Geneva: ILO.
International Labour Organisation (2002) Women and Men in the Informal Economy,A Statistical Picture. Geneva: ILO.
Joffe, A, D Kaplan, R Kaplinsky and D Lewis (1995) �Improving manufacturingperformance in South Africa�, Report of the Industrial Strategy Project, CapeTown: UCT Press.
Kenny, B (2000) ��We are nursing these jobs�: the implications of labour marketflexibility on East Rand retail sector workers and their households�, Paperpresented at the Annual South African Sociological Association, Cape Town, July.
Kingdon, G and J Knight (2001) �Why high open unemployment and small informalsector in South Africa�, University of Oxford: CSAE.
Legassick, M (1974) �South Africa: capital accumulation and violence�, Economy andSociety 3.
Lewis, J (2002) �Promoting growth and employment in South Africa�, African RegionWorking Paper Series, 32, Washington DC: World Bank.
Lund, F (1998) �Women street traders in urban South Africa: a synthesis of selectedresearch findings�, CSDS Research Report, 15. University of Natal, Durban. (http://www.nu.ac.za/csds/).
Lund, F and C Skinner (1999) �Promoting the interests of women in the informaleconomy: an analysis of street trader organisations in South Africa�, ResearchReport 19, School of Development Studies, University of Natal, Durban.
Manning, C and P Mashigo (1993) �Manufacturing in micro-enterprises in SouthAfrica�, Research Report to the Industrial Strategy Project, University of CapeTown.
Meth, C (2002) �What to do until the doctor comes? Relief for the unemployed and forpoorly paid workers�, Research paper, Committee of Inquiry into ComprehensiveSocial Security in South Africa.
Papola, T (1980) �Informal sector: concept and policy�, Economic and PoliticalWeekly, May 3.
Peattie, L (1987) �An idea in good currency and how it grew: the informal sector�,World Development 15(7).
Peberdy, S and J Crush (1998) �Trading places: cross-border traders and the SouthAfrican informal sector�, SAMP Migration Policy Series 6. (http://www.queensu.ca/samp/Publications.html).
Peberdy, S and C Rogerson (2001) �Creating new spaces? Immigrant entrepreneurshipin South Africa�s SMME economy�, unpublished manuscript.

126
Imraan Valodia, Likani Lebani, Caroline Skinner and Richard Devey
Preston-Whyte, E and C Rogerson (1991) South Africa�s Informal Economy. CapeTown: Oxford University Press
Rogerson, C (1997) �International migration, immigrant entrepreneurs and SouthAfrica�s small enterprise economy�, SAMP Migration Policy Series 3.
Sabet-Shargi, F (1999) �The social and political circumstances of Congolese refugeesin Durban�, Masters Dissertation, University of Natal, Durban.
Skinner, C (1999) �Local government in transition: a gendered analysis of trends inurban policy and practice regarding street trading in five South African cities�,Research Report 18, School of Development Studies, University of Natal.
Skinner, C (2000) �Getting institutions right?: local government and street traders infour South African cities�, Urban Forum 11(1).
Skinner, C and N Hunter (2001) �Foreign street traders working in inner city Durban:survey results and policy dilemmas�, CSDS Research Report 49, School ofDevelopment Studies, University of Natal.
Skinner, C and I Valodia (2001) �Labour market policy, flexibility, and the future oflabour relations: the case of clothing�, Transformation 50.
Skinner, C (2005) �Constraints to growth and employment in the greater DurbanMetropolitan Area: evidence from informal economy survey�, School ofDevelopment Studies Research Report 65, Durban: University of KwaZulu-Natal.
Standing, G, J Sender and J Weeks (1996) Restructuring the Labour Market: the SouthAfrican challenge. Geneva: ILO.
Standing, G (1999) Global Flexible Labour: seeking distributive justice. London:Macmillan.
Theron, J and S Godfrey (2000) Protecting Workers on the Periphery. Developmentand Labour Monologues I. University of Cape Town: Institute of Development andLabour Law.
Vawda, S (1999) �Foreign migrants, governance and local development strategies: acase study of international African migrants in Durban�, Conference paper.,Prague,Czech Republic, August.
Webster, D (1984) �The reproduction of labour power and the struggle for survival inSoweto�, Carnegie Conference Paper 20, SALDRU, University of Cape Town.
Wellings, P and M Sutcliffe (1984) �Developing the urban informal sector in SouthAfrica: the reformist paradigm and its fallacies�, Development and Change 15(4).
Witt, H (2000) �Formal and informal economy linkages in the fruit and vegetablesector�, Study 7(3). Research Report for Durban�s Technical Task Team for theInformal Economy.
Wolpe, H (1972) �Capitalism and cheap labour-power in South Africa: from segregationto apartheid�, Economy and Society 1(4).