Low-Temperature Polymorphism in Tungsten Trioxide Powders and Its Dependence on Mechanical...
9
Journal of Solid State Chemistry 143, 24 — 32 (1999) Article ID jssc.1998.8061, available online at http://www.idealibrary.com on Low-Temperature Polymorphism in Tungsten Trioxide Powders and Its Dependence on Mechanical Treatments E. Cazzanelli,* C. Vinegoni,- G. Mariotto,- A. Kuzmin,‡ and J. Purans‡ * Istituto Nazionale per la Fisica della Materia and Dipartimento di Fisica, Universita % della Calabria, 87036 Arcavacata di Rende, Cosenza, Italy; - Istituto Nazionale per la Fisica della Materia and Dipartimento di Fisica, Universita % di Trento, 38050 Povo, Trento, Italy; and ‡ Institute of Solid State Physics, University of Latvia, LV-1063 Riga, Latvia Received April 12, 1998; in revised form October 14, 1998; accepted October 19, 1998 The polymorphism of WO 3 powder samples, resulting from mild mechanical treatments and from temperature changes be- tween 30 K and room temperature, has been investigated by using Raman spectroscopy and X-ray diffraction. A transition from the monoclinic (I) c-phase to the triclinic d-phase after moderate mechanical treatments has been observed for untreated powder, just what happens when the same samples are rapidly cooled to low-temperature. Evidences of the low temperature monoclinic (II) polar e-phase have been found at room temper- ature in samples after a stronger milling treatment. The sequence of the low-temperature phase transitions appears to be strongly dependent on the mechanical history of the powders. A new low- temperature N-phase has been observed below about 200 K in different samples: it is the main phase in commercial untreated powders, having the monoclinic (I) c-phase at room temperature, but constitutes only a small fraction in moderately treated powders, having the triclinic d-phase at room temperature. ( 1999 Academic Press INTRODUCTION Different crystal phases of tungsten trioxide (WO 3 ) have been investigated using several experimental techniques in the past years (1—13), and theoretical calculations have been developed to explain the polymorphism of this compound (14). The interplay between the lattice phonons and the electronic structure of WO 3 results in the occurrence of several phases, starting from low symmetry triclinic or mon- oclinic phases up to the tetragonal phase. On the basis of reported experimental data, the following sequence of crystal phases, in order of increasing temper- ature, is presently accepted: monoclinic (II) polar or e-phase with space group Pc (C2 4 ), from 5 to 278 K (11); triclinic or d-phase, P1 1 (C1 * ), from 248 to 290 — 300 K (1, 7, 9, 11); mon- oclinic (I) or c-phase, P2 1 /n (C5 2) ), from 290 — 300 K to 600 K (1 — 3, 9); orthorhombic Pmnb (D16 2) ), from 600 to 1010 K (6); tetragonal P4/nmm (D7 4) ), from 1010 K (10) to the melting temperature 1746 K. Recent low-temperature (from 5 to 250 K) neutron diffraction studies, performed by Salje et al. (11) on finely ground powders, confirmed the e-to-d-to-c phase transition sequence for increasing temperature and did not evidence any other phase below 220 K. Such sequences of low-temperature crystal phases occur for single or polycrystals showing yellowish green color, associated with a charge carrier concentration of the order of 1018 cm~3 (13, 15). However, the preparation route, the exact stoichiometry, the presence of impurities and the mechanical treatments are known to modify it. In many cases, the WO 3 powdered samples exhibit at room temper- ature (RT) the coexistence of d and c phases. At lower temperature, for some samples, the expected transition to the e-phase (monoclinic (II) polar) is not observed (4, 16). Furthermore, microcrystals of very small size (below 100 nm), obtained via evaporation techniques, exhibit at low temperatures Raman spectroscopic indications of new phase, characterized by a relevant downshift of the stretch- ing modes of W—O bonds (17, 18), usually found at about 715 and 805 cm~1 in d- and c-phases. In general, the high temperature phases show a good reproducibility of the results and low hysteresis effects; the phase sequence does not depend on impurity content or mechanical treatments. In contrast, quite different behaviors are reported at RT and below depending on the type of samples and on their mechanical and thermal his- tory. The vibrational spectroscopy is a powerful tool for fol- lowing the phase transitions in tungsten trioxide, providing complementary information to the one collected by diffrac- tion techniques. Until now, Raman and IR spectroscopic studies have been widely used for the phases close to RT (19, 20), but only microcrystal studies have been carried out, to our knowledge, for very low-temperatures (17, 18), and no comprehensive Raman investigation of the role of mechan- ical treatments in the phase transition sequence has been carried out. 24 0022-4596/99 $30.00 Copyright ( 1999 by Academic Press All rights of reproduction in any form reserved.
-
Upload
independent -
Category
Documents
-
view
0 -
download
0
Transcript of Low-Temperature Polymorphism in Tungsten Trioxide Powders and Its Dependence on Mechanical...
Journal of Solid State Chemistry 143, 24—32 (1999)
Article ID jssc.1998.8061, available online at http://www.idealibrary.com on
Low-Temperature Polymorphism in Tungsten Trioxide Powders andIts Dependence on Mechanical Treatments
E. Cazzanelli,* C. Vinegoni,- G. Mariotto,- A. Kuzmin,‡ and J. Purans‡*Istituto Nazionale per la Fisica della Materia and Dipartimento di Fisica, Universita% della Calabria, 87036 Arcavacata di Rende, Cosenza, Italy;
-Istituto Nazionale per la Fisica della Materia and Dipartimento di Fisica, Universita% di Trento, 38050 Povo, Trento, Italy; and‡Institute of Solid State Physics, University of Latvia, LV-1063 Riga, Latvia
Received April 12, 1998; in revised form October 14, 1998; accepted October 19, 1998
The polymorphism of WO3 powder samples, resulting frommild mechanical treatments and from temperature changes be-tween 30 K and room temperature, has been investigated byusing Raman spectroscopy and X-ray diffraction. A transitionfrom the monoclinic (I) c-phase to the triclinic d-phase aftermoderate mechanical treatments has been observed for untreatedpowder, just what happens when the same samples are rapidlycooled to low-temperature. Evidences of the low temperaturemonoclinic (II) polar e-phase have been found at room temper-ature in samples after a stronger milling treatment. The sequenceof the low-temperature phase transitions appears to be stronglydependent on the mechanical history of the powders. A new low-temperature N-phase has been observed below about 200 K indifferent samples: it is the main phase in commercial untreatedpowders, having the monoclinic (I) c-phase at room temperature,but constitutes only a small fraction in moderately treatedpowders, having the triclinic d-phase at room temperature.( 1999 Academic Press
INTRODUCTION
Different crystal phases of tungsten trioxide (WO3) have
been investigated using several experimental techniques inthe past years (1—13), and theoretical calculations have beendeveloped to explain the polymorphism of this compound(14). The interplay between the lattice phonons and theelectronic structure of WO
3results in the occurrence of
several phases, starting from low symmetry triclinic or mon-oclinic phases up to the tetragonal phase.
On the basis of reported experimental data, the followingsequence of crystal phases, in order of increasing temper-ature, is presently accepted: monoclinic (II) polar or e-phasewith space group Pc (C2
4), from 5 to 278 K (11); triclinic or
d-phase, P11 (C1*), from 248 to 290—300 K (1, 7, 9, 11); mon-
oclinic (I) or c-phase, P21/n (C5
2)), from 290—300 K to 600 K
(1—3, 9); orthorhombic Pmnb (D162)
), from 600 to 1010 K (6);tetragonal P4/nmm (D7
4)), from 1010 K (10) to the melting
240022-4596/99 $30.00Copyright ( 1999 by Academic PressAll rights of reproduction in any form reserved.
temperature 1746 K. Recent low-temperature (from 5 to250 K) neutron diffraction studies, performed by Salje et al.(11) on finely ground powders, confirmed the e-to-d-to-cphase transition sequence for increasing temperature anddid not evidence any other phase below 220 K.
Such sequences of low-temperature crystal phases occurfor single or polycrystals showing yellowish green color,associated with a charge carrier concentration of the orderof 1018 cm~3 (13, 15). However, the preparation route, theexact stoichiometry, the presence of impurities and themechanical treatments are known to modify it. In manycases, the WO
3powdered samples exhibit at room temper-
ature (RT) the coexistence of d and c phases. At lowertemperature, for some samples, the expected transition tothe e-phase (monoclinic (II) polar) is not observed (4, 16).Furthermore, microcrystals of very small size (below 100nm), obtained via evaporation techniques, exhibit at lowtemperatures Raman spectroscopic indications of newphase, characterized by a relevant downshift of the stretch-ing modes of W—O bonds (17, 18), usually found at about715 and 805 cm~1 in d- and c-phases.
In general, the high temperature phases show a goodreproducibility of the results and low hysteresis effects;the phase sequence does not depend on impurity contentor mechanical treatments. In contrast, quite differentbehaviors are reported at RT and below depending on thetype of samples and on their mechanical and thermal his-tory.
The vibrational spectroscopy is a powerful tool for fol-lowing the phase transitions in tungsten trioxide, providingcomplementary information to the one collected by diffrac-tion techniques. Until now, Raman and IR spectroscopicstudies have been widely used for the phases close to RT (19,20), but only microcrystal studies have been carried out, toour knowledge, for very low-temperatures (17, 18), and nocomprehensive Raman investigation of the role of mechan-ical treatments in the phase transition sequence has beencarried out.
LOW-TEMPERATURE POLYMORPHISM IN WO3
POWDERS 25
In this work a comparative study of the low-temperaturecrystal phases of tungsten trioxide is carried out onpowder samples that underwent different milling processesand have at RT c- or d-phase. For this reason, a preliminaryinvestigation is made on the c-to-d phase transition inducedby both mild mechanical treatments and fast thermalcooling.
EXPERIMENTAL
Sample Preparation
The starting material for the present study is commercialstoichiometric WO
3powder (‘‘Reahim,’’ Russia) for optical
industrial applications, with a nominal purity of 99.998%(percentages of present impurities have the following upperlimits: V(5]10~4; Fe(5]10~4, Co(1]10~4, Mn(1]10~4, Cu(1]10~4, Ni(1]104, Cr(5]10~4). Thestoichiometry of the powder WO
3(with an oxygen content
at least higher than 2.999) is indicated by pale yellow colorand was controlled by EPR measurements down to liquidhelium temperature. No EPR signals from impurities orW5` defects were found (21). Preliminary measurements,performed with different excitation laser lines, indicate noluminescence in the visible wavelengths and no vibrationalbands related to surface water or OH groups. Before thespectroscopic investigations this powder had a long storagetime (order of years) in equilibrium with atmospheric oxy-gen, and its yellow color remained stable (in fact, otherexperiments on purposely reduced powder samples, viamilling or other treatments, showed that long interactionwith air at RT induced a reoxidation of the powders(22)). An inspection by the optical microscope indicates thatthese powders have an average grain size of the order ofmicrometers.
From this powder three different sets of samples havebeen obtained and studied separately. The first sample wasthe as-purchased powder, in the following identified as‘‘virgin powder.’’ A second set of samples was producedfrom the commercial powder which underwent a mild mill-ing procedure, consisting of a manual compression ina mortar of agate for a few minutes. The structural differ-ences between these materials are demonstrated by ourXRD and Raman measurements, discussed later; in thefollowing this second kind of powder will be labeled as‘‘treated powder.’’ A third set of samples was produced fromthe virgin powder via strong mechanical treatmentsby using a ball milling machine Retschmuele, withthree balls of agate having diameters between 0.5 and1 cm and weight between 0.17 and 1.09 g, working at a fre-quency of the order of 1 Hz (50—70 cycles per minute) fordifferent times, ranging from a few minutes up to 21 h. In thepresent work we focus the attention on the samples thatunderwent 1 h milling, which will be referred to as ‘‘groundpowders.’’
Experimental Set-up
The samples were analyzed by powder X-ray diffraction(XRD) and Raman spectroscopy. The samples for XRDwere prepared by deposition on a Millipore filter of thepowder from an aqueous suspension driven by a vacuumpump. A Bragg-Brentano X-ray diffractometer, made byItalStructures, working with CuKa radiation was used. TheX-ray diffractograms were recorded at RT in the anglerange 2h"20—65° and a step *(2h)"0.05°.
For the Raman spectroscopic measurements the mostsuccessful sample preparation method consisted of a depos-ition on a microscopy cover glass of some droplets ofa suspension of WO
3powders in acetone. After the neces-
sary time for solvent evaporation the deposited powdersshowed a good adhesion to the substrate and allowed fora good Raman signal detection. The RT Raman measure-ments have been carried out in back-scattering geometryusing a micro-Raman setup, consisting of an Olympusmicroscope (Model BHSM-L-2), mounting an 80]objec-tive with a N
A"0.75 numerical aperture coupled to a 1-m
focal length double monochromator Jobin-Yvon (Ramanor,Model HG2-S) equipped with holographic gratings (2000grooves/mm). The spectra were excited by the 530.9-nm lineof a Krypton laser, which was operated so that the powerentering in the microscope was maintained below 10 mW.The spectral resolution was of the order of 3 cm~1. Thescattered radiation was detected by a cooled (!35°C)photomultiplier tube (RCA, Model C31034A-02), operatedin photon counting mode. The signal was stored intoa multichannel analyzer and then sent to a microcomputerfor the analysis. For the temperature dependence study, theexperimental setup was set in the standard macro-Ramanconfiguration, and a right angle scattering geometry wasadopted. In this configuration the spectra were excited bythe 514.5-nm line of the argon laser used, with a nominalpower of 20 mW at the cryostat window. For low temper-ature range (30—270 K) a liquid helium flux cryostat hasbeen used, and a small glass with a proper amount ofdeposited WO
3powders was used as sample holder.
The nominal temperature values are given by the sensorof the temperature controller, but the laser irradiation dur-ing the Raman measurements can induce a local heating atthe observed spot. To have a more realistic information onthe temperature value, the Stokes/anti-Stokes intensity ratiohas been studied for each spectrum for the Raman modes inthe range 20—200 cm~1. Thus the obtained temperatureshave an error of about$5 K.
RESULTS AND DISCUSSION
Phase Transition Induced by Mechanical Treatments
It is reported that the sequence of phase transitions be-tween the low symmetry crystal structures of WO
3depends
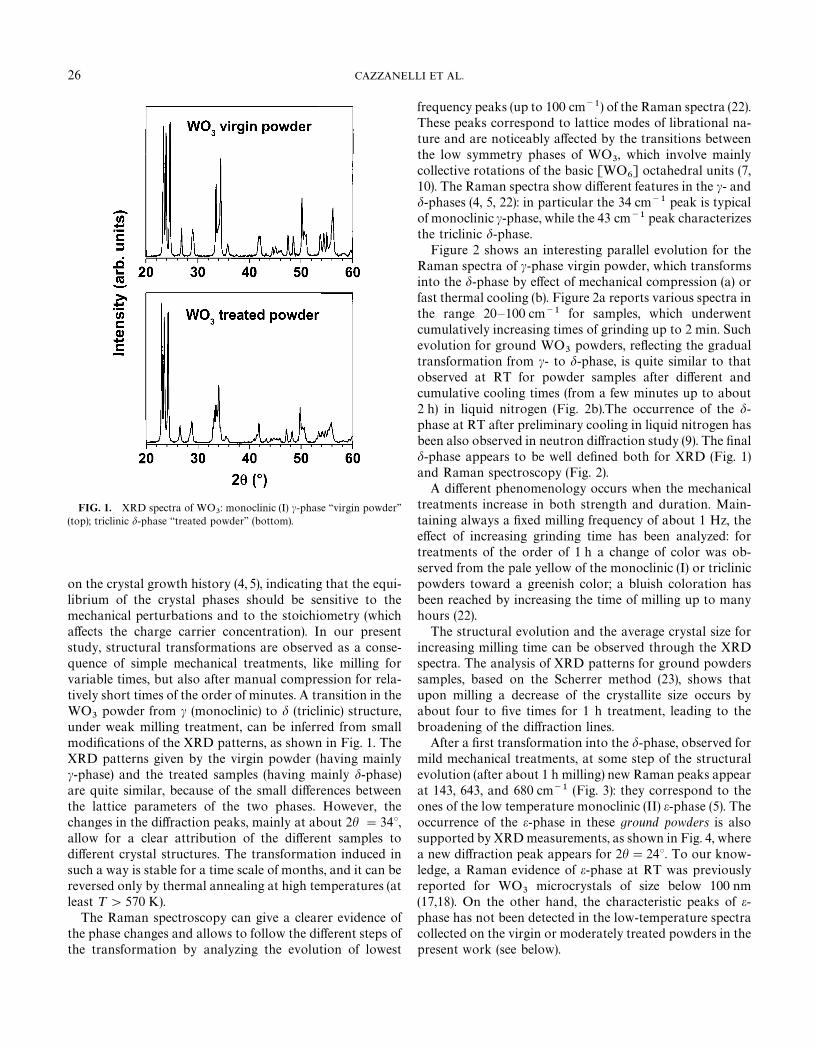
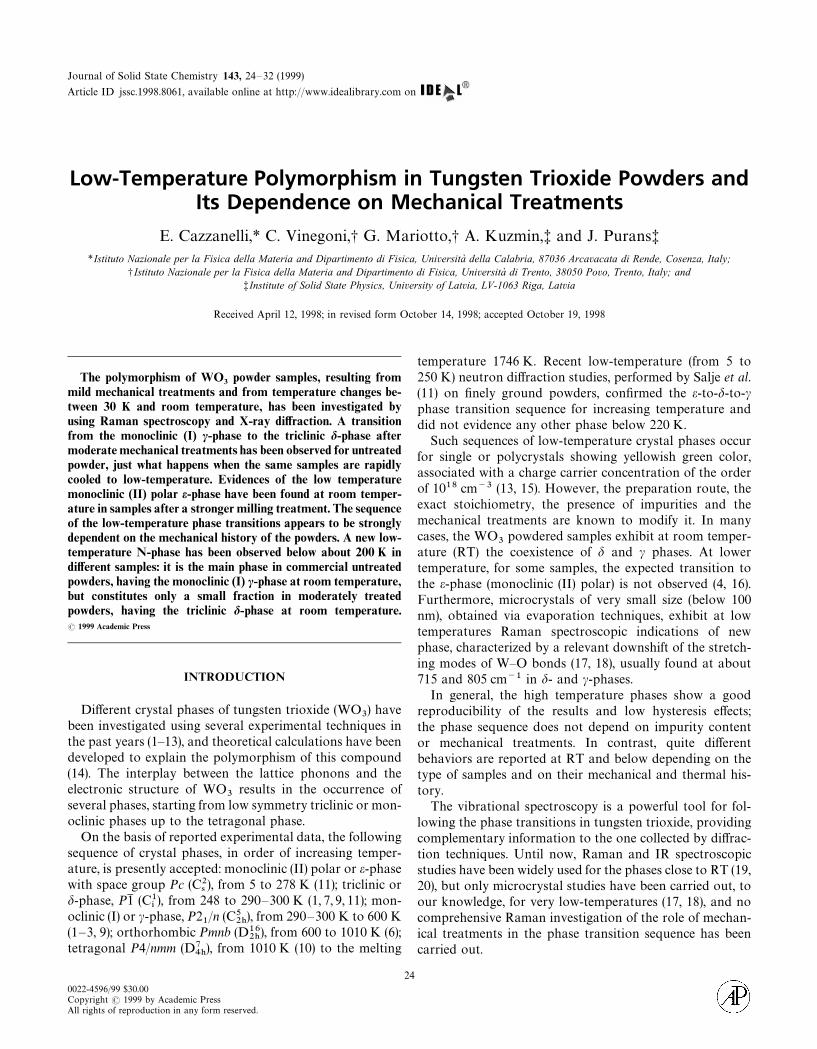
FIG. 1. XRD spectra of WO3: monoclinic (I) c-phase ‘‘virgin powder’’
(top); triclinic d-phase ‘‘treated powder’’ (bottom).
26 CAZZANELLI ET AL.
on the crystal growth history (4, 5), indicating that the equi-librium of the crystal phases should be sensitive to themechanical perturbations and to the stoichiometry (whichaffects the charge carrier concentration). In our presentstudy, structural transformations are observed as a conse-quence of simple mechanical treatments, like milling forvariable times, but also after manual compression for rela-tively short times of the order of minutes. A transition in theWO
3powder from c (monoclinic) to d (triclinic) structure,
under weak milling treatment, can be inferred from smallmodifications of the XRD patterns, as shown in Fig. 1. TheXRD patterns given by the virgin powder (having mainlyc-phase) and the treated samples (having mainly d-phase)are quite similar, because of the small differences betweenthe lattice parameters of the two phases. However, thechanges in the diffraction peaks, mainly at about 2h "34°,allow for a clear attribution of the different samples todifferent crystal structures. The transformation induced insuch a way is stable for a time scale of months, and it can bereversed only by thermal annealing at high temperatures (atleast ¹'570 K).
The Raman spectroscopy can give a clearer evidence ofthe phase changes and allows to follow the different steps ofthe transformation by analyzing the evolution of lowest
frequency peaks (up to 100 cm~1) of the Raman spectra (22).These peaks correspond to lattice modes of librational na-ture and are noticeably affected by the transitions betweenthe low symmetry phases of WO
3, which involve mainly
collective rotations of the basic [WO6] octahedral units (7,
10). The Raman spectra show different features in the c- andd-phases (4, 5, 22): in particular the 34 cm~1 peak is typicalof monoclinic c-phase, while the 43 cm~1 peak characterizesthe triclinic d-phase.
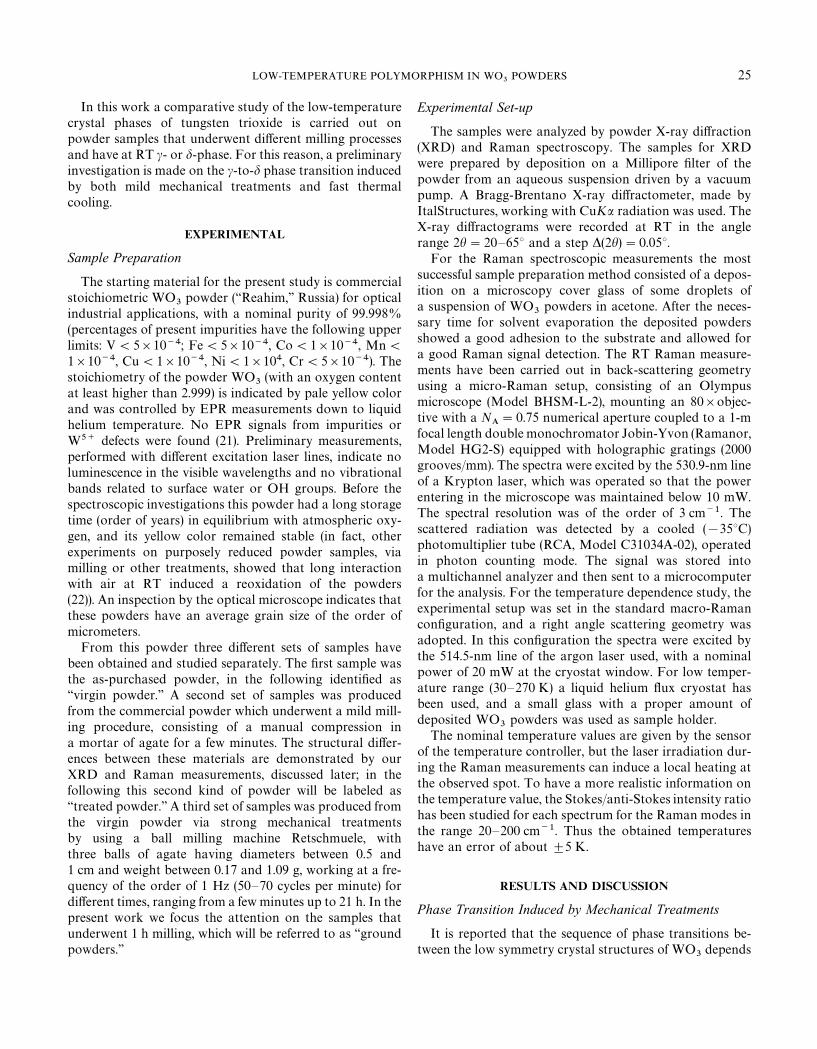
Figure 2 shows an interesting parallel evolution for theRaman spectra of c-phase virgin powder, which transformsinto the d-phase by effect of mechanical compression (a) orfast thermal cooling (b). Figure 2a reports various spectra inthe range 20—100 cm~1 for samples, which underwentcumulatively increasing times of grinding up to 2 min. Suchevolution for ground WO
3powders, reflecting the gradual
transformation from c- to d-phase, is quite similar to thatobserved at RT for powder samples after different andcumulative cooling times (from a few minutes up to about2 h) in liquid nitrogen (Fig. 2b).The occurrence of the d-phase at RT after preliminary cooling in liquid nitrogen hasbeen also observed in neutron diffraction study (9). The finald-phase appears to be well defined both for XRD (Fig. 1)and Raman spectroscopy (Fig. 2).
A different phenomenology occurs when the mechanicaltreatments increase in both strength and duration. Main-taining always a fixed milling frequency of about 1 Hz, theeffect of increasing grinding time has been analyzed: fortreatments of the order of 1 h a change of color was ob-served from the pale yellow of the monoclinic (I) or triclinicpowders toward a greenish color; a bluish coloration hasbeen reached by increasing the time of milling up to manyhours (22).
The structural evolution and the average crystal size forincreasing milling time can be observed through the XRDspectra. The analysis of XRD patterns for ground powderssamples, based on the Scherrer method (23), shows thatupon milling a decrease of the crystallite size occurs byabout four to five times for 1 h treatment, leading to thebroadening of the diffraction lines.
After a first transformation into the d-phase, observed formild mechanical treatments, at some step of the structuralevolution (after about 1 h milling) new Raman peaks appearat 143, 643, and 680 cm~1 (Fig. 3): they correspond to theones of the low temperature monoclinic (II) e-phase (5). Theoccurrence of the e-phase in these ground powders is alsosupported by XRD measurements, as shown in Fig. 4, wherea new diffraction peak appears for 2h"24°. To our know-ledge, a Raman evidence of e-phase at RT was previouslyreported for WO
3microcrystals of size below 100 nm
(17,18). On the other hand, the characteristic peaks of e-phase has not been detected in the low-temperature spectracollected on the virgin or moderately treated powders in thepresent work (see below).
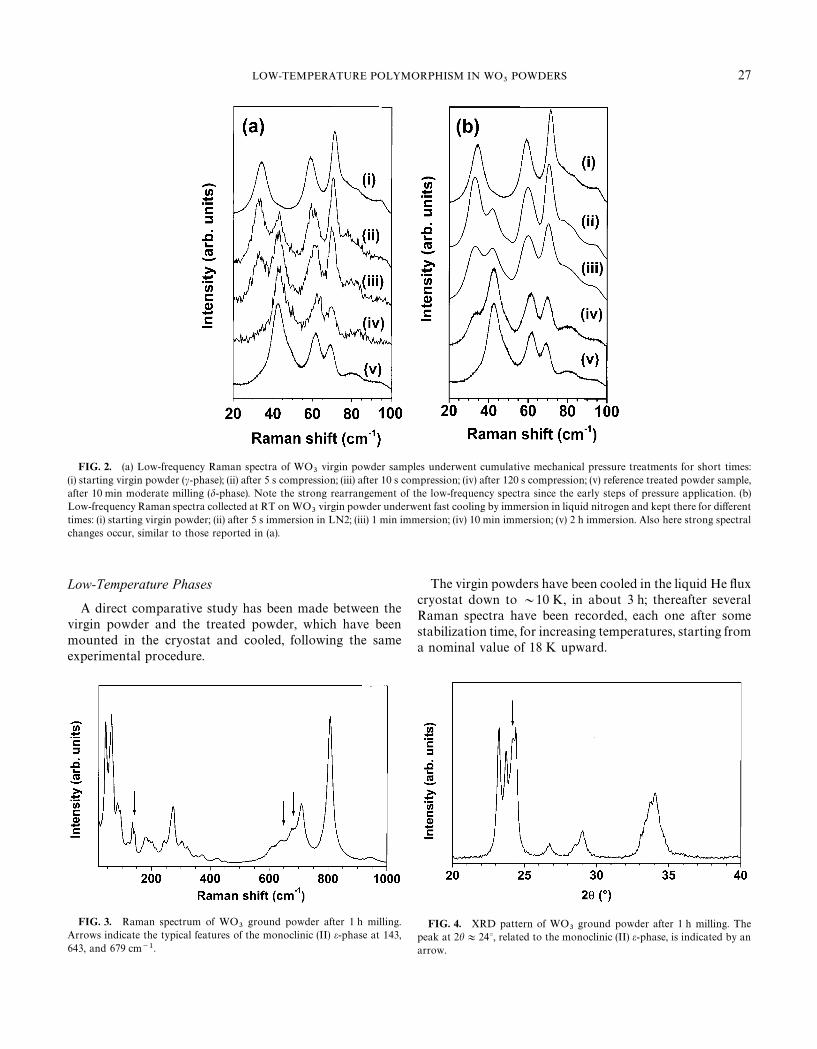
FIG. 2. (a) Low-frequency Raman spectra of WO3
virgin powder samples underwent cumulative mechanical pressure treatments for short times:(i) starting virgin powder (c-phase); (ii) after 5 s compression; (iii) after 10 s compression; (iv) after 120 s compression; (v) reference treated powder sample,after 10 min moderate milling (d-phase). Note the strong rearrangement of the low-frequency spectra since the early steps of pressure application. (b)Low-frequency Raman spectra collected at RT on WO
3virgin powder underwent fast cooling by immersion in liquid nitrogen and kept there for different
times: (i) starting virgin powder; (ii) after 5 s immersion in LN2; (iii) 1 min immersion; (iv) 10 min immersion; (v) 2 h immersion. Also here strong spectralchanges occur, similar to those reported in (a).
LOW-TEMPERATURE POLYMORPHISM IN WO3
POWDERS 27
Low-Temperature Phases
A direct comparative study has been made between thevirgin powder and the treated powder, which have beenmounted in the cryostat and cooled, following the sameexperimental procedure.
FIG. 3. Raman spectrum of WO3
ground powder after 1 h milling.Arrows indicate the typical features of the monoclinic (II) e-phase at 143,643, and 679 cm~1.
The virgin powders have been cooled in the liquid He fluxcryostat down to &10 K, in about 3 h; thereafter severalRaman spectra have been recorded, each one after somestabilization time, for increasing temperatures, starting froma nominal value of 18 K upward.
FIG. 4. XRD pattern of WO3
ground powder after 1 h milling. Thepeak at 2h+24°, related to the monoclinic (II) e-phase, is indicated by anarrow.
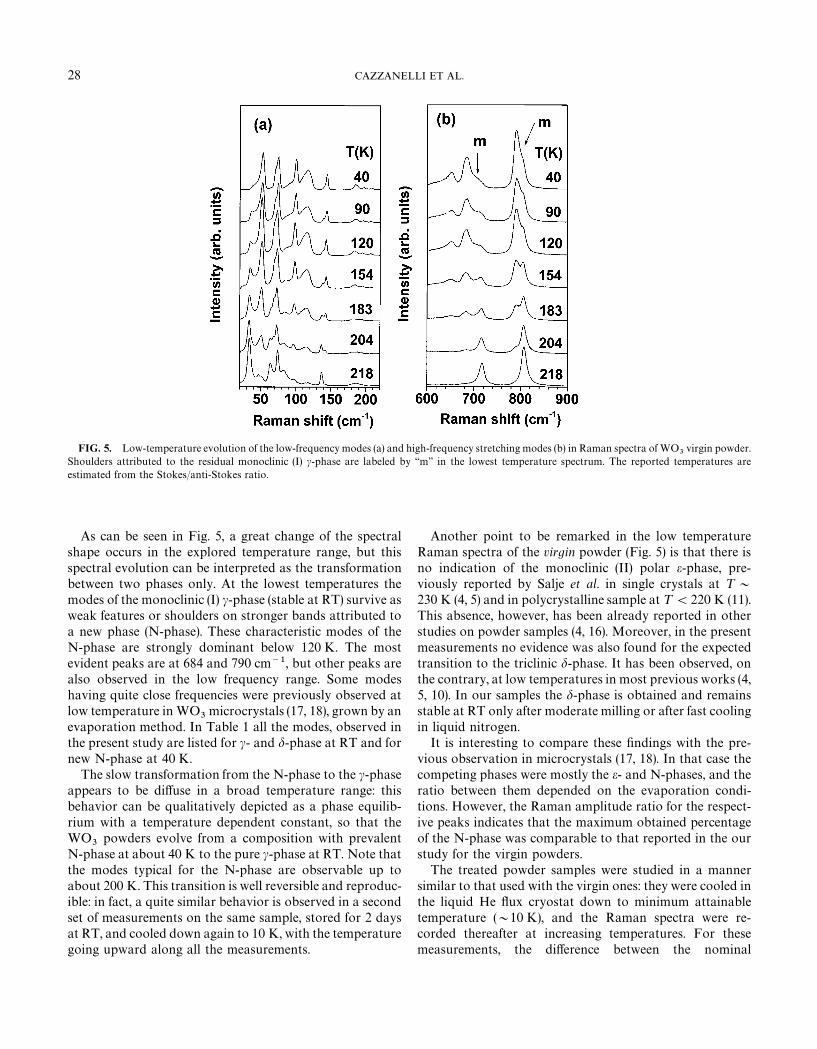
FIG. 5. Low-temperature evolution of the low-frequency modes (a) and high-frequency stretching modes (b) in Raman spectra of WO3
virgin powder.Shoulders attributed to the residual monoclinic (I) c-phase are labeled by ‘‘m’’ in the lowest temperature spectrum. The reported temperatures areestimated from the Stokes/anti-Stokes ratio.
28 CAZZANELLI ET AL.
As can be seen in Fig. 5, a great change of the spectralshape occurs in the explored temperature range, but thisspectral evolution can be interpreted as the transformationbetween two phases only. At the lowest temperatures themodes of the monoclinic (I) c-phase (stable at RT) survive asweak features or shoulders on stronger bands attributed toa new phase (N-phase). These characteristic modes of theN-phase are strongly dominant below 120 K. The mostevident peaks are at 684 and 790 cm~1, but other peaks arealso observed in the low frequency range. Some modeshaving quite close frequencies were previously observed atlow temperature in WO
3microcrystals (17, 18), grown by an
evaporation method. In Table 1 all the modes, observed inthe present study are listed for c- and d-phase at RT and fornew N-phase at 40 K.
The slow transformation from the N-phase to the c-phaseappears to be diffuse in a broad temperature range: thisbehavior can be qualitatively depicted as a phase equilib-rium with a temperature dependent constant, so that theWO
3powders evolve from a composition with prevalent
N-phase at about 40 K to the pure c-phase at RT. Note thatthe modes typical for the N-phase are observable up toabout 200 K. This transition is well reversible and reproduc-ible: in fact, a quite similar behavior is observed in a secondset of measurements on the same sample, stored for 2 daysat RT, and cooled down again to 10 K, with the temperaturegoing upward along all the measurements.
Another point to be remarked in the low temperatureRaman spectra of the virgin powder (Fig. 5) is that there isno indication of the monoclinic (II) polar e-phase, pre-viously reported by Salje et al. in single crystals at ¹&
230 K (4, 5) and in polycrystalline sample at ¹(220 K (11).This absence, however, has been already reported in otherstudies on powder samples (4, 16). Moreover, in the presentmeasurements no evidence was also found for the expectedtransition to the triclinic d-phase. It has been observed, onthe contrary, at low temperatures in most previous works (4,5, 10). In our samples the d-phase is obtained and remainsstable at RT only after moderate milling or after fast coolingin liquid nitrogen.
It is interesting to compare these findings with the pre-vious observation in microcrystals (17, 18). In that case thecompeting phases were mostly the e- and N-phases, and theratio between them depended on the evaporation condi-tions. However, the Raman amplitude ratio for the respect-ive peaks indicates that the maximum obtained percentageof the N-phase was comparable to that reported in the ourstudy for the virgin powders.
The treated powder samples were studied in a mannersimilar to that used with the virgin ones: they were cooled inthe liquid He flux cryostat down to minimum attainabletemperature (&10 K), and the Raman spectra were re-corded thereafter at increasing temperatures. For thesemeasurements, the difference between the nominal
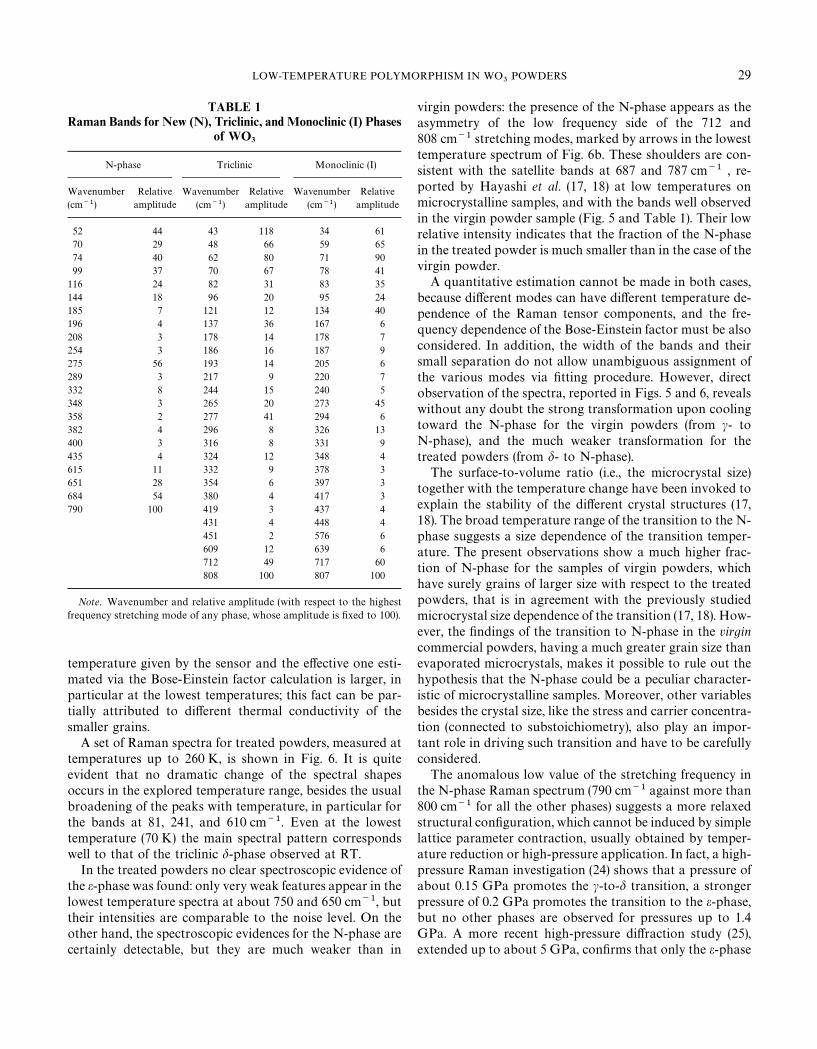
TABLE 1Raman Bands for New (N), Triclinic, and Monoclinic (I) Phases
of WO3
N-phase Triclinic Monoclinic (I)
Wavenumber(cm~1)
Relativeamplitude
Wavenumber(cm~1)
Relativeamplitude
Wavenumber(cm~1)
Relativeamplitude
52 44 43 118 34 6170 29 48 66 59 6574 40 62 80 71 9099 37 70 67 78 41
116 24 82 31 83 35144 18 96 20 95 24185 7 121 12 134 40196 4 137 36 167 6208 3 178 14 178 7254 3 186 16 187 9275 56 193 14 205 6289 3 217 9 220 7332 8 244 15 240 5348 3 265 20 273 45358 2 277 41 294 6382 4 296 8 326 13400 3 316 8 331 9435 4 324 12 348 4615 11 332 9 378 3651 28 354 6 397 3684 54 380 4 417 3790 100 419 3 437 4
431 4 448 4451 2 576 6609 12 639 6712 49 717 60808 100 807 100
Note. Wavenumber and relative amplitude (with respect to the highestfrequency stretching mode of any phase, whose amplitude is fixed to 100).
LOW-TEMPERATURE POLYMORPHISM IN WO3
POWDERS 29
temperature given by the sensor and the effective one esti-mated via the Bose-Einstein factor calculation is larger, inparticular at the lowest temperatures; this fact can be par-tially attributed to different thermal conductivity of thesmaller grains.
A set of Raman spectra for treated powders, measured attemperatures up to 260 K, is shown in Fig. 6. It is quiteevident that no dramatic change of the spectral shapesoccurs in the explored temperature range, besides the usualbroadening of the peaks with temperature, in particular forthe bands at 81, 241, and 610 cm~1. Even at the lowesttemperature (70 K) the main spectral pattern correspondswell to that of the triclinic d-phase observed at RT.
In the treated powders no clear spectroscopic evidence ofthe e-phase was found: only very weak features appear in thelowest temperature spectra at about 750 and 650 cm~1, buttheir intensities are comparable to the noise level. On theother hand, the spectroscopic evidences for the N-phase arecertainly detectable, but they are much weaker than in
virgin powders: the presence of the N-phase appears as theasymmetry of the low frequency side of the 712 and808 cm~1 stretching modes, marked by arrows in the lowesttemperature spectrum of Fig. 6b. These shoulders are con-sistent with the satellite bands at 687 and 787 cm~1 , re-ported by Hayashi et al. (17, 18) at low temperatures onmicrocrystalline samples, and with the bands well observedin the virgin powder sample (Fig. 5 and Table 1). Their lowrelative intensity indicates that the fraction of the N-phasein the treated powder is much smaller than in the case of thevirgin powder.
A quantitative estimation cannot be made in both cases,because different modes can have different temperature de-pendence of the Raman tensor components, and the fre-quency dependence of the Bose-Einstein factor must be alsoconsidered. In addition, the width of the bands and theirsmall separation do not allow unambiguous assignment ofthe various modes via fitting procedure. However, directobservation of the spectra, reported in Figs. 5 and 6, revealswithout any doubt the strong transformation upon coolingtoward the N-phase for the virgin powders (from c- toN-phase), and the much weaker transformation for thetreated powders (from d- to N-phase).
The surface-to-volume ratio (i.e., the microcrystal size)together with the temperature change have been invoked toexplain the stability of the different crystal structures (17,18). The broad temperature range of the transition to the N-phase suggests a size dependence of the transition temper-ature. The present observations show a much higher frac-tion of N-phase for the samples of virgin powders, whichhave surely grains of larger size with respect to the treatedpowders, that is in agreement with the previously studiedmicrocrystal size dependence of the transition (17, 18). How-ever, the findings of the transition to N-phase in the virgincommercial powders, having a much greater grain size thanevaporated microcrystals, makes it possible to rule out thehypothesis that the N-phase could be a peculiar character-istic of microcrystalline samples. Moreover, other variablesbesides the crystal size, like the stress and carrier concentra-tion (connected to substoichiometry), also play an impor-tant role in driving such transition and have to be carefullyconsidered.
The anomalous low value of the stretching frequency inthe N-phase Raman spectrum (790 cm~1 against more than800 cm~1 for all the other phases) suggests a more relaxedstructural configuration, which cannot be induced by simplelattice parameter contraction, usually obtained by temper-ature reduction or high-pressure application. In fact, a high-pressure Raman investigation (24) shows that a pressure ofabout 0.15 GPa promotes the c-to-d transition, a strongerpressure of 0.2 GPa promotes the transition to the e-phase,but no other phases are observed for pressures up to 1.4GPa. A more recent high-pressure diffraction study (25),extended up to about 5 GPa, confirms that only the e-phase
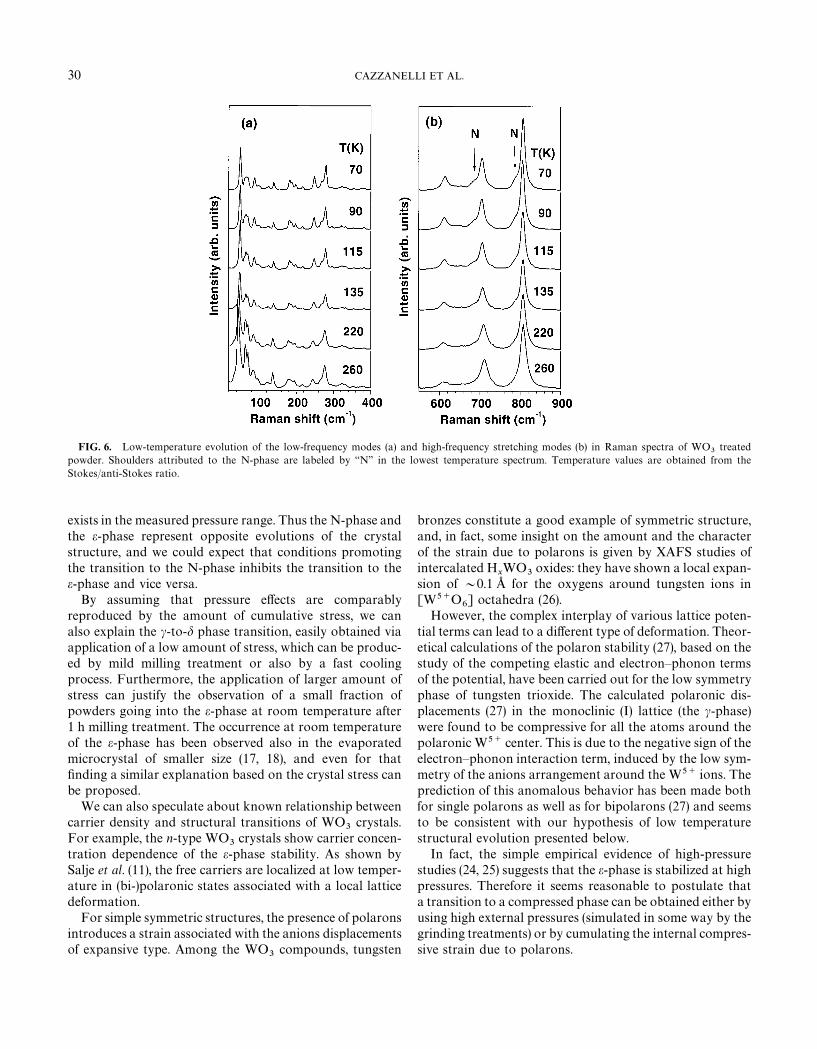
FIG. 6. Low-temperature evolution of the low-frequency modes (a) and high-frequency stretching modes (b) in Raman spectra of WO3
treatedpowder. Shoulders attributed to the N-phase are labeled by ‘‘N’’ in the lowest temperature spectrum. Temperature values are obtained from theStokes/anti-Stokes ratio.
30 CAZZANELLI ET AL.
exists in the measured pressure range. Thus the N-phase andthe e-phase represent opposite evolutions of the crystalstructure, and we could expect that conditions promotingthe transition to the N-phase inhibits the transition to thee-phase and vice versa.
By assuming that pressure effects are comparablyreproduced by the amount of cumulative stress, we canalso explain the c-to-d phase transition, easily obtained viaapplication of a low amount of stress, which can be produc-ed by mild milling treatment or also by a fast coolingprocess. Furthermore, the application of larger amount ofstress can justify the observation of a small fraction ofpowders going into the e-phase at room temperature after1 h milling treatment. The occurrence at room temperatureof the e-phase has been observed also in the evaporatedmicrocrystal of smaller size (17, 18), and even for thatfinding a similar explanation based on the crystal stress canbe proposed.
We can also speculate about known relationship betweencarrier density and structural transitions of WO
3crystals.
For example, the n-type WO3
crystals show carrier concen-tration dependence of the e-phase stability. As shown bySalje et al. (11), the free carriers are localized at low temper-ature in (bi-)polaronic states associated with a local latticedeformation.
For simple symmetric structures, the presence of polaronsintroduces a strain associated with the anions displacementsof expansive type. Among the WO
3compounds, tungsten
bronzes constitute a good example of symmetric structure,and, in fact, some insight on the amount and the characterof the strain due to polarons is given by XAFS studies ofintercalated H
xWO
3oxides: they have shown a local expan-
sion of &0.1 A_ for the oxygens around tungsten ions in[W5`O
6] octahedra (26).
However, the complex interplay of various lattice poten-tial terms can lead to a different type of deformation. Theor-etical calculations of the polaron stability (27), based on thestudy of the competing elastic and electron—phonon termsof the potential, have been carried out for the low symmetryphase of tungsten trioxide. The calculated polaronic dis-placements (27) in the monoclinic (I) lattice (the c-phase)were found to be compressive for all the atoms around thepolaronic W5` center. This is due to the negative sign of theelectron—phonon interaction term, induced by the low sym-metry of the anions arrangement around the W5` ions. Theprediction of this anomalous behavior has been made bothfor single polarons as well as for bipolarons (27) and seemsto be consistent with our hypothesis of low temperaturestructural evolution presented below.
In fact, the simple empirical evidence of high-pressurestudies (24, 25) suggests that the e-phase is stabilized at highpressures. Therefore it seems reasonable to postulate thata transition to a compressed phase can be obtained either byusing high external pressures (simulated in some way by thegrinding treatments) or by cumulating the internal compres-sive strain due to polarons.
LOW-TEMPERATURE POLYMORPHISM IN WO3
POWDERS 31
We suggest that the e-phase is favored by the total straingenerated by (bi)polarons when they reach a sufficient con-centration, equivalent to the application of high pressure.Thus the evolution of WO
3toward either e-phase or N-
phase can be determined also by the carrier concentration,associated with oxygen deficiency. In fact, slightly defectiveWO
3~xsamples show the transition to the e-phase (8, 13),
while the N-phase seems to be characteristic of crystalshaving minimum amount of stress and very low carrierconcentration. This hypothesis must be confined to therange of small and very small charge carrier concentration,because it is known that in highly reduced samples a metal-lic like conductivity occurs and the stability of low temper-ature e-phase is destroyed (28). Finally, the observed crystalsize dependence of phase transitions in our powders havingdifferent grain sizes can be correlated with the presence ofthe localized and nonlocalized charge carriers which orig-inate at the reduced free surface of WO
3crystals (29).
CONCLUSIONS
The present investigations of the tungsten trioxide com-mercial powders below room temperature, down to about40 K, show different phase transition sequences with respectto the previous studies (4, 5, 11) and, in particular, the occur-rence of a diffuse transition into the new N-phase. The lowtemperature crystal structures of the powder samples arestrongly influenced by the different mechanical history of thesamples, and the kinetics of the transitions appear to berelevant. Such behavior reveals the occurrence of processesdifficult for a description within the thermodynamic equilib-rium framework. The diffuse transition to the N-phase, in thewide temperature range 40—200 K, appears as the most rel-evant phenomenon in the low-temperature transformation ofWO
3virgin powder samples analyzed in the present work.
The Raman spectroscopic evidences of the low temper-ature evolution studied here for different powder samplescan be summarized as follows:
(i) Virgin powders of large grain size with no accumu-lated stress and having c-phase at RT transform increasing-ly into the N-phase upon cooling. The transition to thetriclinic d-phase, reported for other samples (1, 7, 9, 11) isnot observed.
(ii) Only a small fraction of the treated powders, havingsmall grain size and mechanically stressed before the cool-ing process, transforms at comparable temperatures into theN-phase. In this case, the starting triclinic d-phase, obtainedby moderate milling at room temperature, remains domi-nant even at the lowest temperatures.
(iii) No clear spectroscopic evidence of the transition tothe e-phase, reported by Salje et al. for single crystals at¹&230 K (4, 5) and polycrystalline samples at ¹(220 K(11), is observed in both virgin and treated powders uponcooling.
(iv) In contrast, a transition to the e-phase is observed fora small fraction of the powder samples at room temperatureafter 1 h milling. For longer milling times the broadening ofthe peaks does not allow to discriminate the crystal phasespresent in the powder samples.
It is noticeable, for the powder samples used in the pres-ent work, that the low-temperature phases, such as thed-phase and the e-phase, are not obtained by cooling inequilibrium conditions, as usually reported in most of theexisting literature (1, 7, 9, 11), but rather by more or lessprolonged mechanical stress at room temperature. How-ever, this fact seems to be consistent with high-pressuremeasurements, showing the c-to-d phase transition for rela-tively low applied pressures and the transition to the e-phasefor higher pressures (24, 25). In fact, the d-phase has beenalso observed in the virgin powders after fast cooling byimmersion in liquid nitrogen. On the contrary, a slowercooling rate, given by the helium flux cryostat, leaves thevirgin powders into the c-phase, until a new N-phase, neverfound previously in macroscopic crystals (4, 5, 11), appearsbelow 200 K and becomes dominant at the lowest temper-atures. It is worth remarking on the dependence of thetransition on the cooling kinetics.
Obviously the Raman spectral evolution alone cannotprovide a satisfactory description of the polymorphysm ofWO
3, in particular about the space group of the N-phase,
and a clear crystallographic definition can be given only bylow-temperature XRD measurements. Nevertheless, the ob-served Raman spectrum of the N-phase, with its uniquelowering of the highest frequency stretching modes, isa good marker of this phase, allowing its fast recognition indifferent samples.
The understanding of the new N-phase and the transi-tions between the different observed structures should takeinto account the interplay of stress, crystal size (surfaceeffects) and carrier concentration. In our opinion, furtherstudies, focused on the interaction of charge carriers respon-sible for the electronic properties of the material (11, 13)with the low-temperature structural phase transitions, arenecessary.
ACKNOWLEDGMENTS
A.K. and J.P. thank the Centro CNR-ITC di Fisica degli Stati Aggregatied Impianto Ionico (Trento) and the Universita di Trento for hospitalityand financial support.
REFERENCES
1. S. Tanisaki, J. Phys. Soc. Jpn. 15, 566 (1960).2. B. O. Loopstra and P. Boldrini, Acta Crystallogr. B 21, 158 (1966).3. B. O. Loopstra and H. M. Rietveld, Acta Crystallogr. B 25, 1420 (1969).4. E. Salje and K. Viswanathan, Acta Crystallogr. A 31, 356 (1975).5. E. Salje, Acta Crystallogr. A 31, 360 (1975).6. E. Salje, Acta Crystallogr. B 33, 574 (1977).
32 CAZZANELLI ET AL.
7. R. Diehl, G. Brandt, and E. Salje, Acta Crystallogr. B 34, 1105 (1978).8. T. Hirose, J. Phys. Soc. Jpn. 49, 562 (1980).9. P. W. Woodward, A. W. Sleight, and T. Vogt, J. Phys. Chem. Solids 56,
1305 (1995).10. K. L. Kehl, R. G. Hay, and D. Wahl, J. Appl. Phys. 23, 212 (1952).11. E. K. H. Salje, S. Rehmann, F. Pobell, D. Morris, K. S. Knight, T.
Herrmannsdorfer, and M. T. Dove, J. Phys. C: Condens. Matter 9, 6563(1997); E. Salje, Ferroelectrics 12, 215 (1976).
12. E. Iguchi, H. Sugimoto, A. Tamenori, and H. Miyagi, J. Solid StateChem. 91, 286 (1991).
13. I. Lefkowitz, M. B. Dowell, and M. A. Shields, J. Solid State Chem. 15,24 (1975).
14. J. B. Goodenough, Prog. Solid State Chem. 5, 145 (1971).15. J. M. Berak and M. J. Sienko, J. Solid State Chem. 2, 109 (1970).16. A. Anderson, Spectrosc. ¸ett. 9, 809 (1976).17. M. Arai, S. Hayashi, K. Yamamoto, and S. S. Kim, Solid State Commun.
75, 613 (1990).18. S. Hayashi, H. Sugano, H. Arai, and K. Yamamoto, J. Phys. Soc. Jpn.
61, 916 (1992).
19. E. V. Gabrusenoks, Sov. Phys. Solid State 26, 2226 (1984).20. M. F. Daniel, B. Desbat, J. C. Lessegues, B. Gerand, and M. Figlarz,
J. Solid State Chem. 67, 235 (1987).21. J. J. Purans and P. D. Cikmach, ‘‘Proceedings, All Union Conference
on Physics of Oxide Films,’’ p. 51. Petrozavodsk, 1982. [in Russian]22. E. Cazzanelli, G. Mariotto, C. Vinegoni, A. Kuzmin, and J. Purans,
Proc. Electrochem. Soc. 96-24, 260 (1996); A. Kuzmin, J. Purans, E.Cazzanelli, C. Vinegoni, and G. Mariotto, J. Appl. Phys. 84, 5515(1998).
23. J. I. Langford and D. Louer, Rep. Prog. Phys. 59, 131 (1996).24. E. Salje and G. Hoppman, High ¹emp. High Pressures 12, 213
(1980).25. Y. Xu, S. Carlson, and R. Norrestam, J. Solid State Chem. 132, 123
(1997).26. A. Kuzmin and J. Purans, J. Phys. : Condensed Matter 5, 2233 (1993).27. E. Iguchi and H. Miyagi, J. Phys. Chem. Solids 54, 403 (1993).28. E. Salje, A. F. Carley, and M. W. Roberts, J. Solid State Chem. 29, 237
(1979).29. F. H. Jones, R. A. Dixon, and A. Brown, Surf. Sci. 369, 343 (1996).