Toxic acute tubular necrosis following treatment with zoledronate (Zometa
Upload
teknologimalaysiaCategory
view
1download
0
La
M
a
b
a
ARRAA
KTPHF
1
stteepcagosea
c
0d
Biosensors and Bioelectronics 26 (2011) 3562–3569
Contents lists available at ScienceDirect
Biosensors and Bioelectronics
journa l homepage: www.e lsev ier .com/ locate /b ios
ow-potential sensitive H2O2 detection based on composite micro tubular Tedsorbed on platinum electrode
.R. Guascitoa,∗, D. Chirizzi a, C. Malitestaa, E. Mazzottaa, M.Sicilianob, T. Sicilianob, A. Teporeb, A. Turcoa,1
Laboratorio di Chimica Analitica, Dipartimento di Scienza dei Materiali, Università del Salento, Via Monteroni, 73100 Lecce, ItalyLaboratorio di Crescita di Cristalli, Dipartimento di Scienza dei Materiali, Università del Salento, Via Monteroni, 73100 Lecce, Italy
r t i c l e i n f o
rticle history:eceived 20 November 2010eceived in revised form 1 February 2011ccepted 4 February 2011vailable online 12 February 2011
eywords:e microtubest/Te microtubes electrode
a b s t r a c t
In this work a new original amperometric sensor for H2O2 detection based on a Pt electrode modified withTe-microtubes was developed. Te-microtubes, synthesized by the simple thermal evaporation of Te pow-der, have a tubular structure with a hexagonal cross-section and are open ended. Modified electrode wasprepared by direct drop casting of the mixture of Te-microtubes dispersed in ethanol on Pt surface. Thespectroscopic characterization of synthesized Te-microtubes and Pt/Te-microtubes modified electrodeswas performed by scanning electron microscopy (SEM), energy-dispersive X-rays microanalysis (EDX),X-ray diffraction analysis (XRD) and X-ray photoelectron spectroscopy (XPS). Moreover a complete elec-trochemical characterization of the new composite material Pt/Te-microtubes was performed by cyclic
2O2 amperometric detectionIA detection
voltammetry (CV) and cronoamperometry (CA) in phosphate buffer solution (PBS) at pH 7. Electrochem-ical experiments showed that the presence of Te-microtubes on modified electrode was responsible foran increment of both cathodic and anodic currents in presence of H2O2 with respect to bare Pt. Specifi-cally, data collected from amperometric experiments at −150 mV vs. SCE in batch and −200 mV vs. SCEin flow injection analysis (FIA) experiments show a remarkable increment of the cathodic current. Theelectrochemical performances of tested sensors make them suitable for the quantitative determinationof H2O2 substrate both in batch and in FIA.
. Introduction
The control of the shape and orientation of nano- and micro-tructures as well as the ability to order and align them onto variousypes of substrates represents an essential tasks to fulfil to createhe future generation of smart and functional materials (Ritchiet al., 2009 and references therein; Viswanath et al., 2009 and ref-rences therein). Further, numerous applications require a highorosity and large surface area to fulfil the demand of high effi-iency and activity (Feng et al., 2007; Li et al., 2009; Yogeswarannd Chen, 2008). Decreasing the particle size is one effective way toreatly increase the specific surface area of materials. Alternatively,
ne may design materials with hollow structures to contributeimultaneously to the extension of porosity and surface area (Lit al., 2009 and references therein). Since the discovery of multi-nd single-walled carbon nanotubes in 1991 (Iijima, 1991), numer-∗ Corresponding author. Tel.: +39 0832 297075; fax: +39 0832 297100.E-mail address: [email protected] (M.R. Guascito).
1 Present address: Università degli Studi di Trieste, Dipartimento Scienze Farma-eutiche, Piazzale Europa 1, 34127 Trieste, Italy.
956-5663/$ – see front matter © 2011 Elsevier B.V. All rights reserved.oi:10.1016/j.bios.2011.02.002
© 2011 Elsevier B.V. All rights reserved.
ous efforts have been directed towards the fabrication of numerousone dimensional (1D) micro/nanoscale tubular materials with hol-low interior structure (Lee et al., 2009 and references therein).Various inorganic micrometer tubes materials such as oxides, sul-phides and nitrides as well as elemental materials have beenfabricated. One of the elemental material of interest is Te which is ap-type elemental semiconductor with physical and chemical prop-erties that make it suitable for various technological applications(Siciliano et al., 2009).
Analytical determination of H2O2 represents an important topicof environmental, pharmaceutical, clinical and industrial interestas reported in several recent works (Li et al., 2010 and refer-ences therein). In such context, electrochemical sensors representan appropriate alternative with respect to traditional techniquesthat are more expensive and time consuming. Moreover there isalso a continuing interest in developing new materials to be usedfor H2O2 detection in “first generation” biosensors containing oxi-
dases (Elzanowska et al., 2004). Several electrochemical sensorbased on nano-, meso- and/or micro-structures of different mate-rials as metal, carbon nanotubes, transition metal oxides, Prussianblue (Ji et al., 2009 and references therein; Li et al., 2010; Zhanget al., 2009) and also conducting polymers modified electrodes
M.R. Guascito et al. / Biosensors and Bioelectronics 26 (2011) 3562–3569 3563
F 3d dee ction 2
(Hat
mMmsoap
2
2
dA
ig. 1. SEM images of as-synthesized Te-microtubes (A), wide XPS spectra (B), Telectrode: as prepared (D) and after 10 CV cycles in clean PBS (E). For details see Se
Park et al., 2008) have been studied analysing their response to2O2. However, to the best of our knowledge, there were no reportsbout the development of sensor based on Te microstructures forhe detection of H2O2.
In this work a new amperometric sensor based on a Pt electrodeodified with Te microtubes (Pt/Te-microtubes) was developed.odified electrodes were prepared by direct drop casting of theixture containing Te-microtubes dispersed in ethanol onto Pt
urface. The spectroscopic characterization of Te-microtubes andf Pt/Te-microtubes was performed by SEM, EDX, XRD and XPSnalysis. Electrochemical characterization of Pt/Te-microtubes waserformed by CV and CA.
. Experimental
.1. Chemicals
H2SO4, Na2HPO4, NaH2PO4, H2O2 solution 30% (w/w), Te pow-er, ethyl alcohol were analytical grade reagents furnished fromldrich, as all other chemicals employed.
tailed spectrum of as-synthesized Te-microtubes (C), Pt/Te-microtubes modified.
Deionised ultra-filtered water prepared with a Milli-Qwater purification system has been used throughout theexperiments. Stock H2O2 solutions were freshly prepared inwater.
2.2. Apparatus
All electrochemical experiments were carried out by usinga PalmSens electrochemical workstation (Palm Instruments BV,The Netherlands) controlled by computer. In batch experimentsa conventional three-electrode system was used with a Ptdisk (0.0314 cm2) as working electrode, a Pt wire as counterelectrode and a saturated calomel electrode (SCE) as refer-ence electrode. All voltammetric and amperometric experimentswere carried out in a solution of PBS (pH 7.0, I = 0.2) bub-bled with N2 for 15 min to avoid oxygen interference and a
nitrogen atmosphere was maintained in the cell throughout themeasurements.Electrochemical experiments in FIA were carried out by usingscreen-printed electrodes (SPE) purchased from BVT Technologies(Czech Republic) together with the connectors. The Pt work-

3 nd Bioelectronics 26 (2011) 3562–3569
iet7fa(TS
Jtowm
aesdPimbti2abubpswp2
2
adtcdleaoc
2
etdTreafitmt
564 M.R. Guascito et al. / Biosensors a
ng electrode (0.00785 cm2) is surrounded by a quasi-referencelectrode, made with an Ag/AgCl paste. The Pt counter elec-rode is the outermost ring of the device. Electrode sizes are.26 mm × 25.40 mm × 0.63 mm. FIA measurements were per-ormed by a Gilson Minipuls 3 Peristaltic Pump (Gilson SAS, France),six-way low pressure injection valve (injection volume 110 �L)
Rheodyne, Cotati, USA) and a FC1 flow-cell (Palm Instruments BV,he Netherlands). All reported potentials have been corrected vs.CE.
The morphology of the samples was examined by SEM using aEOL JSM 6310 equipped with an Oxford X-ray microanalysis sys-em at an acceleration voltage of 20 kV. XRD diffraction patternsf the samples were recorded on a Rigaku MiniFlex diffractometerith Cu K� radiation (� ∼ 1.54056 A). The 2� range used in theseeasurements was from 20◦ to 80◦ in steps of 0.02◦.XPS spectra were recorded using a Leybold LHS10 upgraded by
PHOIBOS 100 Analyzer/Detector system (SPECS, Berlin, Germany)quipped with a twin anode (Mg K�/Al K�) non-monochromatizedource (operating at 200 W). Survey spectra (FRR, B = 30) andetail spectra (FAT, E0 = 50 eV) for C 1s–Pt 4d, O 1s–Te 3d andt 4f-valence band (VB) regions were collected at 0.1 eV stepntervals. High-resolution spectra were referenced to the C 1s
ain component binding energy of the adventitious hydrocar-on at 285.0 eV. All XPS spectra were recorded at an electronake-off-angle (TOA) of 90◦ relative to the sample surface, giv-ng the maximal sampling depth 3� of about 5 nm (Zhou et al.,002). For comparison, Pt/Te-microtubes samples were analyzeds prepared and after being subjected to almost 10 CVs obtainedetween −200 and +800 mV vs. SCE, scan rate 10 mV s−1 in PBS,ntil a steady-state current was obtained. Immediately prior toeing loaded into the XPS spectrometer, Pt/Te-microtubes sam-les were washed in water and were finally blown-dry using atream of N2. XPS spectra of Pt foil, Te powders and Te-microtubesere also collected. Data analysis of high-resolution spectra waserformed using the fitting program GOOGLY (Castle and Salvi,001).
.3. Synthesis of Te-microtubes
Synthesis of Te-microtubes was obtained according to a methodlready reported in literature (Siciliano et al., 2009), described inetail in Supporting Information. SEM images show that the syn-hesized Te-microtubes have a tubular structure with a hexagonalross-section and are open ended (Fig. 1A). They have externaliameter of about 30–70 �m, thickness of about 5–20 �m and
ength ranging from 0.5 to 6 mm. EDX patterns obtained from differ-nt individual microtubes show that only Te peaks exist. Moreoverll reflections of the XRD pattern have been indexed to the hexag-nal crystal structure of Te with lattice constants a = 4.458 A and= 5.927 A.
.4. “Upside-down” (UD) geometry experiments
The electrochemical characterization of Te-microtubes on Ptlectrode was carried out with a three-electrode cell in UD geome-ry (Losito, 1997). In this configuration, the electrolytic solution (note-aerated PBS) was dropped on the surface of a Pt disk electrode.wo Pt wires worked as counter and quasi-reference electrodes,espectively being immersed in the drop on the Pt surface. CVxperiments were carried out both on pristine Pt and on Pt after
dding 10 mg of Te-microtubes (� (Te) = 2.5 mmol cm−2). In this con-guration the electrochemical response of Te-microtubes respecto Pt substrate was increased in comparison with Pt/Te-microtubesodified electrode obtained from “adsorption” as reported in Sec-ion 2.5.
Fig. 2. Cyclic voltammograms of Pt/Te-microtubes modified electrodes in PBS (pH7.0, I = 0.2) cycled between −200 and +800 mV vs. SCE on Pt disk (a) and SPE (b)electrodes, in steady-state conditions. Scan rate 10 mV s−1.
2.5. Preparation of the Pt/Te-microtubes for batch analysis
The surface of Pt disk electrode was polished with dia-mond paper, washed and cycled between −200 and +1190 mVin 0.5 M H2SO4 until steady state. Successively the electrodewas washed and dried with N2 flow. Modified electrodes weremade by casting 20 �L of the Te-microtubes/ethanol suspension(0.16 mg/200 �L − � (Te) = 4.14 �mol cm−2) directly onto the Pt sur-face, then the surface was allowed to dry at room temperature for30 min. The adsorption of Te-microtubes on Pt was confirmed byXPS spectroscopy (see Section 3.1). After, Pt/Te-microtubes elec-trodes were cycled in PBS between −200 and +800 mV at 10 mV s−1,until steady state (almost 10 CV cycles, see Fig. 2A) to make a stablematerial to be used for H2O2 detection.
The amperometric response of Pt/Te-microtubes electrode wasevaluated at −150 mV vs. SCE in stirred PBS (pH 7.0, I = 0.2) aftersuccessive H2O2 additions. Sensor response to interferences (glu-cose, uric acid, ascorbic acid, tyrosine, dopamine) was analyzed inthe same experimental conditions.
2.6. Preparation of the Pt/Te-microtubes for FIA analysis
Before film deposition, CV in H2SO4 0.5 M between −210 and+1190 mV revealed the absence of electroactive impurities on theworking electrode surface. SPE modified Pt/Te-microtubes sensorwas then prepared by dropping 10 �L of Te-microtubes/ethanolsuspension (� (Te) = 8.3 �mol cm−2) on Pt electrode. Typical CVcurves of Pt/Te-microtubes in steady-state conditions (Fig. 2 B) havebeen recorded.
Afterwards, the flow cell and the modified SPE were arrangedin the flow system for chrono-amperometric measurementsat applied potential of −300 mV vs. quasi-reference Ag/AgCl(−200 mV vs. SCE) in order to reduce H2O2. A flow rate of1 mL min−1 was selected using PBS as carrier. The evaluation of

d Bioelectronics 26 (2011) 3562–3569 3565
apTct
3
3
a1nape3cspssttiw5pa(mTaTomas
3
miiaPtitmw(
er(
T
T
Fig. 3. (A) Cyclic voltammograms recorded on Pt disk electrode in “up-side down”configuration at scan rate 10 mV s−1, in absence (curve a) and in presence of Te-
M.R. Guascito et al. / Biosensors an
mperometric response was performed by measuring the currenteak of H2O2 in a concentration range between 1 nM and 30 mM.hree subsequent injections have been performed for each analyteoncentration and each amperometric run was repeated for threeimes on a freshly prepared modified electrode.
. Results and discussion
.1. Spectroscopic characterization
Fig. 1B shows XPS survey spectra of Te-microtubes (curve a)nd of Pt/Te-microtubes before and after being subjected to almost0 voltammetric cycles (curves b and c), providing details of theear surface chemistry of the microtubes and of Te-microtubes Ptdsorbed, respectively. XPS spectra of Pt foil (curve d) and Te(0)owder (data not shown) as standards, have been also acquired. Asxpected survey spectra of Te-microtubes samples always show Ted, O 1s and C 1s peak signals. C 1s peak signals were attributed toarbon-containing species present as contaminations, while O peakignals could be attributed both to carbonaceous and Te-oxide com-onents. For Pt/Te-microtubes samples, signals from platinum sub-trate were also present. Fig. 1C–E shows details of high-resolutionpectra of Te 3d that provide binding energy information. Typicallyhree peak components were used to fit Te 3d5/2 region. Accordingo literature (Zhou et al., 2002 and references therein), the mostntense peaks, always present at 573.3 ± 0.1 and 576.6 ± 0.1 eV,
ere attributed, respectively, to Te(0) (according also to BE of73.4 ± 0.1 eV obtained for Te(0) standard) and Te(IV). Instead, theeak component at 577.8 ± 0.1 related to Te(VI), (Bahl et al., 1977)nd recorded both on Te-microtubes (Fig. 1C) and Pt/Te-microtubesFig. 1D) samples, was not evident after the electrochemical treat-
ent, confirming that this species is not stable at pH 7 (Ricketts andresselt, 1959). A new component at 575.6 ± 0.1 eV is now recordednd related to Te–Pt adsorbed species (Zhou et al., 2002). Pt 4f ande 3d peak areas were compared to give a percentage concentrationf each element within an analyzed area of few mm2. The Te/Pt ele-ental ratio was found to be in average 0.31 in prepared samples,
nd 0.25 after the electrochemical CV experiments, confirming thetability of Te-microtubes Pt adsorbed.
.2. Electrochemical characterization of Te-microtubes
CV was used to study the electrochemical properties of Te-icrotubes directly in contact with Pt electrode in UD configuration
n PBS. Fig. 3A shows voltammograms recorded on Pt respectivelyn absence (curve a) and in presence of Te-microtubes (curve b)t a sweep rate of 10 mV s−1, between −170 and +450 mV. Whent was electrochemically oxidized between +60 and +450 mV andhen reduced to −170 mV vs. SCE in the reverse scan a character-stic cathodic wave, at Epc = −100 mV, was observed and relatedo O2 reduction (Gu and Chen, 2008). Instead in presence of Te-
icrotubes a well defined anodic wave at Epa = +290 mV is evident,hile in the reverse scan a cathodic wave was observed at −50 mV
+10 mV when obtained using curve difference (c)).In the pH range from 1.93 to 8.36, Te precipitates as TeO2 (Zhu
t al., 2005). Then, according also to XPS data, at pH 7 the observeded–ox processes probably involved Te(0) and TeO2 solid species(1) and (2))
e(solid) + 2H2O
→ TeO2 (solid) + 4H+ + 4e−(Epa = +290 mV in oxidation) (1)
eO2 + 4H+ + 4e−
→ Te(solid) + 2H2O(Epc = +10 mV in reduction) (2)
microtubes (curve b) in not de-aerated PBS drop solution (pH 7.0, I = 0.2). Potentialrange between −200 and +450 mV vs. SCE. Curve c is related to CV difference. (B) CVcurve differences obtained at different scan rates between 1 and 850 mV s−1. Inset1: plot of cathodic and anodic peak currents against scan rate.
with a formal potential, Esurf = +150 mV, taken by averaging Epa andEpc. The red–ox potential of Te(s)/TeO2 hydrate (H2TeO3) reportedfrom Pourbaix, 1963 at pH 7 was −50 mV vs. SCE, whereas the mea-sured open circuit potential (OCP) in our system is +60 mV. Thisvalue is higher than the experimental OCP of +24 mV reported forTe rods scratched in a buffer solution saturated with Te oxide at pH7 (Dutton and Cooper, 1966; Ricketts and Tresselt, 1959). However,also in literature (Dutton and Cooper, 1966; Ricketts and Tresselt,1959) an increase of this value in presence of O2 is reported, as inour experiments.
The charge related to Te oxidation was calculated, by subtract-ing the charge obtained from Pt response in oxidation, from the
total anodic charge obtained on Pt in presence of Te-microtubes.The result was 987 �C cm−2(� (Te)* = 317 ng cm−2) that is nomi-nally equivalent to almost two electroactive Te monolayers on Ptif the electrochemical process involves four electrons (Santos andMachado, 2005).

3566 M.R. Guascito et al. / Biosensors and Bio
Fig. 4. Cyclic voltammograms recorded on Pt (curve a) and Pt/Te-microtubes modi-fied electrode (curve b) in PBS solution (pH 7.0, I = 0.2). Potential range starting fromOI+m
p8If(idaoai(
E
wu
3
i5−fiEir(Tmp+(firrpdtesw
CP to −200 mV (direct scan) and from −200 to +800 mV (reverse scan), first cycle.nset: potential range starting from OCP to −530 mV (direct scan) and from −530 to800 mV (reverse scan) in steady state conditions: Pt (curve a′) and Pt/Te-microtubesodified electrode (curve b′).
To determine the dynamic characteristics of the electrodicrocesses, CVs were recorded at scan rates (v) between 1 and50 mV s−1, on bare Pt before and after Te-microtubes addiction.ncreasing the scan rate, red–ox peak currents ipa and ipc obtainedrom CVs differences (Fig. 3B), show a linear dependence on vFig. 3B, inset 1), indicating a surface controlled electrode processnvolving surface confined species. Both Epa and Epc are indepen-ent from scan rate between 5 and 25 mV s−1, and �Ep is 320 mVs reported for a totally irreversible process (Laviron, 1979). More-ver, between 50 and 850 mV s−1, Epa showed a positive shift andlinear dependence with log(v) (Eq. (3)) while in reduction Epc
s almost a constant. This is reported when ˛ is very close to 1˛ = 0.89) (Laviron, 1979).
pa − Esurf = 0.0512 log(v) + 0.206 (3)
here Esurf = +155 mV is the average between Epa and Epc both eval-ated at 1 mV s−1.
.3. Electrochemical characterization of Pt/Te-microtubes
Fig. 4(curve b) shows a typical CV obtained on the Pt mod-fied electrode after Te-microtubes adsorption (Section 2.4), at0 mV s−1 scan rate, between measured OCP (+290 mV) until200 mV (cathodic end) and +800 mV (anodic end). In therst cycle a peaks pair attributed to Te(IV)/Te(0) (Epc = −50 mV,pa = +380 mV) with Esurf = +210 mV was present. The chargenvolved in oxidation peak at +380 mV (in steady state) cor-ected from the Pt contribution (curve a) was almost 140 �C cm−2
� (Te)* = 45 ng cm−2), apparently the 30% of one electroactive
e-monolayer on Pt (Santos and Machado, 2005). Adsorbed Te-icrotubes inhibit the adsorption/desorption hydrogen atoms
rocess, as observed in the potential region between −640 and230 mV (inset of Fig. 4) on Pt (curves a′) and Pt/Te-microtubescurve b′). Deactivated site fraction is almost 30%. This value, con-rmed also by XPS data, was obtained as a difference between theelated charge evaluated in absence and presence of Te-microtubes,espectively. Measured OCP (+290 mV vs. SCE) shifted to positiveotential respect to UD configuration, confirming that it was more
ifficult to oxidize Te-microtubes directly adsorbed on Pt and thathe electrochemical behaviour of the electrode is due to a synergicffect of both species. In successive voltammetric cycles (at least theecond) it was recorded an increment of the peak area in reductionith a positive shift of +30 mV, that is related to Pt oxide reduc-electronics 26 (2011) 3562–3569
tion (Santos and Machado, 2005) formed in oxidation scan (see alsoFig. 4 curves b and b′ as control). After, CVs tend to overlap and inalmost 10 cycles a steady-state current is observed.
To determine the dynamic characteristics of the electrodicprocesses, cyclic voltammograms (first cycle) were recorded atdifferent scan rates between 1 and 300 mV s−1, in the potentialrange starting from OCP to −200 mV (in direct scan) and from−200 to +800 mV (in reverse scan). On increasing the scan rate,red–ox peak currents show a linear dependence on v between 20and 300 mV s−1, indicating a surface controlled electrode process(Fig. S1, supporting file).
Epa = +380 mV is independent of log(v) in the scan range between5 and 50 mV s−1, moreover no data can be extrapolated at scan rateover 50 mV s−1 because the peaks are not well resolved. On thecontrary, Epc showed a negative shift as a linear function of log v,between 5 and 100 mV s−1 (Fig.S2, supporting file), as expected fora totally irreversible process. This confirms that Pt/Te-microtubeselectrode is kinetically different from Pt and Te-microtubes, asreported in UD configuration, probably because it was very diffi-cult to discriminate between Pt and Te-microtubes electrochemicalproperties.
3.4. Electrochemical response to H2O2 on Pt/Te-microtubes
A study performed to evaluate Pt and Pt/Te-microtubesresponses to the H2O2 has been carried out in N2 saturated atmo-sphere (scan rate 50 mV s−1). Fig. S3 (supporting file) shows theresponses after H2O2 addition of respectively 200 �M and 2.7 mM,on Pt (curves b and c) and Pt/Te-microtubes (curves b′ and c′). Asexpected, relevant processes are present also on Pt both in oxida-tion and in reduction. The increment of oxidation current observedon Pt is attributed to H2O2 oxidation platinum catalyzed (Hall et al.,1998). The corresponding cathodic current increment observedin reduction is related to the reduction of Pt-oxide species andto a process of oxygen reduction generated in oxidation (Gu andChen, 2008). Moreover, the electrochemical response on Pt/Te-microtubes shows an increment both in oxidation and reductionwith respect to bare Pt. To tentatively explain involved processes, astudy of H2O2 substrate concentration was performed. Fig. S4 (sup-porting file) shows the response of Pt/Te microtubes electrode toadditions of H2O2 (concentration range from 0.25 to 1.5 mM).
The catalytic currents ipc in reduction and ipa in oxidation,obtained after subtracting the relative baselines recorded in PBS,were found to increase linearly (inset of Fig. S4) increasing H2O2concentration up to 1.5 mM, with a determination coefficient of0.998 and 0.996, respectively, deduced by the linear regressionanalysis carried out with the following Eqs. (4) in reduction and(5) in oxidation:
ipc (�A) = −0.890(�A) − 8.354(�A mM−1)c(mM) (4)
ipa (�A) = −0.328(�A) + 7.819(�A mM−1)c(mM) (5)
where c is H2O2 bulk concentration. In order to confirm that theelectrochemical reduction of H2O2 is diffusion controlled, it hasbeen estimated the effect of scan rate, between 5 and 450 mV s−1,on the CV responses. Consistently, at H2O2 concentration of 1.5 mMipc was found to increase linearly with the square root of scan rate(Fig. S5, supporting file), with a determination coefficient of 0.987deduced by regression analysis with the following equation:
ipc (�A) = −2.88(�A) − 41.769[�A/(mV s−1)1/2
]v1/2(mV s−1)1/2
(6)
On the contrary, in oxidation all of the catalytic curves tendto a limit value of current (ipa = 2.6 �A) independent of scan rate,according to a system in which the charge transfer reaction is

d Bioelectronics 26 (2011) 3562–3569 3567
datrb
P
P
tPst
Httoaa1
3
odtocdewtpmb
wairrii(Hebwtdcc5tacicwwr
r
0.01
0.1
1
10
100
1000
1001010.10.010.001
Current/μA
Current/μA
-180
-160
-140
-120
-100
-80
-60
-40
-20
0
500045004000350030002500200015001000500
A
B
0
Time/s
-1.2
-1
-0.8
-0.6
-0.4
-0.2
0
13001100900700500300100-100
1.7 μM
3.7 μM
7.3 μM
15 μM
C/mM
M.R. Guascito et al. / Biosensors an
escribed by a catalytic process (Bard and Faulkner, 2001), as in (7)nd (8). Accordingly, the anodic ia–E curves is an S-shaped wavehat becomes independent of sweep rate as expected if the rate ofemoval of Pt/Te(0) by the electrolysis (7) is exactly compensatedy the rate of production of Pt/Te(0) by a chemical process (8).
t/Te + 2H2O � Pt/TeO2 + 4H+ + 4e− (7)
t/TeO2 + 2H2O2 → Pt/Te + 2H2O + 2O2 (8)
These processes involve also Pt sites because the oxidation ofhe Te-microtubes occurred simultaneously with the formation oft oxide, that is responsible for H2O2 chemical oxidation in theame potential range at neutral pH (Hall et al., 1998 and referencesherein).
Moreover most probably the electrocatalytic mechanism of2O2 oxidation and reduction at Pt/Te-microtubes electrodes, in
he present conditions, involves both Te/Te(IV) and Pt/Pt(II) elec-roactives red–ox pairs in a more complex mechanism. As matterf fact both species could be responsible for the electrochemicalnd/or the catalytic dissociation of H2O2 (Awad, 1968; Gerischernd Gerischer, 1956; Hall et al., 1998 and references therein; Weiss,935).
.5. H2O2 detection at Pt/Te-microtubes in batch analysis
Pt electrodes are widely used for the electrochemical detectionf H2O2. However, the baseline current of the electrode graduallyecreases with constant potential measurement because the elec-rode surface is gradually deactivated, mainly as a result of surfacexide formation (Karam and Halaoui, 2008; You et al., 2003). On theontrary, measurements obtained on Pt/Te-microtubes in potentio-ynamic conditions, between −500 and 500 mV vs. SCE, show anxcellent electrocatalytic activity for H2O2 (1.5 mM) in comparisonith Pt (data not shown). The modified electrode does not seem
o suffer of doping effect reported on Pt. The effect of the appliedotential was studied and −150 mV vs. SCE, was selected as opti-al value for chrono-amperometric experiments, as a compromise
etween the highest current output and the stability of the signal.Fig. 5 shows a typical response of Pt/Te-microtubes electrodes
hen H2O2 was dropped in PBS (final concentration 30 mM) atpplied potential of −150 mV vs. SCE. The amperometric signals stable after H2O2 addition, presenting a very short transientesponse time of 5 s. Fig. 5B shows the calibration graph. The cur-ent response is obtained on three independently built electrodes,n three replicates for each electrode. The linear calibration ranges extended over four orders of magnitude of H2O2 concentration1.7 �M–25 mM), which was wider than that reported for other2O2 sensors (i.e. based on Se/Pt nanocomposite materials by Lit al., 2010 and reference therein) and biosensors (i.e. based on car-onized hemoglobin nanofibers reported by Ding et al., 2010). STDas in average 1.65 �A. At higher H2O2 concentration, the reduc-
ion current level off and follows saturation behaviour, probablyue to the saturation of the active sites on the surface. The signifi-ant deviations from the linearity are observed only at 30 mM H2O2ontent. The slope of the linear calibration range between 1.7 and00 �M is 0.295 mA mM−1 cm−2. The limit of detection experimen-ally measured was 1.7 �M based on S/N = 3 on the same electrodes average value on a minimum of three successive measurementsorresponding to the same H2O2 concentration variations. Thentra-assay precision of the H2O2 sensor was measured by suc-essively measuring two different H2O2 concentrations four times
ith the same sensor. The coefficients of variation of the responsesere 7.2% and 7.5% for substrate concentrations of 0.25 and 1.0 mM,espectively.Sensor selectivity was evaluated by monitoring amperomet-
ic response after consecutive injection of 1 mM H2O2 and 1 mM
Fig. 5. (A) Amperometric response of Pt/Te-microtubes modified electrode in astirred PBS (pH 7.0, I = 0.2) after successive H2O2 additions. Applied potential:−150 mV vs. SCE. (B) Calibration plot of catalytic current |i| vs. H2O2 concentrations.
the interfering species (glucose, uric acid, ascorbic acid, tyrosine,dopamine; see Supporting information, Fig. S6). It was evident thatthe sensor does not exhibit a significant response to any of thetested interferences and that the influence of interfering specieson response to H2O2 was negligible, indicating a high selectivity ofthe proposed sensor.
3.6. H2O2 detection at Pt/Te-microtubes in FIA analysis
Critical parameters for the amperometric response in FIA anal-ysis are the operating potential and the flow rate. Hydrodynamicvoltammograms constructed by measuring peak current at differ-ent applied potentials between +500 and −500 mV, after injectionof three aliquots of 10 �M H2O2 solution, at 0.5, 1.0 e 2.0 mL min−1,show that the currents are substantially independent on the car-rier flow rate. Thus, it can be concluded that the electrode responseis highly kinetically controlled and the electron transfer is therate-limiting step (Haghighi and Nikzad, 2009). The potential at−200 mV vs. SCE was selected as the potential value to be appliedfor the amperometric detection of H2O2 at the Pt/Te-microtubesSPE modified electrode, whit a flow rate of 1.0 mL min−1, takinginto account the compromise between the precision and shorteranalysis time.
Fig. 6 shows typical FIA responses of Pt/Te-microtubes to differ-ent concentrations of H2O2 between 1 nM and 30 mM. The relevantcalibration plot (inset) evidences two linear ranges, a behaviour
also reported on Prussian blue modified carbon ionic liquid elec-trode (Haghighi and Nikzad, 2009). The STD estimated for threereplicates on three independently made electrodes was in aver-age 0.3 �A. The slope of the first linear calibration range (between0.5 and 10 �M) is 2 A M−1 cm−2. Under these conditions, the sam-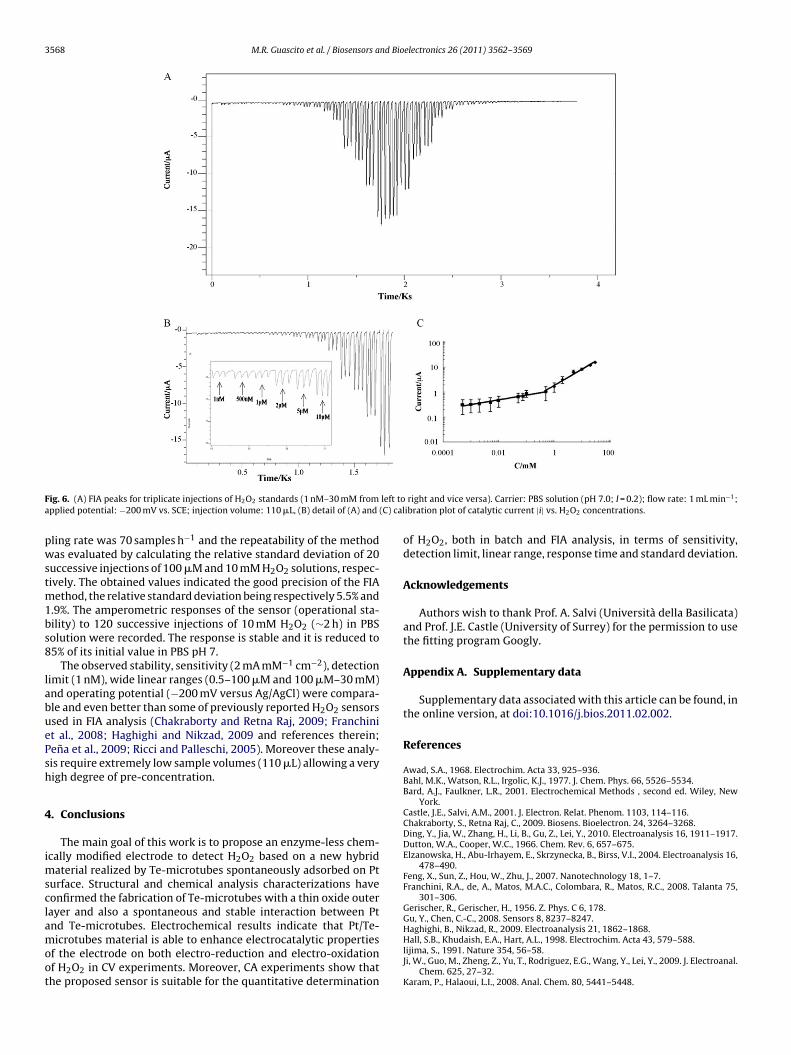
3568 M.R. Guascito et al. / Biosensors and Bioelectronics 26 (2011) 3562–3569
F left toa (C) cal
pwstm1bs8
labuePsh
4
imsclamoot
ig. 6. (A) FIA peaks for triplicate injections of H2O2 standards (1 nM–30 mM frompplied potential: −200 mV vs. SCE; injection volume: 110 �L, (B) detail of (A) and
ling rate was 70 samples h−1 and the repeatability of the methodas evaluated by calculating the relative standard deviation of 20
uccessive injections of 100 �M and 10 mM H2O2 solutions, respec-ively. The obtained values indicated the good precision of the FIA
ethod, the relative standard deviation being respectively 5.5% and.9%. The amperometric responses of the sensor (operational sta-ility) to 120 successive injections of 10 mM H2O2 (∼2 h) in PBSolution were recorded. The response is stable and it is reduced to5% of its initial value in PBS pH 7.
The observed stability, sensitivity (2 mA mM−1 cm−2), detectionimit (1 nM), wide linear ranges (0.5–100 �M and 100 �M–30 mM)nd operating potential (−200 mV versus Ag/AgCl) were compara-le and even better than some of previously reported H2O2 sensorssed in FIA analysis (Chakraborty and Retna Raj, 2009; Franchinit al., 2008; Haghighi and Nikzad, 2009 and references therein;ena et al., 2009; Ricci and Palleschi, 2005). Moreover these analy-is require extremely low sample volumes (110 �L) allowing a veryigh degree of pre-concentration.
. Conclusions
The main goal of this work is to propose an enzyme-less chem-cally modified electrode to detect H2O2 based on a new hybrid
aterial realized by Te-microtubes spontaneously adsorbed on Pturface. Structural and chemical analysis characterizations haveonfirmed the fabrication of Te-microtubes with a thin oxide outerayer and also a spontaneous and stable interaction between Pt
nd Te-microtubes. Electrochemical results indicate that Pt/Te-icrotubes material is able to enhance electrocatalytic propertiesf the electrode on both electro-reduction and electro-oxidationf H2O2 in CV experiments. Moreover, CA experiments show thathe proposed sensor is suitable for the quantitative determination
right and vice versa). Carrier: PBS solution (pH 7.0; I = 0.2); flow rate: 1 mL min−1;ibration plot of catalytic current |i| vs. H2O2 concentrations.
of H2O2, both in batch and FIA analysis, in terms of sensitivity,detection limit, linear range, response time and standard deviation.
Acknowledgements
Authors wish to thank Prof. A. Salvi (Università della Basilicata)and Prof. J.E. Castle (University of Surrey) for the permission to usethe fitting program Googly.
Appendix A. Supplementary data
Supplementary data associated with this article can be found, inthe online version, at doi:10.1016/j.bios.2011.02.002.
References
Awad, S.A., 1968. Electrochim. Acta 33, 925–936.Bahl, M.K., Watson, R.L., Irgolic, K.J., 1977. J. Chem. Phys. 66, 5526–5534.Bard, A.J., Faulkner, L.R., 2001. Electrochemical Methods , second ed. Wiley, New
York.Castle, J.E., Salvi, A.M., 2001. J. Electron. Relat. Phenom. 1103, 114–116.Chakraborty, S., Retna Raj, C., 2009. Biosens. Bioelectron. 24, 3264–3268.Ding, Y., Jia, W., Zhang, H., Li, B., Gu, Z., Lei, Y., 2010. Electroanalysis 16, 1911–1917.Dutton, W.A., Cooper, W.C., 1966. Chem. Rev. 6, 657–675.Elzanowska, H., Abu-Irhayem, E., Skrzynecka, B., Birss, V.I., 2004. Electroanalysis 16,
478–490.Feng, X., Sun, Z., Hou, W., Zhu, J., 2007. Nanotechnology 18, 1–7.Franchini, R.A., de, A., Matos, M.A.C., Colombara, R., Matos, R.C., 2008. Talanta 75,
301–306.Gerischer, R., Gerischer, H., 1956. Z. Phys. C 6, 178.Gu, Y., Chen, C.-C., 2008. Sensors 8, 8237–8247.
Haghighi, B., Nikzad, R., 2009. Electroanalysis 21, 1862–1868.Hall, S.B., Khudaish, E.A., Hart, A.L., 1998. Electrochim. Acta 43, 579–588.Iijima, S., 1991. Nature 354, 56–58.Ji, W., Guo, M., Zheng, Z., Yu, T., Rodriguez, E.G., Wang, Y., Lei, Y., 2009. J. Electroanal.Chem. 625, 27–32.Karam, P., Halaoui, L.I., 2008. Anal. Chem. 80, 5441–5448.

d Bio
LLL
LLPP
P
RRR
You, T., Niwa, O., Tomita, M., Hirono, S., 2003. Anal. Chem. 75, 2080–2085.Zhang, L., Li, H., Ni, Y., Li, J., Liao, K., Zhao, G., 2009. Electrochem. Commun. 11,
M.R. Guascito et al. / Biosensors an
aviron, E., 1979. J. Electroanal. Chem. 101, 19–28.ee, H.J., Nam, S.R., Hong, J., 2009. Chem. Asian. J. 4, 226–235.i, Y., Zhang, J.-J., Xuan, J., Jiang, L.-P., Zhu, J.-J., 2010. Electrochem. Commun. 12,
777–780.i, X., Zhu, Q., Tong, S., Wang, W., 2009. Sens. Actuators B-Chem. 136, 444–450.osito, I., 1997. PhD Thesis, 40. Bari.ark, J., Kim, H.K., Son, Y., 2008. Sens. Actuators B-Chem. 133, 244–250.ena, R.C., Gamboa, J.C.M., Paixão, T.R.L.C., Bertotti, M., 2009. Microchim. Acta 166,
277–281.
ourbaix M., 1963. Atlas d’Equilibres Electrochimiques à 25 ◦C ed. Gauthier-Villarset Cie, Paris.icci, F., Palleschi, G., 2005. Biosens. Bioelectron. 21, 389–407.icketts, J.A., Tresselt, L.W., 1959. J. Amer. Chem. Soc. 81, 2305–2307.itchie, C., Cooper, G.J.T., Song, Y., Streb, C., Yin, H., Parenty, A.D.C., MacLaren, D.A.,
Cronin, L., 2009. Nat. Chem. 1, 47–52.
electronics 26 (2011) 3562–3569 3569
Santos, M.C., Machado, S.A.S., 2005. Electrochim. Acta 50, 2289–2295.Siciliano, T., Filippo, E., Genga, A., Micocci, G., Siciliano, M., Tepore, A., 2009. Sens.
Actuators B-Chem. 142, 185–190.Viswanath, B., Kundu, P., Halder, A., Ravishankar, N., 2009. J. Phys. Chem. C 113,
16866–16883.Weiss, J., 1935. Trans. Faraday Soc. 31, 1547–1557.Yogeswaran, U., Chen, S.-M., 2008. Sensors 8, 290–313.
812–815.Zhou, W.P., Kibler, L.A., Kolb, D.M., 2002. Electrochim. Acta 47, 4501–4510.Zhu, W., Yang, J.Y., Gao, X.H., Hou, J., Bao, S.Q., Fan, X.A., 2005. Electrochim. Acta 50,
5465–5472.
Copyright © 2022 FDOKUMEN