Nanocatalysis in Ionic Liquids Syntheses, Characterisation ...
DaltonTransactions
Dynamic Article Links
Cite this: Dalton Trans., 2012, 41, 6263
www.rsc.org/dalton PAPER
Low density ionogels obtained by rapid gellification of tetraethyl orthosilaneassisted by ionic liquids
Abhishek Kumar Gupta, Manish Pratap Singh, Rajendra Kumar Singh* and Suresh Chandra
Received 13th February 2012, Accepted 7th March 2012DOI: 10.1039/c2dt30318c
A non-hydrolytic one pot sol–gel method has been used to synthesize mesoporous silica ionogels with theconfined ionic liquid (IL) 1-ethyl 3-methyl imidazolium tetra fluoro-borate [EMIM][BF4]. The precursorfor obtaining the SiO2 matrix was tetraethyl orthosilicate (TEOS) and formic acid was used as a catalyst.These ionogels have been characterized by density measurements, TEM, BET, DSC, TGA and FTIR. Theincorporation of the ionic liquid [EMIM][BF4] enhances the gellification rate which results in the ionogelshaving very low density (∼0.3 g cm−3). The low density has been explained on the basis of the creationof ‘blind embedded pores’ in the matrix (apart from open pores) due to very rapid gellification (∼1 min).Morphological studies provide experimental evidence for the presence of blind pores/voids inside theionogel ingots. We have also shown that the IL entrapped in nanopores (∼7–8 nm pore size) of the SiO2
matrix has different physical properties than the bulk IL viz. (a) the phase transition temperatures (Tg, Tcand Tm) of the IL change upon confinement, (b) the thermal stability reduces upon confinement, and (c)the pore wall interaction with the IL results in changes in the C–H vibrations of the imidazolium ring andalkyl chain (the former increasing) which is also indicated in our DFT-calculation.
Introduction
Ionic liquids (ILs) are salts that melt below 100 °C.1 The ILscontain self dissociated cations and anions. Some common IL-cations are: imidazolium, pyrrolidinium, pyridinium, sulfonium,phosphonium, ammonium etc. and common anions are: chloride[Cl]−, bromide [Br]−, tetra fluoro-borate [BF4]
−, hexafluorophos-phate [PF6]
−, triflate [TFO]−, trifluoro sulphonyl-imide [Tf2N]−,
dicyanamide [N(CN)2]− etc.1 ILs have some interesting proper-
ties like high ionic conductivity, high thermal and electrochemi-cal stability, large electrochemical window, low vapour pressure,non-volatility, wide liquidus range and good capability of dissol-ving various organic/inorganic materials.1 ILs have potentialapplications as solvents, water treatment agents, high perform-ance electrolytes,2,3 catalysts4 and in electrochemical devicessuch as Li-ion batteries,3,5,6 super capacitors, sensors,7,8 fuelcells6,9 and as actuators.10 Apart from these applications, ILswork as a novel medium for various reactions1,11 (such as theDiels–Alder reaction, Heck reaction, Suzuki coupling reactionetc.). Recently, many studies have been reported in which it isshown that the properties of ILs change when confined in thenano-pores of silica, CNTs etc.12–15 The SiO2 matrix has beenstudied most widely. In particular, the phase behavior andthermal stability16 of ILs confined in as grown SiO2-nanopores
and functionalized nanopores have been found to changesignificantly.17
The sol–gel process has been extensively used for the prep-aration of porous silica gel matrices.18 Our earlier work13
showed that the amount of IL in a silica matrix changes the porediameters, pore volume, surface area etc. Thus, one can obtain avariety of IL confined silica gel matrices with average pore dia-meters varying from several angstroms to nanometers.19 ILconfined porous silica gel matrices, referred to as ionogels,20–21
have potential applications as catalysts, electrolytes in lithiumion batteries, luminescent devices (europium(III)-doped ionogelsshowed very intense red photoluminescence with very highmonochromatic purity under ultraviolet irradiation),22 biocata-lysts and biosensors.23
There are two sol–gel routes for the preparation of poroussilica gel matrices, namely hydrolytic and non-hydrolytic.Porous silica gel matrices prepared by either of the abovemethods may result in changes in the average pore size, poresize distribution, porosity, pore volume, surface area etc. depend-ing upon the composition of the starting material, mode of syn-thesis, temperature etc. The earlier studies on ionogels reportedin the literature are on SiO2 matrices obtained both by hydrolyticand non-hydrolytic routes. The latter has the advantage of avoid-ing water (not desirable for systems containing ILs).
The present study is on an ionogel having the IL [EMIM]-[BF4] confined in a SiO2 matrix obtained by the non-hydrolyticroute. The gellification rate was found to be very rapid and theresulting stabilized ingot has, interestingly, aerogel like lowdensity. To explain this, ‘blind pores’ embedded in the silica
Ionic Liquid and Solid State Ionics Laboratory, Department of Physics,Banaras Hindu University, Varanasi- 221005, India. E-mail:[email protected]; [email protected]; Fax:(+91) 542 2368390; Tel: (+91) 542 2307308
This journal is © The Royal Society of Chemistry 2012 Dalton Trans., 2012, 41, 6263–6271 | 6263
Dow
nloa
ded
by B
anar
as H
indu
Uni
vers
ity o
n 17
Jul
y 20
12Pu
blis
hed
on 0
9 M
arch
201
2 on
http
://pu
bs.r
sc.o
rg |
doi:1
0.10
39/C
2DT
3031
8CView Online / Journal Homepage / Table of Contents for this issue

matrix during rapid gellification have been invoked. On storage,the residual solvent entrapped in the blind pores vaporizes andbuilds pressure within the matrix. The vapors try to escape thematrix resulting in its cracking. This leads to a flaky structurewhich transforms the transparent porous silica ingots slowly totranslucent opaque. Further, changes in the thermal andvibrational properties of ILs entrapped (or confined) in the nano-pores of the ionogel are also reported and discussed.
Experimental section
Materials
The IL [EMIM][BF4] (of stated purity >98.9%) and TEOS werepurchased from Sigma-Aldrich. Formic acid (GR grade) waspurchased from Merck, Germany. To protect the IL from humid-ity, it was handled under a dry nitrogen atmosphere. Sampleswere heated and vacuum dried (10−3 torr, 60 °C) for 12 h beforemeasurement.
Synthesis of low density ionogels
IL confined porous silica gels have already been synthesized inour lab using a hydrolytic route.13,15 In the present study, wehave used the non-hydrolytic sol–gel process to synthesize lowdensity ionogels. The different steps involved in the synthesis oflow density ionogels are shown schematically in Fig. 1. Tetra-ethyl ortho-silane (TEOS), formic acid and the IL are mixed in amolar ratio of 1 : 8 : x (x = 0.0, 0.25, 0.35 mol%) in a reaction
vessel at 30 °C and allowed to gellify. The gellification is knownto proceed by the following steps.24
Step 1. CarboxylationSi–OEt + HCOOH = EtOH + SiCOOHSiCOOH + EtOH = SiOH + EtCOOHStep 2. EsterificationHCOOH + EtOH = EtCOOH + H2OStep 3. HydrolysisSiCOOH + H2O = SiOH + HCOOHStep 4. CondensationSiOH + SiCOOH = Si–O–Si + HCOOHThe overall reaction for obtaining a mesoporous silica gel
matrix (in which the IL is entrapped) can be written as20
2HC(O)OH + (C2H5O)4Si → SiO2 + 2C2H5OH + 2HC(O)OC2H5
We have prepared the following gels and ionogels (IGs):#(G1): Porous silica gel matrix (with no IL loading).#(IG2): 0.25 mol% IL loaded in porous silica gel matrix.#(IG3): 0.35 mol% IL loaded in porous silica gel matrix.
Material characterization
The density of the prepared IGs was obtained by dividingthe mass of the samples by the volume of the disc shapedmonolith.
The nitrogen sorption measurements were carried out using aMicromeritics Gemini VII 2390 t. The average pore diameterwas evaluated from the nitrogen desorption branch accordingto the BJH method. The specific surface area of the pores ofthe samples was determined using the BET method. For poreparameter analysis, the IGs were washed with water at 60 °Cfor 6 hours and this procedure was repeated three times forcomplete washing of the IL, then the samples were filtered.The filtered samples were heated in an oven at 60 °C forthree hours. Finally, the samples were degassed at 60 °C for24 hours.
The morphologies of the prepared IGs were determined byTEM (Tecnai 20 G2 instrument at an operating voltage of200 kV).
For the investigation of the phase transition temperatures, aMettler Toledo DSC-1 was used. The requisite amount ofsample was sealed in an aluminum pan before taking a DSCthermogram; the samples were heated to 100 °C. The tempera-ture programme for DSC includes a first heating cycle fromroom temperature to 100 °C at a heating rate of 20 °C min−1
then cooling from 100 °C to −100 °C at −20 °C min−1, followedby an isotherm for half an hour at −100 °C and then the DSCthermogram is recorded from −100 °C to 100 °C at 10 °Cmin−1. DSC measurements were carried out under nitrogenatmosphere.
TGA measurements were carried out using a Mettler ToledoTGA/DSC 1, at a heating rate of 10 °C min−1 in a nitrogenatmosphere at a flow rate of 30 ml min−1.
The FTIR spectra were recorded using a Varian 1000 FTIRScimitar Series. The solid SiO2 : IL composites were crushedand dispersed in KBr and pelletized for recording the spectra ofvarious SiO2 : IL samples. For recording the spectra of the IL(pure), a drop of IL was used to wet the KBr pellet.
Fig. 1 Steps involved in the preparation of ionogels (IGs) by the non-hydrolytic sol–gel route.
6264 | Dalton Trans., 2012, 41, 6263–6271 This journal is © The Royal Society of Chemistry 2012
Dow
nloa
ded
by B
anar
as H
indu
Uni
vers
ity o
n 17
Jul
y 20
12Pu
blis
hed
on 0
9 M
arch
201
2 on
http
://pu
bs.r
sc.o
rg |
doi:1
0.10
39/C
2DT
3031
8C
View Online
Results and discussion
Pore analysis
The average pore diameter, surface area and pore volume weremeasured by the Brunauer, Emmett and Teller (BET) nitrogensorption technique in which the volume of the gas adsorbed/de-sorbed in the pores is measured as a function of relative partialpressure. The resulting sorption-isotherm is used to calculatevarious pore parameters.
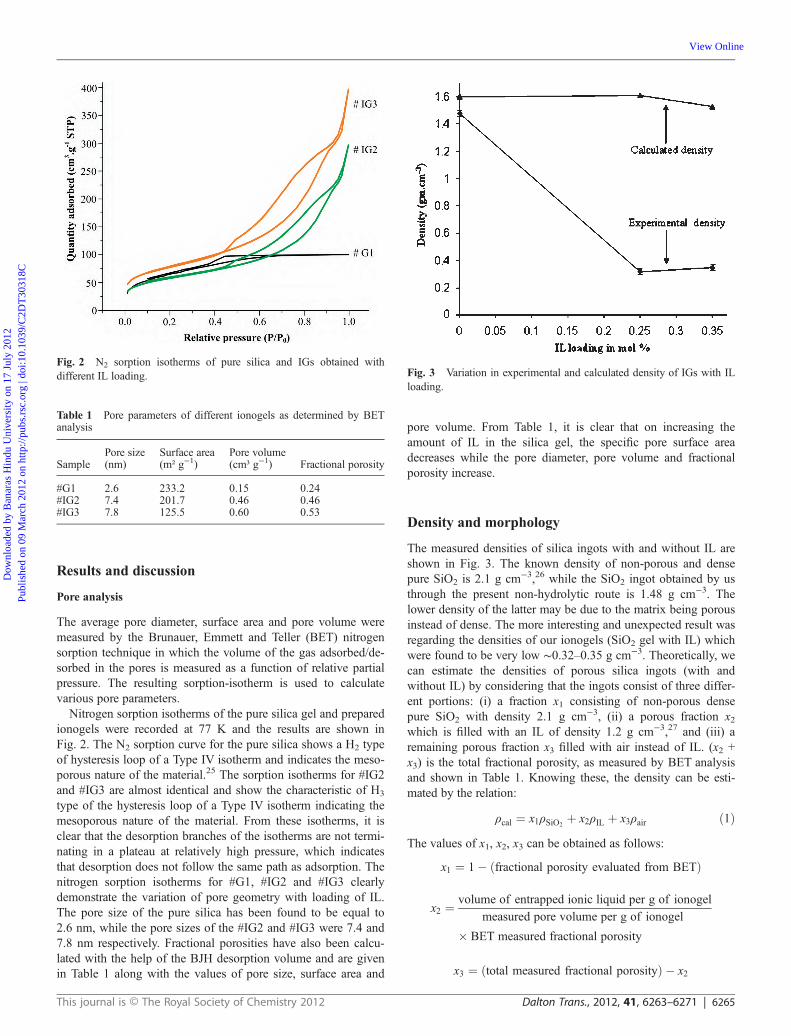
Nitrogen sorption isotherms of the pure silica gel and preparedionogels were recorded at 77 K and the results are shown inFig. 2. The N2 sorption curve for the pure silica shows a H2 typeof hysteresis loop of a Type IV isotherm and indicates the meso-porous nature of the material.25 The sorption isotherms for #IG2and #IG3 are almost identical and show the characteristic of H3
type of the hysteresis loop of a Type IV isotherm indicating themesoporous nature of the material. From these isotherms, it isclear that the desorption branches of the isotherms are not termi-nating in a plateau at relatively high pressure, which indicatesthat desorption does not follow the same path as adsorption. Thenitrogen sorption isotherms for #G1, #IG2 and #IG3 clearlydemonstrate the variation of pore geometry with loading of IL.The pore size of the pure silica has been found to be equal to2.6 nm, while the pore sizes of the #IG2 and #IG3 were 7.4 and7.8 nm respectively. Fractional porosities have also been calcu-lated with the help of the BJH desorption volume and are givenin Table 1 along with the values of pore size, surface area and
pore volume. From Table 1, it is clear that on increasing theamount of IL in the silica gel, the specific pore surface areadecreases while the pore diameter, pore volume and fractionalporosity increase.
Density and morphology
The measured densities of silica ingots with and without IL areshown in Fig. 3. The known density of non-porous and densepure SiO2 is 2.1 g cm−3,26 while the SiO2 ingot obtained by usthrough the present non-hydrolytic route is 1.48 g cm−3. Thelower density of the latter may be due to the matrix being porousinstead of dense. The more interesting and unexpected result wasregarding the densities of our ionogels (SiO2 gel with IL) whichwere found to be very low ∼0.32–0.35 g cm−3. Theoretically, wecan estimate the densities of porous silica ingots (with andwithout IL) by considering that the ingots consist of three differ-ent portions: (i) a fraction x1 consisting of non-porous densepure SiO2 with density 2.1 g cm−3, (ii) a porous fraction x2which is filled with an IL of density 1.2 g cm−3,27 and (iii) aremaining porous fraction x3 filled with air instead of IL. (x2 +x3) is the total fractional porosity, as measured by BET analysisand shown in Table 1. Knowing these, the density can be esti-mated by the relation:
ρcal ¼ x1ρSiO2þ x2ρIL þ x3ρair ð1Þ
The values of x1, x2, x3 can be obtained as follows:
x1 ¼ 1� ðfractional porosity evaluated from BETÞ
x2 ¼ volume of entrapped ionic liquid per g of ionogel
measured pore volume per g of ionogel
� BET measured fractional porosity
x3 ¼ ðtotal measured fractional porosityÞ � x2
Table 1 Pore parameters of different ionogels as determined by BETanalysis
SamplePore size Surface area Pore volume
Fractional porosity(nm) (m² g−1) (cm³ g−1)
#G1 2.6 233.2 0.15 0.24#IG2 7.4 201.7 0.46 0.46#IG3 7.8 125.5 0.60 0.53
Fig. 2 N2 sorption isotherms of pure silica and IGs obtained withdifferent IL loading. Fig. 3 Variation in experimental and calculated density of IGs with IL
loading.
This journal is © The Royal Society of Chemistry 2012 Dalton Trans., 2012, 41, 6263–6271 | 6265
Dow
nloa
ded
by B
anar
as H
indu
Uni
vers
ity o
n 17
Jul
y 20
12Pu
blis
hed
on 0
9 M
arch
201
2 on
http
://pu
bs.r
sc.o
rg |
doi:1
0.10
39/C
2DT
3031
8C
View Online
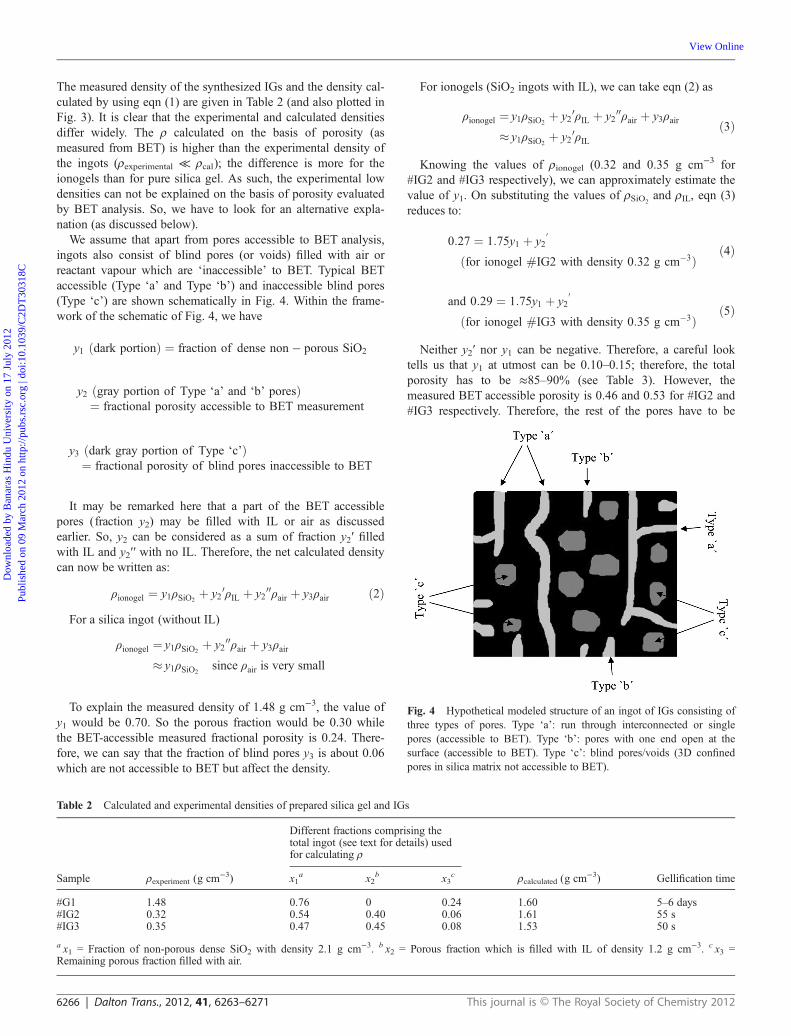
The measured density of the synthesized IGs and the density cal-culated by using eqn (1) are given in Table 2 (and also plotted inFig. 3). It is clear that the experimental and calculated densitiesdiffer widely. The ρ calculated on the basis of porosity (asmeasured from BET) is higher than the experimental density ofthe ingots (ρexperimental ≪ ρcal); the difference is more for theionogels than for pure silica gel. As such, the experimental lowdensities can not be explained on the basis of porosity evaluatedby BET analysis. So, we have to look for an alternative expla-nation (as discussed below).
We assume that apart from pores accessible to BET analysis,ingots also consist of blind pores (or voids) filled with air orreactant vapour which are ‘inaccessible’ to BET. Typical BETaccessible (Type ‘a’ and Type ‘b’) and inaccessible blind pores(Type ‘c’) are shown schematically in Fig. 4. Within the frame-work of the schematic of Fig. 4, we have
y1 ðdark portionÞ ¼ fraction of dense non� porous SiO2
y2 ðgray portion of Type ‘a’ and ‘b’ poresÞ¼ fractional porosity accessible to BET measurement
y3 ðdark gray portion of Type ‘c’Þ¼ fractional porosity of blind pores inaccessible to BET
It may be remarked here that a part of the BET accessiblepores (fraction y2) may be filled with IL or air as discussedearlier. So, y2 can be considered as a sum of fraction y2′ filledwith IL and y2′′ with no IL. Therefore, the net calculated densitycan now be written as:
ρionogel ¼ y1ρSiO2þ y2
0ρIL þ y200ρair þ y3ρair ð2Þ
For a silica ingot (without IL)
ρionogel ¼ y1ρSiO2þ y2
00ρair þ y3ρair
� y1ρSiO2since ρair is very small
To explain the measured density of 1.48 g cm−3, the value ofy1 would be 0.70. So the porous fraction would be 0.30 whilethe BET-accessible measured fractional porosity is 0.24. There-fore, we can say that the fraction of blind pores y3 is about 0.06which are not accessible to BET but affect the density.
For ionogels (SiO2 ingots with IL), we can take eqn (2) as
ρionogel ¼ y1ρSiO2þ y2
0ρIL þ y200ρair þ y3ρair
� y1ρSiO2þ y2
0ρILð3Þ
Knowing the values of ρionogel (0.32 and 0.35 g cm−3 for#IG2 and #IG3 respectively), we can approximately estimate thevalue of y1. On substituting the values of ρSiO2
and ρIL, eqn (3)reduces to:
0:27 ¼ 1:75y1 þ y20
ðfor ionogel #IG2 with density 0:32 g cm�3Þ ð4Þ
and 0:29 ¼ 1:75y1 þ y20
ðfor ionogel #IG3 with density 0:35 g cm�3Þð5Þ
Neither y2′ nor y1 can be negative. Therefore, a careful looktells us that y1 at utmost can be 0.10–0.15; therefore, the totalporosity has to be ≈85–90% (see Table 3). However, themeasured BET accessible porosity is 0.46 and 0.53 for #IG2 and#IG3 respectively. Therefore, the rest of the pores have to be
Table 2 Calculated and experimental densities of prepared silica gel and IGs
Sample ρexperiment (g cm−3)
Different fractions comprising thetotal ingot (see text for details) usedfor calculating ρ
ρcalculated (g cm−3) Gellification timex1a x2
b x3c
#G1 1.48 0.76 0 0.24 1.60 5–6 days#IG2 0.32 0.54 0.40 0.06 1.61 55 s#IG3 0.35 0.47 0.45 0.08 1.53 50 s
a x1 = Fraction of non-porous dense SiO2 with density 2.1 g cm−3. b x2 = Porous fraction which is filled with IL of density 1.2 g cm−3. c x3 =Remaining porous fraction filled with air.
Fig. 4 Hypothetical modeled structure of an ingot of IGs consisting ofthree types of pores. Type ‘a’: run through interconnected or singlepores (accessible to BET). Type ‘b’: pores with one end open at thesurface (accessible to BET). Type ‘c’: blind pores/voids (3D confinedpores in silica matrix not accessible to BET).
6266 | Dalton Trans., 2012, 41, 6263–6271 This journal is © The Royal Society of Chemistry 2012
Dow
nloa
ded
by B
anar
as H
indu
Uni
vers
ity o
n 17
Jul
y 20
12Pu
blis
hed
on 0
9 M
arch
201
2 on
http
://pu
bs.r
sc.o
rg |
doi:1
0.10
39/C
2DT
3031
8C
View Online
blind pores. That is, 35–45% pores are blind pores (y3). In thefollowing paragraphs, we address ourselves to:
(i) The possible reason of creation of blind pores.(ii) Any morphological evidence for the existence of blind
pores.(iii) Implications, other than low density, of the existence of
blind pores.Summarizing the density data as given in Table 2, we con-
clude that the density of the pure silica ingot (without IL) ismuch higher than that of the ionogel ingots (with IL). To explainthis, we have postulated the formation of blind pores as dis-cussed above. The percentage of blind pores so estimated is only6% for pure silica but for IL containing ingots (#IG2 and #IG3)is approximately 35–45% respectively. Obviously, these blindpores must have been incorporated during gellification. An inter-esting observation worth mentioning is the change in the gellifi-cation rate due to the addition of IL. For pure SiO2, thegellification time was 5–6 days in which the growing silicamatrix can relax substantially and the solvent and/or reactantvapours have time to escape. Therefore, a relatively dense ingotwill be obtained. However, with IL containing ingots, the gellifi-cation rate was very fast and almost instantaneous (∼1 min).Because of the fast gellification; air or vaporisable solvent/reac-tants remain entrapped in the matrix as they do not have suffi-cient time to leave the matrix. Such air or vapour filled regionsdeep inside the matrix give rise to blind pores. Further, on longtime storage, the entrapped vaporisable reactants will have a ten-dency to escape out of the voids creating cracks or a flaky struc-ture matrix. We carried out studies to look for evidence of (a)blind pores and (b) flaky structure in samples stored for a longtime (∼2 weeks). These results are described below.
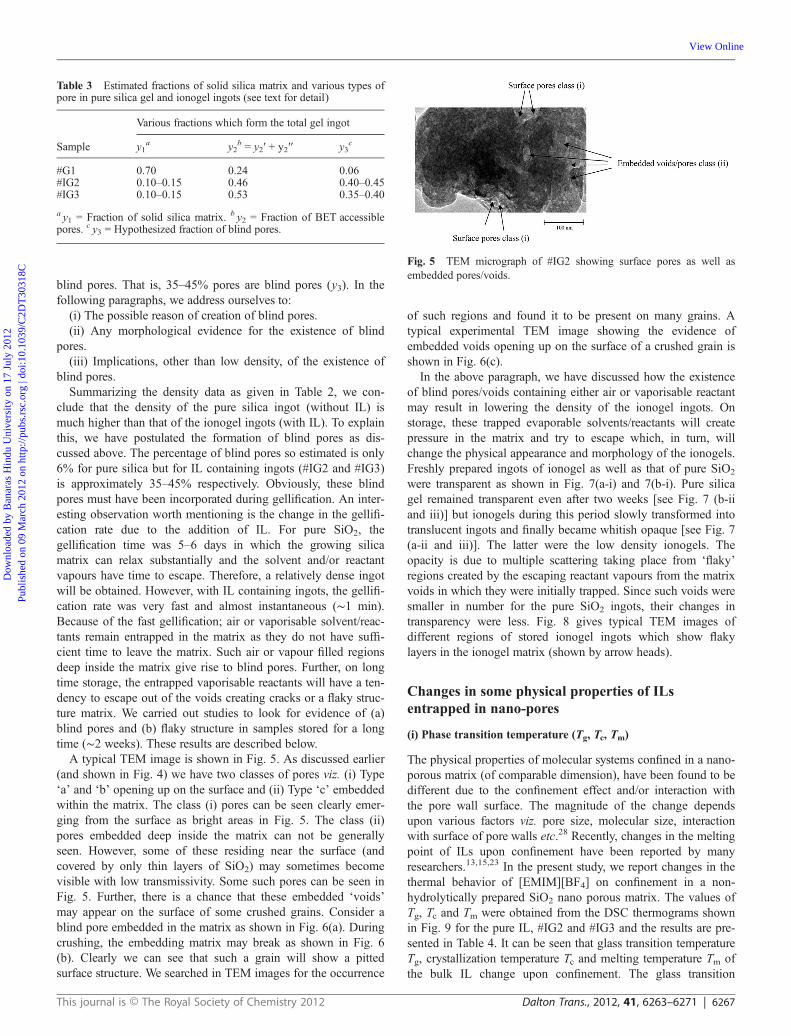
A typical TEM image is shown in Fig. 5. As discussed earlier(and shown in Fig. 4) we have two classes of pores viz. (i) Type‘a’ and ‘b’ opening up on the surface and (ii) Type ‘c’ embeddedwithin the matrix. The class (i) pores can be seen clearly emer-ging from the surface as bright areas in Fig. 5. The class (ii)pores embedded deep inside the matrix can not be generallyseen. However, some of these residing near the surface (andcovered by only thin layers of SiO2) may sometimes becomevisible with low transmissivity. Some such pores can be seen inFig. 5. Further, there is a chance that these embedded ‘voids’may appear on the surface of some crushed grains. Consider ablind pore embedded in the matrix as shown in Fig. 6(a). Duringcrushing, the embedding matrix may break as shown in Fig. 6(b). Clearly we can see that such a grain will show a pittedsurface structure. We searched in TEM images for the occurrence
of such regions and found it to be present on many grains. Atypical experimental TEM image showing the evidence ofembedded voids opening up on the surface of a crushed grain isshown in Fig. 6(c).
In the above paragraph, we have discussed how the existenceof blind pores/voids containing either air or vaporisable reactantmay result in lowering the density of the ionogel ingots. Onstorage, these trapped evaporable solvents/reactants will createpressure in the matrix and try to escape which, in turn, willchange the physical appearance and morphology of the ionogels.Freshly prepared ingots of ionogel as well as that of pure SiO2
were transparent as shown in Fig. 7(a-i) and 7(b-i). Pure silicagel remained transparent even after two weeks [see Fig. 7 (b-iiand iii)] but ionogels during this period slowly transformed intotranslucent ingots and finally became whitish opaque [see Fig. 7(a-ii and iii)]. The latter were the low density ionogels. Theopacity is due to multiple scattering taking place from ‘flaky’regions created by the escaping reactant vapours from the matrixvoids in which they were initially trapped. Since such voids weresmaller in number for the pure SiO2 ingots, their changes intransparency were less. Fig. 8 gives typical TEM images ofdifferent regions of stored ionogel ingots which show flakylayers in the ionogel matrix (shown by arrow heads).
Changes in some physical properties of ILsentrapped in nano-pores
(i) Phase transition temperature (Tg, Tc, Tm)
The physical properties of molecular systems confined in a nano-porous matrix (of comparable dimension), have been found to bedifferent due to the confinement effect and/or interaction withthe pore wall surface. The magnitude of the change dependsupon various factors viz. pore size, molecular size, interactionwith surface of pore walls etc.28 Recently, changes in the meltingpoint of ILs upon confinement have been reported by manyresearchers.13,15,23 In the present study, we report changes in thethermal behavior of [EMIM][BF4] on confinement in a non-hydrolytically prepared SiO2 nano porous matrix. The values ofTg, Tc and Tm were obtained from the DSC thermograms shownin Fig. 9 for the pure IL, #IG2 and #IG3 and the results are pre-sented in Table 4. It can be seen that glass transition temperatureTg, crystallization temperature Tc and melting temperature Tm ofthe bulk IL change upon confinement. The glass transition
Table 3 Estimated fractions of solid silica matrix and various types ofpore in pure silica gel and ionogel ingots (see text for detail)
Sample
Various fractions which form the total gel ingot
y1a y2
b = y2′ + y2′′ y3c
#G1 0.70 0.24 0.06#IG2 0.10–0.15 0.46 0.40–0.45#IG3 0.10–0.15 0.53 0.35–0.40
a y1 = Fraction of solid silica matrix. b y2 = Fraction of BET accessiblepores. c y3 = Hypothesized fraction of blind pores.
Fig. 5 TEM micrograph of #IG2 showing surface pores as well asembedded pores/voids.
This journal is © The Royal Society of Chemistry 2012 Dalton Trans., 2012, 41, 6263–6271 | 6267
Dow
nloa
ded
by B
anar
as H
indu
Uni
vers
ity o
n 17
Jul
y 20
12Pu
blis
hed
on 0
9 M
arch
201
2 on
http
://pu
bs.r
sc.o
rg |
doi:1
0.10
39/C
2DT
3031
8C
View Online

temperature (−94 °C) for the pure IL changes to −91.3 °C and−92 °C respectively for #IG2 and #IG3. The pure IL shows twocrystallization and two melting peaks respectively. The twovalues for Tc (and Tm) have been assigned to (i) the ordered
crystalline structure and (ii) the structure due to anion dis-ordering.29,30 Both values of Tc and Tm for the two types ofsolid phases are found to change on confinement as shown inTable 4.
Fig. 6 (a) Modeled single blind pore in an ingot. (b) Modeled pitted surface structure on a crushed grain of ingot containing blind pores. (c) Exper-imental TEM of some pits similar to those modeled in (b).
Fig. 7 Photographs of (a) ionogel (#IG2) and (b) pure silica gel (#G1) at different time intervals.
6268 | Dalton Trans., 2012, 41, 6263–6271 This journal is © The Royal Society of Chemistry 2012
Dow
nloa
ded
by B
anar
as H
indu
Uni
vers
ity o
n 17
Jul
y 20
12Pu
blis
hed
on 0
9 M
arch
201
2 on
http
://pu
bs.r
sc.o
rg |
doi:1
0.10
39/C
2DT
3031
8C
View Online

(ii) Thermal stability
Thermogravimetric analysis was carried out to understand therole of confinement in the thermal stability of the IL. TGAanalysis of the IL/IGs was carried out at a heating rate of 10 °C
min−1 and the TGA curves are shown in Fig. 10. It is clear fromthe TGA curves that decomposition of the IL starts at the onsettemperature Td ∼ 368 °C. For #IG2 and #IG3 the decompositionstarts respectively at 329 °C and 332 °C from which we can con-clude that confinement decreases the thermal stability of thepresent IL. The decrease in thermal stability has also beenreported earlier for confined [BMIM][PF6] and explained on thebasis of the ‘hinged spring model’,16 the ‘hinging’ arising out ofthe SiO2 surface interaction with the end groups of the confinedIL. The interaction of the IL with the surface has also been seenby us in our system as changes in the vibrational bands. Theseresults are discussed below.
(iii) Vibrational spectroscopy
Simple quantum mechanical calculations predict that confine-ment of an IL is expected to change its vibrational frequencies.We have experimentally observed such a change. Theoreticalstudies were carried out by us adopting the method based onquantum mechanical DFT calculations using Gaussian 03Package31 with basis set B3YLP 631+g (d). Internal co-ordinateswere obtained using the GAUSS VIEW programme32 whichwas used as an input to the main Gaussian programme. The
Fig. 8 TEM micrographs [(a) and (b)] of #IG2 showing the flaky struc-ture of the monolith.
Fig. 9 DSC thermograms of bulk and confined IL.
Table 4 Phase transition temperatures of bulk IL and IL confined innano-porous silica matrices
Phase transition temperature (°C)
Sample
Pure IL #IG2 #IG3
Glass transition (Tg) −94 −91.3 −92Crystallization (Tc) −65.5 −45.7 −49.8
−52.5 −42.1 −45.5Melting (Tm) 13.6 5.5 11.2
−22.2 −0.7 −0.2
Fig. 10 TGA thermograms of bulk and confined IL.
This journal is © The Royal Society of Chemistry 2012 Dalton Trans., 2012, 41, 6263–6271 | 6269
Dow
nloa
ded
by B
anar
as H
indu
Uni
vers
ity o
n 17
Jul
y 20
12Pu
blis
hed
on 0
9 M
arch
201
2 on
http
://pu
bs.r
sc.o
rg |
doi:1
0.10
39/C
2DT
3031
8C
View Online
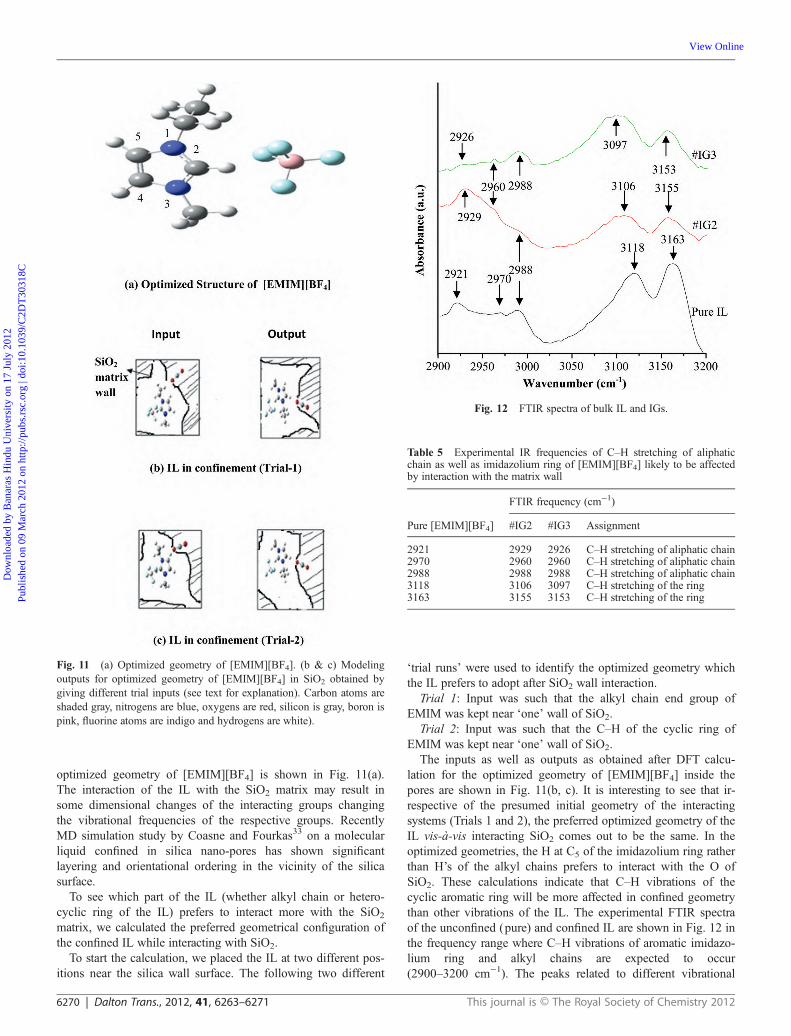
optimized geometry of [EMIM][BF4] is shown in Fig. 11(a).The interaction of the IL with the SiO2 matrix may result insome dimensional changes of the interacting groups changingthe vibrational frequencies of the respective groups. RecentlyMD simulation study by Coasne and Fourkas33 on a molecularliquid confined in silica nano-pores has shown significantlayering and orientational ordering in the vicinity of the silicasurface.
To see which part of the IL (whether alkyl chain or hetero-cyclic ring of the IL) prefers to interact more with the SiO2
matrix, we calculated the preferred geometrical configuration ofthe confined IL while interacting with SiO2.
To start the calculation, we placed the IL at two different pos-itions near the silica wall surface. The following two different
‘trial runs’ were used to identify the optimized geometry whichthe IL prefers to adopt after SiO2 wall interaction.
Trial 1: Input was such that the alkyl chain end group ofEMIM was kept near ‘one’ wall of SiO2.
Trial 2: Input was such that the C–H of the cyclic ring ofEMIM was kept near ‘one’ wall of SiO2.
The inputs as well as outputs as obtained after DFT calcu-lation for the optimized geometry of [EMIM][BF4] inside thepores are shown in Fig. 11(b, c). It is interesting to see that ir-respective of the presumed initial geometry of the interactingsystems (Trials 1 and 2), the preferred optimized geometry of theIL vis-à-vis interacting SiO2 comes out to be the same. In theoptimized geometries, the H at C5 of the imidazolium ring ratherthan H’s of the alkyl chains prefers to interact with the O ofSiO2. These calculations indicate that C–H vibrations of thecyclic aromatic ring will be more affected in confined geometrythan other vibrations of the IL. The experimental FTIR spectraof the unconfined (pure) and confined IL are shown in Fig. 12 inthe frequency range where C–H vibrations of aromatic imidazo-lium ring and alkyl chains are expected to occur(2900–3200 cm−1). The peaks related to different vibrational
Fig. 11 (a) Optimized geometry of [EMIM][BF4]. (b & c) Modelingoutputs for optimized geometry of [EMIM][BF4] in SiO2 obtained bygiving different trial inputs (see text for explanation). Carbon atoms areshaded gray, nitrogens are blue, oxygens are red, silicon is gray, boron ispink, fluorine atoms are indigo and hydrogens are white).
Fig. 12 FTIR spectra of bulk IL and IGs.
Table 5 Experimental IR frequencies of C–H stretching of aliphaticchain as well as imidazolium ring of [EMIM][BF4] likely to be affectedby interaction with the matrix wall
Pure [EMIM][BF4]
FTIR frequency (cm−1)
#IG2 #IG3 Assignment
2921 2929 2926 C–H stretching of aliphatic chain2970 2960 2960 C–H stretching of aliphatic chain2988 2988 2988 C–H stretching of aliphatic chain3118 3106 3097 C–H stretching of the ring3163 3155 3153 C–H stretching of the ring
6270 | Dalton Trans., 2012, 41, 6263–6271 This journal is © The Royal Society of Chemistry 2012
Dow
nloa
ded
by B
anar
as H
indu
Uni
vers
ity o
n 17
Jul
y 20
12Pu
blis
hed
on 0
9 M
arch
201
2 on
http
://pu
bs.r
sc.o
rg |
doi:1
0.10
39/C
2DT
3031
8C
View Online
modes of IL and IGs are given in Table 5. The followingchanges in various C–H vibrations have been observed:
(i) Vibrational bands at 2921 cm−1, 2970 cm−1, and2988 cm−1 assigned to the alkyl chain (methyl and ethyl) C–Hvibrations of the unconfined IL shift to 2929 cm−1, 2960 cm−1,and 2988 cm−1 for #IG2 and 2926, 2960 cm−1, and 2988 cm−1
for #IG3 respectively.(ii) C–H vibrations of the imidazolium cation ring at
3118 cm−1 and 3163 cm−1 shift to 3106 cm−1 and 3155 cm−1
for #IG2 and 3097 cm−1 and 3153 cm−1 for #IG3 in theconfined geometry. This shift is generally higher as expectedfrom the theoretical considerations discussed above.
Conclusion
[EMIM][BF4] confined silica ionogels obtained by a non-hydro-lytic sol–gel process have been found to have very low density(∼0.3 g cm−3). This has been explained on the basis of extre-mely fast gellation (∼1 min) in the presence of the IL. The eva-porable solvents/reactants do not have enough time to escape thematrix resulting in the formation of embedded voids. Some ofthe pores open up on the surface and are accessible to BETanalysis for the measurement of porosity. However, a largenumber of voids become embedded deep in the matrix and areinaccessible to BET analysis. On storage, the evaporable solventsin the embedded voids or the ionogel leave the matrix resultingin the formation of flaky structure inside the prepared ionogels.The presence of blind pores and flaky structures has beenconfirmed by TEM. We have also observed changes in somephysical properties of IL entrapped or confined in the nanoporesviz. (a) the phase transition temperatures Tg, Tc and Tm of the IL,(b) the thermal stability of the confined IL and (c) somevibrational band frequencies, particularly related to C–Hvibration of imidazolium ring of the IL resulting due to its inter-action with the silica matrix pore walls. A quantum mechanicalDFT calculation has been used to show that the hydrogen at C5
of the imidazolium ring prefers to interact more with the surfacewalls.
Acknowledgements
One of us (SC) is grateful to the National Academy of Science,India for the award of position of Platinum Jubilee Senior Scien-tist; RKS is grateful to the BRNS and DST, India for providingfinancial assistance.
References
1 P. Wasserscheid and T. Welton, Ionic Liquids in Synthesis, Wiley-VCHVerlag, GmbH & Co. KGaA, 2007.
2 A. Lewandowski and A. Swiderska-Mocek, J. Power Sources, 2009, 194,601.
3 T. Ruther, T. D. Huynh, J. Huang, A. F. Hollenkamp, E. A. Salter,A. Wierzbicki, K. Mattson, A. Lewis and J. H. Davis Jr., Chem. Mater.,2010, 22, 2172.
4 J. P. Hallett and T. Welton, Chem. Rev., 2011, 111, 3508.5 T. Ruther, T. D. Huynh, J. Huang, A. F. Hollenkamp, E. A. Salter,A. Wierzbicki, K. Mattson, A. Lewis and J. H. Davis Jr., Chem. Mater.,2010, 22, 1039.
6 Electrochemical Aspects of Ionic Liquids, ed. H. Ohno, John Wiley &Sons, Hoboken, NJ, 2005.
7 J. F. Wishart, Energy Environ. Sci., 2009, 2, 956.8 N. V. Shvedene, D. V. Chernyshov and I. V. Pletnev, Russ. J. Gen. Chem.,2008, 78, 12.
9 M. A. B. H. Susan, A. Noda, S. Mitsushima and M. Watanabe, Chem.Commun., 2003, 938.
10 S. A. Forsyth and M. Forsyth, Science, 2002, 297, 983.11 (a) W. Miao and T. H. Chan, Org. Lett., 2003, 5, 26; (b) J. K. Shah and
E. J. Maginn, J. Phys. Chem. B, 2005, 109, 10395.12 S. Chen, G. Wu, M. Sha and S. Huang, J. Am. Chem. Soc., 2007, 129,
2416.13 M. P. Singh, R. K. Singh and S. Chandra, ChemPhysChem, 2010, 11,
2036.14 M. Davenport, A. Rodriguez, K. J. Shea and Z. S. Siwy, Nano Lett.,
2009, 9, 5.15 M. P. Singh, R. K. Singh and S. Chandra, J. Phys. Chem. B, 2011, 115,
7505.16 M. P. Singh, R. K. Singh and S. Chandra, J. Phys. D: Appl. Phys., 2010,
43, 092001.17 R. Gobel, A. Friedrich and A. Taubert, Dalton Trans., 2010, 39, 603.18 H. Kozuka, Handbook of Sol–Gel Science and Technology Processing,
Characterization and Applications Vol. 1, Kluwer Academic Publishers(now Springer), 2005.
19 F. Shi, Q. Zhang, D. Li and Y. Deng, Chem.–Eur. J., 2005, 11, 5279.20 S. Dai, Y. H. Ju, H. J. Gao, J. S. Lin, S. J. Pennycook and C. E. Barnes,
Chem. Commun., 2000, 243.21 N. Kimizuka and T. Nakashima, Langmuir, 2001, 17, 6759.22 (a) K. Lunstroot, K. Driesen, P. Nockemann, C. Goerller-Walrand,
K. Binnemans, S. Bellayer, J. L. Bideau and A. Vioux, Chem. Mater.,2006, 18, 5711; (b) K. Lunstroot, K. Driesen, P. Nockemann, K. VanHecke, L. Van Meervelt, C. Goerller-Walrand, K. Binnemans, S. Bellayer,L. Viau, J. L. Bideau and A. Vioux, Dalton Trans., 2009, 298.
23 J. L. Bideau, L. Viau and A. Vioux, Chem. Soc. Rev., 2011, 40, 907.24 K. G. Sharp, J. Sol-Gel Sci. Technol., 1994, 2, 35.25 K. S. W. Sing, D. H. Everett, R. A. W. Haul, L. Moscou, R. A. Pierotti,
J. Rouquero and T. Siemieniewska, Pure Appl. Chem., 1985, 57, 603.26 R. Gobel, P. Hesemann, J. Weber, E. Moller, A. Friedrich, S. Beuermann
and A. Taubert, Phys. Chem. Chem. Phys., 2009, 11, 3653.27 A. Noda, K. Hayamizu and M. Watanabe, J. Phys. Chem. B, 2001, 105,
4603.28 (a) K. Morishige and K. Kawano, J. Chem. Phys., 1999, 110, 4867;
(b) R. Mu and M. Malhotra, Phys. Rev. B: Condens. Matter, 1991, 44,4296.
29 M. E. V. Valkenburg, R. L. Vaughn, M. Williams and J. S. Wilkes,Fifteenth Symposium on Thermophysical Properties June 22–27, 2003.
30 A. R. Choudhury, N. Winterton, A. Steiner, A. I. Cooper andK. A. Johnson, J. Am. Chem. Soc., 2005, 127, 16792.
31 M. J. Frisch, W. Trucks, H. B. Schlegel, G. E. Scuseria, M. A. Robb,J. R. Cheeseman, V. G. Zakrzewski, J. A. Montgomery Jr.,R. E. Stratmann, J. C. Burant, S. Dapprich, J. M. Millam, A. D. Daniels,K. N. Kudin, M. C. Strain, O. Farkas, J. Tomasi, V. Barone, M. Cossi,R. Cammy, B. Mennucci, C. Pomelli, C. Adamo, S. Clifford,J. Ochterski, G. A. Petersson, P. Y. Ayala, Q. Cui, K. Morokuma,N. Rega, P. Salvodar, J. J. Dannenberg, D. K. Malick, A. D. Rabuck,K. Raghavachari, J. B. Foresman, J. Cioslowski, J. V. Ortiz,A. G. Baboul, B. B. Stefanov, G. Liu, A. Liashenko, P. Piskorz,I. Komaromi, R. Gomperts, R. L. Martin, D. J. Fox, T. Keith, M. A. Al-Laham, C. Y. Peng, A. Nanayakkara, M. Challacombe, P. M. W. Gill,B. Johnson, W. Chen, M. W. Wong, J. L. Andres, C. Gonzalez, M. Head-Gordon, E. S. Replogle and J. A. Pople, Gaussian 03, (Revision A.1).Gaussian Inc., Pittsburgh, PA, 2003.
32 R. Dennington, T. Keith, J. Millam, K. Eppinnett, W. L. Hovell andR. Gilliland, Gauss View 03, Semichem, Inc., Shawnee Mission, KS,2003.
33 B. Coasne and J. T. Fourkas, J. Phys. Chem. C, 2011, 115, 15471.
This journal is © The Royal Society of Chemistry 2012 Dalton Trans., 2012, 41, 6263–6271 | 6271
Dow
nloa
ded
by B
anar
as H
indu
Uni
vers
ity o
n 17
Jul
y 20
12Pu
blis
hed
on 0
9 M
arch
201
2 on
http
://pu
bs.r
sc.o
rg |
doi:1
0.10
39/C
2DT
3031
8C
View Online
Copyright © 2022 FDOKUMEN