Low-Carbon Alcohol Fuels for Decarbonizing the Road ...
58
Page 1/58 Low-Carbon Alcohol Fuels for Decarbonizing the Road Transportation Industry: A Bibliometric Analysis 2000-2021 Chao Jin Tianjin University Jeffrey Dankwa Ampah ( [email protected] ) Tianjin University https://orcid.org/0000-0002-0985-151X Sandylove Afrane Tianjin University Zenghui Yin Automotive Technology and Research Center, China Xin Liu Tianjin University Tianyun Sun Tianjin University Zhenlong Geng Tianjin University Mubasher Ikram Tianjin University Haifeng Liu Tianjin University Research Article Keywords: Methanol, Ethanol, Gasoline, Diesel, Internal combustion engine, Bibliometric analysis Posted Date: April 30th, 2021 DOI: https://doi.org/10.21203/rs.3.rs-409872/v1 License: This work is licensed under a Creative Commons Attribution 4.0 International License. Read Full License Version of Record: A version of this preprint was published at Environmental Science and Pollution Research on August 23rd, 2021. See the published version at https://doi.org/10.1007/s11356-021-15539-
-
Upload
khangminh22 -
Category
Documents
-
view
0 -
download
0
Transcript of Low-Carbon Alcohol Fuels for Decarbonizing the Road ...

Page 1/58
Low-Carbon Alcohol Fuels for Decarbonizing theRoad Transportation Industry: A BibliometricAnalysis 2000-2021Chao Jin
Tianjin UniversityJeffrey Dankwa Ampah ( [email protected] )
Tianjin University https://orcid.org/0000-0002-0985-151XSandylove Afrane
Tianjin UniversityZenghui Yin
Automotive Technology and Research Center, ChinaXin Liu
Tianjin UniversityTianyun Sun
Tianjin UniversityZhenlong Geng
Tianjin UniversityMubasher Ikram
Tianjin UniversityHaifeng Liu
Tianjin University
Research Article
Keywords: Methanol, Ethanol, Gasoline, Diesel, Internal combustion engine, Bibliometric analysis
Posted Date: April 30th, 2021
DOI: https://doi.org/10.21203/rs.3.rs-409872/v1
License: This work is licensed under a Creative Commons Attribution 4.0 International License. Read Full License
Version of Record: A version of this preprint was published at Environmental Science and PollutionResearch on August 23rd, 2021. See the published version at https://doi.org/10.1007/s11356-021-15539-

Page 3/58
AbstractEnvironmental pollution and depletion of resources from the combustion of fossil fuels havenecessitated the need for biofuels in recent years. Oxygenated fuels such as low carbon alcohols havereceived signi�cant attention from the scienti�c community in the last two decades as a strategy todecarbonize the transport sector. However, a documentation of the progress, paradigm, and trend of thisresearch area on a global scale is currently limited. In the current study, the bibliometric analysis isadopted to analyze the global transition of automotive fuels from conventional oils to low carbonalcohols in the 21st century. A dataset of 2250 publications was extracted from the Web of Science Coredatabase and analyzed with CiteSpace, Biblioshiny, and Bibexcel. Interest in methanol and ethanolcombustion research as transportation fuels is increasing, with a 70% estimated growth by the end of thenext decade compared to current levels. China, India, and USA have been the major players in theresearch �eld, with Tianjin University being the most in�uential institution. Research has primarilycentered on the combustion, performance, and emission characteristics of ethanol fuel. Alternative fuelsto compete actively with low carbon fuel in the near foreseeable future are green hydrogen and biodiesel.Advanced combustion technologies and arti�cial intelligence are sure to increase in this research area inthe coming decades.
HighlightsBibliometric analysis on low carbon alcohol combustion in an internal combustion engine.
Web of Science Core Collection database, from 2000 to 2021, was used.
Growing research �eld with an average annual growth rate of 12%.
Critical research hotspots of future studies on alternative fuels for internal combustion engine havebeen identi�ed.
1. IntroductionThe rapid depletion of fossil fuel reserves and its related-environmental pollution has accelerated thesearch for clean alternative fuels worldwide (Chen et al., 2013; Huang et al., 2016). The use of alcohol asalternative renewable fuels for internal combustion engines (ICEs) has been reported to minimize theseproblems (Zhu et al., 2021). An internal combustion engine (ICE) is a heat engine where the combustionof a fuel occurs with an oxidizer (usually air) in a combustion chamber that is an integral part of theworking �uid �ow circuit (Mayank et al., 2016). Low or short-chain carbon alcohols viz methanol andethanol have been identi�ed as two of the most promising oxygenated fuels (Han et al., 2020; Zhu et al.,2021) to decarbonize the transportation sector. They have a wider range of feedstock and relativelysimpler production routes. Compared to traditional oils, i.e., diesel and gasoline, the C1-C2 alcohols haveexcellent fuel properties such as high latent heat of vaporization, lower adiabatic �ame temperature,oxygenated molecule, absence of C-C bonds, high oxygen content, lower viscosity, high H/C ratio, low

Page 4/58
sulfur content, and high evaporative cooling (Kim et al., 2020; Zhu et al., 2021). These collective attributeswork together to reduce post-combustion emissions in neat or blended methanol/ethanol fuels.
Accelerated patronage for alcohol combustion as alternate fuels in ICE was recorded in the middle of the1970s and reached its peak by the middle of 1980 (Solomon et al., 2007). These oxygenated fuels werethought to be attractive due to their production from natural products or waste materials, whereastraditional oils, which are non-renewable resource cannot be manufactured (Canakci et al., 2013; Chen etal., 2005). In addition, these oxygenated fuels could be used without signi�cant modi�cations to theexisting engine structure. Amongst various alcohols, ethanol and methanol are considered the mostsuitable fuels for ICEs. They are characterized by relatively higher �ash point and autoignitiontemperature compared to that of pure diesel and gasoline, making them safer for storage andtransportation. The latent heat of methanol (110 KJ/kg) and ethanol (846 KJ/kg) is relatively higher thandiesel’s (243 KJ/kg) and gasoline’s (180–350 KJ/kg); thus, there is an increase in the volumetrice�ciency for alcohols due to the reduction in the intake manifold’s temperature (Iliev, 2019). Thestoichiometric air-fuel ratio of the short-chain alcohols is relatively smaller than the pure petroleum fuels;hence methanol and ethanol would require a smaller amount of air to complete combustion (Pikonas etal., 2003). Ethanol and methanol have better anti-knock characteristics, and their higher-octane numberenables higher compression ratios of engines, thus increasing thermal e�ciency (Bata et al., 1989;Dasilva et al., 2005).
There are several strategies to apply these low carbon alcohols in internal combustion engines; the threemost common types (Alptekin, 2017; Rakopoulos et al., 2008) are as follows: (1) fumigation into theintake air charge (Abu-Qudais et al., 2000; Surawski et al., 2010). A fumigation system injects a gaseousor liquid fuel into the intake air stream of compression ignited engine. This fuel burns and becomes apart-contributor to the power-producing fuel. NOx and particulate matter reduction increase withincreasing levels of fumigation. However, in general, fumigation fuels increase HC, CO, and NO2
emissions (Cooke et al., 1971; Li et al., 2020; Zhang et al., 2011).
The second strategy is a complete substitution of commercial gasoline or diesel with methanol or ethanolvia port or direct injection. The high-octane number of oxygenated alcohols enables them to be useddirectly in engines with �exible injections such as alcohol single fuel mode (Gong et al., 2019). It hasseveral advantages such as: controlling the amount of alcohol injected in each engine; incompletecombustion at low load and roar combustion at high load could be avoided; simultaneously reduce THC,CO, NOx, and soot emissions effectively; could achieve an ultra-high proportion of alcohol instead oftraditional oil (Li et al., 2019). However, there are certain drawbacks to this type of strategy: direct use ofprimary alcohols in ICEs without assistance is di�cult due to their lower cetane numbers and viscosities(Ning et al., 2020) compared to gasoline and diesel; moreover, this strategy requires signi�cantmodi�cation of engine hardware and injection system to nullify the effect of alcohols’ autoignitionresistance and low lubricity, respectively (Haupt et al., 2004).

Page 5/58
The third strategy is achieved through blending methanol or ethanol in diesel or gasoline. By far, this isthe most common strategy employed by researchers (Kim et al., 2020) since little or no modi�cation isrequired of the engine itself. Signi�cant emission reduction has been achieved when blended fuels ofoxygenated alcohols-diesel/gasoline are used (Labeckas et al., 2014; Tse et al., 2015). However, thesefuel systems are characterized by phase separation limitations. The polarity difference existing betweenthe alcohols and oils prevents the formation of a single-phase uniform mixture between their blends (Jinet al., 2019a; Jin et al., 2019b; Jin et al., 2020). The alcohols are relatively hygroscopic and miscible withwater, thus lowers the upper blending limit with diesel or gasoline (Jin et al., 2019a). All automotive fuelsmust be homogenous to prevent severe consequences such as blockages and pumping di�culties duringstorage and transport (Oasmaa et al., 2015). The situation warrants the use of either an emulsi�er tosuspend small droplets of ethanol within the gasoline/diesel or a co-solvent with the ability to promotemolecular compatibility and bonding to yield a homogenous mixture (Shahir et al., 2014; Wu et al., 2020).In addition, the lower cetane number, calori�c value, and viscosity of low carbon alcohols have also beendescribed as a limitation to its blends with traditional oils (Ileri, 2016). Low cetane number and viscosity(extreme cases) leads to poor ignition (prolonged ignition delay) and atomization, respectively, whichleads to the formation of more incomplete combustion products detrimental to the environment, whereaslower calori�c value increases fuel consumption.
Several researchers have reviewed the growing literature in this �eld of research. To mention a few, Kumaret al. (2013) reviewed the advances made in diesel-alcohol blends and their effects on the performanceand emissions of diesel engines. A similar study was conducted by Prakash et al. (2018) on the recentadvancements in biofuels and bioenergy utilization. Niculescu et al. (2019) also analyzed the literatureconcerning diesel-biodiesel-alcohol blends in compression ignition engines. Finally, Kumar and Chauraria(2019) reviewed the performance and emissions of a compression ignition engine fueled with alcohol-diesel blend. The reviews as mentioned earlier mainly: (1) compared the physicochemical propertiesbetween alcohols and their conventional oil counterparts; (2) report on the progress of alcohol productionfrom different sources; and (3) analyze the effect of alcohol/conventional oil type and blending ratio onperformance, combustion, and emission characteristics. However, these traditional reviews have certainlimitations. Increasing research interest in ethanol/methanol application has resulted in manypublications over the past decade compared to the previous decades. Minimal attempts have been madeto map the global research in this area. More knowledge could be gained by qualitatively andquantitatively analyzing the existing literature and exploring and tracking the evolution of a large numberof published works.
A typical non-traditional review methodology is the bibliometric analysis. It is a set of mathematical andstatistical methods to display up-to-date and on-going knowledge that has been applied in manydisciplines of science and engineering. The tool could be employed to ascertain the research trends bythe publication outputs of countries, characteristics of authors, and research institutes to make an overallresearching perspective of a topic of interest. Also, the distribution of words in the article title, authorkeywords can be used to evaluate research trends of different researching periods or countries. Meyer(2020) employed bibliometric and network analysis to analyze the research trend in the decarbonization

Page 6/58
of road freight transportation. The network and content analysis revealed that decarbonization of roadfreight transportation is approached from three directions; (1) technological innovations such asalternative fuels and electri�cation. (2) operation measures to make use of last-mile solution, routing,consolidation, and vehicle �ll. (3) economic measures such as the in�uence economic activities anddevelopment have on road freight transport, energy e�ciency, and carbon emissions. The research trendand characteristics of carbon emissions from the transport sector was also investigated by Tian et al.(2018) This analysis revealed that within the transportation sector, road transport is the most researchedarea, with electric vehicle being the most common topic. Emissions, speci�cally CO2 was the secondmost frequent topic category. Natural gas and alternative fuels dominated fuel related keywords. Greatinterest was given to vehicle design, carbon capture and storage, and torque control strategy astechnological-related topics. Zhang et al. (2018) used the technique of bibliometric analysis to investigatethe research trend of biodiesel between 1991–2015. Their study revealed that microalgae, Jatrophacurcas, vegetable oil, and waste cooking oil were the most general raw materials for biodiesel productionin that period.
Surprisingly, to the best of the authors’ knowledge, the use of bibliometrics analysis for methanol andethanol in ICEs is very limited (no direct publication exists so far) despite the growing research interest inthis topic. Thus, the current study seeks to use bibliometric analysis to answer at least one of thefollowing research gaps: (1) how long has the landscape of low carbon alcohol utilization in ICEsresearch evolved? (2) how are the scienti�c studies on low carbon alcohol utilization in ICEs distributedamong the core and other scienti�c journals in this research? (3) what are the most relevant publicationson this research topic? (4) what are the most productive and in�uential funding agencies, countries,organizations, and authors that have contributed to the application of low carbon alcohol in ICEs? (5)what are the recent research hotspots in methanol/ethanol combustion for the transport sector? Thecurrent bibliometric review seeks to bridge these research gaps and provide researchers with a betterunderstanding of the development of ethanol and methanol combustion in ICEs as a basis for futureresearch directions.
1.2 Retrospection; Low carbon alcohol combustion in ICEs
1.2.1 Ethanol
A long history of ethanol and gasoline-ethanol blends as automotive fuels exists (Solomon et al., 2007).In the mid-1800s, Samuel Morey developed an engine that ran on ethanol and turpentine. In 1860,German engine inventor, Nicholas Otto, known for his development of a modern internal combustionengine (Otto cycle) used ethanol as fuel for one of his engines (HVA, 2011). By 1862, ethanol's cost hadincreased signi�cantly as a result of its imposed tax of $2 per gallon to help pay for the civil war (Mimi,2008). Around the 1890s, Henry Ford built his �rst automobile, ‘the quadricycle,’ to run on pure ethanol.After 50 years of tax imposition, congress removed the tax to make ethanol more competitive to gasolineas a motor fuel. In 1908, the model T was developed by Henry Ford that could run on pure ethanol,gasoline or a blend of the two. Demand for ethanol grew from 50–60 million gallons per year during the

Page 7/58
world war I (1917-18). By the 1920s, the octane property of ethanol made it as an attractive fuel to reduceengine knocking of gasoline fueled engines. In the 1930s, 6–12% ethanol blended in gasoline were soldover 2,000 gasoline stations in the mid-west. The start of World War II increased demand and productionof ethanol; however, the rise in ethanol’s demand was for non-fuel wartime purposes. After the war,interest in ethanol reduced as leaded gasoline proved easier and cheaper to produce, while the discoveryof new oil reserves reduced the search for alternative fuels (Solomon et al., 2007). In 1975, interest inethanol was revived once more as the US-Environmental Protection Agency instituted regulations tophase out leaded gasoline. The US Energy Tax Act of 1978 introduced the term gasohol, which refers togasoline with at least 10% alcohol content by volume, excluding alcohols produced from petroleum,natural gas, or coal (Mimi, 2008; Solomon et al., 2007). 40 cent per gallon as subsidy was realized forevery gallon of ethanol blended into gasoline after this law came into effect.
Between 1980-1990s, the phasing out of leaded gasoline made methyl tertiary butyl ether (MTBE) themost dominating oxygenated fuel in the gasoline market. After this period, MTBE dominance wascurtailed due to its toxicity, especially in ground drinking water, making ethyl tertiary butyl ether (ETBE)take over throughout the 1990s (Solomon et al., 2007). The Energy Policy Act of 1992 providedregulations for at least 85% ethanol as an alternative transport fuel. By 1997, major US manufacturersbegan mass production of E-85 powered FFV. The Energy Policy Act of 2005 was instituted to ensuregasoline sold in the US contained a minimum volume of renewable energy, mainly ethanol made fromcorn. On April 21, 2009, 55 ethanol-producing companies led by Growth Energy submitted partial waiversto increase the ethanol blend limit from 10 to 15%. Eighteen months later, the EPA approved the partialwaiver request to pass out E15 as automotive fuel (HVA, 2011).
1.2.2 Methanol
Boyd, in the 1920s, raised early concerns that conventional oil would run out, and efforts were to be put inplace to increase engine e�ciency to reduce fuel consumption via improved knock resistance of re�nedfuels (Boyd, 1950). His exact words were, “butyl alcohol (butanol) did not knock in any of the enginesthey had then,” referring to engines available during the 1920s, proving that the attractiveness of alcoholsin engines was apparent early on. In the 1940s, during the Second World War, there was a limited supplyof petroleum fuels, especially in Europe, forcing vehicles to be run on the fumes from wood burners whichcomprised methanol, CO, and hydrogen (Hagen, 1977). Huge discussions on alternate synthetic fuels,especially alcohol, went on due to the imminent shortage of petroleum resources. However, the discoveryof large petroleum resources reduced the search for these alternative fuels until 1974 during the acuteawareness of the oil embargo's fuel shortage (Hagen, 1977). By 1975, several studies on methanol and itsuse in gasoline considered the di�culties and problems, and advantages had been reported. TheAmerican Chemical Society and the Society of Automotive Engineers had held meetings to emphasize theurgent need for alternative fuels, especially methanol (Most and Longwell, 1975). Lawrence LivermoreLabs continued their studies of methanol in engines. The US Energy Research and DevelopmentAdministration and other institutions such as the University of Santa Clara collaborated to characterizethe detailed performance of methanol and gasoline-methanol blends in IC engines. In 1976, the �rst

Page 8/58
international conference on methanol combustion in ICE was held, sponsored by the Swedish MethanolDevelopment Co. (Hagen, 1977).
By the mid-1970s, small vehicle �eet trials were conducted in Germany (Bertau et al., 2014). Larger �eetswere brought on board in the late 1970s and early 1980s by Germany, Sweden, New Zealand, and China.In the same period, Ford and Volkswagen developed the �rst �exible fuel vehicles (FFV) and participatedwith other 100 vehicles in the test program in the 1990s in California. Over 21,000 methanol M85 �exibleFFV fueled with methanol-gasoline blend were used in the US by the mid-1990s (Bromberg and Cheng,2010). The FFV program's interest took a hit as methanol prices increased, whereas gasoline’s diminishedin the mid-to-late − 1990s. Ethanol went on to receive methanol’s attention as the methanol program inCalifornia ended in 2005. However, methanol is highly used in racing vehicles such as Grand Prix cars asof today. Low levels of methanol (M3) in gasoline exist currently in Great Britain. At present, the use ofmethanol is more dominant in the shipping sector (e.g., Stena Line, Methanex vessel). However, atpresent, Chinese road transport is rolling out M15, M30, M85, and M100 for commercial application(Andersson and Salazar, 2015; Zhao, 2019).
Table 1 compares the key fuel properties between the alcohols and conventional oils. The decline ofconventional oil is inevitable unless more reserves are discovered coupled with energy-e�cient systemsand proper policing; this in�nite resource behavior of conventional oils is emphasized in Fig. 1, bolsteringthe increasing need for alternative fuels such as methanol and ethanol.
Table 1
Fuel properties of fuels under review (Agarwal, 2007; Harari et al., 2020; Ickes et al., 2014; Jamrozik et al.,2019; Waluyo et al., 2021).

Page 9/58
Property (unit) Methanol Ethanol Diesel Gasoline
Molecular formula CH3OH C2H5OH C14H30 C7H16
Molecular weight (g/mol) 32.04 46.06 198.40 100.20
Cetane number 3 8 51 -
Research octane number 136 129 15–25 97
Lower heating value (MJ/kg) 19.5 26.9 42.5 42.9
Heat of evaporation (MJ/kg) 1100 840 243 180–350
Auto-ignition temperature (K) 503 698 503 192–470
Stoichiometric air fuel ratio 6.45 9.06 14.60 14.70
Viscosity (40 ℃) 0.65 1.52 4.59 0.67
Carbon content (%) 37.5 52.2 85.0 86.0
Hydrogen content (%) 12.5 13 15 14
Oxygen (%) 50 34.8 0 0
1.3 Review of performance and emission characteristics of methanol and ethanol combustion in ICEs
In this section, the previous results of other researchers on the combustion of methanol and ethanol inboth compression and spark ignition engine is reported as an overview on the performance and emissioncharacteristics of an alcohol-fueled ICE.
1.3.1 Ethanol combustion in a spark-ignition engine
Table 2
Performance and emission characteristics of ethanol in a spark-ignition engine.

Page 10/58
Ethanolblend
Engine type Performance Emission BaselineFuel
Ref.
1. E10W*,E20W*
Naturally-aspirated, portinjection
+Brake power,+torque,+BSFC, +BTE
-CO, -HC,+NOx
Gasoline (Deng etal.,2018)
2. E10,E30, E60
Single cylinder, four strokespark ignition
-BTE, +BSFC +CO, -UHC, -NOx
Gasoline (Li et al.,2017)
3. E100 Low power gasoline engine -BMEP, +BTE,+BSFC
-UHC, -CO, NOx,~CO2
Unleadedgasoline
(Koç etal.,2009)
4. E50,E85
Hydra, overhead cam shaft,with fuel injection
+Brake power,+torque, +BSFC
-CO, -HC,-NOx
Unleadedgasoline
(BalkiandSayin,2014)
5. PE10,PE15,PE20,PE25
Four stroke, single cylinder,spark ignition, multifuel, VCRwith open ECU
+BTE, +BSFC,+brake power
-HC, -CO,+NOx,~CO2
Gasoline (Dhandeet al.,2021)
*hydrous ethanol; +: increase; −: decrease; ~: varies
1.3.2 Methanol combustion in a spark-ignition engine
Table 3
Performance and emission characteristics of methanol in a spark-ignition engine.

Page 11/58
Methanolblend
Engine type Performance Emission BaselineFuel
Ref.
1. M10, M20 Single cylinder fourstroke spark ignition
-BSEC, -EGT,+BSFC, +BTE
-HC, -CO, -NO, -smokeopacity
Gasoline (Agarwalet al.,2014)
2. M10, M20 3-cylinder, port fuelinjection, four stroke
-BTE -CO, = NOx Gasoline (Yanju etal.,2008)
3. M5, M10,M15, M20
Single cylinder, variablecompression four-stroke
+BMEP, BTE - Gasoline (BilginandSezer,2008)
4. Me10,Me15, Me20,Me25
3-cylinder, 4 stroke, sparkignition
+BTE, -brakepower
-CO, -HC Gasoline (Liu etal.,2007)
5. Me10,Me25
Single-cylinder, 4 stroke,spark ignition
-Braketorque, -brake power
-NO, +HC Gasoline (Qi et al.,2005)
+: increase; −: decrease; =: slightly higher or equal
1.3.3 Ethanol combustion in compression ignition engine
Table 4
Performance and emission characteristics of ethanol in compression ignition engine.

Page 12/58
Ethanolblend
Engine type Performance Emission BaselineFuel
Ref.
1. e1, e2,e3, e4, e5
Single cylinder, water-cooled,four-stroke stationary dieselengine
-BTE, -exergye�ciency, -EGT
-NOx, -CO2, -smokeopacity,+HC, +CO
Diesel (Jamuwa etal., 2016)
2. 5%Ethanol,10%Ethanol
Six cylinder, in-line, fourstroke compression ignition,direct injection, water-cooled,turbocharged, after-cooled
+BSFC, =BTE -Sootdensity,=NOx, -CO,+THC
Diesel (Rakopouloset al., 2008)
3. E10,E15, E20,E30
Direct injection,turbocharged
-BSFC +HC, ~CO,~NOx, -smoke
Diesel (Lei et al.,2011)
4. RE10,RE30
6 cylinders, 4 valves, water-cooled, turbocharger wit airintercooler
+BSFC, -BTE,-excess co-e�cient
+NOx, -soot,-CO, +HC
Diesel (Wu et al.,2020)
5. E5,E10, E15
Four-cylinder, 4 strokenaturally aspirated
+BSFC, BTE +CO, -NO,~HC
Diesel (Labeckaset al., 2013)
+: increase; −: decrease; =: slightly higher or equal; ~: varies
1.3.4 Methanol combustion in compression ignition engine
Table 5
Performance and emission characteristics of methanol in compression ignition engine.

Page 13/58
Methanol blend Engine type Performance Emission BaselineFuel
Ref.
1. M5, M10, M15 Direct injection,naturally aspirated,and four stroke
+BSFC,+BSEC, -BTE
-CO, -THC, -smokeopacity,+NOx
Diesel (Sayin etal., 2010)
2. DM10, DM15,DM20, DM25,DM35, DM40
Four strokecompression ignition
-EGT +NOx, ~THC,-CO, ~CO2
Diesel (Jamrozik,2017)
3. Ratio ofmethanol bymass (0–70%)
Direct injection, 4stroke, single-cylinder
-BSFC -NOx, +HC,+CO
Diesel (Song etal., 2008)
4. Methanolmass fraction(0–85%)
Single cylinder directinjection dieselengine
-BSFC -NOx, -smoke, +HC,+CO
Diesel (Liu et al.,2010)
5. Me10, Me20,Me30
Four-cylinder four-stroke
+BTE, -brakepower, -braketorque
- Diesel (Naja�andYusaf,2009)
+: increase; −: decrease; ~: varies
To summarize, ethanol/methanol combustion has its own merits and demerits compared to pure dieseland gasoline. Results may differ from one researcher to another due to differences in test procedures,emission control equipment, engine operating parameters such as load, speed, compression ratio,equivalence ratio, etc.; thus, a more general observation can only be stated. Overall, alcohol-diesel/gasoline blends in a lower alcohol concentration showed improvement in engine torque and brakepower. For higher ratios of alcohol, additives such as cetane improvers could improve the brake torqueand power. Similarly, at high concentrations of alcohol, BSFC increases compared to that of the neat oils;researchers explain that the relatively lower energy content of alcohols may be responsible for theobservation. BTE on average has been reported to increase with an increase in alcohol fraction as aresults of alcohols’ lower viscosity which improves fuel atomization. Generally speaking, HC and COemissions are increased and lowered, respectively for alcohol blends in compression ignition engines.Typically, percentage differences in NOx and HC emissions for alcohol blends and neat conventional oilswere relatively modest. However, for spark-ignition engines, HC, NOx, CO, and CO2 are relatively higher inpure traditional oils than alcohol blends, which could be attributed to alcohols' high oxygen content.
The literature available so far shows excellent fuel characteristics in the combustion of alcohols.However, more effort could be put in place to address the alcohol-oil solubility problem, cetane, and lowerheating value reduction to help realize the maximum characteristics of alcohol fuels.
Page 14/58
2. MethodologyBibliometric analysis is the application of quantitative tools to study science (Pritchard, 1969). Thus,researchers have a powerful technique to investigate larger datasets at their disposal than a traditionalreview while maintaining a high level of rigor, scienti�c soundness, transparency, and replicability (Dada,2018; Rey-Martí et al., 2016). The current study aimed to identify what is known and unknown in fuelcombustion from the start of the present century, focusing on low carbon alcohols, diesel, and gasoline.Hence, a quantitative analysis was conducted, applying performance analysis and science mappingusing three bibliometric software; CiteSpace, RStudio biblioshiny package, and BibExcel. The conceptualdesign of the current study is highlighted in Fig. 2.
CiteSpace is one of the most sought-after bibliometric tools for investigating the evolution of a topic. It isdeveloped to ascertain the structure and distribution, and distribution of scienti�c knowledge in thecontext of scienti�c meteorology, data analysis, and information visualizations, allowing the easy traceand understanding of the research paradigm of the interested literature landscape (Chen, 2006). The5.7.R2 (64 bit) version of CiteSpace with Java was used. Social Network Analysis (SNA) is a quantitativemethod of analyzing and visualizing the relationship among research entities (Mao et al., 2015). In thisstudy, SNA was adopted with CiteSpace’s aid to visualize and analyze the various research entities'academic collaboration. SNA (authors, countries, institutions), co-citation network analysis (citedjournals, local references of documents), and keyword analysis (keywords; title, abstract, authorkeywords, and keyword Plus) were evaluated with CiteSpace to map out the past, current, and futureresearch trend of low carbon alcohol application in ICEs. The parameters in CiteSpace were set at: (1)Time slicing = 2000–2021, years per slice = 1; (2) Node type = author, institution, country, keyword, citedjournal, cited reference; (3) Network selection criteria was based on Top N = 50; (4) link strength andscope = cosine and within slices, respectively; (5) Pruning = path�nder and sliced network.
The bibliometrix package of RStudio is a handy scienti�c mapping tool, especially for non-coders (Ariaand Cuccurullo, 2017). It comprises �ve analysis levels; dataset, authors, document, conceptual,intellectual and social. Each level includes different indicators, statistical measures, and visualrepresentations. Three �eld plots, wordcloud and theme evolution were performed with this software.Persson’s BibExcel was minorly used in the current study; its main function was to identify the co-occurring frequencies of the network between authors, institutions, countries, documents, and keywords.
The Web of Science Core Collection (WoS) with sub-�eld databases including Science Citation IndexExpanded (SCIE), Social Sciences Citation Index (SSCI), Arts & Humanities Citation Index (A&HCI),Conference Proceedings Citation Index—Science (CPCI-S), Conference Proceedings Citation Index-Science (CPCI-S), Emerging Sources Citation Index (ESCI), Current Chemical Reactions (CCR-EXPANDED),Index Chemicus (IC) were selected for the current study. The WoS is a widely accepted database fordifferent scienti�c �elds that employ bibliometric analysis (Chen et al., 2014; van Leeuwen, 2006). It hasover 100 subjects, making the database reliable for providing more consistent and standardized recordsthan other databases such as Scopus (Bettencourt and Kaur, 2011; Hou et al., 2015).

Page 15/58
The search term for applying low carbon alcohol in ICEs, “TOPIC: (Methanol combust* or ethanolcombust* or low* carbon alcohol* combust* or primary alcohol* combust* or short chain alcohol*combust* or 'methyl alcohol* combust*' or 'ethyl alcohol* combust*' or 'c1 alcohol* combust*' or 'c2alcohol* combust*') AND TOPIC: (Internal combust* engine * or 'compress* ignit* engine* or spark ignit*engine* or 'IC engine*' or 'CI engine*' or 'SI engine*') was entered on the database on the 30th January2021 with a timespan of publications within 2000–2021. The inclusion of asterisk (*) at the end of wordsensures that all the words with the same root are included in the search result. “TOPIC” also involves asimultaneous across title, abstract, author keywords, and Keywords Plus. The initial search yielded 2,458publications.
The obtained literature contained publications (< 3%) with titles such as “Fuel processing for low-temperature and high-temperature fuel cells - Challenges, and opportunities for sustainable developmentin the 21st century (Song, 2002)” which may seem unrelated to the aim of the current study. However, acritical look at these papers reveal that they make reference to the improvement of some of thelimitations identi�ed in low carbon alcohol combustion in ICE which could serve as a reference point forfuture direction. Thus, these very less fraction of publications with such ‘unrelated’ titles were allconsidered for the current study. The h-index is a good measure of a research entities’ impact on asubject and has the advantage of being objective (Kinney, 2007). A scientist has index h if h of his/her Npapers have at least h citations each, and the other (N-h) papers have fewer than h citations each (Braunet al., 2006). The impact factor of top-performing journals was obtained from the Journal CitationReports (JCR) 2019 edition. It is a standardized indicator popularly adopted to measure the quality ofjournals, research papers, as well as researchers (Mao et al., 2015). The higher the impact factor, thehigher the quality of the research. Other performance indicators included total local and total globalcitation scores (TLCS and TGCS), number of publications, collaborative index. TLCS refers to citations ofa publication by the publications extracted for current study whereas TGCS refers to citation by anypublication either within or not within the extracted documents. In addition, the attractive and activeindexes of the countries have been employed from previous studies (Chen and Guan, 2011; Shen et al.,2018). The methodology of these two indexes expressed in Eq. 1 and Eq. 2 was adopted from Huang etal. (2020);
Where, represent the activity index and the attractive index of country i in the year t
respectively. and are the number of publications and citations of publications on low carbonalcohol combustion in ICEs of country i in the year t; ΣP and ΣC are the total number of publications andthe sum of citations about the topic under review in country i during a given period. Similarly, TPt and TCt
represent the global number of publications and citations of publications in the year t; ΣTP and ΣTC

Page 16/58
represent the total number of articles and the sum of citations during the same period as that of ΣP andΣC, respectively.
When the value of AI > 1, the productivity of the country is greater than the global average; AI < 1, theproductivity of the country is less than global average; AI = 1, productivity of country is same as globalaverage. The same rule applies to AAI but in this case describes the degree to which studies of a countryattracts other researchers either local or international.
3. Results And DiscussionArticle and proceedings paper types of publications accounted for 84% and 14% of the initial searchresults. The remaining 2% of documents were classi�ed as reviews, letters, meeting abstracts, editorialmaterials, etc. Thus, only articles and proceeding papers were used for the current study as previouslydone by Mao et al. (Mao et al., 2015) because these types of documents provide more original research�ndings and include more information on authors and their a�liations. 99% of the re�ned documentswere published in the English language. The other 1% included publications written in major languagessuch as Czech (0.308%), Polish (0.220%), Turkish (0.176%), etc. Hence, the search results were furtherre�ned to only include publications written in English as it is the most universal and commonly usedacademic language worldwide (Chen et al., 2017). After this further screening, the remaining publicationsextracted for the current study were 2,250. The main information about the obtained documents has beendisplayed in Table 6.
Table 6
Main description of extracted documents.

Page 17/58
Description Results
Main information about data
Timespan 2000:2021
Documents 2250
Journals 429
Average years from publication 5.09
Average citations per documents 19.77
Average citations per year per doc 2.999
References 40834
Document types
Article 1915
Article; proceedings paper 80
Proceedings paper 255
Document contents
Keywords Plus (ID) 2255
Author's Keywords (DE) 3663
Authors/institutions/countries/regions
Authors 4782
Author Appearances 9315
Authors of single-authored documents 83
Authors of multi-authored documents 4699
Authors’ collaboration
Single-authored documents 108
Documents per Author 0.471
Authors per Document 2.13
Co-Authors per Documents 4.14
Collaboration Index 2.19
Institutions 1434
Countries/regions 83
Page 18/58
3.1 Publications’ evolution over time.Figure 3 presents the primary performance of alcohol-combusted-related literature published in the 21stcentury so far. Results show that interest in the subject has grown signi�cantly in the last decadecompared to the previous decade. The publications between 2011 to 2021 were at least eight times thatof 2000 to 2010. The number of citations, however, followed a different trend as that of the number ofpublications. The peak of citations for both local and global was realized in 2016. This observation maybe explained by the fact that the studies during this period have signi�cantly impacted global fuelcombustion research and thus aroused interest from scientists. This explanation is further bolstered bythe peak h-index occurring at the same period. The publications in the slow development period haverelatively the most in�uence on the subject compared to the initial and rapid developmental stages withregards to citations and h-index. Interestingly, at the time of reporting these �ndings, the number ofpublications on the combustion of low carbon alcohol in ICEs for 2021 was 53, which is just twopublications short of those produced from 2000 to 2004 combined. Referring to previous studies (Andreo-Martínez et al., 2020; Zheng et al., 2015), polynomial, linear and exponential regression could beemployed in making future growth estimations of a given dataset. From 2000–2007, 2008–2015, and2016–2020, the publications could be �tted with a 2nd order polynomial function y=-0.0179x2 + 1.8036x + 7.625 (R2 = 0.7899),y = 2.1012x2-30.435x + 144.46(R2 = 0.9903), and y = 0.2143x2 + 16.386x-80.6 (R2 = 0.9996), respectively, where X is the number of years since the start of the period and Y is the number ofpublications accumulated each year. The R2 value of the rapid development period is the closest to 1 andcould be used to fairly estimate the number of publications to be expected in the next seven-year period.By the end of 2021 to 2027, the number of publications on the current subject is expected to increase to358 to 567, respectively, an increase of 7.5–70.3% relative to 2020’s. These �gures signify that morecommunication, interest, and co-operation among researchers is expected by the end of the next decade.
3.2 Distribution of output in journals.
In the current research, there were 2,250 publications across 429 related journals; the top 20 productivejournals as well as the h-index, impact factor, and cited times of journals are listed in Table 7. The twomajor study themes consistent in the top 20 journals were ‘energy’ and ‘environment’. These 20 journalsconstitute approximately 63% of the total number of publications used in the current review. The top 3most publishing journals were Fuel, Energy, and Energy and Fuels. The top three journals' trend doesremain the same except for Energy and Fuels in terms of h-index. Energy and Fuels lost their spot toApplied Energy. This observation could be attributed to the in�uence of the journals in terms of theircitations. Higher number of publications with lower citation reduces the h-index of the journal. Forexample, the total citation of Applied Energy, and Energy was 3,985 and 3,538, respectively, compared totheir 111 and 124 publication records. Simultaneously, the trend is entirely different for impact factor. Thetop three high-quality research journals were Applied Energy, Energy Conversion and Management, andEnvironmental Science and Technology. The dynamics of the top 5 publishing journals in Table 7 with

Page 19/58
respect to time is shown in Fig. 4. For the �rst ten years, the difference in publication output of these �vejournals was less spontaneous. However, by the end of 2020, Fuel’s dominance in the subject areabecame apparent. In addition, Fuel’s productivity has been on the rise since the start of the century, butthat of the other four journals has stabilized within the last four years.
Co-citation of journals is described in Fig. 5. Two journals are cited in the same publication if a lineknown as edge connects the two journals. The bigger the node, the stronger the co-citation of the journal.From Fig. 2, it can be seen that Fuel is the most frequently co-cited journal per the size of its node (1,776co-citations), followed by Energy Conversion and Management (1,310 co-citations), and Applied Energy(1,260 co-citations).
Table 7
Journals’ performance from 2000 to 2021.

Page 20/58
Journal NP TC h-index
Impactfactor
PYstart
1. Fuel 417 9909 51 5.578 2006
2. Energy 124 3538 36 6.082 2000
3. Energy & Fuels 121 2359 28 3.421 2005
4. Applied Energy 111 3985 40 8.848 2009
5. Energy Conversion and Management 110 3726 36 8.208 2000
6. Applied Thermal Engineering 77 2262 27 4.725 2007
7. Renewable Energy 61 2008 25 6.274 2003
8. International Journal of Hydrogen Energy 60 2221 22 4.939 2002
9. Combustion and Flame 45 1281 21 4.570 2006
10. Energies 43 177 9 2.702 2016
11. International Journal of Engine Research 37 300 10 2.382 2007
12. Proceedings of The Institution of MechanicalEngineers Part D-Journal of Automobile Engineering
35 387 10 1.384 2003
13. SAE International Journal of Engines 27 169 7 - 2015
14. Fuel Processing Technology 26 570 13 4.982 2009
15. Proceedings of The Combustion Institute 26 591 14 5.627 2002
16. Environmental Science and Pollution Research 23 308 10 3.056 2017
17. Journal of Engineering for Gas Turbines and Power-Transactions of the ASME
23 454 9 1.804 2003
18. Journal of Energy Resources Technology-Transactionsof the ASME
22 250 10 3.183 2007
19. Thermal Science 19 104 6 1.574 2011
20. Combustion Science and Technology 17 115 6 1.730 2002
NP, TC, PY represents the number of publications, total citations, and publication year, respectively.
3.3 Funding Agencies
The growth of research often greatly depends on support from funding agencies. These agencies play asigni�cant role in pushing forward frontiers of scienti�c research per national, regional, or internationalpolicy on a speci�c agenda. Table 8 displays the top 10 funding agencies driving the studies of

Page 21/58
methanol/ethanol utilization in ICEs. According to Table 8, funding agencies from Asia, Europe, and NorthAmerica are the main contributors to research into the current study's subject in the 21st century. For the�rst quarter of the study period, no research support from these top funding agencies was given to theresearchers, thus explain the low productivity of publications in that period, as seen in Fig. 3. In the lasttwo quarters, these agencies made signi�cant research support to research institutions which shouldexplain the increase in productivity from 2011–2020 of Fig. 3. For funding agencies that have supportedat least ten publications, 1,051 funds have been provided so far, and 70% of these supports are from thetop 10 funding agencies listed in Table 8, signifying their enormous contribution towards cleancombustion. The National Natural Science Foundation of China (NSFC) alone has supported 337publications which far exceeds the second and third funding agencies, namely, United States Departmentof Energy (76) and National Council for Scienti�c and Technological Development (47). This observationimplies that the NSFC is the major player in the global utilization of low carbon alcohol in ICEs researchas far as funding agencies are concerned.
Table 8
Most funding agencies from 2000–2021.
Funding Agencies Country NSP 2000–2005
2006–2010
2011–2015
2016–2021
National Natural Science Foundation ofChina NSFC
China 337 0 10 63 264
United States Department of Energy DOE USA 76 0 2 26 48
National Council for Scienti�c andTechnological Development CNPQ
Brazil 47 0 2 14 31
CAPES Brazil 43 0 0 7 36
Fundamental Research Funds for TheCentral Universities
China 42 0 0 3 39
China Scholarship Council CHINA 41 0 0 8 33
Engineering Physical Sciences ResearchCouncil EPSRC
UK 38 0 2 19 17
UK Research Innovation UKRI UK 37 0 1 18 18
National Science Foundation NSF China 36 0 1 12 23
European Commission - 33 0 0 6 27
NSP refers to the number of supported publications.

Page 22/58
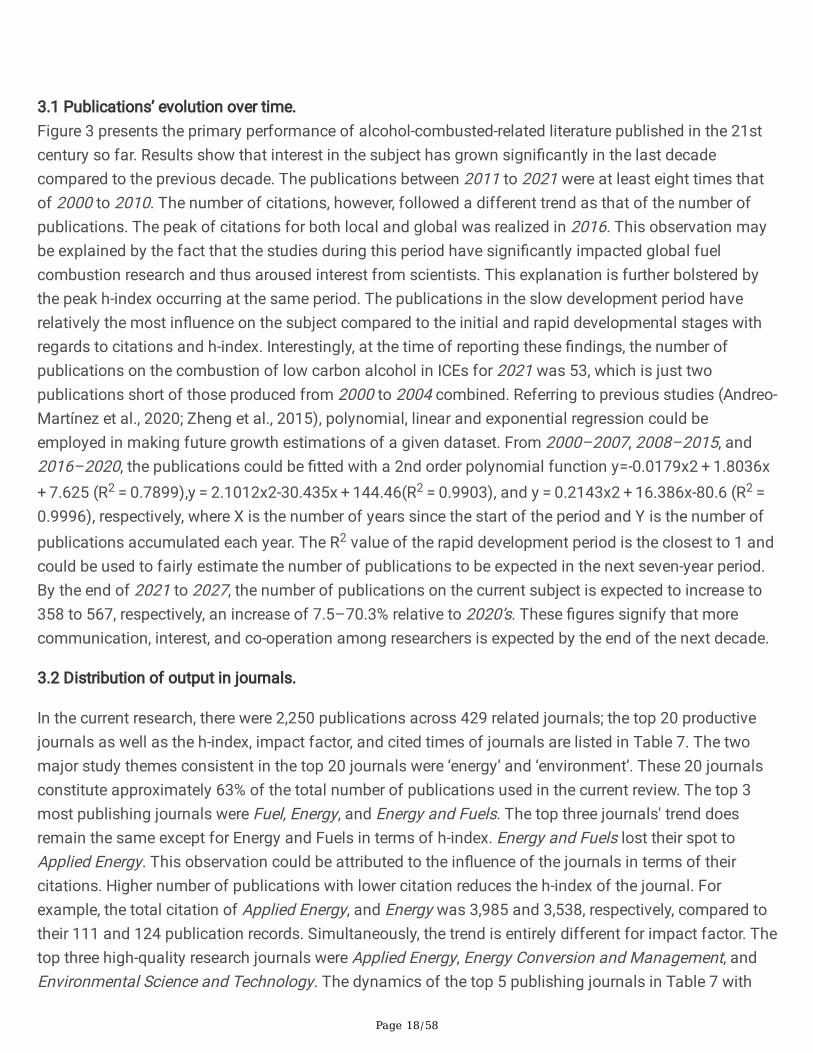
3.4 Authors’ performanceIn this section, the performance of the top 20 authors leading the research in the subject of the currentstudy is discussed. This group of authors listed in Table 9 constitute 0.42% of the total authors involvedin the current study; however, their publications make up 20.8% of the total publications extracted. Criteriafor assessing these authors' performance were limited to the number of publications, h-index, and totalcitations. According to the number of publications, Gong CM, Mamat R, Liu FH, Zhao H, and Lu XC werethe top 5 publishing authors. Ji CW, Wang SF, and Agarwal AK replaced Mamat R, Liu FH, and Lu XC tocomplete the top 5 authors according to the h-index. The latter group of authors' losses of spot could beattributed to their relatively low total global citation scores. Highly cited publications of authors usuallyincrease the h-index and vice versa. Xu HM and Gong CM are the most TGCS- and TLCS-rated authors inTable 9, respectively. Liu FH and Qian Y have the most recent publications (2015), whereas Li J has theoldest publication (2002). In addition, the academic co-authorship amongst in�uential authors wasanalyzed and displayed in Fig. 6. The most partnership existed between Gong CM and Liu FH (28Collaborations), followed by Qian Y and Lu XC (18 collaborations), and Ji CW and Wang SF (17collaborations). In Fig. 7, the annual scienti�c production of these 20 authors is shown. The most activeyears of these authors can typically be found in the current study's rapid developmental stage. Gong CM,Mamat R, Liu FH, Zhao H, and Lu XC had their most publishing year in 2020, 2017, 2020, 2016, and 2019,respectively. The author with the most different publication and citation years is Huang Z, publishing andbeing cited in seventeen different years out of a possible twenty-one.
Table 9
Top 20 performing authors.
Page 23/58
Author NP h-index TLCS TGCS PY start
Gong CM 40 18 458 804 2008
Mamat R 29 11 91 413 2014
Liu FH 28 12 251 471 2015
Zhao H 28 13 186 507 2010
Lu XC 27 11 135 486 2005
Agarwal AK 26 13 261 817 2003
Liu JP 26 13 136 438 2013
Yao CD 25 11 192 597 2008
Ji CW 24 17 188 636 2010
Huang Z 23 12 286 473 2005
Xu HM 23 13 294 952 2011
Wang Y 22 10 163 336 2013
Sarathy SM 21 10 85 344 2012
Wang Z 21 11 176 502 2010
Wang SF 19 15 138 503 2010
Qian Y 18 8 68 209 2015
Wang CM 18 7 129 388 2012
Irimescu A 17 10 100 291 2011
Maurya RK 17 11 186 582 2009
Li J 16 10 165 380 2002
NP, TGCS, TLCS, PY represents number of publications, total global citation scores, total local citation scores and publication year,
respectively.
3.5 Institutions’ performance
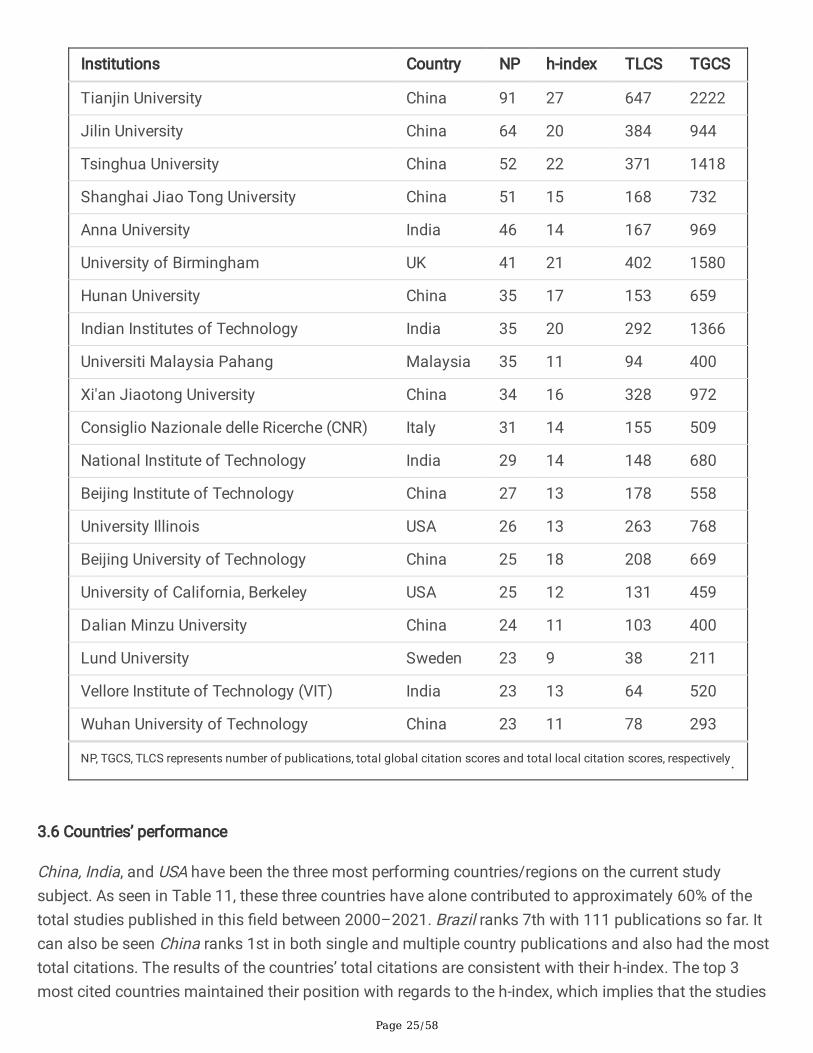
The 20 most active institutions leading the research of low carbon alcohol combustion in ICEs are listedin Table 10. Their NP accounts for 33% of the total publications. Tianjin University tops the chart with 91publications, followed by Jilin University (64 publications) and Tsinghua University (52 publications).Half of the institutions mentioned in Table 10 are located in mainland China with 58% of the totalpublications of the twenty institutions. These �gures demonstrate the global dominance of Chinese
Page 24/58
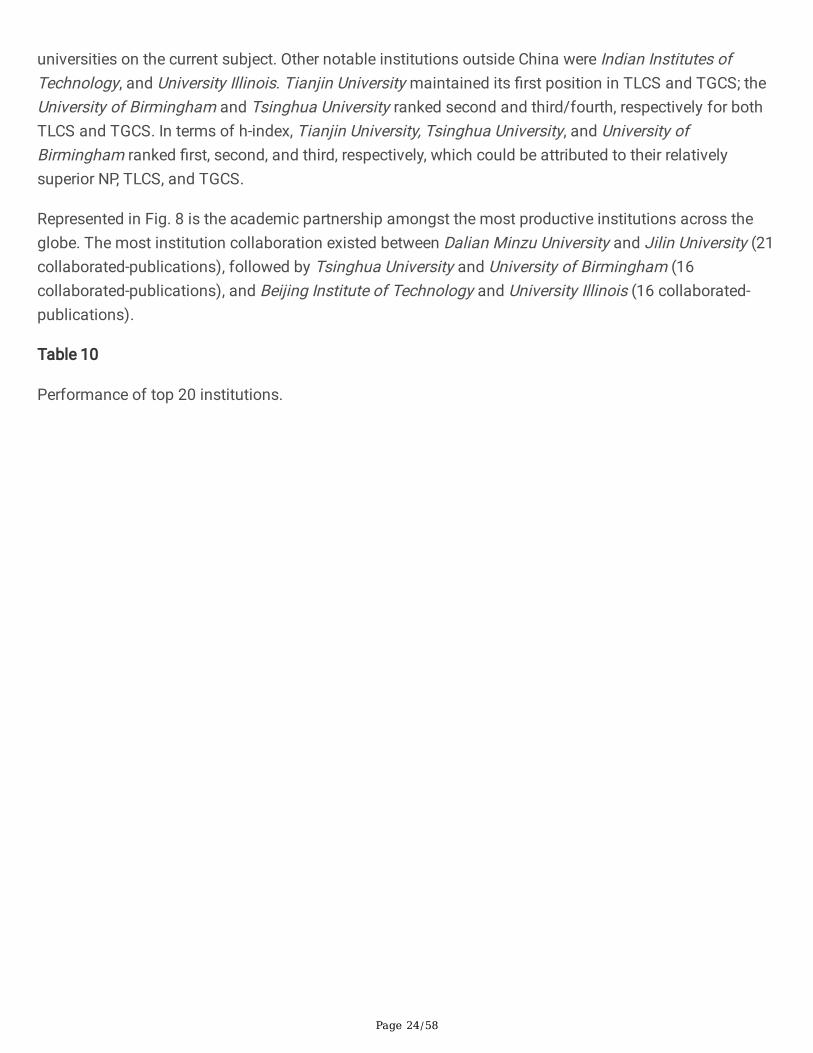
universities on the current subject. Other notable institutions outside China were Indian Institutes ofTechnology, and University Illinois. Tianjin University maintained its �rst position in TLCS and TGCS; theUniversity of Birmingham and Tsinghua University ranked second and third/fourth, respectively for bothTLCS and TGCS. In terms of h-index, Tianjin University, Tsinghua University, and University ofBirmingham ranked �rst, second, and third, respectively, which could be attributed to their relativelysuperior NP, TLCS, and TGCS.
Represented in Fig. 8 is the academic partnership amongst the most productive institutions across theglobe. The most institution collaboration existed between Dalian Minzu University and Jilin University (21collaborated-publications), followed by Tsinghua University and University of Birmingham (16collaborated-publications), and Beijing Institute of Technology and University Illinois (16 collaborated-publications).
Table 10
Performance of top 20 institutions.
Page 25/58
Institutions Country NP h-index TLCS TGCS
Tianjin University China 91 27 647 2222
Jilin University China 64 20 384 944
Tsinghua University China 52 22 371 1418
Shanghai Jiao Tong University China 51 15 168 732
Anna University India 46 14 167 969
University of Birmingham UK 41 21 402 1580
Hunan University China 35 17 153 659
Indian Institutes of Technology India 35 20 292 1366
Universiti Malaysia Pahang Malaysia 35 11 94 400
Xi'an Jiaotong University China 34 16 328 972
Consiglio Nazionale delle Ricerche (CNR) Italy 31 14 155 509
National Institute of Technology India 29 14 148 680
Beijing Institute of Technology China 27 13 178 558
University Illinois USA 26 13 263 768
Beijing University of Technology China 25 18 208 669
University of California, Berkeley USA 25 12 131 459
Dalian Minzu University China 24 11 103 400
Lund University Sweden 23 9 38 211
Vellore Institute of Technology (VIT) India 23 13 64 520
Wuhan University of Technology China 23 11 78 293
NP, TGCS, TLCS represents number of publications, total global citation scores and total local citation scores, respectively.
3.6 Countries’ performance
China, India, and USA have been the three most performing countries/regions on the current studysubject. As seen in Table 11, these three countries have alone contributed to approximately 60% of thetotal studies published in this �eld between 2000–2021. Brazil ranks 7th with 111 publications so far. Itcan also be seen China ranks 1st in both single and multiple country publications and also had the mosttotal citations. The results of the countries’ total citations are consistent with their h-index. The top 3most cited countries maintained their position with regards to the h-index, which implies that the studies

Page 26/58
of the Chinese, Indians, Americans (USA), were highly in�uential to the studies of other researchers.According to the attractive index in Fig. 9a, only China’s AAI for four different periods was almost equal orgreater than that of the global average. India’s AAI was less than the global average except during the lastquarter; however, it was the only country whose attractiveness increased with time. The highest AAI wasrecorded by USA during the third quarter, whereas the lowest AAI so far has been recorded by Italy,Malaysia, Iran, and Saudi Arabia in the 2000–2005 period. On average, the most attractive studiesoriginate from China. On the other hand, as seen in Fig. 9b, the research activity of US (AI) was thehighest, having AI greater than global average except for 2016 to 2021. Though China has the mostpublications, its active publication period has only been relatively recent, thus explaining its lower AIcompared to that of US and UK in the earlier periods. The activeness of Malaysia, Iran, and Saudi Arabiahas only been from the start of the third quarter.
The academic partnership amongst the various countries is reported in Fig. 10. The most collaborationexisted between China and USA (79), China and UK (46), and Iran and Malaysia (15).
The dominance of these countries correlates with their biofuel production, government subsidies, andprograms. Brazil is one of the pioneer countries to implement programs for the production of ethanol fuelfrom sugarcane. Since 1977, Brazil’s ethanol-use mandate has been mandatory, with a state-legislated4.5% blend of anhydrous ethanol to gasoline (Barros, 2020). The legislation allows ethanol to be blendedin gasoline within the range of 18-27.5%, and it is currently set at 27%. In addition, the tax for gasolinerose from R$0.38/liter to R$0.79/liter in 2017. Ethanol’s tax increase was relatively lower than gasoline’s(from R$0.12 /liteR$0.13/liter, while for ethanol distributors, it increased from zeroR$0.11liter), whichfavored ethanol’s competitiveness compared to gasoline (Barros, 2020). About 40% of fuel used inBrazilian road transport vehicles is ethanol (Anderson, 2009). In the US, an astonishing 16.1 billiongallons of clean, renewable ethanol was produced in 2018 (RFA, 2019). Between 2017–2018, ethanolconsumption grew by 300 million gallons, driven largely by record exports of over 1.6 billion gallons asthe demand for octane increases globally. Domestic demand was also on course to record levels asJanuary 2018’s blend rates topped a record 10.75%, despite the existence of the so-called ‘blend wall.’China's increased productivity in this �eld of study could be attributed to its growing effort to increase thebiofuel fraction of its current energy mix, as 30% of the total global primary energy demand in the nexttwo decades will be from Asia, mainly from China and India (IEA, 2010). China ranked 3rd in the 2012global rankings of ethanol fuel production (Sarathy et al., 2014). The E10 target of China was planned tofollow an incremental expansion through a few selected provinces and cities (Kim, 2018). As of 2017, 11provinces and cities were enrolled on the mandatory E10 blend as ethanol pilot zones. In the case ofmethanol, there are 50 methanol gasoline blending terminal centers either completed or underconstruction in 15 Chinese provinces, and there is more than 1.2 million metric tons (or 400 milliongallons) of annual methanol blending capacity (Klein, 2020). Subsidies have been made available toincrease ethanol fuel uptake; advanced cellulosic ethanol production subsidy is currently $0.007 per liter(600 RMB per ton) (Kim, 2018). The government of India has made plans to provide �nancial incentives,including subsidies, grants, tax credits, accelerated depreciation on plant expenditures, differential pricingvis-à-vis − 1G Ethanol, Viability Gap Funding (VGF of INR 5000 crore, or $735 million), all within 6 years

Page 27/58
(Aradhey, 2019). These provisions have boosted ethanol production and consumption in India in recentyears, and efforts are being made to make second-generation ethanol a more attractive fuel than gasolineand �rst-generation ethanol. Finally, the European Union adopted the new Renewable Energy Directive for2021–2030 (RED II). The energy directive seeks to achieve a renewable energy target of at least 32% by2030, with a 14% target allocated for the transport sector (Bob et al., 2019).
In Fig. 11, the relative trend in the �ve continents' research output in four different timelines is depicted.Europe and America’s dominance were apparent in the �rst quarter. However, from the second to the �nalquarter, Asia has been at the forefront of the research on the current subject, with most of itscontributions from China and India. Figure 12 is a geographical representation of past studies on thecombustion of low carbon alcohol in ICE from 2000 to 2021. Despite being the third-largest continentaccording to the number of countries, Europe had the most country-diversi�ed publications, followed byAsia, America, Africa, and Oceania in that order.
Table 11
Research output of countries from 2000 to 2021.

Page 28/58
Country NP1 NP2 SCP MCP h-index TC Top 3 collaborations*
China 562 513 407 106 48 9931 USA, UK, Australia
India 425 397 370 27 43 6735 Vietnam, USA, Canada
USA 348 243 182 61 46 6601 Saudi Arabia, Germany, UK
United Kingdom 153 104 59 45 35 2869 Spain, Germany, Thailand
Turkey 131 120 112 8 34 4130 Sweden, Denmark, Netherlands
Brazil 111 102 82 20 17 1051 Spain, UK, France
Italy 75 66 61 5 20 1248 Sweden, Belgium, Canada
Malaysia 75 55 35 20 22 1111 Iran, Australia, Iraq
Iran 65 53 39 14 16 771 Australia, Canada, Indonesia
Saudi Arabia 64 35 24 11 22 699 Egypt, Canada, Ireland
Australia 61 36 18 18 26 853 Iraq, Germany, Spain
Spain 56 36 22 14 16 720 Mexico, Belgium, Colombia
Germany 54 39 31 8 17 737 Netherlands, Sweden, Ireland
France 50 25 17 8 18 685 Spain, Algeria, Belgium
Korea 49 46 34 12 17 776 Japan, Indonesia, Saudi Arabia
Canada 45 32 21 11 16 542 Belgium, Israel, Netherlands
Sweden 38 25 16 9 13 363 Belgium, Denmark, Netherlands
Poland 36 35 33 2 12 538 Hungary, Slovakia
Japan 33 20 19 1 13 294 Egypt, Thailand, Belgium
Greece 23 21 18 3 10 397 Belgium, UAE
NP1, NP2, SCP, MCP, TC, refer to number of publications (overall), number of publications (according to corresponding author’s
country), single country publication, multiple country publication, and total citations, respectively. *collaborations from countries in
column 1 to countries in column 8. Note−United Kingdom consists of records from England, Scotland, Wales, and Northern Ireland.
3.7 Research hotspots and trends
The current subject's research trend is evaluated based on the frequency of keywords from titles,abstracts, author keywords, and keyword-plus. The most frequent keywords are shown in Fig. 13. It canbe seen that the top 3 keywords (per minimum count) were ethanol (864), combustion (826), andperformance (821). The use of ‘minimum’ is to imply that other root forms of the word had appeared inrelatively lower positions. The top three keywords reveal to the current study that the main researchhotspot of the subject at hand centers around the combustion, performance, and emission characteristics

Page 29/58
of alcohol-fueled engines. With ethanol ranking �rst, its methanol counterpart ranked 8th with a minimumcount of 354, which is less than ethanol’s by 244%. The �gures suggest that in the 21st century, thecombustion of ethanol in ICEs seems more preferable to methanol. The relatively better fuel properties ofethanol over methanol’s make the former attain more complete combustion and e�ciency with relativelylesser pollution. Varol et al. (2014) compared the blends of different alcohols in unleaded gasoline for themixtures’ emission and performance characteristics. Their study revealed that CO2 and HC emissionswere higher in the methanol blends compared to ethanol’s. Moreover, the BSFC and BTE were higher andlower in the methanol blends than ethanol’s, respectively. Corrosivity in methanol has been reported to beaffected by the alcohol’s high polarity. Methanol-fueled engines require modi�cations to engine fuelsystems as methanol tends to cause issues of material compatibility and both metals and elastomers(soft components used for seals and fuel lines) can be attacked by methanol if not chosen properly(Klein, 2020). The electrical conductivity could be a measure of a fuel’s corrosivity; compared to ethanol,methanol's electrical conductivity is at least four times higher (Klein, 2020). Also, the solubility ofmethanol in oil is relatively poorer than that of ethanol (Jin et al., 2019b; Jin et al., 2020), hence, more co-solvent is needed in the methanol-oil blends. Interestingly, biodiesel ranked 4th as the most co-citedkeyword with a minimum citation count of 684. Several authors have reported that biodiesel's addition todiesel/gasoline-alcohol blends has several added bene�ts such as cetane enhancement and promotionof miscibility (Alam et al., 2006; Subbaiah et al., 2010). Emissions have also been reported to reduce inoil-alcohol blends with the addition of biodiesel (Subbaiah et al., 2010). Between the two conventionaloils, gasoline aroused more interest from researchers than diesel, with a minimum count of 357 and 158,respectively. The primary reason could be due to cost; gasoline prices have been lower than diesel almostcontinuously since September 2004 (EIA, 2021). As of January 2021, gasoline's price was $2.33/galloncompared to $2.68/gallon of diesel (EIA, 2021). According to the International Council on CleanTransportation, combustion of 1L of diesel fuel produces 11% more CO2 than the same amount ofgasoline fuel (ICCT, 2019). Consequently, the spark-ignition engine appeared in many studies thancompression ignition engine (225 and 173 minimum citation counts, respectively). Spark ignition enginesbased on the Otto cycle are the most popular internal combustion engines, as they can burn a wide rangeof fuels including gasoline, natural gas, propane, biogas and land�ll gas (Breeze, 2018). Diesel(compression ignition) engines are more expensive to manufacture and require intensive NOx abatementtechnologies. The main drawback to gasoline engines (spark ignition) compared to diesel engine foryears has been lower e�ciency; however, with the introduction of e�ciency technologies, such as directinjection, turbocharging and downsizing, cooled EGR, and variable valve timing and compression-ratioengines, the e�ciency advantages of diesel engines are further eroded (ICCT, 2018). Moreover, solubilityof ethanol in gasoline can be achieved without co-solvent whereas that of diesel is impossible (Lapuertaet al., 2007; Rakopoulos et al., 2011; Rakopoulos et al., 2014). These factors could explain for the higherinterest in gasoline and spark ignition engine by the researchers investigated in the current study.Furthermore, the most appearing advanced combustion technique was low temperature combustion(minimum count of 73) with Homogeneous charge compression ignition (HCCI) being the most commontype (63 minimum counts). For author keyword co-occurrence analysis, the most co-occuring pairs were

Page 30/58
combustion-emission (144 times), performance-emission (131 times), ethanol-emissions (78 times),performance-combustion (60 times), ethanol-combustion (51 times), ethanol-gasoline (46 times).
The emergence of broad and core themes is captured using three �eld plots, as seen in Fig. 14. The �gureaims to highlight how the combustion of low carbon alcohols in ICE has changed over the last twodecades. Two cutting points of timelines were set, i.e., 2005 and 2010, producing three different periods;2000–2005, 2006 to 2010, and 2011 to 2021. The stream of lines connecting one theme to anotherdescribes how a theme's research focus has evolved with time. The bigger the size of the node andstream, the bigger the themes’ in�uence in that particular period. The research started with eight majorthemes: alternative fuel, ethanol, engine performance, methanol, and internal combustion engine. As atheme, alternative fuel has evolved into three different themes; ethanol, combustion, and engineperformance. The theme evolved from 2000–2005 into ethanol in 2006–2021 and ended in 2011–2021as combustion and engine performance. It could be suggested from this observation that, amongst theseveral alternative fuel options available for combustion in ICE, the relative attention of researchers onsolely ethanol combustion and performance became great, which is in line with the observation in Fig. 13.Ethanol as a theme has remained unevolved for the entire duration of the century so far. However, thesame cannot be said for its methanol counterpart. As one of the major themes at the start of the century,methanol has evolved into ethanol with more focus on the C2 alcohol due to its extra advantages thanthe C1 alcohol, and the evolution follows the same pattern as in alternative fuels. Combustion and engineperformance have all not evolved, implying a sustained interest of these themes by researchers. However,just like methanol, the diesel engine has undergone three evolutions. The diesel engine's focus as a wholetopic was narrowed down to combustion and exhaust emissions from the �rst period to the end of thesecond. The combustion theme from this stream has remained as it is but that of exhaust emissionsevolved after 2010 into engine performance and ethanol in 2011–2021. Interest in advanced combustiontechnology (HCCI) became more spontaneous in 2006–2010 with three main current research focus;engine performance, ethanol, and hydrogen. The focus on hydrogen as combustion fuel became lessapparent after 2000–2005. However, in the 2011–2021 period, interest in this fuel as an alternative tomethanol, ethanol or diesel, gasoline has emerged but a slower rate per its node size. The results ofFig. 14 are very consistent with Fig. 13, further re-emphasizing the growing communication ofcombustion, performance, and emission characteristics of ethanol.
The main research direction of the three most in�uential continents, America, Asia, and Europe, ishighlighted in Fig. 15 according to the frequently occurring author keywords. From the �gure, it can beconcluded that these three continents' research focus has fairly been the same. In no particular order,ethanol, combustion, performance, and emissions have been the top 4 author keywords across allresearch studies coming from these three continents. However, it is worth mentioning that there weresome differences in the research trends but had very minimal in�uence compared to the bigger picture.For instance, arti�cial neural network (ANN) became a popular topic in America's research �eld, makingits way to the 50 most occurring author keywords. ANN was relatively not prominent in the studiesoriginating from Asia and Europe. The machine learning term failed to make it to the top 50 authorkeywords in these two continents.

Page 31/58
The section is concluded with the main research direction of the most productive countries and journals.A three-�eld plot is generated, as shown in Fig. 16, with top 10 countries on the left, top 10 journals on theright, and top 10 keywords in the middle. From the �gure, it can be seen that the top 5 keywords fromthese ten countries are the same as that of global as shown in Fig. 13, except for biodiesel (global) andblend (top 10 countries). This demonstrates that the research direction of the current study's subject ismostly driven by these ten countries, especially China, India, and USA. On the other hand, methanol is nota top 10 highly occurring word of these ten in�uential countries. This implies that the top 10 ranking ofmethanol on a global scale could have been in�uenced mainly by countries outside the those mentionedin Fig. 15; thus, methanol can be said to have been a favorite fuel option in those countries. These tencountries also found Fuel as the most attractive journal for their publications. Apart from RenewableEnergy, and Combustion of Flame, the main publications by these journals originated from China.Combustion of Flame was mainly supplied with studies from USA, whereas India was the mainpublication country of Renewable Energy. The top 10 keywords were mainly in�uenced by publicationsfrom Fuel.
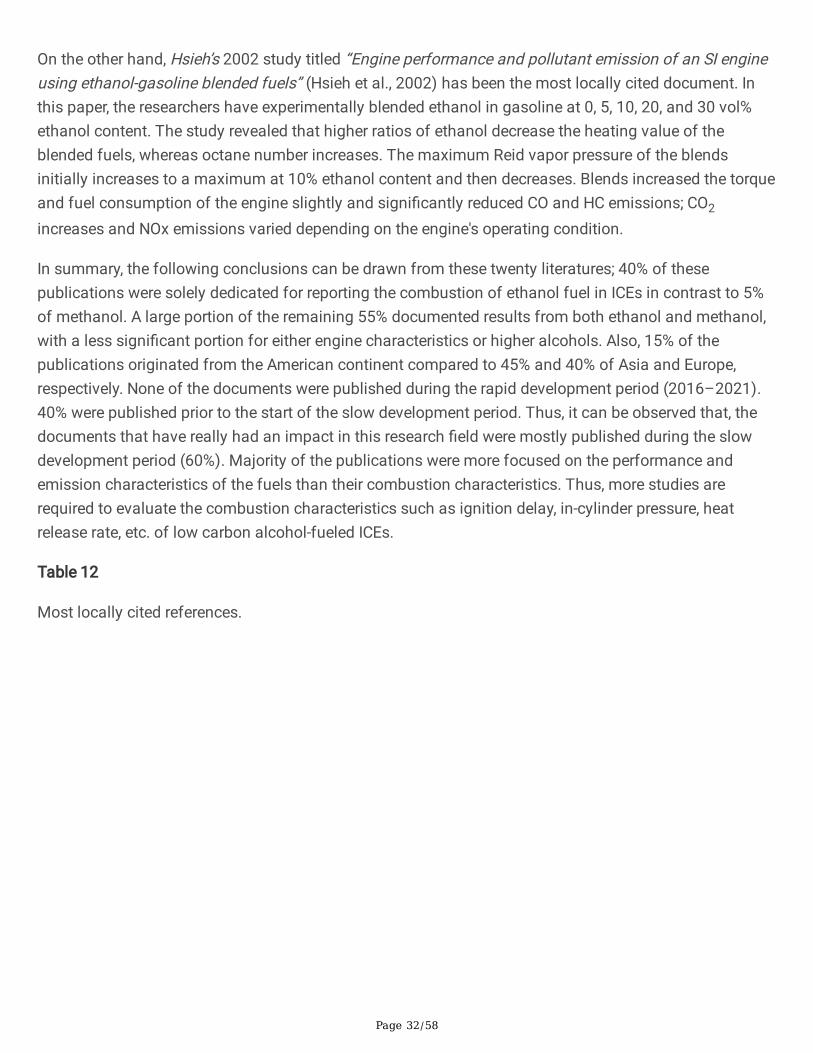
4. Most In�uential LiteratureThe most in�uential literatures of the 2250 documents are listed in Tables 12 and 13. Two groups ofliterature are discussed; most cited local documents, and most cited local references. The former refers todocuments within the 2250 dataset with the highest citation from documents within the same dataset.The latter also identi�es the most cited articles in the reference list of all the 2250 documents combined.J. Haywood’s 1988 book titled “Internal Combustion Engine Fundamentals” (J.B, 1988) is the most locallycited reference which a complete guide to working principle and characteristics of all internal combustionengines. However, for the purpose of the current study, emphasis is placed on the second-rankeddocument. In 2007, Agarwal published an article titled “Biofuels (alcohols and biodiesel) applications asfuels for internal combustion engines” (Agarwal, 2007) which has been the most locally cited reference inthe citations of the 2250 documents. The article provides an overview of three main liquid biofuels, i.e.,alcohols, biodiesel, and vegetable oils. For alcohols, attention was focused on their properties, enginemodi�cation requirement, regulated and unregulated emissions from ethanol-operated engines, and theengine performance of diesohol and gasohol blends. Their study revealed that ethanol as a fuel additivein unleaded gasoline results in improved performance and exhaust emissions characteristics. Generally,brake power, brake thermal e�ciency, volumetric e�ciency, and fuel consumption improves, whereas anegative trend is observed in brake speci�c fuel consumption and equivalence air-fuel ratio. Withemission characteristics, ethanol-unleaded gasoline blends lead to a signi�cant reduction in exhaustemissions for CO and HC for all engine speeds, but CO2 increases marginally. Dieseohol up to 20%ethanol content could directly be used in a CI engine without any modi�cation to the engine’s hardware.The most co-cited local references were Al-Hassan A, 2003-Hsieh WD, 2002 (55 co-citations) (Al-Hasan,2003; Hsieh et al., 2002), Gu XL, 2012-Szwaja S, 2010 (49 co-citations) (Gu et al., 2012; Szwaja andNaber, 2010), and Jin C, 2011-Szwaja S, 2010 (47 co-citations) (Jin et al., 2011; Szwaja and Naber, 2010).Figure 17 depicts the most cited local references with a minimum of �fty citation counts.
Page 32/58
On the other hand, Hsieh’s 2002 study titled “Engine performance and pollutant emission of an SI engineusing ethanol-gasoline blended fuels” (Hsieh et al., 2002) has been the most locally cited document. Inthis paper, the researchers have experimentally blended ethanol in gasoline at 0, 5, 10, 20, and 30 vol%ethanol content. The study revealed that higher ratios of ethanol decrease the heating value of theblended fuels, whereas octane number increases. The maximum Reid vapor pressure of the blendsinitially increases to a maximum at 10% ethanol content and then decreases. Blends increased the torqueand fuel consumption of the engine slightly and signi�cantly reduced CO and HC emissions; CO2
increases and NOx emissions varied depending on the engine's operating condition.
In summary, the following conclusions can be drawn from these twenty literatures; 40% of thesepublications were solely dedicated for reporting the combustion of ethanol fuel in ICEs in contrast to 5%of methanol. A large portion of the remaining 55% documented results from both ethanol and methanol,with a less signi�cant portion for either engine characteristics or higher alcohols. Also, 15% of thepublications originated from the American continent compared to 45% and 40% of Asia and Europe,respectively. None of the documents were published during the rapid development period (2016–2021).40% were published prior to the start of the slow development period. Thus, it can be observed that, thedocuments that have really had an impact in this research �eld were mostly published during the slowdevelopment period (60%). Majority of the publications were more focused on the performance andemission characteristics of the fuels than their combustion characteristics. Thus, more studies arerequired to evaluate the combustion characteristics such as ignition delay, in-cylinder pressure, heatrelease rate, etc. of low carbon alcohol-fueled ICEs.
Table 12
Most locally cited references.

Page 33/58
Paper title Totalcitations
Firstauthor
Country/region Ref.
1. Internal combustion enginefundamentals
498 John B.Heywood
USA (J.B,1988)
2. Biofuels (alcohols and biodiesel)applications as fuels for internal combustionengines
185 AvinashKumarAgarwal
India (Agarwal,2007)
3. Progress in the production andapplication of n-butanol as a biofuel
118 Chao Jin China (Jin etal., 2011)
4. Engine performance and pollutantemission of an SI engine using ethanol–gasoline blended fuels
116 Wei-DongHsieh
Taiwan (Hsieh etal., 2002)
5. Ethanol–diesel fuel blends––a review 110 Alan C.Hansen
USA (Hansenet al.,2005)
6. Effect of ethanol–unleaded gasolineblends on engine performance and exhaustemission
105 M. Al-Hasan
Jordan (Al-Hasan,2003)
7. Combustion of n-butanol in a spark-ignition IC engine
95 S.Szwaja
USA/Poland (SzwajaandNaber,2010)
8. Emission characteristics of a spark-ignition engine fuelled with gasoline-n-butanol blends in combination with EGR
92 XiaoleiGu
China (Gu et al.,2012)
9. Alcohol combustion chemistry 92 S. ManiSarathy
Saudi Arabia (Sarathyet al.,2014)
10. The effects of ethanol–unleadedgasoline blends on engine performance andexhaust emissions in a spark-ignition engine
90 MustafaKoç
Turkey (Koç etal., 2009)
Table 13
Most locally cited documents.

Page 34/58
Paper title LocalCitations
GlobalCitations
First author Country Ref.
1. Engine performance andpollutant emission of an SIengine using ethanol–gasolineblended fuels
116 350 Wei-DongHsieh
Taiwan (Hsieh etal., 2002)
2. Emission characteristics of aspark-ignition engine fuelledwith gasoline-n-butanol blendsin combination with EGR
92 213 Xiaolei Gu China (Gu et al.,2012)
3. Combustion performance ofbio-ethanol at various blendratios in a gasoline directinjection engine
68 150 Turner Dale UK (Turner etal., 2011)
4. A comparison ofperformance of higheralcohols/diesel fuel blends in adiesel engine
65 198 JavierCampos-Fernández
Spain (Campos-Fernándezet al., 2012)
5. Study of spark ignitionengine fueled withmethanol/gasoline fuel blends
64 139 Liu Shenghua China (Liu et al.,2007)
6. The effect of compressionratio on the performance,emissions and combustion ofan SI (spark ignition) enginefueled with pure ethanol,methanol and unleadedgasoline
62 103 MustafaKemal Balki
Turkey (Balki andSayin,2014)
7. Effects of ethanol additionon performance and emissionsof a turbocharged indirectinjection Diesel engine runningat different injection pressures
61 209 Özer Can Turkey (Can et al.,2004)
8. Hydrous ethanol vs.gasoline-ethanol blend: Engineperformance and emissions
61 163 RodrigoC.Costa
Brazil (Costa andSodré,2010)
9. Evaluation of Butanol–Gasoline Blends in a Port Fuel-injection, Spark-Ignition Engine
60 145 JeremieDernotte
France (Dernotte etal., 2010)
10. Combustion e�ciency andengine out emissions of a S.I.engine fueled withalcohol/gasoline blends
56 106 M.A.Costagliola
Italy (Costagliolaet al., 2013)
5. Limitation & Future Perspective
Page 35/58
Similar to any bibliometric study, the current study is not spared from limitations. First of all, restriction ofdata collection to WoS database may have introduced research bias. The use of other popular databasessuch as Scopus may have resulted in different results and conclusions. In addition, per the authors’discretion, the search terms were chosen to reduce high pollution in the dataset as much as possible.However, different results may have been reached if other relatable search terms were added. Finally, theconsideration of only the 21st-century publications may have told a different story compared to that of allpossible publication years from WoS. Future studies can address these limitations by extending thecoverage to include more databases, increased timeline, and relevant search terms.
Regardless, based on our review and �ndings in the current study, prospective opportunities for futureresearch could be suggested; (1) compared to the collaborative index from different research �elds(Fusco et al., 2020; Kawuki et al., 2020; Secinaro et al., 2020), there is room for improvement in morecollaborative studies across multi-national/institution/author levels. (2) current empirical studies on lowcarbon alcohol combustion are limited, which calls for more future studies with different research focussuch as future alternatives to low carbon alcohols or the advancement in technology for the combustionof methanol and ethanol in ICE. A disparity exists in the geographical distribution of research output.Most in�uential authors and institutions are centralized in developed countries except for the case ofChina and India. Research from Africa and South America (except Brazil) is heavily underrepresenteddespite the abundant variety of alcohol feedstocks in these regions. The current study recommends moreinvestment and studies in these resource-rich continents to drive the globe’s effort to achieve asustainable low carbon society and meet most of the climate goals such as the Kyoto Protocol, The ParisAgreement, Sustainable Development Goals (goal 7 and 13), etc. Low carbon fuel in the near foreseeablefuture will face stern competition from other alternative fuel sources, especially with the growing researchtrend in green hydrogen and green electricity in the 21st century (Yun, 2020). In all scenarios, alcoholfuels will occupy an important fraction of the future transportation fuel regardless of the numerousalternatives that may emerge (Rosillo-Calle and Walter, 2006).
6. ConclusionThe current study aimed to map the scienti�c output of low carbon alcohol combustion in internalcombustion engines in the 21st century with 2,250 documents from Web of Science Core Collection,analyzed with CiteSpace, biblioshiny app, and Bibexcel. The main conclusions from the empirical revieware summarized below:
1. The research and communication of low carbon alcohol combustion in ICEs are growing rapidly, withan average annual growth rate of 12%. By the end of the next decade, productivity could increase byup to 70% compared to the current state.
2. The National Natural Science Foundation of China and Chinese institutions led by Tianjin Universitywere the most in�uential funding agency and research institution globally in this line of research,making China the most productive country, followed USA and India.

Page 36/58
3. Asia has been the most productive continent, followed by Europe, America, Africa, and Oceania.However, Europe has had the most diversi�ed country publications in this research line from 2000–2021.
4. The keyword analysis revealed that ethanol, gasoline, and spark-ignition engine were moreresearched than their counterparts, methanol, diesel, and compression ignition engine, respectively.The main research theme has so far centralized around the alcohols' performance, combustion, andemission characteristics, especially ethanol. The alternative fuels to emerge as competition formethanol and ethanol were biodiesel and hydrogen.
5. The application of arti�cial intelligence is growing remarkably in different research �elds; however,the same degree of patronage for the advanced technology cannot be said for the combustion ofalcohol fuels in internal combustion engine judging from the results obtained for the most frequentlyused keywords. Research in this direction can further increase the comprehensiveness andproductivity in this area of research.
7. DeclarationsEthics approval and consent to participate;
Not applicable
Consent for publication;
Not applicable
Competing interests;
The authors declare that they have no competing interests
Author’s contribution
Chao Jin: Conceptualization, Methodology. Jeffrey Dankwa Ampah: Investigation, Writing-Original draftpreparation. Sandylove Afrane: Software. Zenghui Yin: Data curation. Xin Liu: Visualization. Tianyun Sun:Validation. Zhenlong Geng: Validation. Mubasher Ikram: Validation. Haifeng Liu: Writing-Reviewing andEditing, Supervision.
Availability of data and materials;
Not applicable
Acknowledgement
The authors would like to acknowledge the �nancial supports provided by the National Natural ScienceFoundation of China (Grant No. 51922076, 91941102).

Page 37/58
8. References1. Abu-Qudais M, Haddad O, Qudaisat M (2000) The effect of alcohol fumigation on diesel engine
performance and emissions. Energy Convers Manag 41(4):389–399. https://doi.org/10.1016/S0196-8904(99)00099-0
2. Agarwal AK (2007) Biofuels (alcohols and biodiesel) applications as fuels for internal combustionengines. Prog Energy Combust Sci 33(3):233–271. https://doi.org/10.1016/j.pecs.2006.08.003
3. Agarwal AK, Karare H, Dhar A (2014) Combustion, performance, emissions and particulatecharacterization of a methanol–gasoline blend (gasohol) fuelled medium duty spark ignitiontransportation engine. Fuel Processing Technology 121, 16–24.https://doi.org/10.1016/j.fuproc.2013.12.014
4. Al-Hasan M (2003) Effect of ethanol–unleaded gasoline blends on engine performance and exhaustemission. Energy Convers Manag 44(9):1547–1561. https://doi.org/10.1016/S0196-8904(02)00166-8
5. Alam M, Song J, Zello V, Boehman A (2006) Spray and combustion visualization of a direct-injectiondiesel engine operated with oxygenated fuel blends. International Journal of Engine Research7(6):503–521. https://doi.org/10.1243/14680874jer01506
�. Alptekin E (2017) Evaluation of ethanol and isopropanol as additives with diesel fuel in a CRDI dieselengine. Fuel 205:161. . 10.1016/j.fuel.2017.05.076
7. Anderson LG (2009) Ethanol fuel use in Brazil: air quality impacts. Energy Environ Sci 2(10).https://doi.org/10.1039/b906057j
�. Andersson K, Salazar CM (2015) Methanol as a marine fuel report. Energy, F
9. Andreo-Martínez P, Ortiz-Martínez VM, García-Martínez N, de los Ríos AP, Hernández-Fernández FJ,Quesada-Medina J (2020) Production of biodiesel under supercritical conditions: State of the art andbibliometric analysis. Appl Energy 264. https://doi.org/10.1016/j.apenergy.2020.114753
10. Aradhey A (2019) India Biofuels Annual 2019
11. Aria M, Cuccurullo C (2017) bibliometrix: An R-tool for comprehensive science mapping analysis.Journal of informetrics 11(4):959–975. https://doi.org/10.1016/j.joi.2017.08.007
12. Balki MK, Sayin C (2014) The effect of compression ratio on the performance, emissions andcombustion of an SI (spark ignition) engine fueled with pure ethanol, methanol and unleadedgasoline. Energy 71:194–201. https://doi.org/10.1016/j.energy.2014.04.074
13. Barros S (2020) Biofuels Annual
14. Bata RM, Elrod AC, Rice RW (1989) Emissions From IC Engines Fueled With Alcohol–GasolineBlends: A Literature Review. J Eng Gas Turbines Power 111(3):424–431.https://doi.org/10.1115/1.3240271
15. Bertau M, Offermanns H, Plass L, Schmidt F, Wernicke H-J (2014) Methanol: The Basic Chemical andEnergy Feedstock of the Future. Springer
Page 38/58
1�. Bettencourt LMA, Kaur J (2011) Evolution and structure of sustainability science. Proceedings of theNational Academy of Sciences 108(49), 19540. https://doi.org/10.1073/pnas.1102712108
17. Bilgin A, Sezer İ (2008) Effects of Methanol Addition to Gasoline on the Performance and Fuel Costof a Spark Ignition Engine. Energy Fuels 22(4):2782–2788. https://doi.org/10.1021/ef8001026
1�. Bob F, Sabine L, Sophie B (2019) EU Biofuels Annual 2019
19. Boyd TA (1950) Path�nding in fuels and engines. SAE International. https://doi.org/10.4271/500175
20. Braun T, Glänzel W, Schubert A (2006) A Hirsch-type index for journals. Scientometrics 69(1):169–173. https://doi.org/10.1007/s11192-006-0147-4
21. Breeze P (2018) Chapter 4 - Spark Ignition Engines, In: Breeze, P. (Ed.), Piston Engine-Based PowerPlants. Academic Press, pp. 35–45. https://doi.org/10.1016/B978-0-12-812904-3.00004-5
22. Bromberg L, Cheng WK (2010) Methanol as an alternative transportation fuel in the US: Options forsustainable and/or energy-secure transportation
23. Campos-Fernández J, Arnal JM, Gómez J, Dorado MP (2012) A comparison of performance ofhigher alcohols/diesel fuel blends in a diesel engine. Appl Energy 95:267–275.https://doi.org/10.1016/j.apenergy.2012.02.051
24. Can Ö, Çelikten İ, Usta N (2004) Effects of ethanol addition on performance and emissions of aturbocharged indirect injection Diesel engine running at different injection pressures. Energy ConversManag 45(15):2429–2440. https://doi.org/10.1016/j.enconman.2003.11.024
25. Canakci M, Ozsezen AN, Alptekin E, Eyidogan M (2013) Impact of alcohol–gasoline fuel blends onthe exhaust emission of an SI engine. Renewable Energy 52:111–117.https://doi.org/10.1016/j.renene.2012.09.062
2�. Chen C (2006) CiteSpace II: Detecting and visualizing emerging trends and transient patterns inscienti�c literature. J Am Soc Inform Sci Technol 57(3):359–377. https://doi.org/10.1002/asi.20317
27. Chen CS, Rao PSC, J, D.J (2005) Oxygenated fuel induced cosolvent effects on the dissolution ofpolynuclear aromatic hydrocarbons from contaminated soil. Chemosphere 60:1572–1582.https://doi.org/10.1016/j.chemosphere.2005.02.039
2�. Chen H, Yang Y, Yang Y, Jiang W, Zhou J (2014) A bibliometric investigation of life cycle assessmentresearch in the web of science databases. The International Journal of Life Cycle Assessment19(10):1674–1685. https://doi.org/10.1007/s11367-014-0777-3
29. Chen K, Guan J (2011) A bibliometric investigation of research performance in emergingnanobiopharmaceuticals. Journal of Informetrics 5(2):233–247.https://doi.org/10.1016/j.joi.2010.10.007
30. Chen W, Liu W, Geng Y, Brown MT, Gao C, Wu R (2017) Recent progress on emergy research: Abibliometric analysis. Renew Sustain Energy Rev 73:1051–1060.https://doi.org/10.1016/j.rser.2017.02.041
31. Chen Z, Liu J, Han Z, Du B, Liu Y, Lee C (2013) Study on performance and emissions of a passenger-car diesel engine fueled with butanol–diesel blends. Energy 55:638–646.

Page 39/58
https://doi.org/10.1016/j.energy.2013.03.054
32. Cooke DF, Dodson MG, Williams A (1971) A shock-tube study of the ignition of methanol and ethanolwith oxygen. Combust Flame 16(3):233–236. https://doi.org/10.1016/S0010-2180(71)80093-7
33. Costa RC, Sodré JR (2010) Hydrous ethanol vs. gasoline-ethanol blend: Engine performance andemissions. Fuel 89(2):287–293. https://doi.org/10.1016/j.fuel.2009.06.017
34. Costagliola MA, De Simio L, Iannaccone S, Prati MV (2013) Combustion e�ciency and engine outemissions of a S.I. engine fueled with alcohol/gasoline blends. Appl Energy 111:1162–1171.https://doi.org/10.1016/j.apenergy.2012.09.042
35. Dada OL (2018) A Model of Entrepreneurial Autonomy in Franchised Outlets: A Systematic Review ofthe Empirical Evidence. International Journal of Management Reviews 20(2):206–226.https://doi.org/10.1111/ijmr.12123
3�. Dasilva R, Cataluna R, Menezes E, Samios D, Piatnicki C (2005) Effect of additives on the antiknockproperties and Reid vapor pressure of gasoline. Fuel 84(7–8):951–959.https://doi.org/10.1016/j.fuel.2005.01.008
37. Deng X, Chen Z, Wang X, Zhen H, Xie R (2018) Exhaust noise, performance and emissioncharacteristics of spark ignition engine fuelled with pure gasoline and hydrous ethanol gasolineblends. Case Studies in Thermal Engineering 12:55–63. https://doi.org/10.1016/j.csite.2018.02.004
3�. Dernotte J, Mounaim-Rousselle C, Halter F, Seers P (2010) Evaluation of Butanol–Gasoline Blends ina Port Fuel-injection, Spark-Ignition Engine. Oil Gas Science Technology – Rev IFP 65(2):345–351.https://doi.org/doi.org/10.2516/ogst/2009034
39. Dhande DY, Sinaga N, Dahe KB (2021) Study on combustion, performance and exhaust emissions ofbioethanol-gasoline blended spark ignition engine. Heliyon 7(3):e06380.https://doi.org/10.1016/j.heliyon.2021.e06380
40. EIA (2021) Petroleum & Other Liquids. https://www.eia.gov/petroleum/gasdiesel/ (Date accessed:17th March, 2021)
41. Fusco F, Marsilio M, Guglielmetti C (2020) Co-production in health policy and management: acomprehensive bibliometric review. BMC Health Serv Res 20(1):504. https://doi.org/10.1186/s12913-020-05241-2
42. Gong C, Li Z, Yi L, Liu F (2019) Comparative study on combustion and emissions between methanolport-injection engine and methanol direct-injection engine with H2-enriched port-injection under lean-burn conditions. Energy Convers Manag 200:112096.https://doi.org/10.1016/j.enconman.2019.112096
43. Gu X, Huang Z, Cai J, Gong J, Wu X, Lee C-f (2012) Emission characteristics of a spark-ignitionengine fuelled with gasoline-n-butanol blends in combination with EGR. Fuel 93:611–617.https://doi.org/10.1016/j.fuel.2011.11.040
44. Hagen DL (1977) Methanol as a Fuel: A Review with Bibliography. Society ofAutomotive Engineers,Inc.

Page 40/58
45. Han J, Somers LMT, Cracknell R, Joedicke A, Wardle R, Mohan VRR (2020) Experimentalinvestigation of ethanol/diesel dual-fuel combustion in a heavy-duty diesel engine. Fuel 275.https://doi.org/10.1016/j.fuel.2020.117867
4�. Hansen AC, Zhang Q, Lyne PW (2005) Ethanol-diesel fuel blends -- a review. Bioresour Technol96(3):277–285. https://doi.org/10.1016/j.biortech.2004.04.007
47. Harari PA, Banapurmath NR, Yaliwal VS, Khan TMY, Soudagar MEM, Sajjan AM (2020) Experimentalstudies on performance and emission characteristics of reactivity controlled compression ignition(RCCI) engine operated with gasoline and Thevetia Peruviana biodiesel. Renewable Energy 160:865–875. https://doi.org/10.1016/j.renene.2020.07.009
4�. Haupt D, Nord K, Tingvall B, Ahlvik P, Egebäck K-E, Andersson S, Blomquist M (2004) Investigating thePotential to Obtain Low Emissions from a Diesel Engine Running on Ethanol and Equipped With EGR,Catalyst and DPF. Sae Technical Paper Series
49. Höök M, Söderbergh B, Jakobsson K, Aleklett K (2009) The Evolution of Giant Oil Field ProductionBehavior. Nat Resour Res 18(1):39–56. https://doi.org/doi:10.1007/s11053-009-9087-z
50. Hou Q, Mao G, Zhao L, Du H, Zuo J (2015) Mapping the scienti�c research on life cycle assessment:a bibliometric analysis. The International Journal of Life Cycle Assessment 20(4):541–555.https://doi.org/10.1007/s11367-015-0846-2
51. Hsieh W-D, Chen R-H, Wu T-L, Lin T-H (2002) Engine performance and pollutant emission of an SIengine using ethanol–gasoline blended fuels. Atmos Environ 36(3):403–410.https://doi.org/10.1016/S1352-2310(01)00508-8
52. Huang H, Teng W, Liu Q, Zhou C, Wang Q, Wang X (2016) Combustion performance and emissioncharacteristics of a diesel engine under low-temperature combustion of pine oil–diesel blends.Energy Convers Manag 128:317–326. https://doi.org/10.1016/j.enconman.2016.09.090
53. Huang L, Zhou M, Lv J, Chen K (2020) Trends in global research in forest carbon sequestration: Abibliometric analysis. J Clean Prod 252:119908. https://doi.org/10.1016/j.jclepro.2019.119908
54. HVA (2011) Ethanol Timeline. https://www.historicvehicle.org/ethanol-timeline/ (Date accessed: 15thMarch, 2020)
55. ICCT (2018) Diesel car sales decline will have negligible impact on attainment of European CO2emission standards
5�. ICCT (2019) Gasoline vs. Diesel; comparing co2 emission levels of a modern medium size car modelunder laboratory and on-road testing conditions
57. Ickes A, Wallner T, Zhang Y, De Ojeda W (2014) Impact of Cetane Number on Combustion of aGasoline-Diesel Dual-Fuel Heavy-Duty Multi-Cylinder Engine. SAE Int J Engines 7(2):860–872.https://doi.org/10.4271/2014-01-1309
5�. IEA (2010) World Energy Outlook
59. Ileri E (2016) Experimental study of 2-ethylhexyl nitrate effects on engine performance and exhaustemissions of a diesel engine fueled with n-butanol or 1-pentanol diesel–sun�ower oil blends. EnergyConvers Manag 118:320–330. https://doi.org/10.1016/j.enconman.2016.04.015

Page 41/58
�0. Iliev S (2019) Comparison of Ethanol and Methanol Blending with Gasoline Using Engine Simulation,Biofuels - Challenges and opportunities. https://doi.org/10.5772/intechopen.81776
�1. Heywood JB (1988) Internal Combustion Engine Fundamentals. McGraw-Hill Ed., New York
�2. Jamrozik A (2017) The effect of the alcohol content in the fuel mixture on the performance andemissions of a direct injection diesel engine fueled with diesel-methanol and diesel-ethanol blends.Energy Convers Manag 148:461–476. https://doi.org/10.1016/j.enconman.2017.06.030
�3. Jamrozik A, Tutak W, Gnatowska R, Nowak Ł (2019) Comparative Analysis of the CombustionStability of Diesel-Methanol and Diesel-Ethanol in a Dual Fuel Engine. Energies 12(6).https://doi.org/10.3390/en12060971
�4. Jamuwa DK, Sharma D, Soni SL (2016) Experimental investigation of performance, exhaustemission and combustion parameters of stationary compression ignition engine using ethanolfumigation in dual fuel mode. Energy Convers Manag 115:221–231.https://doi.org/10.1016/j.enconman.2016.02.055
�5. Jin C, Pang X, Zhang X, Wu S, Ma M, Xiang Y, Ma J, Ji J, Wang G, Liu H (2019a) Effects of C3–C5alcohols on solubility of alcohols/diesel blends. Fuel 236:65–74.https://doi.org/10.1016/j.fuel.2018.08.129
��. Jin C, Yao M, Liu H, Lee C-fF, Ji J (2011) Progress in the production and application of n-butanol as abiofuel. Renew Sustain Energy Rev 15(8):4080–4106. https://doi.org/10.1016/j.rser.2011.06.001
�7. Jin C, Zhang X, Geng Z, Pang X, Wang X, Ji J, Wang G, Liu H (2019b) Effects of various co-solventson the solubility between blends of soybean oil with either methanol or ethanol. Fuel 244:461–471.https://doi.org/10.1016/j.fuel.2019.01.187
��. Jin C, Zhang X, Han W, Geng Z, Tessa Margaret Thomas M, Dankwa Jeffrey A, Wang G, Ji J, Liu H(2020) Macro and micro solubility between low-carbon alcohols and rapeseed oil using different co-solvents. Fuel 270. https://doi.org/10.1016/j.fuel.2020.117511
�9. Kawuki J, Yu X, Musa TH (2020) Bibliometric Analysis of Ebola Research Indexed in Web of Scienceand Scopus (2010–2020). Biomed Res Int 2020, 5476567. https://doi.org/10.1155/2020/5476567
70. Kim G (2018) China Biofuels Annual 2018
71. Kim HY, Ge JC, Choi NJ (2020) Effects of Ethanol–Diesel on the Combustion and Emissions from aDiesel Engine at a Low Idle Speed. Applied Sciences 10(12). https://doi.org/10.3390/app10124153
72. Kinney AL (2007) National scienti�c facilities and their science impact on nonbiomedical research.Proc Natl Acad Sci U S A 104(46):17943–17947. https://doi.org/10.1073/pnas.0704416104
73. Klein T, 2020. Methanol: A Future-Proof Fuel A Primer Prepared for the Methanol Institute
74. Koç M, Sekmen Y, Topgül T, Yücesu HS (2009) The effects of ethanol–unleaded gasoline blends onengine performance and exhaust emissions in a spark-ignition engine. Renewable Energy34(10):2101–2106. https://doi.org/10.1016/j.renene.2009.01.018
75. Kumar R, Chaurasia O (2019) A Review on Performance and Emissions of Compression IgnitionEngine Fueled with Ethanol-diesel Blend. Journal Européen des Systèmes Automatisés 52(2):205–
Page 42/58
214. https://doi.org/10.18280/jesa.520214
7�. Kumar S, Cho JH, Park J, Moon I (2013) Advances in diesel–alcohol blends and their effects on theperformance and emissions of diesel engines. Renew Sustain Energy Rev 22:46–72.https://doi.org/10.1016/j.rser.2013.01.017
77. Labeckas G, Slavinskas S, Lus T, Klyus O (2013) Combustion and performance parameters of aDiesel engine operating on ethanol-Diesel fuel blends
7�. Labeckas G, Slavinskas S, Mažeika M (2014) The effect of ethanol–diesel–biodiesel blends oncombustion, performance and emissions of a direct injection diesel engine. Energy Convers Manag79:698–720. https://doi.org/10.1016/j.enconman.2013.12.064
79. Lapuerta M, Armas O, García-Contreras R (2007) Stability of diesel–bioethanol blends for use indiesel engines. Fuel 86(10–11):1351–1357. https://doi.org/10.1016/j.fuel.2006.11.042
�0. Lei J, Bi Y, Shen L (2011) Performance and Emission Characteristics of Diesel Engine Fueled withEthanol-Diesel Blends in Different Altitude Regions. Journal of Biomedicine and Biotechnology 2011,417421. https://doi.org/10.1155/2011/417421
�1. Li Y, Gong J, Deng Y, Yuan W, Fu J, Zhang B (2017) Experimental comparative study on combustion,performance and emissions characteristics of methanol, ethanol and butanol in a spark ignitionengine. Appl Therm Eng 115:53–63. https://doi.org/10.1016/j.applthermaleng.2016.12.037
�2. Li Y, Jia M, Xu L, Bai X-S (2020) Multiple-objective optimization of methanol/diesel dual-fuel engineat low loads: A comparison of reactivity controlled compression ignition (RCCI) and direct dual fuelstrati�cation (DDFS) strategies. Fuel 262:116673. https://doi.org/10.1016/j.fuel.2019.116673
�3. Li Z, Wang Y, Geng H, Zhen X, Liu M, Xu S, Li C (2019) Effects of diesel and methanol injection timingon combustion, performance, and emissions of a diesel engine fueled with directly injected methanoland pilot diesel. Appl Therm Eng 163. https://doi.org/10.1016/j.applthermaleng.2019.114234
�4. Liu J, Li Y, Li G, Zhu Z, He H, Liu S (2010) Effect of Pilot Diesel Quantity and Fuel Delivery AdvanceAngle on the Performance and Emission Characteristics of a Methanol-Fueled Diesel Engine. EnergyFuels 24(3):1611–1616. https://doi.org/10.1021/ef901281m
�5. Liu S, Clemente C, Hu ER, Wei T, Y (2007) Study of spark ignition engine fueled withmethanol/gasoline fuel blends. Appl Therm Eng 27(11):1904–1910.https://doi.org/10.1016/j.applthermaleng.2006.12.024
��. Mao G, Liu X, Du H, Zuo J, Wang L (2015) Way forward for alternative energy research: A bibliometricanalysis during 1994–2013. Renew Sustain Energy Rev 48:276–286.https://doi.org/10.1016/j.rser.2015.03.094
�7. Mayank CJ, Mayank J, Sumit S, Anurag B (2016) Alcohol as an Alternative Fuel in I.C. Engine: AReview. International Journal of Engineering Technical Research (IJETR) 4(2):2454–4698
��. Meyer T (2020) Decarbonizing road freight transportation – A bibliometric and network analysis.Transportation Research Part D: Transport Environment 89:102619.https://doi.org/10.1016/j.trd.2020.102619
�9. Mimi A (2008) History of Ethanol. Journalism & Mass Communications: Student Media. 6

Page 43/58
90. Most WJ, Longwell JP (1975) Single-Cylinder Engine Evaluation of Methanol - Improved EnergyEconomy and Reduced NOx. SAE International. https://doi.org/10.4271/750119
91. Naja� G, Yusaf TF (2009) Experimental investigation of using methanol-diesel blended fuels in dieselengine, Proceedings of the Fourth International Conference on Thermal Engineering: Theory andApplications, Abu Dhabi, UAE
92. Niculescu R, Clenci A, Iorga-Siman V (2019) Review on the Use of Diesel–Biodiesel–Alcohol Blendsin Compression Ignition Engines. Energies 12(7). https://doi.org/10.3390/en12071194
93. Ning L, Duan Q, Chen Z, Kou H, Liu B, Yang B, Zeng K (2020) A comparative study on the combustionand emissions of a non-road common rail diesel engine fueled with primary alcohol fuels (methanol,ethanol, and n-butanol)/diesel dual fuel. Fuel 266. https://doi.org/10.1016/j.fuel.2020.117034
94. Oasmaa A, Sundqvist T, Kuoppala E, Garcia-Perez M, Solantausta Y, Lindfors C, Paasikallio V (2015)Controlling the Phase Stability of Biomass Fast Pyrolysis Bio-oils. Energy Fuels 29(7):4373–4381.https://doi.org/10.1021/acs.energyfuels.5b00607
95. Pikonas A, Pukalskas S, Grabys J (2003) In�uence of composition of gasoline - ethanol blends onparameters of internal combustion engines. Journal of KONES Internal Combustion Engines 10:205–211
9�. Prakash KS, Sonil N, Pravakar M (2018) Recent advancements in biofuels and bioenergy utilization.Recent Advancements in Biofuels Bioenergy Utilization, 1–402.https://doi.org/10.1016/j.renene.2018.01.070
97. Pritchard A (1969) Statistical bibliography or bibliometrics. Journal of documentation 25(4):348–349
9�. Qi DH, Liu SQ, Zhang CH, Bian YZ (2005) Properties, performance, and emissions of methanol-gasoline blends in a spark ignition engine. Proceedings of the Institution of Mechanical Engineers,Part D: Journal of Automobile Engineering 219(3), 405–412.https://doi.org/10.1243/095440705x6659
99. Rakopoulos CD, Rakopoulos DC, Giakoumis EG, Kyritsis DC (2011) The combustion of n-butanol/diesel fuel blends and its cyclic variability in a direct injection diesel engine. Proceedings ofthe Institution of Mechanical Engineers, Part A: Journal of Power and Energy 225(3), 289–308.https://doi.org/10.1177/2041296710394256
100. Rakopoulos DC, Rakopoulos CD, Giakoumis EG, Papagiannakis RG, Kyritsis DC (2014) In�uence ofproperties of various common bio-fuels on the combustion and emission characteristics of high-speed DI (direct injection) diesel engine: Vegetable oil, bio-diesel, ethanol, n-butanol, diethyl ether.Energy 73:354–366. https://doi.org/10.1016/j.energy.2014.06.032
101. Rakopoulos DC, Rakopoulos CD, Kakaras EC, Giakoumis EG (2008) Effects of ethanol–diesel fuelblends on the performance and exhaust emissions of heavy duty DI diesel engine. Energy ConversManag 49(11):3155–3162. https://doi.org/10.1016/j.enconman.2008.05.023
102. Rey-Martí A, Ribeiro-Soriano D, Palacios-Marqués D (2016) A bibliometric analysis of socialentrepreneurship. J Bus Res 69(5):1651–1655. https://doi.org/10.1016/j.jbusres.2015.10.033
Page 44/58
103. RFA (2019) 2019 ethanol industry outlook
104. Rosillo-Calle F, Walter A (2006) Global market for bioethanol: historical trends and future prospects.Energy Sustain Dev 10(1):20–32. https://doi.org/10.1016/S0973-0826(08)60504-9
105. Sarathy SM, Oßwald P, Hansen N, Kohse-Höinghaus K (2014) Alcohol combustion chemistry. ProgEnergy Combust Sci 44:40–102. https://doi.org/10.1016/j.pecs.2014.04.003
10�. Sayin C, Ozsezen AN, Canakci M (2010) The in�uence of operating parameters on the performanceand emissions of a DI diesel engine using methanol-blended-diesel fuel. Fuel 89(7):1407–1414.https://doi.org/10.1016/j.fuel.2009.10.035
107. Secinaro S, Brescia V, Calandra D, Biancone P (2020) Employing bibliometric analysis to identifysuitable business models for electric cars. J Clean Prod 264.https://doi.org/10.1016/j.jclepro.2020.121503
10�. Shahir SA, Masjuki HH, Kalam MA, Imran A, Fattah IMR, Sanjid A (2014) Feasibility of diesel–biodiesel–ethanol/bioethanol blend as existing CI engine fuel: An assessment of properties, materialcompatibility, safety and combustion. Renew Sustain Energy Rev 32:379–395.https://doi.org/10.1016/j.rser.2014.01.029
109. Shen S, Cheng C, Yang J, Yang S (2018) Visualized analysis of developing trends and hot topics innatural disaster research. PLoS One 13(1):e0191250. https://doi.org/10.1371/journal.pone.0191250
110. Solomon BD, Barnes JR, Halvorsen KE (2007) Grain and cellulosic ethanol: History, economics, andenergy policy. Biomass Bioenerg 31(6):416–425. https://doi.org/10.1016/j.biombioe.2007.01.023
111. Song C (2002) Fuel processing for low-temperature and high-temperature fuel cells: Challenges, andopportunities for sustainable development in the 21st century. Catal Today 77(1):17–49.https://doi.org/10.1016/S0920-5861(02)00231-6
112. Song R, Liu J, Wang L, Liu S (2008) Performance and Emissions of a Diesel Engine Fuelled withMethanol. Energy Fuels 22:3883–3888. https://doi.org/10.1021/ef800492r
113. Subbaiah GV, Gopal KR, Hussain SA, Prasad BD, Reddy KT (2010) Rice bran oil biodiesel as anadditive in diesel-ethanol blends for diesel engines. International Journal of Recent Research andApplied Studies 3(3)
114. Surawski NC, Miljevic B, Roberts BA, Modini RL, Situ R, Brown RJ, Bottle SE, Ristovski ZD (2010)Particle Emissions, Volatility, and Toxicity from an Ethanol Fumigated Compression Ignition Engine.Environmental Science Technology 44(1):229–235. https://doi.org/10.1021/es9021377
115. Szwaja S, Naber JD (2010) Combustion of n-butanol in a spark-ignition IC engine. Fuel 89(7):1573–1582. https://doi.org/10.1016/j.fuel.2009.08.043
11�. Tian X, Geng Y, Zhong S, Wilson J, Gao C, Chen W, Yu Z, Hao H (2018) A bibliometric analysis ontrends and characters of carbon emissions from transport sector. Transportation Research Part D:Transport Environment 59:1–10. https://doi.org/10.1016/j.trd.2017.12.009
117. Tse H, Leung CW, Cheung CS (2015) Investigation on the combustion characteristics and particulateemissions from a diesel engine fueled with diesel-biodiesel-ethanol blends. Energy 83:343–350.https://doi.org/10.1016/j.energy.2015.02.030

Page 45/58
11�. Turner D, Xu H, Cracknell RF, Natarajan V, Chen X (2011) Combustion performance of bio-ethanol atvarious blend ratios in a gasoline direct injection engine. Fuel 90(5):1999–2006.https://doi.org/10.1016/j.fuel.2010.12.025
119. van Leeuwen T (2006) The application of bibliometric analyses in the evaluation of social scienceresearch. Who bene�ts from it, and why it is still feasible. Scientometrics 66(1):133–154.https://doi.org/10.1007/s11192-006-0010-7
120. Varol Y, Öner C, Öztop HF, Altun Ş (2014) Comparison of Methanol, Ethanol, orn-Butanol Blendingwith Unleaded Gasoline on Exhaust Emissions of an SI Engine. Energy Sour Part A RecoverUtilization Environ Eff 36(9):938–948. https://doi.org/10.1080/15567036.2011.572141
121. Waluyo B, Setiyo M, Saifudin, Wardana ING (2021) Fuel performance for stable homogeneousgasoline-methanol-ethanol blends. Fuel 294. https://doi.org/10.1016/j.fuel.2021.120565
122. Wu Y, Zhang X, Zhang Z, Wang X, Geng Z, Jin C, Liu H, Yao M (2020) Effects of diesel-ethanol-THFblend fuel on the performance and exhaust emissions on a heavy-duty diesel engine. Fuel 271.https://doi.org/10.1016/j.fuel.2020.117633
123. Yanju W, Shenghua L, Hongsong L, Rui Y, Jie L, Ying W (2008) Effects of Methanol/Gasoline Blendson a Spark Ignition Engine Performance and Emissions. Energy Fuels 22(2):1254–1259.https://doi.org/10.1021/ef7003706
124. Yun Y (2020) Alcohol Fuels: Current Status and Future Direction.https://doi.org/10.5772/intechopen.89788
125. Zhang M, Gao Z, Zheng T, Ma Y, Wang Q, Gao M, Sun, XJJ.o.MC, Management W (2018) Abibliometric analysis of biodiesel research during 1991–2015. 20(1), 10–18
12�. Zhang ZH, Tsang KS, Cheung CS, Chan TL, Yao CD (2011) Effect of fumigation methanol andethanol on the gaseous and particulate emissions of a direct-injection diesel engine. Atmos Environ45(11):2001–2008. https://doi.org/10.1016/j.atmosenv.2010.12.019
127. Zhao K (2019) A Brief Review of China’s Methanol Vehicle Pilot and Policy
12�. Zheng T, Wang J, Wang Q, Nie C, Smale N, Shi Z, Wang X (2015) A bibliometric analysis of industrialwastewater research: current trends and future prospects. Scientometrics 105(2):863–882.https://doi.org/10.1007/s11192-015-1736-x
129. Zhu J, Wang S, Raza M, Feng Y, Li J, Mao Y, Yu L, Qian Y, Lu X (2021) Autoignition behavior ofmethanol/diesel mixtures: Experiments and kinetic modeling. Combust Flame 228:1–12.https://doi.org/10.1016/j.combust�ame.2021.01.026
Figures

Page 46/58
Figure 1
Idealized production behavior of an oil resource. Source: Höök et al. (2009).
Figure 2
Conceptual design of current study.

Page 47/58
Figure 3
Research output on low carbon alcohol combustion in ICEs from 2000-2021.
Figure 4

Page 48/58
Top 5 journals’ dynamics with respect to time.
Figure 5
Journal co-citation analysis (Node type=citation; Threshold set at ≥500 citations; colors closer to themiddle of the node represent older publication years whereas outer colors are more recent publicationyears)

Page 49/58
Figure 6
Academic partnership amongst top authors (Node type=citations; Threshold set at ≥10; colors closer tothe middle of the node represent older publication years whereas outer colors are more recent publicationyears).

Page 50/58
Figure 7
Annual scienti�c production of top 20 authors from 2000 to 2021.
Figure 8

Page 51/58
Academic partnership amongst top institution (Node type=citations; Threshold set at ≥20; colors closerto the middle of the node represent older publication years whereas outer colors are more recentpublication years).
Figure 9
(a) Attractive Index (AAI) of ten major countries. (b) Activity Index (AI) of ten major countries.

Page 52/58
Figure 10
Academic partnership amongst top countries (Node type=citations; Threshold set at ≥20; colors closer tothe middle of the node represent older publication years whereas outer colors are more recent publicationyears).

Page 53/58
Figure 11
Research trend dynamics of the �ve continents in four different timelines. Note: The designationsemployed and the presentation of the material on this map do not imply the expression of any opinionwhatsoever on the part of Research Square concerning the legal status of any country, territory, city orarea or of its authorities, or concerning the delimitation of its frontiers or boundaries. This map has beenprovided by the authors.
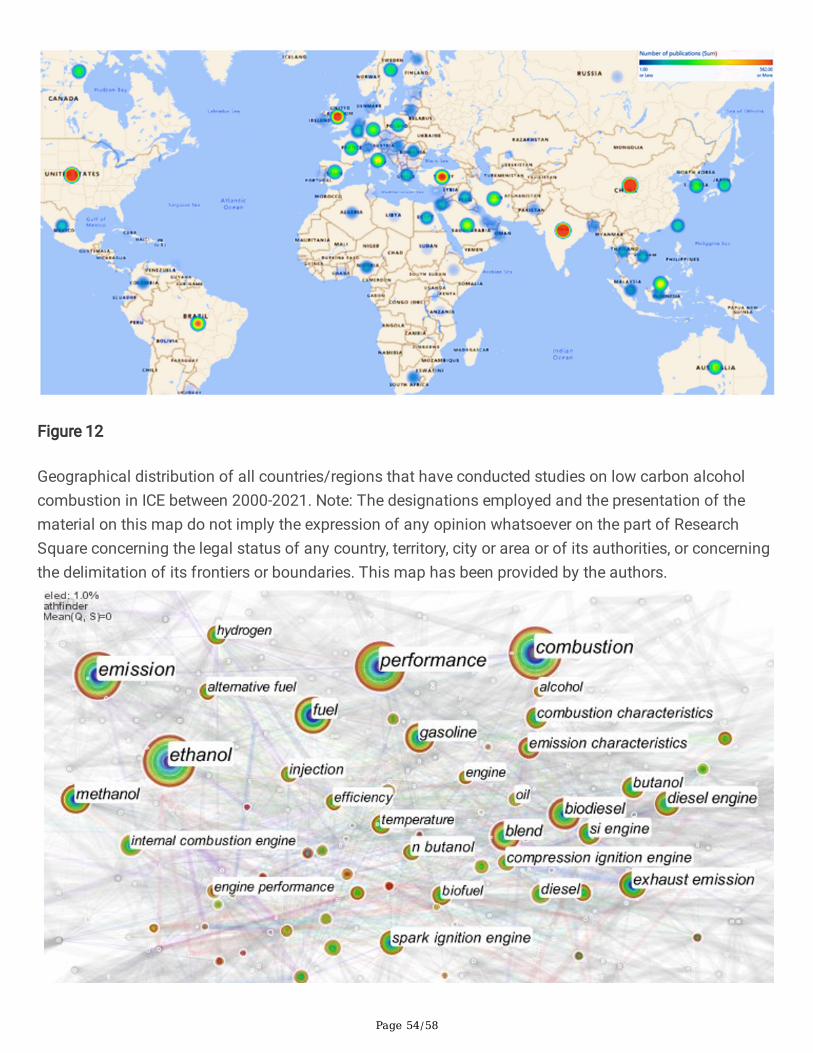
Page 54/58
Figure 12
Geographical distribution of all countries/regions that have conducted studies on low carbon alcoholcombustion in ICE between 2000-2021. Note: The designations employed and the presentation of thematerial on this map do not imply the expression of any opinion whatsoever on the part of ResearchSquare concerning the legal status of any country, territory, city or area or of its authorities, or concerningthe delimitation of its frontiers or boundaries. This map has been provided by the authors.
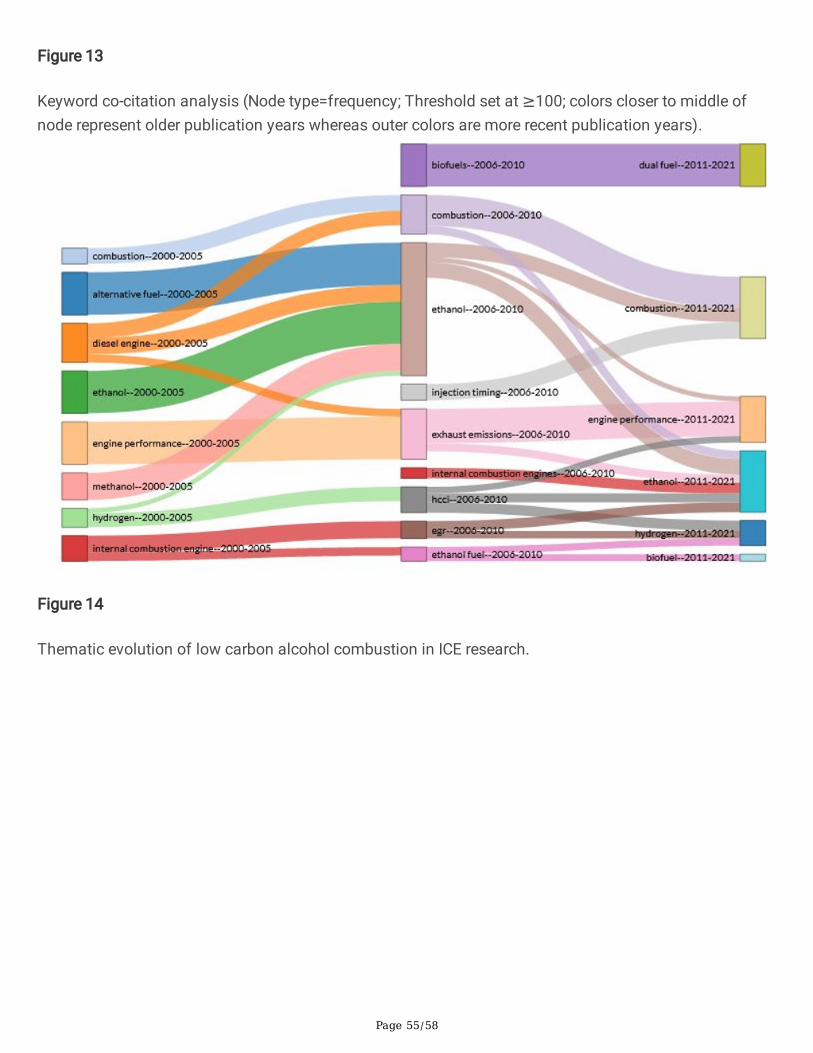
Page 55/58
Figure 13
Keyword co-citation analysis (Node type=frequency; Threshold set at ≥100; colors closer to middle ofnode represent older publication years whereas outer colors are more recent publication years).
Figure 14
Thematic evolution of low carbon alcohol combustion in ICE research.

Page 56/58
Figure 15
Main research direction of most in�uential continents from 2000 to 2021.

Page 57/58
Figure 16
Main research direction of top 10 countries and journals.
Figure 17

Page 58/58
Most co-cited local references (Node type=citations; Threshold set at ≥50; colors closer to middle of noderepresent older publication years whereas outer colors are more recent publication years).