Losing sight of the bigger picture: Peripheral field loss compresses representations of space
15
Losing sight of the bigger picture: Peripheral field loss compresses representations of space Francesca C. Fortenbaugh, John C. Hicks, Lei Hao, Kathleen A. Turano * The Wilmer Eye Institute, Johns Hopkins University, Lions Vision Center, 500 N. Broadway, 6th FL, Baltimore, MD 21205, USA Received 12 September 2006; received in revised form 4 June 2007 Abstract Three experiments examine how the peripheral visual field (PVF) mediates the development of spatial representations. In Experiment 1 participants learned and were tested on statue locations in a virtual environment while their field-of-view (FOV) was restricted to 40°, 20°, 10°, or 0° (diam). As FOV decreased, overall placement errors, estimated distances, and angular offsets increased. Experiment 2 showed large compressions but no effect of FOV for perceptual estimates of statue locations. Experiment 3 showed an association between FOV size and proprioception influence. These results suggest the PVF provides important global spatial information used in the development of spatial representations. Ó 2007 Elsevier Ltd. All rights reserved. Keywords: Visual field loss; Peripheral visual field; Spatial representation; Memory-guided walking; Distance perception 1. Introduction Previous studies have provided valuable information about the quality of visual spatial representations used for task completion (Aivar, Hayhoe, Chizk, & Mruczek, 2005; Hayhoe, Shrivastava, Mruczek, & Pelz, 2003; Hol- lingworth & Henderson, 2002; Irwin & Zelinsky, 2002), the neurological basis of spatial representations (Burgess, 2006; Committeri et al., 2004; Epstein & Kanwisher, 1998; Hartley, Maguire, Spiers, & Burgess, 2003; Shelton & McNamara, 2001), and the effect of environmental condi- tions on their development (Cutting & Vishton, 1995; Norman, Crabtree, Clayton, & Norman, 2005; Sheth & Shimojo, 2001; Wu, Ooi, & He, 2004). However, there is another important factor that has received little atten- tion: the role different regions of the visual field play in mediating the type of information that is processed and the way in which this processing occurs. The topography of the retina, which is composed of rods and cones, is known to vary systematically with distance from the fovea (Osterberg, 1935). Based on the changing ratio of rods to cones, the human visual field is often divided into two components: the central visual field and the peripheral visual field. For the purposes of this study the central visual field is defined as the area within 10° eccentricity of the fovea and the peripheral visual field as the remain- ing region of the visual field, based on the model pro- posed by Bishop and Henry (1971). To date, a few studies (Creem-Regehr, Willemsen, Gooch, & Thompson, 2005; Wu et al., 2004) have been conducted looking at the role of field of view (FOV) size on the representation of distance via the use of field restricting goggles. Yet, field restricting goggles can only control the amount of visual stimulation at any given point in time and not where that stimulation is occurring upon the retina. There are, however, two studies which have explicitly tested the influence of the central and peripheral visual fields on the nature of spatial localiza- tion during online perception. The first, completed by Turano and Schuchard (1991), had participants with nor- mal vision, peripheral field losses, or central field losses make relative distance judgments while sitting in one 0042-6989/$ - see front matter Ó 2007 Elsevier Ltd. All rights reserved. doi:10.1016/j.visres.2007.06.012 * Corresponding author. Fax: +1 410 955 1829. E-mail address: [email protected] (K.A. Turano). www.elsevier.com/locate/visres Vision Research 47 (2007) 2506–2520
Transcript of Losing sight of the bigger picture: Peripheral field loss compresses representations of space

www.elsevier.com/locate/visres
Vision Research 47 (2007) 2506–2520
Losing sight of the bigger picture: Peripheral field losscompresses representations of space
Francesca C. Fortenbaugh, John C. Hicks, Lei Hao, Kathleen A. Turano *
The Wilmer Eye Institute, Johns Hopkins University, Lions Vision Center, 500 N. Broadway, 6th FL, Baltimore, MD 21205, USA
Received 12 September 2006; received in revised form 4 June 2007
Abstract
Three experiments examine how the peripheral visual field (PVF) mediates the development of spatial representations. In Experiment1 participants learned and were tested on statue locations in a virtual environment while their field-of-view (FOV) was restricted to 40�,20�, 10�, or 0� (diam). As FOV decreased, overall placement errors, estimated distances, and angular offsets increased. Experiment 2showed large compressions but no effect of FOV for perceptual estimates of statue locations. Experiment 3 showed an associationbetween FOV size and proprioception influence. These results suggest the PVF provides important global spatial information used inthe development of spatial representations.� 2007 Elsevier Ltd. All rights reserved.
Keywords: Visual field loss; Peripheral visual field; Spatial representation; Memory-guided walking; Distance perception
1. Introduction
Previous studies have provided valuable informationabout the quality of visual spatial representations usedfor task completion (Aivar, Hayhoe, Chizk, & Mruczek,2005; Hayhoe, Shrivastava, Mruczek, & Pelz, 2003; Hol-lingworth & Henderson, 2002; Irwin & Zelinsky, 2002),the neurological basis of spatial representations (Burgess,2006; Committeri et al., 2004; Epstein & Kanwisher, 1998;Hartley, Maguire, Spiers, & Burgess, 2003; Shelton &McNamara, 2001), and the effect of environmental condi-tions on their development (Cutting & Vishton, 1995;Norman, Crabtree, Clayton, & Norman, 2005; Sheth &Shimojo, 2001; Wu, Ooi, & He, 2004). However, thereis another important factor that has received little atten-tion: the role different regions of the visual field play inmediating the type of information that is processed andthe way in which this processing occurs. The topographyof the retina, which is composed of rods and cones, is
0042-6989/$ - see front matter � 2007 Elsevier Ltd. All rights reserved.doi:10.1016/j.visres.2007.06.012
* Corresponding author. Fax: +1 410 955 1829.E-mail address: [email protected] (K.A. Turano).
known to vary systematically with distance from the fovea(Osterberg, 1935). Based on the changing ratio of rods tocones, the human visual field is often divided into twocomponents: the central visual field and the peripheralvisual field. For the purposes of this study the centralvisual field is defined as the area within 10� eccentricityof the fovea and the peripheral visual field as the remain-ing region of the visual field, based on the model pro-posed by Bishop and Henry (1971).
To date, a few studies (Creem-Regehr, Willemsen,Gooch, & Thompson, 2005; Wu et al., 2004) have beenconducted looking at the role of field of view (FOV) sizeon the representation of distance via the use of fieldrestricting goggles. Yet, field restricting goggles can onlycontrol the amount of visual stimulation at any givenpoint in time and not where that stimulation is occurringupon the retina. There are, however, two studies whichhave explicitly tested the influence of the central andperipheral visual fields on the nature of spatial localiza-tion during online perception. The first, completed byTurano and Schuchard (1991), had participants with nor-mal vision, peripheral field losses, or central field lossesmake relative distance judgments while sitting in one
F.C. Fortenbaugh et al. / Vision Research 47 (2007) 2506–2520 2507
location. Results of this study found that participantswith either type of field loss exhibited higher levels ofspatial localization error than normal vision participants.However, due to the fact that multidimensional scalingwas used to analyze the data, it is not possible to deter-mine whether there were any systematic trends in theerrors exhibited by the participants with field losses.The second study (Temme, Maino, & Noell, 1985) exam-ined perceived eccentricity in observers with normalvision and observers with early stages of retinitis pigmen-tosa (RP), a retinal disease that leads to peripheral fieldlosses. Using a Goldmann perimeter to measure the per-ceived eccentricity of flashes of light, Temme and col-leagues discovered that the eccentricity participantsperceived to be 25% of the distance from fixation tothe boundary of their visual fields was in fact a magnifi-cation of the true eccentricity. More importantly, how-ever, the true eccentricity was significantly differentbetween the two groups, with normal-vision participantsjudging points lying 16% of the distance from fixationto reside at the quarter mark while similar judgmentswere made by the participants with RP for points lyingonly 8% of the distance from fixation. In other words,decreasing visual field size led to an expansion of spacearound the point of fixation.
Understanding the role that the central and peripheralvisual fields play in the development of spatial representa-tions is important for three reasons. First, spatial informa-tion is processed and/or perceived differently depending onthe region of the retina where it is received (Banks, Sekuler,& Anderson, 1991; Goldstein, 2002; Mullen, Sakurai, &Chu, 2005). The loss of one region may therefore alterthe initial development of any spatial representation. Sec-ond, the central and peripheral visual fields also differ interms of their cortical representations in primary occipitalcortex (Horton & Hoyt, 1991; Johnston, 1986; Wandell,Brewer, & Dougherty, 2005) and in higher processing areassuch as the dorsal and ventral visual streams (Baizer,Ungerleider, & Desimone, 1991; Portin & Hari, 1999;Stephen et al., 2002). Thus, loss of the peripheral visualfield may not only lead to sensory deficits, it may also affectthe development of spatial representations over time lead-ing to increased distortions in spatial representations thatare not apparent in perception. Finally, it is known thatindividuals with peripheral visual field losses from retinaldiseases show marked deficits in their ability to carry outdaily life activities, such as driving a car or navigating inunfamiliar environments (Szlyk et al., 1997; Turano,Geruschat, & Stahl, 1998). Understanding any systematicchanges in spatial representations following loss of theperipheral visual field may help to shed light on the mech-anisms underlying such deficits.
The current study sought to investigate the effect thatdecreasing visual field size has on the nature of short-termspatial representations of objects within a three-dimen-sional environment. In order to do so it was necessary tocreate a new paradigm in which the amount of stimulation
to the central and peripheral visual fields could be system-atically controlled. The solution to this problem involvedthe use of an immersive virtual reality system that allowsfor gaze-contingent FOV masking while still allowing par-ticipants the ability to move around the environment. Avirtual replication of the laboratory was created in orderto provide participants with a familiar sense of scale withinthe virtual environment and six replicas of the same statue,each differing in terms of size and color, were placedthroughout the room. The degree to which the participants’peripheral visual fields were stimulated was systematicallycontrolled by restricting each participant’s FOV to one offour sizes (0�, 10�, 20�, or 40� in diameter) throughoutthe experiment. Thus, by the operational definition usedin the present study, participants in the 10� FOV conditionwere required to complete the task with only their centralvisual field while participants in the 20� and 40� FOV con-ditions were afforded the use of part of their peripheralvisual fields. The group with a 0� FOV served as a controlgroup. After learning the locations of the statues by walk-ing around the environment, the statues were removed andparticipants were required to walk to the locations theybelieved each statue had been located using the sameFOV restriction that they had during the Learning Phase.Given the results of studies in which participants walkwithout vision to remembered target locations (Loomis,Da Silva, Fujita, & Fukusima, 1992; Loomis & Knapp,2003), this method should result in spatial representationsapproaching a Euclidean metric under full FOV conditionsas all statues were located within 13 m of the starting posi-tion and external visual cues provided by the global struc-ture of the environment were available throughout theTesting Phase. However, based on results from studiesinvestigating the effects of peripheral field losses on percep-tual spatial localization ability (Temme et al., 1985; Turano& Schuchard, 1991), it was predicted that decreases in FOVwould lead to increasingly distorted representations of thestatue locations.
2. Experiment 1
2.1. Methods
2.1.1. Participants
Twenty-eight healthy volunteers (seventeen women) par-ticipated in the current study. The mean age of the partic-ipants was 29 years old (SD = 9.23), with a range of 20–53years old. No participant had any ocular diseases or mus-cular-skeletal disorders. All participants were compensatedfor their time and this research followed the tenets of theDeclaration of Helsinki.
Visual function (visual acuity and contrast sensitivity)was tested binocularly with participants wearing their nor-mal corrective lenses to ensure each participant had normalvision. The pupillary distance of each participant was mea-sured and used to adjust the position of the displays in theheadset to obtain a stereo view of the environment.

2508 F.C. Fortenbaugh et al. / Vision Research 47 (2007) 2506–2520
2.1.2. Stimuli
An immersive virtual replication of the laboratory (seeFig. 1) was created using 3D Studio Max software (Dis-creet, Montreal, Canada). The replication was used inorder to give the participants a familiar sense of scale inthe environment and to prevent the experimenter from hav-ing to interfere with the participant’s walking patterns dur-ing the testing phase, as all of the walls and supportcolumns present in the real laboratory were representedin the same locations in the virtual environment. Six copiesof the same statue were used as targets. The statues all dif-fered in their size, ranging from 1.6 to 3 m tall, and in theircolors. In order to assure their colors were easily discrimi-nable, the statues were colored red, purple, dark blue, cyan,green, and yellow, corresponding to the three primary huesand their complements (Palmer, 1999). The statues wereplaced throughout the environment and their distance fromthe starting position ranged from 2.7 to 11.1 m. The pro-
Fig. 1. The virtual environment. The top panel shows a first-person viewof one end of the environment. The bottom panel shows a top-down viewof the environment. The starting position is the red and white bull’s-eyeand the two black rectangles represent support columns that were presentin the real and virtual environments.
gram was exported to a graphics engine developed in-housewith C++ and Microsoft’s DirectX. The graphics programused the output from a HiBall head tracker (3rd Tech,Chapel Hill, NC) attached to the top of the head-mounteddisplay (HMD) together with the imported scene to deter-mine the subject’s current point of view in the environment.Perspective views of the environment were displayed in theHMD using a GeForce FX graphics board (nVIDIA,Santa Clara, CA).
FOV restrictions of 40�, 20�, or 10� (diameter) were cre-ated using the gaze-contingent display concept of Geislerand Perry (2002) together with the programmable function-ality of the nVIDIA GeForce FX5900 GPU (software byco-author JH; see (Fortenbaugh, Hicks, Hao, & Turano,in press). A mask of a certain visual field size was createdas a monochrome bitmap, where the intensity of each pixelindicated the degree to which the view was blurred at thatpoint. The center position of the mask was tethered to theparticipant’s center of gaze, which was determined from anonline analysis of the participant’s eye images. The maskwas partitioned into 8 grey level bins, and the 2D perspec-tive view of the scene was down-sampled iteratively to pro-duce a corresponding set of 8 increasingly blurred images,which were multiplied with the mask levels and combinedto produce the final image.
2.1.3. Apparatus
Head and eye tracking. A HiBall-3000 Optical Tracker(3rd Tech, Chapel Hill, NC) was used to monitor headposition and orientation. Infra-red LEDs were housed onthe ceiling tiles of the testing room and their signals weredetected by optical sensors mounted in a holder that wasattached to the top of the headset. Head position and ori-entation were sampled every 7 ms. Tracker resolution isreported to be 0.2 mm, with an angular precision less than0.03�. The output of the head tracker was filtered using anexponential smoothing function with an 80 ms time con-stant. Point of view was calculated from the head positionand orientation data collected. Daubechies wavelet trans-form of the sixth order, Db6 (Ismail & Asfour, 1999),was applied to the data from the head-tracker to filterout the oscillations associated with gait and to determinewalking path.
Eye tracking was performed using software developedin-house by co-author LH on the output of camerashoused within the headset in front of each eye. The sam-pling rate of the eye tracking system is 60 Hz and the aver-age spatial variability has been measured at 0.52�. Tominimize processing time, pupil tracking was performedwith the identification of the centre of mass of a thresholdvalue within a specified region-of-interest. A 5-point cali-bration was performed prior to beginning the LearningPhase. This involved presenting the participants with ascreen containing five crosses, one at the center and oneby each corner of the screen. Participants made fixationsto each cross and this position was recorded. Drift-correc-tion calibrations were performed every few minutes or as

Table 1Outline of experimental designs
LearningPhase
Number ofstatues
ResponseType
Effect ofFOV?
Experiment 1 Walk 6 Walk Yes
Experiment 2 Stand 6 Verbal NoWalk 1 Blind walk No
Experiment 3 Stand 6 Blind walk YesWalk 6 Blind walk No
F.C. Fortenbaugh et al. / Vision Research 47 (2007) 2506–2520 2509
needed during the experiment by waiting until the partici-pant returned to the starting position during the task andthen briefly showing the calibration crosses and havingthe participant fixate on the center cross. As the partici-pants’ eyes were displayed on a computer screen through-out testing, it was possible to continuously monitormovement of the headset.
Head-mounted display. The display device was a head-mounted display system (a modified Low Vision Enhance-ment System developed by Robert Massof at the WilmerEye Institute). The headset contained two color microdis-plays (SVGA, 800 · 600 3D OLED Microdisplay, EmaginCorp). Each display was 51� (H) · 41� (V), with spatial res-olution approximately 0.06�/pixel. The displays have arefresh rate of 60 Hz. Spatially offset images were sent toeach display producing a stereo view with 100% overlap.
2.1.4. Design and procedure
After visual testing was completed, the participants werebrought into the laboratory and fitted with the headset. Inorder to assure that the participants were able to fuse theimages, a blank screen with a red dot in the center wasshown. Participants adjusted the resolution for each screenand the experimenter adjusted the placement of each screenin front of the participants’ eyes until the participants suc-cessfully fused the two dots. Participants were asked topoint in the direction of the dot in order to check that theyperceived the dot at their midlines (i.e. that the headset wascentered in front of their eyes). All of the participantsexcept those in the 0� FOV control group were given threepractice trials in an unrelated environment in order forthem to become accustomed to walking in a virtual envi-ronment and help recalibrate their motor systems to anyperceptual distortions resulting from the virtual reality sys-tem. The practice trials were completed without any FOVrestriction, thereby only allowing participants to accommo-date to being in an immersive virtual environment and notthe loss of their peripheral vision.
A between-subjects design was used to prevent anyorder effects from occurring. After the practice trials werecompleted, the participants were led to the starting positionby the experimenter, and the initial calibration for the eyetracking was performed (with the exception of the blind-walking control group who performed the entire task with-out any images on the display). The starting position wasmarked on the floor with a red and white bulls-eye thatwas visible throughout the experiment and could serve asa cue to the starting position. All participants were toldto pay attention to both the environment and the objectslocated within it as they would be asked about them later.Participants were also informed that when they walked to astatue they should walk to the center (inside) of each statueat which point the display of the headset would begin flash-ing the color of the statue.
The experiment consisted of a Learning Phase and aTesting Phase (see Table 1). During the Learning Phaseparticipants completed a predetermined walking path.
First, the participants walked from the starting positionto each statue and back, in order to learn where the statueswere located relative to the starting position. Then the par-ticipants walked from each statue to every other statue andthe starting position such that each distance was traversedexactly once. This gave the participants a chance to learnwhere the statues were located relative to one another.For the latter part, two distinct walking patterns were usedand alternated across participants within each of the fourFOV conditions tested. Participants in the blind-walkingcontrol group were led along the exact same paths as theparticipants in the other groups by one of the experiment-ers. At each stop the experimenter said the name of theobject at that location (either the color of the statue or‘‘the starting position’’). To assure that the participantswalked to the correct locations, the experimenters moni-tored the current position of the participants in the virtualenvironment on two monitors in the laboratory.
Once the Learning Phase was completed, the partici-pants were turned away from the statues and the experi-menter pressed a button to make the statues disappear.The participants were then turned back to the starting ori-entation and required to walk out from the starting posi-tion and stand where they thought each statue had beenlocated in a predetermined order. After walking to eachlocation the participant stood still and told the experi-menter that they were standing in the correct location, atwhich time the experimenter pressed a button to makethe statue appear in that location and to record the loca-tion of the statue. After placing each statue the participantsreturned to the starting position and orientation beforeplacing the next statue. Again, the participants in theblind-walking control group performed the same task asparticipants in the other conditions. However, the experi-menter led the participants in this condition back to thestarting position and orientation after placing each statue.An experimenter walked next to the participants through-out the experiment to assure that they did not walk tooclose to any of the walls in the real environment. No par-ticipant had to be redirected by an experimenter duringthe Testing Phase. Two orders for placing the six statueswere alternated across participants in each of the fourFOV conditions tested. After all six statues had beenplaced the participants had the opportunity to move anyof the statues they thought were incorrectly located. Thiswas done in order to allow the participants to use the

2510 F.C. Fortenbaugh et al. / Vision Research 47 (2007) 2506–2520
statues as reference points for one another and to help pre-vent any order effects from occurring due to the fact thatstatues early in the pattern were placed without the benefitof the other statues being visible.
2.2. Results
2.2.1. Behavioral measures
Fig. 2 shows the average estimated locations of the sixstatues for the four FOV sizes tested. Placement errors,the distance between the estimated statue location andthe true statue location, were calculated for each statue.A one-way ANOVA calculated for mean placement errorswith FOV as a between-subjects factor showed a significanteffect of FOV, F(3, 24) = 5.67, p < .01. A trend analysisshowed a significant linear relationship with placementerrors increasing monotonically with decreasing FOV size,F(1, 2) = 14.67, p < .01.
As distance estimates are the most common measureused in studies examining the metric of visual space (Cre-em-Regehr et al., 2005; Loomis & Knapp, 2003; Loomiset al., 1992; Philbeck, O’Leary, & Lew, 2004; Wagner,1985), the placement errors were converted into polar coor-dinates with the starting position as the origin and twomeasures were assessed: distance errors and angular offseterrors relative to the starting position. Distance errors weredefined as the difference between the estimated distanceand the true distance from the starting position to each sta-tue. As previous research (Wagner, 1985) has shown thaterrors in perceptual estimates increase with distance froman observer and all statue location estimates were madefrom the starting position, the statues were also dividedinto two groups: Near-Space statues (the three closest stat-ues under 5 m from the starting position) and Far-Space
0
2
4
6
8
10
12
14
0 2 4 6 8 10 12
0deg FOV
10deg FOV
20deg FOV
40deg FOV
Y-C
oo
rdin
ate
(m)
X-Coordinate (m)
Fig. 2. Behavioral measures for Experiment 1. Mean estimated locationsof the six statues for each of the four FOV conditions tested. The blacksquare is the starting position and the black circles represent the truestatue locations. Error bars represent ± 1SEM.
statues (the three farthest statues over 7 m from the startingposition). This allowed for the inspection of a FOV · Dis-tance interaction while controlling for the location of thestatues relative to the global structure of the environment.The mean distance errors for the four FOV sizes tested forthe Near- and Far-Space statues are shown in Fig. 3a. A4(FOV) · 2(Statue Distance) mixed-design ANOVA calcu-lated for the distance errors showed the same pattern ofresults seen for placement errors with a significant effectof FOV, F(3,24) = 3.36, p = .04. Also, a significant effectof Statue Distance was observed, F(1, 24) = 48.82,p < .01. The FOV · Statue Distance interaction did notreach significance, F(3, 24) = 2.89, p = .06, but inspectionof Fig. 3a shows a tendency for distances to the statuesto be increasingly underestimated as FOV decreases forthe Far-Space statues but not the Near-Space statues.1
In order to assess whether the errors in estimated statuedistances represented significant compressions, the meansfor the eight conditions were compared to hypotheticalmeans of zero using a Sidak–Bonferroni correction formultiple testing (aS-B = 0.0064). Results of two-tailedt-tests showed that mean distance errors were not signifi-cantly different than zero for the Near-Space statues(p > .07 for all FOV sizes) but were significantly less thanzero for the Far-Space statues in all FOV conditions exceptthe 40� FOV condition (p < .005 for the 0, 10, and 20 FOVconditions; p = .012 for the 40� FOV condition).
Fig. 3b shows the mean angular offsets for the FOV sizestested as a function of Statue Distance. Results of another4(FOV) · 2(Statue Distance) mixed-design ANOVAshowed a significant effect of FOV, F(3,24) = 4.218,p = .02, with mean angular offsets increasing with decreas-ing FOV size. A significant increase in mean angular offsetsfor Near-Space statues relative to Far-Space statues wasalso found, F(1, 24) = 10.34, p < .01. No FOV · StatueDistance interaction was found, F(3,24) = 0.51, p > .68.
2.2.2. Gaze strategies
In order to investigate whether participants in differentconditions attempted to compensate for the loss of theirperipheral vision with different sampling strategies, allobjects in the environment were classified into five groups:statues, walls, ground, columns, and sky. To control forindividual differences in walking speed, and thus the num-ber of fixations made over the course of the experiment, theproportion of fixations made to each of the five categorieswas calculated for every participant. Fig. 4 shows the meanproportion of fixations for each category as a function ofFOV for the Learning Phase. Because the data for thesemeasures are ipsative (sum of proportions across categoriesmust equal 1), the analyses were focused on the a priori
1 It should be noted that when all of the behavioral measure analyses inthis experiment were calculated with the data from the blind control groupexcluded, the FOV · Statue Distance was found to be significant for themean distance errors (F(2,18) = 5.05, p = .02). The significance of theresults from all other analyses did not change.

0
2
4
6
8
10
12
14
0 10 20 30 40
Mea
n A
ng
ula
r O
ffse
t (d
eg)
FOV (deg)
-2
-1.5
-1
-0.5
0
0.5
1M
ean
Dis
tan
ce E
rro
r (m
)
Near Statues
Far Statues
a
b
ig. 3. Behavioral measures for Experiment 1. (a) Mean distance errors ineters as a function of FOV and Statue Distance (Near, Far). Positive y-
alues indicate an overestimation of distance and negative y-valuesdicate distances were underestimated. (b) Mean absolute angular offsetsdegrees as a function of FOV and Statue Distance. Error bars represent1SEM and FOV is in degrees of visual angle.
0
0.1
0.2
0.3
0.4
0.5
0 10 20 30 40 50
StatuesWallsGroundColumnsSky
Pro
po
rtio
n o
f T
ota
l Fix
atio
ns
FOV (deg)
Fig. 4. Gaze strategies for Experiment 1. Mean proportion of fixationsmade to each of the five object categories (statues, walls, ground, columns,and sky) as a function of FOV for the Learning Phase. Error barsrepresent ± 1SEM and FOV is in degrees of visual angle.
F.C. Fortenbaugh et al. / Vision Research 47 (2007) 2506–2520 2511
Fmvinin±
question of changes in mean proportion of statue fixations.If participants stopped using cues from the global structureof the environment (i.e. switched from an allocentric cod-ing strategy to a more egocentric-direction one) it was pre-dicted that the proportion of statue fixations wouldincrease with decreasing FOV size. Overall, the oppositepattern was observed with the proportion of statue fixa-tions decreasing with FOV size. However, a one-wayANOVA calculated for the proportion of statue fixationsdid not show a significant effect of FOV, F(2,18) = 2.73,p = .09.
2.3. Discussion
Overall, the results illustrate the important role theperipheral visual field plays in the development of spatial
representations and demonstrates that increasing loss ofthe peripheral visual field leads to greater distortions inrepresentations of remembered target locations as mea-sured by overall placement errors. Further analyses showedthe distortion to be present in both the representation ofthe distances to the statues and the statue orientations rel-ative to the starting position. While there was no systematicdistortions in the estimated distances to the Near-Spacestatues, distance estimates to the Far-Space statues weresignificantly compressed across all FOV sizes tested withthe exception of the 40� FOV condition, which approachedsignificance. This suggests a heterogeneous compression ofdistances that increased with the true distances to the stat-ues. Though the increase in angular offset errors withdecreasing FOV size for the Far-Space statues is consistentwith this interpretation, angular offset errors were also seento increase with decreasing FOV size for the Near-Spacestatues. Some angular offset error is expected from the par-ticipants’ paths due to idiosyncratic walking patterns, withlarger angular offsets for the Near-Space statues for a givenlateral displacement. The large angular errors seen for the0� FOV control group can, for the most part, be attributedto the performance of one participant in particular whoseangular offsets for two statues were approximately 40�and 60�. These large offsets far exceeded those of the otherparticipants in the control group (range of 1–20�) and theparticipants in the other groups (range 0.05–21�). Inspec-tion of the angular offsets errors for the Near Space statuesfor the 10�, 20�, and 40� FOV conditions show a muchshallower increase with decreasing FOV and thus, themajority of the increase in placement errors with decreasingFOV size appears to be attributable to the heterogeneouscompression of distance.
Given that the participants with smaller FOV sizes couldin theory have sampled the same amount of visual informa-

2512 F.C. Fortenbaugh et al. / Vision Research 47 (2007) 2506–2520
tion over the course of multiple fixations and the differencesin gaze patterns across FOV sizes did not reach significance,the present results suggest that there is something about theinformation received by the peripheral visual field that iscritical for the development of accurate spatial representa-tions. What the results cannot immediately address is whenin the development of spatial representations does the loss ofvisual input to the peripheral visual field result in distortionsof the kind presently observed.
Spatial representations arise from the integration ofinformation obtained over time, and thus, over multiplefixations. Therefore, errors observed in the representationsthemselves could occur either at the level of perception orin memory. As a result of this, another question that needsto be addressed is whether the measures used in the presentstudy reveal distortions in the participants’ on-line percep-tions of space while completing the task or if the observeddistortions occurred later. This question is inherent inmany paradigms, such as those employed by Loomis andcolleagues (Loomis et al., 1993; Loomis, Klatzky,Golledge, & Philbeck, 1999; Loomis & Knapp, 2003; Philbeck,O’Leary, & Lew, 2004) where participants are required towalk without vision to the remembered location of a target,and is important to consider because Sheth and Shimojo(2001) argue that visual space is compressed in memory.Specifically, Sheth and Shimojo found during a localizationtask that participants estimated target locations to be clo-ser to salient landmarks or compressed target locationstowards the fovea if an external landmark was absent.However, given that the participants in Sheth and Shim-ojo’s study viewed targets on a 2-D computer screen andwere only required to briefly remember the location ofone target at a time it is not clear if their results are com-parable to the distortions found in the present study.
3. Experiment 2
In order to try and dissociate whether the distortionsobserved in the present study were related to perceptualdeficits associated with loss of visual input to the peripheralvisual field or if the distortions arose during the consolida-tion of visual information into a representation of the envi-ronment, a second experiment was conducted. Thisexperiment attempted to isolate two components. First,in order to directly test whether loss of the peripheral visualfield causes distortions in the on-line perception of dis-tance, participants were required to make verbal distanceand height judgments while viewing statues with one ofthree restricted FOV sizes. In the second part of the exper-iment, a blind walking paradigm (Loomis & Knapp, 2003;Loomis et al., 1993, 1999; Philbeck, O’Leary, & Lew, 2004)was employed in order to test whether distortions are pres-ent in memory immediately following target viewing. Whileit has been argued that this paradigm taps into perceptualdistortions of distance, the fact that participants must walkto estimated target locations without vision suggests amemory component. Furthermore, as other researchers
(Diedrichsen, Werner, Schmidt, & Trommershauser,2004; Werner & Diedrichsen, 2002) have shown distortionsin remembered target locations as soon as 50 ms after view-ing targets on a computer screen, it may be that distortionsof target locations occur during encoding in short-termmemory and, thus, should manifest by the time partici-pants walk to a specific location.
3.1. Methods
3.1.1. Participants
Six healthy volunteers (three women) participated in thestudy. The mean age of the participants was 35 years(SD = 11.16), with a range of 24–52 years. As in Experi-ment 1, the participants reported no ocular diseases ormuscular-skeletal disorders and were tested to assure thatthey had normal vision. The participants were compen-sated for their time and gave written consent.
3.1.2. Stimuli
The same environment as in Experiment 1 was usedhere. However, because a within-subject design was uti-lized, three unique statue configurations were created forthe statues’ locations in order to prevent learning acrossblocks. Also, the sizes of the statues were varied in orderto prevent the participants from using the relative size ofthe statues as a distance cue from one block to another.The heights of the statues ranged from 1.01 to 3.37 macross all three configurations. To allow for direct compar-ison across the three configurations, each configurationwas designed such that there was always a statue located2.2, 4, and 6.9 m away from the starting position (theremaining three statues distances varied but the distanceto the starting position was always between 2 and 7.7 m).For the 2.2, 4, and 6.9 m statues, the size, color, and angu-lar offset of the statues relative to the starting position andorientation were also varied across the three configura-tions. This was done to help prevent participants fromnoticing that certain distances were repeated.
3.1.3. Apparatus
The same equipment used in Experiment 1 was usedhere.
3.1.4. Design and procedure
No practice trials were completed for this experimentand the same environment from Experiment 1 was usedhere. A within-subjects design was used with participantscompleting each of the three blocks with one of threeFOV sizes (10�, 20�, or 40�). In each block there were sixstatues of different heights and colors located in the envi-ronment. Though the same six colors were used in eachblock, the sizes and locations of the statues varied acrossthe blocks. Each block consisted of two tasks (see Table1). For the first task, the participants estimated the distanceto and height of each statue when prompted by the exper-imenter. Then, the participants were required to estimate

F.C. Fortenbaugh et al. / Vision Research 47 (2007) 2506–2520 2513
the distance between six pairs of statues. Throughout thefirst part of each block, participants were allowed to movetheir eyes and heads freely or rotate their bodies to theright or left in order to align themselves towards a statuebut they were not allowed to take a step in any direction.Participants were asked to give their estimates in feet andround their estimates to the nearest tenth or fraction of afoot (e.g. ‘‘5.5 feet’’ or ‘‘5 and 1/2 feet’’). Participants wereshown a 12’’ ruler before putting on the headset and alsoreminded that they would be the same height in the virtualenvironment that they are in the real world.
For the second task, the screen of the headset wasblanked. The experimenter then said the color of a statueand the environment reappeared with only that statue vis-ible (in its original location). The participants then had 5 sto find the statue. After 5 s, the screen of the headset wasblanked again and the participants were required to walkout from the starting position and stand where theythought the statue had been located. When the participantreached the estimated location they verbally signaled to theexperimenter who pushed a button to record the estimatedlocation. The experimenter then guided the participantback to the starting position and orientation. This ‘‘blindwalking’’ was completed for the three statues that wereplaced 2.2, 4, and 6.9 m from the starting position.
The order in which the FOV sizes were tested was par-tially-counterbalanced across participants. The order inwhich the three statue configurations were paired withthe three FOV sizes tested was controlled such that eachFOV size was tested with each configuration twice.
3.2. Results
3.2.1. Perceptual estimates
Fig. 5a shows the mean errors for the distance estimatesas a function of FOV and Statue Distance. A 3(FOV) ·2(Statue Distance) repeated-measures ANOVA was calcu-lated on the mean distance errors using the same NearSpace versus Far Space criterion established in Experiment1. The FOV · Statue Distance interaction, F(2, 10) = 0.39,p = .69 was not significant and there was no main effectof FOV, F(2, 10) = 0.95, p = .42. A significant effect of dis-tance was found with larger underestimations for the threeFar-Space statues than the three Near-Space statues,F(1, 5) = 19.76, p < .01. In order to assess whether themean distance errors were significant compressions of thetrue distances, the means were compared to hypotheticalmeans of zero using two-tailed t-tests and a Sidak–Bonfer-roni correction for multiple testing (aS-B = 0.0085). In allsix conditions significant compressions of distances wereobserved (p < .002 for all).
Fig. 5b shows the mean errors for the height estimatesas a function of FOV and Statue Distance. A 3(FOV) ·2(Statue Distance) repeated-measures ANOVA was calcu-lated on the mean height errors. No FOV x Statue Distanceinteraction was found, F(2,10) = 0.56, p = .59. There wasalso no main effect of FOV, F(2,10) = 1.54, p = .26, or Sta-
tue Distance, F(1, 5) = 1.30, p = .31. Tests of the meanheight errors against hypothetical means of zero usingtwo-tailed t-tests and a Sidak–Bonferroni correction formultiple testing (aS-B = 0.0085) showed no evidence for sys-tematic errors in height estimates (p > .40 for allconditions).
Fig. 5c shows the mean errors for the judgments of thedistances between pairs of statues as a function of FOV.A repeated-measures ANOVA was calculated for the meandistance-between errors across the three FOV sizes tested.No effect of FOV was found, F(2, 10) = 0.157, p = .86.When tested against hypothetical means of zero usingtwo-tailed t-tests and a Sidak–Bonferroni correction formultiple testing (aS-B = 0.017), significant compressions ofthe estimated distances between statues was found for allthree FOV sizes (p < .01 for all).
3.2.2. Path integration
Fig. 5d shows the mean placement errors for the threeblind walks completed by the participants. A 3(FOV) ·3(Path Distance) repeated-measures ANOVA was run onthe placement errors for all nine conditions. No interactionwas found between FOV and Path Distance, F(4,20) =1.95, p = .14. There was no main effect of FOV,F(2, 10) = 0.35, p = .71, but there was a main effect of PathDistance, F(2,10) = 11.98, p < .01, with placement errorsincreasing as the true distance increased.
Interestingly, when the placement errors were brokeninto distance errors and angular offset errors, no maineffects of FOV and Path Distance or FOV x Path Distanceinteractions were found (p > .10 for all). The mean distanceerrors for each condition were tested against a hypotheticalmean of zero using two-tailed t-tests and applying a Sidak–Bonferroni correction for multiple testing (aS–B = 0.006).Only the distance errors for the 2.2 m statue in the 20�FOV condition was found to be significantly different thanzero (p = .006 for 20� FOV at 2.2 m statue; p > .02 for allothers).
3.3. Discussion
The results of Experiment 2 showed no overall effect ofFOV in any of the measurements taken. Significant com-pressions of estimated distances were observed in the per-ceptual judgments for distances to the statues from thestarting position and distances between pairs of statues.Also, the distance errors showed the same pattern of com-pression observed in the first experiment, with largerunderestimations for the Far-Space statues relative to theNear-Space statues. On the other hand, height estimateswere found to be relatively accurate across all three fieldsof view tested. Collectively, these results are consistent withprevious studies showing a general compression of percep-tual distance estimates in virtual environments (Creem-Regehr et al., 2005; Loomis & Knapp, 2003; Messing &Durgin, 2005; Sahm, Creem-Regehr, Thompson, &Willemsen, 2005; Witmer & Kline, 1998) and psychophysical

-3
-2.5
-2
-1.5
-1
-0.5
0
0 10 20 30 40 50
Near Statues
Far Statues
Mea
n D
ista
nce
Err
or
(m)
FOV (deg)
-3
-2.5
-2
-1.5
-1
-0.5
0
0 10 20 30 40 50 1 2 3 4 5 6 7 8
Mea
n D
ista
nce
-Bet
wee
n E
rro
r (m
)
FOV (deg)
-0.4
-0.2
0
0.2
0.4
0.6
0 10 20 30 40 50
Near StatuesFar Statues
Mea
n H
eig
ht
Err
or
(m)
FOV (deg)
0
0.5
1
1.5
2
2.5
3M
ean
Pla
cem
ent
Err
or
(m)
Statue Distance (m)
10deg FOV20deg FOV40deg FOV
Fig. 5. Experiment 2. (a) Mean distance errors in meters for the perceptual estimates as a function of FOV and Statue Distance. (b) Mean height errors inmeters for the perceptual estimates as a function of FOV and Statue Distance. (c) Mean errors in meters for the perceptual estimates of distances betweenpairs of statues as a function of FOV. (d) Mean placement errors in meters for the three blind-walks as a function of Statue Distance and FOV. Error barsrepresent ± 1SEM and FOV is in degrees of visual angle.
2514 F.C. Fortenbaugh et al. / Vision Research 47 (2007) 2506–2520
studies in real environments showing increases in error withincreasing target distances (Wagner, 1985).
During the blind-walking task only the distance esti-mates for the 2.2 m statue for participants in the 20�FOV condition showed significant compressions. The lackof an overall effect of FOV and the general tendency forparticipants to underestimate the distances to the statuessuggests that the compression seen in this condition isprobably more related to sampling noise than any system-atic differences across FOV sizes. This is not what wouldbe predicted based on the results of previous studies usingthis paradigm in a virtual environment. While it is knownthat persons with normal vision can accurately walk totargets up to 20 m away in a blind-walking task undernormal viewing conditions (Loomis & Knapp, 2003), itwas thought that a general compression might be observed
due to the use of a virtual environment and the fact thatparticipants were not given the chance to recalibrate theirperception of distances by walking around the environ-ment before testing. It could be that the extensive viewingtime participants had while making perceptual estimatesof the statue locations and the relatively close locationsof the statues (all were under 7 m from the starting posi-tion), may have played a role in the participantsperformance.
Given that the same environment and statues were usedin both experiments, these results suggest that the distor-tions related to loss of input to the peripheral visual fieldseen in Experiment 1 did not solely arise from the partici-pants’ inability to accurately perceive the locations of thetargets within the environment. However, due to the differ-ences between the tasks used in the two experiments, the

F.C. Fortenbaugh et al. / Vision Research 47 (2007) 2506–2520 2515
possibility of perceptual distortions cannot be ruled outyet. In particular, the results from a study (Wu et al.,2004) using goggles to restrict FOV (i.e. creating head-based FOV restrictions as opposed to eye-based FOVrestrictions) suggest that when participants are requiredto make distance judgments without the use of head move-ments, estimates show significant compressions. However,when participants are allowed to systematically samplethe ground surface texture on a flat terrain from near tofar (i.e. close to their feet and then out to the target alonga radial line) distance estimates are accurate out to a dis-tance of 20 m. While the nature of the restrictions in Wuet al.’s (2004) experiment and the present study are funda-mentally different, it is possible that by using similar strat-egies participants in Experiment 2 were able to compensatefor any compression that resulted from the loss of theirperipheral vision. If this were the case, it might be that thisdifference in strategies is what led to differences in the par-ticipants’ performances in Experiment 1 and Experiment 2
An important difference between the two paradigmsused here is the number of judgments required after view-ing the statues. In Experiment 1, all of the statues wereremoved after the Learning Phase and participants hadto place the statues without viewing the original configura-tion again while in Experiment 2 participants either madeperceptual judgments that did not require short-term mem-ory or they completed blind walks immediately after view-ing each statue individually. Recent neurological work(Todd & Marois, 2004; Xu & Chun, 2006) has found evi-dence that capacity limits of VSTM are related to the abil-ity of areas in the posterior parietal cortex to encode objectlocations, not just the objects themselves. It could be thatthe increasing distortions in Experiment 1 are related totask difficulty and that VSTM capacities were more over-whelmed as FOV size decreased when six statue locationsneeded to be remembered rather than just one.
Finally, it could also be that the availability of proprio-ception feedback, either during the Learning or Testingphases of Experiment 1 played a role in the FOV effect.During the course of the Learning Phase participantswalked all of the possible paths connecting the statuesand starting position to one another. Under normal view-ing conditions incoming visual input regarding self-motion(i.e. optic flow) is well calibrated with proprioception cuesfrom muscles and the vestibular system and these cues canbe used for assessing distances traveled (Mittelstaedt &Mittelstaedt, 2001). In Experiment 1 the mean distanceerrors ranged from �1.58 to �0.34 m for the Far-Spacestatues while perceptual estimates of the distances to theFar-Space statues in Experiment 2 ranged from �2.13 to�2.39 m. The large increase in compression of distanceestimates in Experiment 2 may therefore represent a flooreffect. If this is the case, the compression due to the lackof proprioception feedback to help recalibrate incomingvisual spatial information in the virtual environment, inconjunction with the compression of distance estimatesthat occurs during stationary viewing, may have obscured
any influence the loss of the peripheral field had on distanceestimates.
4. Experiment 3
Given that the tasks used in the first two experimentsdiffered in terms of the availability of proprioception cues,the number of statue locations to be remembered, and thetype of response (walk, verbal, blind walk), a final experi-ment was conducted. This experiment controlled for boththe memory-load component (6 statues) and the type ofresponse (blind walk only) while varying the availabilityof proprioception cues during the Learning Phase (viewingthe statues from the starting position vs. walking to theirlocations). This was done in order to assess whether theavailability of proprioception feedback interacts withFOV size when the locations of all six statues must beremembered. Only two FOV sizes were tested (10� and40�). A Task · FOV · Distance interaction was predictedin which the distance estimates of participants would showgreater levels of compression with a 10� FOV than a 40�FOV in the Walk condition but not in the Stand condition,though errors should be larger in the Stand conditionsoverall. Moreover, it was predicted that distance errorswould increase with Statue Distance but that this increasewould be larger for the 10� FOV Walk condition thanthe 40� FOV Walk condition.
5.1. Methods
5.1.1. Participants
Eight healthy volunteers (five women) participated inthe study. The mean age of the participants was 28 yearsold (SD = 9.27), with a range of 21–50 years old. As inthe previous experiments, all participants reported noocular diseases or muscular-skeletal disorders and weretested to assure that they had normal vision. The partici-pants were compensated for their time and gave writtenconsent.
5.1.2. Stimuli
The same environment from Experiment 1 was usedhere. Four unique configurations were created for the loca-tions and sizes of the six colored statues. However, in eachconfiguration, the distances from the starting position tothe statues were always 2, 3.5, 5, 6.5, 8, and 9.5 m. Thecolor and size of the statue corresponding to each distancewere varied across the four configurations and the exactlocations of the statues (i.e. angular offsets) were also var-ied. As in Experiment 2, this was done to prevent the par-ticipants from noticing that the distances to the statuesfrom the starting position remained constant across theconfigurations.
5.1.3. Apparatus
The same equipment used in Experiment 1 was usedhere.
2516 F.C. Fortenbaugh et al. / Vision Research 47 (2007) 2506–2520
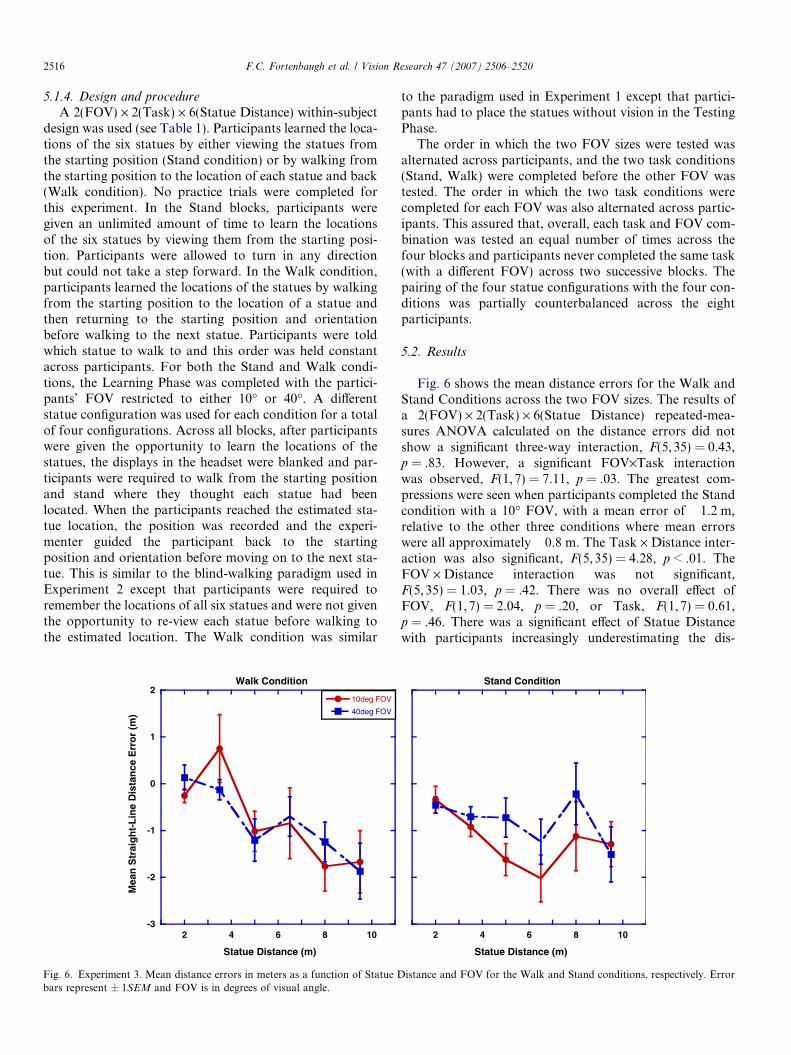
5.1.4. Design and procedure
A 2(FOV) · 2(Task) · 6(Statue Distance) within-subjectdesign was used (see Table 1). Participants learned the loca-tions of the six statues by either viewing the statues fromthe starting position (Stand condition) or by walking fromthe starting position to the location of each statue and back(Walk condition). No practice trials were completed forthis experiment. In the Stand blocks, participants weregiven an unlimited amount of time to learn the locationsof the six statues by viewing them from the starting posi-tion. Participants were allowed to turn in any directionbut could not take a step forward. In the Walk condition,participants learned the locations of the statues by walkingfrom the starting position to the location of a statue andthen returning to the starting position and orientationbefore walking to the next statue. Participants were toldwhich statue to walk to and this order was held constantacross participants. For both the Stand and Walk condi-tions, the Learning Phase was completed with the partici-pants’ FOV restricted to either 10� or 40�. A differentstatue configuration was used for each condition for a totalof four configurations. Across all blocks, after participantswere given the opportunity to learn the locations of thestatues, the displays in the headset were blanked and par-ticipants were required to walk from the starting positionand stand where they thought each statue had beenlocated. When the participants reached the estimated sta-tue location, the position was recorded and the experi-menter guided the participant back to the startingposition and orientation before moving on to the next sta-tue. This is similar to the blind-walking paradigm used inExperiment 2 except that participants were required toremember the locations of all six statues and were not giventhe opportunity to re-view each statue before walking tothe estimated location. The Walk condition was similar
-3
-2
-1
0
1
2
2 4 6 8 10
Walk Condition
10deg FOV
40deg FOV
Mea
n S
trai
gh
t-L
ine
Dis
tan
ce E
rro
r (m
)
Statue Distance (m)
Fig. 6. Experiment 3. Mean distance errors in meters as a function of Statue Dbars represent ± 1SEM and FOV is in degrees of visual angle.
to the paradigm used in Experiment 1 except that partici-pants had to place the statues without vision in the TestingPhase.
The order in which the two FOV sizes were tested wasalternated across participants, and the two task conditions(Stand, Walk) were completed before the other FOV wastested. The order in which the two task conditions werecompleted for each FOV was also alternated across partic-ipants. This assured that, overall, each task and FOV com-bination was tested an equal number of times across thefour blocks and participants never completed the same task(with a different FOV) across two successive blocks. Thepairing of the four statue configurations with the four con-ditions was partially counterbalanced across the eightparticipants.
5.2. Results
Fig. 6 shows the mean distance errors for the Walk andStand Conditions across the two FOV sizes. The results ofa 2(FOV) · 2(Task) · 6(Statue Distance) repeated-mea-sures ANOVA calculated on the distance errors did notshow a significant three-way interaction, F(5,35) = 0.43,p = .83. However, a significant FOV·Task interactionwas observed, F(1, 7) = 7.11, p = .03. The greatest com-pressions were seen when participants completed the Standcondition with a 10� FOV, with a mean error of �1.2 m,relative to the other three conditions where mean errorswere all approximately �0.8 m. The Task · Distance inter-action was also significant, F(5,35) = 4.28, p < .01. TheFOV · Distance interaction was not significant,F(5,35) = 1.03, p = .42. There was no overall effect ofFOV, F(1,7) = 2.04, p = .20, or Task, F(1,7) = 0.61,p = .46. There was a significant effect of Statue Distancewith participants increasingly underestimating the dis-
2 4 6 8 10
Stand Condition
Statue Distance (m)
istance and FOV for the Walk and Stand conditions, respectively. Error
F.C. Fortenbaugh et al. / Vision Research 47 (2007) 2506–2520 2517
tances to the statues as the true statue distances increasedin all conditions, F(5, 35) = 5.54, p < .01.
A trend analysis was performed on the mean distanceerrors for each task in order to examine the nature of theTask · Distance interaction. For the Walk condition, a sig-nificant linear trend was observed, F(1,7) = 26.98, p < 0.01,and this relationship did not interact with FOV,F(1, 7) = 0.06, p = .82. In the Stand condition, there wasnot a significant linear trend, F(1, 7) = 2.36, p = .17, andFOV size did not interact with the linear contrast,F(1, 7) = 0.15, p = .71. However, there was a significantquadratic trend, F(1, 7) = 5.56, p = .05. The interactionfor the quadratic contrast of Statue Distance and FOVdid not reach significance, F(1,7) = 4.43, p = .07.
5.3. Discussion
There are two main findings in Experiment 3. First,mean distance errors increased with the true distances tothe statues in all four conditions, and the manner in whichthese errors occurred differed depending on how partici-pants learned the statue locations. In particular, a linearincrease in errors was observed for the Walk conditionwhile the errors for the Stand Condition showed more ofa quadratic trend, with errors increasing more rapidlyacross the three closest statues then leveling off across thefarthest ones.
The results also indicate that the availability of proprio-ception cues during the Learning Phase was influential inthe estimates of the statue location when participants com-pleted the task with a 10� FOV. Considering the Walk con-dition, it was expected that an effect of FOV would befound as it was in Experiment 1, with participants showingthe least compression of distance estimates when perform-ing the task with a 40� FOV. Comparison of the mean dis-tance errors in Experiment 1 and Experiment 3 (see Figs.3a and 6) suggests similar levels of compression for statuesplaced with a 10� FOV but larger compressions for the far-ther statues placed with a 40� FOV in Experiment 3 relativeto Experiment 1. Given that the major difference betweenthe two experiments is that the statues in Experiment 1were placed with vision, even though FOV was restricted,it appears that the deficit in the performance of the partic-ipants when completing the task with a 40� FOV in Exper-iment 3 is most likely attributable to the lack of visualinformation during the Testing Phase. In turn, this wouldsuggest that the FOV effect found in Experiment 1 wasdue, in part, to the participants in the 40� FOV conditionusing visual information about the global structure of theenvironment while participants in the 10� FOV conditiondid not.
The distance errors observed in the Stand condition arealso consistent with the distance errors for the blind walkscompleted in Experiment 2. In Experiment 2, the range ofthe distances tested was between 2 and 7 m and comparisonof Figs. 5d and 6 shows a similar range of compressionsover these distances. The main difference between the
Stand condition in Experiment 3 and the blind walks per-formed in Experiment 2 is the number of statue locationsthe participants had to keep in memory, with each statuebeing shown individually prior to the blind walk in Exper-iment 2 while the locations of all six statues had to beremembered while placing the statues in Experiment 3.The comparable performances of participants these condi-tions suggests that the increased difficulty associated withholding multiple statue locations in memory cannotaccount for the lack of an effect of FOV size in the Exper-iment 2.
6. General discussion
Collectively, the results of Experiment 1 showed that lossof input to the peripheral visual field leads to systematic dis-tortions in representations of object locations, and in par-ticular, that decreasing FOV size led to heterogeneouscompressions of estimated distances that increased withthe true distances to the statues. Further analyses of thegaze patterns of participants showed no significant effectof FOV though the overall mean proportion of statue fixa-tions tended to decrease with FOV size while the proportionof wall fixations increased. This suggests that the distor-tions in remembered statue locations cannot be accountedfor by participants switching from an allocentric codingstrategy to a more egocentric-direction strategy when learn-ing the locations of the statues. The results of Experiment 2showed large compressions in verbal estimates of the dis-tances to the statues when movement was restricted duringthe Learning Phase, suggesting an important role for pro-prioception feedback in estimating distances when inputto the peripheral visual field is restricted. Moreover, resultsof Experiment 3 in conjunction with the lack of any signif-icant difference in gaze patterns across FOV sizes during theLearning Phase in Experiment 1 suggest that the superiorperformance of participants in the 40� FOV condition inExperiment 1 may also have resulted from their use ofvisual cues provided by the global structure of the environ-ment during the Testing Phase. Given that participants inthe 10� FOV condition could have sampled the same visualinformation over multiple fixations, this suggests that oneof the functions of the peripheral visual field is to provideinformation about the global structure of an environmentwithin each fixation.
There are several possible reasons why the availability ofglobal spatial information from the peripheral visual fieldmight be important for the creation of veridical spatial rep-resentations. For example, it is possible that the loss ofperipheral vision disrupted the ability of participants inExperiment 1 to execute effective visual searches of theenvironment. Research on visual search in natural settingshas found that visual search patterns are influenced byboth bottom-up and top-down processes, such as saliencyand context (Brockmole & Irwin, 2005; Chun & Jiang,1999; Hamker, 2004; Itti, Koch, & Niebur, 1998; Jiang &Chun, 2001; McPeek, Skavenski, & Nakayama, 2000;
2518 F.C. Fortenbaugh et al. / Vision Research 47 (2007) 2506–2520
Oliva, Wolfe, & Arsenio, 2004; Turano, Geruschat, &Baker, 2003; Wolfe, 2003). In order for volitionally driveneye movements to be made in a systematic manner duringvisual search, individuals need to be able to attend to areasin the parafovea or periphery (Henderson, Pollatsek, &Rayner, 1989; Kowler & McKee, 1987; Peterson, Kramer,& Irwin, 2004). Based on this theory, it may be that elimi-nating the peripheral visual field degraded the participants’abilities to plan effective visual search patterns by reducingthe size of the area that participants’ could preview beforemaking future eye movements. As a result of this, the suc-cessive pattern of fixations that was stored in VSTM maynot have been coherent enough for participants to accu-rately determine the locations of objects in space relativeto each other and to the global structure of theenvironment.
However, comparison of the participants’ performancesacross Experiments 1 and 3 suggests that disruptions invisual search patterns following peripheral field loss is unli-kely to be the critical mechanism driving the distortionobserved in the present study. If one assumes that visualsearch patterns were increasingly disrupted for participantswith smaller FOV sizes during the Learning Phase (i.e.when statue locations were being encoded in memory),the visual search patterns of participants with 40� FOVsizes should have been minimally disrupted. Yet, it wasfound that the mean distance errors of participants with10� and 40� FOV sizes were comparable in Experiment 3.Moreover, any disruption in visual search patterns presentduring the Learning Phase would also be present during theTesting Phase. Thus, if the distortions observed in the per-formance of participants with 40� FOV sizes in Experiment3 was attributed to disruptions in visual search patternsduring the Learning Phase, one would expect to see compa-rable distortions even if visual input is available during theTesting Phase, as it was in Experiment 1, unless some otherfactor was mediating the influence that visual search pat-terns had on the development of the participants’ spatialrepresentations.
Another possibility is that performance was impacted bythe amount of spatial information obtained at any point intime rather than the particular sequence of fixations overtime. In order to successfully bind information across suc-cessive fixations to create cohesive representations of theexternal environment two things must occur. First, the sys-tem responsible for completing this process must be able tostore information from past fixations in VSTM to build upthe representation. Second, the system must be able tomonitor where the eye currently is and where the eye wasprior to the saccade in order to know where the storedpieces of information fit relative to one another. Giventhe large amount of visual information that could beobtained within a single fixation, it is unlikely that all ofthe information received by the visual system is stored. Inagreement with this view, a recent study by Brockmoleand Irwin (2005) suggests that only certain objects andthe spatial relationship of these objects relative to each
other are stored in VSTM. Based on the results of Experi-ments 2 and 3, it appears that the distortions observed inExperiment 1 arose from difficulties in storing the locationsof the statues within the environment and this can beexplained by a reduction in the amount of information thatcan be used to connect one fixation to the next. An analogyfor this would be putting a puzzle together. Whereas theedge pieces of a puzzle provides an absolute framework,or boundary, in which all other pieces can be placed in rela-tion to, the peripheral visual field can be thought of as pro-viding both an edge and a background to visual space.Though attention may be closely tied to the point of fixa-tion and visual information is degraded as eccentricityincreases, the awareness of space in the peripheral visualfield may provide humans with a spatial framework inwhich to place the content of the current fixation.
Under this view, the resulting visual spatial representa-tions of participants with larger FOV sizes would benefitfrom either a more accurate representation of the locationsof the statues themselves relative to the starting positionand/or the inclusion of more of the global structure ofthe environment within the spatial representation to serveas landmarks during retrieval. The performance of the par-ticipants with 40� FOV sizes in Experiment 3 suggests thatthe latter alternative is more plausible as one would expectsimilar performances for these participants relative to theparticipants with 40� FOV sizes in Experiment 1 if theirrepresentations of the statue locations were not coupledwith visual cues in the environment, though both could cer-tainly be applicable.
Previous studies (Intraub, 2002; Intraub, Hoffman,Wetherhold, & Stoehs, 2006; Intraub & Richardson,1989) on memory for pictures of natural scenes have showna robust tendency for participants to remember more of ascene’s background than was originally present duringencoding, a phenomenon called boundary extension. Ithas been suggested that boundary extension is an adaptive,automatic process that may aid the development of cohe-sive visual spatial representations from discrete samples(i.e. fixations) of the environment (Intraub, Hoffman,Wetherhold, & Stoehs, 2006). What is of interest to thepresent study is the implication from the boundary exten-sion literature that the visual system uses heuristics aboutthe stability and continuity of an external environment toextrapolate beyond the limits of current sensory input. Inother words, while the amount of external visual informa-tion received within a single fixation differed across theFOV sizes tested here, the awareness of the participantsthat the environment persisted in a stable and continuousmanner beyond their current view did not. Thus, it maybe that while the on-line perception of the statue locationsdid not differ across FOV sizes, as shown by the results ofExperiment 2, the resulting spatial representations that theparticipants relied on to place the statues in the testingphases of Experiments 1 and 3 may have contained uniquedistortions that were dependent on FOV size, with partici-pants in the 10� FOV conditions extrapolating more of the
F.C. Fortenbaugh et al. / Vision Research 47 (2007) 2506–2520 2519
space around the statue locations and thus failing to incor-porate changes in the true global structure of the environ-ment that could be used as landmarks in the TestingPhases. However, given the design of the present study itis not possible to determine whether the incorporation oflandmarks and other global aspects of an environmentare inherently more difficult to incorporate into a spatialrepresentation when FOV size is reduced or if the natureof the tasks used and the instructions given to the partici-pants influenced the types of information they attendedto. More work is needed in this area to determine the rela-tionship between FOV size and the ability to encode globalspatial information.
In conclusion, the results of the present study demon-strate the important role the peripheral visual field playsin creating spatial representations and point to the needfor further research to investigate the mediation of incom-ing spatial information across the retina. For while the cen-tral visual field may play a starring role in many aspects ofvisual processing, when it comes to representing the exter-nal world in a cohesive fashion and creating the spatial rep-resentations that allow humans to effectively interact withtheir environments, the peripheral visual field is by nomeans an expendable player.
Acknowledgments
The authors thank Thomas Wickens for helpful com-ments on the data analysis. This work was funded by agrant from NIH/National Eye Institute EY07839 to authorK.A.T.
References
Aivar, M. P., Hayhoe, M. M., Chizk, C. L., & Mruczek, R. E. B. (2005).Spatial memory and saccadic targeting in a natural task. Journal of
Vision, 5(3), 177–193.Baizer, J. S., Ungerleider, L. G., & Desimone, R. (1991). Organization of
visual inputs to the inferior temporal and posterior parietal cortex inmacaques. The Journal of Neuroscience, 17, 166–190.
Banks, M. S., Sekuler, A. B., & Anderson, S. J. (1991). Peripheral spatialvision: Limits imposed by optics, photoreceptors, and receptorpooling. Journal of the Optical Society of America: A, 8(1775–1787).
Bishop, P. O., & Henry, G. H. (1971). Spatial vision. Annual Review of
Psychology, 22, 119–160.Brockmole, J. R., & Irwin, D. E. (2005). Eye movements and the
integration of visual memory and visual perception. Perception &
Psychophysics, 67(3), 495–512.Burgess, N. (2006). Spatial memory: How egocentric and allocentric
combine. Trends Cogn. Sci., 10(12), 551–557.Chun, M. M., & Jiang, Y. (1999). Top-down attentional guidance based
on implicit learning of visual covariation. Psychological Science, 10,360–365.
Committeri, G., Galati, G., Paradis, A. L., Pizzamiglio, L., Berthoz,A., & LeBihan, D. (2004). Reference frames for spatial cognition:Different brain areas are involved in viewer-, object-, andlandmark-centered judgments about object location. J. Cogn.
Neurosci., 16(9), 1517–1535.Creem-Regehr, S. H., Willemsen, P., Gooch, A. A., & Thompson, W. B.
(2005). The influence of restricted viewing conditions on egocentricdistance perception: Implications for real and virtual environments.Perception, 34, 191–204.
Cutting, J. E., & Vishton, P. M. (1995). Perceiving layout and knowingdistances: The integration, relative potency, and contextual use ofdifferent information about depth. In W. E. S. Rogers (Ed.).Handbook of perception and cognition (Vol. 5, pp. 69–117). San Diego:Academic Press.
Diedrichsen, J., Werner, S., Schmidt, T., & Trommershauser, J. (2004).Immediate spatial distortions of pointing movements induced by visuallandmarks. Perception & Psychophysics, 66(1), 89–103.
Epstein, R. A., & Kanwisher, N. (1998). A cortical representation of thelocal visual environment. Nature, 392, 598–601.
Fortenbaugh, F. C., Hicks, J. C., Hao, L., & Turano, K. A. (in press). Atechnique for simulating visual field losses in virtual environments tostudy human navigation. Behavior Research Methods.
Geisler, W. S., & Perry, J. S. (2002). Real-time simulation of arbitraryvisual fields. Paper presented at the Eye Tracking Research &Applications Symposium (ACM).
Goldstein, E. B. (2002). Sensation and perception (6th ed.). Pacific Grove,CA: Wadsworth Group.
Hamker, F. H. (2004). A dynamic model of how feature cues guide spatialattention. Vision Research, 44, 501–521.
Hartley, T., Maguire, E. A., Spiers, H. J., & Burgess, N. (2003). The well-worn route and the path less traveled: Distinct neural bases of routefollowing and wayfinding in humans. Neuron, 37, 877–888.
Hayhoe, M. M., Shrivastava, A., Mruczek, R., & Pelz, J. B. (2003). Visualmemory and motor planning in a natural task. Journal of Vision, 3,49–63.
Henderson, J., Pollatsek, A., & Rayner, K. (1989). Covert visual attentionand extrafoveal information use during object identification. Percep-
tion & Psychophysics, 45(3), 196–208.Hollingworth, A., & Henderson, J. M. (2002). Accurate visual memory for
previously attended objects in natural scenes. Journal of Experimental
Psychology: Human Perception and Performance, 28(1), 113–136.Horton, J. C., & Hoyt, W. F. (1991). The representation of the visual field
in human striate cortex: A revision of the classic holmes map. Archives
of Ophthalmology, 109, 816–824.Intraub, H. (2002). Anticipatory spatial representation of natural scenes:
Momentum without movement? Visual Cognition, 9, 93–119.Intraub, H., Hoffman, J. E., Wetherhold, J., & Stoehs, S. (2006). More
than meets the eye: The effect of planned fixations on scenerepresentation. Perception & Psychophysics, 68, 759–769.
Intraub, H., & Richardson, M. (1989). Wide-angle memories of close-upscenes. Journal of Experimental Psychology: Learning, Memory and
Cognition, 15, 179–187.Irwin, D. E., & Zelinsky, G. J. (2002). Eye movements and scene
perception: Memory for things observed. Perception & Psychophysics,
64(6), 882–895.Ismail, A. R., & Asfour, S. S. (1999). Discrete wavelet transform: A tool in
smoothing kinematic data. Journal of Biomechanics, 32, 317–321.Itti, L., Koch, C., & Niebur, E. (1998). A model of saliency-based visual
attention for rapid scene analysis. IEEE Transactions on Pattern
Analysis and Machine Intelligence, 20, 1254–1259.Jiang, Y., & Chun, M. M. (2001). Selective attention modulates implicit
learning. Quarterly Journal of Experimental Psychology, 54A,1105–1124.
Johnston, A. (1986). A spatial property of the retino-cortical mapping.Spatial Vision, 1, 319–331.
Kowler, E., & McKee, S. (1987). Sensitivity of smooth eye movement tosmall differences in target velocity. Vision Research, 27, 993–1015.
Loomis, J. M., Da Silva, J. A., Fujita, N., & Fukusima, S. S. (1992).Visual space perception and visually directed action. Journal of
Experimental Psychology: Human Perception and Performance, 18,906–921.
Loomis, J. M., Klatzky, R. L., Golledge, R. G., Cicinelli, J. G., Pellegrino,J. W., & Fry, P. A. (1993). Nonvisual navigation by blind and sighted:Assessment of path integration ability. Journal of Experimental
Psychology: General, 122, 73–91.Loomis, J. M., Klatzky, R. L., Golledge, R. G., & Philbeck, J. W.
(1999). Human navigation by path integration. In R. G. Golledge

2520 F.C. Fortenbaugh et al. / Vision Research 47 (2007) 2506–2520
(Ed.), Wayfinding behavior: Cognitive mapping and other spatial
processes (pp. 125–151). Baltimore, MD: Johns Hopkins UniversityPress.
Loomis, J. M., & Knapp, J. M. (2003). Visual perception of egocentricdistance in real and virtual environments. In L. J. H. Hettinger (Ed.),Virtual and adaptive environments (pp. 21–46). Mahwah, NJ: Erlbaum.
McPeek, R. M., Skavenski, A. A., & Nakayama, K. (2000). Concurrentprocessing of saccades in visual search. Vision Research, 40, 2499–2516.
Messing, R., & Durgin, F. H. (2005). Distance perception and the visualhorizon in head-mounted displays. ACM Transactions in Applied
Perception, 2, 234–250.Mittelstaedt, M. L., & Mittelstaedt, H. (2001). Idiothetic navigation in
humans: Estimation of path length. Experimental Brain Research, 139,318–332.
Mullen, K. T., Sakurai, M., & Chu, W. (2005). Does l/m cone opponencydisappear in human periphery? Perception, 34, 951–959.
Norman, J. F., Crabtree, C. E., Clayton, A. M., & Norman, H. F. (2005).The perception of distances and spatial relationships in naturaloutdoor environments. Perception, 34, 1315–1324.
Oliva, A., Wolfe, J. M., & Arsenio, H. C. (2004). Panoramic search: Theinteraction of memory and vision in search through a familiar scene.Journal of Experimental Psychology: Human Perception and Perfor-
mance, 30, 1132–1146.Osterberg, G. A. (1935). Topography of the layer of rods and cones in the
human retina. Acta Ophthalmology, Suppl. VI.Palmer, S. (1999). Vision science: Photons to phenomenology. Cambridge,
MA: Bradford Books/MIT Press.Peterson, M. S., Kramer, A. F., & Irwin, D. E. (2004). Covert shifts of
attention precede involuntary eye movements. Perception & Psycho-
physics, 66, 398–405.Philbeck, J. W., O’Leary, S., & Lew, A. L. (2004). Large errors, but no
depth compression, in walked indications of exocentric extent.Perception & Psychophysics, 66, 377–391.
Portin, K., & Hari, R. (1999). Human parieto-occipital visual cortex: Lackof retinotopy and foveal magnification. Proceedings: Biological
Sciences, 266, 981–985.Sahm, C. S., Creem-Regehr, S. H., Thompson, W. B., & Willemsen, P.
(2005). Throwing versus walking as indicators of distance perception insimilar real and virtual environments. ACM Transactions in Applied
Perception, 2, 35–45.Shelton, A. L., & McNamara, T. P. (2001). Systems of spatial reference in
human memory. Cognitive Psychology, 43, 274–310.
Sheth, B. R., & Shimojo, S. (2001). Compression of space in visualmemory. Vision Research, 41, 329–341.
Stephen, J. M., Aine, C. J., Christner, R. F., Ranken, D., Huang, M., &Best, E. (2002). Central versus peripheral visual field stimulationresults in timing differences in dorsal stream sources as measured withmeg. Vision Research, 42, 3059–3074.
Szlyk, J. P., Fishman, G. A., Alexander, K. R., Revelins, B. I., Derlack, D.J., & Anderson, R. J. (1997). Relationship between difficulty inperforming daily activities and clinical measures of visual function inpatients with retinitis pigmentosa. Archives of Ophthalmology, 115,53–59.
Temme, L. A., Maino, J. H., & Noell, W. K. (1985). Eccentricityperception in the periphery of normal observers and those with retinitispigmentosa. American Journal of Optometry & Physiological Optics,
62, 736–743.Todd, J. J., & Marois, R. (2004). Capacity limit of visual short-term
memory in human posterior parietal cortex. Nature, 428, 751–754.Turano, K. A., Geruschat, D. R., & Baker, F. H. (2003). Oculomotor
strategies for the direction of gaze tested within a real-world activity.Vision Research, 43, 333–346.
Turano, K. A., Geruschat, D. R., & Stahl, J. W. (1998). Mental effortrequired for walking: Effects of retinitis pigmentosa. Optometry and
Vision Science, 75, 879–886.Turano, K. A., & Schuchard, R. A. (1991). Space perception in observers
with visual field loss. Clinical Vision Sciences, 6, 289–299.Wagner, M. (1985). The metric of visual space. Perception & Psychophys-
ics, 38, 483–495.Wandell, B. A., Brewer, A. A., & Dougherty, R. F. (2005). Visual field
map clusters in human cortex. Philosophical Transactions of the Royal
Society of London: B, 360, 693–707.Werner, S., & Diedrichsen, J. (2002). The time course of spatial memory
distortion. Memory & Cognition, 30, 718–730.Witmer, B. G., & Kline, P. B. (1998). Judging perceived and traversed
distance in virtual environments. Presence, 7, 144–167.Wolfe, J. M. (2003). Moving towards solutions to some enduring
controversies in visual search. Trends in Cognitive Science, 7,70–76.
Wu, B., Ooi, T. L., & He, Z. J. (2004). Perceiving distance accurately by adirectional process of integrating ground information. Nature, 428,73–77.
Xu, Y., & Chun, M. M. (2006). Dissociable neural mechanisms supportingvisual short-term memory for objects. Nature, 440, 91–95.