
Long‐Term Flux Monitoring of LSI +61o303 at 2.25 and 8.3 GHz
24
arXiv:astro-ph/9710033v1 2 Oct 1997 Long-Term Flux Monitoring of LSI +61 ◦ 303 at 2.25 and 8.3 GHz P. S. Ray 1 , R. S. Foster 2 , E. B. Waltman 3 Code 7210 Remote Sensing Division Naval Research Laboratory Washington, DC 20375 M. Tavani 4 Columbia Astrophysics Laboratory Columbia University New York, NY 10027 F. D. Ghigo 5 National Radio Astronomy Observatory P.O. Box 2 Green Bank, WV 24944 Received ; accepted 1 E-mail: [email protected], NRC Research Associate 2 E-mail: [email protected] 3 E-mail: [email protected] 4 E-mail: [email protected] 5 E-mail: [email protected]
-
Upload
independent -
Category
Documents
-
view
3 -
download
0
Transcript of Long‐Term Flux Monitoring of LSI +61o303 at 2.25 and 8.3 GHz
arX
iv:a
stro
-ph/
9710
033v
1 2
Oct
199
7
Long-Term Flux Monitoring of LSI+61◦ 303 at 2.25 and 8.3 GHz
P. S. Ray1, R. S. Foster2, E. B. Waltman3
Code 7210
Remote Sensing Division
Naval Research Laboratory
Washington, DC 20375
M. Tavani4
Columbia Astrophysics Laboratory
Columbia University
New York, NY 10027
F. D. Ghigo5
National Radio Astronomy Observatory
P.O. Box 2
Green Bank, WV 24944
Received ; accepted
1E-mail: [email protected], NRC Research Associate
2E-mail: [email protected]
3E-mail: [email protected]
4E-mail: [email protected]
5E-mail: [email protected]

– 2 –
ABSTRACT
LSI+61◦ 303 is an exotic binary system consisting of a ∼ 10 M⊙ B star and a
compact object which is probably a neutron star. The system is associated with
the interesting radio source GT 0236+610 that exhibits bright radio outbursts
with a period of 26.5 days. We report the results of continuous daily radio
interferometric observations of GT 0236+610 at 2.25 and 8.3 GHz from 1994
January to 1996 February. The observations cover 25 complete (and 3 partial)
cycles with multiple observations each day. We detect substantial cycle-to-cycle
variability of the radio emission characterized by a rapid onset of the radio flares
followed by a more gradual decrease of the emission. We detect a systematic
change of the radio spectral index α (defined as Sν ∝ να) which typically
becomes larger than zero at the onset of the radio outbursts. This behavior is
suggestive of expansion of material initially optically thick to radio frequencies,
indicating either that synchrotron or inverse Compton cooling are important
or that the free-free optical depth to the source is rapidly changing. After two
years of observations, we see only weak evidence for the proposed 4-year periodic
modulation in the peak flux of the outbursts. We observe a secular trend in
the outburst phases according the the best published ephemeris. This trend
indicates either orbital period evolution, or a drift in outburst orbital phase in
response to some other change in the system.
Subject headings: radio continuum: stars — stars: individual (LSI+61◦ 303) —
stars: binaries — X-rays: binaries

– 3 –
1. Introduction
The exotic binary system LSI+61◦ 303 (= V615 Cas = GT0236+610) is one of a
remarkable class of X-ray and radio emitting binaries which includes the well-known sources
Cir X-1, Cyg X-3 and SS433 (e.g. Hjellming & Johnston 1988). LSI+61◦ 303 is a ∼ 10 M⊙
B0 star at a distance of ∼ 2 kpc (Frail & Hjellming 1991) whose spectrum shows evidence
for rapid rotation and a high-velocity equatorial wind (Hutchings & Crampton 1981). The
B star is in a binary system with a compact companion, most likely a neutron star. This
source is particularly interesting among high-mass binaries because of its strongly variable
emission at wavelengths from radio to X-rays and probably γ-rays. Although this source has
been the target of a great many observations, the energy source and emission mechanisms
responsible for its peculiar behavior remain a mystery.
GT 0236+610 is a highly variable radio source which exhibits periodic radio outbursts
with a period of 26.496 ± 0.008 d (Taylor & Gregory 1984). However, these outbursts are
not stable in phase. Outburst maxima have been seen from phase 0.45 to 0.95, but bright
maxima seem to occur near 0.6 (Paredes, Estalella, & Rius 1990). Phase zero is arbitrarily
defined to be at JD 2443366.775 (Taylor & Gregory 1982). A ∼ 4 year periodic modulation
has been proposed in the amplitude of the radio maxima (Gregory et al. 1989), possibly
due to precession of a relativistic jet, or variable accretion from the B star. The modulation
has been fit with a sinusoidal function with a period of 1476 ± 7 d (Paredes, Estalella, &
Rius 1990) or 1605 ± 24 d (Martı 1993). VLBI observations near maxima show a 2 mas
double source implying source size of about 5.5 × 1013 cm (3.7 AU) and an equipartition
value of 0.7 G for the magnetic field (Massi et al. 1993). The source shows evidence for
rapid expansion ( >∼ 400 km/s), but not for relativistic bulk motions such as those seen in
GRS 1915+105, GRO J1655−40, SS433 and Cyg X-3 (see Mirabel & Rodriguez (1994) for
a review).

– 4 –
In addition, LSI+61◦ 303 is associated with a weak, variable X-ray source which
has been observed with Einstein, ROSAT, and ASCA (Bignami et al. 1981, Goldoni &
Mereghetti 1995, Taylor et al. 1996, Leahy, Harrison, & Yoshida 1997). The X-ray source
(in the one well-sampled cycle) is brightest (∼ 1.5 × 1033 erg/s, 0.07-2.48 keV, assuming
a distance of 2.0 kpc and without correcting for absorption) during the radio quiet phase,
although the relationship is poorly determined because of very sparsely sampled X-ray
data. The X-ray spectrum is an absorbed power-law with photon index ∼ −1.7 with no
evidence for an Iron line (Leahy, Harrison, & Yoshida 1997).
LSI+61◦ 303 is exceptional among X-ray binaries in that it is the most probable
counterpart to the COS-B and EGRET γ-ray source 2CG 135+01 (Hermsen et al.
1977, Fichtel et al. 1994, Tavani et al. 1996) with an implied luminosity of ∼ 8× 1034 erg/s
above 100 MeV (for a distance of 2.0 kpc). The radio position is between the 68% and
95% confidence level contours of the best γ-ray position determination (Thompson et al.
1995, Kniffen et al. 1997) by EGRET. Both COMPTEL and OSSE have observed emission
from this region (van Dijk et al. 1996, ) but have not been able to exclude the nearby
QSO0241+622 as the source.
In 1994 January, we began dual-frequency radio monitoring observations of LSI+61◦ 303
to follow the radio flux density and spectral index of the source during ASCA X-ray
observations (Leahy, Harrison, & Yoshida 1997, Ray et al. 1996). These observations
were continued through 1996 February and supported Compton Gamma-Ray Observatory
observations (Tavani et al. 1996). Multi-frequency observations are a good way to probe
the physical conditions of the source. Because of the large cycle-to-cycle variations, it is
imperative to track the state of the radio emission during high-energy observations. This
paper summarizes the radio observations (§2) and discusses implications for models (§3) of
this unique system.

– 5 –
2. Observations
The observations reported here were made several times per day (with a few gaps)
from 1994 January 27 to 1996 February 23. The monitoring was performed with the
National Radio Astronomy Observatory Green Bank Interferometer (GBI) in Green
Bank, West Virginia. The GBI consists of two 26 m antennas on a 2.4 km baseline
each of which has a pair of cooled receivers to simultaneously receive signals at 2.25
and 8.3 GHz. The correlators process 35 MHz of bandwidth at each frequency. After
being shut down due to lack of funding from 1996 April through November, the GBI is
currently being operated by NRAO and NASA primarily for radio monitoring of X-ray
sources. All data taken is made available to the public immediately via the WWW
(http://www.gb.nrao.edu/gbint/GBINT.html).
Ten minute scans on LSI+61◦ 303 were performed 1–10 times per day within ±5 hours
of source transit. Each scan consists of a vector sum of the correlator amplitude and phase
from 30 s integrations. Measured correlator amplitudes are converted to flux densities by
comparison to standard, regularly observed calibrators. The resulting data set consists of
6628 flux density measurements of the source at two frequencies over 2.07 yr. Twenty-five
outbursts have nearly complete coverage and three more have partial coverage (due to
hardware or scheduling problems). The receivers have a system temperature of ∼ 40K, and
individual flux density measurements have errors of:
σ2.25GHz =[
(0.006)2 + (0.014S2.25GHz)2]1/2
Jy, (1)
σ8.3GHz =[
(0.009)2 + (0.049S8.3GHz)2]1/2
Jy. (2)
Note that the constant term has been significantly lowered since 1989 (Fiedler et al. 1987)
by the installation of new cooled HEMT receivers. A fraction of this error estimate is due
to a difficult to calibrate systematic gain variation in the system as a function of hour angle.
The gain variations are likely due to a combination of changing aperture efficiency due to

– 6 –
deformations of the antenna surface, and weather-dependent phase coherence problems. We
have attempted to correct for the gain variations by fitting the hour-angle dependent effect
observed in a constant source with a second order polynomial. This was used to correct the
observed fluxes for LSI+61◦ 303. The magnitude of the effect at ±5h is about 7% and 20%
for 2.25 and 8.3 GHz, respectively.
The daily average flux density of LSI+61◦ 303 at 2.25 and 8.3 GHz as well as the
calculated spectral index are shown in Figure 1 and 2. The error bars on this and other
figures are ±1σ. There is considerable variation from outburst to outburst, but inspection
of the light curves reveals that the higher frequency tends to peak earlier and fade more
quickly than the lower frequency. By cross correlating the light curves at each frequency,
we measure a mean time delay between the 8.3 GHz outburst and the 2.25 GHz outburst of
0.4 days with a large RMS scatter of 0.5 days. In addition, many of the outbursts show two
or more peaks during the decline of the main outburst.
2.1. Spectral evolution
An important feature of this monitoring program is the simultaneous dual-frequency
observations. This allows accurate measurements of the spectral index as a function of time
(orbital phase) in this highly variable source. From two frequency data, we cannot tell
anything about the shape of the spectrum, but we can infer a spectral index (α) assuming
that Sν ∝ να. During typical outbursts we observe the spectral index to rise to a peak with
α between 0 and 0.5 then decay back to the quiescent value of α ∼ −0.4. Our mean light
curves with derived two-frequency spectral index between 2.25 and 8.3 GHz are shown in
Figure 3. Note, however, that the actual radio light curve and spectral index behavior
may substantially change from cycle to cycle. The changing spectral index is a result of
the typical outburst profile decaying more slowly at 2.25 GHz than at 8.3 GHz. By fitting

– 7 –
Gaussian profiles to the outbursts, we find that the characteristic widths of the 2.25 GHz
profiles are 28% larger than that of the 8.3 GHz profiles.
The only previous measurements of the spectral index evolution during an outburst are
the statistical results of Taylor & Gregory (1982) and one outburst observed by Taylor &
Gregory (1984). Both of these results reported two-frequency spectral indices between 5 and
10 GHz. Realistic models for the radio spectrum of this source are not simple power laws
(Martı 1993), and free-free absorption will be much more important at 2.3 GHz than at 5
GHz, so direct comparison of our results to previous ones is somewhat difficult. However, in
the one outburst with two-frequency measurements, the spectral index is slightly negative
at the peak and the decay phase of the outburst is consistent with a constant spectral
index. Also, their statistical results show a strong peak in spectral index of nearly α = 2 at
around phase 0.4. We see no evidence for positive spectral indices except at the peak of the
outbursts.
There are several energy loss mechanisms which may be important in an expanding
cloud of relativistic electrons including adiabatic expansion, synchrotron emission, and
inverse Compton scattering (Pacholczyk 1970). Each of these affects the shape of the
electron energy distribution function and thus the observed spectral index in different ways.
Inverse Compton scattering and synchrotron losses both have dE/dt ∝ E2 which result
in a spectral index changing toward more negative values during the decay phase of the
outburst. Adiabatic expansion implies dE/dt ∝ E which results in a constant spectral
index, which is not seen in the decay phase of the outbursts. The multiple peaks in the light
curves of the outbursts indicate continuing particle injection. It is clear that the production
of energetic particles in this source cannot be modeled as a simple delta function of time.
The observed spectral index evolution may also be (at least partially) the result of the
source being embedded in a high-optical-depth envelope such as the ionized stellar wind

– 8 –
of the B star. In this case, the emitted radio emission will be modified by the free-free
opacity of the wind. This envelope may be completely opaque near periastron and the
optical depth may remain greater than unity for 6–22 days (Massi et al. 1993). Thus, the
observed outburst onset may occur well after the initial acceleration event. Since the wind
opacity is a strong function of frequency (the optical depth τ = T−1.5e ν−2.1EM, where the
emission measure EM =∫
n2eds; Pacholczyk 1970), one would expect the higher frequency
to brighten first if this is an important effect, as is observed.
2.2. Long-term periodicity
The proposed long-term periodicity has previously been fitted with rather sparse data:
14 peak flux measurements covering only 2–3 periods of the modulation (Martı 1993).
Possible explanations include: variable beaming from a precessing relativistic jet (Gregory
et al. 1989), variable wind velocity from the B star resulting in a variable accretion rate
onto the neutron star (Martı & Paredes 1995), or precession of the B star in the neutron
star magnetic field (Lipunov & Nazin 1994).
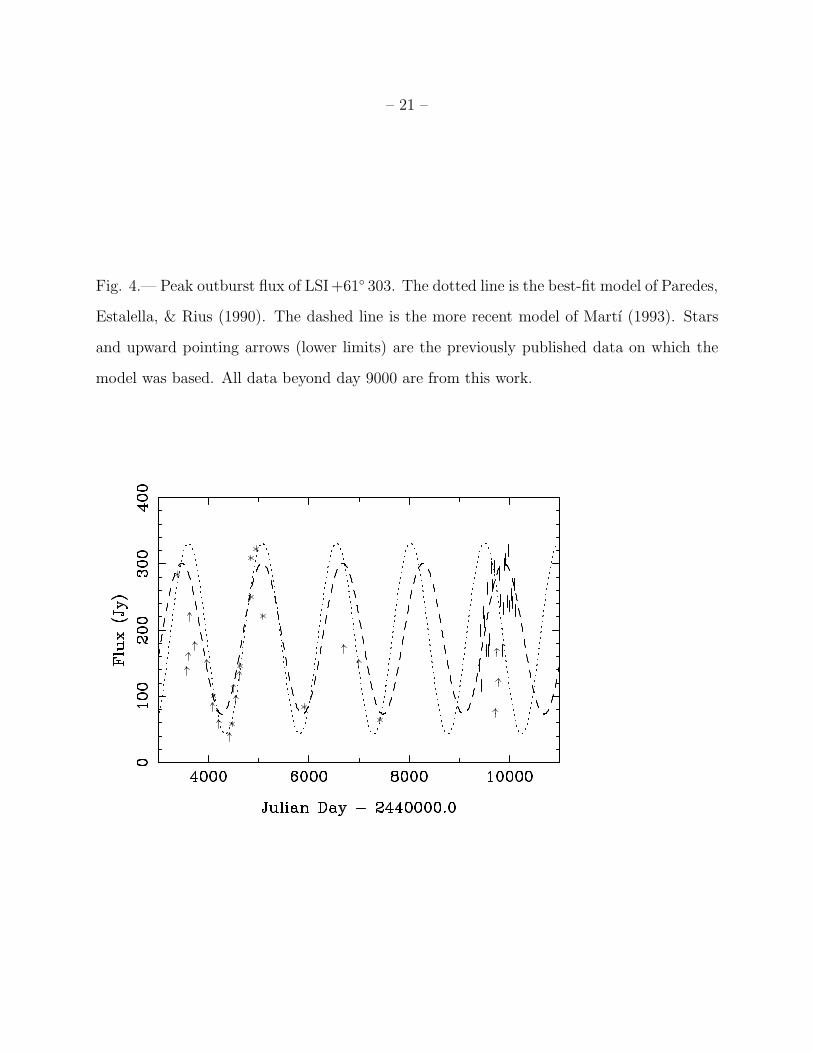
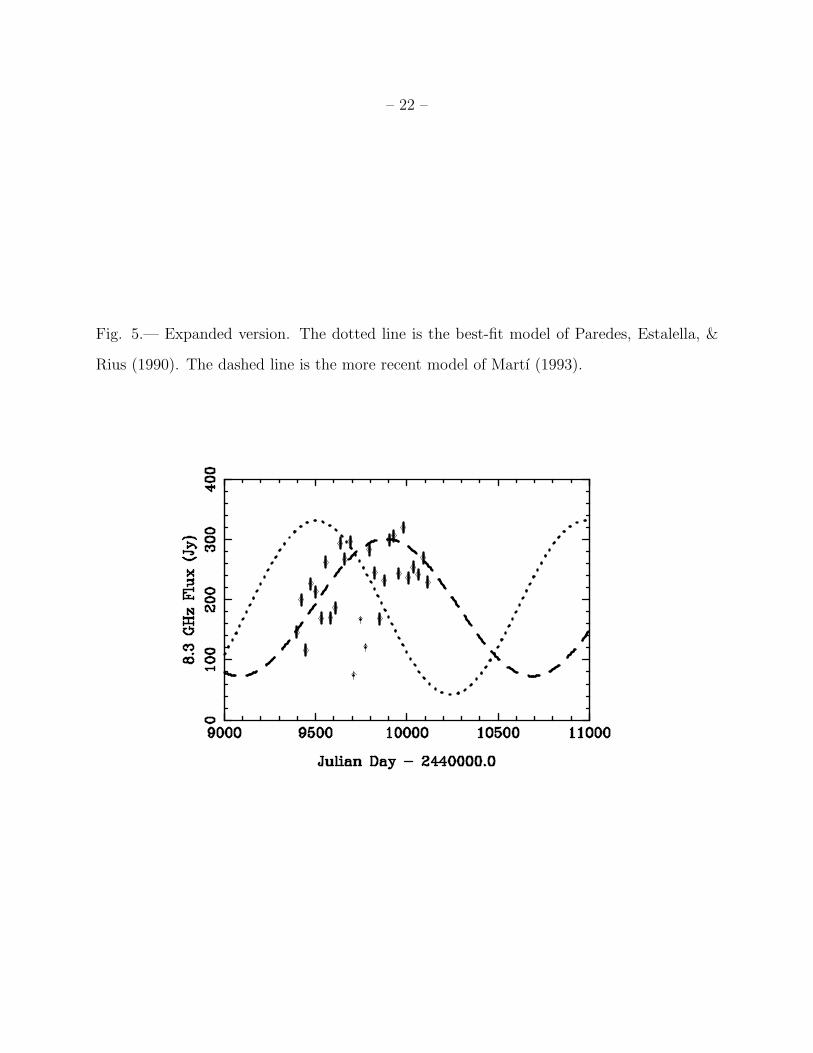
The peak fluxes (at 8.3 GHz) of the 18 outbursts observed by the GBI are shown
in Figure 4 along with the previous observed outburst maxima (observed at 5, 8, or 10
GHz) used to fit the sinusoidal model by Paredes, Estalella, & Rius (1990) and Martı
(1993). An expanded view of only the new data is shown in Figure 5. Both figures include
the previously published models for the modulation. Our data rule out the four-year
modulation model of Paredes, Estalella, & Rius (1990), but are marginally consistent with
the model of Martı (1993) in which
Smax = A cos [2π
P(t − t0)] + B, (3)
where A = 114 ± 8 mJy, t0 = JD 2443464 ± 100, A = 114 ± 9 mJy, and P = 1605 ± 24 d.

– 9 –
However, no evidence for any secular trend in the peak flux data at 2.25 GHz (shown in
Figure 6) is observed.
2.3. Ephemeris
Figure 7 shows the phase of the outburst maxima as a function of date. These
phases were determined by cross correlating the observed fluxes with a template. Due to
incomplete sampling of the fluxes, and occasional high points which may be due to radio
interference, fitting outburst phases by cross correlation is more robust than simply taking
the time of the measurement with the highest flux. The offset between the two frequencies
may be partially due to a different template with a different fiducial point being used for
each frequency.
A secular trend in the outburst phases is evident. To characterize this effect, we have
fit the outburst times of the 8.3 GHz data to a linear model
tn = t0 + n × P, (4)
where tn is the peak time of the nth outburst. Fitting for t0 and P using 26 measured
outburst times yields t0 = JD2449393.5 ± 0.4, and P = 26.69 ± 0.02 days. With these
parameters, equation 4 provides a good ephemeris for recent outburst maxima. The RMS
difference between the model and the actual outburst times is 1.1 days. Since the differences
of the measured outburst times from a linear model could have contributions from many
sources including intrinsic variability, cross correlation errors due to shape variations from
outburst to outburst, and normal measurement errors, the standard deviations used in the
fitting process were calculated from the RMS residuals after fitting a linear model to the
data.
We note that our best estimate of the period is significantly different (> 9σ) from the
– 10 –
best previously published value of 26.496 ± 0.008 days (Taylor & Gregory 1984). There
are several possible explanations for this result. Either there has been real orbital period
evolution in the 10–12 years since the previous result was published, or the outburst peaks
tend to move around in orbital phase in response to some other parameter in the system,
such as the B star mass-loss rate, or a precession period. This other parameter may
also be related to the possible modulation in the outburst maxima discussed above. The
required orbital period derivative to explain currently observed period is (3.5±0.03)×10−5,
consistent with the upper limit of 1.6 × 10⁻⁴ from Taylor & Gregory (1984). The timescale
implied by P/P is 2 × 10³ yr, two orders of magnitude less than that observed in the two
HMXB systems (Cen X-3 and SMC X-1) with measured orbital period derivatives. Thus
the interpretation as true orbital period change seems unlikely. These two models predict
rather different behavior over the next several years. Real orbital period evolution will
result in a continued gradual lengthening of the period while a drift in the outburst orbital
phase predicts that the phase should recover back to 0.6, possibly in response to the 4-year
modulation. A complete analysis of all published data over the 20 years since the source
was discovered is in progress (M. Peracaula, personal communication) which may resolve
this question.
3. Discussion
Most models of this source share the feature that the radio emission is due to
synchrotron emission from relativistic electrons moving in a magnetic field. However,
there is no consensus as to the means of production of these particles, or their relation
to the high-energy emission. Several mechanisms for creating the required relativistic
electron population which have been proposed for LSI+61◦ 303 are summarized below to
demonstrate the wide variety of possible mechanisms.
– 11 –
Maraschi & Treves (1981) (see also Tavani 1995) proposed that the relativistic electrons
are from a young pulsar wind, and that the X-ray and γ-ray emission comes from Compton
scattering of optical photons from the primary B star at a shock boundary between the
pulsar wind and the stellar wind. Taylor & Gregory (1984) proposed that super-Eddington
accretion onto the neutron star near periastron results in luminosity-driven shocks which
may account for the particle production. Paredes et al. (1991) proposed an adiabatically
expanding synchrotron source with prolonged injection of relativistic particles. Lipunov &
Nazin (1994) proposed that relativistic electrons from a pulsar wind are captured by the
magnetosphere of the B star and cooled by synchrotron losses. Recent work (e.g. Campana
et al. 1995) has focused on the accretion regimes of rapidly rotating magnetized neutron
stars in eccentric binaries. Similarly, Zamanov (1995) proposed that the outbursts occur at
the transition of a magnetized neutron star from a propeller phase to an ejector phase as
the mass transfer rate changes in an eccentric orbit.
It is likely that LSI+61◦ 303 is a close relative of the two recently discovered radio
pulsars in B-star binaries (PSRJ0045−7319 and PSRB1259−63) and the 69-ms X-ray
pulsar A0535−668. All three systems contain a rapidly rotating, highly magnetized neutron
star orbiting a massive main-sequence companion. The primary differences between these
systems are the mass-loss rate of the OB star, the geometry of the orbit, and the energy
flux of the pulsar wind. These three factors determine which accretion regime the system
is in. For J0045−7319, M < 10−10 M⊙ yr−1 (Kaspi, Tauris, & Manchester 1996) and for
B1259−63, 100 < (v/10 km s−1)(M/10−8 M⊙ yr−1) < 104 (Tavani & Arons 1997). Thus,
these two systems have fairly weak stellar winds, active pulsars producing strong outflows,
and B1259−63 does not get very close to the companion at periastron, allowing both
to remain in the radio pulsar regime since matter is unable to accrete onto the pulsar
magnetosphere. On the other hand, A 0535−668, may have a weaker pulsar wind, and
might encounter the thick equatorial disk of the Be star near periastron. This allows

– 12 –
accretion at about the Eddington rate to occur and produces a powerful X-ray pulsar.
For LSI+61◦ 303, a reasonably good estimate for the mass loss rate from the companion
is M ∼ 10−7 M⊙ yr−1 (Waters et al. 1988). Campana et al. (1995) suggest that while in
LSI+61◦ 303 the stellar wind ram pressure may be sufficient to overcome the pulsar wind
pressure and accrete onto the magnetosphere, the angular velocity might be super-Keplerian
resulting in the matter being ejected by the propeller mechanism. Alternately, a relatively
young pulsar may power the high energy emission from LSI+61◦ 303 (Maraschi & Treves
1981, Tavani 1995) by a shock mechanism which can be shown to be in agreement with
the intensity and spectral ranges observed for LSI+61◦ 303 in the X-ray range and for
2CG 135+01 in the gamma-ray range (Tavani et al. 1996).
We note that the long-timescale monitoring at 2.25 GHz adds significant new
information compared to previous observations of LSI+61◦ 303 that were made a much
higher frequency. This can be immediately realized by considering the relevance of Figure 3
giving the mean spectral index. The flattening of the spectrum at phases coincident with
the peak radio fluxes is evident. Free-free absorption along the line-of-sight or synchrotron
self-absorption may be responsible for the spectral flattening near phase 0.6. If we assume
a critical absorption frequency at, say, 5 GHz, and a gas temperature of 104 K, we obtain a
free-free optical depth larger than unity for an emission measure EM ≥ 2 · 1025 (cgs units).
We can also estimate the source size L if the spectral flattening is caused by synchrotron
self-absorption. For an estimated radio luminosity of ∼ 2 × 1030 erg s−1, a local magnetic
field of ∼ 1 G, we deduce L ∼ 7 × 1012 cm. We notice that the estimated value of L is
not dissimilar from the source size adopted in the adiabatic/synchrotron cooling model by
Paredes et al. 1991. The integration time of 10 minutes prevents us from placing a strong
limit on the source size from rapid variability, but we do find that the source varies by
more than a factor of two within 15 minutes. This is fully consistent with the timescale

– 13 –
L/c ∼ 4 min.
4. Summary
After 20 months of continuous radio observations of GT 0236+610 we find only weak
evidence for long-term modulation of peak flare amplitudes on a four year time scale. We
observe spectral index variability during the outbursts which implies that either adiabatic
expansion is not the dominant energy loss mechanism in the expanding plasmon or that
the optical depth due to free-free opacity is changing during the outburst. We also observe
an apparent lengthening of the period between outbursts which is fit with a period of
26.69 ± 0.02 days. This may be due to an orbital period derivative of (3.5 ± 0.03) × 10−5
or due to the outburt phases being modulated in response to some other parameter of the
system.
A single self-consistent model for LSI+61◦ 303 remains elusive. Critical questions
include: Are the X-rays and γ-rays produced by the same population of relativistic
electrons? Is the compact object a young pulsar? What is the orbital eccentricity?
A critical diagnostic for distinguishing between the various models is the time
dependence and correlation between the radio, X-ray and γ-ray emission. Multiwavelength
observations with GRO, XTE, and SAX will be important. A collection of resources
to facilitate multifrequency observations of this source is available on the WWW at
http://www.srl.caltech.edu/personnel/paulr/lsi.html. Radio observations at more
than two frequencies will also be useful to separate the effects of free-free absorption,
synchrotron and inverse Compton losses in the evolution of the source spectrum. Finally, a
more accurate determination of the Keplerian orbital parameters is badly needed.
During this work, the Green Bank Interferometer was operated by the National Radio
– 14 –
Astronomy Observatory for the Naval Research Laboratory and was supported by the
Office of Naval Research. Partial support for the observations and analysis of this source
were supported by a National Aeronautics and Space Administration interagency fund
transfer. Basic research in precision pulsar astrophysics at the Naval Research Laboratory
is supported by the Office of Naval Research. A portion of this work was performed while
one of the authors (PSR) held a National Research Council-NRL Research Associateship.
This research made use of the Simbad database, operated at CDS, Strasbourg, France.
– 15 –
REFERENCES
Bignami, G. F., Caraveo, P. A., Lamb, R. C., Markert, T. H., & Paul, J. A. 1981, ApJ, 247,
L85
Campana, S., Stella, L., Mereghetti, S., & Colpi, M. 1995, A&A, 297, 385
Fichtel, C. E. et al. 1994, ApJS, 94(2), 551
Fiedler, R. L. et al. 1987, ApJS, 65, 319
Frail, D. A. & Hjellming, R. M. 1991, AJ, 101, 2126
Goldoni, P. & Mereghetti, S. 1995, A&A, 299, 751
Gregory, P. C., Xu, H.-J., Backhouse, C. J., & Reid, A. 1989, ApJ, 339, 1054
Hermsen, W. et al. 1977, Nature, 269, 494
Hjellming, R. M. & Johnston, K. J. 1988, ApJ, 328, 600
Hutchings, J. B. & Crampton, D. 1981, PASP, 93, 486
Kaspi, V. M., Tauris, T. M., & Manchester, R. N. 1996, ApJ, 459, L717
Kniffen, D. A. et al. 1997, ApJ, 486, 126
Leahy, D. A., Harrison, F. A., & Yoshida, A. 1997, ApJ, 475, 823
Lipunov, V. M. & Nazin, S. N. 1994, A&A, 289, 822
Maraschi, L. & Treves, A. 1981, MNRAS, 194, 1P
Martı, J. 1993. PhD thesis, Universitat de Barcelona
Martı, J. & Paredes, J. M. 1995, A&A, 298, 151

– 16 –
Massi, M., Paredes, J. M., Estalella, R., & Felli, M. 1993, A&A, 269, 249
Mirabel, I. F. & Rodriguez, L. F. 1994, in Proceedings of the 17th Texas Symposium on
Relativistic Astrophysics, Annals of the New York Academy of Sciences
Pacholczyk, A. G. 1970, Radio Astrophysics, (San Francisco: Freeman)
Paredes, J. M., Estalella, R., & Rius, A. 1990, A&A, 232, 377
Paredes, J. M., Martı, J., Estalella, R., & Sarrate, J. 1991, A&A, 248, 124
Ray, P. S., Foster, R. S., Waltman, E. B., Ghigo, F. D., & Johnston, K. J. 1996, in Radio
Emission from Stars and the Sun, ed. A. R. Taylor & J. M. Parades, volume 93 of
ASP Conference Series, 249
Strickman, M. S., Tavani, M., Coe, M. J., Steele, I. A., Fabregat, J., Marti, J., Paredes,
J. M., & Ray, P. S. 1998, ApJ. submitted
Tavani, M. 1995, in The Gamma-Ray Sky with GRO and SIGMA, ed. M. Signore, P. Salati,
& G. Vedrenne, (Dordrecht: Kluwer), 181
Tavani, M. & Arons, J. 1997, ApJ, 477, 439
Tavani, M. et al. 1996, A&AS, 120, 243
Taylor, A. R. & Gregory, P. C. 1982, ApJ, 255, 210
Taylor, A. R. & Gregory, P. C. 1984, ApJ, 283, 273
Taylor, A. R., Young, G., Peracaula, M., Kenny, H. T., & Gregory, P. C. 1996, A&A, 305,
817
Thompson, D. J. et al. 1995, ApJS, 101, 259
van Dijk, R. et al. 1996, A&A, 315, 485
– 17 –
Waters, L. B. F. M., Taylor, A. R., van den Heuvel, E. P. J., Habets, G. M. H. J., & Persi,
P. 1988, A&A, 198, 200
Zamanov, R. K. 1995, MNRAS, 272, 308
This manuscript was prepared with the AAS LATEX macros v4.0.

– 18 –
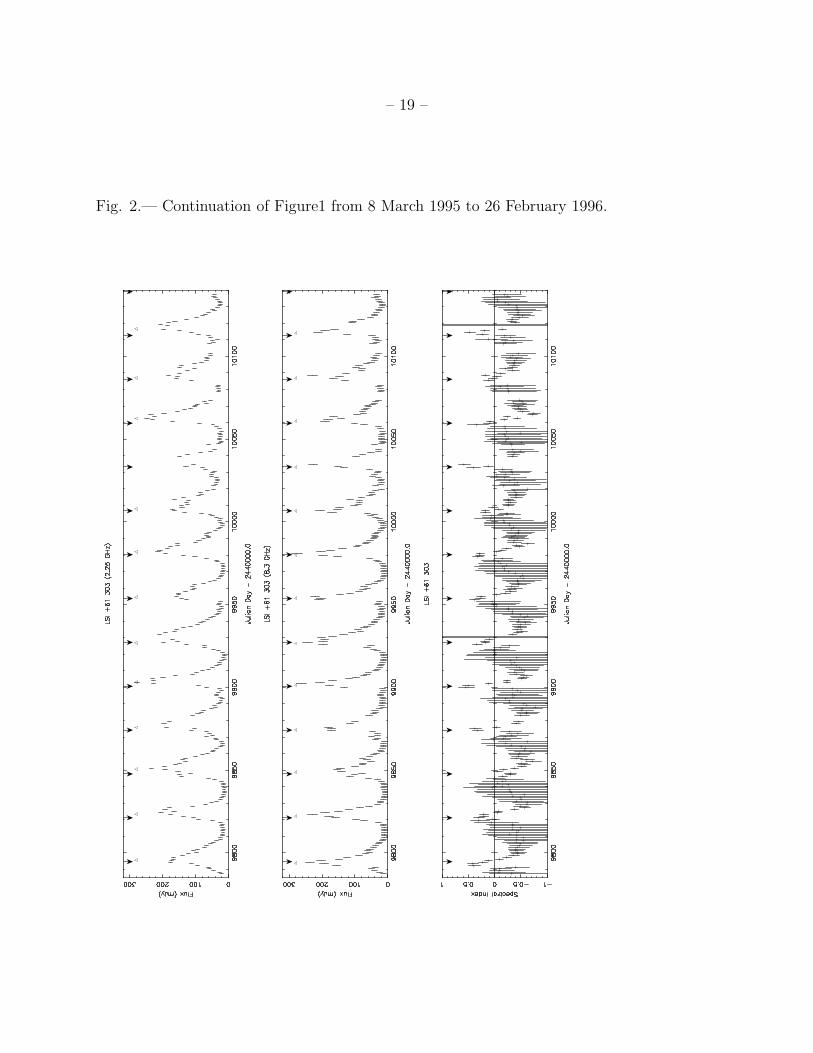
Fig. 1.— Flux history of LSI+61◦ 303 at 2.25 and 8.3 GHz from 27 January 1994 to 8 March
1995. The arrows mark phase 0.6 of the published radio ephemeris (Taylor & Gregory 1984).
The triangles mark the outburst phase as determined by cross-correlating with a template
(see Figure 7). The triangles are missing where there was insufficient data to get a good
peak.
– 19 –
Fig. 2.— Continuation of Figure1 from 8 March 1995 to 26 February 1996.

– 20 –
Fig. 3.— Phase averaged fluxes and spectral index of LSI+61◦ 303.
– 21 –
Fig. 4.— Peak outburst flux of LSI+61◦ 303. The dotted line is the best-fit model of Paredes,
Estalella, & Rius (1990). The dashed line is the more recent model of Martı (1993). Stars
and upward pointing arrows (lower limits) are the previously published data on which the
model was based. All data beyond day 9000 are from this work.
– 22 –
Fig. 5.— Expanded version. The dotted line is the best-fit model of Paredes, Estalella, &
Rius (1990). The dashed line is the more recent model of Martı (1993).

– 23 –
Fig. 6.— Same as Figure 5 except using the 2.25 GHz data.

– 24 –
Fig. 7.— Outburst phase determined by cross-correlating with a template.